Migrant remittances and inequality in Central‐Eastern Europe
20
International Review of Applied Economics Vol. 23, No. 3, May 2009, 289–307 ISSN 0269-2171 print/ISSN 1465-3486 online © 2009 Taylor & Francis DOI: 10.1080/02692170902811710 http://www.informaworld.com Migrant remittances and inequality in Central-Eastern Europe Marilena Giannetti a , Daniela Federici b * and Michele Raitano c a Sapienza University of Rome; b Faculty of Economics, University of Cassino, via S. Angelo, 03043 Cassino (FR), Italy; c Sapienza University of Rome and CRISS Taylor and Francis Ltd CIRA_A_381341.sgm 10.1080/02692170902811710 International Review of Applied Economics 0269-2171 (print)/1465-3486 (online) Original Article 2009 Taylor & Francis 23 3 000000May 2009 DanielaFederici [email protected] The impact of remittance flows on growth and income distribution has attracted a great deal of attention, but the theoretical and empirical literature on the relationship between remittances and economic development is far from clear. Although there is wide consensus that foreign remittances can help the receiving households to increase income, consumption and capabilities to cope with socioeconomic shocks, there has been little quantitative research on impacts of remittances on household welfare and poverty. Our paper seeks to fill some of these gaps proposing an empirical analysis of the role of remittances as a tool for reducing inequality and covering households against poverty and social exclusion risks. The empirical analysis focuses on four Eastern European Countries: Slovenia, Poland, the Czech Republic and Hungary, and is based on the EU-SILC (European Union Statistics on Income and Living Conditions) 2005 data-set providing for each household information as to the received inter-household cash transfers and among which regular cash support from households in other countries (i.e. remittances) are included. The results show that remittances are statistically significant in terms of poverty reduction even if their effects are generally smaller than those of welfare transfers. Furthermore, the impact of remittances and welfare transfers differ across the countries considered. Keywords: remittances; inequality; poverty JEL classification: O10, O15, O52 1. Introduction Migration affects the countries of origin in a variety of ways: through labour supply, changes in skill composition, in internal consumption, in trade pattern and so on. Among those aspects, the impact of remittances flows on growth and income distribu- tion has attracted a lot of attention from economists and international institutions although the theoretical and empirical analysis of the effects of remittances on economic development is far from clear. 1 While there is wide consensus among researchers that foreign remittances can help the receiving households to increase income and well-being, as well as to cope with socioeconomic shocks, there has been little quantitative research on the impact of migrant remittances on household’s welfare and poverty. Although the immediate impact of remittances is on transient poverty, its long-term effects should not be under- estimated. Poor households that receive remittances rapidly attain living standards higher than those having no family member working abroad. These financial transfers have the potential capacity to generate wealth in the home and in the migrant-sending *Corresponding author. Email: [email protected]
Transcript of Migrant remittances and inequality in Central‐Eastern Europe
International Review of Applied EconomicsVol. 23, No. 3, May 2009, 289–307
ISSN 0269-2171 print/ISSN 1465-3486 online© 2009 Taylor & FrancisDOI: 10.1080/02692170902811710http://www.informaworld.com
Migrant remittances and inequality in Central-Eastern Europe
Marilena Giannettia, Daniela Federicib* and Michele Raitanoc
aSapienza University of Rome; bFaculty of Economics, University of Cassino, via S. Angelo, 03043 Cassino (FR), Italy; cSapienza University of Rome and CRISSTaylor and Francis LtdCIRA_A_381341.sgm10.1080/02692170902811710International Review of Applied Economics0269-2171 (print)/1465-3486 (online)Original Article2009Taylor & Francis233000000May [email protected]
The impact of remittance flows on growth and income distribution has attracted agreat deal of attention, but the theoretical and empirical literature on therelationship between remittances and economic development is far from clear.Although there is wide consensus that foreign remittances can help the receivinghouseholds to increase income, consumption and capabilities to cope withsocioeconomic shocks, there has been little quantitative research on impacts ofremittances on household welfare and poverty. Our paper seeks to fill some ofthese gaps proposing an empirical analysis of the role of remittances as a tool forreducing inequality and covering households against poverty and social exclusionrisks. The empirical analysis focuses on four Eastern European Countries:Slovenia, Poland, the Czech Republic and Hungary, and is based on the EU-SILC(European Union Statistics on Income and Living Conditions) 2005 data-setproviding for each household information as to the received inter-household cashtransfers and among which regular cash support from households in othercountries (i.e. remittances) are included. The results show that remittances arestatistically significant in terms of poverty reduction even if their effects aregenerally smaller than those of welfare transfers. Furthermore, the impact ofremittances and welfare transfers differ across the countries considered.
Keywords: remittances; inequality; poverty
JEL classification: O10, O15, O52
1. Introduction
Migration affects the countries of origin in a variety of ways: through labour supply,changes in skill composition, in internal consumption, in trade pattern and so on.Among those aspects, the impact of remittances flows on growth and income distribu-tion has attracted a lot of attention from economists and international institutionsalthough the theoretical and empirical analysis of the effects of remittances oneconomic development is far from clear.1
While there is wide consensus among researchers that foreign remittances can helpthe receiving households to increase income and well-being, as well as to cope withsocioeconomic shocks, there has been little quantitative research on the impact ofmigrant remittances on household’s welfare and poverty. Although the immediateimpact of remittances is on transient poverty, its long-term effects should not be under-estimated. Poor households that receive remittances rapidly attain living standardshigher than those having no family member working abroad. These financial transfershave the potential capacity to generate wealth in the home and in the migrant-sending
*Corresponding author. Email: [email protected]

290 M. Giannetti et al.
community; remittances lead to increased household expenditure in areas consideredimportant for development, particularly education, entrepreneurship and health.
Our article seeks to fill some of these gaps and it proposes an empirical analysisof the role of remittances in reducing inequality and protecting households againstpoverty and social exclusion risks. By focusing on households with migrants, thepaper determines whether and to which extent remittances affect the well-being ofhousehold members left behind. We use household survey data for selected Central-Eastern European (CEE) countries – Slovenia, Poland, the Czech Republic andHungary – with quite different migration patterns.
The paper represents a contribution to the existing literature on the effects ofremittances on poverty and inequality along two major dimensions. A very largenationally representative household survey dataset is used. Moreover, we comparefour of the biggest new European Union (EU)-entrant countries with respect to thecharacteristics of remittances recipients as well as to the effects of transfers on povertyand social exclusion risks.
The paper is organised as follows. In the next section a brief literature review onthe impact of remittances on poverty and development is carried out. In the thirdsection, the key macroeconomic factors of the considered countries are provided. Theempirical analysis is the object of the fourth section. After the description of the dataand the method of analysis, the results of the logit regression constitute the core of thesection. In the fifth section conclusions are drawn.
2. Literature review
Empirical literature on the effect of remittances on income distribution and on povertyreduction is rather mixed. Some researchers argue that migrant remittances tend toreduce income inequality (Oberai, Prasad and Sardana 1989; Guest 1998; Taylor andWyatt 1996), while others point out that remittances increase inequality (Barham andBoucher 1998). Evidence remains contradictory and the answer is likely to criticallydepend on the specific socio-economic circumstances of households which migrantscome from, the types of migration and the different phases in a community’s migra-tion history (Stark, Taylor and Yitzhaki 1988; Russell 1992; Taylor 1999). However,the answer to the question of whether or not remittances help to reduce poverty seemsto be more unanimous. The most recent research at the time of writing (2008) (WorldBank 2006; Jongwanich 2007; Brown and Jimenez 2007) supports the positive effectsof remittances in poverty alleviation. Furthermore, Taylor (1992) notes that, inaddition to the direct impact on income, remittances play an important role in easingcredit constraints for liquidity-constrained households. Once the indirect effects areconsidered, the remittances act to equalise incomes.
Stark, Taylor and Yitzhaki (1986, 1988) analysed household data from two Mexi-can villages, one with a relatively recent Mexico-to-USA migration experience, andone with a longer history of migration. Their findings indicate that the distributionalimpact of remittances strongly depends on the village’s migration history. Adams(1989) by using a sample of three villages in Egypt concludes that the inclusion ofremittances from abroad worsens income inequality. On the contrary, following thesame approach with households from four districts in Pakistan, Adams (1992)observes that remittances have an essentially neutral impact on the rural incomedistribution. The same result is obtained by Milanovic (1987), who – using panel datafrom the 1973, 1978 and 1983 Yugoslavian household surveys – shows that

International Review of Applied Economics 291
remittances tend to raise inequality, given that the poor do not benefit from migrationsince only richer households are able to access migration opportunities. Differently,Markova (2006), shows for Albania both an increase in above-average consumptionand a below-average poverty incidence for households remittances recipients.
Remittances can also contribute to development within migrant-sending commu-nities through the promotion of new small-scale enterprises in the non-farm sector, asit was the case in several countries including Egypt (McCormick and Wahba 2003)and Mexico (Cornelius 1990). Indeed, Woodruff and Zenteno (2007), basing on asurvey of more than 600 small firms in 44 urban areas, state that remittances from theUSA financed much of the micro-enterprise development in Mexico. Such activitiesare likely to be enhanced by the relaxation of credit constraints benefitting remittance-receiving households.
Viet (2008) investigates the impact of foreign remittances on household welfare,poverty and inequality in Vietnam using the Vietnam Household Living StandardSurvey 2002–2004. He found that better-off households received a larger proportionof foreign remittances. As a result, although foreign remittances considerablyincreased income and consumption of the receiving households, their impact onpoverty reduction was rather small. The evidence available from Indonesia shows thatremittances acquired from international labour migration were primarily used forthe acquisition of land and housing improvements (Hugo 2003) while children’seducation was another important use.
At the household level, remittances generally raise the standard of living of recip-ient families. They help to improve children’s education, contribute to better health,housing and family welfare, thus promoting future human capital development.Although flows of remittances accrue directly to households with migrant members,also households that do not receive remittances can indirectly benefit from thesetransfers. Channels by which non-migrant households indirectly gain from flows ofremittances work through the increase in the consumption patterns of recipientfamilies stimulating local production, job creation, creation of new enterprises, devel-opment of new infrastructures, etc. – all mechanisms that may improve developmentin the community.2 Duryea, Lopes Córdova and Olmedo (2005) find that an increasein the share of households receiving remittances in a municipality led both to betterhealth and to children’s school attendance. In several Asian countries, includingPakistan and Thailand, families left behind by migrants used remittances to hire labourand purchase farm equipment, leading to output growth (Kerr 1996).
Yang and Martinez (2005), based on a survey of Filipino households, noticed thatunanticipated increases in remittances contributed not only to enhanced human capitalaccumulation, with less child labour and more child schooling in remittance-receivinghouseholds, but also to a higher rate of participation in capital-intensive enterprises.Glystos (2002) reaches a similar conclusion on the basis of a study on six out of sevenMediterranean countries where investment increases with remittances (see alsoAdams 2006 for Guatemala). León-Ledesma and Piracha (2004) obtain similar resultsfor Eastern European Countries in the 1990s.
3. Economic background
Our analysis focuses on households receiving remittances in Poland, the CzechRepublic, Slovenia and Hungary. A short panoramic overview on the macroeconomicsituation since the end of the 1990’s of these countries is provided.
292 M. Giannetti et al.
The four countries considered above are among the Central and Eastern Europeancountries, the most advanced in the transition process towards the capitalist economicsystem, thanks also to their different status during the planned economy period(Atkinson and Micklewright 1992). Particularly, according to the World Bank classi-fication, the Czech Republic and Slovenia, together with Estonia, are the only threeones that enter the group of high income countries, while Hungary and Poland,together with a few more ex-planned economies, are part of upper-middle incomecountries (ECB 2008).
The Czech economy, after a sharp recession at the end of the 1990s, has shown inthe following ten years a very strong performance, with an average real gross domesticproduct (GDP) growth rate of 4.4% (6.5% in the period 2004–2007) (ECB 2008).Notwithstanding a continuous growth of real wages faster than labour productivity, theunemployment rate, even if quite high until 2006, has been decreasing in the last fewyears reaching 5.3% at the end of 2007. The reduction of unemployment has been madepossible thanks to the strong internal demand while the still excessive unemploymentis mainly due to structural reasons, i.e. mismatch between the demand and the supplyof skills. Given these ‘good’ economic results, the Czech Republic has become a netimmigration country with immigrants flowing in mostly from less economically devel-oped neighbouring transition countries, while the Czech emigrants move towards moreadvanced Organisation of Economic Co-operation and Development (OECD) econo-mies. The strong reduction in the welfare system that accompanied the transition (Gian-netti and Nuti 2007; Composto 2008) and the heterogeneous impact the transition hadon citizens, help to explain the still relatively high household poverty ratio as shownin Table 3 of the next section. It is mostly to these households that in 2006 the US$1300million inward flow of remittances accrued.
In Hungary real GDP growth has been quite constant, around 4.3% in the period1998–2006 while in 2007 a strong slowdown of the economy has been registered. Theunemployment rate was still around 7.4% at the end of 2007. The real GDP per capita,even if one of the highest among the new EU member states, is still very low withrespect to the EU-15 average: just above 50%. Real wages have been increasing in theperiod between 1998 and 2007 boosting inflation and contributing to worseneninginequality of income distribution. The household poverty ratio is still over 13% (seeTable 3). At the end of 2005 the stock of Hungarian emigrants was equal to 4.7% ofthe total population (10 million people), giving rise to an inward flow of remittancesequal to US$363 million (0.3% of GDP) in 2006.3
Poland shows a very similar economic pattern to the Czech Republic even ifstarting from quite different institutional and economic circumstances at the beginningof the transition (Atkinson and Micklewright 1992). The real GDP growth rate in theperiod 1997–2007 has been on average around 4% peaking to 6.5% in 2007. Thanksto the sustained internal demand, unemployment, though still high, fell from 19% in2004 to 9.4% in 2007 (ECB 2008). Poverty heavily affects Polish people especiallygiven the high share of agriculture in the GDP and the strong reduction in welfareexpenditure. The household poverty ratio was 18% in 2005 (Table 3).
Slovenia is the only country of the former Yugoslavia that is already a member ofEU and the first among the new member countries to adopt the euro (at the beginningof 2007). A relatively small country, its economy enjoys a good environment espe-cially after the implementation of the last administrative and economic reforms.Following economic growth, there was an increase in employment, which, since 2004has exceeded the European average (in 2005, employment in Slovenia was 66%, as
International Review of Applied Economics 293
against 63.8% in the EU). Compared with the EU average, Slovenia has also a veryhigh employment rate for women (61.3% in 2005) and the share of inward investmentas a percentage of GDP reached 23% in 2006. These facts help to explain why netmigration flow in the country has been positive in the last few years, althoughthe inflow of remittances have been quite high with regard to the GDP, faring around0.8–0.9% on average since the beginning of the transition process.
4. The empirical analysis
4.1. Data-set and methodology
Our analysis is based on the EU-SILC 2005 micro dataset (Community Statistics onIncome and Living Conditions) that represents the first wave of the new harmonisedpanel survey for all the EU countries (including the new accession countries) aboutindividual and household incomes and living conditions. In particular, EU-SILCsurvey records information regarding the characteristics of all member states forlonger than 16 years as well as on household composition and sources of income. Inaddition, a reference individual is identified for each household. Cross-sectional dataused in the paper refer to income reference year 2005.
Among the several kinds of income that are included in the survey, regular inter-household cash transfers received are recorded. These transfers are defined as regularmonetary amounts received, during the income reference period, from other house-holds or persons; then they mainly include compulsory alimony and child support paidby the partner in case of divorce and regular cash support from households in othercountries, i.e. remittances. Regular inter-household transfer’s alimonies and remit-tances are not distinguished. However, to identify remittances, we assume that in caseof households with, as a reference individual, a divorced woman, these transfers arealimonies; otherwise regular inter-household transfers are imputed as remittances.
To study the impact of remittances on inequality, poverty and social exclusion, ourpaper focuses on a selection of Eastern European Countries: Poland, the CzechRepublic, Hungary and Slovenia, that have been characterised by a wide process oflabour force emigration in recent years.
Such analysis is carried out through three steps: first, we identify which house-holds receive remittances; second, we compute the effect of remittances on reducinginequality and poverty risks in the origin country (comparing such effects with the roleplayed by welfare transfers); finally, we analyse how the fact of being recipients ofremittances is associated with social exclusion risks, by considering the answers totwo specific questions reported in EU-SILC survey.
Before presenting the results, some caveats and drawbacks about the impact ofremittances on the origin country have to be pointed out. As our analysis is based oncross-sectional rather than on longitudinal data, we are not able to infer a causalitynexus between remittances, households’ characteristics and poverty and social-exclusion risks. In other words, given that we do not observe a change in the statusof recipients of remittances over the years, but only such status (and the amount ofremittances when positive) in the base year 2005, the empirical analysis could bebiased by endogeneity (this prevents us from interpreting results in terms of causal-ity; so we may only discuss the correlations). In addition to this, EU-SILC reportsonly the amount of inter-household transfers (from where we identify remittances)in a specific year, without specifying the length of time that households had beenreceiving them.

294 M. Giannetti et al.
However, in spite of such drawbacks from the used data-set, and in the light ofshortage of studies analysing the link between remittances and inequality, especiallyin a comparative perspective, our empirical analysis obtains very interesting insightsof the problems. The very large sample used allows us to compare four of the biggestEU new entrant countries (see Section 3) with respect to the characteristics of remit-tance recipients as well as to the effects of transfers on poverty and social exclusionrisks.4
4.2. The characteristics of remittance recipients
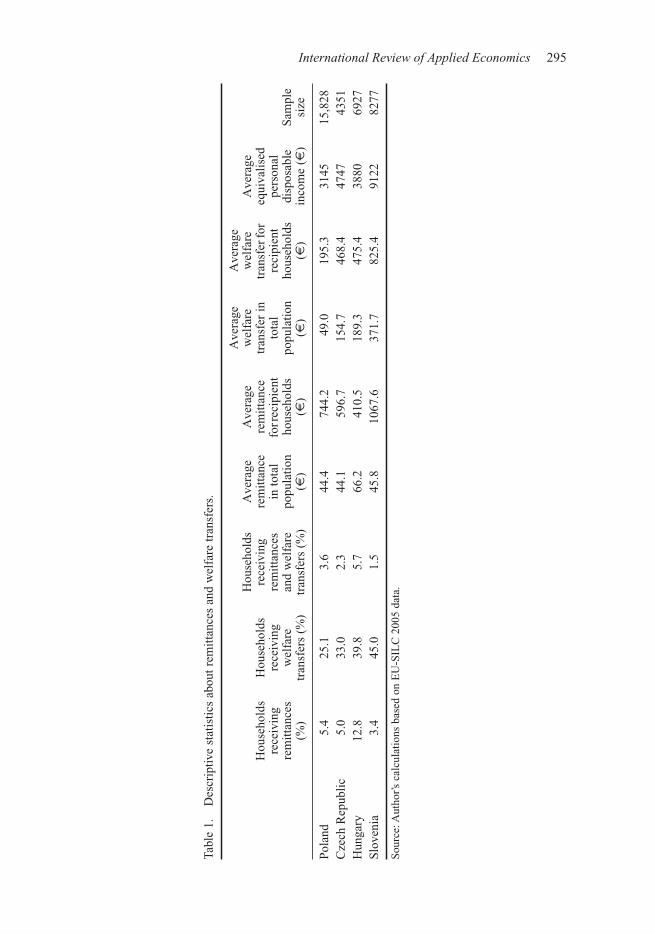
Table 1 reports summary statistics on remittances and welfare transfers. Hungary hasthe highest share of remittance recipients (12.8%). Nonetheless, the received amountper household is higher in Poland and Slovenia (respectively about €750 and €1070yearly).
In the empirical analysis the role of remittances is compared with the one playedby welfare transfers, i.e. family/children related allowances, housing allowances andsocial exclusion benefits.5 Everywhere the share of families receiving welfare trans-fers is much higher than the share of remittance recipients (such share is comprisedbetween 25.1% and 45% vs 3.4% and 12.8% for remittances).6 However, whensignalling the major role played by remittances for the share of households receivingthem, it must be stressed that among remittances of welfare recipients only in Hungaryare average social benefits (slightly) higher than remittances.
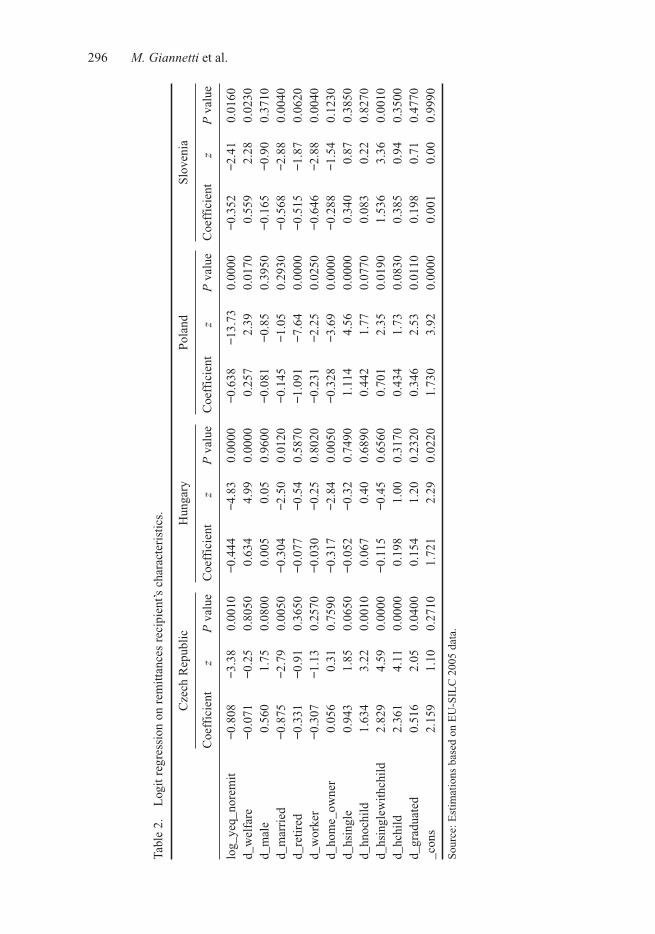
Table 2 shows the results of a logistic regression on the characteristics of remittancerecipients for each country. Specifically, we estimate the following logit equation:
where xi corresponds to the vector of explanatory variables for country i and β repre-sents the coefficients of these variables.
In our study, the independent variables are the log of equalised household incomewithout remittances and several dummies: being a recipient of welfare transfers; sex,marital status, educational attainment and professional status of the householdreferenced individual, home ownership and family composition.
Income is everywhere negatively associated to receipt of remittances, showingthat remittances are mainly paid to households in the lower scale of the income distri-bution.7 Apart from the Czech Republic, being a welfare recipient is significantlycorrelated with receiving remittances, while owning a home is significant andnegatively correlated in Hungary and Poland.
Apart from Poland, marital status affects receipt; educational attainment of thereferenced individual is positive and significant in the Czech Republic and Polandwhile, in the Czech Republic and Hungary, his/her sex does not matter, as a profes-sional status. In Poland and Slovenia, being workers and retired ones is negativelyassociated with receiving remittances.
The picture about family composition is mixed (the reference modality is ‘house-hold with an over 65-year old responsible individual’). In Poland, single families (withor without children) are associated with receipt of remittances while in Slovenia onlysingle families with children are considered. In the Czech Republic older householdsare negatively associated with remittances; in Hungary there is no statistical signifi-cant association between receipt and family composition.
P xi i i= ′ +φ β ε( ) ,
International Review of Applied Economics 295
Tabl
e 1.
Des
crip
tive
stat
isti
cs a
bout
rem
itta
nces
and
wel
fare
tra
nsfe
rs.
Hou
seho
lds
rece
ivin
g re
mit
tanc
es
(%)
Hou
seho
lds
rece
ivin
g w
elfa
re
tran
sfer
s (%
)
Hou
seho
lds
rece
ivin
g re
mit
tanc
es
and
wel
fare
tr
ansf
ers
(%)
Ave
rage
re
mit
tanc
e in
tot
al
popu
lati
on
(€)
Ave
rage
re
mit
tanc
e fo
r rec
ipie
nt
hous
ehol
ds
(€)
Ave
rage
w
elfa
re
tran
sfer
in
tota
l po
pula
tion
(€
)
Ave
rage
w
elfa
re
tran
sfer
for
reci
pien
t ho
useh
olds
(€
)
Ave
rage
eq
uiva
lise
d pe
rson
al
disp
osab
le
inco
me
(€)
Sam
ple
size
Pol
and
5.4
25.1
3.6
44.4
744.
249
.019
5.3
3145
15,8
28C
zech
Rep
ubli
c5.
033
.02.
344
.159
6.7
154.
746
8.4
4747
4351
Hun
gary
12.8
39.8
5.7
66.2
410.
518
9.3
475.
438
8069
27S
love
nia
3.4
45.0
1.5
45.8
1067
.637
1.7
825.
491
2282
77
Sou
rce:
Aut
hor’s
cal
cula
tion
s ba
sed
on E
U-S
ILC
200
5 da
ta.
296 M. Giannetti et al.
Tabl
e 2.
Log
it r
egre
ssio
n on
rem
itta
nces
rec
ipie
nt’s
cha
ract
eris
tics
.
Cze
ch R
epub
lic
Hun
gary
Pol
and
Slo
veni
a
Coe
ffic
ient
zP
val
ueC
oeff
icie
ntz
P v
alue
Coe
ffic
ient
zP
val
ueC
oeff
icie
ntz
P v
alue
log_
yeq_
nore
mit
−0.8
08−3
.38
0.00
10−0
.444
−4.8
30.
0000
−0.6
38−1
3.73
0.00
00−0
.352
−2.4
10.
0160
d_w
elfa
re−0
.071
−0.2
50.
8050
0.63
44.
990.
0000
0.25
72.
390.
0170
0.55
92.
280.
0230
d_m
ale
0.56
01.
750.
0800
0.00
50.
050.
9600
−0.0
81−0
.85
0.39
50−0
.165
−0.9
00.
3710
d_m
arri
ed−0
.875
−2.7
90.
0050
−0.3
04−2
.50
0.01
20−0
.145
−1.0
50.
2930
−0.5
68−2
.88
0.00
40d_
reti
red
−0.3
31−0
.91
0.36
50−0
.077
−0.5
40.
5870
−1.0
91−7
.64
0.00
00−0
.515
−1.8
70.
0620
d_w
orke
r−0
.307
−1.1
30.
2570
−0.0
30−0
.25
0.80
20−0
.231
−2.2
50.
0250
−0.6
46−2
.88
0.00
40d_
hom
e_ow
ner
0.05
60.
310.
7590
−0.3
17−2
.84
0.00
50−0
.328
−3.6
90.
0000
−0.2
88−1
.54
0.12
30d_
hsin
gle
0.94
31.
850.
0650
−0.0
52−0
.32
0.74
901.
114
4.56
0.00
000.
340
0.87
0.38
50d_
hnoc
hild
1.63
43.
220.
0010
0.06
70.
400.
6890
0.44
21.
770.
0770
0.08
30.
220.
8270
d_hs
ingl
ewit
hchi
ld2.
829
4.59
0.00
00−0
.115
−0.4
50.
6560
0.70
12.
350.
0190
1.53
63.
360.
0010
d_hc
hild
2.36
14.
110.
0000
0.19
81.
000.
3170
0.43
41.
730.
0830
0.38
50.
940.
3500
d_gr
adua
ted
0.51
62.
050.
0400
0.15
41.
200.
2320
0.34
62.
530.
0110
0.19
80.
710.
4770
_con
s2.
159
1.10
0.27
101.
721
2.29
0.02
201.
730
3.92
0.00
000.
001
0.00
0.99
90
Sou
rce:
Est
imat
ions
bas
ed o
n E
U-S
ILC
200
5 da
ta.
International Review of Applied Economics 297
4.3. The effects of remittances on inequality and poverty
In this section we show the effect of remittances and welfare benefit transfers oninequality and poverty indexes.8 To address this issue we compare the values ofindexes referred to household income without these components with the one imputedas ‘full income’. The analysis is carried out by observing the percentage change ofindexes when remittances and/or welfare transfers are added to income from othersources.
Before discussing the results, it is necessary to point out that – even if in thepresent section we compare the inequality and poverty indexes without deeplyanalysing the forces behind these outcomes – a different impact of remittances andsocial benefits on inequality and poverty indexes depends mainly on three factors: theshare of households receiving transfers, the average amounts for recipient and thetarget efficiency (i.e. the share of remittances and welfare benefits directed to lessadvantaged people).
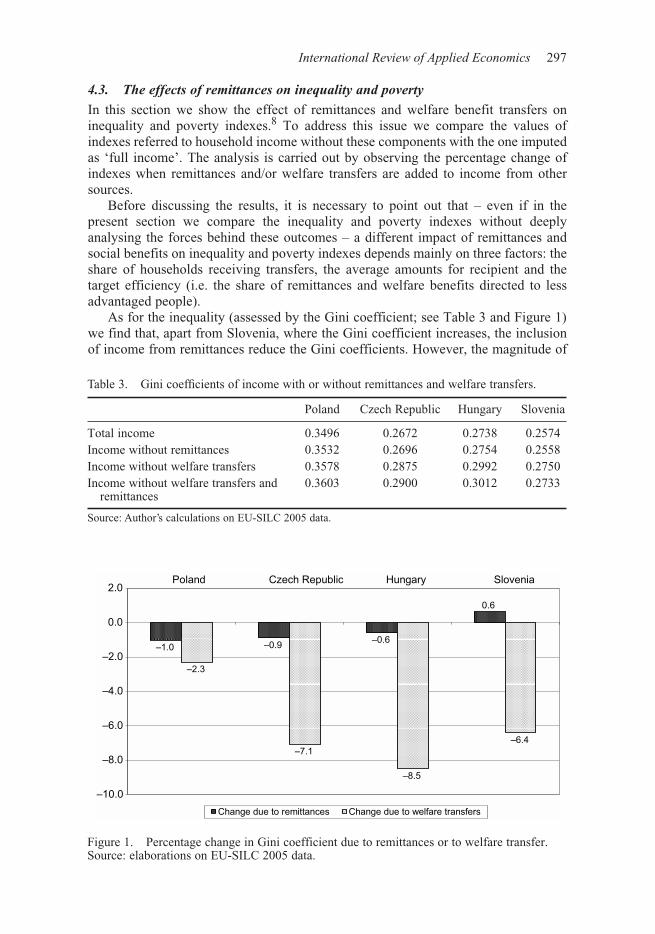
As for the inequality (assessed by the Gini coefficient; see Table 3 and Figure 1)we find that, apart from Slovenia, where the Gini coefficient increases, the inclusionof income from remittances reduce the Gini coefficients. However, the magnitude of
���� ��������
���
����
����
��
����
�����
���
����
����
����
���
���� ���� ����� �������� ������ !� "����
������ ��� # ��$�##����% ������ ��� # &��'��� #���%'��%
Figure 1. Percentage change in Gini coefficient due to remittances or to welfare transfer.Source: elaborations on EU-SILC 2005 data.
Table 3. Gini coefficients of income with or without remittances and welfare transfers.
Poland Czech Republic Hungary Slovenia
Total income 0.3496 0.2672 0.2738 0.2574Income without remittances 0.3532 0.2696 0.2754 0.2558Income without welfare transfers 0.3578 0.2875 0.2992 0.2750Income without welfare transfers and
remittances0.3603 0.2900 0.3012 0.2733
Source: Author’s calculations on EU-SILC 2005 data.
298 M. Giannetti et al.
the reduction of inequality is very small, possibly because of the low share of recipienthouseholds. At any rate, also in Hungary (where the share is 12.8%) the Gini decreas-ing effect of remittances is very low.Figure 1. Percentage change in Gini coefficient due to remittances or to welfare transfer.Source: elaborations on EU-SILC 2005 data.The reduction in the Gini coefficients brought about by welfare transfers is muchhigher everywhere, apart from Poland where such a decrease is limited and onlyslightly higher than the one owig to remittances. This result can be interpreted in lightof the higher share of recipients and to their specific targeting to households in thelower quintiles of the income distribution.
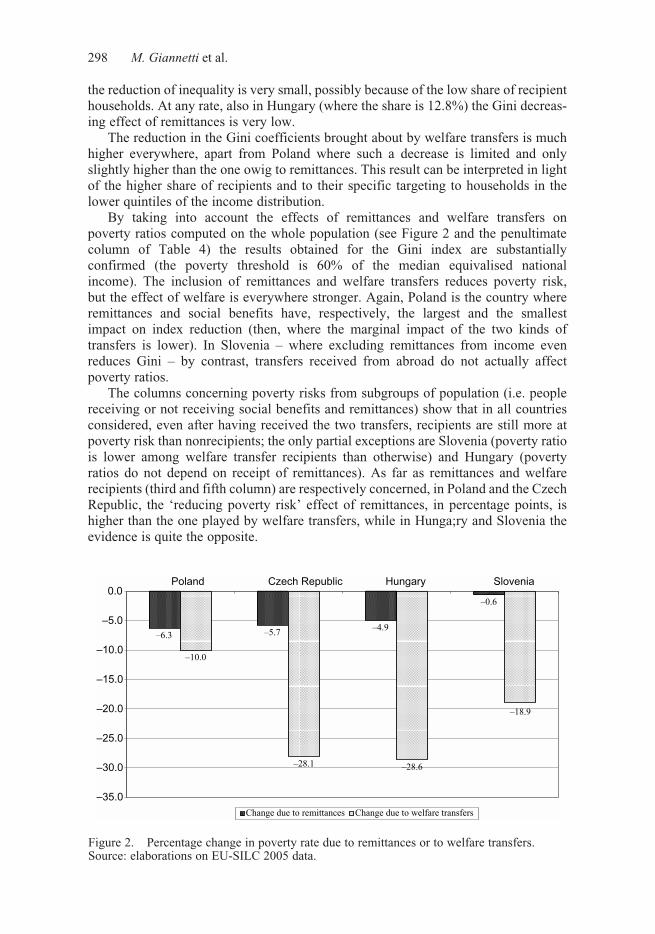
By taking into account the effects of remittances and welfare transfers onpoverty ratios computed on the whole population (see Figure 2 and the penultimatecolumn of Table 4) the results obtained for the Gini index are substantiallyconfirmed (the poverty threshold is 60% of the median equivalised nationalincome). The inclusion of remittances and welfare transfers reduces poverty risk,but the effect of welfare is everywhere stronger. Again, Poland is the country whereremittances and social benefits have, respectively, the largest and the smallestimpact on index reduction (then, where the marginal impact of the two kinds oftransfers is lower). In Slovenia – where excluding remittances from income evenreduces Gini – by contrast, transfers received from abroad do not actually affectpoverty ratios.Figure 2. Percentage change in poverty rate due to remittances or to welfare transfers.Source: elaborations on EU-SILC 2005 data.The columns concerning poverty risks from subgroups of population (i.e. peoplereceiving or not receiving social benefits and remittances) show that in all countriesconsidered, even after having received the two transfers, recipients are still more atpoverty risk than nonrecipients; the only partial exceptions are Slovenia (poverty ratiois lower among welfare transfer recipients than otherwise) and Hungary (povertyratios do not depend on receipt of remittances). As far as remittances and welfarerecipients (third and fifth column) are respectively concerned, in Poland and the CzechRepublic, the ‘reducing poverty risk’ effect of remittances, in percentage points, ishigher than the one played by welfare transfers, while in Hunga;ry and Slovenia theevidence is quite the opposite.
���� ��������
����
����
���
����
����
�����
�����
�����
�����
�����
�����
����
������� ���� ������� ������ ������
� ���� ��� �� ����������� � ���� ��� �� ������� ���������
Figure 2. Percentage change in poverty rate due to remittances or to welfare transfers.Source: elaborations on EU-SILC 2005 data.

International Review of Applied Economics 299
Tabl
e 4.
Pove
rty
rati
os (
shar
e of
tot
al p
opul
atio
n) a
ccor
ding
to
rece
ipt
of r
emit
tanc
es a
nd w
elfa
re t
rans
fers
.
Rem
itta
nce
reci
pien
ts
No
rem
itta
nce
reci
pien
ts
Wel
fare
tr
ansf
er
reci
pien
ts
No
wel
fare
tr
ansf
er
reci
pien
tsT
otal
Pov
erty
th
resh
old
(60%
of
med
ian
equi
vali
sed
inco
me)
(€
)
Pol
and
Tot
al i
ncom
e29
.717
.336
.811
.718
.015
25In
com
e w
itho
ut r
emit
tanc
es51
.217
.3n.
a.n.
a.19
.215
11In
com
e w
itho
ut w
elfa
re t
rans
fers
n.a.
n.a.
44.7
11.7
20.0
1499
Inco
me
wit
hout
wel
fare
tra
nsfe
rs a
nd r
emit
tanc
es53
.219
.345
.713
.021
.214
83C
zech
Rep
ubli
cT
otal
inc
ome
15.6
7.8
17.4
3.7
8.2
2371
Inco
me
wit
hout
rem
itta
nces
26.0
7.8
n.a.
n.a.
8.7
2365
Inco
me
wit
hout
wel
fare
tra
nsfe
rsn.
a.n.
a.27
.23.
711
.423
23In
com
e w
itho
ut w
elfa
re t
rans
fers
and
rem
itta
nces
28.9
11.3
28.8
3.9
12.1
2309
Hun
gary
Tot
al i
ncom
e13
.613
.517
.111
.113
.520
60In
com
e w
itho
ut r
emit
tanc
es19
.513
.5n.
a.n.
a.14
.220
39In
com
e w
itho
ut w
elfa
re t
rans
fers
n.a.
n.a.
30.7
11.1
18.9
1981
Inco
me
wit
hout
wel
fare
tra
nsfe
rs a
nd r
emit
tanc
es28
.618
.832
.511
.720
.019
55S
love
nia
Tot
al i
ncom
e29
.117
.214
.919
.717
.653
35In
com
e w
itho
ut r
emit
tanc
es32
.617
.2n.
a.n.
a.17
.753
23In
com
e w
itho
ut w
elfa
re t
rans
fers
n.a.
n.a.
24.2
19.7
21.7
5118
Inco
me
wit
hout
wel
fare
tra
nsfe
rs a
nd r
emit
tanc
es44
.021
.324
.820
.022
.051
02
Sou
rce:
Aut
hor’s
cal
cula
tion
s on
EU
-SIL
C 2
005
data
.
300 M. Giannetti et al.
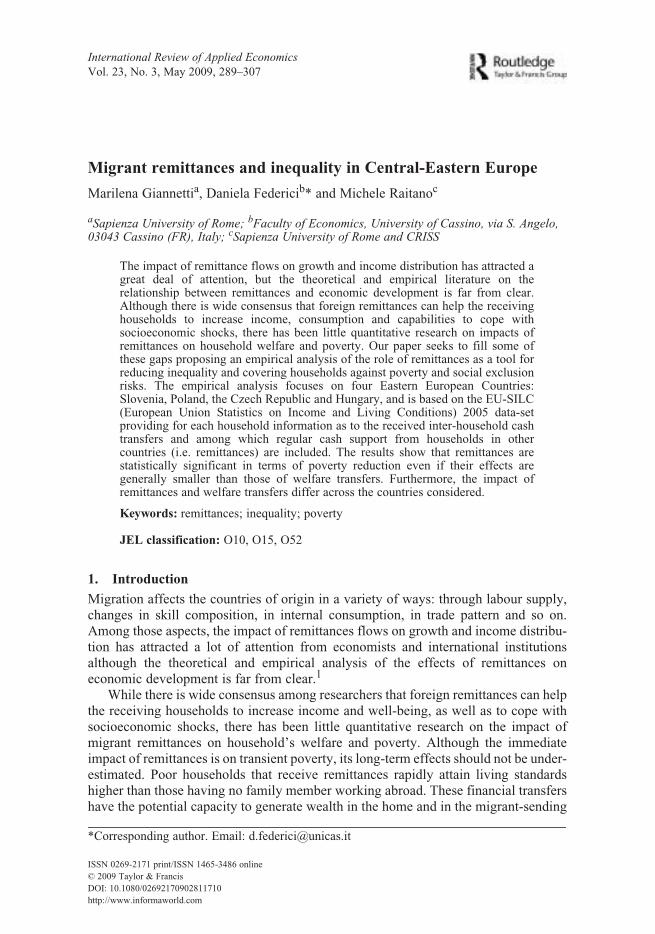
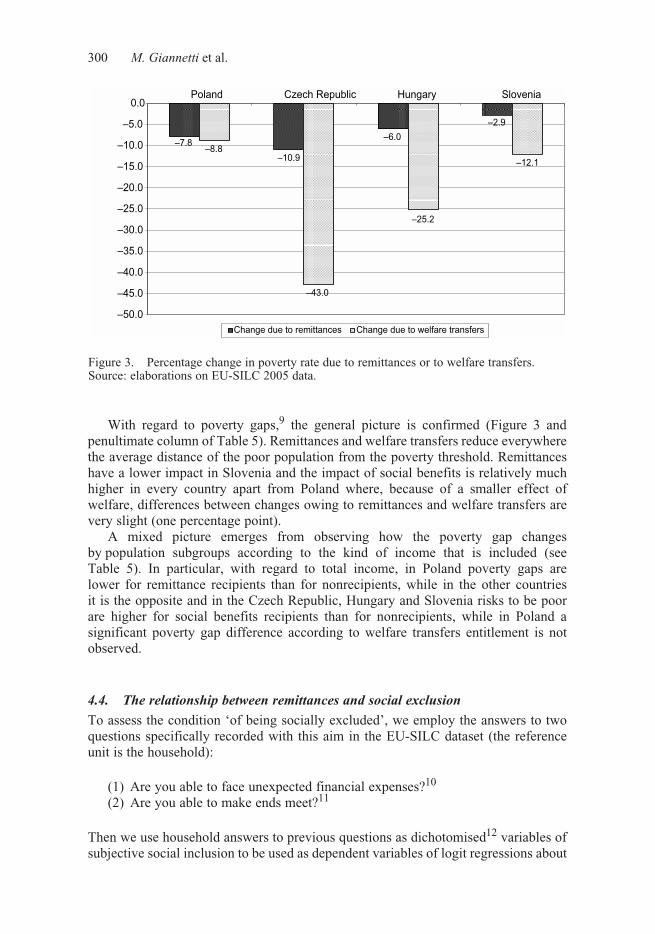
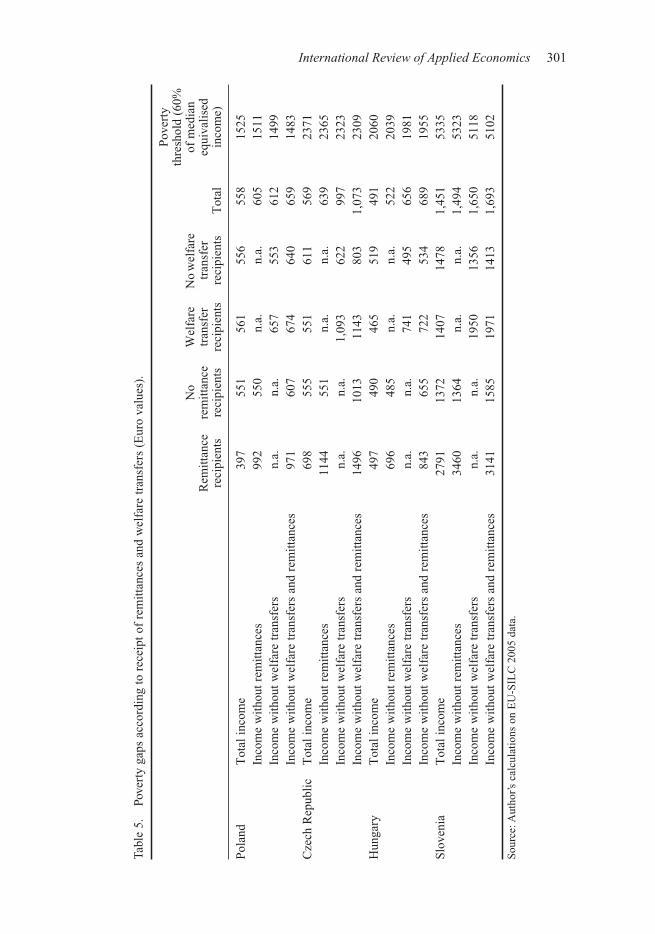
With regard to poverty gaps,9 the general picture is confirmed (Figure 3 andpenultimate column of Table 5). Remittances and welfare transfers reduce everywherethe average distance of the poor population from the poverty threshold. Remittanceshave a lower impact in Slovenia and the impact of social benefits is relatively muchhigher in every country apart from Poland where, because of a smaller effect ofwelfare, differences between changes owing to remittances and welfare transfers arevery slight (one percentage point).Figure 3. Percentage change in poverty rate due to remittances or to welfare transfers.Source: elaborations on EU-SILC 2005 data.A mixed picture emerges from observing how the poverty gap changesby population subgroups according to the kind of income that is included (seeTable 5). In particular, with regard to total income, in Poland poverty gaps arelower for remittance recipients than for nonrecipients, while in the other countriesit is the opposite and in the Czech Republic, Hungary and Slovenia risks to be poorare higher for social benefits recipients than for nonrecipients, while in Poland asignificant poverty gap difference according to welfare transfers entitlement is notobserved.
4.4. The relationship between remittances and social exclusion
To assess the condition ‘of being socially excluded’, we employ the answers to twoquestions specifically recorded with this aim in the EU-SILC dataset (the referenceunit is the household):
(1) Are you able to face unexpected financial expenses?10
(2) Are you able to make ends meet?11
Then we use household answers to previous questions as dichotomised12 variables ofsubjective social inclusion to be used as dependent variables of logit regressions about
�����
����
�����
�����
���
����
����
��
�����
����
����
�����
�����
�����
�����
�����
�����
����
���� ���� ����� �������� ������ !� "����
������ ��� # ��$�##����% ������ ��� # &��'��� #���%'��%
Figure 3. Percentage change in poverty rate due to remittances or to welfare transfers.Source: elaborations on EU-SILC 2005 data.
International Review of Applied Economics 301
Tabl
e 5.
Pove
rty
gaps
acc
ordi
ng t
o re
ceip
t of
rem
itta
nces
and
wel
fare
tra
nsfe
rs (
Eur
o va
lues
).
Rem
itta
nce
reci
pien
ts
No
rem
itta
nce
reci
pien
ts
Wel
fare
tr
ansf
er
reci
pien
ts
No
wel
fare
tr
ansf
er
reci
pien
tsT
otal
Pov
erty
th
resh
old
(60%
of
med
ian
equi
vali
sed
inco
me)
Pol
and
Tot
al i
ncom
e39
755
156
155
655
815
25In
com
e w
itho
ut r
emit
tanc
es99
255
0n.
a.n.
a.60
515
11In
com
e w
itho
ut w
elfa
re t
rans
fers
n.a.
n.a.
657
553
612
1499
Inco
me
wit
hout
wel
fare
tra
nsfe
rs a
nd r
emit
tanc
es97
160
767
464
065
914
83C
zech
Rep
ubli
cT
otal
inc
ome
698
555
551
611
569
2371
Inco
me
wit
hout
rem
itta
nces
1144
551
n.a.
n.a.
639
2365
Inco
me
wit
hout
wel
fare
tra
nsfe
rsn.
a.n.
a.1,
093
622
997
2323
Inco
me
wit
hout
wel
fare
tra
nsfe
rs a
nd r
emit
tanc
es14
9610
1311
4380
31,
073
2309
Hun
gary
Tot
al i
ncom
e49
749
046
551
949
120
60In
com
e w
itho
ut r
emit
tanc
es69
648
5n.
a.n.
a.52
220
39In
com
e w
itho
ut w
elfa
re t
rans
fers
n.a.
n.a.
741
495
656
1981
Inco
me
wit
hout
wel
fare
tra
nsfe
rs a
nd r
emit
tanc
es84
365
572
253
468
919
55S
love
nia
Tot
al i
ncom
e27
9113
7214
0714
781,
451
5335
Inco
me
wit
hout
rem
itta
nces
3460
1364
n.a.
n.a.
1,49
453
23In
com
e w
itho
ut w
elfa
re t
rans
fers
n.a.
n.a.
1950
1356
1,65
051
18In
com
e w
itho
ut w
elfa
re t
rans
fers
and
rem
itta
nces
3141
1585
1971
1413
1,69
351
02
Sou
rce:
Aut
hor’s
cal
cula
tion
s on
EU
-SIL
C 2
005
data
.
302 M. Giannetti et al.
the association between household features and risks to feel socially excluded(dummies assume value 1 if the risk is not faced, 0 otherwise).
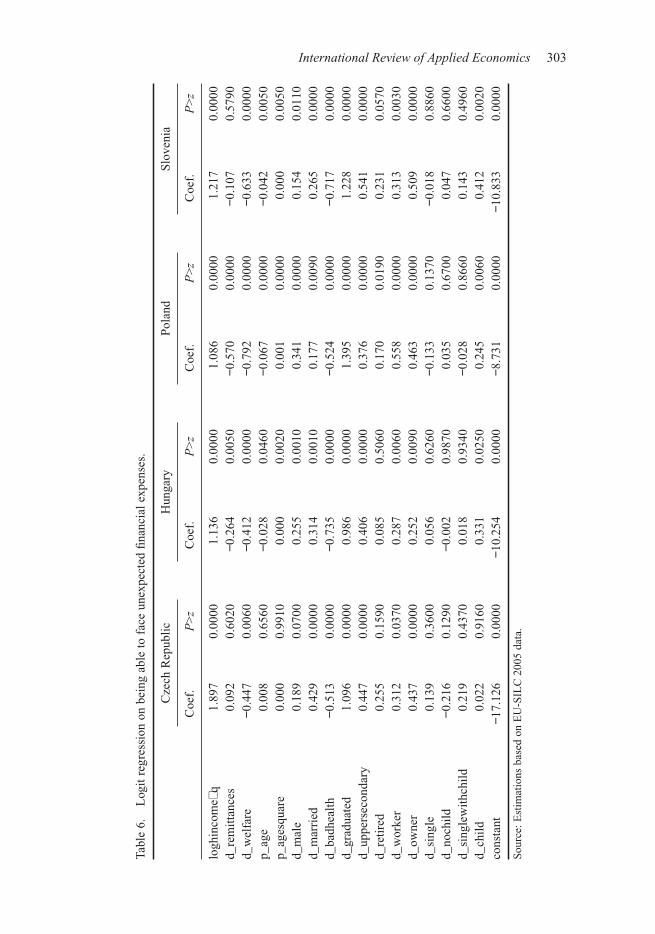
Among control variables, total household equivalent income and two dummies,regarding whether households receive remittances and welfare transfers, areincluded.13 In addition to the independent variables previously discussed (see Table2), the following ones are also included in this step: the age of the reference individual(squared), his subjective health status and two different modalities for educationalattainment.
With regard to the ability to face unexpected expenses (see Table 6), it is noticedthat income is, as expected, always associated with a lower risk, while in Hungary andPoland, being recipients of remittances increases the probability of being at risk and itis not significantly associated with such proxy for social exclusion in the other twocountries. Receiving welfare transfer is, on the contrary, always negatively linked tothe capacity to afford unexpected expenses. Bad health is everywhere linked to higherrisk, while family composition is usually not significant. Older households (identifiedby the respondent age) are more at risk, while families that own a home and with male,married and graduated respondents are generally less at risk. Being a worker decreaserisk, being retired does not reduce it.
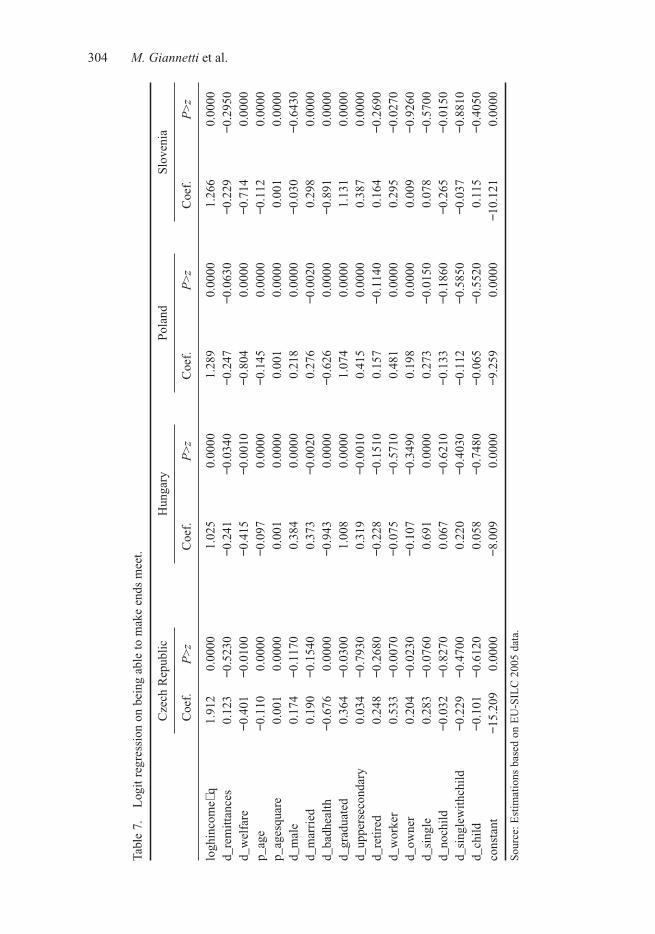
The results of the logit regression concerning the second proxy of social exclu-sion risk analysed, i.e. the ability to make ends meet (see Table 7), show that, as forthe previous indicator, income is associated to less (subjective) risk and being bothwelfare (everywhere) and remittance recipients (in Hungary and Poland) decreasesthe capacity of households to make ends meet. Risks increase with age and badhealth and decrease with educational attainment, work and marital status and (inPoland and the Czech Republic) home ownership. Again, as regards the familycomposition there is not a clear picture – most of the variables are not statisticallysignificant.
5. Conclusions
Notwithstanding the limitation of data we obtained interesting results. In particular,the analysis has shown that remittances are statistically significant in terms ofpoverty reduction. Furthermore, its poverty-reducing effects appear to be generallysmaller in magnitude than welfare transfers. Remittances and welfare-transferimpacts differ across the countries considered. These findings strengthen previousevidence on the relative importance of the country’s institutions and socioeconomicconditions in exploring the effects of remittances in reducing inequality and socialexclusion. A deeper investigation of what remittances mean to the recipient house-holds can be attained by looking more closely at national, regional and localpolicies that can possibly affect and be affected by migration and allocation ofremittances.
AcknowledgementsWork for this article has been supported by the EU FP6 project ‘Inequality: Mechanisms,Effects, Policies’ (INEQ, FP6-029093). The data used in this work come from EU Statistics onIncome and Living Conditions (EU-SILC); European Commission, Eurostat, Cross Sectional,UDB Silc 2005 rev. 1, release February 2008. The results and conclusions are solely theresponsibility of the authors and do not involve in any way Eurostat, the European Commisionor any other national authority.
International Review of Applied Economics 303
Tabl
e 6.
Log
it r
egre
ssio
n on
bei
ng a
ble
to f
ace
unex
pect
ed fi
nanc
ial
expe
nses
.
Cze
ch R
epub
lic
Hun
gary
Pol
and
Slo
veni
a
Coe
f.P
>z
Coe
f.P
>z
Coe
f.P
>z
Coe
f.P
>z
logh
inco
me∼
q1.
897
0.00
001.
136
0.00
001.
086
0.00
001.
217
0.00
00d_
rem
itta
nces
0.09
20.
6020
−0.2
640.
0050
−0.5
700.
0000
−0.1
070.
5790
d_w
elfa
re−0
.447
0.00
60−0
.412
0.00
00−0
.792
0.00
00−0
.633
0.00
00p_
age
0.00
80.
6560
−0.0
280.
0460
−0.0
670.
0000
−0.0
420.
0050
p_ag
esqu
are
0.00
00.
9910
0.00
00.
0020
0.00
10.
0000
0.00
00.
0050
d_m
ale
0.18
90.
0700
0.25
50.
0010
0.34
10.
0000
0.15
40.
0110
d_m
arri
ed0.
429
0.00
000.
314
0.00
100.
177
0.00
900.
265
0.00
00d_
badh
ealt
h−0
.513
0.00
00−0
.735
0.00
00−0
.524
0.00
00−0
.717
0.00
00d_
grad
uate
d1.
096
0.00
000.
986
0.00
001.
395
0.00
001.
228
0.00
00d_
uppe
rsec
onda
ry0.
447
0.00
000.
406
0.00
000.
376
0.00
000.
541
0.00
00d_
reti
red
0.25
50.
1590
0.08
50.
5060
0.17
00.
0190
0.23
10.
0570
d_w
orke
r0.
312
0.03
700.
287
0.00
600.
558
0.00
000.
313
0.00
30d_
owne
r0.
437
0.00
000.
252
0.00
900.
463
0.00
000.
509
0.00
00d_
sing
le0.
139
0.36
000.
056
0.62
60−0
.133
0.13
70−0
.018
0.88
60d_
noch
ild
−0.2
160.
1290
−0.0
020.
9870
0.03
50.
6700
0.04
70.
6600
d_si
ngle
wit
hchi
ld0.
219
0.43
700.
018
0.93
40−0
.028
0.86
600.
143
0.49
60d_
chil
d0.
022
0.91
600.
331
0.02
500.
245
0.00
600.
412
0.00
20co
nsta
nt−1
7.12
60.
0000
−10.
254
0.00
00−8
.731
0.00
00−1
0.83
30.
0000
Sou
rce:
Est
imat
ions
bas
ed o
n E
U-S
ILC
200
5 da
ta.
304 M. Giannetti et al.
Tabl
e 7.
Log
it r
egre
ssio
n on
bei
ng a
ble
to m
ake
ends
mee
t.
Cze
ch R
epub
lic
Hun
gary
Pol
and
Slo
veni
a
Coe
f.P
>z
Coe
f.P
>z
Coe
f.P
>z
Coe
f.P
>z
logh
inco
me∼
q1.
912
0.00
001.
025
0.00
001.
289
0.00
001.
266
0.00
00d_
rem
itta
nces
0.12
3−0
.523
0−0
.241
−0.0
340
−0.2
47−0
.063
0−0
.229
−0.2
950
d_w
elfa
re−0
.401
−0.0
100
−0.4
15−0
.001
0−0
.804
0.00
00−0
.714
0.00
00p_
age
−0.1
100.
0000
−0.0
970.
0000
−0.1
450.
0000
−0.1
120.
0000
p_ag
esqu
are
0.00
10.
0000
0.00
10.
0000
0.00
10.
0000
0.00
10.
0000
d_m
ale
0.17
4−0
.117
00.
384
0.00
000.
218
0.00
00−0
.030
−0.6
430
d_m
arri
ed0.
190
−0.1
540
0.37
3−0
.002
00.
276
−0.0
020
0.29
80.
0000
d_ba
dhea
lth
−0.6
760.
0000
−0.9
430.
0000
−0.6
260.
0000
−0.8
910.
0000
d_gr
adua
ted
0.36
4−0
.030
01.
008
0.00
001.
074
0.00
001.
131
0.00
00d_
uppe
rsec
onda
ry0.
034
−0.7
930
0.31
9−0
.001
00.
415
0.00
000.
387
0.00
00d_
reti
red
0.24
8−0
.268
0−0
.228
−0.1
510
0.15
7−0
.114
00.
164
−0.2
690
d_w
orke
r0.
533
−0.0
070
−0.0
75−0
.571
00.
481
0.00
000.
295
−0.0
270
d_ow
ner
0.20
4−0
.023
0−0
.107
−0.3
490
0.19
80.
0000
0.00
9−0
.926
0d_
sing
le0.
283
−0.0
760
0.69
10.
0000
0.27
3−0
.015
00.
078
−0.5
700
d_no
chil
d−0
.032
−0.8
270
0.06
7−0
.621
0−0
.133
−0.1
860
−0.2
65−0
.015
0d_
sing
lew
ithc
hild
−0.2
29−0
.470
00.
220
−0.4
030
−0.1
12−0
.585
0−0
.037
−0.8
810
d_ch
ild
−0.1
01−0
.612
00.
058
−0.7
480
−0.0
65−0
.552
00.
115
−0.4
050
cons
tant
−15.
209
0.00
00−8
.009
0.00
00−9
.259
0.00
00−1
0.12
10.
0000
Sou
rce:
Est
imat
ions
bas
ed o
n E
U-S
ILC
200
5 da
ta.
International Review of Applied Economics 305
Notes1. For a comprehensive survey on the theoretical and empirical economic literature on
migrants’ remittances see Rapoport and Docquier (2006). See also Woodruff and Zenteno(2007) and Sorensen and Pedersen (2002).
2. World Bank (2006).3. It has to be stressed that all results reported in this section have been computed by using
the household sample weights provided in the EU-SILC dataset. The ‘household’ is the unitof analysis and individual information used in some computations (e.g. educationalattainment and sex) refer to the household reference individual. Money amounts are alwaysreported in euros.
4. EU-SILC survey records, as welfare transfers (i.e. social benefits) at the household level,the ones corresponding to one of two criteria: coverage for the group in question is compul-sory; it is based on the principle of social solidarity (i.e. if it is an insurance-based pension,the premium and entitlements are not proportional to the individual exposure to risk of thepeople protected).
5. It has to be stressed that not all remittance recipients also receive welfare transfers(compare the second and fourth columns in Table 1). It also must be pointed out that somehouseholds, in order not to lose the entitlement to means-tested welfare benefits might notdeclare that they are receiving transfers from abroad (this applies also to the EU-SILCsurvey).
6. As stressed previously, this cannot be interpreted as a definite (causal) signal that remit-tances go to less advantaged households. In order to state some assertions we should firstknow the true income distribution of counterfactual pre-remittances. Remittance recipientscould have a lower income from other sources because they expect to receive a largeamount of money from their migrant-relatives.
7. It has to be stressed that remittances could increase inequality and poverty if they wererelatively better directed to well-off individuals. In this case the Gini coefficient increasesand, through a growth in the level of median income (i.e. the base of the poverty threshold),poverty ratios and gaps could increase too.
8. In line with the World Bank definition, the poverty gap is computed as the mean distancefrom the poverty line of individual incomes below the poverty threshold (60% of themedian income).
9. In each country the question specifically refers to a specific amount linked to the nationalpoverty line. The exact wording of the question is ‘Could your household afford an unex-pected required expense (of a specific amount, country specific) with its own resources?’,where own resources mean that household cannot ask for financial help from anybody, theaccount has to be debited within one month and the household situation regarding potentialdebts does not deteriorate.
10. Answers to the question are recorded through a dichotomised variable (yes or no).11. The question records the household respondent’s assessment of the level of difficulty expe-
rienced by the household in making ends meet, where the level is categorised by a qualita-tive ordinal variable with six modalities (great difficulty, difficulty, some difficulty, fairlyeasily, easily, very easily). Bearing in mind the household’s total monthly income, once canobserve at which level of difficulty the household is able to pay its usual expenses.
12. We aggregate records about ability to make ends meet in a dummy variable, that assumesthe value 0 if individuals are able to do so with difficulty or great difficulty, value 1 otherwise.
13. In the logit regressions information about the amount of remittances and welfare transfersis not considered – only the recipiency status is used as a dummy variable.
ReferencesAdams, R. 1989. Worker remittances and inequality in rural Egypt. Economic Development
and Cultural Change 38, no. 1: 45–71.Adams, R. 1992. The effects of migration and remittances on inequality in rural Pakistan.
Pakistan Development Review 31: 110–33.Adams, R. 2006. Remittances, poverty, and investment in Guatemala. In International migra-
tion, remittances and the brain drain, ed. C. Ozden and M. Schiff, 53–80. Washington,DC: World Bank.
306 M. Giannetti et al.
Atkinson, A.B., and J. Micklewright. 1992. Economic transformation in Eastern Europe andthe distribution of income, Cambridge: Cambridge University Press.
Barham, B., and S. Boucher. 1998. Migration remittances and inequality: estimating thenet effect of migration on income distribution. Journal of Development Economics 55:307–31.
Brown, P.C., and E. Jimenez. 2007. Estimating the net effects of migration and remittances onpoverty and inequality. UNU-WIDER Research Paper No. 2007/23. United NationsUniversity, Finland.
Cornelius, W.A. 1990. Labour migration to the United States: Development outcomes andalternative in Mexican communities. Study of International Migration and CooperativeEconomic Development, No. 38.
Duryea, S., E. Lopes Córdova, and A. Olmedo. 2005. Migrant remittances and infant mortality:evidence from Mexico. Mimeo. IADB, Washington, DC.
European Central Bank. 2008. Convergence Report. Frankfurt am Main, Germany.Giannetti, M., and M. Nuti. 2007. The European social model and its dilution as a conse-
quence of EU enlargement. TIGER Working Paper No. 105, Poland.Glytstos, N.P. 2002. A macroeconometric model of the effects of migrant remittances in
Mediterranean countries. In Human capital: population economics in the Middle East, ed.A.H. Sirageldin. Cairo: American University in Cairo Press.
Guest, P. 1998. Assessing the consequences of internal migration: methodological issues anda case study on Thailand based on longitudinal household survey data. In Migration,urbanization and development: new directions and issues, ed. R. Bilsborrow. Norwell,MA: United Nations.
Hugo, G.J. 2003. Asian experiences in remittances. In Beyond small change: migrantsremittances and economic development, ed. D. Terry et al. Baltimore, MD: IADB andJohn Hopkins University Press.
Jongwanich, J. 2007. Workers’ remittances, economic growth and poverty in developing Asiaand the Pacific countries. UN ESCAP Working Paper WP/07/01: 275-18.
Kerr, B. 1996. Labour migration from South Asia: patters and economic implications. InDevelopment Strategy, Employment and Migration, ed. D. O’Connor and L. Farsakh.Paris: OECD.
León-Ledesma, M., and M. Piracha. 2004. International migration and the role of remittancesin Eastern Europe. Discussion Paper No. 01/13, University of Kent, Canterbury.
Markova, E. 2006. Gaining from Migration: Albania case study. OECD Development Centre,Paris.
McCormick, B., and J. Wahba. 2003. Return international migration and geographicalinequality: the case of Egypt. Journal of African Economies 12, no. 4: 500–32.
Milanovic, B. 1987. Remittances and income distribution. Journal of Economic Studies 14,no. 5: 24–37.
Oberai, A.S., Pradhan H. Prasad, and M.G. Sardana. 1989. Determinants and consequences ofinternal migration in India. Delhi: Oxford University Press.
Rapoport, H., and F. Docquier. 2006. The economics of migrants’ remittances. In Handbookon the economics of giving, altruism and reciprocity, ed. S. Kolm and J. M. Ythier.Amsterdam: North-Holland.
Russell, S. 1992. Migration, remittances and development. International Migration 30, nos.3–4: 267–88.
Sorensen, N., and P. Pedersen. 2002. The Migration and Development Nexus: Evidenceand Policy Options. Policy Study, Center for Development Research (CDR),Copenhagen.
Stark, O., J.E. Taylor, and S. Yitzhaki. 1988. Migration, remittances and inequality. A sensi-tivity analysis using the extended Gini index. Journal of Development Economics 28,no. 3: 309–22.
Stark, O., J.E. Taylor, and S. Yitzhaki. 1986, Remittances and inequality. The EconomicJournal 96, no. 383: 722–40.
Taylor, J.E. 1992. Remittances and inequality reconsidered: direct, indirect and intertemporaleffects. Journal of Policy Modelling 14, no. 2: 187–208.
Taylor, J.E. 1999. The new economics of labour migration and the role of remittances in themigration process. International Migration 37, no. 1: 63–88.

International Review of Applied Economics 307
Taylor, J.E., and T.J. Wyatt. 1996. The shadow value of migrant remittances, income andinequality in a household–farm economy. The Journal of Development Studies 32, no. 6:899–912.
Viet, C.N. 2008. Do foreign remittances matter to poverty and inequality? Evidence fromVietnam. Economics Bulletin 15, no. 1: 1–11.
Woodruff, C., and R. Zenteno. 2007. Migration networks and microenterprises in Mexico.Journal of Development Economics 82, no. 2: 509–28.
World Bank. 2006. Global economic prospects 2006: economic implications of remittancesand migration. Washington, DC: World Bank.
Yang, D., and C. Martinez. 2005. Remittances and poverty in migrants’ home areas: evidencefrom the Philippines. In International migration, remittances and the brain drain, ed. C.Ozden and M. Schiff. Washington, DC: World Bank.