
International Journal of Research in Modern Engineering and ...
678
-
Upload
khangminh22 -
Category
Documents
-
view
0 -
download
0
Transcript of International Journal of Research in Modern Engineering and ...


(ISSN: 2320-6586)
Online
International Journal of Research in
Modern Engineering and Emerging
Technology
(IJRMEET)
Vol. 5, Sp. Issue 9, September 2017
UGC Approved Online International Peer reviewed,
Indexed Journal
No part of this Journal may be reproduced in any form, by Photostat, Microfilm, Xerography,
or any other means, or incorporated into any information retrieval System, electronic or
mechanical, without the written permission of the Author, Editor-in-Chief and the Publisher
of this Journal.
Copyright ©2017 by: RAIJMR
Inc. All Rights Reserved
Published By
Rudra Education Trust (Regd.), 143 Gokuldham Society,
Modhera Road, Village: Dediyasan
Tehsil & Dist. Mehsana. Gujarat (India)
Powered By
Editor-in-Chief
RAIJMR
www.raijmr.com

NATIONAL INSTITUTE OF SCIENCE COMMUNICATION
AND INFORMATION RESOURCES
(Council of Scientific and Industrial Research)
14, Satsang Vihar Marg, New Delhi 110 067 &
Dr. K. S. Krishnan Marg (Near Pusa Gate) -110 012
Ms. V. V. Lakshmi, Head, National Science Library
Phone: 91-11-2686 3759
E-mail: [email protected] website: www.niscair.res.in
NSL/ISSN/INF/2013/467 Dated: February 28, 2013 President, Riddhi Education Trust, Gandhinagar, Gujarat Dear Sir/ Madam,
We are happy to inform you that the following serial(s) published by you has been
registered and assigned ISSN (Online)
ISSN 2320 – 6586 International Journal of Research in Modern Engineering and Emerging Technology (IJRMEET)
It is important that the ISSN should be printed on every issue preferably at the right
hand top corner of the cover page.
The Indian National Centre will be responsible for monitoring the use of ISSN
assigned to Indian Serials and for supplying up to-date data of the same to the
International Centre for ISSN, Paris. For this purpose we request you to send us the
forth coming issue of your serial on complimentary basis.
We solicit your co-operation in this regard.
Yours sincerely
(V.V. Lakshmi)
Head National Science Library
Please don’t forget to send a sample issue of the journal/URL with ISSN printed on it.
Contact : Ms. Shobhna Vij
e-mail : [email protected]
phone : 011-26516672

Inte
rnati
onal
Confe
rence
on
“R
ecent
Inn
ovati
on i
n S
cie
nce
and
Work
shop o
n S
pectr
oscopy &
it
s P
ers
pecti
ves”
15 –
16 S
ept
2017
Org
an
ize
d B
y
Ph
ysi
cs D
ep
art
men
t
Mu
nic
ipa
l A
rts
& U
rba
n S
cie
nce
Co
lle
ge
Me
hsa
na
, G
uja
rat,
In
dia
Co
lla
bo
rati
on
wit
h
Ph
ysi
cs D
ep
art
men
t
Sh
eth
M. N
. S
cie
nce
Co
lle
ge
Pa
tan
, G
uja
rat,
In
dia
RE
T I
nte
rnati
on
al
Aca
dem
ic P
ub
lish
ing
ISS
N:
2320
-6586
(On
lin
e)
As
so
cia
tio
n w
ith
Sp
on
so
red
By
Gu
jara
t C
ou
nci
l o
n S
cie
nce
a
nd
Te
chn
olo
gy
Su
pp
ort
ed
by
Con
fere
nce C
om
mit
tee
Pre
sid
ent
Mr.
An
ilb
hai
Pate
l P
resi
den
t, S
ard
ar V
idh
yabh
avan
Tru
st, M
ehsa
na
Ch
ief
Patr
on
Mr.
K. K
. P
ate
l M
.D., S
ard
ar V
idh
yabh
avan
Tru
st, M
ehsa
na
Patr
on
Dr.
Na
rott
am
Sah
oo,
Mem
ber
Sec
reta
ry &
Ad
vis
or,
GU
JCO
ST
.
Dr.
D.
R. P
ate
l P
rin
cip
al, M
un
icip
al A
rts
& U
rban
Sci
ence
Coll
ege,
Meh
san
a
Pro
f. A
. N
. S
wam
i
Pri
nci
pal
, S
het
h M
. N
. S
cien
ce C
oll
ege,
Pat
an.
Org
an
izin
g S
ecre
tary
Dr.
V.
D. P
ate
l H
ead
, P
hys
ics
Dep
artm
ent,
Munic
ipal
Art
s &
Urb
an
Sci
ence
Coll
ege,
Meh
san
a
Org
an
izin
g C
om
mit
tee
Ad
vis
or C
om
mit
tee
Dr.
Rai
ner
Dic
k,
Phy
sics
Dep
artm
ent,
Un
i. o
f S
ask
atch
ewan
, C
anad
a
Dr.
Zhu
xi
Yan
g,
Dep
artm
ent
of
Phy
sics
, Z
hej
iang
Un
iver
sity
, C
hin
a.
Dr.
CH
U, C
hin
g-C
hi,
Nat
ional
Cen
tral
Univ
ersi
ty, T
aiw
an.
Dr.
K.
S.
Par
ikh,
Pri
nci
pal
, C
. U
. S
hah S
cien
ce C
oll
ege,
Ah
med
abad
Dr.
S. C
. D
wiv
edi,
Ret
. H
ead,
Univ
ersi
ty o
f R
ajas
than,
Jaip
ur
Dr.
Manju
Aro
ra,
Nat
ional
Ph
ysi
cal
Labo
rato
ry,
New
Del
hi.
Dr.
A.
R. Ja
ni,
Dir
ecto
r, S
ICA
RT
, V
. V
. N
agar
Dr.
C.
G.
Lim
bac
hiy
a, D
epar
tmen
t o
f A
pp
lied
Ph
ysi
cs,
M.
S.
Un
iver
sity
.
Dr.
A.
N.
Pra
japat
i, D
epar
tmen
t o
f A
ppli
ed P
hy
sics
, M
. S
. U
niv
ersi
ty.
Dr.
M.
K. T
hak
ore
, C
hem
istr
y D
epar
tmen
t, S
cien
ce C
oll
ege,
Meh
sana
Dr.
M.
P.
Bhra
hm
bhat
t, C
hem
istr
y D
epar
tmen
t, S
cien
ce C
oll
ege,
Pat
an
Dr.
K.
G.
Pat
el,
Bio
log
y D
epar
tmen
t, S
cien
ce C
oll
ege,
Meh
sana
Dr.
N.
K.
Pat
el,
Bo
tan
y D
epar
tmen
t, S
cien
ce C
oll
ege,
Pat
an
Mr.
J. H
. B
arot,
Mat
hem
atic
s D
epar
tmen
t, S
cien
ce C
oll
ege,
Meh
sana.
Mr.
A. J.
Pat
el,
Mat
hem
atic
s D
epar
tmen
t, S
cien
ce C
oll
ege,
Meh
sana
Dr.
K.
B.
Pat
el,
Zoo
log
y D
epar
tmen
t, S
cien
ce C
oll
ege,
Pat
an
Mr.
R.
A.
So
ni,
Bio
tech
nolo
gy D
epar
tmen
t, S
cien
ce C
oll
ege,
Meh
sana
Dr.
R.
J. P
athak
, C
hai
rman
, B
OS
& D
ean,
Sci
ence
Fac
ult
y,
HN
GU
, P
atan
Dr.
J. J.
Vora
, H
ead,
Ch
emis
try
Dep
artm
ent,
H.N
.G.U
., P
atan
Dr.
D.
G.
Vyas,
Hea
d,
Phy
sics
Dep
artm
ent,
H.N
.G.U
., P
atan
Prof.
J. M
. K
ad
iya
Prof.
S. N
. P
an
dy
a
Prof.
D. K
. P
ate
l
Prof.
D. I.
Pa
tel
Prof.
K.
C. M
eva
da
Dr. S
. R
. S
uth
ar
Prof.
M.
R.
Ch
au
dh
ary
D
r. P
. G
. C
hau
dh
ary
P
rof.
M. J. P
ind
ariy
a
Dr. A
. N
. P
ate
l P
rof.
D. D
. Josh
i D
r. K
. R
. P
ate
l P
rof.
N. H
. T
hak
kar
P
rof.
R. J. P
arm
ar
Ph
ysi
cs D
epart
men
t M
un
icip
al
Art
s &
Urb
an
Scie
nce
Co
lleg
e,
Meh
san
a
Ph
ysi
cs D
epart
men
t S
heth
M.
N.
Scie
nce C
oll
eg
e,
Pata
n

Ab
ou
t C
on
feren
ce &
Work
shop
Th
e In
tern
ati
on
al
Con
fere
nce
is
p
lan
ned
to
org
an
ize
by
Ph
ysi
cs D
epa
rtm
ents
of
Mu
nic
ipal
Art
s &
Urb
an
Sci
ence
Coll
ege
in co
llab
ora
tion
w
ith
P
hysi
cs D
epart
men
t, S
het
h
M.
N.
Sci
ence
Coll
ege,
Pata
n.
Th
e m
ain
ob
ject
ive
of
this
con
fere
nce
is
to b
rin
g t
oget
her
facu
ltie
s, r
esea
rch
sch
ola
rs,
stu
den
ts a
nd
in
du
stri
al
exp
erts
aro
un
d t
he
glo
be,
to p
rovid
e
a p
latf
orm
to p
rese
nt
thei
r re
searc
h r
esu
lts.
Th
is c
om
es i
n
ap
pro
pri
ate
ti
me
to
esta
bli
sh
an
ef
fect
ive
chan
nel
to
exch
an
ge
new
id
eas
an
d d
evel
op
men
t act
ivit
ies
in t
he
fiel
ds
of
Sci
ence
s. T
his
wil
l off
er g
reate
r op
port
un
ity t
o e
xp
lore
inn
ova
tive
an
d
inte
llig
ent
co
nce
pts
an
d
oth
er
ad
van
ced
pro
cess
in
wid
e ra
nge
of
ap
pli
cati
on
s.
Ab
ou
t O
rg
an
izin
g C
oll
ege
Mu
nic
ipa
l A
rts
& U
rban
Sci
ence
Coll
ege
was
esta
bli
shed
in
1964 a
nd
is
run
by S
ara
dar
Vid
ya B
havan
Tru
st,
Meh
san
a
an
d
aff
ilia
ted
w
ith
H
emch
an
dra
chary
a
Nort
h
Gu
jara
t
Un
iver
sity
, P
ata
n.
Th
e co
lleg
e h
as
bee
n c
hose
n a
s C
PE
by
UG
C.
Th
e gre
en a
nd
cle
an
cam
pu
s is
sit
uate
d i
n t
he
hea
rt o
f
the
city
. I
nst
itu
te r
un
UG
an
d P
G c
ou
rses
in
Art
s &
Sci
ence
facu
ltie
s.
Sci
ence
fa
cult
y
off
ered
C
hem
istr
y,
Ph
ysi
cs,
Math
ema
tics
, B
ota
ny,
Bio
tech
nolo
gy
cou
rses
. T
he
aim
of
this
in
stit
ute
is
to s
pre
ad
th
e sp
irit
of
edu
cati
on
in
th
e fi
eld
of
inte
llec
tual,
mora
l, p
hysi
cal, i
nd
ust
rial, c
om
mer
cial,
art
s,
law
an
d a
gri
cult
ura
l an
d r
elate
d a
ctiv
itie
s. C
on
seq
uen
tly t
he
ob
ject
ive
is
to
start
an
d
man
age
inst
itu
tion
s of
hig
her
edu
cati
on
.
Ab
ou
t C
oll
ab
ora
tin
g C
oll
ege
Sh
eth
M
. N
. S
cien
ce
Coll
ege
was
start
ed
in
1959 an
d is
man
ag
ed b
y N
ort
h G
uja
rat
Ed
uca
tion
Soci
ety,
Mu
mb
ai
an
d
aff
ilia
ted
w
ith
H
emch
an
dra
charya
Nort
h
Gu
jara
t
Un
iver
sity
, P
ata
n.
Th
e co
lleg
e h
as
bee
n c
hose
n a
s C
PE
by
UG
C.
Th
e
inst
itu
te
off
ered
C
hem
istr
y,
Ph
ysi
cs,
Math
ema
tics
, B
ota
ny,
Zoolo
gy c
ou
rses
. C
oll
ege
has
exce
llen
t
infr
ast
ruct
ure
an
d c
on
gen
ital
envir
on
men
t, w
hic
h p
rovid
es
stu
den
ts a
pla
tform
to e
xh
ibit
th
eir
pote
nti
ali
ty i
n t
he
fiel
d
of
hig
her
ed
uca
tion
. T
he
inst
itu
te b
oast
s of
big
cla
ssro
om
s,
wel
l eq
uip
ped
lab
ora
tori
es,
pro
sper
ou
s li
bra
ry,
hu
ge
sport
s
cam
pu
s,
wel
l d
esig
ned
b
ota
nic
al
gard
en,
an
d
hig
hly
qu
ali
fied
& w
ell
exp
erie
nce
d f
acu
lty m
emb
ers
CA
LL
FO
R P
AP
ER
S
Th
e O
rga
niz
er
cord
iall
y
invit
es
full
le
ng
th
rese
arch
pap
ers
fro
m
all
over
the
Worl
d
to
part
icip
ate
in
th
e
con
fere
nce
. T
his
is
the
prem
ier
foru
m f
or
the
pres
en
ta-
tion
of
new
ad
va
nces
an
d r
ese
arc
h r
esu
lts
in t
he
fiel
ds
of
Ph
ysi
cal
Sci
en
ces
an
d C
hem
ical
scie
nce
s fo
r su
stain
ab
le
dev
elop
men
t. T
he p
ap
ers
sh
ou
ld b
e
ori
gin
al
an
d u
np
ub
-
lish
ed r
esea
rch
work
. A
ll s
ub
mit
ted
ma
nu
scri
pts
wil
l b
e
scru
tin
ized
fo
r p
eer
revie
w
an
d
the
ou
tcom
es
wil
l b
e
noti
fied
to
th
e re
spec
tiv
e a
uth
ors
w
ith
in
15
d
ays
of
sub
mis
sion
.
All
Sel
ecte
d p
ap
ers
wil
l b
e p
ub
lish
ed i
n U
GC
ap
prov
ed
inte
rn
ati
on
al
e-J
ou
rn
al
ha
vin
g I
SS
N N
o.
Tra
ck &
Mod
e o
f P
rese
nta
tion
Tra
ck -
1:
Ph
ysi
cal
Sci
ence
s
(Su
gg
est
ed
fie
ld b
ut
no
t li
mit
ed
)
Ap
pli
ed P
hysi
cs,
Cry
stall
ogra
ph
y,
Th
eore
tica
l &
Com
pu
ta-
tion
al
Ph
ysi
cs,
Con
den
se
matt
er P
hysi
cs,
Bio
ph
ysi
cs,
Nu
-
clea
r P
hysi
cs,
Op
tica
l P
hysi
cs,
Sem
icon
du
ctors
dev
ices
an
d
Ph
oto
nic
s, O
pto
-ele
ctro
nic
s, N
an
o-s
cien
ce, T
her
mal
scie
nce
.
Tra
ck -
2:
Ch
emic
al
Sci
ence
s
(Su
gg
est
ed
fie
ld b
ut
no
t li
mit
ed
)
Inorg
an
ic
Ch
emis
try,
Org
an
ic
Ch
emis
try,
Ph
ysi
cal
Ch
emis
try,
Ind
ust
rial
Ch
emis
try, B
io C
hem
istr
y,
Med
ical
&
Ph
arm
ace
uti
cal
Ch
emis
try, M
ate
rial
Sci
ence
,
Pap
er P
rese
nta
tion
Mod
e of
Pre
sen
tati
on
: O
ral
an
d P
ost
er
Ora
l: M
ult
imed
ia P
rese
nta
tion
of
15 m
in (
Incl
ud
ing Q
&A
)
Post
er:
1 m
eter
X 1
met
er p
ost
er
Pa
per S
ub
mis
sio
n
Th
e p
ap
ers
shou
ld b
e se
nt
in M
icro
soft
docu
men
t fo
rmat
(.d
oc
or
.docx
) to
th
e su
bm
issi
on
.icr
is@
gm
ail
.com
. A
uth
or
mu
st m
enti
on
tr
ack
an
d m
od
e of
pre
sen
tati
on
in
th
e su
bje
ct
(i.e
. S
ub
ject
: S
ub
mit
tin
g
man
usc
rip
t -
Ph
ysi
cal
Sci
ence
-
Ora
l P
rese
nta
tion
)
Dow
nlo
ad
Au
thor
Gu
idel
ine
Con
trib
uto
r
F
acu
ltie
s of
Ph
ysi
cal
Sci
ence
, C
hem
ical
Sci
ence
.
P
ost
gra
du
ate
an
d P
h.
D.
Stu
den
ts o
f P
hysi
cal
Sci
ence
an
d C
hem
ical
Sci
ence
.
In
du
stry
Del
egate
s fo
rm C
on
cern
fie
ld
Imp
orta
nt
Date
Fu
ll P
ap
er S
ub
mis
sion
En
d D
ate
: 30th
Au
gu
st 2
017
Regis
trati
on
& A
ccom
mod
ati
on
Ven
ue &
How
to R
each
Ven
ue
Ph
ysi
cs D
epart
men
t, M
un
icip
al
Art
s &
Urb
an
ban
k S
cien
ce
Coll
ege,
N
ag
alp
ur,
M
eh
san
a-A
hm
edab
ad
H
igh
wa
y,
Meh
san
a, G
uja
rat,
In
dia
, P
IN-3
84002
How
to r
each
T
he
nea
rest
air
port
is
S
ard
ar
Vall
ab
hb
hai
Pate
l In
tern
a-
tion
al
Air
port
at
Ah
med
ab
ad
(75 K
m).
It i
s als
o c
on
nec
ted
by r
ail
to o
ther
majo
r ci
ties
in
In
dia
.
Th
ere
are
d
ail
y
train
s to
an
d
from
D
elh
i an
d
Mu
mb
ai,
Ban
galo
re e
tc.
It is
co
nn
ecte
d b
y ro
ad
w
ith
m
ajo
r ci
ties
of
Gu
jara
t li
ke
Ah
mad
ab
ad
, G
han
dh
inagar,
S
ura
t,
Vad
od
ara
, R
ajk
ot
etc.
via
sta
te h
igh
ways.
Re
gis
tra
tio
n T
yp
e
Re
gis
tra
tio
n
Fe
es
Facu
lty f
rom
In
sti
tute
IN
R 1
250/-
Facu
lty f
rom
Org
an
izin
g &
Co
llab
ora
tin
g In
sti
tute
s
INR
500/-
Stu
den
ts
INR
1000/-
Ind
ustr
y D
ele
gate
s
INR
1500/-
Fo
reig
n D
ele
gate
s
US
D 1
00/-
A
ccom
mod
ati
on
wil
l b
e p
rovid
ed o
n f
irst
co
me
firs
t b
ase
s.
L
iste
ner
ca
n
reg
iste
r
by
se
nd
ing
e
ma
il
to
sub
mis
sion
.icri
s@gm
ail
.com
Noti
fica
tion
of
Acc
epta
nce
: w
ith
in 1
5 d
ays
of
sub
mis
sion
Reg
istr
ati
on
Dea
d l
ine:
05th
Sep
t 2017
Con
fere
nce
Date
: 15-1
6 S
ept
2017
Fu
ll P
ap
er S
ub
mis
sion
sta
rt D
ate
: 1st
Ju
ly 2
017

i
International Journal of Research in
Modern Engineering and Emerging
Technology
(IJRMEET)
VOL. 5, SP. ISSUE 9, SEPTEMBER, 2017
SR.
NO.
CONTENTS PG.
NO.
1 AN INTRODUCTION OF ARDUINO AND ITS PHARMACEUTICAL
APPLICATION
JOSHI NISARG CHANDRAKANT
1-6
2 EXPERIMENTAL PERFORMANCE ANALYSIS OF EVACUATED TUBES
COUPLED DOUBLE BASIN SOLAR STILL WITH PIN FIN
HITESH PANCHA
7-15
3 THERMAL ANALYSIS OF SOME METAL CHELATES OF NICKEL AND
COPPER
K P PATEL
16-20
4 STUDY OF GROWTHFEATURESAND ETCHING ON IN2SE3-XSBX(X= 0.3)
SINGLE CRYSTALS
PIYUSH J. PATEL ET AL.
21-29
5 ULTRASONIC AND VOLUMETRIC STUDY IN THE SOLUTIONS OF
ALKANOLS WITH AQUEOUS ETHYLENE GLYCOL
CHINTU J PATEL
30-36
6 MOBILE CONTROLLED ROBOT WITHOUT MICROCONTROLLER
PATEL VIRENDRAKUMAR N.
37-42
7 A STUDY ON THE PEAK DST AND PEAK NEGATIVE BZ
RELATIONSHIP DURING INTENSE GEOMAGNETIC
NIRAV H THAKKAR ER AL.
43-49
8 THERMODYNAMIC AND TRANSPORT PROPERTIES OF ALIPHATIC
ALCOHOLS WITH AQUEOUS ETHYLENE GLYCOL
CHINTU J PATEL
50-56
9 INFRARED SPECTRA OF TERNARY COMPLEXES USING BENZIDINE
AND QUINOLINE AS DONORS
ASHOK N. PATEL
57-73
ii
SR.
NO.
CONTENTS PG.
NO.
10 ELASTIC PROPERTIES OF TITANIUM-BASED TI44ZR20V36 BULK
METALLIC GLASS
P.G. CHAUDHARI ET AL.
74-82
11 THEORETICAL STUDY OF ELECTRICALRESISTIVITY( )
OF SOME LIQUID ALKALI ELEMENTS
MAYANK H. JANI ET AL.
83-88
12 COUPLING OF THE SOLAR PHOTOSPHERE AND THE CORONA
JITESH M RAMI
89-99
13 EFFECT OF CONCENTRATION OF TEA AND ANNEALING
TEMPERATURE ON BAND GAP OF ZNO: A REVIEW
VIPUL J. SHUKLA ET AL.
100-106
14 ASPHERICITY IN THE FERMI SURFACE OF SOME ALKALINE EARTH
METALS
P. H. SUTHAR ET AL.
107-115
15 DIELECTRIC PROPERTIES OF AMMONIUM DIHYDROGEN
PHOSPHATE (ADP)
VIMAL PATEL ET AL.
116-122
16 CRYSTAL GROWTH AND ETCHING OF INX BI(2-X)SE3 ( X = 0.05)
SINGLE CRYSTAL
HIMANSHU PAVAGADHI ET AL.
123-129
17 STUDY OF TIN SELENIDE NANOPARTICLES PREPARED BY TWO
DIFFERENT METHODS
R.J.PARMAR ET AL.
130-134
18 EFFECT OF DEPOSITION TEMPERATURE ON STRUCTURAL
PROPERTIES OF CHEMICALLY DEPOSITED SNSE THIN FILMS
V. R.SOLANKI ET AL.
135-140
19 SYNTHESIS, CHARACTERIZATION AND FUNCTIONALIZATION OF
MULTI-WALLED CARBON NANOTUBES BY CHEMICAL VAPOUR
DEPOSITION METHOD
PARTH JOSHI ET AL.
141-147
20 ACOUSTICAL PROPERTIES OF AQUEOUS SOLUTIONS OF
PARACETAMOL AT DIFFERENT TEMPERATURES
T. R. PANDIT
148-154
21 PHONON DISPERSION CURVES AND ELASTIC MODULI FOR SN-PB
LIQUID METALLIC ALLOY
A. B. PATEL ET AL.
155-162
22 KINETIC STUDIES OF SORPTION OF ZINC IONS ONTO ACTIVATED
CARBON
PARTH JOSHI ET AL.
163-170
23 STUDY OF ATOMIC FORCE MICROSCOPY ON TUNGSTEN
DISELENIDE SINGLE CRYSTALS DOPED BY COPPER
M. N. PARMAR
171-177
24 SORPTION STUDY OF CADMIUM ION USING ACTIVATED CARBON
PARTH JOSHI ET AL.
178-183

iii
SR.
NO.
CONTENTS PG.
NO.
25 TAILORING OF CU CRYSTAL PHASE WITHNON-FACE CENTRED
CUBIC PHASE: THE TETRAGONAL PHASE
GHANSHYAM R. PATEL ET AL.
184-187
26 ULTRASONIC VELOCITY AND DENSITY OF BINARY MIXTURES OF 1-
BUTYL-3- METHYLIMADAZOLIUM AND METHANOL AT 293.15 K
D. K. BAROT ET AL.
188-193
27 VERTICAL GROWTH OF VAN DER WALL’S HETEROSTRUCTURE BY
DEPOSITING SNSE THIN FILMS ON TO CRYSTALLINE WSE2 AND ITS
CHARACTERIZATION
CHETAN K. ZANKAT ET AL.
194-200
28 OPTICAL PROPERTIES OF PURE AND OFF-STOICHIOMETRIC TIN
SELENIDE SINGLE CRYSTALS
MOHIT TANNARANA ET AL.
201-205
29 DISHARMONIC IDENTIFICATION OF EEG DATA THROUGH WAVELET
TRANSFORM
DHWANILNATH GHAREKHAN ET AL.
206-215
30 QUARKONIUM : A COMPARISON WITH POSITRONIUM
TANVI BHAVSAR ET AL.
216-219
31 THEORETICAL STUDY OF KNIGHT-SHIFTS IN LIQUID ALKALI
METALS
A. M. VORA ET AL.
220-225
32 SOME STATIC AND VIBRATIONAL PROPERTIES OF STRONTIUM
USING LOCAL PSEUDOPOTENTIAL
B.S. PANDYA ET AL.
226-237
33 ELECTRON INDUCED INTERACTIONS CROSS SECTIONS FOR
METHANIMINE (CH2NH)
YOGESH THAKAR ET AL.
238-242
34 ELECTRON INDUCED IONIZATION CROSS SECTIONS FOR CARBON-
TETRAFLOURIDE(CF4)
RAKESH BHAVSAR ET AL.
243-247
35 DIELECTRIC PROPERTIES OF BINARY MIXTURES OF METHYL ISO
BUTYL KETONE AND DIMETHYL SILICONE FLUID
KUNJANN.SHAH ET AL.
248-254
36 CONTINUOUS WAVELET TRANSFORM ON SOIL DATA-A STUDY OF
SURENDRANAGAR DISTRICT OF GUJARAT
PRAKASH H. PATEL ET AL.
255-263
37 ELECTRON IMPACT IONIZATION OF CARBON AND SILICON BASED
MOLECULES
HITESH YADAV ET AL.
264-270
38 THE STUDY OF LATTICE DYNAMICS AND LATTICE MECHANICAL
PROPERTIES USING FIRST PRINCIPLES LOCAL PSEUDOPOTENTIAL
KAMALDEEP G BHATIA
271-276

iv
SR.
NO.
CONTENTS PG.
NO.
39 STUDY OF MOLECULAR INTERACTIONS IN AQUEOUS SOLUTIONS
OF DICLOFENAC POTASSIUM THROUGH ACOUSTICAL PARAMETERS
JIGNA B. KARAKTHALA ET AL.
277-282
40 STUDY OF ELECTRODE POLARIZATION AND IONIC CONDUCTIVITY
RELAXATION IN BINARY MIXTURES OF 3-BROMOANISOLE AND
METHANOL AT 293.15 K
HEMALKUMAR P. VANKAR ET AL.
283-289
41 PROTEIN-LIGAND DOCKING STUDIESOF NOVEL SILVER COMPLEX
OF 4-AMINO-N-(4,6-DIMETHYL-2-PYRIMIDINYL)BENZENE
SULFONAMIDE
BHAVESH N. SOCHA ET AL.
290-299
42 ELASTIC PROPERTIES OF MG65CU25TB10 BULK METALLIC
GLASS USING PSEUDOPOTENTIAL THEORY
A .C. KHUNT ET AL.
300-307
43 THE THEORETICAL STUDY OF ELECTRON DISPERSION CURVES OF
SOME DIVALENT AND TRIVALENT RARE EARTH METALS
HIRAL PATEL ET AL.
308-313
44 TOTAL IONIZATION CROSS SECTIONS OF TRANSITION ATOMS
Y. BAROT ET AL.
314-325
45 INVESTIGATION OF RESISTIVITY AND ACTIVATION ENERGY OF
WSE2 CRYSTAL WITH TEMPERATURE
DR.B.A.THAKAR ET AL.
326-335
46 TOTAL SCATTERING CROSS SECTIONS CALCULATIONS FOR
ELECTRON IMPACT ON CF2 RADICAL
M. Y. BAROT ET AL.
336-357
47 FREQUENCY AND TEMPERATURE DEPENDENT DIELECTRIC STUDY
OF MOSE2 CRYSTALS
DIPAK SAHAY ET AL.
358-366
48 EXACT SOLUTION OF SCHRODINGER EQUATION WITH HARMONIC
PLUS INVERSE SQUARE PLUS NON CENTRAL POTENTIAL VIA
NIKIFOROV-UVAROV METHOD
RAJENDRASINH H PARMAR
36-375
49 TEMPERATURE DEPENDENT ELECTRICAL RESISTIVITY OF WSXSE2-
X (X = 2, 1.5, 0.5) CRYSTALS
PAYAL CHAUHAN ET AL.
376-380
50 GROWTH AND ANISOTROPIC BEHAVIOR OF GES0.5GE0.5 SINGLE
CRYSTALS GROWN USING DIRECT VAPOUR TRANSPORT
TECHNIQUE
DIPIKA B. PATEL ET AL.
381-388
51 STUDY ON FOURIER TRANSFORM INFRARED (FTIR) SPECTROSCOPY
OF CHARGE TRANSFER COMPLEXES (CTCS) OF UBIQUINONE
(COENZYME Q10) AND MENAQUINONE (VITAMIN K2)
D. N. BHAVSAR ET AL.
389-405

v
SR.
NO.
CONTENTS PG.
NO.
52 SYNTHESIS AND CHARACTERIZATION OF PURE AND MG DOPED
ZNO THIN FILMS AND NANORODS
KAUSHAL V. KADIYA
406-412
53 INFRARED SPECTRA OF TERNARY COMPLEXES USING BENZIDINE
AND QUINOLINE AS DONORS
ASHOK N. PATEL ET AL.
413-428
54 GROWTH CHARACTERIZATION AND STUDIES OF SOME MIXED
TARTRATE SINGLE CRYSTAL
SANJAY B.KANSARA ET AL.
429-436
55 PREPARATION AND CHARACTERIZATION OF ACTIVATED CARBON
PRODUCED FROM AZADIRACHTA INDICA (NEEM LEAF)
PARTH JOSHI ET AL.
437-442
56 SYNTHESIS AND CHARACTERISATION OF SOME ACID DYES BASED
ON 4, 4’-DIAMINO DIPHENYL AMINE DERIVATIVE AND THEIR
APPLICATION ON VARIOUS FIBRES
YOGESH S. PATEL ET AL.
443-451
57 A COMPARATIVE STUDY ON PHOTOCATALYTIC ACTIVITY OF ZNO,
ZNS AND THEIR COMPOSITE
BASANT K. MENARIYA ET AL.
453-461
58 WATER QUALITY STUDY OF GROUNDWATER OF BHABHAR
TALUKA (BANASKANTHA DISTRICT, GUJARAT STATE, INDIA)
KIRAN V. MEHTA
462-466
59 NOVEL 1,3,4-OXADIAZOLE DERIVATIVES CONTAINING FURAN
RING: SYNTHESIS, CHARACTERIZATION, ANTIMICROBIAL ASPECTS
DARSHANSINH AJITSINH RAOL ET AL.
467-476
60 STUDY OF THERMODYNAMIC PARAMETERS AND ACTIVATION
ENERGY FROM TGA OF SYNTHESIZED NEW TERNARY TRANSITION
METAL COMPLEXES
DHARA PATEL ET AL.
477-484
61 METHOD DEVELOPMENT AND VALIDATION OF MEBENDAZOLE BY
RP HPLC TECHNIQUE
AMI PATEL ET AL.
485-493
62 COMPARISON STUDY ABOUT PHYSICO-CHEMICAL ANALYSIS OF
GROUND WATER QUALITY OF SELECTED TWO TALUKAS OF
MEHSANA DISTRICT. (NORTH GUJARAT).
LIMBACHIYA M.C ET AL.
494-499
63 SYNTHESIS, CHARACTERIZATION AND BIOLOGICAL EVALUATION
OF SOME AZETIDINONES DERIVATIVES CONTAINING HYDRAZIDE
MOEITIES
MILANKUMAR ARJUNBHAI SHARDA ET AL.
500-509
64 A STUDY OF SALINITY OF GROUND WATER IN SOME SEMI-ARID
TRACTS IN KHERALU TALUKA OF GUJARAT
M.R.SOLANKI ET AL.
510-514

vi
SR.
NO.
CONTENTS PG.
NO.
65 PHOTOCATALYTIC DEGRADATION OF FAST GREEN DYE OVER
CUO/AL2O3 COMPOSITE
DEEPIKA PALIWAL ET AL.
515-524
66 STUDIES ON CHANGES OF PROTEIN IN LIVER OF TWO SPECIES OF
FISHES OFF JODIA COAST IN GULF OF KUTCH.
Y.M.KADIYANI ET AL.
525-529
67 SYNTHESIS AND ANTIMICROBIAL ACTIVITY OF 3-ARYL-5-(4’ N, N-
DIMETHYL AMINO PHENYL)-1-PHENYL PYRAZOLINES
DIGANT N.JOSHI ET AL.
530-534
68 REMOVAL OF COLOURED SUBSTANCE BY AGRICULTURAL
PRODUCT THROUGH ADSORPTION
KIRAN V. MEHTA
535-542
69 FORMATION OF SOME NOVEL ACID AZO DYES : SYNTHESIS,
CHARACTERISATION AND APPLICATION PROPERTIES :III
DR.D.G.PATEL ET AL.
543-552
70 A PRELIMINARY INVESTIGATION OF CYTOTOXIC AND GENOTOXIC
EFFECT OF NICOTINE ON HUMAN CELLS
SANDEEP CHOVATIYA
553-568
71 SYNTHESIS, CHARACTERIZATION AND GLASS REINFORCED
COMPOSITES BASED ON ARYLHYDRAZINO- EPOXY RESIN SYSTEM
DR.S.V.PATEL ET AL.
569-574
72 SYNTHESIS OF A SERIES OF NOVEL 1,3,4OXADIAZOLE CONTAINING
SEMICARBAZIDE (SC) AND THIOSEMICARBAZIDE (TSC) AS
POTENTIAL ANTIMICROBIAL AGENTS
VIKRAM N. PANCHAL ET AL.
575-589
73 SILICON OXIDE BASED INTERFACE LAYER COATING ON CARBON
FIBERS BY DIP COATING PROCESS FOR CARBON FIBER
REINFORCED SILICON CARBIDE COMPOSITES
HARSH VYAS T AL.
590-598
74 FORMULATION AND CHARACTERIZATION OF LIPID
NANOPARTICLES: APPRAISE ITS ANTI-INFLAMMATORY PROPERTY
WITH THERAPEUTIC DRUGS
VAISHWIK J. PATEL ET AL.
599-608
75 A COMPARATIVE STUDY ON PHOTOCATALYTIC ACTIVITY OF ZnO,
ZnS AND THEIR COMPOSITE
BASANT K. MENARIYA ET AL.
609-618
76 QUALITY OF UNDERGROUND WATER OF SOME SALINE TRACTS IN
BANASKANTHA DISTRICT
NIDHI K. PATEL ET AL.
619-625
77 EFFECT OF SOUND TREATMENT ON GERMINATION AND GROWTH
OF PLANT SEEDS
RAJIV D. VAIDYA ET AL.
626-632

vii
SR.
NO.
CONTENTS PG.
NO.
78 CHEMICAL BATH DEPOSITION AND CHARACTERIZATION OF ZNO
ROD-ARRAY FILMS
ANJANA KOTHARI ET AL.
633-641
79 HETERO-MOLECULAR INTERACTIONS IN BINARY MIXTURES USING
DIELECTRIC DATA
A. N. PRAJAPATI
642-651
80 E.P.R. STUDY OF PURE AND DOPED CALCIUM TARTRATE SINGLE
CRYSTALS
S. R. SUTHAR ET AL.
652-656
81 MAGNETIC NANOSTRUCTURE, NANO OPTICS AND ITS
APPLICATIONS
PARESH V MODH ET AL.
657-660

RET ACADEMY FOR INTERNATIONAL JOURNALS OF
MULTIDISCIPLINARY RESEARCH (RAIJMR)
Dear Author / Researcher,
I am very thankful to all the Authors and Researcher Scholars on behalf of our RET Academy
for International Journals of Multidisciplinary Research (RAIJMR) for publishing with us in our
Special issue; Vol. 5 Issue 9, Sept. 2017 of International Journal of Research in Modern
Engineering and Emerging Technology (IJRMEET) ISSN: 2320-6589.
The research work done by the Authors / Research Scholars will prove its high quality for
publication of the paper then after it is valid and reliable for publication in our Journal(s). This is
the main concern for publication of the paper. Not any type of importance is given to the
maintenance charges for publication of the paper.
The prime goal of the academy is to not only to enhance the research work worldwide but also
publishes high quality research work on online and International platform. To discover and find
out the research problems of education and implementation of their solution on the present
scenario of education is the entire aim of all the authors who are publishes their article via this
Journal.
I hope and request to all the Authors, Research Scholars, Readers and members of our advisory
board that kindly recommend and encourage your colleagues as well as your faculty members for
publishing with us.
I am much thankful to all the Dignitaries, Professors, Associate Editors, The Board Members
(India & International), Faculty Members, Political Leaders, Social Workers, Supporters,
Motivators, Authors, Web developers, Subscriber, Best Complimenters and my Family Members
for giving me their fruitful support to release this research work on Wide Area Network via
IJRMEET.
Thanks.
Editor-in-Chief
(RAIJMR)
www.raijmr.com

RET ACADEMY FOR INTERNATIONAL JOURNALS OF
MULTIDISCIPLINARY RESEARCH (RAIJMR)
About Us
RET Academy for International Journals of Multidisciplinary Research (RAIJMR) is an
Intentional academy for International Multidisciplinary Research. Under this title this academy
will publish research Journal(s) with different title(s). These all Journal(s) will publish monthly
one by one in English language.
The prime aim of the academy is to publish multidisciplinary Journals under the head of
RAIJMR and The aim and scope of the Journal is to provide an academic medium and an
important reference for the advancement and dissemination of research results that support high-
level learning, teaching and research in the fields of Management, Technology, Education,
Pharmacy, Humanities, Science, Engineering, Account & Commerce, Social Sciences, Law, etc.
The Journal publishes papers, review articles, and short communications dealing with Education,
Pharmacy, Management, Engineering, Library Science, Physical Education, Account,
Commerce, Arts, Science, Humanities, and Law etc.
RAIJMR would take much care in making your article published without much delay with your
kind co-operation. RAIJMR hopes that Researchers, Research scholars, Academician,
Industrialists etc. would make use of this research publication for the development of all the
discipline. This Academy boasts of hosting four major international Journals under its wings,
namely:
(1) International Journal for Research in Management and Pharmacy (ISSN: 2320-0901)
(2) International Journal for Research in Education (ISSN: 2320-091X)
(3) International Journal of Research in Modern Engineering and Emerging Technology
(ISSN: 2320-6586)
(4) International Journal of Research in Humanities and Social Sciences (ISSN: 2320-771X)
(5) International Journal of Research in all Subjects in Multi Languages (IJRSML)
(ISSN : 2321-2853)

RET ACADEMY FOR INTERNATIONAL JOURNALS OF
MULTIDISCIPLINARY RESEARCH (RAIJMR)
Aims and Scopes
International Journal of Research in
in Modern Engineering and Emerging
Technology
(IJRMEET)
IJRMEET “International Journal of Research in Modern Engineering and Emerging
Technology” is an online peer reviewed international journal in English published monthly for
Scientists, Engineers and Research Scholars involved in Engineering and all other related
Engineering Technologies and Science, and related fields to publish high quality and refereed
papers monthly under the head of RET Academy for International Journals of Multidisciplinary
Research. IJRMEET serves to all practitioners, professionals and clients in the
engineering, design and technology sectors. IJRMEET reviews papers within approximately one
week of submission and publishes accepted articles on the internet immediately upon receiving
the final versions. The aim of IJRMEET is exploring the interface between academic research
and practical applications. The entire aim of IJRMEET is to publish peer reviewed researches
and review articles fastly without delay in the developing field of engineering science and
technology and research science. Manuscripts for publication in IJRMEET are selected through
severe peer review to ensure originality, timeliness, relevance, and readability. Original
theoretical work and application-based studies, which are contributes to a better understanding of
modern engineering, science and technological challenges. The journal publishes research
articles and reviews within the whole field of engineering research, and it will continue to
provide information on the latest trends and developments in this ever-expanding subjects. The
journal also seeks clearly written survey and review articles from experts in the field, to promote
insightful understanding of the state-of-the-art and application trends. Original research papers,
state-of-the-art reviews and technical notes are invited for publication.
Editor-in-Chief
(RAIJMR)
www.raijmr.com

RET ACADEMY FOR INTERNATIONAL JOURNALS OF
MULTIDISCIPLINARY RESEARCH (RAIJMR)
Editor-in-Chief
Miss Nita N. Gajjar
Chief Editors
National International Dr. K. S. Likhia Dr. Michael O. Akintayo (U.S.A.)
Dr. Satishprakash Shukla
Associate Editors
Dr. Sunil Patel (All Journals) Dr. Paresh A. Prajapati (All Journals)
Dr. Himanshu Barot (All Journals) Dr. V. D. Patel (IJRMEET)
Dr. Suresh R. Parmar (IJRHS) Dr. Kamendu R. Thakar (IJRSML)
Advisory Board / Reviewer (India)
Dr. J. H. Pancholi(Pro.V.C.HNGU)
Dr. Sunil K. Joshi (VTs-Member-NCTE)
Dr. M. K. Yagnik(V. V. Nagar)
Dr. V. D. Patel (Mehsana)
Dr. M. L. Joshi (Vision-A’bad)
Dr. Dinubhai Chaudhary(Mehsana)
Dr. Pinakin Yagnik (Anand)
Dr. Ashok S. Thakkar (Patan)
Dr. Rajesh S. Vyas (Modasa)
Dr. K. S. Dedun (Daramali)
Dr. A.D.Shah (Ahmedabad)
Dr. Vinod Asudani (Nagpur)
Mrs. Monika R. Seth (Nagpur)
Dr. Dixa H. Savla (Anand)
Dr.(Mrs) Chhanda Chatterjee (West Bengal)
Dr. Jayaben Barevadia (Surat)
Dr. Dipika B. Shah (VNSGU-Surat)
Dr. V. K. Sapovadia (Ahmedabad)
Dr. Shrikhande (Ins. of Mgt. Pune)
Dr. D. R. Dodiya (Gandhinagar)
Dr. Chhaya Chavda (V.Vidhyanagar)
Dr. Tejal Sheth (Ganpat Uni. Mehsana)
Dr. Avdhesh Gupta (KJIME-Kalol)
Dr. Bhuvan Raval (KJIM-Kalol)
Dr. V. V. Chaudhari (Mehsana)
Dr. Raysinghbhai B. Chaudhari (Surat)
Dr. Jignesh P. Modi (Mehsana)
Dr. Mahesh R. Solanki (Anand)
Dr. Viral Jadav(Ahmedabad)
Dr. Ajaykumar M. Raval (Palanpur)
Dr. G. Muppudathi (Tamilnadu)
Prof. Ganesh Pundlikrao Khandare (‘NAAC’ Steering
Committee Member)
Advisory Board (International)
Dr. Kamlesh P. Suthar (Australia)
Dr. Shailesh L. Gajjar (New Zealand)
Dr. Dhiren P. Suthar (Canada)
Dr. Manish S. Patel (Canada)
Dr. Dibyajyoti Saha (Bangladesh)
Prof. N. D. Patel (Australia)
Dr. Darejan Geladze (Georgia)
Prof. M. B. Gajjar (Canada)
Prof. Rajnikant C. Gajjar (U.A.E.)
Mr. Nilesh Patel (U.K.)
Mr. Shailesh D. Patel (U.S.A.)
Mr. Kirit B. Prajapati (U.S.A.)
Mr. Bhadresh B. Suthar (U.A.E.)
Miss. Shilpa J. Patel (U.S.A.)


International Journal of Research in Modern Engineering and Emerging Technology (IJRMEET) UGC Approved id_47203
Vol. 5, Sp. Issue: 9, Sept.: 2017 (IJRMEET) ISSN: 2320-6586
1 Online International, Refereed, Impact factor & Indexed Monthly Journal www.raijmr.com
RET Academy for International Journals of Multidisciplinary Research (RAIJMR)
An Introduction of Arduino and Its Pharmaceutical Application Joshi Nisarg Chandrakant
Assistant Professor
Ratnamani Science College, Becharaji
Abstract-
This paper is representing information about ARDUINO. In This paper we get some
information about Arduino like type of Arduino boards, hardware, and software. Arduino has
many applications as per example Arduino Satellite (Ardusat), ArduPilot (ArduPilotMega-
APM), Lilypad Arduino. Here I explore its Pharmaceutical Application. How to use Arduino
in Pharmaceutical field that can be introducing in this paper. The Arduino board can gave a
fast processing and easy interfacing. So, the Pharmaceutical Tablets Counting and
Monitoring system will established by using Arduino.
Index terms- Arduino, Hardware, Software, Microcontroller based PTCMS
Introduction-
Arduino is an open source microcontroller which can be easily programmed, erased and
reprogrammed at any instant of time. Introduced in 2005 the Arduino platform was designed
to provide an inexpensive and easy way for hobbyists, students and professionals to create
devices that interact with their environment using sensors and actuators. Based on simple
microcontroller boards, it is an open source computing platform that is used for constructing
and programming electronic devices. It is also capable of acting as a mini computer just like
other microcontrollers by taking inputs and controlling the outputs for a variety of electronics
devices.
The Pharmaceutical Tablets Counting and Monitoring System (PTCMS) is the type of the IR
feedback control system. It is one of requirement machine of the tablet medicine factory. It is
the Brushed DC motor based controlled by the micro controller control method. The IR
sensor is used for the capture of the tablet passing in the key way. Software is developed in C
language is using micro-C programming. The LCD module is used to display the counting

International Journal of Research in Modern Engineering and Emerging Technology (IJRMEET) UGC Approved id_47203
Vol. 5, Sp. Issue: 9, Sept.: 2017 (IJRMEET) ISSN: 2320-6586
2 Online International, Refereed, Impact factor & Indexed Monthly Journal www.raijmr.com
RET Academy for International Journals of Multidisciplinary Research (RAIJMR)
number of the tablet by rotary plate. The infrared Sensor is received the IR ray by IR LED.
The IR LED generated the IR ray by PWM function of the controller. If the Sensor received
the IR ray, the output TTL signal of the sensor is 0. If the sensor not received the IR ray, the
output of the sensor is 1. When the tablet is passing through the key way, the tablet is passed
between the IR sensors. So the IR ray is block to IR sensor. The controller is captured this
state output of IR sensor and display on LCD by character number. This machine is used in
many tablet factories in usefully.
Types of ARDUINO-
Arduino boards are available with many different types of built-in modules in it. Boards such
as Arduino BT come with a built-in Bluetooth module, for wireless communication. These
built-in modules can also be available separately which can then be interfaced (mounted) to
it. These modules are known as Shield. Some of the most commonly used Shields are:
Arduino Ethernet shield: It that allows an Arduino board to connect to the internet
using the Ethernet library and to read and write an SD card using the SD library.
Arduino Wireless shield: It allows your Arduino board to communicate wirelessly
using Zigbee.
Arduino Motor Driver Shield: It allows your Arduino boards to interface with
driver of a motor etc.
Fig.1. Arduino Shields- Ethernet, Wireless and Motor Driver
Here is a list of the different types of Arduino Boards available along with its microcontroller
type, Crystal frequency and availabilities of auto reset facility:

International Journal of Research in Modern Engineering and Emerging Technology (IJRMEET) UGC Approved id_47203
Vol. 5, Sp. Issue: 9, Sept.: 2017 (IJRMEET) ISSN: 2320-6586
3 Online International, Refereed, Impact factor & Indexed Monthly Journal www.raijmr.com
RET Academy for International Journals of Multidisciplinary Research (RAIJMR)
Table-1 Types of ARDUINO
Hardware-
The Arduino Development Board consists of many components that together make it work.
Here are some of those main component blocks that help in its functioning:
Microcontroller: This is the heart of the development board, which works as a mini
computer and can receive as well as send information or command to the peripheral
devices connected to it. The microcontroller used differs from board to board; it also
has its own various specifications.
External Power Supply: This power supply is used to power the Arduino
development board with a regulated voltage ranging from 9 – 12 volts.
USB plug: This plug is a very important port in this board. It is used to upload (burn)
a program to the microcontroller using a USB cable. It also has a regulated power of
5V which also powers the Arduino board in cases when the External Power Supply is
absent.
Internal Programmer: The developed software code can be uploaded to the
microcontroller via USB port, without an external programmer.
Reset button: This button is present on the board and can be used to resets the
Arduino microcontroller.
Analog Pins: There are some analog input pins ranging from A0 – A7 (typical).
These pins are used for the analog input / output. The no. of analog pins also varies
from board to board.

International Journal of Research in Modern Engineering and Emerging Technology (IJRMEET) UGC Approved id_47203
Vol. 5, Sp. Issue: 9, Sept.: 2017 (IJRMEET) ISSN: 2320-6586
4 Online International, Refereed, Impact factor & Indexed Monthly Journal www.raijmr.com
RET Academy for International Journals of Multidisciplinary Research (RAIJMR)
Digital I/O Pins: There are some digital input pins also ranging from 2 to 16
(typical). These pins are used for the digital input / output. The no. of these digital
pins also varies from board to board.
Power and GND Pins: There are pins on the development board that provide 3.3, 5
volts and ground through them.
Software-
The program code written for Arduino is known as a sketch. The software used for
developing such sketches for an Arduino is commonly known as the Arduino IDE. This IDE
contains the following parts in it:
1) Text editor: This is where the simplified code can be written using a simplified
version of C++ programming language.
2) Message area: It displays error and also gives a feedback on saving and exporting the
code.
3) Text: The console displays text output by the Arduino environment including
complete error messages and other information.
4) Console Toolbar: This toolbar contains various buttons like Verify, Upload, New,
Open, Save and Serial Monitor. On the bottom right hand corner of the window there
displays the Development Board and the Serial Port in use.
Micro Controller based PTCMS-
The circuit diagram of the tablet counting machine is composed by five parts. They are key
pad, micro controller PIC16F877A, 16×2 LCD and DC motor with relay driver circuit. The
key pad is used for data input to PIC and LCD is the display output of the system. The
required amount of tablet is type by keypad. The keypad has the digit number 0-9, A, B, C, D
and character value *, #. The char * button is used to accept the number of tablets and #
button is for clear the numbers of tablet. The digit 0-9 buttons are used for required amount of
tablets. The char A-D is non-operation. The welcome screen and amount of tablets is shown
in LCD. The PIC controller is start to drive the DC motors (counting and vibration motor) at
the button * is pushed. The IR sensor is used for crossing of tablets. If the one tablet is across
the IR sensor, the sensor sends the digital data 0 to micro-controller.

International Journal of Research in Modern Engineering and Emerging Technology (IJRMEET) UGC Approved id_47203
Vol. 5, Sp. Issue: 9, Sept.: 2017 (IJRMEET) ISSN: 2320-6586
5 Online International, Refereed, Impact factor & Indexed Monthly Journal www.raijmr.com
RET Academy for International Journals of Multidisciplinary Research (RAIJMR)
Fig.2. Microcontroller based PTCMS
Conclusion-
ARDUINO is an open source microcontroller. It can be easily programmed. So it is
convenient to generate more than tablets in small time period. And save man power, time and
create fully automatic Pharmaceutical Tablets Counting and Monitoring System-PTCMS.
The manufacturing and costing of this system is cheap as compare to market available
system.
Acknowledgements-
For this research work I kindly thankful to my guide Dr. Pranay Joshi, who is inspire me to
work on this topic. Then, I thankful to my campus director Dr. Praful Bharadiya, who’s
specialization in Pharmacy and he gave me a pharmacy related hint. I am grateful to Dr. V.D.
Patel, who is the Head of Physics Department in Municipal Arts & Urban Science College,
Mehsana. He is always encourage me and give me a technically guideline. And last but not
the least I am thankful to Dr. Nilesh Gajjar, who is always ready to help me for publishing
my paper. So I am very grateful to all my SIRs from bottom of my heart.

International Journal of Research in Modern Engineering and Emerging Technology (IJRMEET) UGC Approved id_47203
Vol. 5, Sp. Issue: 9, Sept.: 2017 (IJRMEET) ISSN: 2320-6586
6 Online International, Refereed, Impact factor & Indexed Monthly Journal www.raijmr.com
RET Academy for International Journals of Multidisciplinary Research (RAIJMR)
References-
[1] ARDUINO.CC, “Arduino – Introduction”, 2015 [Online]
Available: http://arduino.cc/en/Guide/Introduction. [Accessed: 25- Feb - 2015].
[2] Arduino.cc, 'Arduino - Products', 2015. [Online].
Available: http://arduino.cc/en/Main/Products. [Accessed: 25- Feb- 2015].
[3] ArduPilot Mega, 'ArduPilot Mega', 2015. [Online].
Available: http://www.ardupilot.co.uk/. [Accessed: 23- Nov- 2015].
[4] Wikipedia, 'ArduSat', 2015. [Online].
Available: http://en.wikipedia.org/wiki/ArduSat. [Accessed: 23- FEB- 2015].
[5] Kickstarter, 'ArduSat - Your Arduino Experiment in Space', 2015. [Online].
Available:https://www.kickstarter.com/projects/575960623/ardusat-your-arduino-
experiment-in-space.[Accessed: 23- Feb- 2015].
[6] DIY Space Exploration, 'Ardusat - Your Personal Satellite Built on Arduino', 2013.
Available: http://www.diyspaceexploration.com/ardusat-your-personal-satellite.
[Accessed: 13- Sep- 2015].
[7] A "An Efficiency Analysis of the Kirby Lester KL16df Automatic Tablet and Capsule
CountingSystem"(http://thethomsengroup.com/TTGI%20Pages/Articles%20Studies%20&%2
0Presentations/ThomsenGroup%20KL%20Study%202004.pdf).
Pharmacy Automation. The Thomsen Group Inc. 2004.Retrieved 5 March 2010
[8] A "Labels, patient information leaflets and packaging for medicines"
(http://www.mhra.gov.uk/Howweregulate/Medicines/Labelspatientinfomationleafletsandpack
aging/index.htm). The Medicines and Healthcare products Regulatory Agency (MHRA).
2010. Retrieved 8 March 2010
[9] A Lagrange F: [Current perspectives on the repackaging and stability of solid oral doses].
AnnPharmFr;2010Nov;68(6):332-58
http://www.sciencedirect.com/science/article/pii/S0003450910001331
[10] Lander, Cyril W. (1993). "8 D.C. Machine Control". Power Electronics (3rd ed.).
London: McGraw Hill International UK. ISBN 0-07-707714-8
http://www.mhra.gov.uk/Howweregulate/Medicines/Labelspatientinfomationleafletsandpackaging/index.htm
http://www.mhra.gov.uk/Howweregulate/Medicines/Labelspatientinfomationleafletsandpackaging/index.htm

International Journal of Research in Modern Engineering and Emerging Technology (IJRMEET) UGC Approved id_47203
Vol. 5, Sp. Issue: 9, Sept.: 2017 (IJRMEET) ISSN: 2320-6586
7 Online International, Refereed, Impact factor & Indexed Monthly Journal www.raijmr.com
RET Academy for International Journals of Multidisciplinary Research (RAIJMR)
Experimental Performance analysis of Evacuated tubes coupled
Double basin solar still with pin fin
Hitesh Panchal
Assistant Professor, Government Engineering College, Patan, Gujarat, India.
Email :[email protected]
Abstract
During early morning, lower intensity radiation never passed through glass cover properly,
hence the temperature of inner glass cover temperaure remains higher compred with water
temperature, hence the distillate ouptut is lower. If preheating of water is carried out then
distillate output of the solar still. Hence, the main aim of this resarch work to carry out
performance analysis of Evacuated tubes coupled double basin solar still in climate
conditions of Patan, Gujarat annually. From the one year research work, it has found 34.3%
increment with use of pin fin compared with alone. At last, comparison has been made with
other researchers work and it has been found 300% enhancment in distillate output compared
with conventional solar still by considering 3 kg average distillate output from conventional
solar still.
Keywords—Evacuated tubes,distillate output,double basinSolar still, fin
Introduction:
A simple way of distilling water is by evaporation and condensation method. In solar still, the
water is evaporated using solar energy. In solar still, impure water is taken in a well-insulated
air tight basin covered with transparent plastic/glass cover. Practically, solar still is termed as
passive solar still. When the cover is exposed to sun, radiation energy is transmitted through
transparent cover, falls in the basin, absorbed by the basin absorber plate, converted into heat
and transferred to water. The water gets heated up, transfer heat to air inside the still and the
air become unsaturated. The water evaporates and makes the air inside still saturated. This air
is subjected circulatory motion due to the temperature difference between water surface and
cover lower surface. When high temperature air touches the cover, becomes cool and the water
present in the air condenses at the lower surface of the cover. This condensed water slides
down and is collected using a drain.
The transparent cover receives and transmits radiation into the still. Likewise, the
condensation takes place along its lower surface. Also, it should suppress thermal radiation in
the atmosphere. Glass is the best material to cover (Duffie et al. [1] since it has higher
transmittance and less reflectivity. Also glass is opaque to thermal radiation. For higher
latitude places, single slope still is preferable, and for northern Chemosphere the still faces
south (Fath et al. [2]. The inclination of the cover is optimized to collect the accumulated
condensate through drain before it drops down to the basin. The condensate mass
accumulation depends on solar intensity and condensation rate. They also conducted indoor
simulation experiments and found that the production rate is higher for 30° cover inclination.
Glass temperature affects the condensation rate at its lower surface. Lower glass surface
temperature increases the circulation of air inside the still which enhances convective and
evaporative heat transfer between basin water and glass. Also, cooler glass lower surface
increases condensation. The glass cover temperature is reduced by continuous flow (Abu-
Hijleh [3] or intermittent flow (Tiwari and Madhuri, 1985) of raw cooling water on the cover.
The cooling water gains latent heat from condensing water and regenerates it in the basin. The

International Journal of Research in Modern Engineering and Emerging Technology (IJRMEET) UGC Approved id_47203
Vol. 5, Sp. Issue: 9, Sept.: 2017 (IJRMEET) ISSN: 2320-6586
8 Online International, Refereed, Impact factor & Indexed Monthly Journal www.raijmr.com
RET Academy for International Journals of Multidisciplinary Research (RAIJMR)
second effect of evaporation and condensation takes place between the covers as shown in.
Bassam A/K Abu-Hijleh et al. [4] result shows increase in production by 20%. Yousef and
Mousa Abu-Arabi [5] results also show that, the use of the film-cooling increases the still
efficiency up to 20%. Lawrence et al. (1989) had carried out research work on varying mass
flow rate of water of upper side of glass cover to see its effect on distillate output and
efficiency of solar still. They found that, enhancement of distillate output and efficiency was
9% and 5%, respectively, when the mass flow rate was 1.5 m/s. Wind velocity is also having
its effect on the temperature of the glass. At higher wind velocity, due to higher convection
heat transfer from the glass to atmosphere the productivity of the still is increasing (Yousef et
al., 2004 and El-Sebaii [6] Tiwari and Rao [7] theoretically analyzed the effect of water
flowing over the glass cover in a single basin still. The result shows the productivity is
increased with flowing water over the glass cover. Also, the yield decrease when the water
flow rate increases. Pr. K. Abdenacer and S. Nafila [8] had conducted lots of experiments
on passive and active solar still based on water temperature and efficiency and found that, the
active solar still always increased distillate output compared with passive solar still. Sebaii et
al., [9] had fabricated passive solar still to find the optimum glass cover inclination. They
performed studies to see best glass cover inclination during winter and summer. It was found
that the optimum glass cover inclination was 33.3° N (Latitude of the place) for both summer
and winter. M.K. Phadatare, S.K. Verma, [10] had evaluated the performance of a solar still
with 4 mm plexiglass as a cover material to see the effect on the internal heat transfer
coefficient and distillate output by varying the depth of brine. They found that, plexiglass of 4
mm thickness found an enhancement of distillate output by 2 cm brine thickness.
Karuppusamy [11] had conducted several experiments on single basin solar still coupled with
evacuated tubes in climate conditions of Chennai to see effect of increase in water temperature
on distillate output of solar still. He took 0.03 m depth of water inside solar still and tested for
one year and found that, the distillate output increased by more than 100% compared with
conventional solar still.Shobha et al.[12]had conducted simple experiment on single basin
solar still coupled with evacuated tubes with help of pipes. They conducted solar still with
evacuated tubes to see effect on distillate output. They found 110% increment in distillate
output.Rahul dev and G N Tiwari [13]had carried out several experiments on single basin
solar still coupled with evacuated tubes in climate conditions of New Delhi,India. They also
conducted theoretical analysis to see the difference between experimental and theoretical
analysis and found good agreement in terms of coefficient of correlation. J. Xiong et al.
[14]fabricated and tested innovative design of single basin solar still coupled with evacuated
tubes. They used stacked tray in the solar still in such a way that the latent heat of
condensation can be utilized properly and found increment in distillate output. Deniz [15] had
conducted research work on single basin solar still with various energy absorbing materials
and tested in climate conditions of Oman. He also carried out theoretical analysis and
compared with experimental results and found good agreement between them.Patan is a best
place for research work on solar energy appliances, due to the higher amount of solar
radiations. Hence it is a best place for research work on solar energy applications.[16-37].
Literature review exhibited that the solar still is a very important device to convert available
brackish water into drinkable water by use of solar energy. Many of the researchers have
worked on it for increment in distillate output. For increment in distillate output, evacuated
tubes are generally used. But the main problem of loss of latent heat of condensation remains
unsolved in solar still when it coupled with evacuated tubes. Hence, in this present research
paper, work has done on evacuated tubes coupled double basin solar still for usage of loss of
latent heat of condensation. Also, fins have not used by the researchers for increment in
surface area. Hence, main aim of this present work is to fabricate evacuated tubes coupled
double basin solar still with pin fin for increment in distillate output.

International Journal of Research in Modern Engineering and Emerging Technology (IJRMEET) UGC Approved id_47203
Vol. 5, Sp. Issue: 9, Sept.: 2017 (IJRMEET) ISSN: 2320-6586
9 Online International, Refereed, Impact factor & Indexed Monthly Journal www.raijmr.com
RET Academy for International Journals of Multidisciplinary Research (RAIJMR)
Experimental set up:
Fig.1 shows the experimental testing set up made by locally available materials in market of
Patan, Gujarat. Fig.2 shows the pin fin used in present experiment. Present experimental set up
consists of 1 meter square cross sectional area. It used two glass cover for top and bottom
basin. Bottom basin contains attachment of evacuated tubes with help of holes. The main use
of direct attachment of evacuated tubes that, the heat loss from the evacuated tubes to pipe is
reduced. Upper basin attached with lower basin with help of glass cover. Dimensions of lower
and upper basin are 1006 mm *1000 mm *500 mm. The fin size of 3 cm used in present
experiment. All the experiments have conducted at clear sky conditions with constant water
depth of 0.03 cm during January 2016 to December 2016.
Fig.1Experimental set up of double basin
solar still with evacuated tubes
Fig.2 pin fin arrangement provided in
solar still
Result and Discussion:
Generally in all solar energy research work the output depends on amount of solar energy
incident on it. Also, the solar radiations increased from morning to noon and then start
reducing due to movement of sun towards the south. Fig. 3 shows comparison between the
water circulation inside solar still from evacuated tubes. It has found that, the increment in
solar intensity increased the radiation incident on evacuated tubes for increment in natural
circulation towards the solar still.
Fig. 4 shows that the hourly variations of solar intensity and ambient temperature on 10th
May and 10th January. 2015. It exhibits that, solar radiation upsurgestill it influences its
supreme value at mid-day, then it fall again. This curve is detected in both summer and
winter investigational days. The highest recorded value of solar intensities was 980 and 960
W/m2 and 600 and 620 W/m2 for vacuum tubes and solar still during 10th May and 10th
January 2015. The maximum ambient temperature is originateapproximately 36 °C and 24 °C
during 10th May and 10th January, 2015

International Journal of Research in Modern Engineering and Emerging Technology (IJRMEET) UGC Approved id_47203
Vol. 5, Sp. Issue: 9, Sept.: 2017 (IJRMEET) ISSN: 2320-6586
10 Online International, Refereed, Impact factor & Indexed Monthly Journal www.raijmr.com
RET Academy for International Journals of Multidisciplinary Research (RAIJMR)
Fig.3 Hourly circulation of water inside the
vacuum tubes
Fig. 4 Hourly variation of solar intensity
and ambient temperature for DBSWVT
during summer experimental days
Fig. 5 Temperature of water in upper and
lower basin without use of fins.
Fig. 6 Temperature of water in double
basin evacuated tubes coupled solar still
with and without fins
Fig. 7 Distillate output received from
evacuated tubes coupled solar still with
and without use of fins
Fig. 8 cumulative output received from
evacuated tubes coupled solar still with
and without use of fins
0
10
20
30
40
50
60
07
:00
09
:00
11
:00
13
:00
15
:00
17
:00
19
:00
21
:00
23
:00
01
:00
03
:00
05
:00
Cir
cula
tion
Rate
(K
g/h
r)
Time (h)
0.0
10.0
20.0
30.0
40.0
0
500
1000
1500
Am
bie
nt
Tem
per
atu
re
Sola
r In
ten
sity
(W
/m2)
Time (h)
I(t)s 10th May I(t)c 10th JanI(t)s 10th May I(t)c 10th Jan
0
50
100
07
:00
09
:00
11
:00
13
:00
15
:00
17
:00
19
:00
21
:00
23
:00
01
:00
03
:00
05
:00
Wate
r T
emp
eratu
re
(°C
)
Time (h)
Tw (LB) 10th May Tw (UB) 10th MayTw (LB)10th Jan Tw (UB) 10th Jan
0
50
100
150
07
:00
09
:00
11
:00
13
:00
15
:00
17
:00
19
:00
21
:00
23
:00
01
:00
03
:00
05
:00
Bas
in T
em
pe
rtu
re (
C)
Time(hr)
Tw (ub) without fin Tw (LB) without fin
Tw(LB) with fin Tw (ub) with fin
00.5
1
07
:00
09
:00
11
:00
13
:00
15
:00
17
:00
19
:00
21
:00
23
:00
01
:00
03
:00
05
:00
dis
tilla
te o
utp
ut
(kg)
Time(hr)
m(LB) without fin m(UB) without fin
m(LB) with fin m(UB) with fin
0
5
10
15
07
:00
09
:00
11
:00
13
:00
15
:00
17
:00
19
:00
21
:00
23
:00
01
:00
03
:00
05
:00
m (
cum
ula
tive
)
Time(hr)
m(cum) without fin m (cum) with fin

International Journal of Research in Modern Engineering and Emerging Technology (IJRMEET) UGC Approved id_47203
Vol. 5, Sp. Issue: 9, Sept.: 2017 (IJRMEET) ISSN: 2320-6586
11 Online International, Refereed, Impact factor & Indexed Monthly Journal www.raijmr.com
RET Academy for International Journals of Multidisciplinary Research (RAIJMR)
Fig. 5demonstratesthe difference of water temperatures of lower and upper basin during
summer and winter experimental days of 10th May and 10thJanuary, 2015. It is shown that,
maximum temperature of water inside the upper and lower basin remains higher during the
summer experimental day compared with winter experimental day due to higher solar
radiation and ambient temperature of the location. It is also shown that, water temperature
increased during the day until it reaches its maximum value at 15:00 pm and then reduced
slowly during summer experimental day and winter experimental day found maximum value
at 14:00 pm and then reduced drastically compared with summer experimental day. The
reason is the volumetric heat capacity of water inside lower and upper basin is responsible for
the slow and drastic reduction in water temperature. Water temperature reaches its maximum
value was 90.2 °C and 78.4 °C during summer experimental day and 63.2°C and 56.7°C.
Climate condition always affects the temperature gained by passive solar still during summer
and winter experimental day, hence summer and winter experimental day, maximum
temperature achieved at 15:00 pm and 14:00 pm. It is also observed that, the lower basin water
temperature remains high throughout the day during summer and winter experimental day, due
to augmentation of vacuum tubes. During winter experimental day, temperature is found more
than 60 °C during 14:00 pm. Generally, water temperature of passive solar still remains lower
during winter, but here lower basin removes excess heat to the upper basin, hence water
temperature remains higher during peak hours. It is a main benefit found in this arrangement.
Fin attachment at lower and upper basin found more productive as shown in Fig. 6. Fin has
characteristic of having increment in heat transfer due to the enhancement of area. Also, they
are porous, hence, it does not only increment the water temperature during daytime but also
during the off-sunshine hours. Fig. 6, it is clearly shown that the temperature of water reaches
to 97 degree celcius and it remains about 90 during two continuous hours. Fig. 7 signifies the distillate output received by solar still with and without attachment of fins. It is found that the fins enlarged the superficial area of water; hence due to the raise in water temperature, its distillate output was improved. Extreme distillate output received was utpo 0.90 kg during 3 pm. Fins have shown remarkable effect during off-sunshine hours as expected. Attachment of fins increased the distillate output not only for the lower basin but also from the upper basin.Fig. 8 shows cumulative distillate output gained by evacuated tubes coupled solar still with and without use of fins. It has found that, the solar still with fins gained 12.61 kg distillate output and without fins gained 9.5 kg. Hence, the increment of 32.75% distillate output compared with alone solar still. The reason behind increment in distillate output was due to the increment in surface area of water. Fig. 9 shows yearly comparative analysis of solar still with and without use of fins. It has found that, the average distillate output of solar still without use of fins found 9.12 kg and with fins 12.25 kg. Hence, average yearly increment in distillate output of 34.3% found in solar still with use of fins.
Fig. 9 comparison of solar still with and without use of fin
0
5
10
15
20
Dis
tilla
te o
utp
ut
(kg)
Month (2016)
solar still without fin
solar still with fin

International Journal of Research in Modern Engineering and Emerging Technology (IJRMEET) UGC Approved id_47203
Vol. 5, Sp. Issue: 9, Sept.: 2017 (IJRMEET) ISSN: 2320-6586
12 Online International, Refereed, Impact factor & Indexed Monthly Journal www.raijmr.com
RET Academy for International Journals of Multidisciplinary Research (RAIJMR)
Table 1 shows the comparison of other researchers work with present research. It has found that, the present work found 300% increment in distillate output compared with conventional solar still.
Table 1: Comparison with other researchers work with present work
Sr.
No.
Name of Researcher Type of attachment with
passive solar still
Increase in distillate
output (%)
1 Dev and Tiwari, (2012) Evacuated tube collector
coupled with passive
solar still
32%
2 SampathkumarKaruppusamy (2012) Evacuated tube collector
with granite gravel
59.78%
3 Xiong. et al. (2013) Multi-effect passive solar
still integrated with
evacuated tubes and
corrugated sheet
90%
4 Z. M. Omara et al. (2013) Evacuated tubes with
wick materials
108%
5 Present work Double basin solar still
with evacuated tubes and
fins
300%
Conclusion:
From the above research works following points were concluded:
Evacuated tubes coupled double basin solar still was a better solar still for converting available brackish water into drinkable water by use of solar energy.
Attachment of fins with coupled double basin solar still found above 30% increment in distillate output compared with without attachment of fin in same still.
Annual distillate output of evacuated tubes coupled solar still with pin fin found 34.3% increment compared with without fin attachment.
Evacuated tubes coupled double basin solar still with pin fin found 300% increment in distillate output compared with conventional solar still.
Acknowledgement:
The authors are very grateful to Gujarat Council on Science and Technology (GUJCOST) for supporting the above project by sanctioned grant of Rs. 5.5 Lakhs.
References:
1. Duffie and Backman., Solar Engineering of Thermal Processes, 2nd
edi,, Wiley
Publication, USA, 1985.
2. Fath Hassan E.S., andHosny H.M., Thermal performance of a single-sloped basin still
with an inherent built-in additional condenser, Desalination, 142, 19-27, 2005.

International Journal of Research in Modern Engineering and Emerging Technology (IJRMEET) UGC Approved id_47203
Vol. 5, Sp. Issue: 9, Sept.: 2017 (IJRMEET) ISSN: 2320-6586
13 Online International, Refereed, Impact factor & Indexed Monthly Journal www.raijmr.com
RET Academy for International Journals of Multidisciplinary Research (RAIJMR)
3. Bassam A, K., Abu-Hijileh., and Rababa’hHimzeh M., Experimental study of a solar
still with sponge cubes in basin’, EnergyCoversion and Management , 44. 677-688,
2003.
4. Bassam A, K., Abu-Hijileh., Himzeh M Rababa’h., Experimental analysis of solar
still with different materials, Energy Coversion and Management, 33, 1411-1418,
2006.
5. Zurigat, Yousef H., and Abu-Arabi, Mousa K., Modelling and performance analysis
of a regenerative solar desalination unit, Applied Thermal Engineering, 24, 1061-
1077,2004.
6. Panchal,H,M., Shah P.K., Effect of varying glass cover thickness on performance of
solar still : In a winter climate conditions, International Journal of Renewable Energy
Research, 1, 212-223, 2014.
7. Zurigat, Yousef H., and Abu Arabi Mpisa K., Modellling and performance analysis of
a regenerative desalination unit, Applied Thermal Engineering, 24, 1061–1072, 2004.
8. Bapeshwararao, V.S.V., Singh, U., Tiwari, G.N., Transient analysis of double basin
solar still, Energy conversion and Management, 23,83-90,1983.
9. El-Sebaii A.A., Aboul-Enein.s, Ramadan M.R.I, El-Bialy,E., Year-round performance
of a modified single-basin solar still with mica plate as a suspended absorber, Energy,
25, 35-49, 2000.
10. Abdenacer, Kaabi Pr., and Nafia, Smakadji., (2007), Impact of temperature difference
(water-solar collector) on solar-still global efficiency, Desalination, 209, 298-
305,2007.
11. Abderachid Trad., and AbdenacerKaabi., Effect of orientation on the performance of
a symmetric solar still with a double effect solar still (comparison study),
Desalination, 329, 68–77, 2013.
12. PhadatareM,K., and Verma S.K., Influence of water depth on internal heat and mass
transfer in a plastic solar still, Desalination,203, 267–275, 2007.
13. Karuppusamy, Sampthkumar., An Experimental study on single basin solar still
augmented with evacuated tubes, Thermal Science, 16, 573-581, 2010.
14. Shobha. B. S., Vilas,Watwe ., Rajesh A. M., Performance Evaluation of A Solar Still
Coupled to an Evacuated Tube Collector type Solar Water Heater, International
Journal of Innovations in Engineering and Technology, 1, 456-460, 2012.
15. Jianyin, Xiong, Guo Xie, Hongfei Zheng., Experimental and numerical study on a
new multi-effect solar still with enhanced condensation surface, Energy Conversion
and Management, 73,176–185,2013.
16. Panchal, Hitesh. 2010. ―Experimental Analysis of Different Absorber Plates
onPerformance of Double Slope Solar Still.‖International Journal of
EngineeringScience and Technology 2 (11): 6626–6629.
17. Panchal, Hitesh. 2011. ―Experimental Investigation of Varying ParametersAffecting
on Double Slope Single Basin Solar Still.‖ International Journalof Advances in
Engineering Sciences 2 (1): 17–21.
18. Panchal, Hitesh. 2016a. ―Performance Investigation on Variations of GlassCover
Thickness on Solar Still: Experimental and Theoretical Analysis.‖Technology and
Economics of Smart Grids and Sustainable Energy 1(4):1–7.
19. Panchal, Hitesh. 2016b. ―Use of Thermal Energy Storage Materials forEnhancement
in Distillate Output of Solar Still: A Review.‖ Renewable andSustainable Energy
Reviews 61: 86–96.
20. Panchal, Hitesh, Manish Doshi, Prakash Chavda, and RanvirgiriGoswami.2010.
―Effect of Cow Dung Cakes Inside Basin on Heat Transfer Coefficientsand

International Journal of Research in Modern Engineering and Emerging Technology (IJRMEET) UGC Approved id_47203
Vol. 5, Sp. Issue: 9, Sept.: 2017 (IJRMEET) ISSN: 2320-6586
14 Online International, Refereed, Impact factor & Indexed Monthly Journal www.raijmr.com
RET Academy for International Journals of Multidisciplinary Research (RAIJMR)
Productivity of Single Basin Single Slope Solar Still.‖ InternationalJournal of Applied
Engineering Research, Dindigul 1 (4): 675–690.
21. Panchal, Hitesh, Manish Doshi, KeyursinhThakor, and Anup Patel.
2011.―Experimental Investigation on Coupling Evacuated Glass Tube Collectoron
Single Slope Single Basin Solar Still Productivity.‖ International Journalof
Mechanical Engineering & Technology 1: 1–9.
22. Panchal, Hitesh, and Indra Mohan. 2017. ―Various Methods Applied to SolarStill for
Enhancement of Distillate Output.‖ Desalination 415: 76–89.
23. Panchal, Hitesh, and Sanjay Patel. 2016. ―Effect of Various Parameters on
Augmentationof Distillate Output of Solar Still: A Review.‖ Technology
andEconomics of Smart Grids and Sustainable Energy 1(4): 1–8.
24. Panchal, Hitesh, Mitesh I. Patel, Bakul Patel, RanvirgiriGoswami, and ManishDoshi.
2011. ―A Comparative Analysis of Single Slope Solar Still Coupledwith Flat Plate
Collector and Passive Solar Still.‖ IJRRAS 7 (2): 111–116.
25. Panchal, Hitesh, and Patel Sanjay. 2017. ―An Extensive Review on DifferentDesign
and Climatic Parameters to Increase Distillate Output of Solar Still.‖Renewable and
Sustainable Energy Reviews 69: 750–758.
26. Panchal, Hitesh, and Pravin Shah. 2011a. ―Char Performance Analysis of
DifferentEnergy Absorbing Plates on Solar Stills.‖ Iranica Journal of Energy
&Environment 2 (4): 297–301.
27. Panchal, Hitesh, and Pravin Shah. 2011b. ―Modelling and Verification of SingleSlope
Solar Still Using ANSYS-CFX.‖ International Journal of Energy andEnvironment 2
(6): 985–998.
28. Panchal, Hitesh, and Pravin Shah. 2012a. ―Effect of Varying Glass CoverThickness
on Performance of Solar Still: In a Winter Climate Conditions.‖International Journal
of Renewable Energy Research 1 (4): 212–223.
29. Panchal, Hitesh, and Pravin Shah. 2012b. ―Investigation on Solar Stills Having
Floating Plates.‖International Journal of Energy and Environment Engineering3 (1):
1–5.
30. Panchal, Hitesh, and Pravin Shah. 2013a. ―Experimental and ANSYS CFD
SimulationAnalysis of Hemispherical Solar Still.‖ IIRE International Journal
ofmRenewable Energy 8 (1): 1–14.
31. Panchal, Hitesh, and Pravin Shah. 2013b. ―Modeling and Verification of
HemisphericalSolar Still Using ANSYS CFD.‖ International Journal of Energy
andEnvironment 4 (3): 427–440.
32. Panchal, Hitesh, and Pravin Shah. 2013c. ―Performance Improvement of SolarStills
via Experimental Investigation.‖ International Journal of AdvancedDesign and
Manufacturing Technology 5 (5): 19–23.
33. Panchal, Hitesh, and Pravin Shah. 2013d. ―Performance Analysis of DoubleBasin
Solar Still with Evacuated Tubes.‖ Applied Solar Energy 49 (3):174–179.
34. Panchal, Hitesh, and Pravin Shah. 2014a. ―Enhancement of Distillate Outputof
Double Basin Solar Still With Vacuum Tubes.‖ Frontiers in Energy 8 (1):101–109.
35. Panchal, Hitesh, and Pravin Shah. 2014b. ―Enhancement of Upper Basin
DistillateOutput by Attachment of Vacuum Tubes with Double-Basin SolarStill.‖
Desalination and Water Treatment 55 (3): 587–595.
doi:10.1080/19443994.2014.913997.
36. Panchal, Hitesh, and Pravin Shah. 2014c. ―Improvement of Solar Still Productivityby
Energy Absorbing Plates.‖ Journal of Renewable Energy andEnvironment 1 (1): 1–7.

International Journal of Research in Modern Engineering and Emerging Technology (IJRMEET) UGC Approved id_47203
Vol. 5, Sp. Issue: 9, Sept.: 2017 (IJRMEET) ISSN: 2320-6586
15 Online International, Refereed, Impact factor & Indexed Monthly Journal www.raijmr.com
RET Academy for International Journals of Multidisciplinary Research (RAIJMR)
37. Panchal, Hitesh, and Pravin Shah. 2014d. ―Investigation on PerformanceAnalysis of
Novel Design of Vacuum Tube-Assisted Double Basin SolarStill: An Experimental
Approach.‖ International Journal of Ambient Energy
37 (3): 220–226. doi:10.1080/01430750.2014.924435.

International Journal of Research in Modern Engineering and Emerging Technology (IJRMEET) UGC Approved id_47203
Vol. 5, Sp. Issue: 9, Sept.: 2017 (IJRMEET) ISSN: 2320-6586
16 Online International, Refereed, Impact factor & Indexed Monthly Journal www.raijmr.com
RET Academy for International Journals of Multidisciplinary Research (RAIJMR)
Thermal Analysis of Some Metal Chelates of Nickel and Copper
K P Patel
R. R. Mehta College of Science & C. L. Parikh College of commerce, Palanpur
Abstract
In the current manuscript a synthesized metal chelates with the combination of ML2 where
characterized by author. Metal chelates where manufactured using Nickel and Copper metal with
two ligand combination. The Metal chelates where characterized by Thermal Gravitometric
Analysis. Broido method is used to analyze the data obtained form thermogram. The
thermogravimetric analyses (TGA) of sample have been carried out by using “Perkin Elmer
Pyris-1 TGA” in a slow stream of air. Percentage of losses with cause of losses was discussed at
the end of manuscript.
Key Word
Metal Chelates, TGA, Thermogram, Weight Loss
Introduction
The transition metal represents the filling of the atomic d-electron shell, because the transition
metals and their alloys typically have high melting temperature and hardness, their economic
importance is immense[1-2]. Salen is the abbreviation for a popular chelating ligand used in
coordination chemistry and homogeneous catalysis[3-4]. In 1938, T. Tsumaki reported that the
cobalt(II) salen reversibly bound O2, and this finding led to intensive research on cobalt
complexes salen and related ligands for the storage and transport of oxygen, i.e. synthetic oxygen
carriers[5]. For comparative study of thermal behavior of related polymer or simple molecules,
each molecule is analyzed by any one or more of these methods of analysis under identical
experimental condition. For example TGA is carried out in air and in oxygen free nitrogen[6-8].
From the results of DTA and TGA, it is possible it note the temperature up to which the material
does not lose weight. It is also possible to know the temperature at which material starts
decomposing[9-11].

International Journal of Research in Modern Engineering and Emerging Technology (IJRMEET) UGC Approved id_47203
Vol. 5, Sp. Issue: 9, Sept.: 2017 (IJRMEET) ISSN: 2320-6586
17 Online International, Refereed, Impact factor & Indexed Monthly Journal www.raijmr.com
RET Academy for International Journals of Multidisciplinary Research (RAIJMR)
Experiment
The thermogravimetric analyses (TGA) of sample have been carried out by using “PERKIN
ELMER PYRIS 1 TGA” in a slow stream of air. The boat prepared from platinum foil would
hold the sample for analysis. It is properly washed and dried. It was suspended on the quartz rod
in the TG balance. The powdered sample (about 5 mg) was placed in the boat. The sample in the
boat is covered by a quartz tube in which the flow of air was maintained. The weight of sample
was noted on TGA balance. The whole assembly was brought down in the furnace. It was
ascertained that the boat was hanging on quartz rod. The experiment was started by the heating
the system at a constant rate of 10°C/min. Simultaneously change in the weight was recorded
automatically with time (temperature). This will reveal percentage weight loss of material s a
function of the time and also of temperature. The experiment was stopped at about 650 °C, when
there was no further decrease in weight.
Result and Discussion
The thermograms were analyzed to obtain information about percentage weight loss at different
temperatures. The results of these analyses are presented in Table 1. Selected themograms are
shown in Figures 1 and 2.
Table – 1: Thermogravimetric analysis of Metal Chelates
Crystal % wt loss at temperature
250 C 300 C 350 C 400 C
(Cu+2
) Chelates 6.2 7.8 16 70
(Ni+2
) Chelates 2.8 5.3 24 67
The brief account of the thermal behavior of samples in air is given below:
Each crystals degradation in two steps.
The degradation of all the crystals start in the temperature Range of 200 to 3500C
depending upon the natures of crystals.
The wt. loss amount in this first stage is in between 4.5 to 7 % this may be due to water
molecules associated in to the crystals.

International Journal of Research in Modern Engineering and Emerging Technology (IJRMEET) UGC Approved id_47203
Vol. 5, Sp. Issue: 9, Sept.: 2017 (IJRMEET) ISSN: 2320-6586
18 Online International, Refereed, Impact factor & Indexed Monthly Journal www.raijmr.com
RET Academy for International Journals of Multidisciplinary Research (RAIJMR)
The second stage of decomposition of all crystals is rapid with the loss of mass about
50%. This is due to “in situ” formation of metal oxide during degradation. Which
accelerate the rapid degradation of crystals.
The last stage of digression cause a mass loss of about 80%. This is due to loss molecular
fragments of polymers.
Figure – 1 TGA Thermogram of Ni(II) Chelates
International Journal of Research in Modern Engineering and Emerging Technology (IJRMEET) UGC Approved id_47203
Vol. 5, Sp. Issue: 9, Sept.: 2017 (IJRMEET) ISSN: 2320-6586
19 Online International, Refereed, Impact factor & Indexed Monthly Journal www.raijmr.com
RET Academy for International Journals of Multidisciplinary Research (RAIJMR)
Figure – 2 TGA Thermogram of Cu(II) Chelates
Reference
1. Jay F. Larrow and Eric N. Jacobsen (2004), "(R,R)-N,N'-Bis(3,5-Di-tert-
Butylsalicylidene)-1,2-Cyclohexanediamino Manganese(III) Chloride, A Highly
Enantioselective Epoxidation Catalyst", Org. Synth.,

International Journal of Research in Modern Engineering and Emerging Technology (IJRMEET) UGC Approved id_47203
Vol. 5, Sp. Issue: 9, Sept.: 2017 (IJRMEET) ISSN: 2320-6586
20 Online International, Refereed, Impact factor & Indexed Monthly Journal www.raijmr.com
RET Academy for International Journals of Multidisciplinary Research (RAIJMR)
2. Zhang, W.; Loebach, J. L.; Wilson, S. R.; Jacobsen, E. N., J. Am. Chem. Soc. 1990, 112,
2801.
3. Irie, R.; Noda, K.; Ito, Y.; Matsumoto, N.; Katsuki, T., Tetrahedron Lett. 1990, 31, 7345.
4. R.M.A. Leith (Ed.) Preparation and Crystal Growth of Materials with Layered
Structures D. Riedel Publication Company, Dordrecht Holland/Boston, U.S.A. (1977).
5. Tokuichi Tsumaki (1938). "Nebenvalenzringverbindungen. IV. Über einige
innerkomplexe Kobaltsalze der Oxyaldimine
6. Charsley, E.L. and Warrington, S.B. Thermal Analysis: Techniques and Application,
Royal Society of Chemistry, UK,(1992).
7. Daniels, T.C. Thermal Analysis John Wiley & Sons, NY, (1973).
8. Ferry, J.D. Viscoelastic Properties of Polymers John Wiley & Sons, NY, (1980).
9. Haines, P.J. et al. Thermal Methods of Analysis: Principles, Applications and Problems,
Blackie Academic and Professional, England, (1995).
10. Hatakeyama, T. and Quinn, F.X. Thermal Analysis: Fundementals and Applications to
Polymer Science, John Wiley & Sons Ltd., England, (1994).
11. Mackenzie, R.C. ed. Differential Thermal Analysis Academic Press, NY, (1970-72)

International Journal of Research in Modern Engineering and Emerging Technology (IJRMEET) UGC Approved id_47203
Vol. 5, Sp. Issue: 9, Sept.: 2017 (IJRMEET) ISSN: 2320-6586
21 Online International, Refereed, Impact factor & Indexed Monthly Journal www.raijmr.com
RET Academy for International Journals of Multidisciplinary Research (RAIJMR)
Study of GrowthFeaturesand etching on In2Se3-xSbx(x= 0.3) Single
Crystals
Piyush J. Patel1,*
, Sandip M. Vyas1, Vimal A. Patel
1, Maunik P. Jani
2 and Girish R. Pandya
3
1Department of Physics, School of Science, Gujarat University, Ahmadabad,
Gujarat, India-380009. 2Department of Physics, Babaria Institute of Technology, Vagodiya, Vadodara, Gujarat, India
3Department of Physics, Faculty of Science, The M.S. University of Baroda, Vadodara-
390002, Gujarat, India
*Corresponding author Email: [email protected];
Abstract:
The III-VI compound semiconductors are important for the fabrication of ionizing radiation
detectors, solid-state electrodes, and photosensitive heterostructures, solar cell and ionic
batteries. In this paper, In2Se2.7Sb0.3 single crystals were grown by the Bridgman method with
temperature gradient of 60 °C/cm and the growth velocity 0.35cm/hr. Some interesting
features observed on the top free surface of as-grown single crystal were examined under the
optical microscope. The study of possible growth mechanism responsible for the appearance
of the characteristic growth features is discussed. A new dislocation etchant has been
developed by successive trial- error method. The dislocation etchant has been found to give
responsible etch-pits on the cleavage surface. Various standard tests for a dislocation etchant
have been carried out and the dislocation density calculated by the etch pit count- method and
result are reported.
Keywords:
Bridgman Method, Shallow Hillock, Parallel Striation, Etching, Scratch Marks and Low
Angle Boundary.
Introduction
In2Se3 compound belongs to the group of semiconductor materials with a layered crystal
structure. In2Se3 single crystals can be used for fabrication of ionizing radiation detectors,
solid-state electrodes, and photosensitive heterostructures. According to Z.C. Medvedeva, the
α-In2Se3 phase has a hexagonal structure with the unit cell parameters a = 4.0 and с = 19.24
Å[1]. The α- In2Se3 compound with a layer structure is considered an excellent material
applicable to solar cells[2] and the ionic batteries[3] and a number of studies on its electrical
and optical properties have been reported[4,5]. It is also known that In2Se3 single crystals
with a stable phase can be grown by introducing impurities during crystal growth [6]. It is
well known for pseudo-binary II-VI semiconductors that adjustable band gaps, refractive

International Journal of Research in Modern Engineering and Emerging Technology (IJRMEET) UGC Approved id_47203
Vol. 5, Sp. Issue: 9, Sept.: 2017 (IJRMEET) ISSN: 2320-6586
22 Online International, Refereed, Impact factor & Indexed Monthly Journal www.raijmr.com
RET Academy for International Journals of Multidisciplinary Research (RAIJMR)
indices and lattice parameters, which depend on the relative amounts of chalcogen atoms in
the compound, can be obtained. Both factors are important for photovoltaic applications,
especially if thin film heterostructures are considered. The need for tailoring band gaps has
led us to work in the In2 (Se, Te) 3system [7]. Each layer consists of five atomic sheets with
atomic structure Se-In-Se-In-Se. These sheets are bound together by strong covalent forces
and the Interaction between adjacent layers is much weaker are of Vander Walls type [8].
Indium Selenide (In2Se3) is one of the important III-VI layered compounds, which has a low
density of 2 dangling bonds and is a candidate material for hetero junction formation with a
very low density of interface states [9]. The III–VI semiconductors, which crystallize with a
layered structure, have been investigated extensively as an example of two-dimensional
systems. Indium Selenide (In2Se3) is a compound semiconductor with a general formula A2B3
belonging to the hexagonal structure [10]. The ultrahigh-density phase-change memory can
be formed by using the difference resistance between various phases of In2Se3[11, 12]. It also
has potential applications in rotary polarisers’ optoelectronic device fabrications. Another
interesting application of In2Se3 are solar cells [13] and in phase-change optical recording
medium[14].
Materials and Methods
The Elemental materials Indium, Selenium and Antimony of 99.999 %( 5N) purity, used for
the preparation of the alloy. These were weighted to stoichiometric proportion and sealed in a
quartz ampoule of0.25 cm in length and 1 cm in diameter under the vacuum of the order of
10-5
torr. The ampoule containing charges were placed in a horizontal alloy mixing furnace at
the temperature 700 0C for 48 hour, during which it was continuously rocked and rotated for
proper mixing and reaction. The ingot was then cooled to room temperature over a period of
24 hour. The single crystals of In2Se2.7Sb0.3were grown by the Bridgeman method with the
growth velocity was 0.35 cm / hr and freezing interface temperature gradient was 60 0C / cm.
Some interesting features on the top free surface of the as grown crystals were observed by
using an optical microscope. A new dislocation etchant developed by using AR grade
chemicals, as discussed below.
Result And Discussion

International Journal of Research in Modern Engineering and Emerging Technology (IJRMEET) UGC Approved id_47203
Vol. 5, Sp. Issue: 9, Sept.: 2017 (IJRMEET) ISSN: 2320-6586
23 Online International, Refereed, Impact factor & Indexed Monthly Journal www.raijmr.com
RET Academy for International Journals of Multidisciplinary Research (RAIJMR)
The surface features and etch patterns of the as grown crystals were examined using a optical
microscope. The topographical variation is found to be the In2Se2.7Sb0.3crystal and hence the
discussion is generalized for all these crystals. Generally, well developed good quality
crystals are found to be orthorhombic in habit. Fig. 1 shows a typical crystal of In2Se2.7Sb0.3.
These crystals have well developed (112) faces. It is observed that generally, the opaque
crystal.
Figure 1. Typical crystal photograph of In2Se2.7Sb0.3.
Most of the orthorhombic crystals have lines running parallel to the major axis and the crystal
is easily cleaved along this line, while in case of monoclinic crystal system, cleavage parallel
to the basal planes is common[15].
A systematic study of the growth features observed on top free surface of the crystals is
discussed in detail. Fig. 2 shows shallow hillock feature observed on top free surface of the
all samples.
Figure 2.Shallow hillock observed on the top free surface of In2Se2.7Sb0.3 crystals.

International Journal of Research in Modern Engineering and Emerging Technology (IJRMEET) UGC Approved id_47203
Vol. 5, Sp. Issue: 9, Sept.: 2017 (IJRMEET) ISSN: 2320-6586
24 Online International, Refereed, Impact factor & Indexed Monthly Journal www.raijmr.com
RET Academy for International Journals of Multidisciplinary Research (RAIJMR)
At the location of the horizontal ridge (denoted by arrows) in fig. 2 a slight bending of the
interference fringes can be recognized, and also it shows that the spacing between two steps
are uniform or equispaced. From this observation it can be concluded that the burgers vector
of the dislocation at the center of the shallow growth spirals must correspond to one unit
translation Similar unit lattice height and lower steps on aqueous solution grown crystal have
been observed and measured on potash alum[16], CdI2[17] and NiSO46H2O[18,19]. From
above discussion it is indicates the layer growth mechanism is predominant for the formation
or growth of crystals.
Figure 3.Parallel Striation observed on the top free surface of In2Se2.7Sb0.3 crystals.
Striations which are parallel lines are seen on most of the crystals. These striations are growth
layers formed on the surface due to periodic incorporation of impurities or variation of
microscopic growth rate [20, 21]. Fig. 3 shows the spreading of parallel growth layers are
comparatively thick at the top of the surface of the crystal. Parallel Striations to the major
axis can be seen which are evidently below the growth patterns. It can be conjectured that the
growth pattern has taken place at the final stage of the growth due to a large supply of ions at
this stage. Thickness of the growth layer increases when the concentration of the reactants is
high.
Desai C. F. have been reported in his Ph. D. Work, the striated morphology of the as-grown
crystal surface can be assigned to transient thermal currents set up by temperature instabilities
which are in turn usually caused by gradients, radial as well as longitudinal [22]. The
striations on a surface normal to the growth axis should then be specifically associated with
the radial gradients. Ideally, there should not be any radial temperature gradient.
Nevertheless, this cannot usually be eliminated because, apart from the furnace
characteristics, the ampoule and material together produce such gradients owing to the vast

International Journal of Research in Modern Engineering and Emerging Technology (IJRMEET) UGC Approved id_47203
Vol. 5, Sp. Issue: 9, Sept.: 2017 (IJRMEET) ISSN: 2320-6586
25 Online International, Refereed, Impact factor & Indexed Monthly Journal www.raijmr.com
RET Academy for International Journals of Multidisciplinary Research (RAIJMR)
difference in their thermal conductivities. Such features were observed in all the crystals
grown by the Bridgman technique.
Figure 4.Very low step train on 110 observed on the top free surface of In2Se2.7Sb0.3
crystals.
The Bridgman grown crystals were cleaved and the cleavage plane was almost parallel to the
growth axis, except for few cleavage lines, which may be due to the stress introduced during
the act of cleaving, the planes were seen to be free of any structures which may resemble
striations.
Also non – bunched steps with very low steps heights, as shown in fig. 4 were commonly
observed. The height of these steps equal about 10-20 Å as was estimated by comparison of
their contrasts on the phase contrast micrograph with the contrast of steps of well-known
height on 111 and 100 potash alum [23].
Observation of very low steps on 110 layer is extremely difficult, even more than on the
100 and 111 faces because of the high anisotropy of the band within a growth layer of
110. The 110 faces do not only contain the strong PBC , but also the weaker PBC
. Such anisotropy, due to the occurrence of some weak lateral bond in the growth layer
of the 110face lead to a lowering of the edge free energy of a two- dimensional nucleus,
this promoting two- dimensional nucleation as was shown by Monte Carlo Simulation [24].
So, due to an enhanced probability of nucleation growth at somewhat higher super
saturations, which may occur for a short time during the removal of crystal from the solution,
the original step pattern may be no longer visible by optical microscopy because of
interference of this step pattern by two- dimensional nuclei.This may occur as a result of
body phenomena.

International Journal of Research in Modern Engineering and Emerging Technology (IJRMEET) UGC Approved id_47203
Vol. 5, Sp. Issue: 9, Sept.: 2017 (IJRMEET) ISSN: 2320-6586
26 Online International, Refereed, Impact factor & Indexed Monthly Journal www.raijmr.com
RET Academy for International Journals of Multidisciplinary Research (RAIJMR)
The perfection of the grown crystals in terms of dislocation content was estimated by the
using dislocation etchant developed by the present authors after numerous trials. The
characteristics of the etchant are shown below.
ETCHANT PROPORTIONS: 5 part of saturated solution of Tartaric acid + 4 part of HNO3
(70% AR) + 1.1 part of Distilled water.
This mixture is capable of producing well defined triangular etchpits. The etching time is 12
second to yield the etch pits. Fig. 5 shows the etch pits, etchant to be capable of revealing
dislocations intersecting the cleavage plane.
Figure 5.Increasing etching observed on the top free surface of In2Se2.7Sb0.3 crystals.
The test of successive etching is based on the fact that a dislocation line cannot terminate
within the crystal. Fig.5 show the etch patterns obtained on the same region on the same
cleavage surface etched for 10 and 15 seconds, respectively. It can be seen that the pits have
to some extent increased in size with the etching time, whereas their number has remained the
same, indicating thereby that the pits are at the sites of emergence of dislocation.
Figure 6.SCRECH MARK observed on the top free surface of In2Se2.7Sb0.3 crystals.

International Journal of Research in Modern Engineering and Emerging Technology (IJRMEET) UGC Approved id_47203
Vol. 5, Sp. Issue: 9, Sept.: 2017 (IJRMEET) ISSN: 2320-6586
27 Online International, Refereed, Impact factor & Indexed Monthly Journal www.raijmr.com
RET Academy for International Journals of Multidisciplinary Research (RAIJMR)
Fig. 6 shows the etch pattern obtained around a scratch produced on the surface. The
increased density and rearrangement of the etch-pits along the slip traces near the scratch
show that the etchant is capable of revealing fresh dislocations also.
Figure 7.Low Angle Boundary observed on the top free surface of In2Se2.7Sb0.3 crystals.
Fig. 7 shows the rows of etch pits originating from point are clearly visible. In the upper part
of the photograph, scattered etch pits are seen and the rows of etchpits may be due to the
deformation introduced during the act of cleavage. The distribution of etch pits and low angle
boundary obtained after etching the specimen by the etchant25
. There are seen distinct rows of
closely spaced etch pits as well as branching of rows. These rows resemble the low angle
boundaries commonly observed in metallic and intermetallic crystals [25-31]. Three rows of
dislocations meeting at a point are known as triaxial boundaries. A model based on minimum
free energy [32] for dislocation tilt boundary gives the relation
nA = nB + nC ……………… (1).
Where, nA,nB and nC are average density of pits along A, B and C branches, respectively.
This relation is satisfied with A, B and C designations indicated on the photograph in the
figure above.
CONCLUSION
Shallow hillock, observed on the top free surface of as grown crystal which represents the
layer growth mechanism is predominant during the crystal growth.
An etchant develop by the author is capable of revels the freshly new dislocations intersecting
the cleavage plane of the crystal.

International Journal of Research in Modern Engineering and Emerging Technology (IJRMEET) UGC Approved id_47203
Vol. 5, Sp. Issue: 9, Sept.: 2017 (IJRMEET) ISSN: 2320-6586
28 Online International, Refereed, Impact factor & Indexed Monthly Journal www.raijmr.com
RET Academy for International Journals of Multidisciplinary Research (RAIJMR)
ACKNOWLEDGMENT
We are thankful to DRS-SAP and DST-FIST programme sponsored to the Department of
Physics school of science, Gujarat University, Ahmedabad, Gujarat, India. Authors are also
thankful to Dr. P. R. Vyas and Prof. P. N. Gajjar, Head of physics department, school of
sciences, Gujarat University, Ahmedabad for his constant encouragement.
REFERENCES
1. Medvedeva, Z.C. Nauka, Moscow, 1968 (in Russian).
2. Herrero, J.;Ortega, J. Solar Energy Mater. 1987, 16, 477.
3. Whittingan,M. S. Solid State Chem. 1978, 12, 41.
4. Julien,C.; Chery, A.; Siapkas, D. Phys. Stat. Sol. (a) 1990, 118, 553.
5. Soeda,J. Ye,; Nakamura, S. Y.; Nittono, O. Jpn. J. Appl. Phys. 1998, 37 , 4264.
6. Katty, A.; Castro, C. A.; Odile, J. P.; Soled S.; Wold,A.J. Solid State Chem. 1978, 24,
107.
7. Sebastian, P.J.; Sivaramakrishnan, V. J. Appl. Phys. 1989, 65, 237.
8. Julien, C.; Eddrief, M. Materials Science and Engineering B, 1992, 13, 247.
9. Mccany, J. V.; Murray, R. V. J. Phy. C 1977, 10, 1211.
10. Parlak, M.; Ercelebi, C.; Gunal,I.; Salaeva Z.; Allkhverdiev,K. Thin Solid Films 1995,
258, 86.
11. Gibson, G. A.; Chaiken,A.; Nauka, K.; Yang,C. C.; Davidson, R.; Holden,A.;
Bicknell, R.; Yeh,B. S.; Chen,J.; Liao, H.; Subramanian,S.;Schut,D.;Jasinski
J.;Lilliental-Weber, Z. Appl. Phys. Lett. 2005, 86, 051902.
12. Lee, H.; Kang, D. H.; Tran, L., Mater. Sci. & Eng. B 2005, 119, 196.
13. Contreras,M.; Gabor,A.; Tennant, A.; Asher,S.; Noufi,R. J Mo Solar Cell Prog.
Photovoltaics 1994, 2, 287.
14. Nishida, T.; Terao, M.; Miyauchi,Y.; Horigome,S.; Kaku, T.; Ohta,N. Appl. Phys.
Lett. 1987, 50, 667.
15. J. D. Dana., The System of Mineralogy, John Wiley and Sons, New York, 1951, 2,
208.
16. Van Enckevort,W. J. P.; Bennema, P.; Van der Linden,W. H. Z. Phy. Chemi (Neue-
Folge) 1981, 124, 171.
17. Okaya, Y. Acta Crystal. 1965, 19, 879.
18. Van Enckevort, W. J. P.; Klapper, H. J. Crystal Growth,1987, 80, 91.

International Journal of Research in Modern Engineering and Emerging Technology (IJRMEET) UGC Approved id_47203
Vol. 5, Sp. Issue: 9, Sept.: 2017 (IJRMEET) ISSN: 2320-6586
29 Online International, Refereed, Impact factor & Indexed Monthly Journal www.raijmr.com
RET Academy for International Journals of Multidisciplinary Research (RAIJMR)
19. Bennema,P.; Van der Eerden,J.; Van Enckevort,W.J.P.; Vander Hock, B.;
Tsukamoto,K.Phys. Stat. Solidi (a) 1979, 55, 403.
20. Authier, A. J. Cryst. Growth, 1977, 42, 612.
21. Kitamura, K.; Komatsu, H. Krist. and Tech., 1978, 13, 811.
22. C. F. Desai,Ph.D. Thesis; The M. S. University(Vadodara, Gujarat, India,1980)
23. Van Enckevort, W. J. P.; Bennema, P.; Van der Linden,W. H. Z. Phy. Chemi 1981,
124, 171.
24. Van der Eerden, J. P.; Van Leeuwen,C.; Bennema, P.; Vander Kruk, W. L.;
Veltman,B. P. Th. J. Appl. Phys. 1977, 48, 2124.
25. Yim, Y. M.;Dismukes,J. P. J. Phys. Chem. Solid, suppl,1967, 187, 187.
26. Bhatt, V.P.; Pandya, G.R. J. Phys. “C” Solid State Physics, 1973, 6, 36.
27. Sagar, A.; Faust, J.W.J. Appl. Phys., 1967, 2S, 482..
28. Sagar, A.; Faust, J.W.Phys. Lett., 1966, 23, 406..
29. Amelinckx, S.Phil. Mag., 1956, 1, 269.
30. Brown, D.M.;Heymann, F.K.J. Appl. Phys., 1964, 35, 1947.
31. Jani, T.M.; Pandya, G.R.; Desai, C. F.J. Cryst. Res. And Technol., 1993, 28, K40.
32. Wemick, J.H.;Hobstetter, J.N.; Lovell, L.C.;Worsi, D.J. Appl. Phys.1958, 29, 1101.

International Journal of Research in Modern Engineering and Emerging Technology (IJRMEET) UGC Approved id_47203
Vol. 5, Sp. Issue: 9, Sept.: 2017 (IJRMEET) ISSN: 2320-6586
30 Online International, Refereed, Impact factor & Indexed Monthly Journal www.raijmr.com
RET Academy for International Journals of Multidisciplinary Research (RAIJMR)
Ultrasonic and Volumetric Study in the Solutions of Alkanols with
Aqueous Ethylene Glycol
Chintu J Patel
Research Scholar
Vibha Sharma
Faculty
Faculty of Science
Pacific Academic of Higher education and Research University
Udaipur
Abstract
In the current paper the Ultrasonic and volumetric study of some solutions were performed by
authors. In the current manuscript Comparison of ultrasonic velocities densities and viscosityof
pure liquids with the corresponding literature values at 308.15 K for different solutions were
studied and presented their experimental results. In the same time Variation of ultrasonic velocity
in the mixtures of methanol, ethanol and 1- propanol with aqueous ethylene glycol was
calculated and graphical data were obtained. Deviation in ultrasonic velocity, deviation in
isentropic compressibility, excess intermolecular free length, excess acoustic impedance, with
mole fraction of methanol, ethanol and 1- propanol in aqueous ethylene glycol solution at T =
308.15 K were calculated.
Key Word
Ultrasonic, Ultrasonic Velocity, Deviation in ultrasonic velocity, deviation in isentropic
compressibility, excess intermolecular free length, excess acoustic impedance
Introduction
The properties of liquid mixtures and solutions can be altered continuously within a reasonable
range by varying the concentration till an optimum value of some desired parameter is attained.
The pure liquids lack such flexibility[1]. The study of properties of liquid mixtures and solutions
finds direct application in chemical, biochemical and medical industry[2]. Speed of sound, itself,
is highly sensitive to the structure and interactions present in liquid systems as it is
fundamentally related to the binding forces between the constituents of the medium[3-5]. The
measurement of speed of sound in liquids enables determination of some useful acoustic and
thermodynamic parameters that are found to be very sensitive to molecular interactions[6].

International Journal of Research in Modern Engineering and Emerging Technology (IJRMEET) UGC Approved id_47203
Vol. 5, Sp. Issue: 9, Sept.: 2017 (IJRMEET) ISSN: 2320-6586
31 Online International, Refereed, Impact factor & Indexed Monthly Journal www.raijmr.com
RET Academy for International Journals of Multidisciplinary Research (RAIJMR)
Hence such measurements are useful to study the nature and strength of molecular interactions in
liquid mixtures[7]. Water and alcohol mixtures show unique maxima and minima in their
thermodynamic and acoustic properties at low alcohol concentrations[8]. The formation of such
maxima/minima in some aqueous solutions of electrolytes and in non-aqueous solutions is also
reported in literature[9].
Experiment
The chemicals used in the present study are ethylene glycol (mass fraction purity 0.99), methanol
(mass fraction purity 0.99), ethanol (mass fraction purity 0.99) (Changshu Yangyuan Chemicals-
China make) and 1-propanol (mass fraction purity 0.99) (G.R Grade, obtained from LOBA
Chemicals, Mumbai, INDIA). These were further purified by standard methods. The solutions of
aqueous ethylene glycol of 0.3 m and 0.9 m are prepared using triply distilled deionised water.
These solutions, in turn, are used to prepare liquid mixtures with methanol, ethanol and 1-
propanol so that its entire range of composition is covered. All the mixtures have been prepared
in the specially designed glass bottles with air tight stoppers and adequate precautions have been
taken to minimize evaporations losses. The weighing of solutions has been made using a
METTER TOLEDO (Switzerland make) ABB5-S/FACT digital balance with an accuracy of
0.01mg. The ultrasonic velocities, densities and viscosities are measured at 308.15 K for the pure
liquids used in this investigation and are compiled in Table 6.A.1 together with the literature data
available.
Table 1: Comparison of ultrasonic velocities (𝒖), densities (𝝆) and viscosity (𝒏) of pure
liquids with the corresponding literature values at 308.15 K
Liquid 𝒖
𝒎. 𝒔−𝟏
𝝆
𝒌𝒈.𝒎−𝟑
𝒏
𝟏𝟎−𝟑𝑵. 𝒔.𝒎−𝟐
Expt. Lit. Expt. Lit. Expt. Lit.
Water 1520.22 1519.36 994.06 994.1 0.7190 0.7210
Ethylene glycol 1632.32 1632.10 1105.85 1103.10 10.4894 10.9680
Methanol 1072.65 1072.40 776.63 776.70 0.4786 0.4780
Ethanol 1115.10 1111.00 776.49 776.41 0.8840 0.8930
1-propanol 1175.60 1175.10 791.41 791.40 1.4152 1.4172

International Journal of Research in Modern Engineering and Emerging Technology (IJRMEET) UGC Approved id_47203
Vol. 5, Sp. Issue: 9, Sept.: 2017 (IJRMEET) ISSN: 2320-6586
32 Online International, Refereed, Impact factor & Indexed Monthly Journal www.raijmr.com
RET Academy for International Journals of Multidisciplinary Research (RAIJMR)
Result and Discussion
The variation of ultrasonic velocity (𝑢) at two different molalities of aqueous ethylene glycol
with mole fraction of methanol/ethanol/1-propanol is shown in Figures 6.A.1.a, 6.A.1.b and
6.A.1.c respectively. The ultrasonic velocity increases in the 0 < 𝑥 < 0.15 mole fraction of
alkanol and it is found to decrease beyond 0.15 mole fraction of alkanol. The ultrasonic velocity
shows a maximum value at about 0.15 m mole fraction of methanol/ethanol/1-propanol for 0.3 m
and 0.9 m aqueous solutions of ethylene glycol. Water and ethylene glycol are both associated
liquids, through the formation of hydrogen bonding. When ethylene glycol is added to water,
association between ethylene glycol and water molecules takes place through hydrogen bonding
which is shown in schema I. This leads to the increase of open structures in the solution as diol
acts as a structure maker.
Table 2: Calculated properties of mole fraction of methanol (x) in aqueous ethylene glycol
solution at T = 308.15 K
X Volume fraction
of methanol
∆𝒖
𝒎. 𝒔−𝟏
∆𝒌𝒔
𝟏𝟎−𝟏𝟎𝑷𝒂−𝟏 𝑳𝒇
𝑬
𝟏𝟎−𝟏𝟎𝒎
𝒁𝑬
𝟏𝟎𝟔𝒌𝒈.𝒎−𝟐. 𝒔−𝟏
0.3 m aqueous ethylene glycol
0.0000 0.0000 0.0000 0.0000 0.0000 0.0000 0.0987 0.0981 69.32 -0.7406 -0.0296 0.0670 0.1968 0.1937 124.27 -1.4004 -0.0558 0.1249 0.3009 0.2937 166.15 -1.9896 -0.0784 0.1669 0.3915 0.3803 199.59 -2.4663 -0.0966 0.1967 0.4944 0.4774 200.68 -2.7687 -0.1061 0.1980 0.5947 0.5707 185.88 -2.9005 -0.1091 0.1871 0.7001 0.6713 154.25 -2.7953 -0.1022 0.1564 0.7963 0.7652 130.64 -2.6003 -0.0933 0.1330 0.8932 0.8744 67.19 -1.6557 -0.0555 0.0637 1.0000 1.0000 0.0000 0.0000 0.0000 0.0000
0.9 m aqueous ethylene glycol 0.0000 0.0000 0.0000 0.0000 0.0000 0.0000 0.0986 0.0978 66.21 -0.7285 -0.0290 0.0668 0.1937 0.1905 122.68 -1.3816 -0.0551 0.1247 0.2965 0.2885 165.73 -1.9781 -0.0785 0.1708 0.3956 0.3816 202.40 -2.5076 -0.0992 0.2086 0.4939 0.4741 205.42 -2.8117 -0.1091 0.2103 0.5969 0.5717 188.64 -2.9358 -0.1108 0.1910 0.6972 0.6672 168.59 -2.9326 -0.1083 0.1705 0.7957 0.7634 140.71 -2.7214 -0.0984 0.1425 0.8934 0.8765 63.85 -1.6140 -0.0535 0.0585 1.0000 1.0000 0.0000 0.0000 0.0000 0.0000

International Journal of Research in Modern Engineering and Emerging Technology (IJRMEET) UGC Approved id_47203
Vol. 5, Sp. Issue: 9, Sept.: 2017 (IJRMEET) ISSN: 2320-6586
33 Online International, Refereed, Impact factor & Indexed Monthly Journal www.raijmr.com
RET Academy for International Journals of Multidisciplinary Research (RAIJMR)
Table 6.A.3 Calculated properties of mole fraction of ethanol (𝒙) 𝒊n aqueous ethylene
glycol solution at T = 308.15 K
X Volume fraction
of ethanol
∆𝒖
𝒎. 𝒔−𝟏
∆𝒌𝒔
𝟏𝟎−𝟏𝟎𝑷𝒂−𝟏 𝑳𝒇
𝑬
𝟏𝟎−𝟏𝟎𝒎
𝒁𝑬
𝟏𝟎𝟔𝒌𝒈.𝒎−𝟐. 𝒔−𝟏
0.3 m aqueous ethylene glycol 0.0000 0.0000 0.0000 0.0000 0.0000 0.0000 0.0579 0.0576 62.97 -0.5059 -0.0219 0.0564 0.1485 0.1456 139.49 -1.1839 -0.0512 0.1329 0.2275 0.2216 171.74 -1.5783 -0.0667 0.1597 0.3038 0.2931 165.85 -1.7650 -0.0723 0.1565 0.4045 0.3884 152.14 -1.9199 -0.0757 0.1397 0.5094 0.4893 138.43 -2.0143 -0.0766 0.1203 0.6114 0.5869 113.52 -1.9505 -0.0720 0.0982 0.7413 0.7132 98.13 -1.8745 -0.0681 0.0872 0.8611 0.8434 40.48 -1.0662 -0.0358 0.0311 1.0000 1.0000 0.0000 0.0000 0.0000 0.0000
0.9 m aqueous ethylene glycol 0.0000 0.0000 0.0000 0.0000 0.0000 0.0000 0.0703 0.0696 77.13 -0.6220 -0.0272 0.0741 0.1447 0.1420 132.13 -1.1278 -0.0485 0.1254 0.2265 0.2202 166.62 -1.5468 -0.0653 0.1569 0.3562 0.3395 181.83 -2.0024 -0.0827 0.1813 0.4675 0.4429 158.21 -2.1139 -0.0842 0.1577 0.5585 0.5264 139.95 -2.1104 -0.0824 0.1345 0.6578 0.6243 119.20 -2.0762 -0.0786 0.1162 0.7845 0.7500 91.16 -1.8284 -0.0676 0.0902 0.8593 0.8397 33.95 -1.0017 -0.0337 0.0272 1.0000 1.0000 0.0000 0.0000 0.0000 0.0000
Table 6.A.4 Calculated properties of mole fraction of 1-propanol (𝒙) in aqueous ethylene
glycol solution at T = 308.15 K
X Volume raction
of methanol
∆𝒖
𝒎. 𝒔−𝟏
∆𝒌𝒔
𝟏𝟎−𝟏𝟎𝑷𝒂−𝟏 𝑳𝒇
𝑬
𝟏𝟎−𝟏𝟎𝒎
𝒁𝑬
𝟏𝟎𝟔𝒌𝒈.𝒎−𝟐. 𝒔−𝟏
0.3 m aqueous ethylene glycol 0.0000 0.0000 0.0000 0.0000 0.0000 0.0000 0.0548 0.0545 71.30 -0.4835 -0.0222 0.0617 0.1167 0.1150 100.97 -0.7649 -0.0339 0.0862 0.1886 0.1852 71.22 -0.7197 -0.0287 0.0467 0.2606 0.2553 61.98 -0.7607 -0.0285 0.0297 0.3448 0.3373 45.64 -0.7440 -0.0258 0.0087 0.4456 0.4371 26.14 -0.6583 -0.0204 -0.0157 0.5471 0.5387 -5.31 -0.3874 -0.0083 -0.0457 0.6934 0.6860 -17.58 -0.1577 -0.0001 -0.0539 0.8179 0.8106 -2.19 -0.2662 -0.0062 -0.0231 1.0000 1.0000 0.0000 0.0000 0.0000 0.0000

International Journal of Research in Modern Engineering and Emerging Technology (IJRMEET) UGC Approved id_47203
Vol. 5, Sp. Issue: 9, Sept.: 2017 (IJRMEET) ISSN: 2320-6586
34 Online International, Refereed, Impact factor & Indexed Monthly Journal www.raijmr.com
RET Academy for International Journals of Multidisciplinary Research (RAIJMR)
0.9 m aqueous ethylene glycol 0.0000 0.0000 0.0000 0.0000 0.0000 0.0000 0.0561 0.0556 69.29 -0.4755 -0.0218 0.0621 0.1159 0.1142 92.07 -0.7117 -0.0312 0.0773 0.1842 0.1805 74.47 -0.7388 -0.0298 0.0520 0.2956 0.2875 61.15 -0.8278 -0.0310 0.0333 0.3565 0.3474 47.39 -0.8569 -0.0308 0.0297 0.4427 0.4327 31.87 -0.7330 -0.0237 -0.0083 0.5687 0.5592 -15.11 -0.3947 -0.0085 -0.0401 0.7086 0.7000 -22.02 -0.2642 -0.0043 -0.0360 0.8276 0.8209 -1.76 -0.2745 -0.0064 -0.0233 1.0000 1.0000 0.0000 0.0000 0.0000 0.0000
Fig. 1: Variation of ultrasonic velocity (𝒖) in the mixtures of methanol with aqueous
ethylene glycol
Fig. 2: Variation of ultrasonic velocity (𝒖) in the mixtures of ethanol with aqueous ethylene
glycol
-100100300500700900
1100130015001700190021002300250027002900310033003500
-0.1 0.2 0.5 0.8 1.1
0.9m
0.3m
0
200
400
600
800
1000
1200
1400
1600
1800
-0.1 0.2 0.5 0.8 1.1
0.3 m
0.9 m

International Journal of Research in Modern Engineering and Emerging Technology (IJRMEET) UGC Approved id_47203
Vol. 5, Sp. Issue: 9, Sept.: 2017 (IJRMEET) ISSN: 2320-6586
35 Online International, Refereed, Impact factor & Indexed Monthly Journal www.raijmr.com
RET Academy for International Journals of Multidisciplinary Research (RAIJMR)
Fig. 3: Variation of ultrasonic velocity (𝒖) in the mixtures of 1- propanol with aqueous
ethylene glycol
Representation of inter molecular interactions in (a) water (b) alcohols (c) ethylene glycol (d)
between water and ethylene glycol molecules. The maximum value in ultrasonic velocity is
observed in the low concentration region of alkanols added to the aqueous ethylene glycol. The
origin of maximum in the low concentration region of alkanol is due to long-range order in water
giving rise to hydrogen bonded structure. Such a structure possesses many cavities and these
cavities can accommodate solute such as alkanol molecules. This is further supported by the
observed large differences in the molar volume between the components of the solution. As
alkanol is added to the aqueous ethylene glycol, alkanol molecules go on occupying the cavities
created in the aqueous ethylene glycol structure. This gives rise to a denser packing of molecules
resulting in the increase of ultrasonic velocity of solutions. This process continues until all the
cavities are filled with solute molecules. Further addition of alkanol, leads to gradually for the
formation of unassociated monomer structures in the solution and at the same time there are
some alkanol molecules which disrupts the hydrogen bonding existing between the water +
ethylene glycol molecules resulting in unassociated ethylene glycol molecules in the solution.
Thus, the structure of solution becomes more and more loosely packed by increasing the
concentration of alkanol molecules. As a result, the ultrasonic velocity in the solution decreases.
0
200
400
600
800
1000
1200
1400
1600
1800
-0.1 0.2 0.5 0.8
0.3m
0.9m

International Journal of Research in Modern Engineering and Emerging Technology (IJRMEET) UGC Approved id_47203
Vol. 5, Sp. Issue: 9, Sept.: 2017 (IJRMEET) ISSN: 2320-6586
36 Online International, Refereed, Impact factor & Indexed Monthly Journal www.raijmr.com
RET Academy for International Journals of Multidisciplinary Research (RAIJMR)
This might be the possible reason to explain the ultrasonic velocity behaviour in the present
investigated solutions. The deviation in ultrasonic velocity (∆𝑢), deviation in isentropic
compressibility (∆𝑘𝑠), excess inter molecular free length (𝐿𝑓𝐸 ) and excess acoustic impedance
(𝑍𝐸) have been calculated from the experimental results of ultrasonic velocity (𝑢) and density
(𝜌) and the data for the above properties are listed in Table 2, .3 and 4 for methanol, ethanol and
1-propanol with aqueous ethylene glycol solution respectively. The variation of deviation in
ultrasonic velocity (∆𝑢) and deviation in isentropic compressibility (∆𝑘𝑠) with mole fraction of
methanol/ethanol/1-propanol is shown in Figures 6.1, 6.2 and 6.3 respectively. The sign and
magnitude of 𝛥𝑢 𝑎𝑛𝑑 ,∆𝑘𝑠 played an important role to describe the molecular rearrangement and
is resulted to the existence of molecular interactions among the component molecules in the
solutions.
Reference
1. B Garcia, R Alcalde, J M Leal and J S Matos, J. Chem. Soc., Faraday Trans. 93, 1115
(1997)
2. K S Pitzer, Thermodynamics, 3rd. Ed. (McGraw-Hill Book Co., NY, 1995)
3. G Douheret, M I Davis, I J Fjallanger and H Hoiland, J. Chem. Soc., Faraday Trans. 93,
1943 (1997)
4. K Tamura, T Sonoda and S Murakami, J. Solution Chem. 28, 777 (1999)
5. A Ali, A K Nain and M Kamil, Thermochim. Acta 274, 209 (1996)
6. A Ali, S Hyder and A K Nain, Acoustics Lett. 21, 77 (1998); J. Mol. Liq. 79, 89 (1999);
Indian J. Phys. B74, 63 (2000)
7. B Jacobson, Acta Chem. Scand. 5, 1214 (1951); 6, 1485 (1952); J. Chem. Phys. 20, 927
(1952)
8. W Van Dael and E Vangeel, Proc. Ist Internat. Conf. on calorimetry thermodynamics,
Warsaw (1969)
9. J A Riddick, W B Bunger and T K Sakano, Techniques in chemistry, vol. VII, Organic
solvents, 4th edn. (John Wiley, New York, 1986)

International Journal of Research in Modern Engineering and Emerging Technology (IJRMEET) UGC Approved id_47203
Vol. 5, Sp. Issue: 9, Sept.: 2017 (IJRMEET) ISSN: 2320-6586
37 Online International, Refereed, Impact factor & Indexed Monthly Journal www.raijmr.com
RET Academy for International Journals of Multidisciplinary Research (RAIJMR)
Mobile Controlled Robot Without Microcontroller Patel Virendrakumar N.
School of Science, Physics Department, Gujarat University Navrangpura, Ahmedabad
Abstract
In this project, we present the controlling of a Robot using DTMF technique Therobot is
controlled by a mobile phone that calls the other mobile phone attached to the robot. During
the call, if any button is pressed, the tone corresponding to the button pressed is heard at the
other end. This tone is called "Dual Tone Multi Frequency tone (DTMF) Using DTMF code
direction of motion of the robot can be controlled by mobile phone. The above system can be
used for military purpose as bomb detector and as "spy robot” and for surveillance
Introduction
DTMF is the acronym for Dual tone Multi frequency. Robotic vehicle based on DTMF
technology is explained in this article. Here is a circuit that operates the robot without using a
microcontroller. This circuit consists of simple ICs. When a key is pressed from our mobile,
it generates a tone combination of two frequencies from our keypad. In the two frequencies,
one is high frequency and another one is low frequency. This frequency can be decoded by
the decoder IC into binary sequence.
DTMF BASED ROBOTIC vehicle circuit principle
DTMF based robotic vehicle circuit consists of DTMF decoder IC, driver IC l293D IC and
motors. DTMF decoder IC used is IC CM8870. It has 18 pins. Tone from DTMF encoder is
given to the DTMF decoder IC. The decoder IC internally, consists of operational amplifier
whose output is given to pre-filters to separate low and high frequencies. Then it is passed to
code detector circuit and it decodes the incoming tone into 4bits of binary data. This data at
the output is directly given to the driver IC to drive the two motors. These motors rotate
according to the decoded output.
If the button pressed from mobile is ‘1’, it gives a decoded output of ‘0001’. Thus, motor
connected to the first two pins will get 0 volts and second motor will have 5 volts to one pin
and 0 volts to another pin. Thus, second motor starts rotating and first motor is off. So, robot
moves in one direction either to left or right. If the robot is to rotate forward or backward
then the binary value should be either ‘0101’ or ‘1010’. These values indicate that two
motors rotate in the same direction i.e. either forward or backward. The following table gives
the low frequency, high frequency and binary output value of each button pressed in the
keypad.

International Journal of Research in Modern Engineering and Emerging Technology (IJRMEET) UGC Approved id_47203
Vol. 5, Sp. Issue: 9, Sept.: 2017 (IJRMEET) ISSN: 2320-6586
38 Online International, Refereed, Impact factor & Indexed Monthly Journal www.raijmr.com
RET Academy for International Journals of Multidisciplinary Research (RAIJMR)
Figure 1 - DTMF

International Journal of Research in Modern Engineering and Emerging Technology (IJRMEET) UGC Approved id_47203
Vol. 5, Sp. Issue: 9, Sept.: 2017 (IJRMEET) ISSN: 2320-6586
39 Online International, Refereed, Impact factor & Indexed Monthly Journal www.raijmr.com
RET Academy for International Journals of Multidisciplinary Research (RAIJMR)
BLOCK DIAGRAM
Figure – 2 DTFM block Diagram
CIRCUIT DIAGRAM
Step by Step Instructions.
1) Power Supply
Take the breadboard and connect the battery holder in horizontal position.
Insert the positive and negative wire of battery snap in holder.

International Journal of Research in Modern Engineering and Emerging Technology (IJRMEET) UGC Approved id_47203
Vol. 5, Sp. Issue: 9, Sept.: 2017 (IJRMEET) ISSN: 2320-6586
40 Online International, Refereed, Impact factor & Indexed Monthly Journal www.raijmr.com
RET Academy for International Journals of Multidisciplinary Research (RAIJMR)
Attach IC 7805 (Voltage Regulator), and place one 10 µF capacitor in IN & GND
connection of IC 7805 and other in GND & OUT connection.
Take the positive supply from the battery holder via breadboard wire and place it in IN
of IC 7805, and connect its negative supply in the last row of the breadboard.
Place the GND of IC 7805 in the last row of the breadboard, and transfer its OUT to the
first row of the breadboard.
Because of these connections, +5V power is obtained in the first row of the breadboard.
To check the power flow path, an LED is given a positive supply via 1K Resistor.
2) IC CM8870 Connections
Connect 1st & 4
th pin of CM8870 (DTMF Receiver) together.
Pick one 100K resistor and place one side of it in 2nd
pin and other side to the 0.1 µf
capacitor.
Pick another 100K resistor and connect 3rd
and 2nd
pin.
Provide GND connection to 5th
, 6th
, and 9th
pins.
Couple 7th
and 8th
pins with 3.58 MHz Oscillator.
Provide +5V supply to 10th
and 18th
pins.
Take one 300K resistor, and place one side of it to 16th pin and other to 0.1 µf capacitor
from 17th pin.
Connect 0.1 µf capacitor to the 18th
pin.
3) IC L293D connections
Insert IC L293D (Motor Controller) in the breadboard.
Supply +5V power to 1st, 8
th, 9
th, and 16
th pins.
Provide ground connection to 4th
, 5th
, 12th
and 13th
pins.
Attach 2nd
, 7th
, 10th
, and 15th
pins of L293D to 14th
, 13th
, 12th
, and 11th
pins of IC
CM8870 respectively.
4) 12V DC motor connections
Take the wire of Right Motor and insert it in 3rd
and 6th
pins of IC L293D.
Also, place the wire of Left Motor in 11th
and 14th
pins of IC L293D.
5) Universal Headphone Jack Connection
Connect the sleeve to the output of 0.1 µf capacitor (2nd
pin) in the IC CM8870.
Provide GND connection to the tip and ring.
Working
After completing the construction, connect the circuit with 9V battery. Also, connect the universal
headphone jack to its respective cell phone with incoming facility. Activate auto-answer mode in
the cell phone before connecting it to the circuit, and enable keypad tones in the cell phone that
you use to make calls. Now, your robot is ready to operate wirelessly with GSM facility once you
make a call to the cell phone connected to the robot. By pressing the number keypads in your cell
phone, you will be able to move the robot in various directions.It is made possible with the help of
Dual Tone Multi Frequency receiver (IC CM8870), in which the sleeve connection of the robot
cell phone is connected to the IC CM8870. The tone received from your cell phone to the robot
cell phone will be converted into binary form, and suitable output is provided by the IC CM8870
to IC L293D.For example, if you press no. 9 in your cell phone, then the robot will move forward
(as per this circuit).

International Journal of Research in Modern Engineering and Emerging Technology (IJRMEET) UGC Approved id_47203
Vol. 5, Sp. Issue: 9, Sept.: 2017 (IJRMEET) ISSN: 2320-6586
41 Online International, Refereed, Impact factor & Indexed Monthly Journal www.raijmr.com
RET Academy for International Journals of Multidisciplinary Research (RAIJMR)
Output
Hardware Module
Acknowledgements
I, hereby, take an opportunity to convey my gratitude for the generous assistance and
cooperation, that I received from the Professor Dr. D.S. TRIPATHI and to all those who
helped me directly and indirectly.
Input given on your cell phone The output obtained from the robot
1 Front Right
2 Reverse Left
3 Stop
4 Reverse Right
5 360 degree rotation (Right)
6 Reverse
7 Reverse Right
8 Front Left
9 Forward
0 360 degree rotation (Left)

International Journal of Research in Modern Engineering and Emerging Technology (IJRMEET) UGC Approved id_47203
Vol. 5, Sp. Issue: 9, Sept.: 2017 (IJRMEET) ISSN: 2320-6586
42 Online International, Refereed, Impact factor & Indexed Monthly Journal www.raijmr.com
RET Academy for International Journals of Multidisciplinary Research (RAIJMR)
I am sincerely thankful for their constant help, stimulating suggestions and encouragement
helped me in completing my Thesis work successfully.
Finally, I am also indebted to my friends without whose help I would have had a hard time
managing everything on my own.
Application
[1] Industrial application
[2] With camera, can be used in surveillances system
References
[1] www.roboticsbible.com
[2] www.engineersgarage.com

International Journal of Research in Modern Engineering and Emerging Technology (IJRMEET) UGC Approved id_47203
Vol. 5, Sp. Issue: 9, Sept.: 2017 (IJRMEET) ISSN: 2320-6586
43 Online International, Refereed, Impact factor & Indexed Monthly Journal www.raijmr.com
RET Academy for International Journals of Multidisciplinary Research (RAIJMR)
A study on the peak Dst and peak negative Bz relationship during
intense geomagnetic
Nirav H Thakkar , D.D.Joshi
Sheth M N Science College, Patan
Abstract
This paper is a study of the relationship between the geomagnetic storm index Dst and the
southward component, Bs, of the interplanetary magnetic field (IMF) driver. This study was
performed during observational period (2011-2013), for which 64 intense geomagnetic
storms (Dst 85 nT) were analyzed. After taking into account the propagation time between
the L1 point and Earth (1 h) and the magnetosphere/ring current response-time to solar wind
forcing (1 h), it was determined that the average delay between the peak Bs and the peak Dst
values is 2 h. It was also observed that the Bs value at peak Dst is 75% of the peak Bs value
in the entire event. When these results are analyzed in terms of the interplanetary electric
field, associated with Bz, some interesting additional studies are indicated, for which some
simple results, of practical space weather forecasting use, are anticipated.
Keywords— Dst Index,Bs component,Bz component,IMF
Introduction
For the association of geomagnetic storm intensity and the interplanetary magnetic field
driver, it is usually assumed that the peak value of the storm, as measured by the storm index
Dst, is attained after the southward component of the interplanetary magnetic field, Bz, has
also reached a peak value[1-2]. However, since there has not been done as yet a quantitative
study of this assumed relationship, in this paper we try to perform such a study for the ACE
observational period of 1997– 2002, during which 64 intense magnetic storms (Dst < 85 nT)
were identified, as described in the following section[3-5]. We believe that this study is
important not only as a forecast tool in space weather applications, but also for a better
physical understanding of solar wind magnetosphere interaction and ring current dynamics
during intense storms[6].

International Journal of Research in Modern Engineering and Emerging Technology (IJRMEET) UGC Approved id_47203
Vol. 5, Sp. Issue: 9, Sept.: 2017 (IJRMEET) ISSN: 2320-6586
44 Online International, Refereed, Impact factor & Indexed Monthly Journal www.raijmr.com
RET Academy for International Journals of Multidisciplinary Research (RAIJMR)
Methodology Analysis
The 1 hour Dst geomagnetic index was used in this work to characterize the geomagnetic
storm development and it was obtained from the World Data Center for Geomagnetism,
Lasco-SOHO CME Catalog. One-hour data of the interplanetary magnetic field Bz
component and Dst index were obtained from Lasco-SOHO CME Catalog. The period
selected for our analysis is observational period from January2011 –December 2013, for
which the Dst index was available in its final form when this work was performed. We have
selected intense geomagnetic storms that reached, at least, a Dst peak of 85 nT. Considering
this criterion, and also selecting storms with multiple, but well separated, peaks
corresponding to different energy injection events were obtained.
Figure 1. Scheme of Bz and Dst profiles during intense magnetic storms.
Figure 1 shows a scheme illustrating how the analysis was done. Figure 1 shows idealized Bz
and Dst profiles as a function of time (t). The Dst and Bs(Bz) peaks are identified by the
labels Dst peak and Bs peak. The storm main phase duration is indicated by the thinner line
and by the tm label. Two dotted vertical lines passing through the Dst and Bz peaks are
shown, and the corresponding values of Dst and Bz in their intersection with the curves are
determined. The Bz and Dst variations were calculated as the ratio between their peak values
and the values in those intersections (the variations are shown as DDst and DBz in Figure 1).
The delay time between Dst and Bz peaks is also determined and is indicated by Dt in Figure
1. This procedure was performed for each storm. For each geomagnetic storm, the hourly
values were provided by CDAW Data Center by NASA.This value was corrected in two
hours, i.e., the Dst curve was displaced two hours backwards in time, in order to take into
account the propagation time, of about 1h.

International Journal of Research in Modern Engineering and Emerging Technology (IJRMEET) UGC Approved id_47203
Vol. 5, Sp. Issue: 9, Sept.: 2017 (IJRMEET) ISSN: 2320-6586
45 Online International, Refereed, Impact factor & Indexed Monthly Journal www.raijmr.com
RET Academy for International Journals of Multidisciplinary Research (RAIJMR)
Results
Figure 2
Figure 3
Figure 4

International Journal of Research in Modern Engineering and Emerging Technology (IJRMEET) UGC Approved id_47203
Vol. 5, Sp. Issue: 9, Sept.: 2017 (IJRMEET) ISSN: 2320-6586
46 Online International, Refereed, Impact factor & Indexed Monthly Journal www.raijmr.com
RET Academy for International Journals of Multidisciplinary Research (RAIJMR)
Figures 2 and 3 and 4 show examples of geomagnetic storms studied in this work. Both
Figures 2 and 3 present the hourly averages of Bz and Dst. The position of peak Dst is
marked by a vertical line, whereas the duration of the main phase before this peak is indicated
by a horizontal bar. The peak values of Dst and Bz are also indicated by labels. In Figure 2,
the storm during January-December 2011 is shown. This was a typical ‘simple’, one-step
magnetic storm. Thus the Dt between these peaks was of 1 hour in this storm. Dst peak
reached 201 nT and Bz peak 23.9 nT. The IMF Bz varied rapidly and reached a peak in a few
hours, giving a Bz variation. The Dst index responded slowly and its relative variation. In
Figure 3, the storm during January-December 2012 is shown. This was a typical ‘simple’,
one-step magnetic storm. Thus the Dt between these peaks was of 1 hour in this storm. Dst
peak reached 201 nT and Bz peak 23.9 nT. The IMF Bz varied rapidly and reached a peak in
a few hours, giving a Bz variation. The Dst index responded slowly and its relative variation
In Figure 4, the storm during January-December 2013 is shown. This was a typical ‘simple’,
one-step magnetic storm. Thus the Dt between these peaks was of 1 hour in this storm. Dst
peak reached 201 nT and Bz peak 23.9 nT. The IMF Bz varied rapidly and reached a peak in
a few hours, giving a Bz variation. The Dst index responded slowly and its relative variation
Table 1. Average Storm Parameters Storms (2011-2013)
Parameter Average ± Standard Deviation
Dst peak 134.6 ± 55.8 nT
Bz in the Dst peak 11.9 ± 7.1 nT
Bz peak 15.6 ± 6.6 nT
Dst in the Bz peak 112.5 ± 58.6 nT
Table 1 shows the average and standard deviation parameters for the storms studied. The
values are the Dst peak (Dstpeak), the Bz value during the time of Dst peak (Bz0 ), the Bz
peak (Bzpeak), the Dst value during the time of Bz peak (Dst0 ). We can see that the average
delay between the Bz and Dst peaks is around 2 hours. As the main phase duration is around
10 hours, the ratio between these two periods is 0.2. The relative Bz and Dst variations are
0.75 and 0.82. This means that the Bz value at peak Dst is 75%, on average, of the minimum
Bz value, while the Dst value at peak Bz is, in average, 82% of the Dst peak.

International Journal of Research in Modern Engineering and Emerging Technology (IJRMEET) UGC Approved id_47203
Vol. 5, Sp. Issue: 9, Sept.: 2017 (IJRMEET) ISSN: 2320-6586
47 Online International, Refereed, Impact factor & Indexed Monthly Journal www.raijmr.com
RET Academy for International Journals of Multidisciplinary Research (RAIJMR)
Above figures show the distribution of the number of storms (left axis; percentage of storms
on the right axis) as a function of the delay Dt between the Bz-Dst peaks. It is seen that most
of the storms have a delay between 0 – 4 hours (more than 70% of the storms), while Table 1
gave an average of 2 hours. Scheme of Bz and Dst profiles during intense magnetic storms.
The peak values of Bz and Dst are indicated by Bzpeak and Dstpeak, the main phase duration
by tm, the delay between the Dst-Bz peaks by Dt and the relative variations by DDst and
DBz.
Figure 2 Geomagnetic storm during January-December 2011. The Bz and Dst hourly
averages are shown. The Dst peak is indicated by a line. This was a typical ‘simple’, one-
step, magnetic storm. Figure 3. Geomagnetic storm during January-December 2012. The Bz
and Dst hourly averages are shown. The Dst peak is indicated by a line. This was a typical
complex, double-step, magnetic storm.
Table 1. Average Storm Parameters for Storms (2011 – 2012) Parameter Average ± Standard
Deviation Dst peak 134.6 ± 55.8 nT Bz in the Dst peak 11.9 ± 7.1 nT Bz peak 15.6 ± 6.6 nT
Dst in the Bz peak 112.5 ± 58.6 nT
Discussion and Conclusions
The main result of the present study indicates that the average delay between the peak Dst
value of an intense magnetic storm and the corresponding peak of the driving Bs value is
about two hours. Since the average duration of the main phase intervals of the studied storms
is 10 hours, this two-hour delay represents 20% of the average main phase duration. Thus, for
storm-forecasting purposes, one can expect that the peak of the storm’s intensity, as measured
by the Dst index, will occur about two hours after the driving Bs component of the IMF has
reached its peak value. It was also found that the Bs value at the time when Dst reaches its
peak is, on average, 75% of the peak Bs value, whereas the Dst value at the time when Bs
reaches its peak is, on average, 82% of the peak Dst value. These two percentages are
somewhat similar. The result shown by Figure 4, that peak Dst occurs with a delay between 0
and 4 hours (with an average of 2 hours) after Bs has reached its peak, may suggest a
physical response time of the ring current to the solar wind driver at the peak interval of an
intense magnetic storm. This information would be of interest for modeling efforts of the ring

International Journal of Research in Modern Engineering and Emerging Technology (IJRMEET) UGC Approved id_47203
Vol. 5, Sp. Issue: 9, Sept.: 2017 (IJRMEET) ISSN: 2320-6586
48 Online International, Refereed, Impact factor & Indexed Monthly Journal www.raijmr.com
RET Academy for International Journals of Multidisciplinary Research (RAIJMR)
current dynamics and studies of loss processes near the peak of the storm. We should note
that delay times between Dst and Bs at other moments of the storm evolution may take
different and usually larger time lags [e.g., Gonzalez et al., 1994]. The corresponding result
that the Bs value at the time of peak Dst is, on average, 75% of the peak Bs value, could
suggest that the storm continues growing for a time interval of about 2 hours, even though Bs
is already decreasing in magnitude. Again, this time lag can be associated to the loss
processes that need such a time constant to overcome the energy input associated to Bs at this
phase (near maximum) of the storm evolution. The two-hour delay can also be used in
studies of storms for which one knows the peak Dst value but, for the corresponding solar
wind driver, one does not have a measured value of peak Bs, only a modeled value from
indirect observations and also one does not know the time at which to select the peak Bs
value. This was the case of a recent study of the historical super intense storm of September
2, 1859, for which Tsurutani et al. [2003] assumed a direct and simultaneous time association
for the occurrence of the Bs and Dst peaks. In order to do a more complete study of this issue,
a more detailed treatment of the data would be necessary, for different levels of Dst domains,
since each event is different, both in the shape of the Ey structure as well as in its duration.
This type of study is outside the scope of the present letter. To our knowledge, the main
results addressed in this letter have not been treated in magnetic storm models, probably
because models usually tend to predict specific events, while we have done a more statistical
study. Thus, we would like to suggest that coming models, whenever possible, tend to use the
information provided by our results.
Acknowledgments
We wish to thanks the CDAW DATA CENTER NASA for Geomagnetism for the Dst index
and Average Bz values.
References
1. Akasofu, S.-I. (1981), Energy coupling between the solar wind and the magnetosphere,
Space Sci. Rev., 28, 121 – 190.

International Journal of Research in Modern Engineering and Emerging Technology (IJRMEET) UGC Approved id_47203
Vol. 5, Sp. Issue: 9, Sept.: 2017 (IJRMEET) ISSN: 2320-6586
49 Online International, Refereed, Impact factor & Indexed Monthly Journal www.raijmr.com
RET Academy for International Journals of Multidisciplinary Research (RAIJMR)
2. Burton, R. K., R. L. McPherron, and C. T. Russell (1975), Empirical relationship between
interplanetary conditions and Dst, J. Geophys. Res., 80, 4204 – 4214.
3. Gonzalez, W. D., J. A. Joselyn, Y. Kamide, H. W. Kroehl, G. Rostoker, B. T. Tsurutani,
and V. Vasyliunas (1994), What is a geomagnetic storm?, J. Geophys. Res., 99, 5771 –
5792.
4. Kamide, Y., et al. (1998), Current understanding of magnetic storms: Storm-substorm
relationships, J. Geophys. Res., 103, 17,705 – 17,728.
5. Tsurutani, B. T., and W. D. Gonzalez (1997), The interplanetary causes of magnetic
storm, in Magnetic Storms, Geophys. Monogr. Ser., vol. 98, edited by B. T. Tsurutani et
al., p. 77, AGU, Washington, D. C.
6. Tsurutani, B. T., W. D. Gonzalez, G. S. Lakhina, and S. Alex (2003), The extreme
magnetic storm of 1 – 2 September, 1859, J. Geophys. Res., 108(A7), 1268,
doi:10.1029/2
002JA009504.

International Journal of Research in Modern Engineering and Emerging Technology (IJRMEET) UGC Approved id_47203
Vol. 5, Sp. Issue: 9, Sept.: 2017 (IJRMEET) ISSN: 2320-6586
50 Online International, Refereed, Impact factor & Indexed Monthly Journal www.raijmr.com
RET Academy for International Journals of Multidisciplinary Research (RAIJMR)
Thermodynamic and Transport Properties of Aliphatic Alcohols
with Aqueous Ethylene Glycol
Chintu J Patel*, Sonam Brahmbhatt#, Vibha Sharma*
*Pacific Academic of Higher education and Research University, Udaipur
#Sarvajanik Science College, Mehsana
Abstract
In the current paper the Thermodynamic and Transport Properties of Aliphatic Alcohols with
Aqueous Ethylene Glycol were performed by authors. The variation of density (ρ) and viscosity
(n) data with mole fraction of methanol/ethanol/1-propanol in aqueous ethylene glycol solution is
calculated at 308.15 K and presented their experimental results. The experimental values of
density and viscosity have been used to calculate the deviation/excess properties like, excess
molar volume, deviation in viscosity, excess enthalpy and excess Gibb’s free energy of
activation of viscous flow.
Key Word
Thermodynamic, Transport Properties, Enthalpy, Gibb’s free energy of activation
Introduction
Thermodynamic properties of sodium liquid and vapor that have been assessed include:
enthalpy, heat capacity at constant pressure, heat capacity at constant volume, vapor pressure,
boiling point, enthalpy of vaporization, density, thermal expansion, adiabatic and isothermal
compressibility, speed of sound, critical parameters, and surface tension. Transport properties of
liquid sodium that have been assessed include: viscosity and thermal conductivity[1]. Transport
and thermodynamic properties of a sintered pellet of the newly discovered MgB2 superconductor
have been measured to determine the characteristic critical magnetic fields and critical current
densities[2]. The ability to obtain reliable thermodynamic and transport properties from a
simulation depends both on the quality of the force field and on the use of a proper simulation
method. Properties such as densities and heat capacities may be obtained readily using standard
techniques. With more effort and advanced simulation methods, solid–liquid and vapor–liquid
phase equilibria may also be determined. Transport properties can also be computed, but the

International Journal of Research in Modern Engineering and Emerging Technology (IJRMEET) UGC Approved id_47203
Vol. 5, Sp. Issue: 9, Sept.: 2017 (IJRMEET) ISSN: 2320-6586
51 Online International, Refereed, Impact factor & Indexed Monthly Journal www.raijmr.com
RET Academy for International Journals of Multidisciplinary Research (RAIJMR)
notoriously slow dynamics of many ionic liquid systems means that great care must be taken to
ensure that the simulations are accurate[3-5]. Fourteen estimation methods for mixture thermal
and transport properties have been compared with each other and with over 1400 experimental
data points to facilitate the choice of methods best suited to this application. A statistical analysis
of the data (including expected accuracy) is presented and recommendations are made for
practical use[6-8].
Experiment
The chemicals used in the present study are ethylene glycol (mass fraction purity 0.99), methanol
(mass fraction purity 0.99), ethanol (mass fraction purity 0.99) (Changshu Yangyuan Chemicals-
China make) and 1-propanol (mass fraction purity 0.99) (G.R Grade, obtained from LOBA
Chemicals, Mumbai, INDIA). These were further purified by standard methods. The solutions of
aqueous ethylene glycol of 0.3 m and 0.9 m are prepared using triply distilled deionised water.
These solutions, in turn, are used to prepare liquid mixtures with methanol, ethanol and 1-
propanol so that its entire range of composition is covered. All the mixtures have been prepared
in the specially designed glass bottles with air tight stoppers and adequate precautions have been
taken to minimize evaporations losses. The weighing of solutions has been made using a
METTER TOLEDO (Switzerland make) ABB5-S/FACT digital balance with an accuracy of
0.01mg. The ultrasonic velocities, densities and viscosities are measured at 308.15 K for the pure
liquids used in this investigation and are compiled in Table 6.A.1 together with the literature data
available.
Result and Discussion
The variation of ultrasonic velocity (𝑢) at two different molalities of aqueous ethylene glycol
with mole fraction of methanol/ethanol/1-propanol is shown in Figures 6.A.1.a, 6.A.1.b and
6.A.1.c respectively. The ultrasonic velocity increases in the 0 < 𝑥 < 0.15 mole fraction of
alkanol and it is found to decrease beyond 0.15 mole fraction of alkanol. The ultrasonic velocity
shows a maximum value at about 0.15 m mole fraction of methanol/ethanol/1-propanol for 0.3 m
and 0.9 m aqueous solutions of ethylene glycol. Water and ethylene glycol are both associated
liquids, through the formation of hydrogen bonding. When ethylene glycol is added to water,
association between ethylene glycol and water molecules takes place through hydrogen bonding

International Journal of Research in Modern Engineering and Emerging Technology (IJRMEET) UGC Approved id_47203
Vol. 5, Sp. Issue: 9, Sept.: 2017 (IJRMEET) ISSN: 2320-6586
52 Online International, Refereed, Impact factor & Indexed Monthly Journal www.raijmr.com
RET Academy for International Journals of Multidisciplinary Research (RAIJMR)
which is shown in schema I. This leads to the increase of open structures in the solution as diol
acts as a structure maker.
Table 1 Calculated properties of excess molar volume,, deviation in viscosities,, excess
enthalpy, and excess Gibb’s free energy of activation of viscous flow, with mole fraction of
methanol in aqueous ethylene glycol solution at T = 308.15 K
mole fraction of
methanol 𝑽𝒎𝑬
𝟏𝟎−𝟓𝒎𝟑.𝒎𝒐𝒍−𝟏
∆𝒏
𝟏𝟎−𝟑𝑵.𝑺.𝑴−𝟐
𝑯𝑬
𝑱.𝒎𝒐𝒍−𝟏
∆𝑮∗𝑬
𝒌𝑱.𝒎𝒐𝒍−𝟏
0.3 m aqueous ethylene glycol
0.0000 0.0000 0.0000 0.0000 0.0000
0.0987 -0.0241 0.1484 2885.92 0.4855
0.1968 -0.0639 0.2506 4633.85 0.7867
0.3009 -0.0969 0.4342 8440.01 1.2755
0.3915 -0.1156 0.4394 8296.03 1.3218
0.4944 -0.1396 0.4384 8560.21 1.3548
0.5947 -0.1649 0.4445 9288.12 1.4015
0.7001 -0.1684 0.4379 10197.74 1.4311
0.7963 -0.1603 0.4302 11019.46 1.4586
0.8932 -0.0864 0.1198 3126.52 0.5158
1.0000 0.0000 0.0000 0.0000 0.0000
0.9 m aqueous ethylene glycol
0.0000 0.0000 0.0000 0.0000 0.0000
0.0986 -0.0321 0.1747 3414.56 0.5270
0.1937 -0.0666 0.2865 5309.62 0.8407
0.2965 -0.1086 0.4464 8434.89 1.2471
0.3956 -0.1430 0.4631 8510.54 1.3223
0.4939 -0.1630 0.4935 9528.62 1.4370
0.5969 -0.1721 0.5128 10791.65 1.5364
0.6972 -0.1759 0.5285 12139.76 1.6292
0.7957 -0.1666 0.5080 12876.90 1.6422
0.8934 -0.0777 0.1207 3320.64 0.5305
1.0000 0.0000 0.0000 0.0000 0.0000

International Journal of Research in Modern Engineering and Emerging Technology (IJRMEET) UGC Approved id_47203
Vol. 5, Sp. Issue: 9, Sept.: 2017 (IJRMEET) ISSN: 2320-6586
53 Online International, Refereed, Impact factor & Indexed Monthly Journal www.raijmr.com
RET Academy for International Journals of Multidisciplinary Research (RAIJMR)
Table 2 Calculated properties of excess molar volume, deviation in viscosities, excess
enthalpy, and excess Gibb’s free energy of activation of viscous flow, with mole fraction of
ethanol in aqueous ethylene glycol solution at T = 308.15 K
mole fraction of
ethanol 𝑽𝒎𝑬
𝟏𝟎−𝟓𝒎𝟑.𝒎𝒐𝒍−𝟏
∆𝒏/𝟏𝟎−𝟑𝑵. 𝒔.𝒎−𝟐 𝑯𝑬/𝑱.𝒎𝒐𝒍−𝟏 ∆𝑮∗𝑬
𝒌𝑱.𝒎𝒐𝒍−𝟏
0.3 m aqueous ethylene glycol 0.0000 0.0000 0.0000 0.0000 0.0000
0.0579 -0.0226 0.1467 2724.47 0.4563
0.1485 -0.0829 0.2974 4759.92 0.8231 0.2275 -0.1161 0.5235 8791.25 1.2962 0.3038 -0.1620 0.5649 9483.17 1.3455 0.4045 -0.1911 0.5919 10126.44 1.3702 0.5094 -0.1965 0.6243 11056.27 1.4110 0.6114 -0.2076 0.6824 12815.26 1.4864 0.7413 -0.2064 0.6320 12353.69 1.3697 0.8611 -0.1162 0.1681 3216.98 0.4277 1.0000 0.0000 0.0000 0.0000 0.0000
0.9 m aqueous ethylene glycol 0.0000 0.0000 0.0000 0.0000 0.0000
0.0703 -0.0405 0.1836 3127.29 0.5113 0.1447 -0.0807 0.2990 4646.11 0.7765 0.2265 -0.1238 0.5155 8331.90 1.2097 0.3562 -0.2194 0.5827 8992.89 1.2825 0.4675 -0.2580 0.6323 10286.36 1.3466 0.5585 -0.2922 0.7174 12503.67 1.4657 0.6578 -0.2687 0.7099 12891.17 1.4554 0.7845 -0.2429 0.5963 11604.95 1.2576 0.8593 -0.1294 0.1702 3362.19 0.4201 1.0000 0.0000 0.0000 0.0000 0.0000
Table 3 Calculated properties of excess molar volume, deviation in viscosities, excess
enthalpy and excess Gibb’s free energy of activation of viscous flow, with mole fraction of
1-propanol in aqueous ethylene glycol solution at T = 308.15 K
mole fraction of
1-propanol 𝑽𝒎𝑬
𝟏𝟎−𝟓𝒎𝟑.𝒎𝒐𝒍−𝟏
∆𝒏
𝟏𝟎−𝟑𝑵. 𝒔.𝒎−𝟐
𝑯𝑬/𝑱.𝒎𝒐𝒍−𝟏 ∆𝑮∗𝑬
𝒌𝑱.𝒎𝒐𝒍−𝟏
0.3 m aqueous ethylene glycol
0.0000 0.0000 0.0000 0.0000 0.0000
0.0548 -0.0266 0.1528 2791.39 0.5071
0.1167 -0.0652 0.2890 5198.57 0.8600
0.1886 -0.0852 0.4295 8396.16 1.1614

International Journal of Research in Modern Engineering and Emerging Technology (IJRMEET) UGC Approved id_47203
Vol. 5, Sp. Issue: 9, Sept.: 2017 (IJRMEET) ISSN: 2320-6586
54 Online International, Refereed, Impact factor & Indexed Monthly Journal www.raijmr.com
RET Academy for International Journals of Multidisciplinary Research (RAIJMR)
0.2606 -0.1005 0.5445 10624.29 1.3600
0.3448 -0.1149 0.6830 13313.32 1.5517
0.4456 -0.1075 0.6495 12905.27 1.4507
0.5471 -0.0921 0.5314 11258.27 1.2118
0.6934 -0.0697 0.3833 8646.65 0.8806
0.8179 -0.0616 0.2269 4817.02 0.5271
1.0000 0.0000 0.0000 0.0000 0.0000
0.9 m aqueous ethylene glycol
0.0000 0.0000 0.0000 0.0000 0.0000
0.0561 -0.0344 0.1931 3498.10 0.5666
0.1159 -0.0661 0.3613 6524.07 0.9546
0.1842 -0.0934 0.5648 10568.19 1.3318
0.2956 -0.1384 0.6722 12391.38 1.4664
0.3565 -0.1353 0.7013 12701.41 1.4918
0.4427 -0.1269 0.6490 12354.28 1.3803
0.5687 -0.1009 0.5185 10552.19 1.1264
0.7086 -0.0797 0.4086 8447.68 0.8738
0.8276 -0.0566 0.3144 6543.48 0.6458
1.0000 0.0000 0.0000 0.0000 0.0000
Table 4 Coefficients 𝑨𝒊 of Redlich-Kister type polynomial equation and the corresponding
standard deviations (𝝈) of all the systems at T = 308.15 K
𝑨𝟎 𝑨𝟏 𝑨𝟐 𝑨𝟑 𝑨𝟒 𝝈
methanol with 0.3 m aqueous ethylene glycol
𝑽𝒎𝑬
𝟏𝟎−𝟓𝒎𝟑.𝒎𝒐𝒍−𝟏
-0.5610 0.4486 -0.6893 -0.1101 0.9883 0.0042
∆𝒏/𝟏𝟎−𝟑𝑵. 𝒔.𝒎−𝟐 1.7428 -0.4118 2.9995 0.4028 -5.4932 0.0435
∆𝑮∗𝑬
𝒌𝑱.𝒎𝒐𝒍−𝟏
5.3574 -2.0166 9.6915 1.2598 -15.1140 0.1274
methanol with 0.9 m aqueous ethylene glycol
𝑽𝒎𝑬
𝟏𝟎−𝟓𝒎𝟑.𝒎𝒐𝒍−𝟏
-0.6435 0.4315 -0.4800 -0.1062 0.8575 0.0086
∆𝒏
/𝟏𝟎−𝟑𝑵. 𝒔.𝒎−𝟐
1.9222 -1.0235 3.8448 1.6406 -6.8399 0.0457
∆𝑮∗𝑬
𝒌𝑱.𝒎𝒐𝒍−𝟏
5.5943 -3.7065 11.8674 4.2720 -18.1980 0.1306

International Journal of Research in Modern Engineering and Emerging Technology (IJRMEET) UGC Approved id_47203
Vol. 5, Sp. Issue: 9, Sept.: 2017 (IJRMEET) ISSN: 2320-6586
55 Online International, Refereed, Impact factor & Indexed Monthly Journal www.raijmr.com
RET Academy for International Journals of Multidisciplinary Research (RAIJMR)
ethanol with 0.3 m aqueous ethylene glycol
𝑽𝒎𝑬
𝟏𝟎−𝟓𝒎𝟑.𝒎𝒐𝒍−𝟏
-0.7982 0.3354 -0.6555 -0.1272 1.2166 0.0080
∆𝒏
/𝟏𝟎−𝟑𝑵. 𝒔.𝒎−𝟐
2.5069 -1.4024 4.1477 4.3499 -9.3069 0.0355
∆𝑮∗𝑬
𝒌𝑱.𝒎𝒐𝒍−𝟏
5.6534 -2.2050 8.9452 9.1388 -17.1540 0.0770
ethanol with 0.9 m aqueous ethylene glycol
𝑽𝒎𝑬
𝟏𝟎−𝟓𝒎𝟑.𝒎𝒐𝒍−𝟏
-1.0891 0.6539 -0.0065 -0.5462 0.6521 0.0152
∆𝒏
/𝟏𝟎−𝟑𝑵. 𝒔.𝒎−𝟐
2.6165 -1.8110 4.3198 4.9521 -9.6441 0.0474
∆𝑮∗𝑬
𝒌𝑱.𝒎𝒐𝒍−𝟏
5.4698 -2.9427 9.7249 9.7113 -18.138 0.0981
1-propanol with 0.3 m aqueous ethylene glycol
𝑽𝒎𝑬
𝟏𝟎−𝟓𝒎𝟑.𝒎𝒐𝒍−𝟏
-0.4010 -0.3188 -0.1032 0.4935 -0.2832 0.0033
∆𝒏
/𝟏𝟎−𝟑𝑵. 𝒔.𝒎−𝟐
2.4412 1.8690 -1.1454 -2.0887 1.5341 0.0235
∆𝑮∗𝑬
𝒌𝑱.𝒎𝒐𝒍−𝟏
5.4532 4.0268 -0.6783 -1.8843 3.2200 0.0384
1-propanol with 0.9 m aqueous ethylene glycol
𝑽𝒎𝑬
𝟏𝟎−𝟓𝒎𝟑.𝒎𝒐𝒍−𝟏
-0.4709 -0.3980 -0.2195 0.4635 0.1582 0.0045
∆𝒏
/𝟏𝟎−𝟑𝑵. 𝒔.𝒎−𝟐
2.3689 1.9725 1.7280 -2.0017 -0.9256 0.0122
∆𝑮∗𝑬
𝒌𝑱.𝒎𝒐𝒍−𝟏
5.0758 3.8484 3.7201 -1.3646 -0.0143 0.0229
The variation of density (𝜌) and viscosity (𝑛) data with mole fraction of methanol/ethanol/1-
propanol in aqueous ethylene glycol solution is calculated respectively. The ñ decreases linearly
in all the systems studied where as ç increases considerably up to certain mole fraction beyond
International Journal of Research in Modern Engineering and Emerging Technology (IJRMEET) UGC Approved id_47203
Vol. 5, Sp. Issue: 9, Sept.: 2017 (IJRMEET) ISSN: 2320-6586
56 Online International, Refereed, Impact factor & Indexed Monthly Journal www.raijmr.com
RET Academy for International Journals of Multidisciplinary Research (RAIJMR)
that it decreases slowly with increase in the mole fraction in all the liquid solutions. This non
monotonic behaviour can be explained in terms of molecular interactions exists in the present
systems.
The experimental values of density and viscosity have been used to calculate the
deviation/excess properties like, excess molar volume (𝑉𝑚𝐸), deviation in viscosity (∆𝑛), excess
enthalpy (𝐻𝐸) and excess Gibb’s free energy of activation of viscous flow (∆𝐺∗𝐸 ). The data
obtained for these properties are presented in Tables 1, 2 and 3 for the solutions of
methanol/ethanol/1-propanol in the aqueous ethylene glycol solution respectively.
The deviation/excess values are fitted to Redlich-Kister type polynomial equation 3.16 and the
corresponding standard deviations, ó are computed using the equation 3.17. The Redlich-Kister
coefficients Ai and the standard deviations of all the solutions are presented in Table 4.
Reference
1. Fink, J. K., and L. Leibowitz. Thermodynamic and transport properties of sodium liquid
and vapor. No. ANL/RE--95/2. Argonne National Lab., IL (United States), 1995.
2. Lemmon, Eric W., Marcia L. Huber, and Mark O. McLinden. "NIST reference fluid
thermodynamic and transport properties–REFPROP." (2002).
3. Maginn, Edward J. "Atomistic simulation of the thermodynamic and transport properties
of ionic liquids." Accounts of chemical research 40.11 (2007): 1200-1207.
4. Mikityuk, Konstantin. "Heat transfer to liquid metal: review of data and correlations for
tube bundles." Nuclear Engineering and Design 239.4 (2009): 680-687.
5. Shpil'rain, E. E., et al. "Dynamic and kinematic viscosity of liquid alkali metals."
Handbook of thermodynamic and transport properties of alkali metals. 1985.
6. Todd, B., and J. B. Young. "Thermodynamic and transport properties of gases for use in
solid oxide fuel cell modelling." Journal of power Sources 110.1 (2002): 186-200.
7. Suwanwarangkul, R., et al. "Performance comparison of Fick’s, dusty-gas and Stefan–
Maxwell models to predict the concentration overpotential of a SOFC anode." Journal of
Power Sources 122.1 (2003): 9-18.
8. Nam, Jin Hyun, and Dong Hyup Jeon. "A comprehensive micro-scale model for transport
and reaction in intermediate temperature solid oxide fuel cells." Electrochimica Acta
51.17 (2006): 3446-3460.

International Journal of Research in Modern Engineering and Emerging Technology (IJRMEET) UGC Approved id_47203
Vol. 5, Sp. Issue: 9, Sept.: 2017 (IJRMEET) ISSN: 2320-6586
57 Online International, Refereed, Impact factor & Indexed Monthly Journal www.raijmr.com
RET Academy for International Journals of Multidisciplinary Research (RAIJMR)
Infrared spectra of ternary complexes using benzidine and
quinoline as donors
Ashok N. Patel1*
, G. K. Solanki
2,, Ajay T. Oza
2
1Sheth M.N. Science College, Hemchandracharya North Gujarat University, Patan-384 265,
Gujarat, India
2Department of Physics, Sardar Patel University, Vallabh Vidyanagar- 388 120, Gujarat,
India
*Correspondence: [email protected]
Abstract: The charge transfer complexes of ternary type are prepared using benzidine and
quinoline as donor molecules and studied with FTIR spectroscopy. Direct interband
transitions are found around 0.22 eV except TCNE complex. The lower absorption edge is
found to be of indirect type. TCNQ and chloranil complexes show half- power beta density
and DDQ and TCNE complexes show triangular distributions. Only iodine complex shows
Gaussian distribution. The low frequency background absorption is Gaussian distributed in
TCNQ, chloranil and iodine complexes. Only TCNE complex shows a square power beta
density. Iodine complex has highest conductivity with a range of free-carrier absorption.
Keywords: Infrared, ternary complexes, beta density, Gaussian distribution, nature of
transition
Introduction
The earlier studies on ternary organic CT complexes included doped (TMTSF)2 ClO4, alkyl-
ammonium donors with TCNQ-iodine, pyrene-TCNQ-ferrocene, substituted anthraquinone
complexes and others [1-6]. (TMPD)1.5 –KI-I2 and (TMPD)1.5 –HI-I2 can be also considered
as ternary systems [7]. There are two types of ternary systems. (1) one-donor and two-
acceptor based systems which include, K-(BEDT-TTF)2 Cu[(CN)2]NX where X=Cl, Br, I,
(C1-TET-TTF)(FeBr4)1-x Fecl4)x etc. [8-15] some of which were organic superconductors. (2)
Two-donors and one acceptor based systems including -(BEDT-TTF)2MHg(SCN)4 where
M=K,NH4, -(BEDT-TTF)2RbZn(SCN)4 and -(CH3)4AS[Pd(dmit)2] [16-23], some of
which were also superconducting. Ternary charge transfer complexes and radical-ion salts

International Journal of Research in Modern Engineering and Emerging Technology (IJRMEET) UGC Approved id_47203
Vol. 5, Sp. Issue: 9, Sept.: 2017 (IJRMEET) ISSN: 2320-6586
58 Online International, Refereed, Impact factor & Indexed Monthly Journal www.raijmr.com
RET Academy for International Journals of Multidisciplinary Research (RAIJMR)
possess unique physical properties which are absent in binary (bimolecular) complexes.
These properties include two-band transport, incommensurate to commensurate transition,
alloy properties, cooperative and competitive binding, more than two oscillator models or
three absorption envelopes, complex-salt character, superconduction and electron-exciton
interactions. In the present work, we report CT complexes of benzidine-quinoline-(TCNQ)2 ,
benzidine-quinoline-(TCNE)2, benzidine-quinoline-(chloranil)2, benzidine-quinoline-(DDQ)2
and benzidine-quinoline-(I2)2 all in 1:1:2 molecular weight proportions.
Experimental
The donor benzidine was grinded with acceptors like TCNQ(7,7,8,8-tetra-cyano-p-
quinodimethane), TCNE(N,N,N,N-tetracyano-p-ethylene), chloranil (2,3,5,6-tetrachloro-p-
benzoquinone), DDQ(2,3-dichloro-5,6-dicyano-p-benzoquinone) and iodine in 1:2 molecular
weight proportions. The liquid donor quinoline was added with the help of micropipette in a
few drops needed in molecular weight proportions to form 1: 1:2 ternary complexes. The
infrared spectra were recorded using a standard Perkin-Elmer spectra-photometer on the KBr-
based semi-transparent pellets of all the five ternary complexes.
Results and discussion
The first is the infrared spectrum of benzidine-quinoline-(TCNQ)2 which is shown here
(Figure 1a). This spectrum can be divided in to three parts according to background
absorption governed by electronic absorption. The first range is the 1700-3600 cm-1
where a
very broad half-power beta density distribution is observed given by
=0E*1/2
(1-E*)
1/2 (1)
where E* = (E-a)/b is the reduced, dimensionless energy variable.
But difference in the spectrum between this and that of benzidine-pyridine-(TCNQ)2 reported
recently is in the splitting of the above distribution at 2317 cm-1
by a dispersion shape of
1() the real part of dielectric constant. Because of this splitting the distribution becomes
asymmetric below 2317 cm-1
. The second range 1700-2170 cm-1
correspond more to a
transition across the usual band gap around 1700 cm-1
, rather than being a part of beta
density. This splitting and asymmetry arise from stronger interaction between quinoline and
TCNQ than pyridine-TCNQ interaction. The third part is below 1700 cm-1
down to 500 cm-1
.
This range consists of a very broad symmetric Gaussian band around 1100 cm-1
. There are no

International Journal of Research in Modern Engineering and Emerging Technology (IJRMEET) UGC Approved id_47203
Vol. 5, Sp. Issue: 9, Sept.: 2017 (IJRMEET) ISSN: 2320-6586
59 Online International, Refereed, Impact factor & Indexed Monthly Journal www.raijmr.com
RET Academy for International Journals of Multidisciplinary Research (RAIJMR)
two envelopes below 1700 cm-1
. This also is a consequence of strong interaction between
quinoline and TCNQ.
The second spectrum is that of benzidine-quinoline-(DDQ)2 (Figure 1b). Here too, the
spectrums can be divided in three main parts. The first range is above 1800 cm-1
where a very
large triangular distribution centered around 3082 cm-1
is observed. This is a consequence of
screening of interaction between benzidine and DDQ by quinoline. In this range, spectrum
significantly differs from that of TCNQ complex. This arises from asymmetric nature of
DDQ molecule leading to more electronic molecular polarizability. It can not be attributed to
the halogen end- group interacting with donor because iodine complex shows different
features in this range.
The triangular distribution can be attributed to the nesting of Fermi surface, i.e. scattering of
q=2kF electrons by phonons, which remains imperfect as revealed by an symmetric
distribution. Then comes the second range which contains an interband electronic transition.
The third range is below 1800 cm-1
down to 400 cm-1
. The background absorption is a
monotonic function rather than a Gaussian distribution, the later found in the TCNQ
complex. The absorption decreases as the frequency (or energy) decreases. The absorption is
minimum at or below 0.05eV (400 cm-1
). Thus in the both ranges spectrum differs for DDQ
complex from that of the TCNQ complex. Benzidine-DDQ interaction is stronger than
benzidine-TCNQ interaction. Benzidine is enable to screen strongly in the DDQ complex.
There is a steep rise in transmission above 1560 cm-1
towards the high frequency side. The
absorption is minimum near 1750 cm-1
and there is a long band-tailing towards low frequency
side. This may be related with imperfect nesting leading to this feature [24]. The real part of
optical conductivity 1 () and the imaginary part of dielectric constant 2 () are related. If
we look at the high-frequency behaviour, it is a broad dispersion shape between 3600 cm-1
and 1750 cm-1
. The constant high frequency background above 3600 cm-1
is extrapolated and
considered to be zero level, the curve in 1750 – 3600 cm-1
is cut to give a dispersion shape
governed by 1 (). There is anomalous dispersion in this range. It is a fluctuation in
absorption around zero level and if we apply lever rule, there is no net absorption. The
integration (area under the band) is almost zero in this range.
The second range of absorption below 1400 cm-1
mainly consists of absorption across a very
small band gap (Eg<0.05 eV). These transitions coupled two bands through a Gaussian
distribution in the TCNQ salts. The transitions are hindered in TCNQ complex while the

International Journal of Research in Modern Engineering and Emerging Technology (IJRMEET) UGC Approved id_47203
Vol. 5, Sp. Issue: 9, Sept.: 2017 (IJRMEET) ISSN: 2320-6586
60 Online International, Refereed, Impact factor & Indexed Monthly Journal www.raijmr.com
RET Academy for International Journals of Multidisciplinary Research (RAIJMR)
transitions occur without being screened in the DDQ complex. In both of TCNQ and DDQ
complexes, the lowest-lying envelope around 750 cm-1
is not observed because it merges in
the mid-IR envelope.
The third spectrum is that of benzidine-quinoline-(chloranil)2 (Figure 2a). In this case, three
envelopes are observed because of lack of delocalization due to screening effect. Benzidine-
chloranil binary complex is weaker in interaction than benzidine-DDQ binary complex. As a
result, the interaction is screened by quinoline molecules. The highest-lying half power beta
density envelope is somewhat similar to the one found in the TCNQ complex but somewhat
asymmetric rather than symmetric with more absorption on high-frequency side. This is
between 1800 cm-1
and 3600 cm-1
. The mid-IR envelope between 1000 cm
-1 and 1800 cm
-1 is
also a flat beta density peak following a half-power law as given by equation 1. In this case,
sharp bands are neglected and either background is considered or inflexion points of the
spikes are joined. The lowest lying Gaussian-shaped envelope around 750 cm-1
is clearly
seen. Thus the spectrum is similar to that of benzidine-pyridine-(chloranil)2.
The next is the IR spectrum of benzidine-quinoline-(TCNE)2 (Figure 2b). The interaction is
stronger than in the chloranil complex. The high-frequency envelop above 1800 cm-1
is a
triangular envelope associated with imperfect nesting as observed in the DDQ complex. This
similarity reveals that this special spectral feature arises out of molecular polarizability of
TCNE. TCNE does not contain aromatic ring as in TCNQ but contains C=C bridge. The four
cyano-groups are more flexible and rotatable in three-dimensions leading to orientational
polarizability. These rotations are hindered by the charge cloud of aromatic ring in TCNQ.
The mid-IR envelope between 950cm-1
and 1800 cm-1
is highly asymmetric with low-
frequency tailing as compared to the envelope of chloranil complex. The lowest-lying
envelope between 400 cm-1
and 900 cm-1
shows with square power beta density asymmetric
distribution compared to that in the case of chloranil complex.
Thus there are two triangular distributions around 3000 cm- and 1400 cm
-1. The one at higher
frequency is due to nesting of Fermi surface and the other at lower frequency is due to
triangular interband gap connected with slant band edges in internal electric field. The later
is related with tunneling of charge carriers.
The last spectrum of benzidine-quinoline-(iodine)2 is also shown (Figure 2c). This spectrum
is similar to its pyridine analog above 1700 cm-1
. The range below 1700 cm-1
consists of a
large number of absorption bands but leaving a scope for the background absorption which

International Journal of Research in Modern Engineering and Emerging Technology (IJRMEET) UGC Approved id_47203
Vol. 5, Sp. Issue: 9, Sept.: 2017 (IJRMEET) ISSN: 2320-6586
61 Online International, Refereed, Impact factor & Indexed Monthly Journal www.raijmr.com
RET Academy for International Journals of Multidisciplinary Research (RAIJMR)
increases as the frequency decreases. This may correspond to a negative band gap as in semi-
metals or free-carrier absorption above a very small band gap lying in far-infrared range.
Also there is a possibility of a transition to an impurity level [25].
There is almost a semicircular distribution related with either isotropically disordered and
positively charged quinoline molecules or disordered molecular iodine in this ternary
complex. There is a small range of free carrier absorption between 1400 cm-1
and 1600 cm-1
.
This is realized by increase in absorption with an increase in wavelength of EM waves.
The beta density distribution is the fitted for the TCNQ complex having the highest-
frequency envelope of this type. The plot of F/(1-k*)1/2
vs k*1/2
where F=-0 and K*=(K-
a)/b is a straight line indicating half-power beta density based on Bernoulli trials (Figure 3a).
The broad lower frequency envelope is fitted a Gaussian distribution (Figure 3b) described by
2
0
0
2
exp2
K KA A
M
(2)
where A0 is the maximum absorption, K0 is the central wave-number and M2 is the second
moment of the distribution. This last parameter is related with the full-width at half-
maximum W according to
2
28ln 2
WM (3)
W is in turn related with electron-phonon coupling constant. Strong electron-intermolecular
vibration coupling in TCNQ complex leads to very broad Gaussian band spanning more than
half-IR-range and leads to a merging of central envelope and lowest-lying envelope
associated with rocking and wagging vibrations. The part of the profile lying above the 2170
cm-1
split, is fitted for a nature of transition. This transition is found to be allowed direct type
(Figure 3 c), not involving any phonon.
Next is the analysis of spectrum of benzidine-quinoline-(DDQ)2. The analysis indicates that
the higher transition across the gap of about 0.2 eV is forbidden direct and the lower
transition across the gap of nearly 0.05 eV is indirect and forbidden type. The lower band gap
can be assigned to the quinoline- DDQ interaction because it is not found in the spectrum of
binary benzidine-DDQ system. This analysis is shown (Figure 4a and 4b)
These graphs reveal direct exciton band around 0.25 eV and involvement of phonon of
energy 0.01 eV, in the cases of a forbidden direct transition and forbidden indirect transition,

International Journal of Research in Modern Engineering and Emerging Technology (IJRMEET) UGC Approved id_47203
Vol. 5, Sp. Issue: 9, Sept.: 2017 (IJRMEET) ISSN: 2320-6586
62 Online International, Refereed, Impact factor & Indexed Monthly Journal www.raijmr.com
RET Academy for International Journals of Multidisciplinary Research (RAIJMR)
respectively. In the later case the break between phonon absorption and phonon emission is
found at 0.15 eV.
Similar analysis of the nature of transition for the chloranil complex is also carried out
(Figure 5a) having indirect exciton. An allowed direct transition is evident. The high-
frequency and mid-IR envelopes are both beta distribution with half-power beta densities
(Figure 5b and 5c). The lowest-frequency envelope is analyzed to be Gaussian curve (Figure
5d).
Thus there is an allowed direct transition with a break due to indirect exciton at 0.245 eV and
exciton threshold at 0.225 eV. The Gaussian envelope has maximum absorption , central
wavenumber and full-width at half maximum (FWHM) as noted in Table 2.
More strongly interacting TCNE-based ternary complex shows two band gaps of 0.2 eV and
0.1 eV with corresponding forbidden indirect and allowed indirect transitions, respectively
(Figure 6a and b). Thus TCNE complexes are small band gap semiconductor-phonon
The higher edge at 0.21 eV shows a break in (αh)1/3
Vs h (eV) transition involving a
phonon of energy of 0.02 eV. The TCNE complex also shows a square power beta density
in the IR spectrum around 700 cm-1
. The analysis of the last spectrum of benzidine-quinoline-
(iodine)2 complex reveals an allowed direct transition (Figure 7a) and two Gaussian
envelopes (Figure 7b and 7c).
The plot of allowed direct transition shows a direct exciton of energy of 0.24 eV. There are
two Gaussians whose parameters are tabulated in table 2. The analysis of free-carrier
absorption is made by plotting logα Vs log giving a slope of 2-5 which corresponding to
scattering of charge carriers by phonons.
Details of upper and lower absorption edges and both absorption envelopes are summarized
(Table 1)
Conclusion
The three out of five ternary complexes based on TCNQ, DDQ and iodine show unusual
spectral features which are making use of benzidine-quinoline combination. The TCNQ
complex shows merging of two lower envelopes with unusually broad Gaussian band DDQ
complex shows two triangular distributions related with imperfect nesting and the second due
to one Franz-Keldy effect. TCNE and chloranil show three envelopes related with three band

International Journal of Research in Modern Engineering and Emerging Technology (IJRMEET) UGC Approved id_47203
Vol. 5, Sp. Issue: 9, Sept.: 2017 (IJRMEET) ISSN: 2320-6586
63 Online International, Refereed, Impact factor & Indexed Monthly Journal www.raijmr.com
RET Academy for International Journals of Multidisciplinary Research (RAIJMR)
model. Iodine complex seems to be having highest conductivity because of negative band gap
or free-carrier absorption.
References:
[1] C. Coulon, S. Flandrois, P. Delhaes, C. Hauw, P. Dupis, Phys. Rev. B, 1981, 23,
2850.
[2] C. Coulon, P. Delhaes, J. Amiell, J. P. Monceau, L. M. Fabre, L. Giral, J. Physique
(France), 1982, 43, 1721.
[3] Andre Barraud, Pierre Lasieur, Annie Ruaudel-Teixier, Michel Van Devyer, Thin
Solid Filam, 1995, 134, 195.
[4] M. G. Abd El Wahed, S. Aaly, H. A. Hammad, S. M. Metwally, J. Phys. Chem.
Solids, 1974, 55, 31.
[5] K. Kudo, M. Nagqoka, S. Kuniyoshi, H. Tanaka, Synthetic Metals, 1995, 71, 2059.
[6] Jeong-Woo Choi, Gun-Yung Jung, Se Young Oh, Won Hong Lee, Dong Myung Shin,
Thin Solid Films, 1996, 284-285, 876.
[7] A.T. Oza, Solid State Commun., 1989, 71, 1005.
[8] J. Wosnitza, H. Elsinger, J. Hagel, S. Wanka, D. Schweizer, Synthetic Metals, 2001,
120, 705.
[9] J. J. McGuire, T. Room, A. Pronin, T. Timusk, J. A. Sch-Wieter, M. E. Kelly, M. A.
Kini, Phys. Rev. B, 2001, 64, 094503.
[10] S. Kamiya, Y. Shimojo, M. A. Tanatar, T. Ishiguro, H. Yamohi, G. Saito, Phys. Rev.
B, 2002, 65, 13410.
[11] K. D. Truong, S. Jandl, M. Poirier, Synthetic Metals, 2002, 130, 229.
[12] Akane Sato, Hiroki Ahutsu, Kazuya Saito, Michio Sorai, Synthetic Metals, 2001, 120,
1035.
[13] A. Paoneli, A. Girlando, A. Fortuneli, Phys. Rev. B, 2001, 64, 054509.
[14] M. A. Tanatar, S. Kagoshima, T. Ishiguro, H. Ito, V. S. Yefanov, V. A. Bonderenko,
N. D. Kushah, E. B. Yagubskii, Phys. Rev. B, 2000, 62, 15561.
[15] M. Enomoto, A. Miyazaki, T. Enoki, Synthetic Metals, 2001, 121, 1800.
[16] D. Andres, M.V. Kartsovnite, W. Biberacher, H. Weiss, E. Balthes, H.
Muler, N. Kulshch, Phys. Rev. B, 2001, 64, 161104.

International Journal of Research in Modern Engineering and Emerging Technology (IJRMEET) UGC Approved id_47203
Vol. 5, Sp. Issue: 9, Sept.: 2017 (IJRMEET) ISSN: 2320-6586
64 Online International, Refereed, Impact factor & Indexed Monthly Journal www.raijmr.com
RET Academy for International Journals of Multidisciplinary Research (RAIJMR)
[17] N. Harrison, C.H. Mielke, A.D. Christianion, J.S. Brooks, M. Tokumoto, Phys. Rev.
Letters, 2001, 86, 1586.
[18] N. Harrison, L. Balicas, J.S. Brooks, M. Tokumoto, Phys. Rev. B, 2000, 62, 14212.
[19] M. Maesato, Y. Kaga, R. Kondo, S. Kagoshima, Phys. Rev. B., 2001, 64, 155104.
[20] M. Maesato, Y. Kaga, R. Kondo, H. Hirai, S. Kagoshima, Synthetic Metals, 2001,
120, 941.
[21] Y. Shimajo, T. Ishiguro, H. Yamochi, G. Saito, Synthetic Metals, 2001, 120, 751.
[22] N. L. Wang, H. Mori, S. Tanaka, J. Dong, B.P. Claymany, J. Phys. Condens. Matter,
2001, 13, 5463.
[23] Reizo Kato, Naoya Tajima, Masafumi Tamura, Jun-Ichi Yamaura, Phys. Rev. B,
2002, 66, 020508.
[24] Balazs Dora, Kazumi Maki, Attila Virosztek, Phys. Rev. B, 2002, 266, 15116.
[25] J.I. Pankove; Optical processes in semiconductors, Eglewood Cliffs, Prentice – Hall
Inc., New Jercy, 1971.

International Journal of Research in Modern Engineering and Emerging Technology (IJRMEET) UGC Approved id_47203
Vol. 5, Sp. Issue: 9, Sept.: 2017 (IJRMEET) ISSN: 2320-6586
65 Online International, Refereed, Impact factor & Indexed Monthly Journal www.raijmr.com
RET Academy for International Journals of Multidisciplinary Research (RAIJMR)
Table 1. Infrared absorption edges for the ternary complexes based on benzidine
quinoline combination.
Name of the
complex
Upper edge Lower edge
Absorption
function
Type of
transition
Band
gap Eg
(eV)
Absorption
function
Type of
transition
Band
gap Eg
(eV)
Benzidine-
quinoline-
(TCNQ)2
h=A(h-Eg)1/2 Allowed
direct
0.22 __ __ __
Benzidine-
quinoline-
(DDQ)2
h=A(h-Eg)3/2
Direct exciton
0.25 eV
Ep = 0.01
Forbidden
direct
0.18 h=A(h-Eg)3
Phonon
Ep = 0.01 eV
Forbidden
indirect
0.006
Benzidine-
quinoline-
(chloranil)2
h=A(h-Eg)1/2
Indirect exciton
0.23eV
Allowed
direct
0.22 __ __ __
Benzidine-
quinoline-
(TCNE)2
h=A(h-Eg)3
Phonon 0.02 eV
Forbidden
indirect
0.21 h=A(h-Eg)2 Allowed
indirect
0.11
Benzidine-
quinoline-
(I2)2
h=A(h-Eg)1/2
Direct exciton
0.16 eV
Allowed
direct
0.21 __ __ __

International Journal of Research in Modern Engineering and Emerging Technology (IJRMEET) UGC Approved id_47203
Vol. 5, Sp. Issue: 9, Sept.: 2017 (IJRMEET) ISSN: 2320-6586
66 Online International, Refereed, Impact factor & Indexed Monthly Journal www.raijmr.com
RET Academy for International Journals of Multidisciplinary Research (RAIJMR)
Table 2. Types and parameters of electronic absorption envelopes in the spectra
of ternary complexes based on benzidine-quinoline combination.
Name of the
complex
First envelope
Ko K m
(cm-1
) (cm-1
) %
Second envelope
Ko K m
(cm-1
) (cm-1
) %
Benzidine-quinoline-
(TCNQ)2
2800 1300 30%
(Half power-Beta density)
And NT-1
1100 1050 35%
(Gaussian distribution)
NT-2
Benzidine-quinoline-
(DDQ)2
3200 1100 50%
(Triangular distribution)
NT-1 and 2
Benzidine-quinoline-
(chloranil)2
2800 1700 20%
(Half-power beta density)
1400 800 16%
(Half power beta density)
770 600 16%
(Gaussian distribution)
Benzidine-quinoline-
(TCNE)2
3200 1200 65%
(Triangular distribution)
1450 500 60
(TD)
SPBD
650 250 35
-Benzidine-quinoline-
(Iodine)2
2800 1700 25%
(Gaussian distributions)
Or CD
850 800 20%
(Gaussian distribution)

International Journal of Research in Modern Engineering and Emerging Technology (IJRMEET) UGC Approved id_47203
Vol. 5, Sp. Issue: 9, Sept.: 2017 (IJRMEET) ISSN: 2320-6586
67 Online International, Refereed, Impact factor & Indexed Monthly Journal www.raijmr.com
RET Academy for International Journals of Multidisciplinary Research (RAIJMR)
Figure 1. Infrared spectra of
(a) benzidine-quinoline-(TCNQ)2 and
(b) benzidine-quinoline-(DDQ)2.
a
b

International Journal of Research in Modern Engineering and Emerging Technology (IJRMEET) UGC Approved id_47203
Vol. 5, Sp. Issue: 9, Sept.: 2017 (IJRMEET) ISSN: 2320-6586
68 Online International, Refereed, Impact factor & Indexed Monthly Journal www.raijmr.com
RET Academy for International Journals of Multidisciplinary Research (RAIJMR)
Figure 2. Infrared spectra of
(a) benzidine-quinoline-(chloranil)2
(b) benzidine-quinoline-(TCNE)2 and
(c) benzidine-quinoline-(iodine)2.
a
b
c

International Journal of Research in Modern Engineering and Emerging Technology (IJRMEET) UGC Approved id_47203
Vol. 5, Sp. Issue: 9, Sept.: 2017 (IJRMEET) ISSN: 2320-6586
69 Online International, Refereed, Impact factor & Indexed Monthly Journal www.raijmr.com
RET Academy for International Journals of Multidisciplinary Research (RAIJMR)
(Fig 3a)
0
0.2
0.4
0.6
0.8
1
0 0.5 1 1.5K*
1/2
F/(
1-K
*)1/
2
Benzidine-Quinoline-(TCNQ)2
(Fig 3b)
2.8
3
3.2
3.4
3.6
3.8
4
0.0E+00 5.0E+05 1.0E+06 1.5E+06
(K-K0)2
LN
A
Benzidine-Quinoline-(TCNQ)2
(Fig 3c)
0
50
100
150
0 0.1 0.2 0.3heV
( h)2
Benzidine-Quinoline-(TCNQ)2
Figure 3. (a) Beta density fit
(b)Gaussian fit and
(c) Nature of transition above 0.2 eV gap
– all of the TCNQ complex.
b
c
a

International Journal of Research in Modern Engineering and Emerging Technology (IJRMEET) UGC Approved id_47203
Vol. 5, Sp. Issue: 9, Sept.: 2017 (IJRMEET) ISSN: 2320-6586
70 Online International, Refereed, Impact factor & Indexed Monthly Journal www.raijmr.com
RET Academy for International Journals of Multidisciplinary Research (RAIJMR)
(Fig 4a)
0
1
2
3
4
5
6
7
0 0.1 0.2 0.3 0.4heV
( h)2
/3
Benzidine-Quinoline-(DDQ)2
(Fig 4b)
1
1.2
1.4
1.6
1.8
2
0 0.05 0.1 0.15 0.2
heV
( h)1
/3
Benzidine-Quinoline-(DDQ)2
Figure 4. (a) Nature of transition above 0.2 eV gap and
(b) nature of transition above 0.05 eV gap.
a
b

International Journal of Research in Modern Engineering and Emerging Technology (IJRMEET) UGC Approved id_47203
Vol. 5, Sp. Issue: 9, Sept.: 2017 (IJRMEET) ISSN: 2320-6586
71 Online International, Refereed, Impact factor & Indexed Monthly Journal www.raijmr.com
RET Academy for International Journals of Multidisciplinary Research (RAIJMR)
(Fig 5a)
0
2
4
6
8
10
12
0 0.1 0.2 0.3heV
( h
)2Benzidine-Quinoline-(Chloranil)2
(Fig 5b)
0
1
2
3
4
5
0 0.2 0.4 0.6 0.8 1k*
1/2
F/(
1-k*
)1/2
Benzidine-Quinoline-(Chloranil)2
(Fig 5c)
0
5
10
15
0 0.2 0.4 0.6 0.8 1K*
1/2
F/(1
-K*)
1/2
Benzidine-Quinoline-(Chloranil)2
(Fig 5d)
1.852.052.252.452.652.853.05
0.0E+00 1.0E+06 2.0E+06 3.0E+06 4.0E+06
(K-K0)2
LN A
Benzidine-Quinoline-(Chloranil)2
Figure 5. (a) Nature of transition above 0.225 eV gap with
indirect exciton
(b) beta density peak
(c) second beta density peak and
(a) Gaussian band analysis.
a
b
c
d

International Journal of Research in Modern Engineering and Emerging Technology (IJRMEET) UGC Approved id_47203
Vol. 5, Sp. Issue: 9, Sept.: 2017 (IJRMEET) ISSN: 2320-6586
72 Online International, Refereed, Impact factor & Indexed Monthly Journal www.raijmr.com
RET Academy for International Journals of Multidisciplinary Research (RAIJMR)
(Fig 6a)
0
0.5
1
1.5
2
2.5
3
0 0.05 0.1 0.15 0.2heV
( h)1
/2Benzidine-Quinoline-(TCNE)2
(Fig 6b)
0.5
1
1.5
2
2.5
3
0 0.1 0.2 0.3 0.4 0.5heV
( h)1
/3
Benzidine-Quinoline-(TCNE)2
Figure 6. (a) nature of transition above 0.1 eV gap and
(b) nature of transition above 0.2 eV gap.
a
b

International Journal of Research in Modern Engineering and Emerging Technology (IJRMEET) UGC Approved id_47203
Vol. 5, Sp. Issue: 9, Sept.: 2017 (IJRMEET) ISSN: 2320-6586
73 Online International, Refereed, Impact factor & Indexed Monthly Journal www.raijmr.com
RET Academy for International Journals of Multidisciplinary Research (RAIJMR)
(Fig 7a)
05
1015
20253035
0 0.1 0.2 0.3h
( h)
2
Benzidine-Quinoline-(I2)2
(eV)
(Fig 7b)
2
2.2
2.4
2.6
2.8
3
0.0E+00 2.0E+05 4.0E+05 6.0E+05 8.0E+05
(K-K0)2
LN
A
Benzidine-Quinoline-(I2)2
(Fig 7c)
2
2.2
2.4
2.6
2.8
3
3.2
0.0E+00 5.0E+05 1.0E+06 1.5E+06 2.0E+06 2.5E+06 3.0E+06 3.5E+06 4.0E+06 4.5E+06
(K-K0)2
LN
A
Benzidine-Quinoline-(I2)2
Figure 7. (a) Nature of transition above 0.21 eV gap
(b) The first Gaussian peak and
(c) The second Gaussian peak.
a
b
c

International Journal of Research in Modern Engineering and Emerging Technology (IJRMEET) UGC Approved id_47203
Vol. 5, Sp. Issue: 9, Sept.: 2017 (IJRMEET) ISSN: 2320-6586
74 Online International, Refereed, Impact factor & Indexed Monthly Journal www.raijmr.com
RET Academy for International Journals of Multidisciplinary Research (RAIJMR)
Elastic Properties of Titanium-based Ti44Zr20V36 bulk metallic glass
P.G. Chaudhari1, S.G. Khambholja
2 and B.Y.Thakore
3
1Department of Physics, Sheth M. N. Science College, Patan-384265, Gujarat, India
2Department of Science & Humanities, B & B Institute of Technology, Vallabh Vidyanagar-388120,
Gujarat, India
3Department of Physics, Sardar Patel University, Vallabh Vidyanagar-388120, Gujarat, India
1email: [email protected]
2email: [email protected]
3email:[email protected]
Abstract: Using Hubbard-Beeby approach and our newly proposed model potential, phonon
modes and elastic properties of titanium-based Ti44Zr20V36 BMG are evaluated. Five different
forms of the local field correlation functions viz. Hartree (H), Taylor (T), Ichimaru and Utsumi
(IU), Farid et al (F) and Sarkar Sen et al (S) are used to investigate the influence of the
screening effects on vibrational dynamics of Ti44Zr20V36 bulk metallic glass. The results for bulk
modulus B, modulus of rigidity G, Poisson’s ratio , Young modulus Y propagation velocity of
elastic waves and dispersion curves are studied. The theoretical computations are found to be in
good agreement with the available experimental results.
Keywords: Phonon frequencies, elastic constant, model potential
PACS: 81.05 Kf; 63.50. Lm; 62.20.dq

International Journal of Research in Modern Engineering and Emerging Technology (IJRMEET) UGC Approved id_47203
Vol. 5, Sp. Issue: 9, Sept.: 2017 (IJRMEET) ISSN: 2320-6586
75 Online International, Refereed, Impact factor & Indexed Monthly Journal www.raijmr.com
RET Academy for International Journals of Multidisciplinary Research (RAIJMR)
Introduction
Recent progress in 2-phase alloys with a glassy matrix phase that exhibits large glass-forming
ability (GFA)[1,2] in ductile-phase–reinforced bulk metallic glass(BMG) composites has
demonstrated that with proper design and microstructure, control enhanced toughness and
tensile ductility can be achieved. Mechanical, magnetic, elastic properties, thermo plastic
behavior and bond properties of material are one of key issues for both scientific significance
and practical application in condensed matter physics [3, 6].
For the commercialization of these new alloys (in present case, Zr-based composites) reducing
the cost and density of composites is beneficial. Low density components with high toughness
and strength could be particularly useful in aerospace and aeronautics industry as replacements
for some crystalline titanium alloy hardware. Ti-based BMG composites are competitive with
conventional titanium alloys for some structural applications where high strength and toughness
are necessity. The elastic properties of metallic glass can be roughly predicted to guide the
selection of alloying elements for developing Ti-based bulk metallic glass (BMG) with larger
glass forming ability (GFA). In present paper, focus is given on the Ti44Zr20V36 bulk metallic
glass (BMG) and the computation is carried out for phonon dispersion curve, bulk modulus B,
modulus of rigidity G, Poisson’s ratio and Young modulus Y [6-9].
Our new model potential represented as the combination of linear and quadratic terms modulated
by repulsive exponential damping factor, which tends to cancel Coulomb potential, inside the
core. While outside the core, it has the Coulombian tail. It becomes zero at r = 0 and smoothness
of the bare-ion potential due to exponential term results in to faster convergence in r-space. In
addition this bare-ion potential is continuous at the core separation. Potential parameter is
estimated through nearest neighbor distance. This form has feature of a Columbic term outside
the core and varying cancellation due to a repulsive and an attractive contribution to the potential
within the core. It is assumed that the potential within the core should neither be zero nor
constant but it should very as a function of r. Thus the model potential has the novel feature of
representing varying cancellation of potential within the core over and above its continuity and
weak nature.
The newly bare-ion model potential used in the present investigations, in r-space, is of the form
[10].

International Journal of Research in Modern Engineering and Emerging Technology (IJRMEET) UGC Approved id_47203
Vol. 5, Sp. Issue: 9, Sept.: 2017 (IJRMEET) ISSN: 2320-6586
76 Online International, Refereed, Impact factor & Indexed Monthly Journal www.raijmr.com
RET Academy for International Journals of Multidisciplinary Research (RAIJMR)
W(r) = −Ze2e∗
rc
2r
rc−
r2
rc2 e
−r
rc ; r ≤ rc
= −Ze2
r ; r ≥ rc (1)
It may be noted that the above form of the potential contains only single parameter rc and is
calculated formula, is given in Ref.[5].
3/1
51.0
Z
rr s
c (2)
Here, Z, Ω, q, e, rs are the valency, atomic volume, wave vector, charge of electron and the
parameter of the potential respectively.
Five different forms of the local field correlation functions viz. Hartree (H) [11], Taylor (T)
[12], Ichimaru and Utsumi (IU) [13], Farid et al (F) [14] and Sarkar Sen et al (S) [15] are
employed for investigation of relative effect of local field correction function on phonon
dispersion curve (PDC) and elastic properties of Ti44Zr20V36 Bulk metallic glass.
Theory
For bulk metallic glass, effective interaction pair potential is written as following.
Veff (r) = Zeff
2 e2
r +
eff
Feff (q)
sin (qr )
qr q2dq (3)
Here Zeff and eff are the effective valance and atomic volume of present system respectively.
The theoretical calculation of the elastic properties of BMGs is based on the pair potential
between ions. 1st term is the direct columbic interaction between ions, which is repulsive and 2
nd
term represents the indirect columbic interaction between ions via electron cloud, which cause
the attractive interaction. Feff(q) determines the long range behavior of inter atomic forces is also
known as volume energy term.
The energy wave number characteristics appearing in the equation (3) is written as below [6,7].
eff2
effeff Heff b eff
H eff
( (q) 1)F (q) V (q)
16 ( (q) 1)(1 f (q))
(4)
Here, Vbeff
(q) is the effective bare ion potential in q space , ϵHeff (q) is the Hartree dielectric
response function. feff (q) is the local field correction function to incorporate the exchange and
correlation effects. The pair correlation function g(r), is computed theoretically from the
effective pair potential as,

International Journal of Research in Modern Engineering and Emerging Technology (IJRMEET) UGC Approved id_47203
Vol. 5, Sp. Issue: 9, Sept.: 2017 (IJRMEET) ISSN: 2320-6586
77 Online International, Refereed, Impact factor & Indexed Monthly Journal www.raijmr.com
RET Academy for International Journals of Multidisciplinary Research (RAIJMR)
g ( r ) = exp −Veff
kB T − 1 (5)
Here, kB is the Boltzmann’ constant and T is the absolute temperature.
According to Hubbard and Beeby approach [7], the longitudinal and transverse phonon
frequencies are given by following equations (6) and (7), respectively.
32
2E
2L
q
)qsin(6
q
)qcos(6
q
)qsin(31q
(6)
32
2E
2T
q
)qsin(6
)q(
)qcos(31q
(7)
E represents the maximum phonon frequency and is given as,
E = 4πneff
3 Meff g r r2Veff
′′ r dr ∞
0 (8)
Veff′′ r =
4Z2
r3 + eff
π2 F(q) 2sin (qr )
qr3 −2cos (qr )
r2 −qsin (qr )
r dq
∞
0 (9)
Here, ρ , Meff , eff and f(q) are the number density, atomic mass, atomic volume and energy
wave number characteristic, respectively. Sound velocities are calculated from long-wavelength
limit of phonon dispersion curve, where phonon frequencies are linear.
Various elastic properties are then determined by the longitudinal and transverse phonon
frequencies. The bulk modulus B, Poisson’s ratio , modulus of rigidity G , Young modulus Y
and Debye temperature θD are calculated using the expression below[8,9],
𝐵 = 𝜌 𝑣𝑙2 −
4
3𝑣𝑡
2 (10)
G = 𝜌𝑣𝑡2 (11)
= 1−2 𝑣𝑡
2/𝑣𝑙2
2−2 𝑣𝑡2/𝑣𝑙
2 (12)
Y = 2G ( + 1 ) (13)
𝜃𝐷 = ℎ
𝑘𝐵
9𝜌
4𝜋
1/3
1
𝑣𝑙3 +
2
𝑣𝑡3
−1/3
(14)
Where 𝜌 is the isotropic density of the solid, h is Planck’s constant and 𝑘𝐵 is the Boltzmann
constant.

International Journal of Research in Modern Engineering and Emerging Technology (IJRMEET) UGC Approved id_47203
Vol. 5, Sp. Issue: 9, Sept.: 2017 (IJRMEET) ISSN: 2320-6586
78 Online International, Refereed, Impact factor & Indexed Monthly Journal www.raijmr.com
RET Academy for International Journals of Multidisciplinary Research (RAIJMR)
Results and Discussions
Table 1. Input Parameter and constant
BMG Zeff Ωeff (au)3 rc
eff (au) Meff (amu)
Ti44Zr20V36 2.76 117.52 1.986 57.436
Table 1 shows the input parameters and constants required for the present study. The newly
proposed bare-ion model potential is used along with different local field correction functions for
the first time to generate pair potential for the Ti44Zr20V36 , a tough and low densities titanium-
based bulk metallic glass system.
Figure:1. Effective pair potential in Ti44Zr20V36 bulk metallic glass using model potential.
The study reveals the general trends of the pair potential in all cases, suggesting that position of
the first minima is greatly affected by the type of screening used. The steep pair potential is in
accordance with the hardness of glassy system.

International Journal of Research in Modern Engineering and Emerging Technology (IJRMEET) UGC Approved id_47203
Vol. 5, Sp. Issue: 9, Sept.: 2017 (IJRMEET) ISSN: 2320-6586
79 Online International, Refereed, Impact factor & Indexed Monthly Journal www.raijmr.com
RET Academy for International Journals of Multidisciplinary Research (RAIJMR)
Figure:2. Longitudinal phonon modes of Ti44Zr20V36 bulk metallic glass.
Figure:3. Transverses phonon modes of Ti44Zr20V36 bulk metallic glass.
The computed of the PDC generated using HB scheme along with five different screening
functions are shown in figures 2 and 3 for the Ti44Zr20V36 From figure 2 and 3, it is observed that
the inclusion of local field correction function raises the phonon frequencies in both longitudinal

International Journal of Research in Modern Engineering and Emerging Technology (IJRMEET) UGC Approved id_47203
Vol. 5, Sp. Issue: 9, Sept.: 2017 (IJRMEET) ISSN: 2320-6586
80 Online International, Refereed, Impact factor & Indexed Monthly Journal www.raijmr.com
RET Academy for International Journals of Multidisciplinary Research (RAIJMR)
as well as transverse branches. The first minimum in the longitudinal branch of Ti44Zr20V36
BMG falls at q ≈ 1.97 − 1.98 Å-1. The related magnitude of first peak of PDC increases but
position of first peak obtained through IU screening function is at higher q value T, F and SS
screening functions give moderate values of phonon frequency. Phonons of transverse branch are
undergoing large thermal modulation due to anharmonicity of lattice vibrations in this branch.
Table 2. Elastic properties of Ti44Zr20V36 BMG
Properties H [11] T[12] IU[13] F[14] S[15] Expt.[17]
ʋl(105cm/s) 4.02 4.15 4.11 4.05 4.20 -
ʋt(105cm/s) 2.32 2.39 2.38 2.34 2.43 -
BT (GPa) 107.30 114.30 112.20 108.70 117.20 113.4
G (GPa) 24.77 26.39 25.89 26.08 27.04 36.7
Ξ 0.25 0.25 0.25 0.25 0.25 0.35
Y (GPa) 61.93 65.96 64.73 62.70 67.61 98.8
θD (K) 241.33 249.07 246.73 242.83 252.16 -
Listed in table 2 are presently computed elastic properties for the Ti44Zr20V36 along with other
data [17]. Table 2 shows that the calculated value of bulk modulus using T and IU screening
functions are very close to one another and close to experiment values, whereas the calculated
bulk modulus using other screening functions show little more deviation from experimental
results. Calculated values of modulus of rigidity and Young’s modulus show higher deviation
from experimental results. This deviation can be justified as following. In the HB approach, the
Poisson’s ratio is calculated in terms of ratio of sound velocity. Since, this ratio of sound velocity
remains constant, the calculated Poisson’s ratio also remains constant i.e. 0.25 and hence the
calculated values of modulus of rigidity and Young modulus are underestimated as observed by
Khambholja et al [18-20]. For the complete analysis, q dependent sound velocities are to be
obtained.

International Journal of Research in Modern Engineering and Emerging Technology (IJRMEET) UGC Approved id_47203
Vol. 5, Sp. Issue: 9, Sept.: 2017 (IJRMEET) ISSN: 2320-6586
81 Online International, Refereed, Impact factor & Indexed Monthly Journal www.raijmr.com
RET Academy for International Journals of Multidisciplinary Research (RAIJMR)
Conclusion
In the present paper, phonon dispersion curves and elastic constants of bulk metallic glass
Ti44Zr20V36 are obtained using theoretical approach of Hubbard and Beeby. The calculated values
of bulk modulus are in good agreement with the experimental results and hence justify the use of
newly proposed model potential in conjunction with HB approach.
References:
1. Hofmann DC,et alDesigning metallic glass matrix composites with high toughness and
tensile ductility. Nature 451,2008;1085-1089.
2. DC Hofmann, A Suh J-Y,Wiest, W L Johnson New processing possibilities for highly
toughned metallic glass matrix composites with tensile ductility. Scripta Matter 59,
2008,684-687.
3. A L Geer 1995 Science 267, 1947.
4. W H Wang, C Dong and C H Shek Mater.Sci.Eng.R 2004, 44, 45.
5. Q K Jiang, G Q Zhang, L Yang , X D Wang , K Saksl, H Franz , R Wunderlich , H Fecht
and J Z Jiang Acta Mater. 55 , 2007, 4409.
6. W H Wang J.Appl.Phys.99, 2006, 093506.
7. J Hubbard and J L Beeby J.Phys. C 2, 1969,556.
8. BY Thakore, PN Gajjar and AR Jani Bull.Mat.Sci.23, 2000, 5.
9. BY Thakore, H Dabhi, M Joshi and AR Jani Phys. Scr.7, 2009.0250007.
10. P B Thakore, PN Gajjar and AR Jani Communication in Phys.14, 2004,15.
11. WA Harrison Phys. Stat.Sol.(6) 181, 1969, 1036.
12. R Taylor J. Phys.F 8, 1981,1699.
13. S Ichimaru and K Utsumi Phys. Rev. B 24, 1981, 3220.
14. B Farid, V Heine, G E Engel and I S Robertson Phys. Rev. 48,1993,11602.
15. A Sarkar, D S Sen and H D Roy Mod. Phys. Lett. 12, 1998, 639.
16. P H Suthar, PN Gajjar, BY Thkore and AR Jani J.Phys.: Conf.Ser. 423,2013,012030.
17. C Douglas. Hofmann PNAS 105, 2008, 20136.
18. S.G. Khambholja, A.L. Ladva and B.Y. Thakore AIP Conference Proceedings 1728,
2016, 020202

International Journal of Research in Modern Engineering and Emerging Technology (IJRMEET) UGC Approved id_47203
Vol. 5, Sp. Issue: 9, Sept.: 2017 (IJRMEET) ISSN: 2320-6586
82 Online International, Refereed, Impact factor & Indexed Monthly Journal www.raijmr.com
RET Academy for International Journals of Multidisciplinary Research (RAIJMR)
19. S.G. Khambholja, B.Y. Thakore, N.K. Bhatt, P.N. Gajjar and A.R. Jani, Crystalline &
Non Crystalline Materials, 384-9, 2014, 83
20. S.G. Khambholja, B.Y. Thakore and A.Jani, Adv Mat Research, 1141, 2016, 162

International Journal of Research in Modern Engineering and Emerging Technology (IJRMEET) UGC Approved id_47203
Vol. 5, Sp. Issue: 9, Sept.: 2017 (IJRMEET) ISSN: 2320-6586
83 Online International, Refereed, Impact factor & Indexed Monthly Journal www.raijmr.com
RET Academy for International Journals of Multidisciplinary Research (RAIJMR)
THEORETICAL STUDY OF ELECTRICALRESISTIVITY( )
OF SOME LIQUID ALKALI ELEMENTS
Mayank H. Jani1and A. M. Vora
2
1Department of Physics, Kalol Institute of Technology and Research Centre,
Kalol 382721, Gujarat, India 2Department of Physics, University School of Sciences,
Gujarat University, Ahmedabad 380009, Gujarat, India
Abstract A universal model potential of Fiolhaiset al.is used to investigate the electrical resistivity( )
of someliquid metallic elementswith Ziman’s theoretical model. Five different types of local
field correction functions are used to study the effect of the exchange and correlation on the
aforementionedproperties. The generalized mean spherical approximation (GMSA) method is
adopted for computing the structure factor of liquid metals. The presently computed results
are found in comparable one with other such available data wherever exists in the literature
either theoretical or experimental.
1. Introduction
In the present study, we have investigated the electrical resistivity () of some alkali elements
with the help of pseudopotential formalism. A universal model potential of Fiolhais[1, 2]
used to describe the electron-ion interaction in these systems is of the form:
xx AeexxR
ZrV 11
1 (1)
The Fourier transform of the model potential is given as,
22222222
22
1
22114
qR
A
qRqRqR
RZeqV
O
(2)
Where,
Rrx , R being a core decay length, and with 0 .
An analyticity condition at 0r determines A and in terms of .
14
22
3
and

International Journal of Research in Modern Engineering and Emerging Technology (IJRMEET) UGC Approved id_47203
Vol. 5, Sp. Issue: 9, Sept.: 2017 (IJRMEET) ISSN: 2320-6586
84 Online International, Refereed, Impact factor & Indexed Monthly Journal www.raijmr.com
RET Academy for International Journals of Multidisciplinary Research (RAIJMR)
2
2
1A
(3)
Other details of this potential are described intheir respective papers [1, 2].
During the last several years there has been an increasing interest in the properties of non-
crystalline conductors such as liquid metals and liquid metallic alloys. Such a liquid exhibits
metallic as well as fluid-like behaviour and hence can help to make a link between the theory
of the liquid states and the theory of the electronic states in metals. And hence the study of
electrical transport properties of liquid metals and their alloys remain one of the favourite
quantities either experimentally or theoretically [3-26].
The Ziman’s [6, 7] nearly free electron (NFE) theory has been fairly successful in describing
the quantitative behaviour of the electrical properties of simple liquid metals. This is because
in these metals the mean free path is about the one hundred times the interatomic distance and
the weak scattering picture should be valid. Even for the heavy polyvalent metals where the
mean free path is only about two interatomic distances, the NFE model can yield results,
which are reasonable in agreement with the experiments. In the present computation of
electrical resistivity ( ) of binary mixture, the most recent local field correction functions
due to Hartree (H) [28], Taylor (T) [29], Ichimaru-Utsumi (IU) [30], Faridet al. (F) [31] and
Sarkar et al. (S) [32] are employed to investigate the influence of exchange and correlation
effects.The generalized mean spherical approximation (GMSA) method [27] is adopted for
computing the structure factor of liquid alkali metals in the present computation.
2. Computational Methodology
The Faber’s [6] approach of investigating electrical resistivity of liquid metals assumes the
model of a gas of conduction electrons which interact with and are scattered by irregularly
placed metal ions. Assuming the free-electron distribution, an expression for the electrical
resistivity of liquid metal in terms of the average of the product of the structure factor and
pseudopotential matrix element is written as [3-26]
qkdqqqVqSkne
mF
F
24
3
0
32
632
2
. (2)

International Journal of Research in Modern Engineering and Emerging Technology (IJRMEET) UGC Approved id_47203
Vol. 5, Sp. Issue: 9, Sept.: 2017 (IJRMEET) ISSN: 2320-6586
85 Online International, Refereed, Impact factor & Indexed Monthly Journal www.raijmr.com
RET Academy for International Journals of Multidisciplinary Research (RAIJMR)
Where n the electron density is related to Fermi wave number and is the unit step function
that cuts of the q -integration at Fk2 corresponding to a perfectly sharp Fermi surface, S(q)
the structure factor and V(q) the screened ion pseudopotential form factor.Here, we have used
generalized mean spherical approximation (GMSA) formulations [27] to generate the
structure factor of the metallic elements.
3. Results and Discussion
The input parameters and constants used in the present computations are written in Table 1.
Metals Z
(a.u.)
T
(K)
r
Li 1 142.47 453 0.46 3.549 0.361
Na 1 254.25 378 0.46 3.075 0.528
K 1 480.24 343 0.46 2.807 0.745
Rb 1 588.98 313 0.43 2.748 0.824
Cs 1 743.53 323 0.43 2.692 0.92
The presently computed results of electrical resistivity ( ) of liquid alkali metals are
narrated in Table 2 with available experimental [4, 6, 18, 19, 22] or theoretical [4-6, 15-23]
data whenever exists in the literature.

International Journal of Research in Modern Engineering and Emerging Technology (IJRMEET) UGC Approved id_47203
Vol. 5, Sp. Issue: 9, Sept.: 2017 (IJRMEET) ISSN: 2320-6586
86 Online International, Refereed, Impact factor & Indexed Monthly Journal www.raijmr.com
RET Academy for International Journals of Multidisciplinary Research (RAIJMR)
Table 2 :Electrical Resistivity ( )(in -cm) of Liquid Alkali Metals.
Metals Present results Expt.
[4, 6, 18,
19, 22]
Others
[4-6, 15-23] H T IU F S
Li 6.58 11.10 12.03 12.17 9.18 24.7
4.58, 5.48, 7, 7.3, 13.76,
18.91, 20.95, 21.15, 23.2,
23.8, 24.7, 24.86, 25,
26.80
Na 8.52 15.63 17.14 17.38 12.58 9.6
5.3, 7.9, 8.44, 9.48, 9.82,
10.11, 10.25, 10.38,
13.58, 13.91, 15.8, 16.3,
18.50, 17.24, 37.7
K 11.15 22.82 25.31 25.75 17.58 13
11.1, 11.48, 11.61, 13.31,
13.60, 13.67, 14.06,
14.87, 15.38, 18.29, 18.5,
19.6, 20.27, 26.11,
Rb 14.75 31.14 34.67 35.29 23.71 22.5
10, 14.70, 18.62, 19.8,
20.8, 20.97, 22, 23.09,
23.38, 23.55, 23.62,
26.85, 26.67, 30.66, 36.74
Cs 16.24 35.96 40.17 40.98 26.81 36
10, 13.8, 14.9, 15.44,
19.81, 20.71, 22.73,
31.29, 31.47, 32.25,
34.67, 39.73, 45.86,
50.44, 54.9, 62.71
It is also noticed from Table 2 that, the present results of the electrical resistivity ( ) of the
liquid alkali metals are found in qualitative agreement with the experimental or theoretical
findings. Also, it is noted that, among the five employed local filed correction functions, the
local field correction function due to H (without exchange and correlation) gives the
minimum numerical value of the electrical resistivity, while the local field correction function
due to F gives the maximum value. In comparison with the presently computed results of the
electrical resistivity ( ) from static H-function, the percentile influences for Li, Na, K, Rb
and Cs liquid metals of T, IU, F and S-functions are of the order of 23.93%-93.44%, 38.77%-
104.72%, 42.11%-147.29%, 44.77%-152.24% and 14.69%-65.05%, respectively.
The effect of local field correction functions plays an important role in the computation of
electrical properties of the liquid metals. The local field correction functions due to IU, F and
S are able to generate consistent results regarding the electrical properties of the liquid metals
of the different groups of the periodic table as those obtained from more commonly employed

International Journal of Research in Modern Engineering and Emerging Technology (IJRMEET) UGC Approved id_47203
Vol. 5, Sp. Issue: 9, Sept.: 2017 (IJRMEET) ISSN: 2320-6586
87 Online International, Refereed, Impact factor & Indexed Monthly Journal www.raijmr.com
RET Academy for International Journals of Multidisciplinary Research (RAIJMR)
H- and T-local field correction functions. Thus, the use of these more promising local field
correction functions is established successfully.
4. Conclusions
Lastly we conclude that, the present computations not only confirmsthe applicability of
universal model potential of Fiolhaiset al. for study of the aforesaid properties but it also
establishes the use of more prominent dielectric functions.
References
[1] C. Fiolhais, J. P. Perdew, S.Q. Armster, J. M. MacLaren, and M. Brajczewska, Phy.
Rev. B51, 14001 (1995)
[2] C. Fiolhais, J. P. Perdew, S.Q. Armster, J. M. MacLaren, and M. Brajczewska, Phy.
Rev. B51, 20 (1995)
[3] P. L. Rossiter, The electrical resistivity of metal and alloys(Cambridge University
Press, London, 1987).
[4] Y. Waseda, The structure of non-crystalline materials liquid and amorphous
solids(McGraw-Hill, New York, 1980).
[5] M. Shimoji, Liquid metals(Academic Press, London, 1977).
[6] T. E. Faber, An Introduction to the theory of liquid metals (Cambridge University
Press, London, 1972).
[7] J.M.Ziman, Phil. Mag. 6, 1013 (1961).
[8] T. Khajil, Phys. Chem. Liq. 37, 773 (1999).
[9] O. Dreieach, R. Evans, H.J. Guntherodt, H.U. Kunz, J. Phys. F2, 709 (1972).
[10] R. Evans, D. A. Greenwood, P. Lloyd, Phys. Lett. A35, 57 (1971).
[11] A. M. Vora, M. H. Patel, B. Y. Thakore, P. N. Gajjar, A. R. Jani, Solid State Phys. 45,
427 (2002).
[12] Aditya M. Vora, Russian Phys. J. 49, 834 (2006).
[13] Aditya M. Vora, J. Optoelec. Adv. Mater. 1, 227 (2007).
[14] Aditya M. Vora, Phys. Chem. Liq. 46, 442(2008)
[15] J. K. Baria, Brazilian J. Phys. 34, 1185 (2004).
[16] J. K. Baria, Physica B337, 245 (2003).
[17] S. Korkmaz, S. D. Korkmaz, Comp. Mater. Sci. 37, 618 (2006).

International Journal of Research in Modern Engineering and Emerging Technology (IJRMEET) UGC Approved id_47203
Vol. 5, Sp. Issue: 9, Sept.: 2017 (IJRMEET) ISSN: 2320-6586
88 Online International, Refereed, Impact factor & Indexed Monthly Journal www.raijmr.com
RET Academy for International Journals of Multidisciplinary Research (RAIJMR)
[18] A. R. Jani, H. K. Patel, P. N. Gajjar, G. Sajeevkumar, Disordered materials (Structure
and Properties), Eds. S. K. Srivastava, INDIAS Publications (Wiley Eastern Limited,
New Delhi, 1993)
[19] T. M. K. Kahjil, M. Tomak, Phys. Stat. Sol (b) 134, 321(1986).
[20] F. Daver, T.M. A. Khajil, M. Tomak, Phys. Stat. Sol. (b)138, 373 (1986).
[21] W. Geertsma, D. Gonzalez, L. H. Gonzalez, Brazilian J.Phys. 33, 406 (2003).
[22] H. S. Schnyders, J. B. Van Zytveld, J. Phys :Conden. Matter 8, 10875 (1996).
[23] G. Bose, H. C. Gupta, B. B. Tripathi, J. Phys. Chem. Solids 35, 595 (1774).
[24] C. R. Leavens, A. H. Macdonald, R. Taylor, A. Ferraz, N. H. March, Phys. Chem.
Liq. 11, 115 (1981).
[25] J. S. Ononiwu, Phys. Stat. Sol. (b) 177, 413 (1993).
[26] J. Gorecki, J. Popielawski, J. Phys. F: Met. Phys. 13, 2107 (1983).
[27] E. Waisman, Mol. Phys. 25, 45 (1973).
[28] W. A. Harrison, Elementary Electronic Structure(World Scientific, Singapore, 1999).
[29] R. Taylor, J. Phys. F: Metal Phys. 8, 1699 (1978).
[30] S. Ichimaru, K. Utsumi, Phys. Rev. B24, 7385 (1981).
[31] B. Farid, V. Heine, G. E. Engel, I. J. Robertson, Phys. Rev. B48, 11602 (1993).
[32] A. Sarkar, D. S. Sen, S. Haldar, D. Roy, Mod. Phys. Lett. B12, 639 (1998).

International Journal of Research in Modern Engineering and Emerging Technology (IJRMEET) UGC Approved id_47203
Vol. 5, Sp. Issue: 9, Sept.: 2017 (IJRMEET) ISSN: 2320-6586
89 Online International, Refereed, Impact factor & Indexed Monthly Journal www.raijmr.com
RET Academy for International Journals of Multidisciplinary Research (RAIJMR)
Coupling of the Solar Photosphere and the Corona
*Jitesh M Rami **Chetan M Patel, ***C A Patel, #D K patel
*Gokul Science College, Sidhpur, **Anjana Science College, Palanpur
***Pramukh Swami Science College, Kadi #Municipal Arts & Urban Science College, Mehsana
Abstract
The atmosphere of the sun is characterized by a complex interplay of competing physical
processes, convection, radiation, conduction and magnetic field. Beside this dominating scale
there is a more or less smooth distribution of spatial scales, both towards smaller and larger
scales making the sun essentially a multi-scale object. Convection and overheating give the
photosphere its face but also act as drivers for the layers above namely the chromospheres and
the corona. The magnetic field configuration effectively couples the photosphere far instant in
the form of loops that are anchored in the convection zone and continue through the atmosphere
up into the chromospheres and corona. The magnetic field is also an important structuring agent
for the small, granulation size scale, although shock waves also play an important role-especially
in the inter network atmosphere where mostly weak field prevail. The magnitude of the flare
depends on the accumulation and storage of magnetic flux, while release of this magnetic field
energy depends on other plasma triggering mechanisms. These mechanisms may be gradient,
deviation and/or variation in sunspot rotation angle as shown earlier by Jain et al., (2011). Based
on recent result from observation and numerical simultaneous, I attempt to study that corona is
heated up by the induction of magnetic flux energy from the photosphere.
Key Word
Convection, Radiation, Conduction, magnetic field, Photosphere, Chromospheres, Corona, Flare,
Plasma triggering, Gradient, Sunspot Rotation Angle
Introduction
The Sun lies at the heart of the solar system, where it is by far the largest object. It holds 99.8
percent of the solar system's mass and is roughly 109 times the diameter of the Earth about one
million Earths could fit inside the sun. The sun has three different layers that define its internal
structure: core, radiative zone, and convective zone[1-2]. The core is the source of all the Sun's
energy. Fortunately for life on earth, the Sun's energy output is just about constant so we do not
see much change in its brightness or the heat it gives off. The Sun's core has a very high
temperature, more than 15 million degrees Kelvin, and the material in the core is very tightly
packed or dense[3-4]. It is a combination of these two properties that creates an environment just
right for nuclear reactions to occur. Once energy is produced in the core of the Sun, it needs a
way to travel from the solar center to the outer regions[5-7]. The physical transport of energy
from its production site to the surrounding regions can be done in a number of ways. However,

International Journal of Research in Modern Engineering and Emerging Technology (IJRMEET) UGC Approved id_47203
Vol. 5, Sp. Issue: 9, Sept.: 2017 (IJRMEET) ISSN: 2320-6586
90 Online International, Refereed, Impact factor & Indexed Monthly Journal www.raijmr.com
RET Academy for International Journals of Multidisciplinary Research (RAIJMR)
for a star like the Sun, the most efficient means of transferring energy near the core is by
radiation. Once out of the radiation zone the energy, originally produced in the core, requires a
new transport mechanism to continue its journey to the surface[8]. Above the convective zone of
the solar interior is the solar atmosphere. As said above, this is made up of three main layers, the
photosphere, the chromospheres and the corona and there exists a region sandwiched between
chromospheres and corona, named as transition region. The photosphere is the lowest of the
three layers of the atmosphere. It is the optical `surface' of the sun, but it isn't actually a solid
surface, it is a shallow shell of gas about 400km deep. The outermost layer of the Sun is called
the corona. It gets its name from the crown like appearance evident during a total solar eclipse.
The corona stretches far out into space and, in fact, particles from the corona reach the earth's
orbit[9-10]. The continuously changing dark regions on the surface of the sun is called SunSpots.
An area with a strong magnetic field is called Actve Region Solar flare and CME’s blast forth
from AR.Solar flares are huge explosion on the Sun. Solar flares are understood to be one of the
most hazardous events occurring in the atmosphere of the Sun. Typically 1032
ergs of energy is
released in 1000 s from a solar flare. It has been widely established that this gigantic energy
comes from the magnetic flux evolving at sub-photospheric level and being transferred to
corona. The random motion of magnetic flux tubes which transfer the energy from photosphere
to corona for storage, which later release in the form of flare emission, can be studied through
observing the magnetic field of the active region (AR)[11-12].
Instruments
In this paper, I probe photospheric magnetic-field observations by Heliospheric Magnetic
Imager(HMI; Scherrer et. al., 2012) onboard Solar Dynamic Observatory (SDO; Pesnell et. al.,
2012).
Instrument used for emission from photosphere
Measuring the magnetic field in the photosphere has a long tradition (Hale 1908). Photospheric
magnetic field, optical intensity, and sunspot evolutions are some of the major areas of
observations of this part of solar atmosphere. Magnetic non-potential fields are the source of
various physical processes occurring in the flux tubes, coronal holes, and energetic flare etc.
Therefore, measurement of magnetic field of the solar photospheric disk is of fundamental
importance. HMI observes the full solar disk at 6173 A˚ with a spatial resolution of 1 arc-second.
It consists of a refracting telescope, a polarization selector, an image stabilization system, a
narrow band tunable filter and two 4096×4096 pixels CCD cameras with mechanical shutters
and control electronics. Images are obtained in a sequence of tuning and polarizations at a 4-
second cadence for each camera. One camera is dedicated to a 45s Doppler and line-of-sight
magnetic field component while the other to 90s vector magnetograms. All of the images are
processed at the HMI/AIA Joint Science Operations Center and archived for science use from
where we have obtained the observations of LOS magnetogram employed for investigation in
this thesis. Table 1 shows the key parameters of HMI/SDO.

International Journal of Research in Modern Engineering and Emerging Technology (IJRMEET) UGC Approved id_47203
Vol. 5, Sp. Issue: 9, Sept.: 2017 (IJRMEET) ISSN: 2320-6586
91 Online International, Refereed, Impact factor & Indexed Monthly Journal www.raijmr.com
RET Academy for International Journals of Multidisciplinary Research (RAIJMR)
Table 1 Key Parameters of HMI/SDO
S. N. Property SDO/HMI
1 Central wavelength 6173.3 ± 0.1 A˚
2 Filter bandwidth 76 mA
3 Field of view 2000 arc sec
4 Angular resolution 1.5 arc sec
5 Spatial resolution 0.50 ± 0.01 arc sec
6 Cadence 45s
Instrument used for emission from corona
The mean temperature of the solar corona is about 2 MK, which however exceeds 10 MK during
solar flares. The quiet corona emits UV, EUV and soft X-ray waveband but during solar flare,
the emission is originated mainly in EUV, X-Ray and Radio waveband due to high-temperature
nature of the emission. The study of processes of energy release in solar flares has been made
employing X-ray observations from Solar X-ray Spectrometer (SOXS) and Reuven Ramaty High
Energy Solar Spectroscopic Imager (RHESSI) missions.The SOXS and RHESSI observations
have been used for the spatial,spectral and temporal evolution of X-ray sources. In this section, I
describethe instruments employed for observing emission from corona. We use the X-ray
observations provided by Geostationary Operational En-vironmental Satellites (GOES) for the
investigation of temporal evolution of flare. GOES has been developed for National Oceanic and
Atmospheric Administration (NOAA) by the National Aeronautics and Space
Administration(NASA). It measures solar radiation in the X-ray and EUV region and the in-situ
magnetic field and energetic particle environment at geosynchronous orbit, providing real-time
data to the NOAA Space Weather Prediction Center (SWPC). GOES satellites provide un-
interrupted observations of the Sun and therefore extensively used for temporal evolution studies
in solar flare X-ray emission. The Space Environment Monitor (SEM) subsystem onboard GOES
consists of four instruments: An energetic particles sensor (EPS), high energy proton and alpha
detector (HEPAD), X-ray sensor (XRS) and two redundant three-axis magnetometers. HEPAD
monitors the incident flux density of protons, alpha particles, and electrons over an extensive
range of energy levels.XRS monitors the X-ray emission from the solar atmosphere. Two
redundant three-axis magnetometers operate one at a time to monitor earths geomagnetic field
strength in the vicinity of the spacecraft. The SEM instruments are capable of ground command-
selectable, in-flight calibration for monitoringon-orbit performance and ensuring proper
operation.
Observation
In following Table - 2 ,we enlist the characteristics of the time duration selected for investigation
ofstatistically independent relationship between photospheric magnetic flux and coronal X-ray
flux. We also list the number of flares as a function of importanceclass for the selected duration.

International Journal of Research in Modern Engineering and Emerging Technology (IJRMEET) UGC Approved id_47203
Vol. 5, Sp. Issue: 9, Sept.: 2017 (IJRMEET) ISSN: 2320-6586
92 Online International, Refereed, Impact factor & Indexed Monthly Journal www.raijmr.com
RET Academy for International Journals of Multidisciplinary Research (RAIJMR)
Table – 2 List of the observation duration for the study of photospheric magnetic flux and
coronal X-ray flux
S. N. Duration AR Nos. No. of Flares(Class)
1 November 2011 NOAA 11339 C(32)-M(8)-X(1)
2 March 2012 NOAA 11429 C(38)-M(12)-X(3)
3 May 2012 NOAA 11476 C(78)-M(7)-X(0)
The photospheric full -disc magnetic field observations are regularly obtainedfrom HMI /SDO
instrument. HMI provides full -disk magnetograms at wavelength 6173A with spatial resolution
of 0.5 per pixel and temporal cadence of 45 s. However, for this analysis, we have selected only
that active region which was associated with the respective flare. The magnetic flux for each
polarity is then estimated using above relation in the units ofGauss/cm2 (Mx). For these
eventsthe Coronal X-ray flux is taken from the observations provided by full-diskX-ray sensors
on-board the Geostationary Operational Environmental Satellites (GOES) operated by NOAA
since 1974. GOES X-ray flux 2 s cadencedata is available from the URL
http://goes.ngdx.noaa.gov/data/avgwhichis also processed through SolarSoft package as describe
above in chapter 3. These observations are then averaged to 4 hours time period in order to
achieve the same time cadence asthat of photospheric magnetic field observations.Finally, this
time averagedcoronal X-ray flux is averaged over 4-hours to obtain 6 values in each day.The
standard deviation is termed as the uncertainty in this dataset as well asoccurred due to
averaging.
Table – 3 (March- 2012) Active Region NOAA11429
Date/Time Magnetic flux (Mx) X-Ray flux (Watt/m2)
04/03/2012 00:00 1.30E+26 5.65E-07
04/03/2012 04:00 1.43E+26 7.13E-07
04/03/2012 08:00 2.46E+26 5.77E-06
04/03/2012 12:00 6.26E+26 4.80E-06
04/03/2012 16:00 6.88E+26 1.33E-06
04/03/2012 20:00 5.21E+26 1.05E-06
05/03/2012 00:00 1.92E+26 9.45E-06
05/03/2012 04:00 3.74E+26 2.99E-05
05/03/2012 08:00 4.89E+26 1.69E-06
05/03/2012 12:00 3.98E+26 1.72E-06
05/03/2012 12:00 4.10E+26 2.85E-06
05/03/2012 20:00 2.77E+26 1.79E-06
06/03/2012 00:00 2.03E+26 2.76E-06
06/03/2012 04:00 2.02E+26 2.31E-06
06/03/2012 08:00 2.10E+26 1.37E-06

International Journal of Research in Modern Engineering and Emerging Technology (IJRMEET) UGC Approved id_47203
Vol. 5, Sp. Issue: 9, Sept.: 2017 (IJRMEET) ISSN: 2320-6586
93 Online International, Refereed, Impact factor & Indexed Monthly Journal www.raijmr.com
RET Academy for International Journals of Multidisciplinary Research (RAIJMR)
06/03/2012 12:00 2.28E+26 3.10E-06
06/03/2012 16:00 2.46E+26 1.19E-06
06/03/2012 20:00 2.76E+26 3.75E-06
07/03/2012 00:00 2.67E+26 9.34E-05
07/03/2012 04:00 2.77E+26 4.05E-06
07/03/2012 08:00 2.54E+26 1.32E-06
07/03/2012 12:00 2.11E+26 1.26E-06
07/03/2012 16:00 1.95E+26 1.37E-06
07/03/2012 20:00 1.83E+26 8.38E-07
08/03/2012 00:00 2.19E+26 9.79E-07
08/03/2012 04:00 1.99E+26 8.63E-07
08/03/2012 08:00 1.89E+26 6.64E-07
08/03/2012 12:00 1.66E+26 8.53E-07
08/03/2012 16:00 1.46E+26 9.17E-07
08/03/2012 20:00 1.34E+26 7.75E-07
09/03/2012 00:00 1.55E+26 6.66E-06
09/03/2012 04:00 1.35E+26 1.16E-05
09/03/2012 08:00 1.23E+26 1.31E-06
09/03/2012 12:00 1.26E+26 1.14E-06
09/03/2012 16:00 1.38E+26 1.19E-06
09/03/2012 20:00 1.46E+26 3.03E-06
10/03/2012 00:00 1.53E+26 1.96E-06
10/03/2012 04:00 1.55E+26 7.02E-07
10/03/2012 08:00 1.62E+26 1.56E-06
10/03/2012 12:00 1.62E+26 2.68E-05
10/03/2012 16:00 1.43E+26 4.36E-06
10/03/2012 20:00 1.23E+26 1.81E-06
11/03/2012 00:00 1.33E+26 1.07E-06
11/03/2012 04:00 1.26E+26 4.98E-07
11/03/2012 08:00 1.08E+26 6.41E-07
11/03/2012 12:00 1.02E+26 5.48E-07
11/03/2012 16:00 1.00E+26 5.85E-07
Table- 4 (May-2012) Active Region NOAA11476
06/05/2012 00:00 1.08E+26 1.27E-06
06/05/2012 04:00 4.33E+25 9.17E-07
06/05/2012 08:00 7.30E+25 6.05E-07
06/05/2012 12:00 1.27E+26 6.87E-07
06/05/2012 16:00 1.27E+26 1.72E-06
06/05/2012 20:00 1.46E+26 1.06E-06

International Journal of Research in Modern Engineering and Emerging Technology (IJRMEET) UGC Approved id_47203
Vol. 5, Sp. Issue: 9, Sept.: 2017 (IJRMEET) ISSN: 2320-6586
94 Online International, Refereed, Impact factor & Indexed Monthly Journal www.raijmr.com
RET Academy for International Journals of Multidisciplinary Research (RAIJMR)
07/05/2012 00:00 1.48E+26 1.60E-07
07/05/2012 04:00 1.54E+26 1.09E-06
07/05/2012 08:00 1.54E+26 8.91E-07
07/05/2012 12:00 1.22E+26 3.87E-06
07/05/2012 16:00 1.02E+26 8.93E-07
07/05/2012 20:00 1.13E+26 5.28E-07
08/05/2012 00:00 1.60E+26 4.22E-07
08/05/2012 04:00 1.43E+26 4.04E-07
08/05/2012 08:00 1.32E+26 7.85E-07
08/05/2012 12:00 1.27E+26 1.06E-06
08/05/2012 16:00 1.32E+26 4.71E-07
08/05/2012 20:00 1.39E+26 3.49E-07
09/05/2012 00:00 1.70E+26 3.52E-07
09/05/2012 04:00 1.38E+26 4.20E-07
09/05/2012 08:00 1.28E+26 5.70E-07
09/05/2012 12:00 1.12E+26 3.00E-06
09/05/2012 16:00 1.23E+26 6.99E-07
09/05/2012 20:00 1.28E+26 2.55E-06
10/05/2012 00:00 1.35E+26 7.07E-07
10/05/2012 00:00 1.35E+26 4.11E-06
10/05/2012 00:00 1.31E+26 6.85E-07
10/05/2012 00:00 1.41E+26 1.48E-06
10/05/2012 00:00 1.42E+26 1.05E-06
10/05/2012 00:00 1.40E+26 2.03E-06
11/05/2012 00:00 1.26E+26 7.46E-07
11/05/2012 00:00 1.18E+26 8.76E-07
11/05/2012 00:00 1.27E+26 1.12E-06
11/05/2012 00:00 1.21E+26 1.13E-06
11/05/2012 00:00 1.17E+26 1.14E-06
11/05/2012 00:00 1.33E+26 1.83E-06
12/05/2012 00:00 1.22E+26 3.03E-06
12/05/2012 00:00 1.16E+26 5.85E-07
12/05/2012 00:00 1.16E+26 4.72E-07
12/05/2012 00:00 1.14E+26 4.77E-07
12/05/2012 00:00 1.06E+26 5.35E-07
12/05/2012 00:00 1.08E+26 4.17E-07
13/05/2012 00:00 1.06E+26 5.39E-07
13/05/2012 00:00 1.06E+26 9.27E-07
13/05/2012 00:00 1.02E+26 1.02E-06
13/05/2012 00:00 1.03E+26 4.78E-07
13/05/2012 00:00 1.03E+26 4.42E-07
13/05/2012 00:00 1.06E+26 4.84E-07

International Journal of Research in Modern Engineering and Emerging Technology (IJRMEET) UGC Approved id_47203
Vol. 5, Sp. Issue: 9, Sept.: 2017 (IJRMEET) ISSN: 2320-6586
95 Online International, Refereed, Impact factor & Indexed Monthly Journal www.raijmr.com
RET Academy for International Journals of Multidisciplinary Research (RAIJMR)
Table – 5 (Nov-2011) Active Region NOAA11339
Date Flux (Mx) Flux (Watt/m2)
04/11/2011 00:00 3.24E+26 4.15E-06
04/11/2011 04:00 3.29E+26 2.45E-06
04/11/2011 08:00 3.42E+26 1.01E-06
04/11/2011 12:00 4.55E+26 9.15E-07
04/11/2011 16:00 4.93E+26 1.24E-06
04/11/2011 20:00 3.88E+26 2.20E-06
05/11/2011 00:00 3.57E+26 7.18E-06
05/11/2011 04:00 3.74E+26 3.20E-06
05/11/2011 08:00 3.60E+26 2.55E-06
05/11/2011 12:00 3.69E+26 1.50E-06
05/11/2011 16:00 3.73E+26 1.08E-06
05/11/2011 20:00 3.45E+26 3.08E-06
06/11/2011 00:00 2.54E+26 3.00E-06
06/11/2011 04:00 2.59E+26 2.05E-06
06/11/2011 08:00 2.49E+26 1.49E-06
06/11/2011 12:00 2.28E+26 1.43E-06
06/11/2011 16:00 2.18E+26 9.35E-07
06/11/2011 20:00 2.09E+26 8.46E-07
07/11/2011 00:00 2.77E+26 1.07E+06
07/11/2011 04:00 2.83E+26 1.26E-06
07/11/2011 08:00 2.90E+26 8.15E-07
07/11/2011 12:00 2.82E+26 1.03E-06
07/11/2011 16:00 2.36E+26 7.88E-07
07/11/2011 20:00 2.05E+26 1.35E-06
08/11/2011 00:00 1.75E+26 1.02E-06
08/11/2011 04:00 1.64E+26 9.15E-07
08/11/2011 08:00 1.72E+26 1.17E-06
08/11/2011 12:00 1.72E+26 7.42E-07
08/11/2011 16:00 1.53E+26 7.57E-07
08/11/2011 20:00 1.44E+26 7.67E-07
09/11/2011 00:00 1.46E+26 1.15E-06
09/11/2011 04:00 1.54E+26 7.25E-07
09/11/2011 08:00 1.73E+26 6.95E-07
09/11/2011 12:00 1.77E+26 3.88E-06
09/11/2011 16:00 1.77E+26 1.00E-06
09/11/2011 20:00 1.87E+26 7.45E-07
10/11/2011 00:00 1.74E+26 8.07E-07
10/11/2011 04:00 1.80E+26 9.73E-07
10/11/2011 08:00 1.89E+26 9.02E-07
10/11/2011 12:00 1.86E+26 1.04E-06
10/11/2011 16:00 1.69E+26 1.79E-06
10/11/2011 20:00 1.71E+26 7.48E-07
11/11/2011 00:00 1.88E+26 7.96E-07
11/11/2011 04:00 1.95E+26 1.65E-06
11/11/2011 08:00 2.19E+26 1.16E-06
11/11/2011 12:00 2.37E+26 1.02E-06

International Journal of Research in Modern Engineering and Emerging Technology (IJRMEET) UGC Approved id_47203
Vol. 5, Sp. Issue: 9, Sept.: 2017 (IJRMEET) ISSN: 2320-6586
96 Online International, Refereed, Impact factor & Indexed Monthly Journal www.raijmr.com
RET Academy for International Journals of Multidisciplinary Research (RAIJMR)
11/11/2011 16:00 2.36E+26 2.17E-06
11/11/2011 20:00 2.28E+26 8.70E-07
Result and Conclusion
After doing all the procedure mentioned earlier the following results were obtained.
Figure - 1 magnetic flux and x-ray flux for an active region (NOAA 11429) with during the
04-March-2012 to 11-March-2012.

International Journal of Research in Modern Engineering and Emerging Technology (IJRMEET) UGC Approved id_47203
Vol. 5, Sp. Issue: 9, Sept.: 2017 (IJRMEET) ISSN: 2320-6586
97 Online International, Refereed, Impact factor & Indexed Monthly Journal www.raijmr.com
RET Academy for International Journals of Multidisciplinary Research (RAIJMR)
Figure - 2 magnetic flux and x-ray flux for an active region (NOAA 11339) with during the
04-Nov-2011 to 11-Nov-2011.

International Journal of Research in Modern Engineering and Emerging Technology (IJRMEET) UGC Approved id_47203
Vol. 5, Sp. Issue: 9, Sept.: 2017 (IJRMEET) ISSN: 2320-6586
98 Online International, Refereed, Impact factor & Indexed Monthly Journal www.raijmr.com
RET Academy for International Journals of Multidisciplinary Research (RAIJMR)
Figure - 3 magnetic flux and x-ray flux for an active region (NOAA 11476) with during the
06-May-2012 to 13-May-2012
We found that, in the photosphere whenever magnetic flux enhances then within we found that
next few hour flare activity start. The magnitude of the flare depends on the accumulation and
storage of magnetic flux, while release of this magnetic field energy depends on other plasma
triggering mechanisms. These mechanisms may be gradient, deviation and/or variation in
sunspot rotation angle as shown earlier by Jain et al., (2011). Result of study of three active
region (AR) show that corona is heated up by the induction of magnetic flux energy from the
photosphere
Reference
1. Aschwanden, M. J., 2005, Physics of the Solar Corona. An Introduction with Problems and
Solutions (2nd edition)
2. Bhatnagar, A. and Livingston, W., 2005, Fundamentals of solar astronomy
3. Jain, R., Awasthi, A. K., Chandel, B., Bharti, L., Hanaoka, Y., and Kiplinger, A.L., 2011,
Solar Phys. 271
4. G. E. Hale, 1908, Astrophys. J., 28, 315
5. Hollweg, J. V., 1985, Chromospheric Diagnostics and Modelling, pp 235–251 9
6. Heyvaerts, J. and Norman, C., 2001, Astronomical and Astrophysical Transactions 20, 295

International Journal of Research in Modern Engineering and Emerging Technology (IJRMEET) UGC Approved id_47203
Vol. 5, Sp. Issue: 9, Sept.: 2017 (IJRMEET) ISSN: 2320-6586
99 Online International, Refereed, Impact factor & Indexed Monthly Journal www.raijmr.com
RET Academy for International Journals of Multidisciplinary Research (RAIJMR)
7. Phillips, K. J. H., Feldman, U., and Landi, E., 2008, Cambridge University Press 5 Pesnell,
W. D., Thompson, B. J., and Chamberlin, P. C., 2012, Solar Phy., 275
8. Scherrer, P. H., Schou, J., Bush, R. I., Kosovichev, A. G., Bogart, R. S.,Hoeksema, J. T.,
Liu, Y., Duvall, T. L., Zhao, J., Title, A. M., Schrijver,
9. C. J., Tarbell, T. D., and Tomczyk, S., 2012, Solar Phys. 275
10. Svestka, Z., 1976, Solar Flares
11. Withbroe, G. L. and Noyes, R. W., 1977, Annual Rev. in Astron. & Astrophys.15, 363
12. Wikstol, O., Judge, P. G., and Hansteen, V. H., 1997, Astrophys. J. 483, 972

International Journal of Research in Modern Engineering and Emerging Technology (IJRMEET) UGC Approved id_47203
Vol. 5, Sp. Issue: 9, Sept.: 2017 (IJRMEET) ISSN: 2320-6586
100 Online International, Refereed, Impact factor & Indexed Monthly Journal www.raijmr.com
RET Academy for International Journals of Multidisciplinary Research (RAIJMR)
“Effect of concentration of TEA and annealing
temperature on band gap of ZnO: A review” Vipul J. Shukla
a,Dr.Amitkumar J.Patel
b
aGujarat Technological University, Chandkheda, Ahmedabad –382424 Gujarat
bGoverment Engineering college,Godhara –389001 Gujarat
Email – [email protected]
Abstract
The nanocrystalline Zinc Oxide (ZnO) thin films were prepared on glass substrates by
chemical bath deposition (CBD) method utilizing aqueous solutions of zinc chloride. Zinc
oxide is classified a semiconductor in group II-VI, whose covalence is on the limit amongst
ionic and covalent semiconductors. A wide energy band (3.37 eV), high bond energy (60
meV) and high thermal and mechanical stability at room temperature. Different chemical and
physical deposition techniques have been connected to create ZnO thin films. Most cases,
high temperature and special atmosphere are fundamental. Be that as it may, the chemical
bath deposition (CBD) technique speaks to a basic and viable method for deposition.
Basically, CBD processes involve preparing ZnO nanoparticles seed layer on special
substrate. This review summarizes the main chemical routes used in the chemical bath
deposition synthesis of undopedZnO thin films. This paper includes review about effect of
complexing agent e.g. TEA and annealing temperature on band gap.
Keywords: Zinc oxide, chemical bath deposition, TEA,band gap, annealing temperature.
Introduction
In recent years, there is a great interest in production of transparent conducting oxide (TCO)
and transparent oxide semiconductorsfor the development of photonic devices and
transparentconducting electrodes (TCE) for solar cells. As of late, there is an incredible
enthusiasm for generation of transparent conducting oxide (TCO) and transparent oxide
semiconductors for the improvement of photonic gadgets and transparent conducting
electrodes (TCE) for solar cells. Zinc oxide has pulled in critical consideration as a material
for ultraviolet (UV) light-producers, varistors, straightforward high power hard transparent
high power electronics ware, surface acoustic wave gadgets, piezoelectric transducers and gas
sensors and furthermore as a window material for presentations and solar cells. zinc oxide is a
hopeful host for solid state blue to UV optoelectronics, including lasers. The applications

International Journal of Research in Modern Engineering and Emerging Technology (IJRMEET) UGC Approved id_47203
Vol. 5, Sp. Issue: 9, Sept.: 2017 (IJRMEET) ISSN: 2320-6586
101 Online International, Refereed, Impact factor & Indexed Monthly Journal www.raijmr.com
RET Academy for International Journals of Multidisciplinary Research (RAIJMR)
incorporate high thickness information stockpiling frameworks, strong state lighting, secure
correspondences and bio detection. Zinc oxide, with its remarkable physical and chemical
properties, for example, high substance solidness, high electrochemical coupling coefficient,
expansive scope of radiation retention and high photostability, is a multifunctional material
[1,2]. In materials science, zinc oxide is delegated a semiconductor in gathering II-VI, whose
covalence is on the limit amongst ionic and covalent semiconductors. A broad energy band
(3.37 eV), high bond energy (60 meV) and high thermal and mechanical dependability at
room temperature make it appealing for potential use in electronics, optoelectronics and laser
innovation [3,4]. The piezo-and pyroelectric properties of ZnO imply that it can be utilized as
a sensor, converter, vitality generator and photocatalyst in hydrogen creation [5,6]. In light of
its hardness, unbending nature and piezoelectric consistent it is an imperative material in the
ceramics industry, while its low danger, biocompatibility and biodegradability make it a
material of enthusiasm for biomedicine and in expert environmental frameworks [7–9]. With
respect to preparation method ofZnO nanostructures, there are an amount of techniques used
to synthesizeZnO nanostructures. metal-organic chemical vapor deposition (MOCVD) [10],
pulsed laser deposition [11], magnetron sputtering method [12], chemical bath deposition
(CBD), electrochemically deposited ZnO thin films and so on. CBD has been connected all
the more extensively in light of the fact that it is a straightforward technique in watery
arrangement and developed in low temperature. Likewise, CBD have another remarkable
attributes, such as the simplicity of operation, the low cost, and so forth [13]. Chemical bath
deposition is generally utilized for the deposition of different metal chalcogenide thin films. It
creates great stores on suitable substrates by the controlled precipitation of the compound
from the solution. The technique offers many points of interest over other well-knownvapour
phase synthetic routes. It might enable us to effectively control the growth factors, for
example, film thickness, deposition rate and nature of crystallites by varying the solution pH,
temperature and bath concentration [14]. It doesn't require high voltage equipment, works at
room temperature, and thus it is economical. The main necessity for this deposition route is
an aqueous solution comprising of a couple of regular chemicals and a substrate for the film
to be kept. It frequently experiences an absence of reproducibility in examination with other
compound procedures; be that as it may, by the best possible and cautious streamlining of the
development parameters, one can accomplish sensible reproducibility. Another favorable
position of the CBD technique over other strategy is that the film can be kept at various
shapes and size of substrates. In this paper, thin films of ZnO have been deposited on silica

International Journal of Research in Modern Engineering and Emerging Technology (IJRMEET) UGC Approved id_47203
Vol. 5, Sp. Issue: 9, Sept.: 2017 (IJRMEET) ISSN: 2320-6586
102 Online International, Refereed, Impact factor & Indexed Monthly Journal www.raijmr.com
RET Academy for International Journals of Multidisciplinary Research (RAIJMR)
glass substrate using chemical bath method. The band gap and the effect of annealing
temperature on band gap have also been investigated. In this paper, we report that decreasing
in concentration of TEA, band gap increases.
Experimental Procedure
CBD method has been ended up being a decent approach for synthesis of ZnO thin film with
the utilization of ZnO seeds in the types of thin films. The substrate is imperative for the
development of thin filmslattice and thermal mismatching between it and the film since it
generally prompts the development of stress in the deposited film.
The ZnO thin films were prepared by chemical bath technique at room temperature. The
reaction bath is composed of ZnCl2, NaOH and TEA (triethanolamine) used as complexing
agent. Concentration of ZnCl2 (0.04 M) and of NaOH (0.08 M) were utilized as a part of this
technique. Tri ethanolamine was used either directly or as aqueous solution with varying
concentration of TEA to ZnOthin films were developed on glass substrate. Before utilize,
these glass slides were absorbed aquaregia, a mixture of concentrated HCl and HNO3 in the
proportion of 3:1. They were removed after 24 h and washed thoroughly in cold detergent
solution, rinsed in distilled water and dribble dried in air. The properly degreased and cleaned
substrate surface has the advantage of producing highly adhesive and uniform film. The
substrate was immersed vertically at the focal point of response shower in such a way it ought
not touch the walls of the beaker [15].Now utilizing same precursori.e.zincchloride(0.1 M)
and instead of other complexingagent,small drops of ammonia were added and stirred
continuously using a magnetic stirrer to obtain optimum pH of 9.4. For this deposition 70 ml
solution of zinc chloride aqueous ammonia were put in 100 ml beaker and the substrates
whose surface had been prepared under standard conditions were vertically suspended in the
beaker and the solution was constantly stirred using magnetic stirrer in a water bath of
constant temperature of 70oC.The deposition time was 70 minutes. After 70 minutes the
substrate with kept thin films were removed, washed with distilled water and left to dry. The
as-stored ZnO thin films were additionally tempered at 200oC and 300
oC in a furnace.The
absorbance of the film was also measuredusing UV mini Schmadzu UV-VIS
spectrophotometer in thewavelength range 300-1100 nm [18].

International Journal of Research in Modern Engineering and Emerging Technology (IJRMEET) UGC Approved id_47203
Vol. 5, Sp. Issue: 9, Sept.: 2017 (IJRMEET) ISSN: 2320-6586
103 Online International, Refereed, Impact factor & Indexed Monthly Journal www.raijmr.com
RET Academy for International Journals of Multidisciplinary Research (RAIJMR)
Results and Discussions
In direct Used of TEA (sample 219) the colour of the film was white but when we decrease
the concentration of TEA in aqueous solution the whiteness of the deposition film decreases
and become almost transparent and their band gap also increases. In sample 219 (3 ml of
direct solution of TEA) we obtain band gap as 2.59 eV [17] and transmittance between 30
and 40%. In sample 311 we used 10 ml of 1 mol aqueous solution of TEA, we obtain band
gap as 2.92 eV and transmittance between 40 and 50%. In sample 339 and 328 we used 8 ml
of 0.1 and 8 ml of 0.01molarity aqueous solution of TEA, we obtain band gap between 3.37
and 3.57 eV and transmittance between 60 and 80%. We obtain different result when we used
aqueous solution of TEA.
In direct Used of TEA (sample 219) the colour of the film was white yet when we decrease
the concentration of TEA in aqueous solution the whiteness of the affidavit film decrease and
turn out to be practically transparent and their band gap also increases. In sample 219 (3 ml of
direct solution of TEA) we get band gap as 2.59 eV [17] and transmittance between of 30 and
40%. In sample 311 we utilized 10 ml of 1 molaqueous solution of TEA, we get band gap as
2.92 eV and transmittance in the vicinity of 40 and half. In sample 339 and 328 we utilized 8
ml of 0.1 and 8 ml of 0.01molarity aqueous solution of TEA, we acquire band crevice in the
vicinity of 3.37 and 3.57 eV and transmittance in the vicinity of 60 and 80%. We get
distinctive outcome when we utilized aqueous solution of TEA.For different sample
219,311,339 and 328,the band gap are 2.59 eV, 2.92 eV, 3.37 eV and 3.57 eV respectively.
Optical Band Gap
The band gap can be determined from the Stern (1963) relation
Ahυ = k(hυ-Eg)n/2
The band gap of the metallic oxide was dictated by plotting (αhv)2 as a component of hv, and
extrapolating the straight segment of the bend to (αhv)2 = 0 as appeared in Fig.1. The value
obtained for the optical band gap is 3.37 and 3.57 eVof 339 and 328 sample.

International Journal of Research in Modern Engineering and Emerging Technology (IJRMEET) UGC Approved id_47203
Vol. 5, Sp. Issue: 9, Sept.: 2017 (IJRMEET) ISSN: 2320-6586
104 Online International, Refereed, Impact factor & Indexed Monthly Journal www.raijmr.com
RET Academy for International Journals of Multidisciplinary Research (RAIJMR)
Figure1. Plots of (αhυ)2 ev
2 m
-2against hυ(ev).[15]
A plot of against the photon energy hυ gives a curve as shown in Figure 2 and extrapolation
of the linear portionof the curve to the axis gives the band gap Eg .The band gaps Eg for as-
deposied, annealed at 200 oC and 300
oC are respectively 2.72, 2.66 and 2.60 eV. The band
gapestimation of 2.72 for as-deposited thin film is practically identical to the band gap value
acquired by Eya et al (2005). There is a red shift in the band gap estimations of the as-
deposited2.72 eV, annealed at 200oC of 2.66 eV and 300
oC of 2.60 eV. This is likewise in
concurrence with the works of Elilarassi and Chandrasekaran (2010) and Lv et al, 2011] who
hν/eV

International Journal of Research in Modern Engineering and Emerging Technology (IJRMEET) UGC Approved id_47203
Vol. 5, Sp. Issue: 9, Sept.: 2017 (IJRMEET) ISSN: 2320-6586
105 Online International, Refereed, Impact factor & Indexed Monthly Journal www.raijmr.com
RET Academy for International Journals of Multidisciplinary Research (RAIJMR)
additionally watched a lessening in band gap of ZnO as the annealing temperature was
incresed. This may be because of a change in the crystallinity of the ZnO thin film
Figure 2: A graph of (Ahυ)2 versus hυ of ZnO thin film for as-deposited, annealed at 200
Cand 300
oC [16]
Conclusions
ZnOfilms have been effectively arranged by CBD technique utilizing ZnCl2 and NaOHwith
TEA as complexing agent. The band gap of the film is 3.57 eV. The ZnO thin films could be
successfully synthesized through the simple chemical bath techniques. The chemical bath
deposition technique was effectively used to manufacture ZnO thin films on zinc
plates.Structural, optical and morphological reviews were done. The crystallite size and band
gap energy were found to rely on upon the bath temperature. The band gap decreased as the
crystallite measure increased. The bath temperature was found to impact the development of
ZnO crystallites: at temperatures over 50 °C, great crystalline film was produced. The pH
range 9.5–10.5 was observed to be the most appropriate for CBD development of ZnO. The
utilization of zinc as the substrate is helpful for smooth adsorption of zinc ions on the surface
and it brings about a fantastic coating. With the expansion of the annealing temperature, the
carrier concentration decreased and the resistivity increased thus band gap is decreased. A
decrease in the band gap was seen after expanding the bath temperature and size of the
crystallites.
References
[1]Segets, D.; Gradl, J.; Taylor, R.K.; Vassilev, V.; Peukert, W. Analysis Of Optical
Absorbance Spectra For The Determination Of ZnO Nanoparticle Size Distribution,
Solubility, And Surface Energy. AcsNano2009, 3, 1703–1710.
[2] Lou, X. Development OfZnO Series Ceramic Semiconductor Gas Sensors. J. Sens. Trans.
Technol. 1991, 3, 1‒5.
[3] Bacaksiz, E.; Parlak, M.; Tomakin, M.; Özcelik, A.; Karakiz, M.; Altunbas, M. The Effect
Of Zinc Nitrate, Zinc Acetate And Zinc Chloride Precursors On Investigation Of Structural
And Optical Properties Of ZnO Thin Films. J. Alloy. Compd. 2008, 466, 447‒450.
[4] Wang, J.; Cao, J.; Fang, B.; Lu, P.; Deng, S.; Wang, H. Synthesis And Characterization
Of Multipod, Flower-Like, And Shuttle-Like ZnO Frameworks In Ionic Liquids. Mater. Lett.
2005, 59, 1405‒1408.

International Journal of Research in Modern Engineering and Emerging Technology (IJRMEET) UGC Approved id_47203
Vol. 5, Sp. Issue: 9, Sept.: 2017 (IJRMEET) ISSN: 2320-6586
106 Online International, Refereed, Impact factor & Indexed Monthly Journal www.raijmr.com
RET Academy for International Journals of Multidisciplinary Research (RAIJMR)
[5] Wang, Z.L. Splendid One-Dimensional Nanostructures Of Zinc Oxide: A New
Nanomaterial Family For Nanotechnology. AcsNano2008, 2, 1987–1992.
[6] Chaari, M.; Matoussi, A. Electrical Conduction And Dielectric Studies Of ZnO Pellets.
Phys. B Condens. Matter 2012, 407, 3441‒3447.
[7] Özgür, Ü.; Alivov, Y.I.; Liu, C.; Teke, A.; Reshchikov, M.A.; Doğan, S.; Avrutin, V.;
Cho, S.J.; Morkoç, H. A Comprehensive Review OfZnO Materials And Devices. J. Appl.
Phys. 2005, 98, Doi:10.1063/1.1992666.
[8] Bhattacharyya, S.; Gedanken, A. A Template-Free, Sonochemical Route To Porous
ZnONano-Disks. MicroporousMesoporous Mater. 2007, 110, 553‒559.
[9] Ludi, B.; Niederberger, M. Zinc Oxide Nanoparticles: Chemical Mechanism And
Classical And Non-Classical Crystallization. Dalton Trans. 2013, 42, 12554‒12568.
[10] J. Y. Park, D. J. Lee, B. T. Lee, J. H. Moon, S. S. Kim, Journal Of Crystal Growth,
2005, 276, 165.
[11] Y. Sun, G.M. Fuge, M. N. R. Ashfold, Chem. Phys. Lett., 2004, 396, 21.
[12] K. B. Sundaram, A. Khan, Thin Solid Films, 1997, 295, 87.
[13] G. Z. Jia, N. Wang, L. Gong, X. N. Fei, Chalcogenide Letters, 2009, 6, 463.
[14] Sankapal B.R., Sartale S.D., Lokhande C.D., Ennaoui A., Sol. Energy Mater. Solar
Cells, 2004, 83, 447.
[15] P.B. Taunk , R. Das, D.P. Bisen, R.K. Tamrakar, NootanRathor., Synthesis And Optical
Properties Of Chemical Bath Deposited ZnO Thin Film, Karbala International Journal Of
Modern Science, 2015, XX , 1-7
[16] Nkrumah, F.K. Ampong, B. Kwakye-Awuah, R.K. Nkum, F. Boakye, Synthesis And
Characterization Of ZnO Thin Films Deposited By Chemical Bath Technique,International
Journal Of Research In Engineering And Technology, 2013, 2 ,12, 809-812
[17]PengZhiwei, Dai Guozhang, Chen Peng, Zhang Qinglin,WanQiang, ZouBingsuo,
Synthesis, Characterization And Optical Properties Of Star-Like ZnO Nanostructures, Mater.
Lett., 2010, 64, 890.
[18] A.K. Singh, V. Viswanath, V.C. Janu, Synthesis, Effect Of Capping Agents, Structural,
Optical And Photoluminescence Properties Of ZnO Nanoparticles, J. Luminescence, 2009,
129, 874-878.

International Journal of Research in Modern Engineering and Emerging Technology (IJRMEET) UGC Approved id_47203
Vol. 5, Sp. Issue: 9, Sept.: 2017 (IJRMEET) ISSN: 2320-6586
107 Online International, Refereed, Impact factor & Indexed Monthly Journal www.raijmr.com
RET Academy for International Journals of Multidisciplinary Research (RAIJMR)
Asphericity in the Fermi surface of some alkaline earth metals
P. H. Suthar*, B. Y. Thakore
+ and P. N. Gajjar
++
*Department of Physics, C. U. Shah Science College, Ahmedabad 380 014,
+Department of Physics, Sardar Patel University, Vallabh Vidyanagar 388 120,
++Department of Physics, School of Sciences, Gujarat University, Ahmedabad 380 009
*E-mail: [email protected]
Abstract
The theoretical observed shape of the Fermi surface (FS) as a probe to examine the applicability,
validity and comparing of our well establish two different pseudopotentials for computing actual
physical quantities to characterize metallic properties is used, the present paper first time reports
a calculation of the shape of the shape of the FS of alkaline earth metals along (Ca (FCC), Sr
(FCC), Ba (BCC)) three principal directions [1 0 0], [1 1 0] and [1 1 1] based on a local model
potential. The effect of four different forms of dielectric functions on asphericity in the FS,
confirms the general correctness of the empirical form factor employed in the investigation.
Keyword: Fermi Surface, alkaline earth metals, Asphericity, Pseudopotential
Introduction
As known as the alkaline earth metals can be considered as simple metals regarding their
electronic structure and from the experimental and theoretical point of view, few properties have
been determine to the date because of this metals have the high chemical reactivity and to the gas
adsorption ability that further increase with temperature [1-5]. These difficulties have induced a
low interest for technological purpose and a disinterested for the theoretical work. So that
theoretical point of view first time we have study the Fermi surface (FS) of an alkaline earth
metals show a small but departure from a free electronic sphere and the study of its asphericity
thus provides a delicates test of band theory predictions. Several electronic properties of metals
are determined from variation in the shape of the Fermi surface. The recent success of such
investigation pertaining to the Fermi surface[1-27] of fcc (Ca and Sr) and bcc (Ba) alkaline earth
metals has motivated us to study of distortion in the Fermi surface of metals to confirms the wide
applicability of pseudopotential theory. The sharp and more complicated than those of alkaline

International Journal of Research in Modern Engineering and Emerging Technology (IJRMEET) UGC Approved id_47203
Vol. 5, Sp. Issue: 9, Sept.: 2017 (IJRMEET) ISSN: 2320-6586
108 Online International, Refereed, Impact factor & Indexed Monthly Journal www.raijmr.com
RET Academy for International Journals of Multidisciplinary Research (RAIJMR)
earth metals. In the present paper asphericity in the Fermi surface of Ca, Sr and Ba is calculated
and compared using our well establish two different model potentials [28, 29].
In the present we focus our attention to the detailed theoretical investigation on the as asphericity
in the Fermi surface in the alkaline earth metals using two different model potentials [28,29]
along with local field correction function due to Hartree(H) [2], Taylor(T) [30], Ichimaru and
Ustumi (IU) [31] , Farid et al (F) [32], Sarkar et al (S) [33] and Hubbard and Sham (HS) [34-35].
Theory and method of computation
The Fermi surface of Fermi-energy EF in wave-number space and is defined by
FEk )( (1)
The Fermi surface (FS) provides us all the electron states that can play any part in the ordinary
transport properties of the metal and for binary alloys. For a metal at absolute zero temperature,
all the states inside the Fermi Surface are filled while those outside are empty. Thus the FS in a
mathematical construction related to the dynamical properties of the conduction electrons in a
metal. In a free electron gas the FS is a sphere.
It is a well-establish fact that the Fermi Surface of a real metal shows a small but definite
departure from the perfectly spherical shape of the free electron gas. The asphericity of the FS
provides us a sensitive test of certain results derived from electronic energy bands. Several
electronic properties of metals are determined from variation in the shape of the FS.
The distortion in the spherical shape of the free electronic Fermi surface is the case of metals and
binary alloys may be given by the expression [1-5].
kqFF kk 10 (2)
Here, kq is the dilation to the free electron Fermi wave number, 0
Fk and kq are the angle
between direction k and reciprocal lattice vector q. The Fermi energy EF on the basis of
perturbation approach up to the second order may be written as [5-7]
qpair
FF qVsqCkm
E )(2
2202
(3)
Where )(2 qVs is the screened ion pseudopotential from factor is given in Suthar et al [28, 29].
The function C(q) is given as [5-7]

International Journal of Research in Modern Engineering and Emerging Technology (IJRMEET) UGC Approved id_47203
Vol. 5, Sp. Issue: 9, Sept.: 2017 (IJRMEET) ISSN: 2320-6586
109 Online International, Refereed, Impact factor & Indexed Monthly Journal www.raijmr.com
RET Academy for International Journals of Multidisciplinary Research (RAIJMR)
qk
qk
qk
mqC
F
F
F
0
0
02 2
2ln
2 (4)
This function is estimated from the conclusion that the distortion should not alter the volume
element enclosed by the Fermi surface.
The expression representing the distortion in the Fermi surface shape, after neglecting higher
power of kq is given as [5-7]
pairq kqFmF
s
F
F qCEqE
qV
k
kK )(
cos4
1)(202
2
0
2
2
(5)
Here 0
FE is the free electron Fermi energy. Another method for computing the distortion in the
FS has been suggested by Wallace [36]. Both the methods are found to give similar results.
The quantities X, Y and δ are most frequently used in the study of radial distortion of the Fermi
surface of alkaline earth elements, which are represented by [27]
4
111100 10)( kkX (6)
4
111110 10)( kkY (7)
4
100110 10)( kk (8)
Results and Discussion
Table-1: Input parameters and Constants.
Metals Z Ω0 (a.u)
rc (a.u)
Model-1 Model-2
Ca 2 293.492 1.3639 1.0453
Sr 2 380.442 1.4871 1.1398
Ba 2 428.515 1.5113 1.1583
Table-1 shows the Input parameters and constants use in the present computation. The Ca, Sr (d-
shell) and Ba (d-shell) alkaline-earth metals can be considered as a simple in regard of the
electronic aspect, they are certainly the less studied elements among the metals. So that here first
time the asphericity in the Fermi surface of FCC Ca, Sr and BCC Ba metals along with [100],
[110] and [111] directions has been evaluated. Fig. 1, 2 and 3 shows the computed asphericity in

International Journal of Research in Modern Engineering and Emerging Technology (IJRMEET) UGC Approved id_47203
Vol. 5, Sp. Issue: 9, Sept.: 2017 (IJRMEET) ISSN: 2320-6586
110 Online International, Refereed, Impact factor & Indexed Monthly Journal www.raijmr.com
RET Academy for International Journals of Multidisciplinary Research (RAIJMR)
the Fermi surface of Ca, Sr and Ba along three principal symmetry directions and it is observed
that the present graphs show the almost same in nature computed using Model-1[28] and Model-
2[29] pseudopotentials. Table 2, 3 and 4 give the numerical values of the Fermi surface
distortion at the points of high symmetry.
Fig. 1: Asphericity in the Fermi surface for Ca using Model-1[28] and Model-2[29] potential.
Fig. 2: Asphericity in the Fermi surface for Sr using Model-1[28] and Model-2[29] potential.

International Journal of Research in Modern Engineering and Emerging Technology (IJRMEET) UGC Approved id_47203
Vol. 5, Sp. Issue: 9, Sept.: 2017 (IJRMEET) ISSN: 2320-6586
111 Online International, Refereed, Impact factor & Indexed Monthly Journal www.raijmr.com
RET Academy for International Journals of Multidisciplinary Research (RAIJMR)
Fig. 3: Asphericity in the Fermi surface for Ba using Model-1[28] and Model-2[29] potential.
The variation in the present results of (%)k in going from [1 0 0] to [1 1 0] and [0 0 1] (via [1 1
1]), due to various local filed correction functions can be judged from the Fig. 1, 2 and 3 the
results obtained with Model-1 and Model-2 along with IU, F, S and HS dielectric functions are
falling between those obtained with H and the T dielectric functions. It is also observed that
present results computed using Model-1 and Model-2 along with IU and F screening almost
overlaps each other. Compared from Fig. 1 to the Hartree dielectric function [2] the variation in
the present finding in the Fermi surface for FCC Ca due to Taylor [31] function is about 64.20%
along [1 0 0], 47.61% along [1 1 0] and 67.02% along [1 1 1] for Model-1. Those variations in
the Fermi surface for Model-2 are about 64.28% along [100], 51.84% along [110] and 66.55%
[1 1 1]. Similarly we can found for the Fermi surface from Fig. 2 for FCC Sr due to T function is
about 71.72% along [1 0 0], 54.67% along [1 1 0] and 74.25% along [1 1 1] for Model-1[28].
Those variations in the Fermi surface for Model-2[29] are about 71.70% along [1 0 0], 59.08%
along [1 1 0] and 74.22% along [1 1 1]. From Fig 3 to the Hartree dielectric functions the
variation in the Fermi surface for BCC Ba due to 63.06% along [1 0 0], 72.31% along [1 1 0] and
158% along [1 1 1] for Model-1, variation in the Fermi surface for Model-2 are about 60.50%
[1 0 0], 65.12%[1 1 0] and 119.12% along [1 1 1]. From Table-2, 3 and Table-4 it is observed
that the Outcome of results computed using the Model-2[29] potential is almost double the

International Journal of Research in Modern Engineering and Emerging Technology (IJRMEET) UGC Approved id_47203
Vol. 5, Sp. Issue: 9, Sept.: 2017 (IJRMEET) ISSN: 2320-6586
112 Online International, Refereed, Impact factor & Indexed Monthly Journal www.raijmr.com
RET Academy for International Journals of Multidisciplinary Research (RAIJMR)
values than those obtained using Model-1[28] potential along with all screening function. Here
the core radius plays a very important role in predicting various properties using the local
pseudopotentials.
Table-2: Radial distribution of the Fermi Surface of Ca (in %)
LFCF Model 100k 110k 111k X Y δ
H M-1 2.2104 -0.1046 -0.2732 2.4836 0.1686 -2.3150
M-2 4.4188 -0.2170 -0.5424 4.9612 0.3254 -4.6358
T M-1 3.6295 -0.1544 -0.4563 4.0858 0.3019 -3.7839
M-2 7.2584 -0.3295 -0.9034 8.1618 0.5739 -7.5879
IU M-1 3.3961 -0.1175 -0.4373 3.8334 0.3198 -3.5136
M-2 6.7913 -0.2601 -0.8642 7.6555 0.6041 -7.0514
F M-1 3.5111 -0.1249 -0.4509 3.9620 0.3260 -3.6360
M-2 7.0215 -0.2751 -0.8912 7.9127 0.6161 -7.2966
S M-1 2.8654 -0.1235 -0.3593 3.2247 0.2358 -2.9889
M-2 5.7296 -0.2618 -0.7120 6.4416 0.4502 -5.9914
HS M-1 2.6433 -0.1142 -0.3312 2.9745 0.2170 -2.7575
M-2 5.2851 -0.2415 -0.6565 5.9416 0.4150 -5.5266
Other -- -- -- -- -- -- --
Table-3: Radial distribution of the Fermi Surface of Sr (in %)
LFCF Model 100k 110k 111k X Y δ
H M-1 2.5357 -0.1220 -0.3125 2.8482 0.1905 -2.6577
M-2 5.0708 -0.2522 -0.6211 5.6919 0.3689 -5.323
T M-1 4.3544 -0.1887 -0.5461 4.9005 0.3574 -4.5431
M-2 8.7111 -0.4012 -1.0821 9.7932 0.6809 -9.1123
IU M-1 4.0470 -0.1408 -0.5210 4.568 0.3802 -4.1878
M-2 8.0958 -0.3108 -1.0301 9.1259 0.7193 -8.4066
F M-1 4.2043 -0.1508 -0.5395 4.7438 0.3887 -4.3551
M-2 8.4108 -0.3314 -1.0669 9.4777 0.7355 -8.7422
S M-1 3.3838 -0.1479 -0.4235 3.8073 0.2756 -3.5317
M-2 6.7686 -0.3128 -0.8397 7.6083 0.5269 -7.0814
HS M-1 3.0872 -0.1349 -0.3862 3.4734 0.2513 -3.2221
M-2 6.1742 -0.2845 -0.7660 2.8482 0.1905 -2.6577
Other -- -- -- -- -- -- --

International Journal of Research in Modern Engineering and Emerging Technology (IJRMEET) UGC Approved id_47203
Vol. 5, Sp. Issue: 9, Sept.: 2017 (IJRMEET) ISSN: 2320-6586
113 Online International, Refereed, Impact factor & Indexed Monthly Journal www.raijmr.com
RET Academy for International Journals of Multidisciplinary Research (RAIJMR)
Table-4: Radial distribution of the Fermi Surface of Ba (in %)
LFCF Model 100k 110k 111k X Y δ
H M-1 0.1083 -0.0975 0.0802 0.0281 -0.1777 -0.2058
M-2 0.2289 -0.2127 0.1438 0.0851 -0.3565 -0.4416
T M-1 0.1766 -0.1680 0.1774 -0.0008 -0.3454 -0.3446
M-2 0.3674 -0.3512 0.3156 0.0518 -0.6668 -0.7186
IU M-1 0.1698 -0.1714 0.2035 -0.0337 -0.3749 -0.3412
M-2 0.3478 -0.3511 0.3053 0.0425 -0.6564 -0.6989
F M-1 0.1750 -0.1758 0.2076 -0.0326 -0.3834 -0.3508
M-2 0.3591 -0.3604 0.3723 -0.0132 -0.7327 -0.7195
S M-1 0.1397 -0.1314 0.1310 0.0087 -0.2624 -0.2711
M-2 0.2918 -0.2778 0.2340 0.0578 -0.5118 -0.5696
HS M-1 0.1261 -0.1208 0.1166 0.0095 -0.2374 -0.2469
M-2 0.2701 -0.2570 0.2088 0.0281 -0.1777 -0.2058
Other -- -- -- -- -- -- --
The quantities X, Y and δ are calculated using the equation 6-8 and calculated values are
displayed in tables along with the available results. X represent the asphericity (%) at [1 0 0]
point relative to [1 1 1]. For the first time we have made here in detail about the asphericity in
the Fermi surface of Ca, Sr and Ba along the [1 0 0], [1 1 0] and [1 1 1] directions. This can be
used as a test for the present local pseudopotentials and other various pseudo-potentials which
have been well established so far. The present approximation for the Fermi surface distortion of
alkaline earth metals might give additional information regarding the trends in the Fermi surface
distortion of the fcc and bcc metals which may be lead to definite relation between the radial
distortion of a nearly spherical surface and the Fourier components of the effective lattice
potential. In the absence of other data and experimental values for present alkaline earth metals
we do not offer any concrete remark at the present, but this results obtained will surely serve as a
good data for further comparison.
Conclusion
Finally it is concluded that for the alkaline earth metals, Ca, Sr and Ba the Fermi surface
distortion is extremely sensitive to the choice of the screening function and it is found from the
present computation that FSD in the Ca, Sr and Ba metals are very similar in nature. Due to lack

International Journal of Research in Modern Engineering and Emerging Technology (IJRMEET) UGC Approved id_47203
Vol. 5, Sp. Issue: 9, Sept.: 2017 (IJRMEET) ISSN: 2320-6586
114 Online International, Refereed, Impact factor & Indexed Monthly Journal www.raijmr.com
RET Academy for International Journals of Multidisciplinary Research (RAIJMR)
of other information and experimental data we do not put any concrete remarks on Fermi surface
of the alkaline earth metals. The different forms of the local field corrections influence heavily
the asphericity in the Fermi surface in all the three regions considered in the present work. This
is also satisfies the self consistency conditions in the compressibility sum rule and the short
range correlation.
Acknowledged
Author PNG acknowledge the support of DST-FIST level-1 and DRS-SAP-I.
References
[1] A. P. Cracknell and K. C. Wong, The Fermi surface, (its concepts, determination and use
in the phys of metals) Cladendon press Oxford (1973).
[2] W. A. Harrison, Pseudopotential in the theory of metals W. A. Benjamin, Inc. (1996).
[3] C. Kittle, Introduction to Solid State Physics,John Wiley and Son, New York (1971).
[4] R. Ahuja, S. Auluck J. M. Wills, O. Eriksson, P. Soderlind, and B. Johansson, Phys. Rev
B,1994, 50, 18 003.
[5] P. N. Gajjar, B. Y. Thakore and A. R. Jani, Solid Stat. Commu.1996, 100, 785.
[6] P. N. Gajjar, B. Y. Thakore, J. S. Luhar and A. R.Jani, Ind. J. Pure & Appl. Phys., 1995
33, 309
[7] M. H. Patel, A. M. Vora, P. N. Gajjar and A. R. Jani, Commun. Theor, Phys.,2002, 38,
365.
[8] G. Jacucci and R Taylor, J. Phys. F: Metal Phys., 1981, 11, 787.
[9] F. S. Ham, Phys. Rev., 1962, 128, 2524.
[10] D. Shohenberg, P.J. Stiles, Proc. Roy. Soc. London, 1964, 281, 62.
[11] M. J. G. Lee,Phys. Rev. B,1971, 4, 673
[12] M. J. G. Lee and V. Heine, Phys. Rev. B, 1971, 5, 3839.
[13] K. O. Okumara and I.M. Templeton,Phil. Mag., 1962, 7, 1239.
[14] J. R. Anderson and A. V. Gold, Phys. Rev. A, 1965, 139, 1459.
[15] T. Schneider and E. Stoll,Phys, Kondens Materie, 1966, 5, 364.
[16] L. Dagens, F. Perrot,Phys. Rev. B, 1973, 8, 1281.
[17] M. Matasura,Phys. Lett. A, 1974, 50, 131.

International Journal of Research in Modern Engineering and Emerging Technology (IJRMEET) UGC Approved id_47203
Vol. 5, Sp. Issue: 9, Sept.: 2017 (IJRMEET) ISSN: 2320-6586
115 Online International, Refereed, Impact factor & Indexed Monthly Journal www.raijmr.com
RET Academy for International Journals of Multidisciplinary Research (RAIJMR)
[18] Shin-Ichi T. Inoue, S. Asano, and J. Yamasta,J. Phys. Soc. Jpn.1971, 30, 1546.
[19] W. Y. Ching, and J. Callaway, Phys. Rev. B, 1973, 9, 5115.
[20] M. Matasura, C. H. Wo and S. Wang, J. Phys. F, 1975, 5, 1849.
[21] D. Jennison,Phys. Rev. B, 1974, 16, 5147.
[22] H. Bross and G. Bohn, Z. Phys. B, 1975, 20, 261.
[23] K. N. Khanna and P. K. Sharma, Phys. Stat. Sol (b), 1978, 88, 809.
[24] K. N. Khanna and P. L. Srivasta, Phys. Stat. Sol (b), 1979, 94, K 169.
[25] S. S. Rajput, R. Prasad, R. M. Singru, W. Trifishauser, A. Eckert G. Kogel, S. Kaprazyk
and A. Bansil, J. Phys,: Condens Matter, 1993, 5, 6149.
[26] H. K. Patel, PhD. thesis, Sardar Patel University,(Vallabh Vidyanagar, India, 1991).
[27] M. H. Patel, PhD. thesis, Sardar Patel University,( Vallabh Vidyanagar, India 2002).
[28] P H Suthar, International conference on condensed matter, 30-31 Oct. 2015,Bikaner,
India, ( AIP Conference Proceeding,USA, 2016) 020599.
[29] P. H. Suthar, B. Y. Thakore, P. N. Gajjar, communication in Physics,2014, 24,135
[30] R. Taylor, J. Phys .F, 1981, 8, 1699.
[31] S. Ichimaru and K. Utsumi, Phys. Rev. B 24 3220 (1981).
[32] B. Farid, V. Heine, G E Engel, I J Robertson, Phys. Rev. B,1993, 48 , 11602.
[33] A Sarkar, D S Sen, H D Roy, Mod. Phys. lett., 1998, 12, 639.
[34] J. Hubbard, Proc. Roy. Soc. London A, 1957, 243, 336.
[35] L. J. Sham, Proc. Roy. Soc. London A, 1965, 283, 33 1965.
[36] D. C. Wallace, Thermodynamics of crystals, New York: John Wiley and Sons, 1972.

International Journal of Research in Modern Engineering and Emerging Technology (IJRMEET) UGC Approved id_47203
Vol. 5, Sp. Issue: 9, Sept.: 2017 (IJRMEET) ISSN: 2320-6586
116 Online International, Refereed, Impact factor & Indexed Monthly Journal www.raijmr.com
RET Academy for International Journals of Multidisciplinary Research (RAIJMR)
Dielectric Properties of Ammonium Dihydrogen Phosphate
(ADP)
Vimal Patel1, S. M. Vyas
2, Piyush Patel
3, Himanshu Pavagadhi
4
1,2,3,4 Department of Physics, School of Sciences, Gujarat University, Ahmedabad-380009.
Mail id: [email protected]
Abstract
Non linear optical phenomenon in material plays a major role in the opto electro
technologies. Ammonium dihydrogen phosphate (ADP) is an excellent inorganic nonlinear
optical material which is used in various instrument applications. In the present work, Pure
ADP powder is used for the characterization at room temperature by the complex relative
dielectric function ε*(ω) =εʹ - jε″ of mixture of ADP with water in molar fraction have been
measured using precision LCR meter in the frequency range 20Hz to 2MHz. The dielectric
properties of the liquid samples are represented in terms of complex relative dielectric
function ε*(ω), conductivity σ*(ω), Refractive Index, Density as well as permeability (εα).
Key Words
NLO, Complex relative dielectric function, conductivity, aqueous solution.
Introduction
Ammonium dihydrogen phosphate (ADP) and potassium dihydrogen phosphate (KDP) is a
nonlinear optical material. Potassium dihydrogen phosphate (KH2P04) and several other
isomorphous salts i.e. potassium dihydrogen arsenate (KH2ASO4), ammonium dihydrogen
phosphate (NH4H2PO4), and ammonium dihydrogen arsenate (NH4H2ASO4) exhibited phase
changes at low temperatures [1]. The group of phosphates isomorphous with the tetragonal
form of NH4H2PO4 (ADP) and NH4HzAsO4 (ADA) provides an opportunity to examine a
structure layout with various combinations of the cationic and anionic groups. In crystal
engineering, the success of controlling various properties of NLO in molecular engineering
from the last few years has prompted better initiative as well as photonic devices have found
more importance because of their capability of carrying information, large storage and high
processing capacity, low cost, etc. All these devices require single crystals or fibres with
nonlinear optical (NLO) properties. This crystal is widely used for electro-optical

International Journal of Research in Modern Engineering and Emerging Technology (IJRMEET) UGC Approved id_47203
Vol. 5, Sp. Issue: 9, Sept.: 2017 (IJRMEET) ISSN: 2320-6586
117 Online International, Refereed, Impact factor & Indexed Monthly Journal www.raijmr.com
RET Academy for International Journals of Multidisciplinary Research (RAIJMR)
applications such as Q- switch for Nd: YAG, Nd: YLF, Ti-sapphire lasers and for acoustic-
optical applications and it is widely used as the second, third and fourth harmonic generator
of Nd: YAG and Nd: YLF lasers. Single crystals of ADP are used for frequency doubling and
tripling of laser system [2-4]. As a representative hydrogen-bonded material, ADP has also
attracted towards relationship between crystal structure and their properties extensive
attention in the investigation of hydrogen bonding behaviors in crystal [5–8]. ADP has been
the subject of a wide variety of investigations compares to last few years. Acceptable studies
have been done on the growth and properties of pure ADP and doped ADP [9-11]. ADP
belongs to tetragonal crystal structure and ADP has unit cell parameters of a = b = 7.510 Å
and c = 7.564 Å [12-14]. The demand for high quality large KDP and ADP single crystals
increases due to their application as frequency conversion crystal in inertial confinement
fusion [15-16]. In this paper we have study the dielectric spectroscopy of binary mixture of
ADP crystal and pure water. In present there is a large interest on the molecular interaction in
the liquid materials, it will provides information to make a comparative dielectric study of the
liquid samples ADP-water mixtures in the frequency range 20Hz to 2MHz and result will be
accurately measured dielectric constant and other evaluated dielectric parameter at constant
temperature. The dielectric properties of material are represented in terms of intensive
quantities i.e. complex relative dielectric function ε*(ω), conductivity σ*(ω).
Materials & Preparation:
ADP materials were of AR grade and the crystal growth process was carried out in aqueous
solution. The calculated amount of ADP was dissolved in double dissolved water. According
to molar fraction the amount of ADP is dissolve in the double distilled water in the range of
0.1 to 0.8 different molar fractions. This solution is used for the study of dielectric
spectroscopy over the frequency range 20Hz to 2MHz.
Result and Discussion
The complex dielectric function ε*(ω) of liquid samples were determined by using precision
LCR meter with four terminal liquid dielectric test fixture used for measurement of
capacitance and resistance in the frequency range 20Hz to 2MHz. The capacitance and
parallel resistance of the dielectric liquid test fixture without samples and with samples were
measured to compensate for a short. The test fixture correction coefficient was also
considered to cancel the effect of stray capacitance during the calculation of the complex

International Journal of Research in Modern Engineering and Emerging Technology (IJRMEET) UGC Approved id_47203
Vol. 5, Sp. Issue: 9, Sept.: 2017 (IJRMEET) ISSN: 2320-6586
118 Online International, Refereed, Impact factor & Indexed Monthly Journal www.raijmr.com
RET Academy for International Journals of Multidisciplinary Research (RAIJMR)
relative dielectric function ε*(ω). The complex relative dielectric function contains two terms
in which first term gives the dielectric constant and it is an important property of the
dielectric materials. The term dielectric constant depends on the frequency of the chemical
structure imperfection of the material, alternating field, temperature and pressure [17]. This
part is basically used for the study of frequency dependence of dielectric constant and
dielectric loss of the liquid samples with different molar fraction of the ADP sample at room
temperature.
(1)
Where CO=Capacitance of air, CP=parallel capacitance with sample, RP=Parallel resistance
with sample, ω=2πf and is the angular frequency, α=correction coefficient of the cell, all
measurements were made at room temperature.
0.0 5.0x10⁴
1.0x10⁵
1.5x10⁵
2.0x10⁵
0.00
7.50x10⁵
1.50x10⁶
2.25x10⁶
3.00x10⁶
0.1 mol
0.2 mol
0.3 mol
0.4 mol
0.5 mol
0.6 mol
0.7 mol
0.8 mol
Die
lec
tric
Co
nsta
nt
Frequency (Hz)
0.0 5.0x10⁵
1.0x10⁶
1.5x10⁶
2.0x10⁶
0.0
2.0x10⁵
4.0x10⁵
6.0x10⁵
8.0x10⁵
1.0x10⁶ 0.1 mol
0.2 mol
0.3 mol
0.4 mol
0.5 mol
0.6 mol
0.7 mol
0.8 mol
Die
lec
tric
Lo
ss
Frequency (Hzs)
Figure 1 (a): Dielectric Constant of liquid of ADP and Figure 1(b): Dielectric Loss of Liquid
of ADP.
The ε*(ω)=εʹ-jεʹʹ is a important quantity with the condition that in the experiment the electric
field is an independent variable and the charge is the dependent one. Considering the charge
as the independent variable, the dielectric constant is shown in figure 1, all mixtures samples
decreases as the frequency increasing from 20Hz to 2MHz. from the figure, dielectric
constant of different molar fraction of ADP in water over a entire frequency range is high in
the low frequency region and decreases gradually with the increases the frequency. This
effect of high dielectric constant at low frequency is due to various polarizations and high
P
P
RCj
C
Cj
00
1)(

International Journal of Research in Modern Engineering and Emerging Technology (IJRMEET) UGC Approved id_47203
Vol. 5, Sp. Issue: 9, Sept.: 2017 (IJRMEET) ISSN: 2320-6586
119 Online International, Refereed, Impact factor & Indexed Monthly Journal www.raijmr.com
RET Academy for International Journals of Multidisciplinary Research (RAIJMR)
value at low frequency is responsible due to electrode polarization and ionic conduction.
Figure 1 (a) show that as the frequency increases value of dielectric constant decreases
because of as the frequency increases the vibration of molecules increases result decreases in
dielectric constant. Figure 2 (b) shows the spectra of dielectric loss with different molar
fraction and the peak at low frequencies in dielectric loss spectra which is used to separate the
bulk material properties depending on electrode polarization and relaxation frequency.
During this electrode polarization, ions are absorbed on the electrode surfaces in the
alternating electric field which involves the charging and discharging of the ions on the
electrode surface [18-19].
Conductivity
Real part and the imaginary part are two part of the complex conductivity *(ω) and its
values can be obtained from the equation 2. Where ε0 (8.854 x 10⁻¹¹
F·m-1
) is free space
dielectric constant.
00 jj (2)
0.0 5.0x10⁵
1.0x10⁶
1.5x10⁶
2.0x10⁶
0
2
4
6
8
10
12
14
Con
duct
ivity
Frequency (Hz)
Figure 3: Real part of conductivity as a function of frequency.
Figure 3 shows the σ′ spectra of the liquid mixture of ADP. This figure shows the linearly
increment upto certain limit in ionic conductivity at low frequency region and this is due to
the increment of number of mobile charge carrier as the molar fraction of the liquid

International Journal of Research in Modern Engineering and Emerging Technology (IJRMEET) UGC Approved id_47203
Vol. 5, Sp. Issue: 9, Sept.: 2017 (IJRMEET) ISSN: 2320-6586
120 Online International, Refereed, Impact factor & Indexed Monthly Journal www.raijmr.com
RET Academy for International Journals of Multidisciplinary Research (RAIJMR)
increases. Spectra show high conductivity at low frequency and as the frequency increases it
become almost saturation.
Refractive Index
The Abbe refractometer is a classic optical instrument which is used to measure the refractive
index of liquids. In order to measure the index, A filtered white light source is used. At the
yellow sodium D line of 589 nm. The refractive index (η) can be calculated using the
equation (3).
=𝐶
𝑉 (3)
Table 1 : various parameter obtain from the experimental data.
Molar Weight(%)
Refractive Index
εα Density (Kg/m3)
0.1 1.339 1.793 1.76
0.2 1.348 1.817 1.80
0.3 1.354 1.834 1.84
0.4 1.367 1.870 1.87
0.5 1.374 1.887 1.91
0.6 1.382 1.910 1.93
0.7 1.389 1.930 1.96
0.8 1.397 1.951 1.99
From the Table 1 we can say that the refractive indices of liquid mixtures are increases as the
molar concentration of mixture increases this is because of as the number of ions increases,
refraction of light also increases. Permeability (εα) can be calculated as the square of
refractive index which is shown in table 1 and increases as the molar fraction of mixtures
increases. pycnometer is used to measure the density of liquid mixtures. Density also
increases as the molar fraction increases. All the measurements were carried out at room
temperature.
Conclusion
This paper gives experimental data for complex relative dielectric function, conductivity,
Refractive index and εα of the mixtures with different molar concentration. Dieletric constant
is high at low frequency but as the frequency increases then it decreases and Dielectric Loss

International Journal of Research in Modern Engineering and Emerging Technology (IJRMEET) UGC Approved id_47203
Vol. 5, Sp. Issue: 9, Sept.: 2017 (IJRMEET) ISSN: 2320-6586
121 Online International, Refereed, Impact factor & Indexed Monthly Journal www.raijmr.com
RET Academy for International Journals of Multidisciplinary Research (RAIJMR)
decreases as the frequency and as molar fraction increases, Conductivity shows increases
linearly as the frequency increases after certain frequencies it becomes constant values. This
analysis shown various dielectric and electric quantity behavior in spectra confirms that this
behavior is governed by the change in molar fraction liquids materials of the ADP and it is
basically used to study the intermolecular of the liquid mixture.
Acknowledgement
The authors are thankful to Department of Science and Technology (DST) and DRS-SAP for
providing experimental facilities. Authors are also thankful to Dr. V. A. Rana for providing
laboratory facilities and Prof. P. N. Gajjar, Head of physics department, school of sciences,
Gujarat University, Ahmedabad for his constant encouragement.
References
1. Georg Busch, "Neue Seignette Elektrika," Helv. Phys. Acta, 1938, 11, No. 3.
2. N. Zaitseva, L.Carman, “Progress in Crystal Growth and Characterization”, 2001, vol.
43, no. 1.6.
3. S. M. Klimentov, S. V Garnov, A. S. Epifanov, A. A Manenkov, “Proceedings of
SPIE” 1994, vol 342, pp-2145.
4. R. Ramirez, J. A Gonzala, “Solid state communications”, 1990, vol. 75, pp 482.
5. D. Xue, S. Zhang, “Physica”, 1999, vol B 262. pp 78.
6. D. Xue, H. Ratajczak, “J. Mol. Struct.”, 2005, vol 716, pp 207.
7. D. Xue, S. Zhang, “Chem. Phys. Lett.”, 1999, vol 301, vol 449.
8. D. Xue, S. Zhang, “J. Phys. Chem. Solids”, 1996, vol. 57, pp 1321.
9. K. Sethuraman, R. R. Babu, R. Gopalakrishnan and P. Ramasamy, “Unidirectional
Growth of(1 1 0) Ammo- nium Dihydrogen Orthophosphate Single Crystal by San-
karanarayanan Ramasamy Method,” Journal of Crystal Growth, 2006, Vol. 294, No.
2, pp. 349-352.
10. S. Nagalingam, S. Vasudevan and P. Ramasamy, “Effect of Impurities on the
Nucleation of ADP from Aqueous Solution,” Crystal Research and Technology,
1981, Vol. 16, No. 6, pp.647-650.
11. R. Ramesh and C. Mahadevan, “Nucleation Studies in Supersaturated Aqueous
Solutions of (NH4)H2PO4 Doped with (NH4)2C2O4·H2O,” Bulletin of Materials
Science, 1998, Vol. 21, No. 4, pp. 287-290.
12. M. E. Lines and A. M. Glass, “Principles and Applica- tions of Ferroelectrics and
Related Materials,” Clarendon Press, Oxford, 1977.
13. N. P. Rajesh, K. Meera, K. Srinivasan, S. Ragavan and P. Ramasamy, “Effect of
EDTA on the Metastable Zone width of ADP,” Journal of Crystal Growth, 2003,Vol.
213, No. 3- 4, pp. 389-394.

International Journal of Research in Modern Engineering and Emerging Technology (IJRMEET) UGC Approved id_47203
Vol. 5, Sp. Issue: 9, Sept.: 2017 (IJRMEET) ISSN: 2320-6586
122 Online International, Refereed, Impact factor & Indexed Monthly Journal www.raijmr.com
RET Academy for International Journals of Multidisciplinary Research (RAIJMR)
14. K. Srinivasan, P. Ramasamy, A. Cantoni and G. Bocelli, “Mixed Crystals of
NH4H2PO4-KH2PO4: Compositional Dependence of Morphology, Microhardness and
Optical Transmittance,” Materials Science and Engineering: B, 1998, Vol. 52, No. 2-
3, pp. 129-133.
15. X. Sun, X. Xu, Z. Gao, Y. Fu, S. Wang, H. Zeng, and Y. Li, J. Cryst. Growth, 2000,
vol. 217, pp. 404.
16. N. Zaitseva, L. Carman, and I. Smolsky, J. Cryst. Growth 241, 363 (2002).
17. Kao K. C., “Dielectric Phenomena in Solids,” Elsevier Academic Press, London,
2004, pp. 54.
18. R. J. Sangwa, S. Sankhla, “Dielectric dispersion study of coexisting phases of
aqueous polymeric solution: Poly(vinyl alcohol)+ Poly (vinyl pyrrolidone) two-
phases system,” j. polymer Science, 2007, vol. 48, no. 9, pp. 2737-2744.
19. N. Shinyashiki, S. Yagihara, I. Arita and S. Mashimo, “Dynamic Study on Dynamic
of Water in Polymer Matrix Studied by a Microwave Dielectric Measurement,”
Journal of Physical Chemistry B, 1998, vol. 102, no. 17, pp. 3249-3251.

International Journal of Research in Modern Engineering and Emerging Technology (IJRMEET) UGC Approved id_47203
Vol. 5, Sp. Issue: 9, Sept.: 2017 (IJRMEET) ISSN: 2320-6586
123 Online International, Refereed, Impact factor & Indexed Monthly Journal www.raijmr.com
RET Academy for International Journals of Multidisciplinary Research (RAIJMR)
Crystal Growth and Etching of InX Bi(2-x)Se3 ( X = 0.05) single
crystal
Himanshu Pavagadhi a, S.M.Vyas
a, Vimal Patel
a, Jaydev Patel
a, M.P.Jani
b, G.R.Pandya
c.
a Department of Physics, School of Science, Gujarat University, Ahmedabad, Gujarat, India.
b Neotech B.Sc college , Vadodara, Gujarat, India.
c Department of Physics, MSU Baroda, Gujarat, India
Email: [email protected]
Abstract
InX Bi(2-x)Se3 crystals were grown by Bridgman method at a growth velocity of 0.5cm/h with
temperature gradient of 650 C/cm in our laboratory. For the structural information about the
InX Bi(2-X)Se3 crystals have been carried by the XRD pattern and composition of material can
be studied by EDAX pattern and using SEM observed crystalline structure. The Parallel
striations perpendicular to the ingot axis are observed on the top free surfaces of crystals
using an optical microscope. A new dislocation etchant based on nitric acid has been found to
give reproducible etch-pitting on the cleavage surface which reveals the freshly dislocations
on the sites. Standard tests for a dislocation etchant have been carried out and results are
reported.
Introduction
Bi2Se3 is a narrow band gap material which has hexagonal structure and it is useful
application in the field of thermoelectric devices as solid state coolers or generators [1–3].
Both n- and p-type Bi2Se3 Single crystals grown by the Bridgman technique is used to make
excellent Hall Effect magnetometers .it can be work in magnetic fields to at least 10 Tesla
and over a wide range of temperature [4]. The thermoelectric figure of merit is high [5] for
Bi2Se3 and Bi2Te3 material. So these materials are useful for thermoelectric energy
conversion. The band gap is very narrow, so it can be used for infrared radiation detectors
[6]. The low temperature peaks found in the Seebeck coefficients in Bi2Se3, materials that
have strong spin orbit coupling and nearby Dirac points [7-10], suggests that these
characteristics may be related. In addition, processing of the microstructure of n- and p-type
Bi2Se3 to reduce the thermal conductivity to the < 1 WK-1 m-1. Bi2Se3, Bi2Te3, and Sb2Te3
are used as 3D topological insulators [11-12]. Many physical phenomena are predicted to
emerge in low dimensional nanostructures of Bi2Se3. [13], ultra-thin Bi2Se3 down to a few

International Journal of Research in Modern Engineering and Emerging Technology (IJRMEET) UGC Approved id_47203
Vol. 5, Sp. Issue: 9, Sept.: 2017 (IJRMEET) ISSN: 2320-6586
124 Online International, Refereed, Impact factor & Indexed Monthly Journal www.raijmr.com
RET Academy for International Journals of Multidisciplinary Research (RAIJMR)
(≤5) nanometers is expected to exhibit topologically non-trivial edge. Recently, preparation
of Bi2Se3 nanostructured materials via wet chemical methods has attracted increasing
attention due to low cost and convenient. Qiu et al [14]. Therefore studies on various
properties of Bi2Se3 are interesting for both basic and applied research. If we crystallize under
proper controlled conditions Bi2Se3 can easily cleavable.
Experimental Details
The stoichiometric amount of In, Bi, and Se each of 5N (99.999%) purity were weighed
accurately up to 10μ gms using a semi micro balance. They were sealed in quartz tube under
a pressure of 10-4
Pa. then the tube was kept horizontal in an alloy mixing furnace at a
temperature of about 775 °C for 48 hr. during which the ampoule was continuously rocked
and rotated for proper mixing and reaction Then the ingot was cooled to room temperature
over a period of 24 hr at a rate of 20 0C/hr. Single crystal InX Bi(2-X)Se3. Grown by Bridgman
method with a temperature gradient of 65 0C/cm and a growth rate of 0.5 cm/hr. The top free
surfaces of the as grown crystal were observed under the optical microscope to exhibit the
growth feature. A crystal was cut at the cleavage plane and used for SEM characterization.
Powder X-ray diffractograms for compounds were analyzed by using Powder X software for
the confirmation of crystal structure and determination of lattice parameters. The
compositions of all the elements present in the grown crystals are determined by energy
dispersive analysis of X-rays (EDAX).The degree of homogeneity was determine by etching
studies. For the study of crystal defect of InX Bi(2-X)Se3 crystal, After numerous trial, the
etchant concentration is 2.5 ml Nitric acid (70% Ar grade) + 10 ml Tartaric acid + 2 ml Water
is found to be good to well define etch pits on a clear background of the sample and the
etching time taken was 10 seconds.
Result & Discussion
Occurrence of parallel striations seems to be a very common phenomenon as far as the crystal
growth of metals, semiconductors, alloys and solid solutions is concerned. For example
STEWART et al. [15], MULLER and WILHELM [16], YIM [17], as well UEDA [18] have
reported such striations on crystals of InSb, BiSb, Ge, etc crystlals. The striations were
explained in terms of variations in speed of solidification resulting due to thermal fluctuations
during crystal growth. The present paper deals with crystallographic study of the parallel
striations and associated characteristic features observed on the top free surface. The

International Journal of Research in Modern Engineering and Emerging Technology (IJRMEET) UGC Approved id_47203
Vol. 5, Sp. Issue: 9, Sept.: 2017 (IJRMEET) ISSN: 2320-6586
125 Online International, Refereed, Impact factor & Indexed Monthly Journal www.raijmr.com
RET Academy for International Journals of Multidisciplinary Research (RAIJMR)
microphotograph in figure typical transverse striations, were found to form an array of
parallel rectilinear lines.
Figure - 1: Parallel Striations observed on freshly cleaved as- grown crystal of InX Bi(2-X)Se3..
The height of these steps equals about 10-20 A0. As was estimated by comparison of their
contrasts on the phase contrast micrographs with the contrast of steps of well known heights
on 111 and 100 potash alum [19].
Figure 2 indicate that the InX Bi(2-X)Se3. As- grown crystals are crystalline and show that the
number of cleavage line is very less so that the perfection of the crystal is more and also
indicates the layer growth mechanism in In: Bi2Se3 single crystal is predominant.
Figure -2: SEM Image of Crystal InX Bi(2-X)Se3.

International Journal of Research in Modern Engineering and Emerging Technology (IJRMEET) UGC Approved id_47203
Vol. 5, Sp. Issue: 9, Sept.: 2017 (IJRMEET) ISSN: 2320-6586
126 Online International, Refereed, Impact factor & Indexed Monthly Journal www.raijmr.com
RET Academy for International Journals of Multidisciplinary Research (RAIJMR)
Fig.3 shows the compositions of all the elements present in the grown crystals are determined
by energy dispersive analysis of X-rays (EDAX). However composition estimated in terms of
wt percentage In = 0.05 %, Bi= 36.52 % Se= 63.43 %.
Figure -3 : EDAX of Crystal InX Bi(2-X)Se3.
Fig.4 shows a typical diffraction pattern recorded with as grown InX Bi(2-X)Se3 single crystal.
There are well resolved peaks with high intensity as well as relatively small intensity. The
structural parameters has been calculated from these data and the obtained values of lattice
parameters are a = 7.535, b = 11.659, c = 3.386 and α = 92.82, ß = 101.17, γ =100.92. The
crystal structure is Triclinic Lattice which is found to match with JCPDS data.
Fig.- 4 : X-Ray Diffraction Pattern of InX Bi(2-X)Se3.

International Journal of Research in Modern Engineering and Emerging Technology (IJRMEET) UGC Approved id_47203
Vol. 5, Sp. Issue: 9, Sept.: 2017 (IJRMEET) ISSN: 2320-6586
127 Online International, Refereed, Impact factor & Indexed Monthly Journal www.raijmr.com
RET Academy for International Journals of Multidisciplinary Research (RAIJMR)
For the study of crystal defect in InX Bi(2-X)Se3. Crystal, after numerous trials, the etchant
concentration is 2.5 ml Nitric acid (70% Ar grade) + 10 ml Tartaric acid + 2 ml Water. This
mixture is capable of producing well defined triangular etchpits. The etching time taken is 10
seconds.
Figure - 5: Etching photograph of Crystal InX Bi(2-X)Se3.
The indices of the planes of the etch pits are determined stereographically. The edges of the
triangular etch pits are in < 110> direction and there planes of point bottomed etch pits
developed on etching are parallel to 111 sleep planes. Further a specimen was pin-indented
on its cleavage plane and subsequently etched. Rosettes of etch pits around the indentation
mark were observed as an etching result indicating that the etchant can reveal freshly
introduced dislocations as well. The fact discussed above indicates that the newly developed
etchant by the authors is a good dislocation etchant. The average dislocation density of the
crystals as measured by the etch-pit count method was found to be 6.2 * 10-4
cm -2
on an
average.
Conclusion:
Parallel striation observed on top free surface of the as grown crystals and from The SEM
characterization of these crystals indicates the layer growth mechanism is predominant. X-ray
diffractograms of InX Bi(2-X)Se3 are indexed indicate the triclinic structure with lattice
parameters are a = 7.535, b = 11.659, c = 3.386 and α = 92.82, ß = 101.17, γ =100.92 its
cleaved along (ı ı ı) plane. From the EDAX characterization, the percentage of InX Bi(2-X)Se3.
Components in the crystal which are In = 0.05 %, Bi= 36.52 % Se= 63.43 %. An etchant

International Journal of Research in Modern Engineering and Emerging Technology (IJRMEET) UGC Approved id_47203
Vol. 5, Sp. Issue: 9, Sept.: 2017 (IJRMEET) ISSN: 2320-6586
128 Online International, Refereed, Impact factor & Indexed Monthly Journal www.raijmr.com
RET Academy for International Journals of Multidisciplinary Research (RAIJMR)
developed by the author is capable of revealing dislocations intersecting the cleaveage plan of
the material.
Acknowledgment
The authors are thankful to Department of Science and Technology (DST) and DRS-SAP for
providing experimental facilities. Authors are also thankful Prof. P. N. Gajjar, Head of
physics department, school of sciences, Gujarat University, Ahmedabad for his constant
encouragement
References
1. S. Augustine and E. Mathai,Mater. Res. Bull.,36,(2001),
2. U. Birkholz,Amorphe und Polykristalline Halblein( Springer, Berlin, 1984).
3. D.M.Rowe,CRC Handbook of thermoelectrics(Chemical rubber, Boca Raton, FL.1995).
4. J.A.Woollan, I.L.Spail, “property of crystal Bi2Se3 and its use as a Hall effect Magnetometer
“ NASA” Technical Note Tn D 7057 , Nov 1972.
5. Champness, C. H.; Muir, W. B.; and Chiang, P. T.: Thermoelectric Properties of n-Type
BigTeg-BigSeg Alloys. Can. J. Physics, vol. 45, no. 11, Nov. 1967, pp -3611-3626.
6. Harman, T. C.: The Physics of Semimetals and Narrow Band-Gap Semiconductors.
7. L. Fu and C.L. Kane, Phys. Rev. B 76 045302 (2007).
8. S. Murakami, New J. Phys. 9 356 (2007).
9. Y. Xia, L. Wray, D. Qian, D. Hsieh, A. Pal, H. Lin, A. Bansil, D. Grauer, Y. S. Hor, R. J.
Cava, and M.Z. Hasan, arXiv:0812.2078 (2008).
10. Haijun Zhang, Chao-Xing Liu, Xiao-Liang Qi, Xi Dai, Zhong Fang, Shou-Cheng Zhang,
arXiv: 0812.1622 (2008).
11. Hsieh, D.; Qian, D.; Wray, L.; Xia, Y.; Hor, Y. S.; Cava, R. J.; Hasan, M. Z. Nature 2008,
452, pp- 970-974.
12. Chen, Y. L.; Analytis, J. G.; Chu, J.; Liu, Z. K.; Mo, S.; Qi, X. L.; Zhang, H. J.; Lu, D. H.;
Dai, X.; Fang, Z.;Zhang, S. C.; Fisher, I. R.; Hussain, Z.; Shen, Z. Science 2009, 325, pp-
178-181.
13. Liu, C.; Zhang, H.; Yan, B.; Qi, X.; Frauenheim, T.; Dai, X.; Fang, Z.; Zhang, S. Phys. Rev.
B 2010, 81, 041307.
14. Qiu XF, Zhu JJ, Pu L, Shi Y, Zheng YD, Chen HY. Sizecontrollable sonochemical synthesis
of thermoelectric material of Bi2Se3 nanocrystals. Inorg Chem Commun 2004; 7: pp-319-21.
15. STEWART.M.T. et al. ;phys.Rev.83 (1951), pp- 657.
16. MULLER.A.,WILHELM.W. :Natureforsch. (germany) 19a (1964), pp- 254.
17. YIM.W.M. : Trans. AIME 236 (1966), pp- 474.

International Journal of Research in Modern Engineering and Emerging Technology (IJRMEET) UGC Approved id_47203
Vol. 5, Sp. Issue: 9, Sept.: 2017 (IJRMEET) ISSN: 2320-6586
129 Online International, Refereed, Impact factor & Indexed Monthly Journal www.raijmr.com
RET Academy for International Journals of Multidisciplinary Research (RAIJMR)
18. UEDA.H. : j.Phys. Soc. Japan 16 (1956), pp- 61.
19. Fang lang Hsu : J. Chin Inst. Eng> Taiwan : 12, (1989), pp-755.

International Journal of Research in Modern Engineering and Emerging Technology (IJRMEET) UGC Approved id_47203
Vol. 5, Sp. Issue: 9, Sept.: 2017 (IJRMEET) ISSN: 2320-6586
130 Online International, Refereed, Impact factor & Indexed Monthly Journal www.raijmr.com
RET Academy for International Journals of Multidisciplinary Research (RAIJMR)
Study of Tin Selenide Nanoparticles Prepared by Two
Different Methods
R.J.Parmar1, V. R.Solanki
2, R. J.Pathak
2, M. D.Parmar
3, K.D.Patel
4
1*Department of Physics, Sheth M.N. Science College, Patan, Gujarat, India
2R.R. Mehta College of Science& C.L. Parikh College of Commerce, Palanpur, Gujarat, India 3M.N. Science College, Visnagar, Gujarat, India
4Physics Department, S.P. University, V.V. Nagar, Anand, Gujarat, India
Corresponding author e-mail:[email protected]
Abstract
In present paper structural properties of SnSe nanoparticles prepared by two different methods is
reported. It is one of the promising materials from its applications. SnSe powder has been
prepared by using two methods, first chemical precipitation method and second one is Chemical
Bath method in deionized water. The prepared samples were investigated for structural
characterization by XRD. The X-ray diffraction studies of the particles show the polycrystalline
nature with orthorhombic crystal structure. Micro- structural parameters such as crystalline size,
dislocation density and microstrain were calculated with respect to different method.
Key words:SnSe nanoparticles, aqueous solution method, Chemical Bath Method, X-Ray Diffraction.
INTRODUCTION
Tin Selenide (SnSe), a member of group IV-VI semiconductors is one of the promising materials
from its applications. Tin Selenide (SnSe) is an exciting semiconductor compounds that are
broadly used as holographic recording systems, optical and optoelectronic materials in infrared
electronic and memory switching devices and in photoelectrical cells [1-4].Lots of investigators
have been involved in the study of nanocrystals because of their special properties like electric,
optoelectric and magnetic [5, 6].SnSe nanoparticles were synthesized by several methods like
solid – state reaction, state metathesis, Bridgman method, self – propagating high temperature
synthesis, brush plating technique [7-11]. These methods have some limitations like the
requirement of a special device and high temperature. Recently, solution routes, such as
hydrothermal, solvothermal, and organ metallic precursor methods have been developed for the
Synthesis of SnSe [12-14].In this reported work we have used two methods chemical
precipitation method and chemical bath method, it’ svery easy technique and it does not require
any special sophisticated equipment. It is a time-consuming process, which facilitates a better

International Journal of Research in Modern Engineering and Emerging Technology (IJRMEET) UGC Approved id_47203
Vol. 5, Sp. Issue: 9, Sept.: 2017 (IJRMEET) ISSN: 2320-6586
131 Online International, Refereed, Impact factor & Indexed Monthly Journal www.raijmr.com
RET Academy for International Journals of Multidisciplinary Research (RAIJMR)
orientation of the crystallites with an improved grain structure, depending on the deposition
situation. Present paper reports the preparation and structural study of the tin selenide powder
obtained by different chemical route.
EXPERIMENTAL DETAILS:
(1) Chemical Precipitation Method:
For the growth of SnSe nanoparticles all the chemicals were of AR grade with 99.99%
purity from Lobal Chemie. Tin chloride and selenium oxide used as precursors of Sn+2
and Se-2
ions in the reaction system. The SnCl2 and SeO2 solutions were mixed for 30 minutes using a
magnetic stirrer by drop wise and as a result precipitations of SnSe were obtained in a solution.
This precipitation is separated by filtering method. Finally separated SnSe nanoparticles were
washed by water and ethanol several times and kept at 100°c for one hour for obtaining dry
powder of SnSe nanoparticles.
(2) Chemical Bath Method
Tin chloride and Sodium selenosulphate used as precursors of Sn+2
and Se-2
ions in the
reaction system. For Sodium selenosulphate, 9.48gm of sodium sulfite in 120 ml water was
refluxed with 2.36gm of selenium for almost 8 hour. It was sealed and kept overnight. It was
then filtered to obtain clear solution. It is recommended to make small volume of
selenosulphate stock solution to be used within 3-4 day.
Sodium hydroxide (1M) solution in deionized water. This solution is used to maintain alkaline
media of PH at about 12.2. In a 100ml beaker 0.95gm of tin chloride in 10ml water is placed
and sodium hydroxide is added drop wise to obtain an alkaline media of PH 12.2. Then 10ml
of sodium selenosulphate solution is introduced into the beaker for the time of 1hours in the
bath. Then filtration and finally dried in hot bath, from the residue solution. This solid phase
(Powder) consist of SnSeNanocrystals.
Figure 1.Photograph of synthesized SnSe nanoparticles
From Chemical Bath Method
Figure 2.Photograph of synthesized SnSe nanoparticles
From Chemical Precipitation Method

International Journal of Research in Modern Engineering and Emerging Technology (IJRMEET) UGC Approved id_47203
Vol. 5, Sp. Issue: 9, Sept.: 2017 (IJRMEET) ISSN: 2320-6586
132 Online International, Refereed, Impact factor & Indexed Monthly Journal www.raijmr.com
RET Academy for International Journals of Multidisciplinary Research (RAIJMR)
RESULTS AND DISCUSSION:
XRD: (Chemical Precipitation Method)
The X-Ray diffraction pattern exhibit peaks at 26.86°, 37.33° and 50.76° corresponding to the
(210), (401) and (221) planes. All these peaks correspond to the orthorhombic phase. The lattice
parameter value a, b and c have been calculated and are found to be a = 11.50Å, b = 4.15Å and c
= 4.44Å which are in good agreement with other research papers [6, 12, 15].
Figure 3
XRD Pattern of prepared SnSe nanoparticles From Chemical Precipitation Method
XRD: (Chemical Bath Method)
The X-Ray diffraction pattern exhibit peaks at 23.56°,29.77° and 51.80° corresponding to the
(300), (111) and (402) planes. All these peaks correspond to the orthorhombic phase. The lattice
parameter value a, b and c have been calculated and are found to be a=11.42Å, b=4.19Å and
c=4.46Å which are in good agreement with other research papers [2, 4, 8].
Figure 4
XRD Pattern of prepared SnSe nanoparticles From Chemical Bath Method

International Journal of Research in Modern Engineering and Emerging Technology (IJRMEET) UGC Approved id_47203
Vol. 5, Sp. Issue: 9, Sept.: 2017 (IJRMEET) ISSN: 2320-6586
133 Online International, Refereed, Impact factor & Indexed Monthly Journal www.raijmr.com
RET Academy for International Journals of Multidisciplinary Research (RAIJMR)
The average size of particles has been obtained from the X-ray diffraction pattern using the
Scherrer’s formula[15].
𝐷 = 𝐾𝜆
𝛽 cos𝜃
Where D is the grain size, K is a constant taken to be 0.94, wavelength of X-ray (1.5406Å), 𝛽 is
the full width half maximum (FWHM), 𝜃 is the diffraction angle. The obtained average
crystalline size SnSenanoparticles from Chemical Precipitation Methodis9.88 nm.&Chemical
Bath Method is2.63nm.
Using crystalline size values, the dislocation density (𝛿), defined as the length of dislocation
lines per unit volume of the crystal was calculated using Willianson and Smallman’s
formula.[16]
𝛿=1/D2
The obtained values of the dislocation density (𝛿) from Chemical Precipitation Methodis 0.0102
(Lin·nm-2
) &Chemical Bath Method is 0.1445 (Lin·nm-2
). This clearly indicates that increasing
the crystalline size and reducing the dislocation density making it a potential candidate for
optoelectronic devices.
The micro strain can be obtained by using the relation
휀 =𝛽 cos 𝜃
4
Table:1Structural parameter of SnSe Nanoparticles from Chemical Precipitation Method.
Plane
(hkl)
Inter planar
spacing, d
(nm)
FWHM
(degrees)
Crystalline size
D (nm)
Dislocation
density 𝛿
(Lines/m2 )
Micro strain
휀
(210) 3.3160 0.9500 2.3817 0.1766 0.1520
Table:2Structuralparameter of SnSe Nanoparticles from Chemical Bath Method.
Plane
(hkl)
Inter planar
spacing, d
(nm)
FWHM
(degrees)
Crystalline size
D (nm)
Dislocation
density 𝛿
(Lines/m2 )
Micro strain
휀
(210) 3.3207 1.6200 1.3546 0.5494 0.2673

International Journal of Research in Modern Engineering and Emerging Technology (IJRMEET) UGC Approved id_47203
Vol. 5, Sp. Issue: 9, Sept.: 2017 (IJRMEET) ISSN: 2320-6586
134 Online International, Refereed, Impact factor & Indexed Monthly Journal www.raijmr.com
RET Academy for International Journals of Multidisciplinary Research (RAIJMR)
CONCLUSION
In this study, two different chemical routes for Tin selenide have been described. The Chemical
Bath method is time consuming and took too much time to compare Chemical Precipitation
method. From Chemical bath method we find black SnSe nanoparticles and from Chemical
precipitation method particles are saffron color. The SnSe Nanoparticles from Chemical Bath
Method had smaller crystalline size (~ 2 nm) as compared to the one prepared from Chemical
Precipitation Method(~ 9 nm). The crystalline sizes were examined by XRD. The X-ray
diffraction studies of the Nanoparticles show the polycrystalline nature with orthorhombic
crystal structure.
REFERENCES
[1] N. R. Mathews, 2011, Electrodeposited tin selenide thin films for photovoltaic applications,
Solar Energy, In press.
[2] J. F. Suyver, R. Bakker, A. Meijerink, J. J. Kelly, Phys. Stat. Sol. (b), 224, pp. 307-312,
(2001).
[3] D. L. Kelin, R. Roth, A. K. L. Lim, A. P. Alivisatos, P. L. McEuen, Nature, 389, pp. 699-701,
(1997).
[4] K. R. Murali, V. Swaminathan, D. C. Trivedi, 81, pp. 113-118, (2004).
[5] Zulkarnain Zainal, Saravanan Nagalingam, Anuarkassim, Mohd Zobir Hussein, Wan
Mahmood Mat Yunus, Solar Energy Materials & Solar Cells, 81, pp. 261-268, (2004).
[6] K. Zweibel, Solar Energy Mater. Solar Cells, 63, pp. 375-386, (2000).
[7].L. Seligson and J. Arnold, J. Amer. Chem. Soc., 115, 8214-8220 (1993)
[8]. Bhatt V.P., Giresan K. and Pandya G.R., J. Crystal Growth, 96, 649-651 (1989)
[9]. Yi H. and Moore J.J., J. Mater. Sci., 25, 1159-1168 (1990)
[10]. Parkin I.P., Chem. Soc. Rev., 25, 199-207 (1996)
[11]. Subramanian B., Sanjeeviraja C. and Jayachandran M., J. Crystal Growth, 234, 421-426
(2002)
[12]. Wang W., Geng Y., Qian Y., Wang C. and Liu X., Mater. Res. Bull., 34, 403-406 (1999)
[13]. B. Li, Y. Xie, J. Huang and Y. Qian, Inorg. Chem., 39, 2061-2064 (2000)
[14]. G. Henshaw, I .Parkin and G. Shaw, J. Chem. Soc. Chem. Commun., 10, 1095-1096 (1996)
20
[15].ZiaulRaza Khan, M. Zulfequar, Mohd. Shahid Khan, Chalcogenide Letters, 7, 431-438
(2010).
[16]. G.K. Williamson and R. E. Smallman, 1956, III. Dislocation Densities in some annealed
and cold-worked metals from measurements on the X-ray Debye- Scherrer spectrum, Philos.
Mag., 1(1), 3445.

International Journal of Research in Modern Engineering and Emerging Technology (IJRMEET) UGC Approved id_47203
Vol. 5, Sp. Issue: 9, Sept.: 2017 (IJRMEET) ISSN: 2320-6586
135 Online International, Refereed, Impact factor & Indexed Monthly Journal www.raijmr.com
RET Academy for International Journals of Multidisciplinary Research (RAIJMR)
Effect of Deposition Temperature on Structural Properties of
Chemically Deposited SnSe Thin Films
V. R.Solanki
1, R.J.Parmar
2, R. J.Pathak
1, M. D.Parmar
3, K.D.Patel
4
1R.R.Mehta College of Science & C. L. Parikh College of Commerce, Palanpur, Gujarat, India 2Department of Physics, Sheth M. N. Science College, Patan, Gujarat, India
3M.N. Science College, Visnagar, Gujarat, India
4Physics Department, S.P. University, V.V. Nagar, Anand, Gujarat, India
Corresponding author e-mail:[email protected]
Abstract
Recently there has been a large amount of interest on the preparation and characterization of
semiconducting materials, mainly SnSe due to its potential applications in various fields. Tin
Selenide (SnSe) is an important IV-VI semiconductor material. Tin Selenide (SnSe) thin films have
been prepared successfully using chemical bath deposition method with different temperature in
deionizer water. The prepared samples were investigated for structural characterization by XRD.
The X-ray diffraction studies of the films show the polycrystalline nature with orthorhombic crystal
structure. Micro structural parameters such as crystalline size, dislocation density and micro strain
were calculated.
Key words: SnSe thin films, Chemical Bath Deposition method, XRD.
INTRODUCTION
Recently the search for thin film materials for solar energy conversion and other related
applications have been identified. Metalchalcogenide materials have shown somewhat better
performance when compared to others. Along with the important binary semiconductors of IV-VI
group, the chalcogenides formed with Sn, especially SnSe have attracted considerable attention in
recent years. SnSe has an orthorhombic crystal structure and studied in the form of both single
crystals and thin films. It’s having paying attention budding interest owing their significant unique
properties. SnSe thin films have been used as light emitting diodes or laser diodes, memory
switching devices, and infrared production and detention [1-6].
For the deposition of thin films of SnSe, various methods like spray pyrolysis, electro-deposition,
chemical vapor deposition, magnetron sputtering, successive ionic layer adsorption and reaction
(SILAR), vacuum evaporation, brush plating, microwave assisted chemical deposition and
chemical bath deposition (CBD) have been employed [7-15]. Among these methods CBD is
relatively simple, more rapid and inexpensive method suitable for deposition on large substrates
irrespective of the shape and morphology of substrates nearly at room temperature. Present paper

International Journal of Research in Modern Engineering and Emerging Technology (IJRMEET) UGC Approved id_47203
Vol. 5, Sp. Issue: 9, Sept.: 2017 (IJRMEET) ISSN: 2320-6586
136 Online International, Refereed, Impact factor & Indexed Monthly Journal www.raijmr.com
RET Academy for International Journals of Multidisciplinary Research (RAIJMR)
reports the preparation and morphological study of the tin selenide thin films obtained by chemical
bath deposition method with different temperature.
EXPERIMENTAL DETAILS:
Chemical Bath Deposition Method:
In this method all the chemicals used were of AR grade. (99.99% purity,Alpha essar).Tin chloride
and Sodium seleno sulphate used as precursors of sn+2
and se -2
ions in the reaction system. To
prepare the stock Sodium seleno sulphate solution, 9.48gm of sodium sulfite in 120 ml water was
refluxed with 2.36gm of selenium for almost 8 hours. The mixture remained under constant stirring
throughout the reflux process seleno sulphate is produced according to the following reaction.
Na2SO3 + Se →Na2SeSO3
Unreacted selenium is filtered off and seleno sulphate solution is placed in air tight bottle. It is
recommended to make small volume of seleno sulphate stock solution to be used within 3-4 days.
Sodium hydroxide (1M) solution in deionized water is used to maintain alkaline media of PH at
about 12.03. In a 100ml beaker 0.95gm of tin chloride in 10ml water is placed and sodium
hydroxide is added drop wise to obtain an alkaline media of PH 12.03. Then 10ml of sodium
selenosulphate solution is introduced into the beaker and substrates are mounted vertically in the
bath. The film growth was carried out at 40ºC&50ºC. A dark brown precipitate gradually fills the
bath and turns black after 20 min. During deposition period the beaker was kept undisturbed for a
time period of 1 hour. We got two films for different temperature.
Fig. 1 Experimental set up for CBD
Fig. 2 Water Bath for CBD

International Journal of Research in Modern Engineering and Emerging Technology (IJRMEET) UGC Approved id_47203
Vol. 5, Sp. Issue: 9, Sept.: 2017 (IJRMEET) ISSN: 2320-6586
137 Online International, Refereed, Impact factor & Indexed Monthly Journal www.raijmr.com
RET Academy for International Journals of Multidisciplinary Research (RAIJMR)
RESULTS AND DISCUSSION
XRD:
The X-Ray diffraction pattern of SnSe nanoparticles prepared by chemical bath deposition method
with different temperature is shown in figure 3. The X-Ray diffraction pattern for at 40ºC
temperature shows 20 to 90.49 2𝜃values and it gives total 127 experimental peaks. Total 91
matching lines are found. The X-Ray diffraction pattern for at 50ºC temperature shows 20 to 90.49
2𝜃values and it gives total 66 experimental peaks. Total 55 matching lines are found. The X-Ray
diffraction pattern for both patterns confirms orthorhombic structure. For both graphs the lattice
parameter values a, b and c have been calculated and are found to be a=11.38Å, b=4.18Å and
c=4.42Å which are in good agreement with other reported paper [6, 8, 16].
Fig. 3 SnSe thin films XRD pattern for at 40ºC temperature.
Fig. 4SnSethinfilms XRD pattern for at 50ºC temperature.

International Journal of Research in Modern Engineering and Emerging Technology (IJRMEET) UGC Approved id_47203
Vol. 5, Sp. Issue: 9, Sept.: 2017 (IJRMEET) ISSN: 2320-6586
138 Online International, Refereed, Impact factor & Indexed Monthly Journal www.raijmr.com
RET Academy for International Journals of Multidisciplinary Research (RAIJMR)
The average crystalline sizes or grain sizes were estimated from the X-ray diffraction pattern using
the Scherrer’s formula [16].
Where D is the grain size, K is a constant taken to be 0.94, wavelength of X-ray (1.5406Ǻ), is the
full width half maximum (FWHM), is the diffraction angle. The obtained average crystalline size
for 40ºC temperature is 5.98 nm&for 50ºC temperature is 4.60nm.
Using Crystalline size values, the dislocation density (𝛿), defined as the length of dislocation lines
per unit volume of the crystal was calculated using Willianson and Smallman’s formula [17].
𝛿=1/D2
This clearly indicates that increasing the crystalline size and reducing the dislocation density making it a potential candidate for optoelectronic devices.
The microstrain can be using the relation
Table:1 Structural Parameters of SnSe Thin Films Prepared at 40ºC Temperature.
Plane (hkl)
Inter planar
spacing, d
(nm)
FWHM
(degrees)
Crystalline
size D (nm)
Dislocation
density
(Lines/m
Micro strain
310 2.8241 0.3019 4.8932 0.04176 0.0739
220 1.9728 0.4529 7.0780 0.0199 0.0511
Table: 2Structural Parameters of SnSe Thin Films Prepared at 50ºC Temperature.
Plane (hkl)
Inter planar
spacing, d
(nm)
FWHM
(degrees)
Crystalline
size D (nm)
Dislocation
density
(Lines/m
Micro strain
310 2.7788 0.4529 3.4504 0.0839 0.1049
220 1.9736 0.4529 5.7530 0.0302 0.0629

International Journal of Research in Modern Engineering and Emerging Technology (IJRMEET) UGC Approved id_47203
Vol. 5, Sp. Issue: 9, Sept.: 2017 (IJRMEET) ISSN: 2320-6586
139 Online International, Refereed, Impact factor & Indexed Monthly Journal www.raijmr.com
RET Academy for International Journals of Multidisciplinary Research (RAIJMR)
CONCLUSION
SnSe thin films were prepared by chemical bath deposition methods at 40ºC & 50ºC temperature. The SnSe thin film prepared at 50ºCtemperature had smaller crystalline size (~ 4.60 nm) as compared to the one prepared at 40ºCtemperature (~ 5.98 nm). The crystalline sizes were examined by XRD. The X-ray diffraction studies of the films show the polycrystalline nature with orthorhombic crystal structure.
REFERENCES
[1] N. R. Mathews, 2011, Electrodeposited tin selenide thin films for photovoltaic applications,
Solar Energy, In press.
[2] J. F. Suyver, R. Bakker, A. Meijerink, J. J. Kelly, Phys. Stat. Sol. (b), 224, pp. 307-312, (2001).
[3] D. L. Kelin, R. Roth, A. K. L. Lim, A. P. Alivisatos, P. L. McEuen, Nature, 389, pp. 699-701,
(1997).
[4] K. R. Murali, V. Swaminathan, D. C. Trivedi, 81, pp. 113-118, (2004).
[5] Zulkarnain Zainal, Saravanan Nagalingam, Anuarkassim, Mohd Zobir Hussein, Wan
Mahmood Mat Yunus, Solar Energy Materials & Solar Cells, 81, pp. 261-268, (2004).
[6] K. Zweibel, Solar Energy Mater. Solar Cells, 63, pp. 375-386, (2000).
[7] Z. Zainal, N. Saravanan, K. Anuar, M. Z. Hussein and W. M. M. Yunus, 2004, Chemical bath
deposition of tin selenide thin films, Mater.Sci.Eng.B, 107(2), 181-185.
[8] V. E. Drozd, I. O. Nikiforova, V. B. Bogevolnov, A. M. Yafyasov, E. O. Filatova and D.
Papazoglou, 2009, ALD synthesis of SnSe layers and nanostructures, J.Phys. D, 42, 125306-
125310.
[9] D. P. Padiyan, A. Marikani and K. R. Murali, 2000, Electrical and photoelectrical properties of
vacuum deposited SnSe thin films, Cryst.Res.Technol, 35(8), 949-957.
[10] N. Kumar, V. Sharma, U. Parihar, R. Sachdeva, N. Padha and C. J. Panchal, 2011, Structure,
optical and electrical characterization of Tin selenide thin films deposited at room temperature
using thermal evaporation method, J. Nano- Electron.Phys., 3(1), 117-126.
[11] J. P. Singh and R. K. Bedi, 1990, Tin selenide films grown by hot wall epitaxy, J. Appl. Phys.,
68, 2776-2779.
[12] G. H. Chandra, J. Naveen Kumara, N. M. Raob, and S. Uthanna, 2007, Preparation and
characterization of flash evaporated tin selenide thin films, J. Cryst. Growth., 306, 68-74.
[13] N. Kumar, V. Sharma, N. Padha, N. M. Shah, M. S. Desai, C. J. Panchal and I. Yu. Protsenko,
2010, Influence of the substrate temperature on the structural, optical, and electrical properties of
tin selenide thin films deposited by thermal evaporation method, Cryst. Res. Technol., 45(1), 53-58.
[14] Z. Zainal, N. Saravanan, K. Anuar, M. Z. Hussein and W. M. M. Yunus, 2003, Tin Selenide
thin films prepared through combination of chemical precipitation and vacuum evaporation
technique, Mater.Sci., 21(2), 225-233.
[15] Z. Zainal, N. Saravanan, K. Anuar, M. Z. Hussein and W. M. M. Yunus, 2003, Tin Selenide
thin films prepared through combination of chemical precipitation and vacuum evaporation
technique, Mater.Sci., 21(2), 225-233.
[16]ZiaulRaza Khan, M. Zulfequar, Mohd. Shahid Khan, Chalcogenide Letters, 7, 431-438 (2010).

International Journal of Research in Modern Engineering and Emerging Technology (IJRMEET) UGC Approved id_47203
Vol. 5, Sp. Issue: 9, Sept.: 2017 (IJRMEET) ISSN: 2320-6586
140 Online International, Refereed, Impact factor & Indexed Monthly Journal www.raijmr.com
RET Academy for International Journals of Multidisciplinary Research (RAIJMR)
[17] G.K. Williamson and R. E. Smallman, 1956, III.Dislocation Densities in some annealed and
cold-worked metals from measurements on the X-ray Debye- Scherrer spectrum, Philos. Mag.,
1(1), 3445.

International Journal of Research in Modern Engineering and Emerging Technology (IJRMEET) UGC Approved id_47203
Vol. 5, Sp. Issue: 9, Sept.: 2017 (IJRMEET) ISSN: 2320-6586
141 Online International, Refereed, Impact factor & Indexed Monthly Journal www.raijmr.com
RET Academy for International Journals of Multidisciplinary Research (RAIJMR)
Synthesis, characterization and functionalization of multi-walled
carbon nanotubes by chemical vapour deposition method
Parth Joshi1, Dimple shah
2 and Pooja Kalaria
2
1Department of Physics, Uka Tarsadia University, Bardoli, Gujarat-394350
2Applied Physics Department, Sardar Vallabhbhai National Institute of Technology, Surat-395007
Corresponding Author* - [email protected]
Abstract
In this paper, multi-walled carbon nanotubes synthesized by chemical vapour deposition
methods. To obtained carbon nanotubes has functionalization with carboxylic and groups. The
exhibit of groups on the carbon nanotubes has been characterization by XRD, FT-IR and TEM.
The X-ray differaction pattern at the angle (2θ) of 26.5𝑜 can be indexed as the (002) reflection of
hexagonal graphite structure. The formation of the carboxylic group in the grafting reaction has
been confirmed by FT-IR spectroscopy. The transmission electron microscopy study of pristine
CNTs is inner length 10 nm, The result indicates that the further grafting is successful. The
functionalized carbon nanotubes can be a new versatile platform for many interesting
applications.
Keywords: Carbon nanotubes, functionalization, carboxylic groups.
Introduction
Carbon Nanotubes(CNTs), long, thin cylinders of carbon, were discovered in 1991 by Sumio
Iijima. It is unique for their size, shape, and remarkable physical and mechanical properties.
Nowadays, MWNTs and SWNTs are produced mainly by three techniques: arc-discharge, laser-
ablation, and catalytic growth.[1] However, synthesizing CNTs remains costly and difficult due
to the high temperatures (around 500°C) and pressures required. Here we report on a chemical
vapour deposition method which allows us to prepare CNTs. CVD is one of the slower methods
of nanotube growth but affords a greater control over the tubes that are grown through the
process. By selecting different process gases, a researcher can control whether CVD produces
single or multi-walled tubes. These process gasses – methane and ethylene – are very stable at
the temperatures in the furnace, typically 600 to 1200 degrees Celsius. Due to gasses’ high
molecular stability, they only decompose at catalyst sites, reducing the amount of amorphous

International Journal of Research in Modern Engineering and Emerging Technology (IJRMEET) UGC Approved id_47203
Vol. 5, Sp. Issue: 9, Sept.: 2017 (IJRMEET) ISSN: 2320-6586
142 Online International, Refereed, Impact factor & Indexed Monthly Journal www.raijmr.com
RET Academy for International Journals of Multidisciplinary Research (RAIJMR)
carbon generated during CVD. Decomposed carbon molecules then assemble themselves into
nanotubes at the catalyst nano-particle sites. Using lithography, scientists can control the location
of nanotube growth by seeding a substrate with catalyst nano-particles.They can also form
nanotubes at an electrical connection, or at a site of physical significance such as a line etched in
the silicon substrate. [2]. Since CNTs tend to agglomerate, serious dispersion problems must be
solved. In order to realize the many potential applications that CNTs can offer, the chemical
functionalization of CNTs is of fundamental importance. Introduction of functional groups, such
as carboxyl and amino groups, not only can improve CNTs solubility in various solvents, but
also are useful for the further chemical link with other compounds, such as inorganic compound
[3], biomolecules[4] and polymers [5] and the CNTs self-assembly into devices structures [6].
Various functional groups attached to CNTs are possible via oxidation withconcentrated acids
[7], cycloaddition [8], arylation [9], diazonium salt chemistry [10–12] and other reactions [13–
15]. Applications in compound materials, electronic QC devices, nano sensors or as gas storage
material are intensively explored. All these potential applications require an extended
functionalization of the nanotubes to make them processable and to tune their properties. [16]
Materials and Methods
Materials and solvents
In present study, attempts were made to synthesize carbon nanotubes using xylene as
carbonaceous precursors and Ferrocene as catalyst compounds & cobalt, nickel and iron were
used as catalyst powder. Concentrated sulfuric acid (H2SO4) and nitric acid (HNO3) were also
used for functionalization.
Preparation of substrate
Silica was taken in the bulk form and grinded in a ball mill for 24 hrs and then powder was
oxidized in a furnace at 900oc for 1 hr . The amount of loss of silica is 9.98% of weight after
oxidation.
Synthesis methods of CNTs
Horizontal Quartz tube furnace was used for the growth of carbon nanotubes. The substrate was
heated in high pure argon up to desired reaction temperature at specific heating rate. On
attainment of desired reaction temperature, the mixture of carbonaceous source and catalyst was

International Journal of Research in Modern Engineering and Emerging Technology (IJRMEET) UGC Approved id_47203
Vol. 5, Sp. Issue: 9, Sept.: 2017 (IJRMEET) ISSN: 2320-6586
143 Online International, Refereed, Impact factor & Indexed Monthly Journal www.raijmr.com
RET Academy for International Journals of Multidisciplinary Research (RAIJMR)
passed for different reaction time from 30 min. The liquid hydrocarbons containing about 5 wt%
of ferrocene (organometallic compound) was injected into the CVD reactor by the syringe pump
along with argon containing H2 atmosphere After the reaction, the furnace was allowed to cool
under argon atmosphere. Substrates used in these studies were weighed before and after the
reaction to determine the amount of carbon produced at different sites within the reactor.
Purification of CNTs
CNTs were placed in 50:50 solution of HF and distilled water and the solution was kept for 24
hrs. It was then filter with distilled water till the neutral pH is obtained. Purified CNTs were
kept in oven to remove the moisture for 72 hrs at 80oc.
Procedure for the synthesis of CNTs/COOH
The pristine carbon nanotubes 0.1 g were first chemically functionalized with mixture of
concentrated sulfuric acid and nitric acid under the ratio of 3:1 the ultrasonication bath for 1 hr.
after the ultrasonication bath material put on stirring for 2 hr. Then 90 ml of water was added
into the mixture. The dispersion was then centrifuged, washed with water until it turned neutral
and dried at 50˚C over night.
Material characterizations
X-ray diffraction is patterns were obtained with a diffractometer using Cu pellet anode at 40 kV,
wavelength 0.154 nm. Fourier transform infrared (FT-IR) spectra of the products were recorded
with KBr pellet spectrometer ranging from 400cm-1
to 4000cm-1
. The morphology and identify
structural changes was examined by transmission electronic microscopy.
Results and Discussion
Transmission electron microscopy
TEM, as one of the most useful methods to characterize the morphologies of nanoparticles in
Nano-composites, and also used for the investigation of the hybrid material.
To prepare TEM samples, some acetone was dropped on the nanotubes film, and then, these
films were transferred with a pair of tweezers to a carbon coated copper grid. It is obvious from
the images that all the nanotubes are hollow and tubular in shape. In some of the images, catalyst
particles can be seen inside the nanotubes. TEM images indicate that the nanotubes are of high
purity, with uniform diameter distribution, and contain no deformity in the structure while Figure

International Journal of Research in Modern Engineering and Emerging Technology (IJRMEET) UGC Approved id_47203
Vol. 5, Sp. Issue: 9, Sept.: 2017 (IJRMEET) ISSN: 2320-6586
144 Online International, Refereed, Impact factor & Indexed Monthly Journal www.raijmr.com
RET Academy for International Journals of Multidisciplinary Research (RAIJMR)
shows Transmission Electron Microscope of the carbon nanotube. It shows that a highly ordered
crystalline structure of CNTs is present.
Fig. 3.1 Transmission electron microscopy of pristine CNTs.
X-Ray Diffraction
This characterization method is not sample destructive and is used to obtain some information on
the interlayer spacing, the structural strain and the impurities. However, carbon nanotubes have
multiple orientations compared to the X-ray incident beam. Peak broadening and peak shift
indicates that the strain is introduced in the nanotube structures due to surface functionalization
and introduction of defects during ultrasonication reaction. The strongest diffraction peak at the
angle (2θ) of 26.5𝑜 can be indexed as the c (002) reflection of hexagonal graphite structure. The
sharpness of the peak at the angle (2θ) of 26.5𝑜 indicates that the graphite structure of the
SWNTs was acid-oxidized without significant damage since any decrease in the order of
crystalline in SWNTs will make XRD peaks broadening and shift the peak diffraction on towards
lower angles.

International Journal of Research in Modern Engineering and Emerging Technology (IJRMEET) UGC Approved id_47203
Vol. 5, Sp. Issue: 9, Sept.: 2017 (IJRMEET) ISSN: 2320-6586
145 Online International, Refereed, Impact factor & Indexed Monthly Journal www.raijmr.com
RET Academy for International Journals of Multidisciplinary Research (RAIJMR)
Figure 3.2 X ray Diffraction graph of CNTs
FT-IR study
FT-IR was conducted on functionalized CNTs as shown in fig 3.3. The IR spectrum shows
important bands at 3450 cm-1
(attributing to OH stretching). 2900 cm-1
and 2950 cm-1
assigned to asymmetric and symmetric CH2 stretching. 1725 cm-1
assigned to stretching
vibrations of carbonyl groups (C=O) present in carboxylic acids(RCOOH). 1625 cm-1
assigned
to conjugated C=C stretching. 1050 cm-1
corresponding to C-O stretch in alcohols. The peak at
1589.40 cm-1
and 1554.68 cm-1
can be assigned to the C=C stretching, which indicates the
graphite structure of MWNTs. Peak at 1400 cm-1
is O-H band of carboxylic group. These results
suggest that carboxylic acid groups have been successfully introduced on to the surfaces
MWNTs by acid treatment.

International Journal of Research in Modern Engineering and Emerging Technology (IJRMEET) UGC Approved id_47203
Vol. 5, Sp. Issue: 9, Sept.: 2017 (IJRMEET) ISSN: 2320-6586
146 Online International, Refereed, Impact factor & Indexed Monthly Journal www.raijmr.com
RET Academy for International Journals of Multidisciplinary Research (RAIJMR)
Fig 3.3 FT-IR study of functionalized carbon nanotubes with carboxylic groups
Conclusion
The research presents a CVD method for producing MWCNTs by using catalyst. In CNTs, the
result of X-ray differaction characterization shows the sharpness of the peak at the angle (2θ) of
indicates that the graphite structure of the MWNTs which match of CNTs JCPDS 75-1621 card.
TEM characterizations of pristine CNTs form bundles which contain crystallized and Multi
walled CNTs with a diameter of around 10 nm. Taking into account the importance of carboxyl
groups on the surface of MWCNTs, these groups has been successfully introduced to achieve the

International Journal of Research in Modern Engineering and Emerging Technology (IJRMEET) UGC Approved id_47203
Vol. 5, Sp. Issue: 9, Sept.: 2017 (IJRMEET) ISSN: 2320-6586
147 Online International, Refereed, Impact factor & Indexed Monthly Journal www.raijmr.com
RET Academy for International Journals of Multidisciplinary Research (RAIJMR)
functionalization of MWCNTs via the mixed acid treatment. FT-IR result on samples confirms
the presence of carboxyl on the MWCNTs. Moreover, carboxyl introduced onto the surfaces of
MWCNTs are available to be further functionalized by conventional chemistry routes.
MWCNTs-COOH may conveniently been served as flexible platforms for further
functionalizations in materials science, cancer treatment, sensor and drug delivery applications.
References: 1. C. Oncel, Y. Yurum, Carbon Nanostructures, 2006, 14,17.
2. G.Gabriel Carbon, 2006, 44 ,1891.
3. S.Banerjee, T. Hemraj‐Benny, S. S.Wong, Advanced Materials, 2005,17,17.
4. D. Tasis, N. Tagmatarchis, A. Bianco, M. Prato, Chemistry of carbon nanotubes,
Chemical Reviews 2006, 106 1105.
5. M.T. Byrne, Y.K. Gun’ko, Advanced Materials, 2010, 22, 1672.
6. C. Klinke, J. B. Hannon, A. Afzali, P. Avouris, (2006). Field-effect transistors assembled
from functionalized carbon nanotubes. Nano letters,6(5), 906-910.
7. F. Avilés, J. V. Cauich-Rodríguez, L. Moo-Tah, A. May-Pat, R. Vargas-Coronado, Carbon,
2009, 47, 2970.
8. N. Tagmatarchis, M. Prato, Journal of materials chemistry, 2004, 14, 437.
9. J. J. Stephenson, A. K. Sadana, A. L. Higginbotham, J. M. Tour, Chemistry of Materials,
2006,18, 4658.
10. J. L.Bahr, J. M. Tour, Chemistry of Materials, 2001. 13, 3823.
11. M. D.Ellison, P. J. Gasda, . The Journal of Physical Chemistry C, 2008, 112, 738.
12. A. Amiri, M. Maghrebi, M. Baniadam, S.Z. Heris, Applied Surface Science, 2011, 257,
10261.
13. J.Y.Yook, J. Jun, S. Kwak, Applied Surface Science, 2010,256, 6941.
14. Ajayan, M. Pulickel, Z. Otto Zhou. Springer Berlin Heidelberg, 2001. 391.
15. Khare, Rupesh, and Suryasarathi Bose. Journal of minerals and Materials
Characterization and Engineering, 2005, 4,31. 16. A.Hirsch, O.Vostrowsky, Springer Berlin Heidelberg, 2005, 193.

International Journal of Research in Modern Engineering and Emerging Technology (IJRMEET) UGC Approved id_47203
Vol. 5, Sp. Issue: 9, Sept.: 2017 (IJRMEET) ISSN: 2320-6586
148 Online International, Refereed, Impact factor & Indexed Monthly Journal www.raijmr.com
RET Academy for International Journals of Multidisciplinary Research (RAIJMR)
Acoustical properties of aqueous solutions of paracetamol at
different temperatures
T. R. Pandit 1, V. A. Rana
2
Dept. of Physics, University School of Sciences, Gujarat University, Ahmedabad, Gujarat, India.
E-mail: [email protected],
Abstract
Measurements of physical properties like refractive index, density, viscosity and ultrasonic
velocity for aqueous solutions of Paracetamol across a temperature range of 293.15 K to 323.15
K were carried out in this study. Obtained results were analyzed for gathering structural
information of solutions as well as to get an idea about its applications in formations of
medicines from the drug. Thermodynamical properties like specific volume (Sv), specific gravity
(SG) for all solutions at all temperatures were also calculated using the values of density. Results
of refractive index were used to calculate dielectric constant at optical frequency (εꝏ) of
solutions. Acoustical parameters like adiabatic compressibility (βa), free length (Lf), acoustic
impedance (Zaco), etc. were also calculated for all solutions from measured physical properties.
Keywords: - Physical properties, paracetamol; ultrasonic velocity; Abbe’s refractometer;
pharmaceuticals
Introduction
Physical properties of pharmaceutical drugs provide useful information regarding drug
formulation, drug dosage, synthesis, etc. In bio-physical chemistry; it is required to understand
drug - macromolecular interaction which involves a complex mechanism. Since most of the bio-
chemical processes occur in aqueous medium; the study of physical properties of a drug in
aqueous state provides useful information in pharmaceutical and medicinal chemistry. The drug
- water interaction and their temperature dependence play an important role to understand the
drug action in human body. Such results can be helpful to predict the absorption of drugs and
transport of drugs across the biological membranes. [1]
Research into the physical properties like solubility, boiling point of thirteen different
pharmaceutical powders has been measured by C.M.Mcloughlin et al. [2] Physical properties
like refractive index, density and viscosity of three pharmaceutical drugs at different
temperatures were measured by Iqbal and Chaudhary. [1] Literature survey confirms that no

International Journal of Research in Modern Engineering and Emerging Technology (IJRMEET) UGC Approved id_47203
Vol. 5, Sp. Issue: 9, Sept.: 2017 (IJRMEET) ISSN: 2320-6586
149 Online International, Refereed, Impact factor & Indexed Monthly Journal www.raijmr.com
RET Academy for International Journals of Multidisciplinary Research (RAIJMR)
attempts has yet been made to obtain physical properties for aqueous solutions of PCM which
has been fulfilled in this study at four different temperatures.
Pharmaceutical drug selected for this study is Paracetamol (PCM) because it is the most
common drugs used in the world for pain, fever and in many other medical issues. PCM has
protein like structure and contains amide group (R-CONH2) in its formulation which indicates
many applications in the field of pharmaceutical sciences as well as in medical sciences.
Figure-1: Structure of PCM
Materials and Methods
Paracetamol (PCM) powder was supplied by “Farmson Pharmaceuticals Gujarat Pvt. Ltd.;
Vadodara” and distilled water was purchased from “High Purity Laboratory Chemicals Pvt. Ltd.;
Mumbai”. Samples of sealed packets were kept in airtight glass container before to make its use
in the experiment. Aqueous solutions of different weight fractions of PCM powder with 10 ml
volume of distilled water were prepared. The maximum amount of weight fractions of PCM
used for experiment is according to its solubility in water i.e. 140 mg / 10 ml. [5] The
concentrations then converted into the unit of molarity using conversion formula described by
E.M.Cheng et al. [6]
For measurements of physical properties refractive index, viscosity, density and ultrasonic
velocity; Abbe’s refractometer, Ostwald’s Viscometer, Pycnometer and Ultrasonic
interferometer were used respectively. Experimental setup and methodology as discussed by
Rana and Chaube [7] has been followed to obtain physical and ultrasonic properties. Allied
parameters from obtained physical properties were calculated using expressions stated in [8].
Comparison of measured values of R.I., density, viscosity and ultrasonic velocity with literature
values at 303.15 K are presented in table - 1.
The chemical formula of PCM is C8H9NO2
and its molecular weight is 151.17 gm /mol.
[3]
PCM is used as an intermediate for
pharmaceuticals, stabilizer for hydrogen
peroxide, photographic chemicals and as an
alternative to aspirin. [4]
Schematic for
structure of PCM is shown in figure - 1.

International Journal of Research in Modern Engineering and Emerging Technology (IJRMEET) UGC Approved id_47203
Vol. 5, Sp. Issue: 9, Sept.: 2017 (IJRMEET) ISSN: 2320-6586
150 Online International, Refereed, Impact factor & Indexed Monthly Journal www.raijmr.com
RET Academy for International Journals of Multidisciplinary Research (RAIJMR)
Physical Property Experimental Value Literature Value
Refractive Index 1.331 1.33105 [9]
Density (kg m-3) 995.41 995.70 [10]
Viscosity (m2 sec-1) 8.008 8.010 [11]
Ultrasonic Velocity (m sec-1) 1507.78 1500 [12]
Table - 1: Comparison of measured and literature values of physical properties of water at
303.15 K temperature
Results and Discussion
Experimentally determined values of R.I., density, viscosity, ultrasonic velocity and other
evaluated parameters for aqueous solutions of PCM at four temperatures are presented in table -
2. Refractometry (technique for measurements of RI) is important in pharmacy for identification
of a pure substance, establishing the purity of some substances and determination of the
concentrations of simple solutions.[13] Values of RI (n) increases with the molarity of PCM
powder and decreases with temperature. Results are obvious because when temperature
increases; solution become less dense that effects as decrement in the value of RI. Increment in
RI value with molarity reflects the presence and increase in concentrations of PCM in water. RI
is the square root of relative permittivity and using this relation; dielectric constant at optical
frequency (εꝏ) has been calculated for all solutions at all temperatures. With reference to this
relation; it can be justified that the variation in temperature causes change in the electronic
polarization due to increase in average expansion of charges and dipole moment.
Density for all solutions increases with the molarity of PCM - water solutions. Increment in
density is the result of increment in weight fraction of PCM powder in solution. Density for all
solutions decreases with temperature due to expansion of volume in the solution. In liquids,
density variation with molarity is typically small at all temperatures but this could be much
greater for gases. Obtained results for density are useful to find the macroscopic properties of
matter to uncover the informations at the atomic level as well as to identify pure substances and
to characterize the composition of many kinds of mixtures of drugs. [14] Using the values of
density; thermodynamical properties specific volume (Sv) and specific gravity (SG) have been
calculated. Linear increment in SV with temperature was observed. Decrement in SV with
molarity is a result of weak solute - solute interaction. [1] Results give an idea about accurate
dosage selection for compositions of PCM with water. Values of SG shows minor variations with
molarity and exhibit non - linear variation with temperature.

International Journal of Research in Modern Engineering and Emerging Technology (IJRMEET) UGC Approved id_47203
Vol. 5, Sp. Issue: 9, Sept.: 2017 (IJRMEET) ISSN: 2320-6586
151 Online International, Refereed, Impact factor & Indexed Monthly Journal www.raijmr.com
RET Academy for International Journals of Multidisciplinary Research (RAIJMR)

International Journal of Research in Modern Engineering and Emerging Technology (IJRMEET) UGC Approved id_47203
Vol. 5, Sp. Issue: 9, Sept.: 2017 (IJRMEET) ISSN: 2320-6586
152 Online International, Refereed, Impact factor & Indexed Monthly Journal www.raijmr.com
RET Academy for International Journals of Multidisciplinary Research (RAIJMR)
Viscosity (η) gives an idea about any liquid in pharmaceuticals, with how much resistance it can
flow whether it is a cough syrup, ointment, etc. It is very important for drug manufacturers to
predict how products will behave when users consumes it. Small variation in viscosity with
molarity of PCM and a noticeable change with temperature have been observed which is a result
of existance of small amount of resistance for flow of liquid. Low values of viscosity refers to
the presence of small molecules in solution with which rearrangement ability is faster than that
of long chain molecules.
It is observed from table that ultrasonic velocity (u) increases linearly with concentration of
PCM and with temperature. Adiabatic compressibility (βa) and Free length (Lf) show an opposite
trend to that of velocity. Free volume (Vf) and molar volume (VM) increases with the
concentration of PCM and increases with temperature. Increase in ultrasonic velocity and
decrease in adiabatic compressibility, free length with concentration indicates strong solute -
solvent interactions [15]; which is also supported by increase in viscous relaxation time (τη).
Figure - 2: Variation of apparent molar volume (ØV) and apparent molar compressibility (Øk)
with molarity and temperature
It can be observed from figure - 2 that; Apparent molar compressibility (Øk) and apparent molar
volume (ØV) also increases non- linearly with concentrations and temperature. Negative values
of ØV and Øk are due to strong attraction between water molecules and paracetamol for
occupying less space.
Linear increase in Rao’s constant (R) and Wada’s constant (W) with concentration can be
observed from figure - 3; indicates solute - solvent molecules are coming close to each other and
the space between them is decreasing with rise in temperature. [16]

International Journal of Research in Modern Engineering and Emerging Technology (IJRMEET) UGC Approved id_47203
Vol. 5, Sp. Issue: 9, Sept.: 2017 (IJRMEET) ISSN: 2320-6586
153 Online International, Refereed, Impact factor & Indexed Monthly Journal www.raijmr.com
RET Academy for International Journals of Multidisciplinary Research (RAIJMR)
Figure - 3: Variation in Rao’s constant (R) and Wada’s constant (W) with molarity and
temperature
Conclusions
Measurements of physical quantities density, refractive index, viscosity and ultrasonic velocity
for aqueous solutions of PCM of varying concentration within its solubility range over a
temperature range of 293.15 K to 323.15 K were performed. Data of refractive index and
dielectric constants at optical frequency for all solutions indicates change in electronic
polarization with molarity of PCM due to increase in average expansion of charges. Density of
solutions found to increase with molarity and decrease with temperature. Values for specific
volume (Sv) and specific gravity (SG) were calculated from density. These parameters are useful
in pharmaceutical sciences for identification of purity of drugs and to estimate the concentration
of drug in the solutions. Viscosity for all solutions exhibits very small variation with molarity
but a noticeable variation with temperature has been observed. Small size of molecules /
particles in solutions were predicted from the small variations of viscosity with concentration.
Ultrasonic velocity increased with molarity as well as with temperature. Parameters obtained
from ultrasonic velocity indicates strong solute - solvent interaction for all solutions and exhibit
decrement in spacing between solute - solvent with rise in temperature.
Acknowledgements
Financial support provided by DST, New Delhi through the DST - FIST (Level-1) project (SR/
FST/PSI-001/2006); and DRS - SAP program grant [No. F. 530/ 10/ DRS/ 2010(SAP-1)] has
been utilized to carry out this work and it is gratefully acknowledged. We are also thankful to
Prof. P. N. Gajjar, Head, Department of Physics, University school of sciences, Gujarat
University, Ahmedabad for his constant encouragement.

International Journal of Research in Modern Engineering and Emerging Technology (IJRMEET) UGC Approved id_47203
Vol. 5, Sp. Issue: 9, Sept.: 2017 (IJRMEET) ISSN: 2320-6586
154 Online International, Refereed, Impact factor & Indexed Monthly Journal www.raijmr.com
RET Academy for International Journals of Multidisciplinary Research (RAIJMR)
References
1. M.J.Iqbal, M.A.Chaudhary; “J. Chem. Thermodynamics”; 2009; 41; 221 - 226.
2. C.M.Mcloughlin, W.A.M. McMinn, T.R.A. Magee; “Powder Technology”; 2003; 134; 40 -
51.
3. G.P.Johari, S.Kim, R.M.Shanker; “Journal of Pharmaceutical Sciences”; 2010; 99 (3); 1358
- 1374.
4. R.E.Mudgett; “Food Technology”; 1986; 40; 84 – 93.
5. M.S.Venkatesh, G.S.V.Raghavan; “Canadian Bio-Systems Engineering”; 2005; 97; 7.15 – 7.30.
6. E.M.Cheng, M. Fareq, F.S.Abdullah et al.; “IEEE International RF and Microwave
Conference”; 2013; 409 - 413.
7. V.A. Rana, H.A. Chaube; “Journal of Molecular Liquids”; 2012; 173; 71–76.
8. S. Ajeetha, A.H.Malini, V.N.M.Devi; “Research journal of pharmaceutical, biological and
chemical sciences”; 2013; 4(3); 218 - 224.
9. A.N.Bashkatov, E.A.Genina; “SPIE”; 2003; 5068; 393 - 395.
10. G.S.Kell; “J. Chem. Eng. Data”; 1975; 20 (1); 97 - 105.
11. J. Kestin, M.Sokolov, A.Wakeham; “Journal of Physical and Chemical Reference Data”;
1978; 7; 941 - 948.
12. C.J.Burton; “The journal of the acoustical society of America”; 1948; 20; 186 - 199.
13. D. R.Lide; “CRC Handbook of chemistry and physics”; 86th
ed.; Boca Raten (FL): CRC
Press; 2005.
14. R.Francesconi, A.Bigi, K.Rubini, F.Comelli; “J. Chem. Eng. Data”; 2005; 50; 1932 - 1937.
15. P.S.Naidu, K.R.Prasad; “Indian Journal of Pure & Applied Physics”; 2004; 42; 512 - 517.
16. J.P.Singh, R.Sharma; “International Journal of Engineering Research and Development”;
2013; 5(11); 48 - 51.

International Journal of Research in Modern Engineering and Emerging Technology (IJRMEET) UGC Approved id_47203
Vol. 5, Sp. Issue: 9, Sept.: 2017 (IJRMEET) ISSN: 2320-6586
155 Online International, Refereed, Impact factor & Indexed Monthly Journal www.raijmr.com
RET Academy for International Journals of Multidisciplinary Research (RAIJMR)
Phonon dispersion curves and elastic moduli
for Sn-Pb liquid metallic alloy
A. B. Patel1#
, C. H. Patel2, N. K. Bhatt
3 and P. N. Gajjar
1
1Department of Physics, School of Sciences, Gujarat University, Ahmedabad, Gujarat – 380009
2Gujarat State board of school textbooks, ‟vidyayan‟, sector-10/A, Gandhinagar, Gujarat –382010
3Department of Physics, M K Bhavnagar University, Bhavnagar, Gujarat – 364001
#Corresponding author. Email: [email protected]
Abstract. The phonon dispersion curves of polyvalent liquid binary SnPb alloy are investigated using
Hubbard and Bebby (HB) approximation at different temperatures. The calculation is based on pseudo
potential due to Hasegawa is valid for all electrons which gives the occurrence of the true field, rather
than a Columbic form in the pre-asymptotic region.In present work, the parameters of Sn-Pb alloy are
obtained from the relation PbSneff Px P x1P ; where, P is the desired effective parameters like rc,
Ω0, σ, etc. and x is the concentration of individual elemental metals. The phonon frequencies in the
large wave length limit, increased faster with q than predicted by classical hydrodynamics which is so-
called positive dispersion. The temperature dependence of elastic moduli is calculated using the
longitudinal and transverse phonon velocities. Because of the non-availability of any experimental
results on PDCs and elastic moduli, it has not been possible to compare the computed results.
Nevertheless, the results obtained may be useful for future comparison qualitatively as well as
quantitatively.
Keywords: pseudo potential; SnPb alloy; phonon dispersion; elastic moduli
Introduction: In recent years, due to the prime technological importance, there has been great interest
for the study of liquid metals and their alloys. Experimentally dispersion curves for longitudinal
phonon and theoretically computer simulation technique have provided dispersion curves for both
longitudinal and transverse phonons in liquids and its alloys [1].During the past few decades, metallic
liquids have been extensively studied using the pseudo potential theory. Phonon dispersion in liquid
metallic alloys is mostly studied for existing collective modes of motion of the constituent atoms.
However, Sn and Pb is the heaviest non-simple element the d- bands in such less simple metals are
completely filled by electrons, still the significant effect of the sp-d hybridization exists. Moreover, the
structure of these less simple liquid metals shows anomalous behavior near their melting temperatures.
In this connection, a careful and comprehensive study requires for various physical properties of liquid
Sn-based alloys. The temperature dependent study of various alloy systems in liquid state is not

International Journal of Research in Modern Engineering and Emerging Technology (IJRMEET) UGC Approved id_47203
Vol. 5, Sp. Issue: 9, Sept.: 2017 (IJRMEET) ISSN: 2320-6586
156 Online International, Refereed, Impact factor & Indexed Monthly Journal www.raijmr.com
RET Academy for International Journals of Multidisciplinary Research (RAIJMR)
largely explored yet. It is a still question how the physical properties of liquid metallic alloys very
with the temperature. Previously Patel et. al.[2] studied vibrational dynamics for liquid Sn and Pb
metals over a wide range of temperature. So our main purpose of this paper is an extension work of
Patel et.al.[2] for Sn-Pb liquid metallic alloys. Therefore, in the present work the vibrational dynamics
and elastic properties of Sn1-XPbX liquid metallic alloy have been investigated for wide temperature
range.
Computational Approach: The second order pseudo potential perturbation theory gives the effective
inter-atomic pair potential V(r) of a metal as the sum of the direct Coulomb repulsive interaction
between two ions and attractive interaction between ions and its screening electron gas is expressed by
[3],
dq2qqr
sin(qr)(q)F
2π
Ω
r
2e2Z(r)V eff
0effeff
eff (1)
Here, Zeff is the valence, e is the electronic charge and Ωeff is the atomic volume of binary
alloys. In the present work, the temperature dependent pair potential is calculated by multiplying a
dimensionless damping term
r
2k
Tk πexp
F
B to the pair potential [4-6], which provides necessary
Friedel-damping as expected at high temperatures. In Eq.-1, Feff(q) is the energy wave number
characteristics. The first term gives the coulomb interaction between ions and the second term is due
to the indirect interaction through the conduction electrons. This indirect interaction can be calculated
using the energy wave number characteristics F(q).
(q))f1)(1(q)(ε1
1(q)ε(q)W
16π
qΩ(q)F
effHeff
effH2
Beff
2eff0
eff
. (2)
Here, εHeff(q) is the Hartree dielectric response function and feff(q) is the local field correction function,
which represents the exchange and correlation effects. In the present work, we used the Ichimaru-
Utsumi [7] local filed correction function which accurately reproduces the Monte-Carlo results and it
also satisfies the self consistency condition in the compressibility sum rule.
The choice of model potential is an important feature which describes the motion of valence
electron in a metal. We have employed the pseudo potential due to Hasegawa et al.[8] for bare ion
interaction potential. Earlier, the ionic potential for Li from first principles, which are extrapolated into
the core region with delta function to describe the core pseudisation is proposed by Hoshino and
Young [9]. It consists full electron-ion interaction and a delta function which represents the
International Journal of Research in Modern Engineering and Emerging Technology (IJRMEET) UGC Approved id_47203
Vol. 5, Sp. Issue: 9, Sept.: 2017 (IJRMEET) ISSN: 2320-6586
157 Online International, Refereed, Impact factor & Indexed Monthly Journal www.raijmr.com
RET Academy for International Journals of Multidisciplinary Research (RAIJMR)
orthogonalisation effect due to the s-core states in such sp-bonded metals. This gives the occurrence of
the true field, rather than a Columbic form in the pre-asymptotic region. Following their calculations,
Hasegawa et al.[8] have improved the model potential form by Coulombic tail by an exponentially
decay term, and inside the core complete cancellation due to orthogonal properties of core and valence
states. Application of this potential gives good results for describing the concentration fluctuation in
structural study of Li-Na liquid alloy [10] and also predicting the correct sign of the phase shift in
liquid potassium. This modified empty-core (MEC) bare ion potential includes non-locality and its q-
space form of is,
)ceff
tanqrq
b)(1
ceffrbexp(
2b2q
2qa1
ceffcosqr
2q
e π4Z(q)W eff
eff
eff
eff2
effBeff
. (3)
In the study of phonon dispersion curves (PDC) of liquid binary alloy the main ingredients are
theinter-atomic pair potential V(r) and pair correlation function g(r). It contains useful information
about the inter particle radial correlation can be obtain using different experimental techniques and
theoretical models. In our previous work[11], we computed static structure factor S(q) and its Fourier
transforms g(r) using Ashcroft-Lengrath [12] approximation is now used to calculate PDC. To
compute the phonon frequencies the most frequently used approach of Hubbard and Beeby (HB) [13]
is adopted. Under HB assumption, the expressions for longitudinal and transverse phonon frequencies
are,
)(q
)6sin(q
)(q
)(qcos6
)(q
)3sin(q- 1
32
2E
2l
. (4)
)(q
)6sin(q
)(q
)3cos(q 1
32
2E
2t
. (5)
Where, dr (r)Vr
2(r)Vg(r)r
3M
4ππω '
eff"eff
0
2
eff
effE
is the maximum phonon frequency and Veff′ r the
first derivative andVeff" r the second derivatives of V(r).
Within the long-wavelength limit, the phonon dispersion curve shows an elastic behavior.
Hence, the longitudinal vl and transverse vt sound velocities are also computed by
q ω and q ω tl , q V ω and q V ω ttll

International Journal of Research in Modern Engineering and Emerging Technology (IJRMEET) UGC Approved id_47203
Vol. 5, Sp. Issue: 9, Sept.: 2017 (IJRMEET) ISSN: 2320-6586
158 Online International, Refereed, Impact factor & Indexed Monthly Journal www.raijmr.com
RET Academy for International Journals of Multidisciplinary Research (RAIJMR)
Then using longitudinal and transverse sound speed, the bulk modulus B, Poisson‟s ratio „ξ‟,
modulus of rigidity G, Young‟s modulus Y and the Debye temperature θD are computed byfollowing
expressions,
2
t2l V
3
4Vρ B ,
2l
2t
2l
2t
V
V22
V
V21
ξ , 2tρV G , 1)2G( Y and
3
1
3t
3l
3
1
βD
V
2
V
1
4π
9ρ
k
h θ
where, „h‟ is Plank constant, kB is the Boltzmann constant and ρ is the isotropic density of the
alloy.
Results and Discussion:
Table-1: The calculated input parameters effective volume and effective core radius at different
temperatures and concentrations.
T(K
)
470 523 613 973 1173 1500
Co
n.
eff0Ω rceff eff0Ω rceff eff0Ω rceff eff0Ω rceff eff0Ω rceff eff0Ω rceff
0 189.36 1.5200 190.25 1.4830 191.77 1.4726 198.066 1.4300 201.749 1.4110 208.075 1.3820
0.1 191.80 1.5374 192.74 1.5030 194.36 1.4931 201.059 1.4487 205.087 1.4290 211.8305 1.3990
0.2 194.24 1.5549 195.22 1.5231 196.95 1.5135 204.052 1.4675 208.426 1.4480 215.5859 1.4161
0.3 196.68 1.5724 197.71 1.5431 199.55 1.5339 207.045 1.4863 211.764 1.4670 219.3414 1.4332
0.4 199.12 1.5898 200.20 1.5632 202.14 1.5544 210.038 1.5051 215.103 1.4860 223.0968 1.4503
0.5 201.55 1.6073 202.69 1.5832 204.73 1.5748 213.031 1.5239 218.441 1.5050 226.8523 1.4674
0.6 203.99 1.6248 205.18 1.6033 207.32 1.5952 216.023 1.5426 221.78 1.5230 230.6078 1.4844
0.7 206.43 1.6422 207.67 1.6233 209.91 1.6157 219.016 1.5614 225.118 1.5420 234.3632 1.5015
0.8 208.87 1.6597 210.15 1.6434 212.50 1.6361 222.009 1.5802 228.456 1.5610 238.1187 1.5186
0.9 211.31 1.6772 212.64 1.6634 215.09 1.6565 225.0027 1.5990 231.7954 1.5800 241.8741 1.5357
1 213.75 1.6947 215.13 1.6835 217.68 1.6770 227.9956 1.6178 235.1338 1.5990 245.6296 1.5528
The parameters used in the present calculation of the phonon dispersion curves of the Sn-Pb
alloy are tabulated in Table-1. Patel et.al.[2] have determined the potential parameter rc by optimizing
hard sphere diameter at a given (n,T) condition. It is noteworthy that this model provides accurate
description of the interactions in the liquid polyvalent metals. In present work, the parameters of Sn-
Pb alloy can be obtained from the relation PbSneff Px P x1P ; where, P is the desired effective
parameters like rc, Ω0, σ, etc. The 0 x 1 is the concentration of individual elemental metals.

International Journal of Research in Modern Engineering and Emerging Technology (IJRMEET) UGC Approved id_47203
Vol. 5, Sp. Issue: 9, Sept.: 2017 (IJRMEET) ISSN: 2320-6586
159 Online International, Refereed, Impact factor & Indexed Monthly Journal www.raijmr.com
RET Academy for International Journals of Multidisciplinary Research (RAIJMR)
Fig. 1 Inter atomic potential at T = 523 K Fig. 2 Same as Fig. 1at T = 1500 K
The inter atomic partial pair potential VSn-Sn(r), VPb-Pb(r) and VSn-Pb(r) have been calculated
using the eq.1 within the framework of pseudo potential formalism are shown in Fig.1 and Fig.2. The
effective pair potential Veff(r) lies in between VSn-Sn(r) and VPb-Pb(r). We can infer from the Fig.1 and
Fig.2, the effective inter atomic pair potentials have significant oscillations in the large r – region at T
= 523 K while these Friedal oscillations are damped at T = 1500 K. This exponentially damped pair
potential has the advantage of not containing the long ranged Friedal oscillations. We can also infer
that, with inclusion of Pb the depth of V(r) decreases near equilibrium. We also observed that the
depth of the principal minimum decreases and the width of well increases with increasing temperature.
These observations are consistent to the fact that with temperature binding decreases resulting into
shallower V(r).
Fig.-3: Longitudinal phonon
frequencies of Sn0.2Pb0.8 at
different temperature.
Fig.-4: Longitudinal phonon
frequencies of Sn0.4Pb0.6 at
different temperature.
Fig.-5: Longitudinal phonon
frequencies of Sn0.6Pb0.4 at
different temperature.
Fig.-6: Longitudinal phonon
frequencies of Sn0.6Pb0.4 at
different temperature.
Fig.-7: Transverse phonon
frequencies of Sn0.2Pb0.8 at
different temperature.
Fig.-8: Transverse phonon
frequencies of Sn0.4Pb0.6 at
different temperature.
Fig.-9: Transverse phonon
frequencies of Sn0.6Pb0.4 at
different temperature.
Fig.-10: Transverse phonon
frequencies of Sn0.8Pb0.2 at
different temperature.

International Journal of Research in Modern Engineering and Emerging Technology (IJRMEET) UGC Approved id_47203
Vol. 5, Sp. Issue: 9, Sept.: 2017 (IJRMEET) ISSN: 2320-6586
160 Online International, Refereed, Impact factor & Indexed Monthly Journal www.raijmr.com
RET Academy for International Journals of Multidisciplinary Research (RAIJMR)
Further, using above obtained effective pair potential the eigen frequencies of Sn-Pb liquid
metallic alloy has been studied for longitudinal and transverse mode. The longitudinal and transverse
phonon frequencies have been computed at different concentration and temperatures are shown in
Fig.3-10. The curves obtain from HB approach reproduces all the broad characteristics of dispersion
relation. Longitudinal phonon shows oscillatory behavior with prominent maximum frequency. We
also examined the position of the first frequency minimum roughly coincides with the first peak of
structure factor S(q) which is around 2kF. It has been revealed that this minimum arises from a process
analogous to the Umklapp scattering in the crystalline solids. Moreover, the maximum frequency of
the transverse phonon is smaller and appears at larger q than longitudinal phonons. The oscillatory
behavior of the transverse phonon is insignificant beyond the first peak. It indicates that the transverse
phonons undergo large thermal modulation compared to longitudinal phonons, due to the
anharmonicity in atomic vibrations, which may be connected with the instability of transverse phonons
in liquid metal systems.The height of the peak decreases gradually where its width increases on raising
the concentration of Pb in Sn.The phonon frequencies in the lower q range increased noticeably faster
with q than predicted by classical hydrodynamics. This is the so-called positive dispersion which was
already observed before in many other simple and non-simple liquid metals [14-17].
Fig.-11: Longitudinal sound speed (vl)
for different temperatures and
concentrations.
Fig.-12: Transverse sound speed (vt)
for different temperatures and
concentrations.
Fig.-13: Bulk Modulus (BM) for
different temperatures and
concentrations.

International Journal of Research in Modern Engineering and Emerging Technology (IJRMEET) UGC Approved id_47203
Vol. 5, Sp. Issue: 9, Sept.: 2017 (IJRMEET) ISSN: 2320-6586
161 Online International, Refereed, Impact factor & Indexed Monthly Journal www.raijmr.com
RET Academy for International Journals of Multidisciplinary Research (RAIJMR)
Fig.-14: Modulus of Rigidity (GR) for
different temperatures and
concentrations.
Fig.-15: Young Modulus (YM) for
different temperatures and
concentrations.
Fig.-16: Debye temperature for
different temperatures and
concentrations.
The dispersion curves show a linear variation in low the wave vector transfer region and depict
the characteristic of elastic waves. The computed values of the elastic moduli for Sn-Pb liquid metallic
alloy at different temperatures and concentrations are shown in Fig.11-16. We can infer that
longitudinal and transverses sound velocities decreases with increasing temperature. In addition, both
sound velocities are also decreases with increasing concentration of Pb in Sn. The elastic moduli
(BM,GR and YM) are found decreases with rising temperatures, while increases with higher
concentration of Pb. From Fig.13-15, the increase in elastic moduli with concentration is observed
upto around T = 1500 K and above this temperature they remains almost constants. The calculated
values of Debye temperature decrease with increasing temperature and concentration of Pb. In
general, we can say that all the elastic parameters are decreases with increasing temperature.
Conclusion: The study indicates that, in liquid alloys, long-range oscillations are also present in the
inter-atomic potential similar to the case of liquids and liquid metals. The Friedal oscillations in the
inter-atomic potential are charge density oscillations, which cause and indirect electronic interaction
between localized charges as pointed out by Haussler [18]. Overall, the PDC generated from the
Hubbard and Beeby [13]approach reproduces satisfactorily the general characteristics of dispersion
curves. The choice of the local field correction functions of the electron gas is also an important factor
in the study of metallic properties. Hence, in present study the model potential along with Ichimaru
and Utsumi local field correction function [7] seems to be capable of explaining the phonon dispersion
curves (PDC) of liquid metallic alloys. We could not compare PDCs and elastic moduli due to
unavailability of experimental and theoretical results, though our findings are guidelines for future
investigation.

International Journal of Research in Modern Engineering and Emerging Technology (IJRMEET) UGC Approved id_47203
Vol. 5, Sp. Issue: 9, Sept.: 2017 (IJRMEET) ISSN: 2320-6586
162 Online International, Refereed, Impact factor & Indexed Monthly Journal www.raijmr.com
RET Academy for International Journals of Multidisciplinary Research (RAIJMR)
Acknowledgments: ABP is thankful to UGC, New Delhi for BSR Start-Up Research Grant, DRS-
SAP program: No.F. 530/10/DRS/2010 (SAP-I) and DST-FIST (DST/FST/PSI-198/2014).
References:
1. S. Hosokawa, H. Sinn, F. Hensel, A. Alatas, E. E. Alp, W.-C. Pilgrim, J. Non-Cryst. Solids,
2002, 312–314, 163.
2. A. B. Patel, PhD Thesis, Sardar Patel University, 2014.
3. A. B. Patel, N. K. Bhatt, B. Y. Thakore, A. R. Jani, AIP Conf. Proc., 2013, 1536, 589.
4. A. B. Patel, N. K. Bhatt, B. Y. Thakore, P. R. Vyas, A. R. Jani, Phys. Chem. Liquids, 2014, 52
471.
5. A. B. Patel, N. K. Bhatt, B. Y. Thakore, P. R. Vyas, A. R. Jani, Mol. Phys., 2014, 112, 2000.
6. A. B. Patel, N. K. Bhatt, B. Y. Thakore, P. R. Vyas, A. R. Jani, Eur. Phys. J. B., 2014, 87, 1.
7. S. Ichimaru, K. Utsumi, Phys. Rev. B., 1981, 24, 3220.
8. M. Hasegawa, K.Hoshino, M. Watabe, H. Young, J. Non-Cryst. Solids, 1990, 117/118, 300.
9. K. Hoshino, W. H. Young, J. Phys. F: Met. Phys, 1986, 16, 1659.
10. K. Hoshino, M. Silbert, A. Stafford, W. H. Young, J. Phys. F., 1987, 17, L49.
11. C. H. Patel, N. K. Bhatt, P. N. Gajjar, Proc. Natl. Conf. on “Recent adv. in materials Sci. &
Tech.”, Dec. 22-23, 2014, MLV Govt. College, Bhilwara, Rajasthan.
12. N. W. Ashcroft, D. C. Langreth, Phys Rev., 1967, 156, 685.
13. J. Hubbard, J. L. Beeby, J. Phys. C, 1969, 2, 556.
14. W.-C. Pilgrim, S. Hosokawa, H. Saggau, H. Sinn, E. Burkel, J. Non Cryst. Solids, 1999, 250–
252, 96, and references therein.
15. S. Hosokawa, J. Greif, F. Demmel, W.-C. Pilgrim, Nucl. Instrum. and Meth. B, 2003, 199,
161.
16. L. E. Bove et al., Phys. Rev. Lett., 2001, 87, 215504.
17. T. Scopigno et al., J. Phys.: Condens. Matter, 2000, 12, 8009.
18. P. Haussler, Physics Reports, 1992, 222, 65.

International Journal of Research in Modern Engineering and Emerging Technology (IJRMEET) UGC Approved id_47203
Vol. 5, Sp. Issue: 9, Sept.: 2017 (IJRMEET) ISSN: 2320-6586
163 Online International, Refereed, Impact factor & Indexed Monthly Journal www.raijmr.com
RET Academy for International Journals of Multidisciplinary Research (RAIJMR)
Kinetic studies of sorption of zinc ions onto activated carbon
Parth Joshi*1, Desai Avani
2 and Desai Riddhi
2
1Department of Physics, Uka Tarsadia University, Bardoli, Gujarat-394350 2Department of Physics, Veer Narmad South Gujarat University, Surat-395007
*E-mail: [email protected]
Abstract
Carbon in dense as well as porous solid form is used in a variety of applications. Activated
porous carbons are made through pyrolysis and activation of carbonaceous natural as well as
synthetic precursors. The use of low-cost activated carbon derived from sugarcane baggase, an
agricultural waste material, has been investigated as a replacement for the current expensive
methods of removing zinc ions from wastewater. With a view to find a suitable application of
the material, activated carbon has been derived, characterized and utilized for the removal of
zinc. The kinetics of adsorption depends on the adsorbate concentration and the physical and
chemical characteristics of the adsorbent. Therefore, this study revealed that sugarcane baggase
can serve as a good source of activated carbon with multiple and simultaneous metal ions
removing potentials and may serve as a better replacement for commercial activated carbons in
applications that warrant their use.
Keywords: Adsorption, activated carbon, zinc removal.
1. Introduction
In recent times, carbon has been one of the magnificent elements which have
revolutionized materials science. Carbon provides materials with excellent properties for a
large spectrum of industrial applications [1]. From carbon we obtain the strongest fibers
(carbon fibers), one of the best solid lubricants (graphite), one of the best electrically
conducting materials (graphite electrodes), the best structural material for high temperature
tribological application (carbon–carbon composites), one of the best porous gas adsorbers
(activated carbon), an essentially non-crystalline impermeable material (vitreous carbon), the
hardest material (diamond), and now the most fascinating material, the fullerenes. All these
forms are made by meticulously choosing the raw materials and processing conditions.

International Journal of Research in Modern Engineering and Emerging Technology (IJRMEET) UGC Approved id_47203
Vol. 5, Sp. Issue: 9, Sept.: 2017 (IJRMEET) ISSN: 2320-6586
164 Online International, Refereed, Impact factor & Indexed Monthly Journal www.raijmr.com
RET Academy for International Journals of Multidisciplinary Research (RAIJMR)
Porous carbons can be grouped into two categories: (i) Carbon foams with desired
architecture of pores for structural and thermal applications; recently, these have been used as
templates for making ceramics, (ii) activated carbons consisting of porous carbons with added
active surface chemical groups. Porous carbons, especially activated porous carbons, constitute
one of the most important types of industrial carbons and have been in use for thousands of
years. Their use in water purification can be dated back to 2000 BC when ancient Egyptians
used charcoal to purify water for medicinal purposes. It was during World War I that major
developments in the use of porous carbons began and there was no going back afterwards.
Newer and more modern technologies have since then developed both for the manufacturing
and application of this versatile material [2]. Activated carbon fibers with very high surface
area (around 2000 m2/gm) have been the latest addition in the family of porous carbons [3].
These fibrous materials have widened the application potential to gas storage and energy areas.
The term activated carbon defines a group of materials with highly developed internal surface
area and porosity, and hence a large capacity for adsorbing chemicals from gases and liquids.
Activated carbons are extremely versatile adsorbents of industrial significance and are used in
a wide range of applications which are concerned principally with removal of undesired
species by adsorption from liquids or gases, in order to effect purification or the recovery of
chemical constituents. They also find use as catalysts or catalyst supports [4]. The strong
market position held by the activated carbon adsorbents relates to their unique properties and
low cost compared with that of possible competitive inorganic adsorbents like zeolite.
Moreover, in porous carbons a broad distribution in pore size and shape is usually obtained in
sharp contrast to almost constant pore size in zeolite. This makes activated carbons more
versatile adsorbing materials. Porous adsorbing carbons are associated with new processes for
development of these materials, mechanisms, material characterization and newer application.
More than 30% of the carbon research world over revolves around activated carbons; newer
precursors, methods of activation and applications.
Zinc is one of the heavy metals considered toxic to plants, invertebrates and even
vertebrate fish. Though zinc is useful to man but excess amount of zinc ions in waste waters
may cause zinc toxicity which could lead to severe hemolytic anemia, liver and kidney
damages; vomiting and diarrhea [5]. Zinc oxide is widely used as a white pigment in paints,
and as a catalyst in the manufacture of rubber [6]. High release of zinc ions into the

International Journal of Research in Modern Engineering and Emerging Technology (IJRMEET) UGC Approved id_47203
Vol. 5, Sp. Issue: 9, Sept.: 2017 (IJRMEET) ISSN: 2320-6586
165 Online International, Refereed, Impact factor & Indexed Monthly Journal www.raijmr.com
RET Academy for International Journals of Multidisciplinary Research (RAIJMR)
environment is also toxic to agricultural activities, sediment entrainment and groundwater. As a
result of this inevitable development due to industrial discharge, a few techniques for the
removal of these heavy metals (lead, zinc, zinc, nickel, chromium, mercury, cadmium,
aluminum, manganese and cobalt) were introduced by concerned researchers for the removal
of these heavy metals from untreated water. These methods are reverse osmosis, ultra filtration,
nano-filtration, coagulation, sedimentation, adsorption, etc. Though, it was discovered that
these methods have been proved to have a lot of disadvantages which includes cost of
operation and production of post sludge. Among the aforementioned treatment methods,
adsorption had been reported as an efficient and economic option [7,8] especially when the
source of adsorbent is economical. Adsorption is one of the cheap and most effective methods
in water purification and activated carbon is preferred adsorbent that is wildly used to treat
waste water containing different classes or types of metal ions. Activated carbon has the
tendency of adsorbing large and small dissolved organic molecules such as gases, chemicals
and metal ions.
Therefore the objectives of these work is to study the kinetics of the removal of zinc ions
using activated carbon from Sugarcane baggase.
2. Processing of activated carbon
Activated carbons are manufactured by the pyrolysis of carbonaceous materials of
vegetable origin, such as Sugarcane baggase, White straw, wood, coal, peat, fruit stones, and
shells or synthetic polymers such as viscose rayon, polyacrylonitrile (PAN) or phenolics
followed by activation of the chars obtained from them. m. The pyrolysis of any carbonaceous
material in absence of air involves decomposition of organic molecules, evolution of tarry and
gaseous products, and finally in a solid porous carbon mass. The porous carbons so obtained
contain predominantly macropores and practically inactive materials with specific surface area
of the order of several square meters per gram. An adsorbent with a highly developed porosity
and a correspondingly large surface area is obtained only by activating the carbonized material
either by physical or chemical activation. The processing of activated carbon basically involves
selection of raw material, carbonization and activation.
2.1 Raw materials
Sugarcane baggase (SB), a by-product procured from a local sugar processing factory was
the precursor used in this study. The collected sample was washed exhaustively with deionized

International Journal of Research in Modern Engineering and Emerging Technology (IJRMEET) UGC Approved id_47203
Vol. 5, Sp. Issue: 9, Sept.: 2017 (IJRMEET) ISSN: 2320-6586
166 Online International, Refereed, Impact factor & Indexed Monthly Journal www.raijmr.com
RET Academy for International Journals of Multidisciplinary Research (RAIJMR)
water to remove adhering dirt particles from the surface. Dried SB was cut, ground and
screened to the desired mesh size of 1–2 mm.
2.2 Activation
The raw material produced was mixed in potassium hydroxide solution with a raw
material (SB)/KOH impregnation with occasional stirring. After stirring the resultant sample
was dried at room temperature for 12 hour and then the resultant sample was dried at 120oC for
24 hour.
After it the sample was again dried for 6 hour and weight loss measured at every half
hour. The resultant sample was washed with hot and cold distilled water until the filtrate
reached to neutral pH.
2.3 Carbonization
The carbonization process was performed by loading 90 gm of dried KOH activated sample
into a furnace, and heated up to a carbonization temperature of 700o
C under purified N2 flow
and after carbonization 20 gm of activated carbon produced.
3. Results and Discussion
3.1 Effect of HA dosage
The adsorption capacity of zinc ions on HA was studied by changing the quantity of
adsorbent keeping the initial zinc ions concentration (100 mg/l), temperature and pH constant.
The adsorption of zinc ions onto HA included two steps-a fast initial adsorption followed by a
much slower gradual adsorption. The adsorption capacity increased sharply in the first 10 min
and then increased slowly. The adsorption equilibrium was reached with a solution contact
time of less than 3 h. Thus the time of 3 h was considered sufficient for the significant removal
of zinc ions and was therefore used for all the further experiments.
3.2 Adsorption kinetics
Kinetics of adsorption describes speeds of reactions that permit to determine the contact
time under agitation put to reach the adsorption equilibrium. In order to determine the
adsorption kinetics of zinc ions on HA, pseudo-first-order and pseudo-second order kinetic
models were applied to the experimental data. Fig. 1 shows the linear plot of log (qe-qt) versus
t. Fig. 2 showed the linear plot of t/qt versus t.
Correlation coefficients of second-order equation for all HA dosage was higher than the
first-order equation and its calculated equilibrium adsorption capacities, qe2, fitted well the

International Journal of Research in Modern Engineering and Emerging Technology (IJRMEET) UGC Approved id_47203
Vol. 5, Sp. Issue: 9, Sept.: 2017 (IJRMEET) ISSN: 2320-6586
167 Online International, Refereed, Impact factor & Indexed Monthly Journal www.raijmr.com
RET Academy for International Journals of Multidisciplinary Research (RAIJMR)
experimental data. These suggest that the pseudo second-order adsorption mechanism is
predominant and that the overall rate of the metal ions adsorption process appear to be
controlled by the chemical process. For the both pseudo equation, the rate constants increases
with an increasing of initial HA dosage.
Figure 1. Adsorption kinetics of zinc ions by activated carbon by pseudo-first order.
Figure 2. Adsorption kinetics of zinc ions by activated carbon by pseudo-second order.
Also, based on the comparison between experimental and theoretically calculated qe
values, it was found that the pseudo second-order model fitted better than pseudo first order
y = -0.017x + 1.884R² = 0.904
y = -0.013x + 1.749R² = 0.835
-0.4
0.1
0.6
1.1
1.6
2.1
0 20 40 60 80 100 120
log(
qe-q
t)
Time (min)
0.125 gm HA
0.100 gm HA
(a)
y = -0.009x + 1.533R² = 0.896
y = -0.007x + 1.512R² = 0.911
-0.2
0
0.2
0.4
0.6
0.8
1
1.2
1.4
1.6
0 20 40 60 80 100 120 140 160
log(
qe-q
t)
Time (min)
0.075 gm HA
0.050 gm HA
(b)
y = 0.012x + 0.330R² = 0.990
y = 0.014x + 0.290R² = 0.987
0
0.5
1
1.5
2
2.5
0 20 40 60 80 100 120 140
t/q
t
Time (min)
0.125 gm HA
0.100 gm HA
(a)
y = 0.015x + 0.255R² = 0.991
y = 0.015x + 0.248R² = 0.992
0
0.5
1
1.5
2
2.5
3
0 20 40 60 80 100 120 140 160 180
t/q
t
Time (min)
0.075 gm HA
0.050 gm HA
(b)

International Journal of Research in Modern Engineering and Emerging Technology (IJRMEET) UGC Approved id_47203
Vol. 5, Sp. Issue: 9, Sept.: 2017 (IJRMEET) ISSN: 2320-6586
168 Online International, Refereed, Impact factor & Indexed Monthly Journal www.raijmr.com
RET Academy for International Journals of Multidisciplinary Research (RAIJMR)
model for removal of zinc ions. This model is more likely to predict the kinetic behavior of
adsorption with chemical reaction being the rate-controlling step and it provides best
correlation to describe chemical adsorption process between the adsorbent and adsorbate. This
suggests that the rate-limiting step of this adsorption system may be chemical adsorption or
chemisorption involved valence forces through sharing or exchange of electrons between
adsorbent and adsorbate.
3.3 Effect of temperature
The temperature has two major effects on the adsorption process. Increasing the
temperature is known to increase the rate of diffusion of the adsorbed molecules across the
external boundary layer and the internal pores of the adsorbent particles, owing to the decrease
in the viscosity of the solution. The removal of zinc ions increases from 23.51 mg/g to 42.12
mg/g by increasing the temperature of the solution from 283K to 323K, indicating that the
process to be endothermic. This kind of temperature dependence of the amount of the zinc ions
adsorbed may be due to the fact that a possible mechanism of interaction is the reaction
between the zinc ions and the cationic sites of HA such a reaction could be favored at higher
temperatures.
3.4 Thermodynamics study
Fig. 3 - Enthalpy and Entropy determination curve for the adsorption of zinc ions using
activated carbon.
The Gibbs free energy change (∆G˚) is negative as expected for a spontaneous process
under the ambient condition. The negative ΔG˚ values indicated that the adsorption of zinc ions
y = -94.27x + 13129R² = 0.986
-20000
-18000
-16000
-14000
-12000
-10000
-8000
-6000
-4000
-2000
0
280 300 320 340
∆G
0
Temp (K)

International Journal of Research in Modern Engineering and Emerging Technology (IJRMEET) UGC Approved id_47203
Vol. 5, Sp. Issue: 9, Sept.: 2017 (IJRMEET) ISSN: 2320-6586
169 Online International, Refereed, Impact factor & Indexed Monthly Journal www.raijmr.com
RET Academy for International Journals of Multidisciplinary Research (RAIJMR)
onto activated carbon was thermodynamically feasible and spontaneous. The enthalpy (ΔH˚)
and entropy (ΔS˚) changes were determined as 13129 J/mol and 94.27 J/mol K, respectively,
from ΔG˚ versus Temperature (K) plot as shown in Fig. 3. The positive value of ΔH˚ confirmed
the endothermic character of the adsorption process. The positive values of ΔS˚ also revealed
the increase of randomness at the solid–solute interface during the adsorption of zinc ions onto
activated carbon. The low value of ΔS˚ indicated that no remarkable change on entropy occurs.
The positive value of entropy change (∆S˚) reflects the affinity of activated carbon toward zinc
ions in aqueous solutions and may suggest some structure changes in the adsorbents. A positive
entropy change for adsorption of metal ions on activated carbon is due to the fixation of ions
on the exchange sites of the randomly distributed surfactant species.
4. Conclusion
The result show that activated carbon , is a good adsorbent for zinc ions and therefore can be
potential candidate for removal of zinc ions from wastewater. The adsorption of zinc ions is
found to increase significantly with the increase in temperature and dosage of the activated
carbon. The thermodynamics of the system pointed out the system was spontaneous and
endothermic. The adsorption process is found to be of second order with the surface diffusion
as one of the rate determining steps. The present study concludes that the activated carbon
could be employed as an efficient adsorbent to remove the zinc ions from wastewater.
References
1) T. Burchell, In Carbon materials for advanced technologies (ed.), 1999, 95.
2) Derbyshier F, Porosity in carbons “Characterization and applications” (ed.),1995, 227.
3) Suzuki M., Active carbon fibre: fundamentals and applications. Carbon, 1994, 32, 577.
4) Patrick J W., Porosity in carbons, Characterisation and application, 1994, 124.
5) A .Muataz, 2nd
International Conference on Environment Science and Technology Singapore,
2011.
6) M . Sekar, V . Sakthi, and S. Rengaraj, Journal. Colloid Interface Science, 2004,279, 307.
7) A. H. Mahvi, International Journal Environment Science Technology, 2008, 5 ,275.
8) M . Malakootian, J. Nouri, and H. Hossiani, Journal Environment Science Technology,
2009,6, 183.
9) S. Babel, T., Kurniawan, Journal of hazardous materials,2002, 219.
10) I.N. Jha, L. Iyengar, A.V.S.P. Rao, J. Environ. Eng., 1988, 114, 962.

International Journal of Research in Modern Engineering and Emerging Technology (IJRMEET) UGC Approved id_47203
Vol. 5, Sp. Issue: 9, Sept.: 2017 (IJRMEET) ISSN: 2320-6586
170 Online International, Refereed, Impact factor & Indexed Monthly Journal www.raijmr.com
RET Academy for International Journals of Multidisciplinary Research (RAIJMR)
11) J.-W. Shim, S.-J. Park, S.-K. Ryu, Carbon, 2001, 39, 1635.
12) S.K. Srivastava, V.K. Gupta, D. Mohan, J. Environ. Eng., 1997, 123 ,461.
13) Rodriguez R., Chemistry and physics of carbon (ed.) P A Thrower, 21, 1, 1995.
14) F. Ferrero, M.P.G. Prati, Annali di Chimica, 1986, 86, 125.
15) M.C. Sekhar, B. Chakravarthy, J. Indian Water Works Assoc. XXXII , 2000,4 ,305.

International Journal of Research in Modern Engineering and Emerging Technology (IJRMEET) UGC Approved id_47203
Vol. 5, Sp. Issue: 9, Sept.: 2017 (IJRMEET) ISSN: 2320-6586
171 Online International, Refereed, Impact factor & Indexed Monthly Journal www.raijmr.com
RET Academy for International Journals of Multidisciplinary Research (RAIJMR)
Study of Atomic Force Microscopy On Tungsten Diselenide
Single Crystals Doped By Copper
M. N. Parmar
Department of Physics, The H. N. S. B. Ltd. Science College, Himatnagar, Gujarat
*Corresponding author Email: [email protected]
Abstract
Tungsten diselenide is a diamagnetic semiconductor which belongs to the family of group VI
B layer type transition metal dichalcogenides. The material exhibits extreme anisotropy in
electrical optical and mechanical properties along and perpendicular to vander waal planes.
This paper deals with copper doping in tungsten diselenide single crystals by vapour phase
technique. AFM are measured on CuxWSe2 ( x= 0, 0.5, 1.0 ) single crystals. The results thus
obtained from above measurements are discussed below in this paper.
Key Words :Crystal Growth ,Vapour phase technique, AFM
Introduction
The transition metal disulphides and diselenides have attracted considerable attention during
the past few years [1,2]. These MX2 (M = transition metal; X = Chalcogen) compounds are
formed by a layer of transition metal atoms between two layers of sulphur or selenium atoms.
There is a strong covalent bonding within the layers, but a weak van der Waals bonding
between them. These materials are used in such diverse applications as catalysis [3], batteries
[4] and lubricants [5]. Recently, these materials have found potential use in the fabrication of
photoelectrochemical (PEC) solar cell for solar energy conversion. It has also been realized
that selenides are more efficient as solar cell materials than sulphides[6]. In light of this
realization, the growth of tungsten diselenide single crystals and its doped compounds using
vapour transport technique have attracted more attention recently. This paper mainly focuses
on Atomic Force Microscope(AFM) by taking real and fourier transform images of
CuxWSe2(x = 0, 0.5, 1.0) single crystals.
Experimental Procedure:
Scanning probe microscope (SPM) consists of family of microscopy where a sharp probe is
scanned across a surface and some tip- sample interactions are monitored.
SPM consist of many forms like scanning tunneling microscope (STM), Atomic Force
Microscope (AFM), magnetic force microscope (MFM), Electric force microscope (EFM)
etc. AFM is one type of scanning probe microscope and also known as nanoscope. It has
ability to create three dimensional micrograph of sample surface with resolution down to the
nano-meter and angstrom scale. These are also capable of measuring or imaging force
between tip and sample surface like van der Waal’s force with resolution in the range of few
nano-Newtons.
AFM operates in three modes.
1. Contact mode AFM.
2. Tapping mode AFM.
3. Non contact mode AFM.
AFM consists of microscope force sensor that responds to a force and a detector that measure
the sensor’s response. In the AFM, sensor is a cantilever with an effective spring constant k.
At the end of the lever, is a sharp tip which is used to sense the force between the tip and
sample. Lever deflects in accordance with the force acting on the tip. Detector measures the

International Journal of Research in Modern Engineering and Emerging Technology (IJRMEET) UGC Approved id_47203
Vol. 5, Sp. Issue: 9, Sept.: 2017 (IJRMEET) ISSN: 2320-6586
172 Online International, Refereed, Impact factor & Indexed Monthly Journal www.raijmr.com
RET Academy for International Journals of Multidisciplinary Research (RAIJMR)
deflection of the lever. In AFM we use the laser feedback detection system which can then be
used to determine the force on the tip by using Hooke’s law F= k z, where z is cantilever
displacement. If the sample is scanned under the tip, force between tip and sample surface
and image of the sample surface are generated. By scanning the AFM cantilever over a
sample surface and recording the deflection of the cantilever the local height of the sample is
measured, three dimensional topographical maps of the surface are then constructed by
plotting the local sample height versus horizontal probe tip position. Several forces typically
contribute to the deflection of an AFM cantilever which are intermolecular microscopic
forces.
Main components of AFM instrument:
The various component of AFM are Scanning probe microscope (SPM), controller, computer,
display monitor and control monitor. The main component of the system is scanning probe
microscope (SPM). The main parts of the SPM are SPM head, scanner, cantilever, tip, control
and feedback system.
SPM head:
It contains photodetector system, cantilever and tip. There are many types of detection
systems like tunneling detection system, capacitance detection system, laser diode photo
detection system etc. In AFM laser diode photo detection system is normally being used. In
this a laser light is being used because it is highly coherent and the spot size is also short.
Laser light is focused on the cantilever supporting the force-sensing tip. And it is reflected
back to photodiode. If cantilever deflect with an angle then laser light reflect with twice the
angle. In this system a four photodiode system is used and is known as quad photodiode.
The four elements of the quad photodiode are combined to provide the different information
depending on the operation mode. At starting the cantilever is fixed at a constant deflection
i.e., set point. And set the laser light with cantilever that after reflection laser light makes spot
at the center of the quad photodiode. Then all photodiodes collect equal light and give it
current that is same. When tip is deflected the laser light also shows the deflection on the
photodiode. These minute deflections of the lever cause the photo detector to collect more
light to other one. And this current fed to substractor and the output of this substractor is
proportional to the deflection of the lever. This is used to image the force across the sample
and maintained set point.
Cantilever :
Cantilever is a beam that is supported at one end and other end is free to move. In AFM force
sensing tip is mounted at the free end of the lever. AFM cantilever is flexible beam whose
geometrical and material property plays an important role in determining the sensitivity and
resolution of AFM. In contact AFM mode cantilever’s flexibility acts as a nanometeric spring
allowing the tip to measure the surface force. For contact mode AFM imaging, it is necessary
to have a cantilever which is soft enough to be deflected by very small forces (k is small) and
has a high enough resonant frequency to not be susceptible to vibration instabilities. This is
accomplished by making the cantilever short, to provide a high resonant frequency and thin
to provide a small force constant. The silicon nitride tip and cantilever is being used
normally. This tips exhibit excellent flexibility. For the typical silicon nitride tips, the value
of spring constant k is 0.58, 0.32, 0.12 or 0.06 N/m depend upon geometry of cantilever.
Cantilever lengths 100 to 200m and tip radius of curvature is 20 – 60 nm. In tapping mode
the cantilever is oscillating up and down at its resonance frequency while its amplitudes are
monitored. In the tapping mode we use much stiffer crystal silicon probe which is oscillated
to its resonance frequency, because tip describes a high frequency oscillating arc (100 kHz)

International Journal of Research in Modern Engineering and Emerging Technology (IJRMEET) UGC Approved id_47203
Vol. 5, Sp. Issue: 9, Sept.: 2017 (IJRMEET) ISSN: 2320-6586
173 Online International, Refereed, Impact factor & Indexed Monthly Journal www.raijmr.com
RET Academy for International Journals of Multidisciplinary Research (RAIJMR)
and larger force constant. It possesses sufficient energy to break free of surface tension force.
This is also non-conducting material. The probe is considerably stiffer than silicon nitride
making it more brittle and less forgiving .The tip and cantilever are an integrated assembly of
single crystal silicon, produced by etching techniques. For typical single crystal silicon
probes, spring constant k = 20 –100 N/m, resonant frequency 200 –400 kHz, tip radius of
curvature 5 -10 nm and cantilever length is about 125m.
Scanner :
In AFM scanner is used for movement of sample or tip. These scanners are made from piezo
electric material (example ceramic polycrystalline material ) which expands and contracts
proportionally to an applied voltage. Piezomaterial expands or contract depends upon the
polarity of the voltage applied. Scanners are of many sizes and each scanner exhibits its own
unique properties. In AFM a scanner tube is being used, which is constructed by combining
independently, operated piezoelectrodes for x, y and z direction, which can manipulate
sample and probes with extreme precision in three dimensions.
Feedback loop :
To produce images the SPM must be capable of controlling the tip sample interaction with
the great precision with the use of feedback loop which safeguards tip and sample by keeping
force between them at a user specified set point level. Set point refers to how much tip
sample force is to be maintained which means that how much force can be applied on the tip
which is just enough to trace the surface features and not so much that the tip is broken off or
sample is damaged. In contact AFM mode the deflection of the cantilever, the tip’s height
above the surface can be precisely maintained. To control this we adjust various gains in the
SPM feed back circuit. The main gains are:
Proportional gain : Amount of correction applied in response to the error signal between set
point force and actual force measured by the detection in direct proportion to the error.
Integral gain : Amount of correction applied in response to the average error between set
point force and actual force measured by the detector.
Look ahead gain : Amount of correction applied in response to the error signal between set
point force and actual force measured by the detector based upon recorded information the
adjacent scan line. Computer works as a controller of feed back loop. Atomic Force
Microscope - Nanoscope is shown in Fig. 1
Fig.1 Atomic Force Microscope (AFM) – Nanoscope

International Journal of Research in Modern Engineering and Emerging Technology (IJRMEET) UGC Approved id_47203
Vol. 5, Sp. Issue: 9, Sept.: 2017 (IJRMEET) ISSN: 2320-6586
174 Online International, Refereed, Impact factor & Indexed Monthly Journal www.raijmr.com
RET Academy for International Journals of Multidisciplinary Research (RAIJMR)
Results and Discussion Surface morphological studies on single crystals of CuxWSe2 (x = 0, 0.5, 1.0) are carried out
by above described Atomic Force Microscope ( in contact mode ) using silicon nitride tip.
With the help of Nanoscope control software package, various section analysis like
periodicity along specific direction, fourier transform of images are studied.
Fig.2 for WSe2 crystal shows the periodicity along any specific direction and the image
clearly shows that atoms in the lattice are arranged in a regular fashion. The measured
horizontal distance is 0.321nm and this value between any two consecutive atoms is
maintained throughout.
Fig.2 Section analysis( periodicity) for WSe2 single crystal
Fig.3 shows layers on the surface of WSe2 in a scanning region of 2.00m with scan rate
10.17Hz. The depth profiling on the surface shows that layers are nearly separated by 20nm
distance from each other.
Fig.3 Shows layers of WSe2 single crystal separated by 20nm distance.
Fig.4 which is again a section analysis for periodicity and it clearly indicates that atoms are
arranged in similar fashion as it was observed in Fig.2. But the scanned region in this image
is different then the previous image which means that crystal are possessing good periodicity
in different region as well.

International Journal of Research in Modern Engineering and Emerging Technology (IJRMEET) UGC Approved id_47203
Vol. 5, Sp. Issue: 9, Sept.: 2017 (IJRMEET) ISSN: 2320-6586
175 Online International, Refereed, Impact factor & Indexed Monthly Journal www.raijmr.com
RET Academy for International Journals of Multidisciplinary Research (RAIJMR)
Fig. 4 Section analysis( periodicity) from different region for WSe2 single crystal.
Fig.5 and Fig.6 are three dimensional view of previous images for WSe2 single crystal
showing periodicity at atomic level.
Fig. 5 Three dimensional photograph for WSe2 single crystal
Fig.6 Another view of three dimensional photograph for WSe2 single crystal

International Journal of Research in Modern Engineering and Emerging Technology (IJRMEET) UGC Approved id_47203
Vol. 5, Sp. Issue: 9, Sept.: 2017 (IJRMEET) ISSN: 2320-6586
176 Online International, Refereed, Impact factor & Indexed Monthly Journal www.raijmr.com
RET Academy for International Journals of Multidisciplinary Research (RAIJMR)
Fig.7 is a section analysis (angle) of Fig.4 which shows pattern of hexagons in the figure.
Now, if we measure the internal angle of hexagon it comes about 124.700 as it is well known
that the internal angle of perfect hexagon is 1200 i.e. it represents perfect hexagonal shape at
atomic level. Similar kind of pattern is obtained on MoS2 crystal using AFM by M. Remskar
et al [7].
Fig. 7 Section analysis (angle) for WSe2 single crystal
Parallel kinds of studies are carried out on Cu0.5WSe2 and Cu1.0WSe2 single crystal and are
discussed below.
Now Fig.8 is a section analysis of 2-D topograph of copper doped WSe2 single crystal and
from the graph in the inset it is clear that atoms are arranged in periodic manner in all
direction. The measurements are taken along one specific direction which shows that
horizontal distance between two points is 0.321nm and that is maintained throughout the
specific direction.
Fig.8 Section analysis ( periodicity) for copper doped WSe2 single crystal.
Fig.9 shows section analysis (angle) of copper doped WSe2 single crystal and shows that
internal angle of hexagon is 123.21A0.

International Journal of Research in Modern Engineering and Emerging Technology (IJRMEET) UGC Approved id_47203
Vol. 5, Sp. Issue: 9, Sept.: 2017 (IJRMEET) ISSN: 2320-6586
177 Online International, Refereed, Impact factor & Indexed Monthly Journal www.raijmr.com
RET Academy for International Journals of Multidisciplinary Research (RAIJMR)
Fig. 9 Section analysis (angle) for copper doped WSe2 single crystal
Conclusion
AFM pictures taken on these samples clearly reflects the periodicity in arrangement of atoms
which is very well maintained throughout the material and also the internal angle obtained
matches to that of on hexagon.
Acknowledgment
Thanks to My Guide Dr. M. P. Dhespande , Department of Physics Sardar Patel University
who gives me good bolden this work possible. Thanks are specifically to Dr. V. Ganesan,
Miss Swati Pandya and other students of low temperature laboratory IUC-DAE, Indore for
helping round the clock to carry out this work.
References:
[1] J Legma, G Vacquier, Mater.Sci.Engg.,B8 (1991)167.
[2] S. G. Patel Cryst. Res. Technol., 27 (1992)285.
[3] R. R. Chianelli Catal.Rev.-Sci. Eng., 26 (1984) 361.
[4] J Bouxel and R Brech Rev. Mater. Sci., 16 (1986) 137.
[5] J.Lince and P Fleischauer J. Mater. Res., 2 (1987)827.
[6] H. Tributsch J. Appl. Phys., 23 (1980)61.
[7] M. Remskar, Z. Skraba, C. Ballif, R. Sanjines, F. Levy
Surface Science, 433-435 ( 1999 ) 637-641.

International Journal of Research in Modern Engineering and Emerging Technology (IJRMEET) UGC Approved id_47203
Vol. 5, Sp. Issue: 9, Sept.: 2017 (IJRMEET) ISSN: 2320-6586
178 Online International, Refereed, Impact factor & Indexed Monthly Journal www.raijmr.com
RET Academy for International Journals of Multidisciplinary Research (RAIJMR)
Sorption study of cadmium ion using activated carbon
Parth Joshi*1, Desai Riddhi
2 and Desai Avani
2
1Department of Physics, Uka Tarsadia University, Bardoli, Gujarat-394350
2Department of Physics, Veer Narmad South Gujarat University, Surat-395007
*E-mail: [email protected]
Abstract
Carbon in dense as well as porous solid form is used in a variety of applications. Activated porous
carbons are made through pyrolysis and activation of carbonaceous natural as well as synthetic
precursors. The use of low-cost activated carbon derived from baggase, an agricultural waste
material, has been investigated as a replacement for the current expensive methods of removing
heavy metals from wastewater. With a view to find a suitable application of the material, activated
carbon has been derived, characterized and utilized for the removal of cadmium and. The uptake of
cadmium was found to be slightly greater and the sorption capacity increases with increase in
temperature. The adsorption of cadmium ions on activated carbon prepared from Sugarcane
Baggase obtained from local sugar industry was carbonized and chemically activated using
potassium hydroxide solutions as activating reagents. Studies were conducted to delineate the effect
of pH and initial metal ions concentration,. On the basis of these studies, various parameters were
evaluated to establish the mechanisms. Therefore sugarcane baggase can serve as a good source of
activated carbon with multiple metal-ions removing potential.
Keywords: Adsorption, Activated carbon, Baggase.
1. Introduction
Heavy metals are toxic to aquatic flora and fauna even in relatively low concentrations. Some of
these are capable of being assimilated, stored and concentrated by organisms. Cadmium is
accumulated in the human body, causing erothrocyte destruction, nausea, salivation, diarrhea and
muscular cramps, renal degradation, chronic pulmonary problems and skeletal deformity[1]. Heavy
metals are present in the soil, natural water and air in various forms and may become contaminates
in food and drinking water [2]. Some of them are constituents of herbicides, pesticides, paints and
fertilizers applications. Hazards associated with the contamination of water have led to the

International Journal of Research in Modern Engineering and Emerging Technology (IJRMEET) UGC Approved id_47203
Vol. 5, Sp. Issue: 9, Sept.: 2017 (IJRMEET) ISSN: 2320-6586
179 Online International, Refereed, Impact factor & Indexed Monthly Journal www.raijmr.com
RET Academy for International Journals of Multidisciplinary Research (RAIJMR)
development of various technologies for water purification namely filtration and ion exchange,
precipitation with carbonate or hydroxide [3]. Several treatment technologies exist for metal
removal, but the process of adsorption using of activated carbon has been found to be an efficient
technology for decolorization of west material.
In recent times, carbon has been one of the magnificent elements which have revolutionized
materials science. Carbon provides materials with excellent properties for a large spectrum of
industrial applications [4]. The term activated carbon define a group of materials with highly
developed internal surface area and porosity, and hence a large capacity for adsorbing chemicals
from gases and liquids. Activated carbons are extremely versatile adsorbents of industrial
significance and are used in a wide range of applications which are concerned principally with
removal of undesired species by adsorption from liquids or gases, in order to effect purification or
the recovery of chemical constituents. They also find use as catalysts or catalyst supports [5]. The
strong market position held by the activated carbon adsorbents relates to their unique properties and
low cost compared with that of possible competitive inorganic adsorbents like zeolites. Moreover,
in porous carbons a broad distribution in pore size and shape is usually obtained in sharp contrast to
almost constant pore size in zeolite. This makes activated carbons more versatile adsorbing
materials.
Heavy metals are non-biodegradable and they tend to accumulate in living organisms, causing
various diseases and disorder. Cadmium causes serious renal damage, anemia and hypertension.
Cadmium occurs naturally in the environment and the main anthropogenic pathway through which
cadmium enters environment is through waste from industrial processes such as electroplating,
smelting, alloy manufacturing, cadmium-nickel batteries, pesticides, mining, fertilizers, textile
operations and refining [6].
In the last two decades, extensive studies have been made on the selection and pyrolysis behavior
of new synthetic precursors to develop active carbons with very high adsorption
capacitiesandcontrolledporesizedistributionsforspecificenergyapplications.Theseprecursors are
polymer-based fibrous materials. The examples are viscose rayon, polyacrylonitrile, saran,
phenolic, PFA [7-9].
During carbonization, most of the non-carbon elements, hydrogen and oxygen are first removed in
gaseous form by pyrolytic decomposition of the starting materials, and the free atoms of elementary
carbon are grouped into organized crystallographic formations known as elementary graphite

International Journal of Research in Modern Engineering and Emerging Technology (IJRMEET) UGC Approved id_47203
Vol. 5, Sp. Issue: 9, Sept.: 2017 (IJRMEET) ISSN: 2320-6586
180 Online International, Refereed, Impact factor & Indexed Monthly Journal www.raijmr.com
RET Academy for International Journals of Multidisciplinary Research (RAIJMR)
crystallites. The mutual arrangement of the crystallite is irregular, so that free interstices exist
between them. Thus carbonization involves thermal decomposition of carbonaceous material,
eliminating non-carbon species producing a fixed carbon mass and rudimentary pore structure [10].
The process is usually carried out at temperature below 800˚C in a continuous stream of an inert
atmosphere. The important parameters that determine the quality and the yield of the carbonized
product are: (i) rate of heating, (ii) final temperature and (iii) soaking time. The carbonization
process involves various important stages that markedly determine the properties of the final
product to be obtained. The basic microstructure of the char with micro porosity is formed around
500˚C. Some of these pores are blocked by the tarry products evolved during pyrolysis and could
be available only when further heat treatment to about 800˚C is given. Further heat treatment to
temperature of 1000˚C and above normally lead to hardening of the carbon structure due to partial
alignment of graphitic planes and decrease in porosity which deaccelerate.
For quite some time we are involved in developing some low-cost activated carbons/adsorbents for
the removal and recovery of organics/metal ions from wastewater. Continuing our activities in this
direction, we have derived a new low-cost activated carbon from baggase (an agricultural waste
material) for the removal of cadmium from synthetic wastewater in systems successfully.
2. Preparation of activated carbon
2.1 Raw materials
Sugarcane baggase were bought in large quantity from local sugar factory, Bardoli. The Sugarcane
baggase were transported to the laboratory for immediate use. The Sugarcane baggase were sorted
out and which were thoroughly washed with water to remove dirt/ unwanted parts and dried very
well in an oven at 100˚C for one hour.
2.2 Activation
The raw material produced was mixed in potassium hydroxide solution with a raw material
(SB)/KOH impregnation with occasional stirring. After stirring the resultant sample was dried at
room temperature for 12 hours and then the resultant sample was dried at 120˚C for 24 housr. After
it the sample was again dried for 6 hours and weight loss measured at every half hour. The resultant
sample was washed with hot and cold distilled water until the filtrate reached to neutral pH.

International Journal of Research in Modern Engineering and Emerging Technology (IJRMEET) UGC Approved id_47203
Vol. 5, Sp. Issue: 9, Sept.: 2017 (IJRMEET) ISSN: 2320-6586
181 Online International, Refereed, Impact factor & Indexed Monthly Journal www.raijmr.com
RET Academy for International Journals of Multidisciplinary Research (RAIJMR)
2.3 Carbonization
The carbonization process was performed by loading 90 gm of dried KOH activated sample into a
furnace, and heated up to a carbonization temperature of 700˚ C under purified N2 flow and after
carbonization 20 gm of activated carbon produced.
3. Results and Discussion
3.1 Effect of cadmium ions concentration
The adsorption of cadmium ions was carried out at different initial concentrations ranging from 50
to 150 mg/l, at pH 7. A higher initial concentration provides an important driving force to overcome
all mass transfer resistances of the cadmium ions between the aqueous and solid phases, thus
increases the uptake of metal ions.
The results show that removal of cadmium ions from solution by activated carbon was found to be
dependent on the initial concentration of metal ions. The amount of adsorbed metal ions increased
with an increase in initial concentration. At low concentrations the available surface for adsorbate is
sufficient so the removal becomes independent of initial concentrations. However, in the case of
higher concentrations of adsorbate, available adsorption sites are occupied by the adsorbate and the
removal depends upon the initial concentrations.
3.2 Adsorption isotherms
The linearized Langmuir and Freundlich adsorption isotherms of cadmium ions obtained at the
cadmium ions concentration of 50 to 150 mg/l are shown in fig 3.1(a) & fig 3.1(b). An adsorption
isotherm is characterized by certain constants, values of which express the surface properties and
affinity of the adsorbent and can also be used to find the adsorption capacity of adsorbent.
As seen in figure, the values of R2
indicate that the adsorption pattern for cadmium ions by HA
followed both Freundlich isotherm (R2 > 0.852) and Langmuir isotherm (R
2 > 0.987). It is clear that
the Langmuir isotherm better fitted for the adsorption of cadmium ions by activated carbon. Results
indicate that the capacity of activated carbon for adsorption of cadmium ions is increased with
increase in concentration which is typical for adsorption of most metal ions from their solution.

International Journal of Research in Modern Engineering and Emerging Technology (IJRMEET) UGC Approved id_47203
Vol. 5, Sp. Issue: 9, Sept.: 2017 (IJRMEET) ISSN: 2320-6586
182 Online International, Refereed, Impact factor & Indexed Monthly Journal www.raijmr.com
RET Academy for International Journals of Multidisciplinary Research (RAIJMR)
4. Conclusion
Figure 3.1. Isotherm plot of cadmium ions adsorbed on activated carbon powders according to (a)
Langmuir adsorption model and (b) Freundlich adsorption model.
3.3 Effect of pH
pH of aqueous solution is an important controlling parameter for cadmium ions adsorption process
and thus role of hydrogen ion concentration was examined from solutions at different pH values
from 5 to 7. A neutral pH range was chosen because an optimum metal ions uptake could be attained
without precipitation of the metal ions. The maximum uptake level of cadmium ions was observed at
pH 7. It was observed from figure 3.2, that the percentage of adsorption of cadmium ions increased
with an increase in pH of the solution.
Figure 3.2. Adsorption studies of cadmium ions using different pH of initial solution.
y = 0.009x + 0.004R² = 0.987
0
0.1
0.2
0.3
0.4
0.5
0.6
0.7
0.8
0 20 40 60 80
Ce/
qe
(g/L
)
Ce (mg/L)
(ay = 0.153x + 1.702
R² = 0.852
1.65
1.7
1.75
1.8
1.85
1.9
1.95
2
0 0.5 1 1.5 2
log
qe
log Ce
(b)
0 20 40 60 80 100 120 140 160
0
10
20
30
40
50
60
70
Sorp
tion
(%
)
Time (min)
pH 7
pH 6
pH 5

International Journal of Research in Modern Engineering and Emerging Technology (IJRMEET) UGC Approved id_47203
Vol. 5, Sp. Issue: 9, Sept.: 2017 (IJRMEET) ISSN: 2320-6586
183 Online International, Refereed, Impact factor & Indexed Monthly Journal www.raijmr.com
RET Academy for International Journals of Multidisciplinary Research (RAIJMR)
4. Conclusion
Adsorption of cadmium ions on activated carbon achieves equilibration quickly. Adsorption of
cadmium ions on activated carbon is strongly dependent on pH values. The adsorption increases
with increasing pH values. The adsorption isotherms of cadmium ions on HA can be described well
by the Langmuir model. The results support reported two-step mechanism involved in the removal
of cadmium ions by activated carbon. Activated carbon can effectively remove cadmium ions in
aqueous solution under different experimental conditions and show potential application prospect.
Reference
1. D. Mohan, K. singh, water research 2002, 36,1.
2. D.N.Olowoyo, A.O.Garuba, Global Advanced Research journal food science technology(ed.),2012,1.
3. T. Burchell, In Carbon materials for advanced technologies (ed.), 1999, 95.
4. Jin H et al, The shape selectivity of activated carbon fibres on a palladium support. Carbon, 1996 39,
421.
5. Patrick J W , Porosity in carbons, Characterisation and applications,1995.
6. I. Mochida, K. Kuroda, S. Miyamoto, C. Sotowa, Y. Korai, S. Kawano, K. Sakanishi, A. Yasutake, and
M. Yoshikawa ,Energy Fuels, 1997, 11 , 272.
7. C.W. Cheung, J.F. Poter, G. McKay, Elovich. J. Chem. Technol. Biotechnol., 2000, 75, 963.
8. J .Wu, J. Lu, T.H. Chen, Z. He, Y. Su, X.Y. Yao, Environ. Earth Sci. 2010, 60, 421.
9. M. Inagaki , New carbons: control of structure & functions , 2000,126.
10. T . Mays, Active carbon fibres. In Carbon materials for advanced technologies (ed.) 199, 95.

International Journal of Research in Modern Engineering and Emerging Technology (IJRMEET) UGC Approved id_47203
Vol. 5, Sp. Issue: 9, Sept.: 2017 (IJRMEET) ISSN: 2320-6586
184 Online International, Refereed, Impact factor & Indexed Monthly Journal www.raijmr.com
RET Academy for International Journals of Multidisciplinary Research (RAIJMR)
Tailoring of Cu crystal phase withnon-face centred cubic
phase: the tetragonal phase
Ghanshyam R. Patel1*, Tushar C. Pandya2, Ashok N. Patel3 and Rajkumar G. Patel4
1Physics Department, Government Science College, Gandhinagar, Gujarat, India.
2Physics Department, St.Xavier’s College, Navrangpura, Ahmedabad, Gujarat, India.
3Physics Department, M.N.Science College, Patan Gujarat, India.
4Electrical Engineering Department, Nirma Institute of Technology, Gujarat, India.
*Email:[email protected]
Abstract: Crystallization of noble metal atoms usually leads to the highly symmetric face-centered
cubic phase that represents the thermodynamically stable structure. In the present work we have
made an effort to tailor the crystal structure of non –face-centered cubic phase of Cu with the help
of DFT using quantum espresso code. We have reported stable tetragonal crystal structures having
three and four number of atoms per unit cells. We report the formation of nano wire having
triangular and square cross section.
Introduction
Nanowires are very important for studying for nanotechnology applications as well as nano science.
In comparison to other low dimensional systems nano wires, have two quantum confined
directions, while one direction is unconfined for electrical conduction. Hence nano wires are used
in applications where electrical conduction, rather than tunnelling transport, is required [1]. Due to
their distinctive density of electronic states, nano wires in the limit of small diameters are expected
to exhibit significantly different optical, electrical and magnetic properties from their bulk
crystalline counterparts. Nano wire is having enhanced surface to volume ratio, very high density of
electronic states, size-dependent band gap, and increased surface scattering for electrons and
phonons compared to their bulk counterpart. Due to their potential application in various field in the
recent years, nano wires and nano rods of metallic and semi-conducting materials have drawn a lot
of research interest.
Metallic nanoparticles with tuneable crystalline phases and internal microstructures exhibits a class
of promising building blocks in achieving very high-strength materials [2].Noble metal
nanoparticles with closely packed non-face-centred cubic (f.c.c.) crystalline phase is rarely
reported. Yugang sun et al. [2] have observed that Ag nano plates with multiple parallel twin planes
exhibited a partial phase transition from f.c.c. to b.c.t. under external pressures higher than
12GPa.Although Ag nano cubes without internal crystalline defects remain perfect f.c.c. phase at
even higher pressures. These results indicate that controlling internal microstructures in nano
particles may represent a promising strategy to achieve tetragonal phase even for nano particles
with large lateral dimensions (for example,> 10nm) at ambient pressure.

International Journal of Research in Modern Engineering and Emerging Technology (IJRMEET) UGC Approved id_47203
Vol. 5, Sp. Issue: 9, Sept.: 2017 (IJRMEET) ISSN: 2320-6586
185 Online International, Refereed, Impact factor & Indexed Monthly Journal www.raijmr.com
RET Academy for International Journals of Multidisciplinary Research (RAIJMR)
By using first-principles calculations based on the density-functional theory, Mahmoud Jafri et al
[3]have systematically investigated the equilibrium structure and the electronic properties of
pentagonal and hexagonal copper nano wires (CuNWs) [3].
In the present work we have made an effort to tailor the crystal structure of non –face-centered
cubic phase of Cu with the help of DFT using quantum espresso code. We have found stable
tetragonal crystal structures having three and four number of atoms per unit cells.
Method of analysis
All the calculations for the tetragonal Cu unit cell with three and four atoms per unit cell have been
performed using density functional theory with the generalized gradient approximation (GGA)
using Perdew–Burke– Ernzerhof (PBE) parameterization of exchange correlation functional as
implemented in the Quantum Espresso code [4]. These calculations are performed using a plane-
wave basis [5]. The plane wave energy cutoff for three and four atoms are respectively 50 Ry and
60 Ry. For the Brillouin zone (BZ) integration we use a 1×1×30 and 1×1×36 sampling mesh for
unit cell withthree atoms and four atoms calculations respectively. Further, we have checked force
relaxation with 0.001118 Ry/au in three atoms per unit cell and 0.002545 Ry/au in four atoms per
unit cell. Convergence threshold used 1.0E-10. The Broyde-Fletcher- Goldfarb-Shanno (BFGS)
method is used for the geometry optimization. Here mixing beta was taken 0.7 and degauss 0.02
considered.
Result and Discussion
Variation of energy versus unit cell volume for tetragonal copper unit cell having three and four
atoms are shown in Fig.1.and Fig.2.respectivly.Minima ofthe energies are found at unit cell volume
125.97 (A0 )3 and 129.13(A0 )3 for three and four atoms per unit cell respectively.
Fig.1 Energy versus Volume for tetragonal copper unit
cell with three atoms
Fig.2 Energy versus Volume for tetragonal copper unit
cell with four atoms

International Journal of Research in Modern Engineering and Emerging Technology (IJRMEET) UGC Approved id_47203
Vol. 5, Sp. Issue: 9, Sept.: 2017 (IJRMEET) ISSN: 2320-6586
186 Online International, Refereed, Impact factor & Indexed Monthly Journal www.raijmr.com
RET Academy for International Journals of Multidisciplinary Research (RAIJMR)
In the Fig.3 simulated image of tetragonal Cu unit cell having three atoms is shown. In Fig.4.
proposed nano wire with triangular cross-section is shown along 2x2x10.
Fig.3. Image of simulated three atom tetragonal copper unit
cell
Fig.4 simulation of triangle cross section nanowire
along 2x2x10
Similarly in the Fig.5 simulated image of tetragonal Cu unit cell having four atoms is shown. In
Fig.6. proposed nano wire with square cross-section is shown along 2x2x10.
Fig.5.Image of simulated four atom tetragonal copper unit
cell Fig.6 simulation of square cross section nanowire
along 2x2x10
Conclusion
We have found that tetragonal unit cell having three atoms is more stable triangular structure. In
this case we have found three different bond lengths, 2.4726A0, 2.4748A
0 and 2.4290 A
0 Similarly
We have found that tetragonal unit cell having four atoms is also stable square structure. In this
case the bond lengths and diagonal length are 2.1860A0and 3.0929 A
0respectively.Both optimised
stable unit cell can be extended in the direction of primitive translation vector c for the simulation
of nano wire.
References
[1] Nanotechnology and nano materials chapter 20, Hardevsingh virk. doi.10.572/16382 (2011).
[2] Yugang sun et al., nature communication (2012).

International Journal of Research in Modern Engineering and Emerging Technology (IJRMEET) UGC Approved id_47203
Vol. 5, Sp. Issue: 9, Sept.: 2017 (IJRMEET) ISSN: 2320-6586
187 Online International, Refereed, Impact factor & Indexed Monthly Journal www.raijmr.com
RET Academy for International Journals of Multidisciplinary Research (RAIJMR)
[3] Mahmoud Jafri et al. computational material science.77, 224-229.(2013)
[4] Baroni S.; Corso A. D.; Gironcoli S.; Giannozzi P.; http://www.pwscf.org
[5] Baroni S.; Gironcoli S. de. Corso D.; Giannozzi P. Rev. Mod. Phys. 73, 515. 2001

International Journal of Research in Modern Engineering and Emerging Technology (IJRMEET) UGC Approved id_47203
Vol. 5, Sp. Issue: 9, Sept.: 2017 (IJRMEET) ISSN: 2320-6586
188 Online International, Refereed, Impact factor & Indexed Monthly Journal www.raijmr.com
RET Academy for International Journals of Multidisciplinary Research (RAIJMR)
Ultrasonic velocity and density of binary mixtures of 1-butyl-3-
methylimadazolium and methanol at 293.15 K
D. K. Barot, V. A. Rana* , H. A. Chaube
Department of Physics, School of Sciences, Gujarat University, Ahmedabad, Gujarat, India
*E mail: [email protected]
Abstract
Physical properties such as ultrasonic velocity (u), density (ρ), viscosity (η) and refractive
index (n) of 1-Butyl-3-methylimadazolium [BMiM][Cl] with methanol (MeOH) of varying
concentration have been measured using ultrasonic interferometer, pyknometer, Ostwald’s
viscometer and Abbe’s refractometer respectively at 293.15K. From the measured values
various acoustical parameters such as, adiabatic compressibility (β), acoustic impedance (Z)
and free length (Lf), etc. have been calculated for all solutions to obtain some structural
information. Results of refractive index are used to calculate dielectric constant at optical
frequency. Obtained parameters were found to vary with the weight fractions of [BMiM][Cl] in
MeOH.
Keywords: Ultrasonic velocity; density; Viscosity; adiabatic compressibility; free length;
acoustic impedance
Introduction
The study of physiochemical behavior and molecular interactions in ionic liquids in pure as
well as in mixed state is of considerable importance and a number of experimental techniques
have been used to investigate the interactions between the components of liquid mixtures. In
recent years, the measurement of ultrasonic velocity has been extensively applied in
understanding the nature of molecular systems, physicochemical behavior and molecular
interactions in liquid mixtures [1-2]. Extensive application of isentropic compressibility of
liquid mixtures in characterizing molecular association, dissociation and complex formation is
available in literature. Ionic liquids are salts with melting points lower than 30oC and look like
a classical liquid but only contain ions. The physicochemical properties of ionic liquids are as
follows (i) under an inert atmosphere, they remain liquid over a temperature range of 200 to
300oC; (ii) they have practically no vapor pressure; (iii) they are reported to have a wide
window of electrochemical stability, good electrical conductivity, high ionic mobility and
excellent chemical stabilities [3-5]. Binary polar liquid mixtures having ionic liquids as one of
the constituents is of considerable interest among the industrialists.

International Journal of Research in Modern Engineering and Emerging Technology (IJRMEET) UGC Approved id_47203
Vol. 5, Sp. Issue: 9, Sept.: 2017 (IJRMEET) ISSN: 2320-6586
189 Online International, Refereed, Impact factor & Indexed Monthly Journal www.raijmr.com
RET Academy for International Journals of Multidisciplinary Research (RAIJMR)
One of the constituent of the binary liquid mixture under study is 1-Butyl-3-
methylimadazolium [BMiM][Cl] member of ionic liquid and self associative and the other
constituent of the binary mixture system is methanol (MeOH) which is also a self-associative,
so it is thought that the binary liquid mixture of [BMiM][Cl] and MeOH will form an
interesting and complex problem of liquid state physics and will provide a good scope to
qualitatively analyze the physico-chemical data to gain some insight to the intermolecular
interactions in the liquid mixture.
Materials and Sample Preparation
[BMiM][Cl] (extra pure), and MeOH (AR grade) were obtained from HPLC Fine Chem.
Limited and were used without further purification. Binary mixtures of [BMiM][Cl] with
MeOH were prepared for nine concentrations by varying weight fractions. Samples were
prepared by syringing weighed amounts of the pure liquids into stopper bottles, and weighed
using digital balance with a precision of (1mg).
Experimental arrangements and methodology described by Rana and Chaube [6] has been
followed to obtain physical and ultrasonic properties of the prepared samples. Allied
parameters of obtained physical properties were calculated using appropriate mathematical
expressions.
Results and discussion
Experimental value of Density (ρ), viscosity (η), refractive index (n) and ultrasonic speed (u)
of pure MeOH at 293.15 K are given in Table 1. They are in good agreement with the literature
values.
Table-1: Comparison of experimentally measured physical properties of MeOH with
literature values at 293.15 K temperature
Physical property Experimental value Literature value
Refractive Index 1.3312 1.33105 [7]
Density (kg m-3) 787.1 786.6 [8]
Viscosity (mPa.s) 0.551 0.554 [8]
Ultrasonic Velocity (m sec-1) 1079.8 1097.6 [9]
Measured values of Refractive Index,Density,Viscosity,Ultrasonic Velocity of mixtures of
[BMiM][Cl] and MeOH are presented in Table 2.

International Journal of Research in Modern Engineering and Emerging Technology (IJRMEET) UGC Approved id_47203
Vol. 5, Sp. Issue: 9, Sept.: 2017 (IJRMEET) ISSN: 2320-6586
190 Online International, Refereed, Impact factor & Indexed Monthly Journal www.raijmr.com
RET Academy for International Journals of Multidisciplinary Research (RAIJMR)
Table-2 Experimentally measured density (ρ), ultrasonic velocity (u), viscosity (η) and
refractive index (n) of mixture of [BMiM][Cl] with MeOH at 293.15 K temperature
Weight
Fraction
(x1)
Density
(ρ)
(kg m-3
)
Ultrasonic
Velocity (u)
(m / s)
Viscosity (η)
(mPa.s)
Refractive
Index
(n)
Dielectric constant
at optical frequency
(εα)
0.001 792.1 1080 0.605 1.3315 1.7728
0.007 792.9 1094 0.606 1.3320 1.7742
0.010 793.8 1109 0.616 1.3330 1.7768
0.012 795.3 1120 0.626 1.3335 1.7782
0.014 796.8 1144 0.636 1.3345 1.7808
0.018 798.5 1163 0.647 1.3360 1.7848
0.021 800.2 1182 0.657 1.3370 1.7875
0.030 801.9 1204 0.677 1.3385 1.7915
0.042 803.6 1230 0.697 1.3395 1.7942
Density for all solutions increases with the increase in weight fractions of [BMiM][Cl] in
MeOH. Obtained results can be useful for determination of macroscopic properties in order to
reveal the information at atomic level. Low values of viscosity for all solutions refers to the
presence of small molecules with which rearrangement ability is faster than compared to that of
long chain molecules [8]. Values of refractive index (n) for different solutions are found to
increase with weight fraction of [BMiM][Cl] which reflects the presence and enhancement of
[BMiM][Cl] weight fractions. Using the values (n) dielectric constant at optical frequency has
been calculated. The evaluated values of various acoustical parameters are reported in Table -
3.
Table-3: Calculated values of adiabatic compressibility (β), free length (LT), acoustical
impedance (Z) of mixture of [BMiM][Cl] with MeOH at 293.15 K temperature
Weight Fraction
Of [BMiM][Cl]
x1
β/( * 10-9
m2N
-1) LT ( * 10
-8m) Z( * 10
5 kgm
-2s
-1)
------------------------------------------------------------------------------------------------------------
0.001 1.082 6.442 8.555
0.007 1.054 6.357 8.674
0.010 1.024 6.267 8.803
0.012 1.002 6.200 8.907
0.014 0.959 6.064 9.115
0.018 0.926 5.959 9.286
0.021 0.894 5.856 9.459
0.030 0.860 5.743 9.655
0.042 0.823 5.616 9.884
Ultrasonic speed is determined by the properties of the medium through which it propagates
and it depends upon both the elastic property (stiffness or rigidity) and inertial property, i.e.
mass density of the individual particles of the medium. In a single phase of matter longitudinal

International Journal of Research in Modern Engineering and Emerging Technology (IJRMEET) UGC Approved id_47203
Vol. 5, Sp. Issue: 9, Sept.: 2017 (IJRMEET) ISSN: 2320-6586
191 Online International, Refereed, Impact factor & Indexed Monthly Journal www.raijmr.com
RET Academy for International Journals of Multidisciplinary Research (RAIJMR)
sound wave travels faster in a less dense material than a more dense material [6]. From Table 2
it can be seen that values of ultrasonic velocity (u) increases with increase in concentration of
[BMiM][Cl]. The evaluated parameters free length (Lf) and adiabatic compressibility ()
exhibit an opposite trend to that of measured ultrasonic velocity (Table 3). This observation is
in agreement with the model proposed by Eyring and Kincaid [5]. Free length of 0.1 gm of
[BMiM][Cl] with MeOH is 6.442 x 10⁻⁸
m at 293.15 K and that of 0.9 gm of [BMiM][Cl] with
MeOH is 5.616 x 10⁻⁸
m at the same temperature. This suggests that the distance between the
surfaces of two neighboring molecules of 0.1 gm [BMiM][Cl] with MeOH is more than that in
0.9 gm of [BMiM][Cl] with MeOH . Free length values are found to decrease with increase in
concentration of [BMiM][Cl] in MeOH and the decrement is non-linear. This suggests that the
ordering of the molecules increases with increasing concentration of [BMiM][Cl] in the
mixture [10].
[BMiM][Cl] + MeOH
-3.E-10
-3.E-10
-2.E-10
-2.E-10
-1.E-10
-5.E-11
0.E+00
0.00 0.01 0.02 0.03 0.04 0.05
x1
E/(
m2N
-1)
[BMiM][Cl] + MeOH
5.5
5.7
5.9
6.1
6.3
6.5
0.00 0.01 0.02 0.03 0.04 0.05
x1
LfE
/(x10
-8m
)
(a) (b)
[BMiM][Cl] + MeOH
0
0.5
1
1.5
2
2.5
0.00 0.01 0.02 0.03 0.04 0.05x1
ZE(x
10
5kg
m-2
s-1
)
(c)
Figure – 1: Excess adiabatic compressibility (E), excess free length (Lf) and excess
acoustic impedance (ZE) of mixtures of [BMiM][Cl] in MeOH at 293.15 K

International Journal of Research in Modern Engineering and Emerging Technology (IJRMEET) UGC Approved id_47203
Vol. 5, Sp. Issue: 9, Sept.: 2017 (IJRMEET) ISSN: 2320-6586
192 Online International, Refereed, Impact factor & Indexed Monthly Journal www.raijmr.com
RET Academy for International Journals of Multidisciplinary Research (RAIJMR)
From the plot of excess adiabatic compressibility (E) against concentration (Fig. 1(a)), it can
be seen that E values are negative over the complete concentration range at given temperature.
The negative E
values indicate that the corresponding ideal mixture is more compressible than
the actual mixture [11]. [BMiM][Cl] and MeOH are self associative in their pure liquid state
however when these two liquids are mixed, breaking of self associative ionic bonded structure
takes place and new ionic bonded structures are formed due to the cross linkage between
[BMiM][Cl] and MeOH molecules. This causes reduction in the compressibility and hence
negative E values. [12]
From Figure 1(c), it can be seen that excess specific acoustic impedance ZE is positive for
entire concentration range of [BMiM][Cl]. This suggests the strengthening of the ionic bonds
and dominance of the attractive forces between the component molecules.
Conclusion
Measurements of physical properties density, viscosity, ultrasonic velocity and refractive index
for solutions of different weight fractions of [BMiM][Cl] in MeOH at 293.15 K were
performed. Values of all physical parameters for MeOH were compared with the literature
value to validate the experimental results. All parameters were found to vary with the weight
fractions of [BMiM][Cl] in mixture. Obtained results for density can be useful for
determination of macroscopic properties in order to reveal the information at atomic level. Low
values of viscosity for all solutions refers to the presence of small molecules with which
rearrangement ability is faster compared to that of long chain molecules. Dominance of long
range dispersive forces can be inferred from the excess free length values.
Acknowledgement
Financial support provided by Department of Science and Technology (DST), New Delhi
through the DST – FIST (Level – 1) project (SR/ FST/ PSI – 001/ 2006); and DRS – SAP
program grant [No. F. 530/ 10/ DRS/ 2010(SAP-1)] has been utilized to carry out this work and
it is gratefully acknowledged. We are also thankful to Prof. P. N. Gajjar, Head, Department of
Physics, University school of sciences, Gujarat University, Ahmedabad for his constant
encouragement.
References
1) K R Seddon, A Stark, M J Torres, Pure Appl. Chem., 2000, 72, 2275–2287.
2) T Welton, Chem. Rev., 1999, 99, 2071-2083.
3) Y Chauvin, H O Bourbigou, Chemtech, 1995, 25, 26-30.
4) H L Ngo, K LeCompte, L Hargens, A B McEwen, Thermochim. Acta, 2000,357,97-102.

International Journal of Research in Modern Engineering and Emerging Technology (IJRMEET) UGC Approved id_47203
Vol. 5, Sp. Issue: 9, Sept.: 2017 (IJRMEET) ISSN: 2320-6586
193 Online International, Refereed, Impact factor & Indexed Monthly Journal www.raijmr.com
RET Academy for International Journals of Multidisciplinary Research (RAIJMR)
5) H Eyring, J F Kincaid, J. Chem. Phys., 1938, 6, 620-630.
6) V A Rana, H A Chaube, J. Mol. Liq., 2012, 173, 71-86.
7) V A Rana, H A Chaube, D H Gadani, J.Mol. Liq., 2011, 164, 191-196.
8) P S Nikam, L N Shrisat, M Hasan, J. Chem. Eng. Data, 1998; 43; 732-737.
9) G V Ramana, E Rajagopal, N M Murthy, Indian J. Pure Appl. Phys., 2005, 43, 259-264.
10) M Vatandas, A B Koc, C Koc, Eur. Food Res. Tech., 2007, 225, 525-532.
11) A Tadd, B D Djordjevid, D K Grozdandid, J. Chem. Eng. Data, 1992, 37, 310-313.
12) P S Naidu, K R Prasad, Indian J. Pure Appl. Phys., 42, 2004, 512-517.

International Journal of Research in Modern Engineering and Emerging Technology (IJRMEET) UGC Approved id_47203
Vol. 5, Sp. Issue: 9, Sept.: 2017 (IJRMEET) ISSN: 2320-6586
194 Online International, Refereed, Impact factor & Indexed Monthly Journal www.raijmr.com
RET Academy for International Journals of Multidisciplinary Research (RAIJMR)
Vertical growth of Van der Wall’s heterostructure by depositing
SnSe thin films on to crystalline WSe2 and its characterization
Chetan K. Zankat, Pratik Pataniya, Alkesh B. Patel, K. D. Pathak, G. K. Solanki,V. M. Pathak
(Department of Physics, Sardar Patel University, Vallabh Vidyanagar- 388120, Gujarat, India)
Email:[email protected]
(1) Chetan K.Zankat
Department of Physics, Sardar Patel University, Vallabh Vidyanagar, Anand-388120,
Gujarat, India.
Email: [email protected]
(2) Pratik Pataniya
Department of Physics, Sardar Patel University, Vallabh Vidyanagar, Anand-388120,
Gujarat, India.
Email: [email protected]
(3) Alkesh B.Patel
Department of Physics, Sardar Patel University, Vallabh Vidyanagar, Anand-388120,
Gujarat, India.
Email:[email protected]
(4) K. D. Patel
Department of Physics, Sardar Patel University, Vallabh Vidyanagar, Anand-388120,
Gujarat, India.
Email: [email protected]
(5) G. K. Solanki
Department of Physics, Sardar Patel University, Vallabh Vidyanagar, Anand-388120,
Gujarat, India.
Email: [email protected]
(6) V. M. Pathak
Department of Physics, Sardar Patel University, Vallabh Vidyanagar, Anand-388120,
Gujarat, India.
Email: [email protected]

International Journal of Research in Modern Engineering and Emerging Technology (IJRMEET) UGC Approved id_47203
Vol. 5, Sp. Issue: 9, Sept.: 2017 (IJRMEET) ISSN: 2320-6586
195 Online International, Refereed, Impact factor & Indexed Monthly Journal www.raijmr.com
RET Academy for International Journals of Multidisciplinary Research (RAIJMR)
Abstract:
Amorphous SnSe thin films of thickness 150nm were deposited on glass substrates as
well as on WSe2 crystals using thermal evaporation technique in vacuum better than 10-5
Torr.
The elemental analysis was made by Energy dispersive analysis of X-ray (EDAX). The
structural properties of deposited thin films were studied by powder X-ray diffraction (XRD)
and transmission electron microscopy (TEM). The selected area electron diffraction pattern
(SAED)of SnSe thin films was analyzed by VSPEC image processing software. The current-
voltage characteristic of prepared hetero-interface (SnSe/WSe2) shows reasonably good current
rectification. The fabricated heterojunction was analyzed in dark and under illumination of
80mW power intensity. For quantitative analysis, the typical device parameters such as ideality
factor and saturation current are evaluated from the observed I-V characteristics on the basis of
thermionic-emission model of current conduction through such hetero-interfaces..
Keywords: TMDC, thermal evaporation, XRD, TEM, heterojunction.
Introduction:
The study of transition metal dichalcogenide(TMDC) materials in recent time has
become one of the most attractive area of research in nano-science due to their vast application
in electronic, optoelectronic devices and sensors [1-2]. Inspired from the success of graphene,
many other 2D materials, such as GaS, GaSe, SnSe, transition metal oxides, etc.have been
extensively studied [3–10]. Many Transition metal dichalcogenides (TMDCs) e.g. WSe2, MoSe2
etc. are Van der Waals layered materials with hexagonal lattice structure constituting stacked tri-
layers in X-M-X form. The structures of layered TMDCs (MX2, where M is a transition element
and X is a chalcogen) incorporate each layer with strong in-plane covalent bonding and weak
out-of-plane van der Waals interactions [11]. Each layered material has its own advantages and
disadvantages. For example, the carrier mobility in black phosphorus (BP) is greater than that in
TMDCs, but TMDCs have larger absorption coefficient compared with BP in visible range of
light spectrum. The band gap of about 1-1.4 eV is the most attractive feature of TMDCs; which
corresponds to their optimum efficiency in solar cell applications. In particular, research interest
in the family of TMDCs has increased dramatically due to their layer-thickness dependent
physical properties, for example, they exhibit transition from an indirect bandgap in bulk to
direct bandgap in monolayer form [12–21]. One of the most explored members of IV-VI group,
SnSe has orthorhombic crystal structure with lattice parameters: a = 11.50 Å, b = 4.15 Å and c =
4.44 Å [22]. In present work, we report the structural properties of SnSe thin film deposited by

International Journal of Research in Modern Engineering and Emerging Technology (IJRMEET) UGC Approved id_47203
Vol. 5, Sp. Issue: 9, Sept.: 2017 (IJRMEET) ISSN: 2320-6586
196 Online International, Refereed, Impact factor & Indexed Monthly Journal www.raijmr.com
RET Academy for International Journals of Multidisciplinary Research (RAIJMR)
thermal evaporation technique. The SnSe/WSe2 heterojunction is fabricated and characterized by
current-voltage measurement technique in dark and illuminated condition.
Materials and methods:
The SnSe films of thickness 150nm are deposited on ultrasonically cleaned glass
substrates and freshly cleaved surface (by mechanical exfoliation) of WSe2 crystals in vacuum
better than 10-5
mbar. During deposition process, deposition rate of ~ 2Å/sec is maintained
constant by Quartz crystal digital thickness controller (SQC-310). The chemical confirmation of
deposited thin film was carried out by EDAX. The structural properties like lattice parameters
and crystallographic planes were determined by powder X-ray diffraction (Rigaku) and
transmission electron microscopy. The hetero junction device was then completed by bonding
thin copper wires by highly conducting silver paste. I-Vcharacteristics of hetero-interface
(SnSe/WSe2) were measured using Keithly-source measure Unit SMU-2400 in dark and under
polychromatic illumination.
Results and discussion:
The EDAX results show the stoichiometry of prepared SnSe thinfilm and weight (%) are
also measured, as mentioned in Table 1. No extra peaks are found in EDAX spectrum, which
confirms the purity of prepared thinfilm.
Table 1Results of EDAX for SnSe thin film.
Wt % of the elements Sn Se
Stoichiometric proportion taken 49.3 50.7
Obtain from the EDAX 46.2 53.8
Figure 1EDAX spectra of deposited SnSe thin film.

International Journal of Research in Modern Engineering and Emerging Technology (IJRMEET) UGC Approved id_47203
Vol. 5, Sp. Issue: 9, Sept.: 2017 (IJRMEET) ISSN: 2320-6586
197 Online International, Refereed, Impact factor & Indexed Monthly Journal www.raijmr.com
RET Academy for International Journals of Multidisciplinary Research (RAIJMR)
The structural properties of SnSe thin films were studied by powder X- ray diffraction
and transmission electron microscopy. The XRD pattern reveals (011) and (111) reflections at
angle 29.44˚ and 30.46˚ respectively, as shown in Figure 2 (a). The SnSe thinfilm has
orthorhombic lattice structure and the determined values of lattice parameters, a = 11.50 Å, b =
4.15 Å and c = 4.44 Å are well in agreement with reported data[22]. The transmission electron
microscopy as used in imaging mode shows uniform SnSe thin film with ~16nm average particle
size (Fig.-2b). Selected area electron diffraction pattern (Fig.-2c) shows diffused ring pattern that
indicates amorphous nature of grown SnSe thin film. For accurate determination of lattice
parameters and indexing of crystallographic planes, we have used VSPEC image processing
software. The obtained (hkl) values (111), (400), (311) and (112) are good in agreement with the
standard JCPDF file [23].
-
Figure 2 (a) X-ray diffraction pattern,(b) grown thin film surface,(c) Indexed SAED pattern, of
Deposited SnSe thin film.
The SnSe/WSe2 hetero junction was characterized by current-voltage measurement
technique at room temperature and in dark and under illumination, as shown in Figure 3. The I-V
measurements show the good current rectification and rectification ratio is determined at ±0.8V.
The current across the junction is found to increase slightly on illuminating the SnSe/WSe2

International Journal of Research in Modern Engineering and Emerging Technology (IJRMEET) UGC Approved id_47203
Vol. 5, Sp. Issue: 9, Sept.: 2017 (IJRMEET) ISSN: 2320-6586
198 Online International, Refereed, Impact factor & Indexed Monthly Journal www.raijmr.com
RET Academy for International Journals of Multidisciplinary Research (RAIJMR)
interface. The current rectification ratio also increases under illumination.The typical parameters
such as ideality factor and saturation current are also determined from the thermionic emission
theory for fabricated device, as mentioned in Table 2. Despite of having good rectification ratio,
the ideality factor is found in excess of unity that indicates domination of non-ideal current
conduction mechanisms originating from lattice mismatch at the interface due to structural
mismatch as well as barrier inhomogeneity. The lattice mismatch may lead to interfacial strain
that leads to formation of strained lattice or lattice defects. Apart from this it is a case of
interface between amorphous material to crystalline material where in grain boundaries of
amorphous material add inhomogeneities when in contact with the crystalline material surface.
This in turn adds additional scattering centers and thus it results in to a system with ideality
factor well in excess of unity.
Figure 3 I-V characteristics of SnSe/WSe2heterojunction.
Table 2 Typical parameters of fabricated device
Illumination
(mW/cm2)
Ideality factor
η
Saturation current
I0(μA)
dark 5.57 0.697
80mw 5.65 0.747
Conclusion:
The SnSe thin film was prepared by thermal evaporation technique. The XRD and TEM analysis
of 150 nm thick films reveals that deposited films of SnSe possess orthorhombic structure with
lattice parameter values matching to standard reported values adhering their stoichiometric
proportion in thin film form. For SnSe/WSe2 junction, the determined value of ideality factor is

International Journal of Research in Modern Engineering and Emerging Technology (IJRMEET) UGC Approved id_47203
Vol. 5, Sp. Issue: 9, Sept.: 2017 (IJRMEET) ISSN: 2320-6586
199 Online International, Refereed, Impact factor & Indexed Monthly Journal www.raijmr.com
RET Academy for International Journals of Multidisciplinary Research (RAIJMR)
greater than one. Hence, it suggests the present interface is the case of inhomogeneous hetero
structure having lattice mismatch.
Reference:
[1] A. Mihai. Popescu, Solid State Science and Tec., 2000 8.
[2] K R Willardson and R E Weber, Semiconducting Chalcogenide Glass I, 2004 78.
[3] P. Hu et al, Nano Lett. 2013 13 1649–54.
[4] D J Late, B Liu, J Luo, A Yan, H S Matte, M Grayson, C N Rao and V P Dravid, Adv.
Mater., 2012 24 3549–54.
[5] L Li, Z Chen, Y Hu, X Wang, T Zhang, W Chen and Q Wang, J. Am. Chem. Soc., 2013 135
1213–6.
[6] W Dang, H Peng, H Li, P Wang and Z Liu, Nano Lett., 2010 10 2870–6.
[7] D Kong, W Dang, J J Cha, H Li, S Meister, H Peng, Z Liu and Y Cui, Nano Lett., 2010 10
2245–50.
[8] K K Kim et al, Nano Lett. 2012 12 161–6.
[9] R Ma and T Sasaki, Adv. Mater., 2010 22 5082–104.
[10] H Li, G Lu, Y Wang, Z Yin, C Cong, Q He, L Wang, F Ding, T Yu and H Zhang, Small
2013 9 1974–81.
[11] M. Chhowalla, H.S. Shin, G. Eda, L. Li, K.P. Loh, H. Zhang, Nat. Chem., 2013 5 263.
[12] B Radisavljevic, A Radenovic, J Brivio, V Giacometti and A Kis, Nature Nanotechnol.,
2011 6 147–50.
[13] Wu Sanfeng, H Chunming, A Grant, S R Jason, H C David and Xu Xiaodong, ACS Nano.,
2013, 7 (3), 2768–2772.
[14] J N Coleman et al, Science., 2011 331 568–716.
[15] Y H Lee et al, Adv. Mater., 2012 24 2320–5.
[16] G A Castellanos, E Cappelluti, R Roldan, N Agrait, F Guinea and B G Rubio, Adv. Mater.,
2013 25 899–903.
[17] S Larentis, B Fallahazad and E Tutuc , Appl. Phys. Lett. 2012 101 223104.
[18] D Kong, H Wang, J J Cha, M Pasta, K J Koski, J Yao and Y Cui, Nano Lett. 2013 13 1341–
7.
[19] H R Gutierrez, L N Perea, A L Elias, A Berkdemir, B Wang, R Lv, U F Lopez, V H Crespi,
H Terrones and M Terrones, Nano Lett. 2013 13 3447–54.
[20] H Zeng et al, Sci. Rep. 2013 3 1608.

International Journal of Research in Modern Engineering and Emerging Technology (IJRMEET) UGC Approved id_47203
Vol. 5, Sp. Issue: 9, Sept.: 2017 (IJRMEET) ISSN: 2320-6586
200 Online International, Refereed, Impact factor & Indexed Monthly Journal www.raijmr.com
RET Academy for International Journals of Multidisciplinary Research (RAIJMR)
[21] W J Zhao, Z Ghorannevis, L Q Chu, M L Toh, C Kloc, P H Tan and G Eda, ACS Nano,
2013 7 791–7.
[22] N. kumar, U. Parihar, R. Kumar, K. J. Patel, C. J. Panchal, N. Padha American Journal of
Materials Science, 2012, 2(1) 41-45
[23] JCPDF card no. 32-1382.

International Journal of Research in Modern Engineering and Emerging Technology (IJRMEET) UGC Approved id_47203
Vol. 5, Sp. Issue: 9, Sept.: 2017 (IJRMEET) ISSN: 2320-6586
201 Online International, Refereed, Impact factor & Indexed Monthly Journal www.raijmr.com
RET Academy for International Journals of Multidisciplinary Research (RAIJMR)
Optical properties of pure and off-stoichiometric tin selenide
single crystals Mohit Tannarana, G. K. Solanki, Pratik Pataniya, K. D. Patel, V. M. Pathak
Department of Physics, Sardar Patel University, Vallabh Vidyanagar-388120, Anand, Gujarat, India.
Email: [email protected]
Abstract:
The single crystals of pure SnSe and Sn0.4Se0.6 (off-stoichiometric) were grown by direct vapour
transport technique. The optical response of grown single crystals was studied by UV-Visible-NIR
spectroscopy. The absorption spectra were recorded for grown single crystals in spectral range
250 nm to 1500 nm. Absorption near the fundamental edge was found to be due to direct allowed
transition and the optical band gap corresponding to this transition has also been determined. The
optical parameters like absorption coefficient, extinction coefficient and refractive index have also
been calculated for grown single crystals. The results thus obtained have been described and
discussed in this paper.
Keywords: Single crystal growth, optical properties, band gap, tin selenide, off-stoichiometry.
Introduction:
Recently, transition metal chalcogenides have attracted great attention due to their excellent
optical properties. Moreover, IV-VI compounds having band gap of 1-2 eV and high absorption
co-efficient are useful for the applications in solar cell and photovoltaic devices. These layered
semiconductors, namely SnS, SnSe, GeS and GeSe have direct as well as indirect band gap, which
may improve efficiency of solar cell. One of the important compounds of chalcogenide family,
SnSe has orthorhombic structure with eight atoms per unit cell forming bi-planar layers normal to
the largest c axis [1-3]. In each bi-layer, atoms are joined to three nearest neighbors by covalent
bond which forms zigzag chains along ab-plane while SnSe bi-layers are stacked upon each other
by weak van der Waals interaction. As the bonds between adjacent double layers are van der
Waals type, this material cleaves easily along a-b (001) planes. In crystalline form, SnSe shows a
wide variety of optical and electrical properties and presence of anisotropy increases the curiosity
of researcher. Besides this, SnSe has shown great potential for applications in phase change

International Journal of Research in Modern Engineering and Emerging Technology (IJRMEET) UGC Approved id_47203
Vol. 5, Sp. Issue: 9, Sept.: 2017 (IJRMEET) ISSN: 2320-6586
202 Online International, Refereed, Impact factor & Indexed Monthly Journal www.raijmr.com
RET Academy for International Journals of Multidisciplinary Research (RAIJMR)
memory devices due to its low crystallization and high melting temperature in certain conditions
[4, 5]. The SnSe is found to be crystallize in orthorhombic lattice structure with space group
13mP and lattice parameters a=4.16Å, b=4.45Å and c=11.55 Å. Many researchers studied the
optical properties of SnSe pure single crystals [6-9] but the off-stoichiometric tin selenide has
been less explored.
Materials and Methods:
The single crystals of SnSe and Sn0.4Se0.6 were grown by direct vapour transport technique. The
optical properties of grown crystals were examined by UV-Visible spectroscopy. The absorption
spectra of samples were recorded using Beckman Model DK-A spectrophotometer (UV-VIS-NIR
spectrophotometer) (Make: Perkin Elmer, Model: Lambda with the light source having radiant
energy in the ultraviolet to near infrared regions of the electromagnetic spectrum. Samples used
for UV-Visible spectroscopy is cleaved mechanically using scotch tape. Cleaved samples are
covered by black opaque paper used for analysis. The absorbance was measured in spectral range
250 nm to 1500 nm at ambient temperature. The optical parameters have been calculated for as
grown samples. For quantitative analysis, optical parameters like bandgap, refractive index and
extinction co-efficient were also determined.
Results and discussion:
The absorption spectra of SnSe and Sn0.4Se0.6 samples were recorded in spectral range 250 nm to
1500 nm is as shown in Figure 1. The increased absorption near the edge is due to the transition of
electron from the valance band to conduction band [10]. The absorption coefficient (α) can be
estimated from Lambert’s law [11].
2.303A
t
(1)
where, t is thickness of the absorbing layer and A is the absorbance from the spectra. The
most prominent peaks are found to be at 1150 nm and 840 nm for SnSe and Sn0.4Se0.6,
respectively. The optical band gap of samples is calculated using following relation:
αhν = A(hν - Eg)r
(2)
for direct transition

International Journal of Research in Modern Engineering and Emerging Technology (IJRMEET) UGC Approved id_47203
Vol. 5, Sp. Issue: 9, Sept.: 2017 (IJRMEET) ISSN: 2320-6586
203 Online International, Refereed, Impact factor & Indexed Monthly Journal www.raijmr.com
RET Academy for International Journals of Multidisciplinary Research (RAIJMR)
(3)
for indirect transition
Figure 1: Absorption spectra of SnSe and Sn0.4Se0.6 crystals
The variation of (αhν) 2 vs. photon energy (hν) is shown in Figure 2. The Values of band gap
obtained from the extrapolation of the straight line portion [7]. The direct bandgap was
determined and found to be 1.0 eV for SnSe and 1.45 eV for Sn0.4Se0.6 single crystals. Figure 3
shows the plot of (αhν)1/2
versus photon energy (hν) which gives the values of indirect transition
for grown single crystals. The determined value of indirect band gap is 0.95 eV and 1.37 eV for
for SnSe and Sn0.4Se0.6 samples respectively. Value of the band gap for SnSe compound is
matched with reported values [6-9]. The change in band gap is due to off-stoichiometry present in
Sn0.4Se0.6compound in which proportion of tin is (less compared to pure SnSe) reduced to 40%.
Figure 2: direct band gap of (a) SnSe and (b) Sn0.4Se0.6crystals

International Journal of Research in Modern Engineering and Emerging Technology (IJRMEET) UGC Approved id_47203
Vol. 5, Sp. Issue: 9, Sept.: 2017 (IJRMEET) ISSN: 2320-6586
204 Online International, Refereed, Impact factor & Indexed Monthly Journal www.raijmr.com
RET Academy for International Journals of Multidisciplinary Research (RAIJMR)
Figure 3: indirect band gap of (a) SnSe and (b) Sn0.4Se0.6 crystals
Figure 4: Variation of Extinction co-efficient and Refractive index at different wavelengths for
(a) SnSe and (b) Sn0.4Se0.6.
The optical parameters such as extinction co-efficient (k) and refractive index (n) have been
calculated using following relations:
4k
(4)
(5)
Where, α = absorbance co-efficient
λ = Wavelength
R= Reflection

International Journal of Research in Modern Engineering and Emerging Technology (IJRMEET) UGC Approved id_47203
Vol. 5, Sp. Issue: 9, Sept.: 2017 (IJRMEET) ISSN: 2320-6586
205 Online International, Refereed, Impact factor & Indexed Monthly Journal www.raijmr.com
RET Academy for International Journals of Multidisciplinary Research (RAIJMR)
The refractive index (n) and extinction coefficient (k) are shown in Figure 4 (a) and (b) for grown
single crystals. These plots show the promising variation of both the parameters for different
wavelengths.
Conclusions:
The single crystals of SnSe and Sn0.4Se0.6 were grown by direct vapour transport technique. Study
of optical properties like direct and indirect band gap, refractive index, extinction co-efficient has
been carried out. Variation in the values of band gap is due to off-stoichiometry present in
Sn0.4Se0.6 compound. Nearly 1.0 eV value of band gap for SnSe is quite promising for its
application in opto-electric devices and solar cell.
References:
[1] Okazaki, J.Phys.Soc., Japan, 1958, 13, 1151- 1155.
[2] S. Logothetidis and H. M. Polatoglou, Phys. Rev. B, 1987, 36, 7491-7499.
[3] G. Valiukonis, D. A. Gussienova, G. Krivaite and A. Sileika, Phys. Stat.Solidi (b), 1986, 135,
299-307.
[4] K. M. Chung,D. Wamwang, M. Wod, M. Wutti and W. Bensc, J.Appl. Phys., 2008,103,
083523(1-7).
[5] K. A. Campbell and C. M. Anderson, Microelectronics Journal, 2007, 38, 52-59.
[6] M. Parentau and M. Carlone, Phys. Rev. B, 1990, 41: 5227-5234.
[7] B.B. Nariya, A.K. Dasadia and A.R. Jani, PRAJNA -Journal of Pure and Applied Sciences,
2011, 19, 79 - 81.
[8] A. M. Elkorashy, journal of Physics and Chemistry of Solids, 1986, 47, 3, 497-504.
[9] C.Julien, M.Eddrief, I.Samaras and M.Balkanski, Materials Science and Engineering: B,
1992, 15, 1, 70-72.
[10] M. M. Parvathi, A. Mohan, V.Arivazhagan and S.Rajesh, AIP conf.proc., 2012, 206, 1451-
1454.
[11] S. A.Khan and A. A. Al-Ghamdi, Mater. Lett., 2009,63, 1740-1742.

International Journal of Research in Modern Engineering and Emerging Technology (IJRMEET) UGC Approved id_47203
Vol. 5, Sp. Issue: 9, Sept.: 2017 (IJRMEET) ISSN: 2320-6586
206 Online International, Refereed, Impact factor & Indexed Monthly Journal www.raijmr.com
RET Academy for International Journals of Multidisciplinary Research (RAIJMR)
Disharmonic Identification of EEG data through Wavelet
Transform
Dhwanilnath Gharekhan 1, Prakash L. Patel
2,3 and Anita Gharekhan
3
1M.Tech Student, M.Tech (Geomatics), Faculty of Technology, CEPT University,
Ahmedabad, India, [email protected]
2Research Scholar, Pacific University, PAHER, Rajasthan, India
3Associate Professor, Department of Physics, C U Shah Science College, Ahmedabad, India,
Abstract
Although the structure of a brain is highly complicated; Brain scans provide an opening to
understand the functionality which a body undergoes during various activities. The brain's
cells produce tiny electrical signals when they send messages to each other. The brain's
electrical charge is maintained by huge number of individual neurons. Neurons are
electrically charged (or "polarized") by membrane transport proteins that pump ions across
their membranes. Each neuron interacts with its neighbouring neurons as well as with remote
neurons. Electroencephalography (EEG) is the recording of these electrical activities along
the scalp. In situations with diseases, there are numerous undulation which enter in the EEG.
Identification of these pattern can provide a better insight of a human’s condition. Wavelet
transform can sometimes diagnose a pathological condition more easily when the frequency
content of the signal is analysed. The frequency spectrum of a signal is basically the
frequency components (spectral components) in that signal. The peaks of a wavelet can be
used in diagnosing such conditions.
Keywords: EEG, Wavelet Transform, Signal, DWT, CWT.
Introduction
Electro-Encephalography
The brain's electrical charge is maintained by huge number of individual neurons. Neurons
are electrically charged (or "polarized") by membrane transport proteins that pump ions
across their membranes[1]. Each neuron interacts with its neighbouring neurons as well as
with remote neurons. They constantly exchange ions with the extracellular milieu, for
example to maintain resting potential and to propagate action potentials. Ions of similar
charge repel each other, and when many ions are pushed out of many neurons at the same

International Journal of Research in Modern Engineering and Emerging Technology (IJRMEET) UGC Approved id_47203
Vol. 5, Sp. Issue: 9, Sept.: 2017 (IJRMEET) ISSN: 2320-6586
207 Online International, Refereed, Impact factor & Indexed Monthly Journal www.raijmr.com
RET Academy for International Journals of Multidisciplinary Research (RAIJMR)
time, they can push their neighbour’s’, who push their neighbours, and so on, in a wave. This
process is known as volume conduction.
When the wave of ions reaches the electrodes on the scalp, they can push or pull electrons on
the metal on the electrodes. Since metal conducts the push and pull of electrons easily, the
difference in push or pull voltages between any two electrodes can be measured by a
voltmeter. Recording these voltages over time gives us the EEG. EEG measures voltage
fluctuations resulting from ionic current flows within the neurons of the brain. Routine EEG
is typically used in the following clinical circumstances:
to distinguish epilepticseizures from other types of spells, such as psychogenic non-
epileptic seizures, syncope (fainting), sub-cortical movement disorders and migraine
variants.
to differentiate "organic" encephalopathy or delirium from primary psychiatric
syndromes such as catatonia
to serve as an adjunct test of brain death
to prognosticate, in certain instances, in patients with coma
to determine whether to wean anti-epileptic medications
The pattern of electrical activity produced on an EEG can be used to help diagnose a number
of conditions that affect the brain [2]. An EEG is mainly used to diagnose and
manage epilepsy (a condition that causes repeated brain seizures). EEGs can also be used to
diagnose and manage sleep disorders such as insomnia. An EEG can identify areas of
the brain that are not working properly. This helps doctors to make decisions about
the type of treatment that is most suitable for you. EEGs are also sometimes used to
determine the level of brain function in people who are in a coma. The patterns can be
undertaken by analyzing them.
Wavelet Transform
Wavelet transform provides information by taking the EEG scans as direct signals
[3].Wavelets refer to small waves and wavelet transform refers to the representation of a
signal in terms of a finite length or fast decaying oscillating waveform. This waveform,
known as the mother wavelet, is scaled and translated to match the input signal. In this
representation, a wavelet series, which is the coordinate representation of a square integral
function with respect to a complete, orthonormal set of basic functions for the discrete

International Journal of Research in Modern Engineering and Emerging Technology (IJRMEET) UGC Approved id_47203
Vol. 5, Sp. Issue: 9, Sept.: 2017 (IJRMEET) ISSN: 2320-6586
208 Online International, Refereed, Impact factor & Indexed Monthly Journal www.raijmr.com
RET Academy for International Journals of Multidisciplinary Research (RAIJMR)
wavelets under consideration. Wavelet transforms are broadly classified into the discrete
wavelet transform (DWT) and the continuous wavelet transform (CWT) [4].
Discrete Wavelet transform is known as mathematical microscope which provides a multi-
resolution analysis of the data under consideration. The data is separated into high frequency
and low frequency components at multiple scales, known respectively as high pass and low
pass coefficients. The basic functions consist of father wavelet )(x and mother wavelet
)(x satisfying Adx , 0dx and 0* dx
and are also square integrable : .122dxdx
A completely orthonormal basis is constructed through translated and scaled versions of
)(x and )(x . Explicitly, )()( xkx k and )2(2 2/
, kxjj
kj , for k and
j0 , provide a complete orthonormal basis through which a data set can be expanded
in the form,
k j
kjkj
k
kk dctf0
,,)(
Here kc ’s the low pass andkjd ,
’s the high pass coefficients. For our analysis, we will make
use of Haar wavelets, in which kc ’s can be interpreted as average of data points of appropriate
size around space location k,kjd ,
’s the high pass coefficients at level j. These represent
differences around location k, over a window of appropriate size, depending on level j [4].
Continuous wavelet transform was developed as an alternative approach to the short time
Fourier transforms to overcome the resolution problem. The wavelet analysis is done in a
similar way to the STFT analysis, in the sense that the signal is multiplied with a function,
similar to the window function in the STFT, and the transform is computed separately for
different segments of the time-domain signal. The continuous wavelet transform is defined as
follows [5].
dt
s
ttxsssCWT xx
*)(
1
),(),(

International Journal of Research in Modern Engineering and Emerging Technology (IJRMEET) UGC Approved id_47203
Vol. 5, Sp. Issue: 9, Sept.: 2017 (IJRMEET) ISSN: 2320-6586
209 Online International, Refereed, Impact factor & Indexed Monthly Journal www.raijmr.com
RET Academy for International Journals of Multidisciplinary Research (RAIJMR)
Materials and Method
Five sets (denoted A–E) each containing 100 single channel EEG segments of 23.6-sec
duration, were composed for the study [6].These segments were selected and cut out from
continuous multichannel EEG recordings after visual inspection for artefacts, e.g., due to
muscle activity or eye movements. Sets A and B consisted of segments taken from surface
EEG recordings that were carried out on five healthy volunteers using a standardized
electrode placement scheme. Volunteers were relaxed in an awake state with eyes open (A)
and eyes closed (B), respectively. Sets C, D, and E originated from our EEG archive of
presurgical diagnosis. For the present study EEGs from five patients were selected, all of
whom had achieved complete seizure control after resection of one of the hippocampal
formations, which was therefore correctly diagnosed to be the epileptogenic zone [2].
Segments in set D were recorded from within the epileptogenic zone, and those in set C from
the hippocampal formation of the opposite hemisphere of the brain. While sets C and D
contained only activity measured during seizure free intervals, set E only contained seizure
activity. Here segments were selected from all recording sites exhibiting ictal activity.
All EEG signals were recorded with the same 128- channel amplifier system, using an
average common reference [omitting electrodes containing pathological activity (C, D and E)
or strong eye movement artefacts (A and B)].After 12 bit analog-to-digital conversion, the
data were written continuously onto the disk of a data acquisition computer system at a
sampling rate of 173.61 Hz. Band-pass filtersettings were 0.53–40 Hz (12 dB/Oct.).
Exemplary EEGs are depicted in fig. 1. More information about the recorded data can be
found in ref 1-5 and data is available in public domain ref. 6.Amplitudes of surface EEG
recordings are typically in the order of some mV. For intracranial EEG recordings amplitudes
range around some 100 mV. For seizure activity these voltages can exceed 1000 mV [7].
There are infinite varieties of discrete wavelets; the choice of a basis set depends on the
application at hand. For our application, we make use of the simplest Haar wavelet, since the
interpretation of the wavelet coefficients is quite transparent here; it is also free from artefacts
arising due to the finite size of the data.
For the Haar wavelet 2
1)1()0( hh and
2
1)1(
~)0(
~ hh , these coefficients are
different for different wavelet basis sets. Haar basis is special, since it is the only wavelet,
which is symmetric and compactly supported. In a level one Haar wavelet decomposition, the
nearest neighbour averages and differences are calculated with the normalization factor of

International Journal of Research in Modern Engineering and Emerging Technology (IJRMEET) UGC Approved id_47203
Vol. 5, Sp. Issue: 9, Sept.: 2017 (IJRMEET) ISSN: 2320-6586
210 Online International, Refereed, Impact factor & Indexed Monthly Journal www.raijmr.com
RET Academy for International Journals of Multidisciplinary Research (RAIJMR)
21 .The alternate coefficients are thrown out in a process called down-sampling or
decimation, which leaves half of the data in the form of low-pass coefficients and the other
half in terms of Level-I high-pass coefficients. Subsequently, the same procedure can be
applied once more to the low-pass coefficients to decompose them into level-II high-pass
coefficients and level-II low-pass coefficients. One can now clearly see that the level-I high-
pass coefficients are the nearest neighbour differences in the Haar wavelet. The level-II high-
pass coefficients are the differences of the nearest neighbour averages. In this manner, one
can find out the differences of progressively larger chunks of data, which are the other higher
level high-pass coefficients. The fluctuations considered here are these Haar wavelet
coefficients, which are the simple differences of intensities at neighbouring wavelengths.
This illustrates how the high-pass coefficients at higher levels separate out the fluctuations
over progressively bigger neighbourhoods.
Figure I: Exemplary EEG time series from each of the five sets. From top to bottom: set A to
set E (denoted a to e).
If the data set contains 2N elements, with N an integer then one can have a N-level
decomposition, after which one is left with only one low-pass coefficient, which is the

International Journal of Research in Modern Engineering and Emerging Technology (IJRMEET) UGC Approved id_47203
Vol. 5, Sp. Issue: 9, Sept.: 2017 (IJRMEET) ISSN: 2320-6586
211 Online International, Refereed, Impact factor & Indexed Monthly Journal www.raijmr.com
RET Academy for International Journals of Multidisciplinary Research (RAIJMR)
average of all points, modulo a normalization factor. It is evident that the high-pass
coefficients, progressively capture differences at a broader scale starting from the nearest
neighbor ones. In more sophisticated wavelets, the above averaging and differentiation is
replaced by a suitable weighted averaging and differentiation. If the data is not 2N, one needs
to append the same with the required number of points by padding or other procedures. It is
worth mentioning that, apart from Haar wavelets, the process of computing wavelet
coefficients needs a suitable extension of data e.g., circular or periodic, which also brings in
artifacts to be clearly differentiated from the true variations. In order to avoid these
complications, we have taken the Haar wavelets for our analysis. The studied data is having
4096 points so it can be decomposed up to twelve levels, without encountering any artificial
features. It should be pointed out that, wavelet transform satisfies the Parseval theorem
implying that
2
,
22 )()( kj
jkki dcI ,
where Ii is the voltage in mV and ck’s and djk’s are the low and high-pass coefficients
respectively.
Results and Discussion
The original EEG signal consist of at least a million entries over its 30 mins time span, out of
which a couple of patches of 4096 entries have been taken into account for studying and
analysing. For the analysis of studied EEG data, the convenient decomposition level is taken
up to 8. Discrete wavelet transform (DWT) means time series will be transformed into high
pass and low pass components and these respective values are being studied individually.
The level-1 low pass coefficients are the averages of nearest neighbour data points, level-2
low pass coefficients represent averages of 4-data points etc. It is clear that, there are 2048
level-1 coefficients, 1024 level-2 coefficients etc. For 4096 data points, we can have twelve
level decomposition. It is observed that, progressive averaging of data in discrete wavelet
transform reduces statistical and experimental uncertainties. The variations at lower level
represent the high frequency components, corresponding to variations in smaller window
sizes.
Discrete Wavelet Transform
As an illustration one typical DWT decomposition in its corresponding low pass coefficients
and high pass coefficient is shown in figure II and III respectively.

International Journal of Research in Modern Engineering and Emerging Technology (IJRMEET) UGC Approved id_47203
Vol. 5, Sp. Issue: 9, Sept.: 2017 (IJRMEET) ISSN: 2320-6586
212 Online International, Refereed, Impact factor & Indexed Monthly Journal www.raijmr.com
RET Academy for International Journals of Multidisciplinary Research (RAIJMR)
Figure II: Low-pass wavelet coefficients of level -1 and level – 8 of condition A.
Figure III: High-pass wavelet coefficients of level -1 and level – 8 of condition A.
While computing wavelet power one take the sum of the square of wavelet coefficients at
particular level e.g., low pass power at level-3 corresponds to sum of square of low pass
coefficients of 3rd level. Usually for the sake of normalization, we normalize it i.e., divides it
by total power P which is the sum of the squares of all the data points. Similarly, one can
compute high pass power. In wavelet transform total power is conserved i.e., sum of low pass
and high pass power yield the total power.The rate of decrease of low pass power, as a
function of levels, is almost same in all conditions except patient is in totally relaxed mode.
While high pass shows variation with levels and can be used for diagnostics purpose.

International Journal of Research in Modern Engineering and Emerging Technology (IJRMEET) UGC Approved id_47203
Vol. 5, Sp. Issue: 9, Sept.: 2017 (IJRMEET) ISSN: 2320-6586
213 Online International, Refereed, Impact factor & Indexed Monthly Journal www.raijmr.com
RET Academy for International Journals of Multidisciplinary Research (RAIJMR)
Figure IV: Plot of typical eight level normalized low pass and high pass power of all
conditions.
Cumulative Sum of CWT Coefficients
In statistical quality control cumulative sum is a sequential analysis technique typically
used for monitoring change detection. In statistical quality control the CUMSUM (or
cumulative sum) is a sequential detection. As its name implies, CUMSUM involves the
calculation of a cumulative sum (which is what makes it "sequential"). Samples from a
process are assigned weights , and summed as follows:
,
When the value of S exceeds a certain threshold value, a change in value has been found. The
above formula only detects changes in the positive direction. When negative changes need to
be found as well, the min. operation should be used instead of the max.operation, and this
time a change has been found when the value of S is below the (negative) value of the
threshold value.
In order to properly study the scalogram behaviour at different scales, the cumulative sum of
the magnitude of wavelet coefficients over time and also on log scale is computed. It is very
interesting to note that, in all the data samples, cumulative power shows different behaviour
between different conditions at certain scale range. A typical plot of cumulative power as a
function of scale values between 1-30 is shown in figureV. This behaviour is observed in
almost all samples, albeit at different scale values. It is found that power is more between the
scales 12 to 14 in relaxed closed eyes condition. It may be attributed to alpha wave.

International Journal of Research in Modern Engineering and Emerging Technology (IJRMEET) UGC Approved id_47203
Vol. 5, Sp. Issue: 9, Sept.: 2017 (IJRMEET) ISSN: 2320-6586
214 Online International, Refereed, Impact factor & Indexed Monthly Journal www.raijmr.com
RET Academy for International Journals of Multidisciplinary Research (RAIJMR)
Figure V: (a) Cumulative sum of wavelet coefficients and on (b) logarithmic scale.
Alpha is the frequency range from 8 Hz to 12 Hz [1]. Hans Berger named the first rhythmic
EEG activity he saw, the "alpha wave." This is activity in the 8–12 Hz range seen in the
posterior regions of the head on both sides, being higher in amplitude on the dominant side. It
is brought out by closing the eyes and by relaxation. It was noted to attenuate with eye
opening or mental exertion.Its location is in posterior regions of head, both sides, higher in
amplitude on dominant side. All the results with sensitivity 85% of the different brain scans,
depict a similar result pattern.
Conclusion
The continuous wavelets have pinpointed significant differences in the different conditions of
EEG. The multiresolution ability and the overcomplete nature of the continuous Morlet
wavelets are responsible in finding out these minute differences with a high sensitivity of
85%. High pass power and cumsum of wavelet coefficients together can give better insight of
EEG conditions and can be robust diagnostic parameters. In conclusion the use of wavelet
transform allowed a scale dependent separation of average behaviour, which is less prone to
statistical and experimental uncertainties.
Acknowledgement
The authors are thankful to Unibonn for providing free datasets, which helped in developing
this study.
References
1. F.H. Lopes da Silva, Electroencephalogr. Clin. Neurophysiol.79, 81 (1991).

International Journal of Research in Modern Engineering and Emerging Technology (IJRMEET) UGC Approved id_47203
Vol. 5, Sp. Issue: 9, Sept.: 2017 (IJRMEET) ISSN: 2320-6586
215 Online International, Refereed, Impact factor & Indexed Monthly Journal www.raijmr.com
RET Academy for International Journals of Multidisciplinary Research (RAIJMR)
2. H. O. Lu¨ders and I. Awad, in Epilepsy Surgery, edited by H. O. Luders (Raven Press,
New York, 1991), pp. 51–61.
3. S. Weigend and N. A. Gershenfeld, Time Series Prediction: Forecasting the Future and
Understanding the Past, Proceedings of the Santa Fe Institute Studies in the Science of
Complexity Vol. XV (Addison -Wesley, Reading, 1993).
4. Daubechies, Ten Lectures on Wavelets, (CfreBMS-NSF regional conference series in
applied mathematics, Philadelphia, PA, 1992, Vol. 64).
5. B. B. Hubbard, The World According to Wavelets, 2nd edition, UniversityPress (India),
Hyderabad, (2003).
6. EEG time series are available under http://www.meb.unibonn.
de/epileptologie/science/physik/eegdata.html
7. Lorena Orosco, Agustina Garces Correa, Eric Laciar, Review: A survey of performance
and techniques of automatic epilepsy detection. Journal of Medical & Biological Engg.
33(6), 2013, 526 – 537
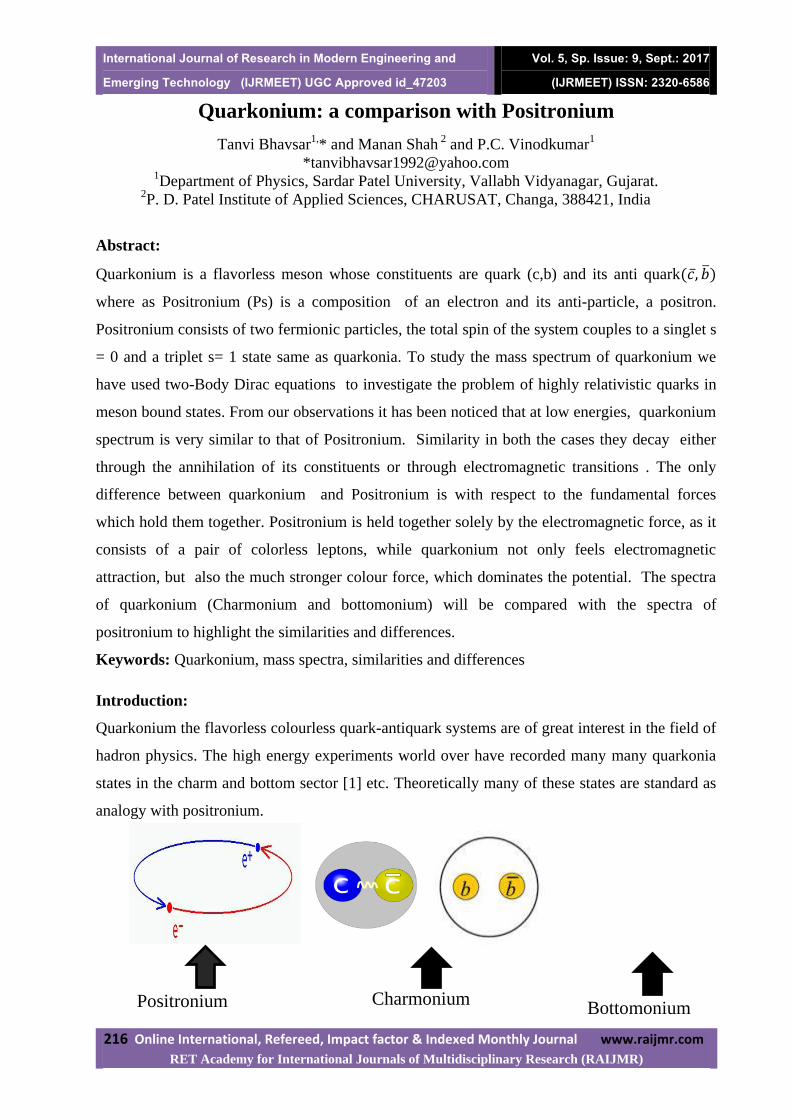
International Journal of Research in Modern Engineering and Emerging Technology (IJRMEET) UGC Approved id_47203
Vol. 5, Sp. Issue: 9, Sept.: 2017 (IJRMEET) ISSN: 2320-6586
216 Online International, Refereed, Impact factor & Indexed Monthly Journal www.raijmr.com
RET Academy for International Journals of Multidisciplinary Research (RAIJMR)
Quarkonium: a comparison with Positronium
Tanvi Bhavsar1,* and Manan Shah
2 and P.C. Vinodkumar
1
*[email protected] 1Department of Physics, Sardar Patel University, Vallabh Vidyanagar, Gujarat.
2P. D. Patel Institute of Applied Sciences, CHARUSAT, Changa, 388421, India
Abstract:
Quarkonium is a flavorless meson whose constituents are quark (c,b) and its anti quark(𝑐 , 𝑏 )
where as Positronium (Ps) is a composition of an electron and its anti-particle, a positron.
Positronium consists of two fermionic particles, the total spin of the system couples to a singlet s
= 0 and a triplet s= 1 state same as quarkonia. To study the mass spectrum of quarkonium we
have used two-Body Dirac equations to investigate the problem of highly relativistic quarks in
meson bound states. From our observations it has been noticed that at low energies, quarkonium
spectrum is very similar to that of Positronium. Similarity in both the cases they decay either
through the annihilation of its constituents or through electromagnetic transitions . The only
difference between quarkonium and Positronium is with respect to the fundamental forces
which hold them together. Positronium is held together solely by the electromagnetic force, as it
consists of a pair of colorless leptons, while quarkonium not only feels electromagnetic
attraction, but also the much stronger colour force, which dominates the potential. The spectra
of quarkonium (Charmonium and bottomonium) will be compared with the spectra of
positronium to highlight the similarities and differences.
Keywords: Quarkonium, mass spectra, similarities and differences
Introduction:
Quarkonium the flavorless colourless quark-antiquark systems are of great interest in the field of
hadron physics. The high energy experiments world over have recorded many many quarkonia
states in the charm and bottom sector [1] etc. Theoretically many of these states are standard as
analogy with positronium.
Positronium
Charmonium
Bottomonium

International Journal of Research in Modern Engineering and Emerging Technology (IJRMEET) UGC Approved id_47203
Vol. 5, Sp. Issue: 9, Sept.: 2017 (IJRMEET) ISSN: 2320-6586
217 Online International, Refereed, Impact factor & Indexed Monthly Journal www.raijmr.com
RET Academy for International Journals of Multidisciplinary Research (RAIJMR)
The spectrum of Positronium is very much similar to of that charmonium and bottomonium at
least at low energies. To study the mass spectrum of quarkonium we have used Relativistic
Dirac Formalism to investigate the problem of relativistic quarks inside the meson. Aim of our
work is to compare mass spectra of quarkonium (Charmonium and bottomonium) with the
spectra of positronium to get more information about Hadron Structure and strong interactions.
This paper is organized as follows: after the introduction,in section II we present our theoretical
formalism that we have used to obtain mass spectra of charmonium and bottomonium. In section
III,mass spectra of charmonium, bottomonin and positronium are comparedand in section IV we
discuss our results and in view of the latest experimental data.
Theoratical formalism
In the present study we assume that meson which is containing quark and anti quark is
independently confined by a potential [2,3],
Where λ is the strength of the confinement part of the potential and V0 is a constant negative
potential depth. To first approximation, the confining part of the interaction is believed to
provide the zeroth
order quark dynamics inside the meson through the quark Lagrangian density
[2,3],
The Dirac equation is obtained from as[2,3,4],
To obtain binding energy we have to solve the two component (positive and negative energy)
Dirac equation. Its solution can be written as [4,5],
where the positive and negative energy solutions corresponds to the quark and antiquark
respectively are written as [4,5],

International Journal of Research in Modern Engineering and Emerging Technology (IJRMEET) UGC Approved id_47203
Vol. 5, Sp. Issue: 9, Sept.: 2017 (IJRMEET) ISSN: 2320-6586
218 Online International, Refereed, Impact factor & Indexed Monthly Journal www.raijmr.com
RET Academy for International Journals of Multidisciplinary Research (RAIJMR)
Nnl j is the overall normalisation constant. The corresponding energy eigen value is given
by[4,5],,
Mass of particular Quark-Antiquark system can be written as [4,5],
Here, Ecmin general can be state dependent which we absorb in our potential parameter V0,
making V0as state dependent parameter.
Comparis on of mass spectra of charmonium and bottomonium with positronium
Fig 1 represents the mass spectra of
bottomonium (in MeV)
Fig 2 represents the mass
spectroscopy of Charmonium (in
MeV)

International Journal of Research in Modern Engineering and Emerging Technology (IJRMEET) UGC Approved id_47203
Vol. 5, Sp. Issue: 9, Sept.: 2017 (IJRMEET) ISSN: 2320-6586
219 Online International, Refereed, Impact factor & Indexed Monthly Journal www.raijmr.com
RET Academy for International Journals of Multidisciplinary Research (RAIJMR)
Results and discussion
Our computed mass spectra for quarkonium is in good agreement with experimental
results.
From our observations it has been noticed that at low energies, quarkonium spectrum is
very similar to that Positronium and deviations from the spectrum of the positronium are
only obtained with higher excitations. Another similarity is their binding energies are
relatively small.
ACKNOWLEDGMENTS
We acknowledge the financial support from DST-SERB, India (research Project number:
SERB/F/8749/2015-16)
Reference:
[1] K.A.Olive et al.(Particle data group) chin. Phys.C, 2014, 38,090001.
[2] M. Shah, B. Patel and P. C. Vinodkumar, Phys. Rev. D 2014, 90, 014009.
[3] M. Shah, B. Patel and P. C. Vinodkumar, Phys. Rev. D 2016, 93, 094028.
[4] W.Greiner,‘Relativistic Quantum Mechancs - Wave Eqautions’, Springer-Verlag Berlin
Heidelberg 1990, NY. U.S.A.
[5] G. Aruldhas , ‘Quantum mechanics’, PHI Learing Private Limited, New Delhi, Second
Edition.
Fig 3 represents the mass spectra of
Positronium (in MeV)

International Journal of Research in Modern Engineering and Emerging Technology (IJRMEET) UGC Approved id_47203
Vol. 5, Sp. Issue: 9, Sept.: 2017 (IJRMEET) ISSN: 2320-6586
220 Online International, Refereed, Impact factor & Indexed Monthly Journal www.raijmr.com
RET Academy for International Journals of Multidisciplinary Research (RAIJMR)
Theoretical Study of Knight-Shifts in Liquid Alkali Metals
A. M. Vora and P. N. Gajjar
Department of Physics, University School of Sciences, Gujarat University,
Ahmedabad-380009, Gujrat, India
E-mail : [email protected], [email protected]
Abstract
In the present paper, we report the knight-shifts of liquid alkali metals at their melting point
temperature using a model potential formalism. A universal model potential given by Fiolhais
et al. is used for the first time with five local field correction functions proposed by Hartree
(H), Taylor (T), Ichimaru-Utsumi (IU), Farid et al. (F) and Sarkar et al. (S) in the present
computation and found suitable for such study. The theoretical structure factors due to PY
theory is adopted for generating the structure factor. It is concluded that, the comparisons of
present results with theoretical findings wherever exists are highly encouraging.
Keywords : Pseudopotential; knight-shifts; structure factor; liquid alkali; local field
correction functions.
Introduction
Knight-shift measurements in metals and alloys are of interest because they provide a delicate
probe of both the electronic and magnetic properties in the vicinity of the resonant nucleus. In
spite of the extensive theoretical work done in this field, it can still be said that a description of
the knight-shift which consistently incorporates all the effects that have been considered
important (such as self constancy and core polarization) is still lacking. Also, the Knight-shift
of simple metals at their melting temperature based on pseudopotential has been studied by
many authors [1-13]. Previously, Styles and Tranfield [4] have studied the knight-shift of about
18 simple liquid metals using non-local pseudopotential theory with reasonable accuracy.
Mishra et al. [7] have used non-local form of pseudopotential for the calculation of the knight-
shift of simple liquid metals. Their results show deviation from the experimental values
ranging 0%-15% and 0%-69% respectively. Halder [10, 11] has reported knight-shift of liquid
metals and their alloys using model potential formalism. Zaremba and Zobin [12] have studied
knight-shifts in simple metals using density functional approach. Very recently, knight-shifts of
some liquid non-transition and transition metals using newly proposed model potential was

International Journal of Research in Modern Engineering and Emerging Technology (IJRMEET) UGC Approved id_47203
Vol. 5, Sp. Issue: 9, Sept.: 2017 (IJRMEET) ISSN: 2320-6586
221 Online International, Refereed, Impact factor & Indexed Monthly Journal www.raijmr.com
RET Academy for International Journals of Multidisciplinary Research (RAIJMR)
reported by Baria [13] and found suitable for his study. We have also reported knight-shift data
of large number of metals [3] with empty core model (EMC) potential of Ashcroft [14].
In the present paper, we are intended to report the knight-shifts of liquid alkali metals based on
the universal model potential of Fiolhais et al. [15]. In the present work, the theoretical
structure factors are computed from the Percus-Yevic (PY) hard sphere model with proper
packing density [16]. Five different types of the local field correction functions proposed by
Taylor (T) [17], Ichimaru-Utsumi (IU) [18], Farid et al. (F) [19] and Sarkar et al. (S) [20] are
employed for the first time to investigate the influence of the exchange and correlation effects
with reference to the static Hartree (H) [21] screening function in the present computations.
Computational Methodology
The knight-shift in liquid metals is described by the equation [1-13]
2
03
2FkOSK . (1)
Where, O is the atomic volume, S is the Pauli susceptibility per unit volume of the
conduction electrons and rFk is the wave function of an electron at the Fermi surface. In
the free electron approximation the temperature dependence of the knight-shifts at a constant
volume in the liquid phase is given by [1-13]
0
2 22
2ln
24
3ln
FF
F
FFFmk
qd
kq
kq
k
qqWqa
kET
Z
T
K, (2)
and the knight-shift of a liquid metal is given by [5, 9]
0
2
1
22
2ln
24
3
FF
F
FFFO k
qd
kq
kq
k
qqWqa
kE
Z
K
K. (3)
Here qa is the structure factor derived via the Percus-Yevic (PY) hard sphere model [16] and
depends only on the packing fraction , qW the screened form factor, MT the melting

International Journal of Research in Modern Engineering and Emerging Technology (IJRMEET) UGC Approved id_47203
Vol. 5, Sp. Issue: 9, Sept.: 2017 (IJRMEET) ISSN: 2320-6586
222 Online International, Refereed, Impact factor & Indexed Monthly Journal www.raijmr.com
RET Academy for International Journals of Multidisciplinary Research (RAIJMR)
temperature, mkE FF 22 the Fermi energy and 3123 OF Zk the Fermi wave vector
with O the atomic volume of the liquid metals.
The universal model potential of Fiolhais et al. [15] is used in the present computation
including five different types of the local field correlation functions [17-21]. The form factor
explored in the present investigation is of the form [15],
22222222
22
1
22114
qR
A
qRqRqRq
RZeqV
O
, (4)
with Rrx , R being a core decay length, and with 0 . An analyticity condition at 0r
determines the parameters A and in terms of as follows,
14
22
3
and 2
2
1A . (5)
Also, Z is the valence, O the atomic volume and q the modified Hartree dielectric
function [21].
Results and Discussion
The input parameters and constants used in the present calculations are given in Table 1. Our
present investigation of the knight-shifts OKK1 and the temperature coefficients of knight-
shifts of alkali metallic elements are narrated in Tables 2-3 with the theoretical [13] data
wherever exists in the literature.
Table 1. Input parameters and other constants.
Metals Z ΩO (au) T (K) (au) R (au)
Li 1 142.47 453 0.46 3.546 0.361
Na 1 254.25 378 0.46 3.074 0.528
K 1 480.84 343 0.46 2.806 0.745
Rb 1 588.98 313 0.43 2.749 0.823
Cs 1 743.53 323 0.43 2.692 0.919

International Journal of Research in Modern Engineering and Emerging Technology (IJRMEET) UGC Approved id_47203
Vol. 5, Sp. Issue: 9, Sept.: 2017 (IJRMEET) ISSN: 2320-6586
223 Online International, Refereed, Impact factor & Indexed Monthly Journal www.raijmr.com
RET Academy for International Journals of Multidisciplinary Research (RAIJMR)
Table 2. Knight-shifts OKK1 of liquid alkali metals at melting point.
Metals Present results Others
[13] H T IU F S
Li 0.0994 0.1318 0.1066 0.1375 0.1172 0.126
Na 0.1270 0.1769 0.1375 0.1856 0.1546 0.206
K 0.1639 0.2438 0.1798 0.2574 0.2075 0.303
Rb 0.2094 0.318 0.2305 0.3367 0.2685 0.378
Cs 0.2295 0.3587 0.2539 0.3807 0.299 0.425
Table 3.The temperature coefficients of knight-shifts (in 10-4
K-1
) of liquid alkali metals at
melting point.
Metals Present results Others
[13] H T IU F S
Li 3.2025 3.3424 3.2349 3.2254 3.2244 3.9
Na 3.0591 3.2148 3.0975 3.0449 3.0729 3.5
K 3.0930 3.2687 3.1399 3.0123 3.0902 2.5
Rb 3.3125 3.4646 3.3586 3.1355 3.2743 3.8
Cs 3.2445 3.3944 3.2927 3.026 3.1945 1.9
From the study of Table 2-3, it can be noted that among the five employed local field
correction functions, the local field correction function due to H (without exchange and
correlation) gives the lowest value of knight-shifts OKK1 and the temperature coefficients of
knight-shifts of liquid alkali metals at melting point while the local field correction function
due to T and F gives the highest values of the properties. The presently computed all results are
found in qualitative agreement with the available theoretical [13]. In comparison with the
presently computed results of the knight-shifts of various local field correction functions with
respect to static H-function, the percentile influence for all liquid alkali metals is found of the
order of 0.09%-15.11% while those found for the temperature coefficients of knight-shifts of
liquid alkali metals at melting point is of the order of 0.46%-15.10%, respectively.
According to the Styles and Tranfield [4], have concluded that the knight-shifts calculations are
not particularly sensitive to the exact values of the structure factor of the metallic elements and

International Journal of Research in Modern Engineering and Emerging Technology (IJRMEET) UGC Approved id_47203
Vol. 5, Sp. Issue: 9, Sept.: 2017 (IJRMEET) ISSN: 2320-6586
224 Online International, Refereed, Impact factor & Indexed Monthly Journal www.raijmr.com
RET Academy for International Journals of Multidisciplinary Research (RAIJMR)
uncertainties in the results cannot account for the differences between theory and experiment.
Also, the values of the conduction electron spin susceptibility used in the present computation
of the knight-shifts are responsible for significant variations. The numerical values of the
knight-shifts OKK1 and the temperature coefficients of knight-shifts are found to be quite
sensitive to the selection of the local field correction functions and showing a significant
variation with the change in the functions. Neither the experimental result for alkali metallic
elements at a constant volume and the knight-shifts are available, so the present investigations
are found in predictive nature.
Conclusions
It is concluded that, we are reporting here the knight-shifts of some liquid alkali metals for the
first time using a Fiolhais et al.’s universal model potential with PY structure factor and
different local field correction functions. Hence, such potential can predict the trend of the
potential over the alkali elements.
Acknowledgements
Computer facility developed under DST-FIST programme from Department of Science and
Technology, Government of India, New Delhi, India and financial assistance under DRS-SAP-
I from University Grants Commission, New Delhi, India is highly acknowledge by the authors.
References
[1] M. Shimoji, Liquid metals, Academic Press, London, 1977.
[2] T. E. Faber, An Introduction to the theory of liquid metals, Cambridge University Press,
London, 1972.
[3] Aditya M. Vora, Chinese J. Phys., 2008, 46, 426.
[4] G. A Styles, G. Tranfield, J. Phys. F.: Metal Phys., 1978, 8, 2035.
[5] F. Seitz, D. Turnbull, Solid State Physics, Vol. 2, Academic press, New York, 1956.
[6] A. L. Ritter, J. A. Gardner, Phys. Rev., 1971, 3, 46.
[7] B. Mishra, L. K. Das, T. Sahu, G. S. Tripathi, P. K. Mishra, J. Phys.: Conden. Mat.,
1990, 2, 9891.
[8] J. Behari, Phil. Mag., 1972, 26, 737.
[9] M. Watabe, M. Tahaka, H. Endo, B. K. Jones, Phil. Mag., 1965, 12, 347.
[10] N. C. Halder, J. Chem. Phys., 1970, 52, 5450.

International Journal of Research in Modern Engineering and Emerging Technology (IJRMEET) UGC Approved id_47203
Vol. 5, Sp. Issue: 9, Sept.: 2017 (IJRMEET) ISSN: 2320-6586
225 Online International, Refereed, Impact factor & Indexed Monthly Journal www.raijmr.com
RET Academy for International Journals of Multidisciplinary Research (RAIJMR)
[11] N. C. Halder, Phys. Rev. 1969, 177, 471.
[12] E. Zaremba, D. Zobin, Phys. Rev. Lett., 1980, 44, 175.
[13] J. K. Baria, Chinese J. Phys., 2003, 41, 528.
[14] N. W. Ashcroft, Phys. Lett., 1966, 23, 48.
[15] C. Fiolhais, J. P. Perdew, S. Q. Armster, J. M. MacLaren, M. Brajczewska, Phys Rev B,
1995, 51, 14001.
[16] J. K. Percus, G. J. Yevick, Phys. Rev., 1958, 110, 1.
[17] R. Taylor, J. Phys. F: Metal Phys., 1978, 8, 8.
[18] S. Ichimaru, K. Utsumi, Phys. Rev. B, 1981, 24, 7385.
[19] B. Farid, V. Heine, G. E. Engel, I. J. Robertson, Phys. Rev. B, 1993, 48, 11602.
[20] A. Sarkar, D. S. Sen, S. Haldar, D. Roy, Mod. Phys. Lett. B, 1998, 12, 639.
[21] W. A. Harrison, Elementary Electronic Structure, World Scientific, Singapore, 1999.

International Journal of Research in Modern Engineering and Emerging Technology (IJRMEET) UGC Approved id_47203
Vol. 5, Sp. Issue: 9, Sept.: 2017 (IJRMEET) ISSN: 2320-6586
226 Online International, Refereed, Impact factor & Indexed Monthly Journal www.raijmr.com
RET Academy for International Journals of Multidisciplinary Research (RAIJMR)
Some static and vibrational properties of strontium
using local pseudopotential
B.S. Pandya1*
, D.D. Satikunvar1, R. H. Joshi
1, N. K. Bhatt
2 and B. Y. Thakore
1
1Department of Physics, Sardar Patel University, Vallabh Vidyanagr – 388 120, Gujarat, India.
2Department of Physics, M. K. Bhavnagar University, Bhavnagar – 364 001, Gujarat, India.
E-mail : [email protected]
Abstract
Within the frame work of second order perturbation theory based on pseudopotential we
have calculated the interatomic pair potential for the elemental strontium employing two
parametric evanescent form of local pseudopotential along with Ichimaru and Utsumi dielectric
screening function which plays a role of exchange and correlation. Presently, we have calculated
interatomic force constants up to 37 shells, dynamical elastic constants, bulk modulus, deviation
from Cauchy relation, Poisson’s ratio, Young’s modulus and propagation velocity of elastic
waves. Overall, we found an excellent agreement of our results with other available results
experimental as well as theoretical.
Keywords
Strontium, elastic constants, pseudopotential, central force
Introduction
The alkaline earth metals make up group IIA of the modern periodic table. Naturally
occurring element strontium occupies all most middle position in the family and it is more
reactive than Ca and Mg but less active than Ba, preserving face centered cubic structure at the
ambient environment. The alkaline earth metal recognized as the empty d-band metals and the
band structure and the other physical properties of them strongly influenced via hybridization
effects at and below Fermi level. All though the vast amount of work has been carried out by the
researchers on the alkaline earth metals but the case of strontium is not much attempted. As
much as the technological applications are concern, the comprehension of the elastic properties
of any metal is at prime importance. The behavior of the elasticity of the Sr can be studied by

International Journal of Research in Modern Engineering and Emerging Technology (IJRMEET) UGC Approved id_47203
Vol. 5, Sp. Issue: 9, Sept.: 2017 (IJRMEET) ISSN: 2320-6586
227 Online International, Refereed, Impact factor & Indexed Monthly Journal www.raijmr.com
RET Academy for International Journals of Multidisciplinary Research (RAIJMR)
investigating the static and vibrational properties of it. The simplest approach is assumption of
central force between the pair of ions or atoms. Also, keeping in mind that the non local effects
are negligible in the effective electron-ion interaction and local potential is sufficient to describe
behavior of interaction, we can calculate elastic properties by the method of homogeneous
deformations. The lattice dynamical properties, within the framework of second order
perturbation treatment on the pseuedopotential, has been subject of many studies. Following to
this, hereby we have calculated the effective ion-ion potential along with interatomic force
constants which are useful while studying the dynamical elastic constants, shear modulus and
bulk modulus. This set of data is efficient in evaluation of violation of Cauchy’s relation,
Poisson’s ratio, Young’s modulus and propagation velocities of elastic waves. We have used
local form of pseudopotential proposed by Fiolhais et al. [1] for exploration of above properties
and dielectric screening function due to Icihmaru and Utsumi [2] is bring into play to mimic the
role of exchange and correlation. Our main objective is to compare our results with the available
experimental as well as other theoretical data and to check the applicability of the formalism.
Evanscent pseudopotential
A “structured” local electron-ion pseudopotential have been proposed by the Fiolhais et
al. [1] which resolves the drawback of the structureless pseudopotential. This proposed
pseudopotential depends on the density on the surface of Wigner-Seitz cell, which is given as
equilibrium number of valence electrons in the interstitial region, instead of density parameters
Rs and valence Z. This potential was formulated directly in and for the solid state so the
complexity of transferability to the solid state does not occur.
After motivated by earlier proposed pseudopotential due to Hellmann [5,6] and
orthogonality arguments [7], authors given the smooth local pseudopotential which has
evanescent form (i.e. as r → ∞) exponential decay of the core repulsion) as,
V r = −ze2
R
1
x 1 − 1 + βx . e−x − Ae−x . (1)
Having, x =r
R; R stands for the core decay length and is a positive parameter.
The local pseudopotential in the form of equation (1) is continuous and its derivatives are
also continuous. This is specially constructed to have a finite value at r → 𝟢 and first and third

International Journal of Research in Modern Engineering and Emerging Technology (IJRMEET) UGC Approved id_47203
Vol. 5, Sp. Issue: 9, Sept.: 2017 (IJRMEET) ISSN: 2320-6586
228 Online International, Refereed, Impact factor & Indexed Monthly Journal www.raijmr.com
RET Academy for International Journals of Multidisciplinary Research (RAIJMR)
derivatives are zero. A and can be determine in terms of by an analytical condition at r = 0.
By expanding the equation (1) about x within limit x → 0, we have
ω → −ze2
R
− + A +
x
1! −
1
22 + + A
+x2
2!
1
3 2 − 2 + A
+x
3! −
1
44 + 3 + A + ⋯
(2)
As first and third derivatives vanish so one can write,
−1
22 + + A = 0 and −
1
44 + 3 + A = 0
By solving above equations, we have A and as,
A = 2
2− and β =
α3−2α
4 α2−1 (3)
By the Fourier transform of equation (1) we have q-space representation for the
pseudopotential as,
V q = 8πZe2R2
Ω
−1
qR2 +
1
qR2 +α2 +
2αβ
qR2 +α2 2+
2A
qR2 +1 2 , (4)
At r = 0, smoothness and analyticity are responsible for better convergence of sums over
reciprocal lattice vectors (lim q→ , ω(q)~q-8).
Authors have determined two parameters R and by employing two conditions. One is
zero pressure at observed density Rs. (i.e. Rs is the empirical input) and second is valence
interstitial electron number Nint. There are two different ways for the determination of parameters
R and namely, “Universal” and “Individual”. If Nint is kept equal to uniform-electron-value at
zero pressure condition, one can attain “Universal set of Parameters” and if the Nint is evaluated
to actual value for each metal, the “individual set of Parameters” can be conquered. But it is
found that bulk properties can be more accurately determined by individual set of parameters so

International Journal of Research in Modern Engineering and Emerging Technology (IJRMEET) UGC Approved id_47203
Vol. 5, Sp. Issue: 9, Sept.: 2017 (IJRMEET) ISSN: 2320-6586
229 Online International, Refereed, Impact factor & Indexed Monthly Journal www.raijmr.com
RET Academy for International Journals of Multidisciplinary Research (RAIJMR)
we have used the individual set of parameters throughout the calculations. Table 1 shows the
individual set of parameters and other input data used for computations.
Table1
Pseudopotential parameters (proposed by Fiolhais et al. [1] ) and supplementary input data for
computations.
Metal
Crystal
Structure
Pseudopotential
Parameters [1]
Valence
(Z)
Mass of ion M [3]
(a.m.u.)
R (a.u.)
Sr FCC 3.176 0.614 2 87.62
Effective ion-ion potential
In the second order perturbation theory, the effective interatomic pair potential of a given
metal is a sum of the Coulombian repulsive interaction between two ions and attractive
interaction between an ion and screening electron cloud. This effective inter-atomic pair
potential can be given as,
V r = Z2e2
r+
o
2 F q sin qr
qrq2 dq (5)
In this equation, Z is the valence. e and are the electronic charge and atomic volume
respectively.The first term in the above equation represents the direct repulsive coulombian
interaction between the ions and the second term gives the indirect interaction of the conduction
electrons and ions. This indirect interaction can be evaluated using the energy wave number
characteristics as,
F q = −o q2
16 WB q 2
H q −1
1+ H q −1 1−f q (6)
Here, H q is the Hartree dielectric screening function [4] and f q represents the local
field correction function, which represents the exchange and correlation effects and as mentioned
earlier we have used IU [3] screening function throughout the present work. To investigate the

International Journal of Research in Modern Engineering and Emerging Technology (IJRMEET) UGC Approved id_47203
Vol. 5, Sp. Issue: 9, Sept.: 2017 (IJRMEET) ISSN: 2320-6586
230 Online International, Refereed, Impact factor & Indexed Monthly Journal www.raijmr.com
RET Academy for International Journals of Multidisciplinary Research (RAIJMR)
various physical properties at different temperature one should have the knowledge about the
temperature dependent pair potential. The temperature dependent pair potential can be obtained
by the multiplication of the dimensionless damping term exp −kB T
2kFr with pair potential. It
will provide the necessary Friedel damping at high temperature as anticipated. With the
following equation we can obtain the pair potential at desired temperature.
V r, T = V r exp −kB T
2kFr (7)
Figure 1 Interatomic potential for solid Sr. Full line is for the temperature 1050 K and dotted line is for
1655 K.
Radial (Kr) and Tangential (Kt) Force Constants The force acting between two atoms or ions depends on the distance between them. A
pair of the ions interacting due to a central interaction have two independent interatomic force
constant, namely tangential (Kt) and radial (Kr). Exploiting interionic potential V(r), we can
acquire tangential and radial force constant in real space as follows [8-12].
The tangential force constants (Kt) given as,
Kt =1
r
dV r
dr

International Journal of Research in Modern Engineering and Emerging Technology (IJRMEET) UGC Approved id_47203
Vol. 5, Sp. Issue: 9, Sept.: 2017 (IJRMEET) ISSN: 2320-6586
231 Online International, Refereed, Impact factor & Indexed Monthly Journal www.raijmr.com
RET Academy for International Journals of Multidisciplinary Research (RAIJMR)
=−Z2 e2
r3 +Ω
π2r2 F q q2 cos qr −sin qr
qr dq
∞
0 (8)
The radial force constants (Kr) given as,
Kr = d2V r
dr2
=2Z2e2
r2 + Ω
π2r2 F q q2∞
0
2 sin qr
qr− 2 cos qr − qr sin qr dq (9)
By utilizing Kr and Kt we can attain the interatomic force constants K as a tensor [13,14] as,
Kαβ = d2Φ r
drα drβ
= δαβ −rα rβ
r2 Kt + rα rβ
r2 Kr (10)
Here, r and r stands for the th
and th
cartesion components of the position vector r of
the ion, correspondingly.
Presently, we have generated the interatomic force constants for 37 shells in the nearest
neighbor region in real space. Table 2 contains results of our computations. Our results
are in a good agreement with the others. For the sack of simplicity we do not
compare our results with other available results.
Table 2
Radial and Tangential Force Constants in dyne/cm
Shell
No.
(n)
Shell
Type
No of Atoms
N(n)
Radial Force
Constants
(in dyne/cm)
Tangential Force
Constants
(in dyne/cm)
1 (011) 12 7179.075464 -413.213293
2 (002) 06 -257.591505 -35.121496
3 (112) 24 228.663676 0.077415
4 (022) 12 -101.013444 5.094013
5 (013) 24 -13.048369 -3.568812
6 (222) 08 52.192484 -0.295125
7 (123) 48 -6.242830 1.681401
8 (004) 06 -29.996404 -0.004955
9 (033) 12 1.240236 -0.934775
10 (411) 24 1.240236 -0.934775
11 (420) 24 20.218919 -0.185348
12 (233) 24 6.257654 0.527905
13 (422) 24 -11.666087 0.348283

International Journal of Research in Modern Engineering and Emerging Technology (IJRMEET) UGC Approved id_47203
Vol. 5, Sp. Issue: 9, Sept.: 2017 (IJRMEET) ISSN: 2320-6586
232 Online International, Refereed, Impact factor & Indexed Monthly Journal www.raijmr.com
RET Academy for International Journals of Multidisciplinary Research (RAIJMR)
14 (510) 24 -11.108290 -0.177179
15 (431) 48 -11.108290 -0.177179
16 (521) 48 9.849224 -0.113136
17 (440) 12 6.333602 0.174637
18 (433) 24 -2.537991 0.227012
19 (530) 24 -2.537991 0.227012
20 (600) 06 -7.419626 0.063720
21 (442) 24 -7.419626 0.063720
22 (611) 24 -4.961898 -0.117610
23 (532) 48 -4.961898 -0.117610
24 (620) 24 1.215748 1.215748
25 (541) 48 5.417775 -0.071591
26 (622) 24 4.805896 0.056829
27 (631) 48 0.733630 0.119888
28 (444) 08 -3.280619 0.087479
29 (017) 24 -4.492987 0.001386
30 (435) 48 -4.492987 0.001386
31 (640) 24 -2.566634 -0.071323
32 (633) 24 0.760550 -0.087229
33 (127) 48 0.760550 -0.087229
34 (642) 48 3.208340 -0.047193
35 (730) 24 3.437833 0.014906
36 (651) 48 -0.890747 0.064447
37 (732) 48 -0.890747 0.064447
Dynamical Elastic Constants, Shear Modulus and Bulk Modulus
When a crystal is under an external stress and if the deformation is relatively small then
the strain is directly proportional to the stress as per the Hooke’s law. Thus, the stress and strain
components are linear functions of each other and they are associated by elastic stiffness
constant. In the cubic crystals there are four three-fold rotation axes. So in cubic crystals there
are three independent elastic constants viz. C11, C12 and C44.
The dynamical elastic constants C11, C12 and C44 can be obtained by long wave length
phonon velocity method [12] that is the dynamical treatment for computation of the elastic
constants as well as incorporating the interatomic force constants Kn at nth neighbour
separation.
C11 = 1
12a N n x2 Kxx
n + y2 Kyy n + z2Kzz
n n (11)

International Journal of Research in Modern Engineering and Emerging Technology (IJRMEET) UGC Approved id_47203
Vol. 5, Sp. Issue: 9, Sept.: 2017 (IJRMEET) ISSN: 2320-6586
233 Online International, Refereed, Impact factor & Indexed Monthly Journal www.raijmr.com
RET Academy for International Journals of Multidisciplinary Research (RAIJMR)
C44 = 1
24a N n y2 + z2 Kxx
n + z2 + x2 Kyyn + x2 + y2 Kzz
n n (12)
C12 + C44 = 1
6a N n yz Kyz
n + zx Kzxn + xy Kxy
n n (13)
Where, a is a lattice constant and N(n) represents the number of atoms at the nth neighbour
separation. Here the atomic position at nth
neighbour separation is demonstrated as a
2 x, y, z .
Shear Modulus (C) using equation (11) and (12) can be given as,
C = C11− C12
2 (14)
Similarly the Bulk Modulus (B),
B = C11 +2C12
3 (15)
While evaluating the elastic constants and bulk modulus using interatomic force
constants, it is necessary to consider the long-range character for the conversion of calculation.
Regarding to this we have performed the real-space sum up to 37 shells. Table 3 contains the
calculated elastic constants, shear modulus and bulk modulus along with other experimental and
theoretical results. Our results are in a better agreement with them. Little difference in a some of
values is due to choice of screening function and form of pseudopotential as far as the theoretical
results are concern.
Table 3
Elastic constants[C11 , C12 and C44 ], Shear modulus [C′] and Bulk modulus [B] for Sr. All quantities are
in [1012 dyne /cm2].
Present Experimental Other Theoretical
Results
𝐂𝟏𝟏 0.2080 0.1700 [18] 0.1910 [24]
0.1888 [19]
0.2500 [20]
𝐂𝟏𝟐 0.1588 0.1221 [18] 0.1480 [24]
0.1473 [19]

International Journal of Research in Modern Engineering and Emerging Technology (IJRMEET) UGC Approved id_47203
Vol. 5, Sp. Issue: 9, Sept.: 2017 (IJRMEET) ISSN: 2320-6586
234 Online International, Refereed, Impact factor & Indexed Monthly Journal www.raijmr.com
RET Academy for International Journals of Multidisciplinary Research (RAIJMR)
0.1700 [20]
𝐂𝟒𝟒 0.1005 0.099 [18] 0.0780 [24]
0.1180 [19]
0.1300 [20]
𝐂′ 0.0240 0.0230 [18]
0.0215 [24]
0.0400 [20]
𝐁
0.1752 0.1200 [18]
0.1620 [24]
0.1190 [22]
0.1420 [21]
0.1960 [20]
0.1250 [23]
Table 4
Deviation from Cauchy’s relation [in 1012 dyne /cm2], Cauchy’s ratio, Poisson’s ration and Young’s
modulus [in 1012 dyne /cm2] for Sr.
Present Experimental
Other
theoretical
results
𝐂𝟏𝟏 − 𝐂𝟏𝟐 0.0582 0.0470 [18] 0.0430 [24]
𝐂𝟏𝟐 𝐂𝟒𝟒 1.5793 1.2330 [18] 1.8970 [24]
σ 0.4329 0.4180 [18] 0.4360 [24]
𝐘 0.0705 0.0590 [18] 0.0610 [24]
Propagation Velocities of the Elastic Waves
Determination of the elastic constants C11, C12 and C4 gives provision to evaluate the
propagation velocity of the elastic waves.
Concerning to the cubic system, the propagation velocity for the longitudinal and
transverse waves in symmetry direction [100] are [3,17],
vL 1 0 0 = C11
ρ
1
2 (21)
vT 1 0 0 = C44
ρ
1
2 (22)

International Journal of Research in Modern Engineering and Emerging Technology (IJRMEET) UGC Approved id_47203
Vol. 5, Sp. Issue: 9, Sept.: 2017 (IJRMEET) ISSN: 2320-6586
235 Online International, Refereed, Impact factor & Indexed Monthly Journal www.raijmr.com
RET Academy for International Journals of Multidisciplinary Research (RAIJMR)
Here, ρ is the density of the crystal. The velocity of the elastic waves in [110] direction are
[3,17],
vL 1 1 0 = C11 + C12 + 2C44
2ρ
1
2 (23)
vT1 1 1 0 = C44
ρ
1
2 (24)
vT2 1 1 0 = C11− C12
2ρ
1
2 (25)
[110] is the face diagonal direction of a cubic crystal. Here three elastic constants can be found
from the three different propagation velocities in this direction. The propagation velocity in the
[111] direction are [3,17],
vL 1 1 1 = C11 +2 C12 + 4C44
3ρ
1
2 (26)
vT 1 1 1 = C11−C12 +C44
3ρ
1
2 (27)
Table 5 shows our computed results as well as other experimental and theoretical results. Results
are in a excellent agreement with them.
Table 5
Propagation velocities [in 105 cm /sec] of elastic waves in Sr.
Present Experimental
Other Theoretical
Results
VL (100) 2.83 2.62 [18] 2.78 [24]
VT (100) 1.97 2.00 [18] 1.77 [24]
VL (110) 4.68 4.26 [18] 4.48 [24]
VT1 (110) 1.97 1.40 [18] 1.77 [24]
VT2 (110) 0.97 0.98 [18] 0.93 [24]
VL (111) 3.45 3.30 [18] 3.28 [24]
VT (111) 1.38 1.40 [18] 1.27 [24]

International Journal of Research in Modern Engineering and Emerging Technology (IJRMEET) UGC Approved id_47203
Vol. 5, Sp. Issue: 9, Sept.: 2017 (IJRMEET) ISSN: 2320-6586
236 Online International, Refereed, Impact factor & Indexed Monthly Journal www.raijmr.com
RET Academy for International Journals of Multidisciplinary Research (RAIJMR)
Conclusion
We have carried out theoretical investigation of static properties of strontium on the basis of
pseudopotential method. Our computed results are in outstanding agreement with the
experimental results and better than the available other theoretical investigations. The present
result has confirmed that the pseudopotential characterized with good q0 value can yield very
good results for metalic properties. To extend this work we can also calculate the anisotropy of
crystal, temperature variation of the all of above properties. Based on present formulation, the
investigation of the electronic properties would be interesting and open problem for future work.
References
[1] C. Fiolhais, J. P. Perdev, S.Q. Armster, J.M. MacLaren and Brajazewska, Phys.
Rev. B, (1996), 51, 14001;ibid., 53, 13193 (E).
[2] S. Ichimaru and K. Utsumi, Phys. Rev., B, (1981), 24, 7385.
[3] C. Kittle, “Introduction to the Solid State Physics”, Wiley Eastern University
Edition, Berkely, CA, (1966).
[4] W. A. Harrison, “Pseudopotential in the Theory of Metals”, W. A. Benjamin, New
York, (1966).
[5] H. Hellmann, Acta Physicochim., USSR, (1934). 1, 913.
[6] H. Hellmann, J. Chem. Phys., (1935), 3, 61.
[7] B. J. Austine, V. Heine and L. J. Sham, Phys. Rev., (1968). 127, 276.
[8] W. M. Shyu and G. D. Gaspari, Phys. Rev., (1968), 170, 687.
[9] W. M. Hartmann and T. O. Milbrodt, Phys. Rev. B, (1971). 3, 4133.
[10] V. B. Gohel, C. K. Acharya and A. R. Jani, J. Phys. F, (1985), 15, 279.
[11] R. F. Wallis, A. A. Maradudin, V. Bortolani, A. G. Eguiluz, A. A. Quong, A.
Franchini and G. Santoro, Phys. Rev. B, (1993), 48, 6043.
[12] E. G. Brovman and M. Yu. Kagan, “Dynamical Properties of Solids”, Vol. 1 ed, G.
K. Horton and A. A. Maradudin, North-Hollend: Amsterdam, (1974).
[13] G. L. Krasko and Z. A. Guruskii, Sov. Phys. Solid State, (1971), 13, 2062.
[14] Z. A. Gurskii and G. L. Krasko, Sov. Phys. Doklady, (1971), 16, 298.
[15] D. Sen and S. K. Sarkar, Phys. Rev. B, (1980), 22, 1856.

International Journal of Research in Modern Engineering and Emerging Technology (IJRMEET) UGC Approved id_47203
Vol. 5, Sp. Issue: 9, Sept.: 2017 (IJRMEET) ISSN: 2320-6586
237 Online International, Refereed, Impact factor & Indexed Monthly Journal www.raijmr.com
RET Academy for International Journals of Multidisciplinary Research (RAIJMR)
[16] W. A. Harrison and J. M. Wills, Phys. Rev. B, (1982), 25, 5007.
[17] D. L. Jules, “Solid State Physics”, Vol. 2 ed., F. Seitz and D. Turnbull, Academic
Press: New York, (1956).
[18] U. Buchenau, M. Heiroth and M. Schober, Phys. Rev. B, (1984), 30, 3502.
[19] S. Das and A. Sarkar, Pramana J. Phys., (1987), 28, 689.
[20] J. A. Moriarty, Phys. Rev. B, 34, (1986), 6738.
[21] D. J. Gonzalez, C. M. Zapata and J. A. Alonso, Phys. Stat. Sol. (b), (1985), 29,
483.
[22] G. K. White, J. Phys. F, (1972), 2, 865.
[23] L. Pollack, J. P. Predew, J. He, M. Marques, F. Nogueira and C. Fiolhais, Phys.
Rev. B, (1997), 55, 23.
[24] T. C. Pandya, “A Comprehensive Study of Physical Properties of Alkaline Earth
Metals (A Pseudopotential Approch)”, Thesis, Gujarat University, (2000).
[25] E. G. Brovman, Yu. Kagan and A. Kholas, Sov. Phys. Solid Stat., (1970), 12, 786.

International Journal of Research in Modern Engineering and Emerging Technology (IJRMEET) UGC Approved id_47203
Vol. 5, Sp. Issue: 9, Sept.: 2017 (IJRMEET) ISSN: 2320-6586
238 Online International, Refereed, Impact factor & Indexed Monthly Journal www.raijmr.com
RET Academy for International Journals of Multidisciplinary Research (RAIJMR)
Electron induced Interactions Cross sections for Methanimine
(CH2NH)
Yogesh Thakar1, RakeshBhavsar
2, Chetan Limbachiya
3,*
1,2M.N. College, Visnagar -384315
3The M.S. University of Baroda, Vadodara – 390001
*E-mail:[email protected]
Abstract
In present work electrons induced processes with important astro-compound, Methanimine
found in tholins of Titan are investigated. We report calculated total elastic cross sections Qel,
andtotal cross sections QT for Methanimine(CH2NH), upon electron impact for energies from
ionization threshold to 5 keV. We have employed Spherical Complex Optical Potential (SCOP)
formalism to calculate total elastic cross section, total cross sections for compound
methanimine total cross sections.
Keywords: Astrocompound compounds, spherical complex optical potential (SCOP),
Total cross sections.
Introduction
Methanimine is astromolecule, detected in sagattarius-B. Since molecule are in gaseous phase
their interaction with electron play important role. Methanimine is of great interest since it is
aminoacid precursor. Methaniminecan form simplest amino acid, glycine when it reacts with
hydrogen cyanide thus it play significant role in life building block. Methanimine is protonated
imines and is detected in an ion composition in agreement with Titan’s INMS measurements
reinforcing the suspected role in chemical species on aerosol production. [1]Calculations of
various cross sections of these targets are in demand in astrophysics
Fig1.Methanimine CH2NH

International Journal of Research in Modern Engineering and Emerging Technology (IJRMEET) UGC Approved id_47203
Vol. 5, Sp. Issue: 9, Sept.: 2017 (IJRMEET) ISSN: 2320-6586
239 Online International, Refereed, Impact factor & Indexed Monthly Journal www.raijmr.com
RET Academy for International Journals of Multidisciplinary Research (RAIJMR)
Table 1: Properties of target molecule [2,3]
Molecule I.P. (eV) Bond lengths(Å) Polarizability(Å3) Dipole-moment (D)
Methanimine
(CH2NH)
10.70
C=N 1.273
N=H 1.023
C–H 1.081
2.47
2.00
Theoretical Methodology
In the present work we have attempted to study the electron driven elastic processes for
methanimine molecule through total elastic cross sections relative to the total cross sections.
The present calculations are done with Spherical Complex Optical Potential(SCOP) method
which is moreappropriate to energy range from threshold to 5 keV.
In order to calculate the total cross sections, we have employed a well-known spherical
complex optical potential (SCOP) formalism [4-7] in which the electron-molecule system can
be represented by a complex potential,
𝑉 𝑟, 𝐸𝑖 = 𝑉𝑅 𝑟, 𝐸𝑖 + 𝑖𝑉𝐼 𝑟, 𝐸𝑖 (1)
Where, 𝑉𝑅 𝑟, 𝐸𝑖 is real potential term and 𝑉𝐼 𝑟, 𝐸𝑖 is an imaginary potential term which
represents the absorption potential.
Here,
𝑉𝑅 𝑟, 𝐸𝑖 = 𝑉𝑠𝑡 𝑟 + 𝑉𝑒𝑥 𝑟, 𝐸𝑖 + 𝑉𝑝𝑜𝑙 𝑟, 𝐸𝑖 (2)
The three terms on the RHS of Eq. (2) represent various real potentialsviz.static, exchange and
polarization potentials which arise due to electron target interactions. To evaluate all these
potentials, the most basic input is charge density of the target. The spherically averaged charge
density𝜌(𝑟) of the molecule and static potential Vst(r) are determined from the constituent
atomic charge densities derived from the Hartree-Fockwave functions of given by Cox and
bonham [8].
The static potential Vst(r) is the potential experienced by the incident electron uponapproaching
a field of an unperturbed target charge cloud which is calculated at the Hartree-Fock level
using fixed nuclei approximation.
For the exchange potential, we have employed Hara’s free electron gas exchange model [9]
which is parameter free and energy dependent. For the polarization potential𝑉𝑝𝑜𝑙 , we have used
a parameter free model of correlation potential by Zhang et al. [10].

International Journal of Research in Modern Engineering and Emerging Technology (IJRMEET) UGC Approved id_47203
Vol. 5, Sp. Issue: 9, Sept.: 2017 (IJRMEET) ISSN: 2320-6586
240 Online International, Refereed, Impact factor & Indexed Monthly Journal www.raijmr.com
RET Academy for International Journals of Multidisciplinary Research (RAIJMR)
The imaginary part 𝑉𝐼 of the complex potential in equation (1) contains absorption potential
which represents the effects of all inelastic channels. Here we have employed a well-known
non-empirical quasi-free model form given by Staszeweska et al. [11] as given below.
𝑉𝑎𝑏𝑠 𝑟, 𝐸𝑖 = −𝜌 𝑟 𝑇𝑙𝑜𝑐
2
8𝜋
10 𝑘𝑓3𝐸𝑖
× 𝜃 𝑃2 − 𝑘𝐹3 − 2∆ × (𝐴1 + 𝐴2 + 𝐴3) (3)
The local kinetic energy of the incident electron is 𝑇𝑙𝑜𝑐 = 𝐸𝑖 − (𝑉𝑠𝑡 + 𝑉𝑒𝑥 )
The parameters A1, A2, and A3 in equation (3) are given as,
A1 = 5 kf
3
2∆, A2 =
kf2(5p2−3kf
2)
(5p2−3kf2)
andA3 = 2θ(2kf
2+2∆−p2)(2kf2+2∆−p2)
52
(p2−kf2)2
. (4)
The absorption potential is not sensitive to long-range potentials like𝑉𝑝𝑜𝑙 . In equation (4),
p2 = 2Ei , 𝑘𝐹 = [3𝜋3𝜌 𝑟 ]1
3 is the Fermi wave vector and ∆ is an energy parameter. Further
θ X is the Heaviside unit step-function, such that θ 𝑋 = 1 for 𝑋 ≥ 0 and is zero otherwise.
The dynamic functions A1, A2 and A3 occurring in equation (4) depend differently on θ 𝑋 , 𝐼, ∆
and𝐸𝑖 , where 𝐼is the ionization threshold of the target. The energy parameter ∆ determines a
threshold below which𝑉𝑎𝑏𝑠 = 0, and the ionization or excitation is prevented energetically. In
fact ∆ is the governing factor which decides the value of the total inelastic cross sections and
that is one of the characteristics of the Staszewska model [11]. We have modified the original
model by considering ∆ as a slowly varying function of 𝐸𝑖 around𝐼 in order toincorporate the
inelastic processes occurring even below the ionization potential viz. excitation processes [12-
16]. Further ∆ as a variable, accounts for the screening of the absorption potential in the target
charge-cloud region as suggested by Blanco and Garcia [17]. This is meaningful since ∆ fixed
at 𝐼 would not allow excitation at incident energy Ei ≤ 𝐼. On the other hand, if the parameter ∆
is much less than the ionization threshold, then 𝑉𝑎𝑏𝑠 becomes exceedingly high near the peak
position. The modification introduced in our paper is aimed at assigning a reasonable minimum
value 0.8I to ∆ and express this parameter as a function of Ei around𝐼 as follows [18]
∆ Ei = 0.8I + β(Ei − I) (4)

International Journal of Research in Modern Engineering and Emerging Technology (IJRMEET) UGC Approved id_47203
Vol. 5, Sp. Issue: 9, Sept.: 2017 (IJRMEET) ISSN: 2320-6586
241 Online International, Refereed, Impact factor & Indexed Monthly Journal www.raijmr.com
RET Academy for International Journals of Multidisciplinary Research (RAIJMR)
In equation (4) β is obtained by requiring that ∆= 𝐼(eV) at Ei = Ep , beyond which ∆ is held
constant and equal to𝐼. Here Ep is the value of incident energy at which the total inelastic cross
sections Qinel reaches its peak. After generating the full complex potential given in equation (1),
we solve the Schrodinger equation numerically using partial wave analysis to obtain complex
phase shifts that are then used to find the total elastic cross section Qel relative to the total cross
sections QT.
Results and Discussion
100 1000
0
5
10
15
20
25
30
35
TC
S(Å
2)
Ei(eV)
Present QT
Present Qel
e-CH2NH
Figure 2TCS for e-CH2NH scattering
Solid line: Present QT; Dash line: Present Qel
Figure 2shows present total cross section and present elastic cross sections.Both Qel as well as
QT tend to follow the ln(E)/E nature at higher energies as expected. Here at high energy
electrons are so fast that they do not have sufficient time to interact with target molecule so Qel
,and QTreduces faster.No theoretical data as well as experimental data is available to the best of
our knowledge. The present results of QT and Qel showing same tendency of variation as other
target like these. % elastic cross sections are also having uniformality with other similar
molecule.
Conclusion
The theoretical approach of SCOP method discussed above allows us the determination of
various total cross sections QT, Qel. All these cross sections are computed under the same
formalism and hence render relative reliability for the data. This study of methanimine -
electron interaction studies are rare cross sections reported are for very first time. Inthis paper
International Journal of Research in Modern Engineering and Emerging Technology (IJRMEET) UGC Approved id_47203
Vol. 5, Sp. Issue: 9, Sept.: 2017 (IJRMEET) ISSN: 2320-6586
242 Online International, Refereed, Impact factor & Indexed Monthly Journal www.raijmr.com
RET Academy for International Journals of Multidisciplinary Research (RAIJMR)
we report for the first time several total cross sections viz. Qel, Qinel. Theoretical Calculations
for molecules presented here for first time with no experimental and theoretical comparison
available. We are expectingexperimental and theoretical calculations to get boost to our work.
References
[1] ICARUS, vol. 219(1) May 2012, Volatile products controlling Titan’s tholins production.
Ncarraso, T Gautir
[2]http://cccbdb.nist.gov
[3]D R Lide, CRC Handbook of Physics and Chemistry, 74th edn. (Chemical Rubber
Company, Boca Raton, FL, 1993-94
[4] Jain A, Baluja K, 1992, Phys. Rev. A 45, 202
[5] Jain A, 1986, Phys. Rev. A 34, 3707
[6] Jain A, 1988, J. Phys. B 22, 905
[7] Limbachiya C, Vinodkumar M, Mason N, 2011, Phys. Rev. A, 83,042708
[8] H. L. JR Cox and R. A. Bonham,1967, J. Chem. Phys. 47, 8
[9] Hara S, 1967, J. Phys. Soc. Japan 22,710
[10] Zhang X, Sun J and Liu Y, 1992, J. Phys. B: At. Mol. Opt. Phys. 25, 1893
[11] Staszewska G, Schwenke D W, Thirumalai D and Truhlar D G, 1983, Phys. Rev. A 28,
2740
[12] Vinodkumar M, Limbachiya C, Barot M, and Mason N, 2012, Eur. Phys. J. D, 66:74
[13] M.A Rahman , S.Gangopadhyay, C. Limbachiya and K. N. Joshipura, 2012 International
Journal of Mass Spectrometry 319 , 48-54
[14]K. N. Joshipura, C. G. LimbachiyaB.G.Vaishnav 2006 Pramana66(2), 403-414
[15] Vinodkumar M, Bhutadia H, Limbachiya C, Joshipura K, 2011, Int. J. Mass Spectrom,
308, 35
[16] Vinodkumar M, Limbachiya C, Joshipura K and Mason N, 2011, Eur. Phys. J. D, 61,579
[17] Blanco F and Garcia G, 2003, Phys. Lett. A 317,458
[18] Vinodkumar M, Limbachiya C and Bhutadia H, 2010, J. Phys. B: At. Mol. Opt.Phys.
43,015203

International Journal of Research in Modern Engineering and Emerging Technology (IJRMEET) UGC Approved id_47203
Vol. 5, Sp. Issue: 9, Sept.: 2017 (IJRMEET) ISSN: 2320-6586
243 Online International, Refereed, Impact factor & Indexed Monthly Journal www.raijmr.com
RET Academy for International Journals of Multidisciplinary Research (RAIJMR)
Electron induced ionization cross sections for carbon-
tetraflouride(CF4)
Rakesh Bhavsar1, Yogesh Thakar
2, Chetan Limbachiya
3,*
1,2M.N. College, Visnagar -384315
3The M.S. University of Baroda, Vadodara – 390001
*E-mail:[email protected]
ABSTRACT
We report electron impact inelastic, ionization and excitation cross sections for plasma feed gas
CF4 from ionization threshold to 5 keV. We have employed Spherical Complex Optical
Potential (SCOP) to calculate total inelastic cross sections Qinel and have used Complex
Scattering Potential – ionization contribution (CSP-ic) formalisms to compute total ionization
cross sections Qion and summed total excitation cross sections ∑Qexc. We have compared our
cross sections with available experimental as well as theoretical results and have found good
agreement wherever available. This is the maiden attempt to report the total excitation cross
sections for this target.
Key Words: plasma processing gas, ionization cross sections, spherical complex optical
potential, complex scattering potential-ionization contribution.
INTRODUCTION
The plasma phase exclusive properties provide powerful remedy to a number of industrial and
manufacturing problems. In semiconductor etching, plasmas can give access to chemically
active species ions and radicals from a relatively inert processing gas[1].The industry relies
upon the development of plasma technology to produce progressively more detailed and
compact systems while also meeting increasingly severe environmental legislation.
Technological plasmas are partially ionized. They contain electrons, atomic ions, molecular
ions, and neutrals [1]
Electron-impact ionization of atoms and molecules are significant process in any plasma.
Electron-impact ionization cross-sections of molecules are important quantities in a variety of
applications as diverse as low-temperature processing plasmas, fusion edge plasmas, gas
discharges, planetary, stellar, and cometary atmospheres, radiation chemistry, mass
spectrometry, and chemical analysis [1]

International Journal of Research in Modern Engineering and Emerging Technology (IJRMEET) UGC Approved id_47203
Vol. 5, Sp. Issue: 9, Sept.: 2017 (IJRMEET) ISSN: 2320-6586
244 Online International, Refereed, Impact factor & Indexed Monthly Journal www.raijmr.com
RET Academy for International Journals of Multidisciplinary Research (RAIJMR)
The carbon-tetrafluoride (CF4) molecule is a frequently used compound in fluorocarbon
plasmas that are widely used in the semiconductor industry, primarily for the plasma etching of
Si based microelectronic devices.
Schematic of CF4
Bond length(Å)
Ionization
Potential
(eV)[2]
Electric dipole
Polarizability
(10−30
m3) [2]
C(1)-F(2)1.3151
C(1)-F(3)1.3151
C(1)-F(4)1.3151
C(1)-F(5)1.3151
14.700 2.824
Table 1: Schematic and properties of CF4
Theoretical Methodology
An important inequality𝑄𝑖𝑛𝑒𝑙 𝐸𝑖 ≥ 𝑄𝑖𝑜𝑛 𝐸𝑖 forms the basis for Complex Scattering
Potential – ionization contribution (CSP-ic) method [3-5]. Here Qinel cross-sections are
computed with the help of SCOP method[6]. Total ionization cross section may be estimated
from total inelastic cross section by defining an energy dependent ratio R(Ei) given by
ion i
i
inel i
Q ER E
Q E (1)
such that, 0 < R 1.
As total ionization cross section is a continuous function of energy, we can express this ratio
also as a continuous function of energy for Ei>I.
21
ln1 1i
UCR E f U C
U a U
(2)
here, Uis the dimensionless variable defined as,I
EU i .

International Journal of Research in Modern Engineering and Emerging Technology (IJRMEET) UGC Approved id_47203
Vol. 5, Sp. Issue: 9, Sept.: 2017 (IJRMEET) ISSN: 2320-6586
245 Online International, Refereed, Impact factor & Indexed Monthly Journal www.raijmr.com
RET Academy for International Journals of Multidisciplinary Research (RAIJMR)
The reason for adopting such explicit form of f(U) could be explained as follows. At high
energies the total inelastic cross section follows the Born Bethe term according to which the
cross sections falls of as ln(U)/U, but at low and intermediate energies they obey 1/E form [7].
Accordingly the first term takes care of the cross sections nature at low and intermediate
energies while the second term describes high energy behavior of cross sections. The
dimensionless parameters C1, C2 and ‘a’ involved in the above equation are deduced by
imposing the three physical conditions on the ratio as discussed below.
0
( )
1
i
i p i p
i p
for E I
R E R for E E
for E E
(3)
The first condition is an exact condition wherein it states that no ionization process is possible
below the ionization threshold of the target. At very high energies (~ 10 Ep) the ionization cross
sections are almost equal to inelastic cross sections as affirmed in the last condition of equation
(3). This is justified by the fact that at such high energies there are innumerable channels open
for the ionization as against very few channels for excitation. At such high energies the
contribution of excitation is negligible leading the ratio approach unity.
The second condition is empirical in nature. RPis the value of R(Ei) at Ei= EP, and it was
observed that the contribution for ionization to total inelastic cross sections is about 70 - 80 %
at the peak of inelastic cross section. Perhaps a first ever estimate of ionization in the relation
to excitation process was made by Turner et al. [8]. They conclude from semi-empirical
calculations that in gaseous H2O, ionization was more probable than excitation above ~ 30 eV.
If σion and σexc are the cross sections of the ionization and excitation respectively then above
100 eV,
0.75ion
ion exc
(4)
It should be noted here that the denominator in equation (4) represents the total inelastic cross
sections. This ratio is similar to the ratio defined in this paper vide equation (1).The value of
the ratio is attributed to the faster fall of the contribution of the first term Qexc to the total
inelastic cross sections beyond Ep in Eq. (3). In order to make our method consistent and
predictive we choose a single value ofRp=0.7 for all the targets studied in this work. Using this

International Journal of Research in Modern Engineering and Emerging Technology (IJRMEET) UGC Approved id_47203
Vol. 5, Sp. Issue: 9, Sept.: 2017 (IJRMEET) ISSN: 2320-6586
246 Online International, Refereed, Impact factor & Indexed Monthly Journal www.raijmr.com
RET Academy for International Journals of Multidisciplinary Research (RAIJMR)
ratio we calculate the ionization cross sections for present targets vide equation (1) and the total
excitation cross sections vide equation (5).
inel i exc i ion iQ E Q E Q E (5)
Results and Discussion
10 100 1000
0
1
2
3
4
5
6
7
8
9
TC
S(A
o2)
Ei(eV)
BEB Kim Qion
Present Qion
DM Qion
H.Nishimura Qion
H.U.Poll et al Qion
Rao et al Qion
M.R.Bruce et al Qion
Present Qinel
Present Qexc
e-CF4
Fig. 1 Total ionization cross sections for e-CF4
The present calculations Qion for CF4 molecule are in very good agreement with theoretical
result of BEB[9] and DM[10] within the required accuracy in energy range from threshold to
5 keV. Experimental results of H. Nishimura [11]shows good agreement with our results for
energy upto 3keV, Rao et al[12] for energy upto 900eV, M.R.Bruce et al[13] for energy upto
500eV and H.U. Poll et al[14] for energy upto 150eV.
Conclusion
In the present work we studied inelastic electron interactions with plasma compound CF4 and
calculated various inelastic cross-sections for threshold to 5 keV. The result shows good
agreement with theoretical and experimental cross-sections. In the cross-section values the
nature of the curve is consistent with the molecular target charge density, target geometry and
ionisation potential. Present work give us confidence hence we are motivated for calculation of
complex target with better accuracy. This will be quite helpful in plasma modelling.

International Journal of Research in Modern Engineering and Emerging Technology (IJRMEET) UGC Approved id_47203
Vol. 5, Sp. Issue: 9, Sept.: 2017 (IJRMEET) ISSN: 2320-6586
247 Online International, Refereed, Impact factor & Indexed Monthly Journal www.raijmr.com
RET Academy for International Journals of Multidisciplinary Research (RAIJMR)
Reference
[1] I. Rozum, P.Limao-Vieira, S.Eden, J.Tennyson and N.Meson, American Institute of
Physics. 35(2006) 267
[2] http://cccbdb.nist.gov [3]K. N. Joshipura, M. Vinodkumar, C. G. Limbachiya, B. K. Antony, Phys. Rev. A,69,
022705(2004)
[4] M.A Rahman , S.Gangopadhyay, C. Limbachiya and K. N. Joshipura, 2012 International
Journal of Mass Spectrometry 319 , 48-54
[5]K. N. Joshipura,C. G. Limbachiya B.G.Vaishnav 2006 Pramana 66(2), 403-414
[6] M.Swadia , R.M. Bhavsar, Y.J. Thakar,M.Vinodkumar and C. G. Limbachiya, Molecular
Physics. DOI: 10.1080/00268976.2017.1333645
[7] G. Garcia, F. Blanco, Phys. Rev. A,62, 044702(2000)
[8]J. E. Turner, H. G. Paretzke, R. N. Hamm, H. A. Wright, and R. H. Ritchie, Radiation
Research. 92, 47-60(1982)
[9] Y.K. Kim, M.E. Rudd, Phys. Rev. A 50 (1994) 3954.
[10] H.Deutsch, K.Becker , S. Matt, T.D.Mark, Int. J. Mass Spectrom,197(2000) 37-69
[11] H.Nishimura, W.M.Huo, M.A.Ali, Y.K.Kim, J.Chem. Phys. 110(1999) 3811
[12] M.V.V.S. Rao, S.K. Srivastava, Contributed Papers, XXthInternational Conference on the
Physics of Electronic andAtomic Collisions (ICPEAC), Abstract Mo150, F. Aumayr,G. Betz,
H.P. Winter (Eds.), July 1997, Vienna,Austria.
[13] M.R. Bruce, R.A. Bonham, Int. J. Mass Spectrom. IonProcesses 123 (1993) 97.
[14] H.U. Poll, C. Winkler, D. Margreiter, V. Grill, T.D. Ma¨rk, Int. J. Mass Spectrom. Ion
Processes 112 (1992) 1-17

International Journal of Research in Modern Engineering and Emerging Technology (IJRMEET) UGC Approved id_47203
Vol. 5, Sp. Issue: 9, Sept.: 2017 (IJRMEET) ISSN: 2320-6586
248 Online International, Refereed, Impact factor & Indexed Monthly Journal www.raijmr.com
RET Academy for International Journals of Multidisciplinary Research (RAIJMR)
Dielectric Properties of Binary Mixtures of Methyl Iso Butyl
Ketone and Dimethyl Silicone Fluid KunjanN.Shah
1), VipinchandraA.Rana
2) and Hemalkumar P.Vankar
3)
1, 2, 3(Department of Physics, Electronics and Space Science, School of Sciences, Gujarat
University,Ahmedabad,Gujarat,India) 1)
ABSTRACT
Complex dielectric permittivity ε*(ω) = ε'(ω) - ε"(ω) of the binary mixtures of methyl iso
butyl ketone and dimethyl silicone fluid were measured using precision LCR meter in the
frequency range 20 Hz to 2 MHz at 303.15 K temperature. The permittivity at optical
frequency of the samples was also determined. Measured dielectric dataare used to gain
information about the effect of concentration variations of the component of the mixtures on
their dielectric properties. The electrode polarization effect was observed under the effect of
low frequency A.C. electric field. The ionic and non-ionic behaviour of the mixtures are also
enlightened.
Keywords. Precision LCR meter, Methyl iso butyl ketone, Dimethyl silicone fluid, Dielectric
Permittivity
INTRODUCTION
Dimethyl silicone fluid (D.M.S.F.) is a type of silicone fluids, whose structure is the
combination of the silicone and oxygen skeleton. It is available in the form of the crystal
clear liquid of viscosities from less than one to one million centistokes. It is most efficient
and reliable material as dielectrics and used as a coolant in transformers. It is widely used in
electrical and electronics applications. It is used as one of the ingredient for the cosmetics
items. It is soluble in hydrocarbon solvents, in chlorinated solvents, and in low molecular
weight aromatic solvents. D.M.S.F. is easily soluble in the ketones like methyl iso butyl
ketone and methyl ethyl ketone. Methyl iso butyl ketone (M.I.B.K.) is an organic colourless
liquid. They have low viscosity and high solvency trend. They are widely used in paint, ink
and in coating industry.Recently we reported [1] dielectric properties of binary mixtures of
methyl iso butyl ketone and amino silicone oil.To gain more information about dielectric
behaviour of silicone fluid in polar solvents, we have studied dielectric properties of the
dimethyl silicone fluid and methyl iso butyl ketone in this paper. The literature survey

International Journal of Research in Modern Engineering and Emerging Technology (IJRMEET) UGC Approved id_47203
Vol. 5, Sp. Issue: 9, Sept.: 2017 (IJRMEET) ISSN: 2320-6586
249 Online International, Refereed, Impact factor & Indexed Monthly Journal www.raijmr.com
RET Academy for International Journals of Multidisciplinary Research (RAIJMR)
suggests that the dielectric properties of D.M.S.F. and M.I.B.K. in the frequency range of 20
Hz to 2 MHz have not been reported, so far.
In the present investigation, we measured complex permittivity of the binary mixtures of
methyl iso butyl ketone and dimethyl silicone fluid of varying concentration in the frequency
range 20 Hz to 2 MHz at 303.15 K temperature. Value of dielectric constant ε' (real part of
complex permittivity ε*) at 2 MHz frequency was taken as static permittivity and square of
measured value of refractive index nD, was taken as permittivity at optical frequency (ε∞=
nD2) for all mixtures samples and are reported in this paper. The relative static permittivity of
the material is highly important property in the field of physics, chemistry and material
science. Investigation of static permittivity of binary mixtures is important in design of mixed
solvents of required solvating powder for suitable solubility and for chemical solubility of the
solute in the solutions [2-4]. Dielectric properties are used to gain the information about the
polarization phenomena taking place under the effect of low frequency A.C. electric field.
The effect of the concentration of the components of the binary mixtures on the dielectric
properties is studied.
MATERIALS AND METHODS
The samples M.I.B.K. (AR Grade) and D.M.S.F. (With 350 Centistokes Viscosity) were used
to make binary mixtures and they were provided by A.C.S. Chemicals Pvt. Ltd. (India) and
Narayan Co-operation Pvt. Ltd. (India) respectively. They were used directly without
purification. The sixteen different samples were prepared by weight fraction of the binary
mixtures of D.M.S.F. and M.I.B.K. The samples were prepared using digital analytical
weight meter and have an accuracy of ± 0.0001 g. Complex permittivity of the liquid samples
in the frequency range 20 Hz to 2 MHz were measured using an Agilent E-4980, precision
LCR meter and self-designed sample holder. Sample holder was designed in our laboratory
and was fabricated by a local manufacturer. The simplified diagram of the sample holder is
shown in Figure (1). While performing the measurements the test fixture correction
coefficient was also considered to cancel the effect of the stray capacitance. The open and
short measurement was also carried out to cancel out the effect of stray capacitance. The
capacitance and parallel resistance of the liquid samples with and without samples were
measured at each frequency point to find out the complex permittivity spectra. The complex
dielectric function of the samples was determined as stated in reference [5]. The refractive

International Journal of Research in Modern Engineering and Emerging Technology (IJRMEET) UGC Approved id_47203
Vol. 5, Sp. Issue: 9, Sept.: 2017 (IJRMEET) ISSN: 2320-6586
250 Online International, Refereed, Impact factor & Indexed Monthly Journal www.raijmr.com
RET Academy for International Journals of Multidisciplinary Research (RAIJMR)
index of the samples was measured using an Abbe’s refractometer and have an accuracy of
±0.001. The square of the refractive index was taken as permittivity at optical frequency.
Figure 1: Simplified diagram of sample holder.
RESULT AND DISCUSSION
The frequency and concentration dependent real (ε'(ω)) and imaginary (ε"(ω)) part of
complex dielectric functionfor the binary mixture of M.I.B.K. and D.M.S.F. at 303.15 K
temperature is shown in Figure (1). The value of the ε'(ω) is high at the lower frequency and
it decreases as the frequency increases. The high value of the ε'(ω) at the lower frequency
indicates the dominance of electrode polarization phenomena taking place under the effect of
the A.C. electric field and also it is because of the blocking of the electrode which impede
free charge motion at the boundary between the electrode surface and bulk material [6]. The
ε'(ω) spectra divides into two different region, for the frequency below 103 Hz it decreases
rapidly with frequency and beyond that frequency it becomes frequency independent. The
value of the ε'(ω) is high for the higher concentration of M.I.B.K. in D.M.S.F. over the entire
range of frequency. It is interesting to note that for pure D.M.S.F. and up to 0.580
concentration of D.M.S.F. in the mixture ε' values remain constant over the entire range of
frequency. However when concentration of M.I.B.K. in the mixtures increases ε' values are
found to increase with decrease in the frequency below 103 Hz. Above this frequency ε'
values remains independent of frequency. Rate of increase of ε' with frequency is found to
Teflon
Inner Cylinder
Outer Cylinder
Connectors
Sample Injected
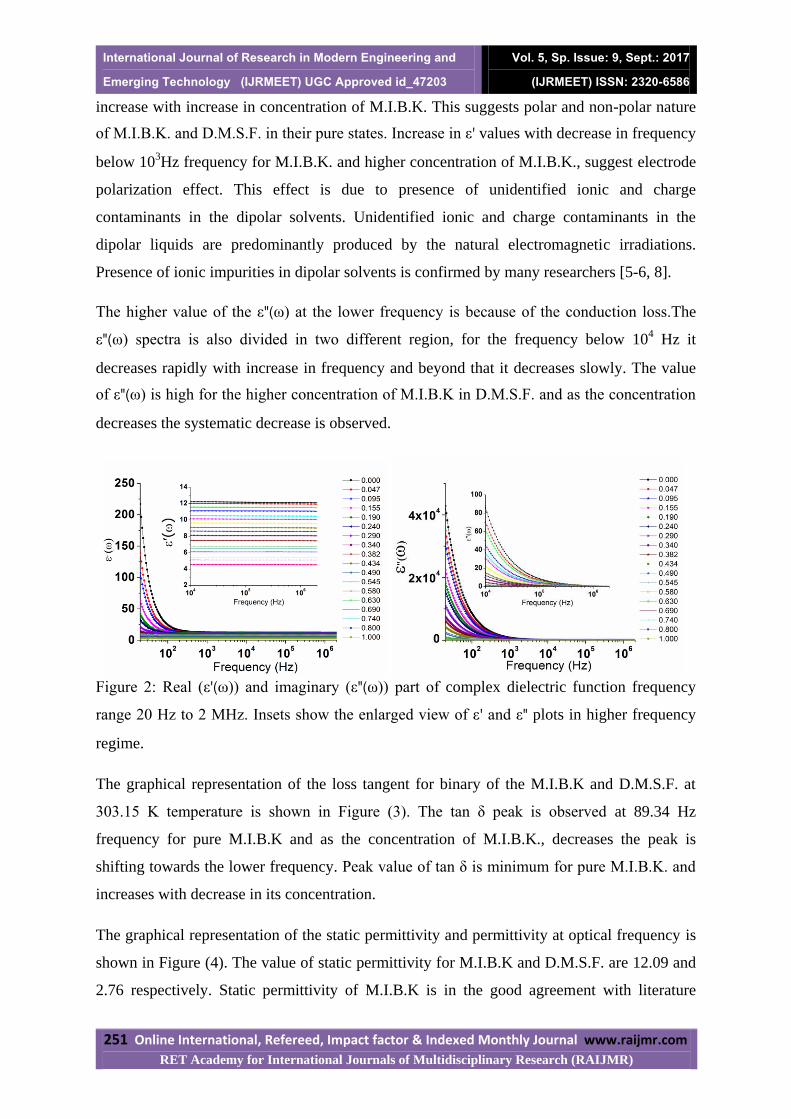
International Journal of Research in Modern Engineering and Emerging Technology (IJRMEET) UGC Approved id_47203
Vol. 5, Sp. Issue: 9, Sept.: 2017 (IJRMEET) ISSN: 2320-6586
251 Online International, Refereed, Impact factor & Indexed Monthly Journal www.raijmr.com
RET Academy for International Journals of Multidisciplinary Research (RAIJMR)
increase with increase in concentration of M.I.B.K. This suggests polar and non-polar nature
of M.I.B.K. and D.M.S.F. in their pure states. Increase in ε' values with decrease in frequency
below 103Hz frequency for M.I.B.K. and higher concentration of M.I.B.K., suggest electrode
polarization effect. This effect is due to presence of unidentified ionic and charge
contaminants in the dipolar solvents. Unidentified ionic and charge contaminants in the
dipolar liquids are predominantly produced by the natural electromagnetic irradiations.
Presence of ionic impurities in dipolar solvents is confirmed by many researchers [5-6, 8].
The higher value of the ε"(ω) at the lower frequency is because of the conduction loss.The
ε"(ω) spectra is also divided in two different region, for the frequency below 104 Hz it
decreases rapidly with increase in frequency and beyond that it decreases slowly. The value
of ε"(ω) is high for the higher concentration of M.I.B.K in D.M.S.F. and as the concentration
decreases the systematic decrease is observed.
Figure 2: Real (ε'(ω)) and imaginary (ε"(ω)) part of complex dielectric function frequency
range 20 Hz to 2 MHz. Insets show the enlarged view of ε' and ε" plots in higher frequency
regime.
The graphical representation of the loss tangent for binary of the M.I.B.K and D.M.S.F. at
303.15 K temperature is shown in Figure (3). The tan δ peak is observed at 89.34 Hz
frequency for pure M.I.B.K and as the concentration of M.I.B.K., decreases the peak is
shifting towards the lower frequency. Peak value of tan δ is minimum for pure M.I.B.K. and
increases with decrease in its concentration.
The graphical representation of the static permittivity and permittivity at optical frequency is
shown in Figure (4). The value of static permittivity for M.I.B.K and D.M.S.F. are 12.09 and
2.76 respectively. Static permittivity of M.I.B.K is in the good agreement with literature

International Journal of Research in Modern Engineering and Emerging Technology (IJRMEET) UGC Approved id_47203
Vol. 5, Sp. Issue: 9, Sept.: 2017 (IJRMEET) ISSN: 2320-6586
252 Online International, Refereed, Impact factor & Indexed Monthly Journal www.raijmr.com
RET Academy for International Journals of Multidisciplinary Research (RAIJMR)
value 12.92 at 297.15 K temperature [7]. The static permittivity values for all the binary
mixtures of M.I.B.K. and D.M.S.F lies between 12.09 and 2.76 and vary linearly with
concentration of D.M.S.F. in M.I.B.K. This suggests absence of intermolecular interaction
between D.M.S.F. and M.I.B.K.The refractive index for M.I.B.K and D.M.S.F. is 1.390 and
1.399 respectively. The refractive index value for the M.I.B.K is in good agreement with the
literature value 1.390 at 303.15 K temperature [1]. It is clearly observed from the Figure (4),
that the permittivity at optical frequency increases linearly as the weight fraction D.M.S.F.
increases in the binary mixtures. This suggests that electronic polarization of M.I.B.K. and
D.M.S.O. is not affected on mixing.
The frequency at which the bulk material property and E.P. phenomena are separated is
known as the electrode polarization frequency (fEP) [8]. That frequency is shown in Figure (3)
for the higher concentration of M.I.B.K. in D.M.S.F. The electrode polarization relaxation
time (ƮEP) is calculated using the relation ƮEP= (2πfEP)-1
[8]. Variation in the electrode
polarization relaxation time with change in weight fraction of D.M.S.F. in M.I.B.K. is shown
in Table (1). As the concentration of M.I.B.K. decreases in D.M.S.F, the electrode
polarization relaxation time increases. The peak is not observed for the higher concentration
of D.M.S.F. in M.I.B.K. in the considered frequency range.
Figure (3) Loss tangent (tan δ) plots for
mixtures of M.I.B.K. and D.M.S.F.
Figure (4) Variation of static
permittivity and permittivity at optical
frequency with concentration of
D.M.S.F. in M.I.B.K.

International Journal of Research in Modern Engineering and Emerging Technology (IJRMEET) UGC Approved id_47203
Vol. 5, Sp. Issue: 9, Sept.: 2017 (IJRMEET) ISSN: 2320-6586
253 Online International, Refereed, Impact factor & Indexed Monthly Journal www.raijmr.com
RET Academy for International Journals of Multidisciplinary Research (RAIJMR)
Table 1: Variation in electrode polarization relaxation time (ƮEP) and electrode polarization
frequency (fEP)
Weight Fraction of D.M.S.F. in M.I.B.K. fEP (Hz) ƮEP (ms)
0.000 89.34 1.782
0.047 50.24 3.169
0.095 47.43 3.358
0.155 44.78 3.556
0.190 35.56 4.478
0.240 22.44 7.096
CONCLUSION
The concentration and frequency dependent dielectric properties of the M.I.B.K. and
D.M.S.F. and their binary mixtures were studied at 303.15 K temperature in the frequency
range 20 Hz to 2 MHz. Static permittivity and permittivity at optical frequency of the same
system were also measured. An electrode polarization phenomenon is taking place under the
effect of low frequency A.C. electric field in M.I.B.K. rich region. The loss tangent tan δ
peak is observed in the higher concentration of M.I.B.K in the D.M.S.F. The electrode
polarization relaxation time increases as the concentration of the M.I.B.K. decreases in
D.M.S.F. Static permittivity and permittivity at optical frequency of M.I.B.K. is in good
agreement with the literature value. The imaginary part of permittivity is high at the lower
frequency this is because of the conduction loss. The static permittivity and permittivity at
optical frequency variation with concentration of D.M.S.F. in M.I.B.K. exhibits linear but
increase trend.
ACKNOWLDEGEMENT
Financial support, provided by Department of Sciences and Technology (DST), New Delhi
through the DST-FIST (Level- I) project (SR/FST/PSI-001/2006), and DRS-SAP program
grant [No.F. 530/10/DRS/2010(SAP-I)] have been utilized to carry out this work and it is
gratefully acknowledged. We are also thankful to Prof. P.N. Gajjar, Head, Department of
Physics, School of Sciences, Gujarat University, Ahmedabad for his constant encouragement.

International Journal of Research in Modern Engineering and Emerging Technology (IJRMEET) UGC Approved id_47203
Vol. 5, Sp. Issue: 9, Sept.: 2017 (IJRMEET) ISSN: 2320-6586
254 Online International, Refereed, Impact factor & Indexed Monthly Journal www.raijmr.com
RET Academy for International Journals of Multidisciplinary Research (RAIJMR)
REFERNCES
1) K.Shah, V.Rana, C.Trivedi&H.Vankar, AIP Conf. Proc, 2017, 1837, 040026_1 –
040026_3
2) A.Chmielewska, M.Urada, K.Klimaszewski & A.Bald, J.Chem.Eng.Data, 2009,
54,801-806
3) G.Goldoni, L.Marcheselli, A.Marchetti,L.Tassi&G.Tosi, J.Sol.Chem, 1992, 21,953-
962
4) Ch.Ramana, A.KiranKumar, M.Ashok Kumar,M.Moodley, J.Of.Chem, 2013,687106,
1-4
5) H.Chaubeand V.Rana ,Adv.Mat.Res.,2013,665,194-201
6) N.Shah, P.Shah &V.Rana, Ionics, 2015, 21, 3217-3222
7) H.Eckstrom, J.Berger &L.Dawson, 1960, 64, 1458-1461.
8) R.Sengwa,S.Choudhary, P.Dhatarwal,J.Mol.Liq,2017,225,42-49

International Journal of Research in Modern Engineering and Emerging Technology (IJRMEET) UGC Approved id_47203
Vol. 5, Sp. Issue: 9, Sept.: 2017 (IJRMEET) ISSN: 2320-6586
255 Online International, Refereed, Impact factor & Indexed Monthly Journal www.raijmr.com
RET Academy for International Journals of Multidisciplinary Research (RAIJMR)
Continuous Wavelet Transform on Soil Data
– A study of Surendranagar District of Gujarat
Prakash H. Patel1,2
, Nirmal P. Patel1,2
, Anita Gharekhan1
1Associate Professor, Department of Physics, C U Shah Science College, Ahmedabad, India.
2Research Scholar, Pacific University, PAHER, Rajasthan, India.
Email:[email protected]
Abstract
Soil quality depends on multi-dimensional factors such as land use, soil management
practices, ecosystem and environmental interactions, so it is considered as complex
characteristic. However, to manage and maintainsoils in an acceptable state for future
generations, soil quality must be adequately defined. At present “Soil Health Card program
of the Government of Gujarat, India” is going on at different Science Colleges and STL (Soil
Test Laboratories). From this program, the district Surendranagar (Gujarat -India) and its
nearest geographical districts are selected for the Soil study and Analysis by Continuous
Wavelet transform and wavelet variance derived from transform as it can provide scientific
basis for monitoring and controlling the tillage management.
Keywords:Soil Study Testing, CWT, Wavelet variance
Introduction
Soil is a naturally occurring porous medium that supports the growth of plant roots by
retaining air, heat, water, and nutrients; and provides mechanical support to the plant. Soil
provides a reservoir of nutrients required by crops. The purpose of soil analysis is to assess
the adequacy, surplus or deficiency of available nutrients for crop growth and to monitor
changes brought about by farming practices. This information is needed for optimum
production, to avoid transferring undesirable levels of some nutrients into the environment
and to ensure a suitable nutrient content in crop products. Regular soil analysis, every 3-5
years, should be undertaken as a vital part of good management practice.The composition of
soil varies from region to region and requirement of the nutrients varies from crop to crop.
So it is very essential to link the quality of soil with the requirement of the crop. If any
deviation or lacunas found in ideal composition, it can be corrected by supplementing the
deficient element to have better crop.
A soil test is the analysis of soil sample to determine nutrient and contaminant content,

International Journal of Research in Modern Engineering and Emerging Technology (IJRMEET) UGC Approved id_47203
Vol. 5, Sp. Issue: 9, Sept.: 2017 (IJRMEET) ISSN: 2320-6586
256 Online International, Refereed, Impact factor & Indexed Monthly Journal www.raijmr.com
RET Academy for International Journals of Multidisciplinary Research (RAIJMR)
composition and other characteristics, such as acidity or pH level. A soil test can determine
fertility, or the expected growth potential of the soil, indicate nutrient deficiencies, potential
toxicities from excessive fertility and inhibitions from the presence of non-essential trace
minerals. Soil nutrients vary with depth and soil components change with time. With the help
of soil analysis one can find out the shortfall of essential elements and can take corrective
steps to have good crop.
Several elements take part in the growth and development of plants, and those absorbed from
the soil are generally known as plant nutrients. In all, 16 elements have been identified and
are established to be essential for plant growth. They are carbon (C), hydrogen (H), Oxygen
(O), nitrogen (N), phosphorus (P), potassium (K), calcium (Ca), magnesium (Mg), iron (Fe),
sulphur(S), zinc (Zn), manganese (Mn), copper (Cu), boron (B), molybdenum (Mo) and
chlorine (Cl). These elements serve as raw materials for growth and development of plants,
and formation of fruits and seeds. Although plants absorb a large number of elements, all of
them are not essential for the growth of crops. Some of these are required in large amounts
and some in traces; these are classified as major and micro nutrients.
The objective of the soil examination is to assess the accessible supplement status, response
of the soil. It is additionally helpful to assess the richness status of soils of a nation or a state
or an area and to arrange a logical or efficient supplement administration program. Remedy
compost utilize, in view of exact data about soil fruitfulness levels in fields, can bring about
expanded harvest yield, decreased cost, less utilization of normal assets and limited natural
effect. Knowing a field's supplement status inconstancy implies compost application can be
balanced all the more nearly to meet the supplemental supplement needs of a yield or soil for
particular field zones. There are at least twelve fundamental supplements that plants require
in an adjusted manner from the dirt keeping in mind the end goal to deliver a decent yield.
Materials
Research is carried out to examine the impact of corporeal and physio-chemical analysis of
nutrition and intensity of crop in Surendranagar District of Gujarat state. At present "Soil
Health Card program of the Government of Gujarat" is going ahead with various Science
Colleges and STL (Soil Test Laboratories). From this program, the region Surendranagar and
its closest topographical locale are chosen for the Soil study and Analysis.The review
territory - Surendranagar is situated between 22° 43'N Latitude and 71° 43'E Longitude can
be appropriately named as entryway to Saurashtra. The region involves a range of 10,489

International Journal of Research in Modern Engineering and Emerging Technology (IJRMEET) UGC Approved id_47203
Vol. 5, Sp. Issue: 9, Sept.: 2017 (IJRMEET) ISSN: 2320-6586
257 Online International, Refereed, Impact factor & Indexed Monthly Journal www.raijmr.com
RET Academy for International Journals of Multidisciplinary Research (RAIJMR)
square kilometers. It has a populace of roughly 1.7 million individuals, out of which 26
percent live in urban communities. It is otherwise called Cotton City of India. It is presently
a noteworthy exchange and handling place for agrarian items, cleanser, glass, cotton, salt,
pharmaceuticals, chemicals and plastics, material course, pottery and sterile product. The
district is divided with major 10 tehsils i.e. Dhrangadhra, Halvad, Wadhwan, Limdi, Patdi
(Dasada), Lakhtar, Muli, Sayla, Chotila and Chuda.There are majorly three types of soils
found in Surendranagar District i.e. Medium Black Soils, Sandy Soils and Saline & Alkaline
Soils. The specification of each of the soil area is presented in following table I.
Table I: Type of Soil in Surendranagar District
Lane No. Type of Soil Area („000
ha)
Percent
1 Medium Black Soil 633.4 60.5
2 Sandy Soil 252.5 24.2
3 Saline & Alkaline
Soil
160.2 15.3
Total 1046.1 100
Source: Soil Test Laboratories Gujarat
The study lane covers, Medium Black Soil under the various tehsil places i.e.
A) Patdi: which covers Makhanpur, Haripur, Jarvala, Savlas, Bajana, Pipadi
B) Muli: which covers Raisangar, Jepar and
C) Chotila which have Morthala
Total 62 soil samples are collected at a distance gaps of 500 mt., which covers above
statedthreeTehsilhaving9 major villages with total distance of 31 km.
Method
Wavelet Transform
Wavelet transform is a scientifically magnifying instrument which gives a multi-
dimensional investigation of the information under thought. It is an intense apparatus for
advanced picture handling and example acknowledgment. There is as of now an amazing
rundown of utilization, including picture handling and video pressure, programmed target
acknowledgment, picture upgrade, edge identification, clamor diminished and surface
examination. The researcher applies this for large scale soil properties and
attributes.Wavelet changes are comprehensively grouped into the discrete wavelet change
(DWT) and the continuous wavelet change (CWT). The discrete wavelet has an entirely

International Journal of Research in Modern Engineering and Emerging Technology (IJRMEET) UGC Approved id_47203
Vol. 5, Sp. Issue: 9, Sept.: 2017 (IJRMEET) ISSN: 2320-6586
258 Online International, Refereed, Impact factor & Indexed Monthly Journal www.raijmr.com
RET Academy for International Journals of Multidisciplinary Research (RAIJMR)
limited size, so DWT utilize a particular subset of all scale and interpretation values,
though the nonstop change works over each conceivable scale and interpretation.
The wavelets shaping a CWT are liable to Heisenberg's vulnerability standard and,
proportionally, discrete wavelet bases might be considered with regards to different types of
the instability guideline.In wavelet changes the information under thought is isolated into
high recurrence and low recurrence parts at numerous levels, referred to individually as high
pass and low passes coefficients. For instance, high pass coefficients at level-1 speak to
varieties at littlest scale and the ensuing more elevated amount coefficients speak to varieties
over greater frame sizes. The low pass coefficients at different levels speak to normal
conduct of the information over relating window sizes.Wavelet changes might be thought to
be types of time-recurrence portrayal and are, in this manner, identified with the subject of
consonant examination. All for all intents and purposes valuable discrete wavelet changes
make utilization of channel banks containing limited drive reaction channels.
CWT Analysis
The data under consideration is composite signal type i.e. a mixture of periodic and non-
periodic components. These type of pattern occurs may be due to the influence of several
processes (e.g. climate change, weather disturbance, random use of fertilizers, crop pattern
etc.) over the time. So it is difficult to get description of composite signals and identification
of specific pattern. So heterogeneity in study area is studied by continuous wavelet transform
to get better insight.
CWT graphs of all parameters are shown in figure I along with original data, where the
horizontal axis is for distance in meters. The orange and red colors in CWT graphs indicate
high coefficients of CWT at a particular frequency and location. The smaller coefficients are
represented by yellow or blue. The very high frequency components are located in the lower
portion of the graphs in shades of blue, indicating lower energies. The figureIshows that most
of the sample data are within acceptable limits i.e. upper control limit (UCL) and lower
control limit (LCL). In CWT graphs y-axis corresponds to scales and z-axis to wavelet
coefficients. The scale to scale analysis is suited to detect local features of aperiodic data.

International Journal of Research in Modern Engineering and Emerging Technology (IJRMEET) UGC Approved id_47203
Vol. 5, Sp. Issue: 9, Sept.: 2017 (IJRMEET) ISSN: 2320-6586
259 Online International, Refereed, Impact factor & Indexed Monthly Journal www.raijmr.com
RET Academy for International Journals of Multidisciplinary Research (RAIJMR)
-20.00
0.00
20.00
40.00
60.00
80.00
100.00
1 5 9 13172125293337414549535761
kg/h
a
Distance along transect (1pt. = 500mt)
P
UCL
Mean
LCL20
4060
111
2131
4151
61
0.2
0.4
0.60.8
1
Distance1pt.= 500 mt.
Scales
CO
EF
S
150.00
250.00
350.00
450.00
1 5 9 13172125293337414549535761
kg/h
a
Distance along transect (1pt. = 500mt)
K
UCL
Mean
LCL
2040
60
111
2131
4151
61
0.20.40.60.8
11.21.4
Distance1pt.= 500 mt.
Scales
CO
EF
S
0.00
0.50
1.00
1.50
2.00
1 5 9 13172125293337414549535761
pp
m
Distance along transect (1 pt. = 500mt)
Zn
UCL
Mean
LCL20
4060
111
2131
4151
61
0.2
0.4
0.6
0.8
Distance1pt.= 500 mt.
Scales
CO
EF
S
-5.00
0.00
5.00
10.00
15.00
1 5 9 13172125293337414549535761
pp
m
Distance along transect (1 pt. = 500mt)
FeUCL
Mean
LCL 2040
60
111
2131
4151
61
0.2
0.4
0.6
0.8
Distance1pt.= 500 mt.
Scales
CO
EF
S
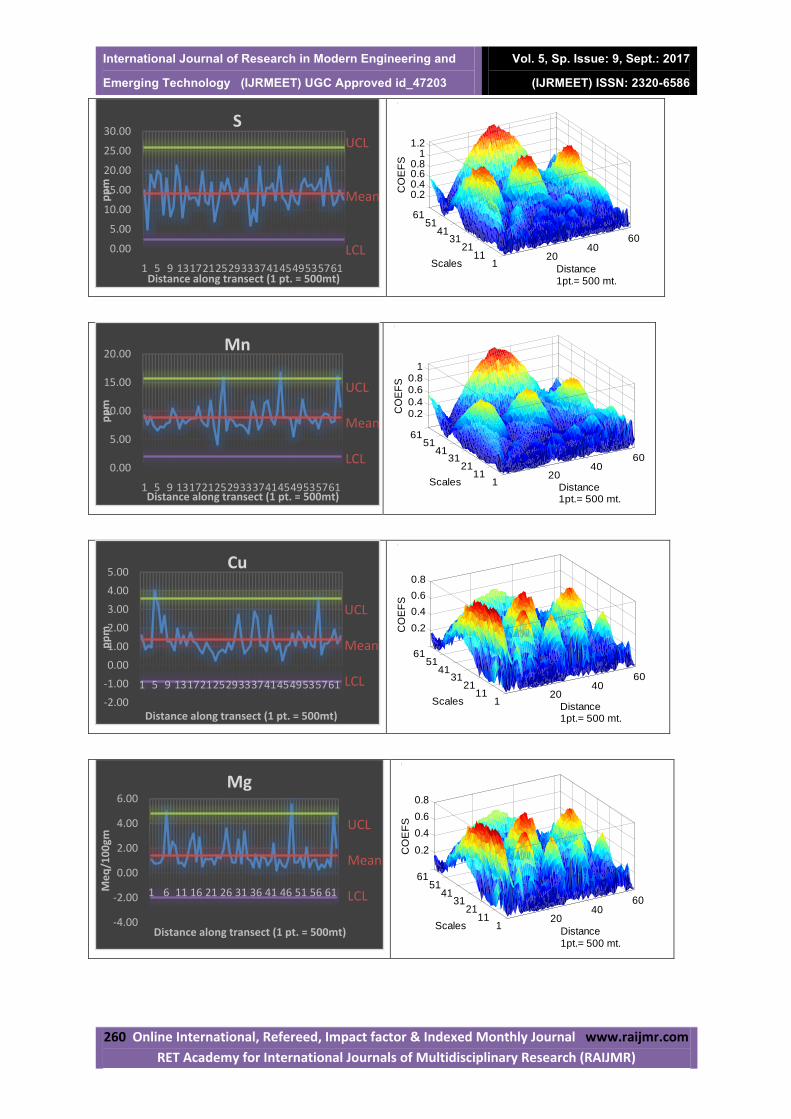
International Journal of Research in Modern Engineering and Emerging Technology (IJRMEET) UGC Approved id_47203
Vol. 5, Sp. Issue: 9, Sept.: 2017 (IJRMEET) ISSN: 2320-6586
260 Online International, Refereed, Impact factor & Indexed Monthly Journal www.raijmr.com
RET Academy for International Journals of Multidisciplinary Research (RAIJMR)
0.00
5.00
10.00
15.00
20.00
25.00
30.00
1 5 9 13172125293337414549535761
pp
m
Distance along transect (1 pt. = 500mt)
SUCL
Mean
LCL20
4060
111
2131
4151
61
0.20.40.60.8
11.2
Distance1pt.= 500 mt.
Scales
CO
EF
S
0.00
5.00
10.00
15.00
20.00
1 5 9 13172125293337414549535761
pp
m
Distance along transect (1 pt. = 500mt)
Mn
UCL
Mean
LCL20
4060
111
2131
4151
61
0.20.4
0.60.8
1
Distance1pt.= 500 mt.
Scales
CO
EF
S
-2.00
-1.00
0.00
1.00
2.00
3.00
4.00
5.00
1 5 9 13172125293337414549535761
pp
m
Distance along transect (1 pt. = 500mt)
Cu
UCL
Mean
LCL20
4060
111
2131
4151
61
0.2
0.4
0.6
0.8
Distance1pt.= 500 mt.
Scales
CO
EF
S
-4.00
-2.00
0.00
2.00
4.00
6.00
1 6 11 16 21 26 31 36 41 46 51 56 61Me
q/1
00
gm
Distance along transect (1 pt. = 500mt)
Mg
UCL
Mean
LCL
2040
60
111
2131
4151
61
0.2
0.4
0.6
0.8
Distance1pt.= 500 mt.
Scales
CO
EF
S

International Journal of Research in Modern Engineering and Emerging Technology (IJRMEET) UGC Approved id_47203
Vol. 5, Sp. Issue: 9, Sept.: 2017 (IJRMEET) ISSN: 2320-6586
261 Online International, Refereed, Impact factor & Indexed Monthly Journal www.raijmr.com
RET Academy for International Journals of Multidisciplinary Research (RAIJMR)
Figure I: Transect of P, K, Zn, Fe, S, Mn, Cu, Mg and Ca of studied Lane with their CWT
presentation
As the wavelet transform is a function of both scale and location, the interpretation of
transform is difficult, so wavelet variance is the solution to facilitate analysis. Wavelet
variance is simply the average of square of wavelet coefficients of a scale. The wavelet
variance is proportional to the number and intensity of a feature of a given scale, a peak in the
wavelet variance indicates presence of high number of low intensity values or low number of
high intensity values. In studied data it is seen the dominant peak is directly proportional to
number of data in a series. It is found from this study that the dominant peak is following a
pattern, it is normally within the range: Half the number of samples + 10% and Half the
number of samples + 20%.In all parameters it is checked, where ever this range is not
followed, heterogeneity is found. In some parameters along with dominant peak, small
multiple peaks are also seen at lower scales, indicating variability and other characteristics of
studied area with low intensity. The values of wavelet variance of macro and micro nutrients
at dominant peak with scale and their respective contribution in percentage is incorporated in
figure II and table II.
Figure II: Shows the wavelet variance of P, K, Zn, Fe, S, Mn, Cu, Mg and Ca data.
The horizontal axis corresponds to wavelet variance as a function of scale.
-5.00
0.00
5.00
10.00
15.00
20.00
1 5 9 13172125293337414549535761
Me
q/1
00
gm
Distance along transect (1 pt. = 500mt)
CaUCL
Mean
LCL 2040
60
111
2131
4151
61
0.20.40.60.8
11.2
Distance1pt.= 500 mt.
Scales
CO
EF
S
0 0.2 0.4 0.6 0.80
10
20
30
40
50
Wavelet Variance
Sca
les
P
K
Zn
Fe
S
Mn
Cu
Mg
Ca

International Journal of Research in Modern Engineering and Emerging Technology (IJRMEET) UGC Approved id_47203
Vol. 5, Sp. Issue: 9, Sept.: 2017 (IJRMEET) ISSN: 2320-6586
262 Online International, Refereed, Impact factor & Indexed Monthly Journal www.raijmr.com
RET Academy for International Journals of Multidisciplinary Research (RAIJMR)
Table II: Varianceinmacro and micro nutrition
Peak
Scale
WaveletVariance
Value
Weightage
in %
P 37 0.41 14.8%
K 34 0.47 17%
Zn 34 0.2 7.22%
Fe 33 0.28 10.1%
S 35 0.64 23.1%
Mn 34 0.29 10.46%
Cu 36 0.26 9.38%
Mg 36 0.09 3.24%
Ca 15 &7 0.13 & 0.1 8.3%
Table II and CWT graphs reveal that
1. P, K and S are dominating the site.
2. Ca is also a higher contributor but the multiple peaks shows not the entire site is under its
influence but it is localized, as dominant peak is not following the pattern and it can be seen
through CWT graph low intensity values are contributing more and giving rise to low scale
multiple peaks.
3. Zn, Fe, Mn and Cu are normal contributor.
4. Cu, Sand P are also showing multiple peaks at lower scale.
5. Sulphur is the highest contributor.
6. It is very interesting to see though Magnesium is following the scale pattern but least
contributor.
With scale we can get information of pattern, if any parameter is not following the pattern,
we can predict variation in data due to some factors (like excess amount of fertilizers,
weathering effect alter the values of particular nutrient, previous crop dependency, so one
should change the next crop).So from dominant peak we can get idea of whole distance area
and with small peaks and multiple peaks district wise as well as village wise also can be
predict. Deviation from the general trend can be directly linked to random events and site
conditions. In this study main event may be lack of knowledge of using fertilizers, quality of
fertilizers, weather conditions etc.

International Journal of Research in Modern Engineering and Emerging Technology (IJRMEET) UGC Approved id_47203
Vol. 5, Sp. Issue: 9, Sept.: 2017 (IJRMEET) ISSN: 2320-6586
263 Online International, Refereed, Impact factor & Indexed Monthly Journal www.raijmr.com
RET Academy for International Journals of Multidisciplinary Research (RAIJMR)
Reference:
1. G. A. Bradshaw and T. A. Spies (1992), “Characterizing canopy gap structure in forests
using wavelet analysis”, Journal of Ecology, Vol.:80, pp. 205–215.
2. R. M. Lark and R. Webster (1999), “Analysis and elucidation of soil variation using
wavelets” European Journal of Soil Science, Vol.:50, pp. 185-206.
3. Walker, J. S. (1999). A Primer on Wavelets and Their Scientific Applications, 1st ed.
Boca Raton (FL) CRC Press.
4. Polikar, R. (2001). The Engineer's Ultimate Guide to Wavelet Analysis: The Wavelet
Tutorial.

International Journal of Research in Modern Engineering and Emerging Technology (IJRMEET) UGC Approved id_47203
Vol. 5, Sp. Issue: 9, Sept.: 2017 (IJRMEET) ISSN: 2320-6586
264 Online International, Refereed, Impact factor & Indexed Monthly Journal www.raijmr.com
RET Academy for International Journals of Multidisciplinary Research (RAIJMR)
Electron Impact Ionization of Carbon and Silicon based
molecules
Hitesh Yadav1,3*
, Hardik Desai2, Minaxi Vinodkumar
3 and P.C. Vinodkumar
1
1Department of Physics, Sardar Patel University, Vallabh Vidyanagr, Gujarat.
2Department of Physics, UkaTarsadia University, Bardoli, Surat, Gujarat.
3Electronics Department, V.P & R.P.T.P. Science College, Vallabh Vidyanagar, Gujarat.
Abstract:
We report electron impact total ionization cross sections for Silicon-based molecules such as
(SiC, SiN, SiO, SiF2) and Carbon-based molecules (CF4, CF3Br, C3H4) from the threshold of
the target to 5000 eV. We have employed Spherical Complex Optical Potential (SCOP) to
compute total inelastic cross sections (Qinel). The total ionization cross section (Qion) is
extracted from the total inelastic cross section using the Complex Scattering Potential–
ionization contribution (CSP-ic) method. The results of most of the targets studied here
compare well with the measurements and the theoretical data wherever available. The
correlation between the peaks of ionization cross sections with the number of target electrons
is also reported. It is observed that not only numberof electrons contribute to ionization cross
sections but also the number of molecular bonds of the target. This correlation is shownfor
the iso-electronic molecule.
Keywords:SCOP, CSP-ic, Ionization cross section, Iso-electroinc molecule.
Introduction:
Atomic-molecular collision study has a history of more than 100 years now and has found
important place in the exploration of basic processes like excitation, ionization and
dissociation or fragmentation at the subatomic level. The problem of electron scattering with
atoms and molecules has been extensively addressed by many theoretical and experimental
scientists in recent past,as these processes have gained much importance in environmental
science, study of aurora, ionosphere of the earth and other astrophysical environments and
low temperature plasmas.
Energetic electrons striking the atomic or molecular targets are responsible for many physical
and chemical processes, which can be classified into elastic and inelastic processes.

International Journal of Research in Modern Engineering and Emerging Technology (IJRMEET) UGC Approved id_47203
Vol. 5, Sp. Issue: 9, Sept.: 2017 (IJRMEET) ISSN: 2320-6586
265 Online International, Refereed, Impact factor & Indexed Monthly Journal www.raijmr.com
RET Academy for International Journals of Multidisciplinary Research (RAIJMR)
Quantitatively, these processes are represented by the elastic and inelastic cross sections.
Inelastic channel includes discrete excitations to higher orbits or ionization that is excitation
to the continuum. Both the processes are important and are responsible for the loss of flux
from the incident channel into the inelastic channel. In fact, the active fragments (ions,
radicals and atoms) generated in the inelastic channels as electrons colliding with the
molecular targets are responsible for several chemical reactions, such as etching, coating and
polymerization leading to surface and material treatment or modifications. Furthermore, the
knowledge of ionization cross sections is a fundamental step in theion–molecule reactions in
chemical reactors [1, 2]. The ionization cross sections play pivotal role in applications of
plasma physics, atmospheric science, mass spectrometry and vacuum technology.
Among the targets of present study, silicon is an important constituent of interstellar dust,
silicon cluster are also found in the atmospheres of planets and their moons [3]. The silicon
based molecules (SiC, SiN, SiO) are of important in applied physics, quantum chemistry and
have a big impact in the interstellar region [4].SiO and SiN are of great interest in discharges
and plasmas as well as in gas lasers, planetary, cometary, radiation chemistry and mass
spectrometry [5]. SiF2 radical isknown to be product of the etching of Si by fluorinated gases
[6, 7]. Electron scattering from small fluorocarbon compounds has been of recent interest due
to the prominent role these molecule plays as feedstock gases for industrial plasmas such as
CF4. Carbon tetrafluoride (CF4) is one of the most widely used components of feed gas
mixture employed for a variety of plasma environment [8]. CF3Br is attractive choice of
precursor for generation of radical beams as the bromine elimination is expected to be the
dominant elimination channel, making CF3Br a likely efficient source of CF3 and Br radicals
[9, 10, 11].Propyne (C3H4) also known as methylacetylene is commonly used as substitute for
acetylene as fuel for welding torches and it’s also being investigated as possible fuel for
rockets in space craft.
Thus, from literature survey it is quite clear that work on these targets are of great
importance.We report total ionization cross sections forSiC, SiN, SiO, SiF2, CF4, CF3Br and
C3H4from the threshold of the target to 5000 eV. The ionization cross sectional data for the
discussed targets are fragmentary and for few of the molecules the ionization cross section
are reported for the first time. In the next section, we discuss the theoretical methodology and
its salient features.

International Journal of Research in Modern Engineering and Emerging Technology (IJRMEET) UGC Approved id_47203
Vol. 5, Sp. Issue: 9, Sept.: 2017 (IJRMEET) ISSN: 2320-6586
266 Online International, Refereed, Impact factor & Indexed Monthly Journal www.raijmr.com
RET Academy for International Journals of Multidisciplinary Research (RAIJMR)
Theoretical Methodology:
We briefly discuss the theoretical methodology employed here for the calculation of the
various cross sections. The details of the methodology can be obtained from our earlier
publications [12-14]. As discussed in the earlier section that the scattering phenomenon is
characterized quantitatively into two important processes namely elastic and inelastic. They
combine to give the total scattering phenomenon.
𝑄𝑇 𝐸𝑖 = 𝑄𝑒𝑙 𝐸𝑖 + 𝑄𝑖𝑛𝑒𝑙 𝐸𝑖 (1)
where Qel represents the elastic cross section and Qinel represents the total inelastic cross
sections. The Spherical Complex Optical PotentialSCOPformalism [12-14] to describe the
electron molecule scattering is represented by the interaction potential,
𝑉𝑜𝑝𝑡 𝐸𝑖 , 𝑟 = 𝑉𝑅 𝐸𝑖 , 𝑟 + 𝑖𝑉𝐼 𝐸𝑖 , 𝑟 (2)
where the real part,𝑉𝑅 𝐸𝑖 , 𝑟 consist of static potential (𝑉𝑠𝑡), exchange potential (𝑉𝑒𝑥 ), and
polarization potential 𝑉𝑝and the complex part 𝑉𝐼 of the optical potentialtakes care of all the
inelastic processes via absorptionpotential (𝑉𝑎𝑏𝑠 ) which accounts for the total loss of flux
scattered into the allowed electronic excitation or ionization channels. It is to be noted that
the SCOP program doesn’t require any fitting parameters. All the potential described by
equation (2) are charge-density dependent. In the SCOP formalism [12-14], the complex
optical potential is used to solve the Schrödinger equation numerically using the partial wave
analysis. Using these partial waves, the complex phase shifts are generated which are key
ingredients to find the relevant cross sections. The phase shifts contain all the information
regarding the scattering events.
Total inelastic cross sections are not directly measurable quantities and hence do not provides
a direct comparison with experiment. But it is obtained by subtracting the elastic cross
section from the total cross sections. Though it is difficult to measure, but it contains an
important quantity which is directly measurable i.e ionization cross section and electronic
excitation cross sections. Thus, the total inelastic cross section (Qinel) can be written as [12]
𝑄𝑖𝑛𝑒𝑙 (𝐸𝑖) = 𝑄𝑒𝑥 𝐸𝑖 + 𝑄𝑖𝑜𝑛 𝐸𝑖 (3)
where the first term represents the sum of all total discrete electronic excitation and the
second term represents the total ionization cross section. The discrete transition arise mainly
from the low-lying dipole allowed transitions for which the cross sections decreases beyond
Ep the energy at which Qinel is maximum therefore by definition we can write,

International Journal of Research in Modern Engineering and Emerging Technology (IJRMEET) UGC Approved id_47203
Vol. 5, Sp. Issue: 9, Sept.: 2017 (IJRMEET) ISSN: 2320-6586
267 Online International, Refereed, Impact factor & Indexed Monthly Journal www.raijmr.com
RET Academy for International Journals of Multidisciplinary Research (RAIJMR)
𝑄𝑖𝑛𝑒𝑙 𝐸𝑖 ≥ 𝑄𝑖𝑜𝑛 𝐸𝑖 (4)
This is an important inequality and it forms the basis for the complex spherical potential-
ionization contribution (CSP-ic) method. The ionization cross-section may be estimated from
total inelastic cross sections by defining an energy dependent ratio R(Ei),
𝑅 𝐸𝑖 = 𝑄𝑖𝑜𝑛 (𝐸𝑖)
𝑄𝑖𝑛𝑒𝑙 (𝐸𝑖) (5)
such that 0 ≤ 𝑅 ≤ 1,
it is apparent from the above ratio that when the incident energy is less than or equal to the
ionization threshold (I) of the target, this ratio is zero as the ionization process has not started.
Also at very high energy say for about then times the energy at which the inelastic peak
occurs, the only dominant process is the ionization and hence the ratio 𝑅 𝐸𝑖 approaches to 1.
𝑅 𝐸𝑖
= 0 𝑓𝑜𝑟 𝐸𝑖 ≤ 𝐼 = 𝑅𝑝𝑓𝑜𝑟 𝐸𝑖 = 𝐸𝑝 ≅ 1 𝑓𝑜𝑟 𝐸𝑖 ≫ 𝐸𝑝
(6)
As the ionization, cross section is continuous function of energy, we can express this ratio as
[12,14]
𝑅 𝐸𝑖 = 1 − 𝑓 𝑈𝑖 = 1 − 𝐶1 𝐶2
𝑈𝑖 + 𝑎+𝑙𝑛𝑈𝑖𝑈𝑖
(7)
where 𝑈𝑖 = 𝐸𝑖
𝐼 dimensionless variable, Ep stands for the incident energy at which the
calculated Qinelattains its maximum value. Rp is the value of R atEi = Ep. The reason for
adopting such term is that, at higher energiesthe total cross sections follows the Bron Bethe
term according to which the cross section falls as 𝑙𝑛𝑈
𝑈, but at low energy and intermediate
energies it obeys 1
𝐸𝑖 [15]. Equation (7) involves dimensionless parameters C1, C2 and a that
depends on the target properties. To determine these parameters, we have used the three
conditions given in equation (6) for the ratio 𝑅 𝐸𝑖 .

International Journal of Research in Modern Engineering and Emerging Technology (IJRMEET) UGC Approved id_47203
Vol. 5, Sp. Issue: 9, Sept.: 2017 (IJRMEET) ISSN: 2320-6586
268 Online International, Refereed, Impact factor & Indexed Monthly Journal www.raijmr.com
RET Academy for International Journals of Multidisciplinary Research (RAIJMR)
Results and Discussion:
The theoretical approach of CSP-ic method outlined above is
employed to determine electron impact total ionization cross
sections. We have presented our graphical results in figure 1-9.
In figure 1-3 we have presented
the calculated Ionization cross section for the
diatomic molecular target (SiC, SiO & SiN)
using the CSP-ic method. Where we have
used the Rp value to be 0.7 i.e. assuming
70% ionization contribution in the inelastic
cross sections [15]. The result presented
here are been reported for the first time to the
best of our knowledge.
In figure 4 we have reported the calculated ionization cross
section for the SiF2 molecule. In figure 5, we presentthe dependency of
the ionization cross section (Qion) on the
number of electron present in the target.
Where SiF2 having the maximum number
of the electrons i.e. 32 and SiC has the
least i.e. 20. Thus the conclusion can be
drawn from the graph that the Qion peaks
depend on the number electrons present in
the molecular or the atomic target.
In the figure 6-7 we have presented the
calculated result for the fluorine containing molecules. It’s very
difficult to ignore the presence of the high
electron affinity of the fluorine atom and
that can be clearlyseen in the case of
experimental results. In figure 6 we have
presented the calculatedQion for the CF4
molecule. And it is in good agreement with
S. Pal et. al [16] , S. Pal et. al [17],
Figure 1 Total Ionization Cross
section (Qion) for e-SiC.
Figure 2 Total Ionization
Cross section (Qion) for e-SiO.
Figure 3 Total Ionization Cross
section (Qion) for e-SiN.
Figure 4 Total Ionization Cross
section (Qion) for e-SiF2
Figure 5 Comparison of the (Qion)
peaks for all silicon based
molecules
Figure 6 Total Ionization Cross section
(Qion) for e-CF4
Figure 7 Total Ionization Cross
section (Qion) for e-CF3Br

International Journal of Research in Modern Engineering and Emerging Technology (IJRMEET) UGC Approved id_47203
Vol. 5, Sp. Issue: 9, Sept.: 2017 (IJRMEET) ISSN: 2320-6586
269 Online International, Refereed, Impact factor & Indexed Monthly Journal www.raijmr.com
RET Academy for International Journals of Multidisciplinary Research (RAIJMR)
Nishimura et. al [18] and Seiglaff et. al [19], at lower energy
regime but at higher energy the nature of the cross section is
qualitatively same but differs quantitatively. While in the
figure 7 we have reported the ionization cross section for e-
CF3Br. The presented data finds overall a good agreement
with available data in the literature [9, 10, 11]. In figure 8 the
present calculated data for the C3H4 is plotted. We have
compared our data with the lone data of Szmytkowski et. al [20]
calculated using the BEB method. The data findsgood agreement at
low and high energy regime and it over estimates the BEB cross section in the intermediate
energy regime.
Figure 9 represents the Qion of two iso-electronic molecules i.e. the molecule having
the same number of the electrons.In the case of SiO and
C3H4where they have the same number of electrons, i.e.
22,from figure 9, it is evidentthat not only the number of
electron responsible for ionizations cross sections but also the
number of atoms present in the molecule. The dissociative
ionization also plays a role in the cross sections. This
comparison between Propyne (C3H4) and SiO indicates the
same.
Conclusion:
In the present work we have reported the results for ionization
cross sections (see figure 1-9) of silicon based and carbon based
molecules of industrial applications. It is also seen that the ionization peak increases with no.
electrons present in the molecule (size of the molecule). It is further noticed that molecules
having the higher number of molecular bonds have higher ionization cross sections even
though their electron numbers are identical. This may be due to the contributions coming
from various dissociative ionization processes of the inelastic channels.
Acknowledgement:
Dr. Minaxi Vinodkumar acknowledges DST-SERB, New Delhi for the Major researchproject
[EMR/2016/000470] for financial support under which part of this work is carried out.
Figure 8 Total Ionization Cross
section (Qion) for e-C3H4
Figure 9 Iso-electronic molecules
ionization cross sections of SiO and
C3H4.

International Journal of Research in Modern Engineering and Emerging Technology (IJRMEET) UGC Approved id_47203
Vol. 5, Sp. Issue: 9, Sept.: 2017 (IJRMEET) ISSN: 2320-6586
270 Online International, Refereed, Impact factor & Indexed Monthly Journal www.raijmr.com
RET Academy for International Journals of Multidisciplinary Research (RAIJMR)
Reference:
[1.] J. L Franklin, Ion-Molecule Reactions (Butterworth, London, 1972) pp:1-2.
[2.] M. T. Bowers, Gas Phase Ion chemistry (Academic Press, London, 1973) pp:1-
2.
[3.] M. C. Necarthy, C. A. Gottlieb & P. Thaddeus, Mol Phys. 2003, 101, 4.
[4.] J. Cernicharo, C.A Gottlieb, M. Guelin, P. Thaddeus & J. M. Vrtiek, Astrophys.
J. 1989, 341,L25.
[5.] B. E. Turner, Astrophys. J. 1996, 468,694.
[6.] H. F. Winter & F. A. Houle, J. Appl. Phys., 1983, 54, 1218.
[7.] Y. Matsumi, S. Toyoda, T. Hayashi, M. Miyarnura, H. Yoshikawa & S.
Komiya, J. Appl. Phys., 1986, 60, 4102.
[8.] L. G. Christophorous, J. K. Olthoff & M. V. V. S. Rao, J. Phys. Chem. Ref.
Data., 1996, 25, 1341.
[9.] M. Bart, P. W. Harland, J. E. Hudson and C. Vallance, Phys. Chem. Chem.
Phys., 2001, 3, 800.
[10.] C.Q. Jiao, B. Ganguly, C.A. DeJoseph, A. Garscadden, Int. J. Mass. Spect.,
2001, 208, 127.
[11.] U Onthong, H Deutsch, K Becker, S Matt, M Probst, T.D Märk, Int. J. Mass
Spect., 2012, 214,53.
[12.] M Swadia, Y Thakar, M Vinodkumar, C Limbachiya, Euro. Phys. J. D 2017, 71,
85.
[13.] H Yadav, M Vinodkumar, C Limbachiya, PC Vinodkumar, Mol. Phys. 2017,
115, 952.
[14.] H Bhutadia, A Chaudhari, M Vinodkumar, Mol. Phys., 2015, 113, 3654.
[15.] J. Turner, H. Paretzke, R. Hamm, H. Wright, R. Richie, Radiat. Res.,
1982, 92, 47.
[16.] S. Pal, P. Bhatt, Int. J. Mass Spect., 2003, 229,151.
[17.] S. Pal, Phs. Scr. 2008, 77, 055304.
[18.] H. Nishimura, W. M. Huo, J. Chem. Phys. 1999, 110, 3811.
[19.] D RSeiglaff, RRejoub, J. Phys. B, 2001, 34, 799.
[20.] C. Szmytkowski, J. R. Brunton, M. J. Brunger & S. J. Buckman, Plasma
Sources Sci. Thechnol. 2010, 19, 065021.

International Journal of Research in Modern Engineering and Emerging Technology (IJRMEET) UGC Approved id_47203
Vol. 5, Sp. Issue: 9, Sept.: 2017 (IJRMEET) ISSN: 2320-6586
271 Online International, Refereed, Impact factor & Indexed Monthly Journal www.raijmr.com
RET Academy for International Journals of Multidisciplinary Research (RAIJMR)
The Study of Lattice Dynamics and Lattice Mechanical
Properties Using First Principles Local Pseudopotential
Kamaldeep G Bhatia1*, Amit B Patel2, Nisarg K Bhatt3, Pulastya R Vyas2 and Vinod B Gohel2
1Department of Physics, L.J.I.E.T., Gujarat Technological University, S. G. Highway,
Ahmedabad- 382210, Gujarat, India
2Department of Physics, School of Science, Gujarat University, Ahmedabad, Gujarat, India
3Department of Physics, M. K. Bhavnagar University, Bhavnagar- 394001, Gujarat, India
*Corresponding author: [email protected]
Abstract:
The local form of the pseudopotential without adjustment of any parameter has been used for
the theoretical study of partly d band transition metal Copper. We have also computed
phonon density of states, temperature variations of Debye Waller factor, mean square
displacement and Debye temperature. Presently obtained results are in excellent agreement
with experimental results. From present study we conclude that the local pseudopotential
without adjustment of any parameter provides more transparent way for understanding of
ionic interaction. Such approach is very simple and identical to first principles approach.
Keywords: Transition metal; local pseudopotential; phonons and lattice mechanical
properties.
PACS:63 20Dj, 65 50 +m
Introduction:
Over the past 40 years, phonon spectra of crystals have been determined by using neutron
scattering experiments for a wide class of systems ranging from elements to multicomponent
materials, metals to semiconductors, insulators and alloys. The theoretical and experimental
studies are helpful for the understanding of many static and lattice mechanical properties at
ambient condition and even at extreme environment (High Temperature and High Pressure).
With the increasing computational power of modern work stationsab initio calculations of
phonons have become possible.These investigations all based on a density functional theory
differ, however, in the treatment ofthe tightly bound core electrons and/or in the basis setused
for describing the wave functions[1]. Since very accuratefull- potential calculations [e.g.,

International Journal of Research in Modern Engineering and Emerging Technology (IJRMEET) UGC Approved id_47203
Vol. 5, Sp. Issue: 9, Sept.: 2017 (IJRMEET) ISSN: 2320-6586
272 Online International, Refereed, Impact factor & Indexed Monthly Journal www.raijmr.com
RET Academy for International Journals of Multidisciplinary Research (RAIJMR)
full-potential linearizedaugmented-plane wave(FLAPW)calculations]arevery time
consuming, even with modern work stations,most studies have been restricted to selected
phononmodes by using the frozen phonon approach [2]. During literature survey it has been
observed that Embedded (EMBM) atom method and Tight Binding [TB] method are also
used for the study of lattice dynamics.
A more elaborated approach is due to the pseudopotential theory. Even transition elements
may be described bya local pseudopotential, provided that the valence is
chosenappropriately[3].For transition metals, unlike what happens for simplemetals, there is
not a large number of suitable pseudopontentials.Essentially, for transition metals, one has to
consider the fact that the tightly bound d-electrons hybridize withthe nearly free electrons,
resulting in a partially filled d-band,crossing the Fermi energy. The presence of the dband has
been a serious impediment to the applicationof pseudopotential perturbation theory for such
systems [4]. Number of attempts have been made in recent past for the study of lattice
dynamics and lattice mechanical properties of transition metals with complex electronic and
structural behaviour [1,4-8]. Nevertheless, for transition metals, it hasbecome necessary to
introduce some sophistication in orderto obtain satisfactory agreement with
experimentalphonon frequencies. During literature survey it has been observed that
theoretical study based on local pseudopotential requires fitting of parameters to predict
phonon spectra of transition metals [1,4]. Keeping this in our mind, in the present
communication, we attempt to uselocal pseudopotential due to Kumar [9] without any
adjustments of parameter for the study of lattice dynamics and lattice mechanical properties
of Cu in the framework of second order perturbation theory. Such calculation is identical with
the one carried out with first principles method.
Theory:
The total dynamical matrix 𝐷𝛼𝛽 (𝑞) will consist of three terms,
𝐷𝛼𝛽 𝑞 = 𝐷𝛼𝛽𝐶 𝑞 + 𝐷𝛼𝛽
𝐸 𝑞 + 𝐷𝛼𝛽𝑅 𝑞 (1)
Here superscripts stand for Columbic, Electronic and Repulsive contributions.𝐷𝛼𝛽𝐶 𝑞 ,
𝐷𝛼𝛽𝐸 𝑞 and𝐷𝛼𝛽
𝑅 𝑞 can be found in [10]. In the harmonic approximation, the Debye-Waller
exponent 2WT is directly obtained from the computed phonon density of states. If g(v) is the
frequency distribution function for the phonons giving the number of vibrational modes in the
frequency interval between v and v + dv [11], then

International Journal of Research in Modern Engineering and Emerging Technology (IJRMEET) UGC Approved id_47203
Vol. 5, Sp. Issue: 9, Sept.: 2017 (IJRMEET) ISSN: 2320-6586
273 Online International, Refereed, Impact factor & Indexed Monthly Journal www.raijmr.com
RET Academy for International Journals of Multidisciplinary Research (RAIJMR)
2𝑊𝑇 =8𝜋2ℏ
3𝑀𝑁(𝑠𝑖𝑛𝜃
𝜆)2
𝑔(𝑣)
𝑣
𝑣𝑚𝑎𝑥
0coth
ℎ𝑣
2𝑘𝐵𝑇𝑑𝑣(2)
where Q is the glancing angle and 𝜆 is the wave length of incident radiation. M is mass of the
atom and N denotes the total number of unit cells in the crystal. In the
harmonicapproximation, the mean square displacement of the atoms in the crystal is given by
the relation [11],
𝑈 2 =3
8𝜋2 (𝜆
𝑠𝑖𝑛𝜃)2𝑊𝑇 (3)
Results and Discussion:
In the present study we have used Kumar’s pseudopotential [9] which has the following form
in r-space, 𝑉𝑖𝑜𝑛 𝑟 =−𝑍𝑒2𝑟
𝑟𝑚 𝑟𝑐 for 0<r<rc; 𝑉𝑖𝑜𝑛 𝑟 =
−𝑍𝑒2𝑟
𝑟𝑚 for rc< r <rm and 𝑉𝑖𝑜𝑛 𝑟 =
−𝑍𝑒2𝑟
𝑟 for
rm< r.In above pseudopotential, there are two adjustable parameters core radius rc and some
model radius rm. We have taken core radius rc as experimental ionic radius and rm as
experimental atomic radius in the present study. In the region r <rc, there is no complete
cancellation of potential but it decreases linearly and in the region rc to rm it remains constant.
It possesses pure coulombic behaviour for the region outside rm.The potential between
regionrc to rm accounts hybridization effects because in case of d-band metals there is no
complete cancellation of potential within this range. In this sense the local form of the
pseudopotential is free from any kind of adjustments of parameter and considered as first
principles pseudopotential. The values of rc and rm are 1.3797 a.u. and 2.9673 a.u.
respectively. The value of effective valency Z=1.1937 obtained from first principles
calculation has been used. It is well known fact that in case of transition metals due to
oscillations of ions there is core-core repulsion which is short range in nature and plays an
important role for the complete understanding of ionic interaction. We have also accounted
such core-core repulsion by using Born-Mayer type of potential. The value of the coefficient
of the Born-Mayer potential is 125 and exponent value is 2.42. The calculated phonon
frequencies in symmetric directions are compared with experimental results as shown in Fig.
1.

International Journal of Research in Modern Engineering and Emerging Technology (IJRMEET) UGC Approved id_47203
Vol. 5, Sp. Issue: 9, Sept.: 2017 (IJRMEET) ISSN: 2320-6586
274 Online International, Refereed, Impact factor & Indexed Monthly Journal www.raijmr.com
RET Academy for International Journals of Multidisciplinary Research (RAIJMR)
FIG. 1 Phonon Dispersion curves for Cu.
The agreement between experimental findings [12] of our computed frequencies are in good
agreement with having maximum deviation less than 20% in both longitudinal and transverse
modes. Again we would like to comment that the parameters are not adjusted to reproduce
any phonon frequency. The best of our knowledge such approach has not been used
previously for the study of lattice dynamics using local pseudopotential. In order to verify the
reliability of present scheme we have computed frequency distribution (phonon density of
states). The frequency spectra of the lattice vibrations is computed by the numerical sampling
of the frequencies according to Blackmann's technique.We have considered a mesh of
evenlyspaced 64000 wave vectors in the first Brillouin zone. The detailsof the calculations
may be found in [13].
The variations of WT and 𝑈 2 alongwith the experimental results due to Peng et. al. [14] are
shown in Fig. 2. The agreement between experimental and theoretical results are very good.
Using phonon density of states we have computed Cv/3R upto 300o K using expression given
in [10]. From such numerical values of temperature variation of Cv/3R we have computed
temperature variation of Debye Temperature upto 300o K as shown in Fig. 3. Computed
results are in excellent agreement with experimental findings due to [15]. Here we would like
to point that the Debye temperatureθD at 0o K is computed using method discussed by Raju
[16].

International Journal of Research in Modern Engineering and Emerging Technology (IJRMEET) UGC Approved id_47203
Vol. 5, Sp. Issue: 9, Sept.: 2017 (IJRMEET) ISSN: 2320-6586
275 Online International, Refereed, Impact factor & Indexed Monthly Journal www.raijmr.com
RET Academy for International Journals of Multidisciplinary Research (RAIJMR)
FIG. 2 Temperature variations of WT and 𝑈 2FIG.3Temperature variations ofθD
Conclusions:
From the present study we conclude that parameter free (first principles) local
pseudopotential explains lattice dynamics and lattice mechanical properties with good degree
of success. The use of experimental values of ionic and atomic radii is more realistic in
comparison with those obtained by favoring some physical properties. We have also find that
for the better description of the physical properties valency do play an important role. Here
we would also like to comment that the pseudopotential constructed using experimental data
can be fully justified when it is used for the study of comprehensive physical properties
(static, lattice mechanical and transport).
Acknowledgements:
We are highly thankful for the financial assistance provided by (i) DST, New Delhi (DST-
FIST (Level 1) project) (ii) UGC, New Delhi (DRS SAP AP-I project), (iii) DST, New Delhi
(DST-FIST project) to the Department of Physics, Gujarat University. One of the author A.
B. Patel is also thankful for the financial support given by UGC (BRS startup programme).
References:
1. C. V. Pandya, P. R. Vyas, T. C. Pandya, N. Rani and V.B. Gohel,Journal of the
Korean Physical Society, 2001, 38(4), 377.
2. K. Kune, Electronic Structure, Dynamics and QuantumStructural Properties of
Condensed Matter, editedby J. T. Devreese and P van Camp, Plenum, New
York,1985.
3. T. Starkloff and J. D. Joannopoulos Phys. Rev. B, 1977, 16,5212.
International Journal of Research in Modern Engineering and Emerging Technology (IJRMEET) UGC Approved id_47203
Vol. 5, Sp. Issue: 9, Sept.: 2017 (IJRMEET) ISSN: 2320-6586
276 Online International, Refereed, Impact factor & Indexed Monthly Journal www.raijmr.com
RET Academy for International Journals of Multidisciplinary Research (RAIJMR)
4. C. V. Pandya, P. R. Vyas, T. C. Pandya, N. Rani and V.B. Gohel, Physica B
Condensed Matter,2001, 307(1-4), 138.
5. A. Eichler, K. P. Bohnen, W. Reichardt and J. Hafner, Phys. Rev. B, 1998, 57, 324.
6. M. I. Katsnelson, I. I. Naumov, A. V. Tre_lov, M. N. Khlopkin and K. Yu Khromov,
Phil. Mag. B,1997, 75, 389.
7. B. A. Greenberg, M. I. Katsnelson, V. G. Koreshkov, Yu N. Osetskii, G. V.
Peschanskikh, A. V. Frefilov, Yu F. Shamanacv and L. I. Yakovenkova, Phys. Stat.
Sol. (b), 1990, 158, 441.
8. A. S. Ivanov, M. I. Katsnelson, A. G. Mikhin, Yu N. Osetskii, A. Yu Rumyantsev, A.
V.Trefilov, Yu F. Shamanaev and L. I. Yakovenkova, Phil. Mag. B, 1994, 69, 1183.
9. J. Kumar, Solid State Communications, 1977, 21, 945.
10. D. C. Wallace, Thermodynamics of Crystals, Dover’s Publication, New York, 1998.
11. P. R. Vyas, C. V. Pandya, T. C. Pandya and V. B.Gohel, Indian J. Phys., 2001,75,
271.
12. G. Nilsson and S. Rolandson, Phys. Rev. B, 1973, 7:6, 2393.
13. P. R. Vyas, PhD thesis, Gujarat University (Ahmedabad, India, 2000).
14. L. M. Peng, G.Ren, S. L.Dudarev and M. J. Whelan, ActaCryst. A, 1996, 52, 456.
15. D. L. Martin, Phys. Rev., 1966,141, 576.
16. S. Raju, E. Mohandas and V. S. Raghunathan, Z. Metallkd, 1996, 87,51.

International Journal of Research in Modern Engineering and Emerging Technology (IJRMEET) UGC Approved id_47203
Vol. 5, Sp. Issue: 9, Sept.: 2017 (IJRMEET) ISSN: 2320-6586
277 Online International, Refereed, Impact factor & Indexed Monthly Journal www.raijmr.com
RET Academy for International Journals of Multidisciplinary Research (RAIJMR)
Study of molecular interactions in aqueous solutions of diclofenac
potassium through acoustical parameters
Jigna B. Karakthala1 and Vipinchandra A. Rana
2
Department of Physics, Gujarat University, Ahmedabad, Gujarat, India.
Email: 1
[email protected],[email protected]
Abstract
Physical properties like Density (ρ), ultrasonic velocity (n), viscosity (h) of aqueous solutions of
diclofenac potassium were measured. Diclofenac potassium is non-steroidal and
anti-inflammatory drug applied to reduce inflammation and analgesic reducing pain. As the
drug’s efficiency is affected by the degree to which it binds to protein within blood plasma,
knowledge of drug interaction with water and protein is of paramount importance. To understand
such interaction, acoustical parameters such as adiabatic compressibility (βa), free length (Lf),
acoustic impedance(Z), Viscous relaxation time (τη), apparent molar volume (Φv) and apparent
molar compressibility (Φk) were determined using measured physical properties. All these
measurements were done at 303.15 K.
Keywords: Density, ultrasonic velocity, viscosity, diclofenac potassium, protein, acoustical
parameters.
Introduction
In medicinal physics, drug-molecular interaction in physiological media involved in drug
transport, protein binding and anesthesia are important phenomena [1]. An effort has been made
in the present investigation to study the behavior of the diclofenac potassium (NSAID-
nonsteroidal anti-inflammatory drug) in water solvent (since most of the biochemical activities
occur in aqueous media) by measuring ultrasonic velocity (n), density (ρ), viscosity (h) and
thereby computing related acoustical and thermal parameters. Diclofenac potassium is
non-steroidal and anti-inflammatory drug applied to reduce inflammation and analgesic reducing
pain. Thermodynamic and transport properties of drug in the aqueous state provides useful
information in pharmaceutical science [2]. A drug’s efficiency may be affected by the degree to
which it binds to the protein within blood plasma. Thus, the knowledge about interaction of drug
with water and protein is of paramount importance [3-5]. Understanding of such interactions
based on solvation which depends on the polarity of solute and solvent, findapplicationin several

International Journal of Research in Modern Engineering and Emerging Technology (IJRMEET) UGC Approved id_47203
Vol. 5, Sp. Issue: 9, Sept.: 2017 (IJRMEET) ISSN: 2320-6586
278 Online International, Refereed, Impact factor & Indexed Monthly Journal www.raijmr.com
RET Academy for International Journals of Multidisciplinary Research (RAIJMR)
industrial and technological processes. Besides in pharmaceutical science for instance drug
delivery, solubility, protein binding is essential [3-10]. The variation in these parameters with
concentration gives idea about changes in molecular structures having weak or strong
interactions[11,12]. In the present investigation physical properties like density (ρ), ultrasonic
velocity (n), viscosity (h) of aqueous solutions of diclofenac potassium were measured, from
these various acoustical parameters are calculated at 303.15 K. The results are interpreted in
terms of molecular interactions between diclofenac potassium and water molecules.
Materials and Methods
2.1 Materials
Diclofenac potassium (with purity 99.98%) was obtained from Shree Parikh Trading,
Ahmedabad, India. The Structural formula of Diclofenac Potassium (C14H10Cl2KNO2) is shown
in scheme 1. Distilled water was obtained from High Purity Laboratory Chemicals (HPLC),
Mumbai, India and was used for preparation of solutions. Which were made on mass basis at
room temperature over the concentration range from 0 M to 0.0822 M using an electronic
balance.
2.2 Measurements
The concentration is converted into the molarity using conversion formula described by E. M.
Cheng et al. [13]. Density of solutions was measured by pycnometer which was calibrated using
water with 995.6 kg/m3
as its density. Viscosity was measured by Ostwald viscometer and was
calibrated with distilled water. All the experiments were repeated thrice. The ultrasonic velocity
for the solutions was measured with ultrasonic interferometer (model F-81S) working at 2 MHz
frequency. The various acoustical parameters like adiabatic compressibility (βa), free length (Lf),
acoustic impedance (Z), viscous relaxation time (tƞ), apparent molar volume (Φv) and apparent
molar compressibility (Φk) were evaluated using equations mentioned in ref. [5,14]. All these
measurements were performed at 303.15 K.
Results and Discussion
Density, viscosity and ultrasonic velocity vary with concentration at 303.15 K for aqueous
diclofenac potassium solutions as illustrated in figure 1. Density of solution increases with
increase in the concentration of diclofenac potassium in distilled water as shown in figure 1.This
might be the result of decreased volume of solution due to the attractive interaction between
solvent-solute molecules which leads to increase in the overall mass of the solution [15]. The
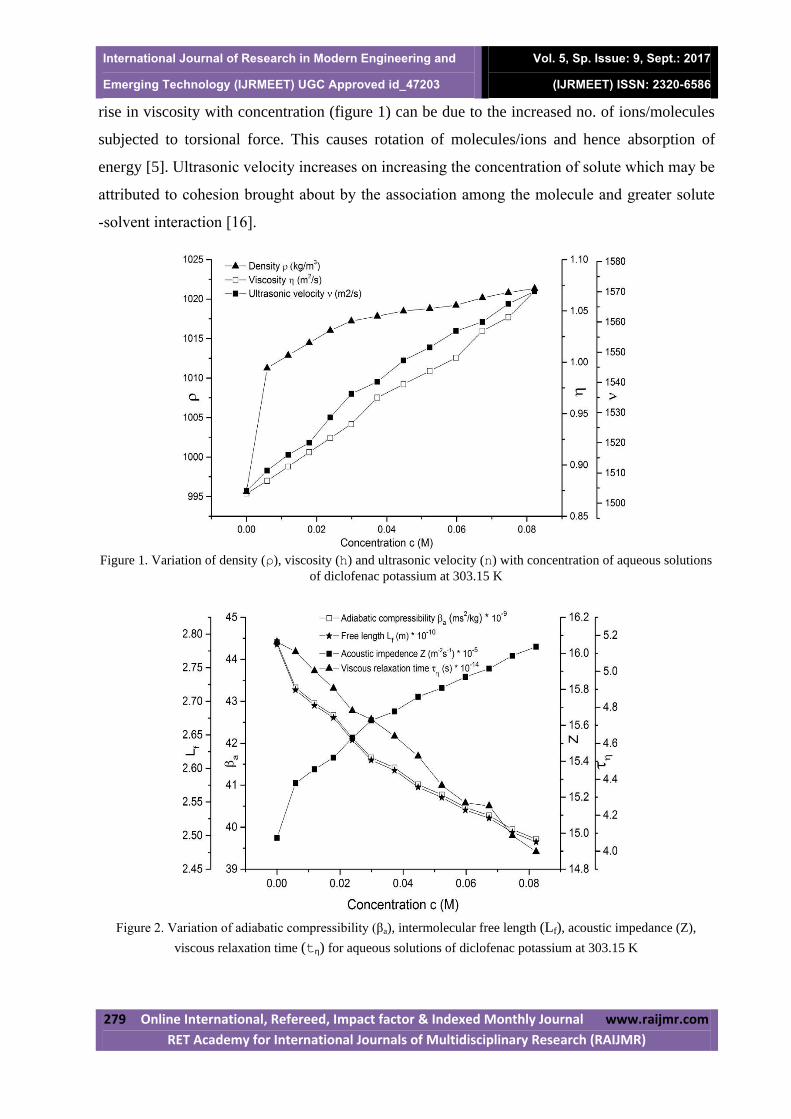
International Journal of Research in Modern Engineering and Emerging Technology (IJRMEET) UGC Approved id_47203
Vol. 5, Sp. Issue: 9, Sept.: 2017 (IJRMEET) ISSN: 2320-6586
279 Online International, Refereed, Impact factor & Indexed Monthly Journal www.raijmr.com
RET Academy for International Journals of Multidisciplinary Research (RAIJMR)
rise in viscosity with concentration (figure 1) can be due to the increased no. of ions/molecules
subjected to torsional force. This causes rotation of molecules/ions and hence absorption of
energy [5]. Ultrasonic velocity increases on increasing the concentration of solute which may be
attributed to cohesion brought about by the association among the molecule and greater solute
-solvent interaction [16].
Figure 1. Variation of density (ρ), viscosity (h) and ultrasonic velocity (n) with concentration of aqueous solutions
of diclofenac potassium at 303.15 K
Figure 2. Variation of adiabatic compressibility (βa), intermolecular free length (Lf), acoustic impedance (Z),
viscous relaxation time (tƞ) for aqueous solutions of diclofenac potassium at 303.15 K

International Journal of Research in Modern Engineering and Emerging Technology (IJRMEET) UGC Approved id_47203
Vol. 5, Sp. Issue: 9, Sept.: 2017 (IJRMEET) ISSN: 2320-6586
280 Online International, Refereed, Impact factor & Indexed Monthly Journal www.raijmr.com
RET Academy for International Journals of Multidisciplinary Research (RAIJMR)
As shown in figure 2, values of adiabatic compressibility decrease with concentration which
indicates formation of strong hydrogen bonding between solute and solvent. This can also be
verified by viscous relaxation time [17]. It is observed that the values of acoustic impedance
increase and inter-molecular free length (distance between the surfaces of the neighboring
molecule) decreases as concentration increases which shows strong interaction between solute
and solvent [15,18].
Water is a polar solvent that solvates polar solutes and ions as they can orient the appropriate
partially charged portion of the molecule towards the solute through electrostatic attraction. This
stabilizes the system and creates hydration (solvation of Diclofenac potassium by water) shell
around each particle of solute. Since diclofenac have hydrogen (H) bond acceptors and donor, it
forms a strong H-bond with water which may be due to the solvated anion as shown in scheme 1
[2].
Scheme 1. Possible interaction of diclofenac potassium with water
Figure 3 shows negative values of apparent molar volume represents weak interaction but
positive values for higher concentration shows that interaction becomes stronger with increase in
the no. of solute ions in the solution which is in good agreement with the above statements.
Studies of D. V. Jahagirdar et al. shows that negative value of compressibility is a sign of
hydrophobic behavior of solute [5,19,20], which may result into lower binding with protein.
Present study shows negative values of compressibility for the considered concentration range of
aqueous diclofenac potassium. Due to lower protein binding diclofenac potassium gets release
easily at appropriate position of the body and being a weak acid with a pKa 4.0, it has a protein
binding ability of more than 99%, study of determination of drug release was done with the help
of UV spectroscopy for diclofenac sodium by Aseri Ajay, et al. [21]. Drug binding may affect
the drug dose response in the body as the drug is less bound, the more efficiently it traverse cell
membranes or diffuse which satisfied with hydrophobic drug to be a better transporter
throughout membranes than others [22].

International Journal of Research in Modern Engineering and Emerging Technology (IJRMEET) UGC Approved id_47203
Vol. 5, Sp. Issue: 9, Sept.: 2017 (IJRMEET) ISSN: 2320-6586
281 Online International, Refereed, Impact factor & Indexed Monthly Journal www.raijmr.com
RET Academy for International Journals of Multidisciplinary Research (RAIJMR)
Figure 3. Variation of Apparent molar volume and apparent molar compressibility with concentration of
aqueous diclofenac potassium solutions at 303.15 K
Conclusion
Experimental Density(ρ), ultrasonic velocity(n), viscosity (h) were measured for aqueous
solutions of diclofenac potassium (non-steroidal and anti-inflammatory drug). Possible structure
for the interaction of diclofenac potassium with water is proposed in this study. Efficiency of
drug is affected by its binds to protein within blood plasma, information of drug interaction with
water and protein is of paramount importance. To interpret such interaction, acoustical
parameters are derived using above three experimentally measured properties. Since negative
values of apparent molar compressibility for given concentration range of aqueous solutions of
diclofenac potassium shows hydrophobic behavior of drug. Besides hydrophobic is a better
transporter throughout membranes than others. Such kind of behavior shows that drug binds less
with protein of blood plasma. Being less bind to the protein, Diclofenac potassium is having
property to release easily at suitable area of body. Thus, appropriate protein binding was affected
by selection of drug dose, so that the selection dose of drug is an important criterion and it
should be taken in keen interest.
Acknowledgement
Financial support, provided by Department of Science and Technology (DST), New Delhi
through the DST-FIST (Level-1) project (SR/FST/PSI-001/2006) and DRS-SAP program grant
[No. F. 530/10/DRS/2010(SAP-1)] have been utilized to carry out this work and it is gratefully

International Journal of Research in Modern Engineering and Emerging Technology (IJRMEET) UGC Approved id_47203
Vol. 5, Sp. Issue: 9, Sept.: 2017 (IJRMEET) ISSN: 2320-6586
282 Online International, Refereed, Impact factor & Indexed Monthly Journal www.raijmr.com
RET Academy for International Journals of Multidisciplinary Research (RAIJMR)
acknowledged.We are also thankful to Prof. P. N. Gajjar, Head, Department of physics, School
of Sciences, Gujarat University, Ahmedabad for his constant encouragement.
References
[1] S. J. Synder, J. R. Synder, J. Chem. Eng., 1974, 19, 207.
[2] M. J. Iqbal, M. A. Chaudhary, J. Chem. Thermodyn., 2009, 41, 221.
[3] J. C. McElnay, P. F. D’Arcy, ADIS Press Australasia, 1983, 25, 495.
[4] S. Stephan, G. Daniel, D. Hartmut, J. Pharm. Sci., 2009, 99, 1107.
[5] D. V. Jahagirdar, B. R. Arbad, S. R. Mirgane, M. K. Lande, A. G. Shankarwar, J. mol. Liq., 1998,
75, 33.
[6] R. G. Rao, S. C. Rambabu, Indian J. Pure Appl. Phys., 2004, 42, 820.
[7] A. Pal, H. Kumar, J. Chem. Thermodyn. 2004, 36,173.
[8] T. S. Rao, N. Veeraiah, C. Rambabu, Indian J. Pure Appl. Phys. 2002, 40, 850.
[9] A. Valen, M. C. Lopez, J. S. Urieta, F. M. Royo, C. Lafuente, J. Mol. Liq., 2002, 95,157.
[10] P. S. Nikkam, B. S. Jagdale, A. B. Sawant, M. Hasan, Indian J. Pure Appl. Phys. 2001, 39, 433.
[11] S. Thirumaran, K. Sathish, Bull. Pure Appl. Sci., 2008, 27, 239.
[12] S. Thirumaran, N. Karthikeyan, Int. J. Chem. Res. 2011, 3, 83.
[13] E. M. Cheng, M. Fareq, F. S. Abdullah et al., IEEE International RF and Microwave Conference,
2013, 409.
[14] S. Ajitha, H. A. Malini, M. V. Devi., Res. J. Pharm. Bio. Chem. Sci. 2013, 4, 218.
[15] S. D. Deosarkar, T. M. Kalyankar, Russ. J. Phys. Chem. 2013, 87, 1060.
[16] A. Dhote, S. Aswale, Adv. Appl. Sci. Res. 2012, 3, 2299.
[17] P. S. Naidu, K. R. Prasad, Indian J. Pure Appl. Phys. 2004, 42, 512.
[18] C. Sharma. Indian J. Pure Appl. Phys., 1989; 27, 32.
[19] K. Shakshi, K Arakawa, Bull. Chem. Soc. 1973, 2738.
[20] S. Prakash, F. M. Ichikaporia, J. D. Pandey., J. Phy. Chem., 1964, 3078.
[21] A. Aseri, D. Duggal, A. Nayak, J. Katewa, Asian J. Pharm. Res. Dev., 2013, 3, 98.
[22] J. Philip, L. Robert, V. prasad, Pharm. Res. Jpn., 2003, 20, 264.

International Journal of Research in Modern Engineering and Emerging Technology (IJRMEET) UGC Approved id_47203
Vol. 5, Sp. Issue: 9, Sept.: 2017 (IJRMEET) ISSN: 2320-6586
283 Online International, Refereed, Impact factor & Indexed Monthly Journal www.raijmr.com
RET Academy for International Journals of Multidisciplinary Research (RAIJMR)
Study of Electrode Polarization and Ionic Conductivity
Relaxation in Binary Mixtures of 3-Bromoanisole and Methanol
at 293.15 K
Hemalkumar P. Vankara and Vipinchandra A. Rana
b
a, b Department of Physics, School of Sciences, Gujarat University, Ahmedabad, Gujarat,
India
Email ID: [email protected],
Abstract
The complex relative dielectric permittivity ɛ*(ω)=ɛ′−jɛ″ of the binary mixtures of 3-
bromoanisole (3-BA) and methanol (MeOH) in the frequency range 20 Hz to 2 MHz at
293.15 K temperature were fitted to Coelho model. The electrode polarization relaxation time
ηEP were obtained using fitted model and compared with the electrode polarization relaxation
time ηEP' which were obtained by the tanδ spectra. The real and imaginary part of complex
electric modulus (M*) were determined for the binary mixtures. The ionic conductivity
relaxation time ηζwere also determined to understand the relaxation processes.
Keywords: Complex relativedielectric permittivity, Coelho Model, Electrode polarization
relaxation time, Ionic conductivity relaxation time.
Introduction
Recently we reported concentration dependent dielectric behaviour of the binary mixtures of
3-bromoanisole (3-BA) and methanol (MeOH) in frequency range 20 Hz to 2 MHz at 293.15
K temperature [1]. As an extension of this work, experimental data of complex relative
dielectric function of binary mixtures of 3-bromoanisole (3-BA) and methanol (MeOH)were
fitted to Coelho model [2, 3] and fitted parameters are reported in this paper. The present
paper concerns mainly with different relaxation phenomenon taking place in the low
frequency region (20 Hz to 2 MHz) in binary mixtures of 3-BA and MeOH of varying
concentration. The relaxation processes were investigated with the help of electrode
polarization relaxation time ηEP and ionic conductivity relaxation time ηζ.

International Journal of Research in Modern Engineering and Emerging Technology (IJRMEET) UGC Approved id_47203
Vol. 5, Sp. Issue: 9, Sept.: 2017 (IJRMEET) ISSN: 2320-6586
284 Online International, Refereed, Impact factor & Indexed Monthly Journal www.raijmr.com
RET Academy for International Journals of Multidisciplinary Research (RAIJMR)
Materials and Methods
Details of materials and sample preparation were reported in our recent publication [1]. The
low frequency complex permittivity data were fitted to the Debye type Coelho model [2,3]
𝜀∗ 𝜔 = 𝜀𝑠 +∆𝜀𝐸𝑃
1+𝑗𝜔 𝜏𝐸𝑃 (1)
Where, ∆𝜀𝐸𝑃 = 𝜀𝑠,𝐸𝑃 − 𝜀𝑠, εs,EP is low frequency dielectric constant in presence of EP, εsis
static dielectric constant and ηEP is electrode polarization relaxation time.
Fitting parameters ∆𝜀𝐸𝑃 ,εs and ηEP were obtained by fitting the experimental data of complex
relative dielectric permittivity ɛ*(ω)to equation (1) by using a complex nonlinear least square
(CNLS) fit method [4].
Complex electric modulus is correlated to the complex relative dielectric function by the
following relation [5]
𝑀∗(𝜔) = 𝑀′ 𝜔 + 𝑀"(𝜔) =𝜀ʹ
𝜀ʹ2+𝜀"2 + 𝜀"
𝜀ʹ2+𝜀"2 (2)
Results and Discussion
Frequency dependent plots of real (ε') and imaginary (ε") parts of relative dielectric function
(ε*) with fitted Coelho model for 3-BA, MeOH and mixture of 3-BA (50%) + MeOH (50%)
are shown in Figure 1.From this figure it can be seen that the experimental data can be well
fitted to Coelho model. The Coelho model is used to fit complex permittivity data of all other
mixture samples. It was observed that the Coelho model provide good fitting for 3-BA and it
start to show deviation in lower frequency region with decrease the concentration of 3-BA in
MeOH. The values of the fitting parameters are reported in Table 1.
Table 1.Fitting parameters εs, ∆𝜀𝐸𝑃 ,and ηEP of the Coelho model.
Concentration
of MeOH εs ∆εEP τEP (ms)
0 7.12 6.292E+05 903.75
0.1 8.34 6.021E+05 40.27
0.2 10.29 5.307E+05 8.60
0.3 12.53 5.250E+05 4.44
0.4 14.89 5.273E+05 3.23
0.5 17.40 5.191E+05 2.60
0.6 19.95 5.143E+05 2.39
0.7 22.51 4.996E+05 2.36
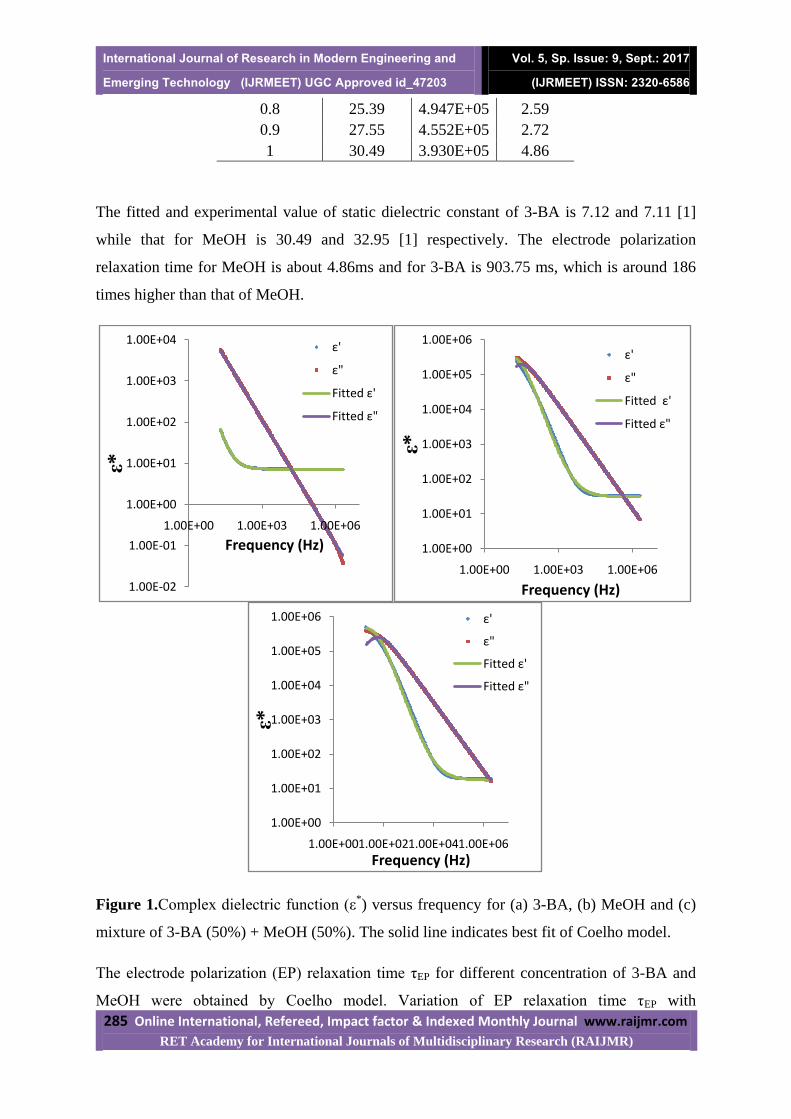
International Journal of Research in Modern Engineering and Emerging Technology (IJRMEET) UGC Approved id_47203
Vol. 5, Sp. Issue: 9, Sept.: 2017 (IJRMEET) ISSN: 2320-6586
285 Online International, Refereed, Impact factor & Indexed Monthly Journal www.raijmr.com
RET Academy for International Journals of Multidisciplinary Research (RAIJMR)
0.8 25.39 4.947E+05 2.59
0.9 27.55 4.552E+05 2.72
1 30.49 3.930E+05 4.86
The fitted and experimental value of static dielectric constant of 3-BA is 7.12 and 7.11 [1]
while that for MeOH is 30.49 and 32.95 [1] respectively. The electrode polarization
relaxation time for MeOH is about 4.86ms and for 3-BA is 903.75 ms, which is around 186
times higher than that of MeOH.
Figure 1.Complex dielectric function (ε*) versus frequency for (a) 3-BA, (b) MeOH and (c)
mixture of 3-BA (50%) + MeOH (50%). The solid line indicates best fit of Coelho model.
The electrode polarization (EP) relaxation time ηEP for different concentration of 3-BA and
MeOH were obtained by Coelho model. Variation of EP relaxation time ηEP with
1.00E-02
1.00E-01
1.00E+00
1.00E+01
1.00E+02
1.00E+03
1.00E+04
1.00E+00 1.00E+03 1.00E+06
ε*
Frequency (Hz)
ε'
ε"
Fitted ε'
Fitted ε"
1.00E+00
1.00E+01
1.00E+02
1.00E+03
1.00E+04
1.00E+05
1.00E+06
1.00E+00 1.00E+03 1.00E+06
ε*
Frequency (Hz)
ε'
ε"
Fitted ε'
Fitted ε"
1.00E+00
1.00E+01
1.00E+02
1.00E+03
1.00E+04
1.00E+05
1.00E+06
1.00E+001.00E+021.00E+041.00E+06
ε*
Frequency (Hz)
ε'
ε"
Fitted ε'
Fitted ε"

International Journal of Research in Modern Engineering and Emerging Technology (IJRMEET) UGC Approved id_47203
Vol. 5, Sp. Issue: 9, Sept.: 2017 (IJRMEET) ISSN: 2320-6586
286 Online International, Refereed, Impact factor & Indexed Monthly Journal www.raijmr.com
RET Academy for International Journals of Multidisciplinary Research (RAIJMR)
concentration of MeOH is shown in Figure 2. As shown in figure 2 the behaviour ηEP is very
similar to EP relaxation time ηEP' which was derived using tanδ plot in our earlier publication
[1]. The ηEP and ηEP' are correlated by the relation 𝜏𝐸𝑃
′ = (𝜏𝐸𝑃𝜏𝜎)1/2[3] where ησ is ionic
conductivity relaxation time which will determined in later part of this paper.
Figure 2. Plot of electrode polarization relaxation time ηEP (Using Coelho model) and ηEP'
(Using tanδ spectra) versus concentration of MeOH
The frequency and concentration dependent real (M') and imaginary (M") part of complex
electric modulus (M*) for binary mixture of 3-BA and MeOH are shown in Figure 3 and 4
respectively. The complex electric modulus is basically inverse of the complex relative
dielectric function (ε*) as a result in Figure 3 the value of M' is very high in high frequency
region. The higher value of M' in high frequency region is due to ionic conduction. In Figure
3, M″ spectra of these mixtures have peaks and frequency fζ corresponding to these peaks is
related to the ionic conductivity relaxation time ηζ by the relation ηζ = (2πfζ)-1
[6, 7]. The
variation of ηζ as a function of concentration of MeOH is shown in Figure 5.

International Journal of Research in Modern Engineering and Emerging Technology (IJRMEET) UGC Approved id_47203
Vol. 5, Sp. Issue: 9, Sept.: 2017 (IJRMEET) ISSN: 2320-6586
287 Online International, Refereed, Impact factor & Indexed Monthly Journal www.raijmr.com
RET Academy for International Journals of Multidisciplinary Research (RAIJMR)
Figure 3. 3D Plot of real part of electric modulus (M') versus % concentration of 3-BA and
frequency
Ionic conductivity relaxation time ηζ of 3-BA and MeOH are about 8.93 µs and 0.38 µs
respectively. The ηζ value decrease up to 80% concentration of MeOH, and remain same up
to 90% concentration and then it increases reaching to ηζ value of pure MeOH.
Figure 4. 3D plot of imaginary part of electric modulus (M") versus % concentration of 3-
BA and frequency
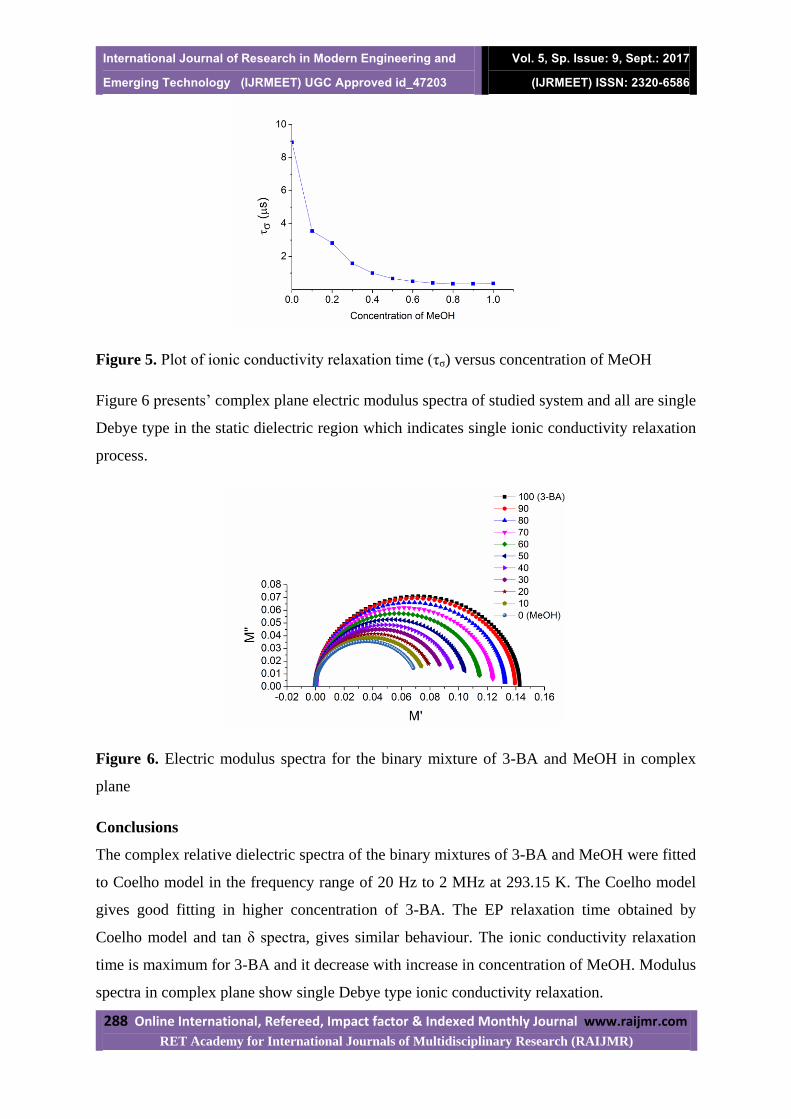
International Journal of Research in Modern Engineering and Emerging Technology (IJRMEET) UGC Approved id_47203
Vol. 5, Sp. Issue: 9, Sept.: 2017 (IJRMEET) ISSN: 2320-6586
288 Online International, Refereed, Impact factor & Indexed Monthly Journal www.raijmr.com
RET Academy for International Journals of Multidisciplinary Research (RAIJMR)
Figure 5. Plot of ionic conductivity relaxation time (ηζ) versus concentration of MeOH
Figure 6 presents’ complex plane electric modulus spectra of studied system and all are single
Debye type in the static dielectric region which indicates single ionic conductivity relaxation
process.
Figure 6. Electric modulus spectra for the binary mixture of 3-BA and MeOH in complex
plane
Conclusions
The complex relative dielectric spectra of the binary mixtures of 3-BA and MeOH were fitted
to Coelho model in the frequency range of 20 Hz to 2 MHz at 293.15 K. The Coelho model
gives good fitting in higher concentration of 3-BA. The EP relaxation time obtained by
Coelho model and tan δ spectra, gives similar behaviour. The ionic conductivity relaxation
time is maximum for 3-BA and it decrease with increase in concentration of MeOH. Modulus
spectra in complex plane show single Debye type ionic conductivity relaxation.

International Journal of Research in Modern Engineering and Emerging Technology (IJRMEET) UGC Approved id_47203
Vol. 5, Sp. Issue: 9, Sept.: 2017 (IJRMEET) ISSN: 2320-6586
289 Online International, Refereed, Impact factor & Indexed Monthly Journal www.raijmr.com
RET Academy for International Journals of Multidisciplinary Research (RAIJMR)
Acknowledgements
Authors are obliged to DST, New Delhi and DRS-SAP for providing financial support
through the DST-FIST (Level- I) project (SR/FST/PSI-001/2006), and DRS-SAP program
grant [No.F. 530/10/DRS/2010(SAP-I)] respectively. We are also thankful to Prof. P.N.
Gajjar, Head, Department of Physics, School of Sciences, Gujarat University, Ahmedabad for
his constant motivation.
References
[1] H. P. Vankar and V. A. Rana, In: D. G. Kuberkar (Ed.), International Conference on
Functional Oxides and Nano materials, 11-13 Nov. 2016, Rajkot, India (AIP, United
States, 2017) 040008.
[2] R. Coelho, J. Non-Cryst. Solids, 1991, 131, 1136.
[3] R. J. Klein, S. Zhang, S. Dou, B. H. Jones, R. H. Colby and J. Runt, J. Chem. Phys.,
2006, 124, 144903.
[4] J. R. Macdonald, LEVM/LEVMW manual, Version 8.12, 2013.
[5] J. Jadzyn, J. Swiergiel, Ind. Eng. Chem. Res., 2012, 51, 807.
[6] S. Zhang, S. Dou, R. H. Colby, J. Runt, J. Non-Cryst. Solids, 2005, 351, 2825.
[7] R. J. Sengwa, S. Sankhla, Colloid. Polym. Sci., 2007, 285, 1237.

International Journal of Research in Modern Engineering and Emerging Technology (IJRMEET) UGC Approved id_47203
Vol. 5, Sp. Issue: 9, Sept.: 2017 (IJRMEET) ISSN: 2320-6586
290 Online International, Refereed, Impact factor & Indexed Monthly Journal www.raijmr.com
RET Academy for International Journals of Multidisciplinary Research (RAIJMR)
Protein-ligand Docking Studiesof Novel Silver Complex of 4-Amino-
N-(4,6-dimethyl-2-pyrimidinyl)benzene sulfonamide
Bhavesh N. Socha2, Sachin B. Pandya2, Kaushik P. Chaudhary2, Khushbu k. Lalvani2, U. H. Patel1
X-ray Crystallographic Laboratory, Department of physics, Sardar Patel University Vallabh
vidhyanagar-388120, Gujarat, India.
Email: [email protected]
Abstract:
This paper deals with molecular docking studies of a novel Silver complex of4-Amino-N-(4,6-
dimethyl-2-pyrimidinyl)benzene sulfonamide (sulfamethazine)with (A) Dihydropteroate
synthase enzymes[ Plague (Yersinia Pestis)](1) 3TZF (2) 5JQ9.(B) Dihydropteroate synthase
enzymes (Homo sapiens) – (1) 4J7U (2) 4HWK.The Molecular Docking performed using a
software package from Schrödinger. Hydrogen-bonding interactions of the title molecule with
the amino acids of the target protein have been analyzed.
Key words: Molecular docking studies, Silver complex of sulfamethazine, hydrogen
bondInteractions, receptors.
Introduction:
Sulfonamides [1] are the first „chemotherapeutic‟ agents which are employed systematically for
the prevention and cure of bacterial infections in human beings also used in the treatment of
inflammatory bowel disease. Sulfa drugs are bacteriostatic. They act by interfering with the
synthesis of folic acid (folate), a member of the vitamin B complex present in all living cells.
Most bacteria make their own folic acid from simpler starting materials; humans and other higher
animals, however, must obtain folic acid in the diet. Thus, sulfa drugs can inhibit the growth of
invading microorganisms without harming the host. Silver ions and silver compounds show a
toxic effect on some bacteria, viruses, algae and fungi, typical for heavy metals like lead or
mercury, this ion forms strong molecular bonds with other substances used by bacteria to respire,
such as molecules containing sulphur, nitrogen, and oxygen. When the Ag+ ion forms a complex
with these molecules, they are rendered unusable by the bacteria, depriving them of necessary
compounds and eventually leading to the bacteria's death. [1],

International Journal of Research in Modern Engineering and Emerging Technology (IJRMEET) UGC Approved id_47203
Vol. 5, Sp. Issue: 9, Sept.: 2017 (IJRMEET) ISSN: 2320-6586
291 Online International, Refereed, Impact factor & Indexed Monthly Journal www.raijmr.com
RET Academy for International Journals of Multidisciplinary Research (RAIJMR)
Sulfamethazine [1] as shown in Figure 1.1 is one of the active member of antibacterial
sulfonamides family. It has spectrum of antimicrobial action similar to other sulfonamides. The
Sulfamethazine (4-amino-N-(4, 6- dimethyl-2-pyrimidinyl) benzene sulfonamide) is commonly
incorporated into swine feed as promotants of growth and for control of certain diseases in
animals. Transition metal complex of sulfamethazine has been synthesized and its structure has
been reported by us. [2](M.phil. dissertation)
Figure 1.1 Sulfamethazine (SMZ)
Plague is a disease that affects humans and other mammals. It is caused by the bacterium,
Yersinia Pestis. Human usually get plague after being bitten by a rodent flea that is carrying the
plague bacterium or by handling an animal infected with plague. [3]
To correlate the structure-function relationship, we have carried out molecular docking studies of
the title molecule using glide docking module of Schrodinger software. The small molecule
called ligand usually interacts with protein‟s binding sites. Binding sites are areas of protein
known to be active in forming of compound. There are several possible mutual conformations in
which binding may occur. These are commonly called binding modes. It also predicts the
strength of the binding, the energy of the complex; the types of signal produced and calculate the
binding affinity between two molecules using scoring function. The most interesting case is the
type protein-ligand interaction, which has its applications in medicine. It aims to achieve an
optimized conformation for both the protein and ligand and relative orientation between protein
and ligand such that the free energy of the overall system is minimized. Molecular docking can
be referred as “lock and key” model [4]. Here the protein can be called as a lock and the ligand
can be called as key, which describes the best fit orientation of the ligand to which it goes and

International Journal of Research in Modern Engineering and Emerging Technology (IJRMEET) UGC Approved id_47203
Vol. 5, Sp. Issue: 9, Sept.: 2017 (IJRMEET) ISSN: 2320-6586
292 Online International, Refereed, Impact factor & Indexed Monthly Journal www.raijmr.com
RET Academy for International Journals of Multidisciplinary Research (RAIJMR)
binds to a particular protein. To perform a docking study, in which the protein structure and
ligand are the inputs and the protein structure data used to be collected from PDB(Protein Data
Bank).
Our interest has focused biological response of novel title molecule shown in Figure 1.2. The
biological activity gets enhanced on undergoing complexation with metals. Several metal
complexes of sulfonamides showed higher activity than free ligand. In this paper the study of
molecular docking has been carried out for the two different types of protein (Yersinia Pestis)and
Homosepiance)[5, 6] in which glide energy, docking score, hydrogen bond interactions and types
of interactions has been presented in Table 1.and compared.
Figure 1.2 Silver complex of sulfamethazine
Materials and methods:
Methodology:
In the present study, we carried out the docking studies of transition metal complex of
sulfamethazine with target proteins (A) Dihydropteroate synthase enzymes[ Plague (Yersinia

International Journal of Research in Modern Engineering and Emerging Technology (IJRMEET) UGC Approved id_47203
Vol. 5, Sp. Issue: 9, Sept.: 2017 (IJRMEET) ISSN: 2320-6586
293 Online International, Refereed, Impact factor & Indexed Monthly Journal www.raijmr.com
RET Academy for International Journals of Multidisciplinary Research (RAIJMR)
Pestis)] (1) 3TZF (2) 5JQ9.(B) Dihydropteroate synthase enzymes (Homo sapiens) – (1) 4J7U
(2) 4HWK which were extracted from PDB. The Protein Data Bank (pdb) is the single, global
archive for information about the 3D structure of bio macromolecules and their complexes, as
determined by X-ray crystallography, NMR spectroscopy and includes more than a few Nobel
Prize winning structures. The crystal structure of the target protein, (A) Dihydropteroate
synthaseenzymes [Plague (Yersinia Pestis)] (1) 3TZF (2) 5JQ9 (B) Dihydropteroate synthase
enzymes (Homo sapiens) – (1) 4J7U (2) 4HWK are downloaded from the PDB with the specific
resolution.
PREPARATION OF PROTEIN
A typical PDB structure file consists only of heavy atoms and may include water molecules,
metal and ions. Some structures are multimeric, and may need to be reduced to a single unit. In
Schrödinger package a set of tools are accumulated to prepare proteins in a form that is suitable
for modeling calculations.
PREPARATION OF LIGAND:
The Schrödinger ligand preparation product LigPrep is designed to prepare different
conformations of the title molecule.
GLIDE GRID GENERATION:
Glide (Grid-based Ligand Docking with Energetics) is a ligand binding tool provided by
Schrödinger package that searches for favorable interactions between one or more ligand
molecules and a receptor molecule, usually a protein. It provides a complete solution for ligand-
receptor docking. The combination of position and orientation of a ligand relative to the receptor,
along with its conformation in docking, is referred to as a ligand pose. The ligand poses that
Glide generates pass through a series of hierarchical filters that evaluate the ligand‟s interaction
with the receptor. Finally, the minimized poses are re-scored to generate the Glide score (G
score) that is the sum of total various figures generated for each ligand during the docking
process. The scoring function (G score), for computing binding affinity is an extension of an
empirically based Chem-Score function of Eldridge et al. [7]. The best G Score is obtained as the

International Journal of Research in Modern Engineering and Emerging Technology (IJRMEET) UGC Approved id_47203
Vol. 5, Sp. Issue: 9, Sept.: 2017 (IJRMEET) ISSN: 2320-6586
294 Online International, Refereed, Impact factor & Indexed Monthly Journal www.raijmr.com
RET Academy for International Journals of Multidisciplinary Research (RAIJMR)
most negative and the most active ligands in terms of G Score are enlisted in descending
order.[8, 9]
Results and Discussion:
Molecular Docking
Molecular docking predicts the binding strength of ligand with different receptors. GLIDE
docking method has been applied to build a binding affinity model for the title molecule with
different protein complexes. The binding is predicted with help of mainly three parameters Glide
score, Glide energy and H-bond interactions. On the basis of these parameters the binding
affinity of ligand towards the receptors are discussed. The more negative value of G-score
indicates the good binding affinity of the ligand with particular protein. The minimum energy for
the formation of complex between ligand and receptor indicates the good binding affinity. More
number of H-bond interactions in the structure revealsligand having good binding mode to
receptor.
Here, silver complex of sulfamethazine is docked with (A) Dihydropteroate synthaseenzymes
[Plague (Yersinia Pestis)] (1) 3TZF (2) 5JQ9. (B) Dihydropteroate synthase enzymes (Homo
sapiens) – (1) 4J7U (2) 4HWK. Docking results are tabulated in Table 1, which clearly reflects
that Silver complex of sulfamethazine molecule binds well with 4HWK receptor
The title molecule is found to have high docking score of -6.0and energy -46.4 kcal/mol with
4HWK receptor. The 5JQ9 receptor gives G-score of -4.0with glide energy -35.8kcal/mol. The
title molecule interacts with 4HWK and 5JQ9 proteins at sites: SER222, ASP214 and ASP212,
(Figure 3). In addition, 4HWK receptor forms hydrogen bond interaction via HID1048 with
pyrimidine nitrogen of SMZ molecule. The binding sites of 4HWK and 5JQ9 proteins after
GLIDE docking with title molecule are depicted in Figure 3 and Figure 4represents hydrogen
bond interactions between 4HWK and 5JQ9 receptors with title molecule.
.

International Journal of Research in Modern Engineering and Emerging Technology (IJRMEET) UGC Approved id_47203
Vol. 5, Sp. Issue: 9, Sept.: 2017 (IJRMEET) ISSN: 2320-6586
295 Online International, Refereed, Impact factor & Indexed Monthly Journal www.raijmr.com
RET Academy for International Journals of Multidisciplinary Research (RAIJMR)
Table 1: Docking results of Silver complex of Sulfamethazine molecule with different
receptors
Protein Receptors
Glide
Score
Glide
energy H-Bond Interactions
Hydrophobic
Interaction
Yersinia
Pestis
(1)3TZF
-2.1
-41.6
(1)N-H.....O
(SER222)
= 1.91Ǻ
(2)O-H…O
(SER222)
=2.84Ǻ
(3)N-H…O
(SER222)
=3.15Ǻ
PRO64,
MET148,
PHE188,
PHE190,
PHE28
(2) 5JQ9
-4.0
-35.8
(1)N-H.....O
(GLU122)
= 2.82Ǻ
(2)N-H…O
(GLU68)
=2.82Ǻ
(3)N-H…O
(GLU68)
=3.02Ǻ
(4)N-H…O
(GLU68)
=2.91Ǻ
nil
Homo
sapiens
(3)4J7U
-5.4
-29.3
(1)N-H.....O
(ASP254)
= 2.73Ǻ
PRO195,
TYR167
CYS156
ALA194
LEU155
(4) 4HWK
-6.0
-46.4
(1)N-H.....O
(ASP212)
= 2.96Ǻ
(2)O-H…O
(ASP214)
=3.72Ǻ
(3)N-H…O
(ASP214)
=3.55Ǻ
PRO160
CYS156
LEU155
PRO197
LEU219

International Journal of Research in Modern Engineering and Emerging Technology (IJRMEET) UGC Approved id_47203
Vol. 5, Sp. Issue: 9, Sept.: 2017 (IJRMEET) ISSN: 2320-6586
296 Online International, Refereed, Impact factor & Indexed Monthly Journal www.raijmr.com
RET Academy for International Journals of Multidisciplinary Research (RAIJMR)
Figure 3: The binding sites of Silver complex of sulfamethazine with (a, b) 4HWK (c) 4J7U

International Journal of Research in Modern Engineering and Emerging Technology (IJRMEET) UGC Approved id_47203
Vol. 5, Sp. Issue: 9, Sept.: 2017 (IJRMEET) ISSN: 2320-6586
297 Online International, Refereed, Impact factor & Indexed Monthly Journal www.raijmr.com
RET Academy for International Journals of Multidisciplinary Research (RAIJMR)
(d, e) 3TZF (f) 5JQ9 of the protein receptors after GLIDE docking

International Journal of Research in Modern Engineering and Emerging Technology (IJRMEET) UGC Approved id_47203
Vol. 5, Sp. Issue: 9, Sept.: 2017 (IJRMEET) ISSN: 2320-6586
298 Online International, Refereed, Impact factor & Indexed Monthly Journal www.raijmr.com
RET Academy for International Journals of Multidisciplinary Research (RAIJMR)
Figure 4: Interaction of Silver complex of sulfamethazine with (a) 4HWK (b) 4J7U
(c, d, e) 3TZF (f) 5JQ9 receptors
Conclusion:
The title molecule Silver complex of Sulfamethazine (SMZ) has been docked with different
receptors. Docking results reveals that the title molecule has the lowest Glide score of-6.0 and
Lowest Glide energy with the receptor-46.4.
Acknowledgement:
Authors are thankful to UGC New Delhi for financial assistance under DSA-1 program procures
Schrodinger maestro docking software.
Reference list
1. www.wikipedia.com
2. Bhavesh N.Socha, M.Phil./Dissertation,Sardar Patel University(Vallabh Vidhyanagar, India
, June-2017)
3. CDC. Plague. Atlanta, GA: US Department of Health and Human Services, CDC; 2015.
Available at http://www.cdc.gov/plague/
4. .D. B. Kitchen, H. Decornez, J. R. Furr, J. Bajorath, Nature reviews Drug discovery, 2004,
3(11), 935.
5. W. L. Jorgensen, Science, 1991, 254 (5034), 954.

International Journal of Research in Modern Engineering and Emerging Technology (IJRMEET) UGC Approved id_47203
Vol. 5, Sp. Issue: 9, Sept.: 2017 (IJRMEET) ISSN: 2320-6586
299 Online International, Refereed, Impact factor & Indexed Monthly Journal www.raijmr.com
RET Academy for International Journals of Multidisciplinary Research (RAIJMR)
6. Mi-Kyung Yun1, Yinan Wu1,2, Zhenmei Li1, Ying Zhao3, M. Brett Waddell4, Antonio M.
Ferreira1,5, Richard E. Lee3, Donald Bashford1,2, Stephen W. White1,2, Science 02 Mar
2012, 335, 6072, 1110-1114.
7. Hirohito Haruki, Miriam Grønlund Pedersen, Katarzyna Irena Gorska, Florence Pojer, Kai
Johnsson,Science, 24 May 2013, 340, 6135, 987-991.
8. ELDRIDGE, M.D., C.W. MURRAY, T.R. AUTON, G.V. PAOLINI, R.P. MEE, Empirical
scoring functions: empirical scoring function to estimate the binding affinity of ligands in
receptor complexes, J. Comput. Aided. Mol. Des., 1997, 11, 425–445.
9. GOHLKE, H., G. KLEBE, Approaches to the description and prediction of the binding
affinity of small-molecule ligands to macromolecular receptors, Angew. Chem. Int. Ed..,
2002, 41, 2644–2676.

International Journal of Research in Modern Engineering and Emerging Technology (IJRMEET) UGC Approved id_47203
Vol. 5, Sp. Issue: 9, Sept.: 2017 (IJRMEET) ISSN: 2320-6586
300 Online International, Refereed, Impact factor & Indexed Monthly Journal www.raijmr.com
RET Academy for International Journals of Multidisciplinary Research (RAIJMR)
Elastic Properties of Mg65Cu25Tb10 Bulk Metallic
Glass Using Pseudopotential Theory
A .C. Khunt#1
, D. D. Satikunvar1, R .H. Joshi
1, N. K. Bhatt
2 and B. Y. Thakore
1
1Department of Physics, Sardar Patel University, Vallabh Vidynagar-388120, Gujarat 2 Department of Physics, M. K. Bhavanagr University, Bhavanagr -364001, Gujarat
#Corresponding author email: [email protected]
Abstract: The phonon dynamics of Mg-based Bulk metallic glass(BMG) has been reported
through this paper. Longitudinal and Transverse modes for phonon eigen frequencies were
studied using the approach proposed by Hubbard-Beeby. Further to calculate the ion-ion
interaction we have used our recently proposed local pseudopotential. In the present study we
have calculated the elastic properties of Mg65Cu25Tb10. Along with the phonon frequencies
different elastic properties are also evaluated. Five different forms of the static local field
correction functions, viz., Hartree (H), Taylor (T), Ichimaru and Utsumi (IU), Farid (F) and
Sarkar and Sen.(S) are employed to investigate the influence of the screening effect on the
vibrational dynamics of Mg65Cu25Tb10 BMG . Result for bulk modulus, modulus of rigidity,
Poisson’s ratio, Young modulus, propagation velocity of elastic waves and dispersion curves
are studied. Good agreement of presented results and others findings confirms the use of our
model pseudopotential to study elastic properties of such a glassy system.
Keywords: elastic constant, pseudopotential.
Introduction
Atoms inside the matters always perform the motion. However, the interaction among
the atoms results into the cooperative motion. These motion of the atoms are provides base to
the macroscopic dynamics of liquids and solids. As we know that the main boundary between
the solid and liquid is periodicity of atoms. Liquids or amorphous structure both has the short
range order [1]. BMG matrix materials are fast developing and promising materials in
modern industry. Bulk metallic glasses have found wide ranging application in the field of
materials science and engineering during the last three decades [2,3]. Such solids have
electronic properties normally associate with metals but atomic arrangement is not spatially
periodic. Ternary metallic glasses made up of components of simple metals provide us with
physically interesting systems for theoretical investigations. Bulk metallic glasses usually
show high strength, large elastic limit and excellent wear and corrosion resistances along with

International Journal of Research in Modern Engineering and Emerging Technology (IJRMEET) UGC Approved id_47203
Vol. 5, Sp. Issue: 9, Sept.: 2017 (IJRMEET) ISSN: 2320-6586
301 Online International, Refereed, Impact factor & Indexed Monthly Journal www.raijmr.com
RET Academy for International Journals of Multidisciplinary Research (RAIJMR)
other remarkable engineering properties. Researchers have developed families of binary and
multicomponent systems [4,5] to from BMGs. Appreciating the continuous success of
applicability of pseudopotential in the study of metallic glasses we thought it worthwhile to
test a typical local pseudopotential. Hence in the present work we have proposed such
application of model pseudopotential. Deviating from a routine approach we have made use
of five prominent screening functions to examine the relative influence of exchange and
correlation effects. This has been carried out by studying collective modes and elastic
properties of Mg65Cu25Tb10 glass.
Computational Methodology
Very first ingredient to calculate the different properties of the matter is the interaction
among the atoms inside the matter. This interaction between the atoms is calculated using the
different form of pair potential. There are many methods are present to calculate the pair
potential, among all of them one is the simplest method is pesudopotential method [6,7]. In
this study we have calculate the pair potential using two different form of pseudopotential.
The first form is recently proposed by us, which is referred as model potential-1 (MP-1),
while another form is referred as model potential-2 (MP-2). Eq.(1) and Eq.(2) represents the
form of MP-1 and MP-2 respectively, in r-space. The core radius Rc is potentail parameter
and calculated as given in Ref [8]. Here, Z and e represent effective valance and electronic
charge, respectively, for model potential 1, the whole effective region is splitted into two
parts which satisfies the boundary conditions. We have included both the feactures of the
pseudopotential cancellation as well as remaining interaction around the ion. Inside the core
region cancellation effect is more and become weaker. A study of form factor gives correct
limiting value of −2
3kf2 as q→0 which is required for local pseudopotential. The most
interesting feature is that this present potential is applicable to almost all metal in periodic
table.
For model potential-2, Inside the core −𝑧𝑒2
𝑟 coloumbian term is modified by
exponential term. At r→0, it approches a constant value of −𝑧𝑒2
𝑅𝑐 and outside the core it
retains the coloumbian term.

International Journal of Research in Modern Engineering and Emerging Technology (IJRMEET) UGC Approved id_47203
Vol. 5, Sp. Issue: 9, Sept.: 2017 (IJRMEET) ISSN: 2320-6586
302 Online International, Refereed, Impact factor & Indexed Monthly Journal www.raijmr.com
RET Academy for International Journals of Multidisciplinary Research (RAIJMR)
c
2
c
R
r
2
c
2
cc
2
Rr r
Ze
Rr eR
r
R
2r
R
eZe W(r) c
(1)
c
2
c
22
Rr r
Ze
Rr expZe
) W(r
Rc
r
rr
Ze
(2)
Since all physical properties can be computed within the pair potential formalism, based on
these model potentail-1 and potential-2, an effective pair potential Veff is calculated. This
allows us to compute ωE2 , where, ωE is the maximum phonon frequency.
(3)
In equation (3), g(r) is pair correlation function.
0
dq qrsin 1qS qr 2π
Ω1rg
(4)
The upper limit in the integration is decided by the length of g(r) in the computation. Meff is
the effective atomic mass and 𝜌eff is the effective number density. The input parameters used
in the calculation are show in Table 1.
The longitudinal and transverse phonon frequencies in Hubbard and Beeby [9,10] approach
are given by following equations.
(5)
(6)
2 2
L E 2 3
3sin(q ) 6cos(q ) 6sin(q )q 1
q q q
2 2
T E 32
3cos(q ) 6sin(q )q 1
(q ) q
2 2effE eff
0eff
4g r r V r dr
3M

International Journal of Research in Modern Engineering and Emerging Technology (IJRMEET) UGC Approved id_47203
Vol. 5, Sp. Issue: 9, Sept.: 2017 (IJRMEET) ISSN: 2320-6586
303 Online International, Refereed, Impact factor & Indexed Monthly Journal www.raijmr.com
RET Academy for International Journals of Multidisciplinary Research (RAIJMR)
Since in the long wavelength limit the phonon dispersion curves show elastic
behaviour, which permits us to write the longitudinal 𝜐l and transverse 𝜐t sound velocities
using the expressions
l q
and t q
Therefore,
𝜔𝑙 = 𝜐𝑙𝑞 and 𝜔𝑡 = 𝜐𝑡𝑞 (7)
The elastic properties such as bulk modulus BT, rigidity modulus G, Poisson's ratio ξ, Young's
modulus Y and Debye temperature θD are computed using the following expressions
depending on longitudinal 𝜐l and transverse 𝜐t sound velocities as [11]
𝐵𝑇 = 𝜌 𝑣𝑙2 −
4
3𝑣𝑡2 (8)
𝜉 = 1−2
𝑣𝑡2
𝑣𝑙2
2−2 𝑣𝑡2
𝑣𝑙2
(9)
(10)
𝐺 = 𝜌𝑣𝑡2
𝑌 = 2𝐺 𝜉 + 1 (11)
11
33
D 3 3
B l t
h 9 1 2
k 4 v v
(12)
Where 𝜌 is the isotropic density, h is Planck's constant and KB is Boltzman's constant.

International Journal of Research in Modern Engineering and Emerging Technology (IJRMEET) UGC Approved id_47203
Vol. 5, Sp. Issue: 9, Sept.: 2017 (IJRMEET) ISSN: 2320-6586
304 Online International, Refereed, Impact factor & Indexed Monthly Journal www.raijmr.com
RET Academy for International Journals of Multidisciplinary Research (RAIJMR)
Result and Discussion
Input parameter used in the calculations is given in table no.i. The longitudinal and transverse
phonon frequencies are shown in figure 1 and 2 for both potential. It is seen form the results
of phonon frequencies that the nature of peak positions are not much affected by different
screening functions. here two different potential are used with the five local field corrections
functions due to [12-16] to generate pair potential.
Table i. Input parameter of Mg65Cu25Tb10 BMG
It is obvious from the figures that the oscillations are prominent in the longitudinal
mode, which indicated that the collective excitations at larger wave vector transfer due to the
dispersion of longitudinal excitation. On the other hand the transverse modes undergo larger
thermal modulation due to the anharmonicity of the vibrations in the alloys. It can also be
seen that the first minimum in longitudinal branch of the dispersion curve falls at a value
q≈0.75Å-1
in the model potential 1 and 2. In the long wavelength limit the dispersion curves
are linear and confirming characteristics of elastic waves. Thephonon dispersion curves
(PDC)for transverse phonons attain maxima at a higher q value than the longitudinal phonon
curves.
Fig.1: Longitudinal phonon frequency using MP-1 Fig .2: Transverse phonon frequency using MP-1
Parameter Z Ωeff
[au]3
rc
[au]
Meff
[amu]
Mg65Cu25Tb10 2.65 161.52 1.24 47.77

International Journal of Research in Modern Engineering and Emerging Technology (IJRMEET) UGC Approved id_47203
Vol. 5, Sp. Issue: 9, Sept.: 2017 (IJRMEET) ISSN: 2320-6586
305 Online International, Refereed, Impact factor & Indexed Monthly Journal www.raijmr.com
RET Academy for International Journals of Multidisciplinary Research (RAIJMR)
Figure.3: Longitudinal phonon frequency using MP-2 Figure 4: Transverse phonon frequency using MP-2
Presently calculated bulk modulus BT, rigidity modulus of G, Poisson's ratio Poisson's ratio ξ,
Young's modulus Y and Debye temperature θD of ternary of liquid alloys are listed in Table
II.
From the table, one can see that by using the H, S, T, IU and F screening functions,
the results are very close to one another as compared to the F screening function. From the
slope of phonon dispersion curve at q ≈ 0, the bulk modulus and other elastic properties are
computed; we see that value of bulk modulus is cloase to experiemental value for both the
potential when employed with Ichimaru and Utsumi screening function.
Table II: Elastic properties (First and Second entries show results for MP-1 and MP-2).
Potential 𝜐l
(105cm/s)
𝜐t
(105cm/s)
BT
(Gpa)
G
(Gpa)
ξ
Y
(Gpa)
θD (K)
Expt.[17] 4.22 2.22 44.70 19.60 0.309 51.30 272.90
Hartree (H)
[12]
MP-1
MP-2
3.78
2.80
2.18
1.62
68.49
37.75
15.80
87.35
0.25
0.25
39.51
21.78
250.63
186.0
Sarkar et al.
(S)[13]
MP-1
MP-2
3.45
2.49
1.99
1.43
56.95
29.75
13.14
68.66
0.25
0.25
32.85
17.16
228.55
165.20
Taylor (T)[14] MP-1
MP-2
3.83
2.62
2.21
1.52
70.24
33.2
16.20
87.35
0.25
0.25
40.52
19.16
253.82
174.56
Ichimaru and
Utsumi(IU)[15]
MP-1
MP-2
3.02
2.80
1.74
1.62
43.72
37.71
10.08
87.25
0.25
0.25
25.22
21.75
200.25
185.98
Farid et al (F)
[16]
MP-1
MP-2
4.22
2.98
2.44
1.78
85.58
46.52
19.76
96.20
0.25
0.25
49.35
28.63
280.17
223.20

International Journal of Research in Modern Engineering and Emerging Technology (IJRMEET) UGC Approved id_47203
Vol. 5, Sp. Issue: 9, Sept.: 2017 (IJRMEET) ISSN: 2320-6586
306 Online International, Refereed, Impact factor & Indexed Monthly Journal www.raijmr.com
RET Academy for International Journals of Multidisciplinary Research (RAIJMR)
The same conclusion can be drawn for other elastic properties as well, except for Poisson
ratio. Experimental Poisson ratio is as high as 0.309, whereas the present calculation predicts
its value as 0.25 ( same for all screening functions and both potentails upto third digit).
Calculated elastic constants due to HB approach are in agreement with the available
experiment data.
Conclusion
Finally, we conclude here that the PDC generated from the HB approach reproduces
sastifactorily general characteristics of dispersion curves. We have studied the collective
dynamics of Mg65Cu25Tb10 BMG using two Pseudopotential. The computed dispersion
curves show all broad features of collective excitation in the system studied here by both the
potentials. The overall picture reveals the importance of local field correction function. it is
seen that the peak position are not affected much by the different screening functions. The
oscillations are more prominent in the longitudinal modes as compared to transverse modes.
This shows the existence of collective excitations at larger momentum transfer due to
longitudinal modes only and the instability of the transverse modes due to anharmonicity of
the atomic vibration in bulk metallic system. Screening function due to Farid et al gives good
overall results compared to other screening functions. Further, elastic constant have
calculated which are in good agreement with the experimental data. We therefore conclude
that both the potentials with proper choice of the parameter in presence of the employed
screening functions may give good vibrational and elastic properties.
References
[1] T. A. Jr and T. Masumoto, J. Phys. Con. Matt., 1995, 7, 1525.
[2] W.L. Johnson MRS Bull. 1999,24, 42.
[3] A. Inoue Acta Mater., 2000, 48, 279 2000.
[4] A. Peker and W. L. Johnson Appl. Phys. Lett., 1993, 63, 2342.
[5] V. Ponnambalam, S. J. Poon, and G. J. Shiflet J. Mater. Res., 2004, 19, 1320.
[6] W. A. Harrison, "Pseudopotential in the theory of metals" W A Benjamin Pub. Co., New
York, 1967.
[7] E. Fermi, Ricerca Sci., 1936, 7, 13.
[8 V. Heine, M. L. Cohen and D. Weaire Solid state Phy., 1970, 24, 249.
[9] J. Hubbard and J. L. Beeby J.Phys., 1969, 2, 556.

International Journal of Research in Modern Engineering and Emerging Technology (IJRMEET) UGC Approved id_47203
Vol. 5, Sp. Issue: 9, Sept.: 2017 (IJRMEET) ISSN: 2320-6586
307 Online International, Refereed, Impact factor & Indexed Monthly Journal www.raijmr.com
RET Academy for International Journals of Multidisciplinary Research (RAIJMR)
[10] P. B. Thakore, P. N. Gajjar, and A. R. Jani, Comm in Phy., 2004, 14, 15.
[11] A. K. Varshneya, A. N. Sreenam and S. R.Swiller Phys.Chem. Glasses., 1993, 34, 179.
[12] W. A. Harrison, Phys. Stat. Sol. B., 1969, 181, 1036.
[13] A. Sarkar, D. S. Sen, S. Haldar, D. Roy Mod. Phys. Lett. B., 1998, 12, 639.
[14] R. Taylor, J. Phys.F, 1981, 8, 1699.
[15] S. Ichimaru and K.Utsumi,P hys. Rev. B., 1981, 24, 3220.
[16] B. Farid, V. Heine, G. E. Engel and I. S. Robertson, Phys. Rev., 1993, 48, 11602.
[17] W. H. Wang, F. Y. Li, M. X. Pan, D. Q. Zhou and R. J. Wang, Acta Materialia, 2004,
52, 715.
.

International Journal of Research in Modern Engineering and Emerging Technology (IJRMEET) UGC Approved id_47203
Vol. 5, Sp. Issue: 9, Sept.: 2017 (IJRMEET) ISSN: 2320-6586
308 Online International, Refereed, Impact factor & Indexed Monthly Journal www.raijmr.com
RET Academy for International Journals of Multidisciplinary Research (RAIJMR)
The Theoretical Study of Electron Dispersion Curves of Some
Divalent and Trivalent Rare Earth Metals
Hiral Patel1, A. B. Patel
2, N. K. Bhatt
3, P. R. Vyas
4 and V. B. Gohel
5
1Ahemdabad Institute of Technology, Ahmedabad-380060, Gujarat, India.
3Department of Physics, M. K. Bhavanagar University, Bhavanagar - 364001, Gujarat, India.
2,4,5 Department of Physics, School of Sciences, Gujarat University, Ahmedabad - 380009, Gujarat, India.
Abstract
We have used a pseudopotential having two parameters for the theoretical study of electronic
energy employing second order perturbation theory for some divalent (Eu and Yb) and
trivalent (La, Ce and Gd) rare earth metals. We have carried out theoretical study of electron
dispersion curves (E(k)→k), Fermi energy (EF) and density of states at Fermi energy (N(EF)).
The order of the magnitude of all physical properties is in accordance with previously
computed results for simple metals. Such theoretical results will be helpful for the
understanding of many liquid state properties like free energy of electron gas, entropy,
thermal conductivity etc. of liquid metals.
Keywords - Liquid rare earth metals; local pseudopotential; electron dispersion; Fermi
energy and density of states.
I. Introduction
The rare earth elements have proven of increasingly great commercial value. The demand of
rare earth elements has been increased because of the technological uses like hybrid engines,
metal alloys, lasers, fluorescent lamps, ceramics and magnets [1]. The rare-earth metals form
a series of elements with almost identical chemical properties. When electrons are added to
these atoms, as the nuclear charge is increased, they go into the 4f shell, and since this shell
lies in the interior of the xenon core region, the bulk properties of the metals are thereby
essentially unchanged. In most of the geological settings, rare earth elements (La, Ce, Gd, Eu
and Yb) are of great importance as they help in the understanding of wide variety of
geological, geochemical and cosmochemical processes that take place on Earth, other planets
and other planetary bodies.
This is however, due to the occurrence of different types of electronic configurations of the
rare earths. La, Ce and Gd hold [Xe]5d1 6s
2, [Xe]4f
15d
1 6s
2 and [Xe] 4f
75d
1 6s
2 (trivalent)
electronic configurations respectively, while Eu and Yb have [Xe] 4f76s
2 and [Xe] 4f
146s
2
(divalent) electronic configurations respectively. In the solid phase, however, most of the

International Journal of Research in Modern Engineering and Emerging Technology (IJRMEET) UGC Approved id_47203
Vol. 5, Sp. Issue: 9, Sept.: 2017 (IJRMEET) ISSN: 2320-6586
309 Online International, Refereed, Impact factor & Indexed Monthly Journal www.raijmr.com
RET Academy for International Journals of Multidisciplinary Research (RAIJMR)
elements are found in the trivalent configuration, and therefore in the condensation of the
atoms one of the 4f electrons has been promoted into the 5d state. In solid state, only
europium and ytterbium remain in a divalent state [2]. If the behaviour of the rare earth
elements is known, some of their metallic properties can be predicted with good degree of
success. The studies of liquid metal resistivity using Ziman’s nearly free electron approach
have been carried out by many researchers [3-6]. It is also found that the order of magnitude
of liquid metal resistivity of some transition metals Mn, Fe and Co is same as that of La, Ce,
Gd and Yb. In case of Eu, the value of the liquid metal resistivity is found to be higher which
is same as that of liquid Ba [7].
Looking to all aforesaid facts, researchers are interested in the study of liquid state properties
of this group of metals. In order to carry out study of physical properties of materials, one
must have enough knowledge about all electron-ion interactions (pseudopotential). The study
of metallic properties using pseudopotential helps to understand interactions persisting in the
corresponding solid metals. The study of comprehensive physical properties (static, lattice-
dynamical and transport) using pseudopotential is found to be very well. For such study the
parameters of the pseudopotential must be determined from most general method. Pollack et.
al. [8] have mentioned that the study of liquid state properties using ab-intio method is
difficult and pseudopotential method has proven to be successful. The study of electron
dispersion curves kkE will help to understand energy distribution in Brillouin Zone.
For such study, one must require knowledge of structure factor and screened electron-ion
interaction. To the best of our knowledge, such study is limited up to simple metals.
Looking to the importance and need of the theoretical predication of electron dispersion, in
the present communication, we have studied electron dispersion curve of liquid rare earth
metals. In our previous paper [10], we have used local pseudopotential due to Kumar [9] and
calculated liquid metal resistivity using nearly free electron Ziman’s approach. In the present
paper, alongwith electron dispersion curves, we have studied density of states at Fermi
energy FEN .
II. Theory
In the framework of second order perturbation theory, the electronic structure of a liquid
metal is sum of ground state energy E0 and first and second order corrections to the energy E1
and E2, which is given in atomic unit as,

International Journal of Research in Modern Engineering and Emerging Technology (IJRMEET) UGC Approved id_47203
Vol. 5, Sp. Issue: 9, Sept.: 2017 (IJRMEET) ISSN: 2320-6586
310 Online International, Refereed, Impact factor & Indexed Monthly Journal www.raijmr.com
RET Academy for International Journals of Multidisciplinary Research (RAIJMR)
22
2
2*
qkk
qVqSqSkqVkkkE (1)
Here kqVk )( is the matrix element of pseudopotential form factor between two zeroth
order plane waves which gives first order correction to the energy and qV is the screened
pseudopotential qqVqV ion
Here q is modified Hartree dielectric function which is expressed as,
qYqHq 11
and qY is exchange and correlation function. We have used Hubbard-Sham exchange and
correlation function [11, 12].
In the present study, we have used bare-ion pseudopotential qVion due to Kumar [9] which
has following form in a.u
ZqRqRqRqRRqRRq
eZqR
q
eZqV ccccc
mc
mion
cos2sin2cos4
cos4 22
4
0
2*
2
0
2*
cmmmcc
m
qRqRqRqRqRqRRq
eZsinsincoscos
43
0
2*
(2)
In case of liquid metals, eq. [1] becomes [13-14],
02 kkkE (3)
Where,
0
2
2
2ln
8
3dq
qk
qkqqVqS
kEk
Zk
FF
(4)
and
(5)
Here Fk is the Fermi momentum, FE is the Fermi energy and qS is the structure factor.
We have used Percus-Yevick form with packing fraction .45.0
III. Result and discussion
In the present study, we have used pseudopotential due to Kumar [9]. In our previous paper,
[10] we have calculated liquid metal resistivity of La, Ce, Gd, Eu and Yb metals using nearly
dqqVqSkEk
Z
FF
0
2
2
30

International Journal of Research in Modern Engineering and Emerging Technology (IJRMEET) UGC Approved id_47203
Vol. 5, Sp. Issue: 9, Sept.: 2017 (IJRMEET) ISSN: 2320-6586
311 Online International, Refereed, Impact factor & Indexed Monthly Journal www.raijmr.com
RET Academy for International Journals of Multidisciplinary Research (RAIJMR)
free electron Ziman’s approach. The pseudopotential parameters Rc (core radius) and some
atomic radius-Rm were determine in the previous paper [10]. In the present study, we have
used the same set of parameters. The presently used pseudpotential is discontinuous in r-
space while continuous in q-space. We have also presented variations of screened
pseudopotential FkqqV for all metal [10]. In the present study we have calculated
0 kkE using equations 3, 4 and 5 as a function of k up to k=4kF which are
shown in figures 1-5 for all the metal studied.
For calculation of electron dispersion, the behaviour of the screened pseudopotential must be
smooth in the sense that it should be wiggle-less. Such behaviour is found in presently used
screened pseudopotentials for all the metals studied. Here we would like to point out that no
extra term is used to make the pseudopotential zero. For the calculation of k, one has to
evaluate integration precisely due to presence of logarithmic term which depends on q as well
as k. Such term has highly oscillatory behaviour. In the present study, evaluation of
-2
-1.5
-1
-0.5
0
0.5
0 10 20 30 40 50
ΔE
(k)(
10
-12
erg)
k(Å-1)
Fig: 1 Electron Dispersion for Lanthanum
-2
-1.5
-1
-0.5
0
0.5
0 10 20 30 40 50Δ
E(k
)(1
0-1
2er
g)
k(Å-1)
Fig:2 Electron Dispersion for Cerium
-2.5
-2
-1.5
-1
-0.5
0
0.5
0 10 20 30 40 50
ΔE
(k)(
10
-12
erg)
k(Å-1)
Fig:3 Electron Dispersion for Gadolinium
-1-0.8-0.6-0.4-0.2
00.20.4
0 10 20 30 40 50
ΔE
(k)(
10
-12
erg)
k(Å-1)
Fig: 4 Electron Dispersion for Europium
-0.6
-0.4
-0.2
0
0.2
0 10 20 30 40 50
ΔE
(k)(
10
-12
erg)
k(Å-1)
Fig: 5 Electron Dispersion for Ytterbium

International Journal of Research in Modern Engineering and Emerging Technology (IJRMEET) UGC Approved id_47203
Vol. 5, Sp. Issue: 9, Sept.: 2017 (IJRMEET) ISSN: 2320-6586
312 Online International, Refereed, Impact factor & Indexed Monthly Journal www.raijmr.com
RET Academy for International Journals of Multidisciplinary Research (RAIJMR)
integration has been carried out with upper limit q=80 kF in step of 0.1 kF. The calculated
electron dispersion curve, in absence of any experimental and other theoretical result may be
considered as a prediction which explains the behaviour of .kE
In the next step of calculation we have computed Fermi-energy by using following relations
in atomic unit.
02 FFF kkE
Fk can be obtained by replacing k with Fk in equation 4. The computed values of FE are
displayed in Table 1.
The density of states at Fermi energy FEN has been calculated by using following
equation,
1
2
2
dk
dE
n
kEN F
F
Where n = number of atoms per unit volume. The calculated values of FEN are also shown
in Table 1.
Table.1 The calculated values of Fermi energy (EF ) and density of states at Fermi level (N(EF))
Metal
EF (x 10-12
erg)
N(EF)(x 1011
(energy-atom)-1
)
La 18.3107 3.32099
Ce 18.9935 3.20160
Gd 18.3660 3.31098
Eu 14.2886 2.83722
Yb 15.1846 2.69588
The order of computed values of FEN is similar to those obtained by Srivastava [13] for
simple metals. The calculation of FEN at liquid density is important ingredient for the
theoretical understanding of many liquid state physical properties like free energy due to
electron gas, entropy, thermal conductivity etc. of liquid metals.
IV. Conclusions
The present study confirms that local pseudopotential with proper form of exchange and
correlation function can be used for the study of liquid state properties of transition and f-

International Journal of Research in Modern Engineering and Emerging Technology (IJRMEET) UGC Approved id_47203
Vol. 5, Sp. Issue: 9, Sept.: 2017 (IJRMEET) ISSN: 2320-6586
313 Online International, Refereed, Impact factor & Indexed Monthly Journal www.raijmr.com
RET Academy for International Journals of Multidisciplinary Research (RAIJMR)
shell metals with good degree of success. During literature survey, it has been observed by us
that many researchers have employed the method of adjusting the valency for the better
understanding of physical properties of this group of metals in solid and liquid phases. Such
study may also be carried out with the help of non-local pseudopotentials. But non-local
pseudopotentials are conceptually complicated and mathematically lengthy while local
pseudopotentials are computationally simple and physically more transparent alongwith their
accuracy. Looking to the success of present study, we would like to extend the presently used
pseudopotential for the study of electronic properties of liquid metal alloys.
Acknowledgements
Authors are thankful for the computational facilities developed using financial assistance
provided by Department of Sciences and Technology (DST), New Delhi through the DST-
FIST (level 1) project (SR/FST/PST-001/2006). One of the authors A. B. Patel is also
thankful to UGC BSR start up research grant.
References
[1] D. Atwood, The Rare Earth Elements: Fundamentals and Applications, United
Kingdom, Wiley Publications, 2012.
[2] B. Johansson and A. Rosengren, Phys. Rev. B, 1975, 11, 8, 2836.
[3] J. Gasser, J. Phys.: Cond. Matter, 2008, 20, 114103.
[4] A. B. Patel, N. K. Bhatt, B. Y. Thakore, P. R. Vyas and A. R. Jani, Molecular
Physics, 2014,112, 15, 2000.
[5] E. Apfelbaum, Phys. Che. of Liquids, 2010, 48, 4, 534.
[6] K. G. Bhatia, N. K. Bhatt, P R. Vyas and V. B. Gohel, AIP conference proceedings,
2015, 1665, 1, 110014.
[7] B. Delley and H. Beck, J.Phys. F: Metal Phys., 1979, 9, 3, 517.
[8] L. Pollack, J. P. Perdew, J. He, M. Marques, F. Nogueira and C. Fiolhais, Phys.
Rev. B, 1979, 55, 15544.
[9] J. Kumar, Solid State Comm., 1977, 21, 945.
[10] M. B. Pathak, N. K. Bhatt, P. R. Vyas and V. B. Gohel, Journal of international
academy of physical science, 2012, 16, 4, 1.
[11] J. Hubbard, Proc. Roy. Soc. A, 1958, 243,336.
[12] L. J. Sham, Proc. Roy. Soc. A, 1965, 283, 33.
[13] S.K. Srivastava, J. Phys. Chem. Solids, 1975, 36, 993.
[14] P. N. Gajjar, B. Y. Thakore and A. R. Jani, Acta Physica Polonica A, 1998, 94, 33.

International Journal of Research in Modern Engineering and Emerging Technology (IJRMEET) UGC Approved id_47203
Vol. 5, Sp. Issue: 9, Sept.: 2017 (IJRMEET) ISSN: 2320-6586
314 Online International, Refereed, Impact factor & Indexed Monthly Journal www.raijmr.com
RET Academy for International Journals of Multidisciplinary Research (RAIJMR)
Total Ionization cross sections of transition atoms
A. Y. Barot1#
, M.Y. Barot2 D.N. Bhavsar
3 and M. Vinodkumar
4
1# Sigma Institute of science and commerce, Vadodara-390001, gujarat, India
2Government Science College Gandhinagar-382016, Gujarat, India
31Bhavan‟s Sheth R. A. College of Science, Khanpur, Ahmedabad-380001, Gujarat, India
4 V. P. & R. P. T. P. Science College, Vallabh Vidyanagar – 388120, Gujarat, India
Corrosponding author: [email protected], Contact: 09601251449
ABSRACT: In this paper the detailed study on the electron scattering with metallic and transition
atoms are presented. Atoms are simpler in view of their well-studied structure and spherical shapes.
We have employed the Complex Optical Potential – ionization contribution (CSP-ic) method to
extract total ionization cross sections from total inelastic cross sections. We have compared our
results with the available theoretical as well as experimental data.
Key Words: Ionization cross sections, Spherical Complex Optical Potential (SCOP) Complex
Optical Potential – ionization contribution (CSP-ic)
Highlights:
Here we compute the total ionization cross sections of transition metals like Fe, Co, Ni, Cu,
Zn and other industrially important metals such as Al and Ga.
Complex Optical Potential – ionization contribution (CSP-ic) method is used to extract total
ionization cross sections from total inelastic cross sections.
PACS number(s): 34.80.Bm
1 INTRODUCTION
Atomic collision phenomena are of fundamental importance in atomic and molecular physics and
play an important role in other fields such as astrophysics, chemistry, plasma physics and laser
physics. The applications of electron impact total ionization cross section (Qion) data in the fields of
atmospheric sciences, astrophysical context and technological plasmas, radiation physics, mass
spectroscopy and semiconductor industry [1] have already been realized. However, the compilation

International Journal of Research in Modern Engineering and Emerging Technology (IJRMEET) UGC Approved id_47203
Vol. 5, Sp. Issue: 9, Sept.: 2017 (IJRMEET) ISSN: 2320-6586
315 Online International, Refereed, Impact factor & Indexed Monthly Journal www.raijmr.com
RET Academy for International Journals of Multidisciplinary Research (RAIJMR)
of all the required data in a single database is still a distant reality. One of the reasons for this is the
scarcity of cross section data for many targets like heavy atoms and exotic molecules and radicals.
Also, the reliability of the available data has been a major concern. Here we compute the total
ionization cross sections of transition metals like Fe, Co, Ni, Cu, Zn and other industrially
important metals such as Al and Ga. We present total ionization cross sections (Qion) of these
atomic targets from their ionization potential (IP) to 2keV incident electron energies.
The Spherical Complex Optical Potential (SCOP) [2, 3] and Complex Optical Potential – ionization
contribution (CSP-ic) method [4, 5] is used to extract total ionization cross sections from total
inelastic cross sections.
Many research groups have determined the electron impact total and ionization cross sections for
molecules [6, 7]. Kim and co-workers [8, 9], Deutsch and Märk [11] and Huo et al. [13] are
engaged in calculating total ionization cross sections. Many groups began by using the additivity
rule (AR) [14] to investigate ionization cross section data for molecules. The AR is a crude high
energy approximation in which the total ionization cross sections of molecules are a simple sum of
the Total Ionization Cross Sections (TICS) of its constituent atoms. This has led to different
variants called modified additivity rules (MAR) [12]. MAR could produce much better results than
AR, but still lacks reliability. This reasons motivated us to pursue a better method, which is more
reliable and easy to handle.
Aluminium (Al) is a silvery white metal belongs to the boron group element. It has an atomic
number 13 and is the third most abundant metal in the earth's crust after oxygen and silicon. It
makes up about 8% by weight of the earth's solid surface [10].
Iron (Fe) is a metal in the first transition series having atomic number 26 and is the most common
element forming the planet earth's outer and inner core. It is the fourth most common element in the
earth's crust. Iron plays an important role in biology, forming complexes with molecular oxygen in
hemoglobin and myoglobin. Iron is also the metal used at the active site of many important redox
enzymes dealing with cellular respiration and oxidation and reduction in plants and animals [10].
Cobalt (Co) is a chemical element with atomic number 27and is found naturally only in chemically
combined form [10].
Nickel (Ni)is a chemical element with atomic number 28. It is silvery white transition metal and is
hard and ductile. Nickel is reactive enough with oxygen so that native nickel is rarely found on

International Journal of Research in Modern Engineering and Emerging Technology (IJRMEET) UGC Approved id_47203
Vol. 5, Sp. Issue: 9, Sept.: 2017 (IJRMEET) ISSN: 2320-6586
316 Online International, Refereed, Impact factor & Indexed Monthly Journal www.raijmr.com
RET Academy for International Journals of Multidisciplinary Research (RAIJMR)
earth's surface, being mostly confined to the interiors of larger nickel–iron meteorites that were
protected from oxidation during their time in space. An iron–nickel mixture is thought to compose
earth's inner core [10].
Copper (Cu) is a ductile metal with atomic number 29. It has very high thermal and electrical
resistivity. Approximately 65% of copper produced is used for electrical applications [10].
Zinc (Zn) is a metallic chemical element with atomic number 30. It is the first element of group 12
of the periodic table. Zinc is the 24th
most abundant element in the Earth's crust and has five stable
isotopes [10].
Gallium (Ga) is a chemical element with atomic number 31. Elemental gallium does not occur in
pure form in nature, but as gallium (III) compounds are in trace amounts in zinc ores and in bauxite.
Roughly 90-95% of gallium consumption is in the electronics industry. Gallium arsenide (GaAs)
can convert light directly into electricity. Further, gallium arsenide is also used in LEDs and
transistors. Scientists employ an alloy with Gallium for the plutonium pits of nuclear weapons to
stabilize the allotropes of plutonium [10].
The Ionization Potential (IP) [15] for these atoms are listed in Table 1
Table 1 Ionization Potential (IP) for Atoms
ATOMS Al Fe Co Ni Cu Zn Ga
IP (eV) 5.98 7.90 7.88 7.63 7.72 9.39 5.99
2. THEORY
The absorption potential takes care of loss of flux into all allowed inelastic channels. For this we
have used model potential of Staszewska et al. [10] which is non-empirical, quasifree, Pauli-
blocking and dynamic in nature. The full form of model potential is represented by,
2 2
1 2 33
8( , ) ( ) ( 2 ) ( )
2 10
locabs i F
F i
TV r E r p k A A A
k E
(1)
And

International Journal of Research in Modern Engineering and Emerging Technology (IJRMEET) UGC Approved id_47203
Vol. 5, Sp. Issue: 9, Sept.: 2017 (IJRMEET) ISSN: 2320-6586
317 Online International, Refereed, Impact factor & Indexed Monthly Journal www.raijmr.com
RET Academy for International Journals of Multidisciplinary Research (RAIJMR)
( )loc i st exT E V V (2)
After generating the full complex optical potential for a given electron molecule system, we solve
the Schrödinger equation numerically with Numerov method using partial wave analysis. Using
these partial waves the complex phase shifts are obtained which are key ingredients to find the
relevant cross sections. The phase shifts contains all the information regarding the scattering event.
Using these complex phase shifts we evaluate total inelastic cross sections. The two vital
components of total inelastic cross sections are given by,
(3)
Total ionization cross section may be estimated from total inelastic cross section by defining an
energy dependent ratio R(Ei) given by,
ion i
i
inel i
Q ER E
Q E (4)
such that, 0 < R 1.
As total ionization cross section is a continuous function of energy, we can express this ratio also as
a continuous function of energy for Ei > I, used in earlier studies as [4, 5 ].
21
ln1 1i
UCR E f U C
U a U
(5)
here, U is the dimensionless variable defined by, I
EU i .
The dimensionless parameters C1, C2 and „a‟ involved in the above equation are deduced by
imposing the three conditions on the ratio as discussed below.
inel i exc i ion iQ E Q E Q E

International Journal of Research in Modern Engineering and Emerging Technology (IJRMEET) UGC Approved id_47203
Vol. 5, Sp. Issue: 9, Sept.: 2017 (IJRMEET) ISSN: 2320-6586
318 Online International, Refereed, Impact factor & Indexed Monthly Journal www.raijmr.com
RET Academy for International Journals of Multidisciplinary Research (RAIJMR)
0
( )
1
i
i p i p
i p
for E I
R E R for E E
for E E
(6)
where Ep is the peak of inelastic cross section.
The first condition is an exact condition wherein it states that no ionization process is possible
below the ionization threshold of the target. According to the last condition, ionization contribution
is almost equal to inelastic contribution at very high (~ 10 Ep) energies. RP is the value of R at Ei =
Ep, and it was observed that at the peak of inelastic cross section the contribution for ionization is
about 70 to 80%. Here we have taken Rp as 0.7 for all the targets studied here.
3 Results and Discussion
Figure 1 shows comparison of total ionization cross section for e – Al scattering with other
available data. There is only one measurement performed by Freund et al. [16] while theoretical
data are provided by Bartlett and Stelbovics [17], Kim and Stone [18] Talukdar et al. [19] and
Joshipura et al. [20].
10 100 1000
0
2
4
6
8
10
12
Qio
n (
Ų)
Energy (eV)
Present
Frund
Joshipura et al
Kim and Stone
Bartlett Stelbovics
Talukdar et al
Al
Figure 1 Total ionization cross section (Qion) for Al atom

International Journal of Research in Modern Engineering and Emerging Technology (IJRMEET) UGC Approved id_47203
Vol. 5, Sp. Issue: 9, Sept.: 2017 (IJRMEET) ISSN: 2320-6586
319 Online International, Refereed, Impact factor & Indexed Monthly Journal www.raijmr.com
RET Academy for International Journals of Multidisciplinary Research (RAIJMR)
Solid line: Present Results,Short Dash dot: Bartlett and Stelbovics [17], Short Dashed line: Kim
and Stone[18], dashed line: Joshipura et al. [20], Dotted line: Talukdar et al. [19], Square with
cross: Freund et al. [16].
Below 30 eV our results are in good agreement with the Kim and Stone [18] and Talukdar et al.
[19]. After 40 eV our theory falls between other theories [17-19] but in good agreement with
Joshipura et al. [20]. We get the peak of 8.77 Å2 at 24 eV same as Freund et al. [16] and Talukdar et
al. [19] but the cross section of Freund et al. [16] at peak is 9.87 Å2 which is around 1 Å
2 higher
compared to present result.
10 100 1000
0
1
2
3
4
5
6 Present
Talukdar et al
McGuire
Freund et al
Qio
nÅ
²
Energy (eV)
Fe
Figure 2 Total ionization cross section for Fe atom
Solid line: Present Results, Dashed Line: Talukdar et al. [19], Dashdot dot: McGuire et al.[21],
Square with cross: Freund et al.[16].
Figure 2 shows comparison of total ionization cross section for e – Fe scattering with available
comparisons. There is single measurement available for the comparison by Freund et al. [16] while
theoretical data is provided by Talukdar et al. [19] and McGuire et al. [21]. McGuire et al. [21] has
employed generalized Oscillator-Strength formulation of the Born approximation for the
calculation of total ionization cross sections. Talukdar et al. [19] have calculated ionization cross
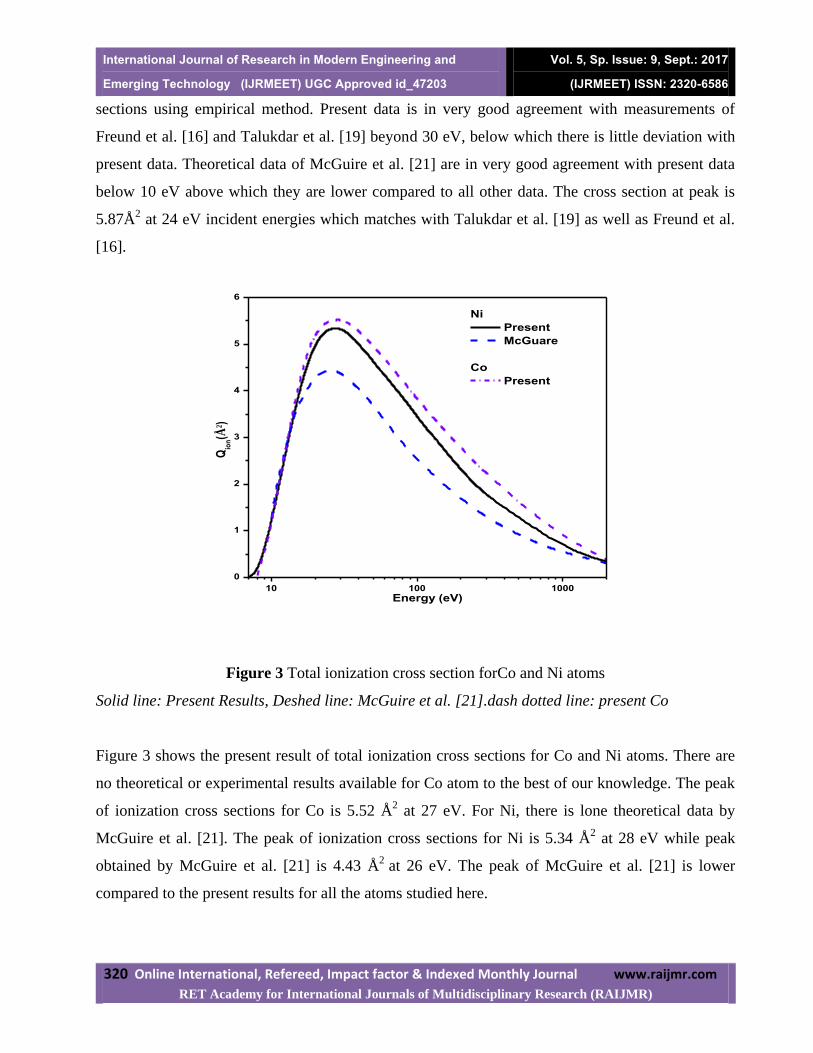
International Journal of Research in Modern Engineering and Emerging Technology (IJRMEET) UGC Approved id_47203
Vol. 5, Sp. Issue: 9, Sept.: 2017 (IJRMEET) ISSN: 2320-6586
320 Online International, Refereed, Impact factor & Indexed Monthly Journal www.raijmr.com
RET Academy for International Journals of Multidisciplinary Research (RAIJMR)
sections using empirical method. Present data is in very good agreement with measurements of
Freund et al. [16] and Talukdar et al. [19] beyond 30 eV, below which there is little deviation with
present data. Theoretical data of McGuire et al. [21] are in very good agreement with present data
below 10 eV above which they are lower compared to all other data. The cross section at peak is
5.87Å2 at 24 eV incident energies which matches with Talukdar et al. [19] as well as Freund et al.
[16].
10 100 1000
0
1
2
3
4
5
6
Qio
n(Å
²)
Energy (eV)
Ni
Present
McGuare
Co
Present
Figure 3 Total ionization cross section forCo and Ni atoms
Solid line: Present Results, Deshed line: McGuire et al. [21].dash dotted line: present Co
Figure 3 shows the present result of total ionization cross sections for Co and Ni atoms. There are
no theoretical or experimental results available for Co atom to the best of our knowledge. The peak
of ionization cross sections for Co is 5.52 Å2 at 27 eV. For Ni, there is lone theoretical data by
McGuire et al. [21]. The peak of ionization cross sections for Ni is 5.34 Å2 at 28 eV while peak
obtained by McGuire et al. [21] is 4.43 Å2
at 26 eV. The peak of McGuire et al. [21] is lower
compared to the present results for all the atoms studied here.

International Journal of Research in Modern Engineering and Emerging Technology (IJRMEET) UGC Approved id_47203
Vol. 5, Sp. Issue: 9, Sept.: 2017 (IJRMEET) ISSN: 2320-6586
321 Online International, Refereed, Impact factor & Indexed Monthly Journal www.raijmr.com
RET Academy for International Journals of Multidisciplinary Research (RAIJMR)
Figure 4 shows the comparison of total ionization cross sections of e – Cu scattering with available
comparisons. The experimental data are provided by two groups [16, 22]. Theoretical data are
provided by Joshipura et al. [20] using CSP-ic method, Kim and Stone [18] by using BEB
formalism and Talukdar et al.[19] by employing some empirical formula. Present results are in
good agreement with both the measurements. Theoretical data of Kim and Stone [18] is lower
compared to all data presented here. Present data is in good agreement with data of Joshipura et al.
[20] till 20 eV beyond which they are higher compared to all other data presented here. Theoretical
data of Talukdar et al. [19] is higher compared to the present data till 100 eV, beyond which they
are in excellent agreement with present data.
10 100 1000
0
1
2
3
4
5
Qio
n(Å
²)
Energy (eV)
Present
Talukdar et al
Kim and stone
Joshipura et al
Frund ei al
Bolorizadeh et al
Cu
Figure 4 Total ionization cross section for Cu atom
Solid line: Present Results, Short dashed Line: Talukdar et al. [19], Dash dot dot: Kim and Stone
[18], short dotted line: Joshipura et al. [20], Circle: Bolorizadehet al.[22], Square with cross:
Freund et al. [16].
Figure 5 shows the present result of total ionization cross sections (Qion) for Zn atom. As per our
knowledge, there is only one theoretical result available by McGuireet al. [21] using generalized
Oscillator-Strength formulation of the Born approximation for the calculation. Overall range of the
energy, good matching obtained between both the theories but slide variation at the peak of the

International Journal of Research in Modern Engineering and Emerging Technology (IJRMEET) UGC Approved id_47203
Vol. 5, Sp. Issue: 9, Sept.: 2017 (IJRMEET) ISSN: 2320-6586
322 Online International, Refereed, Impact factor & Indexed Monthly Journal www.raijmr.com
RET Academy for International Journals of Multidisciplinary Research (RAIJMR)
cross sections observed. We get the peak of 4.42Å2at 30 eV, while McGuire et al. [21] gets the peak
of 4.24 Å2 at 30 eV.
10 100 1000
0
1
2
3
4
5
Qio
n(Å
²)
Energy (eV)
Present
McGuire
Zn
Figure 5 Total ionization cross section for Zn atom
Solid line: Present Results, Dashed line: McGuire et al. [21].
10 100 1000
0
1
2
3
4
5
6
7
8
9
10
11
Qio
n (Ų)
Energy (eV)
Present
Bartlett and
Stelbovics
Talukdar et al
Shul et al
Shimon et al
Ga
Figure 6 Total ionization cross section for Ga atom

International Journal of Research in Modern Engineering and Emerging Technology (IJRMEET) UGC Approved id_47203
Vol. 5, Sp. Issue: 9, Sept.: 2017 (IJRMEET) ISSN: 2320-6586
323 Online International, Refereed, Impact factor & Indexed Monthly Journal www.raijmr.com
RET Academy for International Journals of Multidisciplinary Research (RAIJMR)
Solid line: Present Results, Dashed Line: Bartlett and Stelbovics [17], Dash dot line: Talukdar et
al.[19], Circle with cross: Shulet al.[23], Half-filled triangle: Shimon et al. [24].
Figure 6 shows the comparison of total ionization cross sections for Ga atom. Present results are
going well with the theoretical values of Talukdar et al. [19] and higher compared to Bartlett-
Stelbovics [17]. The measured results of Shul et al. [23] are in agreement with our present results
up to 40 eV. After that the experimental data of Shul et al. [23] goes higher than all the theoretical
results. The results of Shimon et al. [24] are lower at intermediate energies but in good agreement
with the Shul et al. [23] at high energies. Our results lie between the both available theories [17, 19]
throughout the energy range. The peak obtained in present result is 8.88 Å2 at 30 eV. The peak
energy of all theories are similar while experimental peak of Shul et al. [23] is 9.11 Å2 at 30 eV,
which is slightly shifted right side from the others [17, 19, 24].
The present computational data of all atoms are given in table 2. Cross sections at peak are
indicated in bold in table 2.
Table 2 Total Ionization Cross sectionsforstudied atoms
Energy
(eV)
Total Ionization Cross Section (Qion) (Å2)
Al Fe Co Ni Cu Zn Ga
6 0.04 -- -- -- -- -- 0.27
7 0.76 -- -- 0.02 0.02 -- 0.81
8 2.15 0.04 0.04 0.18 0.41 -- 1.58
9 33 0.60 0.53 0.70 0.66 0.002 2.80
10 4.32 1.28 1.14 1.39 1.23 0.407 3.76
15 7.61 4.34 3.94 3.75 2.49 2.99 8.20
20 8.48 5.63 5.18 4.96 61 4.09 8.54
23 8.75 5.86 5.43 5.24 3.89 4.29 8.59
24 8.77 5.87 5.46 5.27 3.93 4.33 8.81
25 8.77 5.86 5.49 5.31 4.00 4.37 8.82
26 8.77 5.84 5.50 5.33 4.07 4.39 8.84
27 8.76 5.83 5.52 5.33 4.09 4.40 8.86

International Journal of Research in Modern Engineering and Emerging Technology (IJRMEET) UGC Approved id_47203
Vol. 5, Sp. Issue: 9, Sept.: 2017 (IJRMEET) ISSN: 2320-6586
324 Online International, Refereed, Impact factor & Indexed Monthly Journal www.raijmr.com
RET Academy for International Journals of Multidisciplinary Research (RAIJMR)
28 8.76 5.80 5.51 5.34 4.10 4.41 8.87
30 8.75 5.72 5.50 5.32 4.16 4.42 8.88
50 7.64 5.03 4.97 4.62 3.88 3.87 7.74
100 5.38 62 3.82 4.5 14 2.81 2.81
1000 1.07 0.74 0.87 0.62 0.77 0.64 1.55
2000 0.57 0.41 0.18 0.33 0.46 0.37 0.37
4. Conclusion
In this article series of calculations to obtain total ionization cross sections for atoms were
carried out. We have employed the well-known SCOP and CSP-ic formalisms to perform these
calculations. The total ionization results obtained are presented in the article numerically in Table 2
and are graphically compared (Fig. 1-6) with other available measurements and theories. We find
that the present results are over all very consistent in strength and shape and hence prove that
present method can produce reliable cross sections. So we are now confident to use this method for
complex targets as well as targets which are difficult to study experimentally for e.g. exotic targets
or radicals. It can be easily employed for the targets where experiments are difficult.
References
1. B. Boudaiffa, P. Cloutier, D. Hunting, M. A. Huels and L. Sanche Science 287, 1658
(2000).
2. A. Jain and K. L. Baluja, Phys. Rev. A 45 (1992) 202.
3. K. N. Joshipura and M. Vinodkumar, Z. Phys. D 41, 133 (1997).
4. B. K. Antony, K. N. Joshipura, N. J. Mason and J. Tennyson, J.Phys.B: At. Mol. Opt. Phys.
37, 1689 (2004).
5. M. Vinodkumar, K. Korot and H. Bhutadia, Int. J. Mass Spectrom. 294, 54 (2010).
6. S. P. Khare, “Introduction to the Theory of Collisions of Electrons with Atoms and
Molecules” (Kluwer Academic / Plenum Publishers, London, 2002).
7. L. G. Christophorou, “Electron molecule interactions and their applications” (Academic
press inc., London, 1984).
8. Y-K Kim and M. E. Rudd, Phys. Rev. A 50, 3954 (1994).

International Journal of Research in Modern Engineering and Emerging Technology (IJRMEET) UGC Approved id_47203
Vol. 5, Sp. Issue: 9, Sept.: 2017 (IJRMEET) ISSN: 2320-6586
325 Online International, Refereed, Impact factor & Indexed Monthly Journal www.raijmr.com
RET Academy for International Journals of Multidisciplinary Research (RAIJMR)
9. Y. K Kim, W. Hwang, N. M. Weinberger, M. A. Ali and M. E. Rudd, J. Chem. Phys.
106,1026(1997).
10. From: http://www.explainthatstuff.com
11. H. Deutsch, K. Becker, S. Matt and T. D. Märk, Int. J. Mass Spectrom. 197, 37(2000).
12. M. Vinodkumar, Ph. D. book, Sardar Patel University, India, (1999).
13. W. M. Huo, Phys. Rev. A 64, 042719 (2001).
14. K. N. Joshipura and M. Vinodkumar, Phys. Letts. A 41 (1997) 361.
15. R Lide, “CRC Handbook of Chemistry and Physics” (CRC Press LLC, Boca RatonFL,
2003).
16. R. S. Freund, R.C. Wetzel, R. J. Shul, T.R. Hayes, Phys. Rev. A41, 3575 (1990).
17. P. L. Bartlett and A T. Stelbovics, Phys. Rev. A 66, 012707 (2002)
18. Y. K. Kim and P.M. Stone, J. Phys. B: At. Mol. Opt. Phys.40,1597(2007).
19. M. R. Talukder, S. Bose, M. A. R. Patoary, A. K. F. Haque, ,M. A. Uddin, A. K. Basak,
and M. Kando, Eur. Phys. J. D 46, 281(2008).
20. K. N. Joshipura, B. G. Vaishnav and C G. Limbachiya, Pramana66, 403 (2006).
21. E. J. McGuire, Phys. Rev. A 16, 62 (1977).
22. M. A. Bolorizadeh, C. J. Patton, M. B. Shah, and H. B. Gil-body, J. Phys. B: At. Mol. Opt.
Phys.27, 175 (1994).
23. R. J. Shul, R.C. Wetzel, R.S. Freund, Phys. Rev. A 39,5588 (1989).
24. L. L. Shimon, E. I. Nepiipov, and I. P. Zapesochnyi, Zh. Tekh. Fiz. 45, 688 (1975) [Sov.
Phys. Tech. Phys. 20, 434 (1975)]

International Journal of Research in Modern Engineering and Emerging Technology (IJRMEET) UGC Approved id_47203
Vol. 5, Sp. Issue: 9, Sept.: 2017 (IJRMEET) ISSN: 2320-6586
326 Online International, Refereed, Impact factor & Indexed Monthly Journal www.raijmr.com
RET Academy for International Journals of Multidisciplinary Research (RAIJMR)
Investigation of Resistivity and Activation energy of WSe2
crystal with Temperature
Dr.B.A.Thakar1,Dr.R.J.Pathak
*,Dr. Dipak sahay
2,Dr.Ripal parmar
3andDr.R.K.Shah
4
1B.S. Patel Polytechnic, Ganpat Vidhyanagar, Kherva
*R.R.Mehta College of Science, Palanpur
2Government Engineering College, Modasa
3Department of Physics, HNGU, Patan
4Arts, Science and Commerce College,Bhadran
Email: [email protected]
ABSTRACT
Single crystals of tungstendiselenide (WSe2) have been grown using direct vapour transport
technique (DVT). The variation of resistivity with temperature was studied along perpendicular
and parallel to c-axis of crystal plane using four probes method. Electrical properties variation
with temperature and parameters are discussed. Activation energy in various temperature range
were analyzed in detail for the crystal of WSe2.
Key words: TMDC crystals, Resistivity, Activation energy.
*INTRODUCTION
The energy levels of semiconductors can be grouped into two bands, the valence band and the
conduction band. In the presence of an external electric field it is the electrons in the valence
band that can move freely, thereby responsible for the electrical conductivity of the
semiconductors. In case of intrinsic semiconductors the Fermi level lies in between the
conduction band minimum and valence band maximum. Since the conduction band lies above
the Fermi level, at 0K, when no thermal excitations are available, the conduction band remains
unoccupied. So conduction is not possible at 0K, and resistance is in infinite. As temperature
increases, occupancy of the conduction band goes up, thereby resulting in decreases of electrical
resistance of the semiconductor. The temperature dependence of resistance follows an
exponential relation with temperature, R = R0 𝑒(−𝛼)/𝑇

International Journal of Research in Modern Engineering and Emerging Technology (IJRMEET) UGC Approved id_47203
Vol. 5, Sp. Issue: 9, Sept.: 2017 (IJRMEET) ISSN: 2320-6586
327 Online International, Refereed, Impact factor & Indexed Monthly Journal www.raijmr.com
RET Academy for International Journals of Multidisciplinary Research (RAIJMR)
Experimental Methodology
The dc resistivity (ρ) of WSe2 crystals perpendicular to c-axis was investigated by using dc
resistivity apparatus. It can be investigated by the following techniques: (1) Van deer Pauw
techniqueand (2) four probe resistivity method. The resistivity of the specimens can be
measured at different temperatures by four probe method.The high temperature dc resistivity
measurements performed on the basal plane in the direction parallel to c-axis and in the
temperature range 312K-673K is made by resistivity apparatus using four probe resistivity
method. The crystals having irregular shape and larger size were normally selected to
investigate their electrical behavior through four probe resistivity method [7].
Four probes are placed on a flat surface of the material whose resistivity is to be
measured. Current is passed through the two outer electrodes and floating potential is
measured across the inner pair. The four probe set up consists of probe arrangement,
oven, constant current source, millimeter and electronic voltmeter. Collinear and equally
spaced spring loaded four probes are coated with zinc at the tips to ensure good electrical contact
with the sample. The resistivity variations with temperature in the range from ambient to 673 K
were studied on the grown crystals using conventional four probe method. The resistivity at each
temperature was evaluated by using the formula [7],
ρ = 2π sR (1)
Where s is the distance between two probes, and ‘R’ is the resistance between two probes. The
resistivity data obtainedfrom the above equation are plotted as a function of inverse of
temperature and are shown in Fig.1 for WSe2.
*RESULTS AND DISCUSSIONS:
TABLE-1DATA TABLE OF THE EXPERIMENT
T(K) R(k Ω) ρ (Ω · m) Log(ρ) R (k Ω) ρ (Ω · m) Log( ρ) 1000/T (K-1
)
312 101 1268.56 3.1033 43.30 543.85 2.74 3.2051
318 95 1193.20 3.0767 32.30 405.69 2.61 3.1447
323 87 1092.72 3.0385 25.40 319.02 2.50 3.0960
328 81 1017.36 3.0075 23.09 290.01 2.46 3.0488

International Journal of Research in Modern Engineering and Emerging Technology (IJRMEET) UGC Approved id_47203
Vol. 5, Sp. Issue: 9, Sept.: 2017 (IJRMEET) ISSN: 2320-6586
328 Online International, Refereed, Impact factor & Indexed Monthly Journal www.raijmr.com
RET Academy for International Journals of Multidisciplinary Research (RAIJMR)
333 75 942.00 2.9741 20.53 257.86 2.41 3.0030
338 71 891.76 2.9502 18.12 227.59 2.36 2.9586
343 68 854.08 2.9315 16.30 204.73 2.31 2.9155
348 66 828.96 2.9185 14.76 185.39 2.27 2.8736
353 63 791.28 2.8983 12.29 154.36 2.19 2.8329
358 62 778.72 2.8914 11.81 148.33 2.17 2.7933
363 60 753.60 2.8771 10.71 134.52 2.13 2.7548
368 56 703.36 2.8472 9.08 114.04 2.06 2.7174
373 54 678.24 2.8314 8.41 105.63 2.02 2.6810
378 51 640.56 2.8066 7.38 92.69 1.97 2.6455
383 49 615.44 2.7892 6.92 86.92 1.94 2.6110
388 46 577.76 2.7617 6.15 77.24 1.89 2.5773
393 43 540.08 2.7325 5.71 71.72 1.86 2.5445
398 41 514.96 2.7118 5.43 68.20 1.83 2.5126
403 39 489.84 2.6901 5.03 63.18 1.80 2.4814
408 37 464.72 2.6672 4.71 59.16 1.77 2.4510
413 36 452.16 2.6553 4.43 55.64 1.75 2.4213
418 34 427.04 2.6305 4.01 50.37 1.70 2.3923
423 32 401.92 2.6041 3.83 48.10 1.68 2.3641
428 30 376.80 2.5761 3.73 46.85 1.67 2.3364
433 28 351.68 2.5461 3.65 45.84 1.66 2.3095
438 27 339.12 2.5304 3.51 44.09 1.64 2.2831
443 25 314.00 2.4969 3.28 41.20 1.61 2.2573
448 23 288.88 2.4607 3.12 39.19 1.59 2.2321
453 20 251.20 2.4000 3.09 38.81 1.59 2.2075
458 20 251.20 2.4000 3.01 37.81 1.58 2.1834
463 18 226.08 2.3543 2.81 35.29 1.55 2.1598
468 17 213.52 2.3294 2.78 34.92 1.54 2.1368
473 17 213.52 2.3294 2.71 34.04 1.53 2.1142
478 15 188.40 2.2751 2.65 33.28 1.52 2.0921
483 14 175.84 2.2451 2.51 31.53 1.50 2.0704
488 13 163.28 2.2129 2.41 30.27 1.48 2.0492
493 12 150.72 2.1782 2.30 28.89 1.46 2.0284
498 12 150.72 2.1782 2.27 28.55 1.46 2.0080
503 13 163.28 2.2129 2.23 28.01 1.45 1.9881
508 14 175.84 2.2451 2.22 27.86 1.44 1.9685
513 13 163.28 2.2129 2.11 26.50 1.42 1.9493
518 11 138.16 2.1404 2.02 25.32 1.40 1.9305
523 10 125.60 2.0990 1.98 24.91 1.40 1.9120
528 12 150.72 2.1782 1.84 23.14 1.36 1.8939
533 12 150.72 2.1782 1.89 23.78 1.38 1.8762
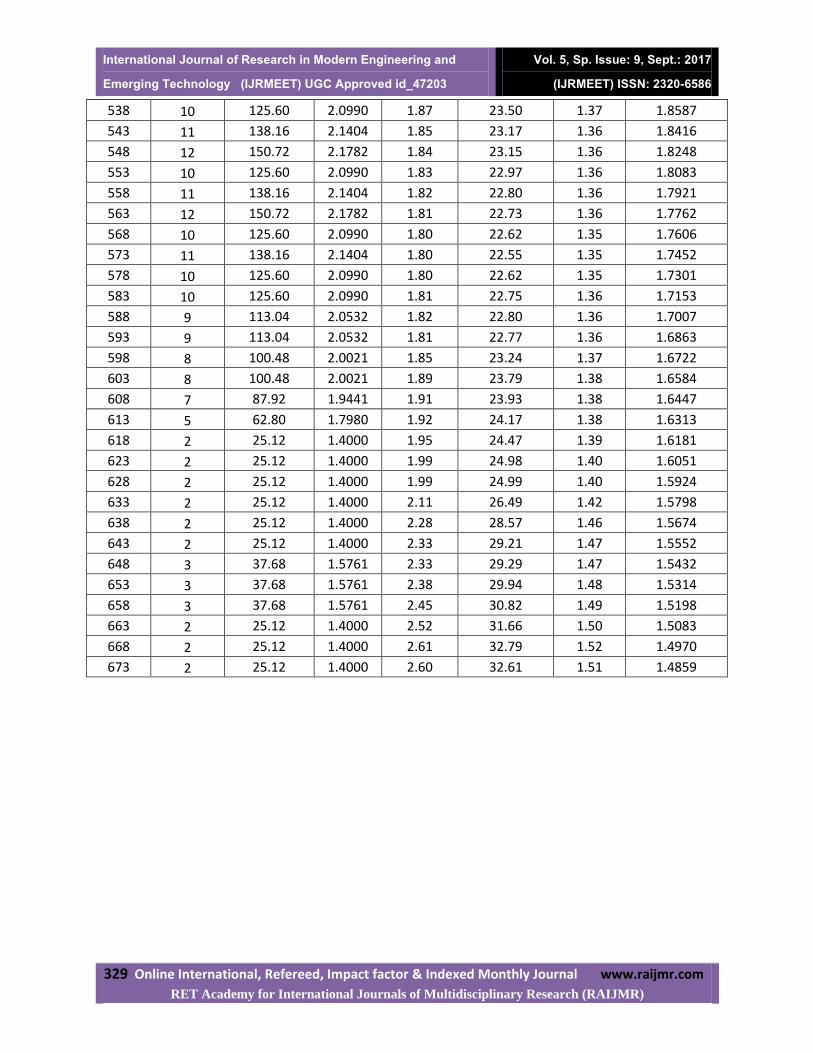
International Journal of Research in Modern Engineering and Emerging Technology (IJRMEET) UGC Approved id_47203
Vol. 5, Sp. Issue: 9, Sept.: 2017 (IJRMEET) ISSN: 2320-6586
329 Online International, Refereed, Impact factor & Indexed Monthly Journal www.raijmr.com
RET Academy for International Journals of Multidisciplinary Research (RAIJMR)
538 10 125.60 2.0990 1.87 23.50 1.37 1.8587
543 11 138.16 2.1404 1.85 23.17 1.36 1.8416
548 12 150.72 2.1782 1.84 23.15 1.36 1.8248
553 10 125.60 2.0990 1.83 22.97 1.36 1.8083
558 11 138.16 2.1404 1.82 22.80 1.36 1.7921
563 12 150.72 2.1782 1.81 22.73 1.36 1.7762
568 10 125.60 2.0990 1.80 22.62 1.35 1.7606
573 11 138.16 2.1404 1.80 22.55 1.35 1.7452
578 10 125.60 2.0990 1.80 22.62 1.35 1.7301
583 10 125.60 2.0990 1.81 22.75 1.36 1.7153
588 9 113.04 2.0532 1.82 22.80 1.36 1.7007
593 9 113.04 2.0532 1.81 22.77 1.36 1.6863
598 8 100.48 2.0021 1.85 23.24 1.37 1.6722
603 8 100.48 2.0021 1.89 23.79 1.38 1.6584
608 7 87.92 1.9441 1.91 23.93 1.38 1.6447
613 5 62.80 1.7980 1.92 24.17 1.38 1.6313
618 2 25.12 1.4000 1.95 24.47 1.39 1.6181
623 2 25.12 1.4000 1.99 24.98 1.40 1.6051
628 2 25.12 1.4000 1.99 24.99 1.40 1.5924
633 2 25.12 1.4000 2.11 26.49 1.42 1.5798
638 2 25.12 1.4000 2.28 28.57 1.46 1.5674
643 2 25.12 1.4000 2.33 29.21 1.47 1.5552
648 3 37.68 1.5761 2.33 29.29 1.47 1.5432
653 3 37.68 1.5761 2.38 29.94 1.48 1.5314
658 3 37.68 1.5761 2.45 30.82 1.49 1.5198
663 2 25.12 1.4000 2.52 31.66 1.50 1.5083
668 2 25.12 1.4000 2.61 32.79 1.52 1.4970
673 2 25.12 1.4000 2.60 32.61 1.51 1.4859

International Journal of Research in Modern Engineering and Emerging Technology (IJRMEET) UGC Approved id_47203
Vol. 5, Sp. Issue: 9, Sept.: 2017 (IJRMEET) ISSN: 2320-6586
330 Online International, Refereed, Impact factor & Indexed Monthly Journal www.raijmr.com
RET Academy for International Journals of Multidisciplinary Research (RAIJMR)
Fig.1: Variation of resistivity (ρ⊥) with temperature (T) of WSe2 crystal
Results of resistivity (ρ⊥) perpendicular to c axis in the temperature range (328K-673K) for a
sample of WSe2is shown in Fig.1.It is fairly evident that resistivity decreases exponentially with
an increase in temperature. This is the typical characteristic of semiconducting material. The
graph of log(ρ)verses 1000/T in Fig.2shows astraightlineregion similar to that observed
byvoraet.el in there research work.
0
100
200
300
400
500
600
300 350 400 450 500 550 600 650 700
ρ (Ω · m)
T(K)
Resistivity (ρ) → Temperature (T)

International Journal of Research in Modern Engineering and Emerging Technology (IJRMEET) UGC Approved id_47203
Vol. 5, Sp. Issue: 9, Sept.: 2017 (IJRMEET) ISSN: 2320-6586
331 Online International, Refereed, Impact factor & Indexed Monthly Journal www.raijmr.com
RET Academy for International Journals of Multidisciplinary Research (RAIJMR)
Fig.2: Variation of resistivity with reciprocal of temperature of WSe2 crystals
Fig.3: Variation of resistivity (ρ)with Temperature (T) of WSe2 crystals
Experiment have been repeated to found out variation in resistivity ( ρ ) parallel to c axis in
temperature range (328K-673K) for a sample of WSe2. Fig:3 shows the outcome of the
y = 0.221x + 0.972
y = 0.830x - 0.243
y = 1.350x - 1.636
0.70
1.20
1.70
2.20
2.70
3.20
1.50 1.70 1.90 2.10 2.30 2.50 2.70 2.90 3.10 3.30
log(ρ)
1000/T(k-1)
log(ρ) → 1000/T
0
200
400
600
800
1000
1200
1400
300 350 400 450 500 550 600 650 700
ρ (Ω · m)
T(K)
Resistivity(ρ)→Temprature(K)

International Journal of Research in Modern Engineering and Emerging Technology (IJRMEET) UGC Approved id_47203
Vol. 5, Sp. Issue: 9, Sept.: 2017 (IJRMEET) ISSN: 2320-6586
332 Online International, Refereed, Impact factor & Indexed Monthly Journal www.raijmr.com
RET Academy for International Journals of Multidisciplinary Research (RAIJMR)
experiment. Fig: 3 shows that resistivity parallel to c axis decreases exponentially with
temperature. The above graph demonstrate typical characteristics of semiconducting materials.
Fig.4: Variation of resistivity with reciprocal of temperature of WSe2 crystals
Fig.4shows avariation of log ρ verses 1000/T. Using the value of a slop of a straight line found
in various temperature range,we have calculated the value of activation energy in a respective
temperature range.
The activation energy is determined from the above plots (Fig. 2 andFig. 4) using equation,
Ea = 2.303 x KB x slope X 1000 (eV) (2)
Where Ea = Activation energy
KB=Boltzmann constant
KB=8.6173 X 10⁻⁵
eV/K
For the samples of WSe2 the resistivity perpendicular and parallel to c-axis decreased with
increase of temperature analogous to semiconducting behavior. The activation energy values
determined from the Fig. 2 and Fig. 4is tabulated in Table 2.
y = 0.734x + 0.802
y = 0.893x + 0.475
y = 0.518x + 1.433
0
0.5
1
1.5
2
2.5
3
3.5
1.6 1.8 2 2.2 2.4 2.6 2.8 3 3.2 3.4
log(ρ)
1000/T(K-1)
log(ρ)→1000/T(K-1)

International Journal of Research in Modern Engineering and Emerging Technology (IJRMEET) UGC Approved id_47203
Vol. 5, Sp. Issue: 9, Sept.: 2017 (IJRMEET) ISSN: 2320-6586
333 Online International, Refereed, Impact factor & Indexed Monthly Journal www.raijmr.com
RET Academy for International Journals of Multidisciplinary Research (RAIJMR)
Table 2: The activation energies calculated from the plotsLog(ρ)vs. 1000/T.
Material Resistivity type Temp. rang Slop Activation energy (Ea (eV))
WSe2 ρ (Ω · m)
598-508 0.221 0.0439
488-368 0.8301 0.1647
353-312 1.3507 0.2680
Material Resistivity type Temp. rang Slop Activation energy (Ea (eV))
WSe2
ρ (Ω · m)
608-528 0.7349 0.1458
453-388 0.8931 0.1772
378-312 0.518 0.1028
*Anisotropy:
In our investigation anisotropy measurements have been carried out in the temperature
range 378K-673K from the ratio of the data of high dc resistivity measured from parallel and
perpendicular to the c-axis. It is seen in Fig.5 that the anisotropy ratioincreases with the increase
in temperature. This variation of anisotropy with temperature shows an identical behavior to that
reported by deshpande et.al.[2] in their research work.

International Journal of Research in Modern Engineering and Emerging Technology (IJRMEET) UGC Approved id_47203
Vol. 5, Sp. Issue: 9, Sept.: 2017 (IJRMEET) ISSN: 2320-6586
334 Online International, Refereed, Impact factor & Indexed Monthly Journal www.raijmr.com
RET Academy for International Journals of Multidisciplinary Research (RAIJMR)
Fig.5:Variation in anisotropy ratio with reciprocal of temperature.
*CONCLUSIONS:
1. Resistivity of WSe2 decreases with an increase in temperature.Hence we can confirms
that DVT grown crystal of WSe2have semiconducting nature.
2. Resistance in parallel to c-axis found to be larger than that of perpendicular to c axis.
Hence we can confirms that DVT grown crystal of WSe2 have layered kind of a solid
state structure.
3. The activation energy’sin various temperature range can be found out using slops of the
plots of log(ρ) versus reciprocal of the temperature.
4. The crystals of WSe2 grown by a direct vapour transport technique are found to have an
anisotropic semiconducting nature.
5. The anisotropy ratio increases with the increase in temperature.
REFERENCES [1] Pankaj R. Patel, H. S. Patel, J. R. Rathod, K. D. Patel, and V. M. Pathak,
American J.Cond.Matt. Phys., 3(1) (2013) 13-20.
[2] M. P. Deshpande, Sunil Chaki, Nilesh N. Pandya and Sagar C. Shah,
PRAJNA – J. P. and App. Sci., 18 (2010) 132 – 135.
[3] H. S. Patel, J. R. Rathod, K. D. Patel and V. M. Pathak,
Research Expo, International Multidisciplinary Research J., 1 (2011) 127.
[4] Sandip R.Unadkat,
Ph.D. Thesis.Sardar Patel University, 2012.
1.55
1.6
1.65
1.7
1.75
1.8
1.85
1.9
1.95
2
0.1 0.2 0.3 0.4 0.5 0.6 0.7 0.8 0.9 1
ρ/ρ
1000/T
ρ/ρ → 1000/T

International Journal of Research in Modern Engineering and Emerging Technology (IJRMEET) UGC Approved id_47203
Vol. 5, Sp. Issue: 9, Sept.: 2017 (IJRMEET) ISSN: 2320-6586
335 Online International, Refereed, Impact factor & Indexed Monthly Journal www.raijmr.com
RET Academy for International Journals of Multidisciplinary Research (RAIJMR)
[5] P. R. Patel and V. M. Pathak,
J. Ele. and Elec. Eng., (2012) 44-46.
[6] Mihir M. Vora and Aditya M. Vora,
The African Review of Physics, 6 (2011) 15.
[7] KalyaniBhoi,
Master of Science Thesis, National Institute of Technology, Rourkela, (2010).
[8] G K Solanki, Dipika.B.Patel, SandipUnadkatAnd M. K. Agarwal,
PRAMANA – J.Phys.,74 (2010) 813-825.
[9] DeepaL.Makhija*, K.D.Patel, V. M. Pathak, R. Srivastava,
J.Ovonic Research, 4 (2008) 141 – 145.
[10] Priyanka Desai*, D.D. Patel, D.N. BhavsarAnd A.R. Jani,
PRAJNA – J.P.andApp.Sci., 19 (2011) 68 -70.
[11] MoussaBougouma, BoubiéGuel, TirianaSegato, Jean B. Legma and Marie-Paule,
Bull. Chem. Soc. Ethiop, 22(2) (2008) 225-236.
[12] Mihir M. Vora and Aditya M. Vora,
The African Review of Physics, 6 (2011) 15.
[13] C. K. Sumesh, K. D. Patel, V. M. Pathak, R. Srivastava,
Chalcogenide Letters, 5 (2008) 177-180.
[14] P. C. Yen, Y. S. Huang and K. K. Tiong,
J. Phys: Condensed Matter, 16 (2004) 2171-2181. [15] S. Y. Hu, M. C. Cheng, Tiong, K. K. Tiong, and Y. S Huang,
J. Phys. Condensed Matter, 17 (2005) 3573-3583.
[16] S.Mattila, J. A.Leiro, M.Heinonen and T. Laiho,
Core level Spectroscopy of MoS2. Surf. Sci., 60 (2006) 5168-5175.
[17] V.Podzorov, M.E.Gershenson, R.Zeis, and E. Bucher,
Appl. Phys. Lett., 84 (2004) 3301-3303.
[18] K.K.Tiong, T.S.Shou, and C.H.Ho,
J. Phys.: Condensed Matter, 12 (2000) 3441–3449.
[19] J.C.Bernede, C. Amory, L. Assmann, and M.Spiesser,
Appl. Surf. Sci,.219 (2003) 238-348.
[20] H. J Goldsmith,
Applications in Thermoelectricity, Methuen Monograph, London, (1950).
[21] H. P. R Frederikse,
Phys. Rev., 91 (1953) 491.

International Journal of Research in Modern Engineering and Emerging Technology (IJRMEET) UGC Approved id_47203
Vol. 5, Sp. Issue: 9, Sept.: 2017 (IJRMEET) ISSN: 2320-6586
336 Online International, Refereed, Impact factor & Indexed Monthly Journal www.raijmr.com
RET Academy for International Journals of Multidisciplinary Research (RAIJMR)
TOTAL SCATTERING CROSS SECTIONS CALCULATIONS FOR ELECTRON
IMPACT ON CF2 RADICAL
M. Y. Barot1#
, A. Y. Barot2, D. N. Bhavsar
3 and M. Vinodkumar
4
1Government Science College Gandhinagar-382016, Gujarat, India
2Sigma Institute of science and commerce, Vadodara-390001, gujarat, India
3Bhavan’s Sheth R. A. College of Science, Khanpur, Ahmedabad-380001, Gujarat, India.
4V. P. & R. P. T. P. Science College, Vallabh Vidyanagar – 388120, Gujarat, India
#correspondant author : [email protected] Tel. No.: +919624045206
Abstract: Total scattering cross sections for electron impact on CF2 in the gas phase are
presented from 0.1 eV to 2000 eV. Computation of such e - CF2 cross sections over such a wide
range of energy is reported for the first time employing two distinct formalisms. From 0.1 eV to
the ionization threshold of the target we employed the ab-initio R-matrix method, while at higher
energies we used the Spherical Complex Optical Potential (SCOP) method. At the crossing
point, the two theories match one another quite well and hence prove that they are consistent
with one another. The total cross sections presented here are in good agreement with other
experimental and theoretical calculations. These results show that the techniques employed here
can be used to predict cross sections for other targets for which data is scarce or not available.
This methodology may be integrated into online databases such as the Virtual Atomic and
Molecular Data Centre (VAMDC) to provide cross section data required by many desperate
users.
Key Words: R-matrix method, ab-initio calculations, Spherical Complex Optical
Potential, Total cross sections, CF2.
PACS number(s): 34.80.Bm
Highlights:
Here we have presented Eigen phase sum, Excitation cross section, Differential cross
sections, Momentum transfer cross section, and Total cross sections for e-CF2.
The calculations of total cross sections show a peak at 0.81 eV using the Static Exchange
Polarization (SEP) model and at 1.86 eV using a Static Exchange (SE) model which is a
reflection of the formation of a u shape resonance state.
These values are close to theoretical calculations by Rozumet al. [J. Phys. Chem. Ref.
data, 35, 267 (2006)] with a peak at 0.89 eV for SEP model and 1.91 eV for SE model.
Lee et al. [Phys. Rev. A, 74, 052716 (2006)] have also reported a peak at 1.65 eV.

International Journal of Research in Modern Engineering and Emerging Technology (IJRMEET) UGC Approved id_47203
Vol. 5, Sp. Issue: 9, Sept.: 2017 (IJRMEET) ISSN: 2320-6586
337 Online International, Refereed, Impact factor & Indexed Monthly Journal www.raijmr.com
RET Academy for International Journals of Multidisciplinary Research (RAIJMR)
1 INTRODUCTION
Molecular radicals play an important role in many electron-driven processes, including
radiation damage in tissue, gas discharges, low-temperature plasma etching environments and
waste deposition technologies. In particular, radicals of the fluorocarbons play a significant role
in the etching processes and evolution of plasmas used in micro and nano-structure assembly, for
example it is now well established that the concentration of CFx (x = 1–3) radicals have a
significant effect on the behavior of fluorocarbon plasmas [1, 2]. Such CFx radicals are
predominantly formed by electron impact induced dissociation of the fluorocarbon feed gases.
In this paper we study the scattering of CF2radicalon electron impact. Experimental
studies of electron collision cross sections with CF2 are difficult and hence to date measured data
has only been reported by one group [3]. Francis-Staite et al. [3] used a crossed–beam electron
scattering experiment to measure e -CF2 differential cross sections at specific angles (20° –
135°) for incident energies between 2 and 20 eV. They also reported calculated data for absolute
differential cross sections and integral cross sections using the Schwinger multichannel method
for impact energies between 2 and 20 eV. Earlier Maddernet al. [4] reported absolute differential
cross sections for incident electron energies of 30–50 eV and over an angular range of 20o–135
o.
Theoretical investigations of the total elastic cross sections for e -CF2 scattering have been
reported by four groups [3, 5-7]. Lee et al. [5] used the Iterative Schwinger variational method
and calculated elastic differential, integral and momentum transfer cross sections as well as total
absorption cross sections in the energy range 1 – 500 eV. Rozumet al. [6] used the R-matrix
method to evaluate the total elastic and excitation cross sections of the six lowest lying
electronic excited states of the CF2. Antony et al. [7] have reported total elastic and total
inelastic cross sections using a Spherical Complex Optical Potential for impact energies between
50 and 2000 eV. Owing to the difficulties involved in experiments with CF2 radicals, total
ionization cross sections have been reported experimentally by two groups, Huoet al. [8] and
Tarnovskyet al. [9] while theoretical estimates of the total ionization cross sections are reported
by three groups [7,10,11]. Thus, reviewing the literature, it is quite clear that the work on e -CF2
is scarce, as most of the authors have focused their results over a specific range of impact
energies as well as for specific cross sections. This work reports various cross section data for a
wide energy range which can be used for plasma modeling.
This paper reports electron impact excitation, differential, momentum transfer, ionization
and total cross sections for e -CF2 scattering over a wide range of energy starting from a very
low energy of 0.1 eV to 2000 eV. Electron-molecule collision cross sections from very low

International Journal of Research in Modern Engineering and Emerging Technology (IJRMEET) UGC Approved id_47203
Vol. 5, Sp. Issue: 9, Sept.: 2017 (IJRMEET) ISSN: 2320-6586
338 Online International, Refereed, Impact factor & Indexed Monthly Journal www.raijmr.com
RET Academy for International Journals of Multidisciplinary Research (RAIJMR)
energy up to threshold play an important role in determining electron transport properties and
electron energy distribution of a swarm of electrons drifting through various gases. They also
play significant role in modeling low temperature plasmas. In addition to the practical interest,
electron scattering data are of fundamental theoretical importance towards the understanding of
various electron assisted molecular chemistry [12]. The motive behind such study is twofold; (1)
to study the resonance processes which are more prominent at low impact energies below 10 eV
through which knowledge of dissociative electron attachment and negative ion formation can be
gathered and (2) to compare the results of this work with available data. In order to achieve these
goals we employed two different formalisms that are consistent and widely used over specific
ranges of impact energies. For low impact energies up to the ionization threshold of the target
we employ the ab-initio R-matrix method [13] while at higher energies computation of the total
cross sections is carried out using a quantum mechanical approach through Spherical Complex
Scattering Potential [14, 15].
This paper is organized as follows, in Section 2 we describe first the target model and
then describe the salient features of the oretical methodologies employed for low energy as well
as high energy calculations. Section III is devoted to results and discussions of the results
obtained and finally we end up with conclusions of the present study.
2 THEORETICAL METHODOLOGIES
The energy range of this study (0.1 to 2000 eV) cannot be modeled by any single theoretical
formalism. Hence the present calculations are based on two distinct methodologies, one valid
below the ionization threshold of the target and the other above it. This paper reports low energy
(0.1 eV to about 15 eV) ab-initio calculation using the Quantemol-N package [16] employing
the UK molecular R-matrix code [13] and the Spherical Complex Scattering Potential formalism
above 15eV. The target model plays an important role as its correct representation ensures
accuracy and stability in the calculation, therefore before discussing the scattering formalisms
we must discuss the target model employed.
A Target Model Used For Low-Energy Calculations
According to equilibrium geometry, CF2 is a triangular radical with a C–F bond length of
2.45 a0 and a bond angle F–C–F of 104.98o
[17]. We employed a double zeta plus polarization
(DZP) basis set similar to 6-31G for the target wave function representation and assumed C2v
point group symmetry of order four. For the optimized nuclear geometry of the target we
employed second order Möller-Plesset perturbation theory in the 6–31G (d) basis set and the

International Journal of Research in Modern Engineering and Emerging Technology (IJRMEET) UGC Approved id_47203
Vol. 5, Sp. Issue: 9, Sept.: 2017 (IJRMEET) ISSN: 2320-6586
339 Online International, Refereed, Impact factor & Indexed Monthly Journal www.raijmr.com
RET Academy for International Journals of Multidisciplinary Research (RAIJMR)
occupied and virtual molecular orbitals obtained using Hartree–Fock–Self consistent field (HF–
SCF) opt0imization which was used to set up the CF2 electronic target states. The ground state
Hartree–Fock electronic configuration is 1b22, 1a1
2, 2a1
2, 3a1
2, 2b2
2, 4a1
2, 3b2
2, 5a1
2, 1b1
2, 1a2
2,
4b22 and 6a1
2. To establishing a balance between the amount of correlation incorporated in the
N-electron target representation, φNi, and the (N+1) electron scattering wavefunction in our
configuration integration (CI) model, out of 24 electrons, we froze 16 electrons in ten molecular
orbitals (1a1, 2a1 3a1, 4a1, 5a1, 1b1, 1b2, 2b2, 3b2, 1a2). The remaining 8 electrons were allowed to
move freely in the active space of 6 target occupied and virtual molecular orbitals (6a1, 7a1, 2b1,
3b1, 4b2, 5b2).
TABLE I. Target properties for CF2 molecule.
Properties of Target Present Theoretical
Results
Experimental Results
Ground state energy
(Hartree)
–236.7341 –236.7305 [5]
–236.7275 [18]
-----
First excitation energy
(eV)
3.28 2.49 [6]
2.42 [19]
2.46 [20]
2.30 [3]
Rotational constant
(cm-1
)(A)(B)
(C)
2.95
0.403
0.353
2.83 [6] 2.95 [17], 2.947 [21]
0.417 [21]
0.364 [21]
Dipole moment (D) 0.301 0.246 [Ref.5]
0.440 [Ref.18]
0.448 [Ref.6]
0.469 [Ref.21]
Our self-consistent field (SCF) calculation yielded the ground state energy for CF2 as –
236.7341 Hartree whichis in good agreement with –236.7305 Hartree calculated by Lee et al. [5]
and –236.7575 Hartree of Russo et al. [18]. The nuclear coordinates will determine the
molecular orbitals, rotational constants, dipole moment and symmetries of the molecule. These
parameters highly affect the cross section (differential, momentum transfer and total cross
sections) calculations. Hence it is imperative to use proper nuclear coordinates. The calculated
rotational constants for CF2 are 2.95 cm-1
, 0.403 cm-1
and 0.353 cm-1
which are very close with
measured data of 2.947 cm-1
, 0.417 cm-1
and 0.364 cm-1
reported by Kirchhoff et al. [21] and

International Journal of Research in Modern Engineering and Emerging Technology (IJRMEET) UGC Approved id_47203
Vol. 5, Sp. Issue: 9, Sept.: 2017 (IJRMEET) ISSN: 2320-6586
340 Online International, Refereed, Impact factor & Indexed Monthly Journal www.raijmr.com
RET Academy for International Journals of Multidisciplinary Research (RAIJMR)
also same as 2.95 cm-1
reported in Computational Chemistry Comparison and Benchmark Data
Base [17] and is slightly lower than the theoretical value of 2.83 cm-1
reported by Rozumet al.
[6]. The calculated first excitation energy is 3.28 eV is higher compared to measured value of
2.3 eV reported by Francis-Staite et al. [3] and theoretical values of 2.49 eV reported by
Rozumet al. [6], 2.42 eV reported by Cai [19]. The calculated dipole moment is 0.301 D which
is higher compared to 0.246 D reported by Lee et al. [5] but is lower than the experimental value
of 0.469 D of Kirchhoff et al. [21] and the theoretical value of 0.44 D of Russo et al. [18] and
0.448 D of Rozumet al. [6]. The target properties along with available comparisons are listed in
Table I and the eight electronic excitation thresholds for CF2 are listed in Table II.
TABLE II.Vertical excitation energies for e -CF2.
State Energy
(eV)
State Energy
(eV)
1A1 00.00 1A2 11.06
3B1
03.28 3B2 11.45
1B1
3A2
06.14
10.96
1B2
3A1
12.66
12.99
B Low Energy Scattering Formalism (0.1 eV To ~ 15 eV)
The most popular methodologies employed for low energy electron collision calculations
are the Kohn variational method [22], the Schwinger multichannel method [23] and the R-matrix
method [24], of which the R-matrix is the most widely used method. The underlying idea behind
the R-matrix method relies on the division of configuration space into two spatial regions,
namely an inner region and outer region. The spatial R-matrix spherical boundary is chosen such
that the complete electronic charge distribution of the target electrons plus the scattering electron
is embedded in it. Thus the all N target electrons plus one scattering electron are contained in the
inner region which makes the problem numerically complex, but physically very precise. All
short range interactions between the target electrons and scattering electron are dominant in this
region which includes static, exchange and correlation polarization potentials. Consequently the
accuracy of scattering calculation depends critically on how appropriately the inner region
physics is defined. The solution of the inner region problem involves rigorous quantum
chemistry methods and thus consumes most of the time needed for calculation. However, the
inner region problem is solved independently of the energy of the scattering electron and hence
is done only once.

International Journal of Research in Modern Engineering and Emerging Technology (IJRMEET) UGC Approved id_47203
Vol. 5, Sp. Issue: 9, Sept.: 2017 (IJRMEET) ISSN: 2320-6586
341 Online International, Refereed, Impact factor & Indexed Monthly Journal www.raijmr.com
RET Academy for International Journals of Multidisciplinary Research (RAIJMR)
In the outer region where the scattering electron is at large distance from the center of
mass of the target, the probability of swapping its identity with any one of the target electrons is
negligible, resulting in a negligible contribution from the exchange and correlation effects. This
makes the problem very simple since only multipolar interactions between the scattering electron
and the target are included. A single center close coupling approximation with direct potentials
leads to a set of coupled differential equations and this allows quick, simple and fast solutions in
the outer region. The outer region calculations are repeated for each set of energies. In the
present calculation the inner R-matrix radius is taken as 10 a0. In the outer region the R-matrix
on the boundary is propagated to a sufficiently large distance where the interaction between
target electrons and scattering electron is assumed to be zero. In the present case this distance is
100 a0. Asymptotic expansion techniques are used to solve the outer region functions [24].
In the inner region target electrons are placed in some combination of target molecular
orbitals which are represented by Gaussian-type orbitals and these are multiplied by spin
functions to generate configuration state functions (CSF’s). The target molecular orbitals are
also supplemented by a set of continuum orbitals which have longer range such that they extend
beyond the inner region R-matrix boundary and hence the inner region wave function is
constructed using a close coupling approximation [25] for all N+1 electrons. In the close
coupling method, scattering cross sections are calculated including the effect of Polarization and
in the presence of resonances due to formation of transient negative ions and various threshold
effects. The total wave function for the system is expressed as,
j m
mk1+NmIjk+NjN
I
N
I
+N
k )bx,,(xχ+)a(xζx,,xψA=ψ 111
1 (1)
where A is the anti–summarization operator that takes care of exchange effect among
N+1 electrons, xN(rn, n) is the spatial and spin coordinate of the nth
electron, ξj is a continuum
molecular orbital spin-coupled with the scattering electron. aIjk and bmk are variational
coefficients determined by the diagonalization of N+1 Hamiltonian matrix.
The accuracy of the calculation depends solely on the accurate construction of the wave
function given in equation (1). The first summation runs over the target states used in the close-
coupled expansion and a static exchange calculation has a single Hartree-Fock target state in the
first sum. Here one electron is placed in the continuum orbital of the target and the rest of the
electrons move in available target molecular orbitals thus generating target + continuum
configurations. In the second term χm are multi-center quadratically integrable functions, known
as L2 functions constructed from target occupied and virtual molecular orbitals, and are used to

International Journal of Research in Modern Engineering and Emerging Technology (IJRMEET) UGC Approved id_47203
Vol. 5, Sp. Issue: 9, Sept.: 2017 (IJRMEET) ISSN: 2320-6586
342 Online International, Refereed, Impact factor & Indexed Monthly Journal www.raijmr.com
RET Academy for International Journals of Multidisciplinary Research (RAIJMR)
represent correlation and Polarization effects. This sum runs over the minimal number of
configurations, usually 3 or fewer, required to relax orthogonality constraints between the target
molecular orbitals and the functions used to represent the configuration. The continuum orbitals
are centered on the center of mass of the molecule. The present close-coupled calculation uses
the lowest number of target states, represented by a configuration interaction (CI) expansion in
the first term and over a hundred configurations in the second. These configurations allow for
both orthogonality relaxation and short-range Polarization effects.
The complete molecular orbital representation in terms of occupied and virtual target
molecular orbitals are constructed using the Hartree-Fock Self-Consistent Field method with
Gaussian-type orbitals (GTOs) and the continuum orbitals of Faure et al. [26] and included up
to g (l = 4) orbitals. The benefit of employing a partial wave expansion for low energy electron
molecule interaction is its rapid convergence. In the case of dipole-forbidden excitations
(∆𝐽 ≠ 1), where J represents the rotational quantum number, the convergence of the partial
waves is rapid but in the case of dipole-allowed excitations ( 1)J the partial wave expansion
converges slowly due to the long range nature of the dipole interaction. In order to account for
the higher partial waves not included in the fixed nuclei T-matrices, the born correction is
applied. The effect of partial waves higher than l = 4 were included using a Born correction
which requires expressions for the partial waves as well as full Born cross sections. These
expressions were drawn from the work of Chu and Dalgarno [27]. We were constrained to
employ partial waves for the continuum orbital up to l = 4 only, as the representation in
Gaussian type orbitals for the Bessel functions higher than l = 4 were not available. For low
partial waves ( 4)l T matrices computed from the R-matrix calculations are employed to
compute the cross sections. The low partial wave contributions arising from the Born
contribution are subtracted in order that the final cross section set only contains those partial
waves due to the R-matrix calculation. We have performed the calculations with and without
dipole Born corrections.
The R-matrix provides the link between the inner region and the outer region. The R-
matrix is propagated to an asymptotic region where the radial wave-functions describing the
scattering electron can be matched to analytical expressions. For this purpose the inner region is
propagated to the outer region potential until its solution matches with the asymptotic functions
given by the Gailitis expansion [28]. Coupled single center equations describing the scattering in
the outer region are integrated to identify the K-matrix elements. The K-matrix is a symmetric

International Journal of Research in Modern Engineering and Emerging Technology (IJRMEET) UGC Approved id_47203
Vol. 5, Sp. Issue: 9, Sept.: 2017 (IJRMEET) ISSN: 2320-6586
343 Online International, Refereed, Impact factor & Indexed Monthly Journal www.raijmr.com
RET Academy for International Journals of Multidisciplinary Research (RAIJMR)
matrix whose dimensions are the number of open channels. All the observables can be deduced
from it and it can be used to obtain T-matrices using the definition,
2
1-
iKT
iK (2)
These T-matrices are in turn used to obtain various total cross sections. The K-matrix is
diagonalized to obtain the eigenphase sum. The eigenphase sum may be further used to obtain
the position and width of resonances by fitting them to the Breit Wigner profile [29]. Differential
and Momentum transfer cross sections (MTCS) are calculated using POLYDCS program [30].
In fact the MTCS is obtained by integrating the differential cross sections (DCS) with a weight
factor (1-cos).
C The high energy scattering formalism
Even with the latest computing facilities available the R–matrix code cannot be extended
to scattering calculations beyond about 15 to 20 eV hence if intermediate to high energy electron
scattering is to be modeled we must use the well–established SCOP formalism [31, 32]. We
employ partial wave analysis to solve the Schrödinger equation with various model potentials as
input. The interaction of incoming electron with the target molecule can be represented by a
complex optical potential comprising of real (VR) and imaginary parts (VI) ,
( , ) ( , ) ( , )out i R i I iV E r V E r iV E r (3)
such that,
)E(r,V+)E(r,V+(r)V=)E(r,V ipiexstiR (4)
where, the real part VR comprises of static potential (Vst), exchange potential (Vex), and
Polarization potential (Vp). The static potential, (Vst) arises from Coulombic interactions between
the static charge distribution of the target and projectile. It is calculated at the Hartree–Fock
level. The exchange potential (Vex) term accounts for electron exchange interaction between the
incoming projectile and one of the target electrons. The Polarization potential (Vp) represents
approximately short range correlations and long range Polarization effects arising from the
temporary redistribution of the target charge cloud. Note that the SCOP as such does not require
any fitting parameters. The most important basic input for evaluating all these potentials is the
charge density of the target. We have used the atomic charge density derived from the Hartree
Fock wave functions of Bunge et al. [33]. Any e –molecule system is more complex compared
to any e -atom system but this complexity is reduced by adopting a single center approach [34,
35] so as to make a ‘spherical approximation’ applicable. In case of CF2 we reduce the system to
single centre by expanding the charge density of both carbon and fluorine atoms at the center of

International Journal of Research in Modern Engineering and Emerging Technology (IJRMEET) UGC Approved id_47203
Vol. 5, Sp. Issue: 9, Sept.: 2017 (IJRMEET) ISSN: 2320-6586
344 Online International, Refereed, Impact factor & Indexed Monthly Journal www.raijmr.com
RET Academy for International Journals of Multidisciplinary Research (RAIJMR)
mass of the system by employing the Bessel function expansion detailed in Gradshetyn and
Ryzhik [36]. The spherically averaged molecular charge–density ( r ) , is determined from the
constituent atomic charge density using the Hartree Fock wave functions of Bunge et al. [33].
The molecular charge density ( r ) obtained is then renormalized to incorporate the covalent
bonding [37]. In the SCOP method the spherical part of the complex optical potential is treated
exactly by a partial wave analysis to yield various cross sections [38]. Here we have neglected
the non-spherical terms arising from the vibrational and rotational excitations in the full
expansion of the optical potential.
The atomic charge densities and static potentials (Vst) are formulated from the
parameterized Hartree–Fock wave functions given by Bunge et al. [33]. The parameter free
Hara’s ‘free electron gas exchange model’ [39] is used to generate the exchange potential (Vex).
The Polarization potential (Vp) is constructed from the parameter free model of the correlation–
Polarization potential given by Zhang et al. [40]. Here, various multipole non-adiabatic
corrections are incorporated into the intermediate region which will approach the correct
asymptotic form at large ‘r’ smoothly. In the low energy region, the small ‘r’ region is not
important due to the fact that higher–order partial waves are unable to penetrate the scattering
region. However in the present energy region, a large number of partial waves contribute to the
scattering parameters and correct short range behavior of the potential is essential.
The imaginary part in Vopt is called the absorption potential, and Vabsor VI accounts for
the total loss of flux scattered into the allowed electronic excitation or ionization channels. Vabs
is not a long range effect and its penetration towards the origin increases with increasing energy.
This implies that at high energies the absorption potential accounts the inner-shell excitations or
ionization processes that may be closed at low energies.
The well-known quasi-free model form of Staszeweskaet al. [41, 42] is employed for the
absorption part and is given by,
)A+A+)(Akθ(pEk
Tρ(r)=)E(r,V 32F
iF
lociabs 1
22
32Δ
10
8π
2
(5)
where the local kinetic energy of the incident electron is,
)V+V+(VE=T pexstiloc (6)
wherep2 = 2Ei, kF= [3π
2 ( r ) ]1/3
is the Fermi wave vector and A1, A2 and A3 are dynamic
functions that depend on ( x ) , I, and Ei. I is the ionization threshold of the target, ( x ) is
the Heaviside unit step–function and is an energy parameter below which Vabs= 0. Hence,
is the principal factor which decides the value of total inelastic cross section, since below this

International Journal of Research in Modern Engineering and Emerging Technology (IJRMEET) UGC Approved id_47203
Vol. 5, Sp. Issue: 9, Sept.: 2017 (IJRMEET) ISSN: 2320-6586
345 Online International, Refereed, Impact factor & Indexed Monthly Journal www.raijmr.com
RET Academy for International Journals of Multidisciplinary Research (RAIJMR)
value ionization or excitation is not permissible. This is one of the main characteristics of the
Staszeweska model [41, 42]. In the original Staszeweska model [41, 42] I and hence it
ignores the contributions coming from discrete excitations at lower incident energies. This had
been realized earlier by Garcia and Blanco [43] who elaborately discussed the need to modify
value. In our calculations we have treated as a slowly varying function of Ei around I. Such
an approximation is meaningful since fixed at I would not allow molecular excitation at
energies iE I . If is taken as being much lower than the ionization threshold then Vabs,
becomes unexpectedly high near the peak position so in order to overcome this we give a
reasonable minimum value of 0.8I to [35] and express the parameter as a function of Eiaround
I as follows,
)β(E+I=)Δ(E ii 10.8 (7)
The value of the parameter is obtained by requiring that = I (eV) at Ei= Ep, the
value of incident energy at which Qinel reaches its peak. Ep can be found by calculating Qinel by
keeping = I. BeyondEp, is kept constant and is equal to the ionization threshold, I. The
theoretical basis for assuming a variable is discussed in more detail by Vinodkumar et al.
[35].
The complex optical potential thus formulated is used to solve the Schrödinger equation
numerically through a partial wave analysis. This calculation will produce complex phase shifts
for each partial wave which carries a signature of the interactions of the incoming projectile with
the target. At low impact energies only a few partial waves are significant, but as the incident
energy increases, more partial waves are needed for convergence. The phase shifts )(δl thus
obtained are employed to find the relevant cross sections, the total elastic (Qel) and the total
inelastic cross sections (Qinel) using the scattering matrix )(=kS ll 2iδexp [44]. Total cross
sections such as the total elastic (Qel) and the total inelastic cross sections (Qinel) can be derived
from the scattering matrix [44]. The sum of these cross sections will then give the total scattering
cross section (QT).
3 RESULTS AND DISCUSSION
In this study we have carried out comprehensive computations of the total cross section
produced by the collision of electrons with CF2 in the gas phase from 0.01 eV to 2000 eV. Both
of the theoretical formalisms used have their own limits over the range of impact energies. More
elaborately, the ab-initio calculations are computationally viable only up to around 20 eV, while

International Journal of Research in Modern Engineering and Emerging Technology (IJRMEET) UGC Approved id_47203
Vol. 5, Sp. Issue: 9, Sept.: 2017 (IJRMEET) ISSN: 2320-6586
346 Online International, Refereed, Impact factor & Indexed Monthly Journal www.raijmr.com
RET Academy for International Journals of Multidisciplinary Research (RAIJMR)
the SCOP formalism can be employed successfully from threshold of the target to 2000 eV. In
this work we compute the total cross section below the ionization threshold using a close
coupling formalism employing the R-matrix method where total cross section is obtained as sum
of total elastic and total electronic excitation cross sections while beyond ionization threshold we
use the SCOP formalism and the total cross section is obtained as the sum of the total elastic and
inelastic cross sections. The results we obtained are consistent and there is a smooth transition at
the overlap of two formalisms (around 14 eV). Thus it is possible to provide the total cross
section over a wide range of impact energies from meV to keV. We have presented our results in
graphical form and numerical values are tabulated in Table III.
TABLE III.Total cross sections (TCS) for e - CF2 scattering in (Å2)
Energy (eV) TCS (Å2)
Q-mol
Energy (eV) TCS (Å2)
SCOP
0.1 23.64 12.0 16.65
0.3 21.95 15.0 15.06
0.5 25.95 20.0 13.80
0.7 59.47 25.0 13.23
0.8 77.79 30.0 12.93
1.0 34.40 50.0 12.33
1.06 30.01 60.0 12.04
2.0 18.86 70.0 11.70
3.0 16.59 80.0 11.29
4.0 15.22 90.0 10.85
5.0 14.46 100.0 10.43
6.0 13.81 300.0 5.81
7.0 13.22 500.0 4.19
8.0 12.91 700.0 3.34
9.0 12.91 1000.0 2.58
10.0 13.34 1500.0 1.89
11.0 14.18 2000.0 1.50
Figure 1 shows a comparison of the present total cross section for e -CF2 scattering for
0.1 eV to 20 eV. We performed calculations using static exchange (SE) and static exchange plus
Polarization (SEP) models. Our data is compared with the theoretical data of Rozumet al. [6]
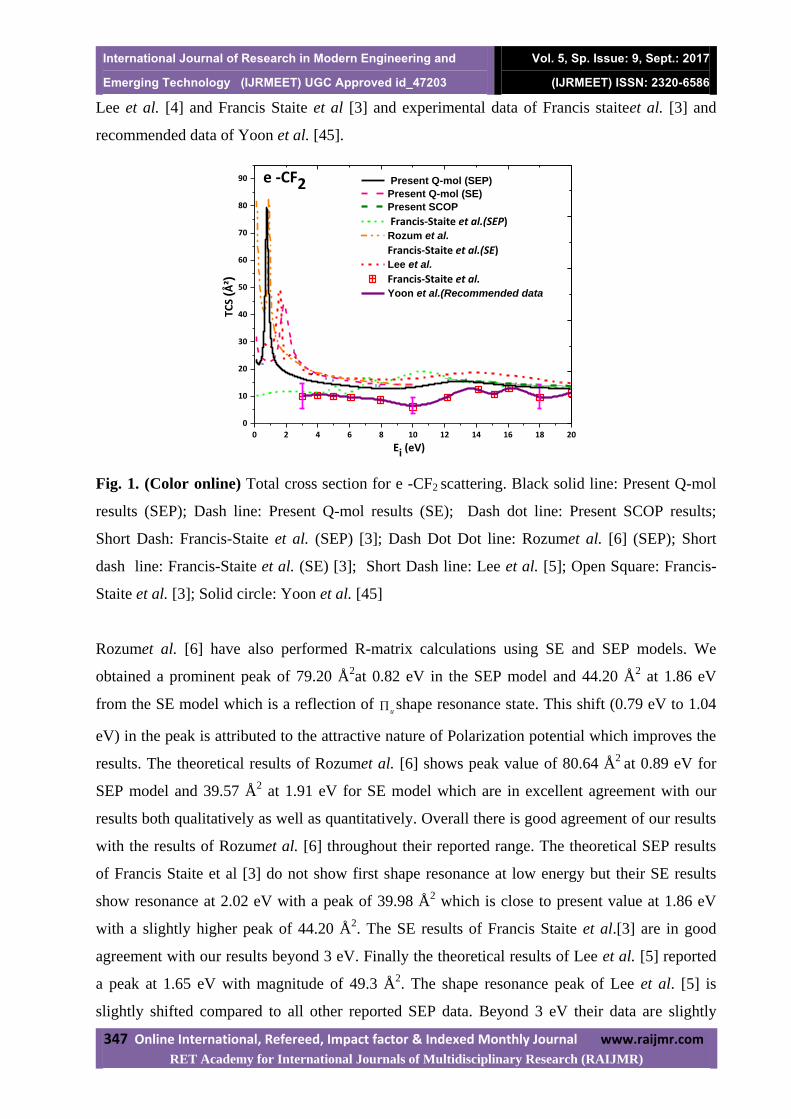
International Journal of Research in Modern Engineering and Emerging Technology (IJRMEET) UGC Approved id_47203
Vol. 5, Sp. Issue: 9, Sept.: 2017 (IJRMEET) ISSN: 2320-6586
347 Online International, Refereed, Impact factor & Indexed Monthly Journal www.raijmr.com
RET Academy for International Journals of Multidisciplinary Research (RAIJMR)
Lee et al. [4] and Francis Staite et al [3] and experimental data of Francis staiteet al. [3] and
recommended data of Yoon et al. [45].
0 2 4 6 8 10 12 14 16 18 20
0
10
20
30
40
50
60
70
80
90 Present Q-mol (SEP)
Present Q-mol (SE)
Present SCOP
Francis-Staite et al.(SEP) Rozum et al.
Francis-Staite et al.(SE) Lee et al.
Francis-Staite et al. Yoon et al.(Recommended data
TCS
(Ų)
e -CF2
Ei (eV)
Fig. 1. (Color online) Total cross section for e -CF2 scattering. Black solid line: Present Q-mol
results (SEP); Dash line: Present Q-mol results (SE); Dash dot line: Present SCOP results;
Short Dash: Francis-Staite et al. (SEP) [3]; Dash Dot Dot line: Rozumet al. [6] (SEP); Short
dash line: Francis-Staite et al. (SE) [3]; Short Dash line: Lee et al. [5]; Open Square: Francis-
Staite et al. [3]; Solid circle: Yoon et al. [45]
Rozumet al. [6] have also performed R-matrix calculations using SE and SEP models. We
obtained a prominent peak of 79.20 Å2at 0.82 eV in the SEP model and 44.20 Å
2 at 1.86 eV
from the SE model which is a reflection of u shape resonance state. This shift (0.79 eV to 1.04
eV) in the peak is attributed to the attractive nature of Polarization potential which improves the
results. The theoretical results of Rozumet al. [6] shows peak value of 80.64 Å2
at 0.89 eV for
SEP model and 39.57 Å2 at 1.91 eV for SE model which are in excellent agreement with our
results both qualitatively as well as quantitatively. Overall there is good agreement of our results
with the results of Rozumet al. [6] throughout their reported range. The theoretical SEP results
of Francis Staite et al [3] do not show first shape resonance at low energy but their SE results
show resonance at 2.02 eV with a peak of 39.98 Å2 which is close to present value at 1.86 eV
with a slightly higher peak of 44.20 Å2. The SE results of Francis Staite et al.[3] are in good
agreement with our results beyond 3 eV. Finally the theoretical results of Lee et al. [5] reported
a peak at 1.65 eV with magnitude of 49.3 Å2. The shape resonance peak of Lee et al. [5] is
slightly shifted compared to all other reported SEP data. Beyond 3 eV their data are slightly

International Journal of Research in Modern Engineering and Emerging Technology (IJRMEET) UGC Approved id_47203
Vol. 5, Sp. Issue: 9, Sept.: 2017 (IJRMEET) ISSN: 2320-6586
348 Online International, Refereed, Impact factor & Indexed Monthly Journal www.raijmr.com
RET Academy for International Journals of Multidisciplinary Research (RAIJMR)
higher compared all data presented here. The low energy shape resonance structure is not visible
in the available experimental as the experimental data reported by Francis Staite el al. [3] is from
2 eV to 20 eV and the shape resonance occurs below 2 eV. We also observed another small
structure at 13.42 eV in our low energy total cross section results which is also seen at the same
energy in the data of Lee et al. [4]. This structure is also reflected in the experimental result of
Francis-Staite et al. [3] at 10.35 eV. This is due to 2B2 scattering channel. The experimental data
of Francis-Staite et al. [3] and recommended data of Yoon et al. [45] are lower compared to all
theoretical results. This discrepancy in ICS is due to the fact that they obtained their ICS data by
integrating the DCS data which introduces an error of 45% due to extrapolation of DCS data in
the range 20o to 0
o and from 135
o to 180
o. However our data show very good agreement with the
experimental data of Francis Staite et al. [3] beyond 15 eV. There is smooth crossover of the our
R matrix data with SCOP data at around 14 eV.
In Figure 2 we present a comparison of our total cross section data over a wide energy
range from 0.1 eV to 2000 eV. The data over such a wide range is an amalgamation of data
obtained through the two formalisms, R-matrix and SCOP. The data obtained through R-matrix
and SCOP agrees and confirms a smooth transition at around 14 eV from one methodology to
the other. We have not shown our SE data and SE data of Francis Staite et al. [3] and Rozumet
al. [6] in Figure 2 as they are already discussed in Figure 1. Also we have already discussed the
low energy data (up to 20 eV) in Figure1. hence we discuss here only intermediate to high
energy data. The lone theoretical data reported from low to high energy is from Lee et al. [5].
The total cross section of Lee et al. [5] is obtained by summing their elastic cross sections and
absorption cross section beyond 15 eV. The present SCOP data finds excellent agreement with
data of Lee et al. [5] beyond 50 eV below which their data are higher compared to the present
data. Theoretical data reported by Antony et al. [7] are much higher compared to our data at 50
eV but this discrepancy decreases with increase in energy and after 200 eV they merge with
present data. The experimental data reported by Maddernet al. [4] are slightly lower compared to
our data but within experimental uncertainty. There is a lone experimental data set reported by
Francis-Staite et al. [3] at 50 eV beyond which no other experimental data is reported. There are
only two theoretical data sets at higher energies with which to compare our data; one reported by
Lee et al. [4] and other reported by Antony et al. [6]. The results of Lee et al. [4] are lower
compared to the present results while those of Antony et al. [6] are higher up to 300 eV beyond
which all data tend to merge. There is discrepancy between our data and measured data of
Francis Staite et al. [3]. This is attributed to large error (~45%) which arises due to extrapolation

International Journal of Research in Modern Engineering and Emerging Technology (IJRMEET) UGC Approved id_47203
Vol. 5, Sp. Issue: 9, Sept.: 2017 (IJRMEET) ISSN: 2320-6586
349 Online International, Refereed, Impact factor & Indexed Monthly Journal www.raijmr.com
RET Academy for International Journals of Multidisciplinary Research (RAIJMR)
of DCS from 20o to 0
o and 135
o to 180
o to obtain the integral cross section as discussed earlier.
The discrepancy is more at low energy below 10 eV and above 10 eV there is better agreement
with our data.
0.1 1 10 100 1000
0
20
40
60
80
100
TC
S (
Ų)
Ei(eV)
Our Q-mol (SEP)
Our SCOP
Rozum et al.
Lee et al.
Antony et al.
Francis-Staite et al.(SEP)
Maddern et al.
Francis-Staite et al.
Yoon et al. (Recommended Data)
e-CF2
Fig. 2.(Color online) Total cross section for e -CF2 scattering. Black solid line: OurQ-mol
results (SEP); Dash dot line: Our SCOP results; Short Dash dot line: Antony et al. [7]; Short
Dot: Francis-Staite et al. (SEP) [3]; Dash Dot Dot line: Rozumet al. [6] (SEP); Short Dash line:
Lee et al. [5]; Open star: Maddern et al. [4]; Open Square: Francis-Staite et al. [3]; Solid circle:
Yoon et al. [45]
Figure 3 shows the eigenphase sum for various doublet scattering states (2A1,
2B1,
2A1
and 2B2) of the CF2 system. It is important to study eigenphase sum as they indicate the position
of electron scattering resonances which are important features in low energy regime. Resonances
occur when the incident electron is temporarily captured by the target to form a negative ion (an
anion) which subsequently decays either by auto detachment (often leaving the target
vibrationally/electronically excited) or by dissociating the molecule to produce a net product
anion (a process known as Dissociative Electron Attachment (DEA)). A recursive procedure for
detecting and performing Breit-Wigner fits to the eigenphase diagram and is done through
program RESON [13]. This program generates new energy points and marks those points where
the numerically computed values of second derivative changes sign from positive to negative.
Finer grids are constructed about each of these points which are used as inputs for Breit-Wigner
fit [13] and the two most important parameters (position and width) related to resonances are

International Journal of Research in Modern Engineering and Emerging Technology (IJRMEET) UGC Approved id_47203
Vol. 5, Sp. Issue: 9, Sept.: 2017 (IJRMEET) ISSN: 2320-6586
350 Online International, Refereed, Impact factor & Indexed Monthly Journal www.raijmr.com
RET Academy for International Journals of Multidisciplinary Research (RAIJMR)
0 2 4 6 8 10 12 14
-4.5
-4.0
-3.5
-3.0
-2.5
-2.0
-1.5
-1.0
-0.5
0.0
0.5
1.0
1.5
2.0
Eige
npha
ses
Ei (eV)
2A1
2B1
2B2
2A2
e -CF2 DZP CI
obtained. Table IV gives the positions and widths of resonances obtained in the our case using
R-matrix calculations.
TABLE IV: Position and width of resonance states.
Resonance
state
Position
(eV)
Width
(eV)
Resonance
state
Position
(eV)
Width
(eV)
Present Others
2B1 0.81 0.24
2B1 0.95[6] 0.18[6]
2A1
6.14 ---
2A1 5.61[6] 2.87[6]
2B2 13.4 ---
2B2 13.5[5] --
2
B2 15.0[4] --
The 2B1 state shows a prominent structure in the eigenphase sum which is reflected as a
strong peak of 65.59 Å2 in the TCS curve at 1.04 eV and it may be attributed to formation of a
2∏u shape resonance. We also observe resonance structure around 6.14 eV due to
2A1 scattering
which is also reflected in our MTCS curve (Figure 6) and this structure is also observed at 5.6
eV by Rozum et al. [6]. The 2B1 excitation cross section also shows an increase around 13.5 eV
and this is seen as structure in the TCS curve at 13.4 eV. The 2B2 resonance was reported at 13.5
eV by Francis Staite et al. [3] and same was reported by Lee et al. [5] at 15 eV. No other
prominent structures are seen in the eigenphase sum below 14 eV for any symmetry and the
same holds true for the total cross section curve. Eigenphase sums also show the important
channels to include in the calculations. It is to be noted that as more states are included in the CC
expansion and retained in the outer region calculation, the eigenphase sum increases reflecting
the improved modeling of Polarization interaction.
Fig. 3.(Color online) Eigenphase sums of e –CF2 for a 10-state CC calculation.
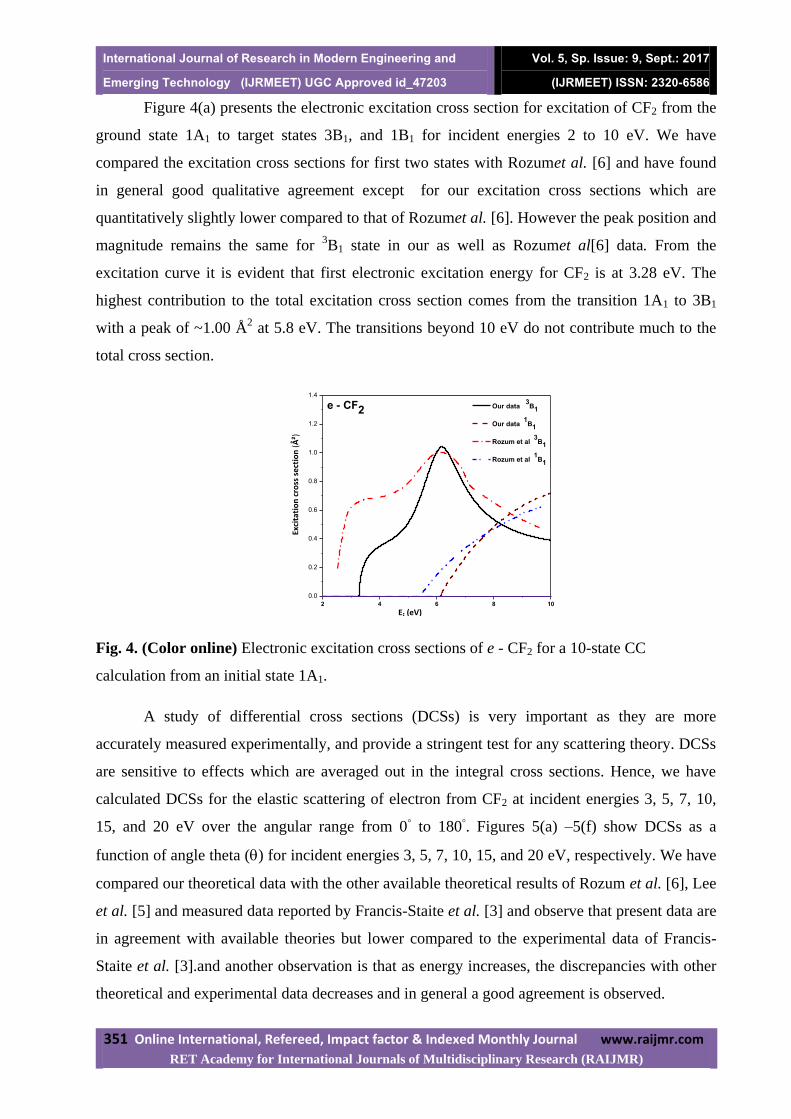
International Journal of Research in Modern Engineering and Emerging Technology (IJRMEET) UGC Approved id_47203
Vol. 5, Sp. Issue: 9, Sept.: 2017 (IJRMEET) ISSN: 2320-6586
351 Online International, Refereed, Impact factor & Indexed Monthly Journal www.raijmr.com
RET Academy for International Journals of Multidisciplinary Research (RAIJMR)
Figure 4(a) presents the electronic excitation cross section for excitation of CF2 from the
ground state 1A1 to target states 3B1, and 1B1 for incident energies 2 to 10 eV. We have
compared the excitation cross sections for first two states with Rozumet al. [6] and have found
in general good qualitative agreement except for our excitation cross sections which are
quantitatively slightly lower compared to that of Rozumet al. [6]. However the peak position and
magnitude remains the same for 3B1 state in our as well as Rozumet al[6] data. From the
excitation curve it is evident that first electronic excitation energy for CF2 is at 3.28 eV. The
highest contribution to the total excitation cross section comes from the transition 1A1 to 3B1
with a peak of ~1.00 Å2 at 5.8 eV. The transitions beyond 10 eV do not contribute much to the
total cross section.
2 4 6 8 10
0.0
0.2
0.4
0.6
0.8
1.0
1.2
1.4
e - CF2
Ei (eV)
Exci
tati
on
cro
ss s
ect
ion
(Å
²)
Our data 3B1
Our data 1B1
Rozum et al 3B1
Rozum et al 1B1
Fig. 4. (Color online) Electronic excitation cross sections of e - CF2 for a 10-state CC
calculation from an initial state 1A1.
A study of differential cross sections (DCSs) is very important as they are more
accurately measured experimentally, and provide a stringent test for any scattering theory. DCSs
are sensitive to effects which are averaged out in the integral cross sections. Hence, we have
calculated DCSs for the elastic scattering of electron from CF2 at incident energies 3, 5, 7, 10,
15, and 20 eV over the angular range from 0 to 180
. Figures 5(a) –5(f) show DCSs as a
function of angle theta () for incident energies 3, 5, 7, 10, 15, and 20 eV, respectively. We have
compared our theoretical data with the other available theoretical results of Rozum et al. [6], Lee
et al. [5] and measured data reported by Francis-Staite et al. [3] and observe that present data are
in agreement with available theories but lower compared to the experimental data of Francis-
Staite et al. [3].and another observation is that as energy increases, the discrepancies with other
theoretical and experimental data decreases and in general a good agreement is observed.

International Journal of Research in Modern Engineering and Emerging Technology (IJRMEET) UGC Approved id_47203
Vol. 5, Sp. Issue: 9, Sept.: 2017 (IJRMEET) ISSN: 2320-6586
352 Online International, Refereed, Impact factor & Indexed Monthly Journal www.raijmr.com
RET Academy for International Journals of Multidisciplinary Research (RAIJMR)
0 20 40 60 80 100 120 140 160 180
1
10
DC
S (
Ų)
Angle ()
Our data
Lee et al.7 eV
0 20 40 60 80 100 120 140 160 180
0.1
1
10
Our data
Lee et al.
Francis et al.
DC
S (
Ų)
Angle ()
10 eV
Fig. 5. (Color online) DCS of e – CF2 scattering at (a) 3 eV, (b) 5 eV, (c) 7 eV, (d) 10 eV, (e)
15eV and (f) 20 eV.
0 20 40 60 80 100 120 140 160 180
1
10
Our data
Lee et al.
Rozum and Tennyson
Francis et al.
DC
S (
Ų)
Angle ()
3 eV
0 20 40 60 80 100 120 140 160 180
1
10
Present
Lee et al
Francis et al
DC
S (
Ų)
Angle ()
5 eV
0 20 40 60 80 100 120 140 160 180
1
10
Our data
Lee et al.
Rozum and Tennyson
Francis et al.
DC
S (
Ų)
Angle ()
3 eV
0 20 40 60 80 100 120 140 160 180
1
10
Present
Lee et al
Francis et alD
CS
(Å
²)
Angle ()
5 eV
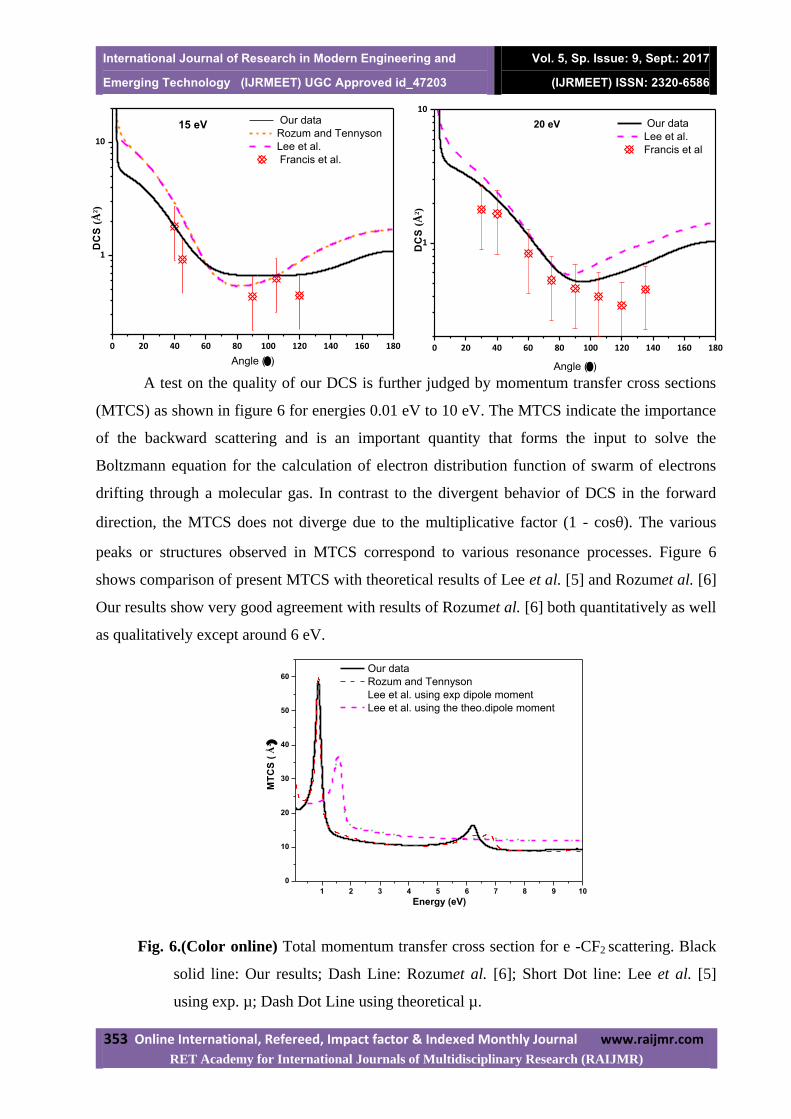
International Journal of Research in Modern Engineering and Emerging Technology (IJRMEET) UGC Approved id_47203
Vol. 5, Sp. Issue: 9, Sept.: 2017 (IJRMEET) ISSN: 2320-6586
353 Online International, Refereed, Impact factor & Indexed Monthly Journal www.raijmr.com
RET Academy for International Journals of Multidisciplinary Research (RAIJMR)
0 20 40 60 80 100 120 140 160 180
1
10
Our data
Rozum and Tennyson
Lee et al.
Francis et al.
DC
S (
Ų)
Angle ()
15 eV
0 20 40 60 80 100 120 140 160 180
1
10
Our data
Lee et al.
Francis et al
DC
S (
Ų)
Angle ()
20 eV
A test on the quality of our DCS is further judged by momentum transfer cross sections
(MTCS) as shown in figure 6 for energies 0.01 eV to 10 eV. The MTCS indicate the importance
of the backward scattering and is an important quantity that forms the input to solve the
Boltzmann equation for the calculation of electron distribution function of swarm of electrons
drifting through a molecular gas. In contrast to the divergent behavior of DCS in the forward
direction, the MTCS does not diverge due to the multiplicative factor (1 - cosθ). The various
peaks or structures observed in MTCS correspond to various resonance processes. Figure 6
shows comparison of present MTCS with theoretical results of Lee et al. [5] and Rozumet al. [6]
Our results show very good agreement with results of Rozumet al. [6] both quantitatively as well
as qualitatively except around 6 eV.
1 2 3 4 5 6 7 8 9 10
0
10
20
30
40
50
60 Our data
Rozum and Tennyson
Lee et al. using exp dipole moment
Lee et al. using the theo.dipole moment
MT
CS
(Å
²
Energy (eV)
Fig. 6.(Color online) Total momentum transfer cross section for e -CF2 scattering. Black
solid line: Our results; Dash Line: Rozumet al. [6]; Short Dot line: Lee et al. [5]
using exp. µ; Dash Dot Line using theoretical µ.

International Journal of Research in Modern Engineering and Emerging Technology (IJRMEET) UGC Approved id_47203
Vol. 5, Sp. Issue: 9, Sept.: 2017 (IJRMEET) ISSN: 2320-6586
354 Online International, Refereed, Impact factor & Indexed Monthly Journal www.raijmr.com
RET Academy for International Journals of Multidisciplinary Research (RAIJMR)
The first prominent peak is the reflection of 2B1 scattering which has identical magnitude
and position (0.88 eV and 60.01 Å2) as seen in results of Rozumet al. [6] and this peak is also
reflected in the TCS (see Figs. 1 & 2). The second peak is at 6.22 eV with magnitude of 16.52
Å2 and it is at 6.77 eV with magnitude of 14.30 Å
2 in the results of Rozumet al. [6]. The results
of Lee et al. [5] show only one structure and shows shifted first peak compared to our results and
the results of Rozumet al. [6] at 1.62 eV with magnitude of 36.85 Å2.
10 100 1000
0.0
0.5
1.0
1.5
2.0
2.5
3.0
3.5
4.0
4.5 Our BEB
Our CSP-ic
Antony et al
si-BED
Kim et al.
Deutsch et al.
Huo et al.
Tarnovsky et al.
Qio
n(Å
2)
Energy (eV)
CF2
Fig. 7. (Color online) Total ionization cross section for e -CF2 scattering. Black solid line: Our
BEB results; Dash Dot Dot line: Present CSP-ic results; Dash line: Antony et al. [7]; Dotted line:
si-BED [3]; Dash Dot line: Kim et al. [11]; Short Dash Dot line: Deutsch et al. [10]; Open
Circle: Huo et al. [8]; Open circle: Tarnovsky et al. [9]
Finally in Figure 7 we show the comparison of our total ionization cross section of e –
CF2 scattering with available results. The theoretical results are reported by three groups [7, 10,
11] and experimentally by two groups [9, 10]. Antony et al. [7] used CSP-ic method, Deutsch et
al. [10] used DM formalism and Kim et al. [11] used BEB formalism to calculate total ionization
cross section. We have reported total ionization cross sections using CSP-ic method and BEB
formalism. The CSP-ic method is described in detail in our earlier publication [35] and hence not
repeated here. We find here that experimental data are much lower compared to all theoretical
results and have high uncertainty of ~25%. This is due to the fact that CF2 is reactive radical and
it has tendency to adhere to the wall of the chamber [3]. All theoretical results are quantitatively
and qualitatively in good agreement with one another except siBED results provided by Deustch
et al. [10]. However our CSP-ic data show a peak at same energy as both the experimental

International Journal of Research in Modern Engineering and Emerging Technology (IJRMEET) UGC Approved id_47203
Vol. 5, Sp. Issue: 9, Sept.: 2017 (IJRMEET) ISSN: 2320-6586
355 Online International, Refereed, Impact factor & Indexed Monthly Journal www.raijmr.com
RET Academy for International Journals of Multidisciplinary Research (RAIJMR)
results [8, 9] at ~80 eV. Experimental data provided by Huoet al. [8] and Tarnovskyet al. [9] are
lower compared to all theoretical data except siBED data [10].
4 CONCLUSIONS
A detailed study of e -CF2 system in terms of eigenphase, electronic excitations,
differential cross sections, momentum transfer, ionization and total cross sections has been
performed and interaction cross sections are reported in the article. We demonstrate here with
the help of eigenphase diagram (Figure 3.) that a CC calculation can give much more
information than a simple static-exchange calculation at low energies. We can readily obtain the
position of resonances that may arise due to temporary negative ion formation from the
eigenphase plots. We obtained a prominent peak of 70.20 Å2at 0.81 eV for SEP model and 44.20
Å2 at 1.86 eV for SE model which is reflection of
u shape resonance state. This resonance is
also reflected in the MTCS curve (Figure 6) at 0.88 eV with magnitude of 60.01 Å2.We also
observed another small structure at 13.4 eV in our low energy total cross section results which is
also seen at the same energy in the data of Lee et al. [5]. This structure is also reflected in the
experimental result of Francis–Staite et al. [3] at 10.35 eV. This is due to 2B2 scattering.
We have performed close coupling calculations employing the UK molecular R-matrix
code below the ionization threshold of the target while the SCOP formalism is used beyond it
[46 – 49]. We have demonstrated through Figures 1and 2 that results obtained using these two
formalisms are consistent and show a smooth transition at the overlap energy (~14 eV). This
confirms the validity of our theories and hence enables us to predict the total cross sections from
low energy (0.1 eV) to high energy (2000 eV).
CF2 is a moderately studied target both by theoreticians and experimentalists for reasons
discussed earlier. Hence we have chosen this target so that present methodology may be put to
the test while still benchmarking our results by comparing with previous works. From the results
presented here we conclude that our results are in good agreement with available data.
Therefore, we are confident that this methodology may be employed further to calculate total
cross sections over a wide range of impact energies in other molecular systems where
experiments are difficult or impossible to perform. Total cross section data is important in a
variety of applications from aeronomy to plasma modeling. Accordingly such a methodology
maybe built into the design of online databases to provide the ‘data user’ with the opportunity to
request their own set of cross sections for use in their own research. Such a prospect will be
explored by the emerging Virtual Atomic and Molecular Data Centre (VAMDC) [50].

International Journal of Research in Modern Engineering and Emerging Technology (IJRMEET) UGC Approved id_47203
Vol. 5, Sp. Issue: 9, Sept.: 2017 (IJRMEET) ISSN: 2320-6586
356 Online International, Refereed, Impact factor & Indexed Monthly Journal www.raijmr.com
RET Academy for International Journals of Multidisciplinary Research (RAIJMR)
REFERENCES
1. P. Chabert, H. Abada, J. -P. Booth, and M. A. Lieberman, J. Appl. Phys. 94, 76 (2003)
2. T. Nakano and H. Sugai, J. Phys. D Appl. Phys. 26, 1909 (1993)
3. J. R. Francis-Staite, T. M. Maddern, M. J. Brunger, S. J. Buckman, C. Winstead, V. McKoy, M.
A. Bolorizadeh, and H. Cho, Phys. Rev. A 79, 052705 (2009)
4. T. M. Maddern, L. R. Hargreaves, J. R. Francis-Staite, M. J. Brunger, S. J. Buckman, C.
Winstead and V. McKoy, Phys. Rev. Lett. 100, 063202 (2008)
5. M. -T. Lee, I. Iga, L. E. Machado, L. M. Brescansin, E. A. y Castro, and G. L. C. de Souza, Phys.
Rev. A 74, 052716 (2006)
6. I. Rozum, P. Lima˜o-Vieira, S. Eden, J. Tennyson, and N. J. Mason,J. Phys. Chem. Ref. Data, 35,
267 (2006)
7. B. K. Antony, K. N. Joshipura,and N. J. Mason, J. Phys. B: At. Mol. Opt. Phys. 38, 189 (2005)
8. W. M. Huo, V. Tarnovsky and K. H. Becker, Chem. Phys. Lett.358, 328 (2002)
9. V. Tarnovsky, P. Kurunczi, D. Rogozhnikov and K. Becker, Int. J. of Mass Spectrom. andIon
Pro. 128, 181(1993)
10. H. Deutsch, T. D. Meark, V. Tarnovsky, K. Becker, C. Cornelissen, L. Cespiva, and V. Bonacic-
Koutecky, Int. J. Mass Spectrom. Ion-Process. 137, 77, (1994)
11. Y.-K. Kim and K. K. Irikura, Proceedings of the 2nd International Conference on Atom Molecular
Data and their Applications, edited by K. Barrington and K. L. Bell, AIP Conf. Proc. No. 543 p.
220 (AIP, New York, 2000)
12. I. Schneider, Adv. At., Mol., Opt. Phys., 1994, 33,183.
13. J. Tennyson, Phys. Rep. 491, 29 (2010)
14. A. Jain, J. Chem. Phys. 86, 1289 (1987)
15. L. E. Machado, R. T. Sugohara, A. S. dos Santos, M.-T. Lee, I. Iga, G. L. C. de Souza, M. G. P.
Homem, S. E. Michelin, and L. M. Brescansin, Phys. Rev. A 84, 032709 (2011)
16. J. Tennyson, D. B. Brown, J. M. Munro, I. Rozum, H. N. Varambhia, and N. Vinci, J. Phys.:
Conf. Ser. 86, 012001 (2007)
17. See http://cccbdb.nist.gov/.
18. N. Russo, E. Sicilia, and M. Toscano, J. Chem. Phys. 97, 5031 (1992)
19. Z. -L. Cai, J. Phys. Chem., 97, 8399 (1993)
20. B. I. Schneider and T. N. Rescigno, Phys. Rev. A 37, 3749 (1988)
21. W. H. Kirchhoff, D. R. LideJr, and F. X. Powell, J. of Mol. Spec., 47, 491498 (1973)
22. K. Takatsuka and V. McKoy, Phys. Rev. A 30, 1734 (1984)
23. H. D. Meyer, Chem. Phys. Lett. 223, 465 (1994)
24. C. J. Noble and R. K. Nesbet, Comput. Phys. Commun. 33, 399 (1984)
25. A. M. Arthurs and A. Dalgarno, Proc. Phys. Soc. London, Sect. A 256, 540 (1960)

International Journal of Research in Modern Engineering and Emerging Technology (IJRMEET) UGC Approved id_47203
Vol. 5, Sp. Issue: 9, Sept.: 2017 (IJRMEET) ISSN: 2320-6586
357 Online International, Refereed, Impact factor & Indexed Monthly Journal www.raijmr.com
RET Academy for International Journals of Multidisciplinary Research (RAIJMR)
26. A. Faure, J. D. Gorfinkiel, L. A. Morgan, and J. Tennyson, Comput. Phys. Commun. 144, 224
(2002)
27. S. I. Chu and A. Dalgarno, Phys. Rev. A 10, 788 (1974)
28. M. Gailitis, J. Phys. B 9, 843 (1976)
29. J. Tennyson and C. J. Nobel, Comput. Phys. Commun. 33, 421 (1984)
30. N. Sanna and F. A. Gianturco, Comput. Phys. Commun. 114, 142 (1998)
31. M. Vinodkumar, K. N. Joshipura, C. G. Limbachiya, and B. K. Antony, Eur. Phys. J. D 37, 67
(2006)
32. K. N. Joshipura, M. Vinodkumar, C. G. Limbachiya, and B. K. Antony, Phys. Rev. A 69, 022705
(2004)
33. C. F. Bunge, J. A. Barrientos, and A. V. Bunge, At. Data Nucl. Data Tables 53, 113 (1993)
34. M. Vinodkumar, C. Limbachiya, K. Korot, and K. N. Joshipura, Eur. Phys. J. D 48, 333 (2008)
35. M. Vinodkumar, K. Korot, and P. C. Vinodkumar, Int. J. Mass Spectrom. 305, 26 (2011)
36. I. Gradashteyn and I. M. Ryzhik, Tables of Integrals, Series and Products (Academic, New York,
1980)
37. M. Vinodkumar, K. N. Joshipura, C. Limbachiya, and N. Mason, Phys. Rev. A 74, 022721
(2006)
38. A. Jain and K. L. Baluja, Phys. Rev. A 45, 202 (1992)
39. S. Hara, J. Phys. Soc. Jpn. 22, 710 (1967)
40. X. Zhang, J. Sun, and Y. Liu, J. Phys. B 25, 1893 (1992)
41. G. Staszewska, D. W. Schwenke, D. Thirumalai, and D. G. Truhlar, Phys. Rev. A 28, 2740
(1983)
42. G. Staszewska, D. M. Schwenke, and D. G. Truhlar, J. Chem. Phys. 81, 3078 (1984)
43. F. Blanco and G. Garcia, Phys. Rev. A 67, 022701 (2003)
44. C. J. Joachain, Quantum Collision Theory (North - Holland, Amsterdam, 1983)
45. J.-S. Yoon, M.-Y. Song, H. Kato, M. Hoshino, H. Tanaka, M. J. Brunger, S. J. Buckman and H.
Cho, J. Phys. Chem. Ref. Data. 39, 033106 (2010)
46. M. Vinodkumar, A. Barot, and B. Antony, J. Chem. Phys. 136, 184308 (2012)
47. M. Vinodkumar and M. Barot, J. Chem. Phys. 137, 074311 (2012)
48. M. Vinodkumar, C. Limbachiya, A. Barot, and N. Mason, Phys. Rev. A 87, 012702 (2013)
49. A. Barot, D. Gupta, M. Vinodkumar, and Bobby Antony, Phys. Rev. A 87, 062701 (2013)
50. M. L. Dubernet, V. Boudon, J. L. Culhane, M. S. Dimitrijevic, A. Z. Fazliev, C. Joblin, F. Kupka,
G. Leto, P. Le Sidaner, P. A. Loboda, H. E.Mason, N. J. Mason, C. Mendoza, G. Mulas, T. J.
Millar, L. A. Nu˜nez, V. I. Perevalov, N. Piskunov, Y. Ralchenko, G. Rixonet al., J. Quant.
Spectrosc. Radiat. Transfer 111, 2151 (2010)

International Journal of Research in Modern Engineering and Emerging Technology (IJRMEET) UGC Approved id_47203
Vol. 5, Sp. Issue: 9, Sept.: 2017 (IJRMEET) ISSN: 2320-6586
358 Online International, Refereed, Impact factor & Indexed Monthly Journal www.raijmr.com
RET Academy for International Journals of Multidisciplinary Research (RAIJMR)
Frequency and temperature dependent dielectric study of
MoSe2 crystals
Dipak Sahay#, Ripal Parmar
1, B.A.Thakar
2, R.K.Shah
3, R.J.Pathak*
#Government Engineering College, Modasa, Gujarat
1Department of Physics, Hemchandracharya North Gujarat University, Patan, Gujarat
2B.S.Patel Polytechnic,Ganpat University,Kherva,Gujarat
3Art,Science and R.A.Patel Commerce College, Bhadran, Gujarat
*R.R.Mehta College of Science, Palanpur
#Email: [email protected]
Abstract: Transition-metal dichalcogenide (TMDC) crystals have emerged as a new class of
semiconductors that display distinctive properties. An interesting group of compounds which has
received Increasing attention from the fundamental as well as the industrial point of view in recent
years. Studying the dielectric constant as a function of frequency and temperature, the various
polarization mechanisms in solids can be understood. The real part of dielectric constant ε′, imaginary
part of dielectric constant ε′′, the dissipation factor tan δ and the alternating current conductivity ζac were
measured in an applied ac electric field of frequencies extending from 100 Hz to 1MHz with temperature
variation of 303 k to 525 k. Based on the dependencies of these dielectric parameters on both the
frequency and temperature, the dielectric properties of the crystals under investigation were elucidated
and analyzed.
Keywords: Transition-metal dichalcogenide (TMDC)
1. Introduction:
The study of dielectric properties of solids often gives good insight into the electric field
distribution within the solids. The various polarization mechanisms in solids can be understood by
studying the dielectric constant as a function of frequency and temperature. A careful study of the
MoSe2 suggests to study the variation of dielectric constant and loss factor of crystalline MoSe2
crystals with respect to frequency and temperature.

International Journal of Research in Modern Engineering and Emerging Technology (IJRMEET) UGC Approved id_47203
Vol. 5, Sp. Issue: 9, Sept.: 2017 (IJRMEET) ISSN: 2320-6586
359 Online International, Refereed, Impact factor & Indexed Monthly Journal www.raijmr.com
RET Academy for International Journals of Multidisciplinary Research (RAIJMR)
The present chapter embodies an in-depth analysis of the variation of dielectric parameters of
MoSe2 crystals in the frequency range 100 Hz to 1 MHz using LCR meter model Agilent 4284A and
temperature range 303K to 523K.
2. Experimental set up:
2.1 High temperature LCR measurement setup :
The grown crystals or pallets were employed. The geometrical dimension of all the samples
were measured using a traveling microscope and the thickness has been measured using micrometer
screw. The dielectric measurements were carried out using the standard two electrode method. The
specimen was mounted in between two flat stainless steel parallel electrodes of a specially designed
sample holder. Both the upper and lower base of the holder can be screwed in for proper contact of
the sample with the electrode. The sample holder was enclosed in a specially built resistance heating
furnace which is capable to provide temperature upto 625K. The whole measurement setup is shown
in Figure 1. To measure all dielectric parameters Automation and Controlling software “LABVIEW”
is used. The parameters like the thickness and area of the sample, starting and ending temperature
and frequency as well as desired steps to increase temperature and frequency has been set in
software. These input data are essential in order to measure dielectric parameters at desired
temperature and frequencies. The digital temperature controller DT84848 is used to monitor the
preferred temperature of the specimen. When preferred temperature is achieved HP4284A LCR
meter will scan all the frequencies and resultant data is feeded in the storage device.

International Journal of Research in Modern Engineering and Emerging Technology (IJRMEET) UGC Approved id_47203
Vol. 5, Sp. Issue: 9, Sept.: 2017 (IJRMEET) ISSN: 2320-6586
360 Online International, Refereed, Impact factor & Indexed Monthly Journal www.raijmr.com
RET Academy for International Journals of Multidisciplinary Research (RAIJMR)
Figure 1: High temperature LCR experiment set up.
2.2 Experimental Details
The grown crystals of MoSe2 by Direct Vapor Transport (DVT) technique were mounted in
the sample holder. The capacitance and the dissipation factor were measured in the frequency range
100 Hz to 1 MHz with different temperature from room temperature to 523K, in the step of 50K
temperature using 4284A LCR meter. From capacitance and dissipation factor all the other parameter
can be calculated.
The dielectric constant “ε” of the sample is calculated using the formula
0C
C
where C is measured capacitance and C0 is calculated by the given equation.
t
AC 0
0
where ε0 is the permittivity of free space (8.854 X 10⁻¹² fm-1), “A” and “t” are the area and thickness
of the samples respectively.
The dielectric loss tangent was computed as
Dftan
where “D” is the dissipation factor and “ f ” is the frequency in kHz.
The resistivity has been determined using the formula:

International Journal of Research in Modern Engineering and Emerging Technology (IJRMEET) UGC Approved id_47203
Vol. 5, Sp. Issue: 9, Sept.: 2017 (IJRMEET) ISSN: 2320-6586
361 Online International, Refereed, Impact factor & Indexed Monthly Journal www.raijmr.com
RET Academy for International Journals of Multidisciplinary Research (RAIJMR)
tan2''
11
0 fCt
A
ac
ac
where ω = 2πf, ε0 is free space permittivity and ε΄΄ = (ε΄tanδ) is the dielectric loss factor, f is the
applied frequency, C and tanδ are the measure capacitance and dielectric loss.
2.3 Results and discussions
The variation of capacitance (c), dielectric constant (ε’), loss tangent (tanδ), a.c. resistivity
(ρac), a. c. conductivity(ζac) and imaginary part(ε”) of permittivity of the as grown MoSe2 crystals
have been shown on Figure 2 (a, b, c, d, e, f) with different frequency and from 303K to 523K
temperature in the step of 50K temperature.
Figure 2 (a): Variation of Capacitance with Frequency and Temperature for MoSe2 crystals.
8.0E-11
1.0E-10
1.2E-10
1.4E-10
1.6E-10
1.8E-10
2.0E-10
100000 300000 500000 700000 900000 1100000
Cap
acit
an
ce
(C)
Frequency (F)
T=303K
T=353K
T=403K
T=453K
T=503K
T=523K

International Journal of Research in Modern Engineering and Emerging Technology (IJRMEET) UGC Approved id_47203
Vol. 5, Sp. Issue: 9, Sept.: 2017 (IJRMEET) ISSN: 2320-6586
362 Online International, Refereed, Impact factor & Indexed Monthly Journal www.raijmr.com
RET Academy for International Journals of Multidisciplinary Research (RAIJMR)
Figure 2 (b): Variation of Dielectric loss with Frequency and Temperature for MoSe2 crystals.
Figure 2 (c): Variation of Dielectric Constant with Frequency and Temperature for MoSe2 crystals.
0
0.5
1
1.5
2
2.5
3
0 200000 400000 600000 800000 1000000 1200000
Die
lectr
ic lo
ss(D
)
Frequency (F)
T=303K
T=353K
T=403K
T=453K
T=503K
T=523K
0.0005
0.0007
0.0009
0.0011
0.0013
0.0015
100000 300000 500000 700000 900000 1100000
Die
lec
tric
co
nsta
nt
(Ɛ')
T=303K
T=353K
T=403K
T=453K
T=503K
T=523K

International Journal of Research in Modern Engineering and Emerging Technology (IJRMEET) UGC Approved id_47203
Vol. 5, Sp. Issue: 9, Sept.: 2017 (IJRMEET) ISSN: 2320-6586
363 Online International, Refereed, Impact factor & Indexed Monthly Journal www.raijmr.com
RET Academy for International Journals of Multidisciplinary Research (RAIJMR)
Figure 2 (d): Variation of resistivity with Frequency and Temperature for MoSe2 crystals.
Figure 2 (e):Variation of Conductivity with Frequency and Temperature for MoSe2 crystals.
0
1E+10
2E+10
3E+10
4E+10
5E+10
6E+10
0.00E+00 2.00E+05 4.00E+05 6.00E+05 8.00E+05 1.00E+06 1.20E+06
Resis
tivit
y
Frequency (F)
T=403K
T=453K
T=503K
T=523K
0
1E-10
2E-10
3E-10
4E-10
5E-10
6E-10
7E-10
8E-10
1.00E+05 3.00E+05 5.00E+05 7.00E+05 9.00E+05 1.10E+06
Co
nd
uc
tiv
ity
Frequency (F)
T=403K
T=453K
T=503K
T=523K

International Journal of Research in Modern Engineering and Emerging Technology (IJRMEET) UGC Approved id_47203
Vol. 5, Sp. Issue: 9, Sept.: 2017 (IJRMEET) ISSN: 2320-6586
364 Online International, Refereed, Impact factor & Indexed Monthly Journal www.raijmr.com
RET Academy for International Journals of Multidisciplinary Research (RAIJMR)
Figure 2 (f): Variation of Imaginary part (Ɛ'') with Frequency and Temperature for MoSe2 crystals.
For MoSe2 crystals, One can see that dielectric behavior is frequency dependent. The
capacitance is increases with increasing temperature and decrease with increasing frequency.
Because at low temperature the mobility of ions is very low and so is the conductivity, resulting a
lower value of capacitance. With temperature, the mobility of charge carriers increases, resulting the
increase in space charge polarization and capacitance both. From Figure 2(c) In plot the dielectric
constant (ε’) is observed to be higher at lower frequency and it monotonously decreases with
increasing frequency up to 1MHz.
The dielectric constant of solids is known to consist of contribution from electronic, ionic,
dipolar and space charge polarization exhibits itself potentially at lower frequency. This polarization
is known to arise from defects or impurity present, grain boundaries etc. [1, 2] and also due to
creation and distributions of either within the bulk or at surface of the crystals. Hence the higher
values of the dielectric constant at lower frequency in the present investigation may be because of a
large amount of space charge polarization [3-5]. Less frequency dependent value of dielectric
constant (ε’) is taken as static dielectric constant. This indicates the probable presence of ionic and
electrical polarization, since the concentration of crystal defects controlling the space charge
polarization negligible. The dispersion of ε’ with frequency can be attributed to the Maxwell –
Wagner type interfacial polarization i.e. the fact that in-homogeneities give rise to a frequency
0
0.001
0.002
0.003
0.004
0.005
0.006
0.007
0.008
0.009
100000 300000 500000 700000 900000 1100000
Imag
inary
part
(ε")
Frequency (F)
T=303K
T=353K
T=403K
T=453K
T=503K
T=523K

International Journal of Research in Modern Engineering and Emerging Technology (IJRMEET) UGC Approved id_47203
Vol. 5, Sp. Issue: 9, Sept.: 2017 (IJRMEET) ISSN: 2320-6586
365 Online International, Refereed, Impact factor & Indexed Monthly Journal www.raijmr.com
RET Academy for International Journals of Multidisciplinary Research (RAIJMR)
dependence of conductivity because charge carriers accumulate at the boundaries of less conducting
regions, thereby creating interfacial polarization [10-12].
The temperature is also found to exhibit an interesting influence on the dielectric properties.
The value of dielectric constant (ε’) increases with temperature for all samples. From Figure 2 (c),
one can notice that at low temperature the variation in dielectric constant is much less frequency
dependent, while at higher temperature the increase in dielectric constant is stronger and much more
frequency dependent. This is due to lattice expansion, polarizability of the constituent ions due to
increase in temperature and available volume together with the increase of atomic polarizability [6].
The faster increase with temperature is contributed by the thermally generated charge carriers.
In the most of the semiconducting compounds the number of charge carriers increases with
temperature while the mobility decreases with rise in temperature. These changes are probably
impeded by trapping a space charge there by building up polarization which results in macroscopic
field distortion [7]. This leads to a large increase in ε’. And also the lattice defect concentration can
rise with temperature making the space charge polarization dominant and hence the ε’ increases with
temperature. The changes in ε’ with temperature are of similar nature at all frequency[10-12].
Figure 2(b) shows the variation in dielectric loss tanδ, it decreases with increasing frequency and it is
also increases consistently with temperature for all the samples. For many materials it has been
observed that the dielectric loss decreases as frequency increases [8, 9]. The response of the normal
materials to applied fields depends on the frequency of the applied fields. In fact, polarization of
material does not respond instantaneously to an applied filed so the permittivity is often treated as a
complex function of frequency. The change in complex dielectric constant with frequency is shown
in Figure 2 (f). This indicates that as the frequency increases the value of imaginary part of the
permittivity decreases. But it increases with temperature for MoSe2 crystals. The observed decrease
in ε’' values with frequency and increase in ε’' with temperature, which are the common features of
all the compositions and it can be on explained on similar arguments as for ε’ [10-12].
The conductivity of the materials is increases with temperature and frequency both while at
lower frequency it is much more independent of frequency. The resistivity decreases with frequency
and temperature both with can be seen from Figure 2 (d). So at higher temperature MoSe2 all single
crystals become more conducting so its resistivity decreases with temperature. At lower frequency
the increase in conductivity is more rapid and at higher frequency the conductivity increases very
slowly [10-12].

International Journal of Research in Modern Engineering and Emerging Technology (IJRMEET) UGC Approved id_47203
Vol. 5, Sp. Issue: 9, Sept.: 2017 (IJRMEET) ISSN: 2320-6586
366 Online International, Refereed, Impact factor & Indexed Monthly Journal www.raijmr.com
RET Academy for International Journals of Multidisciplinary Research (RAIJMR)
References:
[1] J. C. Maxwell., “Electricity and Magnetism” (New York: Oxford Uni. Press), 1 (1973) 828.
[2] K. W. Wagner., Am. Phys., 40 (1973) 817.
[3] K. V. Rao and A. Smakula., J. Appl. Phys., 37 (1966) 319.
[4] Y. R. Reddy and L. Sirdeshmukh., Solid State Comm., 40 (1981) 353.
[5] S. S. Sastry, G. Satynandam, A. Subrahmanyan and V. R. K.Murthy., Phys. Stat. Solidi (a),105
(1988) K71.
[6] C. P. Smyth., “Dielectric Behaviour and Structure”, John-Wiley & Sons, New York, (1953) 132.
[7] A. P. Von Hipple.,“Dielectric behaviour and Structure”, John Wiley & Sons, New York, (1954)
47.
[8] B. B. Parekh and M. J. Joshi., Cryst. Res. & Tech., 42 (2007) 127.
[9] B. B. Parekh, P. M. Vyas, Sonal R. Vasant, M. J. Joshi., Bull. Mater. Sci., 31(2008) 143-147.
[10] Maga D, Igor P and Sergei M 2000 J. Mater. Chem. 10 941
[11] Jona A, Kundu T K, Pradhan S K and Chakrvorty D 2005 J. Appl. Phys. 97 44311
[12] Ismailzade I H and Ismailov R M 1980 Phys. Stat. Sol. (a) 59 K 191
[13] Smolenski G A and Isupov V A 1954 Dokl. Akad. Nauk. SSSR 9 653
[14] Sandip R Unadkat, Thesis, May 2012.

International Journal of Research in Modern Engineering and Emerging Technology (IJRMEET) UGC Approved id_47203
Vol. 5, Sp. Issue: 9, Sept.: 2017 (IJRMEET) ISSN: 2320-6586
367 Online International, Refereed, Impact factor & Indexed Monthly Journal www.raijmr.com
RET Academy for International Journals of Multidisciplinary Research (RAIJMR)
Exact Solution of Schrodinger Equation with Harmonic plus
Inverse Square plus non Central Potential Via Nikiforov-Uvarov
Method
Rajendrasinh H Parmar
Sir P T Science College, Modasa, Gujarat, India
Abstract
Here we presented the solution of Schrodinger equation with harmonic plus inverse square
plus new non central potential. We used Nikiforov-Uvarov Method to obtain energy
eigenvalues and eigenfunctions for this potential. Radial eigenfunctions are expressed in terms
of Laguerre polynomials and angular part of the eigenfunctons are expressed terms of Jacobi
polynomials. Solution of these type potentials having important role in physical science and
quantum chemistry.
Keyword : Schrodinger equation ;non central potential; inverse square potential; eigenfunctons;
eigenvalues
1 Introduction
It is well known that Schrodinger equation (SE) is second order differential equation, no of
methods are developed to solve the relativistic and non relativistic SE. Solution of SE for a
given system gives the wavefunction and eigenvalues, from the wavefunction, we can
understand most of all the properties and behavior of the quantum-physical system. However
form of wavefunction depends on co-ordinate system and type of potential. Transforming SE
into known ordinary differential equation (ODE) whose solutions are available in terms of
special functions like associated Laguerre polynomials, hypergeometric functions etc. is one of
the old methods. Second method is factorization techniques like supersymmetric (SUSY)
method[1], the asymptotic iteration method(AIM) [2-3], the exact quantization rule(EQR)
method [4]method, the Lie algebraic method [5] , the Nikiforov-Uvarov (NU) method [6] etc for
exact solution of SE. Only few potentials are there which the SE can be solved exactly for all n
and l values. Mainly two types potentials have been used to solve SE one is central potentials and
non central potentials. No off researcher are working on analytical exact and approximate
solution of Dirac equation of non central potentials. Central potentials (depends only on radial
part ) have important role in the molecular chemistry , quantum chemistry and atomic physics to
describe the properties qualitatively[7] where as non central potentials depends on radial as well
as angular part of the system. Description of dynamical properties of the system depends on non
central potentials, so we have to take into account non central potentials. No of papers have been

International Journal of Research in Modern Engineering and Emerging Technology (IJRMEET) UGC Approved id_47203
Vol. 5, Sp. Issue: 9, Sept.: 2017 (IJRMEET) ISSN: 2320-6586
368 Online International, Refereed, Impact factor & Indexed Monthly Journal www.raijmr.com
RET Academy for International Journals of Multidisciplinary Research (RAIJMR)
published by different researchers for non central potentials like Makarov potential[8], ,
modified-Kratzer plus ring-shaped potential[9], double ring-shaped Kratzer potential[10],
modified non central potential[11], ring shaped non-spherical oscillator potential[12], ring
shaped pseudo harmonic oscillatory potential[13], Killingbeck radial potential plus central
potential[14], Hartmann ring shaped potential, Mie-type potential, pseudo harmonic oscillatory
plus ring shaped potentia. The solutions of the Schrodinger equation with non-central potentials
are important role in quantum chemistry [[15,16,17]
No of research have been studies for the non central potentials, the eigenvalues and
eigenfunctionsare obtained via seperation of variables in spherical or other coordinate systems.
The concept of the Harmonic oscillator gives us a very good first approximation for
understanding the spectroscopy and the structure of diatomic molecules in their ground
electronic states. Recently, Berkdemir [18] proposed a novel angle-dependent (NAD) potential
and obtained the exact solutions of the Schrodinger equation for the Coulomb and harmonic
oscillator potentials with NAD potential. Here we presented harmonic plus inverse square plus
non central potential (HINP) and its solve using Nikiforov-Uvarov (NU) method. Using NU
method, we obtained eigenvalues and eigenfunctions of this type potential
In section two, we presented NU methods, in third section, we used the separation of variable
method and solve the Schrodinger equation for radial part, in forth part we solve the
Schrodinger equation for angular part. Concluded our work in fifth and last section.
.
2. Nikiforov-Uvarov Method
.
The NU (Niki-forov-Uvarov) method is very good method to obtaining exact answers of certain
states , of energy eigenvalues and the related functions based on Orthogonal polynomials. NU
method is based on reducing a SE into hypergeometric type equation.
Using proper variable 𝑠 = 𝑠 𝑟 to transform second orderdifferential equation into particular
form in which can be solved using NikiforovUvarov Method is
ѱ𝑛,, 𝑠 +
𝜏 𝑠
𝜍(𝑠)ѱ𝑛, 𝑠 +
𝜍 𝑠
𝜍2 𝑠 ѱ𝑛 𝑠 = 0 (1)
Where 𝜏 𝑠 is first degree polynomial, 𝜍 𝑠 , 𝜍(𝑠) are second degree polynomial mostly and
ѱ𝑛 𝑠 hypergeometric type function.
consider ѱ𝑛 𝑠 as,
ѱ𝑛 𝑠 = 𝑎𝑛 𝑠 𝑏𝑛(𝑠) (2)
Using equation (2) in equation (1),
𝜍 𝑠 𝑑2𝑏𝑛 𝑠
𝑑𝑠2 + 𝜏 𝑠 𝑑𝑏𝑛 𝑠
𝑑𝑠+ Λ𝑏𝑛 𝑠 = 0 (3)

International Journal of Research in Modern Engineering and Emerging Technology (IJRMEET) UGC Approved id_47203
Vol. 5, Sp. Issue: 9, Sept.: 2017 (IJRMEET) ISSN: 2320-6586
369 Online International, Refereed, Impact factor & Indexed Monthly Journal www.raijmr.com
RET Academy for International Journals of Multidisciplinary Research (RAIJMR)
Wave function 𝑎𝑛 𝑠 is defined as a logarithm derivative,
1
𝑎(𝑠)
𝑑𝑎 (𝑠)
𝑑𝑠=
𝜋(𝑠)
𝜍(𝑠) (3a)
Parameter Λ and function 𝜋(𝑠) are defined as follows
𝜋 𝑠 =𝑑𝜍
𝑑𝑠−𝜏 𝑠
2±
𝑑𝜍
𝑑𝑠−𝜏 𝑠
2
2
− 𝜍 𝑠 + Κσ (4)
Λ = Κ +𝑑𝜋
𝑑𝑠 (5)
To find the value of Κ in (5),the value under the square root of (4) must be the square root of
polynomial which is mostly first degree polynomial and this is possible when its determiner is
zero i.e 𝑏2 − 4𝑎𝑐 = 0. There fore a new eigenvalue of (3) becomes,
Λ = Λn = −ndτ
ds−
n(n−1)
2
d2σ
ds 2 , n=0,1,2,3,……. (6)
where 𝜏 = 𝜏 𝑠 + 𝜋(𝑠) (7)
From (5) and (6), we obtain the new energy eigenvalue. 𝑑𝜍
𝑑𝑠 must be negative to generate
igenvalues and corresponding eigenfunction. The solution of 𝑏𝑛 𝑠 of (3) is connected to
Rodrigues relation which is given as,
𝑏𝑛 𝑠 =𝐵𝑛
𝜌(𝑠)
𝑑𝑛
𝑑𝑠𝑛 𝜍𝑛 𝑠 𝜌(𝑠) (8)
In above equation 𝐵𝑛 is normalization constant and 𝜌(𝑠) is weight function which satisfy the
below condition
𝑑(𝜍𝜌 )
𝑑𝑠= 𝜏(𝑠)𝜌(𝑠) ,
𝑑𝑤 (𝑠)
𝑑𝑠= 𝑤(𝑠)
𝜏(𝑠)
𝜍(𝑠) (9)
Here 𝑤 𝑠 = 𝜍(𝑠)𝜌(𝑠) (10)
3. Schrodinger equation with harmonic plus inverse square plus new non central potential
𝑉 𝑟,𝜃 =ℏ2
2𝜇 𝐴𝑟2 +
𝐵
𝑟2 +1
𝑟2 𝛼 𝑐𝑜𝑡2𝜃 + 𝛽 𝑐𝑜𝑠𝑒𝑐2𝜃 (10a)
Where 𝑉 𝑟 =ℏ2
2𝜇 𝐴𝑟2 +
𝐵
𝑟2 (10b)
The schrodinger equation in spherical coordinate with non central potential as,

International Journal of Research in Modern Engineering and Emerging Technology (IJRMEET) UGC Approved id_47203
Vol. 5, Sp. Issue: 9, Sept.: 2017 (IJRMEET) ISSN: 2320-6586
370 Online International, Refereed, Impact factor & Indexed Monthly Journal www.raijmr.com
RET Academy for International Journals of Multidisciplinary Research (RAIJMR)
∇2Ψ 𝑟, 𝜃𝜑 + 2𝜇
ℏ2 𝐸 − 𝑉(𝑟,𝜃) Ψ 𝑟, 𝜃,𝜑 = 0 (11)
1
𝑟2 𝜕
𝜕𝑟 𝑟2𝜕
𝜕𝑟 +
1
𝑠𝑖𝑛𝜃
𝜕
𝜕𝜃 𝑠𝑖𝑛𝜃
𝜕
𝜕𝜃 +
1
𝑠𝑖𝑛 2𝜃
𝜕2
𝜕𝜑2 Ψ 𝑟,𝜃𝜑 + 2𝜇
ℏ2 𝐸 − 𝑉(𝑟,𝜃) Ψ 𝑟,𝜃,𝜑 = 0 (12)
Where 𝛼,𝛽,𝐴 𝑎𝑛𝑑 𝐵 are constant, 𝜇 is mass of particle. Using equation (10) in equation (12)
and separation of variable method with taking
Ψ 𝑟,𝜃,𝜑 =𝑈 𝑟
𝑟𝐺 𝜃 Φ(𝜑) (13)
𝑑2𝑈(𝑟)
𝑑𝑟 2 + 𝜉 − 𝑨𝒓𝟐 −𝑩
𝒓𝟐−
𝝀
𝒓𝟐 𝑈 𝑟 = 0 (14)
𝑑2𝐺 𝜃
𝑑𝜃 2 + 𝑐𝑜𝑡𝜃𝑑𝐺 𝜃
𝑑𝜃+ 𝜆 −
𝑚2
𝑠𝑖𝑛 2𝜃− 𝛼 𝑐𝑜𝑡2𝜃 + 𝛽 𝑐𝑜𝑠𝑒𝑐2𝜃 𝐺 𝜃 = 0 (15)
𝑑2Φ(𝜑)
𝑑𝜑 2 + 𝑚2Φ 𝜑 = 0 (16)
Solution of equation (16) is,
Φ𝑚 𝜑 =1
2𝑒±𝑖𝑚𝜑 ,𝑚 = 0, ±1, ±2, ±3,…… .. (17)
Where 𝜉 =2𝜇𝐸
ℏ2 , Here 𝜆 = 𝑙 𝑙 + 1 and 𝑚 are real and dimensionless separation parameters.
4. Solution of radial part of schrodnger equation
4.1 Energy eigenvalues
Taking 𝑠 𝑟 = 𝑟2 and 𝐵 + 𝜆 = 𝜆′ in the equation (14)
𝑑2𝑈(𝑠)
𝑑𝑠2 +1
2𝑠
𝑑𝑈(𝑠)
𝑑𝑠−
𝑨𝒔𝟐−𝜉𝑠+𝝀′
4𝑠2 𝑈 𝑠 = 0 (18)
Comparing equation (18) with equarion (1),
𝜏 𝑠 = 1, 𝜍 𝑠 = 2𝑠 and 𝜍 𝑠 = − 𝑨𝒔𝟐 − 𝜉𝑠 + 𝝀′ (19)
Using equation (52) in equation (4),
𝜋 𝑠 =1
2±
1
4+ 𝐴𝑠2 + 2Κ − 𝜉 𝑠 + 𝝀′ (20)

International Journal of Research in Modern Engineering and Emerging Technology (IJRMEET) UGC Approved id_47203
Vol. 5, Sp. Issue: 9, Sept.: 2017 (IJRMEET) ISSN: 2320-6586
371 Online International, Refereed, Impact factor & Indexed Monthly Journal www.raijmr.com
RET Academy for International Journals of Multidisciplinary Research (RAIJMR)
To solve quadric equation (20) for Κ , taking this quadric equation 𝑏2 − 4𝑎𝑐 = 0,
The possible values of 𝐾± as,
𝐾± =𝜉
2±
1
2 𝐴(4𝜆′ + 1) (21)
𝜋 𝑠 =1
2± 𝐴
𝑠 + 4𝜆 ′+1
4𝐴 , 𝐹𝑜𝑟 𝐾 =
𝜉
2+
1
2 𝐴(4𝜆′ + 1)
𝑠 − 4𝜆 ′+1
4𝐴 𝐹𝑜𝑟 𝐾 =
𝜉
2−
1
2 𝐴(4𝜆′ + 1)
(22)
According to NU method, derivative of 𝜏(𝑠) must be negative. Here acceptable solution of 𝜋 𝑠
is,
𝜋 𝑠 =1
2− 𝐴 𝑠 − 4𝜆 ′+1
4𝐴 for 𝐾 =
𝜉
2−
1
2 𝐴(4𝜆′ + 1) (23)
Putting values of equation (19) and equation (23) in equation (7),
τ(s) = 2 1 − 𝐴 s − 4λ′+1
4A (24)
from equation (5) and (6)
Λ =𝜉
2− 𝐴 1 +
1
2 4𝜆′ + 1 (25)
Λn = 2n A (26)
There fore eigen spectra of potential given by equation (10a) is
𝜉 = 2 𝐴 2𝑛 + 1 + 𝜆′ +1
4 (27)
𝐸𝑛 =ℏ2
𝜇 𝐴 2𝑛 + 1 + (𝐵 + 𝜆) +
1
4 (27a)
Equation (27a) is eigenvalue equation of radial part of SE.
4.2 Wavefunction of radial part of SE
Using equation (9) we can obtained [19,20,21]
𝜌 𝑠 =1
2𝑠 𝝀′+
𝟏
𝟒𝑒− 𝐴𝑠 (28)

International Journal of Research in Modern Engineering and Emerging Technology (IJRMEET) UGC Approved id_47203
Vol. 5, Sp. Issue: 9, Sept.: 2017 (IJRMEET) ISSN: 2320-6586
372 Online International, Refereed, Impact factor & Indexed Monthly Journal www.raijmr.com
RET Academy for International Journals of Multidisciplinary Research (RAIJMR)
And
𝑎𝑛 𝑠 = 𝑠1
4 1+ 4𝝀′+𝟏 𝑒− 𝐴𝑠 (29)
So equation (8),
𝑏𝑛 𝑠 = 𝐵𝑛 2𝑛𝑠 𝝀′+
𝟏
𝟒𝑒− 𝐴𝑠𝑑𝑛
𝑑𝑠𝑛 𝑠𝑛+
1
2 4𝝀′+𝟏 𝑒− 𝐴𝑠 (30)
Now redial wave functioin can be obtained as,
𝑈𝑛 𝑠 = 𝑁𝑛 2𝑛𝑠1
4 1+ 4𝝀′+𝟏 𝑒
𝐴𝑠
2 𝑠−1
2 4𝝀′+𝟏 𝑒− 𝐴𝑠
𝑑𝑛
𝑑𝑠𝑛 𝑠𝑛+
1
2 4𝝀′+𝟏 𝑒− 𝐴𝑠 (31)
𝑁𝑛 is normalizatiionconstant.
In terms of Laguerre polynomial equation (31) as,
𝑈𝑛 𝑠 = 𝑁𝑛 2𝑛𝑠1
4 1+ 4𝝀′+𝟏 𝑒
𝐴𝑠
2 𝐿𝑛−
1
2 4𝝀′+𝟏
( 𝐴𝑠) (32)
For 𝑠 = 𝑟2 equatioin (32) is
𝑈𝑛 𝑠 = 𝑁𝑛 2𝑛𝑟1
2 1+ 4𝝀′+𝟏 𝑒
𝐴𝑟2
2 𝐿𝑛−
1
2 4𝝀′+𝟏
( 𝐴𝑟2) (33)
Equation (33) is wavefunction of radial part of SE.
5. Solution of angle dependent part
5.1 Eigenvalues of angular part of SE
Using coordinate transformation 𝑠 = 𝑐𝑜𝑠𝜃 in equation (15),
𝑑2𝐺 𝑠
𝑑𝑠2 −2𝑠
(1−𝑠2)
𝑑𝐺 𝑠
𝑑𝑠+
1
1−𝑠2 2 − 𝛼 + 𝜆 𝑠2 + 𝛽′ −𝑚2 𝐺 𝑠 = 0 (34)
Where 𝜆 − 𝛽 = 𝛽′. Equating equation (25) with equation (1),
𝜏 𝑠 = −2𝑠, 𝜍 𝑠 = (1 − 𝑠2) and 𝜍 𝑠 = − 𝛼 + 𝜆 𝑠2 + 𝛽′ −𝑚2 (35)
From equation (4),
𝜋 𝑠 = 𝛼 ′ + 𝛽′ − 𝐾 𝑠2 + (𝐾 + 𝑚2 − 𝛽′) (36)
where 𝛼 ′ = 𝛼 + 𝛽 .To solve quadric equation (29) in terms of Κ , taking this quardric 𝑏2 −
4𝑎𝑐 = 0,The possible values of 𝐾± as,

International Journal of Research in Modern Engineering and Emerging Technology (IJRMEET) UGC Approved id_47203
Vol. 5, Sp. Issue: 9, Sept.: 2017 (IJRMEET) ISSN: 2320-6586
373 Online International, Refereed, Impact factor & Indexed Monthly Journal www.raijmr.com
RET Academy for International Journals of Multidisciplinary Research (RAIJMR)
𝐾+ = 𝛽′ + 𝛼 ′ and 𝐾− = 𝛽′-𝑚2
𝜋 𝑠 = ± 𝑚2 + 𝛼 ′, 𝐹𝑜𝑟 𝐾+ = 𝛽′ + 𝛼 ′
𝑚2 + 𝛼 ′ 𝑠 , 𝐹𝑜𝑟 𝐾− = 𝛽′ −𝑚2 (37)
According to NU method, derivative of 𝜏(𝑠) must be negative. So here acceptable solution of
𝜋 𝑠 is,
𝜋 𝑠 = − 𝑚2 + 𝛼 ′ 𝑠 , 𝑎𝑛𝑑 𝐾− = 𝛽′ −𝑚2 (38)
Using equation (7)
τ s = −2 1 + 𝑚2 + 𝛼 ′ s (39)
from equation (5) and (6)
Λ = 𝛽′ −𝑚2 − 𝑚2 + 𝛼 ′ (40)
𝛬𝑛 = 2𝑛 1 + 𝑚2 + 𝛼 ′ − 𝑛(𝑛 − 1) (41)
but Λ = Λn ,
𝛽′ = 𝑛 3 − 𝑛 + (2𝑛 + 1) 𝑚2 + 𝛼 ′ (42)
𝜆 = 𝑛 3 − 𝑛 + 2𝑛 + 1 𝑚2 + 𝛼 ′ + 𝛽 (43)
5.2 Eigen function of angular part
Using equation (9) below equations are obtained[19,20,21].
𝜌 𝑠 = (1 − 𝑠2) 𝑚2+𝛼 ′
(44)
𝑎𝑛 𝑠 = (1 − 𝑠2) 𝑚 2+𝛼 ′
2 (45)
So equation (8),
𝑏𝑛 𝑠 = 𝐶𝑛 1
(1−𝑠2) 𝑚2+𝛼 ′
𝑑𝑛
𝑑𝑠𝑛 (1 − 𝑠2)𝑛+ 𝑚2+𝛼 ′
(46)
Now 𝑏𝑛 𝑠 can be write in terms of Jacobi polynomials 𝑃𝑛( 𝑚2+𝛼 ′, 𝑚2+𝛼 ′
(𝑠),
So equation (46) can be written as,

International Journal of Research in Modern Engineering and Emerging Technology (IJRMEET) UGC Approved id_47203
Vol. 5, Sp. Issue: 9, Sept.: 2017 (IJRMEET) ISSN: 2320-6586
374 Online International, Refereed, Impact factor & Indexed Monthly Journal www.raijmr.com
RET Academy for International Journals of Multidisciplinary Research (RAIJMR)
𝑏𝑛 𝑠 = 𝐶𝑛2𝑛𝑛! (−1)𝑛 (𝑠 − 1)−2 𝑚2+𝛼 ′ 𝑃𝑛
( 𝑚2+𝛼 ′, 𝑚2+𝛼 ′
(𝑠) (47)
Therefore total angular wavefunction obtained from equation (45) and equation(47) as,
𝐺 𝑠 = 𝑎𝑛 𝑠 𝑏𝑛 𝑠
𝐺 𝑠 = 𝐶𝑛2𝑛𝑛! (−1)𝑛 (𝑠 − 1)−2 𝑚2+𝛼 ′(1 − 𝑠2)
𝑚 2+𝛼 ′
2 𝑃𝑛( 𝑚2+𝛼 ′, 𝑚2+𝛼 ′
(𝑠) (48)
5. Conclusion
In this paper, we calculated eigenfunctions and eigenvalues of harmonic plus inverse square plus
non central potential (HINP). It is solved using Nikiforov-Uvarov (NU) method with proper
coordinate transformation. Our result is applicable in nuclear physics and quantum chemistry. By
choosing proper values parameters 𝛼,𝛽,𝐴 𝑎𝑛𝑑 𝐵, we can calculate eigenfunctions and
eigenvalues of particular atom or molecules and from wavefunction, we can find different
dynamical properties of system. For 𝛼,𝛽 𝑎𝑛𝑑 𝐵 = 0, it is form of simple harmonic potential. We
are looking for further studies along this direction.
References
[1] F. Cooper, A. Khare and U. Sukhatme: “Supersymmetry and quantum mechanics
and large-N expansions ”, Phys. Rep., , (1995), Vol. 251,pp. 267–385
[2] S.M. Ikhdair and R. Sever: Int. J. Mod. Phys. A, (2006), Vol. 21, pp. 6465–6476.
[3] S.M. Ikhdair and R. Sever: , J. Mol. Struc.-Theochem, (2007), Vol. 809, pp. 103–113.
[4] Z.–Q. Ma and B.–W. Xu, Euro phys Lett., (2005), Vol. 69, pp. 685–691.
[5] M.R. Setare and E. Karimi:, Phys.Scr., (2007), Vol. 75, pp. 90–93.
[6] A.F. Nikiforov and V.B. Uvarov: Special Functions of Mathematical Physics,Birkhauser,
Basel, 1988.
[7] R. J. Le Roy and R. B. Bernstein, J. Chem. Phys. (1970), 52, 3869.
[8] A. A. Makarov, J. A. Smorodinsky, K. H. Valiev and P. Winternitz, Nuovo
Cimento (1967), A 52, 1061.
[9] C. Berkdemir, A. Berkdemir and J. G. Han, Chem. Phys. Lett (2006) . 417, 326.
[10] A. Durmus and F. Yasuk, J. Chem. Phys. (2007) 126, 074108.
[11] E. Fues, Ann. Phys, (1926) . 80, 367.
[12] S. H. Dong, G. H. Sun and M. Lozada-Cassou, Phys. Lett. A (2004), 328, 299.
[13] H. X. Quan, L. Guang, W. Z. Min, N. L. Bin, and M. Yan, Commun. Theor. Phys.
(2010) 53(2), 242.
[14] C. Cari, A. Suparmi, M. Yunianto and B. N. Pratiwi Journal of Physics: Conference
Series 776 (2016) 012092
[15]M. Kibler and T. Negadi, Int. J. Quantum Chem. (1984), 26, 405.
[16] M. V. Carpido-Bernido and C. C. Bernido, Phys. Lett. (1989), 134A 315.
[17] M. V. Carpido-Bernido, J. Phys. (1991) , A 24, 3013.
[18] C. Berkdemir, J. Math. Phys. (2009), 46, 13
[19] H. Salehi ,Applied Mathematics, (2011), 2, 999-1004

International Journal of Research in Modern Engineering and Emerging Technology (IJRMEET) UGC Approved id_47203
Vol. 5, Sp. Issue: 9, Sept.: 2017 (IJRMEET) ISSN: 2320-6586
375 Online International, Refereed, Impact factor & Indexed Monthly Journal www.raijmr.com
RET Academy for International Journals of Multidisciplinary Research (RAIJMR)
[20] H Goudarzi, A Jafari at al. Adv. Studies Theor. Phys., (2012), Vol. 6, no. 26, 1253 – 1262
[21] D. Akaninyene, . Antia and Okon P. Akpan; Journal of Applied and Theoretical Physics
Research (2017), 1(2),9-13.

International Journal of Research in Modern Engineering and Emerging Technology (IJRMEET) UGC Approved id_47203
Vol. 5, Sp. Issue: 9, Sept.: 2017 (IJRMEET) ISSN: 2320-6586
376 Online International, Refereed, Impact factor & Indexed Monthly Journal www.raijmr.com
RET Academy for International Journals of Multidisciplinary Research (RAIJMR)
Temperature dependent electrical resistivity of WSxSe2-x
(X = 2, 1.5, 0.5) crystals
(1) Payal Chauhan
Department of Physics, Sardar Patel University, Vallabh Vidyanagar -388120, Anand,
Gujarat, India.
Email: [email protected]
(2) Pratik Pataniya
Department of Physics, Sardar Patel University, Vallabh Vidyanagar -388120, Anand,
Gujarat, India.
Email: [email protected]
(3) G. K. Solanki
Department of Physics, Sardar Patel University, Vallabh Vidyanagar -388120, Anand,
Gujarat, India.
Email: [email protected]
(4) K. D. Patel
Department of Physics, Sardar Patel University, Vallabh Vidyanagar -388120, Anand,
Gujarat, India.
Email: [email protected]
(5) V. M. Pathak
Department of Physics, Sardar Patel University, Vallabh Vidyanagar -388120, Anand,
Gujarat, India.
Email: [email protected]
Abstract:
Transition metal dichalcogenides have been intensively studied due to quasi two
dimensional charge transport characteristic. The electrical resistivity of WSxSe2-x (X = 2, 1.5,
0.5)was measured perpendicular to crystallographic c- axis in temperature range from 313 K
to 673 K in the step of 5 K. The resistivity of WSxSe2-x (X = 2, 1.5, 0.5)samples decreases on
increasing the temperature. This study confirms the semiconducting behaviour of grown
samples.The activation energy at different temperature range was calculated using Arrhenius
relation.
Keywords: Activation energy, crystalgrowth, resistivity.

International Journal of Research in Modern Engineering and Emerging Technology (IJRMEET) UGC Approved id_47203
Vol. 5, Sp. Issue: 9, Sept.: 2017 (IJRMEET) ISSN: 2320-6586
377 Online International, Refereed, Impact factor & Indexed Monthly Journal www.raijmr.com
RET Academy for International Journals of Multidisciplinary Research (RAIJMR)
Introduction:
The transition metal dichalcogenides (TMDCs) with generalised formula MX2, where M
is the metal atom and X is the chalcogen atoms are crystalized by stacking of X-M-X
sandwiched structure. In each layer the atoms are bonded by relatively strong covalent bond
and layers are stacked upon each other by weak van der Waals interaction [1]. The anisotropy
in interaction results into the anisotropic charge transport mechanism. The most intensively
explored members of TMDCs family, WSe2 and WS2 are found to be semiconducting in
nature with indirect band gap around 1.2-1.4 eV. They have shown great potential for the
applications in the fields of optoelectronics due to exotic band structure and distinct physical
properties [2-4]. The chemical and environmental stability makes them most suitable
sustainable electronics. Besides this, tenability of electric properties, like conductivity, carrier
concentration and mobility have been demonstrated [5-12]. In order to produce high
performance device, the band gap have been engineered by doping of semiconductors and by
alloying different semiconductors. In present research, tuning of electric transport have been
demonstrated in WSxSe2-x(X = 2, 1.5, 0.5)by varying S and Se content into grown
samples[13]. The electrical resistivity have been measured in parallel and perpendicular to c-
axis in temperature range 313K to 673K in the step of 5 K and activation energy has also
been calculated using Arrhenius relation.
Experimental:
The WSxSe2-x(X = 2, 1.5, 0.5)samples were grown by direct vapour transport technique
using high temperature dual zone horizontal furnace. The electrical resistance of samples was
measured in perpendicular to crystallographic c-axis in temperature range 313K to 673 K
using two probe method. The experimental set up for this study comprises of steel sample
holder with two wire probes and high temperaure single zone vertical furnace. The resistance
was measured by Keithly-2700 multi meter and resistivity was also calculated. The activation
energy was also calculated for grown sample using Arrhenius relation.
Results and discussion:
The temperature dependent electrical resistivity (ρ) measurements perpendicular to c-
axis were performed systematically in temperature range 313 K to 673 K in the step of 5 K.
The temperature- resistivity curves of WSxSe2-x (X = 2, 1.5, 0.5)are shown in Figure1. The
resistivity of WSxSe2-x (X = 2, 1.5, 0.5)samples decreases as the temperature increases. It
depicts the semiconducting behaviour of grown samples.The conductivity curves seen to be
in good agreement with the models related to the thermal carrier emission across grain
boundary barriers where a temperature dependence of conductivity is expected to yield
straight line in Arrhenius plots in the whole temperature range [13].

International Journal of Research in Modern Engineering and Emerging Technology (IJRMEET) UGC Approved id_47203
Vol. 5, Sp. Issue: 9, Sept.: 2017 (IJRMEET) ISSN: 2320-6586
378 Online International, Refereed, Impact factor & Indexed Monthly Journal www.raijmr.com
RET Academy for International Journals of Multidisciplinary Research (RAIJMR)
Figure 1Temperature-resistivity curves for WSxSe2-x (X = 2, 1.5, 0.5)samples
Figure2 log ρ vs 1000/T forWSxSe2-x (X = 2, 1.5, 0.5)samples.
The activation energy was also calculated using following relation:
Tk
E
B
a0 (1)
where, Ea is activation energy, kB is Boltzmann constant and T is absolute temperature.
The logρ vs. 1000/T curves are divided into two regions, as shown in Figure 2. The
activation energy was determined for all the regions and mentioned in Table 1. The relatively
lower values of activation energy attribute the presence of extrinsic conduction mechanism in
WSxSe2-x (X = 2, 1.5, 0.5)samples.

International Journal of Research in Modern Engineering and Emerging Technology (IJRMEET) UGC Approved id_47203
Vol. 5, Sp. Issue: 9, Sept.: 2017 (IJRMEET) ISSN: 2320-6586
379 Online International, Refereed, Impact factor & Indexed Monthly Journal www.raijmr.com
RET Academy for International Journals of Multidisciplinary Research (RAIJMR)
Table 1 Activation energy for WSxSe2-x (X = 2, 1.5, 0.5)samples.
Compositions Perpendicular to c-axis
Temperature
range (K)
Activation
energy (eV)
WS2 298-413 0.108
418-673 0.197
WS1.5Se0.5 298-413 0.182
418-673 0.198
WSSe 298-413 0.168
418-673 0.198
The study of change in electrical resistivity by variation of S and Se is the key part of
present research. The resistivity seems to be decreases on increasing the Se content in grown
samples. In ternary compounds i.e. WSSe and WS1.5Se0.5, the Se-atoms replace the S-atoms
from the host lattice. The activation energy is also found to be decreases as the content of Se
increases.
Conclusions:
The electrical transport properties ofWSxSe2-x (X = 2, 1.5, 0.5)crystals have been studied
with high temperature resistivity measurements. This work has shown that WSxSe2-x (X = 2,
1.5, 0.5)crystal are a semiconducting in nature. The resistivity is decreases as temperature is
increasing in all respective samples.
References:
[1] K. Xu, Z. Wang, X. Du, M.Safdar, C. Jiang and J. He, Nanotechnol., 2013, 24,465-705.
[2] Q. H. Wang, K.Kalantar-Zadeh, A.Kis, J. N. Coleman and M. S.Strano, Nat. Nanotech.,
2012,7, 699–712.
[3] K. A. Patel, C. K. Sumesh, P. Pataniya, G. K. Solanki and K. D. Patel,Eur. Phys. J.
Plus, 2017,132,191.
[4] S.Zheng, L.Sun, T.Yin, A. M. Dubrovkin, F. Liu, Z.Liu, Z. X. Shen and H. J.
Fan,Applied Physics Letters, 2015,106, 063113.
[5] P. Desai, D. D. Patel and A. R. Jani,Journal of Crystal Growth, 2014,390, 12–17.
[6] P. Desai, D. D. Patel and A. R. Jani,Mate. Sci. in Sem. Proces., 2014,24, 40–43.
[7] D. D. Patel, P Desai and A. R. Jani, Journal of Crystal Growth, 2014,400,43–48.
[8] Y. Chen, J.Xi, D. O. Dumcenco, Z.Liu, K.Suenaga, D. Wang, Z. Shuai, Y. S. Huang
and L.Xie,ACS Nano, 2013,7, 4610.
[9] Y.Chen, D. O. Dumcenco, Y.Zhu, X.Zhang, N.Mao, Q.Feng, M.Zhang, J.Zhang, P. H.
Tan, Y. S. Huang and L.Xie,Nanoscale, 2014,6, 2833.
[10] D. O. Dumcenco, H.Kobayashi, Z.Liu, Y. S. Huang and K.Suenaga,Nat. Commun.,
2013,4, 1351.
[11] M.Zhang, J. Wu, Y.Zhu, D. O. Dumcenco, J.Hong, N. Mao, S.Deng, Y.Chen, Y.Yang,
C.Jin, S. H. Chaki, Y. S. Huang, J.Hang and L.Xie,ACS Nano, 2014, 8, 7130.
[12] P.Yu, J.Lin, L.Sun, Q.L. Le, X.Yu, G.Gao, C. H. Hsu, D.Wu, T. R. Chang, Q.Zeng,
F.Liu, Q. J. Wang, H. T. Jeng, H. Lin, A.Trampert, Z.Shen, K.Suenaga and Z.Liu,Adv.
Mater., 2017,29,1603991.

International Journal of Research in Modern Engineering and Emerging Technology (IJRMEET) UGC Approved id_47203
Vol. 5, Sp. Issue: 9, Sept.: 2017 (IJRMEET) ISSN: 2320-6586
380 Online International, Refereed, Impact factor & Indexed Monthly Journal www.raijmr.com
RET Academy for International Journals of Multidisciplinary Research (RAIJMR)
[13] G. K.Solanki, P Pataniya, C. K. Sumesh, K. D. Patel and V. M. Pathak,Journal of
Crystal Growth, 2016 ,441, 101–106.

International Journal of Research in Modern Engineering and
Emerging Technology (IJRMEET) UGC Approved id_47203
Vol. 5, Sp. Issue: 9, Sept.: 2017
(IJRMEET) ISSN: 2320-6586
381 Online International, Refereed, Impact factor & Indexed Monthly Journal www.raijmr.com
RET Academy for International Journals of Multidisciplinary Research (RAIJMR)
Growth and anisotropic behavior of GeS0.5Ge0.5 single crystals
grown using direct vapour transport technique
Dipika B. Patela)
* , Sandeep G. Chovatiyaa)
, Gunvant K. Solankib)
a)*ARIBAS, Sardar Patel University, New Vallabh Vidyanagar 388121, India
b)Department of Physics, Sardar Patel University, Vallabh Vidyanagar 388 120, India
*Corresponding author email Id: [email protected]
Abstract
This paper report the growth of single crystals of ternary mixed compounds of group IV–VI in the
form of GeS0.5Se0.5 using direct vapour transport technique. The grown crystals were characterized
by the X-ray diffraction analysis for their structural parameter determination. All the grown crystals
were found to be orthorhombic structure. The microstructure analysis of the grown crystals reveals
their layered type growth mechanism and are therefore highly anisotropic. The d.c. electrical
resistivity measurements perpendicular to c-axis (i.e. along the basal plane) and parallel to c-axis
(i.e perpendicular to basal plane) in the temperature range 303–723 K were carried out for grown
crystals using four-probe method. The electrical resistivity measurements showed an anisotropic
behavior of electrical resistivity for the grown crystals. The anisotropic behavior GeS0.5Ge0.5 is
presented systematically.
Keywords. Crystal growth; layered structure; resistivity; anisotropy;
Introduction
Natural crystals of many materials are available in nature but they cannot be used directly for
device applications. Instead they should give some sort of treatment because of the main problem of
purity and perfection. The crystal growth study in the last 10 years [1-5] led to the conclusion that
the artificial crystals of most of the materials can be grown in the laboratories.
Sulphides and selenides of the fourth group and metals like germanium and tin (GeS, GeSe, SnS
and SnSe) form an interesting family of layered compounds. These compounds are considered
intermediate between the three dimensional and the two dimensional materials. The bonding
between the layers is weak being of Van der Waal’s type and therefore they can be easily cleaved in
the (001) plane [6]. From this fact one might expect them to exhibit the typical anisotropy of

International Journal of Research in Modern Engineering and
Emerging Technology (IJRMEET) UGC Approved id_47203
Vol. 5, Sp. Issue: 9, Sept.: 2017
(IJRMEET) ISSN: 2320-6586
382 Online International, Refereed, Impact factor & Indexed Monthly Journal www.raijmr.com
RET Academy for International Journals of Multidisciplinary Research (RAIJMR)
electrical properties i.e. conductivity or mobility of a layered structure. Mechanically, single
crystals of these layered materials behave extremely two-dimensional. Although layered materials
are indeed anisotropic, there is a great variation in the anisotropy ratio among them. In some cases
anisotropy factor up to 106 have been reported [7]. Since most of the semiconductor applications
are governed by the electrical properties of the materials, the electrical properties of the IV–VI
compounds (GeS, GeSe, SnS and SnSe) have been carried out by different investigators [8-11].
Most of these studies are nearly confined to investigations of electrical properties along the basal
plane and very few of them report the interesting question of electrical transport along the c-axis.
These lamellar compounds have attracted considerable attention because of their important
properties in the field of optoelectronics, lubricants, photovoltaic/photocatalytic, solar energy
converters, liquid junction solar cell, holographic recording systems, electronic switching and
infrared production and detection. These compounds have been grown in a crystalline form using
various techniques. The vapor transport technique has been proved as a very good technique to
grow good quality single crystal and to avoid the contamination of transporting agent; it is
preferable to grow crystals by DVT technique. They all exhibit an orthorhombic structure
belonging to space group h D2 16 (Pcmn). This paper reports the growth of GeS0.5Ge0.5 crystals
and a systematic study on the anisotropic behavior of GeS0.5Ge0.5.
Material and Methods
The author has grown GeS0.5Ge0.5 crystals using direct vapour transport technique. By setting a
precise temperature gradients between two zones to enhance the transport of material in vapour
form. The mixture was slowly heated to the required temperature. The slow heating was necessary
to avoid any explosion due to the strong exothermic reaction between the elements. A total charge
of nearly 10 g was kept in the furnace. Energy Dispersive Analysis of X-rays (EDAX) has been
carried out for determination of the chemical composition of grown crystals. The X-ray
diffractrograms (XRD) of these compounds were recorded on Philips PW 1710 diffractometer
using CuKα radiation. For the study of variation in resistivity with temperature of the grown crystals
a high temperature measurement set has been designed and developed in University Shophesticsted
Instrumentation Centre (USIC), Sardar Patel University. Using this experimental set up, resistance
of sample has been measured from room temperature to 723K temperature in the step of 10K and

International Journal of Research in Modern Engineering and
Emerging Technology (IJRMEET) UGC Approved id_47203
Vol. 5, Sp. Issue: 9, Sept.: 2017
(IJRMEET) ISSN: 2320-6586
383 Online International, Refereed, Impact factor & Indexed Monthly Journal www.raijmr.com
RET Academy for International Journals of Multidisciplinary Research (RAIJMR)
for each step the corresponding resistivity can been calculated. To avoid excessive heating of the
sample chamber, it is cooled by circulating cold water around it with the help of tubes.
The crystal is mounted in the sample holder which is then in inserted in the sample chamber and
closed at the top. Introducing this assembly in vertical tabular furnace. The temperature of the
sample is raised using variac. The temperature of the sample is measured with the help of Cr-Al
thermocouple kept in vicinity of the sample which is connected to the digital temperature controller
which can control and display the acquired temperature. Starting from room temperature (303 K),
the temperature of the sample is increased slowly from room temperature to 723 K, in steps of 10 K
and at each step the corresponding value of the resistivity of the sample is calculated. Electrical
resistivity parallel c-axis and perpendicular to c-axis has been measured and anisotropy ratio has
been calculated for all the samples.
Result and Discussion
The appropriate growth conditions for GeS0.5 Ge0.5 crystals is shown in table 1. The ampoule
containing the crystals was broken and crystals having maximum size shown in Table 1.
Table 1.Growth parameters of GeS0.5Se0.5 single crystal.
The results of the EDAX report shown in table 2, confirms that the stoichiometry of the
elements has been maintained in the grown crystals.
Crystal
Temperature distribution Growth
Period
[Days)
Dimension of the grown
crystals (cm2)
Reaction
Zone (K)
Growth
Zone (K)
GeS0.5Se0.5 923 873 7 0.75 X 0.65

International Journal of Research in Modern Engineering and
Emerging Technology (IJRMEET) UGC Approved id_47203
Vol. 5, Sp. Issue: 9, Sept.: 2017
(IJRMEET) ISSN: 2320-6586
384 Online International, Refereed, Impact factor & Indexed Monthly Journal www.raijmr.com
RET Academy for International Journals of Multidisciplinary Research (RAIJMR)
Figure 1.Electron diffraction pattern of GeS0.5Se0.5 crystal
Table 2 Chemical composition (wt. %) of as grown GeS0.5Se0.5 single crystal obtained by EDAX
analysis
Crystal
Wt (%) of elements
from EDAX
Wt % of elements taken for
growth experiment
Ge S Se Ge S Se
GeS0.5Se0.5
55.90 12.10 32.00 56.66 12.5 30.81
The values of lattice parameters obtained for GeS0.5 Se0.5 single crystals are compared and
found in agreement with those reported earlier by different investigators. The values of lattice
parameter for the crystal shown in table 3 confirms the orthorhombic structure of grown crystals.
Table 3. Lattice parameters, unit cell volume and X-ray density of GeS0.5Se0.5
Crystal
A in Ǻ
b in Ǻ
c in Ǻ
Unit Cell
Volume
(Ǻ)3
X-ray
Density
g cm-3
GeS0.5Se0.5 4.395 3.712
10.695
174.48
4.875

International Journal of Research in Modern Engineering and
Emerging Technology (IJRMEET) UGC Approved id_47203
Vol. 5, Sp. Issue: 9, Sept.: 2017
(IJRMEET) ISSN: 2320-6586
385 Online International, Refereed, Impact factor & Indexed Monthly Journal www.raijmr.com
RET Academy for International Journals of Multidisciplinary Research (RAIJMR)
The variation of log of electrical resistivity parallel to c-axis and perpendicular to c-axis in the
temperature range 303–723 K are shown in figures 2 & 3 , respectively. The decrease in electrical
resistivity with increase in temperature suggests the semiconducting nature of the grown crystals.
Using the resistivity values, anisotropy ratio was calculated using the relation
where ρ|| is the resistivity parallel to c-axis and ρ⊥ the resistivity perpendicular to c-axis.
Table 4. The values of activation energies perpendicular to c-axis and parallel to c-axis for
GeS0.5Se0.5 single crystal
Sample
Activation energy (eV)
Temp. Range Along a-b axis Temp. Range
Along c-
axis
GeS0.5Se0.5
304-428 0.161 308 – 368 0.189
433-533 0.120 373 – 543 0.491
538-723 0.407 553 -723 1.743
Figure 2. Variation of lnρ vs. inverse of temperature for GeS0.5Se0.5 single crystal along the basal plane.

International Journal of Research in Modern Engineering and
Emerging Technology (IJRMEET) UGC Approved id_47203
Vol. 5, Sp. Issue: 9, Sept.: 2017
(IJRMEET) ISSN: 2320-6586
386 Online International, Refereed, Impact factor & Indexed Monthly Journal www.raijmr.com
RET Academy for International Journals of Multidisciplinary Research (RAIJMR)
The anisotropy ratio was determined at different temperatures in the range 303– 723 K for grown
crystals. Figure 4 shows the variation of log of anisotropy ratio with reciprocal of temperature for
grown crystal. The anisotropy ratio increases as the temperature decreases.
Figure 3. Variation of lnρ vs. inverse of temperature for GeS0.5Se0.5 single crystal normal to the basal
plane.
Figure 4. Variation of logγ with temperature for GeSxSe1-x (x= 0.25, 0.5, 0.75)

International Journal of Research in Modern Engineering and
Emerging Technology (IJRMEET) UGC Approved id_47203
Vol. 5, Sp. Issue: 9, Sept.: 2017
(IJRMEET) ISSN: 2320-6586
387 Online International, Refereed, Impact factor & Indexed Monthly Journal www.raijmr.com
RET Academy for International Journals of Multidisciplinary Research (RAIJMR)
For the materials, which are intermediate between two and three dimensions, there is anisotropy of
strength of the bonds between atoms. Application of temperature or chemical alloying causes
greater changes in the lengths of the weaker bonds than those of stronger ones [12]. This type of
anisotropy behavior is an interesting question for the strongly layered materials and it can also be
explained as an effect of stacking disorder i.e. effect of a nonperiodic stacking sequence. Since the
stacking-fault energy in layered materials is small, real crystals grown at high temperatures usually
exhibit a nonperiodic stacking sequence [13]. The disorder produced by the stacking faults is
sufficient to localize the electron states normal to the layer. While considering the stacking between
the adjacent layers, the whole crystal always remains invariant under the primitive translations
parallel to the layers. So the d.c. resistivity parallel to layers is not affected by the presence of
stacking disorder. However, the variation of resistivity along the basal plane is attributed to the
change in nature. Layered crystals often show predominance of stacking faults [14]. Perpendicular
to the layers, however, there is a probability of transport due to the localization of the electron states
because of the presence of stacking faults. This will therefore give rise to a fairly large amount of
conduction parallel to c-axis. Further the amount of conduction will be more for the crystals where
the likelihood of stacking faults is more. However, according to [13] phenomenon of conduction
along c-axis is formally a hopping process. It probably occurs in these crystals via a large overlap
between states, which extend over many layers.
Conclusion
The growth experiments carried out in this paper clearly indicate that it is possible to grow crystals
of fairly large size using direct vaopur transport technique. The electron diffraction photograph in
figure 1 confirms their crystalline nature. The lattice parameters shown in table 3 are nearly in
agreement with those obtained earlier investigator. From the lattice parameters it has been
confirmed that all the crystals having orthorhombic crystal structure. High temperature resistivity
curves confirm the semiconducting nature of all the crystals. It is also proved that the crystal
having anisotropic nature and having two dimensional as well as three dimensional behaviors. The
increase in anisotropy ratio can be attributed to decrease in conduction along c-axis due to decrease
in presence of stacking disorder. The increase in anisotropy ratio can be attributed to the change in
bond lengths between the anion and cation.in the single crystals.

International Journal of Research in Modern Engineering and
Emerging Technology (IJRMEET) UGC Approved id_47203
Vol. 5, Sp. Issue: 9, Sept.: 2017
(IJRMEET) ISSN: 2320-6586
388 Online International, Refereed, Impact factor & Indexed Monthly Journal www.raijmr.com
RET Academy for International Journals of Multidisciplinary Research (RAIJMR)
References
[1] H. E. Buckley, “ Crystal growth”, John Wiley and Sons, New York, (1951).
[2] W. H. Brattain and G. B. Gareett, Bell. Syst.Tech.J., 32 (1955) 1.
[3] W. H. Brattain and G. B. Garrett, Bell. Syst. Tech. J., 34 (1955) 129.
[4] J. G. Burke, Origin of the Science of the Crystals (Berkeley , University of
California Press), (1966).
[5] D. Elwell and H.J. Scheel, Crystal Growth from High Temperature Solutions (New
Yprk, Academic Press), (1975)
[6] Agarwal A 1998 J. Cryst. Growth 183 347
[7] Agarwal M K, Patel P D and Vijayan O 1983 Phys. Status Solidi A79 103
[8] Maier H and Daniel D R 1977 J. Electron. Mater. 6 693
[9] Clemen C, Saldhana X I, Munz P and Bucher E 1978 Phys. Status Solidi A49 437
[10] Yue Y G, Yue A S and Stafsudd O M Jr 1981 J. Cryst. Growth 54 248
[11] Nagard N Le, Clement C Levy, Katty A and Lieth R M A 1990 Mater. Res. Bull. 25
495
[12] Peters M J and McNeil L E 1990 Phys. Rev. B41 5893
[13] Maschke K and Schmid Ph. 1975 Phys. Rev. B12 4312
[14] Trigunayat G C 1971 Phys. Status Solidi (a)4 281

International Journal of Research in Modern Engineering and Emerging Technology (IJRMEET) UGC Approved id_47203
Vol. 5, Sp. Issue: 9, Sept.: 2017 (IJRMEET) ISSN: 2320-6586
389 Online International, Refereed, Impact factor & Indexed Monthly Journal www.raijmr.com
RET Academy for International Journals of Multidisciplinary Research (RAIJMR)
Study on Fourier Transform Infrared (FTIR) Spectroscopy of
Charge Transfer Complexes (CTCs) of Ubiquinone (Coenzyme
Q10) and Menaquinone (Vitamin K2)
D. N. Bhavsar1#
, M. B. Patel2, S. G. Patel
2, M. Y. Barot
3 and A. T. Oza
2
1Bhavan’s Sheth R. A. College of Science, Khanpur, Ahmedabad-380001, Gujarat, India.
2Department of Physics, Sardar Patel University, Vallabh Vidyanagar-388120, Gujarat, India.
3 Government Science College, Gandhinagar
#corresponding author: [email protected], Tel. No.: +919429382908
Physics and Astronomy Classification Scheme Number (PACS): 82.39.jn, 87.85.jf, 87.14.Pq.
Abstract: The infrared spectra of four charge transfer complexes namely perylene-
ubiquinone, benzidine-ubiquinone, perylene-menaquinone and benzidine-menaquinone have
been studied. Band assignments have been carried out for vibrational bands. Featureless
ranges have been analyzed for nature of transitions which are interband transitions with band
gap in the infrared range. Ubiquinone complexes have shown Gaussian bands as electron
absorption envelopes while menaquinone complexes have shown triangular distributions as
envelopes. Both quinones have shown semiquinone ion bands in infrared (IR) range. A
relation between Lorentzian function and triangular distribution is briefly discussed.
Keywords: FTIR Spectroscopy, vitamin K2, donors and acceptors, triangular distributions.
Highlights:
We report the FTIR spectroscopic study of perylene- ubiquinone, benzidine-
ubiquinone, perylene-menaquinone and benzidine-menaquinone.
Gaussian bands as electron absorption envelopes for ubiquinone complexes and
triangular distributions as envelopes for menaquinone complexes have been verified.
Triangular distribution reveals imperfect nesting of Fermi surface.

International Journal of Research in Modern Engineering and Emerging Technology (IJRMEET) UGC Approved id_47203
Vol. 5, Sp. Issue: 9, Sept.: 2017 (IJRMEET) ISSN: 2320-6586
390 Online International, Refereed, Impact factor & Indexed Monthly Journal www.raijmr.com
RET Academy for International Journals of Multidisciplinary Research (RAIJMR)
1. Introduction
Organic charge transfer complexes are very famous [1-3] but only limited study exists on
charge transfer complexes of biomolecules [4]. Only homo-molecular bio-macromolecular
materials were reported to be semiconducting [5]. Here we have studied charge transfer
complexes of Ubiquinone (Coenzyme Q10) and Menaquinone (Vitamin K2) using infrared
spectroscopy. Ubiquinone is a fat-soluble quinone with a very long isoprenoid side chain of
10 isoprenoid units and therefore also called coenzyme Q10. This compound is found in
mammalian tissues. Ubiquinone is found in the inner membrane occurring in free and bound
protein forms. The function is to collect reducing equivalents from mitochondria vitamins K1
and K2 are found in plants. Vitamin K functions in a blood-clotting mechanism and converts
fibrinogen in to fibrin as an enzyme [6-8]. Menaquinone (Vitamin K2) contains six isoprenoid
units on the one side and an aromatic ring on the opposite side.
Figure 1 (a-b) Molecular structures of donors and acceptors, (c) Ubiquinone (Coenzyme Q10)
(d) Menaquinone (Vitamin K2).
Here, ubiquinone and menaquinone are selected as quinones containing ortho-substituted
isoprenoid side chain as compared to p-Benzoquinone which forms charge transfer
complexes with organic donors. There are two methoxy groups in ubiquinone and an
aromatic ring in menaquinone. Molecular structures of donors and acceptors are shown in
figure 1.
2. Experimental details
Benzidine (0.000656 gm) and ubiquinone (0.003 gm) were taken and grinded in agate
mortar to form a blue-coloured 1:1 charge transfer complex. Similarly, perylene (0.0088 gm)
and ubiquinone (0.003 gm) were grinded to form a green complex. Perylene and
menaquinoneformed green 1:1 complex. Benzidine and menaquinone formed a bluish green
complex in a similar manner.

International Journal of Research in Modern Engineering and Emerging Technology (IJRMEET) UGC Approved id_47203
Vol. 5, Sp. Issue: 9, Sept.: 2017 (IJRMEET) ISSN: 2320-6586
391 Online International, Refereed, Impact factor & Indexed Monthly Journal www.raijmr.com
RET Academy for International Journals of Multidisciplinary Research (RAIJMR)
The samples for infrared spectroscopic measurements were prepared by mixing the four
complexes in 5% with spectrograde anhydrous KBr powder in 95% and compressing in a die
after regrinding in a mortar to form circular pallets. The pallets were placed at infrared
window in Nicolet 400 D spectrophotometer and the spectra were recorded in 400 cm-1
range
of infrared frequencies.
3. Results and Discussion
Figure 2 (a) FTIR spectrum of ubiquinone, (b) Nature of transition in ubiquinone and
(c) ln A vs. (k-K0)2 for Gaussian profile in ubiquinone.
The infrared spectrum of homo-molecular ubiquinone was also taken and it is shown in
figure 2. There is a gap in sharp bands between 1700 cm-1
and 2800 cm-1
and no sharp band
is found in this interval of wave numbers. There are sharp bands above 2800 cm-1
.
Table 1. Band assignments in FTIR spectra of Ubiquinone, Perylene-Ubiquinone
Benzidine-Ubiquinone.
These six bands are assigned to C-H stretching vibrations of methyl groups as well as
those of isoprenoid units (table 1). The band assignments were carried out in full IR range
(Table 1), taking guidance from elsewhere [9, 10]. Four semiquinone ion bands were found at
1220 cm-1
(8.2 ), 1150 cm-1
(8.4 ), 1060 cm-1
(9.5 ) and 880 cm-1
(11.3 ) which show
presence of semiquinone ion.
This reveals that a semiquinone is formed upon a transfer of proton from the end of the
isoprenoid chains towards the oxygen atom of p-benzoquinone. Such materials in which one
part of a macromolecule behaves like a donor and the other part behaves like acceptor are
called self-complexes. Thus, ubiquinone is a self-complex in which side chain of 10
isoprenoid units is folded in three-dimension such as to form a C-H----O contact with oxygen
at para-position of p-benzoquinone. It is either a hydrogen bonding contact or a charge
transfer contact forming an H+-semiquinone anion ionic material.

International Journal of Research in Modern Engineering and Emerging Technology (IJRMEET) UGC Approved id_47203
Vol. 5, Sp. Issue: 9, Sept.: 2017 (IJRMEET) ISSN: 2320-6586
392 Online International, Refereed, Impact factor & Indexed Monthly Journal www.raijmr.com
RET Academy for International Journals of Multidisciplinary Research (RAIJMR)
There is a featureless absorption between 1700 cm-1
and 2800 cm-1
apart from very small
and broad bands which can be analyzed as optical absorption edge with Eg=0.225 eV (1800
cm-1
). Thus, the semiquinone ion form stacks which are semiconducting with this band gap
(figure 2 (b)). Ubiquinone is unique acceptor having negative charge on oxygen atom. In both
cases, dipole-dipole interaction leads to small intermolecular distance along the stacks. The
other evidence of semiconducting nature of ubiquinone is the presence of noise between 3500
cm-1
and 4000 cm-1
which is likely to exist in photoconducting materials. This is a region of
free carrier absorption which can be present in the conduction band. Thus, ubiquinone is a
photoconductor. There is also noise due to localization near the band edges near 1800 cm-1
.
There is Lorentzian Line-shape around 3450 cm-1
, in the spectrum of ubiquinone which
shows that either it is an intrinsic broadening or there is collision broadening. Other
background envelope is around 1400 cm-1
which fits a Gaussian curve (figure 2 (c)) which
shows there is a Doppler broadening of spectral line in this range.
Figure 3 (a) FTIR spectrum of perylene-ubiquinone, (b) FTIR spctrum of benzidine-
ubiquinone, (c) Nature of transition in perylene-ubiquinone, (d) Nature of
transition in benzidine-ubiquinone and (e) ln A vs. (k-K0)2 for Gaussian
profile in perylene-ubiquinone.
The IR spectra of perylene-ubiquinone and benzidine-ubiquinone are also shown in figure
3 (a-b) respectively. The spectrum of perylene-ubiquinone contains featureless absorption
between 1700 cm-1
and 2800 cm-1
. This extends as background absorption down to 800 cm-1
.
Thus, the forbidden energy gap between valence and conduction bands is very small of the
order of 0.10 eV which is analyzed (figure 3(c)). It is a forbidden direct transition and
therefore does not involve absorption and reemission of a phonon. Although ubiquinone is a
macromolecule which should lead to indirect transition, the transition is found to be direct
because the electronic conduction seems to be along the segregated perylene stacks rather

International Journal of Research in Modern Engineering and Emerging Technology (IJRMEET) UGC Approved id_47203
Vol. 5, Sp. Issue: 9, Sept.: 2017 (IJRMEET) ISSN: 2320-6586
393 Online International, Refereed, Impact factor & Indexed Monthly Journal www.raijmr.com
RET Academy for International Journals of Multidisciplinary Research (RAIJMR)
than along the mixed stacks. Perylene cation interacts with ubiquinone which exists in the
form of semiquinone. Again semiquinone ion bands are observed at appropriate frequencies.
Here condensed hydrocarbon perylene with its hydrogen atom shifted towards oxygen atom
of substituted benzoquinone. The IR spectrum of benzidine-ubiquinone is similar (figure
3(b)) to that perylene-ubiquinone (figure 3(a)) except bands of N-H stretching and C-N
stretching of benzidine molecule (table 1). The benzidine– ubiquinone shows an indirect
allowed transition fitting Ah=B(h-Eg)2 with Eg=0.22 eV (figure 3(d)). This gap is along
stacks of semiquinone ions.
The Lorentzian line shape of only ubiquinone around 3450 cm-1
is broadened by Doppler
effect in perylene-ubiquinone and benzidine-ubiquinone shows very broad and weak
Gaussian band almost approaching a Cauchy distribution for large damping coefficient and a
comparatively sharp Gaussian band in the case of benzidine-ubiquinone (figure 3(e)). The
photoconducting noise of only ubiquinone is considerably reduced in perylene-ubiquinone
and benzidine-ubiquinone complexes. Benzidine-ubiquinone is more photoconducting than
perylene-ubiquinone. Benzidne-ubiquinone and perylene-ubiquinone both show four
semiquinone ion bands. In benzidine complex, benzidine condenses into hydroquinone with
N-H---N bonds and hydrogen forming semiquinone ion of ubiquinone.
Figure 4 (a) FTIR spectrum of perylene- menaquinone, (b) FTIR spectrum of benzidine-
menaquinone, (c) Nature of transition in perylene- menaquinone, (d) Nature of
transition in benzidine-menaquinone.
The IR spectra of perylene-menaquinone and benzidine-menaquinone are shown in
(figure 4(a-b) respectively. Both of the spectra show triangular distribution with peak at 3470
cm-1
. This peak is symmetric triangle in perylene-menaquinone while it is an asymmetric
triangle having tail towards low frequency side, i.e. the slope of line forming triangle is
smaller towards low frequency side in benzidine-menaquinone. The Lorentzian is thus

International Journal of Research in Modern Engineering and Emerging Technology (IJRMEET) UGC Approved id_47203
Vol. 5, Sp. Issue: 9, Sept.: 2017 (IJRMEET) ISSN: 2320-6586
394 Online International, Refereed, Impact factor & Indexed Monthly Journal www.raijmr.com
RET Academy for International Journals of Multidisciplinary Research (RAIJMR)
broadened into triangle. The triangular barrier in an internal Franz-Keldysh effect [11] related
with tunneling of charge carriers across the band gap is tracked. The triangular distribution is
the distribution of averages when the statistical meaning is concerned. Either a binomial
distribution or a Lorentzian distribution is broadened to form such a triangular distribution.
There is an increase in electrical conductivity by three orders of magnitude when a
rectangular potential barrier is replaced by triangular distribution.
The wave function of an electron can become half-power beta density given by,
1 1* *2 2(1 )Ak k (1)
Where * K ak
b
and A is constant which is based on Bernoulli trials, i.e. either charge
carrier hops it does not hop. The electrical conductivity is related with wave function
according to 2
ne e where2
e is the charge density. This leads to
2 (1 )e A K K (2)
which is the equation of symmetric triangle. Thus,absorption coefficient becomes
2
1 1
4 4(1 )
e Ak k
n c n c
(3)
which is the triangular distribution. This shows how the triangular distribution is also
related to the hopping conduction.
When the wave function itself is a triangular distribution given by
* *(1 )Ak k (4)
Then the absorption coefficient is square-power beta density according to
*2 * 2(1 )Bk k (5)
which is the case of ionic materials related with optical phonons rather than acoustic
phonons. The potential barrier is triangular when there is Franz-Keldysh effect in a
semiconductor.

International Journal of Research in Modern Engineering and Emerging Technology (IJRMEET) UGC Approved id_47203
Vol. 5, Sp. Issue: 9, Sept.: 2017 (IJRMEET) ISSN: 2320-6586
395 Online International, Refereed, Impact factor & Indexed Monthly Journal www.raijmr.com
RET Academy for International Journals of Multidisciplinary Research (RAIJMR)
The featureless absorption in both menaquinone complexes show forbidden indirect
transition obeyingAh=B(h-Eg)3 in disordered or amorphous materials (figure 4(c-d))
respectively. The band gap of 0.225 eV is the standard band gap in charge transfer
complexes.
The aromatic ring in menaquinone resulting in an asymmetric molecule is responsible for
sharp triangular distribution. The aromatic ring localizes charge carrier while methoxy group
in ubiquinone delocalize charge carriers.
Long isoprenoid side chain in ubiquinone suppresses Peierls transition compared to
perylene-benzoquinone. Only in benzidine-ubiquinone the repulsive interactions dominate
and Peierls transition with Eg=0.225 eV is not suppressed. This may be related to the ionic
nature of benzidine because of ease of quaternization of N-atoms of amine groups.
Table 2. Band assignments in FTIR spectra of Perylene-Menaquinone Benzidine-
Menaquinone.
There is pronounced noise in perylene-menaquinone which shows more photoconducting
nature than benzidine-menaquinone which shows lesser noise. There are three oscillator
models below 1800 cm-1
in both of the menaquinone complexes, which reveal more electron-
phonon coupling as compared to ubiquinone complexes. Band assignments in the spectra of
menaquinone complexes are summarized in table 2.
Lorentzian and Gaussian distributions are related through large damping coefficient. A
harmonic oscillator model leads to Gaussian shape when the full-width at half-maximum
(FWHM) is large [12]. Further, a Gaussian distribution leads to Cauchy distribution when
width is further increased. This is as follows:
2
00
12
( )exp
2
K KA A
M
2
00
12
( )1
2
K KA
M
0
2
0
12
( )1
2
A
K K
M
(6)

International Journal of Research in Modern Engineering and Emerging Technology (IJRMEET) UGC Approved id_47203
Vol. 5, Sp. Issue: 9, Sept.: 2017 (IJRMEET) ISSN: 2320-6586
396 Online International, Refereed, Impact factor & Indexed Monthly Journal www.raijmr.com
RET Academy for International Journals of Multidisciplinary Research (RAIJMR)
Where, Ao is the maximum of the Gaussian curve and M 12 is the second moment of the
distribution related with FWHM. Benzidine-ubiquinone shows a Gaussian band while
perylene-ubiquinone shows a Cauchy distribution described by above approximation for large
Mz. Such an approximation was also discussed earlier [13].
A triangular distribution observed in menaquinone complexes can be described by the
triangular distribution given in the form of
1( ) 1
xdFf x
dx
(7)
Where f(x) is probability density function and F is total probability [14]. Here the mean is
and variance is 2/6. This triangular function can be derived from Lorentzian Line-shape as
follows. The Lorentzian function is
22
0
1( )
2( )
4
Lg
(8)
Where 0 is the resonance frequency and is the damping coefficient. This can be also
written as [15].
2
002
0
2 1( )
( )( )1
2
Lg
(9)
For large 0,
2
0
2
0 0
( )2( ) 1
( )
2
Lg
(10)

International Journal of Research in Modern Engineering and Emerging Technology (IJRMEET) UGC Approved id_47203
Vol. 5, Sp. Issue: 9, Sept.: 2017 (IJRMEET) ISSN: 2320-6586
397 Online International, Refereed, Impact factor & Indexed Monthly Journal www.raijmr.com
RET Academy for International Journals of Multidisciplinary Research (RAIJMR)
For 1/2 where 1/2 is the frequency where amplitude reduces to half, one of -0
cancels with 0 to give
0
0 0
( )2( ) 1
( )
4
Lg
(11)
This is of the form of triangular distribution with proportional to 0. Thus, a
Lorentzian Line-shape can be approximated to a triangular function in the vicinity of
resonance frequency 0. 0 is the mean and 0 is related with the variance. The triangular
distribution is in-between Lorentzian and Gaussian shapes.
Conclusions
In both menaquinone complexes electron-phonon coupling leads to triangular distribution
and in ubiquinone complexes, it leads to Gaussian or Cauchy distribution. Electronic
absorption envelope when Gaussian reveals free charge carriers while triangular distribution
reveals localization. Triangular distribution also reveals imperfect nesting of Fermi surface.
Acknowledgements
One of the author D. N. Bhavsar is very much thankful to DST for selection on INSPIRE
FELLOWSHIP and providing necessary financial support to carry out this work as a full time
Ph.D. student.
References
1. R Foster, in Organic Charge Transfer Complexes and References Therein (London-
New York: Academic, 1969).
2. F Gutman, & L E Lyons, in Organic Semiconductors and References Therein (John
Wiley & sons, Inc., New York, 1967).

International Journal of Research in Modern Engineering and Emerging Technology (IJRMEET) UGC Approved id_47203
Vol. 5, Sp. Issue: 9, Sept.: 2017 (IJRMEET) ISSN: 2320-6586
398 Online International, Refereed, Impact factor & Indexed Monthly Journal www.raijmr.com
RET Academy for International Journals of Multidisciplinary Research (RAIJMR)
3. S Kanda, & H A Pohl, in Macromolecular Chemistry [Monograph]: J E Katon and
Dekker, Marcel. Organic Semiconducting Polymers and References Therein (John
Wiley & sons, Inc., New York, 1968) Vol. 87.
4. M A Slifkin, in Charge Transfer Interactions of Bio-molecules and References
Therein (Academic Press, London-New York, 1971).
5. D D Eley, in Macromolecular Chemistry [Monograph]: Katon, J. E. Dekker, Marcel.
Organic Semiconducting Polymers and References Therein (John Wiley & sons, Inc.,
New York, 1968).
6. L Albert & Lehninger, in Principles of Biochemistry: (CBS publishers and
Distributors, Delhi (India), 1984) p. 269-479.
7. A N Nesmeyanov, in Fundamentals of Organic Chemistry (Mir Publishers, Moscow,
1978) Vol. 4, p. 471.
8. M V Volkenshtein, in Biophysics (Mir Publishers, Moscow, 1983).
9. P S Sindhu, in Molecular Spectroscopy: (Tata Mac Graw-Hill Pub. Co. Ltd., New
Delhi, 1984) Vol. 104.
10. R S Drago, in Physical Methods in Inorganic Chemistry (Affiliated East-West Press
Pvt. Ltd., Madras, 1971) p. 222.
11. J I Pankov, in Optical Processes in Semiconductors (Prentice-Hall Inc. Englewood
Cliffs, New Jersy, 1974).
12. A T Oza, Spectroscopic theory for organic and organometallic conductors. Canadian
Journal of Physics, 80, 1175 (2002).
13. H O Parmar, Ph.D. Thesis (Sardar Patel University, Gujarat (India), 2012), p. 180.
14. P Mukhopadhayay, Mathematical Statistics (Books and Allied Pvt. Ltd., Calcutta,
2002) p. 58-92.

International Journal of Research in Modern Engineering and Emerging Technology (IJRMEET) UGC Approved id_47203
Vol. 5, Sp. Issue: 9, Sept.: 2017 (IJRMEET) ISSN: 2320-6586
399 Online International, Refereed, Impact factor & Indexed Monthly Journal www.raijmr.com
RET Academy for International Journals of Multidisciplinary Research (RAIJMR)
15. B B Laud, Lasers and Non-Linear Optics (Wiley Eastern Limited, New Delhi, 1985)
p. 66.
TABLES:
Table 1. Band assignments in FTIR spectra of Ubiquinone, Perylene-Ubiquinone
Benzidine-Ubiquinone.
Table 2. Band assignments in FTIR spectra of Perylene-Menaquinone Benzidine-
Menaquinone.
FIGURES:
Fig. 1 (a-b) Molecular structures of donors and acceptors, (c) Ubiquinone (Coenzyme Q10)
(d) Menaquinone (Vitamin K2).
Fig. 2 (a) FTIR spectrum of ubiquinone, (b) Nature of transition in ubiquinone and
(c) ln A vs. (k-K0)2 for Gaussian profile in ubiquinone.
Fig. 3 (a) FTIR spectrum of perylene-ubiquinone, (b) FTIR spectrum of benzidine-
ubiquinone, (c) Nature of transition in perylene-ubiquinone, (d) Nature of transition in
benzidine-ubiquinone and (e) ln A vs. (k-K0)2 for Gaussian profile in perylene-
ubiquinone.
Fig.4 (a) FTIR spectrum of perylene- menaquinone, (b) FTIR spectrum of benzidine-
menaquinone, (c) Nature of transition in perylene- menaquinone, (d) Nature of
transition in benzidine-menaquinone.
Tables:

International Journal of Research in Modern Engineering and Emerging Technology (IJRMEET) UGC Approved id_47203
Vol. 5, Sp. Issue: 9, Sept.: 2017 (IJRMEET) ISSN: 2320-6586
400 Online International, Refereed, Impact factor & Indexed Monthly Journal www.raijmr.com
RET Academy for International Journals of Multidisciplinary Research (RAIJMR)
Table 1. Band assignments in FTIR spectra of Ubiquinone, Perylene-Ubiquinone
Benzidine-Ubiquinone.
Band assignments Band assignments Band assignments
Ubiquinone Perylene-Ubiquinone Benzidine-Ubiquinone
Wavenumber
(cm-1
)
Band
Assignment
Wavenumber
(cm-1
)
Band
Assignment
Wavenumber
(cm-1
)
Band
Assignment
3080, 3050
C-H stretching
in CH3 groups
3060 C-H stretching
in C-H groups
3480, 3440,
3350, 3200
N-H, N-H
stretching
2930, 2970,
2900, 2850
C-H stretching
in isoprenoid
units
2980,2850 C-H stretching
in isoprene
units
3060 C-H stretching
1650, 1600 C=O stretching 1650 C=O
stretching
2950 C-H stretching
in isoprene
units
1460 C=C stretching 1500
1400
1260
C=C
stretching
C-H bending
C-O stretching
1650 C=O stretching
1400 C-H bending
(deformation)
1220, 1150,
1060
Semiquinone
ion bands
1500, 1300 C=C stretching
1250 C-O stretching
in
C-OCH3 and in
O-CH3
880 Semiquinone
ion band
1220, 1150,
1060
Semiquinone
bands and C-N
stretching
1220, 1150,
1060, 1000
C-C stretching 850, 800 C-H in C-CH3
and
C-O-CH3
870 Semiquinone
ion band
900 C-H in C-CH3 700, 500 C-H in
isoprene units
800 C-H
880 Semiquinone
ion band
700, 500 C-H in isoprene
units
850
800
C-H in C-O-CH3
700, 500
C-H in isoprene
units

International Journal of Research in Modern Engineering and Emerging Technology (IJRMEET) UGC Approved id_47203
Vol. 5, Sp. Issue: 9, Sept.: 2017 (IJRMEET) ISSN: 2320-6586
401 Online International, Refereed, Impact factor & Indexed Monthly Journal www.raijmr.com
RET Academy for International Journals of Multidisciplinary Research (RAIJMR)
Table 2. Band assignments in FTIR spectra of Perylene-Menaquinone Benzidine-
Menaquinone.
Band assignments Band assignments
Perylene-Menaquinone Benzidine-Menaquinone
Wavenumber
(cm-1
)
Band
Assignment
Wavenumber
(cm-1
)
Band
Assignment
3053 C-H stretching 3469, 3322 N-H stretching
of benzidine
2912, 2865 C-H stretching
in isoprene units
2979, 2919,
2858
C-H bending
1670 C=O stretching 1669 C=O stretching
1454 C=C stretching 1508 C=C stretching
1387 C-H bending 1454 C=C stretching
1293 C-O stretching 1387 C-H bending
1220, 1150,
1060
Semiquinone ion
bands
1293 C-O stretching
870
820
C-H in C-CH3
and
C-O-CH3
1220, 1172,
1060
Semiquinone
ion bands and
C-N stretching
770, 722, 628,
554
C-H in isoprene
units
3053 C-H stretching

International Journal of Research in Modern Engineering and Emerging Technology (IJRMEET) UGC Approved id_47203
Vol. 5, Sp. Issue: 9, Sept.: 2017 (IJRMEET) ISSN: 2320-6586
402 Online International, Refereed, Impact factor & Indexed Monthly Journal www.raijmr.com
RET Academy for International Journals of Multidisciplinary Research (RAIJMR)
Figures:
Fig. 1 (a-b) Molecular structures of donors and acceptors, (c) Ubiquinone (Coenzyme Q10)
(d) Menaquinone (Vitamin K2).

International Journal of Research in Modern Engineering and Emerging Technology (IJRMEET) UGC Approved id_47203
Vol. 5, Sp. Issue: 9, Sept.: 2017 (IJRMEET) ISSN: 2320-6586
403 Online International, Refereed, Impact factor & Indexed Monthly Journal www.raijmr.com
RET Academy for International Journals of Multidisciplinary Research (RAIJMR)
Fig. 2 (a) FTIR spectrum of ubiquinone, (b) Nature of transition in ubiquinone and (c) ln A
vs. (k-K0)2 for Gaussian profile in ubiquinone.

International Journal of Research in Modern Engineering and Emerging Technology (IJRMEET) UGC Approved id_47203
Vol. 5, Sp. Issue: 9, Sept.: 2017 (IJRMEET) ISSN: 2320-6586
404 Online International, Refereed, Impact factor & Indexed Monthly Journal www.raijmr.com
RET Academy for International Journals of Multidisciplinary Research (RAIJMR)
Fig. 3 (a) FTIR spectrum of perylene-ubiquinone, (b) FTIR spectrum of benzidine-
ubiquinone,
(c) Nature of transition in perylene-ubiquinone, (d) Nature of transition in benzidine-
ubiquinone and (e) ln A vs. (k-K0)2 for Gaussian profile in perylene-ubiquinone.

International Journal of Research in Modern Engineering and Emerging Technology (IJRMEET) UGC Approved id_47203
Vol. 5, Sp. Issue: 9, Sept.: 2017 (IJRMEET) ISSN: 2320-6586
405 Online International, Refereed, Impact factor & Indexed Monthly Journal www.raijmr.com
RET Academy for International Journals of Multidisciplinary Research (RAIJMR)
Fig. 4 (a) FTIR spectrum of perylene- menaquinone, (b) FTIR spectrum of benzidine-
menaquinone, (c) Nature of transition in perylene- menaquinone, (d) Nature of
transition in benzidine-menaquinone.

International Journal of Research in Modern Engineering and
Emerging Technology (IJRMEET) UGC Approved id_47203
Vol. 5, Sp. Issue: 9, Sept.: 2017
(IJRMEET) ISSN: 2320-6586
406 Online International, Refereed, Impact factor & Indexed Monthly Journal www.raijmr.com
RET Academy for International Journals of Multidisciplinary Research (RAIJMR)
“Synthesis and Characterization of Pure and Mg Doped
ZnO Thin films and Nanorods”
Kaushal V. Kadiya
Research scholar, Central university of Gujarat, Gandhinagar
E-mail ID: [email protected]
Abstract
In this paper, The optical absorption edge and the near-absorption edge characteristics of Mg
undoped and doped ZnO as Mgx Zn1-x O thin film and Nanorods(NR) using low cost chemical
solution deposition techniques for growing seed layers of pure and Mg doped ZnO via Spin Coating
Method method on glass substrate. Their optical properties were investigated using UV-Vis
spectroscopy and its surface topography and grain size were investigated using AFM . The Mg
dopant was found to be improving optical band gap. Accurate band gap estimation studied was
obtained by using the general equation of absorbance coefficient proportional to photon energy
graph which has discussed below result and discussion with n = 1/2 for an indirect allowed
transition and n = 2 for a direct allowed transition.
Keywords
ZnO , MgO , Mgx Zn1-x O , 2-Methoxy ethanol and MEA. UV detector, AFM.
Introduction:
Nanotechnology is a vast empire of unknown things brought into light and certainly is the future of
the days to come where the size would not be an issue[1-4]. It defines a particle as a single unit in
terms of its properties and transport. Assuming a particle to be roughly spherical, classification can
be done on the basis of their diameters and nanoparticles have size less than 100 nanometres[5-7]
Synthesis Details:
We have followed the Sol-Gel Route for the synthesis of the Mg doped ZnO (i.e. ; where x =
doping in %) thin films with varied doping concentrations (viz. 0% and 4%)[8-9]. In order to

International Journal of Research in Modern Engineering and
Emerging Technology (IJRMEET) UGC Approved id_47203
Vol. 5, Sp. Issue: 9, Sept.: 2017
(IJRMEET) ISSN: 2320-6586
407 Online International, Refereed, Impact factor & Indexed Monthly Journal www.raijmr.com
RET Academy for International Journals of Multidisciplinary Research (RAIJMR)
prepare the Solution and pursue the deposition, following steps were undertaken, The preparation
of 0.3M solution of Zinc Acetate and Magnesium Chloride was accomplished for seed layer growth
by weighing the respective compounds as precursors in accordance with the solid state calculation
route suggested by Dr. Utpal Joshi. These compounds were then dissolved in the 20ml 2-Methoxy
ethanol and MEA (Mono Ethanol Amine) in a ratio of 19.5:0.5 respectively by constant stirring for
30 minutes at 35oC[10-12]. After completion of the stirring process the samples were provided
aging for 24 hours in order to observe the behaviour of the solution under the atmospheric
conditions. These samples were then used for deposition of the solution on the RCA cleaned glass
surface (sec. 2.2) using the Spin Coating Method (sec. 2.1). The Spin coating was approached under
identical conditions for all the samples for 10 coats at 2000 rpm. After each coat the films were
provided drying on the Hot Plate for 10 minutes at 215oC[13-14]. These films were then subjected
to the oven at 75oC for 24hrs and then were subjected to Air Annealing at two different
temperatures viz. 350oC 90 minutes to form the seed layer. These films were then approached Dip
Coating Process prepared with a molarity of 0.5M containing the same precursors for 0% and 4%
concentrations of doping for 1 hour[15]. These films were then subjected to Air Annealing @
4500C for 2 hours for the growth of Nanorods[16].
Configuration
Fig. 1: Typical configuration of an AFM.
(1):: Cantilever, (2): Support for cantilever, (3): Piezoelectric element(to oscillate cantilever at its
Eigen frequency.), (4): Tip (Fixed to open end of a cantilever, acts as the probe), (5): Detector of
deflection and motion of the cantilever, (6): Sample to be measured by AFM, (7): xyz drive, (moves
sample (6) and stage (8) in x, y, and z directions with respect to a tip apex (4)), and (8): Stage. The
small spring-like cantilever (1) is carried by the support (2). Optionally, a piezoelectric element (3)
oscillates the cantilever (1). The sharp tip (4) is fixed to the free end of the cantilever (1). The

International Journal of Research in Modern Engineering and
Emerging Technology (IJRMEET) UGC Approved id_47203
Vol. 5, Sp. Issue: 9, Sept.: 2017
(IJRMEET) ISSN: 2320-6586
408 Online International, Refereed, Impact factor & Indexed Monthly Journal www.raijmr.com
RET Academy for International Journals of Multidisciplinary Research (RAIJMR)
detector (5) records the deflection and motion of the cantilever (1). The sample (6) is mounted on
the sample stage (8). An xyz drive (7) permits to displace the sample (6) and the sample stage (8) in
x, y, and z directions with respect to the tip apex (4). Although Fig. 4 shows the drive attached to
the sample, the drive can also be attached to the tip, or independent drives can be attached to both,
since it is the relative displacement of the sample and tip that needs to be controlled. Controllers and
plotter are not shown in Fig. 4. Numbers in parentheses correspond to numbered features in Fig. 1.
Coordinate directions are defined by the coordinate system (0).According to the configuration
described above, the interaction between tip and sample, which can be an atomic scale
phenomenon, is transduced into changes of the motion of cantilever which is a macro scale
phenomenon. Several different aspects of the cantilever motion can be used to quantify the
interaction between the tip and sample, most commonly the value of the deflection, the amplitude of
an imposed oscillation of the cantilever, or the shift in resonance frequency of the cantilever (see
section Imaging Modes). The detector (5) of AFM measures the deflection (displacement with
respect to the equilibrium position) of the cantilever and converts it into an electrical signal. The
intensity of this signal will be proportional to the displacement of the cantilever.
Image Formation:
When using the AFM to image a sample, the tip is brought into contact with the sample, and the
sample is raster scanned along an x-y grid (fig 4). Most commonly, an electronic feedback loop is
employed to keep the probe-sample force constant during scanning. This feedback loop has the
cantilever deflection as input, and its output controls the distance along the z axis between the probe
support (2 in fig. 3) and the sample support (8 in fig 3). As long as the tip remains in contact with
the sample, and the sample is scanned in the x-y plane, height variations in the sample will change
the deflection of the cantilever. The feedback then adjusts the height of the probe support so that the
deflection is restored to a user-defined value (the set-point). A properly adjusted feedback loop
adjusts the support-sample separation continuously during the scanning motion, such that the
deflection remains approximately constant. In this situation, the feedback output equals the sample
surface topography to within a small error. Historically, a different operation method has been used,
in which the sample-probe support distance is kept constant and not controlled by a feedback (servo
mechanism). In this mode, usually referred to as 'constant height mode', the deflection of the
cantilever is recorded as a function of the sample x-y position. As long as the tip is in contact with
the sample, the deflection then corresponds to surface topography. The main reason this method is
not very popular anymore, is that the forces between tip and sample are not controlled, which can

International Journal of Research in Modern Engineering and
Emerging Technology (IJRMEET) UGC Approved id_47203
Vol. 5, Sp. Issue: 9, Sept.: 2017
(IJRMEET) ISSN: 2320-6586
409 Online International, Refereed, Impact factor & Indexed Monthly Journal www.raijmr.com
RET Academy for International Journals of Multidisciplinary Research (RAIJMR)
lead to forces high enough to damage the tip or the sample. It is however common practice to
record the deflection evenwhen scanning in 'constant force mode', with feedback. This reveals the
small tracking error of the feedback, and can sometimes reveal features that the feedback was not
able to adjust for. The AFM signals, such as sample height or cantilever deflection, are recorded on
a computer during the x-y scan. They are plotted in a pseudocolor image, in which each pixel
represents an x-y position on the sample, and the colour represents the recorded signal.
Results and discussion
Optical Properties
Underlying are the UV data for the MZO thin films in accordance with the synthesis with the
doping varied as 0% and 4%. The plots shown are for Transmittance and Absorbance versus
Wavelength in nm. The transmittance spectra and optical properties of the ZnO NRs in the
wavelength range of 300 to 800 nm were investigated through UV-visible spectroscopy at RT. The
UV-visible transmittance spectra of the ZnO NRs are shown in Figure 1. The inset of Figure 1
shows the magnified view of transmittance spectrum in the wavelength range of 100 to 800 nm.
100 200 300 400 500 600 700 800 900
0
20
40
60
80
100
Tra
nsm
itta
nce
(%
)
Wavelength (nm)
4% Mg doped ZnO
Pure ZnO
9
210 280 350 420 490 560 630 700 770 840
0.0
0.5
1.0
1.5
2.0
2.5
3.0
3.5
4.0
4.5
5.0
5.5
6.0
Ab
so
rba
nce
(a
.u.)
Wavelength (nm)
Pure ZnO
4% Mg doped ZnO
Fig 1. Optical transmittance spectra of ZnO NRs
Fig.2 Graph of Absorbance vs Wavelength

International Journal of Research in Modern Engineering and
Emerging Technology (IJRMEET) UGC Approved id_47203
Vol. 5, Sp. Issue: 9, Sept.: 2017
(IJRMEET) ISSN: 2320-6586
410 Online International, Refereed, Impact factor & Indexed Monthly Journal www.raijmr.com
RET Academy for International Journals of Multidisciplinary Research (RAIJMR)
The graph showed that all of the ZnO NRs that were prepared using different dopping exhibited
strong excitonic absorption peaks at 300 nm. These peaks indicated that the grown ZnO NRs
possessed good optical quality good exciton binding energy. Here we o find value of band gap by
usually use the Tauc relation by plotting a graph between (αhν)n versus (hν).Here The absorption
coefficient (α) for the direct transition of the ZnO NRs was studied using Equation
absorption coefficient (α) = 2.303 A / t
where (A) is absorbance and (t) is thickness of thin film.
while (hν) is the photon energy, where
hν(eV) = 1240 / incident wavelength (nm)
The optical bandgap (αhv)2 dependence on the absorption coefficient (α) over the energy range of
3 to 3.5 eV at RT was calculated, where the line intercept with X axis which shows photon
energy as showed in below figure (3),
2.5 3.0 3.5 4.0 4.5
0.00E+000
1.00E+020
2.00E+020
3.00E+020
4.00E+020
(h)
Photon Energy (eV)
Pure ZnO
Fig.3 (a) For Pure ZnO
2.0 2.5 3.0 3.5 4.0 4.5 5.0-5.00E+019
0.00E+000
5.00E+019
1.00E+020
1.50E+020
2.00E+020
2.50E+020
3.00E+020
3.50E+020
4.00E+020
(h)
Photon Energy (eV)
4% Mg doped ZnO
Fig.3 (b) For 4% Mg doped ZnO

International Journal of Research in Modern Engineering and
Emerging Technology (IJRMEET) UGC Approved id_47203
Vol. 5, Sp. Issue: 9, Sept.: 2017
(IJRMEET) ISSN: 2320-6586
411 Online International, Refereed, Impact factor & Indexed Monthly Journal www.raijmr.com
RET Academy for International Journals of Multidisciplinary Research (RAIJMR)
7
2 3 4 5 6
0.00E+000
5.00E+019
1.00E+020
1.50E+020
2.00E+020
2.50E+020
3.00E+020
3.50E+020
4.00E+020
4.50E+020
5.00E+020
(h)
Photon Energy (eV)
Pure ZnO
4% Mg doped ZnO
Fig.3 (c)
AFM DATA
5.3 Observations:
% of Mg doped in ZnO Band gap (eV)
0% 3.4121
4% 3.6469

International Journal of Research in Modern Engineering and
Emerging Technology (IJRMEET) UGC Approved id_47203
Vol. 5, Sp. Issue: 9, Sept.: 2017
(IJRMEET) ISSN: 2320-6586
412 Online International, Refereed, Impact factor & Indexed Monthly Journal www.raijmr.com
RET Academy for International Journals of Multidisciplinary Research (RAIJMR)
ACKNOWLEDGEMENT
I am thankful to guiding Prof. U.S. Joshi and H.O.D Prof. P.N. Gajjar, School of Science and
all the Faculty Member for providing me the guidance in the preparation of the topic. Without
their experience and insights, it would have been very difficult to do quality work. Also I thank the
Gujarat University for providing the possible assets for the successful execution of the research
project work.
References:
1. Y. T. Yin, W. X. Que, C. H. Kam, J Sol-Gel Sci Technol (2010) 53:605–612.
2. Z.Q. Ma, W.G. Zhao, Y. Wang, Thin Solid Films 515 (2007) 8611–8614.
3. Dongxu Zhao, Yichun Liu, Dezhen Shen, Youming Lu, Jiying Zhang, Xiwu Fan, Journal of
Growth 234 (2002) 427–430.
4. M. Sahal, B.Hartiti, A.Ridah, M.Mollar, B.Marı´, Microelectronics Journal 39 (2008) 1425–
1428.
5. Masashi Ohyama, Hiromitsu Kozuka, Toshinobu Yoko, Thin Solid Films 306 (1997) 78-85.
6. J. Liu, H. Xia, D. Xue, L. Lu, J. Am. Chem. Soc. 131 (2009) 12086.
7. C. Yan, D. Xue, Adv. Mater. 20 (2008) 1055.
8. H. Xia, W. Xiao, M.O. Lai, L. Lu, Funct. Mater. Lett. 2 (2009) 13.
9. T.H. Fang, S.H. Kang, J. Phys. D: Appl. Phys. 41 (2008) 245303.
10. Anna Og. Dikovska, P.A. Atanasov, A.Ts. Andreev, B.S. Zafirova, E.I. Karakoleva, T.R.
Stoyanchov, Appl. Surf. Sci. 254 (2007) 1087.
11. D.X. Jiang, L. Cao, W. Liu, G. Su, H. Qu, Y.G. Sun, B.H. Dong, Nanoscale Res. Lett. 4
(2009)
12. D.K. Hwang, M.C. Jeong, J.M. Myoung, Appl. Surf. Sci. 225 (2004) 217.
13. Investigation on the properties of pure and doped nanocrystalline ZnO films,Ali Fatima A,
December, 2011
14. Tang H, Prasad K, Sanjines R, Schmid PE, Le´vy F (1994) J Appl Phys 75:2042
15. Akl AA, Kamal H, Abdel-Hady K (2006) Appl Surf Sci 252:8651
16. Fan X, Yu T, Zhang L, Chen X, Zou Z (2007) J Chem Phys 20:73347

International Journal of Research in Modern Engineering and Emerging Technology (IJRMEET) UGC Approved id_47203
Vol. 5, Sp. Issue: 9, Sept.: 2017 (IJRMEET) ISSN: 2320-6586
413 Online International, Refereed, Impact factor & Indexed Monthly Journal www.raijmr.com
RET Academy for International Journals of Multidisciplinary Research (RAIJMR)
Infrared spectra of ternary complexes using benzidine and
quinoline as donors
Ashok N. Patel1*
, G. K. Solanki
2,, Ajay T. Oza
2
1Sheth M.N. Science College, Hemchandracharya North Gujarat University, Patan-384 265,
Gujarat, India
2Department of Physics, Sardar Patel University, Vallabh Vidyanagar- 388 120, Gujarat, India
*Correspondence: [email protected]
Abstract: The charge transfer complexes of ternary type are prepared using benzidine and
quinoline as donor molecules and studied with FTIR spectroscopy. Direct interband transitions
are found around 0.22 eV except TCNE complex. The lower absorption edge is found to be of
indirect type. TCNQ and chloranil complexes show half- power beta density and DDQ and
TCNE complexes show triangular distributions. Only iodine complex shows Gaussian
distribution. The low frequency background absorption is Gaussian distributed in TCNQ,
chloranil and iodine complexes. Only TCNE complex shows a square power beta density. Iodine
complex has highest conductivity with a range of free-carrier absorption.
Keywords: Infrared, ternary complexes, beta density, Gaussian distribution, nature of transition
Introduction
The earlier studies on ternary organic CT complexes included doped (TMTSF)2 ClO4, alkyl-
ammonium donors with TCNQ-iodine, pyrene-TCNQ-ferrocene, substituted anthraquinone
complexes and others [1-6]. (TMPD)1.5 –KI-I2 and (TMPD)1.5 –HI-I2 can be also considered as
ternary systems [7]. There are two types of ternary systems. (1) one-donor and two-acceptor
based systems which include, K-(BEDT-TTF)2 Cu[(CN)2]NX where X=Cl, Br, I, (C1-TET-
TTF)(FeBr4)1-x Fecl4)x etc. [8-15] some of which were organic superconductors. (2) Two-donors
and one acceptor based systems including -(BEDT-TTF)2MHg(SCN)4 where M=K,NH4, -
(BEDT-TTF)2RbZn(SCN)4 and -(CH3)4AS[Pd(dmit)2] [16-23], some of which were also
superconducting. Ternary charge transfer complexes and radical-ion salts possess unique
physical properties which are absent in binary (bimolecular) complexes. These properties
include two-band transport, incommensurate to commensurate transition, alloy properties,
cooperative and competitive binding, more than two oscillator models or three absorption

International Journal of Research in Modern Engineering and Emerging Technology (IJRMEET) UGC Approved id_47203
Vol. 5, Sp. Issue: 9, Sept.: 2017 (IJRMEET) ISSN: 2320-6586
414 Online International, Refereed, Impact factor & Indexed Monthly Journal www.raijmr.com
RET Academy for International Journals of Multidisciplinary Research (RAIJMR)
envelopes, complex-salt character, superconduction and electron-exciton interactions. In the
present work, we report CT complexes of benzidine-quinoline-(TCNQ)2 , benzidine-quinoline-
(TCNE)2, benzidine-quinoline-(chloranil)2, benzidine-quinoline-(DDQ)2 and benzidine-
quinoline-(I2)2 all in 1:1:2 molecular weight proportions.
Experimental
The donor benzidine was grinded with acceptors like TCNQ(7,7,8,8-tetra-cyano-p-
quinodimethane), TCNE(N,N,N,N-tetracyano-p-ethylene), chloranil (2,3,5,6-tetrachloro-p-
benzoquinone), DDQ(2,3-dichloro-5,6-dicyano-p-benzoquinone) and iodine in 1:2 molecular
weight proportions. The liquid donor quinoline was added with the help of micropipette in a few
drops needed in molecular weight proportions to form 1: 1:2 ternary complexes. The infrared
spectra were recorded using a standard Perkin-Elmer spectra-photometer on the KBr-based
semi-transparent pellets of all the five ternary complexes.
Results and discussion
The first is the infrared spectrum of benzidine-quinoline-(TCNQ)2 which is shown here (Figure
1a). This spectrum can be divided in to three parts according to background absorption governed
by electronic absorption. The first range is the 1700-3600 cm-1
where a very broad half-power
beta density distribution is observed given by
=0E*1/2
(1-E*)
1/2 (1)
where E* = (E-a)/b is the reduced, dimensionless energy variable.
But difference in the spectrum between this and that of benzidine-pyridine-(TCNQ)2 reported
recently is in the splitting of the above distribution at 2317 cm-1
by a dispersion shape of 1()
the real part of dielectric constant. Because of this splitting the distribution becomes asymmetric
below 2317 cm-1
. The second range 1700-2170 cm-1
correspond more to a transition across the
usual band gap around 1700 cm-1
, rather than being a part of beta density. This splitting and
asymmetry arise from stronger interaction between quinoline and TCNQ than pyridine-TCNQ
interaction. The third part is below 1700 cm-1
down to 500 cm-1
. This range consists of a very
broad symmetric Gaussian band around 1100 cm-1
. There are no two envelopes below 1700 cm-1
.
This also is a consequence of strong interaction between quinoline and TCNQ.
The second spectrum is that of benzidine-quinoline-(DDQ)2 (Figure 1b). Here too, the spectrums
can be divided in three main parts. The first range is above 1800 cm-1
where a very large
triangular distribution centered around 3082 cm-1
is observed. This is a consequence of screening

International Journal of Research in Modern Engineering and Emerging Technology (IJRMEET) UGC Approved id_47203
Vol. 5, Sp. Issue: 9, Sept.: 2017 (IJRMEET) ISSN: 2320-6586
415 Online International, Refereed, Impact factor & Indexed Monthly Journal www.raijmr.com
RET Academy for International Journals of Multidisciplinary Research (RAIJMR)
of interaction between benzidine and DDQ by quinoline. In this range, spectrum significantly
differs from that of TCNQ complex. This arises from asymmetric nature of DDQ molecule
leading to more electronic molecular polarizability. It can not be attributed to the halogen end-
group interacting with donor because iodine complex shows different features in this range.
The triangular distribution can be attributed to the nesting of Fermi surface, i.e. scattering of
q=2kF electrons by phonons, which remains imperfect as revealed by an symmetric distribution.
Then comes the second range which contains an interband electronic transition.
The third range is below 1800 cm-1
down to 400 cm-1
. The background absorption is a
monotonic function rather than a Gaussian distribution, the later found in the TCNQ complex.
The absorption decreases as the frequency (or energy) decreases. The absorption is minimum at
or below 0.05eV (400 cm-1
). Thus in the both ranges spectrum differs for DDQ complex from
that of the TCNQ complex. Benzidine-DDQ interaction is stronger than benzidine-TCNQ
interaction. Benzidine is enable to screen strongly in the DDQ complex. There is a steep rise in
transmission above 1560 cm-1
towards the high frequency side. The absorption is minimum near
1750 cm-1
and there is a long band-tailing towards low frequency side. This may be related with
imperfect nesting leading to this feature [24]. The real part of optical conductivity 1 () and the
imaginary part of dielectric constant 2 () are related. If we look at the high-frequency
behaviour, it is a broad dispersion shape between 3600 cm-1
and 1750 cm-1
. The constant high
frequency background above 3600 cm-1
is extrapolated and considered to be zero level, the curve
in 1750 – 3600 cm-1
is cut to give a dispersion shape governed by 1 (). There is anomalous
dispersion in this range. It is a fluctuation in absorption around zero level and if we apply lever
rule, there is no net absorption. The integration (area under the band) is almost zero in this range.
The second range of absorption below 1400 cm-1
mainly consists of absorption across a very
small band gap (Eg<0.05 eV). These transitions coupled two bands through a Gaussian
distribution in the TCNQ salts. The transitions are hindered in TCNQ complex while the
transitions occur without being screened in the DDQ complex. In both of TCNQ and DDQ
complexes, the lowest-lying envelope around 750 cm-1
is not observed because it merges in the
mid-IR envelope.
The third spectrum is that of benzidine-quinoline-(chloranil)2 (Figure 2a). In this case, three
envelopes are observed because of lack of delocalization due to screening effect. Benzidine-
chloranil binary complex is weaker in interaction than benzidine-DDQ binary complex. As a
result, the interaction is screened by quinoline molecules. The highest-lying half power beta
density envelope is somewhat similar to the one found in the TCNQ complex but somewhat

International Journal of Research in Modern Engineering and Emerging Technology (IJRMEET) UGC Approved id_47203
Vol. 5, Sp. Issue: 9, Sept.: 2017 (IJRMEET) ISSN: 2320-6586
416 Online International, Refereed, Impact factor & Indexed Monthly Journal www.raijmr.com
RET Academy for International Journals of Multidisciplinary Research (RAIJMR)
asymmetric rather than symmetric with more absorption on high-frequency side. This is between
1800 cm-1
and 3600 cm-1
. The mid-IR envelope between 1000 cm
-1 and 1800 cm
-1 is also a flat
beta density peak following a half-power law as given by equation 1. In this case, sharp bands
are neglected and either background is considered or inflexion points of the spikes are joined.
The lowest lying Gaussian-shaped envelope around 750 cm-1
is clearly seen. Thus the spectrum
is similar to that of benzidine-pyridine-(chloranil)2.
The next is the IR spectrum of benzidine-quinoline-(TCNE)2 (Figure 2b). The interaction is
stronger than in the chloranil complex. The high-frequency envelop above 1800 cm-1
is a
triangular envelope associated with imperfect nesting as observed in the DDQ complex. This
similarity reveals that this special spectral feature arises out of molecular polarizability of
TCNE. TCNE does not contain aromatic ring as in TCNQ but contains C=C bridge. The four
cyano-groups are more flexible and rotatable in three-dimensions leading to orientational
polarizability. These rotations are hindered by the charge cloud of aromatic ring in TCNQ.
The mid-IR envelope between 950cm-1
and 1800 cm-1
is highly asymmetric with low-frequency
tailing as compared to the envelope of chloranil complex. The lowest-lying envelope between
400 cm-1
and 900 cm-1
shows with square power beta density asymmetric distribution compared
to that in the case of chloranil complex.
Thus there are two triangular distributions around 3000 cm- and 1400 cm
-1. The one at higher
frequency is due to nesting of Fermi surface and the other at lower frequency is due to triangular
interband gap connected with slant band edges in internal electric field. The later is related with
tunneling of charge carriers.
The last spectrum of benzidine-quinoline-(iodine)2 is also shown (Figure 2c). This spectrum is
similar to its pyridine analog above 1700 cm-1
. The range below 1700 cm-1
consists of a large
number of absorption bands but leaving a scope for the background absorption which increases
as the frequency decreases. This may correspond to a negative band gap as in semi-metals or
free-carrier absorption above a very small band gap lying in far-infrared range. Also there is a
possibility of a transition to an impurity level [25].
There is almost a semicircular distribution related with either isotropically disordered and
positively charged quinoline molecules or disordered molecular iodine in this ternary complex.
There is a small range of free carrier absorption between 1400 cm-1
and 1600 cm-1
. This is
realized by increase in absorption with an increase in wavelength of EM waves.
The beta density distribution is the fitted for the TCNQ complex having the highest-frequency
envelope of this type. The plot of F/(1-k*)1/2
vs k*1/2
where F=-0 and K*=(K-a)/b is a straight
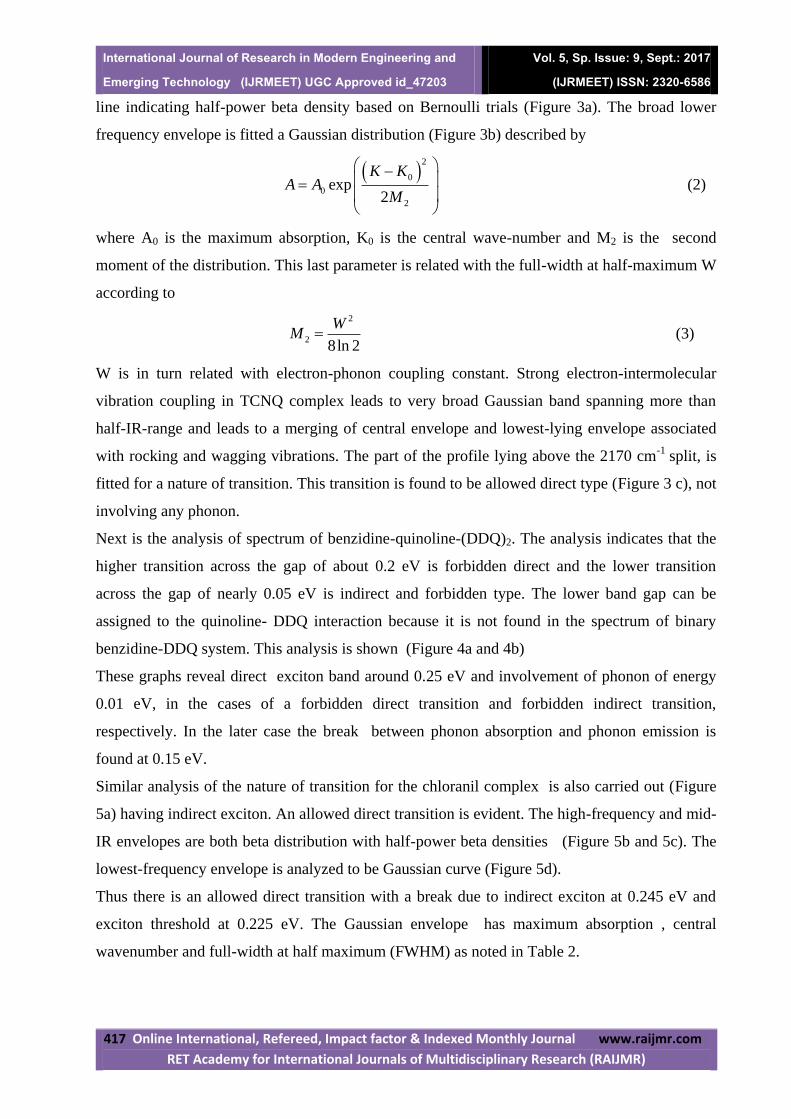
International Journal of Research in Modern Engineering and Emerging Technology (IJRMEET) UGC Approved id_47203
Vol. 5, Sp. Issue: 9, Sept.: 2017 (IJRMEET) ISSN: 2320-6586
417 Online International, Refereed, Impact factor & Indexed Monthly Journal www.raijmr.com
RET Academy for International Journals of Multidisciplinary Research (RAIJMR)
line indicating half-power beta density based on Bernoulli trials (Figure 3a). The broad lower
frequency envelope is fitted a Gaussian distribution (Figure 3b) described by
2
0
0
2
exp2
K KA A
M
(2)
where A0 is the maximum absorption, K0 is the central wave-number and M2 is the second
moment of the distribution. This last parameter is related with the full-width at half-maximum W
according to
2
28ln 2
WM (3)
W is in turn related with electron-phonon coupling constant. Strong electron-intermolecular
vibration coupling in TCNQ complex leads to very broad Gaussian band spanning more than
half-IR-range and leads to a merging of central envelope and lowest-lying envelope associated
with rocking and wagging vibrations. The part of the profile lying above the 2170 cm-1
split, is
fitted for a nature of transition. This transition is found to be allowed direct type (Figure 3 c), not
involving any phonon.
Next is the analysis of spectrum of benzidine-quinoline-(DDQ)2. The analysis indicates that the
higher transition across the gap of about 0.2 eV is forbidden direct and the lower transition
across the gap of nearly 0.05 eV is indirect and forbidden type. The lower band gap can be
assigned to the quinoline- DDQ interaction because it is not found in the spectrum of binary
benzidine-DDQ system. This analysis is shown (Figure 4a and 4b)
These graphs reveal direct exciton band around 0.25 eV and involvement of phonon of energy
0.01 eV, in the cases of a forbidden direct transition and forbidden indirect transition,
respectively. In the later case the break between phonon absorption and phonon emission is
found at 0.15 eV.
Similar analysis of the nature of transition for the chloranil complex is also carried out (Figure
5a) having indirect exciton. An allowed direct transition is evident. The high-frequency and mid-
IR envelopes are both beta distribution with half-power beta densities (Figure 5b and 5c). The
lowest-frequency envelope is analyzed to be Gaussian curve (Figure 5d).
Thus there is an allowed direct transition with a break due to indirect exciton at 0.245 eV and
exciton threshold at 0.225 eV. The Gaussian envelope has maximum absorption , central
wavenumber and full-width at half maximum (FWHM) as noted in Table 2.

International Journal of Research in Modern Engineering and Emerging Technology (IJRMEET) UGC Approved id_47203
Vol. 5, Sp. Issue: 9, Sept.: 2017 (IJRMEET) ISSN: 2320-6586
418 Online International, Refereed, Impact factor & Indexed Monthly Journal www.raijmr.com
RET Academy for International Journals of Multidisciplinary Research (RAIJMR)
More strongly interacting TCNE-based ternary complex shows two band gaps of 0.2 eV and 0.1
eV with corresponding forbidden indirect and allowed indirect transitions, respectively (Figure
6a and b). Thus TCNE complexes are small band gap semiconductor-phonon
The higher edge at 0.21 eV shows a break in (αh)1/3
Vs h (eV) transition involving a phonon
of energy of 0.02 eV. The TCNE complex also shows a square power beta density in the IR
spectrum around 700 cm-1
. The analysis of the last spectrum of benzidine-quinoline-(iodine)2
complex reveals an allowed direct transition (Figure 7a) and two Gaussian envelopes (Figure 7b
and 7c).
The plot of allowed direct transition shows a direct exciton of energy of 0.24 eV. There are two
Gaussians whose parameters are tabulated in table 2. The analysis of free-carrier absorption is
made by plotting logα Vs log giving a slope of 2-5 which corresponding to scattering of charge
carriers by phonons.
Details of upper and lower absorption edges and both absorption envelopes are summarized
(Table 1)
Conclusion
The three out of five ternary complexes based on TCNQ, DDQ and iodine show unusual spectral
features which are making use of benzidine-quinoline combination. The TCNQ complex shows
merging of two lower envelopes with unusually broad Gaussian band DDQ complex shows two
triangular distributions related with imperfect nesting and the second due to one Franz-Keldy
effect. TCNE and chloranil show three envelopes related with three band model. Iodine complex
seems to be having highest conductivity because of negative band gap or free-carrier absorption.
References
[1] C. Coulon, S. Flandrois, P. Delhaes, C. Hauw, P. Dupis, Phys. Rev. B, 1981, 23, 2850.
[2] C. Coulon, P. Delhaes, J. Amiell, J. P. Monceau, L. M. Fabre, L. Giral, J. Physique
(France), 1982, 43, 1721.
[3] Andre Barraud, Pierre Lasieur, Annie Ruaudel-Teixier, Michel Van Devyer, Thin Solid
Filam, 1995, 134, 195.
[4] M. G. Abd El Wahed, S. Aaly, H. A. Hammad, S. M. Metwally, J. Phys. Chem. Solids,
1974, 55, 31.
[5] K. Kudo, M. Nagqoka, S. Kuniyoshi, H. Tanaka, Synthetic Metals, 1995, 71, 2059.
[6] Jeong-Woo Choi, Gun-Yung Jung, Se Young Oh, Won Hong Lee, Dong Myung Shin,
Thin Solid Films, 1996, 284-285, 876.

International Journal of Research in Modern Engineering and Emerging Technology (IJRMEET) UGC Approved id_47203
Vol. 5, Sp. Issue: 9, Sept.: 2017 (IJRMEET) ISSN: 2320-6586
419 Online International, Refereed, Impact factor & Indexed Monthly Journal www.raijmr.com
RET Academy for International Journals of Multidisciplinary Research (RAIJMR)
[7] A.T. Oza, Solid State Commun., 1989, 71, 1005.
[8] J. Wosnitza, H. Elsinger, J. Hagel, S. Wanka, D. Schweizer, Synthetic Metals, 2001, 120,
705.
[9] J. J. McGuire, T. Room, A. Pronin, T. Timusk, J. A. Sch-Wieter, M. E. Kelly, M. A.
Kini, Phys. Rev. B, 2001, 64, 094503.
[10] S. Kamiya, Y. Shimojo, M. A. Tanatar, T. Ishiguro, H. Yamohi, G. Saito, Phys. Rev. B,
2002, 65, 13410.
[11] K. D. Truong, S. Jandl, M. Poirier, Synthetic Metals, 2002, 130, 229.
[12] Akane Sato, Hiroki Ahutsu, Kazuya Saito, Michio Sorai, Synthetic Metals, 2001, 120,
1035.
[13] A. Paoneli, A. Girlando, A. Fortuneli, Phys. Rev. B, 2001, 64, 054509.
[14] M. A. Tanatar, S. Kagoshima, T. Ishiguro, H. Ito, V. S. Yefanov, V. A. Bonderenko, N.
D. Kushah, E. B. Yagubskii, Phys. Rev. B, 2000, 62, 15561.
[15] M. Enomoto, A. Miyazaki, T. Enoki, Synthetic Metals, 2001, 121, 1800.
[16] D. Andres, M.V. Kartsovnite, W. Biberacher, H. Weiss, E. Balthes, H.
Muler, N. Kulshch, Phys. Rev. B, 2001, 64, 161104.
[17] N. Harrison, C.H. Mielke, A.D. Christianion, J.S. Brooks, M. Tokumoto, Phys. Rev.
Letters, 2001, 86, 1586.
[18] N. Harrison, L. Balicas, J.S. Brooks, M. Tokumoto, Phys. Rev. B, 2000, 62, 14212.
[19] M. Maesato, Y. Kaga, R. Kondo, S. Kagoshima, Phys. Rev. B., 2001, 64, 155104.
[20] M. Maesato, Y. Kaga, R. Kondo, H. Hirai, S. Kagoshima, Synthetic Metals, 2001, 120,
941.
[21] Y. Shimajo, T. Ishiguro, H. Yamochi, G. Saito, Synthetic Metals, 2001, 120, 751.
[22] N. L. Wang, H. Mori, S. Tanaka, J. Dong, B.P. Claymany, J. Phys. Condens. Matter,
2001, 13, 5463.
[23] Reizo Kato, Naoya Tajima, Masafumi Tamura, Jun-Ichi Yamaura, Phys. Rev. B, 2002,
66, 020508.
[24] Balazs Dora, Kazumi Maki, Attila Virosztek, Phys. Rev. B, 2002, 266, 15116.
[25] J.I. Pankove; Optical processes in semiconductors, Eglewood Cliffs, Prentice – Hall Inc.,
New Jercy, 1971.

International Journal of Research in Modern Engineering and Emerging Technology (IJRMEET) UGC Approved id_47203
Vol. 5, Sp. Issue: 9, Sept.: 2017 (IJRMEET) ISSN: 2320-6586
420 Online International, Refereed, Impact factor & Indexed Monthly Journal www.raijmr.com
RET Academy for International Journals of Multidisciplinary Research (RAIJMR)
Table 1. Infrared absorption edges for the ternary complexes based on benzidine
quinoline combination.
Name of the
complex
Upper edge Lower edge
Absorption
function
Type of
transition
Band
gap Eg
(eV)
Absorption
function
Type of
transition
Band
gap Eg
(eV)
Benzidine-
quinoline-
(TCNQ)2
h=A(h-Eg)1/2 Allowed
direct
0.22 __ __ __
Benzidine-
quinoline-
(DDQ)2
h=A(h-Eg)3/2
Direct exciton
0.25 eV
Ep = 0.01
Forbidden
direct
0.18 h=A(h-Eg)3
Phonon
Ep = 0.01 eV
Forbidden
indirect
0.006
Benzidine-
quinoline-
(chloranil)2
h=A(h-Eg)1/2
Indirect exciton
0.23eV
Allowed
direct
0.22 __ __ __
Benzidine-
quinoline-
(TCNE)2
h=A(h-Eg)3
Phonon 0.02 eV
Forbidden
indirect
0.21 h=A(h-Eg)2 Allowed
indirect
0.11
Benzidine-
quinoline-
(I2)2
h=A(h-Eg)1/2
Direct exciton
0.16 eV
Allowed
direct
0.21 __ __ __

International Journal of Research in Modern Engineering and Emerging Technology (IJRMEET) UGC Approved id_47203
Vol. 5, Sp. Issue: 9, Sept.: 2017 (IJRMEET) ISSN: 2320-6586
421 Online International, Refereed, Impact factor & Indexed Monthly Journal www.raijmr.com
RET Academy for International Journals of Multidisciplinary Research (RAIJMR)
Table 2. Types and parameters of electronic absorption envelopes in the spectra
of ternary complexes based on benzidine-quinoline combination.
Name of the
complex
First envelope
Ko K m
(cm-1
) (cm-1
) %
Second envelope
Ko K m
(cm-1
) (cm-1
) %
Benzidine-quinoline-
(TCNQ)2
2800 1300 30%
(Half power-Beta density)
And NT-1
1100 1050 35%
(Gaussian distribution)
NT-2
Benzidine-quinoline-
(DDQ)2
3200 1100 50%
(Triangular distribution)
NT-1 and 2
Benzidine-quinoline-
(chloranil)2
2800 1700 20%
(Half-power beta density)
1400 800 16%
(Half power beta density)
770 600 16%
(Gaussian distribution)
Benzidine-quinoline-
(TCNE)2
3200 1200 65%
(Triangular distribution)
1450 500 60
(TD)
SPBD
650 250 35
-Benzidine-quinoline-
(Iodine)2
2800 1700 25%
(Gaussian distributions)
Or CD
850 800 20%
(Gaussian distribution)

International Journal of Research in Modern Engineering and Emerging Technology (IJRMEET) UGC Approved id_47203
Vol. 5, Sp. Issue: 9, Sept.: 2017 (IJRMEET) ISSN: 2320-6586
422 Online International, Refereed, Impact factor & Indexed Monthly Journal www.raijmr.com
RET Academy for International Journals of Multidisciplinary Research (RAIJMR)
Figure 1. Infrared spectra of
(a) benzidine-quinoline-(TCNQ)2 and
(b) benzidine-quinoline-(DDQ)2.
a
b

International Journal of Research in Modern Engineering and Emerging Technology (IJRMEET) UGC Approved id_47203
Vol. 5, Sp. Issue: 9, Sept.: 2017 (IJRMEET) ISSN: 2320-6586
423 Online International, Refereed, Impact factor & Indexed Monthly Journal www.raijmr.com
RET Academy for International Journals of Multidisciplinary Research (RAIJMR)
Figure 2. Infrared spectra of
(a) benzidine-quinoline-(chloranil)2
(b) benzidine-quinoline-(TCNE)2 and
(c) benzidine-quinoline-(iodine)2.
a
b
c

International Journal of Research in Modern Engineering and Emerging Technology (IJRMEET) UGC Approved id_47203
Vol. 5, Sp. Issue: 9, Sept.: 2017 (IJRMEET) ISSN: 2320-6586
424 Online International, Refereed, Impact factor & Indexed Monthly Journal www.raijmr.com
RET Academy for International Journals of Multidisciplinary Research (RAIJMR)
(Fig 3a)
0
0.2
0.4
0.6
0.8
1
0 0.5 1 1.5K*
1/2
F/(
1-K
*)1/
2
Benzidine-Quinoline-(TCNQ)2
(Fig 3b)
2.8
3
3.2
3.4
3.6
3.8
4
0.0E+00 5.0E+05 1.0E+06 1.5E+06
(K-K0)2
LN
A
Benzidine-Quinoline-(TCNQ)2
(Fig 3c)
0
50
100
150
0 0.1 0.2 0.3heV
( h)2
Benzidine-Quinoline-(TCNQ)2
Figure 3. (a) Beta density fit
(b)Gaussian fit and
(c) Nature of transition above 0.2 eV gap
– all of the TCNQ complex.
b
c
a

International Journal of Research in Modern Engineering and Emerging Technology (IJRMEET) UGC Approved id_47203
Vol. 5, Sp. Issue: 9, Sept.: 2017 (IJRMEET) ISSN: 2320-6586
425 Online International, Refereed, Impact factor & Indexed Monthly Journal www.raijmr.com
RET Academy for International Journals of Multidisciplinary Research (RAIJMR)
(Fig 4a)
0
1
2
3
4
5
6
7
0 0.1 0.2 0.3 0.4heV
( h)2
/3
Benzidine-Quinoline-(DDQ)2
(Fig 4b)
1
1.2
1.4
1.6
1.8
2
0 0.05 0.1 0.15 0.2
heV
( h)1
/3
Benzidine-Quinoline-(DDQ)2
Figure 4. (a) Nature of transition above 0.2 eV gap and
(b) nature of transition above 0.05 eV gap.
a
b

International Journal of Research in Modern Engineering and Emerging Technology (IJRMEET) UGC Approved id_47203
Vol. 5, Sp. Issue: 9, Sept.: 2017 (IJRMEET) ISSN: 2320-6586
426 Online International, Refereed, Impact factor & Indexed Monthly Journal www.raijmr.com
RET Academy for International Journals of Multidisciplinary Research (RAIJMR)
(Fig 5a)
0
2
4
6
8
10
12
0 0.1 0.2 0.3heV
( h
)2
Benzidine-Quinoline-(Chloranil)2
(Fig 5b)
0
1
2
3
4
5
0 0.2 0.4 0.6 0.8 1k*
1/2
F/(
1-k*
)1/2
Benzidine-Quinoline-(Chloranil)2
(Fig 5c)
0
5
10
15
0 0.2 0.4 0.6 0.8 1K*
1/2
F/(1
-K*)
1/2
Benzidine-Quinoline-(Chloranil)2
(Fig 5d)
1.852.052.252.452.652.853.05
0.0E+00 1.0E+06 2.0E+06 3.0E+06 4.0E+06
(K-K0)2
LN A
Benzidine-Quinoline-(Chloranil)2
Figure 5. (a) Nature of transition above 0.225 eV gap with
indirect exciton
(b) beta density peak
(c) second beta density peak and
(d) Gaussian band analysis.
a
b
c
d

International Journal of Research in Modern Engineering and Emerging Technology (IJRMEET) UGC Approved id_47203
Vol. 5, Sp. Issue: 9, Sept.: 2017 (IJRMEET) ISSN: 2320-6586
427 Online International, Refereed, Impact factor & Indexed Monthly Journal www.raijmr.com
RET Academy for International Journals of Multidisciplinary Research (RAIJMR)
(Fig 6a)
0
0.5
1
1.5
2
2.5
3
0 0.05 0.1 0.15 0.2heV
( h)1
/2
Benzidine-Quinoline-(TCNE)2
(Fig 6b)
0.5
1
1.5
2
2.5
3
0 0.1 0.2 0.3 0.4 0.5heV
( h)1
/3
Benzidine-Quinoline-(TCNE)2
Figure 6. (a) nature of transition above 0.1 eV gap and
(b) nature of transition above 0.2 eV gap.
a
b

International Journal of Research in Modern Engineering and Emerging Technology (IJRMEET) UGC Approved id_47203
Vol. 5, Sp. Issue: 9, Sept.: 2017 (IJRMEET) ISSN: 2320-6586
428 Online International, Refereed, Impact factor & Indexed Monthly Journal www.raijmr.com
RET Academy for International Journals of Multidisciplinary Research (RAIJMR)
(Fig 7a)
05
1015
20253035
0 0.1 0.2 0.3h
( h)
2
Benzidine-Quinoline-(I2)2
(eV)
(Fig 7b)
2
2.2
2.4
2.6
2.8
3
0.0E+00 2.0E+05 4.0E+05 6.0E+05 8.0E+05
(K-K0)2
LN
A
Benzidine-Quinoline-(I2)2
(Fig 7c)
2
2.2
2.4
2.6
2.8
3
3.2
0.0E+00 5.0E+05 1.0E+06 1.5E+06 2.0E+06 2.5E+06 3.0E+06 3.5E+06 4.0E+06 4.5E+06
(K-K0)2
LN
A
Benzidine-Quinoline-(I2)2
Figure 7. (a) Nature of transition above 0.21 eV gap
(b) The first Gaussian peak and
(c) The second Gaussian peak.
a
b
c

International Journal of Research in Modern Engineering and Emerging Technology (IJRMEET) UGC Approved id_47203
Vol. 5, Sp. Issue: 9, Sept.: 2017 (IJRMEET) ISSN: 2320-6586
429 Online International, Refereed, Impact factor & Indexed Monthly Journal www.raijmr.com
RET Academy for International Journals of Multidisciplinary Research (RAIJMR)
Growth characterization and Studies of some Mixed Tartrate single
crystal
Sanjay B.Kansara1, Tarun J.Patel , Ram N.Nandaniya
1, Girish L.Vekaria
2
1. Shri P.H.G.Muni.Arts And Science College Kalol
2. Sir P.T.Science College Modasa.
Abstract
There are many applications of different tartrate compounds. In present study Strontium-
Manganese Mixed Tartrate Crystals were grown by sol gel growth technique in silica hydro-gel
medium. The test tubes were used as crystallization vessels while silica gel as a growth media.
The optimum growth conditions for crystals were determined. Optimum conditions were
established by varying various parameters such as pH, concentration gel solution, setting time of
the gel solution and concentration of the reactance. These crystals were characterized by using X-
ray diffraction and FTIR analysis.
Key Words:
Keywords: Crystal Growth, Sol-gel preparation, XRD, FT-IR
1. INTRODUCTION
In recent years crystals growth in gel medium has attracted the attention of many investigators [1-
2]. Scientifically and technologically crystal growth and characterization have became an
interesting research area in the past decades. All basic solid materials are made up of single
crystals and they are backbone of the modern technology. Mainly tartrate crystals possess
application as dielectric, ferroelectric and piezoelectric materials. Some tartrate compounds are
used in military applications. Manganese tartrate crystals are used in chemical temperature
indicators. Among the several tartrate compounds, strontium tartrate has received greater attention
on account of its ferroelectric, nonlinear optical and spectral characteristics [3-5].
Currently, great attention has been devoted to the growth and characterization of pure and doped
metal tartrate crystals with the aim of identifying new materials for device applications.
Investigating the effect of dopants on various properties of single crystals is of great interest in the

International Journal of Research in Modern Engineering and Emerging Technology (IJRMEET) UGC Approved id_47203
Vol. 5, Sp. Issue: 9, Sept.: 2017 (IJRMEET) ISSN: 2320-6586
430 Online International, Refereed, Impact factor & Indexed Monthly Journal www.raijmr.com
RET Academy for International Journals of Multidisciplinary Research (RAIJMR)
technological point of view[1]. In the present study single crystals of pure and manganese doped
strontium tartrate trihydrate crystals were grown by the gel technique and the grown crystals were
characterized by carrying out X-ray diffraction (XRD), Fourier transform infrared (FTIR)
spectral. The results obtained are reported herein and discussed.
2 Materials and Methods
2.1Gel Preparation: -
Commercial sodium metasilicate is generally used for the manufacture of soap. In the present case
AR grade sodium metasilicate powder is used for preparation of the gel medium. To remove the
impurities 250g sodium metasilicate was dissolved in one liter of water taken in a beaker. On
stirring it thoroughly, dense milky solution of sodium metasilicate was formed. It was left for a
couple of days, so that heavy insoluble impurities accumulate at the bottom of the beaker. This
was decanted into another beaker and filtered twice with Whatman (cat No 1001 125) filter paper
of 12.5 cm diameter. Then the solution was centrifuged on MSE high-speed centrifuge unit for
about half an hour at 10000 revolutions per minute. Practically all suspended impurities were got
rid off, and as a result transparent golden colored solution of sodium metasilicate was obtained.
This could be preserved as a stock solution for quite a long period [6-9].
2.2 Crystal Growth: -
The crystallization apparatus employed for the present investigation consist of glass test
tubes of 25mm diameter and 140mm length. The AR grade chemicals were used to grow the
crystals. One of the reagents, 1 M levo tartaric acid, was mixed with sodium metasilicate solution
to prepare the gel in such a way that the pH of mixture was maintained 4.5. The specific gravity of
the gel was chosen 1.04. After setting the gel, the supernatant solutions containing various
amounts of SrCl2 and MnCl2 having concentrations of 1M were gently poured without disturbing
the gel surfaces, in respective test tubes. The growth of crystals was completed within the period
of one month [10-12].

International Journal of Research in Modern Engineering and Emerging Technology (IJRMEET) UGC Approved id_47203
Vol. 5, Sp. Issue: 9, Sept.: 2017 (IJRMEET) ISSN: 2320-6586
431 Online International, Refereed, Impact factor & Indexed Monthly Journal www.raijmr.com
RET Academy for International Journals of Multidisciplinary Research (RAIJMR)
Fig 1 Fig 2
3. Characterizations
3.1 FTIR Spectroscopic Studies : -
The FTIR spectra of pure and mixed strontium and calcium lavo tartrate crystals as well as pure
and mixed manganese and iron levo tartrate were reported. In the present investigation three
different strontium and three different strontium and manganese mixed crystals, namely
Sr0.8Mn0.2C4H4O6 3H2O, Sr0.6Mn0.4C4H4O6 3H2O, Sr0.2Mn0.8C4H4O6 2H2O, were investigation by
FTIR spectroscopy.
Figure is FTIR spectra of Sr0.8Mn0.2C4H4O6 3H2O. The assignments of different
absorption band are given in Table. From the table one can confirm the presence of water of
crystallization (~3400cm-1
),C=O (~1600 cm-1
), C-O (~1000 cm to 12000 cm-1
), metal oxygen (~
<800 cm-1
)bond. No systematic variation in the bond due to metal oxygen bond is found on
increasing the contain of manganese in the crystal.

International Journal of Research in Modern Engineering and Emerging Technology (IJRMEET) UGC Approved id_47203
Vol. 5, Sp. Issue: 9, Sept.: 2017 (IJRMEET) ISSN: 2320-6586
432 Online International, Refereed, Impact factor & Indexed Monthly Journal www.raijmr.com
RET Academy for International Journals of Multidisciplinary Research (RAIJMR)
Fig 3
Table 1
Wave number (cm–1
) Assignments
3450.0 Broad O – H stretching due to water of
crystalization
1596.8 C = O stretching
1280.6 C – O stretching
1184.8 C – O stretching
1234.4 C – O stretching
1197.7 C – O stretching
1060.8 O – H deformation out of plane and C – O stretching
1006.8 O – H deformation out of plane and C – O stretching
952.8 O – H deformation out of plane and C – O stretching
918.1 O – H deformation out of plane and C – O stretching
844.8 Metal – oxygen stretching
812.0 Metal – oxygen stretching
530.4 Metal – oxygen stretching
437.8 Metal – oxygen stretching

International Journal of Research in Modern Engineering and Emerging Technology (IJRMEET) UGC Approved id_47203
Vol. 5, Sp. Issue: 9, Sept.: 2017 (IJRMEET) ISSN: 2320-6586
433 Online International, Refereed, Impact factor & Indexed Monthly Journal www.raijmr.com
RET Academy for International Journals of Multidisciplinary Research (RAIJMR)
X – Ray diffraction results for Sr0.8 Mn0.2C4H4O6 nH2O
The present analysis the following cell parameters were taken as the standard one. An X-ray study
of gel grown strontium tartrate tetra hydrate was reported by Bohandy and Murphy [15-18]. The
following lattice parameter were found:
a = 9.48 ± 0.04 Å
b = 10.96 ± 0.04 Å
c = 9.46 ± 0.04 Å
Which is orthorhombic structure. The space group was P212121
For manganese tartrate crystals the following lattice parameters were reported [15].
a = 9.4388 (8)
b = 11.6925 (1)
c = 5.0706 (4)
Whereas, Table gives the values of cell parameters calculated for pure and mixed strontium and
manganese levo tartrate crystals.
The orthorhombicity is calculated by using the following formula,
orthorhimbicity = [b – a / b + a] 100
Where, a and b are the lattice parameters. The values of orthorhombicity are tabulated in table .
The X-ray density (dx) is calculated by the following relation,
dx= 8M/Na abc
Where,
M = Molecular weight
Na = Avogadro number
abc = Cell volume

International Journal of Research in Modern Engineering and Emerging Technology (IJRMEET) UGC Approved id_47203
Vol. 5, Sp. Issue: 9, Sept.: 2017 (IJRMEET) ISSN: 2320-6586
434 Online International, Refereed, Impact factor & Indexed Monthly Journal www.raijmr.com
RET Academy for International Journals of Multidisciplinary Research (RAIJMR)
Fig.4
Table 3
2 θ
degrees
Relative
Intensity % d (Ǻ) h k l
18.7880 35.78 4.7191 002
29.6360 23.45 3.0008 301
31.0786 26.95 2.8792 113
34.2379 100.00 2.6268 203
35.2160 53.46 2.5463 213
39.1449 19.09 2.2993 401
42.7101 29.64 2.1153 204
43.7169 18.27 2.0683 043
45.0288 24.21 2.0200 143
45.8834 23.54 1.9761 422
47.9509 29.73 1.8956 243
48.9013 26.78 1.8609 015

International Journal of Research in Modern Engineering and Emerging Technology (IJRMEET) UGC Approved id_47203
Vol. 5, Sp. Issue: 9, Sept.: 2017 (IJRMEET) ISSN: 2320-6586
435 Online International, Refereed, Impact factor & Indexed Monthly Journal www.raijmr.com
RET Academy for International Journals of Multidisciplinary Research (RAIJMR)
Sample
a (Å) b (Å) c (Å) Cell
volume
(Å)3
Orthoro-
hmbicity
X– ray
density
gm/cm3
Sr0.8Mn0.2C4H4O6
3H2O 9.4828 10.9578 9.4503 981.98 7.21 3.83
Table 4
The present results were compared with the results of pure and mixed calsium and strontium levo
tartrate crystals as well as pure and mixed iron-managanese levo tartrate crystals.
Result Discussion and Conclusion
Single crystals of pure and manganese doped strontiumtartrate trihydrate have been grown
successfully by the gel technique
The FTIR spectra indicate the present of water of crystallization
C = O, C – O, O – H, and metal oxygen bond. The values of lattice parameters of
Sr0.8Mn0.2C4H4O6 3H2O corresponding to the strontium tartrate lattice parameters,
One can find a phase transition occurring in the crystal structure from XRD
Acknowledgments:
The Authors are thankful to Dr M.J.Joshi (Saurashtra University For valuable guidance
and Principal P.H.G. Municipal Arts and Science College, Kalol, for their encouragements.
References
[1] H.K.Henisch,J.Dennisand J. I. Hanoka, J. Phys. Chem. Solids, 26, 493 (1965).
[2] H.K.Henisch,Crystal Growth in Gells, Pennsylvania State University Press, UniversityPark,
Pennsylvania, 1970.
[3] S.M.Dharma Prakash,P.Mohan Rao Bull. Mater. Sci. 4, 511 (1986).

International Journal of Research in Modern Engineering and Emerging Technology (IJRMEET) UGC Approved id_47203
Vol. 5, Sp. Issue: 9, Sept.: 2017 (IJRMEET) ISSN: 2320-6586
436 Online International, Refereed, Impact factor & Indexed Monthly Journal www.raijmr.com
RET Academy for International Journals of Multidisciplinary Research (RAIJMR)
[4] M.R.Shedam,Venkateswara Rao Bull.. Mater Sci. 16, 309 (1993).
[5] S.L.Garud,K.B. Saraf Bull. Mater. Sci. 31, 639 (2008).
[6] Koisse, G. A.Crystal Structure Of Inorganic Compounds”, Edited By Malinowski, T. I.,
Shteintsa Press, Kishinev, (1974) P-103 In Russian.
[7] Henisch, H. K. Dennis, J.And Hanoka, J. I.J. Phys. Chem. Solids, 26 (1965) 493.
[8] Patel, A. R. And Arrora S. K. J. Mater. Sci. , 11 (1976)843.
[9] Patel, A. R. And Arrora S. K.J. Mater. Sci., 12(1977)2124.
[10] Patel A. R. And Arrora, S. K.J. Crystaql Growth, 37(1977)343.
[11] Patel A. R. And Arrora S. K. Kryst. Technol. 13(1978)899.
[12] Raina K. K. J. Mater Sci. (1986)
[13] J. Bohandy and J. c. Marphy, Acta Cryst, B24 (1968) 286.
[14] Natl. Bur. Stand (U. S.) Monogr. 25, 19, 57 (1982).
[15] P.N. Kotru, K. K. Raina and M.L.Koul; J. Mater. Sci., 21 (1986) 3933.
[16] S. Joseph, H. S. Joshi and M. J. Joshi; Cryst. Res. Technol., 32 (1997) 110.
[17] V.S. Joshi and M. J. Joshi; Indian J. Phys., 75A (2001) 159.
[18] B. Ptaszynski, E. Skkiba, J. Krystek; J. of Thermal Analysis and Calorimetry,65 (1) (2001) 3.

International Journal of Research in Modern Engineering and
Emerging Technology (IJRMEET) UGC Approved id_47203
Vol. 5, Sp. Issue: 9, Sept.: 2017
(IJRMEET) ISSN: 2320-6586
437 Online International, Refereed, Impact factor & Indexed Monthly Journal www.raijmr.com
RET Academy for International Journals of Multidisciplinary Research (RAIJMR)
Preparation and Characterization of Activated Carbon Produced
from Azadirachta indica (Neem leaf)
Parth Joshi*, Chirag Patel and Meet Vyas
Department of Physics, Uka Tarsadia University, Bardoli, Gujarat-394350
*E-mail: [email protected]
Abstract
Activated carbon are unique and versatile adsorbents having extended surface area, micro
porous structure, universal adsorption effect, high adsorption capacity and high degree of
surface reactivity. Activated carbons were prepared from Azadirachta indica by phosphoric acid
activation. The effects of activation temperature on activated carbon production were
investigated. The resulting samples were characterized by nitrogen adsorption measurements at
77 K to obtain surface area and pore size distributions. The morphology of the resulting sample
was studied by scanning electron microscopy. Physico-Chemical characteristics such as ash
content, pH, iodine number, porosity, yield percentage and surface area have been carried out to
assess the suitability of the carbon as absorbent. Results of this investigation indicate that the
activated carbon prepared using Azadirachta indica impregnation process followed by activation
at 900˚С under nitrogen atmosphere yield activated carbon with the high surface area and more
developed porosity. Activated carbon prepared from Azadirachta indica by chemical processes
shows excellent improvement in the surface characteristics.
Key words: Activated carbon, carbonization, activation.
1. Introduction
Activated carbon is a form of carbon process to have small, low volume pores that
increase the surface area available for adsorption or chemical reactions. Activated carbon is also
known as activated charcoal. Activated carbon is a predominantly amorphous solid carbon
material with highly developed internal surface area, porous structure and high degree of
surface reactivity. These unique characteristic properties make activated carbon materials very

International Journal of Research in Modern Engineering and
Emerging Technology (IJRMEET) UGC Approved id_47203
Vol. 5, Sp. Issue: 9, Sept.: 2017
(IJRMEET) ISSN: 2320-6586
438 Online International, Refereed, Impact factor & Indexed Monthly Journal www.raijmr.com
RET Academy for International Journals of Multidisciplinary Research (RAIJMR)
versatile adsorbent materials for adsorption of both gaseous and liquid phase pollutants.
Activated carbons are useful adsorbents of industrial significance and are used in a wide range
of applications which are concerned principally with removal of undesired species by
adsorption from liquids or gases [1-6], in order to effect purification [7] or the recovery of
chemical constituents.
Common forms are beads, granules, pellets, fibers, cloths and powder. Some typical
applications are: water and wastewater treatment to remove hazardous organic compounds [8]
or those that impart odor or taste [9], for natural gas storage [10] and odoriferous chemicals
which are merely trapped, upgrading methane from substandard natural gas wells [11], food
decolorization, and pharmaceutical purification. Impregnated activated carbons are widely used
in gas masks and to remove other specific contaminants in gas or water. Impregnants include
sulfuric acid [12-13] (for ammonia or mercury), iron oxide (for hydrogen sulfide or
mercaptans), zinc oxide (for hydrogen cyanide) [14-15], and a combination of heavy metal salts
(for phosgene, arsine, and nerve gases).
2. Processing of activated carbon
Activated carbon is usually derived from charcoal and is sometimes utilized as biochar.
Those derived from coal and coke is referred as activated coal and activated coke respectively.
Activated carbon is carbon produced from carbonaceous source materials such as nutshells,
coconut husk, peat, wood, coir, lignite, coal, and petroleum pitch.
2.1 Raw materials
Azadirachta indica (neem leaves) were collected from Uka Tarsadia university campus
was the precursor used in this study. The collected sample was washed exhaustively with
deionized water to remove adhering dirt particles from the surface. Azadirachta indica (Neem
leaves) were dried till it became yellow and then ground and screened to the desired mesh size of
1–2 mm.
2.2 Activation
The raw material produced was mixed in potassium hydroxide solution with a raw
material (AI)/KOH impregnation with occasional stirring. After stirring the resultant sample was
dried at room temperature for 12 hour and then the resultant sample was dried at 120˚C for 24
hour.

International Journal of Research in Modern Engineering and
Emerging Technology (IJRMEET) UGC Approved id_47203
Vol. 5, Sp. Issue: 9, Sept.: 2017
(IJRMEET) ISSN: 2320-6586
439 Online International, Refereed, Impact factor & Indexed Monthly Journal www.raijmr.com
RET Academy for International Journals of Multidisciplinary Research (RAIJMR)
After it the sample was again dried for 6 hour and weight loss measured at every half
hour. The resultant sample was washed with hot and cold distilled water until the filtrate reached
to neutral pH.
2.3 Carbonization
The carbonization process was performed by loading 50 gm of dried KOH activated sample
into a furnace, and heated up to a carbonization temperature of 800˚C under purified N2 flow and
after carbonization 10 gm of activated carbon produced.
3. Results and Discussion
3.1 Scanning electron microscopy(SEM)
Figures 3.1 show SEM micrographs of prepared activated carbon using chemical
activation. These results show that on activation with KOH, enhanced the bigger pores as shown
in Fig. The filled massgets highly decomposed resulting in clear pore structure. The SEM
photographs of samples show a smooth surface with many orderly pores developed.
Figure 3.1 SEM micrographs of Activated carbon produced by potassium hydroxide activation
3.2 Yield after Carbonization
The Carbonize yield is defined as the mass of carbonize carbon obtained per mass of raw
material (Azadirachta indica). Table 3.1 shows the yields calculated for carbonize sample at
900°C.

International Journal of Research in Modern Engineering and
Emerging Technology (IJRMEET) UGC Approved id_47203
Vol. 5, Sp. Issue: 9, Sept.: 2017
(IJRMEET) ISSN: 2320-6586
440 Online International, Refereed, Impact factor & Indexed Monthly Journal www.raijmr.com
RET Academy for International Journals of Multidisciplinary Research (RAIJMR)
Table: 3.1 Yield after Carbonization
3.3 Ash content of the product
The ash content of activated carbon primarily depends on precursor material and these
mineral matters are desired to be as low as possible to obtain an activated carbon of high quality.
It is known that mineral content of activated carbon causes undesirable effects such as decreasing
the activity and regeneration efficiency of activated carbon.
The amount of ash of activated carbons can range from 1% to 20% and the ash content of
the all produced activated carbon is between these values. As shown in the table 3.2 the values of
ash contents of the activated carbons are 3.24%.
Table: 3.2 Ash content of the activated carbon from azadirachta indica
Temperature
(⁰C)
Initial weight
(gm)
After heating
weight (gm)
Ash content
700 5 0.162 3.24 %
3.4 pH Values of Products
pH is an indicator of nature of the surface functional groups of activated carbon because,
they give an idea about the presence and absence of oxygen or hydrogen containing functional
groups. Also pH of the solution influences the adsorption process by changing behaviour of the
adsorbate-adsorbent interactions significantly. pH of the potassium hydroxide activated carbons
was found 8.5 as it can be seen Potassium hydroxide activation made these products slightly
basic.
3.5 Surface area determination
Methylene blue method can be used as an indicator of the adsorptive capacity of activated
carbons. Methylene blue method of activated carbons indicates the ability of adsorbent to adsorb
on super micropores and mesopores. Surface area by methylene blue before activation is 35
m2/gm and after activation is 650 m
2/gm.
Initial weight
(gm)
After carbonization weight
(gm)
Yield (%)
50 11.52 23.04 %

International Journal of Research in Modern Engineering and
Emerging Technology (IJRMEET) UGC Approved id_47203
Vol. 5, Sp. Issue: 9, Sept.: 2017
(IJRMEET) ISSN: 2320-6586
441 Online International, Refereed, Impact factor & Indexed Monthly Journal www.raijmr.com
RET Academy for International Journals of Multidisciplinary Research (RAIJMR)
3.6 Iodine number
Many carbons preferentially adsorb small molecules. Iodine number is the most
fundamental parameter used to characterize activated carbon performance. It is a measure of
activity level (higher number indicates higher degree of activation – needs citation), often
represented as mg/g. It is a measure of the micropore content of the activated carbon by
adsorption of iodine from solution. Iodine number is a measure of the iodine adsorbed in the
pores and as such, is an indication of the pore volume available in the activated carbon of
interest. The measure Iodine number of activated carbon is 754 mg/g.
4. Conclusion
The type of raw material well as the activation conditions determines the properties and yield
of activated carbon. Activated carbon produced from azardicha indica is cost effective as it
easily available. The prepared activated carbon attained surface area 650 m2/gm and surface area
before activation was 35 m2/gm. From which we conclude that surface area after activation was
increased. Prepared Activated carbon has large surface area so it will increase it adsorption
capacity, and it can utilize in water purification, air purification etc. A low cost and high quality
active carbon should be of high surface area, produced at low temperature. Methods of activation
of carbon materials have opened up a new avenue to tune the structural, textural, morphological
and surface properties of carbon materials to suit to the problem in hand.
References
1) A. Kumar, S. Kumar and S. Kumar, Carbon, 2003, 41, 3015.
2) L. R. Radovic, I. F. Silva, J. I. Ume, J. A. Menendez and C. A. Leon Y Leon, Carbon, 1997,
35, 1339.
3) D. Mohan, K. P. Singh, S. Sinha and D. Gosh, Carbon, 2004, 42, 2409.
4) A. Bagreev, J. A. Menendez, I. Dukhno and Y. Tarasenko , Carbon, 2005, 43, 208.
5) A. A. Bagreev, W. Kuang and T. J. Bandosz, Adsorption, 2005, 11, 461.
6) K. L. Foster, R. G. Fuerman, J. Economy, S. M. Larson and M. J. Rood, Chemistry of
Materials, 1992, 4, 1068.
7) W. J. Huang, C. Y. Chen and M. Y. Peng, Water SA, 2004, 30, 369.
8) D. Rajkumar, K. Palanivelu and N. Balasubramanian, J. Environ. Eng. Sci.,2005, 4, 1.
9) R. S. Juang, R. L. Tseng and F. C. Wu, Adsorption, 2001, 7, 65.
10) V. C. Menon, S. Komarneni, J. Porous Mater., 1998, 5, 43.

International Journal of Research in Modern Engineering and
Emerging Technology (IJRMEET) UGC Approved id_47203
Vol. 5, Sp. Issue: 9, Sept.: 2017
(IJRMEET) ISSN: 2320-6586
442 Online International, Refereed, Impact factor & Indexed Monthly Journal www.raijmr.com
RET Academy for International Journals of Multidisciplinary Research (RAIJMR)
11) A. Herbst and P. Harting, Adsorption, 2002, 8, 111.
12) J. Guo, W. S. Xu, Y. L. Chen, A. C. Lua, J. Colloid Int. Sci., 2005, 281, 285.
13) W. Feng, S. Kwon, X. Feng, E. Borguet, R. D. Vidic and M. Asce, J. of Environ. Eng.,
March 2006, 292.
14) Y. Kikuchi, Q. Qian, M. Machida and H. Tatsumoto, Carbon, 2006, 44, 195.
15) M.P. Cal, B.W. Strickler, A.A. Lizzio, Carbon, 2000, 38, 1757.

International Journal of Research in Modern Engineering and Emerging Technology (IJRMEET) UGC Approved id_47203
Vol. 5, Sp. Issue: 9, Sept.: 2017 (IJRMEET) ISSN: 2320-6586
443 Online International, Refereed, Impact factor & Indexed Monthly Journal www.raijmr.com RET Academy for International Journals of Multidisciplinary Research (RAIJMR)
Synthesis and characterisation of some acid dyes based on 4, 4’-
diamino diphenyl amine derivative and their
application on various fibres Yogesh S. Patel* and Keshav C. Patel
The Patidar Gin Science College, Bardoli-394601, Di-Surat, Gujarat, India.
* Corresponding author’s email address: [email protected] , Mob. No. 9879267042
Abstract
Various acid dyes have been prepared by coupling diazotized 4, 4’-diamino diphenyl amine with
various acid coupling components and their dyeing performance as acid dyes has been assessed on
silk, wool and nylon fibres. All the dyes gave orange to maroon shades with good to very good light
fastness on each fibres. The purity of dyes was checked by thin layer chromatography. The IR spectra
showed all characteristics bands and a representative dyes PMR spectra showed all the signals. The
percentage dye bath exhaustion on different fibres was reasonably good and acceptable. The dyes
fibres showed moderate to very good fastness to light, washing and rubbing.
Keywords
4, 4’-diamino diphenyl amine, acid coupling components, dyeing, exhaustion, spectra.
Introduction
Acid dyes are divided in to three group based on their difference in affinity, which is primarily a
function of the molecular size [1]. Acid dyes are water soluble anionic dyes that are applied to by
printing on protein fibres and by the vigorous process selected dyes may be printed on viscose from a
paste containing area, other important use includes the dyeing of leather, paper, jute, straw and
anodized aluminium the coloring of food and drink, drugs, cosmetics, insecticides, fertilizers, wood,
stains, varnishes, ink, plastics, resins and the manufacture of toners and pigments of the lake type [2].
We wish to describe a simple and efficient protocol for the rapid preparation of acid dyes were
probably originally so named because of the presence of one or more sulphonic acid or other acidic
groups in the molecules. These dyes give very bright hues and have a wide range of fastness
properties from very poor to very good [3, 4].
Chemically the acid dyes consist of azo [5], anthraquinone [6], azine [7], pyrazolone [8], nitro and
nitroso compounds. R.S.Patel and K.C.Patel [9] have synthesised some novel acid dyes and evaluate

International Journal of Research in Modern Engineering and Emerging Technology (IJRMEET) UGC Approved id_47203
Vol. 5, Sp. Issue: 9, Sept.: 2017 (IJRMEET) ISSN: 2320-6586
444 Online International, Refereed, Impact factor & Indexed Monthly Journal www.raijmr.com RET Academy for International Journals of Multidisciplinary Research (RAIJMR)
their dyeing application on various fibres. Moreover, various reports are available in the literature on
dyeing of wool and nylon with acid dyes the reason being that, acid dyes are used on fibres with
cationic sites [10].
We report here the synthesis and characterization of the dyeing properties of the acid dyes base on 4,
4’-diamino diphenyl amine. The acid dyes of the following structure were prepared.
NHN=N N=N RR
Where R = acid coupling component such as H-acid, K-acid, J-acid, T-acid, R-acid, Gamma acid, N-
phenyl J-acid, Tobias acid, Bronner’s acid, Chicago acid, Laurent’s acid, Peri acid, Sulfotobias acid,
Schaeffer’s acid and Cleve acid.
Materials and Methods
[I] Synthesis of 4,4’-diamino diphenyl amine:
(i) Synthesis of 4,4’-dinitro diphenyl amine:
Concentrated sulphuric acid (25ml) is added to a well stirred solution of diphenyl amine (3.83gm,
0.02mole) in glacial acetic acid (20ml). The clear solution is cooled (freezing mixture of ice-salt),
stirred and a mixture of concentrated nitric acid (7.5ml) and concentrated sulphuric acid (4.8ml) is
added slowly through a dropping funnel. The temperature of the reaction mixture is maintained
below 5-10ºC. The mixture is allowed to attain room temperature and left for 30 minutes. It is poured
on to crushed ice and the mixture stirred well. The separated product is filtered, washed with cold
water (until free of acid) and crystallized from alcohol, yield 80%, m.p. 222 ºC.
(ii) Synthesis of 4,4’-diamino diphenyl amine:
4,4’-dinitro diphenyl amine (5.18gm, 0.02mole) was suspended in a solution of sodium sulphide (non
hydrated 14.4gm, 0.06mole) in water (75ml) was refluxed for 2 hours, yielding a deep reddish brown
solution, after cooling and diluted with water (75ml) and strongly acidifying with hydrochloric acid,
the solution was boiled for 20 minutes and filtered. Addition for sodium carbonate precipitated free
amine. The product was crystallized from ethanol, yield 70%, m.p. 158 ºC.
[2] Diazotization of 4,4’-diamino diphenyl amine:

International Journal of Research in Modern Engineering and Emerging Technology (IJRMEET) UGC Approved id_47203
Vol. 5, Sp. Issue: 9, Sept.: 2017 (IJRMEET) ISSN: 2320-6586
445 Online International, Refereed, Impact factor & Indexed Monthly Journal www.raijmr.com RET Academy for International Journals of Multidisciplinary Research (RAIJMR)
4,4’-diamino diphenyl amine (1.99gm, 0.01mole) was suspended in water(60ml). Hydrochloric acid
(10ml) was added drop wise to this well stirred suspension. The solution was cooled to 0-5 ºC in an
ice bath. A solution of NaNO2 (1.2gm) in water (8-10ml) previously cooled to 0 ºC, was the added
over a period of 5 minutes with stirring. The stirring was continued for an hour; maintain the same
temperature, with positive test for nitrous acid on starch iodide paper. After just destroying excess of
nitrous acid with required amount of a solution of sulphamic acid, the clear diazotize solution at 0-5
ºC obtained was use for subsequent coupling reaction.
[3] Synthesis of various acid dyes:
H-acid (6.38gm, 0.02mole) was suspended in water (20ml) and dissolved at neutral pH with sodium
carbonate (10% W/V) to obtain a clear solution. The solution was cooled below 5 ºC in an ice bath.
To this well stirred solution, the above mentioned solution of diazotize was added drop wise over
period of 10-15 minutes, maintaining the pH 7-8 by simultaneous addition of sodium carbonate
solution (10% W/V), during coupling purple solution was formed. The stirring was continued for
three hours keeping the temperature at 0-5 ºC. The reaction mixture was heated up to 60 ºC and
sodium chloride added until the colouring material was precipitated. It was stirred for an hour,
filtered and washed with a small amount of sodium chloride solution (50% W/V). The solid was
dried at 80-90 ºC and extracted with DMF solvent. The dye was purified by coupling the DMF
extract with excess of chloroform. A purple dye was filtered, washed with chloroform and dried at 60
ºC, yield 85%. Different acid coupling components were used to form various acid dyes.
Dyeing of Fibres:
All the dyes were applied on silk, wool and nylon fibres using the reported procedure [11,12].
Fastness Test:
Fastness to light was assessed in accordance with BS: 1006-1978. The rubbing fastness test was
carried out with a crockmeter (Atlas) in accordance with AATCC-1961, and the wash fastness test in
accordance with IS: 765-1979.
Result and Discussion
All the dyes were orange to marron in colour and obtained in excellent yield (75% to 85%). The
purity of all dyes was checked by Thin Layer Chromatography [13]. The absorption spectra of all the
dyes were recorded on Beckmann DB-GT grafting spectrophotometer. The characterization data of
dyes are given in table-1.

International Journal of Research in Modern Engineering and Emerging Technology (IJRMEET) UGC Approved id_47203
Vol. 5, Sp. Issue: 9, Sept.: 2017 (IJRMEET) ISSN: 2320-6586
446 Online International, Refereed, Impact factor & Indexed Monthly Journal www.raijmr.com RET Academy for International Journals of Multidisciplinary Research (RAIJMR)
Infrared Spectra:
The IR spectra of the dyes D1 to D15 were recorded on Perkin-Elmer spectrophotometer (Model 830)
using KBr pellets. Dyes D1 to D15 showed characteristic band at 2810-2820 (-CH2-) [14], 1650-1660
(-NH-), 1370-1380 (-N=N-), 1040-1070 (S=0) and 3420-3410 cm-1
due to (O-H and N-H) stretching
vibration.
PMR Spectra:
The PMR spectra (300MHz, CDCl3) of a representative dye showed signals at 3.45 (-OH), 8.24 (-
NH), 2.10 (-CH2-) and 6.82-8.14 (aromatic proton).
Fastness Properties:
The percentage exhaustion, fixation and fastness propertied of dyes D1 to D15 are given in table 2 and
3. All the dyes D1 to D15 showed good affinity for silk, wool and nylon gave moderate to very good
light, washing and rubbing fastness and good to very good exhaustion and fixation.
Conclusion
Various acid dyes based on 4, 4’- diamino diphenyl amine have been synthesized. These dye mostly
orange, yellow, brown and marron shaded on silk, wool and nylon fabric having good fastness
properties. The variation in the hues of the dyed fabric result from the both the nature and position of
the substituent present on the coupler ring. The exhaustion and fixation of these dyes are very good;
this indicates that the dyes have good affinity and solubility with the fabric. The remarkable degree of
levelness after washing indicates the good penetration and affinity of these dyes to the fabric. The
intrinsic conjugation in the diazo structure results in very good colour strength.
Acknowledgements
The authors would like to thank to the department of chemistry, Veer Narmad south Gujarat
University, Surat, for providing research facilities during my research work. I wish to record my
deeply felt thanks to Atul product limited, Atul, for scanning IR spectra, providing dyeing and library
facilities and recording fastness properties, CDRI, Lucknow, for providing NMR spectra.

International Journal of Research in Modern Engineering and Emerging Technology (IJRMEET) UGC Approved id_47203
Vol. 5, Sp. Issue: 9, Sept.: 2017 (IJRMEET) ISSN: 2320-6586
447 Online International, Refereed, Impact factor & Indexed Monthly Journal www.raijmr.com RET Academy for International Journals of Multidisciplinary Research (RAIJMR)
Reaction Scheme:
[1] Synthesis of 4,4’- diamino diphenyl amine:
(i) Synthesis of 4,4’- dinitro diphenyl amine:
Nitration
0-5oC
1. Conc. H2SO4
2. Conc. HNO3
NH NO2O2N
4,4'-dinitro diphenyl amine
(ii) Synthesis of 4,4’- diamino diphenyl amine:
NH NO2O2N
4,4'-dinitro diphenyl amine
Reduction
Na2S
NH NH2H2N
4,4'-diamino diphenyl amine
[2] Diazotization of 4,4’- diamino diphenyl amine:
NH NH2H2N
4,4'-diamino diphenyl amine
NaNO2 /HCl
Diazotization
0-5oC
NH N=NN=N ClCl
Diazotize solution
[3] Synthesis of Dyes:
NH N=NN=N ClCl
NH2OH
SO3HHO3S
+
H- acidDiazotize solution
CouplingReaction
0-5oC
pH 7.0
NH N=NN=N
NH2OH
SO3NaNaO3S
OHNH2
SO3NaNaO3S
Dye-1
NH
Diphenyl amine

International Journal of Research in Modern Engineering and Emerging Technology (IJRMEET) UGC Approved id_47203
Vol. 5, Sp. Issue: 9, Sept.: 2017 (IJRMEET) ISSN: 2320-6586
448 Online International, Refereed, Impact factor & Indexed Monthly Journal www.raijmr.com RET Academy for International Journals of Multidisciplinary Research (RAIJMR)
Table-1: Characterization
Dye
No
Coupling
Component
Molecular Formula M.W.
gm
Yield
%
% C % H % N Rf
Value Obt. Req. Obt. Req. Obt. Req.
D1 H-acid C32H21O14N7S4Na4 947 85 40.52 40.54 2.20 2.21 10.33 10.34 0.48
D2 K-acid C32H21O14N7S4Na4 947 81 40.53 40.54 2.20 2.21 10.32 10.34 0.45
D3 J-acid C32H23O8N7S2Na2 743 88 51.66 51.68 3.07 3.09 13.17 13.18 0.61
D4 T-acid C32H19O18N7S6Na6 1119 85 34.30 34.31 1.67 1.69 8.74 8.75 0.46
D5 R-acid C32H23O14N7S4Na4 947 73 40.53 40.54 2.41 2.42 10.31 10.34 0.63
D6 Gamma acid C32H23O8N7S2Na2 743 81 51.67 51.68 3.08 3.09 13.16 13.18 0.55
D7 N-phenyl J-
acid
C34H27O8N7S2Na2 743 75 54.90 54.91 3.61 3.63 13.15 13.18 0.65
D8 Tobias acid C32H23O6N7S2Na2 711 78 53.98 54.00 3.21 3.23 13.77 13.78 0.51
D9 Bronner’s
acid
C32H23O6N7S2Na2 711 77 53.99 54.00 3.22 3.23 13.76 13.78 0.64
D10 Chicago acid C32H23O8N7S2Na2 743 80 51.66 51.68 3.08 3.09 13.14 13.18 0.48
D11 Laurent’s
acid
C32H23O6N7S2Na2 711 74 53.98 54.00 3.20 3.23 13.75 13.78 0.58
D12 Peri acid C32H23O6N7S2Na2 711 83 53.99 54.00 3.21 3.23 13.76 13.78 0.53
D13 Sulfotobias
acid
C32H23O6N7S2Na2 711 71 53.98 54.00 3.22 3.23 13.74 13.78 0.53
D14 Schaeffer’s
acid
C32H21O6N7S2Na2 741 84 51.81 51.82 2.82 2.83 13.21 13.22 0.54
D15 Cleve acid C32H23O6N7S2Na2 711 82 53.98 54.00 3.21 3.23 13.77 13.78 0.59

International Journal of Research in Modern Engineering and Emerging Technology (IJRMEET) UGC Approved id_47203
Vol. 5, Sp. Issue: 9, Sept.: 2017 (IJRMEET) ISSN: 2320-6586
449 Online International, Refereed, Impact factor & Indexed Monthly Journal www.raijmr.com RET Academy for International Journals of Multidisciplinary Research (RAIJMR)
Table-2: Shade, Percentage, Exhaustion and Fixation of acid dyes on silk, wool and nylon
fibres.
Dye
No.
% Exhaustion % Fixation
Silk Wool Nylon Silk Wool Nylon
D1 76.45 77.20 67.88 87.63 87.43 80.95
D2 68.35 74.95 66.75 79.80 83.52 84.76
D3 69.55 71.75 63.00 82.02 82.16 76.74
D4 72.55 68.75 62.35 84.83 80.58 96.74
D5 74.30 73.15 67.63 85.46 82.59 80.44
D6 68.85 75.10 68.25 80.90 83.95 73.99
D7 73.15 76.45 70.80 84.75 85.67 81.85
D8 69.95 71.00 70.25 82.41 80.98 81.70
D9 71.75 72.65 67.13 83.69 82.51 79.85
D10 75.30 67.00 69.85 86.32 78.05 80.95
D11 71.05 70.75 71.70 83.04 81.13 81.58
D12 67.78 68.10 65.70 79.08 79.88 78.69
D13 74.95 75.80 64.35 85.39 85.55 77.77
D14 72.25 74.05 66.50 83.73 83.11 79.32
D15 70.20 66.05 69.20 82.69 79.33 82.80

International Journal of Research in Modern Engineering and Emerging Technology (IJRMEET) UGC Approved id_47203
Vol. 5, Sp. Issue: 9, Sept.: 2017 (IJRMEET) ISSN: 2320-6586
450 Online International, Refereed, Impact factor & Indexed Monthly Journal www.raijmr.com RET Academy for International Journals of Multidisciplinary Research (RAIJMR)
Table-3: Fastness properties of acid dyes on silk, wool and nylon fibres.
Dye
No.
Light Fastness Wash Fastness Rubbing Fastness
Dry Wet
S W N S W N S W C S W N
D1 5 3 6 4 3 5 3 3-4 4 3 3 4
D2 5-6 3-4 6 4-5 3-4 4-5 3-4 3 5 3-4 3-4 3-4
D3 4 4 5-6 4 4 4 4 3-4 5 3-4 3 3-4
D4 4-5 5 4-5 3 3-4 3-4 3 4 5 3 3-4 4
D5 5 4 5 3-4 4-5 4-5 3 3-4 4 3 3 3-4
D6 4-5 4-5 4-5 4 4 3-4 4-5 3 4 3-4 3 3-4
D7 6 5 5 5 3-4 4 3-4 3-4 3-4 3 4 4
D8 5 6 4 4-5 4 4 4 4 4-5 4 4 4
D9 5-6 4-5 5-6 3-4 4 5 4 4 5 3-4 3-4 3-4
D10 6 5-6 6 4 4 4 3-4 3-4 4 3 4 3
D11 5-6 4 5-6 3-4 3-4 4-5 3 4 3-4 3-4 4 3-4
D12 5 5 5 4 4-5 4-5 3-4 4-5 5 3 3-4 4
D13 4 4 4-5 4-5 4 4 3 5 4 3-4 4 3-4
D14 4 4 5 4 3-4 3-4 4 4-5 4-5 4 3-4 4
D15 4 4-5 5-6 4 4-5 4 3 5 5 4 5 5
S=Silk, W=Wool, N=Nylon

International Journal of Research in Modern Engineering and Emerging Technology (IJRMEET) UGC Approved id_47203
Vol. 5, Sp. Issue: 9, Sept.: 2017 (IJRMEET) ISSN: 2320-6586
451 Online International, Refereed, Impact factor & Indexed Monthly Journal www.raijmr.com RET Academy for International Journals of Multidisciplinary Research (RAIJMR)
References
[1] “Colour Index”, Society of Dyes and Colourist, Bardford, 3rd
Edn., Vol.1.
[2] “Ullmans Encyclopedia of Industrial Chemistry”, 1996, 5th
Edn., Vol. 3, 263-264.
[3] K. Peter, P. Jarmila, M. Jiri, Czech, 1991, 5, 269,163, Appl. 88/8, 254, Chem. Abstr. 1992, 116,
23753u.
[4] De Giorgi, M. Rita, “Jour. Soc. Dyer. Colo.” 1993, 109, 121, 405, 10, Chem. Abstr. 1994,121,
23350y.
[5] Pual Wight (Zeneca Limited, UK); GBA PL. 1997, 97/26, 340-19, Chem. Abstr. 1999, 130,
253667u.
[6] J. F. Feeman; Ger. Offen., 2, 250, 865, “Jour. Soc. Dyer. Colo.” 91, 316; Chem. Abstr. 1973, 79,
106131q.
[7] J.F. Corbett, “Jour. Soc. Dyer. Colo.” 1972, 88, 438.
[8] F. Ray Hunter, U.S. 4, 045, 425; Chem. Abstr. 1977, 87, 169245r.
[9] R.S. Patel, P.S. Patel, S.K. Patel and K.C. Patel; Oriental J. Of Chemistry, 2004, Vol. 20(2), 263-
268.
[10] M.D. Koushic Uddin and H.M. Sonia, A Comparative Study on Silk Dyeing with Acid and
Reactive Dye, Int. J. Engr. and Tech., 2010, 10(6), 21-26.
[11] V.A. Shenai, Chemistry of Dyes and Principles of Dyeing; Sevak Publication, Bombay, 1973.
[12] A. Guesmi, N.B. Hamadi, N. Ladhari, F. Sakli, dyeing properties and colour fastness of wool
dyed with indicaxanthin natural dye, Industrial Crop and Products, 2012, 37, 493-499.
[13] Bernard Fried and Joseph Sharm, Thin Layer Chromatography Technique and Application,
Marcel Dekker, New York, Basel, 1982.
[14] N.B. Colthup, L.H. Daly and E.W. Stephen, Introduction of Infrared and Raman Spectroscopy,
Academic Press, New York, San Francisco, 1975.

International Journal of Research in Modern Engineering and Emerging Technology (IJRMEET) UGC Approved id_47203
Vol. 5, Sp. Issue: 9, Sept.: 2017 (IJRMEET) ISSN: 2320-6586
452 Online International, Refereed, Impact factor & Indexed Monthly Journal www.raijmr.com RET Academy for International Journals of Multidisciplinary Research (RAIJMR)
A COMPARATIVE STUDY ON PHOTOCATALYTIC ACTIVITY OF ZnO, ZnS AND
THEIR COMPOSITE
BASANT K. MENARIYA, TARUNA DANGI, RAKSHIT AMETAAND SURESH C. AMETA
Department of Chemistry, PAHER University, Udaipur- 313003 (Raj.) INDIA
E-mail: [email protected]
ABSTRACT
A composite of ZnO and ZnS was prepared by simple solid state mechanochemical technique
and it was used as a semiconductor for the photocatalytic degradation of Azure B. The effect of
several parameters like pH, Azure B concentration, amount of composite and intensity of light
was monitored.The optimum conditions obtained for this degradation were: Azure B = 1.80 ×
10-5
M, pH = 10.0, amount of composite = 0.10 g and light intensity = 60.0 mWcm-2
. The
photocatalytic efficiency of ZnO-ZnS composite was compared with pure ZnO and ZnS.. It was
found that composite of ZnO - ZnS shows better photocatalytic activity as compared with ZnO
and ZnS alone for the degradation of Azure B in the presence of visible light.
Key words:ZnO , ZnS, Composite ,Photocatalytic activity, Azure B
INTRODUCTION
Effluents from various industries like dyeing, textile, paper, pulp and printing industries
contain pollutants such as, detergent, acids, soaps, pesticides, chemicals, dye etc, which are the
major sources of water pollution. Large scale production and extensive applications of synthetic
dyes cause considerable environmental pollution. Dyes are difficult to decompose biologically
and chemically.
Therefore, severaltechniques such as precipitation, flocculation, air stripping, adsorption,
reverse osmosis, ultrafiltration, etc. are being used for removal of contaminants. Heterogeneous
photocatalytic oxidation is an effective method to remove organic pollutant even at low
concentrations. Here, semiconductor particles on excitation act as photocatalysts or short-
circuited microelectrodes. Semiconductor generates electron-hole pair on excitation which may
be used either for oxidation or reduction of the dye.
Photocatalysis has shown various promising applications. Vinodgopal
andPrashant1studied degradation of azo dye by SnO2/TiO2 coupled semiconductor thin films.
Preparation of Bi12TiO20 and use in photocatalytic degradation was studied by Xuet al.2
Ungelenket al.3showed that nanoscale β-Sn1-nWO4
.nα-Sn is a highly efficient photocatalyst for
degradation of organic dyes in day light and it was observed to be a real ‘green’ synthesis.

International Journal of Research in Modern Engineering and Emerging Technology (IJRMEET) UGC Approved id_47203
Vol. 5, Sp. Issue: 9, Sept.: 2017 (IJRMEET) ISSN: 2320-6586
453 Online International, Refereed, Impact factor & Indexed Monthly Journal www.raijmr.com RET Academy for International Journals of Multidisciplinary Research (RAIJMR)
Kothari et al.4 have carried out the photoreduction of malachite green using CdS as photocatalyst
and ascorbic acid/EDTA as reductants. The photocatalytic degradation of crystal violet in
aqueous solutions was investigated by Sahoo et al.5
with Ag+ doped TiO2 under UV and
simulated solar light. Kansal et al.6
reported photocatalytic degradation of methyl orange and
rhodamine 6G using several photocatalyst such as titanium dioxide, zinc oxide, stannic oxide,
zinc sulphide and cadmium sulphide. A comparative photooxidative degradation of azure-B
using sono-photo-Fenton and photo-Fenton reagents has been reported by Vaishnave et al.7 and
they concluded the photochemical decomposition rate of azure-B is markedly increased in the
presence of ultrasound. Azure B was photocatalytically degraded by Sharmaet al.8 using NiS-
ZnS composite in molar ratio 1:5. Claudia et al.9
synthesized nanocrystals of ZnS (∼3 to 5 nm
diameter) with>50% product yield and reported the photocatalytic degradation of p-nitrophenol
and acid orange 7. Visible light-driven degradation of methylene blue in the presence of
semiconducting ZnS and CdS nanoparticles was reported by Soltani et al.10
Wenjiang et al.11
prepared spherical ZnO/ZnS core/shell particles under the hydrothermal
condition and studied the photocatalytic degradation of methyl orange as a probe reaction.
Nuengmatchaet al.12
studied visible light-induced photocatalytic degradation of rhodamine B
and industrial dyes (texbrite BAC-L and texbrite NFW-L) in the presence of ZnO-graphene-TiO2
composite. The novel zirconium oxide, nickel oxide and zinc oxide nanoparticles supported on
activated carbons were successfully fabricated through microwave irradiation method by Suresh
et al.13
and used for photocatalytic degradation of textile dyeing wastewater. Lachhebet al.14
studied photocatalytic degradation of anthraquinonic (alizarin S), azoic (crocein orange G,
methyl red), Congo red, heteropolyaromatic (methylene blue) dyes in TiO2/UV aqueous
suspensions. Bhati et al.15
synthesized CeCr2O5 nanoparticles by microwave method for the
decolorization of yellowish orange and fast green dyes, common water effluents of textile
industries. Gandhi et al.16
degradated methylene blue using coprecipitatedsulphidephotocatalyst.
This coprecipitated semiconductor CoS-ZnS (in 1 : 10 mole ratios) was prepared by
coprecipitation and used for photodegradation of methylene blue. Daneshvar et al.17
compared
the degradation of acid red 14 in the presence and absence of UV light using photocatalyst ZnO
and observed that the amount of H2O2 affect the photodegradation of dye. Devipriya and
Yesodharan18
have performed complete photocatalytic mineralization of pesticides to harmless
products.
ZnO and ZnS composite was prepared using a simple mechanochemical method. The
obtained nanoparticles were characterized by XRD, UV-Vis absorption spectroscopy, SEM and

International Journal of Research in Modern Engineering and Emerging Technology (IJRMEET) UGC Approved id_47203
Vol. 5, Sp. Issue: 9, Sept.: 2017 (IJRMEET) ISSN: 2320-6586
454 Online International, Refereed, Impact factor & Indexed Monthly Journal www.raijmr.com RET Academy for International Journals of Multidisciplinary Research (RAIJMR)
EDX. The photocatalytic activity of as prepared composite was examined in the degradation of
Azure B under visible light in air at room temperature and the influence of different
experimental parameters such as the ZnS-ZnS amount, pH of the solution, dye concentration
and light intensity on the rate of degradation was observed.
EXPERIMENTAL
Preparation of composite
Composite of ZnO and ZnS was prepared by simple solid state mechanochemical
method.Equal amount of ZnO and ZnS(1:1 ratio) was taken and then it was ground with the help
of pestle and mortar. Then it was used for photocatalytic degradation of Azure B.
Characterization of Composite
X-rays diffraction pattern of the ZnO-ZnS composite is shown in Fig. 1. Average particle
size of the crystalline composite was calculated by Debye-Scherrer’s equation and it was found
87.03 nm.
Fig. 1: XRD spectrum of composite
The elemental composition and surface morphology were observed out by scanning
electron microscope equipped with an energy dispersive X-ray spectrophotometer. The SEM
image of ZnO-ZnS composite is given Fig. 2. It shows that the particles of composite have rough
surface with irregular size.

International Journal of Research in Modern Engineering and Emerging Technology (IJRMEET) UGC Approved id_47203
Vol. 5, Sp. Issue: 9, Sept.: 2017 (IJRMEET) ISSN: 2320-6586
455 Online International, Refereed, Impact factor & Indexed Monthly Journal www.raijmr.com RET Academy for International Journals of Multidisciplinary Research (RAIJMR)
Fig. 2: SEM Image of composite
EDX analysis was performed to analyze the elemental constituent of mixed ZnO –
ZnSand it revealed that three elements are present in nanomaterial i.e. Zn, S and O (Fig. 3) .
Table1: Elemental composition
Elements Weight (%) Atomic (%)
Zn 67.63 46.41
O 16.39 34.40
S 15.97 19.18
Photocatalytic degradation
0.0305 g Azure B was dissolved in 100.0 mL of doubly distilled water so that the
concentration of dye solution was 1.0 x 10⁻³
M. It was used as a stock solutionand further diluted
as and, when required. The absorbance of Azure B solution was observed with the help
ofspectrophotometer( Systronic model 106 ) at λmax= 650 nm.It was irradiated with a 200 W
tungsten lamp (CEL, Model SM 201) Reaction solution was exposed to visible light.A water
filter was used between light source and solution to cut off the thermal radiation.
The dye solution was divided into four beakers. These beakers were kept under four
different experimental conditions and initial and final absorbances (A) were observed after 3 hrs
for solution of each beaker.Control experiments were carried out, which proved that this reaction
is photocatalytic in nature.
The photocatalytic degradation of Azure B dye was studied, after adding of 0.10 g of
composite in 50 mL dye solution (1.8 x 10⁻⁵
M) at pH 10.0. A 200W tungsten lamp wasused for

International Journal of Research in Modern Engineering and Emerging Technology (IJRMEET) UGC Approved id_47203
Vol. 5, Sp. Issue: 9, Sept.: 2017 (IJRMEET) ISSN: 2320-6586
456 Online International, Refereed, Impact factor & Indexed Monthly Journal www.raijmr.com RET Academy for International Journals of Multidisciplinary Research (RAIJMR)
irradiation (60.0 W cm-2
light intensity). Irrdiationwas carried out in glass vessel.A solarimeter
(Suryamapi CEL 201) was used for the measurement of light intensities. Water filter was usedto
cut thermal effect. A digital pH meter was used to measure pH of the dye solutions.pH of the
dye solutions was adjusted by addition of previously standardized 0.1 N sulphuric acid and 0.1N
sodium hydroxide solution. UV-Visible spectrometer (Systronic Model 106) was used to
measureabsorbance (A) of the dye solution at regular time intervals. A linear plot between plot
of 1+ logA and timeshows that Azure Bdegradation follows pseudo-first order kinetics.
The rate constant was calculated with the help of given formula -
k = 2.303 × slope
RESULTS AND DISCUSSION
Table 2: Atypical run
[Azure B ] = 1.80 x 10⁻⁵
M pH= 10.0
Amount of composite = 0.10 g Light intensity = 60.0 mWcm-2
Time (min.) Absorbance (A) 1+log A (ZnO-ZnS)
0 0.693 0.8407
5 0.591 0.7715
10 0.478 0.6794
15 0.391 0.5922
20 0.311 0.4927
25 0.269 0.4297
30 0.226 0.3541
Time (min.) Absorbance (A) 1 + log A (ZnO-ZnS)
35 0.174 0.2405
40 0.152 0.1818
35 0.129 0.1106
50 0.108 0.0334
Rate constant ( k ) with ZnO = 4.72 x 10⁻⁴
sec-1
Rate constant ( k ) with ZnS = 4.38 x 10⁻⁴
sec-1
Rate constant ( k ) with ZnO-ZnS = 6.14 x 10⁻⁴
sec-1

International Journal of Research in Modern Engineering and Emerging Technology (IJRMEET) UGC Approved id_47203
Vol. 5, Sp. Issue: 9, Sept.: 2017 (IJRMEET) ISSN: 2320-6586
457 Online International, Refereed, Impact factor & Indexed Monthly Journal www.raijmr.com RET Academy for International Journals of Multidisciplinary Research (RAIJMR)
Effect of pH
The effect of pH on photocatalytic degradation was monitored in the range 6.0- 11 and
the results are tabulated in Table 3. It was observed that the rate of degradation of azure B
increaseswith increase in pH and maximum efficiency was exhibited at pH 10.0. This result may
beexplained on the basis that on increasing pH, there was greater probability for the formationof
oxygen anion radical (O2•−
), which are produced from the reaction between O2 moleculeand
electron (e–) of the semiconductor. When pH was increased above 10.0, the rate of thereaction
was found to decrease, which may attributed the fact that cationic form of azure B isconverted
to its neutral form, which faces no attraction towards the negatively chargedsemiconductor
surface due to the absorption of hydroxyl ions.
Table 3: Effect of pH
[Azure B ] = 1.80 x 10⁻⁵
M
Amount of composite = 0.10 g Light intensity = 60 .0 mWcm-2
pH Rate constant (k) × 104(sec
-1)
6.0 0.59
6.5 0.63
7.0 0.75
7.5 1.17
8.0 1.49
8.5 2.32
9.0 3.14
9.5 4.06
pH Rate constant (k) × 104 (sec
-1)
10.0 6.14
10.5 5.19
11.0 4.93
Effect of dye concentration
Effect of concentration of Azure B was studied by taking its different concentrations i.e.
1.0 x 10⁻⁵
M-2.6 x 10⁻⁵
M. The results are reported in Table 4. It was observed that the rate of
photocatalytic degradation increased with increase in concentration of dye up to a certain
concentration (1.8 x 10⁻⁵
M). This may be attributed to the fact that as the concentration of dye
was increased, more dye molecules were available for excitation and hence, there was an

International Journal of Research in Modern Engineering and Emerging Technology (IJRMEET) UGC Approved id_47203
Vol. 5, Sp. Issue: 9, Sept.: 2017 (IJRMEET) ISSN: 2320-6586
458 Online International, Refereed, Impact factor & Indexed Monthly Journal www.raijmr.com RET Academy for International Journals of Multidisciplinary Research (RAIJMR)
increase in the rate. The rate of photocatalytic degradation was found to decrease with futhter
increase in the concentration of dye. This indicated that after certain concentration, the dye itself
start acting as obstacle for the incident light and it does not allow the required light intensity to
reach the semiconducting particles and thus, declining the rate of the photocatalytic degradation
of dye.
Table 4: Effect of dye concentration
Amount of composite = 0.10 g pH= 10.0
Light intensity = 60.0 mWcm-2
[ Azure B ] x 105
Rate constant (k) × 104(sec
-1)
1.0 4.03
1.2 4.46
1.4 5.03
1.6 5.57
1.8 6.14
2.0 5.57
2.2 5.32
2.4 5.03
2.6 4.53
Effect of amount of semiconductor (ZnO-ZnS) composite
The rate of photocatalytic degradation of Azure B increases with an increase in the
amountof composite but finally, it becomesalmost constant after a certain amount, i.e. 0.10g.
This may be attributed to the fact that as thequantity of composite was increased, theexposed
surface area also increases, but aftera definite limit, if the quantity of compositewas further
increased, then there will be noincrease in the exposed surface area of thephotocatalyst. It may
be considered like asaturation point; above which, any increase inthe amount of semiconductor
has insignificantor no effect on the rate of photocatalyticdegradation of Azure B, as any
increasein the amount of composite after thissaturation point will only increase the thicknessof
the film at the bottom of the reaction vessel.The saturation point shifts to upper rangefor bigger
vessels, while reverse was true forsmaller vessels.
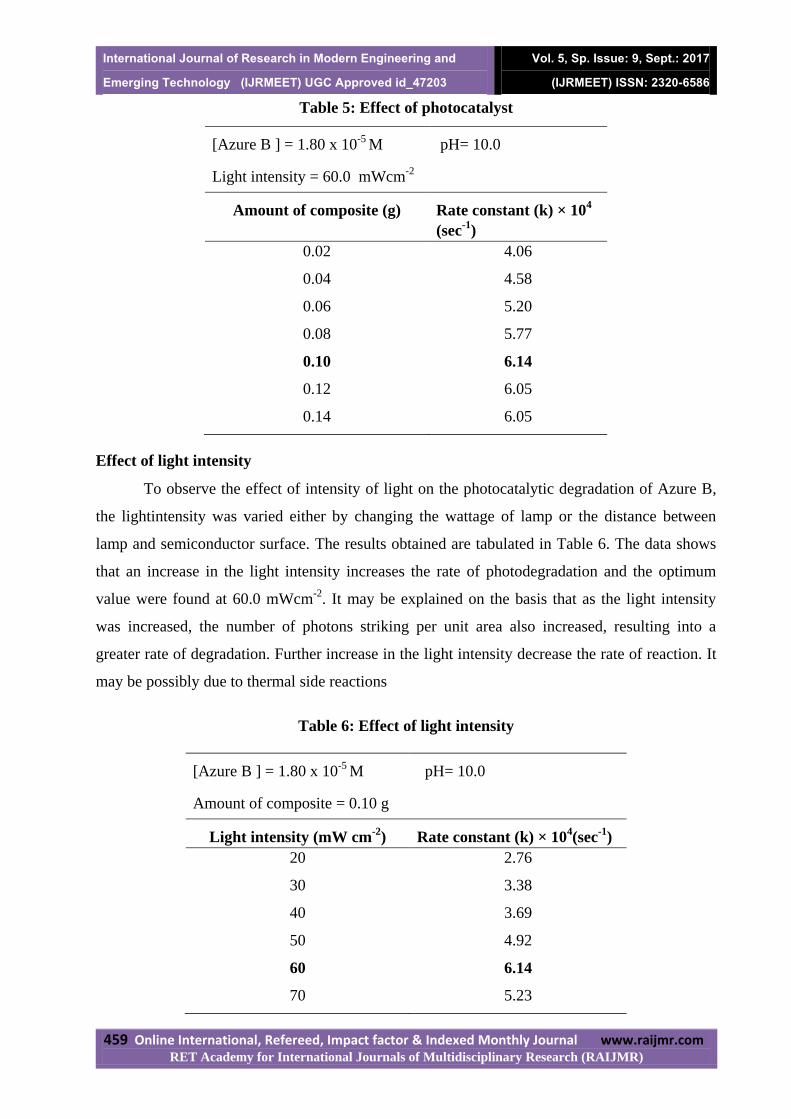
International Journal of Research in Modern Engineering and Emerging Technology (IJRMEET) UGC Approved id_47203
Vol. 5, Sp. Issue: 9, Sept.: 2017 (IJRMEET) ISSN: 2320-6586
459 Online International, Refereed, Impact factor & Indexed Monthly Journal www.raijmr.com RET Academy for International Journals of Multidisciplinary Research (RAIJMR)
Table 5: Effect of photocatalyst
[Azure B ] = 1.80 x 10⁻⁵
M pH= 10.0
Light intensity = 60.0 mWcm-2
Amount of composite (g)
Rate constant (k) × 104
(sec-1
)
0.02 4.06
0.04 4.58
0.06 5.20
0.08 5.77
0.10 6.14
0.12 6.05
0.14 6.05
Effect of light intensity
To observe the effect of intensity of light on the photocatalytic degradation of Azure B,
the lightintensity was varied either by changing the wattage of lamp or the distance between
lamp and semiconductor surface. The results obtained are tabulated in Table 6. The data shows
that an increase in the light intensity increases the rate of photodegradation and the optimum
value were found at 60.0 mWcm-2
. It may be explained on the basis that as the light intensity
was increased, the number of photons striking per unit area also increased, resulting into a
greater rate of degradation. Further increase in the light intensity decrease the rate of reaction. It
may be possibly due to thermal side reactions
Table 6: Effect of light intensity
[Azure B ] = 1.80 x 10⁻⁵
M pH= 10.0
Amount of composite = 0.10 g
Light intensity (mW cm-2
)
Rate constant (k) × 104(sec
-1)
20 2.76
30 3.38
40 3.69
50 4.92
60 6.14
70 5.23

International Journal of Research in Modern Engineering and Emerging Technology (IJRMEET) UGC Approved id_47203
Vol. 5, Sp. Issue: 9, Sept.: 2017 (IJRMEET) ISSN: 2320-6586
460 Online International, Refereed, Impact factor & Indexed Monthly Journal www.raijmr.com RET Academy for International Journals of Multidisciplinary Research (RAIJMR)
Mechanism –
On the basis of these observations, a tentative mechanism for photocatalytic degradation
of azure B (Dye) has been proposed as follows:
1Dye0
hν1Dye1 (Singlet excited state)
1Dye1
ISC 3Dye1 (Triplet excited state)
SC hν
e- (CB) + h
+ (VB)
e−+ O2 O2
•−
O2•−
+ 3Dye1 Leuco Dye
Leuco DyeProducts
Azure B absorbs suitable wavelength and gives its first excited singlet state followed by
intersystem crossing (ISC) to triplet state. On the other hand, the semiconducting composite
ZnO-ZnS also uses the radiant energy to excite its electron from valence band to the conduction
band; thus, leaving behind a hole. The dissolved oxygen accepts electron of composite and is
converted into oxygen anion radical. In the next step, the dye molecule in triplet state donate an
electron to oxygen anionradical and oxidized to its leuco form, which further degrades into
harmless products. The hydroxyl radicals do not participate in the photodegradation of dye as the
reaction rate was not appreciably retarded in presence of hydroxyl radical scavengers;
isopropanol.
CONCLUSION
A comparative study has been carried out between photocatalytic activity of pure ZnO
and ZnSand their composite. Azure B dye was used as a model system to compare their
photocatalytic activity. The rate constants for photocatalytic degradation of Azure B using ZnO,
ZnS and ZnO-ZnSwere 4.72 x 10⁻⁴
sec-1
, 4.38 x 10⁻⁴
sec-1
and 6.14 x 10⁻⁴
sec-1
, respectively.
These results clearly indicates that the composite ZnO-ZnSshowed better results as compared to
individual ZnO and ZnS. The observation of present work will explore the use of composites in
enhancing photocatalytic performance of a photocatalyst.
ACKNOWLEDGEMENTS
One of the authors Basant K. Menariya is thankful to Head Department of Chemistry, PAHER
University, Udaipur for providing laboratory facilities.

International Journal of Research in Modern Engineering and Emerging Technology (IJRMEET) UGC Approved id_47203
Vol. 5, Sp. Issue: 9, Sept.: 2017 (IJRMEET) ISSN: 2320-6586
461 Online International, Refereed, Impact factor & Indexed Monthly Journal www.raijmr.com RET Academy for International Journals of Multidisciplinary Research (RAIJMR)
REFERENCES
1. K. Vinodgopal, V. K. Prashant. Sci. Tech., 1995, 29, 841.
2. S. Xu , W. Shangguan, J. Yuan, J. Shi, M. Chen, Sci. Tech. Adv. Mater., 2007, 8, 40.
3. J.Ungelenkand,C. Feldmann, Appl.Catal. B: Environ., 2011, 102, 515.
4. S. Kothari, A. Kumar, R. Vyas, R. Ameta, P. B. Punjabi, J. Braz. Chem. Soc., 2009, 20,
1821.
5. C. Sahoo, A. K. Gupta, A. Pal, Dyes and Pigmen., 2005, 66, 189.
6. S. K. Kansal, M. Singh, D. Sud, J. Hazard. Mater., 2007, 141, 581.
7. P. Vaishnave, A. Kumar, R. Ameta, P. B. Punjabi, S. C. Ameta, Arab. J. Chem.,2014, 7,
981.
8. V. Sharma, N. Gandhi, A. Khant R.C. Khandelwal, Int. J. Chem. Sci., 2010, 8, 1965.
9. L. Claudia, T. Martinez, R. K. Mehra, J. Coll. Interf. Sci., 2001, 240, 525.
10. N. Soltani, E. Saion, M. Z. Hussein, M. Erfani, A. Abedini , G. Bahmanrokh, M.
Navasery, P. Vaziri, Inter. J. Mol. Sci., 2012, 13, 12242.
11. L. Wenjiang, G. Song, F. Xie, M. Chen, Y. Zhao, Mater. Lett., 2013, 96, 221.
12. P. Nuengmatcha, S. Chanthai, R. Mahachai, W. Chunoh, J. Environ. Chem. Eng., 2016,
4, 2170.
13. P. Suresh, J. Judithvijaya, L. Johnkennedy, Trans. Nonfer. Met. Soc. China, 2015, 25,
4216.
14. H. Lachheb, E. Puzenat, A. Houas, M. Ksibi, E. Elaloui, C. Guillard, J. M. Herrmann,
Appl. Catal. B: Environ., 2002, 39, 75.
15. I. Bhati, J. Sharma, A. Ameta, S. C. Ameta, Int. J. Chem. Sci., 2011, 9, 1787.
16. N. Gandhi, V. Sharma, A. Khant,R. C. Khandelwal, Int. J. Chem. Sci., 2010, 8, 1924.
17. N. Daneshvar, D. Salari, A. R. Khataee, J. Photochem. Photobiol. A: Chem., 2004, 162,
317.
18. S. Devipriya, S. Yesodharan, Sol. Energy Mater. Solar. Cells, 2005, 86, 309.

International Journal of Research in Modern Engineering and Emerging Technology (IJRMEET) UGC Approved id_47203
Vol. 5, Sp. Issue: 9, Sept.: 2017 (IJRMEET) ISSN: 2320-6586
462 Online International, Refereed, Impact factor & Indexed Monthly Journal www.raijmr.com RET Academy for International Journals of Multidisciplinary Research (RAIJMR)
Water Quality Study of Groundwater of Bhabhar Taluka (Banaskantha
District, Gujarat State, India)
Kiran V. Mehta
Department of Chemistry, R. R. Mehta College of Science and C. L. Parikh
College of Commerce, PALANPUR-385001, Dist. – Banaskantha, State -
Gujarat(India)
Email: [email protected]
Abstract
This research paper is about drinking water quality of groundwater on the basis of
physicochemical evaluation. Groundwater samples were collected from the various places of
rural areas of Bhabhar taluka of Gujarat state of India and their parameters like temperature,
colour, odour, turbidity, electrical conductance (E.C.), pH, total dissolved solids (TDS), total
alkalinity and concentrations of ions like fluoride, chloride, calcium, magnesium sodium and
potassium were assessed. The results were compared with the drinking water guidelines
suggested by Indian Council of Medical Research (ICMR). The study shows that water
should be treated properly before its use as drinking water to avoid its probable adverse
effects on health.
Keywords - Evaluation, quality, groundwater, awareness.
Introduction
In rural areas like Bhabhar Taluka of Banaskantha district of Gujarat state of India
where rainfall is very low and water transportation is not greatly effective, local people use
groundwater for irrigation as well as for drinking purpose. Owing to the increased strain on
ground-water resources, it becomes valued to evaluate the groundwater quality: whether the
water is suitable for drinking or not? With such a point of view, this work was carried out.
This kind of research may generate awareness not only in local people but also in the other
people about drinking water quality and its management.
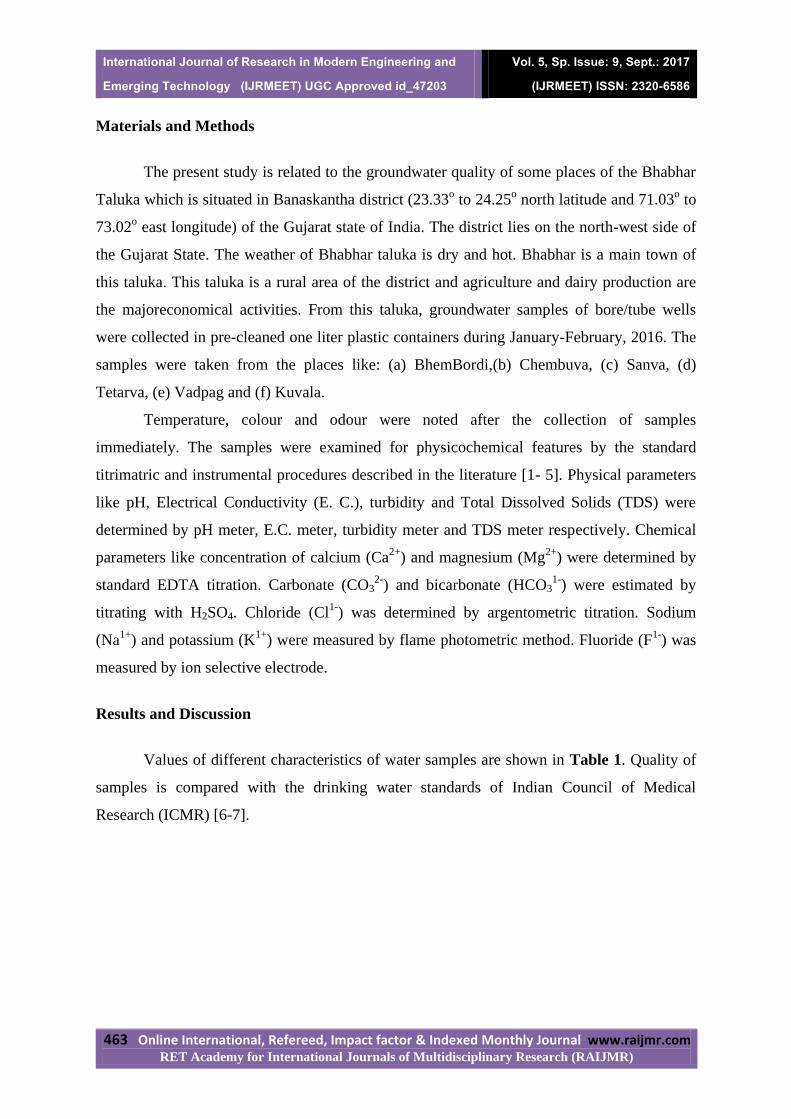
International Journal of Research in Modern Engineering and Emerging Technology (IJRMEET) UGC Approved id_47203
Vol. 5, Sp. Issue: 9, Sept.: 2017 (IJRMEET) ISSN: 2320-6586
463 Online International, Refereed, Impact factor & Indexed Monthly Journal www.raijmr.com RET Academy for International Journals of Multidisciplinary Research (RAIJMR)
Materials and Methods
The present study is related to the groundwater quality of some places of the Bhabhar
Taluka which is situated in Banaskantha district (23.33o to 24.25
o north latitude and 71.03
o to
73.02o east longitude) of the Gujarat state of India. The district lies on the north-west side of
the Gujarat State. The weather of Bhabhar taluka is dry and hot. Bhabhar is a main town of
this taluka. This taluka is a rural area of the district and agriculture and dairy production are
the majoreconomical activities. From this taluka, groundwater samples of bore/tube wells
were collected in pre-cleaned one liter plastic containers during January-February, 2016. The
samples were taken from the places like: (a) BhemBordi,(b) Chembuva, (c) Sanva, (d)
Tetarva, (e) Vadpag and (f) Kuvala.
Temperature, colour and odour were noted after the collection of samples
immediately. The samples were examined for physicochemical features by the standard
titrimatric and instrumental procedures described in the literature [1- 5]. Physical parameters
like pH, Electrical Conductivity (E. C.), turbidity and Total Dissolved Solids (TDS) were
determined by pH meter, E.C. meter, turbidity meter and TDS meter respectively. Chemical
parameters like concentration of calcium (Ca2+
) and magnesium (Mg2+
) were determined by
standard EDTA titration. Carbonate (CO32-
) and bicarbonate (HCO31-
) were estimated by
titrating with H2SO4. Chloride (Cl1-
) was determined by argentometric titration. Sodium
(Na1+
) and potassium (K1+
) were measured by flame photometric method. Fluoride (F1-
) was
measured by ion selective electrode.
Results and Discussion
Values of different characteristics of water samples are shown in Table 1. Quality of
samples is compared with the drinking water standards of Indian Council of Medical
Research (ICMR) [6-7].

International Journal of Research in Modern Engineering and Emerging Technology (IJRMEET) UGC Approved id_47203
Vol. 5, Sp. Issue: 9, Sept.: 2017 (IJRMEET) ISSN: 2320-6586
464 Online International, Refereed, Impact factor & Indexed Monthly Journal www.raijmr.com RET Academy for International Journals of Multidisciplinary Research (RAIJMR)
Table-1: Values of physicochemical parameters of water samples
Sr.
No.
of
Para.
Parameter
a b c d e f Mean S.D.
1 Temp.0C 24.2 24.5 24.4 24.2 24.5 24.4 24.37 0.13
2 Colour Cl Cl Cl Cl Cl Cl - -
3 Odour Ol Ol Ol Ol Ol Ol - -
4 Tur.
(NTU) 2.50 2.00 2.10 2.50 2.75 1.75 2.27 0.38
5 TDS
(mg/l) 1400 1560 1440 1380 1025 1130 1322.50 202.52
6 pH 8.10 8.15 7.90 8.40 8.50 7.80 8.14 0.27
7 E.C. (µs
cm-1
) 1725 1800 1690 1500 1230 1450 1565.83 212.66
8 T. A.
(mg/l) 331.40 330.10 315.70 280.10 400.60 350.20 334.68 39.89
9 F1-
(mg/l) 1.90 0.80 1.20 1.30 0.90 0.80 1.15 0.42
10 Cl1-
(mg/l) 150.15 210.40 166.40 170.90 140.55 110 156.07 33.62
11 Na1+
(mg/l) 180 204.26 209.80 210.30 190.80 220.70 202.64 14.78
12 K1+
(mg/l) 2.40 4.80 5.18 4.10 3.50 3.27 3.88 1.03
13 Ca2+
(mg/l) 13.25 11.80 10.75 14.20 12.60 15.45 13.01 1.68
14 Mg2+
(mg/l) 6.10 4.85 6.33 7.80 5.47 6.11 6.11 0.99
Para.: Parameter, S.D.: standard Deviation

International Journal of Research in Modern Engineering and Emerging Technology (IJRMEET) UGC Approved id_47203
Vol. 5, Sp. Issue: 9, Sept.: 2017 (IJRMEET) ISSN: 2320-6586
465 Online International, Refereed, Impact factor & Indexed Monthly Journal www.raijmr.com RET Academy for International Journals of Multidisciplinary Research (RAIJMR)
All the samples were found colourless and clear. Direct inspection of the samples for
odour was done and found that samples were odourless. Turbidity indicates dimness of water.
Clear water contains low turbidity level while grubby water contains high turbidity level. For
all the samples, turbidity was in the range of 1.75 to 2.75 NTU (Nephelometric Turbidity
Unit).
TDS for the samples varied from 1025 to 1560 mg/l. For TDS, ICMR suggests 500
mg/l as the desirable limit while 1500-3000 mg/l as the maximum permissible limit. Here, all
the samples (a tof) showed TDS values which were exceeding the desirable limit. High TDS
reduces the quality and affects the taste of water.
pH values of samples were in the range of 7.80 to 8.50. All the samples were in the
desired pH range (7.0 - 8.5) suggested by ICMR. High values of electrical conductivity (E.
C.) exhibit large amount of salts dissolved in water. This kind of property is not desired as it
makes water unsuitable for drinking. E. C. of the samples varied from 1230 to 1800μs cm-1
having standard deviation of 212.66μs cm-1
.
Presence of large amount of fluoride (higher than 1.5 mg/l) is associated with dental
and skeletal fluorosis, while inadequate amount of fluoride (less than1.0 mg/l) is associated
with dental carries. The F1-
concentration in samples was from 0.80 to 1.90 mg/l. Samples (a,
c, d) were beyond the desirable limit (1.0 mg/l) indicated by ICMR.
Cl1-
values of samples were in the range of 110 to 210.40.Sample(b) was violating the
limit (200 mg/l) for Cl1-
indicated by ICMR.
High level of Na1+
is associated with excessive salinity in water. Na1+
values of
samples were in the range of 180 to 220.70.K1+
values of samples were in the range of 2.40 to
5.18 having mean 3.88 and standard deviation 1.03.
Hardness of water is caused by multivalent cations and is largely due to Ca2+
and
Mg2+
ions. Ca2+
values of samples were in the range of 10.75 to 15.45.Thus, Ca2+
in the
samples was within the desirable limit (75 mg/l) indicated by ICMR. Mg2+
values of samples
were in the range of 4.75 to 7.80.
Conclusions
The TDS values of samples suggest that this water is not suitable for drinking
purpose.

International Journal of Research in Modern Engineering and Emerging Technology (IJRMEET) UGC Approved id_47203
Vol. 5, Sp. Issue: 9, Sept.: 2017 (IJRMEET) ISSN: 2320-6586
466 Online International, Refereed, Impact factor & Indexed Monthly Journal www.raijmr.com RET Academy for International Journals of Multidisciplinary Research (RAIJMR)
The quality of water samples studied were acceptable from the some of the
physicochemical parameters but as Cl1-
, F1-
and Na1+
values of few samples were violating
the desirable limit suggested by ICMR, the water should be treated properly before its usage
as drinking water to avoid probable unpleasant effects. Remedial measures should be taken.
As a result, public should be made aware of drinking water quality. Active participation of
people to keep the situation of groundwater under control is also of a great worth.
References
[1] Trivedi R. K. and Goel P. K., 1986, Chemical and Biological Methods for Water
Pollution Studies, Environmental Publication, Karad (India), 1-112.
[2] Food and Agriculture Organization (FAO), 1997, Chemical Analysis Manual for Food
and Water, FAO, Rome, 20-26.
[3] Aghazadeh N. andMogaddam A. A.,2010, Assessment of Groundwater Quality and its
Suitability for Drinking and Agricultural Uses in the Oshnavieh Area, Northwest of Iran,
Journal of Environmental Protection, 1, 30-40.
[4] Ackah M., Agyemang O., Anim A. K., Osei J.,Bentil N. O., Kpattah L., Gyamfi E.T. and
Hanson J.E.K., 2011, Assessment of groundwater quality for drinking and irrigation: the
case study of Teiman-Oyarifa Community, Ga East Municipality, Ghana, Proceedings of
the International Academy of Ecology and Environmental Sciences, 1(3-4), 186-194.
[5] Mohamed A. A. J., AbdulRahman I. and Lim L. H., 2014, Groundwater Quality
Assessment in the Urban-West Region Of Zanzibar Island, Environmental Monitoring
and Assessment,186, 6287–6300.
[6] Etim E.E., Odoh R., Itodo A.U., Umoh S. D. and Lawal U., 2013,Water Quality Index
for the Assessment of Water Quality from Different Sources in the Niger Delta Region
of Nigeria,Frontiers in Science,3(3), 89-95.
[7] Chatterjee P.R. and Raziuddin M., Studies on the Water Quality of a Water Body at
Asansol Town, West Bengal,2007, Nature Environment and Pollution Technology, 6(2),
289-292.

International Journal of Research in Modern Engineering and Emerging Technology (IJRMEET) UGC Approved id_47203
Vol. 5, Sp. Issue: 9, Sept.: 2017 (IJRMEET) ISSN: 2320-6586
467 Online International, Refereed, Impact factor & Indexed Monthly Journal www.raijmr.com RET Academy for International Journals of Multidisciplinary Research (RAIJMR)
NOVEL 1,3,4-OXADIAZOLE DERIVATIVES CONTAINING FURAN RING:
SYNTHESIS, CHARACTERIZATION, ANTIMICROBIAL ASPECTS
Name – Darshansinh Ajitsinh Raol,Dr.G.D.Acharya
Chemistry Department,
R.R.Mehta College of Science & C.L.Parikh College of Commerce, Palanpur
Email – [email protected]
ABSTRACT
5-(naphtho[2,1-b] furan-2-yl)-1,3,4-oxadiazole-2(3H)-thione (1) is prepared by
reaction between Ethyl naphtho[2,1-b]furan-2-carboxylate and hydrazine hydrate, followed
by reaction with CS2/KOH. The mannich reaction of 1,3,4-oxadiazole compound (1)
followed by reaction with 4-chloro phenyl hydrazine yield different 4-(4-
chlorophenylamino)-1-((disubstitutedamino)methyl)-3-(naphtho[2,1-b]furan-2-yl)-1H-1,2,4-
triazole-5(4H)-thione (3a-e). The newly synthesized compounds (3a-e) were characterized
using their physical properties, elemental analysis and spectral data. Also these compounds
were evaluated for their antimicrobial activities against different bacterial and fungal strains.
KEYWORDS
4-chlorophenylhydrazine, naphtho[2,1-b]furan, Mannich reaction, Spectral studies,
antimicrobial activities.
INTRODUCTION
Now a day, Mannich base reaction has increased interest due to their medicinal
importance [1,2]. The presence of basic Mannich side chain has shown a noticeable increase
in activities like antimalarial, anticancer, antitumor and anti-HIV activities [3-6]. The
important molecule derived through the mannich base reaction named 1,3,4-Oxadiazoles are

International Journal of Research in Modern Engineering and Emerging Technology (IJRMEET) UGC Approved id_47203
Vol. 5, Sp. Issue: 9, Sept.: 2017 (IJRMEET) ISSN: 2320-6586
468 Online International, Refereed, Impact factor & Indexed Monthly Journal www.raijmr.com RET Academy for International Journals of Multidisciplinary Research (RAIJMR)
important heterocyclic compounds in pharmaceutical field and several from them are the key
compounds with potential biological activities such as anticancer, antitubercular, anti-
inflammatory, antianlgesic, [7-9]. Also derivatives of 1,3,4-oxadiazole have been the object
of investigation due to their antibacterial and antifungal [10,11].
Naphtho[2,1-b]furan nucleus has been widely accepted as a unique substructure for
the synthesis of biologically active molecules [12]. In addition, Naphtho[2,1-b]furan moiety
present in many natural products were reported to possess biological activities [13,14].
In recent past the heterocycles containing Naphtho[2,1-b]furan were synthesized in
our laboratory [15,16] have exhibited significant biological activities. Such a versatile
biological activity of the both the molecules has encouraged further investigations in the
biological field. Hence, the present communication comprises the synthesis, characterization
and antimicrobial aspects of novel 1,3,4-oxadiazole derivatives containing furan ring. The
general synthesis of novel 1,3,4-oxadiazole derivatives are shown in Scheme-1.

469 Online International, Refereed, Impact factor & Indexed Monthly Journal www.raijmr.com RET Academy for International Journals of Multidisciplinary Research (RAIJMR)
Scheme-1 General synthesis of novel 1,3,4-oxadiazole derivatives
MATERIALS AND METHODS
All the necessary chemicals were purchased from local market while all solvents were
of laboratory grade and used after further purification. 5-(naphtho[2,1-b]furan-2-yl)-1,3,4-
oxadiazole-2(3H)-thione (1) was prepared according to reported method [15]. Melting points
of all synthesized compounds were determined in open capillary tubes were uncorrected. The
FTIR spectra were recorded using KBr pellets on a Nicolet 400D spectrometer and 1H NMR

470 Online International, Refereed, Impact factor & Indexed Monthly Journal www.raijmr.com RET Academy for International Journals of Multidisciplinary Research (RAIJMR)
spectra were recorded in DMSO with TMS as internal standard on a Bruker spectrometer at
400 MHz.
Preparation of 4-(4-chlorophenylamino)-1-((disubstitutedamino)methyl)-3-
(naphtho[2,1-b]furan-2-yl)-1H-1,2,4-triazole-5(4H)-thione (3a-e):-
The compounds 3a-e were prepared according to following two step method:
In the first step equimolar mixture of 5-(naphtho[2,1-b]furan-2-yl)-1,3,4-oxadiazole-
2(3H)-thione (1), formaldehyde and secondary amine (a-e) in 20 ml ethyl alcohol was taken
into round bottom flask and stirred for about 18-20 hrs. The solid product separated was
filtered and wash with ethyl alcohol. The solid products obtained were 3-
((disubstitutedamino)methyl)-5-(naphtho[2,1-b]furan-2-yl)-1,3,4-oxadiazole-2(3H)-thione
and designated as (2a-e).
In second step 3-((disubstitutedamino)methyl)-5-(naphtho[2,1-b]furan-2-yl)-1,3,4-
oxadiazole-2(3H)-thione (2a-e) was added to a solution of 4-cholorophenyl hydrazine
hydrate (0.02 mole) in ethyl alcohol (40 ml) and refluxed on water bath for 8-9 hrs. The
resultant mixture was poured into cold water, acidified with glacial CH3COOH and
recrystallization from Rectified spirit yield 4-(4-chlorophenylamino)-1-
((disubstitutedamino)methyl)-3-(naphtho[2,1-b]furan-2-yl)-1H-1,2,4-triazole-5(4H)-thione
(3a-e). The yields, melting points and elemental analysis results of all compounds are given
in Table-1.
International Journal of Research in Modern Engineering and Emerging Technology (IJRMEET) UGC Approved id_47203
Vol. 5, Sp. Issue: 9, Sept.: 2017 (IJRMEET) ISSN: 2320-6586

Ta
ble
-1 P
hysi
cal
pro
per
ties
an
d e
lem
enta
l an
aly
sis
of
com
po
un
ds
(3a
-e)
Co
mp
ou
nd
R
1
R2
Yie
ld
M.P
.
0C
Ele
men
tal
An
aly
sis
%C
%
H
%N
%
S
Fou
nd
C
alc
d.
Fou
nd
C
alc
d.
Fo
un
d
Ca
lcd
. F
ou
nd
C
alc
d.
3a
C
H3
CH
3
72
215
61.3
9
61.3
5
4.4
8
4.4
7
15.5
6
15
.52
7.1
3
7.0
9
3b
C
H3
Et
75
204
62.1
3
62
.10
4.7
8
4.7
2
15.0
9
15
.07
6.9
1
6.9
0
3c
Et
Et
70
207
6
2.8
2
62
.79
5.0
6
5.0
3
14.6
5
14
.62
6.7
1
6.6
8
3d
E
t C
6H
5
66
201
66
.21
66
.18
4.6
0
4.5
7
13.3
1
13
.25
6.1
0
6.0
8
3e
C6H
5
C6H
5
62
198
69.0
4
68
.98
4.2
1
4.1
7
12
.20
12
.16
5.5
9
5.5
8
471 Online International, Refereed, Impact factor & Indexed Monthly Journal www.raijmr.com RET Academy for International Journals of Multidisciplinary Research (RAIJMR)
International Journal of Research in Modern Engineering and Emerging Technology (IJRMEET) UGC Approved id_47203
Vol. 5, Sp. Issue: 9, Sept.: 2017 (IJRMEET) ISSN: 2320-6586

International Journal of Research in Modern Engineering and Emerging Technology (IJRMEET) UGC Approved id_47203
Vol. 5, Sp. Issue: 9, Sept.: 2017 (IJRMEET) ISSN: 2320-6586
472 Online International, Refereed, Impact factor & Indexed Monthly Journal www.raijmr.com RET Academy for International Journals of Multidisciplinary Research (RAIJMR)
ANTIMICROBIAL STUDY
Antibacterial activities
The antibacterial activities of all compounds (3a-e) were studied against two gram-
positive bacteria (Bacillus subtilis and Staphylococcus aureus) and two gram-negative
bacteria (Klebsiella Promioe and Escherichia Coli) using agar cup plate method at a
concentration of 50μg/ml. A methanol was used as control in this method while tetracycline
was used as a standard drug for comparison purpose. The area of inhibition of zone measured
in cm. The antibacterial activity results are tabulated in following Table-2.
Table-2 Antibacterial Activity of Compounds (3a-e)
Compounds Gram +Ve Gram -Ve
B. Subtilis S. aureus K. Promioe E. Coli
3a 64 55 70 66
3b 61 54 66 69
3c 59 51 65 72
3d 63 56 71 75
3e 68 58 73 71
Tetracycline 72 64 78 82
Antifungal Activities
The Antifungal activity of all compounds (3a-e) was studied by agar cup method at
1000 ppm concentration. Fungal strains used in the present study are Aspergillus niger,
Nigrospora Sp, and Rhizopus nigricum. The antifungal activities were measured on each of
these fungal strains on a potato dextrose agar (PDA) medium. Such a PDA medium contained
potato 200g, dextrose 20g, agar 20g and water 1c. Five days old cultures were employed for
the study. The compounds to be tested were suspended (1000ppm) in a PDA medium and

International Journal of Research in Modern Engineering and Emerging Technology (IJRMEET) UGC Approved id_47203
Vol. 5, Sp. Issue: 9, Sept.: 2017 (IJRMEET) ISSN: 2320-6586
473 Online International, Refereed, Impact factor & Indexed Monthly Journal www.raijmr.com RET Academy for International Journals of Multidisciplinary Research (RAIJMR)
autoclaved at 120o
C for 15 min. at 15atm. pressure. These media were poured into sterile
Petri plates and the organisms were inoculated after cooling the Petri plates. The percentage
inhibition for fungi was calculated after five days using the formula given below:
Percentage of inhibition = 100(X-Y) / X
Where, X = Area of colony in control plate
Y = Area of colony in test plate
The antifungal activity results are display in following Table-3.
Table- 3 Antifungal Activity of Compounds (3a-e)
Zone of Inhibition at 1000 ppm (%)
Compound Aspergillus
Niger
Nigrospora
Sp.
Rhizopus
Nigricum
3a 64 68 65
3b 57 66 63
3c 67 66 69
3d 69 74 72
3e 71 76 70
RESULTS AND DISCUSSION
It was observed that 3-((disubstitutedamino)methyl)-5-(naphtho[2,1-b]furan-2-yl)-
1,3,4-oxadiazole-2(3H)-thione, on condensation with 4-chloro hydrazine hydrate yields 3-
final compounds i.e. 4-(4-chlorophenylamino)-1-((disubstitutedamino)methyl)-3-
(naphtho[2,1-b]furan-2-yl)-1H-1,2,4-triazole-5(4H)-thione (3a-e).

International Journal of Research in Modern Engineering and Emerging Technology (IJRMEET) UGC Approved id_47203
Vol. 5, Sp. Issue: 9, Sept.: 2017 (IJRMEET) ISSN: 2320-6586
474 Online International, Refereed, Impact factor & Indexed Monthly Journal www.raijmr.com RET Academy for International Journals of Multidisciplinary Research (RAIJMR)
The structures of (3a-e) were confirmed on the basis of their elemental analysis, FTIR
spectrum and 1H NMR spectrum. The C, H, N analysis data of all compounds were well
agreed with their predicted structures presented in Scheme-1.
The FTIR spectrum of all compound shows an important band at 3254 and 1175 cm-1
due to NH stretching and C=S group, respectively. The another bands were found at their
respective positions such as at 3035 cm-1
(C-H of Ar), 1632 cm-1
(C=N), 771 cm-1
(C-O-C
ring), 2953,1372 cm-1
(-CH3/3a and 3b).
The 1H NMR spectrum of compound 3a-e in DMSO indicates that the all compounds
shows singlet of 1H at ~3.95 δ ppm due to NH group, singlet of 2H at ~4.52 δ ppm due to
CH2. Also all the aromatic protons are appeared in multiplicity at 7.05-8.72 δ. Also some
important substituted protons for each compound is found as follows:
3a; 2.17 (s,6H,CH3), 3b; 2.20 (s,3H,CH3), 1.15 (t,3H,CH3), 2.57 (q,2H,CH2), 3c; 1.14
(t,6H,CH3), 2.62 (q,4H, CH2), 3d;1.12 (t,3H,CH3), 2.60 (q,2H,CH2), 6.80–7.21 (m,5H,Ar-H),
3e; 6.80–7.21 (m,10H,Ar-H). Thus the structures of compounds 3a-e are confirmed as shown
in Scheme-1.
The elemental analysis results revealed that the CHNS content of all compounds are
consistence with their predicted structure. The IR data also direct for assignment of the
predicted structure. Compounds 3g and 3e were shows good antimicrobial activity.
CONCLUSION
In conclusion, in present we synthesized novel 1,3,4-oxadiazole derivatives
containing furan ring says, 4-(4-chlorophenylamino)-1-((disubstitutedamino)methyl)-3-
(naphtho[2,1-b]furan-2-yl)-1H-1,2,4-triazole-5(4H)-thione. All the synthesized compounds
were studied for their antibacterial and antifungal activity which shows good to moderate
activity against all employed antimicrobial strains. Compounds 3d and 3e was found more

International Journal of Research in Modern Engineering and Emerging Technology (IJRMEET) UGC Approved id_47203
Vol. 5, Sp. Issue: 9, Sept.: 2017 (IJRMEET) ISSN: 2320-6586
475 Online International, Refereed, Impact factor & Indexed Monthly Journal www.raijmr.com RET Academy for International Journals of Multidisciplinary Research (RAIJMR)
toxic for microbes while other compounds found to be moderately active compared to
standard drug tetracycline.
REFERENCES
[1] S. Bala, N. Sharma, A. Kajal, S. Kamboj and V. Saini, International Journal of
Medicinal Chemistry, 2014, 2014, 1-15.
[2] G. Roman. European Journal of Medicinal Chemistry, 2015, 89, 743-816.
[3] D. Sharma, D. Chetia, and M. Rudrapal, Asian Journal of Chemistry, 2016, 28, 782-788.
[4] G. Chen, Letters in Drug Design & Discovery, 2016, 13, 395-400.
[5] S. Bondock, H. Gieman and A. El-Shafei. Journal of Saudi Chemical Society, 2016, 20,
695-702.
[6] S. Li and J.-An Ma. Chemical Society Reviews, 2015, 44, 7439-7448.
[7] S. Bajaj, European Journal of Medicinal Chemistry, 2015, 97, 124-141.
[8] N. C. Desai, H. Somani, A. Trivedi, K. Bhatt, L. Nawale, V. M. Khedkar, P. C. Jha and D.
Sarkar, Bioorganic & Medicinal Chemistry Letters, 2016, 26, 1776-1783.
[9] S. N. Thore, S. V. Gupta and K. G. Baheti, Journal of Saudi Chemical Society, 2016, 20,
S46-S52.
[10] P. Li, Pei, L. Shi, M. N. Gao, X.Yang, W. Xue, L. H. Jin, D. Y. Hu and B. A. Song,
Bioorganic & medicinal chemistry letters, 2015, 25, 481-484.
[11] M. Y. Wani, A. Ahmad, R. A. Shiekh, K. J. Al-Ghamdi, and A. J. Sobral, Bioorganic &
Medicinal Chemistry, 2015, 23, 4172-4180.
[12] A. H. El-Wahab, Z. I. A. Al-Fifi, A. H. Bedair, F. M. Ali, A. H. Halawa and A. M. El
Agrody, Molecules, 2011, 16, 307-318.
[13] G. M. B. Bettolo, C. G. Cassinovi and C. Galeffi, Tetrahedron Letters, 1965, 6, 4857-
4864.
[14] J. Stochigt, U. Srocka and M. H. Zenk, Phytochemistry, 1973, 12, 2389-2391.

International Journal of Research in Modern Engineering and Emerging Technology (IJRMEET) UGC Approved id_47203
Vol. 5, Sp. Issue: 9, Sept.: 2017 (IJRMEET) ISSN: 2320-6586
476 Online International, Refereed, Impact factor & Indexed Monthly Journal www.raijmr.com RET Academy for International Journals of Multidisciplinary Research (RAIJMR)
[15] D. Raol Journal of Chemical and Pharmaceutical Research, 2015,
7, 104-107.
[16] G. R. Varde and G. D. Aacharya, Der Chemica Sinica, 2015, 6, 9-13.

International Journal of Research in Modern Engineering and Emerging Technology (IJRMEET) UGC Approved id_47203
Vol. 5, Sp. Issue: 9, Sept.: 2017 (IJRMEET) ISSN: 2320-6586
477 Online International, Refereed, Impact factor & Indexed Monthly Journal www.raijmr.com RET Academy for International Journals of Multidisciplinary Research (RAIJMR)
Study of Thermodynamic Parameters and Activation Energy
from TGA of Synthesized New Ternary Transition Metal
Complexes
Dhara Patel, Anal patel
Shri Sarvajanik Science College Mehsana
Abstract
Ternary Transition Metal complexes of Co(II),Cu(II) and Ni(II) with Schiff base and
metformin. have been synthesized . They were characterized by Elemental analysis, Infrared
spectra, Electronic spectra and Thermo gravimetric analysis studies. Kinetic Parameters, such
as energy of activation (Ea), enthalpy (ΔH#), entropy (ΔS#) and Gibbs energy (ΔG#), were
computed from the TGA data. Based on the thermal studies, Thermal stability and kinetic
parameters of these complexes were studied by employing Thermo gravimetric Analysis
(TGA). The percentage of loss observed in all complexes above 300 oC was higher,
indicating the decomposition of complexes and formation of oxides. Activation energy for
decomposition has been calculated using Broido method. Mathematical analysis of the data
has allowed us to determine various parameters using integral method. The trend of the
kinetic parameters was found to be different from that of the thermal stability order.
Keyword
Ternary Transition Metal complexes, TGA, Enthalpy, Entropy, Gibbs energy
Introduction
Metformin hydrochloride is a strongly basic bi substituted guanidine derivative with short
side chains[1] The metabolic abnormalities of non-insulin dependent diabetes mellitus are
generally acknowledged to result from a combination of insulin resistance and impaired
insulin secretion[2]. Schiff bases offer a versatile and flexible series of ligands capable to
bind with various metal ions to give complexes with suitable properties for theoretical and/or
practical Applications [3].. The metal complexes of Schiff bases derived from heterocyclic
compounds have been the centre of attraction for many workers in recent years.[4,5]. The
physico-chemical data suggested tetrahedral geometry for the Cu(II), Co(II) and Ni(II)
complexes. Thermo kinetic and spectral studies of metal complexes some Schiff bases [6]
TGA is commonly employed in research and testing to determine characteristics of materials
such as polymers, In presence study The thermal behaviour (TGA) of the complexes was
studied and kinetic parameters were determined by Broido method [7]. Very few systems
have been reported [8] showing the relationship between thermal stability of metal chelates
and structure of the chelating agents. Wendlandt and co-workers [9,11] and Hill and co-
workers[12] studied the thermal properties of metal chelates with different types of
complexing ligands. Structural studies on several metal chelates of 1-diketones and 2-
hydroxycarbonyl compounds have been reviewed by Holm and O’ Connor. The Broido
method was used to evaluate the kinetic parameters from the TGA curves. Plots of ln(ln 1/y)
versus 1000/T (where y is the fraction not yet decomposed) for different stage of the thermal
degradation of the complexes and evaluation of kinetic parameters the integral method.
Synthesis of Metal complexes
The complexes under investigation were prepared by three mixing ethanolic solution of
0.01M Schiff base, 0.01M metal salt and 0.01M metformin. The obtained mixture was

International Journal of Research in Modern Engineering and Emerging Technology (IJRMEET) UGC Approved id_47203
Vol. 5, Sp. Issue: 9, Sept.: 2017 (IJRMEET) ISSN: 2320-6586
478 Online International, Refereed, Impact factor & Indexed Monthly Journal www.raijmr.com RET Academy for International Journals of Multidisciplinary Research (RAIJMR)
refluxed with continues stirring for four hours. The resulted mixture was filtered, product was
collected and then washed several times with hot ethanol until the filtrate became clear. The
complexes were dried in desiccator over anhydrous CaCl2 under vacuum. The yield ranged
from 60-75% and the melting points of all complexes was above 350ºC.
X = 4H2O ·Cl
or
X = Cl
or
X = 4H2O ·Cl2
Results and Discussion
The analytical data of the complexes is presented in Table - 1 indicates 1:1:1 stoichiometry.
All synthesized complexes were Coloured and possess high decomposition points. All were
amorphous and stable in air.
Table-1: Analytical Data and Some Physical Properties of the Metal Complexes
Sb = Schiff Base , D.P. = Decomposition point, Met = Metformin
Analysis and Physical Measurements:
Elements like C, H, O and N were analyzed with a Perkin-Elmer 2400 series II elemental
analyzer. The metal content was estimated with titrematry method using standardized EDTA
solution after decomposing the complexes with aquaregia mixture. Magnetic susceptibilities
were measured at room temperature on a Gouy[13] balance using Hg[Co(CNS)]4 as
calibrate. The IR spectra were recorded on a Perkin-Elmer Lamda-983 spectrometer with
samples prepared as KBr pellets and UVVisible reflectance spectra were obtained on a
Co
mp
lex
Mo
lecu
lar
Fo
rmu
la
Co
lou
r
Formula
Weight
Yield
% (g)
Analysis of elements (%) Found (Calculated) Molar
Conductance
Ω-1
cm2 mol
-1
D.P.
(oC)
M C H O N Cl
[Ni·
Sb
·Met
·
H2O
] C
l 2
NiC
17H
25N
7
O2C
l 2
Ch
erry
red
489.087 68
(7.34)
12.00
(11.89)
41.75
(41.65)
5.11
(5.02)
6.54
(6.39)
20.1
(19.90)
14.49
(14.40) 78.9 >400
[Co
·Sb
·Met
·H
2O
] 4
H2O
·C
l 2
Co
C17H
33N
7O
6
Cl 2
Bro
wn
561.233 68
(8.42)
10.50
(10.39)
36.37
(35.98)
5.88
(5.48)
17.11
(16.99)
17.46
(17.35)
12.63
(12.49) 73.7 >350
[Cu·S
b·M
et·H
2O
] 4H
2O
· C
l 2
Cu
C1
7H
33N
7O
6C
l
2
Dar
k g
reen
565.846 65
(8.48)
11.23
(11.10)
36.1
(35.90)
5.83
(5.69)
16.96
(16.77)
17.32
(17.26)
12.53
(12.46) 55.8 >350

International Journal of Research in Modern Engineering and Emerging Technology (IJRMEET) UGC Approved id_47203
Vol. 5, Sp. Issue: 9, Sept.: 2017 (IJRMEET) ISSN: 2320-6586
479 Online International, Refereed, Impact factor & Indexed Monthly Journal www.raijmr.com RET Academy for International Journals of Multidisciplinary Research (RAIJMR)
Beckman DK-2A spectrophotometer using MgO as reference. Thermal measurements were
carried out using perkin-Elmer TGA- 7DSC-PYRIS-1-DTA-7 thermal analyzer.
Conductance Measurements:
All the synthesized metal complexes in DMF. The analytical data were summarized in
[Table1] reveals a stoichiometry of 1:2, metal: ligand. The molar conductance values of 10–3
M solutions in DMF were in the range of (55.8-78.9) ohm-1
cm2 mol
-1, indicating a
intermediate-electrolytic behaviour of the complexes.
Infrared Spectra & Electronic Spectra :
There is strong coupling among the IR bands of ternary complexes and hence quantitative
interpretation of the bands in the IR spectra is not possible without normal coordinate
analysis. Important IR frequencies of the complexes are listed in Table 2 along with their
suggested assignments. The IR spectra of all of the complexes differed from those of the
ligands. A strong band ascribed to the presence of υOH of Schiff base appears at 3009 cm-1
in spectrum. This band disappeared in spectra of all metal complexes which accounts for
coordination of -OH. Similarly frequency appear at 3010 cm-1 to 3153 cm-1 in complexes,
which gives indication for presence of water molecules. The spectra of schiff base showed
υC=N- stretching band, thus band was observed at 1660 cm-1 related to schiff base but such
band does not appear in the spectrum of metformin. [Table-2]. The complex of Ni(II) has
shown electronic transitions at 4273cm-1
(υ1), 11627 cm-1
(υ2) and 15384 cm-1
(υ3)
respectively. The complex of Co(II) has shown electronic transitions at 4255 cm-1
(υ1), 6450
cm-1
(υ2) and 14230 cm-1
(υ3).The complex of Cu(II) has shown electronic transitions bands
between 14492 cm-1
- 5208 cm-1
broad band.above three complexes are suggested for
octahedral geometry.data shown in [table 3].
Table-2: Infrared Spectral data of the Metal Complexes (cm-1
)
Co
mp
lex
υ-NH
Metformin
υ-C=NH
Metformin
υ-N-CH3
Metformin
υ-C=N-
Schiff
base
υ –OH
Schiff base
υ-C=C-
Schiff base
υ-NH
Schiff base υ M-N υ M-N=C υ M-NH υ M-OH2
Met
form
in
1580
sharp(s)
3367
sharp(s)
1381
sharp(m) - - - - - - - -
Sch
iff
Bas
e - - - 1660
sharp(s)
3009
sharp(m)
1612
sharp(s)
910
sharp(m)
1361
sharp(m) - - - -
[Ni·
Sb·M
et
·H2O
]Cl 2
1558
sharp(s)
3053
sharp(m)
1371
sharp(m)
1641
sharp(s)
3010
sharp(m)
1610
sharp(s)
812
sharp(m)
1260
sharp(m)
580
sharp(m)
812
sharp(m)
472
sharp(m)
848
sharp(m)
[Co·S
b·M
et·H
2O
] 4H
2O
·Cl 2
1529
sharp(s)
3059
sharp(m)
1357
sharp(m)
1639
sharp(s)
3050
sharp(m)
1612
sharp(s)
758
sharp(m)
1329
sharp(m)
567
sharp(m)
783
sharp(m)
470
sharp(m)
820
sharp(m)

International Journal of Research in Modern Engineering and Emerging Technology (IJRMEET) UGC Approved id_47203
Vol. 5, Sp. Issue: 9, Sept.: 2017 (IJRMEET) ISSN: 2320-6586
480 Online International, Refereed, Impact factor & Indexed Monthly Journal www.raijmr.com RET Academy for International Journals of Multidisciplinary Research (RAIJMR)
[Cu·S
b·M
et·H
2
O]
4H
2O
·Cl 2
1522
sharp(s)
3020
sharp(m)
1377
sharp(m)
1644
sharp(s)
3153
sharp(m)
1595
sharp(s)
846
sharp(m)
1289
sharp(m)
580
sharp(m)
802
sharp(m)
480
sharp(m)
856
sharp(m)
Sb = Schiff Base, Met = Metformin, (s) = Strong, (m) = Medium
Table-3: Electronic Spectra and Magnetic Moment Data for the Complexes
Com
ple
x
Absorption
region (cm-1
)
Band
assignment
Magnetic
moment
µeff (B.M.)
Geometry
[Ni·
Sb
·Met
·H2O
]Cl 2
4273 cm-1
11627 cm-1
15384 cm-1
3A2g 3T2g
3A2g 3T1g(F)
3A2g 3T1(P)
2.83 Octahedral
[Co
·Sb
·Met
·H2O
]
4H
2O
·Cl 2
4255 cm-1
6450 cm-1
14230 cm-1
4T1g 4T2g
4T1g 2Eg
4T1g 4A2g
3.87 Octahedral
[Cu
·Sb
·Met
·H2O
]
4H
2O
·Cl 2
14492cm-1---5208cm-1
Broad band
eg t2g
x2-y2 z2
x2-y2 xy
1.87
Octahedral
Sb = Schiff Base, Met = Metformin
Thermal studies
The complexes lost weight gradually during every phase of the experiment, then the samples
underwent an accelerated weight loss and finally in the temperature range of about 500-
600oC rate of weight loss became much more moderate. During the initial phase the gradual
weight loss may be due to water of hydration which may be either crystal or coordinated
water. The cumulative weight loses of metal complexes at 50C, 100°C, 150°C, 200°C and
250°C are presented in [Table 4]. Decomposition of all complexes starts above 300oC. The
rate of decomposition of metal complexes is lower than that of the ligand suggested that there
may be weak intermolecular hydrogen bonding. Co(II) has five, Ni(II) has one and Cu(II) has
five water molecules as part of their structure. All complexes lost hydration water 50°C and
150°C and then the co-ordinated water molecule was lost above ≥250°C. The decomposition
was complete at >600°C for all complexes. Above three complexes are suggested one water
molecule is coordinated.The TGA curves of all complexes were shown in [Figure 1].

International Journal of Research in Modern Engineering and Emerging Technology (IJRMEET) UGC Approved id_47203
Vol. 5, Sp. Issue: 9, Sept.: 2017 (IJRMEET) ISSN: 2320-6586
481 Online International, Refereed, Impact factor & Indexed Monthly Journal www.raijmr.com RET Academy for International Journals of Multidisciplinary Research (RAIJMR)
Table-4: Cumulative Weight Loss Data of Metal Complexes at 50oC to 250
OC
Complex
Found
50oC 100
oC 150
oC 200
oC 250
oC
g % g % g % g % g %
[Ni·Sb·Met·H2O]Cl2 0.48 0.1 0.48 0.1 0.97 0.2 7.34 1.5 8.80 1.8
[Co·Sb·Met·H2O]
4H2O·Cl2 5.61 1.0 11.22 2.0 14.03 2.5 75.76 13.5 95.41 17.0
[Cu·Sb·Met·H2O]
4H2O·Cl2 0.56 0.1 6.22 1.0 8.48 1.5 14.14 2.5 19.80 4.5
Sb = Schiff Base , Met = Metformin
Cu(II) Complex Co(II) Complex Ni(II) Complex
Fig-1: TGA curves for metal complexes
Activation Energy and Thermodynamic Parameters studies
The Broido method was used to evaluate the kinetic parameters from the TGAcurves. Plots of
ln(ln 1/y) versus 1000/T (where y is the fraction not yet decomposed) for three stage of the
thermal degradation of the complexes are shown in [Figure2] .
Cu(II)
Complex

International Journal of Research in Modern Engineering and Emerging Technology (IJRMEET) UGC Approved id_47203
Vol. 5, Sp. Issue: 9, Sept.: 2017 (IJRMEET) ISSN: 2320-6586
482 Online International, Refereed, Impact factor & Indexed Monthly Journal www.raijmr.com RET Academy for International Journals of Multidisciplinary Research (RAIJMR)
Co(II)
Complex
Ni(II)
Complex
Fig 2: Plot of ln[ln(1/y)] vs 1000/T for metal (II) Complexes
The slope of the plot ln(ln 1/y) versus 1000/T is related to the energy of activation as
Ea = –2.303 ×R ×slope (1)
Where, R = gas constant.
The parameters, enthalpy (DH#), entropy (DS#) and Gibbs energy (DG#) of activation were
calculated using the following standard equations
DH # = Ea – R Td (2)
DS# = DH#/T – 4.576 log T/K’ – 47.22 (3)
where K’ = –ln(ln 1/y)
DG# = DH# –DTS# (4)
The activation energies of decomposition were the range (10.66-42.36), (10.34-29.09),and
(8.25-16.56) kJ mol-1 in Cu(II), Co(II) and Ni(II) respectively. The high values of the
activation energies reflect the thermal stability of the complexes[12-13]. The entropy of
activation (DS#) and enthalpies of activation(DH#) values for three steps of all the
complexes are negative and the negative values of the entropies of activation are
compensated by the values of the enthalpies of activation leading to almost the same values

International Journal of Research in Modern Engineering and Emerging Technology (IJRMEET) UGC Approved id_47203
Vol. 5, Sp. Issue: 9, Sept.: 2017 (IJRMEET) ISSN: 2320-6586
483 Online International, Refereed, Impact factor & Indexed Monthly Journal www.raijmr.com RET Academy for International Journals of Multidisciplinary Research (RAIJMR)
(27883-28739 kJ mol-1) for the free energies of activation(DG#). The data were summarized
in [Table 5].
Table -5 Activation energy and Thermodynamic parameters some metal complexes
Complex Stage Temp Range
oC
Ea
kJ mol-1 (ΔH#) (ΔS#) (ΔG#)
[Ni· Sb·Met ·H2O]
Cl2
1 60-290 16.56804 -6659.57 -42.0805 28731.21
2 300-490 8.290411 -6667.85 -42.0926 28739.48
3 500-600 8.257179 -6667.88 -42.0926 28739.51
[Co· Sb·Met ·H2O]
4H2O·Cl2
1 50-130 29.09889 -6647.04 -42.1357 27925.95
2 130-180 22.38045 -6653.76 -42.1458 27932.66
3 210-600 10.34211 -6665.8 -42.164 27944.68
[Cu·Sb·Met·H2O]
4H2O·Cl2
1 60-120 42.36379 -5885.52 -41.4452 27883.87
2 120-500 22.86517 -5905.02 -41.4742 27903.34
3 500-600 10.6681 -5917.21 -41.4923 -22003.7
Sb = Schiff Base, Met = Metformin
The entropy of activation had negative values in all the complexes, which indicates that the
decomposition reactions proceed with a lower rate than normal ones.The calculated values of
the activation energy of the complexes are relatively low, indicating the autocatalytic effect
of the metal ion on the thermal decomposition of the complex. The negative activation
entropy value indicates that the activated complexes were more ordered than the reactant and
that the reactions were slow.
References
1. Stepensky D., Friedman M., Srour W., Raz, I. and Hoffman A., J. Control. Rel.,71, 107
(2001).
2. Stumvoll M., Nurjahan N., Perriello G.,Dailey. G and Gerich J. E., N Engl J
Med.,33(9), 550 (1995).
3. Ahmed A. A., BenGuzzi S. A. and ELHadiA. A., J of Sci. and Its Appli., 1(1),79,
(2007).
4. Raman, N., Dhaveethu Raju, J., Sakthivel, A.( 2007). Synthesis, spectral
characterization of Schiff base transition metal complexes: DNA cleavage and
antimicrobial activity studies. J. Chem. Sci., 119, 303.
5. Wang, D., Yang, Y., Zhao, T., Wu, X., Wang, S., Hou, Y., Chen, W. (2006), Synthesis
and properties of a Pr(III) complex with 2-acetylbenzimidazoledehyde-glycine Schiff-
base ligand. Chin. Sci. Bull., 51, 785.
6. Sanjiv, A., Sohan, L., Satish, K., Mahender, K., Comparative degradation kinetic
studies of three biopolymers: Chitin, chitosan and cellulose. Archives of Applied
Science Research, 3(2011), 3, pp. 188-201.
7. Broido, A. (1761). A simple, sensitive graphical method of treating thermogravimetric
analysis data. J. Poly. Sci., 7A(2), 1761.

International Journal of Research in Modern Engineering and Emerging Technology (IJRMEET) UGC Approved id_47203
Vol. 5, Sp. Issue: 9, Sept.: 2017 (IJRMEET) ISSN: 2320-6586
484 Online International, Refereed, Impact factor & Indexed Monthly Journal www.raijmr.com RET Academy for International Journals of Multidisciplinary Research (RAIJMR)
8. Wendlandt, W. W. (1957). The thermal decomposition of the 5,7-dihalo-8-quinolinol
rare earth metal chelates. Anal. Chim. Acta, 17, 428.
9. Ascenzo, G D., Wendlandt, W. W. (1970). The thermal properties of some metal
pyridinecarboxylates. Anal. Chim. Acta, 50, 79.
10. Chang, F. C., Wendlandt, W. W. (1971). Thermal reactions of coordination compounds:
Part II. Chlorobromobis(ethylenediamine)- and dibromobis(ethylenediamine)- cobalt
(III) complexes. Thermochim Acta, 2(4) , 293.
11. Perry, D. L., Vaz, C. Wendlandt, W. W. (1974). The thermogravimetry and differential
thermal analysis curves of some di-2- pyridyl ketone nickel(II) complexes. Thermochim
Acta, 9, 76. |
12. Scency, C. G., Hill, J. O., Magee, R., J. (1975). Thermal analysis of copper
dithiocarbamates. Thermochim Acta, 11, 301.
13. Pierce W. S., Magneto Chemistry, New York (USA): Interscience, 62 (1956).

International Journal of Research in Modern Engineering and Emerging Technology (IJRMEET) UGC Approved id_47203
Vol. 5, Sp. Issue: 9, Sept.: 2017 (IJRMEET) ISSN: 2320-6586
485 Online International, Refereed, Impact factor & Indexed Monthly Journal www.raijmr.com RET Academy for International Journals of Multidisciplinary Research (RAIJMR)
METHOD DEVELOPMENT AND VALIDATION OF
MEBENDAZOLE BY RP HPLC TECHNIQUE
AMI PATELa, SMITKUMAR PATEL
b, VIPAL PATEL
c,
BHASKARRAV MAKWANAd
ABSTRACT
A simple, selective, linear, precise and accurate RP-HPLC method was developed
and validated for rapid assay of MEBENDAZOLE. Isocratic elution at a flow rate
of 1.2 ml /min was employed on a symmetry C18 column at ambient temperature.
The mobile phase consisted of Acetonitrile: 0.1M Acetic Acid 60:40 (v/v). The UV
detection wavelength was at 210 nm. Linearity was observed in concentration
range of 60-100 mg/ml. The retention time for MEBENDAZOLE was 3.0 min.
The method was validated as per the ICH guidelines. The proposed method can be
successfully applied for the estimation of MEBENDAZOLE.
Key words: Mebendazole, Method Development, Validation, 210nm, 3.0min.
INTRODUCTION TO MEBENDAZOLE
Mebendazole (MBZ) is a medication used to treat a number of parasitic
worm infestations.[3]
This includes ascariasis, pinworm disease, hookworm
infections, guinea worm infections, hydatid disease, and giardia, among others.[3]
It
is taken by mouth.[3]
Mebendazoleis usually well tolerated.[3]
Common side effects include headache,
vomiting, and ringing in the ears.[3]
If used at large doses it may cause bone
marrow suppression.[3]
It is unclear if it is safe in pregnancy.[3]
Mebendazole is a
broad-spectrum antihelminthic agent of the benzimidazole type.[3]
Mebendazole came into use in 1971, after it was developed in Belgium.[4]
It is on
the World Health Organization's List of Essential Medicines, the most effective
and safe medicines needed in a health system.[5]
Mebendazole is available as
a generic medication.[6]

International Journal of Research in Modern Engineering and Emerging Technology (IJRMEET) UGC Approved id_47203
Vol. 5, Sp. Issue: 9, Sept.: 2017 (IJRMEET) ISSN: 2320-6586
486 Online International, Refereed, Impact factor & Indexed Monthly Journal www.raijmr.com RET Academy for International Journals of Multidisciplinary Research (RAIJMR)
Description
DRUGS: Mebendazole
STRUCTURE:
The structural formula of Mebendazole is shown below:
Figure – 1 Molecular structure of Mebendazole
IUPAC NAME: Methyl (5-benzoyl-1H-benzimidazol-2-yl)carbamate
Molecular Formula: C16H13N3O3
Molecular Weight: 295.293 g/mol
Classification of Drugs :Antiparasitic agent
1.1 Pharmacokinetic data
Bioavailability : 2–10%
Protein binding : 95%
Metabolism : Extensive liver

International Journal of Research in Modern Engineering and Emerging Technology (IJRMEET) UGC Approved id_47203
Vol. 5, Sp. Issue: 9, Sept.: 2017 (IJRMEET) ISSN: 2320-6586
487 Online International, Refereed, Impact factor & Indexed Monthly Journal www.raijmr.com RET Academy for International Journals of Multidisciplinary Research (RAIJMR)
2. EXPERIMENTAL
2.1 Materials
Mebendazole was providedby Arti drugs lab Ltd. as raw material. Analytical
HPLC grade Acetonitrile was purchased from Merk Pvt. Ltd. HPLC grade
Acetic Acid and Water were obtained from Finar laboratory.
2.2 Instrumentation
The chromatographic system used to perform development and validation of
this assay method was comprised of a LC-20ATvp binary pump, a SPD-20Avp
UV-VIS detector and a rheodyne manual injector model 7725i with 20μl loop
(Shimadzu, Kyoto, Japan) connected to a multi-instrument data acquisition and
data processing system (Class-VP 6.13 SP2, Shimadzu).
2.3 Mobile phase preparation
The mobile phase consisted of Acetonitrile – 0.1M Glacial Acetic Acid (60:
40, v/v). To prepare 0.1M Glacial Acetic Acid solution, 60 gram (5.7 ml) Glacial
Acetic Acid were weighed and dissolve in 1000 ml HPLC grade Water. Mobile
phase was filtered through a 0.45 μm nylon membrane (Millipore Pvt. Ltd.
Bangalore, India) and degassed in an ultrasonic bath (Spincotech Pvt. Ltd.,
Mumbai).
2.4 Diluent Preparation
Mobile phase was used as diluent.
2.5 Standard Preparation
100mg of Mebendazole was weighed and transferred (working standard)
into a 100ml volumetric flask. The diluent methanol was added and sonicated to
dissolve it completely and made up to the mark with the same solvent. Further 1ml
Biological half-life : 3–6 hours
Excretion : Faeces, urine (5–10%)

International Journal of Research in Modern Engineering and Emerging Technology (IJRMEET) UGC Approved id_47203
Vol. 5, Sp. Issue: 9, Sept.: 2017 (IJRMEET) ISSN: 2320-6586
488 Online International, Refereed, Impact factor & Indexed Monthly Journal www.raijmr.com RET Academy for International Journals of Multidisciplinary Research (RAIJMR)
of the above stock solution was pipetted into a 10ml volumetric flask and diluted
up to the mark with diluent. The contents were mixed well and filtered through
0.45 μm nylon membrane paper. The calibration curve was plotted with the
concentrations of the 60 to 100 mg/ml working standard solutions. Calibration
solutions wereprepared and analyzed immediately after preparation.
The formulation tablets of mebendazole were crushed to give finely
powdered material. Powder equivalent to 60 mg ofdrug was taken in 100 ml of
volumetric flask containing 5 ml of mobile phase and was shaken to dissolve the
drug and then filtered through 0.45 μm nylon membrane paper.
2.6 Chromatographic Conditions
Chromatographic analysis was performed on Luna hypersil C18 (250x4.6
mm, 5 μ) column. The mobile phase was consisted of Acetonitrile and 0.1M
Glacial Acetic Acid (60: 40, v/v). The flow rate of the mobile phase was adjusted
to 1.2 mL/min and the injection volume was 20 μl. Detection was performed at 210
nm.
3. RESULT AND DISCUSSION
3.1Development and Optimization of the HPLC Method
Proper selection of the method depends upon the nature of the sample (ionic
or ionisable or neutral molecule), its molecular weight and solubility. Mebendazole
is dissolved in polar solvent hence RP-HPLC was selected to estimate them. To
develop a rugged and suitable HPLC method for the quantitative determination of
Mebendazole, the analytical conditions were selected after testing the different
parameters such as diluents, buffer, buffer concentration, organic solvent for
mobile phase and mobile phase composition and other chromatographic
conditions. Our preliminary trials using different composition of mobile phases
consisting of water with methanol or Acetonitrile, did not give good peak shape.
The mobile phase consisted of Acetonitrile – 0.1M Glacial Acetic Acid (60:
40, v/v). To prepare the buffer solution, 60 gm(5.7 ml) Glacial Acetic Acid was
weighed and dissolves in 1000 ml HPLC grade water. Mobile phase was filtered
through a 0.45 μmnylon membrane (Millipore Pvt. Ltd. Bangalore, India) and
degassed in an ultrasonic bath (Spincotech Pvt. Ltd., Mumbai).

International Journal of Research in Modern Engineering and Emerging Technology (IJRMEET) UGC Approved id_47203
Vol. 5, Sp. Issue: 9, Sept.: 2017 (IJRMEET) ISSN: 2320-6586
489 Online International, Refereed, Impact factor & Indexed Monthly Journal www.raijmr.com RET Academy for International Journals of Multidisciplinary Research (RAIJMR)
By using 0.1M Glacial Acetic Acid in 1000 ml of buffer and keeping mobile
phase composition as Acetonitrile – 0.1M Glacial Acetic Acid (60: 40, v/v), best
peak shape was obtained. For the selection of organic constituent of mobile phase,
Acetonitrile was chosen to reduce the longer retention time and to attain good peak
shape. Figure 2 represents wavelength selection. Figure 2 represent the
chromatogram of standard respectively.
Figure 2: Chromatogram of standard preparation
3.2 Method Validation
3.2.1 Linearity
Five points calibration curve were obtained in a concentration range from
60-100 mg/ml for Mebendazole. The response of the drug was found to be linear in
the investigation concentration range and the linear regression equation was y =
499.994x -25999.64 with correlation coefficient 0.9958. (Figure 3)

International Journal of Research in Modern Engineering and Emerging Technology (IJRMEET) UGC Approved id_47203
Vol. 5, Sp. Issue: 9, Sept.: 2017 (IJRMEET) ISSN: 2320-6586
490 Online International, Refereed, Impact factor & Indexed Monthly Journal www.raijmr.com RET Academy for International Journals of Multidisciplinary Research (RAIJMR)
Figure 3: Linearity curve for Mebendazole
Table No. 3.1 Linearity of Mebendazole
Set No Concentration Area
1 60 mg/ml 4000.000
2 70 mg/ml 8520.001
3 80 mg/ml 12950.120
4 90 mg/ml 17996.096
5 100 mg/ml 22590.000
3.2.2 LOD and LOQ
The limit of detection and limit of quantification were evaluated by serial dilutions
of Mebendazole stock solution in order to obtain signal to noise ratio of 3:1 for
LOD and 10:1 for LOQ. The LOD value for Axitinib was found to be 1 mg/ml and
the LOQ value 10 mg/ml.
3.2.3 Precision
Precision study was established by evaluating method precision and
intermediate precision study. System precision was evaluated by analyzing the
standard solution five times. Method precision of the analytical method was
determined by analyzing six sets of sample preparation. Assay of all six replicate
0
5000
10000
15000
20000
25000
60 70 80 90 100

International Journal of Research in Modern Engineering and Emerging Technology (IJRMEET) UGC Approved id_47203
Vol. 5, Sp. Issue: 9, Sept.: 2017 (IJRMEET) ISSN: 2320-6586
491 Online International, Refereed, Impact factor & Indexed Monthly Journal www.raijmr.com RET Academy for International Journals of Multidisciplinary Research (RAIJMR)
sample preparations was determined and mean % assay value, standard deviation;
% relative standard deviation was calculated. Intermediate precision of the
analytical method was determined by performing method precision on another day
by another analyst under same experimental condition. Assay of all six replicate
sample preparations was determined and mean % assay value, standard deviation;
% relative standard deviation was calculated.
Data obtain from precision experiments are given in Table 5.2 for intraday
and interday precision study for Axitinib. The RSD values for intraday precision
study and interday precision study was < 2.0% for Mebendazole, which confirm
that the method was precise.
The result of repeatability and intermediate precision study are shown in
Table 3.2. The developed method was found to be precise as the %RSD values for
the repeatability and intermediate precision studies were 0.00019 % and 0.00006
%, respectively, which confirm that method was precise.
Table 3.2: Evaluation data of precision study
Set (80 mg/ml) Intraday (n=6) Interday (n=6)
1 12950.120 12950.999
2 12950.124 12950.980
3 12950.078 12951.003
4 12950.137 12950.998
5 12950.114 12950.999
6 12950.078 12950.998
Mean 12950.100 12951.00
Standard Deviation 0.0248 0.0081
%RSD 0.00019 0.00006
3.2.4 Accuracy
The HPLC area responses for accuracy determination are depicted in Table
3.3. The result shown that best recoveries (99.00 - 100.00 %) of the spiked drug
were obtained at each added concentration, indicating that the method was
accurate. Chromatogram obtain during accuracy study were shown in Figure 13-15

International Journal of Research in Modern Engineering and Emerging Technology (IJRMEET) UGC Approved id_47203
Vol. 5, Sp. Issue: 9, Sept.: 2017 (IJRMEET) ISSN: 2320-6586
492 Online International, Refereed, Impact factor & Indexed Monthly Journal www.raijmr.com RET Academy for International Journals of Multidisciplinary Research (RAIJMR)
Table 3.3: Evaluation data of accuracy study
Concentration
in mg/ml
Amount
added
concentration a
(mg/ml)
Amount found
Concentrationa
(mg/ml)
%
Recovery
% RSD
80 0.1000 0.0990 99.00 0.012
90 0.1001 0.0999 99.99 0.015
100 0.1001 0.1000 100.00 0.018
. a Each value corresponds to the mean of three determinations.
3.2.5 Robustness
The result of robustness study of the developed assay method was established in
Table 5.4. The result shown that during all variance conditions, assay value of the
test preparation solution was not affected and it was in accordance with that of
actual. System suitability parameters were also found satisfactory; hence the
analytical method would be concluded as robust.
3.2.6 System suitability
A system suitability test of the chromatographic system was performed
before each validation run. Five replicate injections of standard preparation were
injected and asymmetry, theoretical plate and % RSD of peak area were
determined for same. Acceptance criteria for system suitability, asymmetry not
more than 2.0, Theoretical plate not less then 5000 and % RSD of peak area not
more then 2.0, were full fill during all validation parameter.
4. REFERANCE
1. www.google.com
2. www.wikipedia.com
3."Mebendazole". The American Society of Health-System
Pharmacists.Retrieved Aug 18, 2015.

International Journal of Research in Modern Engineering and Emerging Technology (IJRMEET) UGC Approved id_47203
Vol. 5, Sp. Issue: 9, Sept.: 2017 (IJRMEET) ISSN: 2320-6586
493 Online International, Refereed, Impact factor & Indexed Monthly Journal www.raijmr.com RET Academy for International Journals of Multidisciplinary Research (RAIJMR)
4. Mehlhorn, Heinz (2001). Encyclopedic reference of parasitology. 107
tables (2 ed.). Berlin [u.a.]: Springer. p. 259. ISBN 9783540668299.
5. "WHO Model List of Essential Medicines (19th List)" (PDF). World Health
Organization. April 2015. Retrieved 8 December 2016.
6. Hamilton, Richard J. (2012). Tarascon pocket pharmacopoeia (13 ed.).
Burlington, Mass.: Jones & Bartlett Learning. p. 33. ISBN 9781449624286
7. Durgeshparekh et al, “RP HPLC method development and validation for
quantification of mebendazole inapi and pharmaceutical formulation”,
PharmaTutor (Print-ISSN: 2394 - 6679; e-ISSN: 2347 - 7881) Volume 4, Issue
5 , page 46-51.
8. AnantAgrekar and et ai, “ Simultaneous determination of mebendazole and
pyrantelpamoate from tablets by RP HPLC”, Article in Talanta 44 (11): 1959-
69, December 1997 , DOI : 10.1016/S0039-9140(96)02118-2, source: Pubmed
9. Indian pharmacopeia
10.British Pharmacopeia

International Journal of Research in Modern Engineering and Emerging Technology (IJRMEET) UGC Approved id_47203
Vol. 5, Sp. Issue: 9, Sept.: 2017 (IJRMEET) ISSN: 2320-6586
494 Online International, Refereed, Impact factor & Indexed Monthly Journal www.raijmr.com RET Academy for International Journals of Multidisciplinary Research (RAIJMR)
Comparison Study About Physico-Chemical Analysis of Ground
Water Quality of Selected Two Talukas of Mehsana District.
(North Gujarat).
1Limbachiya M.C,
2Joshi D. N,
3Patel P. S,
4Solanki M.R
1, 2, 3, 4
R.R.Mehta College of Science & G D Modi College of Commerce, Palanpur (North
Gujarat), India.
Abstract:
Irrigation water samples were analyzed for Electrical Conductivity (EC), pH, Total Dissolved
Solids (TDS), cations (Ca+2
, Mg+2
, Na+ and K
+) and anions (CO3
-2, HCO3
-1, Cl
-1, and SO4
-2).
Various indices viz., Residual Sodium Carbonate (RSC), Sodium Adsorption Ratio (SAR) and
Soluble Sodium Percentage (SSP) were calculated from the estimated cations and anions
expressed in me / L.
In general, the well/tube well water samples of Mehsana district were slightly alkaline in reaction
(pH values 7.02 to 8.21), TDS values range from 270 to 1970 ppm in study area. The maximum
salt concentration was found in groundwater samples of Bechraji and Mehsana taluka .The
minimum concentration of CO3-2
was found in ground water samples of Bechraji taluka. For
HCO3-1
ions, the minimum concentration was found in ground water samples of in Bechraji
taluka. The minimum concentration of sulphate (SO4-2
) ion was found in ground water samples
of Bechraji taluka. The overall RSC values were ranged from -22.71 to 8.2 with mean value of
0.8825 me/L.
As per RSC values, the result show that 90 percent ground water samples of Bechraji taluka fall
under safe categories and only 10 percent ground water samples fall under unsafe categories.The
highest value of Na+1
/K+1
ratio was recorded in ground water samples of Bechraji taluka
Keywords: Ground Water, Residual Sodium Carbonate (RSC), Physico-Chemical.Sodium
Adsorption Ratio (SAR).
Introduction:
In India most of the population in dependent on ground water as the only source of drinking
water supply. The ground water is believed to be comparatively much clean and free form
pollution then surface water. But prolonged discharge of the industrial effluents, domestic of the
industrial effluents, domestic sewage and solid was dump caused the ground water to become
polluted and created health problemes[1]. Water is never found pure in nature. Rain water is the
nearest approach to chemically pure water, but it contains small account of organic matter and
dissolved gases,principally O2and Co2 taken from the air. Much of the current concern with
regards to environmental quality is focused on water because of its importance in maintaining the
human health and health of the ecosystem. Fresh water is finite resource, essential for
agriculture, industry and even human existence, without fresh water of adequate quantity and
quality, sustainable development will not be possible[2].
71 % of the Earth's surface is covered by water. Earth's surface water is held in two different
kinds of water bodies: Salt water bodies and Fresh water bodies.

International Journal of Research in Modern Engineering and Emerging Technology (IJRMEET) UGC Approved id_47203
Vol. 5, Sp. Issue: 9, Sept.: 2017 (IJRMEET) ISSN: 2320-6586
495 Online International, Refereed, Impact factor & Indexed Monthly Journal www.raijmr.com RET Academy for International Journals of Multidisciplinary Research (RAIJMR)
Fresh water resource is becoming day-by-day at the faster rate of deterioration of the water
quality is now a global problem[3].
The study area:
Mehsana district is situated in the northern part of the Gujarat state. Spreading over 4376.38
sq.km having ten talukas. This district is situated between 23o 0’ to 24
o 1’ N latitude and 72
o 0’
to 72o 50’ E longitude. It is bounded by Banaskantha district in North, Patan district in West,
Sabarkantha district in East and Ahmedabad, Gandhinagar district in South. Almost all the areas
of this district fall under arid and semi-arid climate. There is no any permanent river in this
district.
The groundwater is also very deep and salty forest is very rare, in this district. In northern part of
Mehsana district, single cropping is predominant cropping pattern double cropping is possible
only where irrigation facilities are available.The mean annual temp of the area is 260 C.The
maximum temperature in may being 440C.The average rain fall of the area is 25-303mm.
4
Material and Methods:
The underground well/tube well water samples from representative area were collected, filtered
and stored in the plastic bottle putting a layer of toluene and analyzed for major ion chemistry
employing the standard water quality procedure APHA.5,6
The methods used for analysis or
different constituents of water are as under:
Methods used for analysis of irrigation water:
The underground well/tube well water samples from representative area were collected, filtered
and stored in the plastic bottle putting a layer of toluene. The methods used for analysis or
different constituents of water are as under:
Characteristics Methods used Reference
pH pH meter
(Systronic India Ltd., Model type 322) Richard
(1954)
EC Electric Conductivity meter
(Systronic India Ltd., Model No. 303) Richard
(1954)
CO3-2 + HCO3
-1 Neutralization method
(Titrating against sulphuric acid) Richard
(1954)
Clˉ AgNO3 Titration
(Precipitation method) Richard
(1954)
SO4-2
Titration against standard Barium chloride
solution Vogel, A.I.
(1948)
Na+ Flame photometrically (Mediflame 127,
Systronic India Ltd., Sr. No. 2913) Richard
(1954)
K+ Flame photometrically (Mediflame 127,
Systronic India Ltd., Sr. No. 2913) Richard
(1954)
Ca+2 Versenate method
(Titration against EDTA solution) Richard
(1954)
Mg+2 Versenate method
(Titration against standard EDTA solution) Richard
(1954)
The following water quality indices were calculated by standard formulas for categorization
purpose.

International Journal of Research in Modern Engineering and Emerging Technology (IJRMEET) UGC Approved id_47203
Vol. 5, Sp. Issue: 9, Sept.: 2017 (IJRMEET) ISSN: 2320-6586
496 Online International, Refereed, Impact factor & Indexed Monthly Journal www.raijmr.com RET Academy for International Journals of Multidisciplinary Research (RAIJMR)
Soluble Sodium Percentage (SSP)
Soluble
Sodium
Percentage
=
Na+
Ca+2
+ Mg+2
+ Na+ + K
+
X 100
(Concentration of all cations are in me/L)
Sodium adsorption ratio (SAR):
Sodium adsorption ratio is calculated using the formula:
Na+
SAR = √ Ca
+2 + Mg
+2
2
(Concentration of all cations are in me/L)
Residual Sodium Carbonate (RSC)
The residual sodium carbonate may be calculated simply by substracting the quantity of Ca + Mg
from the sum total of carbonates and bi-carbonates determined separately in a given sample and
expressed in me/L.
Thus,
RSC = (CO3-2
+ HCO3-1
) – (Ca+2
+Mg+2
) (All ionic concentrations are in me/L)
Table - 1 Range and Average value of chemical constituents of underground well waters of
Becharaji taluka.
(Sample No. 1 to 20) Sr.
No. Characteristics Values
Minimum Maximum Average
1. EC dSm-1 at 25oC 0.4 6.15 3.22
2. pH 7.02 8.08 7.78
3. TDS 270 1970 1276.5
4. SSP 49.53 83.18 67.38
5. SAR 2.33 21.69 9.76
6. RSC -9.1 3.1 -3.08
Cations, me/L
7. Ca+2 + Mg+2 2.8 17.1 9.79
8. Na+1 2.75 47.5 21.9
9. K+1 0.0007 0.0179 0.005765

International Journal of Research in Modern Engineering and Emerging Technology (IJRMEET) UGC Approved id_47203
Vol. 5, Sp. Issue: 9, Sept.: 2017 (IJRMEET) ISSN: 2320-6586
497 Online International, Refereed, Impact factor & Indexed Monthly Journal www.raijmr.com RET Academy for International Journals of Multidisciplinary Research (RAIJMR)
Anions, me/L
10. CO3-2 0.00 0.8 0.28
11. HCO3-1 3.4 9.7 6.43
12. Cl-1 10 44 23.5
Table – 2 Range and Average value of chemical constituents of underground Well
waters of Mehsana taluka
(Sample No. 21 to 42). Sr.
No. Characteristics
Values Minimum Maximum Average
1. EC dSm-1 at 25oC 0.85 7.7 2.8
2. pH 7.23 8.01 7.69
3. TDS 570 1830 1110.46
4. SSP 52.27 75.82 66.21
5. SAR 3.95 14.95 9.28
6. RSC -22.2 3.7 -2.46
Cations, me/L
7. Ca+2 + Mg+2 4.5 30.5 10.5
8. Na+1 7 49 21.69
9. K+1 0.0025 0.0083 0.0059
Anions,me/L
10. CO3-2 0 1.2 0.5
11. HCO3-1 5.6 9.9 7.56
12. Cl-1 6 70 20.48
Table II and III give information about the quality of water in relation to their sodium
absorption ratio (SAR) and RSC Value.
Table – 3 Cationic and anionic percentage of the total ions Taluka –Bechraji
Sample No. 1 to 20 Sr.
No. Ions
(me/L) Values
Minimum Maximum Average 1. Ca+2 + Mg+2 2.8 17.1 9.79 2. Na+1 2.75 47.5 21.9 3. K+1 0.0007 0.0179 0.005765 4. CO3
-2 0.00 0.8 0.28 5. HCO3
-1 3.4 9.7 6.43 6. Cl-1 10 44 23.5

International Journal of Research in Modern Engineering and Emerging Technology (IJRMEET) UGC Approved id_47203
Vol. 5, Sp. Issue: 9, Sept.: 2017 (IJRMEET) ISSN: 2320-6586
498 Online International, Refereed, Impact factor & Indexed Monthly Journal www.raijmr.com RET Academy for International Journals of Multidisciplinary Research (RAIJMR)
Table – 4 Taluka- Mehsana
Sample No. 21 to 42 Sr.
No. Ions
(me/L) Values
Minimum Maximum Average 1. Ca+2 + Mg+2 4.5 30.5 10.5 2. Na+1 7 49 21.69 3. K+1 0.0025 0.0083 0.0059 4. CO3
-2 0 1.2 0.5 5. HCO3
-1 5.6 9.9 7.56 6. Cl-1 6 70 20.48
Mean cation composition in different EC classes are given in Table III. The result shows that
Na+ and Ca
+2 + Mg
+2, ions increased with the salinity, but K
+ ion decreased in C4 class of EC in
Bechraji taluka.
The concentration of Na+, Ca
+2 + Mg
+2 ions regularly increased with salinity but and K
+ ion
decreased in C4 class of EC in ground water samples of Vijapur taluka of Mehsana district. Such
observations were also recorded by Timbadiya and Paliwal et al. (1975) and Patel et al. (1993) in
ground water samples of three talukas of Mehsana district.
Mean cation composition in different EC classes Taluka Bechraji
Sample No: 1 to 20
Sr.
No. Cations (me/L)
EC in dSm-1
0.0-0.25
(C1)
0.25-0.75
(C2)
0.75-2.25
(C3)
2.25-5.0
(C4)
1. Na+1
- 2.75 11.6875 25.89
2. K+1
- 0.0025 0.007 0.0057
3. Ca+2
+ Mg+2
- 2.8 4.575 11.64
Taluka- Mehsana
Sample No. 21 to 42
Sr.
No. Cations (me/L)
EC in dSm-1
0.0-0.25
(C1) 0.25-0.75
(C2) 0.75-2.25
(C3) 2.25-5.0
(C4) 1. Na+1 - - 21.125 22.66 2. K+1 - - 0.0058 0.0061 3. Ca+2 + Mg+2 - - 10.62 10.29
In bechraji taluka, the concentration of CO3-2
, HCO3-1
and Cl-1
varied from 0.0 to 0.8, 3.4 to 9.7
and 10.0 to 44.0 me/L with the mean values of 0.28, 6.43 and 23.5 me/L, respectively (Table
4.5).In Mehsana taluka, the concentration of these anions varied from 0.0 to12, 5.6 to 9.9 and 6
to 70 me/L with the mean value of 0.5 and 7.56 and 20.48 me/L respectively
Results and Discussion:
As per experimental data, the water of Bechraji taluka of Mehsana District has high to very high
salinity (EC of 0.4 to 4.15) and low sodium hazard (2.33 to 21.69 SAR Value) and probably safe
to unsafe limits of RSC (-9.1 to 3.1).Only 9.09% as doubt to unsafe (unsuitable) for irrigation

International Journal of Research in Modern Engineering and Emerging Technology (IJRMEET) UGC Approved id_47203
Vol. 5, Sp. Issue: 9, Sept.: 2017 (IJRMEET) ISSN: 2320-6586
499 Online International, Refereed, Impact factor & Indexed Monthly Journal www.raijmr.com RET Academy for International Journals of Multidisciplinary Research (RAIJMR)
.Unsuitable irrigation water not only reduces the crop growth but also affects the chemical
characteristics of the soil in which the crop is growing.
Out of twenty two samples of Mehsana taluka, about Foutteen samples fall under C3 class, eight
samples fall under C4 class and as per USSL classification. None of sample falls under C1 class
in Mehsana taluka. As per Kanwar's and Ramamoorthy's classification, 2 9 and 11 samples fall
under C5, C4 and C3 classes, respectively.
From the above results, it can be concluded that most of the ground water samples fall under
C3class in Mehsana taluka. About 61 percent samples fall under C3 class in Bechraji, Mehsana
taluka. and 6 percent ground water samples fall under C2 class in Bechraji,Mehsana,taluka. The
ground water of Bechraji and Mehsana taluka is more salineThe ground water of Bechraji taluka
had very high salinity maximum number of ground water samples in high to very high salinity
(C3 and C4 class). A very high proportion of sodium in these water samples is also reflected in
the Eton's (1935) classification. Based on Soluble Sodium Percentage (SSP) classification,
maximum numbers of ground water samples i.e., about 5 percent samples fall under SSP class I
(0.0 – 50.0) in Bechraji taluka. In ground water samples of Mehsana taluka 13 samples fall under
class III. As per value of RSC, ground water of Bechraji and Mehsana taluka was mostly found
free from RSC hazards and maximum quantity of underground water of Kadi taluka of Mehsana
district was found unsafe for irrigation purpose.
References:
1. Raja R E, Lydia Sharmila, J.Princy Merlin, Chritopher G, (2002) Physico-Chemical
Analysis of some Ground water samples of KotputliTown Jaipur,Rajasthan, Indian J
Environ Prot., 22(2), 137.
2. Kumar N, (1997) A View on Freshwater environment, Ecol. Env & Cons. 3, (3-4).
3. Mahananda H.B, Mahananda M.R, and. Mohanty B.P, (2005). Studies on the Physico-
chemical and Biological Parameters of a Fresh Water Pond Ecosystem as an Indicator of
Water Pollution. Ecol. Env & Cons.11 (3-4), pp 537-541.
4. Limbachiya M.C.,Patel K.C.Nimavat K.S., and Vyas K.B.,Study on quality of irrigation
water of vijapur talukas of mehsana disrtrict.Gujarat India.Elixir
Appl.Chem.40(2011):5471-5473.
5. Standard method for examination of water and waste water ,”American public health
Association”,Washington DC.,18th
edition.,1962:p.1134
6. Standard method for examination of water and waste water ,”American public health
Association”,Washington DC.,18th
edition .,1995:2-4,29-179.

International Journal of Research in Modern Engineering and Emerging Technology (IJRMEET) UGC Approved id_47203
Vol. 5, Sp. Issue: 9, Sept.: 2017 (IJRMEET) ISSN: 2320-6586
SYNTHESIS, CHARACTERIZATION AND BIOLOGICAL EVALUATION OF SOME
AZETIDINONES DERIVATIVES CONTAINING HYDRAZIDE MOEITIES
Milankumar Arjunbhai Sharda, Dr.G.D.Acharya
Department of chemistry,
RR.Mehta College of Science & C.L.Parikh College of Commerce, Palanpur
E-mail - [email protected]
ABSTRACT
N-arylidene derivatives(3a-h) was synthesized using Naphtho[2,1-b]furan-2-
carbohydrazide (1) react with aromatic aldehydes (2a-h). Further cyclocondensation reaction
between compounds (3a-h) with chloroacetyl chloride yields desired compoundsViz N-(3-chloro-2-
oxo-4-phenylazetidin-1-yl)naphtho[2,1-b]furan-2-carboxamide4(a-h). The characterization of these
compounds was carried outby using analytical and spectral analysis. Also synthesized compounds
were examined for their antimicrobial activities. The results show good to moderate antimicrobial
activity for all compounds.
KEY WORDS:Naphtho[2,1-b]furan-2-carbohydrazide, Azetidinones, Arylidine derivatives,
Antimicrobial activity, Spectral Studies.
INTRODUCTION
Heterocyclic compounds extensivelyfound in nature and also synthesized were studiedfor
their wide variety of biological activities [1-3]. Many naturally occurring and synthetic compounds
contain hydrazide as a basic moiety, which posses interesting pharmaceutical, agricultural and
industrial properties [4-6]. Hydrazide and its derivative are well known for their extensive biological
activities such as antibacterial, antifungal, antitubercular, anti-cancer, anti-inflammatory anti-
consuvalentactivity [7-10].
Since the first discovery of the β-lactams by Staudinger, the interest continued for these
derivatives because of the pharmalogical significance of β-lactam antibiotics along with finding of
500 Online International, Refereed, Impact factor & Indexed Monthly Journal www.raijmr.com RET Academy for International Journals of Multidisciplinary Research (RAIJMR)

International Journal of Research in Modern Engineering and Emerging Technology (IJRMEET) UGC Approved id_47203
Vol. 5, Sp. Issue: 9, Sept.: 2017 (IJRMEET) ISSN: 2320-6586
501 Online International, Refereed, Impact factor & Indexed Monthly Journal www.raijmr.com RET Academy for International Journals of Multidisciplinary Research (RAIJMR)
naturally occurring β-lactams. A vast research has been carried out over the years for the chemistry
of azetidinones which continues as an emerging field [11,12]. As a result many of azetidinone
derivatives found diverse therapeutic applications such as antibacterial, antifungal, antitubercular,
anti-cancer, anti-inflammatory, and antihypertensive [13-17].
In search of biological active compounds merge both of azetidinone and hydrazide moieties
which may enhance the biological activity of compounds. Hence the present communication
comprises the synthesis and characterization of new azetidinone derivatives based on N-arylidine
derivatives. Also the antimicrobial evaluation were carried out for all compounds against different
bacterial and fungal strains. The general procedure for targeted compounds is shown in Scheme-1.

International Journal of Research in Modern Engineering and Emerging Technology (IJRMEET) UGC Approved id_47203
Vol. 5, Sp. Issue: 9, Sept.: 2017 (IJRMEET) ISSN: 2320-6586
502 Online International, Refereed, Impact factor & Indexed Monthly Journal www.raijmr.com RET Academy for International Journals of Multidisciplinary Research (RAIJMR)
MATERIALS AND METHODS
Melting points were determined in open capillary tubes and were uncorrected. The IR
spectra were recorded in KBr pellets on a Nicolet 400D spectrometer and 1H NMR spectra were
recorded in DMSO with TMS as internal standard on a Bruker spectrometer at 400 MHz. LC-MS of
selected samples taken on LC-MSD-Trap-SL-01046.
All the chemicals were laboratory grade and purchased from local market. naphtho[2,1-
b]furan-2-carbohydrazide was prepared by reported method [18],While the synthesis of N-arylidene
derivatives were carried out according to our previous report [19]. The yields, melting points and
elemental analysis data of arylidene derivatives are given in Table -1.
PreparationN-(3-chloro-2-oxo-4-phenylazetidin-1-yl)naphtho[2,1-b]furan-2-carboxamide (4a-h):
A mixture of arylidine derivatives (3a-h) and triethyl amine (TEA) was dissolved in 1,4-
dioxane and stirred well at 0-5 °C. To this well-stirred cooled solution drop wise addition of
chloroacetyl chloride was carried. The mixture was then allowed stirring for 3-4 hours and further
left at room temperature for 24 hours. The resultant mixture was concentrated, cooled, poured into
ice-cold water, and then air-dried. Further the products were recrystallized using ether and n-
hexane. The final products (4a-h) were obtained in good yield. The physical and elemental results of
compounds (4a-e) are displayed in Table -2.
Scheme-1

Tab
le: 1
Ph
ysic
al a
nd
Ele
me
nta
l An
alys
is o
f C
om
po
un
ds
(3a-
h)
Co
mp
d.
Mo
lecu
lar
form
ula
(Mo
l.w
t.)
LC-M
S
Dat
a Y
ield
M
.P.*
0C
Ele
me
nta
l An
alys
is
%C
%
H
%N
Fou
nd
C
alcd
. Fo
un
d
Cal
cd.
Fou
nd
C
alcd
.
3a
C2
0H
14N
2O
2
(31
4)
31
5
66
1
78
-18
0
76
.40
7
6.4
4
.47
4
.4
8.8
9
8.9
3b
C
21H
16N
2O
2
(32
8)
32
4
64
1
75
-17
6
76
.79
7
6.8
4
.90
4
.9
8.5
1
8.5
3c
C2
1H
16N
2O
2
(32
8)
32
7
63
1
81
-18
3
76
.80
7
6.8
4
.88
4
.9
8.5
1
8.5
3d
C
20H
14N
2O
3
(33
0)
33
3
65
1
76
-17
8
72
.69
7
2.7
4
.25
4
.2
8.4
6
8.4
3e
C
20H
14N
2O
3
(33
0)
33
6
67
1
82
-18
4
72
.71
7
2.7
4
.26
4
.2
8.4
7
8.4
3f
C2
1H
16N
2O
3
(34
4)
34
1
65
1
67
-16
8
73
.22
7
3.2
4
.66
4
.6
8.1
0
8.1
3g
C2
1H
16N
2O
3
(34
4)
34
8
63
1
73
-17
4
73
.22
7
3.2
4
.67
4
.6
8.1
2
8.1
3h
C
20H
13N
2O
2C
l
(34
8.5
) 3
53
6
3
18
0-1
82
6
8.8
6
68
.8
3.7
4
3.7
8
.01
8
.0
* U
nco
rrec
ted
503 Online International, Refereed, Impact factor & Indexed Monthly Journal www.raijmr.com RET Academy for International Journals of Multidisciplinary Research (RAIJMR)
International Journal of Research in Modern Engineering and Emerging Technology (IJRMEET) UGC Approved id_47203
Vol. 5, Sp. Issue: 9, Sept.: 2017 (IJRMEET) ISSN: 2320-6586

Tab
le:2
Ph
ysic
al a
nd
Ele
me
nta
l An
alys
is o
f C
om
po
un
ds
(4a-
h)
*Un
corr
ecte
d
Co
mp
d.
Mo
lecu
lar
form
ula
(Mo
l.w
t.)
Yie
ld
M.P
.*
0C
Ele
me
nta
l An
alys
is
%C
%
H
%N
Fo
un
d
Cal
cd.
Fou
nd
C
alcd
. Fo
un
d
Cal
cd.
4a
C2
2H
15C
lN2O
3
(39
0)
65
2
25
-22
6
67
.61
6
7.5
3
.87
3
.8
7.1
7
7.1
4b
C
23H
17C
lN2O
3
(40
4)
62
2
10
-21
2
68
.23
6
8.2
4
.23
4
.2
6.9
2
6.9
4c
C2
3H
17C
lN2O
3
(40
4)
61
2
05
-20
6
68
.23
6
8.2
4
.23
4
.2
6.9
2
6.9
4d
C
22H
15C
lN2O
4
(40
6)
67
2
20
-22
1
64
.95
6
4.9
3
.72
3
.7
6.8
9
6.8
4e
C
22H
15C
lN2O
4
(40
6)
64
2
02
-20
3
64
.95
6
4.9
3
.72
3
.7
6.8
9
6.8
4f
C2
3H
17C
lN2O
4
(42
0)
65
1
99
-20
1
65
.64
6
5.6
4
.07
4
.0
6.6
6
6.6
4g
C2
3H
17C
lN2O
4
(42
0)
68
1
95
-19
7
65
.64
6
5.6
4
.07
4
.0
6.6
6
6.6
4h
C
22H
14C
l 2N
2O
3
(42
5)
55
2
11
-21
2
62
.13
6
2.1
3
.32
3
.3
6.5
9
6.6
International Journal of Research in Modern Engineering and Emerging Technology (IJRMEET) UGC Approved id_47203
Vol. 5, Sp. Issue: 9, Sept.: 2017 (IJRMEET) ISSN: 2320-6586
504 Online International, Refereed, Impact factor & Indexed Monthly Journal www.raijmr.com RET Academy for International Journals of Multidisciplinary Research (RAIJMR)

International Journal of Research in Modern Engineering and Emerging Technology (IJRMEET) UGC Approved id_47203
Vol. 5, Sp. Issue: 9, Sept.: 2017 (IJRMEET) ISSN: 2320-6586
505 Online International, Refereed, Impact factor & Indexed Monthly Journal www.raijmr.com RET Academy for International Journals of Multidisciplinary Research (RAIJMR)
BIOLOGICAL SCREENING
Antibacterial activities
The antibacterial activities of all the compounds were studied against gram-positive bacteria and
gram-negative bacteria at a concentration of 50μg/ML by agar cup plate method. A methanol system
was used as control in this method. Similar conditions using tetracycline as a control was used standard
for comparison. The area of inhibition of zone measured in mm. Some compounds were found more
toxic for Bacillus subtilis and E.coli bacterial strains, while for other bacterial strains the compounds
shows moderate activity compare to standard drug used (Table -3).
Table: 3 Antibacterial Activities of Compounds (4a-h)
Compounds Gram +Ve Gram -Ve
Staphylococcus aureus Bacillus subtilis E.coli Klebsiella promioe
4a 44 64 63 62
4b 40 61 59 57
4c 42 65 57 50
4d 44 72 70 61
4e 46 74 71 65
4f 41 69 67 68
4g 43 70 69 70
4h 40 57 62 63
Tetracycline 57 76 74 84
Antifungal Activities
The fungicidal activity of all the compounds was studied at 1000 ppm concentration in vitro.
Plant pathogenic organisms used wereBotrydepladia thiobromine, Nigrospora Sp, Aspergillus niger and

International Journal of Research in Modern Engineering and Emerging Technology (IJRMEET) UGC Approved id_47203
Vol. 5, Sp. Issue: 9, Sept.: 2017 (IJRMEET) ISSN: 2320-6586
506 Online International, Refereed, Impact factor & Indexed Monthly Journal www.raijmr.com RET Academy for International Journals of Multidisciplinary Research (RAIJMR)
Rhizopus nigricum. The antifungal activities of all the compounds (4a-h) were measured on each of these
plant pathogenic strains on a potato dextrose agar (PDA) medium. Such a PDA medium contained
potato 200g, dextrose 20g, agar 20g and water 1c. Five days old cultures were employed. The
compounds to be tested were suspended (1000ppm) in a PDA medium and autoclaved at 120o C for 15
min. at 15atm. pressure. These media were poured into sterile Petri plates and the organisms were
inoculated after cooling the Petri plates. The percentage inhibition for fungi was calculated after five
days using the formula given below:
Percentage of inhibition = 100(X-Y) / X
Where, X = Area of colony in control plate
Y = Area of colony in test plate
The fungicidal activity displayed by various compounds (4a-h) is shown in Table-4.
Table: 4 Antifungal Activities of Compounds (4a-h)
Zone of Inhibition at 1000 ppm (%)
Compounds Nigrospora Sp. Aspergillus
Niger Botrydepladia Thiobromine Rhizopus Nigricum
4a 74 77 64 69
4b 68 70 62 64
4c 69 72 60 62
4d 70 73 61 65
4e 70 76 63 67
4f 68 74 60 64
4g 66 72 57 61
4h 65 70 55 60

International Journal of Research in Modern Engineering and Emerging Technology (IJRMEET) UGC Approved id_47203
Vol. 5, Sp. Issue: 9, Sept.: 2017 (IJRMEET) ISSN: 2320-6586
507 Online International, Refereed, Impact factor & Indexed Monthly Journal www.raijmr.com RET Academy for International Journals of Multidisciplinary Research (RAIJMR)
RESULTS AND DISCUSSION
Condensation reaction between Naphtho[2,1-b]furan-2-carbohydrazide (1) react with aromatic
aldehydes (2a-h) resulted into the different N-arylidine derivatives (3a-h). Further reaction of these N-
arylidine derivatives (3a-h) withchloroacetyl chloride in presence of 1,4-dioxane gives targeted
compounds in good yields i.e. N-(3-chloro-2-oxo-4-phenylazetidin-1-yl)naphtho[2,1-b]furan-2-
carboxamide (4a-h). IR spectra showing an essential absorption band at 3435 cm-1(N-H),1240 cm-1(C-O),
3030-3080cm-1 (C-H of Ar.),1690cm-1(CONH),2815-2850cm-1(-OCH3),2950,1370cm-1(-CH3).1H NMR:7.53-
8.56(12H,m,Ar-H),11.6-11.9(1H,s,CONH),8.4-8.6(1H,s,N=CH),3b;2.28(3H,s,CH3),3c;2.32(3H,s,CH3), 3d;
5.10(1H,s,-OH),3e; 5.23(1H,s,-OH),3f; 3.84(3H,s,-OCH3), 3g; 3.85(3H,s,-OCH3).The C, H, N analysis data of
all compounds are presented in Table -1.
The experimental C,H,N data of newly prepared (4a-h)(Table-2) were in very good agreement
with predicted structure (Scheme-1)were further supported by the IR spectra showing an absorption
bands at1735-1750 cm-1 (C=O of β-lactam), 3030-3080 cm-1(C-H, of Ar.), 1725,1675 cm-1 (-
CO,CONH),3410-3425(N-H),1240-1250 (C-O), 2815-2850 cm-1 (-OCH3), 2950,1370 cm-1 (-CH3)for (4a-h)
compound.
1H NMR:5.3, 5.8 (2H, s, β-lactam of azitidinone), 11.2-11.4 (1H, s,-CONH),4b; 2.29 (3H,s,-CH3), 4c; 2.35
(3H,s,CH3), 4d; 5.21 (1H,s,-OH), 4e; 5.27 (1H,s,-OH),4f; 3.94 (3H,s,-OCH3), 4g; 3.91 (3H,s,-OCH3). The C, H,
N, S analysis data of all compounds are presented in Table-2.
CONCLUSION
The final products were prepared by using condensation of N-arylidine derivatives with
chloroacetyl chloride and further characterization carried out by using elemental, IR and NMR analysis.
The elemental analyses are well matched with the predicted structure as shown in scheme-1 while the
IR analyses shows essential peaks to support the probable structure of synthesized compounds.The
antimicrobial activity possess good to moderate activity against employed strains.

International Journal of Research in Modern Engineering and Emerging Technology (IJRMEET) UGC Approved id_47203
Vol. 5, Sp. Issue: 9, Sept.: 2017 (IJRMEET) ISSN: 2320-6586
508 Online International, Refereed, Impact factor & Indexed Monthly Journal www.raijmr.com RET Academy for International Journals of Multidisciplinary Research (RAIJMR)
ACKNOWLEDGEMENT
The authors are thankful to Dr.---------------, Head, Department of Chemistry, for providing
laboratory facilities.
REFERENCES
[1].M.S. Saini, A. Kumar, J. Dwivedi and R. Singh, Inter. J. Pharm. Sci. Res., 4, 66 (2013).
[2]. S. V. Hote and S. P. Bhoyar, IOSR J. Appl. Chem., 1, 43 (2014).
[3]. R. Dua, S. Shrivastava, S. K. Sonwane and S. K. Srivastava, Adv. Biol. Res. 5, 120 (2011).
[4]. R. A. Rane, N. K. Sahu, C. P. Shah and N. K. Shah. J. Enzyme Inhib. Med. Chem., 29,
401 (2013).
[5]. R. M. Mohare, D. H. Fleit and O. K. Sakk. Mol., 16, 16 (2010).
[6]. M. N. Koopaei, M. J. Assarzadeh, A. Almasirad, S. F. Ghasemi-Niri, M. Amini, A. Kebriaeezadeh, N. N.
Koopaei, M. Ghadimi and A. Tabe, Iran. J. Pharm. Res., 12, 721 (2013).
[7]. N. Kumar and L. Singh, Int. J. Cli. Pharm. Res., 7, 154 (2015).
[8]. R. Narang, B. Narasimhan and S. Sharma, Curr. Med. Chem., 19, 569 (2012).
[9]. T. Nasr, S. Bondoc and M. Youns, Euro. J. Med. Chem., 76, 539 (2014).
[10].M. Kim, S. Lee, E. B. Park, K. J. Kim, H. H. Lee, J. S. Shin, K. Fischer, A. Koeberle,
O. Werzd, K. T. Lee and J. Y. Lee, Bioorg. Med. Chem. Lett., 1, 94 (2016).
[11]. H. Staudinger, Commun. Liebigs Ann. Chem., 51, 356 (1907).
[12]. D. S. Salunkhe and P.B. Piste, Int. J. Pharm. Sci. Res., 4, 666 (2014).
[13]. A. Deep, P. Kumar, B. Narasimhan, S. M. Lim, K. Ramasamy, R. K. Mishra and V.
Mani, Acta Poloniae Pharm. Drug Res., 73, 65 (2016).
[14]. S. D. Joshi, U. A. More, D. Parkale, T. M. Aminabhavi, A. K. Gadad, M. N.
Nadagouda and R. Jawarkar, Med. Chem. Res., 24, 3892 (2015).

International Journal of Research in Modern Engineering and Emerging Technology (IJRMEET) UGC Approved id_47203
Vol. 5, Sp. Issue: 9, Sept.: 2017 (IJRMEET) ISSN: 2320-6586
509 Online International, Refereed, Impact factor & Indexed Monthly Journal www.raijmr.com RET Academy for International Journals of Multidisciplinary Research (RAIJMR)
[15]. M. W. Majewski, K. D. Watson, S. Cho, P. A. Miller, S. G. Franzblau and M. J.
Miller, Med. Chem. Commu., 7, 141 (2016).
[16]. S. K. Gupta, A. Mishra, Anti-inflammatory & Anti-allergy Agents in Med. Chem., 15,
DOI: 10.2174/1871523015666160210124545, (2015).
[17]. N. Singh, R. C. Agarwal and C. P. Singh, J. Chem. Pharm. Res., 4, 5185 (2012).
[18]. P.J. Shah, H.S. Patel and B.P.Patel, J. Saudi. Chem. Soc.,17, 307 (2013).
[19]. First paper reference

International Journal of Research in Modern Engineering and Emerging Technology (IJRMEET) UGC Approved id_47203
Vol. 5, Sp. Issue: 9, Sept.: 2017 (IJRMEET) ISSN: 2320-6586
510 Online International, Refereed, Impact factor & Indexed Monthly Journal www.raijmr.com RET Academy for International Journals of Multidisciplinary Research (RAIJMR)
A Study of Salinity of ground water in some semi-arid tracts in
Kheralu Taluka of Gujarat
M.R.Solanki1, M.C.Limbachiya
Department of Chemistry, R. R. Mehta College of Science and C. L. Parikh
College of Commerce, Palanpur, Gujarat.
Abstract
Because of the insufficiency of water resources and serious environment, it becomes
much more mergence to develop the water saving agricultureThe northern part of Gujarat
state may be classified as a semi-arid region because most of the area receiving low rainfall.
About fiftysamples of ground water were collected from different tracts in Kheralu regions
during pre-monsoon2015,post-monsoon 2015 and pre-monsoon 2016 and tested for their EC
and PHvalues. These water samples were further tested for cations and anions. The data
obtainwere used for classification of water into different categories on the basis of EC
(ElectricalConductivity).In general it was found that there was no area having EC within 250
micromhos/cm in ground water during year 2015-16. Thus, the water quality has improved
duringpre-monsoon 2016, as compared to pre-monsoon 2015 due to the recharging of ground
waterby high rainfall in year 2015.
Key words: Water Analysis, Salinity, Electrical Conductivity.
Introduction
Soil salinization and soil water pollution were great concerned with fast development
in Northern part of Gujarat.Water is an elixir part of our lifeit is a universal solvent. [1] and it
dissolves the minerals from the rock in which, it isstored and thus chemical and physical
parameters of a particular area will be changed. Tillsome time ago, the quality of ground
water was considered to be relatively very good incomparison to surface water[2-3].
Handa[4]has carried out ground water contamination studies invarious parts of the country.
Study on ground water quality with respect to drinking,irrigation, and industrial purposes
have been carried out in different part of India [5-7]Underground water in North Gujarat have
diversity of quality problems. Ground water whichis always in motion interacts with the
subsurface environment during this movement. Itdissolves transports and deposits mineral
matter. The health and economic prosperity ofcommunity rest on the supply of clean water to
individual. In our Nation, it is estimated thatabout 75 million work days are lost every year
due to water related diseases. The quality of ground water varies from place to place.
In the arid and semi-arid region, majority of ground water are of poor quality. i.e.
eithersaline or alkali. Soil degradation through salination has seriously affected the
productivity ofover 1.214 Mha of land in Gujarat state out of which 55 percent of the area
comes undermoderately to highly saline which is unsuitable for cultivation of the crops. The
remaining 45percent area has low to moderately salinating problems. The problems related
with waterquality are more servers in North Gujarat.
Quality of irrigation water is one of the main factors to be understood in irrigated
agriculture. Injudicious irrigations even with good quality water turn much agriculturally
good soil in toSaline or alkali condition. Quality of water is an important consideration in any
appraisal ofsalinity or alkali conditions in an irrigated area. Generally all irrigation water that
have beenused for successfully for a long period have a conductivity value less than 2250
micromhos/cm. Water of higher conductivity may be used with suitable amendments

International Journal of Research in Modern Engineering and Emerging Technology (IJRMEET) UGC Approved id_47203
Vol. 5, Sp. Issue: 9, Sept.: 2017 (IJRMEET) ISSN: 2320-6586
511 Online International, Refereed, Impact factor & Indexed Monthly Journal www.raijmr.com RET Academy for International Journals of Multidisciplinary Research (RAIJMR)
andprecautions, but under normal conditions they are harmful to the soil structure and
theircontinuous use will result in salinity hazard, with ultimate effect on plant growth.
Salinityhazards affect the plant through the effects of excessive salts and osmotic pressure of
soilsolution which restricts the water and nutrient absorption. The first effect of salinity
underfield situation is the reduction in germination. The salt concentration are measure in
terms of
micro mhos/cm (or dsm-1), mg /L (ppm) and meq/L.
Materials and Methods
Experimental
The northern part of Gujarat state may be classified as a semi arid region. The mean
annualtemperature of the area is 27.0ºc. The maximum temperature in May being 43ºc.
Theaverage annual rainfall of the area is 26-32″there being fairly wide variation from year
toyear. There is no any permanent river in this region. The ground water is also very deep
There is under study some areain Kheralu taluka in Mehsana district of North
Gujarat.The area is a semi arid region. The major water resources of the area are wells and
tube wells.
During the year 2015-2016, about 42 ground water samples were collected during
pre-monsoon2015, 48 samples during post monsoon 2015, and about fifty (50) samples
duringpre-monsoon 2016. The samples collected from the wells were analyzed for major
ionchemistry, employing the standard water quality procedures APHA [8-9]. pH and
electricconductance were measured usingpH and EC meter. Total dissolved solids were
computed bymultiplying the EC by conversion factor 0.65 as suggested by Hem [10]. Total
hardness asCaCO3 was measured by using standard EDTA solution. Mg was calculated
taking thedifference of TH and ca. Chloride was determined volumetric method using
standard AgNO3solution. Sulphate was estimated through turbidimetric method. Table-1
presents the resultsof some typical ground water samples. The data obtained were used for
classification ofwater into different categories on the basis of electrical conductivity(EC).
Table-1 : Chemical properties of ground water in some semi-arid tracts of North
Gujarat during year 2015-16.
SR
No.
EC.
Dsm-1
at 25°c
TDS
(ppm)
PH
mg / L.
Ca+2
Mg+2
Na+1
K+1
CO3-2
HCO3-1
Cl-1
SO4-2
1 2.02 989 8.20 2.5 3.2 11.5 0.06 1.8 4.5 9.1 1.8
2 0.80 721 8.46 1.2 1.0 14.2 0.05 0.4 7.8 8.9 4.6
3 1.82 772 8.06 1.0 1.3 15.3 0.03 1.0 6.4 7.7 9.2
4 1.75 784 8.01 1.7 0.9 12.5 0.01 0.8 10.2 11.3 7.5
5 2.39 875 8.87 1.9 2.1 6.7 0.03 0.4 7.3 8.7 4.6
6 2.47 947 8.11 1.9 2.0 10.3 0.01 0.6 7.6 8.9 1.8
7 4.24 1049 7.09 2.9 2.6 5.3 0.06 1.6 9.2 21.4 1.7
8 4.46 1200 8.49 3.4 3.3 16.7 0.05 1.2 4.6 23.1 11.1
9 3.31 689 8.22 1.5 1.4 14.6 0.04 0.5 3.8 7.4 4.9
10 4.04 931 7.08 3.1 1.9 8.8 0.01 2.1 9.38 11.8 6.7

International Journal of Research in Modern Engineering and Emerging Technology (IJRMEET) UGC Approved id_47203
Vol. 5, Sp. Issue: 9, Sept.: 2017 (IJRMEET) ISSN: 2320-6586
512 Online International, Refereed, Impact factor & Indexed Monthly Journal www.raijmr.com RET Academy for International Journals of Multidisciplinary Research (RAIJMR)
Table-2to Table-4 gives an information about the distribution of samples under
variousranges of salinity in the ground water during the pre-monsoon 2015, post
monsoon 2015 and pre- monsoon 2016[10-15]
Table-2 : Distribution of ground water samples , under various ranges of salinity
During the Pre-monsoon 2015
Sr.
No
Electrical
Conductivity
In m mhos/cm.
Pre-monsoon 2015
Number of samples % of samples
1 0-250 Nil Nil
2 250-750 01 2.35
3 750-2250 21 50.64
4 2250-5000 16 37.46
5 >5000 04 9.55
Table-3 : Distribution of ground water samples , under various ranges of salinity
During the Post-monsoon 2015
Sr.
No
Electrical
Conductivity
In m mhos/cm.
Post-monsoon 2015
Number of samples % of samples
1 0-250 Nil Nil
2 250-750 01 2.11
3 750-2250 29 61.20
4 2250-5000 15 30.24
5 >5000 03 6.45
Table 4: Distribution of ground water samples, under various ranges of salinity. During
the Pre-monsoon 2016
Sr.
No
Electrical
Conductivity
In m mhos/cm.
Pre-monsoon 2016
Number of samples % of samples
1 0-250 Nil Nil
2 250-750 01 2.0
3 750-2250 28 55
4 2250-5000 17 35
5 >5000 04 8
Results and Discussion
The quality of water is influenced by the nature of rock minerals through which it
passes. Itmay undergo changes due to ion exchange, dissolution of salts, and hydrolysis of
materials ofthe rocks, as well as the surface soils. The total concentration of soluble salts as
measured byelectrical conductivity. The categories of water on the basis of their electrical
conductivity areas follows: (Table-5)

International Journal of Research in Modern Engineering and Emerging Technology (IJRMEET) UGC Approved id_47203
Vol. 5, Sp. Issue: 9, Sept.: 2017 (IJRMEET) ISSN: 2320-6586
513 Online International, Refereed, Impact factor & Indexed Monthly Journal www.raijmr.com RET Academy for International Journals of Multidisciplinary Research (RAIJMR)
Table-5 : Classification of water
Sr.
No
Electrical
Conductivity
In m mhos/cm. at
250C
Category
1 0-250 Excellent
2 250-750 Good
3 750-2250 Permissible
4 2250-5000 Doubtful
5 >5000 Unsafe
It can be seen from the above tables that there was no sample having EC within 250
micromhos/cm in ground water during year 2015-16. During pre-monsoon 2015, 2.35
percentwater samples had EC values between 250 to 750 micro mhos/cm which was slightly
decreased to 2.11percent during post monsoon 2015 and it was again slightly decreased to2.0
percent during pre-monsoon 2016. There was 50.64 percent samples having EC Between750
to 2250 micro mhos/cm during pre monsoon 2015 it was increased to 61.20 percentduring
post-monsoon 2015and it was again decreased to 55.0 percent during pre monsoon2016.
There was 50.64 percent samples having EC Between 2250-5000 micro mhos/cmduring pre
monsoon 2015. It was decreased to 30.24percent during post monsoon 2015. Andit was
increased to 35.0 percent during pre monsoon 2016. There was 9.55 percent watersamples
having EC more than 5000 micro mhos/cm during pre monsoon 2015. It wasdecreased to
6.45percent during post monsoon 2015 and again it was increased to 8.0 percentduring pre-
monsoon 2016
Conclusion
The water quality has improved during pre monsoon 2016, as compared to pre
monsoon 2015in North Gujarat due to the recharging of ground water by high rainfall in year
2015.
References
[1] Chiew, F. H. S., and T. A. McMahon. 1991. Groundwater recharge from rainfall and
irrigation in the Campaspe River Basin. Australian Journal of Soil Research 29:651–70.
[2] So, H. B., and L. A. G. Aylmore. 1993. How do sodic soils behave? The effect of sodicity
on soil physical behavior. Australian Journal of Soil Research 31:761–77.
[3] Bhat D. M., and Hegde G. R., IJEH, 1997, 39, 61.
[4] Handa B. K., Ground Water Contamination in India Key Paper Regional Workshop on
Environmental Aspects of Ground Water Development, Kurrukshetra1994, Oct. 17-19.
[5]Kitamura Y., Tomohisa Y., Toshimasa H., et al.. Agricultural Water Management, 2006,
85:1-14.
[6] Majmudar D. and Gupta N., IJEH, 2002, 42, 28.
[7] Kurshid S. H., Hussain H. and Zabeerudein, Indian J. Appl. Hydrology, 2002, V(XV), 30.
[8] APHA, Standard methods for the examination of water and waste water; Washington
USA, (1995).
[9] Standard Method for Examination of Water and Waste Water American Public Health

International Journal of Research in Modern Engineering and Emerging Technology (IJRMEET) UGC Approved id_47203
Vol. 5, Sp. Issue: 9, Sept.: 2017 (IJRMEET) ISSN: 2320-6586
514 Online International, Refereed, Impact factor & Indexed Monthly Journal www.raijmr.com RET Academy for International Journals of Multidisciplinary Research (RAIJMR)
Association, Washington DC, 18th Edition, 1992, pp. 1134.
[10] Hem J.D., Study and interpretation of the Chemical Characteristics of Natural Waters
2254, Scientific Publisher, Jodhpur, 1991.
[11] Abbasi S.A., A method manual by Water Quality „sampling and Analysis: Discovery
publishing house New Delhi, 1998.
[12] Annual Reports: Soil Survey Division, Govt. of Gujarat, Gandhinagar.
[13] Durga Prasad N. K. and Sankarapitchaiah. P, . Inland water Resources: India. Discovery
Publishing House. New Delhi.
[14] Water and Salinity Balances for Irrigated Agriculture in Pakistan. Jacob W. Kijne, 1996.
[15]Cheng-Shin Jang A, Shih-Kai Chen B, Yi-Ming Kuo , “Establishing An Irrigation
Management Plan of Sustainable Groundwater Based On Spatial Variability of Water
Quality and Quantity” Journal of Hydrology (Elsevier) 414–415, 201–210 (2012)

International Journal of Research in Modern Engineering and Emerging Technology (IJRMEET) UGC Approved id_47203
Vol. 5, Sp. Issue: 9, Sept.: 2017 (IJRMEET) ISSN: 2320-6586
515 Online International, Refereed, Impact factor & Indexed Monthly Journal www.raijmr.com RET Academy for International Journals of Multidisciplinary Research (RAIJMR)
PHOTOCATALYTIC DEGRADATION OF FAST GREEN DYE OVER CuO/Al2O3
COMPOSITE
DEEPIKA PALIWALa*
, RAKSHIT AMETAa and BINDU KATARIA
b
aDepartment of Chemistry, PAHER University, UDAIPUR – 313003 (Raj.) INDIA
bDepartment of Chemistry,S. M. B. Govt. P.G. College, NATHDWARA – 313301 (Raj.)
INDIA
Email: [email protected]
ABSTRACT
Fast green dye is generally used in artificial food coloring, which is harmful for
human health. The photocatalytic degradation of fast green was monitored by
spectrophotometrically in presence of CuO/Al2O3. The effect of some parameters affecting
the rate of reaction, such as pH, dye concentration, amount of composite, light intensity, etc.
has been studied. Optimum parameters were found as pH =8.0, concentration = 1.20×10⁻⁵
M;
amount of semiconductor = 0.12g and intensity of light = 60.0 mWcm−2
. It was observed that
composite was having better photocatalytic activity, then individual components.
INTRODUCTION
Various industries use dyes in order to colour their products and throw a lot of
coloured wastewater in the form of effluent. The discharge of dye-bearing wastewater into
natural streams and rivers from the textile, paper, carpet, leather, distillery and printing
industries make severe problems. The cleaning of wastewater is one of the most serious
environmental problems of the present day. Discharge of dyeing industry wastewater into
natural water bodies is not desirable as the colour prevents re-oxygenation in receiving water
by cutting off penetration of sunlight. It also increases the BOD, and cause lack of dissolved
oxygen to sustain aquatic life. Nowadays, research is focused on reactive and other anionic
dyes because a large fraction of these dyes are remain in wastewater due to low removal
efficiency of the conventional wastewater treatment plants. Fast green dye has been widely
used in histology and cytology. It has been found to have tumorigenic effects in experimental
animals, as well as mutagenic effects in both; experimental animals and humans.
Furthermore, in its undiluted form, it poses risks of irritation of eyes, skin, digestive tract, and
respiratory tract.
A number of studies have been made on the degradation of toxic organic compounds
in wastewater by photocatalytic process using various semiconductors.Akpan and

International Journal of Research in Modern Engineering and Emerging Technology (IJRMEET) UGC Approved id_47203
Vol. 5, Sp. Issue: 9, Sept.: 2017 (IJRMEET) ISSN: 2320-6586
516 Online International, Refereed, Impact factor & Indexed Monthly Journal www.raijmr.com RET Academy for International Journals of Multidisciplinary Research (RAIJMR)
Hameed1presented a review of the effects of operating parameters on the photocatalytic
degradation of textile dyes using TiO2-based photocatalysts. The findings revealed that
different parameters, such as the initial pH of the solution, oxidizing agents, temperature of
calcination, dopant(s) content and catalyst loading exert their individual influence on the
photocatalytic degradation of any dye in wastewaters.Sharma et al.2degraded fast green FCF
by Fe-pillared bentonite clay in presence of light. Bhatiet al.3preparedthe nano-sized bimetal
ternary oxide(CeCrO3)using microwave treatment and used itfor photocatalytic degradation
of fast green dye. Rochkind et al.4 treated effluents stream containing hazardous dyes. They
are of the opinion that dyes are inappropriate as model compound for the evaluation of
photocatalytic activity of noval photocatalysts claimed to operate under visible
light.Ntsendwana et al.5 prepared a photo anode of exfoliated graphite-ZnO nanocomposite.
They studied degradation of eosin yellow dye arefound that degradation efficiency of eosin
yellow was 93%.Gupta et al.6 used barium chromate powder as a photocatalyst for the
degradation of eosin yellow.
Byberg at al.7 studied the photocatalytic degradation of six acid dyes, i.e. direct red
80, direct red 81, direct red 23, direct violet 51, direct yellow 27 and direct yellow 50. All
these dyes were compared in term of their mineralization, toxicity and removal of colour.
TiO2 was used as a semiconductor for this purpose. Hassan et al.8modified CN-TiO2 with
cryptomelane octahedral molecular sieves(OMS-2) by sol-gel method based self-assembly
technique to enhance its photocatalytic activity under the daylight irradiation. ljubas et al.9
used TiO2 nanoparticles as semiconductor photocatalysts for the degradation ofcongo red
(CR) and methyl orange (MO) dyes in an aqueous solution. Since TiO2 particles become
photocatalytically active on exposure to UV radiation, two sources of UV-A radiation were
used – natural solar radiations, which contains 3–5% UV-A and artificial, solar-like radiation,
created by using a lamp.
Mohabansiet al.10
degraded aqueous solution of methylene blue dye in presence of a
photocatalyst and UV light. Titanium dioxide and zinc oxide were used as photocatalyst for
the study.The rate of decolorisation was estimated spectrophotometrically from residual
concentration. Shrivastava et al.11
reportedthat removal of dye methylene blue and Cr (VI) by
considering influent concentration, loading of photocatalyst, pH and contact time as operating
variables. The percentage removal of dye and Cr(VI) increases with increasing contact time.
Tayade et al.12
degraded methylene blue selecting it as a model compound. They used

International Journal of Research in Modern Engineering and Emerging Technology (IJRMEET) UGC Approved id_47203
Vol. 5, Sp. Issue: 9, Sept.: 2017 (IJRMEET) ISSN: 2320-6586
517 Online International, Refereed, Impact factor & Indexed Monthly Journal www.raijmr.com RET Academy for International Journals of Multidisciplinary Research (RAIJMR)
ultraviolet light emitting diodes (UV-LED) as an alternate source. The photocatalytic activity
of P-25 Degussa TiO2 was evaluated using UV-LED reactor. Kottam et al.13
preparednano-
sized ZnO powder and photocatalytic degradation of rhodamine B dye was carried out
usingthis ZnO nanopowder.
EXPERIMENTAL
1.0 × 10⁻³
M stock solution was prepared by dissolving 0.0808 g of fast green in 100.0
mL of doubly distilled water. The absorbance of fast green was determined with the help of
spectrophotometer at λmax = 624nm. The structure of the dye is shown in Fig. 1.
Figure 1: Chemical Structure of fast green
The dye solution was placed in equal amounts in three beakers.
The first beaker containing fast green solution was kept with by CuO (copper oxide).
The second beaker containing fast green solution was kept with by using Al2O3
(aluminium oxide)
The third beaker containing fast green solution was kept withCuO/Al2O3 composite.
1.0 × 10⁻⁵
M Fast green solution was prepared using doubly distilled water and 0.12 g
of CuO/Al2O3 composite was added to it and pH was kept 8.0.Then this solution was exposed
to a 200 W tungsten lamp at 60.0 mWcm−2
. A decrease in absorbance of fast green solution
was observed with increasing time of exposure and it was faster in case of composite than
individual components. A plot of 1 + log A against time was found to be linear, which
indicates that the photocatalytic degradation of fast green follows pseudo-first order kinetics
(Fig. 2). The rate constant was measured with the help of expression k = 2.303 × slope. A
typical run is presented in Table1.
Table 1: A typical run
pH = 8.0, [Fast green] = 1.20 × 10⁻⁵
M, Amount of CuO/Al2O3 = 0.12g, Light intensity

International Journal of Research in Modern Engineering and Emerging Technology (IJRMEET) UGC Approved id_47203
Vol. 5, Sp. Issue: 9, Sept.: 2017 (IJRMEET) ISSN: 2320-6586
518 Online International, Refereed, Impact factor & Indexed Monthly Journal www.raijmr.com RET Academy for International Journals of Multidisciplinary Research (RAIJMR)
= 60.0 mWcm−2
Time
(min.)
CuO Al2O3 CuO/Al2O3
A 1 + logA A 1 + logA A 1 + logA
0 0.589 0.7701 0.589 0.7701 0.589 0.7701
10 0.569 0.7551 0.582 0.7649 0.549 0.7396
20 0.550 0.7404 0.573 0.7582 0.533 0.7267
30 0.526 0.7210 0.568 0.7543 0.501 0.6998
40 0.524 0.7193 0.549 0.7396 0.473 0.6749
50 0.501 0.6998 0.543 0.7348 0.457 0.6599
60 0.490 0.6902 0.537 0.7299 0.437 0.6405
70 0.473 0.6749 0.531 0.7251 0.412 0.6149
80 0.452 0.6551 0.525 0.7202 0.398 0.5998
90 0.441 0.6444 0.519 0.7152 0.376 0.5752
Rate constant (k) for CuO = 5.36×10⁻⁵
sec−1
Rate constant (k) for Al2O3 = 2.34×10⁻⁵
sec−1
Rate constant (k) for CuO/Al2O3= 8.30×10⁻⁵
sec−1
0 20 40 60 80 100
0.56
0.58
0.60
0.62
0.64
0.66
0.68
0.70
0.72
0.74
0.76
0.78
1+
lo
g A
Time (min)
CuO
Al2O3
CuO/Al2O3
Figure 2: Typical run

International Journal of Research in Modern Engineering and Emerging Technology (IJRMEET) UGC Approved id_47203
Vol. 5, Sp. Issue: 9, Sept.: 2017 (IJRMEET) ISSN: 2320-6586
519 Online International, Refereed, Impact factor & Indexed Monthly Journal www.raijmr.com RET Academy for International Journals of Multidisciplinary Research (RAIJMR)
RESULTS AND DISCUSSION
Effect of pH
The rate of degradation of fast green was investigated in the pH range 5.0 to 10.0. The
results are given in Table 2. It was observed that the rate of degradation of fast green
increases as pH was increased and optimum value found at pH=8.0.On further increasing pH,
beyond 8.0, the rate of the reaction was decreased. This may be explained on the basis that at
lower pH, the dye molecules present in neutral form have less attraction towards H+ ions, but
as the pH of the dye solution was increased, attraction between anionic dye molecules and H+
ion increases, but after optimum value at 8.0, anionic dye molecules face repulsion with
−OHions and therefore the rate is retarded.
Table 2: Effect of pH
[Fast green] = 1.20 × 10⁻⁵
M, CuO/Al2O3 = 0.12 g, Light intensity = 60.0 mWcm−2
pH Rate constant (k) × 105(sec
-1)
5.0
5.5
6.0
6.5
7.0
7.5
8.0
8.5
9.0
9.5
4.54
5.26
6.10
6.14
7.35
8.12
8.30
6.88
6.19
5.55
Effect of fast green concentration
The effect of fast green concentration was studied on degradation rate of dye by
taking its different concentrations.
The results are tabulated in Table 3.
Table 3: Effect of fast green concentration
pH = 8.0, CuO/Al2O3 = 0.12 g, Light intensity = 60.0 mWcm−2

International Journal of Research in Modern Engineering and Emerging Technology (IJRMEET) UGC Approved id_47203
Vol. 5, Sp. Issue: 9, Sept.: 2017 (IJRMEET) ISSN: 2320-6586
520 Online International, Refereed, Impact factor & Indexed Monthly Journal www.raijmr.com RET Academy for International Journals of Multidisciplinary Research (RAIJMR)
[Fast green] × 105 M Rate constant (k) × 10
5 (sec
−1)
0.20
0.40
0.60
0.80
1.00
1.20
1.40
1.60
5.70
6.64
7.14
7.66
8.06
8.30
7.20
6.93
As concentration of fast green was increased rate of reaction was also increased. It
reaches a maximum at 1.20 × 10⁻⁵
M concentration but thereafter, rate of reaction decreases
on increasing the dye concentration further. As the concentration of dye was increased,
number of dye molecules also increased resulting in higher rate of degradations but above
this particular limit, it acts as an internal filler and proper light intensity does not reach to
semiconductor surface at on the bottom of the vessel and as a result degradation rate
decreases.
Effect of amount of CuO/Al2O3
The amount of composite is also likely to affect the degradation of dye and hence,
different amounts of CuO/Al2O3 composite were used. Results are tabulated in Table 4.
Table 4: Effect of amount of CuO/Al2O3 composite
pH = 8.0, [Fast green] = 1.20 × 10⁻⁵
M, Light intensity = 60.0 mWcm−2
Amount of CuO/Al2O3 Rate constant (k) × 105sec
−1
0.02
0.04
0.06
0.08
0.10
0.12
0.14
0.16
5.15
6.01
6.59
7.11
7.98
8.30
7.67
6.92

International Journal of Research in Modern Engineering and Emerging Technology (IJRMEET) UGC Approved id_47203
Vol. 5, Sp. Issue: 9, Sept.: 2017 (IJRMEET) ISSN: 2320-6586
521 Online International, Refereed, Impact factor & Indexed Monthly Journal www.raijmr.com RET Academy for International Journals of Multidisciplinary Research (RAIJMR)
The rate of degradation of dye was increased on increasing the amount of composite
up to 0.12 g; but as the amount of composite was increased further. The rate of degradation
decreases. This may be explained on the basis that after a particular value, it forms multilayer
permitting close contact between particles; thus, e− − h
+ recombination takes place resulting
in a decrease in rate of reaction.
Effect of light intensity
The distance between the light source and exposed surface area of photocatalyst was
varied to find out the effect of light intensity. As the intensity of light was increased, rate of
degradation also increases. It is because of the fact that when light intensity was increased,
the number of photons striking per unit area of semiconductor powder per unit time also
increases. On further increasing the intensity of lightabove 60.0 mWcm−2
, rate of reaction
decreases may be due to some side reactions.
Table 5: Effect of light intensity
pH = 8.0, CuO/Al2O3 = 0.12 g, [Fast green] = 1.20 × 10⁻⁵
M
Light intensity (mWcm−2
) Rate constant (k) × 105(sec
−1)
20.0
30.0
40.0
50.0
60.0
70.0
5.26
5.39
5.85
6.80
8.30
6.72
Mechanism
According to observations, mechanism for photocatalytic degradationof fast green (FG)has
been proposed as follows:
1FG0
hν1FG1 …(1)
1FG1
ISC3FG1 …(2)
SC hν
e−
(CB) + h+
(VB) …(3)
e− + O2
O2
…(4)

International Journal of Research in Modern Engineering and Emerging Technology (IJRMEET) UGC Approved id_47203
Vol. 5, Sp. Issue: 9, Sept.: 2017 (IJRMEET) ISSN: 2320-6586
522 Online International, Refereed, Impact factor & Indexed Monthly Journal www.raijmr.com RET Academy for International Journals of Multidisciplinary Research (RAIJMR)
O2
+ 3FG1
Leuco FG …(5)
Leuco FG
Products …(6)
Fast green absorbs light and excited to its singlet excited state from ground state.
Singlet state is then converted to its corresponding triplet state through inter system
crossing.Composite is also excited by absorbing light and an electron is promoted to its
conduction band leaving a h+ (hole) in valence band. This electron combines with oxygen
(dissolved oxygen) and form oxyanion radical. These oxyanion oxidizes the triplet state of
fast green into its leuco form, which finally degrades to colourless product. The hydroxyl
radical does not participates as an active oxidizing species as the rate of degradation remains
unaffected even ion the presence of hydroxyl radical scavenger i.e. 2-propanol.
After complete degradation of dye,some physico-parameters were analyzed for treated
and untreated dye solution and the results weregiven in Table 6.
Table 6: Comparison of physico-chemical parameters
Quality parameter Before degradation After degradation
DO 7.6ppm 9.15ppm
Hardness 465ppm 280ppm
pH 8.0 7.0
Conductance 10.3 mS 62.2 mS
TDS 407ppm 513ppm
Dissolved Oxygen
Dissolved oxygen refers to the level of free, non-compound oxygen present in water
or other liquids. It is an important parameter in assessing water quality because of its
influence on the organisms living within a body of water. The dissolved oxygen is 5ppm in
normal potable water. Value of fast green dye was increased from 7.6ppm to 9.15ppm.
Hardness
Hardness is the amount of dissolved calcium and magnesium in the water. Hard water
is high in dissolved minerals; both, calcium and magnesium. General guidelines for
classification of waters are: 0 to 60 mg/L (milligrams per liter) as calcium carbonate is

International Journal of Research in Modern Engineering and Emerging Technology (IJRMEET) UGC Approved id_47203
Vol. 5, Sp. Issue: 9, Sept.: 2017 (IJRMEET) ISSN: 2320-6586
523 Online International, Refereed, Impact factor & Indexed Monthly Journal www.raijmr.com RET Academy for International Journals of Multidisciplinary Research (RAIJMR)
classified as soft; 61 to 120 mg/L as moderately hard; 121 to 180 mg/L as hard; and more
than 180 mg/L as very hard.Fast green hardness decreases from 465ppm to 280ppm.
pH
Catalytic advanced oxidationreactions developed for the discoloration of the dye
wastewater result in very effective oxidative degradation of a variety of dyes from food and
textile industry effluents. pH value decreases from 8.0 to 7.0 after degradation of fast green.
Conductance
Conductivity is directly proportional to dissolved minerals in the solution.
Conductometer was used for measuring ion concentration of solution. Fast green dye solution
shows conductance 10.3 mS before degradation, but after degradation, it increased up to62.2
mS.
Total dissolved solid (TDS)
In general, the total dissolved solids concentration is the sum of the cations (positively
charged) and anions (negatively charged) ions in the water. Therefore, the total dissolved
solids test provides a qualitative measure of the amount of dissolved ions but does not tell us
the nature or ion relationships. TDS value of fast green increased from 407 to 513ppm due to
mineralization of dye.
CONCLUSION
In the present investigation, it was found that the degradation rate of fast green dye
was higher when we have used composite of CuO/Al2O3in compare to CuO and Al2O3. The
optimum conditions for dye degradation were achieved. The comparison of physico-chemical
parameters of fast green dye solutions (before and after treatment) were analyzed, which
supported that the dye solution after treatment may be reused in cleaning and irrigation
purpose.
REFERENCES
1. U. G. Akpan and B. H. Hameed, J. Hazard. Mater., 2009, 520–529, 170.
2. G. Sharma, D.Sonia, S.Benjamin, R.Ameta and S.Sharma, Sci. Revs. Chem. Commun.,
2014,138-145, 4(4).

International Journal of Research in Modern Engineering and Emerging Technology (IJRMEET) UGC Approved id_47203
Vol. 5, Sp. Issue: 9, Sept.: 2017 (IJRMEET) ISSN: 2320-6586
524 Online International, Refereed, Impact factor & Indexed Monthly Journal www.raijmr.com RET Academy for International Journals of Multidisciplinary Research (RAIJMR)
3. I. Bhati, P. B. Punjabi and S. C. Ameta, Macedon. J. Chem. Chem.Eng.,2010,195–202,
29(2).
4. M. Rochkind, S. Pasternak and Y. Paz, Molecules, 2015,88-110, 20.
5. B. Ntsendwana, S. Sampath, B.B. Mamba, O.S. Oluwafemi and O.A. arotiba, J. Mater.
Sci. Electro.,2016, 592-598, 27(1).
6. S. Gupta, D. Soni, R. Ameta and S. Benjamin, Chem. Sci. Tran., 2015, 851-857, 4(3).
7. R. Byberg, J. Cobb, L. D. Martin, R. W. Thompson, T. A. Camesano, O. Zahraa and M.
N. Pons, Environ. Sci. Pollut. Res. Int., 2013,3570-3581, 20(6).
8. M. E. Hassan, J. Chen, G. Liu, D. Zhu and J. Cai, Materials, 2014,8024-8036, 7.
9. D. ljubas, G. Smoljanic and H. Juretic,J. Env. Manage., 2015, 83–91, 161.
10. N.P.Mohabansi, V. B. Patil and N.Yenkie,Rasayan J. Chem., 2011, 814-819, 4(4).
11. V. S. Shrivastava, Arch. App. Sci. Res.,2012, 1244-1254, 4 (3).
12. R. J. Tayade, T. S. Natarajan and H. C. Bajaj,Ind. Eng. Chem. Res., 2009 10262–
10267, 48 (23).
13. N. Kottam,C.R. Girija and B.M. Nagabhushana,Powder Technology,2012, 91-97, 215.

International Journal of Research in Modern Engineering and Emerging Technology (IJRMEET) UGC Approved id_47203
Vol. 5, Sp. Issue: 9, Sept.: 2017 (IJRMEET) ISSN: 2320-6586
525 Online International, Refereed, Impact factor & Indexed Monthly Journal www.raijmr.com RET Academy for International Journals of Multidisciplinary Research (RAIJMR)
STUDIES ON CHANGES OF PROTEIN IN LIVER OF TWO SPECIES OF
FISHES OFF JODIA COAST IN GULF OF KUTCH.
Y.M.Kadiyani, D.N.Joshi* Department of Biology, Bhavan’s College, Dakor-388225
Department of Chemistry,
*R.R.Mehtacollege of science and
C.L.Parikh College of commerce Palanpur 385001
Abstract
In case of E.tetradactylum protein content in the liver shows an increased level
during pre-spawning and spawning period and the level decreases during post-
spawning period, and normally same trend is observed in L.tade during active
spawning period. It is worth noting that when compared to liver, the red muscles
have more protein, as compared to the white muscles. This may be treated as the
indication of nutritive value of both the species the fish muscles.
Introduction
The liver in fishes perform may function as liver of higher vertebrates. It is
generally believed to be main site for production and distribution of intermediary
metabolites (Popper and Schaffner, 1957). A relative increase in liver size and
maturity in fish has been reported and a steady increase in liver weight of female
fish along with gonadal maturation has been recorded. Marked variations in liver,
glycogen, lipids, amino acids, inorganic ions, in liver of fishes in relation to sexual
maturity have been presented by many workers (Love, 1970; a review). The liver
in L. tade is of dark red colour whereas E. tetradactylumis of yellow brown colour
and it has occupied the largest protein viscera.
International Journal of Research in Modern Engineering and Emerging Technology (IJRMEET) UGC Approved id_47203
Vol. 5, Sp. Issue: 9, Sept.: 2017 (IJRMEET) ISSN: 2320-6586
526 Online International, Refereed, Impact factor & Indexed Monthly Journal www.raijmr.com RET Academy for International Journals of Multidisciplinary Research (RAIJMR)
It is obvious that when the main sites of metabolic processes in E. tetradactylum
and L. tade the liver is studied biochemically to investigate the variations in
glycogen, lipids, cholesterol, protein, sodium, potassium, calcium, magnesium,
phosphorus and iron. An attempt to throw some lights on various facets of
metabolism of E. tetradactylumand L. tadewould be fruitful.
However, very few investigations on variations in protein content, of fishes have
been undertaken suggesting transit of protein from organs like liver to ovary, at
various maturing stages of ovary, was reported by Philips, et al. (1964); Yamashita
(1967).A decrease in protein in the organs other than ovaries at late maturing
stages in the fishes have also been reported (Love, 1970).
Varghese (1976) has estimated monthly percentage of protein in white muscles and
red muscles of male and female of Pampus argenteusand Parastromateus nigerand
found a rise in protein value from stage I to III of maturity and that declined at
stages IV and V of maturity in P. argenteusfemale and in both female and male of
P. niger.
Material and Methods
Samples of liver were taken from fifteen to twenty live fish, E.
tetradactylumand L. tadeevery month. The samples were then dried in an oven at
480C for 3 to 5 days. The dried homogenous powders were prepared. Total
nitrogen was determined by Kjeldhal's method (A.O.A.O. 1965) with distillate
collected in 4% boric acid solution. Now protein nitrogen (NPN) was estimated as
that protein of the total nitrogen (TN) soluble in trichloroacetic acid as per the
method of Jacobs (1951).

International Journal of Research in Modern Engineering and Emerging Technology (IJRMEET) UGC Approved id_47203
Vol. 5, Sp. Issue: 9, Sept.: 2017 (IJRMEET) ISSN: 2320-6586
527 Online International, Refereed, Impact factor & Indexed Monthly Journal www.raijmr.com RET Academy for International Journals of Multidisciplinary Research (RAIJMR)
Protein nitrogen (PN) was calculated by deducting the value from total nitrogen
(TN) value and Protein content by multiplying the protein nitrogen (PN) value with
6.25 the protein factor was calculated as per formula (Nimi 1972).
...... X 6.25 = Protein factor
Results and Discussion
The protein content in liver increases in May to July and shows fluctuating
level from July to December in E. tetradactylum. Comparing the protein content in
liver with sexual maturity it is revealed that amount of protein increase during pre-
spawning and spawning and the level starts to decrease during the late period of
spawning and post spawning period i.e. from February to April.
In case of L. tade it gradually increases in pre-spawning period (July to October)
and show higher level during late period of spawning and after spawning.
Varghese (1976) has reported the rise in liver protein during early stage of maturity
and in late stage of sexual maturity. The fall in proteins value at stages V and VI of
the fishes possibly caused by depletion was also recorded by Varghese (1976).
Similarly, decrease of protein content in organs other than ovaries at late maturity
stages have been reported by several workers (Love, 1970). The protein content in
liver of E. tetradactylum and L. tade shows higher level during pre-spawning, love
level during late period spawning and after spawning agree with results of Love,
(1970) and Varghese, (1976).
It is worth noting that when compared to liver, the red muscles have more
protein, as compared to the white muscles. This may be treated as the indication of
nutritive value of both the species the fish muscles.

International Journal of Research in Modern Engineering and Emerging Technology (IJRMEET) UGC Approved id_47203
Vol. 5, Sp. Issue: 9, Sept.: 2017 (IJRMEET) ISSN: 2320-6586
528 Online International, Refereed, Impact factor & Indexed Monthly Journal www.raijmr.com RET Academy for International Journals of Multidisciplinary Research (RAIJMR)
Table-1 Showing the Month wise Protein Content in Liver mg/gm
Month E. tetradactylum L. tade
January 47.27±0.03 51.20±0.05
February 45.95±0.06 38.90±0.03
March 40.25±0.03 36.30±0.01
April 36.30±0.03 32.40±0.00
May 33.65±0.00 27.15±0.06
June 44.65±0.08 30.20±0.06
July 52.10±0.03 32.80±0.06
August 46.65±0.05 35.85±0.03
September 49.00±0.00 38.50±0.00
October 45.10±0.03 44.20±0.03
November 52.92±0.06 42.95±0.01
December 51.90±0.03 47.70±0.02

International Journal of Research in Modern Engineering and Emerging Technology (IJRMEET) UGC Approved id_47203
Vol. 5, Sp. Issue: 9, Sept.: 2017 (IJRMEET) ISSN: 2320-6586
529 Online International, Refereed, Impact factor & Indexed Monthly Journal www.raijmr.com RET Academy for International Journals of Multidisciplinary Research (RAIJMR)
Reference
[1] Airan, J .W. (1950). J .W. (1950). Studies on Kolhapur Fresh Water fishes I.
Water extractable proteins and minerals contents. Indian J.Med. Research 38,
169-172.
[2] Arevalo, A. (1948). Study of the variation in the chemical composition of the
Trachurus trachurusL. Botn. Inst.esp.Occanogr.no.8 – 13.
[3] Atwater., (1892).The chemical composition and nutritive value of food fishes.
Ann.Rept.Comm.Fish and Fisheries for 1888.Washington, 697.
[4] Bano, Yagna. (1977).Seasonal variations in the biochemical composition of
Clarius batyachius. L.Proc Indian Acad.Sci. Vol. 85(B) (3): 147 – 155.
[5] Dawson, A.S. & Grimm A.S. (1980), quantitative seasonal change in the
Protein and energy content of the carcass, ovaries and liver of adult female
Place, Pleuronecle platessa L. Fish Biol.16, 493 – 504.
[6] Dela Hunty, G. & De vlaming, V.L. (1980).Seasonal relationships of ovary
Weight, liver weight and fat Stores with body weight in the gold fish,
Carassiusauratus L.J.Fish Biol 16:5-13.
[7] Geiger, E. and Borgstrom, G. (1962).Fish protein – nutritive aspects. IN
“Fish as Food” (G.Borgastrm.ed.).Vol.II Chapter 2, pp.29-114 Academic
Press, Landon and New York.
[8] Gerking, S.D. (1955) Induence of rato of feeding on body composition and
Protein metabolism of blue gill sunfish.Physiol.Zool.28, 26 – 282.
[9] Hamior, G. (1955). Fish Proteins. IN “Advance in Protein chemistry”,
Vol.X. Edited by M.L.Anson, Bailey, and J.T. Edsall.Academic Press,
NewYork.PP. 227 - 288.
[10] Ilder, D.P. and Bitnersm I. (1960).Biochemical studies on Sockey salmoon
During spawning migration.IX.Fat, Protein and water in the major internal
Organs and Cholesterol in the liver and gonads of the standard fish.J.Fish.
Res.Bd.Can.17, 113-122.
[11] Jeeja Tharakan and N.D.Inasu 2009 Variations in the Protein content of
Muscle, Liver and Ovary during Reproductive Cycle in Puntius Parrah.
Millennium Zoology Vol.10 (1),2009:30-33
[12] Krivobok M.N. (1964). On the role of the liver in the maturation of the
Ovaries of the Baltic herring,Clupea harengus membress L.Vop.Ikhtiol.
4,483-494.
[13] Medford B.A.and Mackay W.C.1978 Protein and lipid content of gonads,
Liver and muscles of northern pike Esoxhiclus in relation to Gonad growth.
J.ish.Research Board of Canada 35:213-219
[14] Varghese, T. P. (1976). Studies on muscles, gonads and liver of pomfrets,
Pamus argenteus and Parastormatesus nigerof Saurashtra coast. Ph. D.
Thesis.

International Journal of Research in Modern Engineering and Emerging Technology (IJRMEET) UGC Approved id_47203
Vol. 5, Sp. Issue: 9, Sept.: 2017 (IJRMEET) ISSN: 2320-6586
530 Online International, Refereed, Impact factor & Indexed Monthly Journal www.raijmr.com RET Academy for International Journals of Multidisciplinary Research (RAIJMR)
SYNTHESIS AND ANTIMICROBIAL ACTIVITY OF 3-ARYL-5-(4’ N, N-
DIMETHYL AMINO PHENYL)-1-PHENYL PYRAZOLINES
DIGANT N.JOSHI*, M.C.LIMBACHIYA, P.S.PATEL, Y.M.KADIYANI
*R.R.MEHTA COLLEGE OF SCIENCE & C.L.PARIKH COLLEGE OF COMMERCE
PALANPUR385001(GUJARAT)
Department of Biology, Bhavan’sCollege,Dakor 388225GUJARAT
4 N,N-Dimethyl amino phenyl Benzaldehyde1 on treatment with different acetophenones
yielded 1 Aryl-3-(4’N,N-dimethylamino Phenyl)-2- Propenone (2a-e) which on cyclisation with
phenyl hydrazine hydrate gives 3 Aryl-5-(4’ N,N-dimethyl aminophenyl)-1-Phenyl pyrazolines
(3a-e). The structures of the compounds 2a-e,3a-e were confirmed by elemental analysis,
IR,NMR &MASS spectral data. All the products were evaluated for their in vitro growth
inhibitory activity against several microbes.
INTRODUCION
Among a wide variety of heterocycles that have been explored for developing pharmaceutically
important molecules like pyrazolines1-4
have played an important role in medicinal chemistry. In
the light of these interesting biological activities, it appeared of interest to synthesize some new
pyrazoline derivatives bearing 4- N,N’ dimethylaminophenyl benzaldehyde moiety and asses
their biopotential.
The starting compound 4- N,N’ dimethylaminophenyl benzaldehyde4- N,N’
dimethylaminophenyl benzaldehyde on reaction with aromatic acetophenones yielded
corrospopnding 1-Aryl-3-(4’N,N-dimethyl amino phenyl)2
propenone(2a-e). Compound(2a-e) on
treatment with hydrazine hydrate in ethanol and in glacial acetic acid afforded corresponding 3-
Aryl-5-(4’N,N-dimethyl amino phenyl)-1-Phenyl pyrazolines. (3a-e) 5 (scheme 1)
The structures of the compounds synthesized were assigned on the basis of elemental analysis
IR,NMR &MASS spectral data. The compounds were evaluated for their antimicrobial
screening.
ANTIMICROBIAL ACTIVITY
The antimicrobial activity was determined using cup-plate agar diffusion method. The plates
were incubated at 370
C FOR 24 hrs. in case of antimicrobial activity and at 300
C for48 hrs. in
case of antifungal activity. The control was also maintained with 0.1 ml of DMF in similar
manner. The zones of inhibition of the growth were measured in mm. All the compounds were
screened invitro for their antimicrobial activity against a variety of bacterial strains like Bacillus
megaterium and Bacillus subtilis Gram positive and Escherichia coli and Aerobactoraerogen
Gram negative bacteria and fungaiAspergillusawamori .Known antibiotics like Ampicillin,

International Journal of Research in Modern Engineering and Emerging Technology (IJRMEET) UGC Approved id_47203
Vol. 5, Sp. Issue: 9, Sept.: 2017 (IJRMEET) ISSN: 2320-6586
531 Online International, Refereed, Impact factor & Indexed Monthly Journal www.raijmr.com RET Academy for International Journals of Multidisciplinary Research (RAIJMR)
Amoxicillin, Chloramphenicol, Norfloxacin, Gresiofulvin Showed a zone of inhibition at 25-30
mm.and greseofulvin at 25 mm. against various strains at bacteria and fungi.
CONCLUSION
Most of the compounds displayed moderate antimicrobial activity.
EXPERIMENTAL SECTION
All the melting points were determined in open capillary tubes and are uncorrected. IR spectra
were recorded on SHIMADZU-FT-IR-8400 Spectrophotometer 4000-400 cm-1
KBr disc.PMR
spectra on BRUKER Spectrometer(300 MHz) Mass spectra were recorded at C.D.R.I. Lucknow.
1 Aryl-3-(4’ N,N dimethyl aminophenyl) -2- propenone.
To an afficiently stirred solution of 4 N,N-dimethyl amino phenyl benzaldehyde 1 (0.01
mole 1.49 gm.) and 4- ethoxy acetophenone (0.01 mole 1.64 gm) in ethanole(25 ml) added 40%
NaOH (3ml). The reaction mixture was heated for 10 min. and kept on stirrer for 24 hrs. The
mixture was poured into ice water and acidified and crystallized from ethanole to give (2e).
Yield 50%,m.p.880C Calcd. For C19H21NO2; C,77.28;H,7.11; N,4.74%; Found; C77.25; H, 7.08;
N,4.72%
Similarly other members were prepared and their physical data recorded in Table-1.
3-4-Ethoxy-5-(4’N,N-dimethyl amino phenyl)-1-Phenyl pyrazoline (2e)
A mixture of 1,4-Ethoxyphenyl-3-(4’-N,N-dimethylaminophenyl)-propenone (0.01 mole2.95
gm) and phenyl hydrazine (1.08g, 0.01M) in ethanole (25 ml) was refluxed on a boiling water
bath for 8 hrs.The reaction mixture was poured over crushed ice and acidified with acetic acid.
The product was isolated and crystallized from ethanol to give 3e. Yield 59%, m.p. 79oC,
calcd.for;C25H27N3O; C,77.92; H,7.01; N,10.90 % C,77.88; H,7.88; N,10.85%
Similarly other 3-Aryl-5-(4’-N,N-dimethylaminophenyl)-1-phenyl pyrazolines were prepared.
The physical data recorded in Table 1

International Journal of Research in Modern Engineering and Emerging Technology (IJRMEET) UGC Approved id_47203
Vol. 5, Sp. Issue: 9, Sept.: 2017 (IJRMEET) ISSN: 2320-6586
532 Online International, Refereed, Impact factor & Indexed Monthly Journal www.raijmr.com RET Academy for International Journals of Multidisciplinary Research (RAIJMR)
SPECTRAL DATA
When R=4-ethoxyphenyl
IR (KBr) Values in cm-1
Compd. (2e) C=O1641cm-1
;C-O-C 1255cm-1;HC=CH 3000cm
-1;CH3 2904cm
-1
Compd. (3e) C=N 1606cm-1
;N-H 3423 cm-1
; C-O-C 1251,1043 cm-1
; CH3 2970 cm-1
Compd. (4e) C=O1650 cm-1
C=N 1606 cm-1
;C-O-C 1250, 1050 cm-1
CH3 2990 cm-1
PMR TMS CDCl3 Value in Dppm
Compd.(2e) 3.00 (s,6H,N(CH3)2); 6.96 (d,1H,HC=C-CO); 6.69(d,1H,C=CH-CO); 4.10
(q,2H, Ar-O-CH2).
Compd.(3e) 3.02(s,6H,N(CH3)2); 8.59 (s,1H,NH-Ar) ;4.50(q,2H,OCH2); 1.25 (t,3H,CH3-C)
Compd.(4e) 2.89 (s,6H,N(CH3)2 ;2.38 (s,3H, CO-CH3) ;4.12 (q,2H,O-CH2); 1.39(t,3H,CH3-C)
MASS DATA
We have observed molecular ion peak at in compd. 2e at 296, 3e at 310, and 4e at 351.
REFERENCES
1. Fahmay A.M., Hassan Kh. M., Khalaf A.A. & Ahmed R.A.,(Fac sci. AssiutEgypt) Rev Chim,
1988(Eng.); ChemAbstr. 111(1989) 77898.
2. Das &Mittra A.S., Indian J.Chem. 16 B (1978) 638.
3.Cremlyn R.J., Swinbourne F.J., &Mookerjee E. (Sch.
Nat.Sci.Hatfieldpolytech,HalfieldHetrtford Shire Uk), Indian J. Chem 25 B(1986) 562; Chem.
Absr. 105 (1986) 16428.
4. Lapm&Philip G (Dupont de Nemours, EI and Co.) Eur Pat Appl EP 300,692 (Cl CO7D
231/05) 25 Jan 1989, U S Appl(1987 74, 795, 48, pp. CHEM Abstr. 111(1989) 7397.
5. Murthy A.K. RaoN.v., Indian J Chem. 10 (1972) 38, Chem. Abstr. 77 (1972) 29615.

International Journal of Research in Modern Engineering and Emerging Technology (IJRMEET) UGC Approved id_47203
Vol. 5, Sp. Issue: 9, Sept.: 2017 (IJRMEET) ISSN: 2320-6586
533 Online International, Refereed, Impact factor & Indexed Monthly Journal www.raijmr.com RET Academy for International Journals of Multidisciplinary Research (RAIJMR)
R Molecular
formula
M.W. M.P. 0C
Yield
%
% of Nitrogen
Calcd. Found
2a Phenyl C17H17NO 251 65 60 5.57 5.53
2b 4-Bromo
phenyl
C17H16NOBr 330 107 70 4.24 4.19
2c 4-Chloro
phenyl
C17H16NOCl 288.5 115 68 4.90 4.80
2d 2,4-dihydroxy
phenyl
C17H17NO3 283 80 59 4.94 4.91
2e 4-ethoxy
phenyl
C19H21NO2 295 85 50 4.74 4.68
2f 2-Hydroxy
phenyl
C17H17NO2 267 155 44 5.24 5.19
2g 4-Hydroxy
phenyl
C18H19NO2 267 83 40 5.24 5.16
2h 4-Methoxy
phenyl
C17H18N3Cl 281 90 63 4.98 4.94
2i 2-Methyl
phenyl
C18H19NO 265 80 71 5.28 5.25
2j 4-Nitro phenyl C18H16N2O3 308 190 56 9.09 9.07
3a Phenyl C23H23N3 318 69 60 13.20 13.19
3b 4-Bromo
phenyl
C23H22N3Br 397 110 65 10.57 10.54
3c 4-Chloro
phenyl
C23H22N3Cl 352.5 98 67 11.91 11.86
3d 2,4-dihydroxy
phenyl
C23H23N3O2 350 180 53 12.00 11.95
3e 4-ethoxy
phenyl
C25H27N3O 385 79 59 10.90 10.82
3f 2-Hydroxy
phenyl
C23H23N3O 357 115 47 11.76 11.72
3g 4-Hydroxy
phenyl
C23H23N3O 357 149 45 11.76 11.74
3h 4-Methoxy
phenyl
C24H25 N3O 371 90 61 11.32 11.31
3i 2-Methyl
phenyl
C24H25 N3 355 133 56 11.83 11.80
3j 4-Nitro phenyl C23H22N4O2 386 75 60 14.50 14.48

International Journal of Research in Modern Engineering and Emerging Technology (IJRMEET) UGC Approved id_47203
Vol. 5, Sp. Issue: 9, Sept.: 2017 (IJRMEET) ISSN: 2320-6586
534 Online International, Refereed, Impact factor & Indexed Monthly Journal www.raijmr.com RET Academy for International Journals of Multidisciplinary Research (RAIJMR)
TABLE No. 2A. BIOLOGICAL ACTIVITY OF STANDARD DRUGS TOWARDS
STRAINS OF BACTERIA AND FUNGI
Sr.
No.
Drugs Zones of inhibition in m.m
B.mega B.subtilis E.coli A.aerogens A.awamori
1 Amoxicillin 25 16 23 24 0
2 Ampicillin 23 18 27 25 0
3 Chloramphenicol 24 19 26 25 0
4 Norfloxacin 24 19 30 30 0
5 Griseofulvin - - - - 25
6 D.M.F. 10 10 12 11 10
TABLE No. 2B. ANTIMICROBIAL ACTIVITY OF 2a-j, 3a-j.TOWARDSDIFFERENT
STRAINS OF BACTERIA AND FUNGI
No
R
Antimicrobial activity
Zone of inhibition in m.m
B.megaB. subtilisE.coliA.aerogen
Antifungal
Activity
A.awamori
2a Phenyl 13 15 12 15 16
2b 4-Bromo phenyl 18 16 15 18 14
2c 4-Chloro phenyl 19 21 17 19 19
2d 2,4-dihydroxy
phenyl
13 15 16 14 14
2e 4-ethoxy phenyl 15 18 12 16 14
2f 2-Hydroxy phenyl 16 17 15 14 16
2g 4-Hydroxy phenyl 14 15 13 16 14
2h 4-Methoxy
phenyl
21 19 20 17 20
2i 2-Methyl phenyl 19 20 17 18 21
2j 4-Nitro phenyl 18 16 16 17 22
3a Phenyl 15 16 18 14 20
3b 4-Bromo phenyl 14 13 17 15 18
3c 4-Chloro phenyl 13 18 15 16 19
3d 2,4-dihydroxy
phenyl
17 19 16 18 14
3e 4-ethoxy phenyl 15 18 21 18 15
3f 2-Hydroxy phenyl 18 16 17 14 20
3g 4-Hydroxy phenyl 16 17 19 15 15
3h 4-Methoxy
phenyl
15 20 17 18 18
3i 2-Methyl phenyl 17 14 20 17 18
3j 4-Nitro phenyl 19 16 18 20 17

International Journal of Research in Modern Engineering and Emerging Technology (IJRMEET) UGC Approved id_47203
Vol. 5, Sp. Issue: 9, Sept.: 2017 (IJRMEET) ISSN: 2320-6586
535 Online International, Refereed, Impact factor & Indexed Monthly Journal www.raijmr.com RET Academy for International Journals of Multidisciplinary Research (RAIJMR)
Removal of Coloured Substance by Agricultural Product
through Adsorption
Kiran V. Mehta
Department of Chemistry,
R. R. Mehta College of Science and C. L. Parikh College of Commerce,
PALANPUR-385001, Dist.-Banaskantha, State-Gujarat(India)
Abstract
Coloured substances which are generated as wastage by factories
may create environmental issues. Complex aromatic coloured substances do
not easily degrade and remain in the environment. Coloured water may be
made harmless by physical or chemical processes. Adsorption is a good
processbut use of activated carbon as an adsorbent is costly. It gives chance
for other low cost adsorbents. Agricultural product- wheat straw can be used
as a low cost adsorbent for the removal of coloured substances. Wheat straw
was used for the present study for the removal of a coloured substance: 3,4-
dihydroxy-9,10-dioxoanthracene-2-sulfonic acid from the solution. Effect of
initial dye concentration and effect of adsorbent amount with respect to time
were studied. The study indicates that wheat straw powder can be used as a
low cost adsorbent.
Key words : adsorption, coloured substance, removal.
Introduction
The demand for colourants has experienced extraordinary increase in
the past some years. Industries like textile, rubber, food, drug, paper,
cosmetics,beverages and plastic use colourants. These colourants are water

International Journal of Research in Modern Engineering and Emerging Technology (IJRMEET) UGC Approved id_47203
Vol. 5, Sp. Issue: 9, Sept.: 2017 (IJRMEET) ISSN: 2320-6586
536 Online International, Refereed, Impact factor & Indexed Monthly Journal www.raijmr.com RET Academy for International Journals of Multidisciplinary Research (RAIJMR)
pollutants. They are present in variousextentsin industrial waste water.
Coloured industrial waste water expulsion is done into land area or water
area(lake, river or sea). However, most of the colourants are hard to degrade
because they are stable to light and oxidizing agents. Thus, they tend to
persist in the environment. It creates public health problems[1-6]. This
contaminated water affects the flora and fauna of the related region. As a
result, the environmental issues about the removal of these pollutants are
gaining much more attention in recent years.
Conventional technologies employed for eliminating dye from
industrial effluents include coagulation, chemical oxidation and biological
treatment. Generally, coloured water is treated with either by physical,
biological or chemical processes. However, these processes are very pricey.
The dyes from aqueous medium can be efficiently removed by adsorption
process which is a surface phenomenon. A well known adsorbent, activated
carbon can be prepared from carbonaceous material. As activated carbon is
highly porous, it is a superb adsorbent but is very expensive[1,2]. This has led
to further research for the cheaper replacement of adsorbent material.
General skills applied for the removal of colourants are: chemical
oxidation, coagulation and biological treatment. These processes are costly.
Colourants from aqueous solution can be eliminated by adsorption. Activated
carbon is a good adsorbent but it is pricey[3,4]. Hence, research for the
cheaper adsorbent material becomes important and interesting.These
materials include ginger waste, jute fibers, coconut shell, sugarcane bagasse,
castor seed shell, rice husk, almond shell, saw dust, spent tea leaves, plum
kernel, jack fruit leaves, palm fruit bunch, orange peel, etc.[5-11]. These
materials are low-priced and natural.
Discovering competent and environment friendly adsorbents for the
abstraction of colourants from aqueous medium is an important work for
reducing the black side of industrial development. In the present research

International Journal of Research in Modern Engineering and Emerging Technology (IJRMEET) UGC Approved id_47203
Vol. 5, Sp. Issue: 9, Sept.: 2017 (IJRMEET) ISSN: 2320-6586
537 Online International, Refereed, Impact factor & Indexed Monthly Journal www.raijmr.com RET Academy for International Journals of Multidisciplinary Research (RAIJMR)
paper, dry wheat straw powder(WSP) was applied for the elimination of
colouring matter (3,4-dihydroxy-9,10-dioxoanthracene-2-sulfonic acid)
(DDSA) from its aqueous solution.
Materials and Methods:
Adsorbate :
O
OHOH
O
S
O
O
OH
IUPAC name : 3,4-dihydroxy-9,10-dioxo-4a,9,9a,10-tetrahydroanthracene-2-sulfonic acid
General name: 3,4-dihydroxy-9.10 dioxoanthracene--2-sulfonic acid
Fig.-1:Structure of DDSA
Sodium salt of 3,4-dihydroxy-9,10-dioxoanthracene-2-sulfonic
acid(DDSA), a colourant, was used as adsorbate for the present study. The
structure of this colourant is shown in Figure-1.
Adsorbent:
India is a country producing a huge amount of wheat. So, dry straws are
easily obtainable as an agricultural byproduct. Dry straws of wheat plants
used for the present work were collected from the local farms. They were
washed four times with distilled water to remove dust and water soluble
impurities. Straws were dried till they became brittle. Then it was sieved in
the range of 45-50 mesh(US). Straws were further washed with distilled
water till the washings were free from turbidity. The powdered material

International Journal of Research in Modern Engineering and Emerging Technology (IJRMEET) UGC Approved id_47203
Vol. 5, Sp. Issue: 9, Sept.: 2017 (IJRMEET) ISSN: 2320-6586
538 Online International, Refereed, Impact factor & Indexed Monthly Journal www.raijmr.com RET Academy for International Journals of Multidisciplinary Research (RAIJMR)
obtained was dried at 105oC for 4-5 hours and placed in a desiccator. Then,
Wheat Straw Powder(WSP) was used as the adsorbent.
Adsorption Experiments:
Adsorption of DDSA on powder of dry wheat straw powder (WSP)
was carried out and effect of initial concentration of adsorbate and effect of
amount of adsorbent with respect to contact time were studied.
Simultaneously, all experiments were conducted with no adsorbent to ensure
that adsorption was by wheat straw powder and not by the other factors. The
process of adsorption was studied by analyzing adsorption elimination of the
colourant from the solution. The experimental mixture was stirred on a rotary
orbit shaker at 180 rpm. The study was performed according to the methods
described in the literature[13-21].
Results and Discussion:
For the determining effect of the initial dye concentration, the study
was performed at fixed adsorbent amount(0.4 g/100 ml) at room temperature
(33±1)0C for 120 minutes at various initial concentrations of DDSA. The
DDSA removal was determined at 20, 40, 60, 80, 100 and120 minutes. The
results are shown in Table - 1.

International Journal of Research in Modern Engineering and Emerging Technology (IJRMEET) UGC Approved id_47203
Vol. 5, Sp. Issue: 9, Sept.: 2017 (IJRMEET) ISSN: 2320-6586
539 Online International, Refereed, Impact factor & Indexed Monthly Journal www.raijmr.com RET Academy for International Journals of Multidisciplinary Research (RAIJMR)
Table – 1: Effect of initial concentration of DDSA on adsorption using
WSP
Amount of adsorbent (WSP): 0.4 g/100ml, time: 120 min.
Initial DDSA
concentration
(mg/l)
% of DDSA removal with time(min.)
20 40 60 80 100 120
25 9.50 15.80 26.40 62.80 65.25 60.51
50 11.25 21.30 30.12 73.10 75.51 77.52
75 28.40 32.25 31.58 77.45 68.84 79.11
100 29.00 33.15 34.10 68.50 70.30 79.62
125 30.11 38.20 45.28 79.25 75.63 81.14
150 32.24 40.55 42.65 80.10 82.19 80.11
175 10.50 12.35 33.40 59.85 64.57 70.15
The adsorption of DDSA on WSP was studied by
changing the amount of adsorbent for 120 minutes. During this, DDSA
concentration was kept 100 mg/l. The results are shown in Table - 2. The
results indicate that the percentage of adsorption increases with the increase
in the amount of adsorbent.
Table – 2 : Effect of amount of adsorbent on DDSA removal
DDSAconcentration: 100 mg/l, time : 120 min.
Adsorbent (WSP) dose
(g/100ml)
% of DDSA removal with time(min.)
20 40 60 80 100 120
0.2 14.27 18.89 20.12 22.03 31.50 30.14
0.4 17.33 20.02 23.05 30.87 36.24 35.07
0.6 28.55 37.09 45.06 47.01 58.04 69.01
0.8 30.46 40.15 46.01 48.09 59.90 78.65
1.0 22.52 42.23 44.16 44.70 51.92 47.84

International Journal of Research in Modern Engineering and Emerging Technology (IJRMEET) UGC Approved id_47203
Vol. 5, Sp. Issue: 9, Sept.: 2017 (IJRMEET) ISSN: 2320-6586
540 Online International, Refereed, Impact factor & Indexed Monthly Journal www.raijmr.com RET Academy for International Journals of Multidisciplinary Research (RAIJMR)
Conclusion:
The present study shows that the dry wheat straw powder can be used
as a good, low cost adsorbent for the removal of the DDSA from aqueous
solution. The amount of DDSA adsorbed was found to alter with time,
adsorbent dosage and initial concentration of DDSA.
References:
[1] Perkowski J., Kos L., DecolourizationOf Model Dye House Wastewater
With Advanced Oxidation Processes, Fibres And Textiles In Eastern
Europe,2003, 11, 67-71.
[2] Oclay T., Isik K., Gulen E., Derin O., Colour Removal From Textile
Wastewaters, Water Science And Technology,1996, 34, 9-11.
[3] Karaca S., Gurses A., Aclkyldlz M., Ejder M., Adsorption Of Cationic
Dye From Aqueous Solutions By Activated Carbon, Microporous And
Mesoporous Materials,2008, Vol. 115, Issue-3, 376-382.
[4] Kannan N., Sundram M. M., Kinetic And Mechanism Of Removal Of
Methylene Blue By Adsorption On Various Carbons-A Comparative
Study, Dyes And Pigments, 2001, 1, 25-40.
[5] Ahmad R., Kumar R., Adsorption Study Of Patent Blue Vf Using
Ginger Waste Material, Journal Of The Iranian Chemical
Research,2008, Vol. 1, 85-94.
[6] Memon G. Z., Bhanger M.I., Akhtar M., Peach-Nut Shells-An Effective
And Low Cost Adsorbent For The Removal Of Endosulfan From
Aqueous Solutions, Pakistan Journal Of Analytical Environmental
Chemistry, 2009, Vol. 10, No. 1-2, 14-18.

International Journal of Research in Modern Engineering and Emerging Technology (IJRMEET) UGC Approved id_47203
Vol. 5, Sp. Issue: 9, Sept.: 2017 (IJRMEET) ISSN: 2320-6586
541 Online International, Refereed, Impact factor & Indexed Monthly Journal www.raijmr.com RET Academy for International Journals of Multidisciplinary Research (RAIJMR)
[7] Ozer A., Dursun G., Removal Of Methylene Blue From Aqueous
Solution By Dehydrated Wheat Bran Carbon, Journal Of Hazardous
Materials,2007, Vol. 146, Issue: 1-2, 262-269.
[8] Bat Zias F. A., Sindiras D. K., Dye Adsorption By Calcium Chloride
Treated Beech Sawdust In Batch And Fixed Bed Systems, Journal Of
Hazardous Materials,2004, Vol. 114, Issue: 1-3, 167-174.
[9] Lo Stuart T., William R. R., Michael A. C., Removal Of Dissolved
Textile Dyes From Wastewater By A Compost Sorbent, Coloration
Technology,2003,119, 14-18.
[10] Annadurai G., Juang R. S., Lee D. J., Use Of Cellulose Based Wastes
For Adsorption Of Dyes From Aqueous Solutions, Journal Of
Hazardous Materials,2002, B-92, 263-274.
[11] Nassar M. M., The Kinetics Of Basic Dye Removal Using Palm-Fruit
Bunch, Adsorption Science Technology,1997, 15, 609-617.
[12] Dae-Hee, Won–Seok, Tai-Il Y, Dyestuff Wastewater Treatment Using
Chemical Oxidation, Physical Adsorption And Fixed Bed Biofilm
Process, Process Biochemistry,1999, 34, 429-439.
[13] Safarik I., Namburska K., Safarikova M., Adsorption Of Water Soluble
Organic Dyes On Magnetic Charcoal, Journal Of Chemical Technology
And Biotechnology,1997, 69, 1-4.
[14] Noroozi, B., Sorial, G. A., Bahrami, H., Arami, M., Equilibrium And
Kinetic Adsorption Study Of A Cationic Dye By A Natural Adsorbent-
Silkworm Pupa, Journal Of Hazardous Materials,2007, B139, 167–174.
[15] Ola A., Ahmed E. N., Amany E. S., Azza K., Use Of Rice Husk For
Adsorption Of Direct Dyes From Aqueous Solution: A Case Study Of
Direct F. Scarlet, Egyptian Journal Of Aquatic Research, 2005, 31(1),
1–11.

International Journal of Research in Modern Engineering and Emerging Technology (IJRMEET) UGC Approved id_47203
Vol. 5, Sp. Issue: 9, Sept.: 2017 (IJRMEET) ISSN: 2320-6586
542 Online International, Refereed, Impact factor & Indexed Monthly Journal www.raijmr.com RET Academy for International Journals of Multidisciplinary Research (RAIJMR)
[16] Mckay G., Equilibrium Studies For The Adsorption Of Dyestuffs From
Aqueous Solutions By Low Cost Materials, Water, Air And Soil
Pollution,1986, 29, 273-283.
[17] Inthorn D., Singhtho S., Thiravetyan P., Khan E., Decolorization of
Basic, Direct And Reactive Dyes By Pre-Treated Narrow-Leaved
Cattail(Typhaangustifolia Linn.), Bioresource Technology, 2004, 94,
299–306.
[18] Renmin, G. Yi. D., Mei L., Chao Y., Huijun L., Yingzhi S., Utilization
Of Powdered Peanut Hull As Biosorbent For Removal Of Anionic Dyes
From Aqueous Solution, Dyes And Pigments, 2005, 64, 187–192.
[19] Changwei H., Jian Long L., Yin Zhou, Mei Li, Feng X., Huiming Li,
Enhanced Removal Of Methylene Blue From Aqueous Solution By
Pummelo Peel Pretreated With Sodium Hydroxide, Journal Of Health
Science,2009, 55(4), 619-624.
[20] Rasheedkhan A., Tahir H., Uddin F., Hameed U., Adsorption Of
Methylene Blue From Aqueous Solution On The Surface Of Wool Fiber
And Cotton Fiber, Journal Of Applied Science And Environmental
Management,2005,9(2), 29-35.
[21] Perineau F., Molinier J., Gaset A., Adsorption Of Ionic Dyes Onto
Charred Plant Material,Journal Of Chemical Technology and
Biotechnology,1982, 32, 749-755.

International Journal of Research in Modern Engineering and Emerging Technology (IJRMEET) UGC Approved id_47203
Vol. 5, Sp. Issue: 9, Sept.: 2017 (IJRMEET) ISSN: 2320-6586
Formation of some novel Acid azo dyes : synthesis,
characterisation and Application properties :III
Dr.D.G.Patel and Dr.R.T.Patel, Dr.M.K.Thkor, Dr.B.K.Patel
Department of Chemistry, Municipal arts and Urban bank science college,
Mehsana-384001, Gujarat, India.
Email : [email protected]
Abstract
Novel acid azo dyes have been prepared by the coupling of diazo solution of
4 –methoxy Aniline with 1-(4-N-acetyl amino) 2-methyl phenyl , 2-chloro ethanone. The
resultant product were hydrolysis by refluxing with ethanol containing for 4-5 hours .The
coupling compound of various aromatic acid R1-R6 with above diazonium salt soln.The
resultant dyes were characterized by spectral techniques, i.e., elemental analysis, IR, UV––
visible spectroscopy. The dyeing performance of all the dyes was evaluated on wool and
nylon fabrics and studies their light and washing fastness properties.
Keywords: acid azo dye, UV––visible spectroscopy , light fastness, washing fastness.
Introduction:
Out of different classes of dyes, azo dyes constitute the largest group of colorants
used in industry 1. Azo dyes do not occur in nature and are produced only through chemical
synthesis2. The emergence of diverse classes of synthetic dyes including azo-dye occurred due
to constant effort to find specific dye or a particular class of dye for application on diverse
materials of industrial importance mainly textile fibres, aluminium sheet, leather, electro
optical devices,ink –jet printers etc. 3
543 Online International, Refereed, Impact factor & Indexed Monthly Journal www.raijmr.com RET Academy for International Journals of Multidisciplinary Research (RAIJMR)

International Journal of Research in Modern Engineering and Emerging Technology (IJRMEET) UGC Approved id_47203
Vol. 5, Sp. Issue: 9, Sept.: 2017 (IJRMEET) ISSN: 2320-6586
While phenols are well established intermediates for the synthesis of various
commercial dyes 4-8
, they are marketed in the form of azo-acid dyes etc. All of these dyes
having phenolic motif, containing hydroxyl group as an auxochrome group. Such
auxochromic(-OH) and chromophoric (>C=O) group containing compound The area in which
the acid azo dyes formation based on this compound may yield the dyes with good hue
properties. Hence, in continuation of our earlier work 9-10
, it was thought interesting to explore
the field of acid azo dyes based on 1-(4-N-acetyl amino) 2-methoxy phenyl 2-chloro ethanone.
The proposed synthetic route is shown in Scheme 1.
Materials and Methods :
All the chemicals used were of analytical reagent grade and were used without further
purification, All the product were synthesized and characterized by their spectral analysis, All
Chemicals and solvents like acetone, ethanol, NaNO2, NaOH, sodium acetate were purchased
from S.D.fine chemicals (india).
Melting points were taken by open capillary tube and are uncorrected.. The UV-Visible
spectra were recorded in DMF using Shimadzu A-200 Spectrophotometer and C,H,N of all
disperse dyes were estimated by the means of a carlo Erba elemental analyzer (Italy) The
characteristic data of different molecules were studied their light, wash fastness properties
and further study applied on wool fibers and nylon fibers.
Experimental :
Synthesis of acid azo dyes :
First 4-methoxy aniline was dissolve in a mixture of anhydrous actetone And pyridine in
250ml flask then added dropwise to a mixture of 1-(4-N-acetyl amino) 2-methyl phenyl 2-
chloro ethanone and sodiumbicarbonate as an accepter.The reaction mixture is set aside
over night. Then resultant product were hydrolysis by refluxing with ethanol containg HCl
for 4-5 hours . The cool solution was dilute with water and was mass just alkaline with
544 Online International, Refereed, Impact factor & Indexed Monthly Journal www.raijmr.com RET Academy for International Journals of Multidisciplinary Research (RAIJMR)

International Journal of Research in Modern Engineering and Emerging Technology (IJRMEET) UGC Approved id_47203
Vol. 5, Sp. Issue: 9, Sept.: 2017 (IJRMEET) ISSN: 2320-6586
545 Online International, Refereed, Impact factor & Indexed Monthly Journal www.raijmr.com RET Academy for International Journals of Multidisciplinary Research (RAIJMR)
conc.NH3 solution (d= 0.880) to give yield 1-(4-N-acetyl amino) - 2-(N-methyl phenyl
amino) ethanone. Diazotization of various aromatic acid was performed by a reported
method [11-13] .The yield was dissolved in HCl with stirring and the solution cooled to 0-
5°C in an ice-bath . A solution of sodium nitrite (0.01 mole) in 5ml water cooled to 0°C then
was added .The excess nitrous acid was neutralized with sulfamic acid/urea (1.0 gm) and the
mixture was filtered to get the clear diazonium salt solution. R1-R6 coupling component was
dissolved in NaOH (15 ml) and then solution cooled 0-5˙c To this well stirred solution the
above diazonium salt solution was added slowly so that temperature did not rise above 0-5˙c
while maintaining the pH 4-5 by the action of sodium acetate solution (10% w/v) the mixture
was stirred for 3 hrs. at 0-5°C.After completion of the reaction the solid material was filtered,
washed and dried it. So R1-R6 acid azo dyes were prepared.
Results and Discussion :
The acid azo dyes obtained from this compounds are shown in Scheme-I
The observed bands in the IR spectra for each dye are shown in Table-I,
IR spectra of all seven series of acid azo dyes contain aromatic nuclei, azo group
and hydroxyl group. The band appeared from 1030 to 1350 cm-1
due to primary –OH group,
The strong band at 1610 to 1640 cm-1
appeared in the spectra are considered for the presence
of azo (-N=N-) group. The bands around of 6505 to 1050 cm-1
are attributed to the presence
of –SO3OH group. In the spectra of dyes obtained from aniline derivatives side chain
attached to the tertiary nitrogen The broad band around 3445-3540 comprises to primary
stretching. The weak bands observed 2890-and 2950 cm-1
which is attributed to the -CH2
stretching vibration.
The IR spectra of all dyes comprise the important bands due to initial diazo
component. The bends due to –CH3 stretching 2905-2930 and 1320-1475 cm-1
and -CO of -
COCH2 aniline (-CH3) . The other bands due to presence of coupling component are their
respective positions. The elemental of C,H,N confirmed by Table: II.
The visible absorption spectroscopic properties of the all dyes were recorded in DMF.
Absorption maximum (λmax), Intensities’ ( log ε), dyeing assessment of acid azo dyes on

International Journal of Research in Modern Engineering and Emerging Technology (IJRMEET) UGC Approved id_47203
Vol. 5, Sp. Issue: 9, Sept.: 2017 (IJRMEET) ISSN: 2320-6586
546 Online International, Refereed, Impact factor & Indexed Monthly Journal www.raijmr.com RET Academy for International Journals of Multidisciplinary Research (RAIJMR)
Wool and Nylon fabrics are shown in Table-III, The absorption maximum (λmax) of all the
dyes falls in the range 471-527 nm in DMF. The values of the logarithm of molar extinction
coefficient ( log ε) of all the dyes were in the range of 3.910-4.921 , consistent with their
medium absorption intensity The disperse azo dyes were applied at a 2% dye bath on nylon
and wool fabrics and gave various shade implied in Table-III.
Conclusion :
The azo disperse dyes have been prepared using based on 1-(4-N-acetyl amino)
- 2-(N-methoxy phenyl amino) ethanone. The present study prepared acid azo dyes showed
wide range of shades like Desert sandy, Rose like, Sandy, Pink, Crimson, Violet. They
showed good dyeing performance on wool and nylon fiber and The light fastness values of
the acid azo dyes are more consistent. The dyeing showed an fair and good fastness to light,
R-6 acid azo dyes was excellent fastness to washing and other dyes were with good to very
good fastness to washing.
Conclusion
Two brilliant azo dyes were successfully synthesized by standard methods of diazotization
and coupling using little variation of pH maintenance and methods of crystallization.
Brilliant crystals of 4-methoxybenzeneazo-2'-naphthol and 2-nitrobenzeneazo-2'-naphthol
were isolated and characterized by a number of spectroscopic methods. The results on the
elemental analysis and spectral studies of each dye were consistent and hence confirm the
predicted structure. The synthesized dyes showed excellent fastness to light, washing with
good fastness to rubbing. They also showed remarkable levelness after washing. The nature of
the substituents in the coupling components also showed little influence on the visible
absorption and the shade of the dyeing. The results showed that both the dyes exhibited very
slow rate of oxidation and also inhibited bacterial growth but the rate of oxidation of dye 2
was comparatively lower than dye 1 and hence resulted more antibacterial effect.

International Journal of Research in Modern Engineering and Emerging Technology (IJRMEET) UGC Approved id_47203
Vol. 5, Sp. Issue: 9, Sept.: 2017 (IJRMEET) ISSN: 2320-6586
547 Online International, Refereed, Impact factor & Indexed Monthly Journal www.raijmr.com RET Academy for International Journals of Multidisciplinary Research (RAIJMR)
Table : I Structure of the Coulping component and corresponding of novel azo dyes :
Dye No Coulping component Acid azo Dyes
R-1 NH2
SO3H
HNCH 2CO
CH3
N=N H3CO
NH2
SO3H
R-2
SO3H
NH2
HNCH 2CO
CH3
N=N
SO3H
NH2
H3CO
R-3
NH2
SO3H
HNCH 2CO
CH3
N=N
NH2
SO3H
H3CO
R-4
HO3S
NH2
SO3H
HNCH 2CO
CH3
N=N
HO3S
NH2
SO3H
H3CO
R-5
HO3S
OHNH2
HNCH 2CO
CH3
N=N
HO3S
OHNH2
H3CO
R-6
HO3S NH2
OH
HNCH 2CO
CH3
N=N
HO3S NH2
OH
H3CO
R-7
SO3H
OH
SO3H
NH2
HNCH 2CO
CH3
N=N
SO3H
OH
SO3H
NH2
H3CO

Ta
ble
: I
Po
siti
on
sel
ecte
d B
an
ds
in I
R S
pec
tra
of
Aid
azo
dy
es :
D
ye
No
P
rim
ary
am
ine
cm-1
C-H
Str
etch
ing
aro
ma
tic
cm-1
N=
N
Str
etch
ing
aro
ma
tic
cm-1
Na
pth
elen
e
Su
bst
itu
ted
cm-1
1,4
-di
Su
bst
itu
ted
cm-1
Pri
ma
ry
Alc
oh
ol
cm-1
T
erti
ary
Am
ine
cm-1
S
=O
Str
etch
ing
vib
rati
on
of
Su
lfo
nic
aci
d
cm-1
R-1
3
54
0
29
30
16
15
,14
70
16
30
15
70
15
75
,11
80
10
35
10
30
12
75
1
14
5
11
50
,10
35
65
5
R-2
3
45
0
29
50
,29
85
16
15
,14
25
16
40
15
65
15
65
11
55
10
30
12
60
1
15
5
11
50
,10
35
67
5
R-3
3
44
5
29
35
,16
15
14
75
,14
50
16
20
15
80
15
75
,11
60
10
25
10
30
12
40
,12
50
1
16
5
11
50
65
5
R-4
3
44
5
29
05
,29
50
15
15
,16
15
16
10
15
45
15
40
,11
45
10
55
10
30
12
40
1
14
5
11
50
,10
65
65
5
R-5
3
45
5
29
45
16
30
,16
15
16
10
16
20
15
80
15
75
,11
50
10
50
10
30
10
50
,13
50
1
15
5
11
95
,10
55
65
5
R-6
3
45
5
29
10
,15
80
15
25
16
20
15
25
15
20
,30
10
11
85
,10
55
10
50
13
00
1
14
5
11
85
,10
55
65
5
R-7
3
45
0
29
15
,15
70
15
15
16
20
16
25
16
20
,12
10
10
75
10
50
,
12
75
1
18
5
11
60
,10
50
65
5
All
th
es s
pec
tra
co
mp
ari
sed
th
e b
an
ds
aro
un
d 2
89
0 a
nd
29
50
cm
-1 p
rese
nte
d o
f -
CH
2
of
-C
OC
H2 g
rou
p
548 Online International, Refereed, Impact factor & Indexed Monthly Journal www.raijmr.com RET Academy for International Journals of Multidisciplinary Research (RAIJMR)
International Journal of Research in Modern Engineering and Emerging Technology (IJRMEET) UGC Approved id_47203
Vol. 5, Sp. Issue: 9, Sept.: 2017 (IJRMEET) ISSN: 2320-6586

Ta
ble
: I
I C
ha
ract
eriz
ati
on
of
no
vel
Aci
d a
zo d
yes
:
Dy
e N
o
Mo
lecu
lar
Fo
rmu
la
Mo
l.W
t
(gm
/mo
le)
Mel
tin
g
Po
int
˙C
%
C
%
H
%
N
Fo
un
d
Ca
l F
ou
nd
C
al
Fo
un
d
Ca
l
R-1
C
26H
22N
4O
5S
5
04
21
7
61
.90
61
.93
4.3
6
4.4
6
11
.11
11
.12
R-2
C
26H
22N
4O
5S
5
04
22
0
61
.90
61
.93
4.3
6
4.4
6
11
.11
11
.12
R-3
C
26H
22N
4O
5S
5
04
21
2
61
.90
61
.93
4.6
0
4.4
6
11
.11
11
.12
R-4
C
26H
22N
4O
8S
2
60
0
23
2
52
.00
52
.10
3.6
6
3.7
0
9.3
3
9.4
0
R-5
C
26H
22N
4O
6S
5
20
23
5
60
.0
60
.1.
4.2
3
4.2
5
10
.76
1
0.8
0
R-6
C
26H
22N
4O
6S
5
20
23
0
60
.0
60
.1.
4.2
3
4.2
5
10
.76
1
0.8
0
R-7
C
26H
22N
4O
S2
60
0
24
4
52
.00
52
.10
3
.66
3.7
0
9.3
3
9.4
0
Ta
ble
:II
I A
bso
rpti
on
ma
xim
am
(λm
ax
), I
nte
nsi
tes
( lo
g ε
), A
cid
azo
dy
es o
n W
oo
l a
nd
Ny
lon
fa
bri
cs :
Dy
e
λm
ax
(n
m)
Lo
g ε
S
ha
de
Dy
ein
g p
rop
erti
es
Dy
ein
g o
n
wo
ol
Dy
ein
g o
n n
ylo
n
L
W
L
W
R-1
4
78
.0
4.2
16
D
eser
t S
an
dy
5
4
5
4
R-2
4
85
.0
4.6
78
R
ose
lik
e 5
3
5
3
R-3
4
71
.0
4.3
95
S
an
dy
4-5
4
4
-5
4
R-4
5
27
.0
3.9
10
P
ink
4
-5
4
4-5
4
R-5
5
26
.0
4.4
45
P
ink
4
3
4
3
R-6
5
13
.0
4.8
41
C
rim
son
5
5
5
5
R-7
5
18
.0
4.9
21
V
iole
t 5
4
5
4
Lig
ht
fast
nes
s: 1
-po
or,
2-s
lig
ht,
3-m
od
era
te,
4-f
air
, 5
-go
od
, 6
-ver
y g
oo
d.
Wa
sh
fast
nes
s: 1
-po
or,
2-f
air
, 3
-go
od
, 4
-ver
y g
oo
d,
5-e
xce
llen
t.
549 Online International, Refereed, Impact factor & Indexed Monthly Journal www.raijmr.com RET Academy for International Journals of Multidisciplinary Research (RAIJMR)
International Journal of Research in Modern Engineering and Emerging Technology (IJRMEET) UGC Approved id_47203
Vol. 5, Sp. Issue: 9, Sept.: 2017 (IJRMEET) ISSN: 2320-6586

International Journal of Research in Modern Engineering and Emerging Technology (IJRMEET) UGC Approved id_47203
Vol. 5, Sp. Issue: 9, Sept.: 2017 (IJRMEET) ISSN: 2320-6586
550 Online International, Refereed, Impact factor & Indexed Monthly Journal www.raijmr.com RET Academy for International Journals of Multidisciplinary Research (RAIJMR)
Reaction scheme-I
NHCOCH 3
CH3
ClCH2CO+
Anhydrous AcetoneSodium bicarbonated
as an acid acceptor
Diazotisation
0-5. C
1-(4-N-acetyl amino)-2-methyl Phenyl 2-Chloro ethanone
1-(4-acetyl amino-2-methyl phenyl)-2-(N-4-methoxy phenyl amino) ethanone
Hydrolysis
(i) HCl,ethanol
(ii) NH3
1-(4-amino-2-methyl phenyl)- 2- (N-4-methoxy phenyl) ethanone
Coupling Component
NH2
4- Methoxy Aniline
H3CO
NHCOCH 3
CH3
-NHCH 2CO-H3CO
HCl,NaNO 2 NH2
CH3
-NHCH 2CO-H3CO
CH3
-NHCH 2CO- N=N-Cl
Diazonium Salt
H3CO
Acid azo dyes
CH3
-NHCH 2CO- N=N-H3CO

551 Online International, Refereed, Impact factor & Indexed Monthly Journal www.raijmr.com RET Academy for International Journals of Multidisciplinary Research (RAIJMR)
R-1 Laurent’s acid NH2
SO3H
R-5 Gamma acid
HO3S
OHNH2
R-2 Bronner’s acid
SO3H
NH2
R-6 J-acid
HO3S NH2
OH
R-3 Tobias acid
NH2
SO3H
R-7 Chicago acid
SO3H
OH
SO3H
NH2
R-4 H-acid
HO3S
NH2
SO3H
References :
1. Zollinger, H.,. Color Chemistry-Synthesis, Properties and Application of Organic
Dyes and Pigments, VCH publishers, New York, 1987, 92-102.
2 Maynard, C. W., Riegel’s Handbook of Industrial Chemistry, 3rd ed. Van Nostard
Reinhold,New York, 1983, 809-861
3. catino S. C and Farris, R. E., Concise Encyclopedia of Chemical Technology, M.
Grayson Ed., John Wiley & sons, New York, 1985,142.
4. Cumming W M and Howie G, J Chem Soc., 1933, 133.
5. Peters A T and Walker D, J Chem Soc., 1956, 429.
7. Gordon P F and Gregory P, Organic Chemistry in Colour, 1st Ed., Springer-Verlag
Berlin Heidelberg: New York, 1983, 60.
8. Mohamed S K, Nour A M and El-Din, J Chem Res.,(s) 1999, 8, 508.
9. Naik R D, Desai C K and Desai K R, Oriental J Chem., 2000, 16, 159.
10 B.C.Dixit,H.M.Patel,D.J.Desai,R.B.Dixit,E-J. chem..2009,6(2), 315.

International Journal of Research in Modern Engineering and Emerging Technology (IJRMEET) UGC Approved id_47203
Vol. 5, Sp. Issue: 9, Sept.: 2017 (IJRMEET) ISSN: 2320-6586
552 Online International, Refereed, Impact factor & Indexed Monthly Journal www.raijmr.com RET Academy for International Journals of Multidisciplinary Research (RAIJMR)
11 Vogel A I, A Textbook of Practical Organic Chemistry, 3rd Ed., Longman:London,
1961, p.620.
12 M.szymczyk,A.E.shafei,H.S.Freeman,Dye pign.2007,8,72.
13. H.E.Frirz-David,L.Blengy,Fundamental process of dye chemistry,3rd
edition, wiley,
Newyork,1949,p.241.

International Journal of Research in Modern Engineering and Emerging Technology (IJRMEET) UGC Approved id_47203
Vol. 5, Sp. Issue: 9, Sept.: 2017 (IJRMEET) ISSN: 2320-6586
553 Online International, Refereed, Impact factor & Indexed Monthly Journal www.raijmr.com RET Academy for International Journals of Multidisciplinary Research (RAIJMR)
A Preliminary investigation of cytotoxic and genotoxic
effect of nicotine on human cells
Sandeep Chovatiya*, Sharthak Zaveri and Dipika Patel
Ashok & Rita Patel Institute of Integrated Study and Research in Biotechnology and Allied
Science, New Vallabh Vidhyanagar – 388 120, Gujarat.
*Corresponding author email Id: [email protected]
Abstract:
The objective of the present study was to investigate the potential of nicotine to induce
micronucleated polymorphism in tobacco chewing individuals; as well as geneotoxic
effect of nicotine on chromosomes. In vivo and in vitro cytological studies carried out in
control and tobacco chewing individuals clearly indicated marked differences. In tobacco
chewing individuals, micronuclei (MN) formation was significantly higher along with an
increase the size of the nucleus. No significant cell mortality was observed in 10% and
20% nicotine treatment to the leucocytes by MTT assay. The results show that nicotine
causes significant genotoxic effect on leukocytes by comate assay and chromosome
abbreviation.
Key words: Nicotine, Chewing tobacco, Micronuclei, Cell viability
1. Introduction:
Nicotine is found in a wide variety of plants. However, the principal source of nicotine
exposure is through the use of tobacco and nicotine-replacement therapies such as
transdermal nicotine patches and nicotine-containing gum [1]. Nicotine is known to have
various toxic effects on humans. Also, nicotine is shown to have genotoxic effect on
human lymphocytes and tonsillar tissue [2]. Moreover the deaths caused by nicotine are
highest in comparison to deaths caused by other factors or diseases as shown in figure-1.
The exact effect of nicotine on human cells and DNA is still unknown and so a lot of
research still needs to be done in this field.

International Journal of Research in Modern Engineering and Emerging Technology (IJRMEET) UGC Approved id_47203
Vol. 5, Sp. Issue: 9, Sept.: 2017 (IJRMEET) ISSN: 2320-6586
554 Online International, Refereed, Impact factor & Indexed Monthly Journal www.raijmr.com RET Academy for International Journals of Multidisciplinary Research (RAIJMR)
Figure 1: Causes of Death in World Population (The Source is taken from a survey carried
out in USA and conducted by WHO).
Barbour et al. [3] showed a connection between smoking and Breast Cancer. Tobacco smoke
is highly addictive and has been linked to 20 percent of all deaths in the United States. It
contains many cancer causing chemicals such as nicotine, and almost one third of all cancer
deaths are related to tobacco use. Tobacco smoking has generally been considered to have
little or no association with breast cancer risk. Newer studies have challenged this conclusion
and suggested a connection between smoking and an increased risk of breast cancer, but more
investigation is needed to resolve this issue.
Kleinsasser et al. [2] showed that Nicotine demonstrates genotoxicity in human tonsillar tissue
and lymphocytes. To assess the genotoxicity of nicotine, the DNA damaging effect on human
lymphocytes and target cells from lymphatic tissue of the palatine tonsils from 10 healthy
patients was tested with the alkaline single-cell microgel electrophoresis (Comet) assay. The
degree of DNA migration, a measure of possible DNA single strand breaks, alkali labile sites,
and incomplete excision repair sites, was expressed as the Olive tail moment, the percentage
of DNA in the tail, and the tail length. One hour exposure to nicotine at 0.125, 0.25, 0.5, 1, 2,

International Journal of Research in Modern Engineering and Emerging Technology (IJRMEET) UGC Approved id_47203
Vol. 5, Sp. Issue: 9, Sept.: 2017 (IJRMEET) ISSN: 2320-6586
555 Online International, Refereed, Impact factor & Indexed Monthly Journal www.raijmr.com RET Academy for International Journals of Multidisciplinary Research (RAIJMR)
and 4 mM induced a statistically significant dose-dependent increase of DNA migration up to
3.8-fold and 3.2-fold in tonsillar cells and lymphocytes, respectively.
It is estimated that one in three people in the world will develop cancer at some stage in their
lives and that one in four will die from the disease. Smoking is the biggest risk factor for and
largest single cause of cancer and approximately one third of all cancer deaths are attributable
to smoking. Globally, one in five cancer deaths are caused by tobacco. In October 2009,
scientists from 10 countries met at the International Agency for Research on Cancer (IARC)
to reassess the carcinogenicity of several compounds, including tobacco. The review,
published by The Lancet Oncology, concludes that there is sufficient evidence to confirm that
smoking is a cause of 15 types of cancer namely: cancer of the bladder, bone marrow
(myeloid leukemia, cervix, colorectal (large bowel), kidney, larynx (voice box), liver, lung,
mouth (including lip and tongue), nose, esophagus (gullet), ovaries, pancreas, pharynx (throat)
and stomach. The report also states that there is some evidence to suggest that smoking is a
cause of breast cancer [4, 5].
About 92% of human cancers are derived from external and internal epithelium. No effective
techniques are available for making direct chromosome preparation from epithelium tissues.
Casartelli et al. [6] observed MN frequencies in exfoliated buccal cells in normal mucosa,
precancerous lesions and squamous cell carcinoma. They suggested a link of this bio-marker
with neoplastic progressions. The induction in vivo by carcinogens and mutagens is a sign of
the genotoxic effect of such substances. The MN assay in exfoliated cells is an innovative
genotoxicity technique and holds promise for the study of epithelial carcinogens. It is
considered to be a sensitive method for monitoring genetic damage [7].
Direct genotoxic effects of nicotine have been shown in human gingival fibroblasts [8] and
spermatozoa [9]. Furthermore, nicotine may also stimulate tumor development by non-
genotoxic mechanisms such as angioneogenesis [10, 11], growth stimulation [12], and
receptor-regulated cellular growth [13].
The present study reports the cytotoxic and genotoxic effects of chewing tobacco in ex-
foliated cells through MN assay; and on lymphocyte through MTT test, cellular apoptosis,
COMET assay and chromosomal aberrations through Metaphase plate preparation under in
vitro conditions.

International Journal of Research in Modern Engineering and Emerging Technology (IJRMEET) UGC Approved id_47203
Vol. 5, Sp. Issue: 9, Sept.: 2017 (IJRMEET) ISSN: 2320-6586
556 Online International, Refereed, Impact factor & Indexed Monthly Journal www.raijmr.com RET Academy for International Journals of Multidisciplinary Research (RAIJMR)
2. Materials and Methods
2.1. EXTRACTION OF NICOTINE BY SOXHLET ASSEMBLY:
Tobacco leaves were taken directly from fields. They were then dried and grinded to fine
powder and then placed in a thimble made of thick filter paper. The thimble was placed in a
soxhlet extractor which was placed onto a flask containing the extraction solvent. The Soxhlet
was then equipped with a condenser. The solvent i.e. distilled water was heated to reflux. The
cycle was repeated over and over for 6 hours to get a high concentration of the sample in the
solvent. Same process was repeated for tobacco obtained commercially (Budhalal, Budhalal &
Co. (Tobacco Merchant), Ahmedabad).
2.2. STUDY OF CYTOTOXIC EFFECTS OF CHEWING TOBACCO IN IN-VIVO
CONDITIONS:
2.2.1. How the subjects were chosen: The sample was collected from subjects who were
known to chew tobacco from last 5-8 years.
2.2.2. Oral smears were obtained from the subjects as follows: The subjects were asked
to rinse their mouth thoroughly with water. A pre moistened wooden spatula/toothpick was
used to collect the cells from the oral mucosa. The spatula was applied to a pre-cleaned
slide to prepare the smear [7].
2.2.3. Staining of cheek cells with Giemsa for identification of Micronulei: Smears were
air dried fixed in 80% methanol and stained with Giemsa solution. Cheek cells were
observed under 10X and 40X compound microscope for observation of micronuclei [7].
2.3. VIABILITY ASSAY:
The blood cells were cultured in falcon tubes as in leukocyte culturing. After 24 hours of
incubation, cells were treated with sample of 10% and 20% nicotine and again incubated for
48 hours. After that cell suspension was taken and 1:1:1 dilution of the suspension was
prepared using cells with media, 0.4% trypan blue solution and doubled distilled water. The
suspension was loaded on a hematocytometer and immediately observing under microscope.

International Journal of Research in Modern Engineering and Emerging Technology (IJRMEET) UGC Approved id_47203
Vol. 5, Sp. Issue: 9, Sept.: 2017 (IJRMEET) ISSN: 2320-6586
557 Online International, Refereed, Impact factor & Indexed Monthly Journal www.raijmr.com RET Academy for International Journals of Multidisciplinary Research (RAIJMR)
2.4. MTT TEST:
The MTT assay was used to determine the effect of nicotine on cell growth / proliferation. A
96-well plate was seeded with 100 µl hematocytes along with the media incubated for 24
hours in incubator at 37 °C. After completion of incubation the cells were treated with 10%
and 20% nicotine, while control well was exempted from addition of sample and the plate was
again incubated at 37 °C for 48 hours. After incubation, plate was removed from incubator and
20 µl MTT reagent solution (1mg/ml; prepared in 1X PBS) was added. The plate was then
incubated for 3 hours. After that the 100 µl stop solution i.e. DMSO was added and
precipitates were allowed to dissolve for 1 hour followed by spectrophotometric analysis at
490 nm. The results were expressed as percentage of untreated control in RPMI 1640 culture
medium.
2.5. DETERMINATION OF CELLULAR APOPTOSIS:
To evaluate whether nicotine induce apoptosis or not, the blood cells were cultured in falcon
tubes and sample added and incubated as seen in cell viability assay. After incubation, cells
were washed with NH4Cl at 1500 rpm for 10 minutes until white pellet was obtained. The
obtained pellet was suspended in 200 μl saline solution (1X PBS). 100 µl of Hoechst 33342 (1
µg/ml) was added, mixed by inverting 3-4 times and kept in incubator at 37 °C for 40-45
minutes. Then suspension was centrifuged at 1500 rpm for 10 minutes and pellet resuspended
in 50 µl of 1X PBS. A drop of the prepared suspension was placed on clean slide, covered by
a coverslip and observed under fluorescent microscope.
2.6. COMET ASSAY:
The alkaline version of comet assay was performed according to Singh et al. [14] with a slight
modification. The culture was prepared and sample added as shown in leukocyte culturing and
then incubated for 48 hours. Harvesting was done using 10 ml mixture of 0.85% ammonium
chloride (NH4Cl), 0.1% SDS and a pinch of EDTA (for lyses of RBCs) and centrifuged at
1500 rpm for 10 minutes. Centrifugation was repeated until white pellet was obtained. The
white pellet obtained was suspended in 100 μl PBS. Meanwhile, a thin layer of normal
melting agarose (1%) was prepared on clean, grease free slides was allowed to solidify. Now
on the solidified NMA slides, 20 μl of the obtained white pellet (suspended in PBS) was

International Journal of Research in Modern Engineering and Emerging Technology (IJRMEET) UGC Approved id_47203
Vol. 5, Sp. Issue: 9, Sept.: 2017 (IJRMEET) ISSN: 2320-6586
558 Online International, Refereed, Impact factor & Indexed Monthly Journal www.raijmr.com RET Academy for International Journals of Multidisciplinary Research (RAIJMR)
added at the centre followed by addition of 5 μl of sample (10% and 20% nicotine). The
mixture was properly mixed using a micropipette. Now ~40 μl of low melting agarose (0.5%)
was added over the mixture and allowed to solidify. The prepared slides were kept in lysing
solution (Stock: 14.6 gm-NaCl, 3.72 gm-EDTA, 0.12-gm Tris HCl, 0.8 gm-NaOH in 100 ml
distilled water, pH 10. Working (freshly prepared): 36 ml Stock solution, 4 ml DMSO, 0.4 ml
Triton X-100) for 2 hours. After 2 hours the slides were removed from the lysing solution and
kept in an electrophoretic unit filled with electrophoresis buffer (3 gm-NaOH, 0.075 gm
EDTA in 250 ml D/W, pH >13). The slides were allowed to run for 20 minutes at 50V/300
mA. Immediately the slides were transferred in a neutralizing buffer (4.85 gm-tris buffer in
1000 ml D/W, pH 7.5) for 10 minutes. The slides were lastly stained with 80 μl EtBr (0.1
mg/ml) and left for 5 minutes. Slides were washed with PBS to remove excess stain and
observed under florescence microscope.
2.7. LEUKOCYTE CULTURING:
For leukocyte culture, blood was collected from the healthy donor in heparinized tubes.
Cultures containing RPMI 1640 (0.8 ml), Blood (0.4ml) 15 % fetal calf serum (1.5ml), PHA
(0.1ml), and antibiotics were incubated at 37 °C for 72 h. Then 75 μl of 10% and 20%
prepared solution of tobacco extract was added in 4 experimental tubes (2 each respectively)
after completion of 24 hours of incubation. Control culture tubes were incubated without
tobacco extract. Two hours prior to harvesting, 20 µl EtBr (1 mg/ml) was added to all culture
tubes. After that 75 µl colchicine (0.2 mg/ml) was added to culture tubes 1 hour prior to
harvesting. For harvesting of cells, the culture was first centrifuged at 1000 rpm for 5 minutes
and 8 ml hypotonic solution (560 mg KCl/100 ml) was added to the pellet followed by
incubation in water bath at 37 0C for 35 minutes. After that, 1 ml of chilled fixative (Methanol
and Glacial Acetic Acid in 3:1 ratio) was added followed by centrifugation at 1000 rpm for 5
minutes. Supernatant was discarded and again 6-7 ml of chilled fixative was added and
centrifuged. This step was repeated twice until white pellet was obtained. The obtained white
pellet was suspended in 1 ml of fixative, and slides were prepared by putting few drops of
solution on wet slide and were dried followed by staining with 8% Giemsa for 20 minutes
[15].

International Journal of Research in Modern Engineering and Emerging Technology (IJRMEET) UGC Approved id_47203
Vol. 5, Sp. Issue: 9, Sept.: 2017 (IJRMEET) ISSN: 2320-6586
559 Online International, Refereed, Impact factor & Indexed Monthly Journal www.raijmr.com RET Academy for International Journals of Multidisciplinary Research (RAIJMR)
3. RESULTS AND DISCUSSION:
3.1. STUDY OF CYTOTOXIC EFFECTS OF CHEWING TOBACCO IN IN-VIVO
CONDITIONS BY OBSERVING THE FORMATION OF MICRONUCLEI:
The results of micronucleus (MN) analysis of oral epithelial cells from person chewing
tobacco and, those not chewing tobacco are shown in figure-2. All the experimental samples
were found to chew different types of tobacco, 4-6 times a day, consuming approximately 2-5
gms of tobacco/day. All of them seem to be taking tobacco since last 5-8 years. Apart from
tobacco chewing habit, subjects in experimental samples seem to be not taking any other
cytotoxic agents like alcohol, tobacco in smoking form, drug etc.
Figure 2: Smear of oral exfoliated cells. Arrow indicates the presence of
micronuclei. (A) Control (B) Subject.
Results suggest that controls do not show any micronuclei and so were not taking any
cytotoxic agents. Micronucleus assays was performed on oral exfoliated cells of subjects
chewing tobacco and not chewing tobacco, using conventional giemsa staining. The
experimental subjects showed a significantly higher micronucleus frequency than the control.
Tobacco is a primary cause of cancer. Cigarette smoke is identified as a factor involved in the
early stages of tumorogenesis, especially lung cancer and may also be involved in other
organs example, Mouth, Pharynx and Bladder [16]. MN methods have been used for
diffracting genotoxic effects in human lymphocytes and in oral mucosa cell as well. Halder et
al [7] suggested the role of MN frequency as a marker of epithelial carcinogenic progression.
According to MN assay is reliable and technically easy to perform and is an efficient
alternative to the metaphase analysis. It can also be used as marker of epithelial carcinogenic
progression. MN is considered to be the result of chromosome fragments or whole
chromosome lagging behind the genome at the cell division. They arise from fragments

International Journal of Research in Modern Engineering and Emerging Technology (IJRMEET) UGC Approved id_47203
Vol. 5, Sp. Issue: 9, Sept.: 2017 (IJRMEET) ISSN: 2320-6586
560 Online International, Refereed, Impact factor & Indexed Monthly Journal www.raijmr.com RET Academy for International Journals of Multidisciplinary Research (RAIJMR)
produced by chromosome breaks, by certain types of chromatid interchanges and from whole
chromosomes. At telophase, they form a small nucleus near the main one from which they are
derived.
3.2. CELL VIABILITY:
The viability of cells can be analyzed by staining cells with trypan blue. Live cell exclude dye
from entering because of intact cell-membrane and thus remained colourless while the dead
cells were stained blue. The result showed that there was no significant effect on cell viability
and most of the cells treated with different concentration of sample remained viable. The
viability of cell in control was almost 100 %, while it was 99% and 95% in cells treated with
10% and 20% nicotine respectively. There was no observable change in cell morphology.
Kleinsasser et al. [2] showed that nicotine did not exert cytotoxic effects in any of the
experiments based on the trypan blue test. Cell viability was well above 75% in both cell types
before and after exposure to nicotine. In another experiment to study effect of nicotine on cell
viability and morphology of human fibroblasts, the test results revealed that more unviable
cells were found in the groups exposed to nicotine, in comparison with the control group.
Moreover, with increasing doses of nicotine there was a directly proportional increase in the
number of unviable cells [17]. It was also shown that Cigarette smoke condensate at 50 lg/mL
induced a moderate increase in cell viability, whereas the corresponding nicotine
concentration (3.2 lg/mL) did not produce this response. Cigarette smoke condensate at 250
lg/mL, but not nicotine at 16 lg/mL (the corresponding nicotine concentration) induced cell
death [18]. To understand the effects of nicotine in human retinal pigment epithelial (ARPE-
19), human microvascular endothelial cells (HMVEC) and rat neurosensory retinal (R28)
cells, ARPE-19, HMVEC and R28 cell cultures were treated with 10-2
and 10-4
nicotine for 24
h. Trypan blue dye exclusion assay was performed. With 10-2
M nicotine treatment, R28 cell
cultures and HMVEC cultures showed decreased cell viability, while ARPE-19 cells showed
no change in cell viability [19].
3.3. MTT ASSAY:
The cytotoxic effect of nicotine on cell proliferation of hematocytes was evaluated by using
MTT assay. The graph obtained is shown below:

International Journal of Research in Modern Engineering and Emerging Technology (IJRMEET) UGC Approved id_47203
Vol. 5, Sp. Issue: 9, Sept.: 2017 (IJRMEET) ISSN: 2320-6586
561 Online International, Refereed, Impact factor & Indexed Monthly Journal www.raijmr.com RET Academy for International Journals of Multidisciplinary Research (RAIJMR)
Figure 3: Cell viability at 10% and 20% nicotine concentration by MTT test
The results showed that upon incubation with nicotine for 48 hour, there was a dose-
dependent increase in mitochondrial dysfunction within cells. There was a statistically
countable difference in cell viability by various concentration of nicotine, compared to the
untreated control. Though there was notable decrease in mitochondrial dysfunction in treated
cell, the overall viability of cell remain >95%. Nicotine inhibited the proliferation of
immortalized and malignant keratinocytes in dose- and time-dependent manners as
determined by MTT assay [20]. The significant decrease of MTT reduction and increase of
lipid peroxidation in PC12 cells were only observed at treatments with high concentrations of
nicotine (1 and 10 mM) [21].
3.4. CELL APOPTOSIS:
The nuclear chromatin of cells was stained with Hoechst 33342 fluorochrome, followed by
observation under a fluorescence microscope. Apoptotic cells were distinguished from viable
cells by observing the condensed chromatin which was of bright blue colour, while viable
cells showed light blue colour. Nicotine showed dose dependent apoptotic effects on
lymphocyte cells, compared with untreated cells.
100%
97.51%
95.91%
93.0%
94.0%
95.0%
96.0%
97.0%
98.0%
99.0%
100.0%
0 10% 20%
% V
iab
ility
of
cell
Nicotine Concentration
% Viability of cells at different nicotine concentration

International Journal of Research in Modern Engineering and Emerging Technology (IJRMEET) UGC Approved id_47203
Vol. 5, Sp. Issue: 9, Sept.: 2017 (IJRMEET) ISSN: 2320-6586
562 Online International, Refereed, Impact factor & Indexed Monthly Journal www.raijmr.com RET Academy for International Journals of Multidisciplinary Research (RAIJMR)
Figure 4: Fluorescent photograph of lymphocyte cells stained with Hoechst 33342.
(A)Control (B) 20% nicotine. The arrow indicates the brightly blue stained
chromatin of dead cells.
The results indicate that as nicotine concentration increases there is a gradual increase in the
no. of apoptotic cells (Figure 4). Control as well as culture with 10% nicotine did not show
any apoptotic cell while culture with 20% nicotine showed very few (~1-2) apoptotic cell/s.
Hoechst 33342 is a popular cell-permeant nuclear stain that emits blue fluorescence when
bound to dsDNA [22]. Hoechst 33342 induce apoptosis in the HL-60 cells in a time- and dose-
dependent manner [23]. Nicotine induces paradoxical effects that might alternatively enforce
survival or trigger apoptosis. Nicotine acts as an inducer of apoptosis in normal or transformed
lymphocytes, and possibly other non-neuronal cells [24]. When the rats were pretreated by
nicotine, neuronal degeneration was attenuated. This observation was confirmed by Hoechst
33342 staining which allowed identifying of cells with condensed, fragmented nuclei, which
has been proposed to be a vital sign of apoptosis [25].

International Journal of Research in Modern Engineering and Emerging Technology (IJRMEET) UGC Approved id_47203
Vol. 5, Sp. Issue: 9, Sept.: 2017 (IJRMEET) ISSN: 2320-6586
563 Online International, Refereed, Impact factor & Indexed Monthly Journal www.raijmr.com RET Academy for International Journals of Multidisciplinary Research (RAIJMR)
DNA level damage at every individual cell level can be measured by the comet assay.
Figure 5: Effect of nicotine and formation of comet tail (A) Control-20X (B) Cells
treated with 20% nicotine-45X
The results show that nicotine causes significant genotoxic effect on leukocytes. The DNA
damage can be visualized as the length of comet tail formed (Figure 5). The alkaline single-
cell microgel electrophoresis (Comet) assay is a sensitive tool for detection of DNA single
strand breaks, as well as foralkali labile and incomplete excision repair sites [26].
Lymphocytes and mucosal cells as human target cells have been analyzed by this method [27].
Kleinsasser et al., [2] showed that 1 hr of incubation with nicotine induced a significant
concentration-dependent increase in DNA migration in the Comet assay in tonsillar cells as
well as in peripheral lymphocytes from the same donors. When highly pure nicotine from two
different commercial sources was used, the significant concentration dependent DNA damage
by nicotine was confirmed for both tonsillar cells and peripheral lymphocytes. There was no
difference in DNA migration as far as the source of nicotine was concerned. A similar effect
was shown previously for myosmine, a minor tobacco alkaloid that also occurs in a variety of
foods, e.g., cereals, nuts, cocoa, and dairy products [2, 28]. Nicotine was equally genotoxic to
lymphocytes and tonsillar cells. This finding is in contrast to results obtained for other
3.5. COMET ASSAY:

International Journal of Research in Modern Engineering and Emerging Technology (IJRMEET) UGC Approved id_47203
Vol. 5, Sp. Issue: 9, Sept.: 2017 (IJRMEET) ISSN: 2320-6586
564 Online International, Refereed, Impact factor & Indexed Monthly Journal www.raijmr.com RET Academy for International Journals of Multidisciplinary Research (RAIJMR)
genotoxic compounds such as vanadium and, to a lesser extent, phthalates and myosmine,
which were more genotoxic to lymphocytes than to mucosal cells [2]. An analysis of a
possible influence of smoking status on DNA migration in the negative controls showed no
significant differences. This finding is in line with results of Hoffmann and Speit [29],
showing no differences in peripheral blood cells from heavy smokers and nonsmokers, in the
comet assay. A significant increase was observed in Olive tail moment and tail length was
obtained when dose of nicotine was increased. Higher dose of nicotine showed significant
DNA damage while at lower conc. no damage was detected by comet assay [30].
3.6. LEUKOCYTE CULTURING:
Leukocyte culture in the presence of nicotin has exhibited different chromosomal aberrations
like ring chromosome, chromosome breaks and with total change in chromosomal
organization. Figure-6 shows that different chromosomal aberrations are observed. The results
found in tubes with 20% nicotine sample added to it, shows the formation of ring chromosome
as shown in Figure 6 (B), while chromosome condensation was observed Figure 6 (C) in
another culture.

International Journal of Research in Modern Engineering and Emerging Technology (IJRMEET) UGC Approved id_47203
Vol. 5, Sp. Issue: 9, Sept.: 2017 (IJRMEET) ISSN: 2320-6586
565 Online International, Refereed, Impact factor & Indexed Monthly Journal www.raijmr.com RET Academy for International Journals of Multidisciplinary Research (RAIJMR)
Figure 6: Metaphase plate showing chromosomes.(A) Control (B) & (C) Effect on
chromosome by treatment with 20% nicotine. (B) Ring Chromosome - Arrow
shows the occurance of ring chromosome (C) Completely Condensed Chromosome
Development of chromosomal aberrations in cultured leukocytes in the presence of nicotine
confirms the genotoxic effect of nicotine most probably by forming DNA adducts. Though we
could only check the effects of nicotine at the concentration of 10% & 20% only, the effects
of nicotine with different concentrations should further be studied for the proper evaluation of
genotoxic effect. When leukocytes were cultured with tobacco extract, chromosomal
aberrations like chromatid break, dicentric chromosomes, chromosome ring formation and
complete change in the organization could be observed. In a similar observation, elevated
chromosomal aberration frequencies in smokers have been reported [31, 32]. The review,
published by The Lancet Oncology, concludes that there is sufficient evidence to confirm that
smoking is a cause of 15 types of cancer [5]. Tobacco metabolites formed in the form of
carcinogens form DNA adducts, usually with adenine or guanine. DNA adducts which escape
cellular repair could persist and may lead to miscoding and mutation [33].
4. CONCLUSION:
The findings suggest that micronuclei assay of oral epithelial cells can be used as simple
markers for understanding genotoxic damage caused by chewing tobacco products by people
and they can be warned for possible development of cancer later in life. We could also
confirm the genotoxic effects of tobacco in in-vitro conditions on cultured leukocytes by
studying chromosomal aberrations and by performing comet assay. The formation of comet
tail on cultured leukocytes indicates the DNA damage done by nicotine. Though there is no
significant change in cell viability or cell apoptosis we could conclude that nicotine causes a
dose-dependent damage on human hematocytes. As the concentration of nicotine increases
there is a gradual decrease in viable cells and an increase in apoptotic cells. The exact
genotoxic and cytotoxic effect of nicotine is still not known and thus a further research needs
to be focused in this field.

International Journal of Research in Modern Engineering and Emerging Technology (IJRMEET) UGC Approved id_47203
Vol. 5, Sp. Issue: 9, Sept.: 2017 (IJRMEET) ISSN: 2320-6586
566 Online International, Refereed, Impact factor & Indexed Monthly Journal www.raijmr.com RET Academy for International Journals of Multidisciplinary Research (RAIJMR)
5. ACKNOWLEDGEMENTS
The author would like to thanks Dr. Joshi and Dr. Rank, Veterinary Dept. Anand Agriculture
University, Anand, Gujarat for provides the microscopy facility. The author would also like to
thank SICART, Vallabh Vidhyanagar, Gujarat for instrumental facility.
6. REFERENCES:
[1] Heisheman, S.C., Taylor, R.C. and Henningfield, J.E. Nicotine and smoking: a review of
effects on human performance, Exp. Clin. Pharmacol. (1994), 2: 345–395.
[2] Kleinsasser NH et al. - Toxicological Sciences, (2005), 86(2), 309–317.
[3] Barbour S. Warren et al. - Cornell University Program on Breast Cancer and
Environmental Risk Factors in New York State (BCERF) (2002).
[4] Peto R et al. Mortality from smoking in developed countries 1950-2000 (2nd edition)
Oxford University Press (2004).
[5] Straif Kurt et al. The Lancet Oncology, (2009), 10 (11), 1033 – 1034.
[6] Casartelli G, Bonatti S, De Ferrari M, Scala M, Mereu P, Margarino G, Abbondandolo A.
Micronucleus frequencies in exfoliated buccal cells in normal mucosa, precancerous lesions
and squamous cell carcinoma. Anal Quant Cytol Histol. (2000), 22(6):486-92.
[7] Halder A., T. Chakraborty, K. Mandal, P. K. Gure, S. Das, R. Raychowdhury and A.
K. Ghosh Comparative Study of Exfoliated Oral Mucosal Cell Micronuclei frequency in
Normal, Precancerous and Malignant Epithelium. Int J Hum Genet, (2004), 4(4), 257-260.
[8] Argentin, G., and Cicchetti, R. Genotoxic and antiapoptotic effect of nicotine on human
gingival fibroblasts. Toxicol. Sci. (2004), 79, 75–81.
[9] Arabi, M. Nicotinic infertility: assessing DNA and plasma membrane integrity of human
spermatozoa. Andrologia, (2004), 36, 305–310.
[10] Heeschen, C., Jang, J. J., Weis, M., Pathak, A., Kaji, S., Hu, R. S., Tsao, P. S., Johnson,
F. L., and Cooke, J. P. Nicotine stimulates angiogenesis and promotes tumor growth and
atherosclerosis. Nat. Med. (2001), 7, 835–841.
[11] Cooke, J. P., and Bitterman, H. Nicotine and angiogenesis: A new paradigm for tobacco-
related diseases. Ann. Med. (2004), 36, 33–40.
[12] Shin, V. Y.,Wu,W. K. K., Ye, Y.-N., So,W. H. L., Koo, M.W. L., Liu, E. S. L., Luo, J.-
C., and Cho, C.-H. Nicotine promotes gastric tumor growth and neovascularization by

International Journal of Research in Modern Engineering and Emerging Technology (IJRMEET) UGC Approved id_47203
Vol. 5, Sp. Issue: 9, Sept.: 2017 (IJRMEET) ISSN: 2320-6586
567 Online International, Refereed, Impact factor & Indexed Monthly Journal www.raijmr.com RET Academy for International Journals of Multidisciplinary Research (RAIJMR)
activating extracellular signal-regulated kinase and cyclooxygenase-2. Carcinogenesis, (2004),
25, 2487–2495.
[13] Schuller, H. M., Plummer, H. K., and Jull, B. A. Receptor-mediated effects of nicotine
and its nitrosated derivative NNK on pulmonary neuroendocrine cells. Anat. Rec., (2003),
270A, 51–58.
[14] Singh NP, McCoy MT, Tice RR, Schneider EL. A simple technique for quantitation of
low levels of DNA damage in individual cells. Experimental Cell Research. (1988)
175(1):184–191.
[15] Patel R. K., Radhakrishna U. and Khoda V. K.. A modified technique of GTG banding in
Cattle and buffaloes. The Nucleus. (1995), 38: 37-39.
[16] Rowland RE, Harding KM. Increased sister chromatid exchange in the peripheral blood
lymphocytes of young women who smoke cigarettes. Hereditas, (1999), 131(2):143-6.
[17] Martinez AE, Silverio KG, Rossa C Jr. - Effect of nicotine on the viability and
morphology of fibroblasts: in vitro study. Brazilian Oral Research. (2002), 16(3):234-8.
[18] Silva D, Cáceres M, Arancibia R, Martínez C, Martínez J, Smith PC. Effects of cigarette
smoke and nicotine on cell viability, migration and myofibroblastic differentiation. Journal of
Periodontal Res. (2012), 47(5):599-607.
[19] Patil AJ, Gramajo AL, Sharma A, Seigel GM, Kuppermann BD, Kenney MC.
Differential effects of nicotine on retinal and vascular cells in vitro. Toxicology. (2009),
259(1-2):69-76.
[20] Lee HJ, Guo HY, Lee SK, Jeon BH, Jun CD, Lee SK, Park MH, Kim EC. Effects of
nicotine on proliferation, cell cycle, and differentiation in immortalized and malignant oral
keratinocytes. Journal of Oral Pathology and Medicine, (2005), 34(7): 436-43.
[21] Guan ZZ, Wen-Feng Yu, Agneta Nordberg (2003) - Dual effects of nicotine on oxidative
stress and neuroprotection in PC12 cells. Neurochemistry international. Volume 43, Issue 3,
August 2003, Pages 243–249.
[22] Oriowo OM, Cullen AP, Sivak JG. Impairment of eye lens cell physiology and optics by
broadband ultraviolet A-ultraviolet B radiation. Photochem Photobiol. (2002), 76:361–7.
[23] Zhang X, Chen J, Davis B, Kiechle F. Hoechst 33342 induces apoptosis in HL-60 cells
and inhibits topoisomerase I in vivo. Arch Pathol Lab Med. (1999), 123(10):921-7.

International Journal of Research in Modern Engineering and Emerging Technology (IJRMEET) UGC Approved id_47203
Vol. 5, Sp. Issue: 9, Sept.: 2017 (IJRMEET) ISSN: 2320-6586
568 Online International, Refereed, Impact factor & Indexed Monthly Journal www.raijmr.com RET Academy for International Journals of Multidisciplinary Research (RAIJMR)
[24] Oloris SC, Ashley A. Frazer-Abel, Cristan M. Jubala, Susan P. Fosmire, Karen M.
Helm, Sally R. Robinson, Derek M. Korpela, Megan M. Duckett, Shairaz Baksh and Jaime F.
Modiano. Nicotine-Mediated Signals Modulate Cell Death And Survival Of T Lymphocytes.
Toxicology and Applied Pharmacology. (2010), 242(3):299-309.
[25] Riljak V., M. Milotová, K. Jandová, J. Pokorný, M. Langmeier. Morphological changes
in the Hippocampus following nicotine and kainic acid administration. Physiol. Res. (2007),
56: 641-649.
[26] Lee E., Lee J., Sul D., and Lee J. Use of the tail moment of the lymphocytes to evaluate
DNA damage in human biomonitoring studies. Toxicol. Sci. (2004), 81, 121–132.
[27] Harrus U., Schmezer P., Kuchenmeister F. and Maier H. Genotoxic effect on human
mucous membrane biopsies of the upper aerodigestive tract. Laryngorhinootologie, (1999),
78, 176–181.
[28] Tyroller S., Zwickenpflug W., and Richter E. New sources of dietary myosmine uptake
from cereals, fruits, vegetables and milk. J. Agric. Food. Chem. (2002), 50, 4909–4915.
[29] Hoffmann H., and Speit G. Assessment of DNA damage in peripheral blood of heavy
smokers with the Comet assay and the micronucleus test. Mutat. Res., (2005), 581, 105–114.
[30] Sobkowiak R, Lesicki A. Genotoxicity of nicotine in cell culture of Caenorhabditis
elegans evaluated by the comet assay. Drug Chem Toxicol. (2009), 32(3):252-7.
[31] Obe G., Herha, J. Chromosomal aberrations in heavy smokers, Hum. Genet. (1987), 41,
259-263.
[31] Vijayalaxmi, H. J. Evans. In vivo and in vitro effects of sister chromatid exchanges in
human peripheral blood lymphocytes, Mutat. Res. 92 (1982) 321-332.
[33] Kuper H, Adami HO, Boffetta P. Tobacco use, cancer causation and public health impact.
J Intern Med. (2002), 251(6):455-66.

International Journal of Research in Modern Engineering and
Emerging Technology (IJRMEET) UGC Approved id_47203
Vol. 5, Sp. Issue: 9, Sept.: 2017
(IJRMEET) ISSN: 2320-6586
569 Online International, Refereed, Impact factor & Indexed Monthly Journal www.raijmr.com
RET Academy for International Journals of Multidisciplinary Research (RAIJMR)
Synthesis, Characterization and Glass reinforced
composites based on Arylhydrazino- Epoxy resin system
Dr.S.V.Patel 1 and Dr.J.N.Patel
2
Chemistry Department, Sir P.T.Science College, Modasa. Gujarat (India)
1Corresponding author, Email:
[email protected] , [email protected]
ABSTRACT
Arylhydrazino-bismaleimide (AHBM) were prepared by Michael addition reaction between
phenyl hydrazine derivatives with N,N’-(4-4’-biphenylene) bismaleimide (BBM). These
AHBM were used for curing of commercial epoxy resin. The curing behaviour of commercial
epoxy resin with this AHBM compounds have been monitored on differential scanning
calorimetry (DSC) using 2- methyl imidazole as a catalyst. Glass reinforced composites of
epoxy-AHBM system have been also prepared and characterized by mechanically and
chemically.
Keywords : Bismaleimide, Michael addition reaction, Phenyl hydrazine, epoxy resin
INTODUCTION
Epoxy resins are extensively used in a number of applications like molding, adhesives, paints,
powder coatings etc.[1]
Epoxy resins in their pre-cured state they are either in form of
colorless to yellowish brown viscous liquid. The viscous state of epoxy resins are quite stable
and do not affect by whether at room temperature. The cure state of such epoxy resins can be
exhibited by adding curing agents in to them. Numbers of curing agents are reported and
some of them received commercial value. The diamines, anhydrides, thiols etc. are well
known epoxy curing agents i.e. hardeners.[1]
The area in which the epoxy hardener containing
hydrazine group have received patentable reports.[2]
Only hydrazine derivatives of carboxylic
acid have been reported as epoxy curing agents.[3-6]
If the hydrazine derivatives of
bismeleimide tried for hardening epoxy resin which may alter the properties of end products
up to some extent. It is also well known that imide containing polymers say, polyimides have
high performance properties.[7-11]
Hence with a view of merging of epoxy resin as soft
segment and bismaleimied as a hard segment, in to cured network, the present paper
comprises curing study of epoxy resin by arylhydrazine derivatives of bismaleimide (AHBM)
and composite fabrication study.

International Journal of Research in Modern Engineering and
Emerging Technology (IJRMEET) UGC Approved id_47203
Vol. 5, Sp. Issue: 9, Sept.: 2017
(IJRMEET) ISSN: 2320-6586
570 Online International, Refereed, Impact factor & Indexed Monthly Journal www.raijmr.com
RET Academy for International Journals of Multidisciplinary Research (RAIJMR)
EXPERIMENTAL
Materials
Commercial epoxy resin i.e. Novolac was obtained from sympol products Pvt.Ltd.
Ahmadabad, India. The specification of this epoxy resin is as indicating under.
Epoxy equivalent: 171-183, Viscosity: 1.10-1.70 Poise, Density: 1.21-1.23 gm/cm3
Aryl hydrazine derivatives were obtained from Chiti Chem. Baroda, India, and used as
received. N-Nʹ (4, 4ʹ - biphyenylene) bismaleimide (BBM) was prepared by the method
reported in literature8. Other chemicals used were of laboratory grade.
Synthesis of arylhydrazino-N-Nʹ biphenylene) bismaleimide (AHBBM)
All the arylhydrazino –N-Nʹ (4, 4ʹ- biphyenylene) bismaleimide (AHBBM) derivatives
(shown in scheme – I) were prepared according to our earlier communication9.
Synthesis of unreinforced epoxy resin – AHBBM systems
The unreinforced epoxy resin – AHBBM products were by mixing epoxy resin (1
mol) and AHBBM derivatives (0.25 mol) [12]
. (As used for DSC study) and heated for 2 hrs at
curing temperature (i.e. Tp obtained from DSC experiment) shown in Table -1. The products
were crushed, washed by hot water and them air dried. The thermal properties of these
products are presented in Table-2.
Composite Fabrication
The glass fiber reinforced composites (GRC) based on epoxy resin – AHBBM system
were prepared by mixing stochiometric ratio of epoxy resin and AHBBM (40%wt. of total
glass cloth) in THF [12-14]
.The resulting mixture was mixed well for 10 min .The suspension
was then applied with a brush on to a 150 mm X 150 mm epoxy compatible fiber glass cloth,
and the solvent was allowed to evaporate. Once dried the ten prepregs were stacked one on
top of another, press between steel plates coated with a Teflon film release and compressed in
flat platen under about 0.5 Mpa pressure. The prepregs were cured by heating the press at
170-180 °C for 12 hrs in an air circulated oven. The laminated so obtained was cooled at
room temperature before the pressure was released. Test specimens were made by cutting the
laminates and machining them to final dimension.
MEASUREMENT
FTIR spectral analysis was carried on Perkin Elmer- 983 spectrophotometer. Curing
of a epoxy resin with AHBBM compounds were monitored by differential scanning
calorimetry using a Dupont 900 DSC. The instrument was calibrated using standard material
known heated of fusion. Curing was carried out using a single heating rate of 10 Kelvin/min.

International Journal of Research in Modern Engineering and
Emerging Technology (IJRMEET) UGC Approved id_47203
Vol. 5, Sp. Issue: 9, Sept.: 2017
(IJRMEET) ISSN: 2320-6586
571 Online International, Refereed, Impact factor & Indexed Monthly Journal www.raijmr.com
RET Academy for International Journals of Multidisciplinary Research (RAIJMR)
The sample for this investigation was in the range of 4 to 5 mg and an empty cell was used as
a reference. The thermo gravimetric analysis (TGA) of all AHBBM epoxy cured and their
uncured products was carried out on a DuPont thermo balance in air at a heating rate of 10
Kelvin/min. All the mechanical and chemical properties were determined according to ASTM
or ISO methods.
RESULTS AND DISCUSSION
In our earlier communication [11]
we have reported the synthesis of hydrazine-
bismaleimides. The synthesis was based on Michel-addition of phenyl hydrazine and
bismaleimides. Further study of few of these derivatives for epoxy curing presented here.
The DSC study of epoxy – AHBBM was adopted to establish the curing temperature
for bulk curing. Examination of all the DSC scan of epoxy –AHBBM system, a broad curing
exotherm was observed in the temperature range of 120-250°C. The exotherm was
characterized by noting Tp-temperature obtained by drawing a tangent to the steepest position
of the start of the exotherm, Tp- the peak exotherm temperature, Tf - the final exotherm
temperature and ∆H – the heat of curing obtained from the area under exotherm. The result of
DSC scans for the curing of all the AHBBM resins by AHBBM in the presence of catalyst
are summarized in Table-1. All the samples have a Tp in the range of 100-170°C and
depending upon the nature of the system. The heat of curing is fast as indicating reaction was
completed in the presence of catalyst.
The unreinforced AHBBM epoxy resin system have also been prepared and
characterized. Observation of the IR spectra (not shown here) of all the AHBBM – epoxy
unreinforced system revels that all the spectra comprise the spectral feature of aromatic ring
(3030, 1500, 1600 cm-1
). Only the discernible difference is observed between cured product
and parent compounds. The band due to epoxy ring at 910 cm-1
in the spectra of resin is
almost vanished in the spectra of all the epoxy- AHBBM cured products. This indicates that
the curing of epoxy ring exhibited through epoxy group and – NHNH- group of AHBBM
compounds. The TGA data of all cured products are given in Table-2. The cured products
start their decomposition at around 250 °C. The rate of decomposition increase between 300
°C and 500 °C. The results of TGA show that the cured products lose almost 90% of their
mass at 600 °C. The results of TGA show that the cured products have quit good thermal
stability.
The glass reinforced composites of epoxy-AHBBM resins have density of in the range
of 1.8 to 2.0 gm/cm3. Examination of chemical resistance test reveals that all composites have

International Journal of Research in Modern Engineering and
Emerging Technology (IJRMEET) UGC Approved id_47203
Vol. 5, Sp. Issue: 9, Sept.: 2017
(IJRMEET) ISSN: 2320-6586
572 Online International, Refereed, Impact factor & Indexed Monthly Journal www.raijmr.com
RET Academy for International Journals of Multidisciplinary Research (RAIJMR)
remarkable resistance to organic solvents and concentrated HCL. However treatment with
concentrated NaOH changes their thickness is small amount and weight by about 1.3%.
Examination of the results of mechanical properties of all composites reveals that all the
composites have good mechanical strength. All the mechanical properties and chemical
resistance data furnished in Table-3.
Table-1 : DSC Curing study of AHBBM-epoxy resin System.
Sample Cure Onset
temperature
Ti (°C)
Peak
temperature
Tp (°C)
Final
temperature Tf
(°C)
Activation
energy (Ea)
K.cal/mol
AHBBM1 + NE
AHBBM2 + NE
AHBBM3 + NE
AHBBM4 + NE
AHBBM5 + NE
135
115
106
95
126
165
149
118
110
169
175
166
168
160
190
34.10
30.90
32.10
34.10
35.30
Stoichiometric proportion of AHBBM – epoxy resin was used.
Table-2: TGA of AHBBM – epoxy resin system.
Sample % Weight loss at various temperature (°C)
250 300 400 500 600
AHBBM1 + NE
AHBBM2 + NE
AHBBM3 + NE
AHBBM4 + NE
AHBBM5 + NE
4
6
5
6
5
12
15
14
14
13
35
37
37
38
36
68
67
69
65
66
91
92
93
90
91
Where, NE = Novolac Epoxy Resin

International Journal of Research in Modern Engineering and
Emerging Technology (IJRMEET) UGC Approved id_47203
Vol. 5, Sp. Issue: 9, Sept.: 2017
(IJRMEET) ISSN: 2320-6586
573 Online International, Refereed, Impact factor & Indexed Monthly Journal www.raijmr.com
RET Academy for International Journals of Multidisciplinary Research (RAIJMR)
Table - 3: Mechanical and electrical properties of glass reinforced composites based on
AHBBM- epoxy ( equivalent ratio ) system.
Sample Chemical
Resistance %
change in
Density
gm/cm3
Flexural
Strength
( MPa)
(ASTM
D-790)
Compressive
Strength
(MPa)
(ISO
Method)
Impact
Strength
(MPa)
(ASTM)
D-790
Hardness
(R)
(ASTM
D- 790) Thick
ness
Weight
AHBBM1 + NE
AHBBM2 + NE
AHBBM3 + NE
AHBBM4 + NE
AHBBM5 + NE
0.8
0.9
1.0
0.9
0.8
1.2
1.0
1.1
1.0
1.1
1.85
1.95
1.92
1.95
1.97
195
197
192
202
207
189
213
209
214
198
215
240
230
230
270
133
134
137
140
133
Scheme -I Ar = 1. Phenyl
2. 4- Chloro phenyl 3. 4- Bromo phenyl 4. 4- Methyl phenyl 5. 4- Methoxy phenyl

International Journal of Research in Modern Engineering and
Emerging Technology (IJRMEET) UGC Approved id_47203
Vol. 5, Sp. Issue: 9, Sept.: 2017
(IJRMEET) ISSN: 2320-6586
574 Online International, Refereed, Impact factor & Indexed Monthly Journal www.raijmr.com
RET Academy for International Journals of Multidisciplinary Research (RAIJMR)
ACKNOWLEDGEMENTS
Authors are highly thankful to principal Sir P.T.Science College, Modasa, for his constant
encouragement and proving laboratory facilities.
REFERENCES
1. Lee H and Naville K., Hand Book of Epoxy Resin, McGraw Hill, New York. (1978).
2. Young Glenda, C., US Patent: 4,816,531, Chem. Abstr, 111, 196058c. (1989).
3. Baraban, O.P., Ryskina A.E. and Efimenco L.V.
(i) Sintezi, SvoistavZhidk, Unglevodorod Kauchakovnaikh Osnove M (1979), 121.
(ii) Zh. KhimAbstr. No. 24T, (1979), 600.
4. Kochetov, D.P., Gritsenko F.R., Grishchenko V.K. and Yu.L.Spirin,
VysokomolSoedin (A) 21, (1979), 2171.
5. Aelony , D., J. Appli. Polym.Sci.13 (1969), 227.
6. Levine, H.H. US Petent: 3 (1959) 3, 014,009.
7. Adrora, N.A. “Polyimides” Academy of science of USSR (1968).
8. Crivelio, J.V., J.Poly. Sci., Polym.Chem. Ed., (1976) 14,159.
9. Patel, H.S. ; Patel , B.K. Interacting blends of acrylated poly(ester- amide) resins with
methyl methacrylate monomer Part 2 . J. Rein. Plast. Comp. 29, 1359 – 1365 (2010).
10. Patel, H.S. ; Patel , B.K. ; Morekar, M.M. ; Dixit,B.C. Synthesis, characterization and
glass reinforcement of urea-formaldehyde-phenol resins . Int. J. Poly. Mater. 2009,
58, 604 – 611.
11. Patel, S.V. and Daraji, J.M. Oriental J.Org.Chem.(India) Vol.17(2),(2001),299-302.
12. Patel, S.V. and Daraji, J.M. Ultra Sc.of.Phy.Sci.(India) Vol.14(1),(2002).
13. O Al-Qabandi, Anjali De Silva, Salah Al-Enezi,M Bassyouni, Journal of Reinforced
Plastics and Composites. Volume: 33 issues: 24, page(s): 2287-2299, (2014).
14. Bhavdeep K. Patel , Hasmukh S. Patel & Manish M. Morekar. Jor.of Poly.Plastics
Technology and Engineering. Volume 52, Issue 4, Pages 332-336., (2013).
International Journal of Research in Modern Engineering and Emerging Technology (IJRMEET) UGC Approved id_47203
Vol. 5, Sp. Issue: 9, Sept.: 2017 (IJRMEET) ISSN: 2320-6586
575 Online International, Refereed, Impact factor & Indexed Monthly Journal www.raijmr.com RET Academy for International Journals of Multidisciplinary Research (RAIJMR)
Synthesis of a series of novel 1,3,4oxadiazole containing
semicarbazide (SC) and thiosemicarbazide (TSC) as potential
antimicrobial agents
Vikram N. Panchal1*
, Hiran H. Variya1, G.R.Patel
1 , Manoj A Vora
2
1Department of Chemistry, Sheth M. N. Science College, NGES campus, Patan - 384265, India
2Department of Chemistry, School of science, Gujarat university, Ahmedabad, Gujarat, India
E-mail:[email protected]
Abstract
The newly synthesized two series namely: (E)-2-benzylidene-N-(2-((5-phenyl-1,3,4-oxadiazol-2-
yl)thio)acetyl)hydrazinecarboxamide/(E)-2-benzylidene-N-(2-((5-phenyl-1,3,4-oxadiazol-2-yl)
thio)ethanethioyl)hydrazinecarboxamide (3a-3r) were prepared. These compounds synthesized
from 5-phenyl-1,3,4-oxadiazole-2-thiol, Thiosemicarbazide (TSC) and Semicarbazide (SC) were
vital functionalities containing the wide range of Pharmacological activities and have a wide
range of therapeutic properties. The structure of the synthesized compounds was confirmed by
spectral data and evaluated for their in vitro antibacterial and antifungal activities against fungi,
Gram-positive and Gram-negative bacteria.
Keywords: 1,3,4 oxadiazole, Thiosemicarbazide, Semicarbazide, Antimicrobial.
Introduction
Drug discovery is considered a complex and activity. Therefore, researcher trying to developed
Heterocyclic new entities containing N,O,S, and P having broad range of microbial activities
against a number of bacteria and fungi and become most important field of research in Phrama
industry due to their many wide applications. It follows from the literature that depending on the
type of substituent, the analogues of 1,3,4-oxadaizoles have high potential for a wide range of
biological activities such as antimicrobial1,2
, anti-inflammatory3, analgesic
4 , anticancer
5, anti-
malarial6, antihypertensive
7 and antiviral
8. 1,3,4-oxadaizole based compounds are plenty. Schiff
bases have also gained important in the field of medicine due to their wide range of biological

International Journal of Research in Modern Engineering and Emerging Technology (IJRMEET) UGC Approved id_47203
Vol. 5, Sp. Issue: 9, Sept.: 2017 (IJRMEET) ISSN: 2320-6586
576 Online International, Refereed, Impact factor & Indexed Monthly Journal www.raijmr.com RET Academy for International Journals of Multidisciplinary Research (RAIJMR)
activities such as antimicrobial9-11
, anti-tubular12
, anti-HIV13
, anticancer13
, antitumor14
, anti-
inflammatory15
, analgesic15
and anticonvulsant16,17
. In the medicinal applications, many
heterocyclic nuclei, 1,3,4-oxadaizle and Schiff bases have been considerable interest due to their
important biological properties.
Data from NMR, FTIR, mass and elemental analysis were used to characterize the compounds.
The antibacterial activities potency of these Schiff base bearing 1,3,4-oxadiazoles compounds
were evaluated against certain standard strains. The antibacterial activities of compounds were
compared to standards.
With these criteria and literature data considering the importance of 1,3,4-oxadaizole moiety in
medicinal chemistry, here two series containing 1,3,4-oxadaizole and TSC, SC were designed
and synthesized for their antimicrobial activities against Gram-positive and Gram-negative
bacteria.
RESULT AND DISCUSSION
Chemistry
The title compounds were prepared according to the synthetic strategy described in Scheme-1.
The key moiety in the present work Schiff base 1a-1r were synthesized from using various
benzaldehyde and thiosemicarbazide (TSC) or Semicarbazide (SC) in the presence of acetic acid
in ethanol, Further, we planned to extended our studies by using chloroacetylchloride (CAC)
with TEA in presence of DMF to yielded 2a-2r which treated with 5-phenyl-1,3,4-oxadiazole-2-
thiol, to afford different substituent's of title compounds 3a-3r which confirmed by spectral
data.

International Journal of Research in Modern Engineering and Emerging Technology (IJRMEET) UGC Approved id_47203
Vol. 5, Sp. Issue: 9, Sept.: 2017 (IJRMEET) ISSN: 2320-6586
577 Online International, Refereed, Impact factor & Indexed Monthly Journal www.raijmr.com RET Academy for International Journals of Multidisciplinary Research (RAIJMR)
Scheme -1 Synthesis of targeted compound 3a-3r
Table 1. The substituent of the compounds for derivatives of 3a-3r.
Compounds R X Molecular
Formula
Yield (%) Melting
Point˚C
3a Ph O C18H15N5O3 80 165-168
3b p-F Ph O C18H14FN5O3S 76 161-165
3c p-Cl Ph O C18H14ClN5O3S 77 165-169
3d p-Br Ph O C18H14BrN5O3S 70 161-165
3e p-OCH3 Ph O C19H17N5O4S 78 161-165
3f p-CH3 Ph O C19H17N5O3S 75 165-168
3g m-NO2 Ph O C18H14N6O5S 76 161-165
3h p-OH Ph O C18H5N5O4S 73 162-165
3i 2,4- (Cl)2 Ph O C18H13Cl2N5O3S 72 167-170
3j Ph S C18H15N5O2S2 78 164-167

International Journal of Research in Modern Engineering and Emerging Technology (IJRMEET) UGC Approved id_47203
Vol. 5, Sp. Issue: 9, Sept.: 2017 (IJRMEET) ISSN: 2320-6586
578 Online International, Refereed, Impact factor & Indexed Monthly Journal www.raijmr.com RET Academy for International Journals of Multidisciplinary Research (RAIJMR)
3k p-F Ph S C18H14FN5O2S2 77 165-168
3l p-Cl Ph S C18H14ClN5O2S2 75 161-165
3m p-Br Ph S C18H14BrN5O2S2 78 161-165
3n p-OCH3 Ph S C19H17N5O3S2 72 165-168
3o p-CH3 Ph S C19H17N5O2S2 71 161-165
3p m-NO2 Ph S C18H14N6O4S2 70 162-165
3q p-OH Ph S C18H15N5O3S2 74 168-171
3r 2,4- (Cl)2 Ph S C18H13Cl2N5O2S2 73 170-173
Antimicrobial activity
The Synthesized Series of 3a-3r compounds were screened for their antimicrobial activity. Agar
well diffusion technique was used for the activity. The microorganisms like gram negative The
newly synthesized compounds 3a-3r were screened in vitro for antibacterial activity against
Gram positive Micrococcus luteus (MTCC No. 11948), Bacillus Cereus (MTCC No. 8558) and
Gram negative Enterobacter aerogens (MTCC No. 8558), Escherichia coli (MTCC No. 1610).
The standard inoculums (110 CFU/mL) were distributed on the surface of sterile nutrient agar
plates by a sterile glass spreader. Candida albicans and Aspergillus fumigatus was used for the
antifungal activity. A loopful of a particular fungal strain was used for the antifungal assay.
Fungal strain was transferred to a 3.0 mL saline to achieve a suspension of related species. 0.1
mL of the spore suspension was spread on the surface of sterile sabouraud dextrose agar plates.
A 6 mm diameter well punched in the agar media and packed with 100 μL of (500 μg/mL in
DMSO) the tested chemical compounds previously sterilized through 0.45 sterile membranes
filter. The plates kept at RT for 1 hrs then incubated at 24 hrs for bacteria and 5 days for fungi.
The activities were evaluated by measuring the inhibition zone diameters. Antimicrobial
activities of compounds are shown in table 2.

International Journal of Research in Modern Engineering and Emerging Technology (IJRMEET) UGC Approved id_47203
Vol. 5, Sp. Issue: 9, Sept.: 2017 (IJRMEET) ISSN: 2320-6586
579 Online International, Refereed, Impact factor & Indexed Monthly Journal www.raijmr.com RET Academy for International Journals of Multidisciplinary Research (RAIJMR)
Table 2: Antimicrobial activity of compounds 3a to 3r.
Compound
Inhibition Zone Diameter (mm)
Enterobacter
aerogens
Escherichia
coli
Micrococcus
luteus
Bacillus
cereus
Penicillium
marneffei
Collectotrichum
capsici
MTCC No.
8558
MTCC
No. 1610
MTCC No.
11948
MTCC
No. 8558
3a 20 22 26 23 12 15
3b 21 20 19 20 11 14
3c 25 26 21 22 Negative 15
3d 20 19 23 20 Negative Negative
3e 22 21 21 19 12 17
3f 19 23 22 21 Negative 17
3g 21 21 25 23 11 15
3h 20 22 22 19 Negative Negative
3i 24 25 20 21 10 12
3j 22 22 21 21 14 Negative
3k 22 20 21 23 Negative 15
3l 20 21 24 20 Negative 16
3m 21 24 19 19 12 Negative
3n 18 19 21 21 Negative 13
3o 22 21 21 22 11 14
3p 20 19 19 19 Negative 13
3q 21 21 23 22 Negative Negative
3r 18 22 24 23 11 15
Tetracycline 25 23 25 25 - -
Flucanazole - - - - 22 25
Minimum inhibitory Concentration (MIC)
Broth dilution technique was used for determination of MIC. The nutrient broth and yeast extract
broth media and it contain 1mL of different concentrations of Compounds (5,10,15,20 μg/mL).

International Journal of Research in Modern Engineering and Emerging Technology (IJRMEET) UGC Approved id_47203
Vol. 5, Sp. Issue: 9, Sept.: 2017 (IJRMEET) ISSN: 2320-6586
580 Online International, Refereed, Impact factor & Indexed Monthly Journal www.raijmr.com RET Academy for International Journals of Multidisciplinary Research (RAIJMR)
Spectrophotometer was used for the moniter of growth. The microbial screening data revealed
that compounds 3i and 3c have highest inhibition zone diameter while 3q,3d and 3h have no
antifungal effect. Compounds 3c,3d,3f,3h,3k,3l,3n,3p and 3q were completely inactive against
Aspergillus fumigates.MIC results of compounds are shown in table 3.
Table 3: MIC (μg/mL) results of compounds 3a to 3r
Compound
MIC values (μg/mL)
Enterobacter
aerogens
Escherichia
coli
Micrococcus
luteus
Bacillus
cereus
Aspergillus
fumigatus
Candida
albicans
MTCC No.
8558
MTCC
No. 1610
MTCC No.
11948
MTCC
No.
8558
3a 10 5 10 10 15 10
3b 10 10 15 15 20 10
3c 15 15 5 10 10 10
3d 5 10 10 10 10 15
3e 10 20 15 15 10 5
3f 15 10 5 5 15 10
3g 10 15 10 10 5 15
3h 20 5 15 15 10 10
3i 10 10 10 10 15 15
3j 15 15 20 20 10 5
3k 5 10 10 5 20 10
3l 10 20 15 10 10 15
3m 15 5 5 15 10 10
3n 5 10 10 10 10 20
3o 10 15 15 20 15 10
3p 15 10 10 10 5 5
3q 10 20 20 15 10 10
3r 20 10 10 5 15 10

International Journal of Research in Modern Engineering and Emerging Technology (IJRMEET) UGC Approved id_47203
Vol. 5, Sp. Issue: 9, Sept.: 2017 (IJRMEET) ISSN: 2320-6586
581 Online International, Refereed, Impact factor & Indexed Monthly Journal www.raijmr.com RET Academy for International Journals of Multidisciplinary Research (RAIJMR)
EXPERIMENTAL SECTION
General
All starting materials and other reagents were purchased from commercially supplier. All the
melting points were determined in open capillary and uncorrected by using a Melt-Tempt
instrument, The absorbance spectra IR were recorded on Perkin-Elmer 377 spectrophotometer,
1H NMR spectra were recorded on Bruckner at 400MHz, In DMSO solution. The elemental
analysis were analyzer for C,H,N,O, and S were estimated on PerkinElmer, series II, 2400 CHNS
analyzer (CSIR Bhavnagar, INDIA) Mass spectra were recorded at Advion Expression CMS,
USA
General Procedure for the (E)-2-benzylidenehydrazinecarboxamide / (E)-2-benzylidene
hydrazinecarbothioamide derivatives. (1a-1r)
The aqueous Solution of Semicarbazide/thiosemicarbazide (0.01 mol) and benzaldehyde
derivatives (0.01 mol) in 1:1 molar ratio taken in an RBF. The reaction mixture was kept over a
magnetic stirrer and stirred well at a room temperature for 2 h. the solid was formed, filtered and
washed with petroleum ether. Obtained solid was dried and checked by TLC.
General procedure for the (E)-2-benzylidene-N-(2-chloroacetyl)hydrazinecarboxamide /
(E)-2-benzylidene-N-(2-chloroacetyl)hydrazinecarboxamide derivatives. (2a-2r)
A mixture of compound 1(0.01 mol) with Chloroacetyl chloride (0.015 mol) and 4-5 drops of
TEA(triethylamine) in 25 ml DMF as the solvent in RBF. The reaction mixture was stirred for 4
hr at Room temperature. The Completion of the reaction was checked by TLC using toluene:
Acetone (30%). The solution poured in to ice water. Obtained solid was filtered by vacuum
pump and crystalline it in Ethanol.
General procedure for the (E)-2-benzylidene-N-(2-((5-phenyl-1,3,4-oxadiazol-2-
yl)thio)acetyl)hydrazinecarboxamide / (E)-N-(2-benzylidenehydrazinecarbonothioyl)-2-((5-
phenyl-1,3,4-oxadiazol-2-yl)thio)acetamide derivatives (3a-3r)
Above synthesized derivatives (0.01 mol) was reacted with 5-phenyl-1,3,4-oxadiazole-2-thiol
(0.01 mol) in presence of potassium carbonate (0.02 mol) and acetone. The reaction was stirred

International Journal of Research in Modern Engineering and Emerging Technology (IJRMEET) UGC Approved id_47203
Vol. 5, Sp. Issue: 9, Sept.: 2017 (IJRMEET) ISSN: 2320-6586
582 Online International, Refereed, Impact factor & Indexed Monthly Journal www.raijmr.com RET Academy for International Journals of Multidisciplinary Research (RAIJMR)
at room Temperature for 5 hr. The Completion of the reaction was checked by TLC using
toluene: Acetone (20%). The product was poured into water and stirred for 1 hr. The obtained
solid was collected and dried. Crystallize into ethanol.
(E)-2-benzylidene-N-(2-((5-phenyl-1,3,4-oxadiazol-2-yl)thio)acetyl)hydrazinecarboxamide 3a
I.R (KBr) (υmax, cm-1): 3195 (N-H), 3088, 2964 (C-H), 1666 (C=O), 1587, 1542, 1512,
1457,1284 (C=N, C=C), 1159, 1002, 920, 746, 685 3456 cm-1
; 1H NMR (400 MHz, DMSO) δ
11.08 (s, 2H, NH), 4.27 (s, 2H, CH2), 7.00-7.82 (m, 10H, ArH), 6.4 (s, 1H HC=N) 13
C-NMR δ
38.6, 147.6, 172.5, 123-154.8 (14 aromatic carbons), MS (m/z) 380.89 (M+); Elemental Analysis
C, 56.68; H, 3.96; N, 18.36; O, 12.58; S, 8.41, Found: C 56.6, H 3.92, N 18.16, O 12.53, S
8.18%.
(E)-2-(4-fluorobenzylidene)-N-(2-((5-phenyl-1,3,4-oxadiazol-2-yl)thio)acetyl)hydrazinecarbox
amide 3b I.R (KBr) (υmax, cm-1): 3197 (N-H), 3088, 2965 (C-H), 1668 (C=O), 1585, 1541,
1522, 1455,1284 (C=N, C=C), 1159, 1004, 925, 742, 685 3456 cm-1
; 1H NMR (400 MHz,
DMSO) δ 11.10 (s, 2H, NH), 4.32 (s, 2H, CH2), 7.05-7.92 (m, 9H, ArH), 6.6 (s, 1H HC=N) 13
C-
NMR δ 38.5 (CH2), 147.8 (N-CH-Ar), 172.2 (C=O), 123-154.8 (14 aromatic carbons), MS (m/z)
398.92 (M+); Elemental Analysis C, 54.13; H, 3.53; F, 4.76; N, 17.53; O, 12.02; S, 8.03% Found:
C 53.7, H 3.32, N 17.16, O 12.22 S 8.58 %.
(E)-2-(4-chlorobenzylidene)-N-(2-((5-phenyl-1,3,4-oxadiazol-2-yl)thio)acetyl)hydrazinecarbox
amide 3c I.R (KBr) (υmax, cm-1): 3196 (N-H), 3086, 2966 (C-H), 1665 (C=O), 1584, 1542,
1512, 1448,1294 (C=N, C=C), 1159, 1004, 925, 742, 685 3456 cm-1
; 1H NMR (400 MHz,
DMSO) δ 11.02 (s, 2H, NH), 4.12 (s, 2H, CH2), 7.05-8.42 (m, 9H, ArH), 6.6 (s, 1H HC=N) 13
C-
NMR δ 39.5 (CH2), 145.8 (N-CH-Ar), 170.2 (C=O), 123-154.8 (14 aromatic carbons), 167.7 (S-
C-N benz thio), MS (m/z) 414.97 (M+); Elemental Analysis: C, 51.99; H, 3.39; Cl, 8.53; N,
16.84; O, 11.54; S, 7.71; Found: C 50.7, H 3.22, N 16.06,O 11.88 S 7.58 %.
(E)-2-(4-bromobenzylidene)-N-(2-((5-phenyl-1,3,4-oxadiazol-2-yl)thio)acetyl)hydrazinecarbox
amide 3d I.R (KBr) (υmax, cm-1): 3192 (N-H), 3080, 2956 (C-H), 1662 (C=O), 1581, 1539,
1522, 1448,1294 (C=N, C=C), 1149, 1004, 921, 742, 684 3455 cm-1
; 1H NMR (400 MHz,

International Journal of Research in Modern Engineering and Emerging Technology (IJRMEET) UGC Approved id_47203
Vol. 5, Sp. Issue: 9, Sept.: 2017 (IJRMEET) ISSN: 2320-6586
583 Online International, Refereed, Impact factor & Indexed Monthly Journal www.raijmr.com RET Academy for International Journals of Multidisciplinary Research (RAIJMR)
DMSO) δ 11.11 (s, 2H, NH), 4.15 (s, 2H, CH2), 7.05-7.48 (m, 4H, ArH), 7.5-8.5, (m, 9H,
thiazole ArH),6.6 (s, 1H HC=N) 13
C-NMR δ 39.5 (CH2), 145.8 (N-CH-Ar), 171.2 (C=O), 123-
154.8 (14 aromatic carbons), 166.7 (S-C-N benz thio), MS (m/z) 460.91 (M+); Elemental
Analysis: C, 46.97; H, 3.07; Br, 17.36; N, 15.21; O, 10.43; S, 6.97; Found: C 45.7, H 2.82, N
15.46,O 10.18 S 6.58 %.
(E)-2-(4-methoxybenzylidene)-N-(2-((5-phenyl-1,3,4-oxadiazol-2-yl)thio)acetyl)hydrazinecarbox
\amide 3e I.R (KBr) (υmax, cm-1): 3192 (N-H), 3082, 2955 (C-H), 1662 (C=O), 1570, 1534,
1522, 1458,1296 (C=N, C=C), 1154, 1006, 924, 740, 684 3454 cm-1
; 1H NMR (400 MHz,
DMSO) δ 3.71 (s,3H Ar-OCH3) 11.03 (s, 2H, NH), 4.16 (s, 2H, CH2), 7.05-8.45 (m, 9H, ArH),
6.6 (s, 1H HC=N) 13
C-NMR δ 39.5 (CH2), 145.8 (N-CH-Ar), 171.2 (C=O), 123-154.8 (14
aromatic carbons), 55.4 (OCH3), MS (m/z) 411.01 (M+); Anal. Elemental Analysis: C, 55.47; H,
4.16; N, 17.02; O, 15.55; S, 7.79: Found: C 53.7, H 4.99, N 17.96,O 14.98 S 7.8 %.
(E)-2-(4-methylbenzylidene)-N-(2-((5-phenyl-1,3,4-oxadiazol-2-yl)thio)acetyl)hydrazinecarbox
amide 3f I.R (KBr) (υmax, cm-1): 3190 (N-H), 3082, 2955 (C-H), 1662 (C=O), 1570, 1534,
1522, 1458,1296 (C=N, C=C), 1154, 1006, 924, 740, 684 3454 cm-1
; 1H NMR (400 MHz,
DMSO) δ 2.51 (s,3H Ar-CH3) 11.05 (s, 2H, NH), 4.15 (s, 2H, CH2), 7.05-8.55 (m, 9H, ArH), 6.6
(s, 1H HC=N) 13
C-NMR δ 39.4 (CH2), 145.6 (N-CH-Ar), 171.2 (C=O), 124-154.4 (14 aromatic
carbons), 54.4 (CH3), MS (m/z) 394.02 (M+); Elemental Analysis: C, 57.71; H, 4.33; N, 17.71;
O, 12.14; S, 8.11% Found: C 56.7, H 4.19, N 17.56,O 11.98 S 8.58 %.
(E)-2-(3-nitrobenzylidene)-N-(2-((5-phenyl-1,3,4-oxadiazol-2-yl)thio)acetyl)hydrazinecarbox
amide 3g I.R (KBr) (υmax, cm-1): 3192 (N-H), 3080, 2956 (C-H), 1662 (C=O), 1581, 1539,
1522, 1448,1294 (C=N, C=C), 1149, 1004, 921, 742, 684 3455 cm-1
; 1H NMR (400 MHz,
DMSO) δ 11.11 (s, 2H, NH), 4.15 (s, 2H, CH2), 7.05-8.48 (m, 9H, ArH), 6.6 (s, 1H HC=N) 13
C-
NMR δ 39.5 (CH2), 145.8 (N-CH-Ar), 171.2 (C=O), 123-154.8 (14 aromatic carbons), MS (m/z)
425.97 (M+); Elemental Analysis: C, 50.70; H, 3.31; N, 19.71; O, 18.76; S, 7.52 % Found: C
49.2, H 3.12, N 18.76,O 18.38 S 7.48 %.

International Journal of Research in Modern Engineering and Emerging Technology (IJRMEET) UGC Approved id_47203
Vol. 5, Sp. Issue: 9, Sept.: 2017 (IJRMEET) ISSN: 2320-6586
584 Online International, Refereed, Impact factor & Indexed Monthly Journal www.raijmr.com RET Academy for International Journals of Multidisciplinary Research (RAIJMR)
(E)-2-(4-hydroxybenzylidene)-N-(2-((5-phenyl-1,3,4-oxadiazol-2-yl)thio)acetyl)hydrazinecarbox
amide 3h I.R (KBr) (υmax, cm-1): 3198 (N-H), 3088, 2965 (C-H), 1668 (C=O), 1585, 1541,
1522, 1455,1284 (C=N, C=C), 1159, 1004, 925, 742, 685 3456 cm-1
; 1H NMR (400 MHz,
DMSO) δ 11.02 (s, 2H, NH), 11.59 (s, 1H, OH), 4.32 (s, 2H, CH2), 7.05-8.38 (m, 9H, ArH),
6.6 (s, 1H HC=N) 13
C-NMR δ 38.5 (CH2), 147.8 (N-CH-Ar), 172.2 (C=O), 123-154.8 (14
aromatic carbons), MS (m/z) 396.99 (M+); Elemental Analysis: C, 54.40; H, 3.80; N, 17.62; O,
16.10; S, 8.07% Found: C 52.7, H 3.62, N 16.51, O 15.42 S 8.58 %
(E)-2-(2,4-dichlorobenzylidene)-N-(2-((5-phenyl-1,3,4-oxadiazol-2-yl)thio)acetyl)hydrazine
carboxamide 3i I.R (KBr) (υmax, cm-1): 3192 (N-H), 3088, 2965 (C-H), 1668 (C=O), 1585,
1541, 1522, 1455,1284 (C=N, C=C), 1159, 1004, 925, 742, 685 3456 cm-1
; 1H NMR (400 MHz,
DMSO) δ 11.08 (s, 2H, NH), 4.32 (s, 2H, CH2), 7.05-8.28 (m, 8H, ArH), 6.6 (s, 1H HC=N)
13C-NMR δ 38.7 (CH2), 147.8 (N-CH-Ar), 172.4 (C=O), 123-155.8 (14 aromatic carbons), MS
(m/z) 448.88 (M+); Elemental Analysis: C, 48.01; H, 2.91; Cl, 15.75; N, 15.55; O, 10.66; S,
7.12% Found: C 46.5, H 2.32, N 15.76, O 10.22 S 7.58 %
(E)-N-(2-benzylidenehydrazinecarbonothioyl)-2-((5-phenyl-1,3,4-oxadiazol-2-yl)thio) acetamide
3j I.R (KBr) (υmax, cm-1): 3190 (N-H), 3088, 2964 (C-H), 1666 (C=O), 1220 (C=S), 1587,
1542, 1512, 1456,1284 (C=N, C=C), 1155, 1002, 920, 746, 685 3456 cm-1
; 1H NMR (400 MHz,
DMSO) δ 11.04 (s, 2H, NH), 4.26 (s, 2H, CH2), 7.00-8.32 (m, 9H, ArH), 6.4 (s, 1H HC=N) 13
C-
NMR δ 38.6 (CH2), 147.4 (N-CH-Ar), 172.4 (C=O), 182.4 (C=S), 123-154.8 (14 aromatic
carbons), MS (m/z) 397.01 (M+); Elemental Analysis: C, 54.39; H, 3.80; N, 17.62; O, 8.05; S,
16.13 % Found: C 52.80, H 3.72, N 17.56, O 8.13.4 S 16.88%.
(E)-N-(2-(4-fluorobenzylidene)hydrazinecarbonothioyl)-2-((5-phenyl-1,3,4-oxadiazol-2-l)thio)
acetamide 3k I.R (KBr) (υmax, cm-1): 3192 (N-H), 3088, 2965 (C-H), 1668 (C=O), 1222 (C=S),
1585, 1541, 1522, 1455,1284 (C=N, C=C), 1159, 1004, 925, 742, 685 3456 cm-1
; 1H NMR (400
MHz, DMSO) δ 11.10 (s, 2H, NH), 4.32 (s, 2H, CH2), 7.05-8.38 (m, 9H, ArH), ,6.6 (s, 1H
HC=N) 13
C-NMR δ 38.5 (CH2), 147.8 (N-CH-Ar), 172.2 (C=O), 181.4 (C=S), 123-154.8 (14
aromatic carbons), MS (m/z) 415.02 (M+); Elemental Analysis: C, 52.04; H, 3.40; F, 4.57; N,
16.86; O, 7.70; S, 15.44% Found: C 53.7, H 3.32, N 16.16, O 8.22 S 15.58 %.

International Journal of Research in Modern Engineering and Emerging Technology (IJRMEET) UGC Approved id_47203
Vol. 5, Sp. Issue: 9, Sept.: 2017 (IJRMEET) ISSN: 2320-6586
585 Online International, Refereed, Impact factor & Indexed Monthly Journal www.raijmr.com RET Academy for International Journals of Multidisciplinary Research (RAIJMR)
(E)-N-(2-(4-chlorobenzylidene)hydrazinecarbonothioyl)-2-((5-phenyl-1,3,4-oxadiazol-2yl)thio)
acetamide 3l I.R (KBr) (υmax, cm-1): 3196 (N-H), 3086, 2966 (C-H), 1665 (C=O), 1584, 1542,
1512, 1448,1294 (C=N, C=C), 1159, 1004, 925, 742, 685 3456 cm-1
; 1H NMR (400 MHz,
DMSO) δ 11.02 (s, 2H, NH), 4.12 (s, 2H, CH2), 7.05-8.42 (m, 9H, ArH), 6.6 (s, 1H HC=N) 13
C-
NMR δ 39.5 (CH2), 145.8 (N-CH-Ar), 170.2 (C=O), 180.4 (C=S), 123-154.8 (14 aromatic
carbons), MS (m/z) 430.98 (M+); Elemental Analysis: C, 50.05; H, 3.27; Cl, 8.21; N, 16.21; O,
7.41; S, 14.85% Found: C 48.7, H 3.12, N 16.36,O 7.88 S 14.88 %.
(E)-N-(2-(4-bromobenzylidene)hydrazinecarbonothioyl)-2-((5-phenyl-1,3,4-oxadiazol-2-yl)thio)
acetamide 3m I.R (KBr) (υmax, cm-1): 3194 (N-H), 3080, 2956 (C-H), 1665 (C=O), 1215
(C=S),1581, 1539, 1522, 1448,1294 (C=N, C=C), 1149, 1004, 921, 742, 684 3455 cm-1
; 1H
NMR (400 MHz, DMSO) δ 11.09 (s, 2H, NH), 4.17 (s, 2H, CH2), 7.05-7.48 (m, 9H, ArH), 6.6
(s, 1H HC=N) 13
C-NMR δ 39.5 (CH2), 145.9 (N-CH-Ar), 171.2 (C=O), 181.4 (C=S), 123-154.8
(14 aromatic carbons), MS (m/z) 476.78 (M+); Elemental Analysis: C, 45.38; H, 2.96; Br, 16.77;
N, 14.70; O, 6.72; S, 13.46% Found: C 43.7, H 2.82, N 14.46,O 6.48 S 13.68 %.
(E)-N-(2-(4-methoxybenzylidene)hydrazinecarbonothioyl)-2-((5-phenyl-1,3,4-oxadiazol-2-yl)thio
acetamide 3n I.R (KBr) (υmax, cm-1): 3192 (N-H), 3082, 2955 (C-H), 1662 (C=O), 1222
(C=S), 1570, 1534, 1522, 1458,1296 (C=N, C=C), 1154, 1006, 924, 740, 684 3454 cm-1
; 1H
NMR (400 MHz, DMSO) δ 3.71 (s,3H Ar-OCH3) 11.03 (s, 2H, NH), 4.16 (s, 2H, CH2), 7.05-
8.45 (m, 9H, ArH), 6.6 (s, 1H HC=N) 13
C-NMR δ 39.5 (CH2), 145.8 (N-CH-Ar), 171.2 (C=O),
181.4 (C=S), 123-154.8 (14 aromatic carbons), 55.4 (OCH3), MS (m/z) 427.01 (M+); Elemental
Analysis: C, 53.38; H, 4.01; N, 16.38; O, 11.23; S, 15.00% Found: C 53.7, H 4.09, N 16.96,O
10.98 S 15.08 %.
(E)-N-(2-(4-methylbenzylidene)hydrazinecarbonothioyl)-2-((5-phenyl-1,3,4-oxadiazol-2-yl)thio
)acetamide 3o I.R (KBr) (υmax, cm-1): 3198 (N-H), 3082, 2955 (C-H), 1664 (C=O), 1220
(C=S), 1570, 1534, 1522, 1458,1296 (C=N, C=C), 1154, 1006, 924, 740, 684 3454 cm-1
; 1H
NMR (400 MHz, DMSO) δ 2.51 (s,3H Ar-CH3) 11.05 (s, 2H, NH), 4.15 (s, 2H, CH2), 7.05-8.65
(m, 4H, ArH),6.6 (s, 1H HC=N) 13
C-NMR δ 39.4 (CH2), 145.6 (N-CH-Ar), 171.2 (C=O), 180.2
(C=S), 124-154.4 (14 aromatic carbons), 54.4 (CH3), MS (m/z) 411.04 (M+); Elemental
International Journal of Research in Modern Engineering and Emerging Technology (IJRMEET) UGC Approved id_47203
Vol. 5, Sp. Issue: 9, Sept.: 2017 (IJRMEET) ISSN: 2320-6586
586 Online International, Refereed, Impact factor & Indexed Monthly Journal www.raijmr.com RET Academy for International Journals of Multidisciplinary Research (RAIJMR)
Analysis: C, 55.46; H, 4.16; N, 17.02; O, 7.78; S, 15.58% Found: C 53.7, H 4.09, N 17.01,O
7.98 S 14.08 %.
(E)-N-(2-(4-nitrobenzylidene)hydrazinecarbonothioyl)-2-((5-phenyl-1,3,4-oxadiazol-2-yl)thio)
acetamide 3pI.R (KBr) (υmax, cm-1): 3192 (N-H), 3080, 2956 (C-H), 1662 (C=O), 1224 (C=S),
1581, 1539, 1522, 1448,1294 (C=N, C=C), 1149, 1004, 921, 742, 684 3455 cm-1
; 1H NMR (400
MHz, DMSO) δ 11.11 (s, 2H, NH), 4.15 (s, 2H, CH2), 7.05-8.48 (m, 9H, ArH), 6.6 (s, 1H
HC=N) 13
C-NMR δ 39.5 (CH2), 145.8 (N-CH-Ar), 171.2 (C=O), 181.5 (C=S), 123-154.8 (14
aromatic carbons), MS (m/z) 442.03 (M+); Elemental Analysis: C, 48.86; H, 3.19; N, 18.99; O,
14.46; S, 14.49 % Found: C 47.2, H 3.12, N 18.26,O 14.18 S 14.28 %.
(E)-N-(2-(4-hydroxybenzylidene)hydrazinecarbonothioyl)-2-((5-phenyl-1,3,4-oxadiazol-2-yl)thio)
acetamide 3q I.R (KBr) (υmax, cm-1): 3198 (N-H), 3088, 2965 (C-H), 1668 (C=O), 1221 (C=S),
1585, 1541, 1522, 1455,1284 (C=N, C=C), 1159, 1004, 925, 742, 685 3456 cm-1
; 1H NMR (400
MHz, DMSO) δ 11.02 (s, 2H, NH), 11.59 (s, 1H, OH), 4.32 (s, 2H, CH2), 7.05-8.38 (m, 9H,
ArH), 6.6 (s, 1H HC=N) 13
C-NMR δ 38.5 (CH2), 147.8 (N-CH-Ar), 172.2 (C=O), 180.5 (C=S),
123-154.8 (14 aromatic carbons), MS (m/z) 413.05 (M+); Elemental Analysis: C, 52.29; H, 3.66;
N, 16.94; O, 11.61; S, 15.51 % Found: C 50.7, H 3.62, N 16.01, O 10.92 S 15.98 %
(E)-N-(2-(3,5-dichlorobenzylidene)hydrazinecarbonothioyl)-2-((5-phenyl-1,3,4-oxadiazol-2-yl)
thio)acetamide 3r I.R (KBr) (υmax, cm-1): 3192 (N-H), 3088, 2965 (C-H), 1668 (C=O), 1210
(C=S), 1585, 1541, 1522, 1455,1284 (C=N, C=C), 1159, 1004, 925, 742, 685 3456 cm-1
; 1H
NMR (400 MHz, DMSO) δ 11.08 (s, 2H, NH), 4.32 (s, 2H, CH2), 7.05-8.28 (m, 8H, ArH), 6.6
(s, 1H HC=N) 13
C-NMR δ 38.7 (CH2), 147.8 (N-CH-Ar), 172.4 (C=O), 180.1 (C=S), 123-155.8
(14 aromatic carbons), MS (m/z) 464.90 (M+); Elemental Analysis: C, 46.36; H, 2.81; Cl, 15.20;
N, 15.02; O, 6.86 ; S, 13.75 % Found: C 44.81, H 2.62, N 15.36, O 6.52 S 13.18 %
Conclusion
In this study, analogues of 5-phenyl-1,3,4-oxadiazole-2-thiol bearing Thiosemicarbazide and 5-
phenyl-1,3,4-oxadiazole-2-thiol bearing Semicarbazide have been designed , synthesized and

International Journal of Research in Modern Engineering and Emerging Technology (IJRMEET) UGC Approved id_47203
Vol. 5, Sp. Issue: 9, Sept.: 2017 (IJRMEET) ISSN: 2320-6586
587 Online International, Refereed, Impact factor & Indexed Monthly Journal www.raijmr.com RET Academy for International Journals of Multidisciplinary Research (RAIJMR)
characterized. All the compounds evaluated for their antimicrobial study against gram positive,
gram negative bacteria and fungi. The microbial screening data revealed that compounds 3i and
3c have highest inhibition zone diameter while 3q, 3d and 3h have no antifungal effect.
Compounds 3c, 3d, 3f, 3h, 3k, 3l, 3n, 3p and 3q were completely inactive against Aspergillus
fumigates.
Acknowledgement
The author is thankful and express sincere gratitude to The Sheth M. N. Science College,
H.N.G.U., Patan. The author is also thankful Saurashtra University, Rajkot and CMCRI,
Bhavnagar for providing analytical data of the compounds.
References
[1]. M. Afroz, M. S. Yar, S. G. Abdel-hamid, S. I. Al, and A. Samad, “European Journal of
Medicinal Chemistry Molecular properties prediction , synthesis and antimicrobial
activity of some newer oxadiazole derivatives,” Eur. J. Med. Chem., vol. 45, no. 12, pp.
5862–5869, 2010.
[2]. S. Ningaiah, U. K. Bhadraiah, S. D. Doddaramappa, S. Keshavamurthy, and C.
Javarasetty, “Novel pyrazole integrated 1,3,4-oxadiazoles: Synthesis, characterization
and antimicrobial evaluation,” Bioorg. Med. Chem. Lett., 2013.
[3]. M. Farooqui, R. Bora, and C. R. Patil, “Synthesis , analgesic and anti-inflammatory
activities of novel,” Eur. J. Med. Chem., vol. 44, no. 2, pp. 794–799, 2009.
[4]. S. Yavuz et al., “Synthesis and Pharmacological Evaluation of Some Novel Thebaine
Derivatives: N‐(Tetrazol‐1H‐5‐yl)‐6, 14‐endoethenotetrahydrothebaine Incorporating the
1, 3, 4‐Oxadiazole or the 1, 3, 4‐Thiadiazole Moiety,” Arch. Pharm. (Weinheim)., vol.
346, no. 6, pp. 455–462, 2013.
[5]. S. Valente et al., “1,3,4-Oxadiazole-Containing Histone Deacetylase Inhibitors:
Anticancer Activities in Cancer Cells,” pp. 1–7, 2014.
[6]. M. Zareef et al., “Synthesis and antimalarial activity of novel chiral and achiral
benzenesulfonamides bearing 1, 3, 4-oxadiazole moieties,” J. Enzyme Inhib. Med. Chem.,
vol. 22, no. 3, pp. 301–308, 2007.

International Journal of Research in Modern Engineering and Emerging Technology (IJRMEET) UGC Approved id_47203
Vol. 5, Sp. Issue: 9, Sept.: 2017 (IJRMEET) ISSN: 2320-6586
588 Online International, Refereed, Impact factor & Indexed Monthly Journal www.raijmr.com RET Academy for International Journals of Multidisciplinary Research (RAIJMR)
[7]. K. A. Ali, E. A. Ragab, T. A. Farghaly, and M. M. Abdalla, “Synthesis of new
functionalized 3 subsitituted [1, 2, 4] triazolo [4, 3-a] pyrimidine dreivatives: Potential
antihypertensive agents,” Acta Pol. Pharm, vol. 68, no. 2, pp. 237–247, 2011.
[8]. T. Kampmann et al., “In silico screening of small molecule libraries using the dengue
virus envelope E protein has identified compounds with antiviral activity against multiple
flaviviruses,” Antiviral Res., vol. 84, no. 3, pp. 234–241, 2009.
[9]. Shi L, Ge H, Tan S, et al. Synthesis and antimicrobial activities of Schiff bases
derived from 5-chloro-salicylaldehyde. Eur J Med Chem. 2007;42:558–564
[10]. Sinha D, Tiwari A, Singh S, et al. Synthesis, characterization and biological
activity of Schiff base analogues of indole-3-carboxaldehyde. Eur J Med Chem.
2008;43:160–165
[11]. Karthikeyan MS, Prasad DJ, Poojary B, Bhat KS, Holla BS, Kumari NS. Synthesis
and biological activity of Schiff and Mannich bases bearing 2,4-dichloro-5-
fluorophenyl moiety. Bioorg Med Chem. 2006;14:7482–7489
[12]. Patole J, Shingnapurkar D, Padhyea S, Ratledge C. Schiff base conjugates of
paminosalicylic acid as antimycobacterial agents. Bioorg Med Chem Lett. 2006;16:15
14–1517
[13]. Vicini P, Geronikaki A, Incerti M, et al. Synthesis and biological evaluation of
benzo[d]isothiazole, benzothiazole and thiazole Schiff bases. Bioorg Med Chem.
2003;11:4785–4789
[14]. Ren S, Wang R, Komatsu K, et al. Synthesis, biological evaluation and
quantitative structure-activity relationship analysis of new Schiff Bases of
hydroxysemicarbazide as potential antitumor agents. J Med Chem. 2002;45:410–419.
[15]. Bhandari SV, Bothara KG, Raut MK, Patil AA, Sarkate AP, Mokale VJ. Design,
synthesis and evaluation of antiinflammatory, analgesic and ulcerogenicity
studies of novel S-substituted phenacyl-1,3,4-oxadiazole-2-thiol and Schiff
bases of diclofenac acid as nonulcerogenic derivatives. Bioorg Med Chem.
2008;16:1822–1831

International Journal of Research in Modern Engineering and Emerging Technology (IJRMEET) UGC Approved id_47203
Vol. 5, Sp. Issue: 9, Sept.: 2017 (IJRMEET) ISSN: 2320-6586
589 Online International, Refereed, Impact factor & Indexed Monthly Journal www.raijmr.com RET Academy for International Journals of Multidisciplinary Research (RAIJMR)
[16]. Sridhar SK, Pandeya SN, Stables JP, Ramesh A. Anticonvulsant activity of
hydrazones, Schiff and Mannich bases of isatin derivatives. Eur J Pharm Sci.
2002;16:129–132.
[17]. Kaplan JP, Raizon BM. New anticonvulsants: Schiff Bases of g-aminobutyric acid
and g-aminobutyramide. J Med Chem. 1980;23:702–704.

International Journal of Research in Modern Engineering and Emerging Technology (IJRMEET) UGC Approved id_47203
Vol. 5, Sp. Issue: 9, Sept.: 2017 (IJRMEET) ISSN: 2320-6586
590 Online International, Refereed, Impact factor & Indexed Monthly Journal www.raijmr.com RET Academy for International Journals of Multidisciplinary Research (RAIJMR)
Silicon Oxide Based InterfaceLayer Coating on Carbon Fibers by
Dip Coating Process for Carbon Fiber Reinforced Silicon Carbide
Composites
Harsh Vyasa,b
, C. Jariwalaa*
a Institute for Plasma Research, GIDC Electronics Estate, Sector-25, Gandhinagar, INDIA
b Department of Metallurgical and Material Engineering, Government Engineering College,
Sector-28, Gandhinagar, INDIA.
* Corresponding author e-mail: [email protected]&[email protected]
Abstract
Carbon fibres-reinforced ceramic matrix composites are promising candidate materials for high-
temperatureapplications in many technological challenging areas such as aerospace and nuclear
reactor industries. In oxidizing environments at temperatures above 400°C, however, carbon
fibres are rapidly oxidized. Therefore, a need to coat carbon fibres is essential for carbon fibre-
reinforced composite in order to protect it against oxidation [1-3]
. In this present work, we
investigated an effect of Silicon Oxide (SiO2) interface layer coating on Carbon fibers deposited
by dip coating method. Prior to dip coating, Carbon fiberswere thoroughly cleaned for removal
of surface contamination and sizing. Carbon fiberswere dipped into coating precursor solution
prepared from tetraethyl orthosilicate [Si(OC2H5)4] for different dipping cycles & dipping time
duration, followed by standard heat-treatment. Scanning Electron Microscopic surface analysis
confirmed uniformity & consistency of SiO2 coating on carbon fibers surface. Energy Dispersive
X-ray spectrum obtained for SiO2 dip coated layer on carbon fibers shows the presence of Si
element in the form of SiO2 in dip-coated carbon fibers, whereas tensile testing prove the
enhancement of tensile strength of SiO2 coated carbon fibers as compared to un-coated carbon
fibers.
IndexTerms —Cf/SiC composites, SiO2 Interface layer coating, Dip Coating process,
Scanning Electron Microscopy (SEM), Energy Dispersive X-ray (EDX) Analysis, Tensile
Testing.

International Journal of Research in Modern Engineering and Emerging Technology (IJRMEET) UGC Approved id_47203
Vol. 5, Sp. Issue: 9, Sept.: 2017 (IJRMEET) ISSN: 2320-6586
591 Online International, Refereed, Impact factor & Indexed Monthly Journal www.raijmr.com RET Academy for International Journals of Multidisciplinary Research (RAIJMR)
Introduction
Carbon fibers (Cf) reinforced silicon carbide (SiC) matrix (Cf/SiC) composites consisting of
reinforcing Cf embedded in a SiC matrix are widely used in high temperature applications due to
their outstanding properties such as high thermal and mechanical strength, low density, radiation
tolerance, chemical stability and stiffness compared to the conventional materials like metals and
alloys[3-6]
. At high temperature, the interface between CfandSiC matrix degrades and starts
oxidizing exposed Cfsurface [2-5]
. Hence, the role of the interface layer coating is to allow de-
bonding between Cfand SiC matrix during deformation and to increase fracture toughness, and
also to prevent oxidation of Cf[7-11]
. Here, interface layer permits the adjustment of the difference
in thermo-mechanical properties between the fibers and matrix. Without an interface, Cf/SiC
composites behave as brittle materials in the same manner as monolithic ceramics [12-15]
.
In this present work, we investigated an effect of SiO2 interface layer coating by dip coating
method on Cf. Prior to dip coating, Cfwere thoroughly cleaned in an acetone for removal of dust
particles, other surface contaminations and sizing. Cfwere dipped into coating precursor solution
for different dipping cycles & dipping time duration, followed by drying up to 200˚C after each
dipping cycle & then finally heat-treated at 500˚C temperature. The detail characterization of dip
coated Cf were performed using SEM, EDX and tensile testing for surface analysis, composition
analysis and strength measurement, respectively.
EXPERIMENTAL
The detail procedure for SiO2 coating on Cf and their characterization are mention in flow chart
as shown in fig.1. The coating solution was prepared by dissolving tetraethyl orthosilicate into 2-
propanol. The home-made dip coating system is shown schematic in fig.2 used for preset study.
The de-sized & cleaned Cf -tows of 60mm (long) sizes were gripped into the stain-less steel fiber
holder for dip coating. Cf along with stain less steel holder were dipped into the coating solution
for SiO2 coating on Cf. The Cf – tows were dipped into the coating precursor for 3, 5, 7, 9, 11, 13
&15 (no.) dipping cycles & for 5minutes (constant) dipping time duration. Each dipping cycles
were include the step of dipping of carbon fibers into the coating precursor, pull-out of carbon
fibers from the coating precursor, drying of fibers using IR-heater and also cooling of the carbon
fibers at room temperature for few minutes. The fibers were dipped and pull out at fixed rate of
3cm.m-1
from the coating precursor. Carbon fibers were dried up to 200°C after pull out from the

International Journal of Research in Modern Engineering and Emerging Technology (IJRMEET) UGC Approved id_47203
Vol. 5, Sp. Issue: 9, Sept.: 2017 (IJRMEET) ISSN: 2320-6586
592 Online International, Refereed, Impact factor & Indexed Monthly Journal www.raijmr.com RET Academy for International Journals of Multidisciplinary Research (RAIJMR)
coating solution using IR-heater and finally heat-treated/sintered at 500˚C in an inert atmosphere
for 60 minutes for densification & strong bonding of SiO2 coating with carbon fibers in vacuum
furnace. The detail dip coating parameters were mentioned in table-1. The surface morphology
analyses of coated-Cf were performed using SEM (440i, LEO make, UK) and EDX were used
for chemical composition investigation. The Instron Tensile Tester (Model 4411) was used to
measure tensile strength of SiO2 coated –Cf with different process parameters.
Fig.1: Process flow chart for dip coating process
TABLE I
Table: Process parameters for dip coating
Temperature of the-
bath during dip-coating
Room-temperature(25-30˚c)
Pull out rate 3 cm.m-1
Dipping time 5 minutes.
Dipping cycles (no.) 3, 5, 7, 9, 11, 13 & 15 dipping cycles
detailed characterizations
EDX, SEM & Tensile-Testing of fibers
Heat Treatment at 500˚c in an inert atmosphere for 1hr.
Drying up to 200˚c using IR- heater
Dip coating at various parameters
Room temperature drying followed by heat treatment at 150˚C-200˚C in a vacuum oven
Removal of dust particles, sizing & surface contaminations by acetone
Carbon fibers tows

International Journal of Research in Modern Engineering and Emerging Technology (IJRMEET) UGC Approved id_47203
Vol. 5, Sp. Issue: 9, Sept.: 2017 (IJRMEET) ISSN: 2320-6586
593 Online International, Refereed, Impact factor & Indexed Monthly Journal www.raijmr.com RET Academy for International Journals of Multidisciplinary Research (RAIJMR)
Drying temperature for
carbon fibers after pull-out from the
coating solution
100-200˚c
Drying time 2-5 minutes
Sintering/heat-treatment- temp. 500˚c ( in an inert atmosphere)
Sintering/heat-treatment time 1hr.
Fig. 2: Homemade Dip Coating Assembly
Results & Discussion
I. Energy Dispersive X-ray (EDX) analysis:
In order to determine the chemical composition of SiO2 dip-coated Cf, EDX analysis of all dip-
coated carbon fibers were carried out by using EDX analyzer connected to SEM.
Fig. 3: EDX spectrum of SiO2 dip coated film on un-treated carbon fibers

International Journal of Research in Modern Engineering and Emerging Technology (IJRMEET) UGC Approved id_47203
Vol. 5, Sp. Issue: 9, Sept.: 2017 (IJRMEET) ISSN: 2320-6586
594 Online International, Refereed, Impact factor & Indexed Monthly Journal www.raijmr.com RET Academy for International Journals of Multidisciplinary Research (RAIJMR)
A typical EDX spectrum obtained for 5 (no.) dipping cycles coated SiO2 dip coated film on un-
treated carbon fibers is shown in figure 3, confirms the presence & consistency of Si element in
the form of SiO2 in all dip-coated carbon fibers.
II. Scanning Electron Microscopy (SEM) – Analysis:
Fig. 4 Typical SEM monograph at
10KX shows the surface morphology
of Carbon fiber single filament, which
confirms the presence of ridges on
surface of the Cf.
Fig. 5 Typical monograph of SEM at
10KX shows the surface morphology of
3dipping cycles coated Carbon fiber
single filament.
Fig. 6 Typical monograph of SEM at
100X shows the surface morphology of
3 dipping cycles coated Carbon fiber
tow (similar SEM monographs were
obtained for 3, 5, 7 & 9 dipping cycles
coated carbon fibers)
Fig. 7 Typical monograph of SEM at
100X shows the surface morphology of
11 dipping cycles coated Carbon fiber
tow (A similar monograph of SEM
obtained for 11, 13 & 15 dipping cycles
coated carbon fibers).

International Journal of Research in Modern Engineering and Emerging Technology (IJRMEET) UGC Approved id_47203
Vol. 5, Sp. Issue: 9, Sept.: 2017 (IJRMEET) ISSN: 2320-6586
595 Online International, Refereed, Impact factor & Indexed Monthly Journal www.raijmr.com RET Academy for International Journals of Multidisciplinary Research (RAIJMR)
The SEM-image of as received carbon fiber-single filament (after de-sizing & cleaning) at 10KX
shows the carbon fiber’s surface has parallel aligned grooves and ridges along the fiber axis
(fig.4). Whereas, the SEM-image of 3 (no.)-dipping cycles coated carbon fiber at 10KX shows
the consistency & uniformity of the coating on to the surface of the carbon fiber-single filament
(fig. 5).
The SEM-monograph for 3, 5, 7 & 9 (no.) dipping cycles coated carbon fibers-tows shows the
consistency & uniformity of the coating on to the surfaces of the carbon fibers-tows (Fig. 6).
Whereas The SEM-monograph of 11, 13 & 15 (no.) dipping cycles coated carbon fibers-tows
shows the pilling off of the coating from the surfaces of the carbon fibers-tows (Fig.7). Here,
during the pilling off of the coating from the surfaces of the carbon fibers-tows, some bunch of
the carbon fiber-filaments could also peel out with the coating. So, the weight of the 11, 13 & 15
(no.) dipping cycles coated (untreated) carbon fibers-tows was suddenly decreased as compared
to the weight of as received carbon fibers-tow.
III. Tensile – Testing:
Tensile-Testing of all coated & uncoated carbon fibers was carried out by using Instron Tensile-
Tester (Model 4411) for determining the tensile properties of coated & uncoated carbon fibers.
Table -2 shows the typical tensile testing parameters used for measurement of tensile strength of
coated Cf.
Table: 2
Table: Tensile Testing parameters
General: Method description ASTM D 2256
Dimension: Final Length 25.00mm
Dimension: Final Width 50.00mm
Dimension: Geometry Rectangular
Test: Control mode 1 Extension
Speed 2mm/min

International Journal of Research in Modern Engineering and Emerging Technology (IJRMEET) UGC Approved id_47203
Vol. 5, Sp. Issue: 9, Sept.: 2017 (IJRMEET) ISSN: 2320-6586
596 Online International, Refereed, Impact factor & Indexed Monthly Journal www.raijmr.com RET Academy for International Journals of Multidisciplinary Research (RAIJMR)
Fig.8 Tensile-Strength (N/mm2) Vs Dipping Cycles (number) for Cfcoated with SiO2 by Dip
Coating Process
Fig.8 shows the Tensile Strength vs. Dipping Cycles graph. Here, the coating improves the
strength of the Carbon fibers up to 9 no. of dipping cycles. The tensile strength of Carbon Fiber
with 3, 5, 7 & 9 no. of dipping cycles coating increases from 667.119N/mm2 to 847.283N/mm
2
which confirms the enhancement of Tensile-Strength in respect to dipping cycles (Fig.7).
Whereas, tensile strength of 11, 13 & 15 dipping cycles coated carbon fibers decreases from
847.283N/mm2 to 478.456N/mm
2 due to the pilling off of the coating from surfaces of the coated
carbon fiber tows (Fig.7).
Conclusion:
In present study, Silicon Oxide (SiO2) interface layer coating on Carbon fibers deposited by dip
coating method. The effects of dipping cycles with fixed dipping time have been attempted in
detail for interface layer application on carbon fibers. EDX spectrum obtained for SiO2 dip
coated film on carbon fibers confirms the presence of Si element in the form of SiO2 in dip-
coated carbon fibers. SEM monographs obtained for 3, 5, 7 & 9 no. of dipping cycles coated
carbon fibers confirms the uniformity & consistency of coating on surface of the Cf. Whereas,
SEM images obtained for 11, 13 & 15 no. of dipping cycles coated carbon fibers shows the
pilling off of coating on surface of the carbon fiber tow. Tensile Strength of as received Cf, 3, 5,
7 & 9 dipping cycles coated Carbon fibers increases from 667.119N/mm2 to 847.283N/mm
2
which confirms the enhancement of Tensile-Strength with respect to dipping cycles whereas,
tensile strength of 11, 13 & 15 dipping cycles coated carbon fibers decreases from
667.119683.265
760.6 801.392
847.283
605.506
581.71
478.456
0
100
200
300
400
500
600
700
800
900
0 3 5 7 9 11 13 15
Tensile-Strength …
International Journal of Research in Modern Engineering and Emerging Technology (IJRMEET) UGC Approved id_47203
Vol. 5, Sp. Issue: 9, Sept.: 2017 (IJRMEET) ISSN: 2320-6586
597 Online International, Refereed, Impact factor & Indexed Monthly Journal www.raijmr.com RET Academy for International Journals of Multidisciplinary Research (RAIJMR)
847.283N/mm2 to 478.456N/mm
2 due to the pilling off of the coating on surface of the coated
carbon fibers tows as seen by SEM analysis.
References:
[1] Bin Li, Yi Feng, Gang Quian, Jingcheng Zhang, ZhongZhuang, &Xianping Wang, “The
effect of gamma ray irradiation on PAN-based intermediate modulus carbon fibers”, Journal
of nuclear materials 443 (2013) 26-31.
[2] P. C. Kang, G. Q. Chen, B. Zhang, G. H. Wu, S. Mula, & C. C. Koch, “Oxidation protection
of carbon fibers by a reaction sintered nanostructured SiC coating”, Surface & coating
technology 206 (2011) 305-311.
[3] Yunzhou Zhu, Zhengren Huang, Shaoming Dong, Ming Yuan &Dongliang Jiang,
“Manufacturing 2D carbon-fiber-reinforced SiC matrix composites by slurry infiltration &
PIP process”, Ceramics International 34 (2008), pp1201-1205.
[4] S. P. Lee, K. S. Cho, H. U. Lee, J. K. Lee, D. S. Bae, & J.H. Byun, “Microsture& Mechanical
property of SiC/SiC&Cf / SiC composites”, IOP Conf. Series: Materials science &
engineering 18 (2011) 162017.
[5] W. Krenkel&F. Berndt, “C/SiC composites for space applications and advanced friction
systems”, Materials Science and Engineering A 412, July 2005, pp 177–181.
[6] Laifei Cheng, YongdongXu, Litong Zhang, &Xiaowei Yin, “Oxidation behavior of three
dimensional C/SiC composites in air and combustion gas environments”, Carbon 38 2000, pp
2103–2108.
[7] Jeanne Petko, J. Douglas. Kisser, Terry. McCue & Michael Verrilli, “Characterizations of
C/SiC ceramic matrix composites with novel fiber coatings”, 26th
annual conference on
composites, materials, & structures cape Canaveral, Jan 28-31, 2002.
[8] N. Igawa, T. Taguchi, R. Yamada, Y. Ishii, S. Jitsukawa, “Mechanical properties of SiC/SiC
composite with magnesium-silicon oxide interphase”, Journal of nuclear materials (J. Nucl.
Mater.), 367-370 (2007) 725-729.
[9] N. Igawa, T. Taguchi, R. Yamada, Y. Ishii, S. Jitsukawa, “Preperation of silicon-based oxide
layer on high-crystalline SiC fiber as an interphase in SiC/SiC composites”, of nuclear
materials (J. Nucl. Mater.), 329-333 (2004) 554-557.

International Journal of Research in Modern Engineering and Emerging Technology (IJRMEET) UGC Approved id_47203
Vol. 5, Sp. Issue: 9, Sept.: 2017 (IJRMEET) ISSN: 2320-6586
598 Online International, Refereed, Impact factor & Indexed Monthly Journal www.raijmr.com RET Academy for International Journals of Multidisciplinary Research (RAIJMR)
[10] T. Taguchi, N. Igawa, R. Yamada, M. Futakawa, S. Jitsukawa, Ceram. Eng. Sci. Proc. 22A
(2000) 533.
[11] T. Taguchi, T. Nozawa, N. Igawa, Y. Katoh, S. Jitsukawa, A. Kohyama, T. Hinoki, L. L.
Snead, J. Nucl. Mater.329-333(2004)572.
[12] H. Y. Zhu, Y. C. Zhang, H. Y. Wu, Y. P. Qui,” Nano effect of oxygen-plasma Treatment
nano-SiO2 sol-gel coating T-300 carbon-fiber”, Materials Science Forum, 2009, pp.706-713.
[13] F. Lamouroux, S. Bertrand, R. Pailler, R. Naslain, M. Cataldi, “Oxidation-resistant carbon-
fiber-reinforced ceramic-matrix composites”, Composites science and technology 59 (1999)
1073-1085
[14] L. Liu, Y. J. Song, H. J. Fu, Z. X. Jiang, X. Z. Zhang, L. N. Wu, Y. D. Huang, “The effect
of interphase modification on carbon fiber/polyarylacetylene resin composites”, Applied
surface science 254 (2008) 5342-5347.
[15] R. M. Rocha, C. A. A. Cairo, M. L. A. Graca (2006). "Formation of carbon fiber-reinforced
ceramic matrix composites with ploysiloxane/silicon derived matrix". Materials Science and
Engineering, Part A 437, 2006, pp 268–273.

International Journal of Research in Modern Engineering and Emerging Technology (IJRMEET) UGC Approved id_47203
Vol. 5, Sp. Issue: 9, Sept.: 2017 (IJRMEET) ISSN: 2320-6586
599 Online International, Refereed, Impact factor & Indexed Monthly Journal www.raijmr.com RET Academy for International Journals of Multidisciplinary Research (RAIJMR)
Formulation and characterization of lipid nanoparticles: appraise
its anti-inflammatory property with therapeutic drugs
Vaishwik J. Patel1*
, Niket S. Powar1, Vikram N. Panchal
1•
1School of Engineering and Applied Science1: Ahmedabad University, GICT Building, Central
Campus,Navrangapura Ahmedabad, 380009, Gujarat, India. 1•
Sheth M.N. Science College, HNGU, Patan, Gujarat, India.
1* Correspondence: Vaishwik Patel, Email: [email protected]
Abstract:
Inflammation is one of the defensive responses of the body that reduce initial cause of injury.
Chronic inflammation, type of the inflammation which in uncontrolled manner leads to hay
fever, periodontitis, atherosclerosis, rheumatoid arthritis, and cancer. Study is an orchestrated
attempt to formulate and characterized lipid based drugs delivery vehicle, liposomes designed for
sustained and controlled delivery of methotrexate (MTX) and aceclofeanc (Ace). Inflammation
was induced in breast cancer cells by LPS treatment for in-vitro estimation was characterized by
pro-inflammatory cytokines such as TNF-α, IL-6 and IL-1β[8][11]
. Anti-inflammatory drugs
including MTX and Ace have great efficiency towards inflammation but also have limitations
such as, shorter half-life, lack of target specificity, bio-distribution in kidney, liver and other
organs and toxicity rendered to healthy cells to refrain their use. Liposomes have been invented
due to lower toxicity, bio-compatibility and capability to deliver both hydrophilic and lipophilic
drug. This study was aimed at formulation of drug entrapped liposome by thin film hydration
method and characterized formulated liposomes by various methods. MTT assay were performed
to calculate IC50. The levels of pro-inflammatory cytokines were estimated to observe sustained
and controlled release of MTX and Ace via liposomes and open new vistas to address
inflammatory diseases.
Introduction:
Inflammation is one of the defensive responses of the body that involvesvarious molecules or
mediators to fight against pathogens. It is characterized by five prime signs, namely redness,
swelling, heat, pain and loss of function [22]
.The protective inflammatory responses are normally
induced and remain for short duration; however, during the pathogenic attack inflammatory
responses last-longer to activate the defense system [18]
. Inflammation is categorized as; 1) Acute
inflammation, 2) Chronic inflammation. The acute inflammation initiated by infection or tissue
injury, transport of blood components (plasma and leukocytes) to the site of infection or injury[1]
.
Infection is firstly recognized by tissue resident macrophages and mast cells, which involves in
production of various inflammatory mediators[1][13][14]
. The neutrophils kill the invaders by

International Journal of Research in Modern Engineering and Emerging Technology (IJRMEET) UGC Approved id_47203
Vol. 5, Sp. Issue: 9, Sept.: 2017 (IJRMEET) ISSN: 2320-6586
600 Online International, Refereed, Impact factor & Indexed Monthly Journal www.raijmr.com RET Academy for International Journals of Multidisciplinary Research (RAIJMR)
releasing the toxic contents which are specific enough to differentiate microbial and host
molecules [13]
. The immunological balance between pro-and anti- inflammatory molecule is
crucial for the resolution of inflammation and thereby infection [17]
. The inability of macrophages
to engulf and destroy pathogens or foreign bodies may initiate the synthesis of granulomas [12]
,
full of lysosomes. Prolonged synthesis of reactive molecules, injured healthy cells and activated
immune cells lead to various cytokine production reduce the normal tissue function [5]
, resulting
into various pathologies. Whereas chronic inflammation mostly leads to the autoimmune
diseases like rheumatoid arthritis, psoriasis, pernicious anemia, vitiligo, scleroderma,
inflammatory bowel disease, type-2 diabetes etc.have been reportedly established. Higher
production pro-inflammatory cytokines play an instrumental role in pathogenesis of disease [15]
.
Pro-inflammatory cytokines are secreted by various immune cells including synovial
macrophages, B cells, fibrocytes, synoviocytes, CD4 and CD8 positive T cells present at
inflammation sites and can be detected by synoviumimmunohistochemistry[10]
.
Figure II: Pro-inflammatory cytokines involved in inflammatory diseases
Various types of Non-Steroidal Anti-Inflammatory Drugs (NSAIDs), corticosteroids, and
Disease Modifying Anti-Rheumatic Drugs DMARDs) have been used for treatment of chronic
Figure I Schema of chronic inflammation & associated diseases

International Journal of Research in Modern Engineering and Emerging Technology (IJRMEET) UGC Approved id_47203
Vol. 5, Sp. Issue: 9, Sept.: 2017 (IJRMEET) ISSN: 2320-6586
601 Online International, Refereed, Impact factor & Indexed Monthly Journal www.raijmr.com RET Academy for International Journals of Multidisciplinary Research (RAIJMR)
Figure III: Mechanism of action of aceclofenac
(Ace)
inflammation associated diseases[16]
. NSAIDs areused only to provide symptomatic relief by
inhibiting cyclooxygenase (COX) enzymes. The inhibition of COX activity by NSAID leads to
the reduction in pain and inflammation[19]
.
Aceclofenac and its metabolic product (4`-hydroxydiclofenac) reduces IL-1&TNF-alpha by
penetrates monocytes/macrophages to suppress
inflammation but it cause gastrointestinal
complications, dyspepsia, heartburn, anorexia,
abdominal pain, nausea, flatulence, diarrhea, and
peptic ulcers at higher doses [9]
.
Like NSAIDs, DMARDs like methotrexate (MTX)
are widely used for the treatment inflammatory
diseases. Methotrexate (MTX) majorly used
DMRDs, inhibits dihydrofolatereductase involved in
de novo synthetic pathway of purine and pyrimidine, intermediates of DNA and RNA.
Tetrahydrofolate plays a crucial role in methylation of DNA, RNA proteins.
Figure IV: Mechanism of action of Methotrexate
MTX at lower concentration act as anti-inflammatory drug than anti-proliferative
(immunosuppressive) drug[2][4]
. MTX are reported to be effective against RA but oftentimes
doses of DMARDs are associated with diseases such as digestive organ dysfunction such as
liver, kidney, stomatitis, depilation and myelo-suppression [9]
.Eventhough the half-lifeof MTX
and Aceis short, 0.7-5.8 hour and 4 hoursrespectively.Hence need of drug delivery vehicle is
necessary for the targeted and sustained release of drug.Various drug delivery carriers are
introduced such as lipid and polymer based nanocarriers, micelles, liposomes, nanoparticles,
neosome etc.

International Journal of Research in Modern Engineering and Emerging Technology (IJRMEET) UGC Approved id_47203
Vol. 5, Sp. Issue: 9, Sept.: 2017 (IJRMEET) ISSN: 2320-6586
602 Online International, Refereed, Impact factor & Indexed Monthly Journal www.raijmr.com RET Academy for International Journals of Multidisciplinary Research (RAIJMR)
Liposomes are attributable to bio-compatible, less immunogenic; moreover the potential to
deliver lipophilic and hydrophilic drugs for sustained drug release and rendering less toxicity to
healthy cells as compare with other nanocarriers [21][3]
.Various types of liposome are used for
delivery of therapeutic drugs such as conventional liposomes, pH-sensitive liposomes, cationic
liposomes, immune-liposomes and long-circulating liposomes [5]
.Conventional liposome for the
delivery of MTX and Ace is formulated with varying concentration of soya-phosphatidyl choline
(soya PC) and Cholesterol (chol) and maintains the same drug concentration.Breast cancer cell
line MDA-MB 468 was used to assess the in-vitro analysis of anti-infammatory effect of plain
drug and drug loaded liposomes. For mimic inflammation in cell line, Lipopolysaccharide (LPS)
isolated from bacterial cell wall was given to cell line for in-vitro estimation of inflammation.
Inflammation was characterized by pro-inflammatory cytokines like interleukin-6 (IL-6) and
tumor necrosis factor-α (TNF-α). Elisa assay for determination of pro-inflammatory cytokines by
kit-based method was for the comparison between naked and liposomal drug delivery. The target
specificity and sustained delivery of drug(s) is the prominent issue and should be objectively
addressed to develop therapeutic interventions against various inflammatory diseases.
Synthesis of liposomes
Materials: Methotrexate and aceclofenac, Cholesterol, Methanol and Soya phosphatidyl choline
were purchased from sigma-aldrich. Chloroform was purchased from Merk,Phosphate-
bufferedsaline(PBS),3-(4,5-dimethylthiazol-2-yl)-2,5-diphenyltetrazolium bromide (MTT) and
DMEM high glucose media purchased from Hi-media, 96- well flat bottom plate, Rotevarotary
evaporator, Branson probe-sonicator, Malvern Zetasizer (nano ZS), UV spectrometer (Perkin
Elmer, Lambda 365), TEM (JEOL 1400).
Method:
Three Different concentration of lipids and cholesterol were dissolved in organic solvent, organic
phase removed by rotary evaporator. Obtained film was hydrated by the PBS. The Liposomal
suspension was sonicated (Probe sonicator) to get unilamelar vesicles from multilamelar
vesicles.Liposomal suspension was then determined using zetasizer for size, zeta potential and
polydispersity whereas TEM analysis was also done for its size and shapes. For TEM analysis
liposome suspension was dropped on carbon coated copper grid and placed overnight for
drying.Drug entrapment efficiency was calculated by the centrifugation of liposome suspension
at 17000rpm for 1 hr[7]
. The supernatant wastransferred in another tube and pallet containing the
liposome is disintegrated using triton-X. The absorbance of supernatant and pelletwere measured
using UV spectrophotometer at 275nm for aceclofenac and 300nm for methotrexate.MDA-MB-

International Journal of Research in Modern Engineering and Emerging Technology (IJRMEET) UGC Approved id_47203
Vol. 5, Sp. Issue: 9, Sept.: 2017 (IJRMEET) ISSN: 2320-6586
603 Online International, Refereed, Impact factor & Indexed Monthly Journal www.raijmr.com RET Academy for International Journals of Multidisciplinary Research (RAIJMR)
Figure V:(a) Standard calibration curve of MTX at 300nm.(b) Standard calibration curve of Ace at 270nm.
y = 0.046x
R² = 0.993
0
0.5
1
1.5
2
0 50
abso
rban
ce
concentration in μg/ml
Calibration curve of Ace
o.d.(270)
Linear (o.d.(270))
468, triple negative breast cancer cell line was cultivated in DMEM high glucose medium. IC50
assay was performed for determining of inhibitory concentration of MTX and Ace drug. For in-
vitro analysis of anti-inflammatory activity cell-line was inflamed by using lipopolysaccharide
after 24 hours cell were treated with plain and drug loaded liposomes anti-inflammatory activity
was checked after 24 hours post treatment by cytokine ELISA kit.
Results & Discussion:
The drug loading efficiency was calculated by the formula given below:
(Weight of Total drug – weight of free drug) X 100
(Weight of lipid polymer)
The drug loading efficiencies were calculated for three different formulations of both the drug.
The drug loading efficiency has been always estimated to be lesser than 30%.
Formulations of
Methotrexate
Loading
efficiency
Formulation 1 10.73%
y = 0.075x
R² = 0.995
00.5
11.5
22.5
33.5
0 50
abso
rban
ce
concentration in μg/ml
Calibration curve of MTX
o.d.(300 nm)
Linear (o.d.(300 nm))

International Journal of Research in Modern Engineering and Emerging Technology (IJRMEET) UGC Approved id_47203
Vol. 5, Sp. Issue: 9, Sept.: 2017 (IJRMEET) ISSN: 2320-6586
604 Online International, Refereed, Impact factor & Indexed Monthly Journal www.raijmr.com RET Academy for International Journals of Multidisciplinary Research (RAIJMR)
Table II: Percentage drug loading efficiency of Aceclofenac
Table I: Percentage drug loading efficiency of Methotrexate
(a) (b)
Figure VI: TEM image of drug loaded (a) and unloaded liposomes (b) range of 500
nm.
Formulation1 was seen to have better loading
efficiency than rest of the two other formulations. Hence, we decided to carry-out the
characterization using formulation1 with both MTX and Ace.
The zeta-potential, particle size and polydispersity index (PDI) of formulation1 with both drugs
was analyzed using Zeta-sizer (Malvern, Nano zs). Subsequently the zeta-potential of MTX and
Ace was obtained -13.4 and -27.4mv. The average size of aceclofenac was obtained to be 289nm
whereas for MTX, it was 200nm. PDI of MTX and Ace was 0.372 & 0.272, respectively. The
zeta-potential indicates that repulsion between, similarly charged particles in dispersion. So, the
particles with higher potential have higher stability. Particle size is difficult to regulate, it is one
of the important parameters as it helps to escape the immune system especially the wandering
macrophages at the size of ≤200nm[6]
.
Formulation 2 10.7%
Formulation 3 10.4%
Formulations of
Aceclofenac
Loading
efficiency
Formulation1 10.7%
Formulation2 10.5%
Formulation3 10.5%

International Journal of Research in Modern Engineering and Emerging Technology (IJRMEET) UGC Approved id_47203
Vol. 5, Sp. Issue: 9, Sept.: 2017 (IJRMEET) ISSN: 2320-6586
605 Online International, Refereed, Impact factor & Indexed Monthly Journal www.raijmr.com RET Academy for International Journals of Multidisciplinary Research (RAIJMR)
Figure VII: IC50 determination of MTX and Ace by MTT
assay
Figure IX:Concentration of IL-6 at 48hr post treatment. Figure VIII:Concentration of TNF-α at 48hr post treatment.
MTT Assay for determination of IC50
-‘
Ten different concentrations [10-4
M to 10-12
M] of MTX and Ace were selected.A graph was
plotted between percentage cell viability Vs. concentration of drug (M). IC50 for MTX and Ace
was estimated to be 0.45μg/ml and 0.035μg/mlat 10-6
M and 10-7
respectively.The IC50
estimation with both drugs paved the way for in-vitro analysis of drug entrapped in liposomes.
In-vitro analysis of cytokines (IL-6 and TNF-α)
Pro-inflammatory cytokines estimation was carried out by ELISA kit [20]
.We demostratedthat
concentration of IL-6 saw a steep decrease with free drug due to burst release, but the drug
0
10
20
30
40
50
60
con
cen
tra
ton
of
IL-6
(p
g/m
l) inflamed
plain lipo
plain MTX
MTX/L1
MTX/L2
MTX/L3
plain Ace
Ace/L1
Ace/L2
0
5
10
15
20
25
30
Co
nc.
of
TN
F-α
(pg
/ml)
inflamed
plain lipo
plain MTX
MTX/L1
MTX/L2
MTX/L3
Ace
Ace/L1
Ace/L2

International Journal of Research in Modern Engineering and Emerging Technology (IJRMEET) UGC Approved id_47203
Vol. 5, Sp. Issue: 9, Sept.: 2017 (IJRMEET) ISSN: 2320-6586
606 Online International, Refereed, Impact factor & Indexed Monthly Journal www.raijmr.com RET Academy for International Journals of Multidisciplinary Research (RAIJMR)
loaded liposomes are seen to release their content (MTX) in a sustained manner and therefore
inhibition of inflammatory cytokines (IL-6) lasted-longer.
Conclusion:
The comparative analysis of free drug and drug(s) loaded liposome shows that drug loaded onto
liposome showed low bio-degradability, and sustained release in reducing the inflammation
induced by the LPS treatment even with smaller concentrations used. Liposomal formulation
used in in-vitro delivery have capability to form nano-dimmers for approximately 199.3±0.3nm
and 285.6±0.2nm size and loading efficiencies are approximately 10.7% and 10.5%for MTX and
Ace loaded liposome, respectively. The level of pro-inflammatory cytokines in experimentally
induced inflammation in breast cancer cells before and after therapeutic treatment with
liposomally entrapped drug is suggestive of the relevance of the present study in surfacing the
sustained and controlled release attributes of liposomes. Liposomal formulation and its
engineered versions might be used to deliver MTX and Ace to subside inflammation in a specific
and in regulated manner with reduced toxicity and minimal adverse.The nearby delivery vehicle
opens new avenues to study systemic inflammatory diseases such as Rheumatoid Arthritis, brain
cancer etc, and needs to be further exploredboth in vitro as well as in experimentally induced
animal models.
References
1. Barton, Gregory M., The Journal of clinical investigation 118, no. 2, 2008, 413.
2. Laouini, Abdallah, Chiraz Jaafar-Maalej, Imen Limayem-Blouza, S. Sfar, Catherine
Charcosset, and Hatem Fessi., Journal of colloid Science and Biotechnology 1, no. 2, 2012,
147-168.
3. Çağdaş, Melis, Ali Demir Sezer, and Seyda Bucak., In Application of Nanotechnology in
Drug Delivery. InTech, 2014., 1-50.
4. Cutolo, M., A. Sulli, C. Pizzorni, Bm Seriolo, and R. H. Straub., Annals of the rheumatic
diseases 60, no. 8, 2001, 729-735.

International Journal of Research in Modern Engineering and Emerging Technology (IJRMEET) UGC Approved id_47203
Vol. 5, Sp. Issue: 9, Sept.: 2017 (IJRMEET) ISSN: 2320-6586
607 Online International, Refereed, Impact factor & Indexed Monthly Journal www.raijmr.com RET Academy for International Journals of Multidisciplinary Research (RAIJMR)
5. Franceschi, Claudio, and Judith Campisi., Journals of Gerontology Series A: Biomedical
Sciences and Medical Sciences 69, no. 1, 2014, S4-S9.
6. Garg, Neeraj K., Priya Dwivedi, Christopher Campbell, and Rajeev K. Tyagi., European
Journal of Pharmaceutical Sciences 47, no. 5, 2012, 1006-1014.
7. Mohamed, j. Muthu, P. Bharathidasan, and M. Mohamed Raffick., International Journal of
Pharma and Bio Sciences 3, no. 4, 2012, 419–432.
8. Lan Li, Fadi S. Braiteh., Pharmaceutical and Nano Sciences 4, no .3, 2015, 162–174.
9. Kapoor, Bhupinder, Sachin Kumar Singh, Monica Gulati, Reena Gupta, and Yogyata
Vaidya., The Scientific World Journal 2014.
10. Konigsberg, Paula J., J. Eric Debrick, Tomasz J. Pawlowski, and Uwe D. Staerz., Biochimica
et Biophysica Acta (BBA)-Biomembranes 1421, no. 1, 1999, 149-162.
11. Makene, Vedastus W., and Edmund J. Pool., Water and Environment Journal 29, no. 3 2015,
353-359.
12. Medzhitov, Ruslan., Nature 454, no. 7203, 2008, 428.
13. Nathan, Carl., Nature reviews. Immunology 6, no. 3, 2006, 173.
14. Pober, Jordan S., and William C. Sessa., Nature reviews, Immunology 7, no. 10, 2007
15. Russell, Anthony, Boulos Haraoui, Edward Keystone, and Alice Klinkhoff., Clinical
therapeutics 23, no. 11, 2001, 1824-1838.
16. Sanka, Krishna, Rajeswara Rao Pragada, and Prabhakar Reddy Veerareddy., Journal of
microencapsulation 32, no. 8, 2015, 794-803.
17. Serhan, Charles N., and John Savill., Nature immunology 6, no. 12, 2005, 1191-1197.

International Journal of Research in Modern Engineering and Emerging Technology (IJRMEET) UGC Approved id_47203
Vol. 5, Sp. Issue: 9, Sept.: 2017 (IJRMEET) ISSN: 2320-6586
608 Online International, Refereed, Impact factor & Indexed Monthly Journal www.raijmr.com RET Academy for International Journals of Multidisciplinary Research (RAIJMR)
18. Valeyev, Najl V., Christian Hundhausen, Yoshinori Umezawa, Nikolay V. Kotov, Gareth
Williams, Alex Clop, Crysanthi Ainali, Christos Ouzounis, Sophia Tsoka, and Frank O.
Nestle., PLoS computational biology 6, no. 12, 2010.
19. Yuan, Fang, Ling-dong Quan, Liao Cui, Steven R. Goldring, and Dong Wang., Advanced
drug delivery reviews 64, no. 12, 2012, 1205-1219.
20. Williams, A. S., S. G. Jones, R. M. Goodfellow, N. Amos, and B. D. Williams., British
journal of pharmacology 128, no. 1, 1999, 234-240.
21. Bangham, Alec D., and R. W. Horne., Journal of molecular biology 8, no. 5, 1964, 660-668.
Book
22. Hurley, John Victor. Acute inflammation. Churchill Livingstone, 1972.

International Journal of Research in Modern Engineering and Emerging Technology (IJRMEET) UGC Approved id_47203
Vol. 5, Sp. Issue: 9, Sept.: 2017 (IJRMEET) ISSN: 2320-6586
609 Online International, Refereed, Impact factor & Indexed Monthly Journal www.raijmr.com
RET Academy for International Journals of Multidisciplinary Research (RAIJMR)
A COMPARATIVE STUDY ON PHOTOCATALYTIC ACTIVITY
OF ZnO, ZnS AND THEIR COMPOSITE
BASANT K. MENARIYA, TARUNA DANGI, RAKSHIT AMETA, SURESH C. AMETA
Department of Chemistry, PAHER University, Udaipur- 313003 (Raj.) INDIA
E-mail: [email protected]
ABSTRACT
A composite of ZnO and ZnS was prepared by simple solid state mechanochemical technique and
it was used as a semiconductor for thephotocatalytic degradation of Azure B. The effect of several
parameters like pH, Azure B concentration, amount of composite and intensity of light was
monitored.The optimum conditions obtained for this degradation were: Azure B = 1.80 × 10⁻⁵
M,
pH = 10.0, amount of composite = 0.10 g and light intensity = 60.0 mWcm-2
. The
photocatalyticefficiency of ZnO-ZnS composite was compared with pure ZnO and ZnS.It was
found that composite of ZnO-ZnS shows betterphotocatalytic activity as compared with ZnO and
ZnS alone for the degradation of Azure B in the presence of visible light.
Key words:ZnO ,ZnS, Composite ,Photocatalytic activity, Azure B
INTRODUCTION
Effluents from various industries like dyeing, textile, paper, pulp and printing industries
contain pollutants such as, detergent, acids, soaps, pesticides, chemicals, dye etc, which are the
major sources of water pollution. Large scale production and extensive applications of synthetic
dyes cause considerable environmental pollution. Dyes are difficult to decompose biologically
and chemically.
Therefore, severaltechniques such as precipitation, flocculation, air stripping, adsorption,
reverse osmosis, ultrafiltration, etc. are being used for removal of contaminants. Heterogeneous
photocatalytic oxidation is an effective method to remove organic pollutant even at low
concentrations. Here, semiconductor particles on excitation act as photocatalysts or short-circuited
microelectrodes. Semiconductor generates electron-hole pair on excitation which may be used
either for oxidation or reduction of the dye.
Photocatalysis has shown various promising applications.Vinodgopal andPrashant1studied
degradation of azo dye by SnO2/TiO2 coupled semiconductor thin films. Preparation of Bi12TiO20
and use inphotocatalytic degradation was studied by Xuet al.2Ungelenket al.
3 showed that

International Journal of Research in Modern Engineering and Emerging Technology (IJRMEET) UGC Approved id_47203
Vol. 5, Sp. Issue: 9, Sept.: 2017 (IJRMEET) ISSN: 2320-6586
610 Online International, Refereed, Impact factor & Indexed Monthly Journal www.raijmr.com
RET Academy for International Journals of Multidisciplinary Research (RAIJMR)
nanoscale β-Sn1-nWO4.nα-Sn is a highly efficient photocatalystfor degradation of organic dyes in
day light and it was observed to be a real ‘green’ synthesis. Kothari et al.4 have carried out the
photoreduction of malachite green usingCdS as photocatalyst and ascorbic acid/EDTA as
reductants. Thephotocatalytic degradation of crystal violet in aqueous solutions was investigated
by Sahooet al.5
with Ag+ doped TiO2 under UV and simulated solar light.Kansalet al.
6 reported
photocatalytic degradation of methyl orange and rhodamine 6G using several photocatalyst such
as titanium dioxide, zinc oxide, stannic oxide, zinc sulphide and cadmium sulphide. A
comparative photooxidative degradation of azure-B using sono-photo-Fenton and photo-Fenton
reagents has been reported by Vaishnaveet al.7 and they concluded the photochemical
decomposition rate of azure-B is markedly increased in the presence of ultrasound. Azure B was
photocatalytically degraded by Sharmaet al.8 using NiS-ZnS composite in molar ratio 1:5. Claudia
et al.9
synthesized nanocrystals of ZnS (∼3 to 5 nm diameter) with>50% product yield and
reported the photocatalytic degradation of p-nitrophenol and acid orange 7. Visible light-driven
degradation of methylene blue in the presence of semiconductingZnS and CdS nanoparticles was
reported by Soltaniet al.10
Wenjianget al.11
prepared spherical ZnO/ZnS core/shell particles under the hydrothermal
condition and studied the photocatalytic degradation of methyl orange as a probe reaction.
Nuengmatchaet al.12
studied visible light-inducedphotocatalytic degradation of rhodamine B and
industrial dyes (texbrite BAC-L and texbrite NFW-L) in the presence of ZnO-graphene-TiO2
composite. The novel zirconium oxide, nickel oxide and zinc oxide nanoparticles supported on
activated carbons were successfully fabricated through microwave irradiation method by Suresh et
al.13
and used for photocatalytic degradation of textile dyeing wastewater. Lachhebet al.14
studied
photocatalytic degradation of anthraquinonic (alizarin S), azoic (crocein orange G, methyl red),
Congo red, heteropolyaromatic (methylene blue) dyes in TiO2/UV aqueous suspensions. Bhati et
al.15
synthesized CeCr2O5 nanoparticles by microwave method for the decolorization of yellowish
orange and fast green dyes, common water effluents of textile industries. Gandhi et
al.16
degradated methylene blue using coprecipitatedsulphidephotocatalyst. This coprecipitated
semiconductor CoS-ZnS (in 1 : 10 mole ratios) was prepared by coprecipitation and used for
photodegradation of methylene blue.Daneshvar et al.17
compared the degradation of acid red 14 in
the presence and absence of UV light using photocatalystZnO and observed that the amount of
H2O2affect the photodegradation of dye. Devipriya and Yesodharan18
have performed complete
photocatalytic mineralization of pesticides to harmless products.

International Journal of Research in Modern Engineering and Emerging Technology (IJRMEET) UGC Approved id_47203
Vol. 5, Sp. Issue: 9, Sept.: 2017 (IJRMEET) ISSN: 2320-6586
611 Online International, Refereed, Impact factor & Indexed Monthly Journal www.raijmr.com
RET Academy for International Journals of Multidisciplinary Research (RAIJMR)
ZnO and ZnS compositewas preparedusing a simple mechanochemicalmethod. The
obtained nanoparticles were characterized by XRD, UV-Vis absorption spectroscopy, SEM and
EDX. The photocatalytic activity of as prepared composite was examined in the degradation of
Azure B under visible light in air at room temperature and the influence of different experimental
parameters such as the ZnS-ZnS amount, pH of the solution, dye concentration and light intensity
on the rate of degradation was observed.
EXPERIMENTAL
Preparation of composite
Composite of ZnO and ZnS was prepared by simple solid state mechanochemical
method.Equal amount of ZnO and ZnS(1:1 ratio) was taken and then it was ground with the help
of pestle and mortar. Then it was used for photocatalytic degradation of Azure B.
Characterization of Composite
X-rays diffraction pattern of theZnO-ZnS composite is shown in Fig. 1. Average particle
size of the crystalline composite was calculated by Debye-Scherrer’s equation and it was found
87.03 nm.
Fig. 1: XRD spectrum of composite
The elemental composition and surface morphology were observed out by scanning
electron microscope equipped with an energy dispersive X-ray spectrophotometer. The SEM

International Journal of Research in Modern Engineering and Emerging Technology (IJRMEET) UGC Approved id_47203
Vol. 5, Sp. Issue: 9, Sept.: 2017 (IJRMEET) ISSN: 2320-6586
612 Online International, Refereed, Impact factor & Indexed Monthly Journal www.raijmr.com
RET Academy for International Journals of Multidisciplinary Research (RAIJMR)
image of ZnO-ZnS composite is given Fig. 2. It shows that the particles of composite have rough
surface with irregular size.
Fig. 2: SEM Image of composite
EDX analysis was performed to analyze the elemental constituent of mixed ZnO –ZnSand
it revealed that three elements are present in nanomaterial i.e. Zn, S and O (Fig. 3) .
Table1: Elemental composition
Elements Weight (%) Atomic (%)
Zn 67.63 46.41
O 16.39 34.40
S 15.97 19.18
Photocatalytic degradation
0.0305 g Azure B was dissolved in 100.0 mL of doubly distilled water so that the
concentration of dye solution was 1.0 x 10⁻³
M. It was used as a stock solutionand further diluted
as and, when required. The absorbance of Azure B solution was observed with the help
ofspectrophotometer( Systronic model 106 ) at λmax= 650 nm.It was irradiated with a 200 W
tungsten lamp (CEL, Model SM 201) Reaction solution was exposed to visible light.A water filter
was used between light source and solution to cut off the thermal radiation.

International Journal of Research in Modern Engineering and Emerging Technology (IJRMEET) UGC Approved id_47203
Vol. 5, Sp. Issue: 9, Sept.: 2017 (IJRMEET) ISSN: 2320-6586
613 Online International, Refereed, Impact factor & Indexed Monthly Journal www.raijmr.com
RET Academy for International Journals of Multidisciplinary Research (RAIJMR)
The dye solution was divided into four beakers. These beakers were kept under four
different experimental conditions and initial and final absorbances (A) were observed after 3 hrs
for solution of each beaker. Control experiments were carried out, which proved that this reaction
is photocatalytic in nature.
The photocatalytic degradation of Azure B dye was studied, after adding of 0.10 g of
composite in 50 mL dye solution (1.8 x 10⁻⁵
M) at pH 10.0. A 200W tungsten lamp wasused for
irradiation (60.0 W cm-2
light intensity). Irrdiationwas carried out in glass vessel.A solarimeter
(Suryamapi CEL 201) was used for the measurement of light intensities. Water filter was usedto
cut thermal effect. A digital pH meter was used to measure pH of the dye solutions.pH of the dye
solutions was adjusted by addition of previously standardized 0.1 N sulphuric acid and 0.1N
sodium hydroxide solution. UV-Visible spectrometer (Systronic Model 106) was used to
measureabsorbance (A) of the dye solution at regular time intervals. A linear plot between plot of
1+ logA and timeshows that Azure Bdegradation follows pseudo-first order kinetics.
The rate constant was calculated with the help of given formula -
k = 2.303 × slope
RESULTS AND DISCUSSION
Table 2: Atypical run
[Azure B ] = 1.80 x 10⁻⁵
M pH= 10.0
Amount of composite = 0.10 g Light intensity = 60.0 mWcm-2
Time (min.) Absorbance (A) 1+log A (ZnO-ZnS)
0 0.693 0.8407
5 0.591 0.7715
10 0.478 0.6794
15 0.391 0.5922
20 0.311 0.4927
25 0.269 0.4297
30 0.226 0.3541
35 0.174 0.2405
Time (min.) Absorbance (A) 1 + log A (ZnO-ZnS)
40 0.152 0.1818
35 0.129 0.1106
50 0.108 0.0334

International Journal of Research in Modern Engineering and Emerging Technology (IJRMEET) UGC Approved id_47203
Vol. 5, Sp. Issue: 9, Sept.: 2017 (IJRMEET) ISSN: 2320-6586
614 Online International, Refereed, Impact factor & Indexed Monthly Journal www.raijmr.com
RET Academy for International Journals of Multidisciplinary Research (RAIJMR)
Rate constant ( k ) with ZnO = 4.72 x 10⁻⁴
sec-1
Rate constant ( k ) with ZnS = 4.38 x 10⁻⁴
sec-1
Rate constant ( k ) with ZnO-ZnS = 6.14 x 10⁻⁴
sec-1
Effect of pH
The effect of pH on photocatalytic degradation was monitored in the range 6.0- 11 and the
results are tabulated in Table 3. It was observed that the rate of degradation of azure B
increaseswith increase in pH and maximum efficiency was exhibited at pH 10.0. This result may
beexplained on the basis that on increasing pH, there was greater probability for the formationof
oxygen anion radical (O2•−
), which are produced from the reaction between O2 moleculeand
electron (e–) of the semiconductor. When pH was increased above 10.0, the rate of thereaction
was found to decrease, which may attributed the fact that cationic form of azure B isconverted to
its neutral form, which faces no attraction towards the negatively chargedsemiconductor surface
due to the absorption of hydroxyl ions.
Table 3: Effect of pH
[Azure B ] = 1.80 x 10⁻⁵
M
Amount of composite = 0.10 g Light intensity = 60 .0 mWcm-2
pH Rate constant (k) × 104(sec
-1)
6.0 0.59
6.5 0.63
7.0 0.75
7.5 1.17
8.0 1.49
8.5 2.32
9.0 3.14
9.5 4.06
pH Rate constant (k) × 104
(sec-1
)
10.0 6.14
10.5 5.19
11.0 4.93

International Journal of Research in Modern Engineering and Emerging Technology (IJRMEET) UGC Approved id_47203
Vol. 5, Sp. Issue: 9, Sept.: 2017 (IJRMEET) ISSN: 2320-6586
615 Online International, Refereed, Impact factor & Indexed Monthly Journal www.raijmr.com
RET Academy for International Journals of Multidisciplinary Research (RAIJMR)
Effect of dye concentration
Effect of concentration of Azure B was studied by taking its different concentrations i.e.
1.0 x 10⁻⁵
M-2.6 x 10⁻⁵
M. The results are reported in Table 4. It was observed that the rate of
photocatalytic degradation increased with increase in concentration of dye up to a certain
concentration (1.8 x 10⁻⁵
M). This may be attributed to the fact that as the concentration of dye was
increased, more dye molecules were available for excitation and hence, there was an increase in
the rate. The rate of photocatalytic degradation was found to decrease with futhter increase in the
concentration of dye. This indicated that after certain concentration, the dye itself start acting as
obstacle for the incident light and it does not allow the required light intensity to reach the
semiconducting particles and thus, declining the rate of the photocatalytic degradation of dye.
Table 4: Effect of dye concentration
Amount of composite = 0.10 g pH= 10.0
Light intensity = 60.0 mWcm-2
[ Azure B ] x 105
Rate constant (k) × 104(sec
-1)
1.0 4.03
1.2 4.46
1.4 5.03
1.6 5.57
1.8 6.14
2.0 5.57
2.2 5.32
2.4 5.03
2.6 4.53
Effect of amount of semiconductor (ZnO-ZnS) composite
The rate of photocatalyticdegradation of Azure B increases with an increase in the
amountof composite but finally, it becomesalmost constant after a certain amount, i.e. 0.10g. This
may be attributed to the fact that as thequantity of composite was increased, theexposed surface
area also increases, but aftera definite limit, if the quantity of compositewas further increased,
then there will be noincrease in the exposed surface area of thephotocatalyst. It may be considered
like asaturation point; above which, any increase inthe amount of semiconductor has
insignificantor no effect on the rate of photocatalyticdegradation of Azure B, as any increasein the
amount of composite after thissaturation point will only increase the thicknessof the film at the

International Journal of Research in Modern Engineering and Emerging Technology (IJRMEET) UGC Approved id_47203
Vol. 5, Sp. Issue: 9, Sept.: 2017 (IJRMEET) ISSN: 2320-6586
616 Online International, Refereed, Impact factor & Indexed Monthly Journal www.raijmr.com
RET Academy for International Journals of Multidisciplinary Research (RAIJMR)
bottom of the reaction vessel.The saturation point shifts to upper rangefor bigger vessels, while
reverse was true forsmaller vessels.
Table 5: Effect of photocatalyst
[Azure B ] = 1.80 x 10⁻⁵
M pH= 10.0
Light intensity = 60.0 mWcm-2
Amount of composite (g)
Rate constant (k) × 104
(sec-1
)
0.02 4.06
0.04 4.58
0.06 5.20
0.08 5.77
0.10 6.14
0.12 6.05
0.14 6.05
Effect of light intensity
To observe the effect of intensity of light on the photocatalytic degradation of Azure B, the
lightintensity was varied either by changing the wattage of lamp or the distance between lamp and
semiconductor surface. The results obtained are tabulated in Table 6. The data shows that an
increase in the light intensity increases the rate of photodegradation and the optimum value were
found at 60.0 mWcm-2
. It may be explained on the basis that as the light intensity was increased,
the number of photons striking per unit area also increased, resulting into a greater rate of
degradation. Further increase in the light intensity decrease the rate of reaction. It may be possibly
due to thermal side reactions
Table 6: Effect of light intensity
[Azure B ] = 1.80 x 10⁻⁵
M pH= 10.0
Amount of composite = 0.10 g
Light intensity (mW cm-2
)
Rate constant (k) × 104(sec
-1)
20 2.76
30 3.38
40 3.69
50 4.92

International Journal of Research in Modern Engineering and Emerging Technology (IJRMEET) UGC Approved id_47203
Vol. 5, Sp. Issue: 9, Sept.: 2017 (IJRMEET) ISSN: 2320-6586
617 Online International, Refereed, Impact factor & Indexed Monthly Journal www.raijmr.com
RET Academy for International Journals of Multidisciplinary Research (RAIJMR)
60 6.14
70 5.23
Mechanism –
On the basis of these observations, a tentative mechanism for photocatalytic degradation of
azure B (Dye) has been proposed as follows:
1Dye0
hν 1Dye1 (Singlet excited state)
1Dye1
ISC 3Dye1 (Triplet excited state)
SC hν
e- (CB) + h
+ (VB)
e−+ O2 O2
•−
O2•−
+ 3Dye1 Leuco Dye
Leuco DyeProducts
Azure B absorbs suitable wavelength and gives its first excited singlet state followed by
intersystem crossing (ISC) to triplet state. On the other hand, the semiconducting composite ZnO-
ZnS also uses the radiant energy to excite its electron from valence band to the conduction band;
thus, leaving behind a hole. The dissolved oxygen accepts electron of composite and is converted
into oxygen anion radical. In the next step, the dye molecule in triplet state donate an electron to
oxygen anionradical and oxidized to its leuco form, which further degrades into harmless
products. The hydroxyl radicals do not participate in the photodegradation of dye as the reaction
rate was not appreciably retarded in presence of hydroxyl radical scavengers; isopropanol.
CONCLUSION
A comparative study has been carried out between photocatalytic activity of pure ZnO and
ZnSand their composite. Azure B dye was used as a model system to compare their photocatalytic
activity. The rate constants for photocatalytic degradation of Azure B usingZnO, ZnS and ZnO-
ZnSwere 4.72 x 10⁻⁴
sec-1
, 4.38 x 10⁻⁴
sec-1
and 6.14 x 10⁻⁴
sec-1
, respectively. These results clearly
indicates that the composite ZnO-ZnSshowed better results as compared to individual ZnO and
ZnS. The observation of present work will explore the use of composites in enhancing
photocatalytic performance of a photocatalyst.

International Journal of Research in Modern Engineering and Emerging Technology (IJRMEET) UGC Approved id_47203
Vol. 5, Sp. Issue: 9, Sept.: 2017 (IJRMEET) ISSN: 2320-6586
618 Online International, Refereed, Impact factor & Indexed Monthly Journal www.raijmr.com
RET Academy for International Journals of Multidisciplinary Research (RAIJMR)
ACKNOWLEDGEMENTS
One of the authors Basant K. Menariya is thankful to Head Department of Chemistry, PAHER
University, Udaipur for providing laboratory facilities.
REFERENCES
1. K. Vinodgopal, V. K.Prashant. Sci. Tech., 1995, 29, 841.
2. S. Xu , W.Shangguan, J. Yuan, J. Shi, M. Chen, Sci. Tech. Adv. Mater., 2007, 8, 40.
3. J.Ungelenkand,C. Feldmann, Appl.Catal. B: Environ., 2011, 102, 515.
4. S. Kothari, A. Kumar, R. Vyas, R. Ameta, P. B. Punjabi, J. Braz. Chem. Soc., 2009, 20,
1821.
5. C. Sahoo, A. K. Gupta, A. Pal, Dyes and Pigmen., 2005, 66, 189.
6. S. K. Kansal, M. Singh, D. Sud, J. Hazard. Mater., 2007, 141, 581.
7. P. Vaishnave, A. Kumar, R.Ameta, P. B. Punjabi, S. C. Ameta, Arab. J. Chem.,2014, 7,
981.
8. V. Sharma, N. Gandhi, A. Khant R.C. Khandelwal, Int. J. Chem. Sci., 2010, 8, 1965.
9. L. Claudia, T. Martinez, R. K. Mehra, J. Coll. Interf. Sci., 2001, 240, 525.
10. N. Soltani, E. Saion, M. Z. Hussein, M. Erfani, A.Abedini , G. Bahmanrokh, M. Navasery,
P. Vaziri, Inter. J. Mol. Sci., 2012, 13, 12242.
11. L. Wenjiang, G. Song, F. Xie, M. Chen, Y. Zhao, Mater. Lett., 2013, 96, 221.
12. P. Nuengmatcha, S. Chanthai, R. Mahachai, W. Chunoh, J. Environ. Chem. Eng., 2016, 4,
2170.
13. P. Suresh, J. Judithvijaya, L. Johnkennedy, Trans. Nonfer. Met. Soc. China, 2015, 25,
4216.
14. H. Lachheb, E. Puzenat, A. Houas, M. Ksibi, E. Elaloui, C. Guillard, J. M. Herrmann,
Appl. Catal. B: Environ., 2002, 39, 75.
15. I. Bhati, J. Sharma, A. Ameta, S. C. Ameta, Int. J. Chem. Sci., 2011, 9, 1787.
16. N. Gandhi, V. Sharma, A. Khant,R. C. Khandelwal, Int. J. Chem. Sci., 2010, 8, 1924.
17. N. Daneshvar, D. Salari, A. R. Khataee, J. Photochem. Photobiol. A: Chem., 2004, 162,
317.
18. S. Devipriya, S. Yesodharan, Sol. Energy Mater. Solar. Cells, 2005, 86, 309.

619 Online International, Refereed, Impact factor & Indexed Monthly Journal www.raijmr.com RET Academy for International Journals of Multidisciplinary Research (RAIJMR)
International Journal of Research in Modern Engineering and Emerging Technology (IJRMEET) UGC Approved id_47203
Vol. 5, Sp. Issue: 9, Sept.: 2017 (IJRMEET) ISSN: 2320-6586

International Journal of Research in Modern Engineering and Emerging Technology (IJRMEET) UGC Approved id_47203
Vol. 5, Sp. Issue: 9, Sept.: 2017 (IJRMEET) ISSN: 2320-6586
620 Online International, Refereed, Impact factor & Indexed Monthly Journal www.raijmr.com RET Academy for International Journals of Multidisciplinary Research (RAIJMR)

621 Online International, Refereed, Impact factor & Indexed Monthly Journal www.raijmr.com RET Academy for International Journals of Multidisciplinary Research (RAIJMR)
International Journal of Research in Modern Engineering and Emerging Technology (IJRMEET) UGC Approved id_47203
Vol. 5, Sp. Issue: 9, Sept.: 2017 (IJRMEET) ISSN: 2320-6586

622 Online International, Refereed, Impact factor & Indexed Monthly Journal www.raijmr.com RET Academy for International Journals of Multidisciplinary Research (RAIJMR)
International Journal of Research in Modern Engineering and Emerging Technology (IJRMEET) UGC Approved id_47203
Vol. 5, Sp. Issue: 9, Sept.: 2017 (IJRMEET) ISSN: 2320-6586

International Journal of Research in Modern Engineering and Emerging Technology (IJRMEET) UGC Approved id_47203
Vol. 5, Sp. Issue: 9, Sept.: 2017 (IJRMEET) ISSN: 2320-6586
623 Online International, Refereed, Impact factor & Indexed Monthly Journal www.raijmr.com RET Academy for International Journals of Multidisciplinary Research (RAIJMR)

624 Online International, Refereed, Impact factor & Indexed Monthly Journal www.raijmr.com RET Academy for International Journals of Multidisciplinary Research (RAIJMR)
International Journal of Research in Modern Engineering and Emerging Technology (IJRMEET) UGC Approved id_47203
Vol. 5, Sp. Issue: 9, Sept.: 2017 (IJRMEET) ISSN: 2320-6586

International Journal of Research in Modern Engineering and Emerging Technology (IJRMEET) UGC Approved id_47203
Vol. 5, Sp. Issue: 9, Sept.: 2017 (IJRMEET) ISSN: 2320-6586
625 Online International, Refereed, Impact factor & Indexed Monthly Journal www.raijmr.com RET Academy for International Journals of Multidisciplinary Research (RAIJMR)

International Journal of Research in Modern Engineering and Emerging Technology (IJRMEET) UGC Approved id_47203
Vol. 5, Sp. Issue: 9, Sept.: 2017 (IJRMEET) ISSN: 2320-6586
626 Online International, Refereed, Impact factor & Indexed Monthly Journal www.raijmr.com
RET Academy for International Journals of Multidisciplinary Research (RAIJMR)
EFFECT OF SOUND TREATMENT ON
GERMINATION AND GROWTH OF PLANT SEEDS
Rajiv D. Vaidya1, Kaushik R. Patel
2, Mehul S. Dave
3 and Devendra B. Vanol
4
1Biogas Research Center, Gujarat Vidyapith, SADRA
2Sheth P. T. Arts and Science College, GODHRA
3N. V. Patel College of Pure and Applied Sciences, V. V. Nagar
4ARIBAS, New Vallabh Vidyanagar
ABSTRACT
An attempt has been made to understand the effect of sound treatment on the
germination rate and growth of various plant seeds viz., Choli (Vigna unguiculata), Methi
(Trigonella foenum graceum), Damro (Ocimum basilicum L.) and Guar or Cluster Bean
(Cyamopsis tetragonoloba) seeds. The seeds have been subjected to rhythmic classical music.
The genetically uniform seeds were exposed to classical sound for one hour daily up to one
week period using normal mobile instrument. Out of these species, Guar or Cluster Bean
(Cyamopsis tetragonoloba) was treated with different types of sound (music-rhythmic
classical, rhythmic rock and non rhythmic traffic noise) with varying frequency (low- 50 to
100 Hz and High- 1500 to 2000 Hz) for distances (near – 25 cm and far- 550 cm) using
laptop attached with loudspeaker.
The seeds with no sound treatment were considered as control. Both treated and non-
treated seeds were kept in similar environment and conditions. The germination rate was
monitored for a week and then growth of Guar plants for the period of 45 days. The results
shows that sound have a significant positive effect on plant germination rate. Plant seeds
under the influence of sound treatment had a higher germination rate compare to control. No
adverse effects of sound treatment on germination rate were noticed.
KEY WORDS
Sound treatment, germination rate, growth, plant seeds, frequency of sound

International Journal of Research in Modern Engineering and Emerging Technology (IJRMEET) UGC Approved id_47203
Vol. 5, Sp. Issue: 9, Sept.: 2017 (IJRMEET) ISSN: 2320-6586
627 Online International, Refereed, Impact factor & Indexed Monthly Journal www.raijmr.com
RET Academy for International Journals of Multidisciplinary Research (RAIJMR)
INTRODUCTION
The use of music and sound to improve health is not a novel idea. Both harmful and
beneficial effects of music have been recognized by the ancient Greeks and Romans,
including Pythagoras, Democritus, Aristotle, Galenand Celsus [1]. Music is used in treatment
of illnesses since for a long time past in China, India and Turkey. The effects of music
treatment are better in neuropathies and depressions [2]. Many experiments have been done
to see the effects of music on growing plants. In the 1950’s, Indian botanist T. C. Singh made
first recorded studies about effects of music on plants [3]. Studies about the effects of music
were continued with Purple Passion vine plants [3] Paddy [4], wheat [5], Arabidopsis [6],
Mimosa pudica [7], Groovy plants [8], corn [9]. The effect of influence of different
ecological factors and physiological attributes of plants have been explored extensively [10].
Seed germination and seedling growth behavior influences by different pretreatments has
been studied for different plants [11]. Sound wave can accelerate growth of plants and the
stimulation of sound wave has an obvious effect on growth and development of plants [12].
The aim of the present study is to investigate the effect of sound treatment on
germination rate of plant seeds and growth of plants. The primary experiments were done on
Choli (Vigna unguiculata), Methi (Trigonella foenum graceum), Damro (Ocimum basilicum
L.) and Guar or Cluster Bean (Cyamopsis tetragonoloba) seeds as they have applications for
human consumption, medicinal purpose, crop and soil improvement, cattle feed and various
industrial applications.
MATERIALS AND METHODS
Genetically uniform seeds of Choli (Vigna unguiculata), Methi (Trigonella foenum
graceum), Damro (Ocimum basilicum L.) and Guar or Cluster Bean (Cyamopsis
tetragonoloba) were collected from Anand Agriculture University (AAU), Anand , Gujarat
,India . The Seeds were soaked in a tape water for overnight to make their skin softer; then
after fungicides (bavastine) treatment was given for five minute and seeds were washed
repeatedly by tap water. Seeds were distributed into three sets of petri plates (5 seeds / petri
plates) with blotting paper in it and then given sound treatment (Classical Music) using
mobile instrument for one hour daily to grow these seeds at room temperature. The petri
plates were kept at a distance of 2 cm from the mobile instrument and classical music was
played to the set labeled treatment using it. The control was not given any external sound
exposure. The volume of the selected sound pieces and the piece of music played was
uniform throughout the exposure period. The regular observations of number of seeds

International Journal of Research in Modern Engineering and Emerging Technology (IJRMEET) UGC Approved id_47203
Vol. 5, Sp. Issue: 9, Sept.: 2017 (IJRMEET) ISSN: 2320-6586
628 Online International, Refereed, Impact factor & Indexed Monthly Journal www.raijmr.com
RET Academy for International Journals of Multidisciplinary Research (RAIJMR)
germinated and other physical parameters were recorded and compared with control. Out of
these species, Guar or Cluster Bean (Cyamopsis tetragonoloba) was treated with different
types of sound (music-rhythmic classical, rhythmic rock and non rhythmic traffic noise) and
with varying frequency (low- 50 to 100 Hz and High- 1500 to 2000 Hz) for distances (near –
25 cm and far- 550 cm) using laptop attached with loudspeaker. Three replications were
taken for comparison. Each set was kept in the same environmental conditions and were
received the same external sound.
RESULTS AND DISCUSSION
Seed germination recorded everyday till germinated all seeds in petridish. Figure 1 shows
Petri dish experiment with mobile instrument for First day for T1: Choli (Vigna unguiculata),
T2: Methi (Trigonella foenum graceum) and T3: Damro (Ocimum basilicum L.). Figure 2
indicated the Petri dish experiment with treated seeds on Third day. Whereas Petri dish
experiment with control seeds on Fifth day is shown in Figure 3.
Figure 1: Petri dish experiment with mobile instrument. (First day)
T1: Choli (Vigna unguiculata), T2: Methi (Trigonella foenum graceum)
and T3: Damro (Ocimum basilicum L.)

International Journal of Research in Modern Engineering and Emerging Technology (IJRMEET) UGC Approved id_47203
Vol. 5, Sp. Issue: 9, Sept.: 2017 (IJRMEET) ISSN: 2320-6586
629 Online International, Refereed, Impact factor & Indexed Monthly Journal www.raijmr.com
RET Academy for International Journals of Multidisciplinary Research (RAIJMR)
The difference in germination of seeds were maximum for the plants exposed to at
near (25cm) at low(50-100) and high(1500-2000) frequency in silent classical music in 4th
day and also maximum for the plants exposed to at near (25cm) and far(550cm) at
high(1500-2000) frequency in silent classical music in 7th
day, followed by the plants
exposed to rhythmic rock music maximum germination rate observed in near(25cm)
;far(550cm) at low(50-100) frequency; and near(25cm) at high(1500-2000) frequency in 4th
day and also maximum for the plants exposed to both near (25cm) and far(550cm) at
low(50-100) and high(1500-2000) frequency in rhythmic rock music in 7th
day and
when non rhythmic traffic noise exposed to plants seed germination rate would be maximum
in near(25cm) at high(1500-2000) frequency and same for the plants exposed to at near
(25cm) and far(550cm) low (50-100) and high(1500-2000) frequency in traffic noise in 7th
day. Variation in Height (Growth) of Guar Plant with different types of music up to 13 days
observations is shown in Figure 4.
Figure 2: Petri dish experiment with treated seeds. (Third day)
Figure 3: Petri dish experiment with control seeds. (Fifth day)

International Journal of Research in Modern Engineering and Emerging Technology (IJRMEET) UGC Approved id_47203
Vol. 5, Sp. Issue: 9, Sept.: 2017 (IJRMEET) ISSN: 2320-6586
630 Online International, Refereed, Impact factor & Indexed Monthly Journal www.raijmr.com
RET Academy for International Journals of Multidisciplinary Research (RAIJMR)
The control set showed the minimum difference compare to other frequencies and
types of sound. That means that musical sound with high(1500-2000) frequency has
definitely helped in better growth of the plant and same effect in traffic noise in case of seed
germination in petridishplates. Therefore, the plants with no external sound or untreated
control being played showed slower growth.
Further, Figure 5 indicates number of leaves (Growth) of Guar Plant with different
types of music up to 13 days observations. Figure 6 is about the Size of leaves for Guar
Plant. Total Chlorophyll concentration in Guar Plant for classical sound treatment was
observed and shown here in Figure 7.
ECONOMICS OF SOUND TREATMENT ON SEEDS:
Figure 4: Variation in Height (Growth) of Guar Plant with different types of music up to
13 days observations.
Figure 5: Number of leaves (Growth) of Guar Plant with different types of music up to
13 days observations.
Figure 6: Size of leaves
In Guar Plant. Figure 7: Total Chlorophyll concentration in Guar
Plant for classical sound treatment.

International Journal of Research in Modern Engineering and Emerging Technology (IJRMEET) UGC Approved id_47203
Vol. 5, Sp. Issue: 9, Sept.: 2017 (IJRMEET) ISSN: 2320-6586
631 Online International, Refereed, Impact factor & Indexed Monthly Journal www.raijmr.com
RET Academy for International Journals of Multidisciplinary Research (RAIJMR)
The tremendous scope in the field of agriculture to be bio-simulation with sound of
different frequency and exposure period to increase the germination as well as growth rate
and yield of the various plants. It has also been observed and reported that such treatment are
not harmful to plants as well as to environment. The environmental friendly techniques can
be utilized for the same purpose. The farmers can take best advantage in terms of quantity
and quality of crops by giving sound treatment. It is possible to establish a small working
business in pilot scale primarily for providing effective and improved eco-friendly technique
for better agricultural product that may also be useful for further research.
CONCLUSIONS
(1) The considerable improvement in germination rate was observed as compare to control
due to sound treatment.
(2) The plots for difference in number of seeds germination; height and in number of leaves
clearly show that there is positive effect of silent classical musical sound compare to
rhythmic rock musical sound on the growth of the plants. Both silent classical music and
rhythmic rock music have given better results than the control.
(3) Higher frequency (1500-2000 Hz) have given better results than lower frequency
(50-100 Hz).
(4) Near (25cm) distant plants shows positive effect compare to far (550cm) distant plants.
(5) The plant is able to differentiate between “some sound” and “no sound”; “music” and
“noise” and also between higher frequency (1500-2000 Hz) and lower frequency
(50-100 Hz); near(25cm) and far(550cm) in particular.

International Journal of Research in Modern Engineering and Emerging Technology (IJRMEET) UGC Approved id_47203
Vol. 5, Sp. Issue: 9, Sept.: 2017 (IJRMEET) ISSN: 2320-6586
632 Online International, Refereed, Impact factor & Indexed Monthly Journal www.raijmr.com
RET Academy for International Journals of Multidisciplinary Research (RAIJMR)
ACKNOWLEDGEMENT
The research work presented here is experimented partly at Sheth P. T. Arts & Science
College, Godhra and at ARIBAS, New Vallabh Vidyanagar. Authors are thankful to the
concern authorities of both institutions and management for their generous support of all kind
during the span of research work.
REFERENCES
[1] Rooke A, Sunrise Magazine, Theosophical University Press, 1985.
[2] Wicke, 2005
[3] Tompkins P and C Bird, Harper Collins, 1989.
[4] Subramanian S et al., Madras Agric. J., 56: 510-516, 1969.
[5] Weinberger P and M Measures, Can. J. Bot., 57: 1036-1039, 1979.
[6]Braam J and Davis RW, Cell, 60: 357-364, 1990.
[7] Jones D, Green Music Naure, 351: 104, 1991.
[8] Davis R and P Scott, J. Exp. Bot., 51: 73, 2000.
[9] Talos, ASPB News, 286:8-9, 2001.
[10] Abd El-Naby, Zeinab M, Sakr H O, Asian Journal of Plant Sciences and Research,
2 (4): 388-395, 2012.
[11] Asha R, Pawan K, Asian Journal of Plant Sciences and Research, 2 (4): 409-413,
2012.
[12] Collin M and Foreman J, Canadian Acoustics, 29, 2001.

International Journal of Research in Modern Engineering and Emerging Technology (IJRMEET) UGC Approved id_47203
Vol. 5, Sp. Issue: 9, Sept.: 2017 (IJRMEET) ISSN: 2320-6586
633 Online International, Refereed, Impact factor & Indexed Monthly Journal www.raijmr.com
RET Academy for International Journals of Multidisciplinary Research (RAIJMR)
Chemical Bath Deposition and Characterization of ZnO Rod-Array Films
Anjana Kothari* and T K Chaudhuri§
Dr. K C Patel Research and Development Centre (KRADLE),
Charotar University of Science and Technology (CHARUSAT),
CHARUSAT Campus, Changa 388 421, Anand, Gujarat, India
§Former Head, KRADLE, CHARUSAT, Changa
*E-mail:[email protected]
Abstract:
Chemical bath deposition (CBD) is asimple, low-costtechnique used to deposit various
nanostructures of ZnO. In this paper, we report CBD of ZnO rod-array filmsdeposited on large
area substrates. The films have been deposited on the side walls of thegrowth assembly which
forms a chemical bath. The side walls are the bare glass plates which act as substrate for the
deposition of ZnO rod-arrays films. Deposition of the film has been carried out at 85 oC using an
aqueous bath of tetra ammonium zinc complex prepared from RO water (drinking water). X-ray
diffraction study shows that the as-deposited films are uniaxially out-of-plane textured along the
c-axis. Scanning Electron Microscopy reveals the films consist of rod-arrays of dia. ~ 150 – 200
nm and length ~ 4.5 m. Optical study such as diffuse reflectance has been carried out.
Keywords: ZnO rod-arrays, Chemical Bath Deposition, X-ray Diffraction, Scanning Electron
Microscopy, Diffuse Reflectance.
Introduction:
Industrial production of zinc oxide had begun in around 1840. However, its use for industrial
application was first reported by P. Puscher in 1869, 148 years back [1-4]. ZnO has been used in
rubber industry since a long time by providing an invisible support. It is also used in various
applications such as ceramics, food, agriculture, and cosmetics. Nowadays, ZnO finds place in
various optoelectronic applications depending on their nano-/microstructures. These applications
range from solar cells to transistors to sensors [5-9]. All these applications require a simple, low-
cost, energy efficient and environment friendly deposition routes which can be scale-up at

International Journal of Research in Modern Engineering and Emerging Technology (IJRMEET) UGC Approved id_47203
Vol. 5, Sp. Issue: 9, Sept.: 2017 (IJRMEET) ISSN: 2320-6586
634 Online International, Refereed, Impact factor & Indexed Monthly Journal www.raijmr.com
RET Academy for International Journals of Multidisciplinary Research (RAIJMR)
industrial level. Since the device applications always require a film, we put our efforts to deposit
the ZnO films on large area substrate by using a simple deposition technique, Chemical Bath
Deposition (CBD).This manuscript describes the deposition of ZnO rod-array films on large area
substrate at relatively low deposition temperature. The films were deposited from the RO water
which we use as drinking water.
Materials and Methods:
ZnO rod-array films were deposited from aqueous solution of tetra ammonium zinc complex,
Zn(NH3)42+
at 85oC [10]. This typical deposition procedure requires 85ml (pH:10)of
Zn(CH3COO)2·2H2O (3.6583 g/l) and NH4OH (5N) solutions prepared from Reverse Osmosis
(RO) water (drinking water). To depositthe films we had prepared a growth assembly by using
bare glass plates as shown in Fig. I. These bare glass plates act as substrate. The precursor
solution (PS) waspoured into this chemical bath, and thenthe whole assemblywas
introducedintothe waterbath which waskeptat 90oC. The assembly was taken outafter45 min. All
the four sides of the assembly were coated with the white film of ZnO. These films were
washedinrunningwatertoremoveany non-adherentpowder and finally driedinanovenat60oC.The
detailed procedure of the film deposition is given in our earlier reports [10]. The chemicals used
were ofanalytical grade supplied by Merck Ltd., Mumbai, India. The typical dimension of the
glass plates are 75 mm x 75 mm x 1.5 mm. Before making the square shaped growth assembly,
the substrates were ultrasonically cleaned in chromic acid, distilled water, acetone, methanoland
dried in warm air.The compositionandtextureoftheproductsweredetermined from X-
raydiffraction(XRD)plots(θ–2θ) recordedwithaPhilips (X'Pert) X-raydiffractometer(XRD)
(usingNi-filteredCuKα radiation) from 20o to 80
o. Themorphologyandstructureoftheproducts
wasstudiedbyaJeol(JSM-5610LV)scanningelectronmicroscope (SEM). The diffuse
reflectance(RD) spectra of the films were measured from 300 to 1200 nm with aPerkin Elmer
(Lambda 19) spectrophotometer.
Results and Discussion:
Adhesive, uniformand white ZnO rod-array films were deposited on the bare glass plates of the
chemical bath. The bottom of this bath doesn’t show any deposition of ZnO particles. It proves
the films get deposited at preferred sites only. Hence, only heterogeneous nucleation prevailed.

International Journal of Research in Modern Engineering and Emerging Technology (IJRMEET) UGC Approved id_47203
Vol. 5, Sp. Issue: 9, Sept.: 2017 (IJRMEET) ISSN: 2320-6586
635 Online International, Refereed, Impact factor & Indexed Monthly Journal www.raijmr.com
RET Academy for International Journals of Multidisciplinary Research (RAIJMR)
Fig. I Schematicof growth assembly-a chemical bath, used to deposit ZnO rod-array films
Figure Irepresents schematic of growth assembly used as chemical bath to deposit ZnO rod-array
films on large area substrate. The films have been deposited on the side walls of the growth
assembly. All these walls are at 90° angle (vertical) to each other. The scanning electron
microphotograph (Fig. I) reveals the deposition of ZnO rod –arrays of diameter ~ 150- 200 nm
and length ~ 3.5 - 4 m.
An XRD plot of ZnO rod-array film deposited at 85 oC is depicted in Fig. II. The graph consists
of peaks at 31.595°, 34.205°, 36.065°, 47.315°, 56.405°, 62.645°, 67.775° and 72.335°. These
diffraction lines match well with standard XRD lines of hexagonal ZnO (JCPDS: 36-1451) and
are due to reflections from (100), (002), (101), (102), (110) (103), (201)and (004) planes,

International Journal of Research in Modern Engineering and Emerging Technology (IJRMEET) UGC Approved id_47203
Vol. 5, Sp. Issue: 9, Sept.: 2017 (IJRMEET) ISSN: 2320-6586
636 Online International, Refereed, Impact factor & Indexed Monthly Journal www.raijmr.com
RET Academy for International Journals of Multidisciplinary Research (RAIJMR)
respectively. The film shows prominently strong line of (002) along with fairly strong lines of
(100) and (101) suggests the films are preferentially oriented along the c-axis. The texture
coefficient [11] Tc(002) ~ 2.49 indicates that the film has strong uniaxially out-of-plane texturing
along c-axis.
Fig. II X-ray Diffractogram of ZnO rod-array film deposited on bare glass plates of
the growth assembly
Scanning Electron Microphotograph of ZnO rod-array film deposited on the sides of the growth
assembly is presented in Fig. III. The inset image shows the top-view of the film. These films
consist of an array of rods which are aligned normal to the bare glass substrate. Some of the rods
are agglomerated and very few rods are aligned parallel to the plane of the substrate.

International Journal of Research in Modern Engineering and Emerging Technology (IJRMEET) UGC Approved id_47203
Vol. 5, Sp. Issue: 9, Sept.: 2017 (IJRMEET) ISSN: 2320-6586
637 Online International, Refereed, Impact factor & Indexed Monthly Journal www.raijmr.com
RET Academy for International Journals of Multidisciplinary Research (RAIJMR)
Fig. IIIScanning Electron Microphotograph of ZnO rod-array deposited on the sides
of the growth assembly; Inset shows the top view of the film
Figure IV represents the ZnO rod-arrays deposited on the bare (seedless) glass substrate at 85°C
in 45 min. The enlarged view of the selected growth region shows the filmconsists of rod-arrays
of dia. ~ 200 nm and length ~ 3 m. As revealed in the micrograph some of the rods are
agglomerated (big red circle on the RHS) whereas some are twinned (Red colour square). The
circled region (black circle) shows the formation of steps in the single, well-grown ZnO rod. This
proves the rodswere grown via step growth mechanism.The ZnO rod-array films also show some
non-uniformity in the deposition as depicted in Fig. V. As shown in the enlarged view of the Fig.
V, a rod deposited parallel to the substrate acts as an origin, and from this origin the secondary
and tertiary rods are growing out which forms flower-like structure.Few rods have emerged from
the bigger size rod and are grown to the length of ~ 1 m to 4 m. Micrograph also reveals
twinning of the rods as well as splitting of the tips.

International Journal of Research in Modern Engineering and Emerging Technology (IJRMEET) UGC Approved id_47203
Vol. 5, Sp. Issue: 9, Sept.: 2017 (IJRMEET) ISSN: 2320-6586
638 Online International, Refereed, Impact factor & Indexed Monthly Journal www.raijmr.com
RET Academy for International Journals of Multidisciplinary Research (RAIJMR)
Fig. IVScanning Electron Microphotograph of twinned ZnO rod-arrays deposited
on the sides of the growth assembly

International Journal of Research in Modern Engineering and Emerging Technology (IJRMEET) UGC Approved id_47203
Vol. 5, Sp. Issue: 9, Sept.: 2017 (IJRMEET) ISSN: 2320-6586
639 Online International, Refereed, Impact factor & Indexed Monthly Journal www.raijmr.com
RET Academy for International Journals of Multidisciplinary Research (RAIJMR)
Fig.V Scanning Electron Microphotograph ofZnO rod-array film deposited on the
sides of the chemical bath
Diffuse reflectance (RD) spectrum of ZnO rod-array film on seedless glass is shown in Fig. VI.
As shown in the Fig., R increases from ~ 28 % to 36 % from the wavelength 1200 nm to 450 nm.
Thehigher diffusereflectance is because of granular structure of the films which leads to
scattering of incident beam of light. Figure 6 shows a plot of wavelength (nm) versus (h)2
obtained by using Kubelka-Munk function [12]. The energy band gap value is calculated from
this plot by extrapolating the band edge. The energy band gap value derived for the ZnO rod-

International Journal of Research in Modern Engineering and Emerging Technology (IJRMEET) UGC Approved id_47203
Vol. 5, Sp. Issue: 9, Sept.: 2017 (IJRMEET) ISSN: 2320-6586
640 Online International, Refereed, Impact factor & Indexed Monthly Journal www.raijmr.com
RET Academy for International Journals of Multidisciplinary Research (RAIJMR)
array films is 3.22 eV (Fig. VII). The shift in the band gap, from 3.37 eV to 3.22 eV, may be due
to the presence of defects in these rods.
Fig. VI Diffuse reflectance spectrum of ZnO rod-array film deposited on bare
glass substrate
Fig. VII Plot of wavelengthvs Kubelka-Munk function for ZnO rod-array films

International Journal of Research in Modern Engineering and Emerging Technology (IJRMEET) UGC Approved id_47203
Vol. 5, Sp. Issue: 9, Sept.: 2017 (IJRMEET) ISSN: 2320-6586
641 Online International, Refereed, Impact factor & Indexed Monthly Journal www.raijmr.com
RET Academy for International Journals of Multidisciplinary Research (RAIJMR)
Conclusion:
A simple growth assembly has been developedtodeposit ZnO rod-array films on seedless large
area substrateat 85oC within 1 h. The films have been deposited from a chemical bath of
Zn(NH3)42+
prepared from drinking water.
Thedepositionmethodholdspromiseforindustrialproductionofvariousnano-/microstructuresofZnO.
Acknowledgements:
This work is funded by Gujarat Council on Science and Technology (GUJCOST), Department of
Science and Technology (DST), Government of Gujarat, India (Sanction No. GUJCOST/MRP/
2015 -2016 /1932).
References
[1] Zinc Oxide Producers Association (ZOPA) – A Sector Group of The European Chemical
Industry Council [2013, 2017]. Available: ⟨http://www.zopa.org/⟩.
[2] C. Puscher, Polytechn. J., 1869, 190, 421.
[3] G. Hodes, Phys. Chem. Chem. Phys., 2007, 9, 2181–2196.
[4] M. R. De Guire, L. P. Bauermann, H. Parikh, J. Bill, Chemical Bath Deposition,
(Chapter 1), Springer DOI:10.1007/978-3-211-99311-8_14
[5] Y. E. Romanyuk, H. Hagendorfer, P. Stücheli, P. Fuchs, A. R. Uhl, C. M. Sutter-Fella, M.
Werner, S. Haass, J. Stückelberger , C. Broussillou, P-P. Grand, V. Bermudez, A. N.
Tiwari, Adv. Funct. Mater, 2014, 1-16 (DOI: 10.1002/adfm.201402288).
[6] H. Wang, T. Kubo, J. Nakazaki, H. Segawa, Phys. Stat Solidi RRL Solar, 2014, 1–5 /
DOI 10.1002/pssr.201409461.
[7] J. Roh, H. Kim, M. Park, J. Kwak, C. Lee, Appl. Surf Sci, 2017, 420, 100 – 104.
[8] Z. Fan and J.G. Lu, Internat. J. High Speed Electr. Syst., 2006, 16, 883 – 896.
[9] Y. H.Navale, S.T.Navale, N.S.Ramgir, F.J.Stadler, S.K.Gupta, D. K.Aswal, V.B.Patil,
Sens. Actuators B, 2017, 251, 551 – 563.
[10] A. Kothari, T K. Chaudhuri, Mater.Lett., 2014, 137, 366 – 368.
[11] M. Wang,C-H.Ye, Y. Zhang, H-X.Wang, X-Y. Zeng, L-D Zhang, J. Mater. Sci.:
Mater.Electron.,2008, 19, 211–216.
[12] Kubelka andMunk, Zeit. FürTekn. Physik, 1931,12, 593.

International Journal of Research in Modern Engineering and
Emerging Technology (IJRMEET) UGC Approved id_47203 Vol. 5, Sp. Issue: 9, Sept.: 2017
(IJRMEET) ISSN: 2320-6586
642 Online International, Refereed, Impact factor & Indexed Monthly Journal www.raijmr.com RET Academy for International Journals of Multidisciplinary Research (RAIJMR)
HETERO-MOLECULAR INTERACTIONS IN BINARY MIXTURES
USING DIELECTRIC DATA
A. N. Prajapati
Department of Applied Physics,
Faculty of Technology and Engineering,
The M. S. University of Baroda,Vadodara.
Email:[email protected]
Abstract:
Studies on Physico-chemical properties of binary liquid mixtures provide information on the
nature of interactions between the constituent of the binaries. Literature provides extensive
data on the static dielectric constant (ε0) and refractive index (n) of liquids, but the combined
study of all is quite scarce.In the present report, static dielectric constant (ε0)and refractive
index (n)have beenexperimentally determined for binary liquid mixture of 1-Butanol (1-
BuOH) with N, N Dimethylformamide (DMF)over varying concentration of both
mixture composition in the range (0.0 →1.0) at constant temperature303 K.Static dielectric
constant (ε0) and refractive index (n) for the binary mixture have beenmeasured using high
precision LCR meter (0.2 MHz) and Abbe’s refractometer respectively. Various dielectric
parameters namely Kirkwood correlation parameter (g), Kirkwood effective correlation
parameter (geff), Kirkwood angular correlation parameter (gF) and Bruggeman parameter (fB)
are determined for the binary mixtures. Variations of these parameters against the
concentration of constituents are discussed in terms of molecular interaction between the
constituent species. Excess of static dielectric constant (ε0)E and refractive index (n)E are
determined and fitted with Redlich-Kister polynomial equation to derive the binary
coefficients and standard deviations. These data have great significance in applied areas of
research. They are needful for design processes in chemical, pharmaceutical, petrochemical
and to develop models.
1. Keywords
1-Butanol, Bruggeman factor, Binary mixtures, DMF, Kirkwood parameters, Molecular
interactions, Refractive index, Static dielectric constant.
2. Introduction
Dielectric constant is an intrinsic property of the bulk material, which plays an important role
in the solution properties. In recent years, measurements of static dielectric constant,
refractive index and density have been adequately employed in understanding the nature of

International Journal of Research in Modern Engineering and
Emerging Technology (IJRMEET) UGC Approved id_47203 Vol. 5, Sp. Issue: 9, Sept.: 2017
(IJRMEET) ISSN: 2320-6586
643 Online International, Refereed, Impact factor & Indexed Monthly Journal www.raijmr.com RET Academy for International Journals of Multidisciplinary Research (RAIJMR)
molecular interactions and physico-chemical behaviour in liquid mixtures. The nonrectilinear
behaviour of above mentioned properties of liquid mixtures with changing mole or volume
fractions is attributed to the difference in size of the molecules and strength of interactions.
Dielectric studies on binary mixtures are important for understanding the heterogeneous and
homogeneous interactions (dipole–dipole interaction and hydrogen bonding) in the mixture.
[1-10]. The broad classifications of the methods to study H-bonding are chemical,
crystallographic, spectroscopic and theoretical. The chemical methods are mainly concerned
with the thermodynamic properties like enthalpy, entropy, heat of mixing, etc. The
crystallographic studies are mostly related to the conformation of the structure in H-bonded
systems by X-ray diffraction, neutron diffraction and electron diffraction methods [11]. The
spectroscopic effects consider the physical aspects of H-bonding like molecular potentials,
barrier to internal rotation, the vibrational energies of the bonds which are modified by the
potential field, etc. Dielectric studies have often proved to be a powerful tool to give insights
into the mechanisms of association and reorientational dynamics of dipolar liquids [2–4].
Amides have high polarity and strong solvating power; which makes them important solvents
in chemical industry. N, N-Dimethylformamide (DMF) has been chosen for the present study
because its properties have been the subject of considerable interest due to its relationship to
peptides and proteins [2-4,8,11]. Further it is an important solvent that finds applications in
polymer science and pharmaceutical industry too. DMF is highly aprotic polar solvent with a
large dipole moment and a relatively high dielectric constant. In the pure state, it shows self-
association through dipole-dipole interactions. Therefore, the solution chemistry of these
compounds can be strongly influenced by inter and intra molecular H-bonding interactions,
which consequently plays an important role in determining the physiochemical properties of
these molecules. 1-Butanol (1-BuOH) is used as an ingredient in perfumes and as a solvent
for the extraction of essential oils, also used as an extractant in the manufacture
of antibiotics, hormones, and vitamins. It is a solvent for paints, coatings, natural resins,
gums, synthetic resins, dyes, alkaloids, and camphor. 1-BuOH is used as a swelling agent in
textiles, as a component of hydraulic brake fluids, cleaning formulations, degreasers,
repellents and as a component of ore floation agents [12-14].
3. Materials and Methods
1-Butanol (1-BuOH) of AR Grade was procured from Sd-finechem, India. AR grade N, N
Dimethylformamide (DMF) was supplied by LobaChemie Pvt Ltd, (India). Binary mixtures
were prepared in hermetically sealed glass vials at 11 volume concentrations (0.0 →1.0) over

International Journal of Research in Modern Engineering and
Emerging Technology (IJRMEET) UGC Approved id_47203 Vol. 5, Sp. Issue: 9, Sept.: 2017
(IJRMEET) ISSN: 2320-6586
644 Online International, Refereed, Impact factor & Indexed Monthly Journal www.raijmr.com RET Academy for International Journals of Multidisciplinary Research (RAIJMR)
the entire mixing range at 303 K. The mole fractions of the mixture constituents were
determined using the formula
x1= (ρ1∙∅1 M1)⁄(ρ1∙∅1 M1)⁄ +(ρ2∙∅2 M2)⁄ (1)
where ϕ is the volume fraction, ρ is the density, M is molecular weight, suffix 1 and 2 are the
components 1-BuOH and DMF of the binary mixtures, respectively.
3.1. Dielectric measurement
The static dielectric constant values (ε0) of DMF, 1-BuOH and their binary mixtures are
determined using the capacitive measurement method at 0.2 MHz using high precision LCR
meter (Hameg HM8118) with help of cylindrical test fixture designed at lab for the electrical
capacitance measurements. Electrical capacitance of the cell without and with the sample are
measured. The Electrical capacitance of the cell was stable and reproducible.
3.2. Refractive index measurement
The refractive index of each of the solution is determined at a wavelength of 589 nm using an
Abbe Refractometer. The refractometer is initially calibrated by a standard liquid (HPLC
grade) and then used to perform refractive index measurement at constant temperatures. The
temperature of the refractometer was controlled by circulation of water in the sample
compartment. The optical dielectric constant (ε∞) of DMF, 1-BuOH and their binary are taken
as the square of the refractive index (n).
All measurements were carried out at constant temperature (303 K). The temperature was
controlled thermostatically using constant temperature water bath. The maximum
measurement error in the values of (ε0) and n are 0.9 % and 0.02 % respectively.
Table 1. Comparison of static dielectric constant (ε0) and refractive index (n) with the literature values.
_______________________________________________________________ Compound Name Static dielectric constant (ε0) Refractive index (n)
_______________________________________________________________ Experimental Literature Experimental Literature
_______________________________________________________________ 1-BuOH 16.67 16.91 a 1.3994 1.3983 b DMF 38.77 36.55 d 1.4293 1.4163 c
_______________________________________________________________ aRef- 14,bRef- 15, cRef- 16,dRef- 17

International Journal of Research in Modern Engineering and
Emerging Technology (IJRMEET) UGC Approved id_47203 Vol. 5, Sp. Issue: 9, Sept.: 2017
(IJRMEET) ISSN: 2320-6586
645 Online International, Refereed, Impact factor & Indexed Monthly Journal www.raijmr.com RET Academy for International Journals of Multidisciplinary Research (RAIJMR)
4. Results and Discussion
The experimental values of static dielectric constant (ε0) and refractive index (n) of pure
organic liquids used in the present study along with their literature values are presented in
Table 1. It is seen that the experimental values obtained in the present study are in good
agreement with the literature values. Variation of static dielectric constant (ε0) and refractive
index (n) against mole fraction of 1-BuOH are shown in Figure 1.
Figure1. Variation of static dielectric constant and refractive index against mole fraction of
1-BuOH in the binary mixtures of (DMF+1-BuOH) at 303 K.
The nonlinear variation of static dielectric constant (ε0) against mole fraction of 1-BuOH
suggests molecular interaction between the molecular constituents. In the liquid binary
mixtures, there is a wide range of possible molecular interactions between the constituents
such as hydrogen bonding, dipole-dipole and induced dipole-dipole interactions. As a result
of these interactions deviations occur from ideal dielectric behaviour with the variation in
concentration of mixture constituents [2-4,18,19]. There is a considerable difference between
dipole moment values (μDMF = 3.82 D and μ1-BuOH = 1.68 D) of the constituent molecules.
Therefore, the internal field in the pure state would be very different from the internal field in
the mixed state. The excess static dielectric constant (ε0)E and excess refractive index (n)E are
calculated from the experimental data [4,7,10,18],

International Journal of Research in Modern Engineering and
Emerging Technology (IJRMEET) UGC Approved id_47203 Vol. 5, Sp. Issue: 9, Sept.: 2017
(IJRMEET) ISSN: 2320-6586
646 Online International, Refereed, Impact factor & Indexed Monthly Journal www.raijmr.com RET Academy for International Journals of Multidisciplinary Research (RAIJMR)
(ε0)E = (ε0m − ε∞m) − (ε01 − ε∞1)∙x1+(ε02 − ε∞2)∙x2 (2)
(n)E = nm − (n1∙x1 + n2∙x2) (3)
where suffix ‘m’, ‘1’ and ‘2’have their usual meaning mixture, component 1 (i.e. 1-BuOH)
component 2 (i.e. DMF) respectively. These excess parameters are fitted in Redlich-Kister
polynomial equation [16,19]
(A)E = x1 ∙ x1 ∑ ai ∙ (x2 − x1)ini (4)
To obtain the parameters ai, X1 and X2 are the mole fractions of 1-BuOH and DMF, ‘n’ is
the degree of polynomial. The linear least-squares fitting procedure was used to fit the
polynomials to the data. The adjustable parameters ai, with standard errors is listed in Table
2.
Table 2. Redlich-Kister parameters ai (i = 0 to 3) with correlation parameter for binary mixtures. ______________________________________________________________ Parameter a0 a1 a2 a3 σ ______________________________________________________________ (ε0)E -8.92085 -3.60637 2.23260 -2.21551 0.99319 (n)E -0.002582 -0.003693 0.0001918 0.003706 0.98137 ______________________________________________________________
The variations of excess function ((ε0)E and(n)E) are shown in figure 2 (Geometrical shapes
and smooth line shows expt. data points and R-K fitted respectively). The character changes
of the static dielectric constant are very clear as the function of composition of mixtures in
the case of excess values of ε0. The (ε0)E values of binary mixtures of 1-BuOH+DMF are non
zero and shows ((ε0)E< 0) negative deviation . This indicates that both molecular species
interact so as to reduce the total effective dipoles due to orientation of some of the
neighbouring dipoles in opposite direction in these systems. Hence there is a decrease in the
values of the static dielectric constants of the binary mixture from their ideal mixing values.
These suggest that the molecular species may form multimers leading to less effective
dipoles. The different strength of H-bond interactions and net dipolar alignments is
responsible for the divergent magnitude of (ε0)E values in these mixtures. Whereas the
negative deviation of (n)E suggests mixtures have slightly lower values of the optical
permittvity than the ideal case at Na-D line wavelength.

International Journal of Research in Modern Engineering and
Emerging Technology (IJRMEET) UGC Approved id_47203 Vol. 5, Sp. Issue: 9, Sept.: 2017
(IJRMEET) ISSN: 2320-6586
647 Online International, Refereed, Impact factor & Indexed Monthly Journal www.raijmr.com RET Academy for International Journals of Multidisciplinary Research (RAIJMR)
Figure 2. Variation of excess static dielectric constant (((ε0)E) and excess refractive index
(n)E) against mole fraction of 1-BuOH in the binary mixtures of (DMF+1-BuOH) at 303
K.
The Kirkwood correlation factor (g) provides a more clear and detailed information on
dipole-dipole correlation in associating polar liquids and the information regarding
orientation of electric dipoles in polar liquids [18-19]. The expression for g
4πN9kT
ρM
gμ2= (ε0−ε∞)(2ε0+ε∞)ε0(ε∞+2)2 (5)
Where μ is the dipole moment, ρ is the density of liquid at temperature T, M is the
molecular weight, k is the Boltzmann constant, N is the Avogadro's number. For a liquid in
which molecules tend to orient themselves with the parallel dipole alignments in the same
direction results the ‘g’ value greater than unity. When the polar liquid molecules prefer an
ordering with anti-parallel dipoles, the ‘g’ value comes smaller than unity, and for non-
associating molecules, the ‘g’ value is nearly unity. The departure of ‘g’ value from unity is a
measure of degree of short range dipolar ordering due to H-bond interactions. ‘g’ value 1-
BuOH greater than unity (g = 3.24), which confirms the existence of H-bonded molecular
multimers with parallel dipole alignments. The value of ‘g’ for DMF is near to unity (g =
1.21) and thus confirms its weakly-associative behaviour. For the mixtures of two polar

International Journal of Research in Modern Engineering and
Emerging Technology (IJRMEET) UGC Approved id_47203 Vol. 5, Sp. Issue: 9, Sept.: 2017
(IJRMEET) ISSN: 2320-6586
648 Online International, Refereed, Impact factor & Indexed Monthly Journal www.raijmr.com RET Academy for International Journals of Multidisciplinary Research (RAIJMR)
liquids, the effective Kirkwood correlation factor (geff) of two different molecules is
evaluated from the modified Kirkwood equation. The Modified Kirkwood equation for the
binary mixture is expressed as
4πN9kT
ρ1M1μ1
2∅1 + ρ2M2μ2
2∅2 geff= (ε0m−ε∞m)(2ε0m+ε∞m)ε0m(ε∞m+2)2 (6)
The corrective Kirkwood correlation factor (gF) equally affecting the Kirkwood
correlation factors of pure substances 1 and 2
4πN9kT
ρ1M1μ1
2∅1g1 + ρ2M2μ2
2∅2g2 gF = (ε0m−ε∞m )(2ε0m +ε∞m )ε0m (ε∞m +2)2 (7)
Figure 3. Variation of geff and gF against mole fraction of 1-BuOH in the binary mixtures
of (DMF+1-BuOH) at 303 K.
The evaluated geff and gF values of the binary mixtures are plotted against the volume
fraction of 1-BuOH in Fig. 3. The geffvalues of binary mixtures have shown deviation from
ideality, which confirms the net change in dipolar ordering of the mixture constituents due to
H-bond complexation. It is observed that for the studied binary mixture system shows
negative deviation from ideality. The deviation of gF values from unity confirms that the H-
bonded structures of mixture constituents changes significantly. The extent of departure of gf
from unity represents the degree of interaction in binary mixture constituents. In the present

International Journal of Research in Modern Engineering and
Emerging Technology (IJRMEET) UGC Approved id_47203 Vol. 5, Sp. Issue: 9, Sept.: 2017
(IJRMEET) ISSN: 2320-6586
649 Online International, Refereed, Impact factor & Indexed Monthly Journal www.raijmr.com RET Academy for International Journals of Multidisciplinary Research (RAIJMR)
study, the magnitude of deviation of gF values from unity is maximum at 0.55 mole fraction
of 1-BuOH. This suggests that strong molecular interaction is taking place at this
concentration. Another important dielectric parameter is the Bruggeman parameter (fB) which
give information about the interaction between components in the mixture [19-21]. If there is
no interaction between the components in the mixture then the Bruggeman parameter (fB)
varies linearly with the volume fraction ΦB, but if there is interaction between the molecular
species then fB varies nonlinearly with ΦB. The Bruggeman parameter fB is given by
fB= ε0m− ε02ε01− ε02
ε01ε0m
13 = 1 − ∅2 (8)
Here, ΦB is the volume fraction of component B, whereasεoA, εoB and εom are the static
dielectric constants of component A, component B and binary mixture respectively.
According to Eq. 8, a linear relationship is expected which should give a straight line when fB
is plotted against ΦB. However, from the Fig. 4, it is observed that for the studied binary
system experimental values of fB are found to deviate from the linear relationship.
fB= ε0m− ε02ε01−ε02
ε01ε0m
13 =1 − (a − (a − 1)∅2)∅2 (9)
where ‘a’ is a numerical fitting parameter. Here, it is assumed that the volume fraction of the
solute in the mixture is modified by a factor of [a–(a–1)ΦB]. This modification of volume
fraction is may be due to structural rearrangement of the solute molecules in the mixture.
which signify the change in the orientation of the constituent molecules and thus measures
the extent of the dipole interaction of the constituent polar liquids of the binary mixture in
terms of size of molecules and their occupation of volume. For the studied system, the
observed value of numerical fitting parameter (a = 1.15) indicating hetero molecular
interaction between the molecular species. Further it also suggests that the effective volume
of the DMF molecules decrease as 1-BuOH added in the mixture.

International Journal of Research in Modern Engineering and
Emerging Technology (IJRMEET) UGC Approved id_47203 Vol. 5, Sp. Issue: 9, Sept.: 2017
(IJRMEET) ISSN: 2320-6586
650 Online International, Refereed, Impact factor & Indexed Monthly Journal www.raijmr.com RET Academy for International Journals of Multidisciplinary Research (RAIJMR)
Figure 4. Variation of fBagainst mole fraction of 1-BuOH in the binary mixtures of (DMF+1-
BuOH) at 303 K.
5 Conclusions
The static dielectric constant (ε0) and refractive index (n) of 1-BuOH, DMF and their binary
mixtures are determined. Excess static dielectric constant (ε0)E, excess refractive index (n)E
Kirkwood parameters (geff and gF) and Bruggeman parameter (fB) are evaluated and discussed
in terms of hetero molecular interaction between molecular species. The results obtained
from the present investigation indicate that the molecules of studied binary mixtures may be
joined, by a network of interactions such as dipolar and hydrogen bonds, to form stable
intermolecular complexes between the molecular species.
6 Acknowledgement
Author is thankful to UGC, New Delhi, India, for providing financial assistance through
major research project [F.No. 41-929/2012 (SR)].
References
[1] A. Gilani, H. Gilani, M. Ansari, N. Ojani, J. Chem. Thermodynamics, 2012, 44, 44.
[2] R. Sengwa, V. Khatri, S. Sankhla, J Mol. Liqs., 2009, 144, 89.
[3] R. Sengwa, V. Khatri, S. Sankhla, Indian J. Chem. A, 2009, 48, 512.
[4] R. Sengwa, S. Sankhla, N. Shinyashiki, J Sol. Chem., 2008, 37, 137.
[5] A. Prajapati, A. Vyas, V. Rana, S. Bhatnagar, J. Mol. Liq., 2010, 151, 12.
[6] A. Rodriguez, J. Canosa, J. Tojo, J. Chem. Eng. Data., 2001, 46, 1506.
[7] A. Prajapati, V. Rana, A. Vyas, D. Gadani, J. Int. Acad. Phys. Sci., 2012, 16, 387.
[8] A. Prajapati, V. Rana, A. Vyas, D. Gadani, Advanced Materials Research., 2013, 665,
317.

International Journal of Research in Modern Engineering and
Emerging Technology (IJRMEET) UGC Approved id_47203 Vol. 5, Sp. Issue: 9, Sept.: 2017
(IJRMEET) ISSN: 2320-6586
651 Online International, Refereed, Impact factor & Indexed Monthly Journal www.raijmr.com RET Academy for International Journals of Multidisciplinary Research (RAIJMR)
[9] A. Prajapati, Advanced Materials Research., 2016, 1141, 125.
[10] A. Prajapati, V. Rana, A. Vyas, Ind. J. Pure & Appl. Phys., 2017, 55, 297.
[11] T. Thenappan, U. Sankar, J Mol. Liqs., 2006, 126, 38.
[12] I. Mellan, Industrial Solvents, Van Nostrand Reinhold, New York, 1950, 482.
[13] A. Doolittle, The Technology of Solvents and Plasticizers, Wiley, New York,
1954, 644.
[14] C. Dorota, B. Adam, R. Sengwa, J Mol. Liqs., 2013, 179, 72.
[15] F. Dossoki, J Chin. Chem. Soc., 2007, 54, 1129.
[16] M. Andrea, P. Carlo, T. Mara, T. Lorenzo, T. Giuseppe, J Chem. Eng. Data, 1991, 36,
365.
[17] R. Sengwa, V. Khatri, S. Sankhla, J Sol. Chem., 2009, 38, 763.
[18] T. Madhumohan, T. Vijayalaxmi, Phys. Chem. Liq., 2013, 51, 480.
[19] A. Prajapati, V. Rana, A. Vyas, S. Bhatnagar, Ind. J. Pure & Appl. Phys., 2011, 49,
478.
[20] A. Prajapati, V. Rana, A. Vyas, Ind. J. Pure & Appl. Phys., 2013, 51, 104.
[21] S. Puranik, A. Kumbharkhane, S. Mehrotra, Bruggeman model, J. Mol. Liqs., 1994, 94,
173.

International Journal of Research in Modern Engineering and
Emerging Technology (IJRMEET) UGC Approved id_47203 Vol. 5, Sp. Issue: 9, Sept.: 2017
(IJRMEET) ISSN: 2320-6586
652 Online International, Refereed, Impact factor & Indexed Monthly Journal www.raijmr.com RET Academy for International Journals of Multidisciplinary Research (RAIJMR)
E.P.R. Study of Pure and Doped Calcium Tartrate Single Crystals
S. R. Suthar and M. J. Joshi
Physics Department, Municipal Arts & Urban Bank Science College,
Mehsana , Gujarat, 384002 .
Crystal Growth Laboratory, Department of Physics, Saurashtra University, Rajkot 360005.
E-Mail : [email protected]
. Abstract:
Calcium dextro and levo tartrate single crystals with different amounts of doping of Mn2+ have
been grown by single diffusion gel growth technique in silica hydrogel.The powder XRD pattern
suggested that the crystals were found to be of single phase and no significant variations in the values of
cell parameters were observed due to the doping of Mn.2+ The 110 faces of single crystalline Mn.2+
doped calcium dextro and levo-tartrate crystals were investigated by EPR(Electron Paramagnetic
Resonance) spectroscopy in perpendicular as well as parallel directions to this face. From the spectra two
different phases of Mn2+ were observed.The values of EPR parameters were found to be nearly the same
for calcium dextro tartrate and calcium levo-tartrate crystals with different amounts of Mn2+ doping
within the experimental limits.
1. Introduction: The electron paramagnetic resonance technique has attracted the attention of not only chemists but
also the material scientists and solid state physicists to study various materials. Materials may be
monocrystalline, microcrystalline or glassy and give spectra according to their nature, which may be rich
and well resolved -or poorly resolved. The EPR technique has been employed for spin identification, spin
counting spin mapping, spin motion and spin imaging of a variety of advanced materials, transition
metals, rare- earth and actinide cmpounds, organic charge transfer complexes,etc. This technique has
proved to be specific, sensitive up to ppm level of composition, phase and texture, accurate as a
quantitative and non distructive tool1-4, which has been reviewed by Sunanda.1
Calcium tartrate crystals are found to be exhibiting ferroelectric and non linear optical properties5-
9. The ferroelectricity in gel grown calcium tartrate was reported by Gon8. Suryanarayana et al.9 have
studied optical and structural properties of strontium doped calcium tartrate crystals. In the present
investigation, calcium dextro tartrate (CDT) and, calcium levo tartrate (CLT) crystals have been grown by
the gel technique by doping them with Mn2+ in different amounts. An attempt is made by the present
authors to investigate these doped crystals by EPR spectroscopy to find out the effect of optically
sensitive dextro and levo tartrate radicals on the growth of crystals as well as the effect of doping.
2. Experimental Techniques:--
Single crystals of calcium tartrate were grown in silica hydro-gel by incorporating single diffusion
reaction technique. The gel was set by mixing the aqueous solutions of sodium metasilicate of 1.06

International Journal of Research in Modern Engineering and
Emerging Technology (IJRMEET) UGC Approved id_47203 Vol. 5, Sp. Issue: 9, Sept.: 2017
(IJRMEET) ISSN: 2320-6586
653 Online International, Refereed, Impact factor & Indexed Monthly Journal www.raijmr.com RET Academy for International Journals of Multidisciplinary Research (RAIJMR)
specific gravity with 1.0 M tartaric acid, either dextro or levo as the case may be so that the pH of mixture
could be set at 3.8.This mixture was transferred in to glass test tubes of 2.5 cm diameter and 15 cm
length. After setting the gel supernatant solutions were poured in different test tubes without disturbing
the gel. After a few days, nucleation started in the gel and good quality, prismatic, transparent crystals
grew. The crystals of pure calcium tartrate crystal were colorless and transparent. Whereas the Mn2+
doped crystals were light yellowish in colour.
The samples were analyzed by the powder X-ray diffraction technique using PHILIPS x’ PERT
MPD system at C.S.M.C.R.I.,Bhavnagar.The sample were analyzed by powder X computer software and
the crystal structure was determined for different samples.
The field was applied perpendicular and parallel to 110 face of the crystals. The EPR spectra were
recorded in X-band (8.5 to 9.5GHz) at room temperature at RSIC, I.I.T., Mumbai. The crystals were
rotated and the spectra were recorded perpendicular and parallel to the 110 face with the help of a
suitable goniometer using TCNE as a marker.
3 Results and discussion:
There has been considerable interest in the study of the EPR spectra of single crystals either by
irradiating with X-Rays or gamma-rays or doping by transition or rare earth elements.2-3 The ESR study of
Mn2+ in Co2M(SO4)26H2O(M=Zn,Mg,Co,Ni) single crystals10 and Mn2+ in Nd2Zn3(NO3)12.24H2O single
crystals11 have been reported. Pure and vanadyl doped single crystals of strontium tartrate tetra hydrate
have been characterized by EPR spectroscopic technique. The angular variation has shown that Vo2+ ion
has a fixed orientation in the lattice. The g and A tensors and their direction cosines were evaluated from
the EPR analysis. The EPR and electronics spectral results have shown that the Vo2+ ions occupy the
interstitial sites in the lattice (tetragonal) having C4v symmetry. Suzuki et al 12 reported the ESR spectra of
Cu2+ doped sodium ammonium tartrate.
In the present investigation, MnCl2 solution of different concentrations of were added along with
1.0M CaCl2 solutions in order to achieve appropriate doping of Mn2+ in the calcium tartrate lattice.
Calcium tartrate crystals were grown by diffusion of Ca2+ and tartrate ions in gel media and the reaction
between them forming nucleation centers, subsequently, the growth of crystals occurs on such nucleation
centers. Doping of Mn2+ is expected substitute Ca2+ in calcium tartrate lattice during the growth of the
crystals, which is not expected to change the crystal structure and the cell dimensions of calcium tartrate
crystals. This has been verified by powder X-Ray diffraction (XRD) patterns and no extra phase appears
in the XRD patterns due to doping of Mn2+. The crystal structure and cell parameters are found to be same
within the experimental variations. Table (1) shows the cell parameters obtained for Mn2+ doped calcium
tartrate crystals. These values are matching with the standard values of cell parameters reported by
Amady13 for calcium tartrate crystals as follows.
a = 9.24 + 0.02 Ǻ , b = 10.63 + 0.02 Ǻ and c = 9.66 + 0.02 Ǻ

International Journal of Research in Modern Engineering and
Emerging Technology (IJRMEET) UGC Approved id_47203 Vol. 5, Sp. Issue: 9, Sept.: 2017
(IJRMEET) ISSN: 2320-6586
654 Online International, Refereed, Impact factor & Indexed Monthly Journal www.raijmr.com RET Academy for International Journals of Multidisciplinary Research (RAIJMR)
Table 1 Powder XRD data of pure and doped CT crystals
The EPR spectra of Mn2+ doped calcium tartrate single crystals exhibit hyperfine splitting in form
of five regions of each block containing six lines. The EPR -spectra of 0.01% Mn2+ doped calcium tartrate
crystals recorded perpendicular and parallel to110 face are shown in Figure (1)and Figure (2),
respectively. The EPR parameter s g|| g⊥ , A|| , A⊥ , D||, D⊥ are calculated from the spectra and listed
in Table (2)
Figure (1) EPR of 0.01% Mn2+ doped ⊥ to 110 face CLT crystal
Figure (2) EPR of 0.01% Mn2+ doped ǁ to 110 face CLT crystal
Sample Cell parameters
a b c
Pure CaC4H4O6 9.2134 10.5841 9.6253
0.001M Mn2+ doped CLT crystals 9.2053 10.6018 9.6117 0.01M Mn2+ doped CLT crystals 9.21 10.5763 9.615 0.1M Mn2+ doped CLT crystals 9.2168 10.5677 9.6147 0.001M Mn2+ doped CDT crystals 9.2084 10.5964 9.6276 0.01M Mn2+ doped CDT crystals 9.216 10.59 9.621 0.1M Mn2+ doped CDT crystals 9.2979 10.5766 9.6488

International Journal of Research in Modern Engineering and
Emerging Technology (IJRMEET) UGC Approved id_47203 Vol. 5, Sp. Issue: 9, Sept.: 2017
(IJRMEET) ISSN: 2320-6586
655 Online International, Refereed, Impact factor & Indexed Monthly Journal www.raijmr.com RET Academy for International Journals of Multidisciplinary Research (RAIJMR)
Mn2+ is a d5 ion having a total electron spin S = 5/2 in its ground state as required by the Hund’s
rule of maximum multiplicity. The ground term of this ion is 6S5/2. This term split up, due to zero filed,
into three Kramer’s doublets e.g., ±5/2, ±3/2, ±1/2.This degeneracy is lifted as used in EPR experiment
giving six energy levels with spin –5/2, -3/2, -1/2, +1/2, +3/2, +5/2 in increasing order. Each of these
energy levels is further split into six equally spaced levels by the interaction of these spins with the
nuclear spin, which for Mn+2 is I=5/2 and hence the number of levels (2I+1) gives six lines. Therefore, the
energy level diagram with total thirty levels is obtained in the presence of an applied magnetic field and
for microwave absorption signals to be observed two selection rules are obeyed Viz., ∆S= +1, and ∆MI =
o. These results in five regions of spectral absorption each block containing six lines.
Table 2 EPR Parameters of Mn2+ doped CLTT crystals
Samples A⊥ A || g⊥ g || D⊥ D ||
0.001M Mn2+ doped CDT crystals
96 97.5 2.029357 1.97331 201.25 301.25
0.01M Mn2+ doped CDT crystals
94 90 2.044639 1.98776 167.5 270.625
0.1M Mn2+ doped CDT crystals
98.12 91 2.085278 1.96759 294 190.62
0.001M Mn2+ doped CLT crystals
96.25 94.99 1.9779 2.044639 300.62 207.5
0.01M Mn2+ doped CLT crystals
92.5 95.66 2.03057 1.98195 203.12 295
0.1M Mn2+ doped CLT crystals
95.33 92 2.057307 1.9977 285.25 151.875
From the spectra of Figure (1) and Figure (2), it is found that there are two different phases of
Mn+2 tartrate complexes present in the crystal. This corresponds to the results of Jain and Venkateswaralu 11. The EPR spectra of phase one is well spread out while that of the other is found to be located in close
signals with a small spread in the middle of the spectra. Different parameters for Mn+2 doped calcium
tartrate crystals are comprised in Table (2), which suggest that no marked deference either due to level of
Mn+2 doping or the type of parent compound i.e., dextro or levo tartrate is observed.
4 CONCLUSION
Calcium tartrate crystals were grown with different amount of Mn+2 doping did not change the cell
parameters of grown calcium tartrate crystals and produced the single phase crystals. Mn++ doped calcium
CT crystals are characterized by EPR spectroscopy in X-band at room temperature. Single crystalline
samples of Mn++ doped CLTT crystals are analyzed parallel and perpendicular to 110 face. Various
EPR parameters are observed as the concentration of Mn++ increases in the crystals. From the two types
of spreads in the EPR spectra it is conjectured that two types of different environments of Mn++ exist in
the crystals. Mn++ is expected to occupy the interstitial positions in CLTT crystals.

International Journal of Research in Modern Engineering and
Emerging Technology (IJRMEET) UGC Approved id_47203 Vol. 5, Sp. Issue: 9, Sept.: 2017
(IJRMEET) ISSN: 2320-6586
656 Online International, Refereed, Impact factor & Indexed Monthly Journal www.raijmr.com RET Academy for International Journals of Multidisciplinary Research (RAIJMR)
ACKNOWLEDGEMENTS
Authors are thankful to Prof. L. D. Dave (Retired Head, Chemistry Department, Bhavnagar
University, Bhavnagar) for his valuable guidance to find out the EPR parameters of the spectra.
References (1) Sunandana S., Bull. Mater Sci. 21 (1998)1.
(2) Ayscough P. B., “Electron Spin Resonance in Chemistry”, Methuen & Co., London (1967)
(3) Carrington A. McLachlan A.D, “ Introdution to Magnetic Resonance” Harper Int., New
York,(1967)
(4) Drago R. S., “Physical Methods in Chemistry” Saunders College ,NewYork (1977)
(5) Medrano C. Gunter P. and Arend H, phys. Status Solid. 14B (1987) 749
(6) Brehat F. and Wyncke B. J.Phys. B.: At Mol.Opt. Phys. 22 (1989) 1981
(7) Nakatani N. Jpn. J. Appl. Phys. 30 (1991) 1961
(8) Gon H B J. Cryst. Growth.102 (1990) 501
(9) Suryanarayana K.Dharmaprakash SM and Sooryanarayana K Bull. Mate. Sci. 21(1998)87
(10) Jain V K, Kapor V, Prakash V; Solid State Commun.,97(1996) 425
(11) Jain V K and Venkateswaralu, Indian J. of pure and Appl. Phys. 16 (1978) 841
(12) Suzuki I, Maeda M, Abe R; J.Phys. Soc. Japan, 33 (1972) 860
(13) Ambady G K, Acta cryst. B24(1968) 1548

Magnetic Nanostructure, Nano optics and its Applications
Paresh V Modh1 Kalpesh C Mevada2
R R Mehta College of Science
C L Parikh College Commerce, Palanpur1
Municipal Arts & Urban Bank Science College, Mahesana2 Email:Paresh.modh_rediffmail.com
Abstract: The present paper reports the study of modulation in intensity of light transmitted
through the thin films of nanostructured. The form of the created features ranges from craters and
ditches to hillocks. The process has been demonstrated on gold substrates by utilization
of uranium, carbon, and cesium tips. Nanoparticles are now being used in the manufacture of
scratchproof eyeglasses, crack- resistant paints, and anti-graffiti coatings for walls, transparent
sunscreens, stain-repellent fabrics, self-cleaning windows and ceramic coatings for solar cells.
Nanotechnology is a part of science and technology about the control of matter on the atomic and
molecular scale - this means things that are about 1000 nanometers or
smaller. Nanotechnology includes making products such as magnetic devices, analysts, sensors,
etc. Nanotechnology is being studied for both the magnetic and electric. Magnetic
Nanotechnology in medicine involves applications of nanoparticles currently under development,
as well as longer ranges research that involves the use of manufactured Nano-robots to make
repairs at the cellular level. Nanotechnology eases the water cleansing process because inserting
nanoparticles into underground water sources is cheaper and more efficient than pumping water
for treatment. The primary objective of this magnetoscopy is to apply Nano tools in biological
systems to overcome the current problems in medical/biological world. Magnetic devices
are proposed use of 100 pm diameter magnetic particles, with and without a carrier fluid.
Keywords: Magnetoscopy, Nano motor, AC and DC Magnetic field, rotating magnetic power
generator
Introduction: In this work, we present on some extent to experimental and theoretical study on the small
angle scattering. Theoretical study of small angle scattering is explained more effectively. When the
radiation is incident on the specimen, it deviates from its path is known as small angle scattering. Nanostructure is very important technique to obtain detail information of bulk sample. In the
Nanostructure, partially crystalline or amorphous solids, liquids or gases are used as target. Moreover
electrons, gamma rays, X-rays, are incident and target should be point object. But I consider only X-ray,
so it is known as small angle scattering. The improvement in the Nanostructure instrumentation has
recently enabled to get easy collection of datas. Distortion due to the X- ray detection system can be
removed. The transverse dimension t of the coherence volume is also defined and discussed, as coherence
volume is important to analyze datas. Out of three aspects like shape, Nanostructure and packing, two
properties must be known in order to explain rest of above properties. Characteristics of nanoparticles like
gold can be known, if TEM method is included with the SAXS method, we will get best performance like
information on morphological features ranging from micro structure to macro structure. Explanation of
pin-hole collimated instruments, Bose- Hart instruments, slit collimated instruments are very popular due
to their flexibility multi-
International Journal of Research in Modern Engineering and
Emerging Technology (IJRMEET) UGC Approved id_47203
Vol. 5, Sp. Issue: 9, Sept.: 2017
(IJRMEET) ISSN: 2320-6586
657 Online International, Refereed, Impact factor & Indexed Monthly Journal www.raijmr.com RET Academy for International Journals of Multidisciplinary Research (RAIJMR)

phase system to explain scattering. There is also drawback of SAXS related to scattering intensity will be
explained in paper.
Nano Structure: Magnetic Nano structure indicates that space time emerges in the low energy sector of a
fundamental condensate. Small angle scattering is very important method for the Nano structural
particles. SAS is developing at a high step over the past two decades. All the theoretical datas pass under
this method so that improvements in data correction steps are corrected. Mathematical descriptions are
also given where it is necessary. An introduction is also explained here for Nano optics.
Irradiate a sample with a well collimated beam of some type of radiation measure the resulting
intensity as a function of angle between the incoming beam and scattered beam, and then determine the
structure that caused the observed pattern. Scattering patterns are caused by the interference of the
secondary waves that are emitted from various structures when irradiated. Scattering of X-Ray is caused
by difference in electron density, scattering of neutrons is caused by difference in scattering power of
different nuclei and scattering of light is caused by difference in refractive index.
If at any instant there are n particles in a beam with a velocity v, the flux of the beam is nv and if
N be the number of nuclei exposed to the beam at any instant of time, then the rate of react or scattering is
expressed as proportional to nv and N.
In 19 th centuries, Rontgen discovered radiation with wavelength much smaller than that of visible
light. Rontgen named this high energy radiation Nano optics because of their unknown nature. Soon after
this discovery, Von Laue and his associate discovered that scatter X-ray in distinct pattern. It was quickly
recognized that these patterns give direct insight into the structure of the materials that caused the
scattering. Since these early discoveries, many technical advances made Nano optics scattering one of the
most powerful characterization tools available for both homogeneous and heterogeneous materials.
Irradiate a sample with a well- collimated beam of some type of radiation measure the resulting
intensity as a function of angle between the incoming beam and scattered beam, and then determine the
structure that caused the observed pattern. Scattering patterns are caused by the interference of secondary
waves that are emitted from various structures (electron for X-rays and light, nuclei for neutrons) when
irradiated. Scattering of X-ray is caused by differences in electron density, scattering of neutrons is
caused by differences in scattering power of different nuclei and scattering of light is caused by difference
in refractive index. Since the larger the diffraction angle the smaller the length scale probed, wide angle
X-ray scattering is used to determine crystal structure on the atomic length scale while small angle X-ray
scattering or small angle scattering is used to explore microstructure on colloidal length scale.
Nano optics has many drawbacks but still this method has much important information, for
example, experiment of gold nanoparticles, krypton bubbles in copper, coated silica particles, zerolite
precursor particles are exactly agreement between Nano optics and Nano crystal analysis. Small angle X-
Ray scattering requires combined techniques of TEM and AP. When two main contrasting phases are
involved in these methods, we get best performance of the sample. When someone uses these two
conditions are coincide, hence we will get information on morphological features ranging from sub
nanometer region to several micron. This information is valid for the entire range of radiation.
International Journal of Research in Modern Engineering and
Emerging Technology (IJRMEET) UGC Approved id_47203
Vol. 5, Sp. Issue: 9, Sept.: 2017
(IJRMEET) ISSN: 2320-6586
658 Online International, Refereed, Impact factor & Indexed Monthly Journal www.raijmr.com RET Academy for International Journals of Multidisciplinary Research (RAIJMR)
DR.NILESH
Typewritten Text

Nano Optics: One more drawback of Nano optics, even it is more used in the phase system, Nano optics
measures only the scattering intensity is collected. This method cannot measure phase of photons. And
critical information of the originals structure is also lost. According to latest research, distribution of
electron density is responsible for the scattering. This means many solutions may be equally valid for a
particular set of collected intensities which may only be resolved by obtaining structural information from
other technique such as transmission electron microscope. This is unexpected correction.
Nano optics, which is virtually nonexistence at small angles, refers to scattered waves that have
changed phase and wavelength. The coherent scattering of Nano optics by a single fixed particle is
explained. The increasing availability of intense short pulse Nano optics sources allows a measurement
of a type not possible before, namely angular fluctuations of intensity about mean values on rings of
constant q from snapshots of a relatively small number of identical particles differing only in random
positions and random orientations. In an optical instrument a monochromatic beam of Nano optics is
brought to a sample from which some of the X-rays scatter, while most simply go through the sample
with interacting with it. The scattered X-ray from a scattering pattern which is then detected at a detector
which is typically a three dimensional flat Nano optics detector situated behind the sample perpendicular
to the direction of the primary beam that initially hit the sample. The purpose here is not to familiarize the
reader with all these methods but rather to describe the most commonly used approaches. An important is
that Monte-Carlo methods can be used to calculate entire scattering patterns.
The signal from each molecule will be its vibrational average and signal amplification is
provided by the addition of such vibrational averages from all illuminated atoms, as given by the Nano
optics. Nowadays, there are many instruments like SAXS, and variety of flavors and colors. There are
three parts (1) pin hole collimate instruments (2) slit collimated instruments (3) Boson-Hart instruments.
Pinhole collimated instrument is very popular due to their flexibility in terms of samples and easy
availability in the market. This part of instrument is very useful and also dominates the SAXS field and
for neutron sources.
Slit collimated instrument is much more compact than the pin hole collimated systems. Slit
collimated instrument is less expensive and illuminates a larger amount of sample to collect more
scattering. SAXS is capable of delivering structural information of macro molecules between 10 to 35 nm
of repeat distance in partially ordered systems of up to 160nm. SAXS instruments can be divided into two
main groups point collimation and line collimation instruments. Point –collection instruments have pin
holes that shape the X-ray beam to a small circular spot that illuminates the sample. Due to the small
illuminated sample volume and the waste fullness of collimation process- only those photons are allowed
to pass that happens to fly in the right direction. Moreover the scattered intensity is small and therefore
the measurement time is in the order of hours or days in case of very weak scatterers. And second type of
instrument is much larger compared to point collimation. Line collimation is of great benefit for any
isotropic nanostructured materials like proteins and particle dispersion.
Nanostructure method is a technique to solve a complex problem by the observation of a random
process whose parameters are based on the complex problem. Consider the task of choosing points in
space to simulate a sphere with a radius equal to 5 cm. The points in space, once chosen, will then be used
as scattering points. However, there are problems with the shell and grid method, the problem is that the
discrete shells cause artifacts in the scattering pattern. Also it is very difficult to get a constant point
International Journal of Research in Modern Engineering and
Emerging Technology (IJRMEET) UGC Approved id_47203
Vol. 5, Sp. Issue: 9, Sept.: 2017
(IJRMEET) ISSN: 2320-6586
659 Online International, Refereed, Impact factor & Indexed Monthly Journal www.raijmr.com RET Academy for International Journals of Multidisciplinary Research (RAIJMR)

density with this method. So the t of choosing random points to simulate the sphere is by far the most
appropriate choice.
Applications: In order to reduce scattering, more focusing and mono chromatization crystals,
high intensities Optics sources and total reflective mirrors, three collimators are used. These types of
inventions led to adoption of all of these elements in, subsequent instruments to improve the flux and
signal to noise ratio. Due to X-ray sources we can increase brightness, increase in photon flux 107 photons
per second, photons are generated from micro source tubes. Nano optics topology experiment, 1011 -1013
photons per second are necessary. This is only happening when synchrotron based instruments are used.
“Nikon” camera is suitable for ultra-small angle scattering purposes which are used for high
angular selectivity of crystalline reflections to single out a very narrow band of cattering angles for
observations.
Actually, there are three important parameters to know a structure properties (1) polydisperity (2)
shape (3) packing. Out of these three, two properties must be known for the structural properties. With the
help of particle size distribution and shape, we know an arrangement of particles in the space. A unique
particle size distribution can be obtained by making a low density packing assumption and from particle
shape. Particle shape is determined by TEM method. This essay investigates what could be meant by this
claim.
In the case of Nano optics application, the materials can be solid or liquid and they can contain
solid, liquid or gaseous domains of the same or another material in any combination. Not only particles,
but also the structure of ordered systems likes lamellae, and fractal- like materials can be studied. The
most important outcome of this part of the research is in learning how to properly perform these
simulations. The existence of analytical solutions allowed me to pinpoint error in the code, allowed for
the determination of simulation times required, and also aided in the choice of a random number
generator.
Conclusion: The ultimate goal of this research to develop a Nano Optics and its application method that
is able to fit real experimental data. For the simplest systems, i.e. identical single particles that are
infinitely symmetric or identical single particles with perfect alignment, this goal could currently be
reached if a suitable least square routine are developed. The former could probably be cooled and run on a
fast PC, while the latter is obviously more time consuming because an entire two dimensional pattern is
necessary.
References:
(1) Glatter O, Kratky O, ed.(1982). Small Angle X-ray Scattering
(2) J. Doumerc, A. Ammar, A. Wichainchai, M. Pouchard and P. Hagenmuller, “Sur Quelques Nouveaux
Composes de Structure de Type Delafossite,” Journal of physical chemistry of Solids.
(3) J.E. Maslar, W.S. Hurst, T.A. Vanderah and I. Levin,” The Raman Spectra of X- ray” Journal of
Raman Spectrograph”
(4)E.V.Lavor, F. Bornnert and J. Weber,” Dominant Hydrogen-Oxygen Complex in Hydrothermally
Grown ZnO”
(5)W.A Schutte, “Production of Organic Molecules in Interstellar Ices,” Advances in Space Research.
(6) A.Wada,N. Mochizuki and K. Hiraoka, “Methaanol Formation from Electron-Irradiated
MixedH2O/CH4 Ice at 10K.”
International Journal of Research in Modern Engineering and
Emerging Technology (IJRMEET) UGC Approved id_47203
Vol. 5, Sp. Issue: 9, Sept.: 2017
(IJRMEET) ISSN: 2320-6586
660 Online International, Refereed, Impact factor & Indexed Monthly Journal www.raijmr.com RET Academy for International Journals of Multidisciplinary Research (RAIJMR)
DR.NILESH
Typewritten Text