International Journal of Mechanical Engineering ISSN : 2277 ...
20
International Journal of Mechanical Engineering ISSN : 2277-7059 Volume 2 Issue 2 http://www.ijmejournal.com/ https://sites.google.com/site/journalijme/ 85 ANALYSIS OF THE EFFECT OF CHANGES IN FUEL INJECTOR POSITION ON GAS TURBINE COMBUSTION EFFICIENCY USING LARGE EDDY SIMULATION (LES) Shandy Kharisma Irianto 1 , Gunawan Nugroho 2 Department of Engineering Physics, Institut Teknologi Sepuluh Nopember Surabaya Indonesia 60111 Abstract. Researches on gas turbine have been widely performed, especially on combustion chamber with a non-premixed combustion process. In this work, the research ofthe combustion chamber has been performed using the LES method. The aim of this study is to analyze the combustion process with various fuel injector angles and fuel rate. The analyzed aspects are flow pattern, temperature distribution and species concentration on stoichiometry condition. The mixing process between fuel and air at the combustion zone is affected by the increase in injector angle which, 33.55 o (model 1) being the optimum injector angle to obtain the highest efficiency of 84.6%. It is noted that model 2 (injector 45 o ) has the lowest emission containing waste gases of CH 4 and CO, i.e. 0.75 and 0.089 times lower than those of model 1, respectively. However, the combustion efficiency of model 2 is lower than model 1, i.e. 82.7%. Keywords: Gas turbine combustor, Large Eddy Simulation (LES), Stoichiometry, Computational Fluid Dynamics. 1. I NTRODUCTION Gas turbine is a machine which is often encountered in aircraft and large scale power generation industry. On the aircraft, gas turbine is used as a main driving machine while on the power generation industry, gas turbine is used to drive turbine that been coupled with generator to produce the electrical power [1]. Gas turbine consists of three main components, they are compressor that is used to compress the combustion air, the combustor where combustion process occurs and the turbine where in the work is produced. Researches on gas turbine have been widely performed. The aims are for combustion efficiency and turbine blade temperature enhancement, combustion stabilization on lean mixture enhancement that can save the fuel. The design method of direct experimental needs high cost and time consuming. Therefore, many researches are performed with Computational Fluid Dynamics (CFD) simulation [2]. There are many methods in simulation using CFD. They are Direct Numerical Simulation (DNS), Reynolds or Favre Averaging of the Navier-Stokes Equations (RANS) and Large Eddy Simulations (LES) .The DNS and LES are able to give a better prediction in unsteady flow behaviour and give more detail results than RANS method [3]. LES method is often used in many previous researches because LES 1 [email protected] 2 [email protected], [email protected]
-
Upload
khangminh22 -
Category
Documents
-
view
0 -
download
0
Transcript of International Journal of Mechanical Engineering ISSN : 2277 ...

International Journal of Mechanical Engineering
ISSN : 2277-7059 Volume 2 Issue 2 http://www.ijmejournal.com/ https://sites.google.com/site/journalijme/
85
ANALYSIS OF THE EFFECT OF CHANGES IN FUEL
INJECTOR POSITION ON GAS TURBINE
COMBUSTION EFFICIENCY USING LARGE EDDY
SIMULATION (LES)
Shandy Kharisma Irianto1, Gunawan Nugroho
2
Department of Engineering Physics, Institut Teknologi Sepuluh Nopember Surabaya Indonesia 60111
Abstract. Researches on gas turbine have been widely performed, especially on combustion chamber with a non-premixed combustion process. In this work, the research ofthe combustion
chamber has been performed using the LES method. The aim of this study is to analyze the
combustion process with various fuel injector angles and fuel rate. The analyzed aspects are flow pattern, temperature distribution and species concentration on stoichiometry condition. The mixing process between fuel and air at the combustion zone is affected by the increase in injector angle which, 33.55
o (model 1) being the optimum injector angle to obtain the highest
efficiency of 84.6%. It is noted that model 2 (injector 45o) has the lowest emission containing
waste gases of CH4 and CO, i.e. 0.75 and 0.089 times lower than those of model 1,
respectively. However, the combustion efficiency of model 2 is lower than model 1, i.e. 82.7%.
Keywords: Gas turbine combustor, Large Eddy Simulation (LES), Stoichiometry, Computational Fluid Dynamics.
1. INTRODUCTION
Gas turbine is a machine which is often encountered in aircraft and large scale power generation industry. On the aircraft, gas turbine is used as a main driving machine
while on the power generation industry, gas turbine is used to drive turbine that been coupled with generator to produce the electrical power [1]. Gas turbine consists of three main components, they are compressor that is used to compress the combustion air, the combustor where combustion process occurs and the turbine where in the work is produced.
Researches on gas turbine have been widely performed. The aims are for
combustion efficiency and turbine blade temperature enhancement, combustion stabilization on lean mixture enhancement that can save the fuel. The design method of direct experimental needs high cost and time consuming. Therefore, many researches are performed with Computational Fluid Dynamics (CFD) simulation [2].
There are many methods in simulation using CFD. They are Direct Numerical Simulation (DNS), Reynolds or Favre Averaging of the Navier-Stokes Equations
(RANS) and Large Eddy Simulations (LES).The DNS and LES are able to give a better prediction in unsteady flow behaviour and give more detail results than RANS method [3]. LES method is often used in many previous researches because LES

International Journal of Mechanical Engineering
ISSN : 2277-7059 Volume 2 Issue 2 http://www.ijmejournal.com/ https://sites.google.com/site/journalijme/
86
captures three dimensional and transient natures of turbulent flows [4]. The research about combustor used LES and RANS method was performed by G. Boulder [5]. The research was for comparing the RANS and LES method. Their simulation results showed that LES method gave more accurate results againts the experiment than the RANS method. LES could give higher temperature on reaction zone with a sharper pattern [5].
In the combustion process, LES method gives much simplicity to engineers to analyze the combustion process. This method is used widely because take lower cost and shorter time than DNS [2]. In industrial application problem, LES is a reliable and accurate numerical method, appropriate for configuration and complex data validations. Achieving those results, LES must be completed with a good sub grid scale model [6].
In the combustion process, the mixing process between fuel and air has strong effect to combustion process completeness, which is proved by Yehia A. Eldrainyet et al [7]. Analysis was carried out for swirler with a wide aperture that can be adjusted to obtain the desired intensity values.The research had successfully created a swirler design hat can be increase the efficiency of gas turbine combustion on a specific work load. From these studies, it was obtained that the mass flow rate and air flow profile is
very influential in the combustion process. In addition to giving the effect of rotation on the air, the combustion process is also influenced by the position of the air injector and materials. There are two types of parallel and oblique positions dealing with forming a wide angle. The results for the position of the fuel and air are equal then the stoichiometric mixture of mass fraction in the primary are a (primary zone) is located in a more narrow area and very close to
the injector fuel injector position than the latter [4].
2. THEORETICAL FRAMEWORK
2.1 Gas Turbine
Gas turbine consists of three components which are shown in figure1. Air flow into the compressor through the compressor input channel. Compressor will change the
low pressure air become high pressure air, which then increase the outlet temperature. High pressure air enters the combustion chamber through the holes that have been designed to produce perfect combustion in the combustion chamber, but before entering the combustion chamber, the air passes the diffuser to reduce the air speed.
In the combustion chamber, the air mixes with fuel and burned inconstant pressure (isobaric). Hot gas from combustor flow into turbine through a transition
piece lead the exhaust gas to the turbine blades before the gas drives the turbines [9].

International Journal of Mechanical Engineering
ISSN : 2277-7059 Volume 2 Issue 2 http://www.ijmejournal.com/ https://sites.google.com/site/journalijme/
87
Fig. 1. MW 701 D Gas turbine system [8].
Combustion chamber is where the combustion process occurs. Each section in
the combustion chamber has an influence on the combustion process. In Figure 2 are the parts of gas turbine combustion chamber.
Fig. 2. Combustion chamber parts [9]
Combustion chamber consists of the outer tube (air casing) and the liner, Air
casing (air shell) is the outer part of the combustion chamber which has a simple form generally. The aim of air shell is to protect the material from the high temperature gas
in combustion chamber. Diffuser is useful to reduce the air velocity came from the compressor before it enters the combustion chamber.
Snout is an extension of the air swirler. The snout function is to divide the air that will enter the primary zone, secondary zone and dillution zone. Swirler is part of the combustion chamber to create turbulence in the primary zone to produce the perfect mixing process. Fuel injector is part of the combustion chamber which is
responsible as a supplier of fuel into the combustion zone. Igniter, in application of gas turbine, igniter sparkplug is usually similar with the spark plug on a motorcycle.
Compressor Combustor Turbine

International Journal of Mechanical Engineering
ISSN : 2277-7059 Volume 2 Issue 2 http://www.ijmejournal.com/ https://sites.google.com/site/journalijme/
88
(a) (b)
Fig. 3. Gas turbine MW 701 D combustor sections (a) Combustor basket, (b) Transition piece.
The above picture is the combustion chamber with 701MWD series. The gas
turbine has the output temperature of 1150oC, developed by Mitsubishi Heavy
Industries[8]. Combustion chamber is generally composed of two parts, they are combustor basket and transition piece.
2.2 Combustion Stoichiometry
Stoichiometric quantity is the ratio between the amounts of the air (oxidizer) is required with a number of fuels. If the ratio between fuel and oxidizer larger than stoichiometry condition, the combustion process will be occurred in lean condition, while if the amount of air supplied is less or do not achieve stoichiometry condition, the combustion process will be occurs in rich condition. Ratio between the oxidizer
and fuel are determined by writing a simple atomic equilibrium, assuming that the fuel reacts to form a product. For hydro carbon fuels with CxHy structure, the stoichiometric relationship can be expressed as [8],
CxHy + a(O2 + 3,76N2) xCO2 + (y/2)H2O + 3,76aN2 (1)
where a = x + y/4 (2)
For simplicity, we assume that the composition of air is made up of 21% oxygen (O2), 79% Nitrogen (N2) so for every mole of oxygen contained 3.76 moles of nitrogen.
The equivalence ratio for fuel-air is given by [8].
A/F)stoic = (
)
(3)
MWair and MWfuel are the molecular weight of air and fuel. In general, the mixture ratio between fuel-air can be expressed in ratio equivalent (Φ)
Φ = ( ⁄ )
⁄
( ⁄ )
( ⁄ )
(4)

International Journal of Mechanical Engineering
ISSN : 2277-7059 Volume 2 Issue 2 http://www.ijmejournal.com/ https://sites.google.com/site/journalijme/
89
From the above definition, itis obtained that for fuel excess (rich) then Φ> 1, for excess air (lean), Φ<1. For the equilibrium value of Φ= 1[8].
2.3 Combustion Efficiency
Low combustion efficiency shows that the fuel is not burnt completely. The
uncompleted combustion is manifested by white smoke emissions containing unburned hydrocarbons which are derived from fuel and carbon monoxide. To avoid that condition, the efficiency of combustion must be above 96% [11].
The main function of the combustion process is to increase the temperature of the air flow by burning the fuel. There are several factors that can affect the combustion efficiency, air pressure, temperature, mass flow rate and dimensions of
the combustion chamber. Combustion efficiency can be defined as [11].
) (5)
where
so ) (6)
2.4 Large Eddy Simulation
Large eddy simulation is one of turbulence models which is also related on the Kolmogorov theory [3]. The theory makes an assumption that the large eddies flows depend on the geometry of the flow, while for the smaller eddies are similar and have common properties. Therefore, LES is only able to compute the large eddies
explicitly, which the smaller eddies will be modeled. In LES, large-scale movement patterns of flow is calculated by using the same method with DNS, while the effect of general scale that smaller (subgrid scale) will be modeled using a subgrid scale model (SGS).
There are some differences between modeling using LES and RANS. In RANS, modeling is done based on time or a series of basic equations that are
averaged. Thus, it causes RANS is not able to capture the unsteady flow and changes
of the small scale accurately. The average of the fluctuating value is zero, i.e. . In LES, the basic equation filtered separately is not the result of the time averaged. The flow structure that larger than the width of the filter will be calculated explicitly, while for the effect of scale that cannot be solved will be modeled using a SGS model. It can be concluded that most of the energy is in the larger vortex. Smaller vortices
have more typical properties and less important and should be easier in the modeling.
The value of small-scale component is no longer zero, i.e. . In practice, LES is able to predict the vertical structure of the complex unsteady flow field significantly [3].

International Journal of Mechanical Engineering
ISSN : 2277-7059 Volume 2 Issue 2 http://www.ijmejournal.com/ https://sites.google.com/site/journalijme/
90
3. SIMULATION VARIABLES
Simulations are performed using the Personal Computer with specification 3.4GHz 8-
cores CPU with 16 GB of memory. Verification data is when the turbine speed is 2994 rpm. There are two variations of the position angle of 45
o injector (model 2), 60
o
(model 3) and 33.55° (model 1) is the normal angle that is mounted on the gas turbine. Angle variation is expected able to improve the mixing process between the fuels with the combustion air. The fuel consist of three main species, they are methane (CH4) of 87.12%, ethane (C2H6) of 5.98% and propane (C3H8) of 3.26%.
The simulations are performed by assuming that the combustion is occurred in the primary region in the stoichiometry condition Φ= 1, the rate of fuel mass flow rate is 0.264 kg/s. After identifying the fuel mass flow rate, the stoichiometry calculations are conducted with according to equation (4). The obtained values of the air mass flow rate is 4.3 kg/s. The swirler air mass flow rate and head holes air percentage are 15% and 5%, while for the air percentage that pass through the primary holes and
corrugated holes is obtained by comparing the area which the combustion air coming through.
It is obtained that the air swirler mass flow rate is 0.645 kg/s, the head holes is 0.215 kg/s, primary holes is2.02 kg/s and corrugated hole of 1.41kg/s. While for the air mass flow rate which through the secondary holes and dilution holes are obtained by using same method i.e. 0.866 kg/s and 1.58 kg/s. Thus, the analysis of velocity
contours, temperature distribution patterns and the mass fraction of pollutant gases (CO) are conducted. The variation of the fuel mass flow rate is done by changing the equivalent ratio from 1 to 0.7, 0.8 and 0.9 or at 0.0154 kg/s, 0.0178 kg/s and 0.02 kg/s. In this simulation, it is necessary to change the value of convergence limit (Under relaxation factor).
Fig. 4. Boundary conditions
No Nama Tipe
(kg/s)
To
(K)
P
(kPag)
1 in_bbg Mass flow
inlet
0.022 300 1850
2 in_wirler Mass flow
inlet
0.03225 581 710
3 in_head Mass flow
inlet
0.215 581 710
4 in_primary Mass flow
inlet
0.33 581 710
5 in_secondary Mass flow
inlet
0.144 581 710
6 in_dilution Mass flow
inlet
0.263 581 710
7 in_corugated Mass flow
inlet
0.71 581 710
8 ignitor Wall - 1000 -
9 wall Wall - 300 -
10 out Pressure
outlet
- - 0

International Journal of Mechanical Engineering
ISSN : 2277-7059 Volume 2 Issue 2 http://www.ijmejournal.com/ https://sites.google.com/site/journalijme/
91
This value is useful for determining the magnitude relationship between the next grids. Under relaxation factor is very influential on the iteration process and even specify the length of convergence. In the present research, the value of relaxation factor is the default value. Calculations are performed on the time step size of 0.001s with the number of time steps is 10. The maximum value is 500 iterations per times step.
Field data are used in the simulation is the output of combustion chamber of the temperature 1199.7 K.The results are obtained from the simulation is 1109.31 K, which is very close with 7.5% difference.
4. RESULT AND DISCUSSION
4.1 Flow, Temperature and Emission
The iso thermal flow pattern is shown to investigate the flow configuration that occurs in every model of the combustion chamber. The predicted flow patterns are very useful in analyzing how the process of mixing fuel with air that occurs particularly in the combustion zone (primary and secondary) to be expressed qualitatively.
Fig. 5. Longitude Velocity Profile (a) model 1, (b) model 2, (c) model 3
It can be seen in figure 5 that the configurations of gas flow rate which are
marked with blue stripes. It is identified that all three models have significant differences. Basically the process of mixing between fuel and air is most common in the primary zone. Therefore, the primary zone is what will be the main focus in the analysis.
Flow configuration differences are the vortices and the extent of local mixing. The more extensive vortices mixing area shows the mixing process that occurs. In the
case of the collision between the gaseous fuels with air head, model 1 has a regional
(a) (b)
(c)
International Journal of Mechanical Engineering
ISSN : 2277-7059 Volume 2 Issue 2 http://www.ijmejournal.com/ https://sites.google.com/site/journalijme/
92
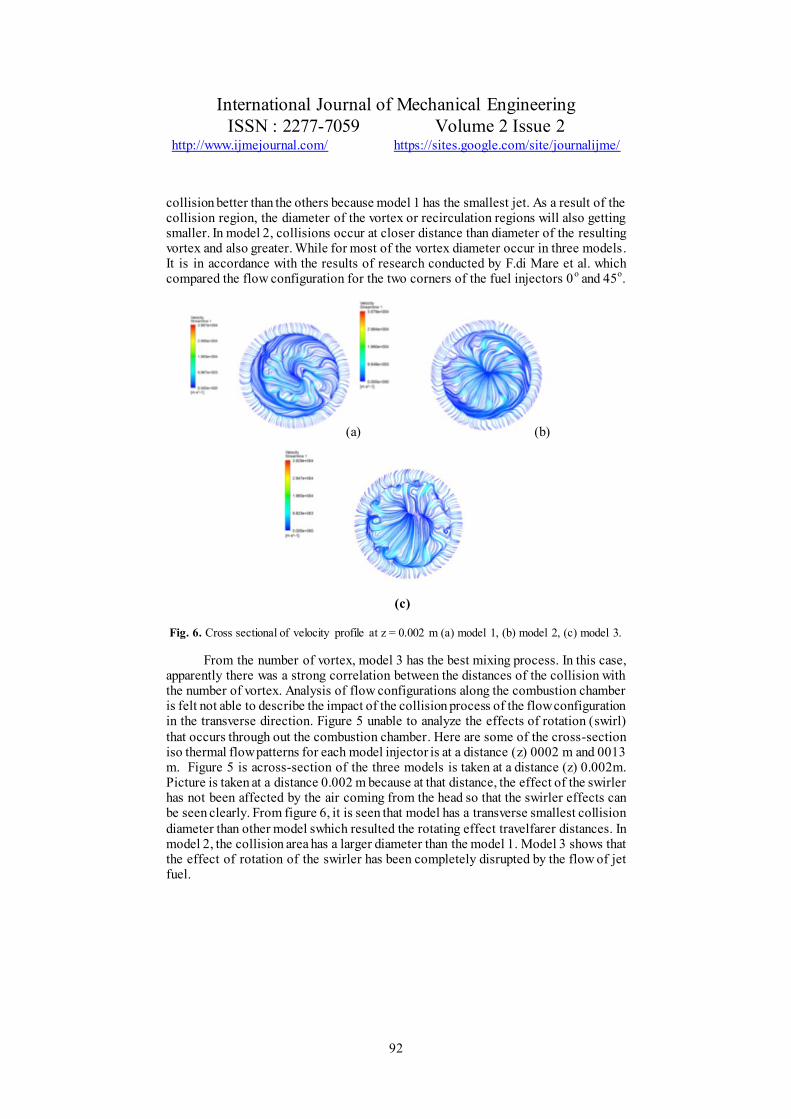
collision better than the others because model 1 has the smallest jet. As a result of the collision region, the diameter of the vortex or recirculation regions will also getting smaller. In model 2, collisions occur at closer distance than diameter of the resulting vortex and also greater. While for most of the vortex diameter occur in three models. It is in accordance with the results of research conducted by F.di Mare et al. which compared the flow configuration for the two corners of the fuel injectors 0
o and 45
o.
(a) (b)
(c)
Fig. 6. Cross sectional of velocity profile at z = 0.002 m (a) model 1, (b) model 2, (c) model 3.
From the number of vortex, model 3 has the best mixing process. In this case, apparently there was a strong correlation between the distances of the collision with the number of vortex. Analysis of flow configurations along the combustion chamber is felt not able to describe the impact of the collision process of the flow configuration in the transverse direction. Figure 5 unable to analyze the effects of rotation (swirl)
that occurs through out the combustion chamber. Here are some of the cross-section iso thermal flow patterns for each model injector is at a distance (z) 0002 m and 0013 m. Figure 5 is across-section of the three models is taken at a distance (z) 0.002m. Picture is taken at a distance 0.002 m because at that distance, the effect of the swirler has not been affected by the air coming from the head so that the swirler effects can be seen clearly. From figure 6, it is seen that model has a transverse smallest collision
diameter than other model swhich resulted the rotating effect travelfarer distances. In model 2, the collision area has a larger diameter than the model 1. Model 3 shows that the effect of rotation of the swirler has been completely disrupted by the flow of jet fuel.

International Journal of Mechanical Engineering
ISSN : 2277-7059 Volume 2 Issue 2 http://www.ijmejournal.com/ https://sites.google.com/site/journalijme/
93
Time 0.002 s Time 0.006 s
Time 0.004 s Time 0.008 s
Time 0.01 s
Fig. 7. Temperature contour of model 1
The temperature as a result of the combustion process variables described in the order function of time from 0001 s to 0.01s is shown in Figure 7. From the above sequence of images,it can be seen that the combustion chamber temperature patterns are always changing in time (unsteady).
(a)
(b)
Fig. 8. Temperature contour (a) model 2, (b) model 3

International Journal of Mechanical Engineering
ISSN : 2277-7059 Volume 2 Issue 2 http://www.ijmejournal.com/ https://sites.google.com/site/journalijme/
94
The pattern of temperature distribution in model 2 and model 3 can be seen in Figure 8. The major point of the fuel injectors will affect the volume of gas mixtures are represented by the temperature. The greater angle the injector will make volume of gas mixture that is formed is also greater and vice versa. With the amount of larger gas mixture, it also can be ascertained more perfect combustion. From three models that have been studied, it can be said that the third model is capable to generate best
mixing process, especially in the combustion zone.
Fig. 9.Cross sectional temperature contour in the combustor (a) model 1, (b) model 2, (c) model 3.
To determine the overall temperature pattern in the combustion chamber there are cross-sections of the combustion chamber as shown in Figure 9. There are seven cross sections respectively at distance (z) 0002 m, 0.01 m, 0:02 m, 0:03 m, 0:04 m, 0.05 m, 0:06 m. Shown in the third picture, each model has the same temperature
pattern that is spread to each side of the combustion chamber, but there are differences in relation to the location of the combustion process as indicated by differences in location and volume of hot air generated.
(a) (b)
(c)

International Journal of Mechanical Engineering
ISSN : 2277-7059 Volume 2 Issue 2 http://www.ijmejournal.com/ https://sites.google.com/site/journalijme/
95
(a) (b)
(c)
Fig. 10 .Temperature isosurface 2200 K (a) model 1, (b) model 2, (c) model 3
In model 1the optimal combustion process occurs in the secondary area. This
indicates that the process of mixing between the fuels with air in the primary area is not satisfaction. For model 2, the most optimum mixing process occurs in the mid-section between the primary and secondary areas, while for model 3 the mixing process is closer to the head area of the combustion chamber that is precisely on the primary zone. For more details can be seen in Figure 10.
From isosurface contour (Figure 10), it can be viewed as the three-
dimensional contour of the temperature pattern. It is seen that the high temperature gas is only found along the side of the combustion chamber and not be found in the middle or near the wall of the combustion chamber. In model 1, the contours of temperature with the temperature reaching 2200K marked with orange color has a distribution area that is located farther away from the head of the combustion chamber when compared with model 2 and model 3.
Fig. 11. Trend of temperature
0 0.01 0.02 0.03 0.04 0.05 0.061000
1100
1200
1300
1400
1500
1600
1700
1800
Distance, z (m)
Te
mp
era
ture
(K
)
model 1
model 2
model 3

International Journal of Mechanical Engineering
ISSN : 2277-7059 Volume 2 Issue 2 http://www.ijmejournal.com/ https://sites.google.com/site/journalijme/
96
The green line (model 3) has the highest average temperature until the distance (z) is 0.028m at combustion zone. Furthermore, the graph for each model will decrease in coinciding position as the impact of cooling air from the cooling holes. The higher trend of temperature average distribution pattern on the graph indicates that model 3 has the best mixing process. However, that condition does not equal with the output temperature.
(a) (b)
(c)
Fig. 12. CO mass fraction distribution (a) Model 1, (b) model 2, (c) model 3.
Combustion can occur with perfect and imperfect. Complete combustion will produce carbon dioxide (CO2) and water vapor (H2O), while the combustion that occurs imperfectly will also produce carbon monoxide (CO). Therefore, CO is used as the basis of analysis of combustion imperfections. In non-premixed combustion,
combustion perfection depends on the mixing process between fuel and air. It is shown in Figure 12, model 1 has the largest number of mass fractions with the distribution that is narrower than other models. In model 2, the amount of CO mass fraction seems less but with the wide distribution area. The best mixing process occurs in model 3.
International Journal of Mechanical Engineering
ISSN : 2277-7059 Volume 2 Issue 2 http://www.ijmejournal.com/ https://sites.google.com/site/journalijme/
97
(a) (b)
(c)
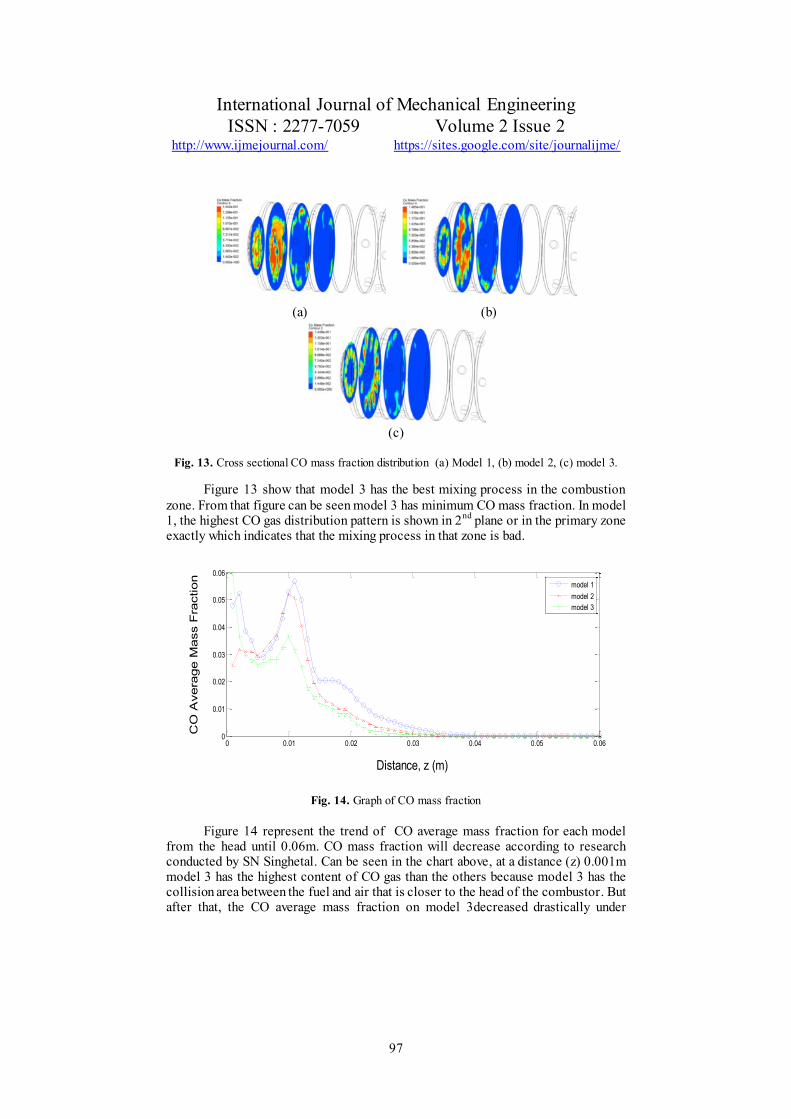
Fig. 13. Cross sectional CO mass fraction distribution (a) Model 1, (b) model 2, (c) model 3.
Figure 13 show that model 3 has the best mixing process in the combustion
zone. From that figure can be seen model 3 has minimum CO mass fraction. In model 1, the highest CO gas distribution pattern is shown in 2
nd plane or in the primary zone
exactly which indicates that the mixing process in that zone is bad.
Fig. 14. Graph of CO mass fraction
Figure 14 represent the trend of CO average mass fraction for each model from the head until 0.06m. CO mass fraction will decrease according to research conducted by SN Singhetal. Can be seen in the chart above, at a distance (z) 0.001m model 3 has the highest content of CO gas than the others because model 3 has the collision area between the fuel and air that is closer to the head of the combustor. But after that, the CO average mass fraction on model 3decreased drastically under
0 0.01 0.02 0.03 0.04 0.05 0.060
0.01
0.02
0.03
0.04
0.05
0.06
Distance, z (m)
CO
Avera
ge M
ass F
raction
model 1
model 2
model 3

International Journal of Mechanical Engineering
ISSN : 2277-7059 Volume 2 Issue 2 http://www.ijmejournal.com/ https://sites.google.com/site/journalijme/
98
models 1 and 2. This suggests that the mixing process that occurs in model 3 is better than model 1 and model 2.
Fig. 15. Graph of CH4mass fraction
Figure 15 is a representation of the CH4 mass fraction in the combustion
chamber. From the graph above can be explained that there is a very strong relationship between the amounts of CH4 with the amount of CO gas generated. Can be seen in Figure 15, CH4 average mass fraction has the highest value at the distance (z) 0.001m.
Fig. 16. Graph ofCO2mass fraction
Figure 16 is representation of CO2 average mass fraction in the gas turbine.
Figure 16 has same trend graph with figure 11. This represents that there is proportional relationship between the mixing process and combustion temperature. It will also affect in CO2 level is produced whose value is inversely l to the levels of CO gas.
0 0.01 0.02 0.03 0.04 0.05 0.060
0.01
0.02
0.03
0.04
0.05
0.06
Distance, z (m)
CH
4 A
vera
ge M
ass F
raction
model 1
model 2
model 3
0 0.01 0.02 0.03 0.04 0.05 0.060.02
0.03
0.04
0.05
0.06
0.07
0.08
Distance, z (m)
CO
2 A
vera
ge M
ass F
raction
model 1
model 2
model 3

International Journal of Mechanical Engineering
ISSN : 2277-7059 Volume 2 Issue 2 http://www.ijmejournal.com/ https://sites.google.com/site/journalijme/
99
Model 3 has more waste gases CH4 and CO than the model 2. There are any kinds of factors which cause that conditions can occur. A change in the corner of the injector seems to be very influential on the flow configuration, in particular the effect of swirler which plays an important role in generating the flow tangential that can occur with optimum mixing. It appears that the effect was most evident around the model 1. This is because model 1 has the smallest angle jet which causes the swirler
effects stemming from the swirler, not completely absorbed. While model 2 and model 3 have greater relative loss of swirler effect than model 1 that causes the magnitude of the mass fraction of CH4 is wasted on the output side of the model 3 has the greatest value. At first, indeed model 3 was the model which has the best mixing process, but the mixing quality will be decreased when further away from the head of the combustion chamber. Meanwhile, the cause of model 2 and model 3 has
lower temperature than model 1 is imperfect fuel mixing process in the primary zone. The imperfect mixing process in the combustion zone causes there is some fuel which escapes into the cooling zone and the amount of fuel exceeds the lower limit of flame (lean flammability). From figure 6 and 7, can be seen, precisely in the cooling zone of the combustion process in model 1 is still occurs caused temperature was higher than the others.
4.2 Fuel Mass Flow Rate Variation
Variations in the fuel mass flow rate are done by changing the ratio ranging from 0.7, 0.8 ,0.9 and 1. The results of the fuel mass flow rate variation are displayed in trend of temperature, CH4 mass fraction average, CO mass fraction average and the
combustion chamber efficiency.
Fig. 17. Graph of outlet temperature
From figure 17 above can be seen that the output of the combustion chamber temperature will increase with increasing in the rate of fuel mass. Model 1 always has higher outlet temperature than the others. Where as in model 3, has a value of the output temperature is almost the same as model 2 for the equivalent ratio of 0.7, 0.8, and 0.9 but not for stoichiometric conditions.
0.65 0.7 0.75 0.8 0.85 0.9 0.95 1940
960
980
1000
1020
1040
1060
1080
1100
1120
Equivalent Ratio
Tem
pera
ture
(K
)
model 1
model 2
model 3

International Journal of Mechanical Engineering
ISSN : 2277-7059 Volume 2 Issue 2 http://www.ijmejournal.com/ https://sites.google.com/site/journalijme/
100
Fig. 18. Graph of CH4 mass fraction
Figure 18 is the value of CH4 mass fractions at the output of the combustion
chamber for the three models. Looks at the equivalent ratio of 0.7 and 0.8, model 3
has the smallest amount of wasted CH4. This suggests that model 3 is only able to provide good combustion process during the lean combustion occurs. As for model 2, was originally to have wasted the amount of CH4 gas is greater than model 3 but when the equivalent ratio close to 1, the amount of wasted CH4 gas has a value which is smaller than other models. It seems also true for the amount of CO gas is wasted that is illustrated in Figure 19.
Fig. 19. Graph of CO mass fraction
In Figure 19 it appears that the amount of CO mass fraction at the outlet for
the three models decreased with increasing equivalent ratio in the combustion process. However, little difference is obtained when the equivalent ratio close to 1. In
this case, model 2 has the smallest wasted CO gas.
0.65 0.7 0.75 0.8 0.85 0.9 0.95 10.2
0.4
0.6
0.8
1
1.2
1.4
1.6
1.8x 10
-9
Equivalent Ratio
CH
4 A
vera
ge M
ass F
raction
model 1
model 2
model 3
0.65 0.7 0.75 0.8 0.85 0.9 0.95 10.2
0.4
0.6
0.8
1
1.2
1.4
1.6
1.8
2x 10
-6
Equivalent Ratio
CO
Avera
ge M
ass F
raction
model 1
model 2
model 3

International Journal of Mechanical Engineering
ISSN : 2277-7059 Volume 2 Issue 2 http://www.ijmejournal.com/ https://sites.google.com/site/journalijme/
101
4.3 Combustion efficiency
Efficiency is a quantity that is useful to express the performance of a system. This efficiency value is obtained by comparing the amount of heat energy produced from burning and the amount of heat energy that is inserted into the combustion chamber of the fuel obtained according to (equation 5). The amount of efficiency is affected by
temperature, the amount of mass fraction of each species in the flue gas, and the rate of fuel.
Fig. 20. Graph of combustion efficiency
Shown in Figure 20 the value of the efficiency will decreased with increasing
the value of equivalent ratios. Decrease in efficiency is due to the increasing number of regions rich mixture fuel in the combustion chamber which causes the combustion process imperfect.
Can be seen from Figure 20 the temperature distribution patterns for each value of equivalent ratios. The increasing in equivalent ratio will make combustion region increase too that causes the output temperature of the combustion chamber will also increase the impact on increasing enthalpy of combustion gases. Combustion area also resulted in an increasingly broad CO gas which was originally formed by the combustion of fuel-rich mixture of experience and the oxidation process to form CO2.
0.65 0.7 0.75 0.8 0.85 0.9 0.95 182
84
86
88
90
92
94
96
98
Equivalent Ratio
Com
bustion E
ffic
iency
model 1
model 2
model 3

International Journal of Mechanical Engineering
ISSN : 2277-7059 Volume 2 Issue 2 http://www.ijmejournal.com/ https://sites.google.com/site/journalijme/
102
(a)
(b)
Fig. 21. Graph of (a) N2 mass fraction, (b) O2 mass fraction
Figure 21indicate the cause of the decrease inefficiency at the time of the
addition of flow rate (Figure 4.18). The cause is NO2 gas formation from the reaction between N2 and O2 are. Shown in the picture above there are four lines that represent
each of the combustion conditions in model 1. The O2 and N2 will decrease when the equivalent ratio increase. NO2 forming reaction is endothermic which absorbs energy from the combustion gases which cause the value of the enthalpy of combustion products has declined.
5. CONCLUSION
The gas turbine combuster has been investigated by using LES in this reserach. It is obtained that the larger point of the fuel injector will produce an efficient process of
mixing in the combustion zone, but it has not be enable to ensure that the combustion
0 0.01 0.02 0.03 0.04 0.05 0.060.7
0.71
0.72
0.73
0.74
0.75
0.76
Distance, z (m)
N2 A
vera
ge M
ass F
raction
f/f stoic = 0.7
f/f stoic = 0.8
f/f stoic = 0.9
f/f stoic = 1
0 0.01 0.02 0.03 0.04 0.05 0.060.08
0.1
0.12
0.14
0.16
0.18
0.2
Distance, z (m)
O2 A
vera
ge M
ass F
raction
f/f stoic = 0.7
f/f stoic = 0.8
f/f stoic = 0.9
f/f stoic = 1

International Journal of Mechanical Engineering
ISSN : 2277-7059 Volume 2 Issue 2 http://www.ijmejournal.com/ https://sites.google.com/site/journalijme/
103
process, namely producing the higher output temperatures of the combustion chamber. Moreover, the highest combustion efficiency at stoichiometric conditions with a value of 84.6% is owned by the injector with the angles 33.55
o, but for the
lowest emissions in waste gas content of CH4 and CO respectively at 0.75 and 0.089 times that of model 1 being owned by the injector with 45
o angle with an efficiency of
82.7%..
REFERENCES
1. Levabre, Arthur H. “Gas Turbin Combustion” McGraw Hill 1983 . 2. Yan Ying-Wen, Zhao Jian-Xing, Zhang Jing-Zhou, Liu Yong. ”Large Eddy
Simulation of two-phase spray combustion for gas turbine combustor” Applied Thermal Engineering 28(2007). hal 1365-1374.
3. Jiang, Xi. Hong lai, Choi.“Numerical Techniques for Direct and Large-Eddy Simulation” Chapman & Hall/CRC.2009.
4. F. di Mare, W.P Jones, and K.R. Menzies ”Large Eddy Simulations of a model gas turbin combustor”, Combustion and Flame 137(2004). hal 278-294.
5. G. Boudier, L.Y.M. Gicquel, T. Poinsot, D. Bissie`res, C. Be´rat. “ Comparison of LES, RANS and experiments in an aeronautical gas turbine combustion chamber” Proceedings of the Combustion Institute 31 (2007) 3075–3082.
6. ParvizMoin. “Advances in large eddy simulation methodology for complec
flows” International Journal of Heat and Fluid Flow 23 (2002) 710–720. 7. Yehia A. Eldrainy, Khalid M. Saqr, Hossam S. Aly, Mohammad Nazri Mohd
Jaafar. “CFD insight of the flow dynamics in a novel swirler for gas turbine combustors ”. International Communications in Heat and Mass Transfer 36 (2009) 936–941.
8. Susumu Takahashi, Masahiko Mori, KeizoTsukagoshi, Junichiro Masada,
TakahamaMasayuki.”Development and On-site Test Operation of the MW-701 DA Advanced Gas Turbine”. Mitshubishi Heavy Industries, Ltd Technical Review Vol.31 No.3 (Oct.1994)
9. Turns, Stephen R.”AnIntroduction to Combustion” second edition, McGraw Hill. 2000.
10. Fawzy El-Mahallawy, Saad El-Din Habik. “Fundamentals and Technology of
Combustion” Elsevier 2002. 11. Arthur H. Levabre, Dilip R. Ballal.”Gas Turbine Combustion Alternatif Fuel and
Emission”.third edition. CLC press. 2010.

International Journal of Mechanical Engineering
ISSN : 2277-7059 Volume 2 Issue 2 http://www.ijmejournal.com/ https://sites.google.com/site/journalijme/
104