International diversification and industry-related labor income risk
36
International diversification and industryrelated labor income risk Carolina Fugazza Maela Giofré Giovanna Nicodano No. 192 December 2010 www.carloalberto.org/working_papers © 2010 by Carolina Fugazza, Maela Giofré and Giovanna Nicodano. Any opinions expressed here are those of the authors and not those of the Collegio Carlo Alberto.
-
Upload
carloalberto -
Category
Documents
-
view
1 -
download
0
Transcript of International diversification and industry-related labor income risk
International diversification and industryrelatedlabor income risk
Carolina FugazzaMaela GiofréGiovanna Nicodano
No. 192
December 2010
www.carloalberto.org/working_papers
© 2010 by Carolina Fugazza, Maela Giofré and Giovanna Nicodano. Any opinions expressed here arethose of the authors and not those of the Collegio Carlo Alberto.

International diversi�cation and industry-related labor income risk�
Carolina Fugazzay, Maela Giofréz and Giovanna Nicodanox
December 17, 2010
Abstract
Do equity markets help diversifying away industry-related labor income risk? This paper reconsidersthe hedging role of stock markets by focusing on international equity diversi�cation, rather than domesticasset allocation, and on industry wage, rather than individual labor income. We test for di¤erences inimplied equilibrium equity portfolios across investors belonging to di¤erent industry-country pairs. Wecompare these industry-based portfolio holdings to the one that is optimal for an investor endowed withthe average home-country labor income. Our results resurrect the role of equities in hedging wage risk byuncovering remarkable heterogeneity across industries within each investing country. Our analysis alsodelivers insights concerning the role of occupational pension funds in designing optimal portfolios for theirmembers.
JEL: E44, G11, G15Keywords: optimal portfolio choice, international diversi�cation, labor income risk, industry-speci�c human capital,occupational pension funds
�We thank Fabio Bagliano, Joao Cocco, Ian Cooper, Frank De Jong, Bernard Dumas, Esther Eiling, Elsa Fornero, MassimoGuidolin, Urban Jermann, Roel Mehlkopf, Louis Viceira and participants at Royal Economic Society 2009 Conference, EFA 2008Meetings, ICPM - Rotman and Netspar Workshops, CIEF Meeting and Collegio Carlo Alberto seminar for helpful discussion andcomments. We are especially grateful to the late Onorato Castellino for his insights and encouragement. Financial support fromRotman International Centre for Pension Management (University of Toronto), Netspar and the Italian Ministry of Universityand Research is gratefully aknowledged. Any errors or omissions are responsibility of the authors.yUniversità di Torino and Center for Research of Pensions and Welfare Policies (CeRP)-Collegio Carlo Alberto (CCA);
[email protected]; Tel. +39 011 6705048zUniversità di Torino and CeRP-CCA; [email protected]; Tel. +390116705052xUniversità di Torino, CeRP-CCA and Netspar; [email protected]; Tel. +39 011 6705006.
1

1 Introduction
Optimal portfolios ought to hedge labor income risk (Merton, 1971; Mayers, 1972). Such risk might a priori
dictate considerable variation in equity portfolios across workers, since they face heterogeneous wage shocks in
diverse industries. However, the correlation between domestic equity returns and occupation-related shocks
to household income is usually close to zero (Campbell et al., 2001; Davis and Willen, 2000). This evidence
casts doubts on the potential contribution of equity markets in diversifying away labor income risk.
Our paper reconsiders the hedging role of stock markets by shifting the attention to international equity
diversi�cation, rather than domestic asset allocation, and to industry wage, rather than individual labor
income. The bene�ts from international diversi�cation of equity portfolios have indeed been documented
long ago (Grubel, 1968; Levy and Sarnat, 1970) and persist despite increased stock market integration and
systemic crises (Das and Uppal, 2004; De Santis and Gerard, 1997). Our second focus �the one on industry
risk within each country �derives from the magnitude and stability of interindustry wage di¤erentials in the
US (Dickens and Katz, 1987; Krueger and Summers, 1987, 1988; Katz and Summers, 1989; Weinberg, 2001),
which points to the importance of the industry factor in the labor income process. International comparisons
con�rm this pattern in many OECD countries (Gittleman and Wol¤, 1993; Kahn 1998). Moreover, wages
may be acyclical at industry level, while they tend to be cyclical at the country level (Barsky and Solon,
1989). Thus considering the correlations between industry wages � as opposed to aggregate wages � and
international stock returns is likely to imply very di¤erent portfolio strategies.
Against this background, this paper measures the di¤erences in equity portfolios across investors belonging
to di¤erent industry-country pairs in 1998-2004. In particular, we compute implied equilibrium holdings in
the stock indices of ten destination countries held by US, Canadian and Italian investors working in seven
di¤erent industries, from Financials to Manufacturing. We compare these industry based portfolios to the
national restricted portfolio, i.e. the one that would be optimal for an investor endowed with the average
home-country labor income. Should they turn out to be equal, then there would be no scope for hedging
industry-speci�c risk through international equity markets - in line with previous evidence on individual wage
pro�les and domestic equity investments.
Our results resurrect the role of equities in hedging wage risk by uncovering remarkable heterogeneity
across industries within each investing country, consistent with the literature on inter-industry wage di¤er-
entials. A �rst indicator is the dispersion in implied equilibrium portfolios for workers belonging to di¤erent
industries within a country. For instance, portfolio shares in UK equities range, depending on the industry,
from -0.15 to 0.16 for US workers, from -0.04 to 0.29 for Canadians and from -0.19 to 0.30 for Italians. A
second indicator is the distance between equilibrium weights for a worker in a given industry and the rep-
2

resentative national worker. These distances range from a minimum of 0.04 to a maximum of 0.37 for a US
investor, from 0.03 to 0.87 for a Canadian, and from 0.03 to 0.26 for an Italian. A third indicator is the
di¤erence in the labour income component of equilibrium portfolios between two industries, computed for
all possible destination stock markets and all industry pairs. The percentage of statistically di¤erent labor
income components across industry pairs is 48% for the US, 44% for Canada and 28% for Italy. These results
complement existing evidence indicating that an investor bene�ts from diversi�cation of equity portfolios
both across countries and across industries (Gri¢ n and Karolyi, 1998; Carrieri et al., 2004). This literature
on the factor structure of stock returns does not however consider the non tradability of investors�human
capital, that we take to the foreground.1
Our �ndings also provide insights on whether occupational pension funds may di¤erentiate their invest-
ment strategies from those of open-end pension funds.2 Members in any given occupational plan plausibly
face the same industry shocks, since membership is based on their employment industry. On the contrary,
participants in open-end pension fund belong to di¤erent industries. An occupational pension fund is there-
fore able to design portfolio composition so as to hedge shocks to its own industry, while open-end pension
funds can only hedge national income shocks. Thus, if the correlation between shocks to French equity and
shocks to wages in US manufacturing is higher than that of the average US worker, then US pension funds
for manufacturing workers ought to demand less French stocks relative to the national restricted portfolio.
Clearly, this tailored allocation is valuable only if shocks di¤er across industries so that optimal allocations
do as well, which is what we �nd.
This paper is structured as follows. In Section 2 we describe the related literature. Section 3 illustrates
the theoretical framework. Section 4 reports details on data and econometric methods. In section 4 we
discuss our empirical results. Section 5 concludes.
2 Related Literature
Our paper builds on an equilibrium model of international equity allocation where investors hedge country-
speci�c in�ation risk (Adler and Dumas, 1983) and industry-speci�c labor income risk (Coen, 2001). Investors
from di¤erent countries may choose a di¤erent composition of their risky portfolio, because they hedge
deviations from both the world in�ation rate and the world labor income growth rate. Here, we retain
the assumption of country-speci�c in�ation risk but also allow for heterogeneous labor income induced by
being employed in di¤erent industries. Consequently, optimal stock portfolios also hedge the deviation of1Our results are also consistent with Eiling (2006), who �nds evidence of the ability of human capital returns at the industry
level to account for a large portion of observed returns.2We take the perspective of De�ned Contribution (DC) plans, where contributions are �xed proportions of participants�
salary and bene�ts depend on the plan�s portfolio returns.
3

an industry in a given country from world income growth. Thus, a Canadian investor working in the leisure
industry attributes a lower weight to Dutch stocks if the covariance of Dutch equity returns with her industry
wage exceeds the world average wage covariance. Our empirical results also indicate the relative importance
of wage and in�ation risk in determining international equity diversi�cation, showing that the labor hedging
motive is stronger than the in�ation hedging one in the three countries considered. Finally, cross country
comparison reveals that both hedging motives appear to be stronger in the US and in Canada than in Italy,
suggesting that the role of �nancial markets in hedging background risk may be related to the extent of wage
stabilization granted by labor market institutions.
This type of analysis connects our paper to the literature on the so called �home bias puzzle�, consisting
in a disproportionate actual investment in domestic assets with respect to the weight of domestic assets in
the market portfolio. The latter ought to be the equilibrium risky portfolio according to the International
CAPM. Such large holdings of domestic assets by domestic investors can be rational if domestic equities are a
better hedge of country-speci�c risks, such as deviations from the purchasing power parity or risks connected
with non traded assets. Cooper and Kaplanis (1994) do not support the in�ation hedging motive as an
explanation of the equity home bias. Baxter and Jermann (1997) �nd a quasi-perfect positive correlation
among domestic returns to human and physical capital, which should induce a short position in domestic
assets - widening the home bias. Moreover, Baxter et al. (1998) show that consideration of non traded
consumption goods and/or factors of production does not help reducing the home bias. On the contrary,
Bottazzi et al. (1996), while con�rming that human capital and physical capital returns can have positive
correlation, argue that accounting for human capital reduces the bias towards domestic assets. Indeed, they
�nd a negative correlation with �nancial returns, which reduces the home bias by about 30%. Julliard and
Rosa (2009) argue that Baxter and Jermann (1997) results derive from an econometric restriction which is
rejected by the data. When a general speci�cation is allowed for, considering human capital risk does not
always worsen the puzzle, and in some cases it helps explaining it. Palacios-Huerta (2001) observe that
the home bias drastically shrinks when accounting for heterogeneous human capital of stockholders and
non-stockholders.
Our disaggregation pursues instead the industry dimension. Our conjecture is that the optimal position
in domestic assets in a given country ought to be traced back to the worker�s industry shocks rather than her
country aggregate shocks.3 According to our results, hedging income risk at the industry level still cannot
explain the home bias puzzle: the domestic equity holdings observed in actual portfolios are still higher
3For instance, volatile labor income shocks in two industries command large positions in domestic assets if they display lowcorrelation with domestic equities - which could be the case if �rms are unlisted. Yet, optimal domestic equity holdings wouldappear lower if we instead consider a worker with the average of those two labour incomes and if industry shocks are negativelycorrelated (as could be the case for an importing and an exporting industry).
4
than our implied equilibrium allocations. However, Baxter and Jermann (1997)�s prescription of going short
in domestic assets holds only for Italy (-0.01). In the US we �nd that accounting for both the labor and
the in�ation hedging e¤ects leads to an optimal long position in domestic asset (0.36), albeit lower than its
market share (0.42). For Canada, the optimal positions in domestic equities is instead 0.09, larger than its
market share (0.03).
The e¤ect of labor income on optimal portfolio composition has been investigated in life-cycle models
(Campbell et al., 2001; Davis and Willen, 2000; Cocco et al, 2005; Koijen et al, 2010). There are however two
important di¤erences between these papers and our study, aside from our focus on industry-based (rather
than individual) portfolio choice and labor income. They calibrate optimal portfolio composition in partial
equilibrium, whereas we calibrate equilibrium equity allocations.4 Portfolio choice rests on the correlation
structure of �nancial asset returns and labor income in both cases. However, what matters in this model
is the relative magnitude of correlations. Thus, a small negative correlation between US manufacturing
wages and French equity returns would dictate a small optimal portfolio share in French stocks for a US
manufacturing worker in partial equilibrium. On the contrary, it may translate in large holdings of French
stocks in our results, if other wages have positive correlations with French returns. Second, life cycle models
usually account for predictable individual wage pro�les, conditional on observed characteristics such as age
and education. On the contrary, our portfolio choice rule is myopic - as in similar portfolio decisions with
constant investment opportunities. Thus we simply use the rate of growth in per capita labor income to
measure returns to human capital and its realized volatility to proxy for risk, following - for instance -
Jagannathan and Wang (1996). This is the measure we can compute with our data, but it overlooks several
important dimensions that a¤ect the individual returns to human capital when the decision to invest in
education or experience is endogenous. However Palacios-Huerta (2003b), who adopts measures of human
capital returns accounting for individual human capital gains, skill premia and endogenous labor supply, �nds
that most of the improvement in the explanatory power of the conditional CAPM derives from the measure
that we use, namely the growth rate in per capita labor income.
In this paper we take the standpoint of the representative worker of an industry in a given country
and ask whether her portfolio strategy, designed to hedge labor income risk, should di¤er from that of the
representative investor�s in the same country. Many recent works point to the relevance of several sources
of heterogeneity in labor income. On the one hand, Campbell and Korniotis (2008) construct a measure of
labor income growth for households in the top percentiles of the income distribution, as they are the ones
4Other models compare implied portfolio shares to actual holdings, trying to explain the cross sectional dispersion of householdportfolios (Heaton and Lucas, 2000; Guiso et al., 1996; Angerer and Lam, 2009) or observed life-cycle patterns (Benzoni et al.,2007). On the contrary, we do not observe the industry based portfolios � but test for di¤erences between implied industryportfolios.
5
that usually hold stocks. They �nd that the explanatory power of the human capital CAPM nearly doubles
when they use that measure of the return to human capital. We are unfortunately unaware of data on labor
income growth disaggregated along both the industry and the wealth dimension. Thus we are also forced to
aggregate workers belonging to di¤erent percentiles of the income distribution, within any given industry. On
the other hand, Palacios-Huerta (2003a) shows that risk-adjusted returns to skill may di¤er across education,
experience and gender. Here we focus instead on industry-related heterogeneity, implicitly assuming that
wage shocks have identical co-movements with international equity returns for every occupation within each
industry. Ideally, our analysis could jointly account for occupation and industry characteristics in deriving
optimal international diversi�cation strategies at a �ner disaggregation level. However, the coarser analysis
allowed by our data can still be valuable since it sheds light on systematic industry-related shocks that have
been relatively neglected with respect to occupational ones. Furthermore, it indicates whether one speci�c
type of �nancial intermediary, that is the occupational pension funds, may hedge in international equity
markets that risk component which is common to all occupations within the same industry.
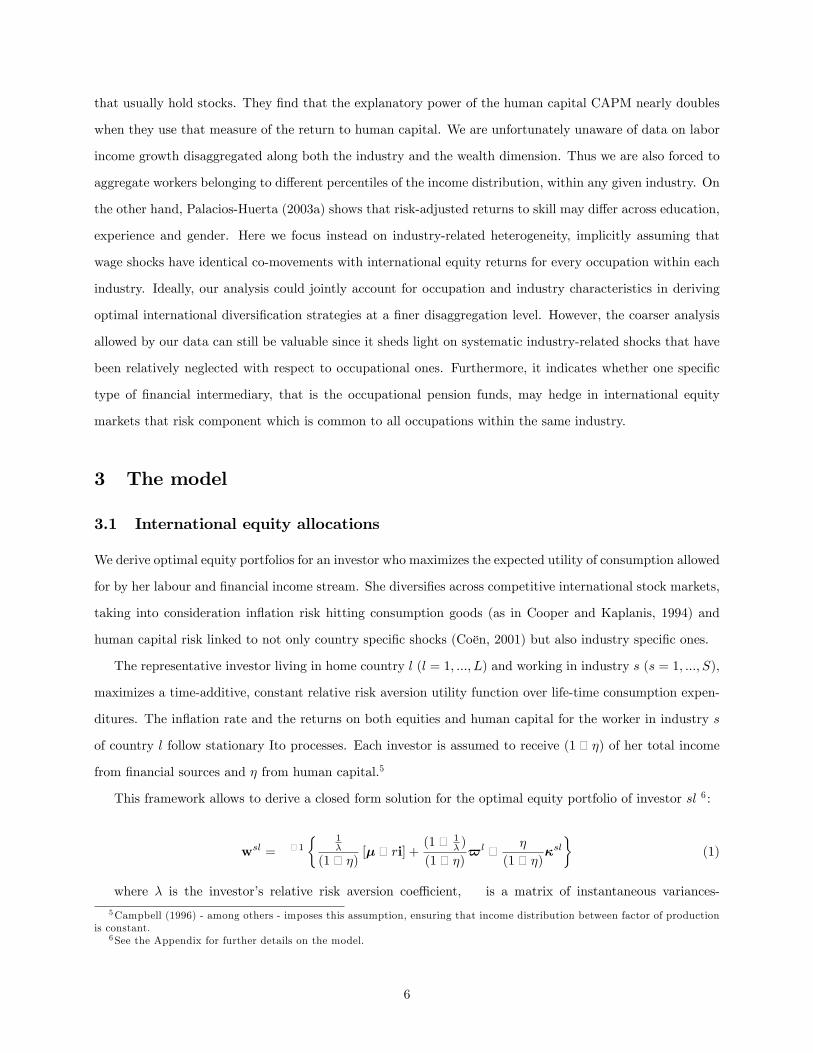
3 The model
3.1 International equity allocations
We derive optimal equity portfolios for an investor who maximizes the expected utility of consumption allowed
for by her labour and �nancial income stream. She diversi�es across competitive international stock markets,
taking into consideration in�ation risk hitting consumption goods (as in Cooper and Kaplanis, 1994) and
human capital risk linked to not only country speci�c shocks (Coën, 2001) but also industry speci�c ones.
The representative investor living in home country ( = 1 ) and working in industry ( = 1 )
maximizes a time-additive, constant relative risk aversion utility function over life-time consumption expen-
ditures. The in�ation rate and the returns on both equities and human capital for the worker in industry
of country follow stationary Ito processes. Each investor is assumed to receive (1¬ �) of her total income
from �nancial sources and � from human capital.5
This framework allows to derive a closed form solution for the optimal equity portfolio of investor 6 :
w = ¬1� 1
�
(1¬ �)[�¬ i] +
(1¬ 1� )
(1¬ �)$ ¬ �
(1¬ �)��
(1)
where � is the investor�s relative risk aversion coe¢ cient, is a matrix of instantaneous variances-
5Campbell (1996) - among others - imposes this assumption, ensuring that income distribution between factor of productionis constant.
6See the Appendix for further details on the model.
6

covariances (�) of nominal rates of return on international equity indexes, � ¬ i represents the vector of
the expected excess returns, $ is the vector of covariances �� between nominal equity return in country
and country �s rate of in�ation, and � is the vector of covariances � between nominal equity return
and investor �s labor income growth.
The optimal portfolio is composed of three parts. The �rst is the usual myopic portfolio which is common
to all investors since it only depends upon the joint distribution of equity returns. The share demanded in the
-th stock index increases in -th excess return, and falls in its contribution to overall risk. The second term
is the country speci�c hedge portfolio of Adler and Dumas (1983). When relative risk aversion exceeds 1, the
portfolio share of -th stock index increases if the correlation between country in�ation and -th nominal
returns is positive. This ensures that the -th stock index is a good hedge against increases in the price of
country consumption goods. The third is the industry-country speci�c hedge portfolio built to hedge labor
income risk, which is equal for investors working in the same industry and country who face common labor
income risk. The portfolio share of -th stock index increases if the correlation between wage risk in industry
in country has negative correlation with the -th nominal return. Clearly, the optimal portfolio coincides
with the myopic portfolio for all investors when investors�speci�c background risks are neglected.
We obtain the following equilibrium portfolio allocations from (1) by imposing the market clearing con-
dition:7
w =MS+(1¬ 1� )(1¬�)
¬1��
¬P
��¬ �(1¬�)
¬1��� ¬
P
���
(2)
where MS is the vector of the country market shares,P
captures the average world covariance
between country in�ation rates and equity returns, whileP
� measures the average world covariance
between industry labor income and equity returns. In equilibrium investor optimal portfolio coincides
with the sum of the market portfolio, which is universally e¢ cient if background risks are neglected, and two
hedging components.
The �rst hedging component indicates that investor �s allocation to equity is higher than the -th
market share when the covariance of the -th return with country in�ation is higher than the world average
in�ation covariance. The second hedging component indicates that investor �s allocation to equity is
higher the lower is the covariance between the -th return and wage growth in industry with respect to
the world average wage covariance.
7 In equilibrium the equity supply in the N countries equals the equity demand: MS =
w where MS is the market
portfolio, i.e. the vector of shares of each equity market over total world capitalization, and represents the wealth of industry in country as a fraction of total world wealth (accordingly, represents the wealth of country as a fraction of total worldwealth).
7

3.2 Implications
The �rst implication concerns the role of international equity markets in diversifying industry wage risk.
Assume that wage growth rates in all the industries in country exhibit the same comovement with the
index return , i.e.:
( ) = ( ) 8 (3)
where is the wage growth rate prevailing in industry of country , is the average wage growth
in country and is the nominal return on equity index . Then we would obtain that the portfolio
composition w is optimal for all industries in country , which exactly coincides with Coën (2001):
w = w 8 (4)
When (3) or, indi¤erently, (4) holds, then the portfolio suitable to hedge risks associated with the average
national labor income in country (that we call the �national restricted portfolio�) is also optimal for hedging
labor income risks at industry level . This result would in turn imply no role for international equity markets
in hedging industry risk. It would thus extend partial equilibrium results referring to domestic asset allocation
(Campbell et al., 2001; Davis and Willen, 2000) to an equilibrium setting with international diversi�cation.
Furthermore, result (4) would suggest no di¤erence in the equity portfolio of occupational pension funds and
open-end pension funds.8 If instead (4) does not hold, then international equity diversi�cation strategies at
the industry level are suitable to hedge labor income risk. To assess the di¤erence between the country level
investment strategy and the industry-level ones, we adopt as a benchmark a representative country investor
endowed with average home country labor income.
A second implication concerns the home bias puzzle, de�ned in the literature as the di¤erence between
the actual and the smaller implied equilibrium position of country in its own domestic equity market. When
restriction (4) is implicitly imposed, the quasi perfect correlation between human capital and assets returns
at the national level leads to an implied equilibrium short position in domestic assets - leading to a widening
of the home bias ( as in Baxter and Jermann, 1997). In our framework, the equilibrium position in domestic
equity, and hence the home bias, is the result of the aggregation of industry speci�c portfolios, which in turn
depends on the covariance between industry speci�c wage growth rates and the returns on equity. Thus,
a positive correlation between US manufacturing wage and US equity returns may well lead to a positive
hedging demand for US stocks if such correlation is lower than the average industry income - equity return
8We cannot test for equality of actual pension funds holdings, because of data availability. Indeed the industry classi�cationcommon to the three investing countries does not in general coincide with that of occupational pension funds.
8

correlation. We juxtapose the aggregate industry speci�c portfolios, which we call the �national unrestricted
portfolio�, de�ned asP
�w9 , to the national restricted one obtained by imposing (4).
4 Data and Methodology
We consider three investing countries -US, Canada and Italy- for which monthly data on wages at the
industry level are available. This selection of countries is determined by data availability. Our analysis can
nonetheless be of general interest for at least two sets of reasons. First, our sample includes the United
States, that constitutes the benchmark for many analyses alternatively focusing on optimal portfolio choice
and wage di¤erentials. Moreover, there is a remarkable heterogeneity in wage bargaining systems and labor
market institutions within our limited sample, that may induce heterogeneity in optimal portfolio allocations.
In particular, Canada and the United States have �exible and decentralized wage setting while Italy features
a high degree of centralization, which tends to reduce �uctuations across industries. Thus, we may get some
insights on the impact of wage setting institutions on portfolio choice.
Data are drawn for the US from the Current Employment Statistics, for Canada from the Survey of
Employment, Payrolls and Hours and for Italy from Retribuzioni e Lavoro, ISTAT. The coarser industry level
disaggregation for the Italian labor markets forces us to consider only seven industries within each country:
Financials, Leisure, Manufacturing, Trade, Transports and Communications, Utilities, Other Services.
In Canada these labor statistics are available since 1997, only. Thus we use data over 1997:01 - 2004:12,
for a total of 96 observations. We then derive 84 overlapping annual observations on the corresponding
growth rates prevailing over 1998:01 to 2004:12. We thus have enough information to consistently estimate
the relationship of wage growth and in�ation rates with �nancial returns.
Annual stock market capitalization and total returns - in local currencies - are drawn from Datastream
Equity Indexes for ten destination countries: Canada, France, Germany, Italy, Japan, Netherlands, Sweden,
United Kingdom, United States, Rest of the World. In the empirical implementation we assume that investors
completely hedge exchange rate risk, i.e. we keep all variables expressed in local currencies.10
Finally, in�ation rates are based on CPI indices from the IMF International Financial Statistics.
In Table 1 we report the mean and standard deviations of nominal industry wage growths in the three
investing countries from which it can be evidenced that they are comparable across the three countries.
Importantly, heterogeneity across industries emerges when considering correlations of industry nominal wages
9The national unrestricted portfolios are obtained by aggregating across industries the industry-based portfolios within eachcountry. In the aggregation, the relative weight � of industry in country is measured by the total labor compensation paidby industry with respect the total labor compensation paid in country .10Baxter and Jermann (1997) adopt the same approach.
9

with the respective national wage growth in Table 2.11 Over the whole sample period, correlations range
from -0.33 to 0.80 for the US, from -0.42 to 0.73 for Canada and from 0.01 to 0.73 for Italy, evidencing a
lower degree of heterogeneity in Italy.
Table 3 displays the mean and standard deviation of stock returns for the ten destination countries so as
to complete the overview of the relevant variables.
In order to compute the equilibrium allocations in (2), we directly observe in the data the vector of
market shares , while we obtain the hedging components from regression analysis, following Cooper and
Kaplanis (1994). The term ¬1h�
¬P
�iis the vector b of coe¢ cients of the multiple regression
of (p ¬P
p) �where p is the in�ation rate of country �on the vector of realized nominal returns R
¬1
¬
X
!= b �
0
BBBBBBBBBBB@
1...
...
1
CCCCCCCCCCCA
(5)
Similarly, the labor income component, ¬1�� ¬
P
��coincides with the vector q of coe¢ -
cients of the multiple regression of (x ¬P
x) onto the vector of realized nominal returns R, where
x is the rate of change of labor income in industry -country :
¬1
� ¬
X
�
!= q �
0
BBBBBBBBBBB@
1...
...
1
CCCCCCCCCCCA
(6)
For each industry , we obtain the q hedging coe¢ cients to compute the industry portfolios. The
weighted aggregation across industries, where weights are taken from the relative labor compensation in each
industry , is what we call the �national unrestricted portfolio�, i.e. the country portfolio obtained by
aggregating the industry-based portfolios of that country.
For each country , we also obtain the national restricted portfolio suitable to hedge risks attached to the
average labor income process by estimating the q hedging coe¢ cients: thus, we also run a regression where
11Persistent heterogeneity is a common �nding. On the one hand, wage growth displays a di¤erent cyclical pattern at theindustry and at the aggregate level (Barsky and Solon, 1989). On the other hand, the labor contribution to total factorproductivity varies considerably across industries and persists over time (Jorgenson et al., 2005; Corrado et al., 2007).
10

the dependent variable is the deviation of the average national wage rate from the average world wage rate.
In the above regressions we proxy the wealth shares ( ) with the market shares () as in Cooper and
Kaplanis (1994) and Adler and Dumas (1983).
Several papers, including Eiling (2006), Jagannathan and Wang (1996), Julliard (2008), Palacios-Huerta
(2001), �nd a relationship between expected stock returns and (expected) labour income. These �ndings
suggest to account for the endogeneity of stock returns. Consequently, contemporaneous returns are instru-
mented with lagged returns, and estimation is performed through GMM.12 We thus run one regression for
each country to obtain the in�ation hedging coe¢ cients b (5):
( ¬X
) = 0 +X
=1
+ (7)
and one regression for each industry to obtain the industry speci�c labor income hedging coe¢ cients
q (6):
( ¬X
) = 0 +X
=1
+ � (8)
In our analysis, we investigate the ability of �nancial returns to hedge in�ation and labor income risks
at annual frequency. We use monthly observations on overlapping annual equity returns, wage growth and
in�ation rates so to have enough information to consistently estimate parameters.13 We correct for the
induced serial correlations in the errors with the Newey-West method to obtain consistent standard errors.
Under the new notation, the -th element of the vector of equilibrium allocations in (2) is equal to:
= +
(1¬ 1� )
(1¬ �) ¬
�
(1¬ �) (9)
The coe¢ cients � and � are exogenous parameters. The risk aversion parameter � is set equal to 5.14
The parameter � is set equal to the world average labor share (063).15
12We have also conducted a Three-Stages-Least-Squares estimation to account for the correlation between wage growth rateand in�ation rate. We estimated, within a system, all equations for the in�ation hedging coe¢ cient and for labor hedgingcoe¢ cients in all industries. The estimated coe¢ cients are una¤ected and the standard errors do not signi�cantly alter resultswith respect to the case of applying directly the GMM method to the system. We therefore opt for the latter as it providesrobust standard errors of estimates.13Boudoukh and Richardson (1993), among others, apply the same approach when looking at the in�ation-stock returns
regression with overlapping returns.14 In our simulations we consider alternative values for the coe¢ cient of relative risk aversion � in the range f2 10g, as
commonly proposed by the literature. Our �ndings on portfolio compositions are similar under di¤erent degrees of risk aversion.So we report results only for the case of risk aversion equal to �ve.15Campbell (1996) suggests that the ratio of human wealth to total wealth is about two-thirds, since 2/3 of the national GDP
goes to labor. The choice of a speci�c level of �, should however not a¤ect our conclusions about the heterogeneity of optimalportfolios across industries.
11
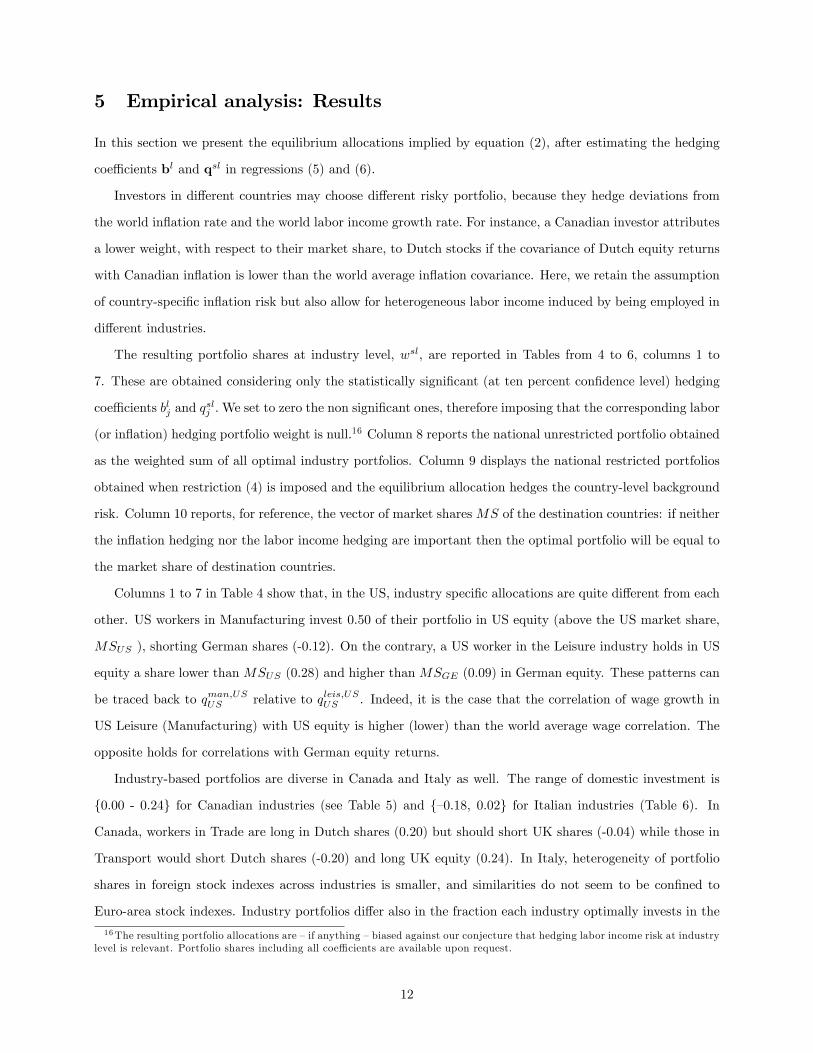
5 Empirical analysis: Results
In this section we present the equilibrium allocations implied by equation (2), after estimating the hedging
coe¢ cients b and q in regressions (5) and (6).
Investors in di¤erent countries may choose di¤erent risky portfolio, because they hedge deviations from
the world in�ation rate and the world labor income growth rate. For instance, a Canadian investor attributes
a lower weight, with respect to their market share, to Dutch stocks if the covariance of Dutch equity returns
with Canadian in�ation is lower than the world average in�ation covariance. Here, we retain the assumption
of country-speci�c in�ation risk but also allow for heterogeneous labor income induced by being employed in
di¤erent industries.
The resulting portfolio shares at industry level, , are reported in Tables from 4 to 6, columns 1 to
7. These are obtained considering only the statistically signi�cant (at ten percent con�dence level) hedging
coe¢ cients and We set to zero the non signi�cant ones, therefore imposing that the corresponding labor
(or in�ation) hedging portfolio weight is null.16 Column 8 reports the national unrestricted portfolio obtained
as the weighted sum of all optimal industry portfolios. Column 9 displays the national restricted portfolios
obtained when restriction (4) is imposed and the equilibrium allocation hedges the country-level background
risk. Column 10 reports, for reference, the vector of market shares of the destination countries: if neither
the in�ation hedging nor the labor income hedging are important then the optimal portfolio will be equal to
the market share of destination countries.
Columns 1 to 7 in Table 4 show that, in the US, industry speci�c allocations are quite di¤erent from each
other. US workers in Manufacturing invest 0.50 of their portfolio in US equity (above the US market share,
), shorting German shares (-0.12). On the contrary, a US worker in the Leisure industry holds in US
equity a share lower than (0.28) and higher than (0.09) in German equity. These patterns can
be traced back to relative to . Indeed, it is the case that the correlation of wage growth in
US Leisure (Manufacturing) with US equity is higher (lower) than the world average wage correlation. The
opposite holds for correlations with German equity returns.
Industry-based portfolios are diverse in Canada and Italy as well. The range of domestic investment is
{0.00 - 0.24} for Canadian industries (see Table 5) and {�0.18, 0.02} for Italian industries (Table 6). In
Canada, workers in Trade are long in Dutch shares (0.20) but should short UK shares (-0.04) while those in
Transport would short Dutch shares (-0.20) and long UK equity (0.24). In Italy, heterogeneity of portfolio
shares in foreign stock indexes across industries is smaller, and similarities do not seem to be con�ned to
Euro-area stock indexes. Industry portfolios di¤er also in the fraction each industry optimally invests in the
16The resulting portfolio allocations are �if anything �biased against our conjecture that hedging labor income risk at industrylevel is relevant. Portfolio shares including all coe¢ cients are available upon request.
12
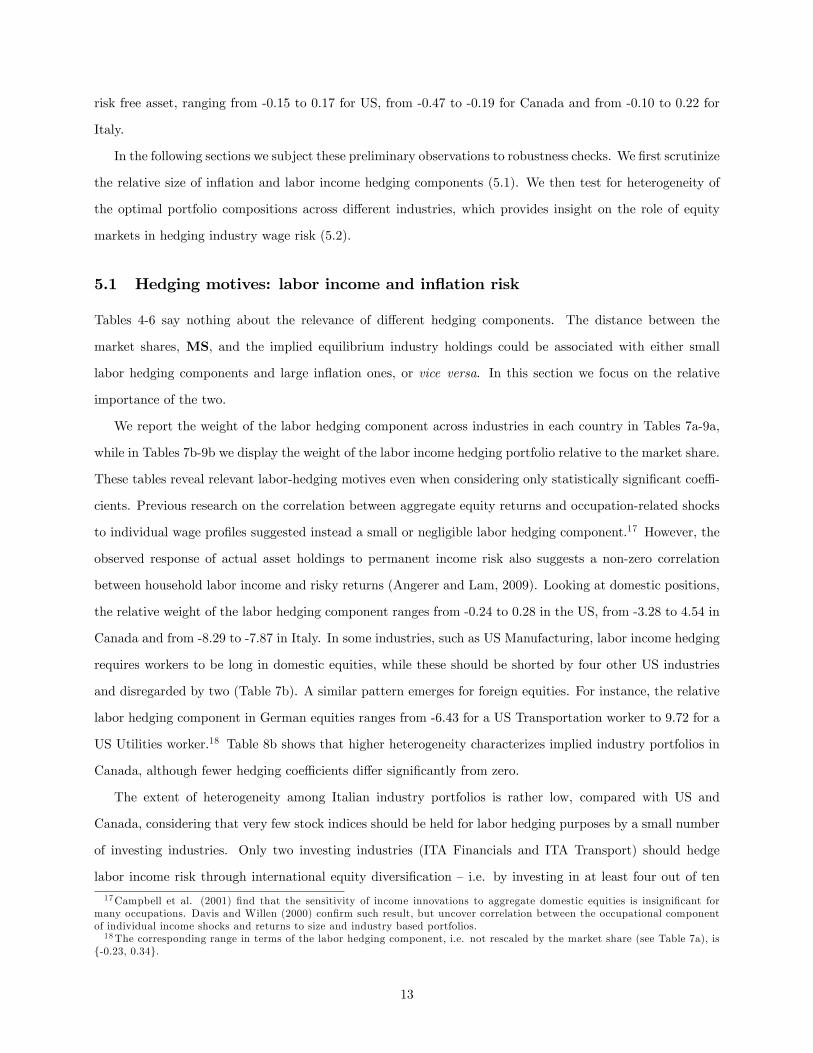
risk free asset, ranging from -0.15 to 0.17 for US, from -0.47 to -0.19 for Canada and from -0.10 to 0.22 for
Italy.
In the following sections we subject these preliminary observations to robustness checks. We �rst scrutinize
the relative size of in�ation and labor income hedging components (5.1). We then test for heterogeneity of
the optimal portfolio compositions across di¤erent industries, which provides insight on the role of equity
markets in hedging industry wage risk (5.2).
5.1 Hedging motives: labor income and in�ation risk
Tables 4-6 say nothing about the relevance of di¤erent hedging components. The distance between the
market shares, MS and the implied equilibrium industry holdings could be associated with either small
labor hedging components and large in�ation ones, or vice versa. In this section we focus on the relative
importance of the two.
We report the weight of the labor hedging component across industries in each country in Tables 7a-9a,
while in Tables 7b-9b we display the weight of the labor income hedging portfolio relative to the market share.
These tables reveal relevant labor-hedging motives even when considering only statistically signi�cant coe¢ -
cients. Previous research on the correlation between aggregate equity returns and occupation-related shocks
to individual wage pro�les suggested instead a small or negligible labor hedging component.17 However, the
observed response of actual asset holdings to permanent income risk also suggests a non-zero correlation
between household labor income and risky returns (Angerer and Lam, 2009). Looking at domestic positions,
the relative weight of the labor hedging component ranges from -0.24 to 0.28 in the US, from -3.28 to 4.54 in
Canada and from -8.29 to -7.87 in Italy. In some industries, such as US Manufacturing, labor income hedging
requires workers to be long in domestic equities, while these should be shorted by four other US industries
and disregarded by two (Table 7b). A similar pattern emerges for foreign equities. For instance, the relative
labor hedging component in German equities ranges from -6.43 for a US Transportation worker to 9.72 for a
US Utilities worker.18 Table 8b shows that higher heterogeneity characterizes implied industry portfolios in
Canada, although fewer hedging coe¢ cients di¤er signi�cantly from zero.
The extent of heterogeneity among Italian industry portfolios is rather low, compared with US and
Canada, considering that very few stock indices should be held for labor hedging purposes by a small number
of investing industries. Only two investing industries (ITA Financials and ITA Transport) should hedge
labor income risk through international equity diversi�cation �i.e. by investing in at least four out of ten
17Campbell et al. (2001) �nd that the sensitivity of income innovations to aggregate domestic equities is insigni�cant formany occupations. Davis and Willen (2000) con�rm such result, but uncover correlation between the occupational componentof individual income shocks and returns to size and industry based portfolios.18The corresponding range in terms of the labor hedging component, i.e. not rescaled by the market share (see Table 7a), is
{-0.23, 0.34}.
13

stock markets. Moreover, three equity indices would be totally disregarded for labor hedging purposes by all
industries.
Column 9 of each table reports the in�ation hedging component, which is common to all industries in a
country. Our �ndings point to a modest role of several international equity markets in hedging in�ation risk.
Five out of ten destination stock indices turn out to have no signi�cant hedging role for US in�ation risk.
Moreover, US equities are shorted by US investors. On the contrary, six equity indices are signi�cantly useful
to hedge in�ation risk for Canadians, who also have an implied long position in domestic equities. Finally,
equity markets play a little role in hedging Italian in�ation risk: eight stock indices, including the domestic
one, are not signi�cantly correlated with domestic in�ation.
For comparison, Column 8 of Tables 7-9 displays the labor hedging component in the national unrestricted
portfolio, obtained by aggregating the labor hedging components at industry level weighted by labor income
compensation. Summing up values in Columns 8 and 9 we obtain the total hedging component in the national
unrestricted portfolio (Column 10). Such component can be interpreted as the equilibrium portfolio share,
due to the hedging motives of all industries in a country. For all the three countries considered, labor hedging
motives seem to prevail on in�ation hedging ones in determining departure of the optimal aggregate demand
from the MS.
Yet, this perspective even underestimates the size of the aggregate labor hedging motive, as positive and
negative positions in industry-speci�c portfolios o¤set each other in the aggregation procedure. Table 10
provides an alternative measure of the size of the labor hedging motive, that is the weighted average �across
industries �of the absolute values of labor hedging components, by destination countries (Columns 3 and 4).
Columns 1 and 2 display, by destination stock indices, the absolute size of the in�ation hedging components.
The last row in each panel reports the sum of the hedging components for all destination countries. This
is the sum of the (absolute) portfolio positions speci�cally designed to hedge in�ation (Columns 1 and 2)
or industry risk (Columns 3 and 4). Comparison between Column 2 and 4, which account for statistically
signi�cant coe¢ cients only, evidences that the labor hedging motive is stronger than the in�ation hedging
one in all investing countries. A cross country comparison reveals that both hedging motives appear to be
stronger in US and Canada than in Italy. The small size of the labor hedging component for Italy supports
the conjecture that centralized wage setting smooths wage shocks, possibly weakening the link with �nancial
shocks.
Column 5 and 6 of Table 10 report the absolute value of the labor hedging component in the national
restricted portfolio. Ignoring heterogeneity across industries leads to underestimate the labor hedging motive,
as the weighted average of labor hedging component across industries (Column 4) exceeds the size of the
labor hedging in the national restricted portfolio (Column 6). This result suggests that both the size and
14

the heterogeneity of labor hedging components across industry matter. In the following section we subject
heterogeneity to statistical tests.
5.2 Hedging industry-speci�c labor income risk
So far we maintained the assumption that restriction (4) does not hold. We now formally test the equality
of labor income hedging coe¢ cients across investing industries ( ) by estimating the regressions (8) for the
seven industries within the same country in a system. The result of this test reveals whether hedging wage
risk requires industry-speci�c portfolios. The null hypothesis of the Wald test we perform is the following
: 2=
26=(10)
where is the set of investing industries. Under the null, the equilibrium portfolio share held in stock
index by industry is equal to that held by industry .
We provide a graphical representation of the result of this test, hence of the statistical di¤erence among
the industry-based portfolios. For each and every pair of industries within a country, we count the number of
signi�cantly di¤erent coe¢ cients. Since we have seven industries, we consider 21 possible pairs for each
investing country. For each pair we count the number of signi�cantly di¤erent labor hedging portfolio
components. For instance, we check whether US workers in the trade and in the leisure industry invested the
same portfolio share in Japanese stocks. We repeat this test for the other nine destination countries.
Figure 1-3 associate the number of statistically di¤erent coe¢ cients on the horizontal axis to the number
of industry-pairs on the vertical axis. Thus there are eight industry-pairs out of 21 that di¤er in �ve portfolio
shares out of ten in the US. In Canada �ve industry-pairs out of 21 di¤er by seven portfolio weights out
of ten. In Italy six industry-pairs di¤er by two portfolio weights.19 The subtitle to each graph reports the
number of statistically di¤erent coe¢ cients as a percentage of 210 (21 pairs times 10 coe¢ cients, one for each
destination country). This is 48% for the US, 44% for Canada and 28% for Italy. Thus, it appears that an
industry- tailored portfolio designed by occupational pension funds would be most valuable in the US and in
Canada.
Last but not least, we perform a Wald test on the di¤erence between the industry speci�c labor hedging
coe¢ cient, , and the national restricted one,
: 2= (11)
19This type of test could be used in order to endogenize the optimal industry perimeter of pension funds, when there is a costto specialized portfolio management.
15

Table 11 reports the statistically signi�cant absolute distances between industry (w) and national re-
stricted portfolio weights (w). We �nd that such distances are large. The widest range, from 0.03 to 0.87,
is observed for Canada, being 0.04-0.37 for US and 0.03-0.26 for Italy. Moreover, the number of statistically
signi�cant distances is highest for US and lowest for Italy, con�rming that industry-tailored portfolios are
most useful to the US and Canada.
Finally, Table 12 reports portfolio dispersion measures derived over industry portfolios shown in Tables 4,
5 and 6. Table 12.I and 12.II report the measures of dispersion of optimal equity portfolios across investing
industries for fully hedged and unhedged20 positions, respectively. Panel (a) displays the standard deviation of
di¤erences between industry portfolios from the national restricted portfolio in the corresponding country.21
These are computed weighting each di¤erence either with the industry labor compensation (weighted) or
with equal weights (unweighted). In table 12.I this is equal to 32 percentage points (pp) in the US, 42
pp for Canada and 22 pp for Italy, when we account for statistically signi�cant weighted di¤erences. The
dispersion measures increase to 36 pp for the US, 56 pp for Canada and 25 pp for Italy when industries are
equally weighted. Thus, it appears that industries with a smaller relative labor income compensation should
command portfolio shares that are more distant from the national restricted one.
Panel (b) displays the standard deviation of industry portfolio weights assigned to each destination country
( ) evaluated with respect to the corresponding weight in the national restricted portfolio (
).
22 The
standard weighted deviation is 10 pp for US, 13 pp for Canada and 7 pp for Italy. Table 12.II reports
these measures of dispersion computed under the assumption that exchange rate risk is unhedged. Though
the unhedged optimal portfolio compositions23 di¤er substantially from the fully-hedged ones, results about
heterogeneity across industry portfolios are qualitatively similar.
The extent of heterogeneity in labor income across industries, and hence the role of occupational pension
funds appear to be robust independently of the metric used. They consistently appear more marked in the
US and Canada than in Italy. Lower industry heterogeneity in Italy might be ascribed to stronger centralized
wage setting24 , which in turn might cause lower correlation between domestic stock returns and wage growth.
5.3 Home bias and industry risk
In this section, we assess whether the observed home bias can be the outcome of hedging labor income risk
at the industry, rather than at the country, level. Baxter and Jermann (1997) predict that including human
20For each investing industry, unhedged positions are computed on series expressed in the home-currency.21The measures of dispersion are derived computing standard measures of variability around the national restricted portfolio
rather than around the mean. Reported measures are derived, alternatively, on all distances and on only signi�cant distances.22The measures of dispersion are explained in detail in Table 12.23Not reported here, but available upon request.24 Indeed, Kahn (1998) and Flanagan (1999) �nd that wage dispersion across industries is related to centralized wage setting
in a cross-country study.
16

capital necessarily worsens the home bias puzzle. Julliard and Rosa (2009) show that their result need not
hold and may actually be reverted when the speci�cation allows for economic integration among countries.
Our �ndings are in between, as we �nd that human capital worsens the puzzle only in some cases.
We re-examine the risky portfolio composition in column 8 of Tables 4, 5 and 6. To allow for comparison
with previous literature we normalize the equity portfolio shares to sum up to one. Hedging industry wage-
risk cannot explain the puzzle. In no case we �nd that the aggregation of industry equity portfolios, which
sum up to the unrestricted national portfolios, match the high domestic equity holdings observed in actual
portfolios and widely documented by previous literature (see Lewis, 1999). At the end of year 2003, US held
0.86 of their wealth in domestic equities. The corresponding �gures for Canada and Italy were 0.70 and 0.58.
The equilibrium weights, implied by the model, are 0.36, 0.09, and -0.01, respectively25 .
We now benchmark in more detail our results with those in previous literature. Table 13 displays the
home bias, which is the di¤erence between actual and optimal position in domestic assets for each investing
country. Column 3, 4 and 5 report results by Baxter and Jermann (1997), Bottazzi et al. (1996)26 and Coën
(2001) respectively, while columns 6-9 report our results27 . Columns 6 and 7 (8 and 9) report, respectively,
the home bias measures for the restricted national portfolio and the unrestricted one in the case exchange
rate risk is fully hedged (unhedged).
According to our results, Baxter and Jermann (1997)�s prescription of going short in domestic assets does
not necessarily hold. The correlation of US stock returns with wages and in�ation induces an equilibrium
domestic share (0.36) just below the market share (0.42). The Canadian market share and Canadian optimal
domestic position are respectively equal to 0.03 and 0.09, while the corresponding digits for Italy are 0.02
and -0.01. In order to make the comparison more precise we should ignore the in�ation hedging component
when deriving equity portfolios. Even in this case, their portfolio prescription does not necessarily hold, as
going short in domestic equities is not optimal in all countries. For example, the Canadian labor income
hedging component turns out to be positive at the aggregate level, as four out of seven industries in Canada
should be long in domestic assets.
Our results on the equilibrium portfolio suitable to hedge both in�ation and labor income at the national
level are also directly comparable with those in Coën (2001). He �nds that domestic assets do not have a
role in hedging both types of risks, so the optimal portfolio weight on domestic equity does not signi�cantly
depart from its market share. He evaluates the home bias as the di¤erence between the actual position in
domestic equity and the market share, �nding values equal to 0.51 for US, 0.70 for Canada and 0.83 for Italy,
25Our results con�rm Pesenti and van Wincoop (2002) �ndings on the limited ability of nontradables in explaining the homebias puzzle.26 In Table 13 we report our computations of the home bias according to the method adopted in Bottazzi et al. (1996).27We do not explicitly compare our results with Julliard and Rosa (2009) and Palacios-Huerta (2001) because they do not
cover all the three investing countries included in our analysis.
17

that we report in Table 13 column 5. We report in column 6 the home bias corresponding to the optimal
national restricted portfolio implied by our estimation analysis: it is equal to 0.56 for the US, to 0.62 for
Canada and 0.56 for Italy. Thus, accounting for human capital at the aggregate level can a¤ect the measure
of the home bias either by marginally increasing it, as in the case of the US or by decreasing it as for Italy
and Canada.
Finally, comparing columns 6 and 7 in Table 13 we �nd that accounting for industry-based risk does not
a¤ect substantially the home bias. It is slightly reduced for US (0.50) and Canada (0.61), while it turns out
to increase for Italy (0.59).28
Our results indicate that the observed high level of domestic investments cannot be explained by the
industry disaggregation alone. We may have to control for other relevant factors, such as investors�wealth,
education level, experience, in order to isolate the contribution of the industry factor. These individual
characteristics are highly correlated with stock market participation that helps reconciling the evidence of
home bias with normative portfolio allocation, as shown by Palacios-Huerta (2001) and Julliard (2004).
For instance, we might expect the Transportation sector, a large non-tradable sector, to display a stronger
correlation with domestic assets leading to a lower optimal domestic equity allocation than the aggregate one.
However, it may be the case that investors with low �nancial wealth, who diversify less into equity, are over-
represented in this industry thus eventually neutralizing the industry e¤ect on the home bias. More generally,
if the unconditional distribution of wealth (education level, experience) is di¤erent from the distribution
conditional on industry, then it becomes necessary to adjust for these factors in order to single out the
domestic investment associated with hedging labor income risk at industry level.
Finally, Julliard (2004) �nds that, in the presence of borrowing constraints and for a low liquid-wealth -to-
labor-income ratio, the correlation of human capital with domestic �nancial wealth prevails in determining
portfolio allocations. On the contrary, when the liquid wealth component exceeds the labor income one,
the investors diversify their portfolio internationally. Since most US investors have a low ratio, then in the
aggregate they display a home bias. In our simpli�ed model we assume that all investors receive the same
fraction of income from labor and �nancial markets within each country. If we could account for individual
sources of wealth, we could control for a dimension that has been shown to provide a further argument to
the home bias puzzle explanation and so, eventually, disentangle the distinct role played by industry. The
unavailability of these time series data at the industry level unfortunately does not allow us to derive sounder
conclusions on the speci�c role of industry characteristics on home bias.
28Columns 8 and 9 of Table 13 report the home bias assuming that exchange rate positions are unhedged. Since unhedgedporto�ios di¤er substantially from fully-hedged ones, the home bias measures di¤er as well. When exchange rate risk is unhedged,the home bias is reduced and unchanged for the US and Canada respectively, while it increases for Italy.
18

6 Conclusions
This paper resurrects a role for equity markets in diversifying labor income risk. Our results point to the
importance of accounting for this source of background risk when designing optimal portfolio strategies
at industry level. More speci�cally, the negligible impact of the industry component in previous analyses
focusing on domestic equity portfolios (Cocco et al., 2005) suggests that it is crucial to enlarge the spectrum
of investable assets to international equities.
These �ndings imply a role for occupational pension funds. Households often fail to attain their objectives
in �nancial decision planning (Campbell, 2006) and institutional investors may help cope with these failures
(Bodie, 2003). As pension funds�assets represent a large fraction of households�wealth in most countries 29 ,
tracing connections between their investment strategies and households�risk exposure is relevant. The size
and heterogeneity of labor income hedging components in equilibrium portfolios, implied by our estimates,
suggests that pension funds may help workers smooth labour income by tailoring their international equity
portfolios to industry wage risk. We did not test for di¤erences of actual portfolio holdings across pension
funds, because of missing comparable cross-country data. Thus the question whether occupational pension
funds do actually hedge industry shocks is open, but can be addressed in future research focusing on a single
country. Last but not least, a one-country focus would also allow to investigate portfolio allocations with
predictable (returns and) labor income growth, thanks to longer data series.
Inter-industry portfolio di¤erences are especially pronounced for Canada and the US, while they appear
to be weaker in Italy. This pattern could be ascribed to stronger centralized wage setting in Italy. If this
conjecture is correct, our results would suggest the existence of substitutability between alternative insurance
mechanisms. Palacios-Huerta (2001) emphasizes that human capital risks may be hedged by life insurance,
unemployment insurance, medical insurance, marriage or other forms of partnerships. In our aggregate level
setting, our �ndings points to the existence of a potential substitution mechanism between a �nancially-based
and an institutionally-based labor income hedging strategy. In particular, the role of occupational pension
funds would be lower in countries where wage setting institutions already dampen industry wage shocks.
Data unavailability unfortunately does not allow to widen the cross-sectional dimension of our data set that
would be necessary in order to provide further evidence on this policy relevant result.
29Pension funds�assets over GDP are equal to 95% for US and 52% for Canada. In Italy they are expected to grow, from thecurrent 3%, as a consequence of social security reform (OECD, 2004).
19

References
[1] Adler, M. and B. Dumas (1983), �International Portfolio Choice and Corporation Finance: A Synthesis�,Journal of Finance, 38, 925-984.
[2] Angerer, X. and P.-S. Lam (2009), �Income Risk and Portfolio Choice: An Empirical Study�, Journalof Finance, 64, 1037-1055.
[3] Barsky R. B., Solon, G. (1989), �The Seasonal Cycle and the Business Cycle�, Journal of PoliticalEconomy, 97, 503-534.
[4] Baxter, M. and U. J. Jermann (1997). �The International Diversi�cation Puzzle Is Worse Than YouThink�, American Economic Review, 87(1), 170-80.
[5] Baxter, M., U .J. Jermann and R.G. King (1998), �Nontraded Goods, Nontraded Factors, and Interna-tional Non-Diversi�cation�, Journal of International Economics, 44, 212-229.
[6] Benzoni, L., P. Collin-Dufresne and R.S. Goldstein (2007), �Portfolio Choice Over the Life-Cycle whenStocks and Labor Markets are Cointegrated�, FRB of Chicago Working Paper No. 2007-11.
[7] Bodie, Z. (2003), �Thoughts on the Future: Life-Cycle Investing in Theory and Practice�, FinancialAnalysts Journal, 59, 24-29.
[8] Bottazzi, L, P. Pesenti and E. van Wincoop (1996), �Wages, Pro�ts, and the International PortfolioPuzzle�, European Economic Review, 40, 219-254.
[9] Boudoukh, J., and M. Richardson (1993),�Stock Returns and In�ation: A Long-Horizon Perspective�,American Economic Review, 83, 1346-1355.
[10] Campbell, J.Y. (1996), �Understanding Risk and Return�, Journal of Political Economy, 104, 298-345.
[11] Campbell, J. Y. (2006), �Household Finance�, Journal of Finance, 61, 1553-1604.
[12] Campbell, J. Y., Cocco, J. F., F. J. Gomes and P. J. Maenhout (2001), �Investing Retirement Wealth:A Life-Cycle Model�, in Campbell, J. Y and M. Feldstein, eds. Risk Aspects of Investment Based SocialSecurity Reform (Chicago: University of Chicago Press).
[13] Campbell, S. and G. Korniotis (2008), "The Human Capital That Matters: Expected Returns andthe Income of A uent Households", Finance and Economics Discussion Series 2008-2009, Board ofGovernors of the Federal Reserve System.
[14] Carrieri F., Errunza V., and S. Sarkissian (2004), Industry Risk and Market Integration, ManagementScience, 50, 207-221
[15] Cocco, J. F., F. J. Gomes and P. J. Maenhout (2005), �Consumption and Portfolio Choice over the LifeCycle�, Review of Financial Studies, 18, 491-533.
[16] Coën, A. (2001), �Home bias and International Capital Asset Pricing Model with Human Capital�,Journal of Multinational Financial Management, 11, 497-513.
[17] Cooper, I. A. and E. Kaplanis (1994), �Home Bias in Equity Portfolios, In�ation Hedging and Interna-tional Capital Market Equilibrium�, Review of Financial Studies, 7, 45-60.
[18] Corrado, C., P. Lengerman, E. J. Bartelsman and J. J. Beaulieu (2007), �Sectoral Productivity in theUnited States: Recent Developments and Role of IT�, Federal Reserve Board, Finance and EconomicDiscussion Series.
[19] Das, S. and R. Uppal (2004), �Systemic Risk and International Portfolio Choice�, Journal of Finance,59, 2809-2834.
20

[20] Davis, S.J. and P. Willen (2000), �Occupation-Level Income Shocks and Asset Returns: their Covarianceand Implications for Portfolio Choice�, NBER Working Paper No W7905
[21] De Santis, G. and B. Gerard (1997), �International Asset Pricing and Portfolio Diversi�cation withTime-Varying Risk�, Journal of Finance, 52, 1881-1912.
[22] Dickens, W. T. and L. F. Katz (1987), �Inter-Industry Wage Di¤erences and Industry Characteristics�in Lang K. and Leonard J., eds. Unemployment and the Structure of Labor Markets, Basil Blackwell,Oxford.
[23] Eiling, E. (2006), �Can Nontradable Assets Explain the Apparent Premium for Idiosyncratic Risk? TheCase of Industry-speci�c Human Capital�, Working paper, Tilburg University.
[24] Flanagan, R. J. (1999), �Macroeconomic Performance and Collective Bargaining: An International Per-spective�, Journal of Economic Literature, 37, 1150-1175.
[25] Gittleman, M. and E. N. Wol¤ (1993), �International Comparison of Inter-Industry Wage Di¤erentials�,Review of Income and Wealth, 39, 295-312.
[26] Grauer, R. and H.N. Hakansson (1987), �Gains From International Diversi�cation 1968-1985: Returnson Portfolios of Stocks and Bonds�, Journal of Finance, 42, 721-741.
[27] Gri¢ n, J.M and A.G. Karolyi (1998), �Another Look at the Role of the Industrial Structure of Marketsfor International Diversi�cation Strategies�, Journal of Financial Economics, 50, 351-373.
[28] Grubel, H. (1968), �International Diversi�ed Portfolios: Welfare Gains and Capital Flows�, AmericanEconomic Review, 58, 1299-1314.
[29] Guiso, L., T. Jappelli and D. Terlizzese (1996), �Income Risk, Borrowing Constraints and PortfolioChoice�, American Economic Review, 86, 158-172.
[30] Heaton, J. and D. Lucas (2000), �Portfolio Choice in the Presence of Background Risk�, The EconomicJournal, 1-26
[31] Jagannathan, R. and Z. Wang (1996), �The Conditional CAPM and the Cross-Section of ExpectedReturns�, Journal of Finance, 51, 3-53.
[32] Jorgenson, D. W., S. H. Mun and J. S. Kevin (2005), �The Sources of Growth of U.S. Industries�,Federal Reserve Bank of New York, Working Paper.
[33] Julliard, C. (2004), "Human Capital and International Portfolio Choice", Princeton University, mimeo.
[34] Julliard, C. (2008), "Labor Income Risk and Asset Returns", LSE mimeo.
[35] Julliard, C. and C. Rosa (2009), "The International Diversi�cation Puzzle is not Worse Than YouThink", LSE mimeo.
[36] Kahn, L. M. (1998), �Collective Bargaining and the Inter-Industry Wage Structure: International Evi-dence�, Economica, 65, 507-534.
[37] Katz, L. F. and L. H. Summers (1989), �Industry Rents: Evidence and Implications�, Brookings Paperson Economic Activity: Microeconomics, 209�275.
[38] Koijen, R.S.J., T.E. Nijman and B.J.M. Werker (2010), �When Can Life Cycle Investors Bene�t fromTime-Varying Bond Risk Premia?�, Review of Financial Studies, 23, 741-780.
[39] Krueger, A. B. and L. H. Summers (1987), �Re�ection on the Inter-Industry Wage Structure�, in LangK. and Leonard J., eds. Unemployment and the Structure of Labor Markets, Basil Blackwell, Oxford.
[40] Levy, H. and M. Sarnat (1970), �International Diversi�cation in Investment Portfolios�, American Eco-nomic Review, 60, 668-675.
21

[41] Lewis, K.K. (1999), �Trying to Explain Home Bias in Equities and Consumption�Journal of EconomicLiterature, 37, 571-608.
[42] Mayers, D. (1972), �Non-Marketable Assets and the Capital Market Equilibrium Under Uncertainty�,in Jensen M., ed. Studies in the Theory of Capital Markets, Praeger, New York, 223-248.
[43] Merton, R.C. (1971), �Optimum Consumption and Portfolio Rules in a Continuous-Time Model�, Econo-metrica, 41, 867-87.
[44] OECD, 2004, Global Pension Statistics.
[45] Palacios-Huerta, I. (2001), �The Human Capital of Stockholders and the International Diversi�cationPuzzle�, Journal of International Economics, 54, 309-31.
[46] Palacios-Huerta, I. (2003a), �An Empirical Analysis of the Risk Properties of Human Capital Returns�,American Economic Review, 93, 948-964.
[47] Palacios-Huerta, I. (2003b), �The Robustness of the Conditional CAPM with Human Capital�, Journalof Financial Econometrics, 1, 272-289.
[48] Pesenti, P. and E. van Wincoop (2002), �Can Nontradables Generate Substantial Home Bias?�, Journalof Money, Credit and Banking, 34, 25-50.
[49] Weinberg, B. A. (2001), �Long-TermWage Fluctuations with Industry-Speci�c Human Capital�, Journalof Labor Economics, 1. 231-264.
22
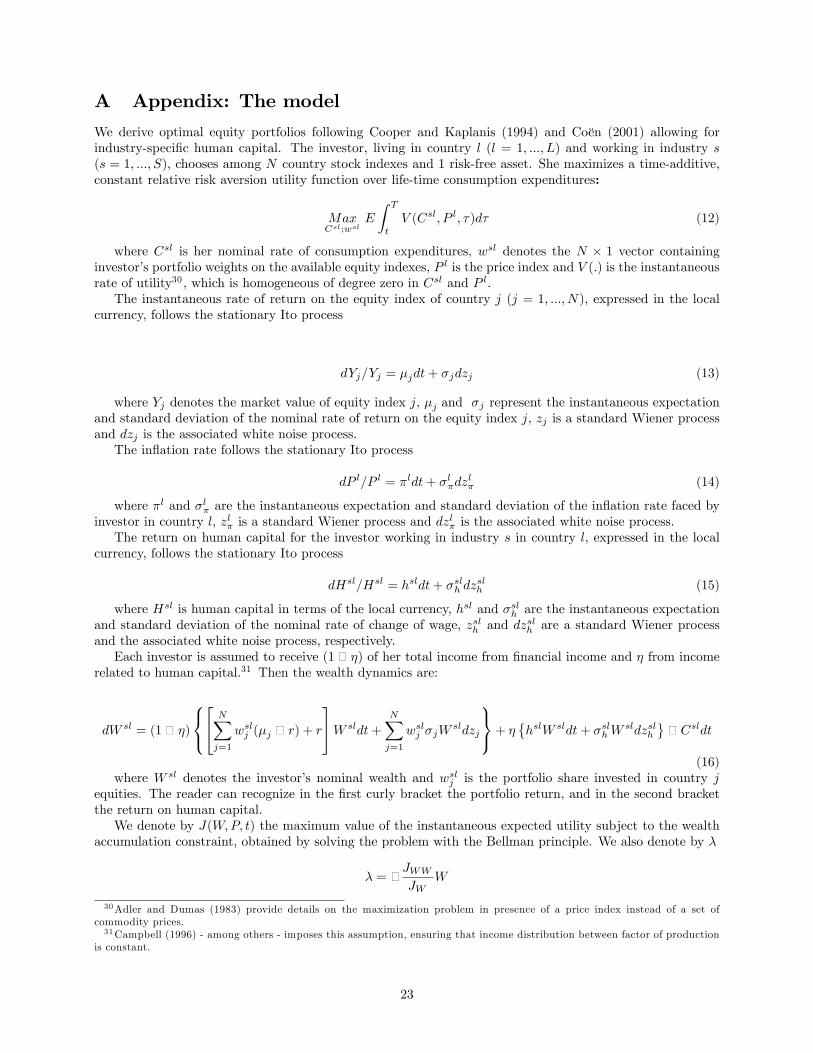
A Appendix: The model
We derive optimal equity portfolios following Cooper and Kaplanis (1994) and Coën (2001) allowing forindustry-speci�c human capital. The investor, living in country ( = 1 ) and working in industry ( = 1 ) chooses among country stock indexes and 1 risk-free asset. She maximizes a time-additive,constant relative risk aversion utility function over life-time consumption expenditures:
;
Z
( �)� (12)
where is her nominal rate of consumption expenditures, denotes the � 1 vector containinginvestor�s portfolio weights on the available equity indexes, is the price index and () is the instantaneousrate of utility30 , which is homogeneous of degree zero in and .The instantaneous rate of return on the equity index of country ( = 1 ), expressed in the local
currency, follows the stationary Ito process
= �+ � (13)
where denotes the market value of equity index , � and � represent the instantaneous expectationand standard deviation of the nominal rate of return on the equity index , is a standard Wiener processand is the associated white noise process.The in�ation rate follows the stationary Ito process
= �+ ��� (14)
where � and �� are the instantaneous expectation and standard deviation of the in�ation rate faced byinvestor in country , � is a standard Wiener process and � is the associated white noise process.The return on human capital for the investor working in industry in country , expressed in the local
currency, follows the stationary Ito process
= + � (15)
where is human capital in terms of the local currency, and � are the instantaneous expectationand standard deviation of the nominal rate of change of wage, and are a standard Wiener processand the associated white noise process, respectively.Each investor is assumed to receive (1¬ �) of her total income from �nancial income and � from income
related to human capital.31 Then the wealth dynamics are:
= (1¬ �)
8<
:
2
4X
=1
(� ¬ ) +
3
5 +X
=1
�
9=
;+ �� + �
¬
(16)where denotes the investor�s nominal wealth and
is the portfolio share invested in country equities. The reader can recognize in the �rst curly bracket the portfolio return, and in the second bracketthe return on human capital.We denote by ( ) the maximum value of the instantaneous expected utility subject to the wealth
accumulation constraint, obtained by solving the problem with the Bellman principle. We also denote by �
� = ¬
30Adler and Dumas (1983) provide details on the maximization problem in presence of a price index instead of a set ofcommodity prices.31Campbell (1996) - among others - imposes this assumption, ensuring that income distribution between factor of production
is constant.
23

the common investor�s relative risk aversion coe¢ cient where and are, respectively, the �rst andsecond partial derivative of () with respect to .>From the solution of the problem, the nominal risk premium on equity index is:
� ¬ =���(1¬ �)
�+ �
"(1¬ �)
X
=1
� + ��
#(17)
where �� is the covariance between returns on stock index and the in�ation rate in country , � isthe covariance between returns on assets and , and � is the covariance between returns on asset andthe labor income growth in sector in country .The equity portfolio of investor is therefore given by equation (1).We impose the market clearing condition, requiring that the vector of equity supply in the N countries
equals the vector of equity demand.32 When both vectors are expressed as shares, we have:
MS =X
w (18)
where MS is the market portfolio, i.e. the vector of shares of each equity market over total worldcapitalization, and represents the wealth of industry in country as a fraction of total world wealth(accordingly, represents the wealth of country as a fraction of total world wealth). Substituting (1) into(18) we obtain the following equilibrium condition:
MS = ¬1�
1�
(1¬�) (�¬ i) +(1¬ 1� )(1¬�)
P
¬ �(1¬�)
P
��
(19)
Substituting the market clearing condition back into the equity portfolio we can rewrite the �nal equilib-rium portfolio as in equation (2).
32The following condition says that the net supply of bonds is zero and of equities is the capitalization of the relevant equitymarket.
24
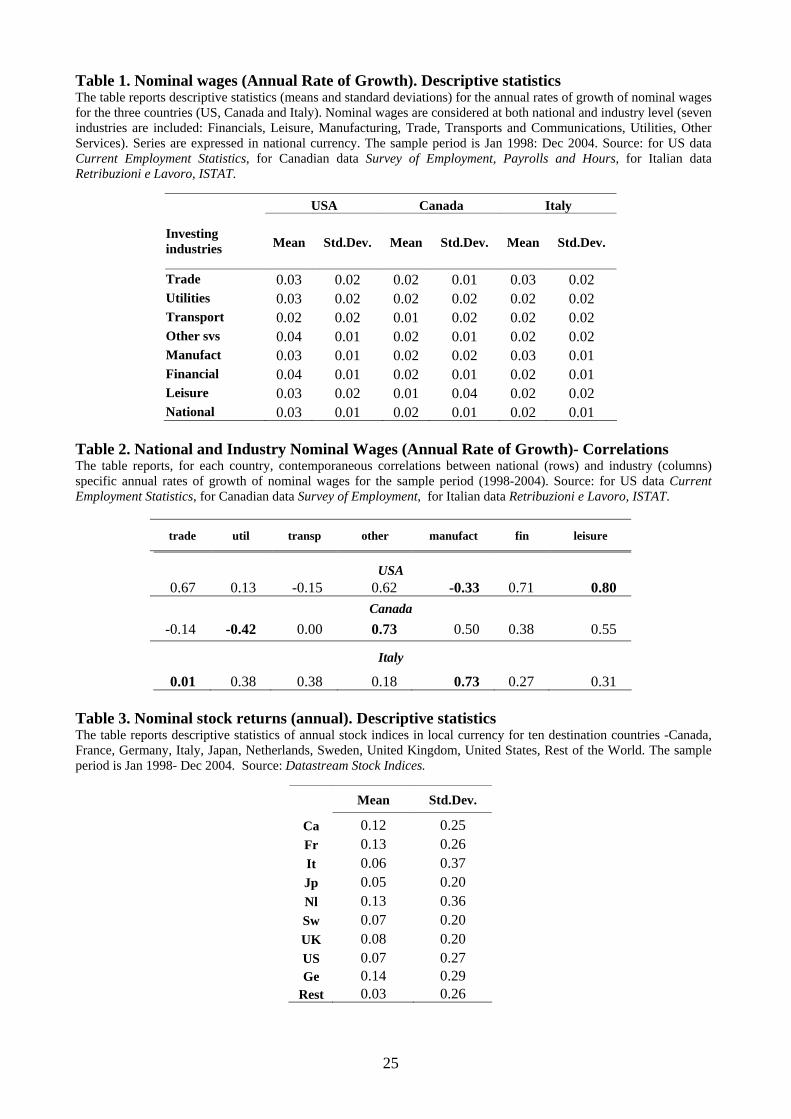
Table 1. Nominal wages (Annual Rate of Growth). Descriptive statistics The table reports descriptive statistics (means and standard deviations) for the annual rates of growth of nominal wages for the three countries (US, Canada and Italy). Nominal wages are considered at both national and industry level (seven industries are included: Financials, Leisure, Manufacturing, Trade, Transports and Communications, Utilities, Other Services). Series are expressed in national currency. The sample period is Jan 1998: Dec 2004. Source: for US data Current Employment Statistics, for Canadian data Survey of Employment, Payrolls and Hours, for Italian data Retribuzioni e Lavoro, ISTAT.
USA Canada Italy
Mean Std.Dev. Mean Std.Dev. Mean Std.Dev. Investing industries
Trade 0.03 0.02 0.02 0.01 0.03 0.02 Utilities 0.03 0.02 0.02 0.02 0.02 0.02 Transport 0.02 0.02 0.01 0.02 0.02 0.02 Other svs 0.04 0.01 0.02 0.01 0.02 0.02 Manufact 0.03 0.01 0.02 0.02 0.03 0.01 Financial 0.04 0.01 0.02 0.01 0.02 0.01 Leisure 0.03 0.02 0.01 0.04 0.02 0.02 National 0.03 0.01 0.02 0.01 0.02 0.01
Table 2. National and Industry Nominal Wages (Annual Rate of Growth)- Correlations The table reports, for each country, contemporaneous correlations between national (rows) and industry (columns) specific annual rates of growth of nominal wages for the sample period (1998-2004). Source: for US data Current Employment Statistics, for Canadian data Survey of Employment, for Italian data Retribuzioni e Lavoro, ISTAT.
trade util transp other manufact fin leisure
USA 0.67 0.13 -0.15 0.62 -0.33 0.71 0.80
Canada
-0.14 -0.42 0.00 0.73 0.50 0.38 0.55
Italy
0.01 0.38 0.38 0.18 0.73 0.27 0.31 Table 3. Nominal stock returns (annual). Descriptive statistics The table reports descriptive statistics of annual stock indices in local currency for ten destination countries -Canada, France, Germany, Italy, Japan, Netherlands, Sweden, United Kingdom, United States, Rest of the World. The sample period is Jan 1998- Dec 2004. Source: Datastream Stock Indices.
Mean Std.Dev.
Ca 0.12 0.25 Fr 0.13 0.26 It 0.06 0.37 Jp 0.05 0.20 Nl 0.13 0.36 Sw 0.07 0.20 UK 0.08 0.20 US 0.07 0.27 Ge 0.14 0.29
Rest 0.03 0.26
25

Table 4. Optimal portfolios for US workers The table reports optimal equity portfolio shares in 10 equity indexes (rows) for a US investor working in one of seven industries (columns). The last row in each portfolio represents the share invested in risk free assets. In each panel, the first seven columns report the optimal equity portfolio suitable to hedge both the national inflation risk and the industry-specific labor income risk while the eighth column reports the optimal equity portfolio suitable to hedge the national inflation risk and the national average labor income risk. The last column reports, for comparison, the market share for each destination country: this is the efficient in absence of background risk. The table reports the optimal equity portfolio composition derived considering only significant coefficients (at 10% confidence level).
USA
National
trade util transp other manuf fin leis unrestr restr market share
Ca 0.24 0.30 0.14 0.08 0.04 0.13 0.25 0.12 0.15 0.03 Fr 0.17 0.17 0.17 -0.05 0.29 0.17 0.17 0.14 0.04 0.05 It -0.02 -0.02 -0.02 0.16 -0.10 0.10 0.11 0.06 0.09 0.02 Jp 0.11 0.19 0.11 0.18 0.05 0.11 0.11 0.12 0.16 0.11 Nl 0.02 0.02 0.36 0.02 -0.17 -0.24 0.02 -0.10 0.02 0.02 Sw -0.10 -0.33 0.09 -0.05 0.08 -0.08 -0.13 -0.05 -0.05 0.01 UK 0.09 -0.15 0.09 0.09 0.16 0.09 -0.08 0.09 0.09 0.09 US 0.30 0.38 0.38 0.32 0.50 0.30 0.28 0.34 0.32 0.42 Ge 0.09 0.30 -0.27 0.09 -0.12 -0.04 0.09 -0.01 0.04 0.04
Rest 0.22 0.12 0.10 0.22 0.22 0.28 0.22 0.24 0.22 0.22 T-bill -0.09 0.02 -0.15 -0.06 0.05 0.17 -0.05 0.04 -0.07 -
Table 5. Optimal portfolios for Canadian workers This table reports the optimal equity portfolios shares invested in 10 equity indexes (rows) by a Canadian investor working in one of the seven industries (columns). Otherwise the table mirrors Table 4.
Canada
national
trade util transp other manuf fin leis unrestr restr market share
Ca 0.14 0.24 0.21 0.10 0.16 0.00 0.10 0.11 0.10 0.03 Fr 0.05 0.05 0.05 0.05 0.24 0.05 -0.54 0.05 0.05 0.05 It 0.18 0.18 0.18 0.28 0.06 0.18 1.06 0.24 0.18 0.02 Jp 0.20 0.20 0.20 0.20 0.20 0.20 0.42 0.21 0.20 0.11 Nl 0.20 0.02 -0.20 -0.19 0.02 0.02 -0.76 -0.08 0.02 0.02 Sw -0.09 -0.09 -0.09 -0.09 -0.09 0.07 -0.29 -0.08 -0.09 0.01 UK -0.04 0.09 0.24 -0.04 0.09 0.29 0.09 0.06 0.09 0.09 US 0.33 0.09 0.33 0.56 0.33 0.33 0.33 0.41 0.39 0.42 Ge 0.11 0.31 0.11 0.11 0.11 0.11 0.49 0.14 0.11 0.04
Rest 0.22 0.22 0.22 0.22 0.22 0.22 0.40 0.23 0.22 0.22 T-bill -0.31 -0.30 -0.24 -0.19 -0.34 -0.47 -0.31 -0.29 -0.26 -
26

Table 6. Optimal portfolios for Italian workers This table reports the optimal portfolio shares in 10 equity indexes (rows) by an Italian investor working in one of the seven industries (columns). Otherwise the table mirrors Tables 4 and 5.
Italy
national
trade util transp other manuf fin leis unrestr restr market share
Ca 0.03 0.20 0.20 0.03 0.12 0.03 0.21 0.09 0.09 0.03 Fr 0.05 0.05 0.05 0.05 0.05 0.26 0.05 0.03 0.05 0.05 It 0.02 -0.17 0.02 0.02 0.02 -0.18 0.02 -0.07 0.02 0.02 Jp 0.11 0.11 0.11 0.11 0.11 0.11 0.11 0.11 0.11 0.11 Nl -0.07 -0.07 -0.07 -0.07 -0.07 -0.07 -0.07 -0.07 -0.07 0.02 Sw 0.01 0.01 0.01 0.01 0.01 0.01 0.01 -0.02 0.01 0.01 UK 0.09 0.09 -0.17 0.09 0.09 0.30 -0.19 0.20 0.09 0.09 US 0.42 0.42 0.42 0.51 0.42 0.56 0.42 0.51 0.49 0.42 Ge 0.12 0.12 0.25 0.12 0.12 -0.05 0.12 0.05 0.12 0.04
Rest 0.22 0.06 0.11 0.22 0.13 0.14 0.09 0.17 0.17 0.22 T-bill 0.00 0.18 0.08 -0.08 0.00 -0.10 0.22 0.00 -0.07 -
Table 7a. Hedging components by US investing industries This table reports, for each US investing industry, the labor and inflation hedging components. Columns 1 – 7 report the labor income hedging component at industry level. Column 8 reports the labor hedging component in the unrestricted national portfolio. Column 9 reports the inflation hedging component which is common to all industries. In the last column the total (labor plus inflation) hedging component for the national unrestricted portfolio is reported. The table considers portfolios where only statistically significant coefficients (at 10% confidence level) are considered. Minimum and maximum figures are in bold face (only values deriving from significant coefficients are considered).
USA
Labor Hedge Infl
Hedge Tot
Hedge
trade util transp other manuf fin leis nat. unrestr.
Ca 0.16 0.22 0.07 - -0.04 0.06 0.18 0.05 0.05 0.09 Fr - - - -0.22 0.12 - - -0.03 0.12 0.09 It - - - 0.18 -0.08 0.12 0.13 0.08 -0.05 0.04 Jp - 0.08 - 0.07 -0.06 - - 0.01 - 0.01 Nl - - 0.35 - -0.19 -0.26 - -0.12 - -0.12 Sw -0.12 -0.34 0.08 -0.06 0.07 -0.09 -0.14 -0.06 - -0.06 UK - -0.24 - - 0.08 - -0.17 0.01 - 0.01 US -0.09 - - -0.06 0.12 -0.08 -0.10 -0.04 -0.04 -0.08 Ge 0.13 0.34 -0.23 0.13 -0.08 - 0.13 0.03 -0.08 -0.04
Rest - -0.10 -0.12 - - 0.07 - 0.02 - 0.02
27
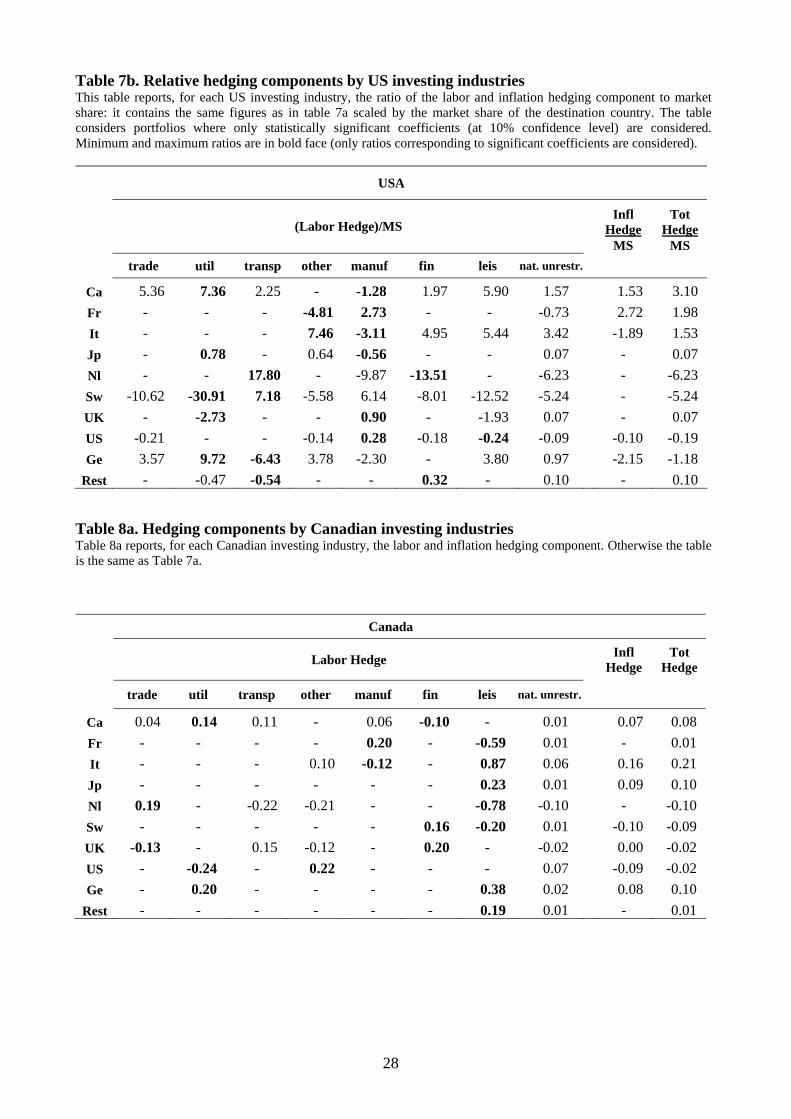
Table 7b. Relative hedging components by US investing industries This table reports, for each US investing industry, the ratio of the labor and inflation hedging component to market share: it contains the same figures as in table 7a scaled by the market share of the destination country. The table considers portfolios where only statistically significant coefficients (at 10% confidence level) are considered. Minimum and maximum ratios are in bold face (only ratios corresponding to significant coefficients are considered).
USA
Infl
HedgeTot
Hedge
(Labor Hedge)/MS MS MS
trade util transp other manuf fin leis nat. unrestr. Ca 5.36 7.36 2.25 - -1.28 1.97 5.90 1.57 1.53 3.10 Fr - - - -4.81 2.73 - - -0.73 2.72 1.98 It - - - 7.46 -3.11 4.95 5.44 3.42 -1.89 1.53 Jp - 0.78 - 0.64 -0.56 - - 0.07 - 0.07 Nl - - 17.80 - -9.87 -13.51 - -6.23 - -6.23 Sw -10.62 -30.91 7.18 -5.58 6.14 -8.01 -12.52 -5.24 - -5.24 UK - -2.73 - - 0.90 - -1.93 0.07 - 0.07 US -0.21 - - -0.14 0.28 -0.18 -0.24 -0.09 -0.10 -0.19 Ge 3.57 9.72 -6.43 3.78 -2.30 - 3.80 0.97 -2.15 -1.18
Rest - -0.47 -0.54 - - 0.32 - 0.10 - 0.10
Table 8a. Hedging components by Canadian investing industries Table 8a reports, for each Canadian investing industry, the labor and inflation hedging component. Otherwise the table is the same as Table 7a.
Canada
Labor Hedge Infl
Hedge Tot
Hedge
trade util transp other manuf fin leis nat. unrestr.
Ca 0.04 0.14 0.11 - 0.06 -0.10 - 0.01 0.07 0.08 Fr - - - - 0.20 - -0.59 0.01 - 0.01 It - - - 0.10 -0.12 - 0.87 0.06 0.16 0.21 Jp - - - - - - 0.23 0.01 0.09 0.10 Nl 0.19 - -0.22 -0.21 - - -0.78 -0.10 - -0.10 Sw - - - - - 0.16 -0.20 0.01 -0.10 -0.09 UK -0.13 - 0.15 -0.12 - 0.20 - -0.02 0.00 -0.02 US - -0.24 - 0.22 - - - 0.07 -0.09 -0.02 Ge - 0.20 - - - - 0.38 0.02 0.08 0.10
Rest - - - - - - 0.19 0.01 - 0.01
28

Table 8b. Relative hedging components by Canadian investing industries Table 8b reports, for each Canadian investing industry, the ratio of the labor and inflation hedging component to market share: it contains the same figures as in table 8a but scaled by the market share of the destination country. Otherwise the table is the same as Table 7b.
Canada
Infl
HedgeTot
Hedge
(Labor Hedge)/MS MS MS
trade util transp other manuf fin leis nat. unrestr. Ca 1.40 4.54 3.71 - 1.93 -3.28 - 0.45 2.38 2.82 Fr - - - - 4.32 - -12.96 0.20 - 0.20 It - - - 4.04 -4.84 - 35.42 2.28 6.42 8.70 Jp - - - - - - 2.10 0.11 0.80 0.92 Nl 9.54 - -11.45 -10.95 - - -39.97 -4.98 - -4.98 Sw - - - - - 15.05 -18.20 1.27 -9.22 -7.95 UK -1.46 - 1.75 -1.43 - 2.31 - -0.28 - -0.28 US - -0.57 - 0.53 - - - 0.17 -0.21 -0.04 Ge - 5.56 - - - - 10.67 0.65 2.23 2.88
Rest - - - - - - 0.86 0.05 - 0.05
Table 9a. Hedging components by Italian investing industries Table 9a reports, for each Italian investing industry, the labor and inflation hedging component. Otherwise the table is the same as Tables 7a and 8a.
Italy
Labor Hedge Infl
Hedge Tot
Hedge
trade util transp other manuf fin leis nat. unrestr.
Ca - 0.17 0.17 - 0.09 - 0.18 0.05 - 0.05Fr - - - - - 0.21 - 0.04 - 0.04It - -0.19 - - - -0.20 - -0.04 - -0.04Jp - - - - - - - - - - Nl - - - - - - - - -0.09 -0.09 Sw - - - - - - - - - - UK - - -0.26 - - 0.21 -0.27 - - - US - - - 0.08 - 0.13 - 0.05 - 0.05 Ge - - 0.13 - - -0.18 - -0.02 0.09 0.07
Rest - -0.16 -0.11 - -0.08 -0.08 -0.13 -0.05 - -0.05
29

Table 9b. Relative hedging components by Italian investing industries Table 9b reports, for each Italian investing industry, the ratio of the labor and inflation hedging component to market share: it contains the same figures as in table 9a but scaled by the market share of the destination country. Otherwise the table is the same as Table 7b and 8b.
Italy
Infl
HedgeTot
Hedge
(Labor Hedge)/MS MS MS
trade util transp other manuf fin leis nat. unrestr. Ca - 5.66 5.50 - 2.99 - 6.05 1.51 - 1.51 Fr - - - - - 4.72 - 0.81 - 0.81 It - -7.87 - - - -8.29 - -1.51 - -1.51 Jp - - - - - - - - - - Nl - - - - - - - - -4.73 -4.73 Sw - - - - - - - - - - UK - - -3.00 - - 2.48 -3.16 0.05 - 0.05 US - - - 0.20 - 0.32 - 0.11 - 0.11 Ge - - 3.59 - - -4.94 - -0.59 2.49 1.90
Rest - -0.72 -0.50 - -0.39 -0.35 -0.59 -0.23 - -0.23
30

Table 10. Size of hedging components: industry vs national restricted The table reports, for each country, the size of hedging components, i.e. the hedging components in absolute value. Panel a) refers to US investing country, panel b) and c) to Canada and Italy, respectively. In columns (1) and (2) we report the size of inflation hedging component common to all industries. In (3) and (4) we report the weighted average of the size of the labor hedging components across all industries. Columns (5) and (6) report the size of the labor hedging component in the national restricted portfolio. In the last column of the table we report, for comparison, the market share of each destination country. The last row in each panel reports the sum of the absolute hedging components across all destination countries. Results are derived for portfolios with all coefficients ((1), (3), (5)) and for those with only significant coefficients ((2), (4), (6)).
a) USA
Infl Hedge Abs Labor Hedge industry
wgt av Abs Labor Hedge national
restr. all coeffs sign. coeffs all coeffs sign. coeffs all coeffs sign. coeffs market share
(1) (2) (3) (4) (5) (6) Ca 0.05 0.05 0.06 0.06 0.08 0.08 0.03 Fr 0.12 0.12 0.09 0.07 0.13 0.13 0.05 It 0.05 0.05 0.11 0.11 0.11 0.11 0.02 Jp 0.01 - 0.04 0.03 0.05 0.05 0.11 Nl 0.02 - 0.17 0.15 0.03 - 0.02 Sw 0.02 - 0.08 0.08 0.06 0.06 0.01 UK 0.02 - 0.07 0.02 0.06 - 0.09 US 0.04 0.04 0.08 0.08 0.07 0.07 0.42 Ge 0.08 0.08 0.10 0.08 0.09 0.09 0.04 Rest 0.02 - 0.05 0.03 0.00 - 0.22 sum hedge 0.42 0.33 0.84 0.71 0.67 0.58
b) Canada
Ca 0.07 0.07 0.06 0.04 0.01 - 0.03 Fr 0.07 - 0.10 0.07 0.01 - 0.05 It 0.16 0.16 0.12 0.11 0.00 - 0.02 Jp 0.09 0.09 0.04 0.01 0.01 - 0.11 Nl 0.10 - 0.17 0.16 0.05 - 0.02 Sw 0.10 0.10 0.05 0.04 0.01 - 0.01 UK 0.08 - 0.13 0.10 0.00 - 0.09 US 0.09 0.09 0.11 0.08 0.06 0.06 0.42 Ge 0.08 0.08 0.07 0.02 0.03 - 0.04 Rest 0.00 - 0.03 0.01 0.00 - 0.22 sum hedge 0.85 0.59 0.88 0.64 0.19 0.06
c) Italy
Ca 0.02 - 0.05 0.05 0.03 0.06 0.03 Fr 0.04 - 0.09 0.04 0.14 - 0.05 It 0.01 - 0.08 0.04 0.05 - 0.02 Jp 0.01 - 0.04 - 0.06 - 0.11 Nl 0.09 0.09 0.04 - 0.09 - 0.02 Sw 0.01 - 0.04 - 0.08 - 0.01 UK 0.03 - 0.15 0.07 0.13 - 0.09 US 0.02 - 0.07 0.05 0.10 0.06 0.42 Ge 0.09 0.09 0.11 0.04 0.05 - 0.04 Rest 0.01 - 0.06 0.05 0.02 0.05 0.22 sum hedge 0.33 0.18 0.74 0.32 0.75 0.17
31

Table 11. Absolute distance industry-national The table reports for each optimal portfolio weight at industry level the absolute distance from the optimal corresponding weight at national level. Here only significant differences are considered (Wald test at 10% confidence level). The optimal portfolio hedging the national labor income risk (national restricted ptf) is reported in the last column, while columns from 1 to 7 show the distance of each optimal industry portfolio weight from the corresponding weight in the national restricted ptf. Panel a) refers to US investing industries, panel b) and c) to Canadian and Italian industries, respectively.
a) USA
trade util transp other manufact fin leisure national restricted
Ca 0.08 - - 0.07 0.11 - 0.10 0.15 Fr 0.09 0.19 0.18 0.09 0.26 0.14 - 0.04 It 0.13 - 0.17 0.07 0.19 - - 0.09 Jp 0.05 0.03 - - 0.11 - - 0.15 Nl - - 0.37 - - 0.23 - 0.02 Sw 0.06 - 0.14 - 0.13 - 0.08 -0.07 UK 0.11 0.18 - - 0.14 0.13 0.11 0.05 US - - - - 0.18 - - 0.32 Ge - 0.26 0.31 0.05 0.17 - - 0.04
Rest - 0.10 0.12 0.04 - 0.07 - 0.20 b) Canada
trade util transp other manufact fin leisure national
restricted Ca 0.05 0.15 0.12 - 0.07 0.09 - 0.09 Fr - - - - 0.19 - 0.60 -0.02 It - - - 0.10 0.12 - 0.87 0.19 Jp - - - 0.03 - - 0.24 0.19 Nl 0.24 - - 0.16 - - 0.72 -0.14 Sw - - - - - 0.15 0.21 -0.08 UK 0.13 - 0.15 0.13 - 0.20 - 0.01 US 0.09 0.30 0.12 0.17 - - - 0.39 Ge - 0.23 - - - - 0.41 0.09
Rest - - - - - - 0.18 0.06 c) Italy
trade util transp other manufact fin leisure national restricted
Ca - 0.11 0.10 - 0.03 0.08 0.12 0.11
Fr - - - - - 0.20 - 0.01 It - 0.17 - - - 0.18 - -0.01 Jp - - - - - 0.07 - 0.11 Nl - - - - - - - -0.14 Sw - - - - - 0.07 - -0.03 UK - - 0.25 - 0.09 0.23 0.26 0.11 US - - - - - 0.07 - 0.50 Ge - - 0.11 - 0.08 0.19 - 0.14
Rest - 0.11 0.06 - 0.04 - 0.08 0.04
32

Table 12. Synthetic measures of dispersion (fully hedged) Panels 12.I and 12.II report synthetic measures of dispersion of optimal equity portfolios across investing industries for fully hedged and unhedged positions, respectively. The measures of dispersion are computed around the national restricted portfolio. Reported measures are derived, alternatively, on all distances ((1), (3), (5)) and on significant distances only ((2), (4), (6)). Panel a) reports the standard deviation of industry portfolios (around the national portfolio) while panel b) reports the standard deviation of individual weights in industry portfolios (around individual weights in the national portfolio). Both unweighted and weighted measures are considered (in the weighted measure the weights are computed considering the labor compensation of each investing industry on total labor compensation in each country). The unweighted standard deviation of the S industry portfolios in country l with respect to the restricted national portfolio l is computed as
( )S
jlsl
j
S
s
N
j
PUl
ww∑∑ −=
=
= 11
2
σ
where S is the total number (seven) of industries in country l, N is the total number of destination equity indices (ten),
wjsl
is the optimal weight of equity index j in the portfolio of industry s in country l, wjl is the optimal weight of
equity index j in the restricted national portfolio of country l. The weighted standard deviation of the S industry portfolios in country l with respect to the restricted national portfolio l is computed as
( )∑∑ −=
==
S
s
N
jPWl
jlsl
jsl ww
11
2νσ
where slν here is the relative weight of industry s in country l, measured by the total labor income compensation paid in industry s relative to the total labor income compensation in country l. The unweighted and weighted standard deviations of the S industry portfolio weights in country l with respect to the weights in restricted national portfolio l are computed, respectively, as
( )NPU
l
wUl
2σσ = and ( )
NPW
l
wWl
2σσ =
I. Fully hedged
United States Canada Italy
all dist. sign. dist. all dist. sign. dist. all dist. sign. dist. (1) (2) (3) (4) (5) (6)
a) portfolios
weighted sd 0.33 0.32 0.44 0.42 0.29 0.22 unweighted sd 0.39 0.36 0.62 0.56 0.32 0.25 b) weights
weighted sd 0.10 0.10 0.14 0.13 0.09 0.07 unweighted sd 0.12 0.11 0.19 0.19 0.10 0.08
II. Unhedged
United States Canada Italy
all dist. sign. dist. all dist. sign. dist. all dist. sign. dist. (1) (2) (3) (4) (5) (6)
a) portfolios
weighted sd 0.33 0.32 0.43 0.40 0.31 0.25 unweighted sd 0.39 0.37 0.59 0.53 0.33 0.28 b) weights
weighted sd 0.11 0.10 0.13 0.13 0.10 0.08 unweighted sd 0.12 0.14 0.19 0.17 0.10 0.09
33

Table 13. Home bias Table 13 compares our results on home bias for the three investing countries with findings in Baxter and Jermann (1997), Bottazzi et al. (1996) and Coen (2001). The first two columns report the actual position invested in domestic equities together with their market share (in parenthesis). Column (3) to (9) report the home bias measured as the actual position minus the optimal positions in domestic equities. In columns (6) and (7) the home bias measure is computed with respect to the optimal equity portfolios derived in the paper (in which we retain all nominal variable expressed in local currency), while in columns (8) and (9) report the home bias is measured with respect to optimal equity portfolios computed (but not reported here) considering all nominal variables expressed in the currency of the investing country (i.e. exchange rate positions are unhedged).
Actual % Invested in domestic equities (MS) Home bias
Baxter-
Jermann* Bottazzi et al.** Coen** Our Paper - National portfolio***
Fully-Hedged Unhedged
1994 2003*
restr unrestr restr unrestr
(1) (2) (3) (4) (5) (6) (7) (8) (9)
Canada 0.72 (0.03) 0.70 (0.03) -1.12 0.70 0.62 0.61 0.62 0.64 Italy 0.85 (0.05) 0.58 (0.02) 1.20 0.83 0.56 0.59 1.30 1.30 US 0.92 (0.48) 0.86 (0.42) 1.04 0.25 0.51 0.56 0.50 0.46 0.41 * Actual positions are those at the end of year 2003, while market shares are evaluated at the end of year 2004 (source Sorensen et al., 2007). ** The home bias is computed using data on actual positions and market shares at the end of 1994. *** The home bias is computed using data on actual positions at the end of 2003.
34
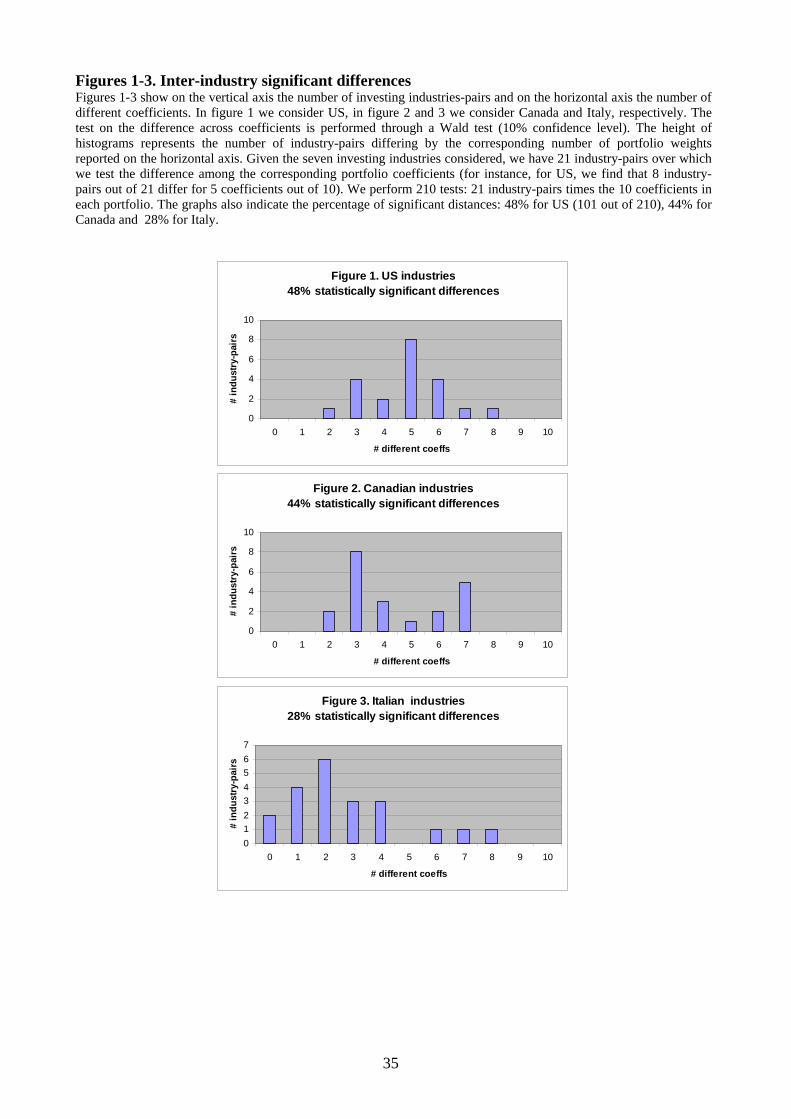
Figures 1-3. Inter-industry significant differences Figures 1-3 show on the vertical axis the number of investing industries-pairs and on the horizontal axis the number of different coefficients. In figure 1 we consider US, in figure 2 and 3 we consider Canada and Italy, respectively. The test on the difference across coefficients is performed through a Wald test (10% confidence level). The height of histograms represents the number of industry-pairs differing by the corresponding number of portfolio weights reported on the horizontal axis. Given the seven investing industries considered, we have 21 industry-pairs over which we test the difference among the corresponding portfolio coefficients (for instance, for US, we find that 8 industry-pairs out of 21 differ for 5 coefficients out of 10). We perform 210 tests: 21 industry-pairs times the 10 coefficients in each portfolio. The graphs also indicate the percentage of significant distances: 48% for US (101 out of 210), 44% for Canada and 28% for Italy.
Figure 1. US industries 48% statistically significant differences
0
2
4
6
8
10
0 1 2 3 4 5 6 7 8 9 10
# different coeffs
# in
dust
ry-p
airs
Figure 2. Canadian industries
44% statistically significant differences
0
2
4
6
8
10
0 1 2 3 4 5 6 7 8 9 10
# different coeffs
# in
dust
ry-p
airs
Figure 3. Italian industries
28% statistically significant differences
01234567
0 1 2 3 4 5 6 7 8 9 10
# different coeffs
# in
dust
ry-p
airs
35