Crop Diversification, Dietary Diversity and Agricultural Income
28
1 Crop Diversification, Dietary Diversity and Agricultural Income: Empirical Evidence from Eight Developing Countries Lorenzo Pellegrini Luca Tasciotti Erasmus University of Rotterdam – Institute of Social Studies [email protected] ; [email protected] Abstract This study analysis the dilemma food crop specialization/diversification estimating the effects of crops’ diversification through the analysis of a dataset of households’ surveys from eight developing and transition economies. The study answers two research questions concerning the relation between the number of food crops produced by rural households on one side and (i) two measures of dietary diversity and (ii) crop income on the other. Descriptive analysis points out that crop activities are practiced by the vast majority of rural households despite agriculture’s role appears to be more limited In terms of income generation. The highest share of agricultural land is devoted to produce staple food; high values commodities, such as fruits and vegetables, although limited, are still produced. Both descriptive statistics and regression results show a positive correlation between the number of crops produced, the two indicators of dietary diversity and household crop income, even after controlling for variables related to the household characteristics. Keywords: D13, O12, O57, Q12.
-
Upload
khangminh22 -
Category
Documents
-
view
0 -
download
0
Transcript of Crop Diversification, Dietary Diversity and Agricultural Income

1
Crop Diversification, Dietary Diversity and Agricultural Income:
Empirical Evidence from Eight Developing Countries
Lorenzo Pellegrini
Luca Tasciotti
Erasmus University of Rotterdam – Institute of Social Studies
[email protected] ; [email protected]
Abstract
This study analysis the dilemma food crop specialization/diversification estimating the
effects of crops’ diversification through the analysis of a dataset of households’ surveys from
eight developing and transition economies. The study answers two research questions
concerning the relation between the number of food crops produced by rural households on
one side and (i) two measures of dietary diversity and (ii) crop income on the other.
Descriptive analysis points out that crop activities are practiced by the vast majority of rural
households despite agriculture’s role appears to be more limited In terms of income
generation. The highest share of agricultural land is devoted to produce staple food; high
values commodities, such as fruits and vegetables, although limited, are still produced.
Both descriptive statistics and regression results show a positive correlation between the
number of crops produced, the two indicators of dietary diversity and household crop
income, even after controlling for variables related to the household characteristics.
Keywords: D13, O12, O57, Q12.

2
1. Introduction
The diversification of agricultural activities for households living in developing and transition
economies has a clear intuitive appeal: it is a form of risk spreading and allows overcoming
credit market failures and internal/external shocks, which ultimately allow households to
smooth their consumption (Ellis, 2000). In fact, the encompassing issue of income
diversification has become prominent in development studies (Carney, 1998).
Crop diversification can be used as a tool to increase farm income, generate employment,
alleviate poverty, conserve soil and water resources and is reckoned as an important
strategy to overcome many of the emergencies faced by developing countries (Joshi et al.,
2004). Low income households in developing countries are the ones whose farms are
marked by the lack of crop diversification combined with production for self-consumption.
Furthermore, due to very high transportation costs and to the remoteness of the villages
they live in, some rural dwellers are forced to rely on their agricultural production or on the
locally produced crops to satisfy their nutritional needs. Currently, rural households’ diet too
often lacks basic micronutrients with the potential consequence of increasing susceptibility
to infection and diseases in the short run and major cognitive impairment in the long run
(Eckhardt, 2006). The majority of the studies focussing on the dilemma between
specialization and diversification in crop activities have been directed towards the
theoretical analysis of the problem (Alderman and Paxson, 1992; Reardon et al., 1998;
Reardon 2000; Barrett et al. 2001) without an empirical analysis quantifying the effects of
one or the other strategy. Few empirical studies have estimated the impact crop
diversification has on indicators regarding households’ nutrition (Chand, 1996; Johnson,

3
1992; Pingali and Rosegrant, 1995; Senaka Arachchi, 1998; Webb and Von Braun, 1994; Von
Braun, 1995; Ryan and Spencer, 2001).
Our study measures the effects that crops diversification, here identified by the number of
food crops produced by rural households, has on two indicators of household’s dietary
diversity and on the amount of crop income.1 The current study is the first employing
representative national surveys from eight developing and transition economics, to assess
the magnitude of the effects that crops diversification on households’ welfare, taking into
account two different but related perspectives. On one hand, we analyse the impact crops
diversification has on crop income; on the other, we quantify the magnitude of the positive
link between crops diversification and two indicators of dietary diversity. The analysis is
based on households level data from countries located in different areas of the globe. The
robustness of the results presented is underscored by the fact that, despite the
geographical, political and agricultural differences among the countries analysed, the results
at the global level and at the individual country level go in the same direction.
Cross-country analyses like the one presented here are notoriously problematic. Variables in
diverse surveys are typically measured and aggregated differently over time and space,
which makes it difficult to discern consistent relationships and leads to fragile conclusions. In
the recent years, the Food and Agriculture Organization (FAO) of United Nations has
compiled the Rural Income Generating Activities (RIGA) database, a selection of Living
Standards Measurement Studies and similar multi-purpose household surveys that are
1 We acknowledge the
fact that the Simpson or the Herfindahl indicators would have also been useful measures of crop
diversification. Unfortunately, the construction of those indicators is not feasible as the majority of the surveys we use do
not provide us with an appropriate set of variables (i.e. the indication of the land size devoted to that crop; data on the
agricultural yield have not been collected consistently in all surveys).
4
nationally representative and present high degrees of comparability in codification and
nomenclatures.2 Cross-country studies based on the RIGA database have shown that
patterns, regularities and common features constantly emerge, even when conducted in
different agro-ecological, institutional and socio-economic conditions (e.g. Davis et al., 2010;
Winters et al., 2010; Pica-Ciamarra et al., 2011; Zezza et al., 2011; 2009; Zezza and Tasciotti,
2010). The objective of this study is not to compare the results from the eight countries; we
would like to assess whether, even with all these cross-country and cross-household
differences, a clear general pattern emerges and whether this pattern is consistent in all the
countries considered.
The paper is structured as follows. The next section deals with the importance of crops
diversification from a nutritional point of view, the dilemma between specialization and
diversification and the impact crops diversification is considered to have on nutrition. A
description of the data used for the analysis and a brief quantification of the correlation
between crops diversification on one side, nutritional diversity and crop income on the other
is illustrated in the section ‘Cross country evidence’. In the section ‘Empirical model and
results’, the methodology used and the main results of the multivariate analysis are
explained. Key findings and policy implications are discussed in the final section.
2. The role of crops diversification
2.1. The relevance of crops diversity: nutrition, health and cognitive development
2 The RIGA data and their full documentation are available at www.fao.org/es/ESA/riga/. The RIGA project involved 19
countries in total. However, not all countries have the data necessary to run the analysis as we did in the paper. The 8
countries included in our study is the maximum number of countries for which the analysis could have been done, in other
words data availability has driven the choice of the set of countries included.
5
Overall, in the last decades considerable progress has been recorded in terms of hunger
reduction. The proportion of the world’s people living in developing countries who are still
under nourished declined from about 25 percent in 1970 to about 16 percent in 2005.
Nevertheless, that still means that some 800 million people in developing countries remain
chronically underfed (FAO, 2009). Furthermore, eradicating hunger is not enough to ensure
good health since the latter requires –among other things–a balanced and diverse diet.
Having increased the production of cheap cereal foods, especially after the food price
increase of the biennium 2007-2008 (Von Braun, 2008), has coincided with a reduction of
agricultural diversity which has ultimately lead to a decrease in the dietary diversity. For
example, the increased availability of staples followed by an increase in the cereal and cereal
products intakes occurred in some developing countries have been linked to a decrease in
the intakes of iron and has led to a greater incidence of iron deficiency anaemia observed in
the Sub-Saharan countries (Frison et al, 2004).
Although many institutions appear optimistic with respect to the hunger problem,
malnutrition still represents a pressing challenge. In 2008 the Copenhagen Business School
asked eight eminent economists to imagine they had $75 billion to spend on topics that
would help the world. Almost everyone agreed to invest more on nutrition: vitamin
supplements for children, zinc and iodine nutrients as out of the total amount of 40
nutrients people normally need, four are chronically lacking in developing countries (The
Economist, 2011). It is becoming increasingly recognized that a diet rich in energy (i.e.
kilocalories) but lacking other essential components can lead to a number of diseases such
as heart problems, diabetes, cancer and obesity (Frison et al. 2004). These conditions are no
longer associated only with affluence as they are increasingly present among poorer people
in developing countries.
6
Micronutrient deficiency, caused by cereal based diets, may impair cognitive development
and lower resistance to disease in children and adults (UNICEF/Micronutrient Initiative,
2004). It increases the risk of morbidity and mortality of both mothers and infants during
childbirth and, in addition, impairs the physical ability and economic productivity of adults.
The costs of these deficiencies in terms of reduced quality of life are enormous, not to
mention the economic costs for the society (Shetty, 2009).
A study of more than 40,000 women living in the US showed that those who consumed a
greater number of different types of foods had a lower risk of mortality (Kant et al., 2000). A
study on a sample of Italian households demonstrated the link between greater dietary
diversity, high consumption of fruits and vegetables, and reduced incidence of stomach
cancer (La Vecchia et al., 1997).
Analysis of Kenyan households’ nutrition has been demonstrated that diversity in the diet
has clear beneficial effects on the physical and cognitive growth of young children up to 3
years old (Onyango et al., 1998). Another study pointed out that in Mali there is a strong
correlation between consumption of fruits and vegetables and both nutritional adequacy
and consumption of specific nutrients such as vitamins A and C (Hatløy et al., 1998). On the
same line, researches on Tehranian women showed the positive relationship between a
variety of different food groups and nutrient adequacy (Mirmira et al, 2006) and on women
in reproductive age living in Burkina Faso, Mali, Mozambique, Bangladesh and the
Philippines (Arimond et al., 2010).
2.2. Why diversifying agricultural activities

7
Sixty years have passed since Heady in 1952 proposed the diversification concept in
agricultural activities as a mean of handling uncertainty. One of the most important
objective of diversification in agricultural activities is to decrease the overall production risk
by selecting a mix of crops whose productivity has a low or negative correlation and whose
nutritional values are important for the household’s diet. Crop diversification strategies have
been pursued worldwide as a way to improve household income in less-developed countries
(Papademetriou and Dent, 2001). The rational for diversification strategies is based on the
facts that i) rotating the crops has a beneficial effects for the soil guaranteeing
environmental protection; ii) it potentially reduces pest and diseases; and iii) it increases
food security, by offering farmers access to sufficient, nutritious and diversified food in areas
where markets are not available (Caviglia-Harris and Sills, 2005; Kurosaki, 2003; Matson et
al. 1997; Yao, 1997). Furthermore, crop diversification has gained renewed interest due to
the liberalization of agricultural policies and the globalization of agricultural markets. State
interventions in the recent past have moderated domestic prices fluctuations. Nowadays, as
domestic prices follow international prices more closely, farmers are forced to cope with the
implications of larger fluctuations in commodity prices (Weiss and Briglauer, 2000).
Relying on food imports to satisfy domestic nutritional needs promotes food insecurity by
subjecting developing countries to the fluctuations of the world market prices. Lastly, in
remote areas where physical access to markets is costly or markets are not available,
households diversify their crop production patterns to satisfy their own consumption needs
(Omamo, 1998).
Despite the fact that diversification plays an important role in agriculture, there are few
studies that explicitly relate crop income with farm / crop diversification. Many of the
available quantitative studies are confined to farms located in the U.S. and focus on the

8
trade-off between diversification and farm size (Pope and Prescott, 1980; Sun et al. 1995;
Weiss and Briglauer, 2000; White and Irwin, 1972).
In the next section, we provide the first empirical analysis –based on a large dataset from
developing and transition countries– examining the implications of crop diversification at
crop income and dietary diversity level.
3. Cross country evidence
In this section we measure the crops diversification phenomena using data from a cross
section of developing countries. This study is fundamentally different from any other study
regarding crops diversification and its effects since we use (i) nationally representative data,
(ii) a comparable definition of agricultural activities, and (iii) a comparative international
perspective. In what follows, just rural households have been considered. The data used in
the following analysis come from the Rural Income generating Activities (RIGA) project,
which had built a database constructed from a pool of several Living Standards
Measurement Surveys (LSMS) and similarly constructed surveys, made available by the
World Bank and other national and international institutions. Survey data from the following
countries are used in what follows (the year of the survey in parentheses): Albania (2005),
Indonesia (2000), Malawi (2004), Nepal (2003), Nicaragua (2001), Pakistan (2001), Panama
(2003), and Vietnam (1998).3 This list includes different geographic areas and countries in
different stages of development.
3 The RIGA project analyzed data from 19 countries located in 4 continents. However, not all the 19 countries for which
‘general data’ are available do have the data necessary to run the following analysis. As a result, the 8 countries for which
we bring evidence represent the maximum number of countries for which the analysis could have been done.
9
Agriculture is practiced by the great majority of rural households. This does not surprise at
all since it is well recognised that agricultural activities provide the basic livelihood for the
majority of households living in developing areas.4 Almost all the rural households living in
Malawi, Nepal, Vietnam and Albania are engaged in some sort of food crop production
without any remarkable difference among richer and poorer households. In all the countries
the percentages of rural households engaged in agricultural activities are above the 50
percent threshold with the only exception of households living in Pakistan and richer rural
Indonesian households.
Although the participation rate in agricultural activities is overall high, the percentage of
total income coming from food crop activities does not follow the same pattern being lower
than 30 percent in 6 out of the 8 countries denoting that rural households do diversify their
sources of income and that food crop productivity is not always very high. The participation
rate does not show any particular pattern among rural households in different expenditures
quintiles.
Crops mainly produced by rural dwellers are those for which the country, or the household,
might have a comparative advantage, there are a number of other crops which are
systematically produced (Table 1). The data clearly show that farmers give priority to the
production of those staple crops which are at the base of the local diet. Nevertheless, other
crops, which are not considered basic food for the nutrition but are definitely important for
diversifying the diet, i.e. fruits and vegetables, appear to be present in the agricultural
rotation as well. The degree of crops diversification varies from country to country, with
4 By agricultural activities we mean activities related to the harvesting of food crops. In what follows, cash crops (e.g. coffee,
mustard, sugar cane, etc…) have been excluded from the analysis.

10
Vietnam appearing on one side, highly specialized on rice production, and Albania at the
other side of the spectrum with a very high degree of diversification.
[Table 1 about here]
Notwithstanding variation across countries, clearly in the majority of the countries rural
households tend to rotate among a limited number of crops: the combination among two,
three and maximum four agricultural products are the most practised by the households
(Table 2)5. Very few households produce more than 6 different crops for reasons most likely
related to the limited size of the allotment as well as for the intrinsic difficulty of producing
many products (water requirements, necessity of sun exposition and type of land among
others).
[Table 2 about here]
Dietary diversity, or dietary variety, one of the outcome variables of this study, is here
defined as the number of different food (food count indicator in the following text; it is a
simple count of the food consumed by the household) or food groups (food group indicator
in the following text) consumed over a given reference period. Dietary diversity is often used
as a food security proxy in nutrition surveys, and it has been generally found to be closely
correlated to both caloric adequacy (the amount of kilocalories consumed) and
anthropometric outcomes (Ruel, 2006 and Moursi et al, 2008). In developing countries,
single food or food group counts have been the most popular measurement approaches for
dietary diversity.
5 In the analysis which follows, we do take into account all the land used by the households: home garden, agricultural land,
rented / owned land, land used without any specific proprietary right.
11
Summary statistics regarding the food count and the food group indicators are presented in
Table 3. Since surveys in different countries collect data on different number of food, the
food count indicator across countries is not comparable. This indicator ranges between one
and a positive number (the maximum number for each survey is available in the column
‘Maximum value’ in Table 3). The food group indicator ranges between zero and 13 and is
theoretically comparable across countries being based on the methodology developed by
USAID’s FANTA project and adapted by FAO’s nutrition division (FAO, 2007). Both indicators
have been recently used by Zezza and Tasciotti, 2010, in assessing the role urban agriculture
plays for household’s dietary diversity.
[Table 3 about here]
Looking at the food count indicator, it seems that in all the countries here considered there
is a positive relationship between the number of crops produced and the number of food
consumed by rural households (Table 4). What is worth noting is that, within each of the
three land classes6 we divided the rural population in, producing more crops is associated
with an increase in the number of food consumed by the household (t-tests run for each
country for households in each land class prove that the food count indicators reported in
Table 4 are statistically different in 75% of the cases). This result indicates that specializing in
the production of one single crop and then trading the harvest does not increase the
household food count indicator as much as crops diversification does. Within each land class,
the number of food consumed on average by rural household within each land class follows
an inverted ‘U’ shape, meaning that the food count indicator increases until a certain
6 Rural households have been divided in three groups according the land the own; land class ‘0-1’ indicates size of land
owned between 0 and 1 hectare, ‘1-2’ between 1 and 2 hectares, ‘>2’ larger than 2 hectares.
12
threshold and then it drops. After the threshold, diet diversification does not benefit
anymore from further agricultural diversification.
[Table 4 about here]
4. Empirical model and results
As explained in the previous section, crops diversification can have several impacts on the
dietary diversity indicators and on the agricultural income of rural households; in this section
we explore these relationships. We begin by looking at the correlation between crop
diversity and a series of indicators of dietary adequacy and then move to crop diversity and
agricultural income.
The three models take the form of the following equations:
1) Log[E(Food group indicator|diversification,diversification^2, X)] =
a0 +a1 diversification +a2 diversification^2 + a3 X
2) Log [E(Food count indicator| diversification,diversification^2, X)] =
a0 +a1 diversification +a2 diversification^2 + a3 X
3) Log (Total crop income)=a0 +a1 diversification +a2 diversification^2 + a3 X 7
where the dependent variable is either represented by a food group indicator (model 1))
(see table A1 in the Appendix for the classification), a simple food count indicator (model 2))
7 While to a certain extent all cross-sectional analysis of this type is subject to the endogeneity problem, we find that the
evidence presented in our paper is quite robust across specifications and countries. Furthermore the literature (Johnson,
1992; von Braun, 1995; Senaka Arachchi, 1998; Barghouti et al. 2004) suggests that crop diversification has an impact on
the two indicators of dietary diversity and on crop income and not the other way around.

13
as previously described and the total food crop income variable (model 3)).8 The variable
‘diversification’ represents the number of crops the rural household yearly produce in its
allotment; the square term allows us to measure whether its influence on the dependent
variable has a positive or negative curvature. ‘X’ is a vector of household demographic and
socio-economic control variables. The regressions also include a set of geographic dummy
variables, and square terms for the age and education variables and an independently,
identically distributed error term ε. We include a set of independent variables in order to
identity the sign and magnitude of the link between crop diversification and the dependent
variables without those aggregates polluting the final results; i.e. we avoid an omitted
variable bias (see Zezza and Tasciotti, 2010).
The three models, indicated by model 1), 2) and 3), are run separately for each country using
just rural households (‘country specific regressions’ in what follows). Model 1) and Model 2),
being count data model, have been estimated using a Poisson regression technique9, whilst
Model 3) has been estimated using ordinary least squares. Furthermore, model 1) and 3) are
run for the pooled sample of rural households living in the 8 countries (‘pooled sample
regression’ in what follows)10. Model 2) has not been run for the pooled sample as it would
not have any meaning; the dependent variable, in fact, is not comparable across countries
since it assumes different values depending on how the survey has been designed. In total
we end up having 9 regressions respectively for model 1) and for model 3) (8 country specific
8 Regarding the crop income calculation, two total crop income variables have been created. The first one includes
estimates of own crop consumption based on the agricultural production module of the household questionnaire whereas
the second one includes estimates of own crop consumption based on the food expenditure section of the questionnaire.
For the regression analysis, both the variables have been used with no remarkable differences in the results. 9 The choice of the poisson model over the negative binomial is given by the fact that the two dependent variables, food
count and food group indicator, are not over dispersed as the test says. A significant p (p<0.05) test statistic from the over
dispersion test indicates that the poisson model is appropriate. Only for Indonesia, Nicaragua and Vietnam the test of over
dispersion run on the food count indicator is significant but never at 1 percent level. 10
The pooled regression has been possible given the fact that data on different countries are absolutely comparable. The
only two variables which have needed further manipulation are the one regarding the ‘crop income’ and the ‘per capita
expenditure’, both measured in the local currency unit of the year of the survey. To make this variable comparable across
the 8 countries, all the values on ‘crop income’ and ‘per capita expenditure’ have been transformed in US dollar 2010.
14
regressions plus one for the pooled sample regression’) and 8 regressions for the model 2) (8
country specific regressions). Table 5 shows the results for the pooled regressions.
Overall, after introducing the set of X controls specified above, we find evidence that rural
households producing different crops do have greater dietary diversity (Table 5, second
column). The ratio of the result is intuitive; those households diversifying their agricultural
production increase the chance of consuming food which before were precluded to the
family. The reasons of the preclusions range from affordability problem, since food other
than staples might be unaffordable, to the absence of markets in the village where the
households reside. Furthermore, the fact that some villages are located in impervious part of
the country makes the supply via transportation very difficult. The sign of the other variables
are the expected ones; level of education and the age of the head of the household (proxies
for its wisdom), share of female members in the family, per capita expenditure and land size
increase the probability of consuming items from different food groups. The variable
household size has a positive impact on the dependent variable meaning that a bigger family
could theoretically work on a bigger piece of land. Having larger ruminants and owning a
tractor increase the chance of having a more diversified diet; other livestock ownership has a
positive effect as well.
The signs of the coefficients of the pooled regression for model 3) are the ones expected as
well. Following our preliminary descriptive findings, crop diversification has a positive and
significant impact on the total crop income. The marginal effect is now even greater, as an
extra crop has the potentiality to increase the crop income by 16 percent. The channels
through which this extra income could be generated are multiple. As an example, the rural
household can now sell the ‘new’ product, and being a ‘non staple item’ the selling price is
higher. Total agricultural yields might increase as well, as continuous cereal production

15
systems, including systems with two or three crops per plot, may become progressively
susceptible to diseases and insect pests because of insufficient diversity in the crop rotation
and could depauperate the land (Tilman et al., 2002).
[Table 5 about here]
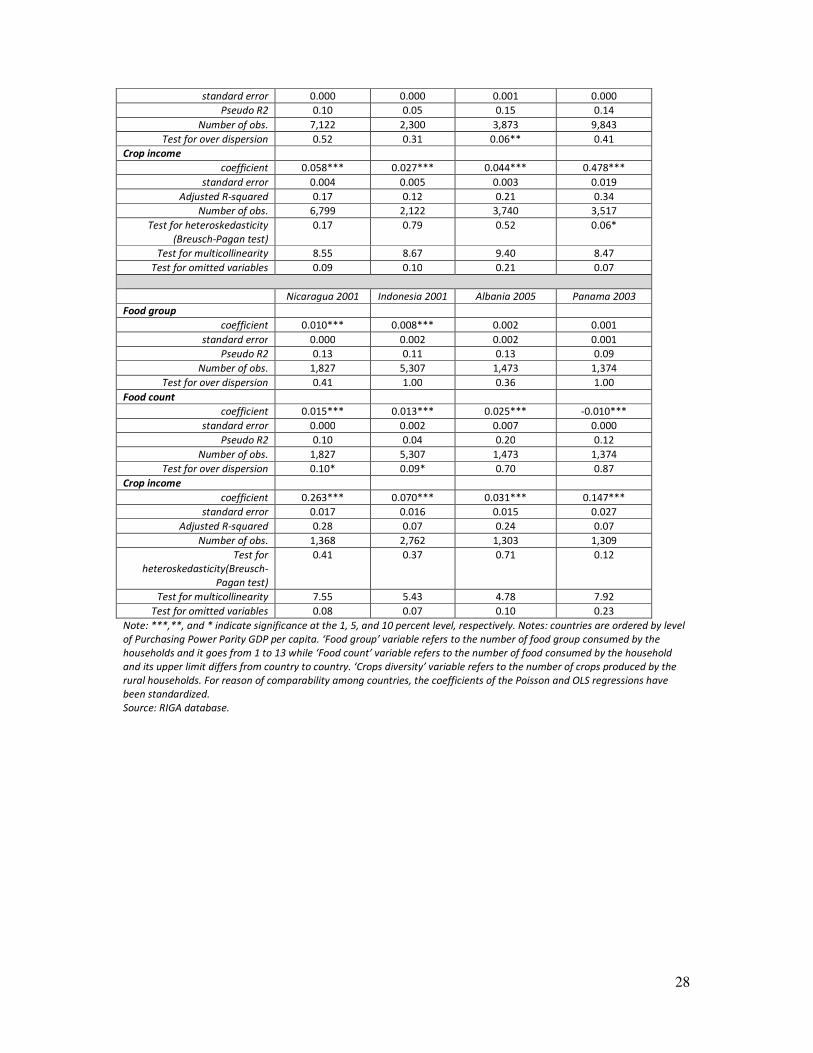
Looking at the country specific regressions (Table 6), households diet receives a significant
beneficial impact from crop diversification in all the countries, when nutrition is measured
using the food groups indicator, and in 7 out of 8 countries, when nutrition is measured
using the food count indicator. The marginal effect of an additional crop on the food count
indicator is not big, the maximum being 27 percent in Malawi and 22 percent in Nicaragua
(marginal effects means that if the average number of food groups for Malawi is 14.78 – see
Table 5- an increase of 27 percent brings it to 18.77 on average). The marginal effect on the
food group indicator is slightly lower, with the maximum increases observed in Indonesia
and Nicaragua (8 percent in both the countries). The increase in the number of food groups
consumed by the household is smaller if compared to the increase in the simple food counts
when crops diversification is practiced. This is due to the fact that the former variable, food
groups, has a limited range (between 0 and 13) and the variability of this variable itself is not
that large either.
Agricultural diversity seems to have a definitely higher impact on the agricultural incomes,
measured in local currency unit; the marginal effect of producing an additional crop
potentially increase average farm income of, among the others, 25 percent in Panama, 22
percent in Malawi, 13 in Vietnam, and lastly 90 percent in Pakistan. Regressions run for the
poorest quintile of rural households and for households endowed with less land lead to very

16
similar results highlighting the fact that even the poorer households, in terms of income and
land endowment, might benefit from crop diversification.
[Table 6 about here]
All the regression results, either considering the pooled sample or the country specific
regressions, provide a robust confirmation of a positive link between crop diversification on
one side and two measures of dietary diversity and crop income on the other. The
magnitude of the marginal effects, rather small in the case of the food group indicators but
bigger for what concerns crop incomes and the food count indicators, varies quite
extensively suggesting that crop diversity has a different impact depending on the country.
The most powerful results come from the food crop income analysis. In all the 8 countries
we find a positive and rather strong statistically significant association between food crop
income and the number of crops produced.
It is worth stressing the fact the an increase in the food consumption, whether measured by
the food group or by the food count indicator, might lead to negative effects if it is
concentrated in households which already consume an high amount of calories. Even though
obesity is believed to be a pathology only affecting households living in the urban and in the
rich part of the world, there is evidence of increasing eating disorder in rural areas of
developing countries as well (Zezza and Tasciotti, 2011).
Conclusions
This study estimates the effects of food crops diversification through the analysis of a large
dataset of household surveys from eight developing and transition countries. The current
study answers two specific research questions concerning the existence of the link between
17
the number of food crops produced by rural households on one side and (i) two measures of
dietary diversity and ii) crop income. Smallholders producers often strive to maintain
subsistence food production despite food crops could yield higher returns. Diversifying crops
production can be viewed, as noted above, as an insurance policy for farm households. The
higher the transaction and food transportation costs are and the closer the households are
to food subsistence level, the stronger should be the households’ preference for diversifying
the crop mix.
From a theoretical point of view, the diversification strategy can be seen as a second best
solution since the benefits of market integration and economic specialization are foregone.
Practically, however, the production of own food supplies can be seen as the first best
strategy given the risky economic environment, the missing insurance market, the
fluctuations in food prices and the unpredictable climate changes.
Our descriptive analysis points out that agriculture is practiced by the vast majority of rural
households, with lower percentages only in rural Pakistan. In terms of income generation,
though, agriculture’s role appears to be more limited, with the exception of Malawi and
Vietnam where the percentage of income coming from crop activities is close to 50 percent.
The highest share of agricultural land is devoted to produce staple food, namely maize, rice
and wheat depending on the country. However, high values commodities, such as fruits and
vegetables, are still produced.
Our data highlights that the link between the number of crops produced and the dietary
diversity indicators is positive and follows an inverted ‘U’ shape. Regression analysis
confirms this finding; the variable measuring the crops diversification is positive and
significant while its square term is significant as well but has a negative sign. In the great
majority of the countries analyzed, regression results show a positive correlation between

18
the number of crops produced and the two dietary diversity indicators, even after
controlling for variables related to the household economic welfare and to the household
characteristics. In addition, we find evidence that in all countries the number of crops
produced is positively and statistically significantly related to crop income. The policy lesson
which can be drawn is that crop diversification has a double role: it has a non-negligible
impact on the households’ diet and, ceteris paribus, it increases the agricultural revenues.
Furthermore, all the results, although different in magnitude from country to country, go in
the same direction. Even though the eight countries we took into account are different from
each other for geographic reasons, government policies and agricultural intensity and
specialization, all the regressions results and summary statistics allow us to draw a common
law.
In light of the fact that poverty is mostly concentrated in rural areas and that rural poor are
the most vulnerable to economic shocks, the findings have also major policy implications.
Having direct access to a wider variety of food via direct production is definitely beneficial to
rural households, which, on the other hand, could not always rely on trade and markets.
At the same time, it is important to stress that, even though the impact of crops’
diversification on agricultural income is positive and rather large, on average above 15
percent, the marginal effects that an additional crop has on the two measures of dietary
diversity could be quiet small insofar as positive (in the range of 5 percent). The magnitude
of the effect should be taken into account when assessing the potential contribution of more
diversified crop production on food security.
Even though the results do not leave doubt on the sign of the relation, it is important to
keep in mind that this study refers to country averages; case studies within each country
might catch peculiarities for which this relation does not hold anymore.

19
Appendix A
Table A1: List of food groups and content of each group
Food Group Content of the group
Food group 1 Cereals and grain products
Food group 2 Starchy, roots, tubers and legumes
Food group 3 Nuts, seeds and legumes
Food group 4 Vegetables
Food group 5 Fruits
Food group 6 Sugar, syrup and sweets
Food group 7 Meat and poultry
Food group 8 Fish and shellfish
Food group 9 Milk and milk products
Food group 10 Oil and fats
Food group 11 Beverages
Food group 12 Eggs
Food group 13 Miscellaneous
Notes: USAID’s FANTA project and adapted by FAO’s nutrition division (FAO, 2007).
Table A2: Food consumption record technique and recall period
Country and year Food consumption record technique Recall period
Malawi 2004 One enumerator’s visit 7 days
Nepal 2003 One enumerator’s visit 31 days
Vietnam 1998 One enumerator’s visit 365 days
Pakistan 2001 One enumerator’s visit 14 days
Nicaragua 2001 One enumerator’s visit 15 days
Indonesia 2000 One enumerator’s visit 7 days
Albania 2005 14 day diary compiled by the household 14 day
Panama 2003 One enumerator’s visit 15 days
Notes: LSMS and country representative surveys used different techniques for collecting data, hence the recall periods are
different from country to country.
References
Alderman, H. and Paxson, C. H. (1992), Do the Poor Insure? A Synthesis of the Literature on
Risk and Consumption in Developing Countries, World Bank Policy Research Working paper,
WPS 1008.
Arimond, M., Wiesmann, D., Becquey, E., Carriquiry, A. Daniels, M. C. (2010), Simple Food
Group Diversity Indicators Predict Micronutrient Adequacy of Women’s Diets in 5 Diverse,
Resource-Poor Settings, The Journal of Nutrition, vol. (140): 2059S–2069S.
20
Barghouti, S., Kane, S., Sorby, K. and Ali, M. (2004), Agricultural Diversification for the Poor.
Guidelines for Practitioners, The International Bank for Reconstruction and Development,
Washington, D.C..
Barrett, C.B., Reardon, T. and Webb, P. (2001), Nonfarm income diversification and
household livelihood strategies in rural Africa: concepts, dynamics, and policy implications,
Food Policy, vol. 26, 315–331.
Carney, D. (1998), Sustainable rural livelihoods: What contribution can we make? Book
edited by Carney, London: DFID.
Caviglia-Harris, J. and Sills, E. (2005), Land Use and Income Diversification: Comparing
Traditional and Colonist Population in the Brazilian Amazon, Agricultural Economics: 221-
237.
Chand, R. (1996), Diversification Through High Value Crops in Western Himalayan Region:
Evidence From Himachal Pradesh, Indian Journal of Agricultural Economics, vol. (41) 4: 652-
63.
Davis, B., Winters, P., Carletto, G., Covarrubias, K., Quiñones, E. J., Zezza, A., Stamoulis, K.,
Azzarri, C. and DiGiuseppe, S. (2010), A Cross-Country Comparison of Rural Income
Generating Activities, World Development, Elsevier, vol. 38(1): 48-63.
Eckhardt, C. L. (2006), Micronutrient Malnutrition, Obesity, and Chronic Disease in Countries
Undergoing the Nutrition Transition: Potential Links and Program/Policy Implications, IFPRI,
Washington, United States.
Ellis, F. (2000), Rural Livelihoods and Diversity in Developing Countries, Oxford University
Press.

21
FAO (2007), Guidelines for Measuring Household and Individual Dietary Diversity, Prepared
by FAO Nutrition and Consumer Protection Division with support from the EC/FAO Food
Security Information for Action Programme and the Food and Nutrition Technical Assistance
(FANTA) Project, Rome.
FAO (2009), The State of Food Insecurity in the World: Economic crisis — impacts and lessons
learned, FAO, Rome.
Hatløy, A., Torheim, L.E. and Oshaug, A. (1998), Food variety – a good indicator of nutritional
adequacy of the diet? A case study from an urban area in Mali, West Africa, European
Journal of Clinical Nutrition, vol. (52):891-898.
Heady, E. O. (1952), Diversification in resource allocation and minimization of income
variability, Journal of Farm Economics, vol. 34: 482–496.
Johnson, H. (1992), Rural livelihoods: action from below, in H. Bernstein, B. Crow, H. Johnson
(Eds.), Rural Livelihoods: Crises and Responses, Oxford University Press, Oxford (1992)
Joshi, P. K., Gulati Ashock, Birthal, S. P., Laxmi Tewari (2004), Agricultural diversification in
South Asia: patterns, determinants and policy Implications, Economic and Political Weekly,
vol. 39(24): 2257-2467.
Kant, A.K., Schatzkin, A., Graubard, B.I. and Schairer, C. (2000), A prospective study of diet
quality and mortality in women, Journal of American Medical Associations, vol. (283): 2109-
2115.
Kurosaki, T. (2003), Specialization and Diversification in Agricultural Transformation: The
Case of West Punjab, American Journal of Agricultural Economics, vol. 85: 372-386.

22
La Vecchia, C., Munoz, S.E., Braga, C., Fernandez, E. and Recarli, A. (1997), Diet diversity and
gastric cancer, International Journal of Cancer, vol. (72): 255-257.
Mirmira, Azadbakht, L. and Azizi, F. (2006), Dietary Diversity within Food Groups: An
Indicator of Specific Nutrient Adequacy in Tehranian Women, Journal of the American
College of Nutrition, vol. (25) 4: 354–361.
Moursi, M., Arimond, M., Dewey, K. G., Trèche, S., Ruel, M. T. and Delpeuch, F. (2008),
Dietary Diversity is a Good Predictor of the Micronutrient Density of the Diet of 6- to 23-
Month-Old Children in Madagascar, Journal of Nutrition, vol. 138(12): 2448–453.
Papademetriou, M. and Dent, F. (2001), Crops Diversification in the Asia-Pacific Region, FAO,
Rome.
Pica-Ciamarra, U., L. Tasciotti, J. Otte, and A. Zezza (2011), Livestock Assets. Country
Evidence from Household Surveys. Unpublished manuscript, Livestock Income and Rural
Households.
Pingali, P. L. and Rosegrant, M. W. (1995), Agricultural Commercialization and
Diversification: Processes and Policies, Food Policy, vol. (20) 3: 171-86.
Pope, R. and Prescott, R (1980), Diversification in Relation to Farm Size and other
Socioeconomic Characteristics, American Journal of Agricultural Economics, vol. 62: 554-559.
Reardon, T., Matlon, P. and Delgado, C. (1998), Coping with household-level food insecurity
in drought-affected areas of Burkina Faso, World Development, vol. (19) 9: 1065-1075.
Reardon, T. (2000), Interactions between the Agricultural System and Non-Agricultural
Activities of Farm Households in Developing Countries, in J-P Colin and E. W. Crawford (eds.)
Research on Agricultural System: Accomplishments, Perspective, and Issues.

23
Ruel, M.T. (2006), Operationalizing dietary diversity: a review of measurement issues and
research priorities, Journal of Nutrition, vol. (133): 3911S-3926S.
Ryan, J. G. and Spencer, D. C. (2001), Future Challenges and Opportunities for Agricultural. R
and D in the Semi-Arid Tropics, International Crops Research Institute for the Semi-Arid
Tropics, Patancheru, India.
Shetty, P. (2009), Incorporating nutritional considerations when addressing food insecurity,
Food Security, vol. (1) 4:431–440.
Senaka Arachchi, R.B. (1998), Drought and household coping strategies among peasant
communities in the dry zone of Sri Lanka, J. Twigg, M.R. Bhatt (Eds.), Understanding
Vulnerability: South Asian Perspectives, Intermediate Technology Publications (on behalf of
Duryog Nivaran), London (1998).
Sun, T., Jinkins, J., and El-Osta, H. (1995), Multinomial Logit Analysis of Farm Diversification
for Midwestern Farms, paper presented at the Annual Conference of the American
Agricultural Economics Association in Indianapolis.
The Economist (2011), Hidden Hunger. How much can farming really improve people’s
health?
Tilman, D., Cassman, K. G., Matson, P. A., Naylor, R. and Polasky, S. (2002), Agricultural
sustainability and intensive production practices, Nature, vol. 418: 671-677.
UNICEF/Micronutrient Initiative (2004), Vitamin and mineral deficiency: a world progress
report, Micronutrient Initiative, Canada.
Von Braun, J. (2008), Food and Financial Crisis. Implications for Agriculture and the Poor,
IFPRI Food Policy Report, Washington D.C.

24
Von Braun, J. (1995), Agricultural Commercialization: Impact on Income and Nutrition and
Implications for Policy, Food Policy, vol. (20) 3: 187-202.
Tables
Table 1: Most cultivated crops, by share of land
Country
and year
Crops and size of land (as a share of land devoted to agriculture)
Malawi
2004
Crop Maize Beans Ground nut Potatoes Cassava Chick peas Sorghum
Share of land (in %) 59 10 10 8 7 4 2
Nepal
2003
Crop Rice Maize Wheat Vegetables Lentils Potatoes Fresh fruit
Share of land (in %) 41 23 18 6 5 5 2
Vietnam
1998
Crop Rice Maize Vegetables Cassava Ground nut Beans Fresh fruit
Share of land (in %) 72 11 5 5 3 2 2
Pakistan Crop Wheat Rice Chick peas Maize Beans Mangoes Potatoes

25
2001 Share of land (in %) 63 20 7 6 2 1 1
Nicaragua
2001
Crop Maize Beans Rice Nuts Oranges Cassava Cabbages
Share of land (in %) 46 34 10 4 3 2 1
Indonesia
2000
Crop Rice Maize Coconut Cassava Nuts Beans Fruit
Share of land (in %) 57 18 14 5 4 1 1
Albania
2005
Crop Wheat Maize Olives Beans Oats Figs Apples
Share of land (in %) 38 22 18 6 6 6 4
Panama
2003
Crop Rice Maize Melons Banana Beans Oranges Vegetables
Share of land (in %) 54 25 8 5 4 3 1
Notes: Figures in the table refer to the share of cultivated land at the country level in percent and add up to 100 . Countries
are ordered by level of Purchasing Power Parity GDP per capita.
Source: FAOSTAT, 2009.
Table 2: Share of rural households producing different number of crops
Country and year Number of crops produced and share of households
1 2 3 4 5 6 7 >=8 Total
Malawi 2004 11 21 23 20 13 6 3 3 100
Nepal 2003 3 25 8 18 8 10 3 25 100
Vietnam 1998 7 7 8 8 9 7 8 46 100
Pakistan 2001 22 61 15 2 0 0 0 0 100
Nicaragua 2001 6 19 20 17 11 9 7 11 100
Indonesia 2000 28 29 25 11 4 2 1 0 100
Albania 2005 11 31 15 14 8 9 3 9 100
Panama 2003 36 38 19 6 1 0 0 0 100
Notes: countries are ordered by level of Purchasing Power Parity GDP per capita.
Source: RIGA database.
Table 3: Average, minimum and maximum values for the food count and food group indicators
Country and year Food count indicator Food group indicator
Average Minimum value Maximum value Average Minimum value Maximum value
Malawi 2004 15 1 51 8 1 13
Nepal 2003 22 10 37 12 2 13
Vietnam 1998 11 3 24 6 1 13
Pakistan 2001 19 4 42 10 1 13

26
Nicaragua 2001 18 1 59 9 1 13
Indonesia 2000 17 1 33 10 1 13
Albania 2005 34 1 69 10 1 13
Panama 2003 41 4 75 11 2 13
Notes: countries are ordered by level of Purchasing Power Parity GDP per capita.
Source: RIGA database.
Table 4: Food count indicator, by land class and by number of crops (from 0 to 8 or higher)
Country and year
Land
class
Maximum
number of
food available 0 1 2 3 4 5 6 7 >=8
Malawi 2004
0-1
53
12 13 13 14 15 16 18 16 16
1-2 11 12 13 14 16 16 18 18 17
>2 n/a 12 13 15 16 18 18 20 19
Nepal 2003
0-1
35
19 21 21 21 22 22 21 22 18
1-2 18 21 23 24 25 24 22 22 24
>2 20 24 24 24 22 23 24 21 26
Vietnam 1998
0-1
20
n/a 10 11 11 11 11 11 11 12
1-2 n/a n/a 11 11 11 12 12 11 12
>2 n/a n/a n/a 12 10 13 19 14 12
Pakistan 2001
0-1
83
17 19 19 20 21 18 n/a n/a n/a
1-2 18 20 20 21 24 23 n/a n/a n/a
>2 19 20 21 22 23 25 n/a n/a n/a
Nicaragua 2001
0-1
61
15 16 16 17 19 19 17 21 22
1-2 14 15 16 16 18 19 20 21 19
>2 18 18 19 20 22 21 20 20 20
Indonesia 2000
0-1
37
15 17 18 18 18 18 18 18 21
1-2 16 17 18 19 17 19 18 18 22
>2 18 19 19 19 18 19 18 20 18
Albania 2005
0-1
74
23 29 28 32 36 37 42 31 40
1-2 21 29 34 37 39 38 35 39 40
>2 30 45 42 37 40 47 45 41 39
Panama 2003
0-1
82
41 43 42 46 45 42 n/a n/a n/a
1-2 42 41 39 38 45 59 n/a n/a n/a
>2 36 36 38 37 42 52 n/a n/a n/a
Notes: land class ‘0-1’ indicates size of land owned between 0 and 1 hectare, ‘1-2’ between 1 and 2 hectares, ‘>2’ bigger
than 2 hectares. The number in the column ‘Number of food available’ represents the total number of food recorded in the
survey. Countries are ordered by level of Purchasing Power Parity GDP per capita.
Source: RIGA database.
Table 5: Regression results for the pooled model indicated by model 1) and model 3)
Dependent variable: Food group indicator and logarithm of crop income
Independent variables Coefficients Dep. Var.:
Food group indicator
Coefficients Dep. Var.:
Log (Crop Income)
Crop diversification 0.010*** 0.152***
Crop diversification^2 -0.001*** -0.005***
Household size 0.005*** 0.006***
Education head of the hh. 0.010*** 0.011***
Education head of the hh. Squared -0.001*** -0.000
Age of the head of the hh. 0.003*** 0.018***
Age of the head of the hh. Squared -0.000*** -0.000***
Share of women in working age 0.026*** -0.140***

27
Per capita expenditure 0.000*** -------
Size of land owned (in ha.) 0.001 0.008***
Large ruminants ownership 0.012*** 0.081
Other livestock ownership 0.012*** 0.002
Tractor ownership 0.001* 0.001***
Dummy Albania -0.007 0.527***
Dummy Indonesia -0.083*** 5.334***
Dummy Malawi -0.059*** -2.563***
Dummy Nepal 0.158*** -4.555***
Dummy Pakistan -0.156*** -6.761***
Dummy Panama -0.032*** -3.207***
Dummy Vietnam 0.031*** -11.239***
Constant 2.184*** 15.686***
Number of households 33,119 23,641
Adjusted R-squared 0.24+ 0.22
Test for over dispersion 1.00 n/a
Test for heteroskedasticity (Breusch-
Pagan test)
n/a 0.07*
Test for multicollinearity n/a 7.34
Test for omitted variables n/a 0.48
Note: ***,**, and * indicate significance at the 1, 5, and 10 percent level, respectively. ‘Food group indicator’ refers to the
number of food group consumed by the households and it varies from 1 to 13. ‘Crops diversification’ variable refers to the
number of crops produced by the rural households. ‘Crop incomes’ and ‘per capita expenditure’ from the 8 countries,
originally measured in local currency unit, has been inflated and converted to US dollars 2010. +
the number indicate the
pseudo R2 as for the Poisson regression the ‘Adjusted R-squared’ is not available.
Source: RIGA database.
Table 6: Regression results for model 1), 2) and 3) (the coefficients expressed are the ones associated to the variable
measuring the crops diversification)
Dependent Variable Countries and year
Malawi 2004 Nepal 2003 Vietnam 1998 Pakistan 2001
Food group
coefficient 0.009*** 0.001*** 0.002*** 0.002***
standard error 0.000 0.000 0.000 0.000
Pseudo R2 0.31 0.11 0.15 0.10
Number of obs. 7122 2,300 3873 9,843
Test for over dispersion 0.92 0.37 1.00 0.96
Food count
coefficient 0.020*** 0.001*** 0.010*** 0.007***
28
standard error 0.000 0.000 0.001 0.000
Pseudo R2 0.10 0.05 0.15 0.14
Number of obs. 7,122 2,300 3,873 9,843
Test for over dispersion 0.52 0.31 0.06** 0.41
Crop income
coefficient 0.058*** 0.027*** 0.044*** 0.478***
standard error 0.004 0.005 0.003 0.019
Adjusted R-squared 0.17 0.12 0.21 0.34
Number of obs. 6,799 2,122 3,740 3,517
Test for heteroskedasticity
(Breusch-Pagan test)
0.17 0.79 0.52 0.06*
Test for multicollinearity 8.55 8.67 9.40 8.47
Test for omitted variables 0.09 0.10 0.21 0.07
Nicaragua 2001 Indonesia 2001 Albania 2005 Panama 2003
Food group
coefficient 0.010*** 0.008*** 0.002 0.001
standard error 0.000 0.002 0.002 0.001
Pseudo R2 0.13 0.11 0.13 0.09
Number of obs. 1,827 5,307 1,473 1,374
Test for over dispersion 0.41 1.00 0.36 1.00
Food count
coefficient 0.015*** 0.013*** 0.025*** -0.010***
standard error 0.000 0.002 0.007 0.000
Pseudo R2 0.10 0.04 0.20 0.12
Number of obs. 1,827 5,307 1,473 1,374
Test for over dispersion 0.10* 0.09* 0.70 0.87
Crop income
coefficient 0.263*** 0.070*** 0.031*** 0.147***
standard error 0.017 0.016 0.015 0.027
Adjusted R-squared 0.28 0.07 0.24 0.07
Number of obs. 1,368 2,762 1,303 1,309
Test for
heteroskedasticity(Breusch-
Pagan test)
0.41 0.37 0.71 0.12
Test for multicollinearity 7.55 5.43 4.78 7.92
Test for omitted variables 0.08 0.07 0.10 0.23
Note: ***,**, and * indicate significance at the 1, 5, and 10 percent level, respectively. Notes: countries are ordered by level
of Purchasing Power Parity GDP per capita. ‘Food group’ variable refers to the number of food group consumed by the
households and it goes from 1 to 13 while ‘Food count’ variable refers to the number of food consumed by the household
and its upper limit differs from country to country. ‘Crops diversity’ variable refers to the number of crops produced by the
rural households. For reason of comparability among countries, the coefficients of the Poisson and OLS regressions have
been standardized.
Source: RIGA database.