Globalisation, industrial diversification and ... - EconStor
Journal of Economics and Sustainable Development www.iiste.org
ISSN 2222-1700 (Paper) ISSN 2222-2855 (Online)
Vol.2, No.8, 2011
78 | P a g e
www.iiste.org
Pattern, Trend and Determinants of Crop Diversification:
Empirical Evidence from Smallholders in Eastern Ethiopia
Wondimagegn Mesfin
School of Agricultural Economics and Agribusiness, Haramaya University
P.O.Box 103, Dire Dawa, Ethiopia
Mobile: +251-912172096 E-mail: [email protected]
Bekabil Fufa
School of Agricultural Economics and Agribusiness, Haramaya University
P.O.Box 138, Dire Dawa, Ethiopia
Mobile: +251-910577471 E-mail: [email protected]
Jema Haji
School of Agricultural Economics and Agribusiness, Haramaya University
P.O.Box 138, Dire Dawa, Ethiopia
Mobile: +251-911780518 E-mail: [email protected]
Received: October 29, 2011
Accepted: October 30, 2011
Published: November 4, 2011
The study was sponsored by Ministry of Education (Haramaya University)
Abstract
Crop diversification is the most important risk management strategies. The study investigated the pattern,
trend and covariates of crop diversification in eastern Ethiopia based on data collected from 167 households
randomly and proportionately selected. In order to manage risks of drought, pests and diseases, soil fertility
decline and input prices variations, farmers in the study areas employ crop diversification as a self-insuring
strategy. The farmers are becoming risk-averse which has implications on technology adoption. Tobit
model result indicated that farmers with more extension contacts and larger livestock size are likely to
specialize whereas those who have access to market information and irrigation, those who own machinery
and more number of farm plots are more likely to diversify. In order to promote crop diversification,
providing farm machinery through easy loans and improving access to market information and irrigation
should be given attention. The extension system should include risk-minimization as a strategy.
Keywords: crop diversification, risk, risk management strategies, risk-averse, Ethiopia.
1. Introduction
Ethiopia is a country whose economy is significantly dependent on agriculture sector. The sector is
dominated by smallholder peasant agriculture which accounts for more than 95% of the total food
production. The sector supports employment for 85% of the population, 90% of exports and 50% of GDP.
Journal of Economics and Sustainable Development www.iiste.org
ISSN 2222-1700 (Paper) ISSN 2222-2855 (Online)
Vol.2, No.8, 2011
79 | P a g e
www.iiste.org
Out of the total agricultural land, about 97% is cultivated by smallholders who produce more than 97% of
the agricultural output. Despite its importance, the agricultural sector is traditional and subsistence-oriented
(Jema 2008) and it characterized by poor and declining performance. This performance is attributed to
many interrelated factors which include recurrent drought, land degradation, paucity of land, crop and
livestock pests and diseases, lack of improved and suitable technologies, poor marketing and service
infrastructure (Girma 2002; Belaineh 2003).
In Ethiopia, farming is particularly weather-dependent and farmers face price, yield and resource risks that
arise from the biophysical and socio-economic environment in which they operate. Rural households in the
country are exposed to a variety of risks that include harvest failure as a result of drought, frost, floods and
other climatic events and death of livestock (Dercon 2002). These risks influence the production and
resource allocation decisions of smallholder farmers. Lack of institutional innovations such as credit and
insurance schemes in most developing countries makes individual risk management a significant issue to
cash-constrained smallholder farmers.
In an effort to adapt to the risky environment, smallholders make certain production decisions and employ
various risk mitigating strategies. Crop diversification is one method of reducing income variability
(Briglauer 2000). According to the comparative advantage theory, diversification can reduce risks but at the
expense of income. Despite the significant role crop diversification plays in agriculture, there are only few
empirical studies on the factors that determine diversification. This study has examined the effect of
various household characteristics and other factors on crop diversification.
In Eastern Ethiopia, the economy is characterized by subsistence mixed farming systems, low agricultural
productivity and poor access to major markets (Bezabih & Hadera 2006; Jema 2008). Agricultural
production in the area is generally characterized by a high degree of instability. This is mainly attributed to
the nature of the agricultural production which is associated with high degree of uncertainty which arises
from dependency of the agricultural production on uncontrollable weather conditions (erratic and variable
rainfall) which caused great fluctuations on crops yield on the one hand, and large fluctuations in input and
output prices. It is argued that diversifying by growing more enterprises may lead to farm income stability
(Tefera et al. 2003). The smallholder farmers in the area practice crop diversification of different types.
However, the pattern and trend of crop diversification and its implications are not studied. The study
therefore, attempted to analyze the pattern and trend of crop diversification in eastern Ethiopia.
2. Research Methodology
2.1. The Study Area
The study is conducted in Eastern Hararghe zone which is among the seventeen zones of Oromia National
Regional state of Ethiopia. It is located between 70 32’N-9
0 44’N latitude and 41
012’E-42
053’E longitude.
The Zone has an average altitude of 1750 meters above sea level. Climatically, the zone is subdivided into
Kola (note 1), Woinadega and Dega. The zone has a total area of about 24,900 km2
and divided into 17
districts. From the zone, Kombolcha and Haramaya districts are selected for this study. Haramaya district is
found in the North Central part of the Zone. The district comprises of 33 peasant associations (PAs) and it
is characterized by plateau, mountains, hills and plains. Altitudinally stretching between 1400 and 2340
meters above sea level, Haramaya falls under middle high land agro-climatic zone and the mean annual rain
fall is 790 mm. The district has a total population of about 236 600 of which about 90% live in rural areas.
Kombolcha district is found in the northern part of East Hararghe zone. Physiographically, it is
characterized by dissected plateaus, mountains, hills, plains and valleys. Of the 19 peasant associations in
the District, seven (37%) are located in the lowlands and the remaining 12 (63%) are located in the
Woinadega. Altitudinally, Kombolcha district stretches between 1200 and 2460 meters above sea level and
it falls under Woinadega (74%) and Kola (26%) agro-climatic zones. The district has a total population of
about 120 000 and more than 90% of the population resides in rural areas. The annual rainfall ranges from
600 mm to 900 mm.
Mixed farming system with the predominance of crop production is practiced in the two districts. Farmers
produce different crops in order to secure their family food supply and cover various household
Journal of Economics and Sustainable Development www.iiste.org
ISSN 2222-1700 (Paper) ISSN 2222-2855 (Online)
Vol.2, No.8, 2011
80 | P a g e
www.iiste.org
expenditures. Permanent crops include sorghum, maize, haricot bean and groundnut. Vegetables mainly
potato, onion, cabbage, lettuce, tomato, carrot and beet root are commonly produced. In addition, chat (note
2) is the dominant cash crop widely produced in the areas. Keeping animals in their homestead to provide
feed by the cut and carry system is commonly practiced in the highland areas. The production system in the
areas is both rain-fed and irrigated systems the rain-fed production system being most dominant. Unreliable
rainfall, low adoption of modern technologies, lack of credit facilities, shortage of potable water supply,
backward infrastructural facilities, deterioration of forests and soil fertility are the major problems. On the
other hand, varied and favorable climatic conditions are the major potentials of the district.
2.2. Types and Sources of Data
The study was based on both primary and secondary data. Primary data related to the socioeconomic
characteristics of the farmers such as land size, family size, land, labor, crop yield, and livestock owned,
machinery owned, risk sources and mitigation strategies were gathered from the sample farmers. Secondary
data like prices of commodities and other related information were collected from Agriculture and Rural
Development and marketing offices of the districts. Different published and unpublished materials were
also reviewed. In addition, websites were consulted for secondary data and supporting literature.
2.3. Sampling Design and Methods of Data collection
For the study, both probability and non-probability sampling techniques were employed. Haramaya and
Kombolcha districts (note 3) were selected purposively since they have vegetable dominated-mixed
farming systems and smallholder farmers in these districts are exposed to various types of risks. A two
stage random sampling procedure was then employed to select 167 respondents from the districts. In the
first stage, 10 peasant associations (4 from Kombolcha and 6 from Haramaya districts) were selected
proportionately. In the second stage, 167 sample households were selected from each peasant association
using probability proportional to size method. The data for the study were collected with the aid of a
questionnaire. In addition, information was obtained from discussions with District Agricultural Officers
and extension workers and other farmers outside the formal sample to supplement the data.
Before conducting the formal survey, the questionnaire was pre-tested by interviewing seven farmers. This
greatly helped to improve the questionnaire to generate relevant data and to have clear understanding about
the farming system in the areas. The researcher recruited twelve enumerators, who have good knowledge
and experience on farming system and they were given training on the objective of the data collection, how
they approach and clarify questions to farmers and record the data properly.
2.4. Methods of Data Analysis
In order to address the objectives of the study, descriptive analysis and econometric model were employed
in this study.
2.4.1. Descriptive statistics
Descriptive statistics was employed to analyze and present the socioeconomic characteristics of sample
households and to rank farmers’ responses with regard to certain questions. In addition, prioritizing factors
influencing farm household decisions were made using simple descriptive statistical tools. Descriptive
analysis involved calculating of frequency, percentages, means, and standard deviation.
2.4.2. Econometric model
Tobit regression was used to analyze covariates of crop diversification and its intensity. The variable used
to measure crop diversification is a modification of the Entropy index that lies strictly between zero and
one. The diversity index is censored because some of its values cluster at the limit (i.e., 0 for complete
specialization and 1 for perfect diversification). Standard ordinary least squares (OLS) or seemingly
Journal of Economics and Sustainable Development www.iiste.org
ISSN 2222-1700 (Paper) ISSN 2222-2855 (Online)
Vol.2, No.8, 2011
81 | P a g e
www.iiste.org
unrelated regression (SUR) of the diversity index will yield biased and inconsistent estimates in this
situation. For the same reasons as above, it is not appropriate to use a classical regression model for this
purpose. Hence, opting for other econometric models is in v v evitable for handling the matter. One of such
models is censored regression models.
Censored regression models refer to a model in which we observe the dependent variable only if it is above
or below some cut off level. Tobit model is a special case of censored regression models that arise when the
dependent variable is limited (or censored) from above and/or below. It is a non-linear model which
employed maximum likelihood estimation technique which estimates the likelihood of crop diversification
and its intensity. The Tobit approach has been applied in previous studies of crop diversification (e.g.
Allison 2010). This model is appropriate since the dependent variable is an index which takes values
between 0 and 1 inclusive. The dependent variable of the model can be either left-censored, right-censored,
or both left-censored and right-censored, where the lower and/or upper limit of the dependent variable can
be any number.
The two-limit Tobit model can be specified as:
iii xy '* (1)
where *
iy is a latent variable (unobserved for values smaller than 0 and greater than 1) representing
specialization or diversification index; ix is a vector of explanatory variables; ' is a vector of unknown
parameters; and i is a disturbance term.
Denoting yi (crop diversification index) as the observed dependent variable the two limit Tobit model can
be specified as:
11
10*
00
*
*
*
i
i
i
i
yif
yify
yif
y (2)
In principle, a maximum likelihood approach may be employed to address the censoring (e.g., Tobit model)
and account for correlations in error terms across equations by specifying a multivariate density function
for the error terms (Benin et al. 2004). Censored regression models (including the standard Tobit model)
are usually estimated by the Maximum Likelihood (ML) method. The log likelihood function is specified
with an assumption that the disturbance term follows a normal distribution with mean 0 and
variance2 .
Unlike traditional regression coefficients, the Tobit coefficients cannot be interpreted directly as estimates
of the magnitude of the marginal effects of changes in the explanatory variables on the expected value of
the dependent variable. In a Tobit equation, marginal effect includes both the influence of the explanatory
variable on the probability of crop diversification as well as its intensity. More explicitly, the marginal
effect takes into consideration that a change in an explanatory variable will affect simultaneously the
number of sample farmers diversifying their production and the extent of diversification.
Definition of Variables and Hypothesis
Dependent Variable: The dependent variable used is crop diversification measured by the modified
entropy index. The modified entropy index accounts for both the mix of crops and the relative importance
of each crop to the farm business. The index spans a continuous range from 0 to 1; the value of the index
for a completely specialized farm producing one crop is 0 where as a completely diversified farm with
equal shares of each crop has an index of 1.
The modified entropy index which represents the dependent variable in this study is obtained using the
formula:
Journal of Economics and Sustainable Development www.iiste.org
ISSN 2222-1700 (Paper) ISSN 2222-2855 (Online)
Vol.2, No.8, 2011
82 | P a g e
www.iiste.org
N
i
iiindex
N
ppD
1 )ln(
)1
ln(
)( (3)
Where, Dindex is crop diversification index, pi is proportion of area under ith
crop, i refers to each of the N
possible enterprises.
At maximum diversification, this index takes a value of 1 and at maximum specialization it attains a value
of 0. The modified entropy index provides a uniform and fixed scale and hence it is used as a norm to
compare and rank the extent of diversification spatially. Other empirical studies on determinants of farm
diversification have used the same index (e.g. Mishra & El-Osta 2002).
Explanatory variables: The following were expected to be explanatory variables determining the level of
farm diversification. These variables are identified based on review of the empirical works and economic
theory.
Farm size: Farm size is a continuous variable referring to the total land holding by the farmer measured in
hectares. It was expected to positively related to crop diversification. Previous findings indicate that
diversification activities are concentrated on large farms (Weiss and Briglauer 2000; Mishra and El-Osta
2002; Benin et al. 2004; Fetien et al. 2009). It was, therefore, hypothesized that larger farms may be more
diversified.
Age of the household head: Age is a continuous variable and a negative relationship was expected
between age of the farm operator and diversification. Previous studies suggest that older farm operators are
less likely to diversify (Mishra and EL-Osta 2002). One possible explanation is that older farm operators
are less risk-averse and less diversified whereas young and beginning farm operators might be more risk-
averse.
Household size: The size of the farm household was expected to be positively related with diversification.
Previous studies also support this hypothesis (Weiss & Briglauer 2000; Mishra & El-Osta 2002; Benin et
al. 2004).
Distance to markets: Previous works on farm diversification highlighted the importance of proximity to
main roads and markets for development of other farm enterprises (Benin et al. 2004). A negative
correlation was expected between crop diversification and proximity to markets. It is a continuous variable
and measured in kilometers.
Number of extension contacts: The larger the number of contacts a farmer has with an extension agent,
the more he is likely to engage in production of large number of enterprises. It is a continuous variable and
measured as the number of contacts the famer has with the agent per year. The finding of Fetien et al.
(2009) also supported this hypothesis.
Farm Machinery (tractor, water pump): Whether the farmer has farm machinery or not was expected to
be positive determinant of crop diversification. One study in India has indicated that there is a positive
relation between possession of machinery (tractor) and farm diversification (Mishra & El-Osta 2002).
Off/non-farm income: This variable is defined for this particular study as all incomes except on-farm
income earned by the sample household. Off-farm/non-farm income diversifies a farm operator’s income
portfolio and reduces the degree of farm diversification and possibly off-farm work is not compatible with
the labor demands of farm diversification. Off-farm income from wages and salaries is a continuous
variable that was expected to be negatively correlated with crop diversification. Mishra & El-Osta (2002),
Weiss & Briglauer (2000) have also reported inverse relations.
Number of farm plots: This variable is a continuous and expected to positively influence crop
diversification. The more the number of farm plots, the more is the diversification (Benin et al. 2004).
Access to market information: It is a dummy variable taking value 0 if a household have no access to
market information and 1 otherwise. This variable was hypothesized to have a positive relation with crop
Journal of Economics and Sustainable Development www.iiste.org
ISSN 2222-1700 (Paper) ISSN 2222-2855 (Online)
Vol.2, No.8, 2011
83 | P a g e
www.iiste.org
diversification. Irrigation intensity: It is a continuous variable measured as the total irrigated area under
each crop divided by the total cropped area by a farmer. The hypothesis is based on Lonnie et al. (1989).
Sex of the household: This is a dummy variable assuming 0 if female and 1 if male household head. The
variable was expected to have a positive effect on diversification due to the fact that there is skill or
requirements for frequent and early ploughing. Hence, male headed households are more likely to diversify
(Fetien et al. 2009).
3. Results and Discussions
The major findings of the study are discussed in the following sections. The first section deals with the
socio-economic characteristics of the sample farmers in the two districts while the second section describes
the patterns and trend of crop diversification in the study area. The final section presents and discusses the
covariates of crop diversification using the Tobit regression.
3.1. Socioeconomic Characteristics of the Sample Households
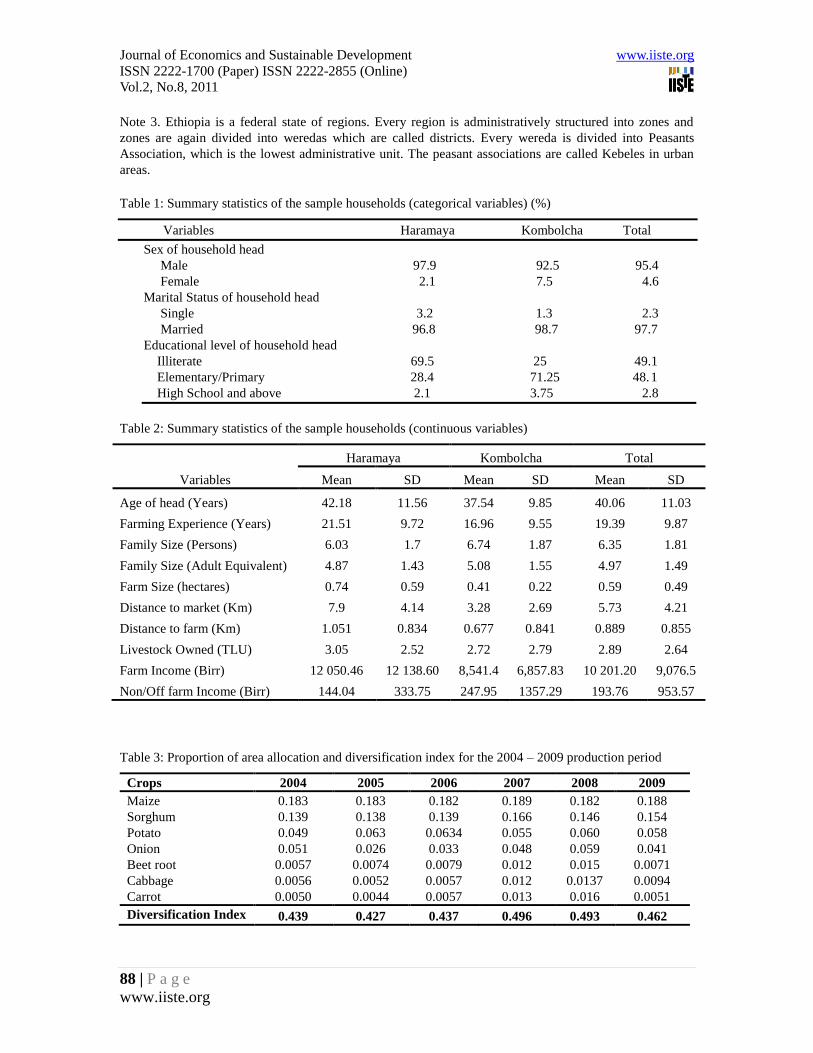
The socioeconomic characteristics of the sample households are presented in the Tables 1 and 2. The
descriptive statistics results indicate that the majorities (more than 95%) of the households are male-headed
and married. About 70% of the sample respondents in Haramaya district are illiterate whereas about 75% of
the respondents in Kombolcha district are at least able to read and write. Against this background, it is
interesting to note that the number of household heads with no education is clearly higher in Haramaya
district than in Kombolcha. This suggests lower investment in human capital among the households of
Haramaya district.
About 6% of the sample households in the study area are engaged in off-farm or non-farm income
generating activities. This indicates that considerable proportion of the farmers does not have access to off-
farm and non-farm income sources. This situation is supposed to constrain the off-farm/non-farm income to
serve as a hedge against crop failure risk.
The socio-economic profile of households for the continuous variables is summarized in table 2. The
average age of the household heads in the study area is above 40 years and farmers in Haramaya district
have slightly longer years of experience in farming than household heads in Kombolcha district. On
average, the n relatively large household size is maintained in the study areas (around 5 adults per
household). Larger household size allows the household flexibility to pool resources and share risks by
taking advantage of household return to scale and labor supply they need during peaked demand season.
The average land holding in the study areas is less than the national average which is 1.53 hectares. The
average land holding in Haramaya district (0.74 ha) is higher than that of Kombolcha (0.41 ha) on average.
In Haramaya district, there is greater variability in land ownership as indicated by the higher standard
deviation (0.598). The average livestock holding measured in tropical livestock units is slightly higher in
Haramaya (3.05) than in Kombolcha (2.72) district. This might be related to the fact that households in
Haramaya district have enough land to raise livestock besides growing crops.
Farmers in Haramaya are expected to walk long distance to reach the nearest market as indicated by the
average distance to market. This attributed to the fact that most of the peasant associations of the district are
located far from the district capital, Haramaya town. So, transport costs are therefore, potential constraints
particularly for the farmers in Haramaya district.
The average annual farm income is relatively higher and more variable in Haramaya district than
Kombolcha. The result of the descriptive statistics indicated that the average non/off-farm income was
higher in Kombolcha district. However, there is greater variability among households in Kombolcha district
than in Haramaya.
3.2. Crop choices and trend in Crop diversification
Journal of Economics and Sustainable Development www.iiste.org
ISSN 2222-1700 (Paper) ISSN 2222-2855 (Online)
Vol.2, No.8, 2011
84 | P a g e
www.iiste.org
Land allocation is an indicator of importance of the crop under consideration. Crop portfolio composition
of the study areas seems to contain significantly higher proportion of low- risk low- return crops. To some
extent, on the other hand, they contain low concentration of high value cash crops. Farms in the highlands
are commonly producing vegetables and staple crops and production of chat is common in the mid-
highlands.
The areas allocated to major crops in the study areas for six production years (2004 – 2009) are presented
in Table 3. The data is obtained from the District Agricultural Offices. The area allocated for all crops
remains nearly the same indicating no significant increase in area allocated to both cereal crops and
vegetables for the six years. However, the increase in area allocated for cereals seems higher than that of
vegetables indicating farmers are tending to be less commercialized through time. Hence, there is a need to
revert this tendency.
There appears an increasing trend in diversification in the study areas. As already indicated, analyzing the
trend in diversification may help to know risk-aversion behavior of smallholder farmers. As long as crop
diversification dominates the literature as a dominant risk management strategy, risk-averse smallholder
farmers are characterized by diversified farms. Hence, increase in diversification index with time indicates
increase in risk aversion. Crop diversification as measured by land under each crop has shown an
increasing trend for the 2004 to 2009 production period. There have been changes in the pattern of
agricultural diversification at the district level. Farms keep on diversifying their farms and the usual notion
of crop diversification as a risk management practice is also approved in the present study. The study also
found that farmers in eastern Hararghe highlands of Ethiopia are tending to be risk-averse over time. The
major contributor to increased farm diversification is also believed to be the increase in land fragmentation
in the study area. This has important implication to technology adoption behavior of smallholder farmers.
With increase in risk aversion through time, farmers might become more reluctant to adopt technologies.
3.3. Pattern of crop diversification
The different forms of crop diversification are crop rotation and intercropping. Intercropping is the most
common form of enterprise diversification in eastern Hararghe. The result of the survey indicates that
farmers intercrop for three major reasons: to increase soil fertility, better use of resource (land in this case
since it is scarce) and for minimizing risk due to loss from another enterprise(s). According to Bezabih and
Hadera (2007), the advantage of intercropping may also entail supplementary relationship which calls for
physical support of one crop to the other crop and erosion control through providing continuous leaf cover
over the ground surface.
Crop rotation is believed to reduce disease incidence and increase soil fertility. Intercropping might allow
efficient use of land by growing more crops together. Farm diversification is growing different crops on
different plots hence reduce risk of losing crops from all fields. The survey result also indicated that
intercropping as a form of diversification plays significant roles. About 78% of the respondents indicate
that their reason for intercropping is to reduce risk of losing yield from crop due to specialization. Other
reasons for intercropping were shortage of land and to increase soil fertility by intercropping with
vegetables and leguminous crops. This result indicates that farmers in the study area are much concerned
about land scarcity, soil fertility and risk management.
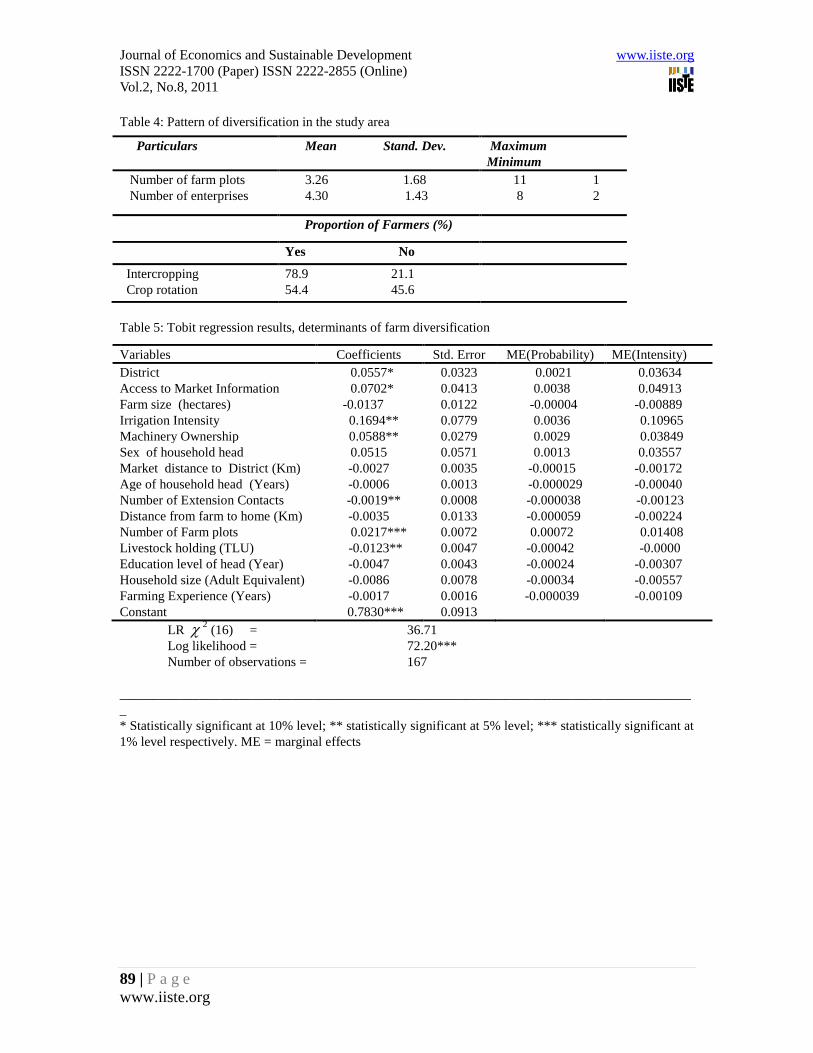
The proportion of farmers practicing crop rotation and crop rotation, average number of farm plots operated
and number of crops grown in a single production period are indicated in Table 4. The result indicated that
significant proportion of the sample farmers practice crop rotation and intercropping. The major crop
rotation practices are sorghum between two vegetable crops and vegetables between maize years. The
result related to the average number of farm plots operated by a household indicates that a household on
average operates about 4 farm plots. This indicates that farm land fragmentation is persistent in the area. A
typical farmer grows 4 crops in a single production period. If number of enterprises grown by a farmer is
taken as a measure of crop diversification, it tells that the farmers are diversifying their production.
Journal of Economics and Sustainable Development www.iiste.org
ISSN 2222-1700 (Paper) ISSN 2222-2855 (Online)
Vol.2, No.8, 2011
85 | P a g e
www.iiste.org
3.4. Determinants of Farm Diversification
The results of a Tobit model which analyzed covariates of crop diversification were estimated using
STATA Version 9.10 statistical package. The results are summarized and presented in Table 5.
Multicollinearity was checked using variance inflation factor (VIF) for continuous variables and
Contingency Coefficients for dummy variables. The calculated VIF values are all less than 10 (the cut-off
point) and contingency coefficients were less than 0.75 (the cut-off point) which indicated that
multicollinearity is not a serious problem. Since the Tobit model has a probit component and its results are
sensitive to the assumption of homoscedasticity, a robust standard error Tobit regression was run.
The coefficient of livestock ownership as is negative and significant at 5% indicating an inverse
relationship between livestock ownership and crop diversification. The explanation for the result is,
livestock as measure of wealth may act as insurance against crop production risk, bearing a negative
relationship with crop diversification. So, households with large number of livestock are less likely to grow
more crops. The result is consistent with the findings of Benin et al. (2004), but in contrast to that of Feiten
et al. (2009).
The positive coefficient for the number of farm plots operated by a household indicates that households
with more number of farm plots are more likely to diversify by growing different crops on each plot of
land. The variable is significant at 1% probability level. More fragmented farms with larger numbers of
farm plots have more crops that are likely to be grown more evenly since the farm plots are approximately
of equal size. Likewise, by diversifying plot locations across the soil toposequence, farmers are able to
reduce plot-yield co-variation and thus reduce aggregate production variability. The result of the study is in
line with the finding of Berhanu & Moti (2010) who found land fragmentation to be most important
determinant of crop diversification. An increase in farm plots will increase the intensity of diversification
by 1.40% on average.
Access to market information significantly affects crop diversification at 10% probability level. Households
having access to market information are more likely to diversify their production since they have the
information related to supply, demand and prices of most crops.
It is evident from the result that households who own farm machinery (water pump) are more likely to
diversify because they can properly perform different farming operations on time and can market their
produce easily. The variable is significant at 5% probability level and the result is consistent with the
finding of Muhammed et al. (2008). Owning machinery (water pump) is related to an increase in
probability of crop diversification by 0.29% and the intensity by 3.85% on average.
There appears a negative and significant relationship between number of extension contacts per year and
crop diversification and the coefficient is significant at 5% probability level. This might be associated with
the extension system which is concentrated on enhancing farmers’ productivity and profitability which
favors specialization at micro-level and overlooks the role of crop diversification in risk minimization. The
result is consistent with the finding of Fetien et al. (2009) and in line with the explanation of Richard
(1998) who stated that extension contact has discouraged intercropping for a number of years and has
promoted the growing of pure crops targeted for commercial purposes. The result is also supported by
Ayinde et al. (2008) where positive relationship was found between risk coefficients of the household and
their access to extension services.
Irrigation intensity measured as the proportion of area irrigated was found to significantly and positively
affect crop diversification at 10% probability level. Farmers who have access to irrigation have
opportunities to grow more crops. This is observed in the study area where farmers having access to
irrigation grow vegetables on their farms. The result of this study is in line with the explanation of Lonnie
et al. (1989) who found positive relationship between irrigation and enterprise diversification.
Finally, geographical location of farms determines cropping pattern, rainfall, soil productivity and so on.
To this end, in addition to the diversity with respect to Peasant associations within the sample districts, a
district dummy was defined and included in the model. The result indicates that compared to farmers in
Kombolcha district (northern part), farmers in Haramaya district (North central part) are more likely to
Journal of Economics and Sustainable Development www.iiste.org
ISSN 2222-1700 (Paper) ISSN 2222-2855 (Online)
Vol.2, No.8, 2011
86 | P a g e
www.iiste.org
diversify their farms. However, this difference may be attributed to variables which are not important for
classifying the two districts as having different farming systems or the differentiating factor might be
simply location of farms in the study area.
4. Conclusion and Policy Issues
4.1. Conclusion
Considering the multidimensional importance of crop diversification as a risk management strategy and an
engine for ensuring food security, the present study was conceived to assess the patterns, trend and
determinants of crop diversification at farm level.
Large number of farmers practices crop rotation and intercropping for different important reasons which
include reducing disease and pest infestations, manage with land scarcity, improving soil fertility and
reducing risks. There appears an increasing trend in crop diversification which attributes to increase in area
allocated to cereal crops. This indicated that farmers are tending to be more risk-averse and this will have
an implication in technology adoption and agricultural development in the area.
A modified entropy index was considered as an approach to measure crop diversification based on area in
hectare under each crop. The Tobit estimates indicates that access to market information, irrigation
intensity, machinery ownership, livestock size, extension contact, number of farm plots and location of
farms are found to be the most important factors that significantly influence crop diversification.
4.2. Policy Implications and Further Research
Based on the empirical evidences, the following recommendations are suggested to promote crop
diversification which is a mechanism for farmers for avoiding risks and to ensure a sustainable level of
farm returns.
Policy makers need to devise a way to revert the farmers’ tendency to become more risk-averse
through time. This might improve farmers’ technology adoption decisions.
Attention should be given to design strategies so that farmers might diversify their production to
high value crops leaving small land for staple cereal crops.
Farm machinery especially water pumps should be provided through easy loan schemes and
investment in irrigation projects would also save the farmers from drought and erratic rainfall.
Access to market information need to be given attention. Infrastructures like farm to market roads
and access to markets can play positive role in enhancing diversification among farmers.
The extension system should not stick only to increasing productivity or profitability; risk
reduction should be part and parcel of an extension system. Negative relation between
diversification and extension contact urges that production under risk should be made part of
farmers’ training and extension programs brought in to improve the efficiency of individual farms.
Diversification of farming is very useful investment to mitigate risk. Inclusion of livestock
enterprises might minimize the risks in the farming. In addition, it might contribute to efficient use
of labor. Hence, future research in the areas should integrate livestock in the model.
Even though crop diversification is thought to be dominant risk management strategy, further
study regarding farmers’ perception about it, its costs and benefits need to be explicitly studied.
5. References
Alison, K. B. (2010), “Crop Diversification and Technology Adoption: The Role of Market Isolation in
Ethiopia”, M Sc Thesis, Montana State University, Bozeman, Montana.
Ayinde, O. E., Omotesho, O. A., & Adewumi M.O. (2008), “Risk attitudes and management strategies of
small-scale crop producers in Kwara State, Nigeria: A ranking approach”, African journal of business
Management 2(12): 217-221.
Journal of Economics and Sustainable Development www.iiste.org
ISSN 2222-1700 (Paper) ISSN 2222-2855 (Online)
Vol.2, No.8, 2011
87 | P a g e
www.iiste.org
Belaineh, L. (2003), “Risk Management Strategies of Smallholder Farmers in the Eastern Highlands of
Ethiopia”, Doctoral Thesis, Swedish University of Agricultural Sciences, Department of Rural
Development Studies, Uppsala.
Benin, S. M., Smale, Gebremedhin, B., Pender, J. & Ehui, S. (2004), “The determinants of cereal crop
diversity on farms in the Ethiopian Highlands”, Contributed paper for the 25th
International Conference of
Agricultural Economists, Durban, South Africa.
Berhanu G. & Moti J. (2010), “Market Orientation, Diversification and Market Participation of
Smallholders: Evidence from Ethiopia”, World Food System - A Contribution from Europe, Tropentag,
Zurich. International Livestock Research Institute (ILRI), Improving Productivity and Market Success
(IPMS) Project, Ethiopia.
Bezabih E. & Hadera G. (2007), Constraints and Opportunities of Horticulture Production and Marketing in
Eastern Ethiopia. Drylands Coordination Group Report No. 46
Briglauer, W. (2000), “Motives for Firm Diversification: A survey on Theory and Empirical Evidence”,
WIFO, Working Papers, Vol. 26, pp. 151-153.
Dercon, (2002), “Income risk, coping strategies and safety nets”, The World Bank Research Observer,
17(2). 141.
Fetien A., Asmund B. & Melinda S. (2009), “Measuring on Farm Diversity and Determinants of Barely
Diversity in Tigray: Northern Ethiopia”.
Girma, T. (2002), “Management of Moisture Stress Risk in Crop Production in North Eastern Ethiopia: The
Case of Kalu District”, M Sc Thesis, School of Graduate Studies, Alemaya University, Ethiopia.
Greene, W. (2000), Econometric Analysis, 4th
edition, NJ. Prentice-Hall Inc. Upper Saddle River, NJ.
Jema, H. (2008), “Economic Efficiency and Marketing Performance of Vegetable Production in the Eastern
and Central Parts of Ethiopia”, Doctoral Thesis, Swedish University of Agricultural Sciences, Faculty of
Natural Resources and Agricultural Sciences, Department of Economics, Uppsala. 42p.
Lonnie, R., Vandeveer, Kenneth W. Paxton, & David, R. L. (1989), “Irrigation and potential diversification
benefits in humid climates”, Southern Journal of Agricultural Economics, 167-174.
Mishra, A. & El-Osta H. (2002), “Risk Management through Enterprise Diversification. A farm level
Analysis”, Paper presented at AAEA meetings in Long Beach, CA, U.S.A.
Muhammed, A., Hassan, S., Nasser M. Z., Irfan A. B. & Asma, J. (2008), “Factors Affecting Farm
Diversification in Rice-Wheat”, Department of Agricultural Economics, University of Agriculture,
Faisalabad.
Richard, F. (1998), “Risk Diversification Opportunities through Legumes in smallholder farming systems
in the semi arid areas of Zimbabwe”.
Tefera, T. L., Kirsten J. F. & Perret, S. (2003), “Market Incentives, Farmers’ Response and a Policy
Dilemma: A Case Study of Chat Production in the Eastern Ethiopian highlands”, Agrekon, 42: 3
Weiss, C. R. & Briglauer, W. (2000), “Determinants and Dynamics of Farm Diversification”, Working
paper EWP 0002. Department of Food Economics and Consumption Studies, University of Keil.
Notes
Note 1. Kola (lowland) agro-climatic zone (500-1500 m.a.s.l.) is characterized by annual mean rainfall of
410-820 mm and temperature of 20-250C. Woinadega (mid-highland) agro-ecological zone (1500-2300
m.a.s.l.) is characterized by an average annual rain fall of 600-2000 mm and mean temperature of 15-200C (
Hurni 1995 cited in Belaineh 2003).
Note 2. Chat or khat (Catha edulis) is cultivated as cash crop for its young leaves and tender stems chewed
as a mild natural stimulant, which like coffee or alcoholic beverages, plays an important role in the social
life of people in Ethiopia in general and in Hararghe and Somali region in particular ( Klingele 1998).
Journal of Economics and Sustainable Development www.iiste.org
ISSN 2222-1700 (Paper) ISSN 2222-2855 (Online)
Vol.2, No.8, 2011
88 | P a g e
www.iiste.org
Note 3. Ethiopia is a federal state of regions. Every region is administratively structured into zones and
zones are again divided into weredas which are called districts. Every wereda is divided into Peasants
Association, which is the lowest administrative unit. The peasant associations are called Kebeles in urban
areas.
Table 1: Summary statistics of the sample households (categorical variables) (%)
Variables Haramaya Kombolcha Total
Sex of household head
Male 97.9 92.5 95.4
Female 2.1 7.5 4.6
Marital Status of household head
Single 3.2 1.3 2.3
Married 96.8 98.7 97.7
Educational level of household head
Illiterate 69.5 25 49.1
Elementary/Primary 28.4 71.25 48.1
High School and above 2.1 3.75 2.8
Table 2: Summary statistics of the sample households (continuous variables)
Variables
Haramaya Kombolcha Total
Mean SD Mean SD Mean SD
Age of head (Years) 42.18 11.56 37.54 9.85 40.06 11.03
Farming Experience (Years) 21.51 9.72 16.96 9.55 19.39 9.87
Family Size (Persons) 6.03 1.7 6.74 1.87 6.35 1.81
Family Size (Adult Equivalent) 4.87 1.43 5.08 1.55 4.97 1.49
Farm Size (hectares) 0.74 0.59 0.41 0.22 0.59 0.49
Distance to market (Km) 7.9 4.14 3.28 2.69 5.73 4.21
Distance to farm (Km) 1.051 0.834 0.677 0.841 0.889 0.855
Livestock Owned (TLU) 3.05 2.52 2.72 2.79 2.89 2.64
Farm Income (Birr) 12 050.46 12 138.60 8,541.4 6,857.83 10 201.20 9,076.5
Non/Off farm Income (Birr) 144.04 333.75 247.95 1357.29 193.76 953.57
Table 3: Proportion of area allocation and diversification index for the 2004 – 2009 production period
Crops 2004 2005 2006 2007 2008 2009
Maize 0.183 0.183 0.182 0.189 0.182 0.188
Sorghum 0.139 0.138 0.139 0.166 0.146 0.154
Potato 0.049 0.063 0.0634 0.055 0.060 0.058
Onion 0.051 0.026 0.033 0.048 0.059 0.041
Beet root 0.0057 0.0074 0.0079 0.012 0.015 0.0071
Cabbage 0.0056 0.0052 0.0057 0.012 0.0137 0.0094
Carrot 0.0050 0.0044 0.0057 0.013 0.016 0.0051
Diversification Index 0.439 0.427 0.437 0.496 0.493 0.462
Journal of Economics and Sustainable Development www.iiste.org
ISSN 2222-1700 (Paper) ISSN 2222-2855 (Online)
Vol.2, No.8, 2011
89 | P a g e
www.iiste.org
Table 4: Pattern of diversification in the study area
Particulars Mean Stand. Dev. Maximum
Minimum
Number of farm plots
Number of enterprises
3.26 1.68
4.30 1.43
11 1
8 2
Proportion of Farmers (%)
Yes No
Intercropping
Crop rotation
78.9 21.1
54.4 45.6
Table 5: Tobit regression results, determinants of farm diversification
Variables Coefficients Std. Error ME(Probability) ME(Intensity)
District 0.0557* 0.0323 0.0021 0.03634
Access to Market Information 0.0702* 0.0413 0.0038 0.04913
Farm size (hectares) -0.0137 0.0122 -0.00004 -0.00889
Irrigation Intensity 0.1694** 0.0779 0.0036 0.10965
Machinery Ownership 0.0588** 0.0279 0.0029 0.03849
Sex of household head 0.0515 0.0571 0.0013 0.03557
Market distance to District (Km) -0.0027 0.0035 -0.00015 -0.00172
Age of household head (Years) -0.0006 0.0013 -0.000029 -0.00040
Number of Extension Contacts -0.0019** 0.0008 -0.000038 -0.00123
Distance from farm to home (Km) -0.0035 0.0133 -0.000059 -0.00224
Number of Farm plots 0.0217*** 0.0072 0.00072 0.01408
Livestock holding (TLU) -0.0123** 0.0047 -0.00042 -0.0000
Education level of head (Year) -0.0047 0.0043 -0.00024 -0.00307
Household size (Adult Equivalent) -0.0086 0.0078 -0.00034 -0.00557
Farming Experience (Years) -0.0017 0.0016 -0.000039 -0.00109
Constant 0.7830*** 0.0913
LR 2 (16) = 36.71
Log likelihood = 72.20***
Number of observations = 167
______________________________________________________________________________________
_
* Statistically significant at 10% level; ** statistically significant at 5% level; *** statistically significant at
1% level respectively. ME = marginal effects
This academic article was published by The International Institute for Science,
Technology and Education (IISTE). The IISTE is a pioneer in the Open Access
Publishing service based in the U.S. and Europe. The aim of the institute is
Accelerating Global Knowledge Sharing.
More information about the publisher can be found in the IISTE’s homepage:
http://www.iiste.org
The IISTE is currently hosting more than 30 peer-reviewed academic journals and
collaborating with academic institutions around the world. Prospective authors of
IISTE journals can find the submission instruction on the following page:
http://www.iiste.org/Journals/
The IISTE editorial team promises to the review and publish all the qualified
submissions in a fast manner. All the journals articles are available online to the
readers all over the world without financial, legal, or technical barriers other than
those inseparable from gaining access to the internet itself. Printed version of the
journals is also available upon request of readers and authors.
IISTE Knowledge Sharing Partners
EBSCO, Index Copernicus, Ulrich's Periodicals Directory, JournalTOCS, PKP Open
Archives Harvester, Bielefeld Academic Search Engine, Elektronische
Zeitschriftenbibliothek EZB, Open J-Gate, OCLC WorldCat, Universe Digtial
Library , NewJour, Google Scholar
Copyright © 2022 FDOKUMEN


![smallholders in Marathwada, Maharashtra state [India]](https://static.fdokumen.com/doc/165x107/632768b35c2c3bbfa80429ba/smallholders-in-marathwada-maharashtra-state-india.jpg)