International Conference - REDETE
912
-
Upload
khangminh22 -
Category
Documents
-
view
0 -
download
0
Transcript of International Conference - REDETE


Second REDETE Conference
ECONOMIC DEVELOPMENT AND ENTREPRENEURSHIP IN TRANSITION ECONOMIES:
A Search for New Paradigms
CONFERENCE PROCEEDINGS
Banja Luka,
October 25-27, 2012
ISSN 2233-1034 • ISBN 978-99938-46-54-3

International Conference
ECONOMIC DEVELOPMENT AND ENTREPRENEURSHIP IN TRANSITION
ECONOMIES: A Search for New Paradigms
2nd
REDETE 2012

Publisher: Faculty of Economics, University of Banja Luka
Majke Jugovica 4 78 000 Banja Luka, RS, BiH
Phone: + 387 51 430 012 Fax: + 387 51 430 053
For the Publisher: Novak Kondić, Dean
Editor: Jovo Ateljević
Reviewers / Editorial Board:
Peter Rosa, UK Carlos Fernandez, Portugal Alistair R Anderson, UK
Ljiljana Erakovic, NZ Stephen Page, UK
Anna Rogut, Poland Vassilis Fouskas, UK Jelena Budak, Croatia
Friederike Welter, Sweden Irena Ateljevic, Netherlands
Slavica Singer, Croatia Kiril Todorov, Bulgaria Fuada Stankovic, Serbia
Ljubinka Joksimovic, Serbia Tony O’Rourke, UK
Dejan Jovic, Croatia Marijan Cigula, Croatia Bojan Zecevic, Serbia
Nikola Vukmirovic, BiH Zdravko Todorovic, BiH
Sasa Petkovic, BIH Jovo Ateljevic, BiH Željko Vaško, BiH
Darko Petkovic, BiH Veland Ramadini, FRY Macedonia
Zhelyu Vladimirov, Bulgaria Radoslav Grujic, BiH
Nexhbi Veseli, FRY Macedonia Biljana Predić, Serbia Branko Ljutić, Serbia

Organizing Committee:
Jovo Ateljević, Chairperson Dragana Došenović, Conference secretary
Branka Zolak Poljašević
Željana Jovičić Marijana P. Milić Mario Milanović
Tajana Serdar Goran Radivojac Dejan Mikerević Darko Milunović
Jelena Tešić Dragan Gligorić
Dragan Milovanović Stefan Pajić Tina Marić
Dalibor Rodić Deana Lolić
Slobodan Miščević
Typesetting: www.eradovi.com
Cover Design: www.eradovi.com

Copyright © Faculty of Economics in Banja Luka, Banja Luka, 2011 All rights reserved. No part of this publication may be reproduced, stored in retrieval system, or transmitted in any form or by any means, electronic, mechanical, photocopying, recording or otherwise, without the prior permission of the Faculty of Economics, University of Banja Luka.
ISSN 2233-1034 • ISBN 978-99938-46-54-3
CIP - Каталогизација у публикацији Народна и универзитетска библиотека Републике Српске, Бања Лука 33(082) INTERNATIONAL Scientific Conference "Economic Development and Entrepreneurship in Transition Economies: A Search for New Paradigms" (2 ; 2012 ; Banja Luka) Conference proceedings / International Scientific Conference "Economic Development and Entrepreneurship in Transition Economies: A Search for New Paradigms", Banja Luka, october 25-27, 2012 ; [managing editors Jovo Ateljević, Dragana Došenović]. - Banja Luka : Faculty of Economics, 2013. - 892 str. : ilustr. ; 30 cm Na nasl. str.: Second Redete Conference. - Bibliografija uz sve radove. ISBN 978-99938-46-54-3 COBISS.BH-ID 3641880

Second REDETE Conference Economic Development and Entrepreneurship in Transition Economies:
A Search for New Paradigms
Under the support of: Government of Republic of Srpska
Minister of Science and Technology Professor Jasmin Komić, PhD
Programme Committee: Jovo Ateljević, Chairperson (RS-BiH) David Smallbone, Chairperson (UK)
Peter Rosa, UK Carlos Fernandez, Portugal Alistair R Anderson, UK
Ljiljana Erakovic, NZ Stephen Page, UK
Anna Rogut, Poland Vassilis Fouskas, UK Jelena Budak, Croatia
Friederike Welter, Sweden Irena Ateljevic, Netherlands
Slavica Singer, Croatia Kiril Todorov, Bulgaria Fuada Stankovic, Serbia
Ljubinka Joksimovic, Serbia Tony O’Rourke, UK
Dejan Jovic, Croatia Marijan Cigula, Croatia Bojan Zecevic, Serbia
Nikola Vukmirovic, BiH Zdravko Todorovic, BiH
Sasa Petkovic, BIH Jovo Ateljevic, BiH Željko Vaško, BiH
Darko Petkovic, BiH Veland Ramadini, FRY Macedonia
Zhelyu Vladimirov, Bulgaria Radoslav Grujic, BiH
Nexhbi Veseli, FRY Macedonia Biljana Predić, Serbia Branko Ljutić, Serbia

Sponsors of the 2nd REDETE Conference Economic Development and Entrepreneurship in Transition Economies:
A Review of Current Policy Approaches

Contents:
PART ONE: ECONOMIC CRISES, BUSINESS ENVIRONMENT, TRANSITION
AND NATIONAL MARKET POSITIONING
THE IMPACT OF ECONOMIC CRISIS ON THE EASE OF DOING BUSINESS IN THE WESTERN BALKANS COUNTRIES ..................................................................................................... 9
OPENNESS TO TRADE AND VULNERABILITIES OF SMALL TRANSITIONAL ECONOMIES IN THE GLOBAL ECONOMIC CRISIS .................................................................................... 22
REMITTANCES AND THEIR EFECTIVENESS FOR POVERTY REDUCTION IN ALBANIA .................. 34
NEW TRENDS AND CHALLENGES OF DEVELOPMENT ECONOMICS ................................................... 45
ECONOMIC CRISIS IMPACT ON DEVELOPMENT OF STRESS AT EMPLOYEES .................................. 55
THE EFFECTS OF THE GLOBAL FINANCIAL CRISIS ON DEBT FINANCING: CROATIA VS MACEDONIA ............................................................................................................................. 64
MEASURING THE QUALITATIVE COMPETITIVENESS OF THE MACEDONIAN ECONOMY ........... 76
IMPACT OF THE ECONOMIC CRISIS ON ACCOMMODATION ESTABLISHMENTS IN CZECH REPUBLIC .................................................................................................... 87
THE COMPETITIVE POSITION OF BOSNIA AND HERZEGOVINA IN THE WESTERN BALKAN REGION ............................................................................................................ 98
PART TWO: ENTREPRENEURSHIP, INNOVATION, ENTREPRENEURSHIP INFRASTRUCTURE
INNOVATION-ORIENTED ENTREPRENEURSHIP AND SOCIO-ECONOMIC DEVELOPMENT .......... 110
INNOVATION AS THE DRIVING FORCE OF GROWTH IN SMALL ENTERPRISES ............................. 123
THE IMPACT OF BUSINESS INCUBATORS AND INNOVATION CENTERS ON THE DEVELOPMENT OF THE MACEDONIAN ECONOMY ............................................................... 130
FOSTERING INNOVATIONS ON FACULTIES AND NEED OF CONNECTING THEM TO THE BUSINESS SECTOR .............................................................................................................. 139
BUSINESS FORECASTING IN THE FUNCTION OF GROWTH AND DEVELOPMENT OF ENTERPRISES BASED ON NEW TECHNOLOGIES AND INNOVATIONS ......................................... 150
BUSINESS INCUBATORS AS TOOLS FOR DEVELOPMENT OF MICRO AND SMALL-SIZED ENTERPRISES IN SERBIA ......................................................................................... 162
PART THREE: INTELLECTUAL AND SOCIAL CAPITAL, KNOWLEDGE ECONOMY
MEASURING INTELLECTUAL CAPITAL IN THE BANKING SECTOR IN THE REPUBLIC OF MACEDONIA ............................................................................................................ 172
INTELLECTUAL CAPITAL – DEVELOPMENT RESOURCE AND KEY COMPETITIVENESS FACTOR OF 21st CENTURY ................................................................... 185
KNOWLEDGE SHARING IN THE ALBANIAN EMERGING ECONOMY ................................................. 196
SOCIAL CAPITAL: AN ASSET FOR IMPROVING PUBLIC SECTOR PERFORMANCE.......................... 200
GENERATING INNOVATIONS AND IMPROVEMENT OF PERFORMANCE OF COMPANIES USING KNOWLEDGE CHAIN MODEL .......................................................................... 220
REDETE – ECONOMIC DEVELOPMENT AND ENTEREPRENEURSHIP IN TRANSITION ECONOMIES
2
PART FOUR: EXTERNAL FINDINGS, EU AND OTHER FUNDS,
PRIVATE-PUBLIC PARTNERSHIP
DEVELOPMENT OF MORE COMPLEX STRUCTURE OF FINANCIAL MARKETS' INSTITUTIONS IN BOSNIA AND HERZEGOVINA .................................................................................... 229
THE CAPITAL MARKET DEVELOPMENT IN THE FUNCTION OF EFFICIENT PORTFOLIO MANAGEMENT IN THE REPUBLIC OF MACEDONIA .............................................................................. 240
PARTNERING UNIVERSITIES AND COMPANIES IN RUSSIA: EFFECTS OF NEW GOVERNMENT INITIATIVE .......................................................................................................... 248
CAPACITY FOR ACCEPTANCE AND USE OF PRE-ACCESSION FUNDS OF THE REPUBLIC OF MACEDONIA ............................................................................................ 260
DOES LEASING WORK IN DEVELOPING ECONOMIES .......................................................................... 270
INTERNATIONAL TRADE OF GOODS AS A DETERMINANT OF GDP GROWTH IN CROATIA .................................................................................................................... 286
ECONOMIC DEVELOPMENT IN TRANSITION ECONOMIES:
WHAT AND HOW IS NEEDED TO BE IMPROVED IN THE AREA OF SOCIAL VALUES?................... 302
VENTURE CAPITAL AND PRIVATE EQUITY ACTIVITIES IN WESTERN BALKANS COUNTRIES ......................................................................................................... 317
PART FIVE: STRATEGIES, INTERNATIONALISATION, BUSINESS DEVELOPMENT AND GROWTH
BUSINESS STRATEGIES FOR COMPANIES IN TRANSITION COUNTRIES AT GLOBAL CONDITIONS...................................................................................................... 330
HIGH GROWTH ENTREPRENEURSHIP IN BOSNIA AND HERZEGOVINA – IMPORTANCE, CURRENT STATE AND PERSPECTIVES ....................................................................... 337
GROWTH ASPIRATIONS OF THE EARLY-STAGE ENTREPRENEURS: EMPIRICAL INVESTIGATION OF THE SOUTHEAST EUROPEAN COUNTRIES .................................. 346
THE DEVELOPMENT OF CONCEPT OF CALCULATION COST MODEL FOR THE COMPANIES OF THE TRANSITIONAL ECONOMIES ............................................................... 358
REVITALIZATION STRATEGY OF COMPANIES IN CRISIS .................................................................... 370
AN ANALYSIS OF COMMODITY TRADE BETWEEN POLAND AND BOSNIA AND HERZEGOVINA ............................................................................................................. 379
COMPARATIVE ANALYSIS OF PRESENT MARKETING STRATEGY: DAVID VS. GOLIATH IN CONFECTIONERY INDUSTRY ......................................................................... 400
APPLICABILITY OF THE PORTER’S VALUE CHAIN TO THE SERVICE SECTOR: EXAMPLE OF THE BANKING SECTOR ....................................................................................................... 409
PART SIX: BUSINESS COMPETIVENESS, BUSINESS ORGANIZATION
BUSINESS ETHICS AND COMPANY PERFORMANCE ............................................................................. 423
INFORMAL ORIGIN, FIRM PERFORMANCE AND CONDUCT IN THE BALKANS ............................... 434
ENCOURAGE ECONOMY DEVELOPMENT BY GREEN TECHNOLOGY INTRODUCTION ................. 461
TECHNOLOGICAL EVOLUTION IN THE FINANCIAL SERVICES MARKETING CONCEPT .............. 469

REDETE – ECONOMIC DEVELOPMENT AND ENTEREPRENEURSHIP IN TRANSITION ECONOMIES
3
THE COST OF CAPITAL IN THE REPUBLIC OF SRPSKA ......................................................................... 480
TYPICAL PROBLEMS OF REORGANIZATION IN SERBIAN ENTERPRISES ........................................ 495
DIGITAL MARKETING IN THE VIRTUAL SPACE – CHALLENGES FOR COMPANIES IN MACEDONIA AND WESTERN BALKANS ............................................................ 506
CORRELATION BETWEEN COMPETITIVENESS AND QUALITY SYSTEM IN LARGE CROATIAN COMPANIES ............................................................................................................. 513
BUSINESS FORECASTING AS A FUNCTION OF RESTRUCTURING COMPANIES IN CRISIS WITH SPECIAL EMPHASIS ON COMPANIES IN BOSNIA AND HERZEGOVINA ............... 524
TANGIBLE FIXED ASSETS ACCOUNTING ................................................................................................. 536
FINANCING OF CULTURE IN POLAND AND IN FRANCE – COMPARATIVE ANALYSES ................ 543
COMPETITION AND ITS PROTECTION ON SERBIAN RETAIL MARKET ............................................. 558
PODLASIE BUSINES ACTIVITIES ON THE EXAMPLE OF THE COMPANY „SAMASZ” .................... 567
PART SEVEN: GOVERNMENT AND ECONOMIC DEVELOPMENT,
GOVERNMENT POLICIES
APPLICATION OF PRINCIPAL COMPONENT ANALYSIS IN MONITORING INDEBTEDNESS AND EVALUATION OF CHANGES IN PUBLIC DEBT IN BIH ................................... 576
PLEDGE FOR A CHANGE IN EDUCATION OF TODAY’S ECONOMISTS .............................................. 587
ELIMINATION OF RISKS IN THE CONTEXT OF CURRENCY FLUCTUATIONS .................................. 593
THE EFFECTS OF DIRECT TAXATION ON ECONOMIC OPERATORS IN ROMANIA ......................... 610
ТHE IMPACT OF LOCAL GOVERNMENT IN LOCAL DEVELOPMENT WITH PARTICULAR EMPHASIS ON THE REPUBLIC OF MACEDONIA ............................................... 619
DECENTRALIZATION IN A FUNCTION OF REGIONAL DEVELOPMENT IN SERBIA ......................... 627
THE IMPACT OF BUDGETARY SPENDING ON THE ECONOMIC GROWTH IN THE COUNTRIES FROM EASTERN EUROPE ........................................................................................ 635
COORDINATION OF FISCAL AND MONETARY POLICY IN TERMS OF FINANCIAL CRISIS AND THEIR IMPORTANCE FOR THE TRANSITION ECONOMIES .................................................................................................................... 644
IMPACT OF THE COMPETITION POLICY ON THE ECONOMIC DEVELOPMENT IN TRANSITION ECONOMIES ....................................................................................................................... 654
HEALTH AND ECONOMIC GROWTH .......................................................................................................... 664
BENCHMARKING AS A FUNCTION OF CREATING A NEW IMAGE OF ENTERPRENEURSHIP IN THE REGION OF FORMER YUGOSLAVIA .................................................... 674
PART EIGHT: SMES: MANAGEMENT, FINANCING, CHALLENGES AND ISSUE
THE MOST COMMON SYMPTOMS AND CAUSES OF CRISES IN SMALL AND MIDDLE COMPANIES ........................................................................................................................... 681
RISK MANAGEMENT STANDARDS AND SMEs ......................................................................................... 692
FACTORS ENHANCING ECONOMIC PERFORMANCE IN HOSPITALITY. THE PARADIGM OF GREEK HOTEL COMPANIES .................................................................................... 704
IDENTIFICATION OF CONTROLLING AND EVALUATION OF THE USE OF THE INTERNAL FINANCIAL REPORTS IN THE ŠIBENIK KNIN COUNTY SME’s................. 713

REDETE – ECONOMIC DEVELOPMENT AND ENTEREPRENEURSHIP IN TRANSITION ECONOMIES
4
IMPROVING ACCESS TO FINANCE OF SME’S WITH SUBSIDIZED CREDIT LINES: THE CASE OF MACEDONIA .......................................................................................................................... 724
MICROCREDITING AS A FACTOR IN DEVELOPMENT OF SMALL BUSINESS IN BOSNIA IN HERZEGOVINA ...................................................................................................................... 736
PART NINE: ENTREPRENEURIALISM, RESPONSIBLE BUSINESS, CSR
ENTERPRISE ETHICS AS A NECESSARY PARADIGM FOR ENTERPRISE’S DEVELOPMENT .......... 747
SOCIAL ENTREPRENEURSHIP NETWORKING MODELS IN TRANSITION ECONOMIES AS INNOVATIVE TOOLS FOR SUSTAINABLE DEVELOPMENT ..................................... 754
LEVEL OF UNDERSTANDING OF THE CONCEPT OF CORPORATE SOCIAL RESPONSIBILITY IN UNA-SANA CANTON ............................................................................................... 765
BUSINESS ETHICS AND COMPANY PERFORMANCE .............................................................................. 775
PART TEN: TOURISM, REGIONAL DEVELOPED,
CROSS-BORDER COLLABORATION, SUSTAINABILITY
STRATEGIC APPROACH OF SUSTAINABLE MANAGEMENT OF THE DEVELOPMENT OF RURAL TOURISM - A CASE STUDY IN MACEDONIA .......................... 786
THE BENEFITS OF CROSS-BORDER COOPERATION: THE BIHOR-HAJDU BIHAR EUROREGION ................................................................................................. 796
ENTERPRENEURSHIP AS A FACTOR FOR ECONOMIC DEVELOPMENT IN THE CROSS BORDER REGION KICHEVO - KORCA ............................................................................ 813
EVALUATION OF SUSTAINABILITY REPORTING OF CZECH COMPANIES ....................................... 824
PLACE OF SUSTAINABLE TOURISM IN REGIONAL DEVELOPMENT OF SERBIA ............................. 833
THE PROPOSITION OF THE MODEL FOR MANAGING TURISTM RESOURCES OF THE BORDER AREAS – THE BASIS FOR CREATING A TOURIST BRAND ..................................... 845
RURAL TOURISM SUSTAINABLE DEVELOPMENT AND RURAL DEVELOPMENT OF BOSNIA AND HERZEGOVINA................................................................................................................. 852
ENTREPRENEUSHIP AND INNOVATION AS A CONDITION FOR POSITIONING ON THE INTERNATIONAL TOURISM MARKET ........................................................................................ 864
YOUTH CHAMBER OF COMMERCE ............................................................................................................ 872
FEMALE ENTREPRENEURSHIP AS A PRECONDITION FOR CREATING ENTREPRENEURIAL CLIMATE IN THE SOCIETY ..................................................................................... 882
PROMOTION IN FUNCTION OF STRENGTHENING COMPETITIVE ADVANTAGES AND SUSTAINABLE DEVELOPMENT OF RURAL ISTRIA .......................................... 892

REDETE – ECONOMIC DEVELOPMENT AND ENTEREPRENEURSHIP IN TRANSITION ECONOMIES
5
FORWARD
The REDETE conference 2012 sought to identify new paradigms able to accommodate the complexity of economic development and entrepreneurship in transition and developing eco-nomies. In order to solve complex societal problems in these countries an integrated or holistic approach by two or more disciplines is needed. Also, the most recent economic and financial crises have revealed all the key weaknesses that transitional countries, either inherited from the previous system or generated during the transformation process, thus further challenging scholars in the field. In practice, those weaknesses and problems are different from those of developed countries.
Indeed, all relevant evidence indicate that the transition process in most countries has not bro-ught many tangible results in the domain of economic development; low standard of living, no-ticeable poverty, high unemployment, continuous depopulation - constant rural- urban population flows, inappropriate exploitation of natural and other resources, lack of innovation and entre-preneurial culture, a few foreign investment activities, high dependency on public spending and social welfare programmes, increasing external debt are more than visible, even in those countries that are members of the EU. For example, seven countries from central and south-east Europe the latest EU members (Hungary, Romania, Poland, Bulgaria, Czech republic, Slovakia, Slovenia, have generated 861 billion (US$), external debt, 4 times more than it was in 2003 (212bill). Po-verty and unemployment have also increased considerably. As far as the Western Balkan countries concerned (except Albania) in 2010 had the GDP level around or below the level of the 1989. Only Albania had the GDP about 72% higher than in 1989, because 1989 was extremely poor, while Croatia and Macedonia had approximately the same GDP level. GDP of other three countries, Serbia, Bosnia and Herzegovina and Montenegro was considerably lower in 2010 than twenty-one years ago (EBRD, 2010).
It is argued that most of the problems of transitional economies are largely rooted in “a transformed relationship between public policy and markets”. Clearly, this involves shifting the relationship between economics and politics. There is little doubt that in the so-called developed world (which perhaps we can define as OECD membership), there have been stages of change in the “free market” or “capitalist” economy:
- In the 19th century, the liberal economic order ensured that politics and economics were distinct, without much crossover between political and economic structures (only in the area of the military-industrial complex).
- This view was challenged in the 1930’s during the great recession. As a result, states became more engaged in economic direction – probably Swedish social democracy and the social partnership concept is the most coherent definition of that phase.
- However, in the 1980’s that model was strongly challenged by the neo-liberal visions of Reaganomics and Thatcherism. This sought the rolling back of any engagement of the state in economic policy or practice
- In 2010 we have come to realise that neither politics nor economics can provide the answer in full. Markets are as irrational as politicians and quite as capable at making immense mistakes – the financial crisis was the result of politicians wishing not to restrict economic activity and thus supervising it inadequately.
In the future, perhaps we are looking at a more pragmatic model, seeking to build on the very fragile return to growth over the next decade but also assuming that markets are not perfect and there is no model that can replicate the economy in the same way that there is no perfect political environment and no model that can predict the behaviour of the political classes

REDETE – ECONOMIC DEVELOPMENT AND ENTEREPRENEURSHIP IN TRANSITION ECONOMIES
6
Without doubt it is almost impossible to study the current state of the international financial and banking system, and its relevance to the transition economies, without taking account the (near) meltdown of the global financial system during 2007-2009. The crisis that occurred over that period has not ended, it continues to influence and impact on economies, financial systems and the ability of individual entrepreneurs to operate in an effective way.
The crisis has also led us inevitably into questioning previously ingrained assumptions about the free market and its financial system, which was the fruit of the massive era of liberalisation and de-regulation that grew out of the Thatcherite and Reaganite socio-economic philosophies. This has brought commentators in many conferences and debates to raise such questions as:
Do we return to the pre-1980 “utility banking” environment, suggested by the Vicker’s Commission in the UK and the Obama proposals in the USA?
Do we match-and-mend by seeking to make the existing pre-2007 environment fireproof? (The common policy of the Brown and Cameron UK governments)
Do we look for new and more radical solutions? Opinions are inevitably mixed, dependent to a greater or lesser degree on political and
economic standpoints. However, as an example three fairly divergent views can be given: 1. The classic capitalist “hands off” approach – according to this view, the greatest risk faci-
ng the banking industry is not financial but political (CSFI/PricewaterhouseCoopers 2010 “Banking Banana Skins” survey).
2. The Franco-German dirigiste /social market view – this differs by stating that direct inter-vention by the state on behalf of all citizens may be justified even if it reduces the independence of the banking system. More than 50% of the EU’s citizens are suffering the huge burden on tax-payers for bailing out illiquid banks or are suffering from wage reductions, loss of jobs or higher taxes as a result of the crisis.
3. The “new economics approach” – this involves aggressive action by supranational institu-tions to tax speculative financial activities; to curb socially unproductive financial activities; to break up the big global banks, reducing them to a size where the breakdown of three banks would not jeopardise the global economy.
4. Another critical question is: How the Global Financial Crisis 2007-2009 has affected entrepreneurship in transition economies?
The effects of the global financial crisis did not affect European transition economies until the latter part of 2008 as the following factors began to occur:
- Recessionary trends began to affect Germany, France, UK, Netherlands and Scandinavia thus limiting export outflows from the transition countries and foreign direct investment inflows.
- The significant exposure of German, Austrian and Italian banks to Central and South-East Europe and of Scandinavian banks to the Baltic States led them to incur losses on the loan books with (which?) built up during the rapid credit expansion during 2004-2007.
- Manufacturing slowdown in such key manufacturing sectors as the automotive industry led to a knock-on effect in component manufactures in transition countries.
- The same slowdown also contributed to a slowdown in “informal” remittance transfers from countries such as Germany, Switzerland, Netherlands and Sweden. This would particularly affect West Balkan countries – BiH, Macedonia and Serbia – where informal remittances (i.e. grey economy) may easily equate to one third of official GDP.
- The problems of the domination of foreign bank ownership in a number of economies – e.g. BiH, Hungary, Serbia, – produced a greater level of credit starvation for SMEs than in those economies where domestic bank ownership remained fairly significant (e.g. Slovenia).

REDETE – ECONOMIC DEVELOPMENT AND ENTEREPRENEURSHIP IN TRANSITION ECONOMIES
7
Thus we cannot state a common set of reactions or experiences on entrepreneurship in those economies. Undoubtedly, there are some specifically obvious features; countries with high-tec-hnology entrepreneur inputs into major industries affected by the recession (automotive, aero-space) did have problems. Equally, those entrepreneurs providing inputs into the “defensive sector” (pharmaceuticals, environmental energy, agro-food, food retailing and distribution) were able to weather the storm, although the effective collapse of easy trade credits has proved a major issue.
Clearly there are an increasing number of questions, for scholars, policy makers and prac-titioners. Certainly, scholars before others are expected to take a greater part of the responsibilities for being slow in addressing these negative trends/problems and suggesting constructive solutions. New paradigms are needed; it is not simply enough to replicate concepts, methodologies developed over years in the Western world. Papers presented at the Conference have significantly contributed to better understanding issues and problems that face transition economies.
At the beginning of the 21st century political as well as moral issues increasingly surround entrepreneurship and economic development. This is even more apparent in transitional countries where wealth creation of private enterprise is not always transparent, and the role of government and transnational authorities, as some scholars believe is questionable. This conference aims to bring together leading scholars from political studies to contribute to this debate. More specifically, REDETE Politics aims at re-launching the debates and scholarly research on issues such as the relationship between the public and the private spheres, or the ways in which the crisis of globalisation and financialisation impacts upon transitional countries, particularly those from the Balkans and the Near East. How one could view and analyse economic and social development and democratic politics in the region after the twin collapse of Socialism in the East and the Euro-Atlantic economies in the West? How can democratic structures of conflict prevention be built under economic and political scarcity of means to achieve the desired aims of regulation and social welfare? Development is not a post-conflict strategy as seen by the West; rather, it is a conflict prevention strategy that has to flourish in conditions of peace. REDETE Politics examines all these issues, as well as the development of political democracy and plurali-sm, the interaction between the region and the European Union, NATO and other international organisations. Availability of such events is increasing therefore it’s a big challenge to gather bu-sy scholars and practitioners together in any significant number. The link between politics and economic development was well articulated by one of the Conference keynotes Vassilis Fouskas, Prof. of International Relations at London’s Richmond University and the founding Editor of the Journal of Balkans and Near Eastern Studies. His talk was drawn from his recent book on the The Greek Workshop of Debt and the Failure of the European Project.
The Forum continues to attract younger researchers, from south-east Europe in particular. These new scholars appear to be pragmatic and future-oriented, brave, greedless and free-minded.
As we are very much committed to continue with the REDETE conference, we use this opportunity to invite you to the 3rd REDETE conference, which will be held in March 2014.
Banja Luka, Stirling, March, 2012
Programme Committee Chairpersons Jovo Ateljevic & Tony O’Rourke

PART ONE:
Economic Crises, Business Environment, Transition And National Market Positioning

REDETE – ECONOMIC DEVELOPMENT AND ENTEREPRENEURSHIP IN TRANSITION ECONOMIES
9
THE IMPACT OF ECONOMIC CRISIS ON THE EASE OF DOING BUSINESS IN THE WESTERN BALKANS COUNTRIES
Dimitar NIKOLOSKI1 Tanja MICALEVSKA2
Abstract
The region of Western Balkans is often considered as lagging reformer compared with the more developed transition countries. The private sector that mainly consists of small and medium sized enterprises is still not strong enough to bear the development in the region and to absorb the huge mass of unemployed workers. Some of them were transformed as a result of privatisation of the previous state owned companies while others were established as new start-ups. The governments in the Western Balkans countries by recognizing the importance of the private sector for the economic growth, committed themselves to take actions in order to impro-ve the business climate and institutional infrastructure. The recent economic crisis has affected all economies in the world and is manifested by decline in their GDP growth rates and indus-trial production indices, increased unemployment and unfavourable tendencies in their balan-ces of payments. The Western Balkan countries which are characterised by low industrialisation and small capital base are supposed to suffer the most. In this context we pose several research questions: What are the factors that influence the business climate? How can be identified the comparative business advantages and disadvantages? Which policies can be implemented to achieve greater development?
The aim of this paper is to compare the ease of doing business in Western Balkan economies from different aspects such as starting up business, registering property, getting credit, paying taxes, closing business, getting electricity, employing workers etc. before the economic crisis and afterwards. Furthermore, we intend to identify the effectiveness of reforms taken in these countries and their policy implications. The analysis of the relevant factors that lead to best performances will be carried out by using various quantitative techniques such as econometric modelling of panel data. Accordingly, we will formulate policy measures that Western Balkans countries can apply in order to improve their business environment which is conductive to hig-her levels of economic growth. With respect to this, we will take into account the possible limi-tations in this research, such as the availability of data, their quality and validity, as well as the different starting positions of different countries.
Key words: Small and medium sized enterprises, economic crisis, business environment
1 Faculty of economics-Prilep, “Gorche Petrov”, bb 7500 Prilep, Republic of Macedonia 2 Faculty of economics-Prilep “Gorche Petrov”, bb 7500 Prilep,Republic of Macedonia

REDETE – ECONOMIC DEVELOPMENT AND ENTEREPRENEURSHIP IN TRANSITION ECONOMIES
10
1. Introduction
The term “Western Balkans” refers a wide region that includes the following states: Macedo-nia, Serbia, Croatia, Bosnia and Herzegovina, Montenegro, Kosovo and Albania. For many years these societies had social values and practices different from those that can be found in market oriented economies. The transition road of Western Balkans was tiled with good purposes, not so good policies and very bad if any means for implementation of the policies. Although each country has chosen its own path in transforming the society, they all experienced difficulties, ma-de some good but much more, bad decisions which led them lagging behind advanced transition countries. The most significant reasons for the slowdown were the political conflicts and the passion for fulfillment of their national interest.
Nowadays, the region is still characterized with diversity of interests and conflicts delivered from the past. On the other hand, there exists a common interest among different nations to reach greater economic growth, political stability and better living standard for their people through better collaboration. Governments in Western Balkans are aware that they can achieve greater de-velopment by supporting businesses, improving the business climate and becoming more attarc-tive to foreign and domestic investors.
The global recession posed a real threat for these already fragile economies. The lack of demand globally reduced the exports. Foreign investments also decreased. To avoid the negative impact of the crisis on the Western Balkans, most of the governments approached to the problems by introducing strategic development model based on promoting entrepreneurship, stimulating the start ups and supporting the established business. In order to make an attractive ground for running business in Western Balkan economies, they implemented various strategies and instru-ments such as: working on reforms in institutions, building society infrastructure, supporting the policies that improve security, strengthening the financial sector, promoting privatization and entrepreneurship, encouraging the establishment of small and medium enterprises (SMEs).
The aim of this research is to present the reforms undertaken to improve the business climate in the Western Balkans, focusing on the main factors that affect SMEs as dominant form of business in these economies. The basic topics refer to the following broad areas: (i) Reforms in the legislation; (ii) Access to finance; and (iii) Taxation system. For this purpose we use data collected from Doing business reports and apply appropriate statistical analyses in order to detect casual relationships between regulatory reforms, access to credit and taxation system with the ease of doing business. Moreover, by repeatedly measuring the changes in the business environment of the same countries through years, their improvement can be noted and recorded. Having information about each Western Balkan country access in addressing the needs of the private sector, the benefits from reforms and the eventual mistakes is useful for understanding the current state of countries and making recommendations for policymakers in their decisions for the future. In this context we will use the Doing business simulator which will help us in designing appropriate policy recommendations conducive to improvement in the business climate and higher economic growth.
2. Background analysis
The general business environment in Western Balkan countries, regarding social economic and political situation, represent a challenging task. The development problems and negative past experiences can be attributed to two main groups of factors i.e. political and economic that we will further elaborate.

REDETE – ECONOMIC DEVELOPMENT AND ENTEREPRENEURSHIP IN TRANSITION ECONOMIES
11
Political factors
The political factors encompass national instabilities and wars which happened after the brake-up of the former Yugoslavia. These wars proved to be fatal for the lives of many people, damaged the infrastructure and destroyed the industry of all involved countries (Minchev, Lessenski, Stojkovski, & Ralchev, 2010).
The most serious consequences were felt in Bosnia and Herzegovina where the war lasted longer than in other countries and the hate and violence were unseen ever before. The end of the bloodshed came with the USA mediation and the signing of the Dayton Peace Agreement. According the agreement Bosnia and Herzegovina consist of two parts, Republika Srpska and Federation of Bosnia and Herzegovina. Another severely affected country from the wars was Croatia where the war lasted till 1995. The Federal Republic of Yugoslavia consisting of Serbia and Montenegro was also affected from the war, especially because its army took part in the wars in Bosnia and Herzegovina and in Croatia. Eventually, this federation ceased to exist in 2006 when both republics proclaimed their independence. Macedonia was the only country which managed to gain its independence in a peace way, without any conflicts and wars. On the other hand, Albania was not involved in war, even though it felt the negative consequences of the extreme communist regime, characterized by isolation from the outside world, prohibition of private property, dictatorship and violated basic human rights.
After the collapse of communism and the end of the separation wars Western Balkans gradually started to recover. However, Balkan was still uncertain region with possibility of new political escalations. The next war happened in 1999 engendered by an armed conflict for independence of Kosovo. In order to calm the situation, NATO forces intervened and assisted the restoration of the peace. Soon after, in 2001 Macedonia experienced an interethnic conflict between Macedonian army and Albanian armed groups that claimed increased rights for the Albanian minority. Fortunately, due to the involvement of international factor, the included parties reached an agreement signed in Ohrid on August 13, 2001. Since than the Western Balkan countries make efforts to overcame interethnic disagreements and orient their activities towards improving both the internal affairs and relations with neighbors. Nowadays, almost all countries in the region are focused on overtaking the barriers and disputes and improving the political stability in the region.
Economic factors
The main economic factor affecting the economic development in Western Balkans is the inadequacy of the policies and instruments necessary for transition from public to private ownership. During the socialist regime, the Western Balkan economies consisted of large public companies. During the transition to market economy, all countries implemented various strategies in order to ease the privatization process. In what follows we address some of the problems faced during the process of transition.
In Macedonia the process of privatization was long lasting and had dubious epilog. Although the initial concept was to transform the public capital into private by introducing the employee shareholding, latter another model was applied. Instead of being more effective and more market oriented, that model led partly to criminal behavior. As a consequence most of the big firms went bankrupt. The ones that manage to survive rarely remained to exist as a whole. Most of them were fragmented into new small and medium enterprises. In the same time individuals used the opportunity to become their bosses and provide themselves economic security. However their number was small and insufficient to absorb the unemployment created with the failure of entire industries (Nikoloski, D. (2009), (Gveroski, M. and Nikoloski, D. 2006).
In Croatia, similarly as in Macedonia, there privatization occurred after the proclamation of independence, but it was mainly criminal. For instance, capital was accumulated by mechanisms

REDETE – ECONOMIC DEVELOPMENT AND ENTEREPRENEURSHIP IN TRANSITION ECONOMIES
12
of corruption and many employees lost their jobs. The real transition process and liberalization of the economy, started after 2000. Since then a number reforms were designed and implemented which contributed Croatia to become one of the most economically advanced country in the Western Balkans. The macroeconomic conditions improved, private sector was established and new jobs were created. Most of the new registered companies were small and medium enterprises.
Serbia and Montenegro started the privatization process late compared to other countries in the region. Previously the privatization was partial with majority of companies being nationalized. Afterwards, when privatization became obligatory, the process developed successfully and the results were satisfactory. As a result, nowadays in the structure of Serbian economy dominate private small and medium business.
In Albania, transformation of the economy into an open one dominated by market principles was accompanied with many difficulties. Although small the progress in Albania was significant given its unfavorable starting point as a country where private ownership for a long time was forbidden. The privatization process started with privatization of small service businesses, than followed by the state companies, land, flats, and utility sectors as electricity and telecommu-nications.
The transition process in Bosnia and Herzegovina was long lasting and in many respects complicated. To support privatization, international donor institutions offered Bosnia and Herzegovina financial and non financial help. Measures were undertaken, but decision making was conducted on two levels regional and central. The coordination among the two levels was relatively poor which produced unbalances. The need for common strategies and policies was more than evident. It was what international institutions were asking too, in order to keep donor financial help and technical assistance for the private sector development.
At outset of transition to market economy in the Western Balkan countries, it was evident that the key role in the development and job creation would have small and medium enterprises. Gveroski M., Risteska A.,Dimeski S.(2010). However, the number of SMEs was very small. The reason for this was not only the lack of initiative, but also the barriers for functioning and development of enterprises. Among the most common obstacles we can state the following: complex, time consuming and expensive procedures needed for registration and obtaining a license, absence of possibilities for funding, restrictive access to foreign loans, poor financial discipline and insolvency of debtors, frequent changes of the regulative, obsolete production equipment, inefficient organization and small production series, distrust between managers and employs, lack of market information, no adequate promotion of goods and services on the foreign markets. As a consequence, the improvement of a business climate was difficult and required implementation of multidimensional measures.
In these circumstances the Western Balkans pro-European orientation played one of the most important roles in the recovery. The aspirations for integration into the European Union influenced the governments to work permanently on the improvement of the institutional system, regulatory environment and the competitiveness of their economies. The crucial point was the European Summit in Thessalonica in 2003 where the Western Balkan countries endorsed the European Charter for Small enterprises at the European Union (EC, OECD, ETF, EBRD, 2009). Since then process of reforming and creating a favorable business climate was intensified. Nowadays, the aim of each government is to create an open and competitive economy with developed private sector.
The last decade was marked with many projects focused on modernization of the regulation environment, fiscal and monetary systems by making them suitable to the new market and more risk taking ambient. The changes were sizable especially in terms of time and cost for opening, operating and closing businesses. The private sector was established gradually, which resulted in creation of new jobs. Most of the new registered companies were small and medium enterprises and they became respective participants in countries’ GDP.

REDETE – ECONOMIC DEVELOPMENT AND ENTEREPRENEURSHIP IN TRANSITION ECONOMIES
13
3. Reforms of legislation
Laws and regulations have a considerable economic impact. They can be supportive for the businesses or can be considered as a barrier. Most of the Western Balkan countries had inherited legislation from the previous socialistic system that was not suitable for building market oriented economy. In order to reduce the bureaucratic and administrative procedures for enterprises and to promote their growth, governments intervened with various reforms, especially in the field of registration business, registration property, obtaining permits and licenses. First they identified the burdensome regulations, improved the existing legislative and introduced new laws. Then, they made efforts to evaluate the institutional framework in order to review the impact of regulations in terms of its costs and benefits. The progress with respect to reforms of legislation differs from country to country. For instance, Croatia, Macedonia and Serbia implemented systemic improvements of the existing regulations and institutions. On the other hand, Albania, Montenegro, Bosnia and Herzegovina and Kosovo advanced some elements for legislative and administrative simplification but further corrections are needed (Penev & Marusic, 2009).
Croatia was one step ahead the others because except adapting new legislative, also improved the institutional infrastructure and enabled appropriate implementation of the laws. Croatia started the legislative rebuilding process with launching of the Regulatory guillotine program which assumed reviewing the laws, simplifying them and removing the redundant ones. The renewed legislation made it easier to launch an enterprise and cut the time for registering it, first by implementing one stop shop and then by introducing on-line registration. In addition, obtaining construction permits became faster and more efficient with application of the new building code. Also, the property registration system, cadastre and movable register is fully functional and can be accessed on-line.
Macedonia is right behind Croatia because it has adopted strategic approach for better regulation. In Macedonia the Regulatory Guillotine Project was applied to clean the legislation and to create a single national registers for permits and approvals. In 2006 with the introduction of the one stop shop system, starting business in Macedonia became simpler and cheaper. Today the Central register office can process a company registration application for less than a day, unlike before when the same procedure took a couple of days. Another issue is the recognition of the principle “silence is consent” which decreased the degree of delayed or no response from public administration. Land and real estate property registration was eased too.
In Serbia regulative reforms started in 2004 but were intensified after 2008. Aiming to create favorable regulative environment, to reduce the costs and the administrative procedures for enterprises the company registration process from the commercial courts was delivered to the Business regulatory agency and the one stop shop system was implemented. Regarding the registering of property, Serbia has improved its serviceable system for registration of movable assets and has completed the real estate cadastre. Also, the time needed for transferring property, was shorten.
In Albania the procedures for starting a business were renewed, registration was made electronic, the capital requirement was reduced. Also, tax, health insurance and labor registration were consolidated into a single application. Post registration processes and licensing were moderated too. The property registration was improved by setting time limits, property rights were strengthened and the informal constructions legalized. However the administrative barriers are still present and affect enterprises.
In Montenegro segments of regulatory environment were relatively improved and business start up was eased. For illustration, the registration procedures were simplified by introducing one single registration form for tax administration and by implementing a one stop shop system. Also administrative barriers for obtaining permits for start-ups were eliminated by providing new mechanism for permit approval.
Major problem in Kosovo has been the lack of laws, inefficient public services, unfair competition and centralization of institutions in the capital Prishtina. To solve these problems, the

REDETE – ECONOMIC DEVELOPMENT AND ENTEREPRENEURSHIP IN TRANSITION ECONOMIES
14
old legislative was replaced with new modern one, based on European standards. Centralization problem was removed by establishing municipal business centers for registration businesses. In addition, the process for obtaining construction permits was improved, but the delivery of public services, electricity and water supply, is not yet reliable. The cadastral system is operational, but corrupted, which affects the process of registering and transferring property.
In Bosnia and Herzegovina measures were undertaken in order improve the regulatory environment, but only on regional rather than state level. Therefore the success is estimated to be unbalanced, greater in Republika Srpska than in Federation of Bosnia and Herzegovina. The need for common strategies and policies is more than evident. Starting a business in Bosnia and Herzegovina today is a complex process. Registering new businesses takes place in registering courts and procedures are durable, expensive and different in various regions. In the past the number of procedures for obtaining permits was enormous. Now the process is rendered slightly easier as a result to the improvements of the land registry and cadastre. Property register offices are unreliable because transfers must be registered with municipal authorities and transactions have often been not recorded or delayed. In recent time with the computerization of the Land registry in Sarajevo the delays are reduced. Apart from the land register, a register for movable assets has also been established.
To illustrate the position of each country and make comparisons between them, we used data from Doing Business report 2012. The report offers quantitative indicators on business regulations across 183 countries. Indicators are used to calculate countries’ ranks in 10 areas. In this research given ranks for different areas are combined and divided into three groups. The first group presents in one figure together the ranks for all Western Balkan countries regarding the following criteria: dealing with construction permits, getting electricity and enforcing contracts (Figure 1).
As we can see from Figure 1, dealing with construction permits is easier in Macedonia while in Croatia, Serbia, Montenegro and Kosovo the process is more durable and expensive. Albania is lagging behind them all, and improvements such as cutting the number of procedures, time and cost for obtaining the necessary permits. Another major problem for Albania but also for Bosnia and Herzegovina is getting electricity. Macedonian access to electricity is limited, despite the fact that the country has achieved satisfactory rankings in other fields. In other hands, Croatia, Montenegro and Serbia stand better with this regard.
Figure 1.Ranks of the Western Balkan countries with respect to reforms of legislation (Source: Doing business, 2012)
020406080
100120140160180200
Mac
edon
ia
Mon
teneg
ro
Croati
a
Albani
a
Serbia
Kosov
oBiH
Dealing withConstructionPermits -RankGettingElectricity -Rank
EnforcingContracts -Rank

REDETE – ECONOMIC DEVELOPMENT AND ENTEREPRENEURSHIP IN TRANSITION ECONOMIES
15
Enforcing contracts is less complex in Croatia, Macedonia and Albania, while in Kosovo and Montenegro procedures are durable and inefficient.
4. Access to finance
The access to finance is one of the basic conditions for a successful business. It depends from the credit information system, the level of transparency, the legal rights of lenders and borrowers, use of small loans, venture capital and financial instruments (EC. OECD. ETF.EBRD, 2009). In the Western Balkans SMEs finance facilities are constrained, despite the fact that governments continually attempt to remove the barriers. Even thought a number of programs have been adopted in order to encourage access to credit the high interest rates, guarantee requirements are still unfavorable for small and medium enterprises (EC. OECD. ETF.EBRD, 2009).
Credit system in Croatia is transparent. The government has provided loan schemes and guarantee funds for small and medium enterprises. These businesses can contact the Bank for reconstruction and development to SMEs, and get loans under favorable conditions. Apart from credits SMEs can finance themselves by leasing agreements or by issuing stocks on the stock exchange. These forms for financing are rarely used by enterprises, but compared to the previous period, the interest for using them has increased.
In the Republic of Macedonia there are 18 banks, three of them Komercijalna banka, Stopanska banka and NLB Tutunska banka are larger and provide most of the services for the companies. Macedonian Bank for development support is a state owned bank which has a role intermediation between SMEs and commercial banks in order to ease the process of getting loans. However, procedures for getting most of these credits are lengthy. Leasing agreements are present in Macedonia, but companies use them mostly for purchasing of vehicles and less for equipment. The Macedonian stock exchange is operative and transactions are growing, but the equity market is still not developed. The credit information services function properly, the public credit bureau has improved the database and a private bureau was established. Also, guarantee schemes are privately managed. In order to strengthen the rights of borrowers, the law for personal data allows them to check their information in the credit registry OECD. (2010).
In Serbia, banks have special departments for SMEs. In direction of facilitating the access to credit the collateral requirements were reduced, the credit information services began to offer borrowers access to their credit data. Serbian guarantee fund Vojvodina Guarantee fund and other municipal funds issue guarantees for small and medium enterprises. The leasing and private equity funds are alternative sources for financing.
Considering the access to credit in Montenegro, banks offered short term and expensive credits, but enterprises could get credit from micro financing institutions and public institutions like Directorate for development of SMEs, Development fund of Montenegro, etc. Also in Montenegro there are two stock markets. The credit information system was improved in 2010, when public credit registry was established. The registry enabled lenders to inform themselves about the potential borrowers.
Financial sector in Albania is stable with dominant participation of foreign banks such as Raiffeisen International and Intesa Sanpaolo. Some banks, for example Procredit bank, have specialized products for small and medium enterprises. The non-bank sector is still not developed. To improve the information and transparency in the banking sector a credit bureau was established. However, the absence of other means for financing remains a problem.
In Kosovo the availability of finance has been and still is one of the major limitations for small and medium enterprises. The causes are high interest rates, large collateral requirements and ineffective credit information system. There are three main banks with dominant foreign capital. Non-bank institutions, equity markets and venture capital, as means for financing, still are absent. The constraints have been recognized, but, so far little is done to eliminate them.

REDETE – ECONOMIC DEVELOPMENT AND ENTEREPRENEURSHIP IN TRANSITION ECONOMIES
16
In Bosnia and Herzegovina access to credit is limited. Most of the loans are short-term and accompanied with high interest rates. Apart from banks, alternative for financing are microcredit institutions, but enterprises are not always satisfied with their services and conditions. There are two capital markets one in each entity but trading is limited. Consequently, small and medium businesses in Bosnia and Herzegovina have financial problems, and often find themselves into insolvency.
According to the Doing business report 2012 below we present the ranks for Western Balkan countries regarding the following criteria: getting credit, protecting investors, resolving insolvency and trading across borders (Figure 2).
Figure 2. Ranks of the Western Balkan countries with regarding access to finance (Source: Doing business, 2012)
020406080
100120140160180200
Mac
edon
ia
Mon
teneg
ro
Croati
a
Albani
a
Serbia
Kosov
oBiH
Getting Credit- Rank
ProtectingInvestors -Rank
TradingAcrossBorders -RankResolvingInsolvency -Rank
The conditions for getting credit are relatively good in all Western Balkan countries. In the most favorable position for receiving credit are SMEs in Montenegro. In Macedonia, Kosovo, Serbia and Albania there are still issues that need to be improved, but they are in advanced position comparing to Croatia and Bosnia and Herzegovina. The situation with the insolvency in the observed countries is similar. Insolvency remains a major problem in Croatia, Bosnia and Herzegovina and Serbia, while Macedonia, Montenegro and Kosovo show considerable improvements. Considering the strength of investor protections Albania and Macedonia are ahead, followed by Serbia and Bosnia and Herzegovina, and finally by Croatia and Kosovo. The flow of money, goods and services across borders is easiest in Montenegro and Macedonia, whereas Kosovo, Serbia and Bosnia and Herzegovina are lagging far behind.
5. Taxation system
To attract investments and to foster small and medium enterprises growth is a strategic goal of policymakers. It can be achieved only with proper taxation policy, taxation rates and taxation base rules. Although every Western Balkan country has developed its own taxation system based on its own macroeconomic conditions and needs there are some common features such as facilitating

REDETE – ECONOMIC DEVELOPMENT AND ENTEREPRENEURSHIP IN TRANSITION ECONOMIES
17
tax compliance, simplification of the fiscal schemes and improving the tax administration (EC. OECD. ETF.EBRD, 2009).
Tax treatment of small and medium enterprises in Republic of Macedonia, it is beneficial in a number of aspects. First there is an attractive package of taxes for investors such as flat corporate income tax and personal income tax of 10%. VAT is 18% and 5%. Second, reinvested profits are fully exempt from taxation. Third, the social security contribution rates are reduced. Moreover, the tax policy has been used by the government as an advantage in order to promote the country as an attractive investment destination. Therefore, the taxes remained unchanged even when all other Western Balkan countries increased them during the recent economic crisis.
In Serbia all companies regardless their size pay corporate income tax of 10%. Dividends were exempt from the corporate tax. The social security contributions for employers are 11% for the pension insurance, 6.15% for the health insurance. Tax credit of 40% was granted for SMEs for fixed assets investments. VAT rates are 18% and 8% (TaxRates.cc).
In Montenegro the corporate income tax was 9% and the obligation for advance payment of corporate tax was abolished. Capital gains were taxed as normal income and tax loses could be carried 5 years. Social security contributions were 9.8%. The standard VAT tax rate was 17% and the reduced is 7%.
In Kosovo improvements have been made in the taxation system. Therefore, the corporate income tax rate was cut from 20% to 10% and the collection process was reorganized.
In Bosnia and Herzegovina the corporate income tax was reduced from 30% to 10%, the distributed profit was exempt from taxing and the employer contribution rates for social security were decreased. VAT standard tax rate was 17% and some goods and services were exempt.
Regarding the taxation system in Croatia, tax burden has been relatively high, which discourages investors. For instance the income tax rate was progressive between 12% and 40%. Croatia corporate tax rate was flat 20%. Dividends were not subject of tax, capital gains tax is also 20%. Deductions of corporate tax rate were available for new investments and for investing in research and development. The standard VAT rate was 23% and additional reduced rates of 10% and 0%.
In Albania important improvements were made in the fiscal system. The corporate tax was reduced from 20% to 10%, the dividend was exempt from tax payment, VAT general rate was 20%, social security contributions were cut from 20% to 15% and it was introduced electronic system of filing and payment of taxes.
In order to compare economies and explore if they have made paying taxes easier or not, we present in one figure together the following ranks for the Western Balkan countries: starting a business, registering property and paying taxes (Figure 3).

REDETE – ECONOMIC DEVELOPMENT AND ENTEREPRENEURSHIP IN TRANSITION ECONOMIES
18
Figure 3. Ranks of the Western Balkan countries with respect to taxation system (Source: Doing business, 2012)
02040
6080
100120
140160180
Mac
edon
ia
Mon
teneg
ro
Croati
a
Albani
a
Serbia
Kosov
oBiH
Starting aBusiness -Rank
RegisteringProperty -Rank
Paying Taxes- Rank
As shown on the Figure 3 most advanced country in the taxation related areas is Republic of
Macedonia, while Croatia and Kosovo has also encouraging tax policy. On the other side, in Montenegro, Bosnia and Herzegovina, Serbia and Albania taxation system should be improved. Starting a business there is fast and cheaper comparing with other Western Balkans. With this regard, in a particularly unfavorable position are entrepreneurs in Bosnia and Herzegovina, and especially in Kosovo. Registering property is simpler in Serbia and Macedonia. Albania, Bosnia and Herzegovina and Kosovo are slipping behind. Than provide appropriate interpretation and comparisons
6. The implications of the economic recession
The global economic crisis started as a credit crunch in USA, then continued as a debt crisis in Europe and affected almost all countries in the world. Western Balkan countries did not remain apart from the global recession. Their close relations with European Union led to slipping over the crisis in this region. The main factors that contributed for spreading the crisis were weak global demand, decreased international trade and reduced sources for financing, whether it is for donations, loans or direct investments (European Commission, 2009).
At the very beginning of the crisis, the Western Balkan region didn’t feel much of the negative effects. The economic growth recorded in the years before continued in the first half of 2008. Consequences started to feel in the second half of 2008 when the growth rates declined, but they were still positive. As the crisis developed and affected European countries, the production, employment and investments in Western Balkans decreased. Growth rates drastically felt and some countries even registered negative growth. The macroeconomic stability in the region was jeopardized, stability of currencies and overall monetary systems were endangered as a result of the vulnerability of the euro. In fact, Western Balkans bank system stayed stable, due to its rigor and lack of innovative financial instruments. However, the recession hit the real economy and caused slowdown of economic activity. The decrease in the global demand and reduced international trade affected Western Balkan countries exports and changed their trade balances. Deficits were frequent and countries public debt increased. They were obligated to ask for

REDETE – ECONOMIC DEVELOPMENT AND ENTEREPRENEURSHIP IN TRANSITION ECONOMIES
19
external finance assistance. International Monetary fund offered the needed help and most of the countries get loans to alleviate the implications of the crisis.
The governments in the region took measures such as reconstruction of budgets, tax reforms and launching infrastructure projects. Every country had its own approach in overcoming the crisis, but not all succeeded to escape the negative implications and improve their economic stability. The reforms to certain extent reduced the deficits and levels of debt, but on the other side worsen the business environment and affected the SME sector development. The most common problems that businesses faced were increased taxes, reduced donations from external sources, limited access to finance as a consequence of the strengthened credit requirements. The longstanding efforts of countries to improve the business environment seemed to be in vain. Many small enterprises went bankrupt while others barely managed to sustain. To support them governments reacted with financial facilities, institutional support and providing consulting services. Furthermore, the European Commission approved crisis package for small and medium enterprises and financial aid from European investment bank.
According to World Bank the crisis influence in Balkans is yet to be felt (SETimes.com). The bank predicts hard times for the region. Governments must react accordingly and on time in order to save the established business from destruction, but also to enrich economic structure of their countries with new business. Overcoming the recession and accelerating the post crisis recovery strongly depends of the preparedness of policymaker for protection and stimulating of SME’s in their development.
7. Conclusions and policy recommendations
This paper has we have examined the business climate in Western Balkans and the suitability of various government measures for its improvement. Generally, we can conclude that Western Balkans do not represent a monolithic group with respect to the ease of doing business. According to the results from the analysis, doing business is easiest in Macedonia whose rank is 22. Majority of the countries such as Montenegro, Croatia, Albania and Serbia belong to the middle range with ranks 56, 80, 82 and 92 respectively. On the other side, Kosovo and Bosnia and Herzegovina are still facing a lot of problems and their ranks are 117 and 125 respectively.
Despite this general observation, each Western Balkan country has its own strengths and weak points. For example, Macedonia is leading in starting a business, obtaining permits and paying taxes, but it needs improvements in getting electricity, getting credit and resolving insolvency. Montenegro leads in getting credit, resolving insolvency and trading across borders, but faces problems in other fields such as: enforcing contracts, registering property and obtaining construction permits. Croatia leads in enforcing contracts and getting electricity and is relatively good in dealing with permits, but weak in getting credit protecting investors and resolving insolvency. Serbia is also struggling with resolving insolvency, dealing with permits and paying taxes but is ahead of all Western Balkans in registering property. Albania stands high with respect to protection of investors, but access to electricity, taxation system and registration of properties are its weak points. Finally, Kosovo and Bosnia and Herzegovina are the two countries with biggest limitations for businesses and need substantial government reforms in order to make further improvements.
In sum, the current circumstances in the sphere of regulation, access to finance and taxation system in Western Balkans provide a room for further reforms. This has been recognized by the policymakers in the region who repeatedly have undertaken measures for improving the business climate. According to our analysis we identify the areas where appropriate policy measures are necessary. By using the Doing Business simulator we next examine the potential implications of the potential policy reforms.
In the case of Macedonia, access to electricity can be noted as the main gap whose filling may improve the rank of the country. For illustration, diminution of the procedures for getting

REDETE – ECONOMIC DEVELOPMENT AND ENTEREPRENEURSHIP IN TRANSITION ECONOMIES
20
electricity from 5 to 3 and decreasing the time from 150 to 60 days would improve the overall rank for doing business from 22 to 18. In the case of Montenegro, the weak point is enforcing contracts and by undertaking appropriate reforms the procedures can be reduced from 49 to about 30, which will result with movements in the general rank from 56 to 45. Also dealing with construction permits can be simplified by lowering the number of procedures from 17 to about 12 that will improve the overall ranking for 5 positions. Croatia target reforms could be resolving insolvency by means for increasing the recovery rate. Slight enlargement in the recovery rate from 29.7 to 44 will improve the rank from 80 to the 63 position. In Serbia we have identified that paying taxes is time consuming and for instance cutting the hours needed, from 279 to about 200 hours will result with change in the overall rank for 5 positions. Having in mind that Albania’s greatest problem is getting electricity we simulate fewer procedures for accessing electricity. Namely, by shortening the number of procedures from 6 to 4, the rank moves from 82 to 77. Unlike the above mentioned Western Balkans, Kosovo and Bosnia and Herzegovina business situation require more substantial reforms in several fields. For example, in Kosovo trading across borders is crucial, because most of the products in the country are imported. Lowering the number of documents for import and export from 8 to 4, could improve the general rank from 117 to 109. Similarly, the number of procedures for enforcing contracts in Kosovo is very big standing at 53 in 2012. If we assume minimizing them to about 30, the rank for doing business will improve to 113. Bosnia and Herzegovina, similarly to Kosovo needs improvements in more areas. If the procedures for registering property decrease from 7 to 5, the rank will improve for 6 positions. The same can be achieved with cutting the procedures for enforcing contract from 37 to 30.
Scenarios and simulations used above intend to help policy creators to introduce the right measures, as essential tools for advancing the business climate in Western Balkan countries. In this context we recommend applying them simultaneously and in coordination in order to achieve a synergy effect. In this manner the Western Balkan countries would improve the overall business climate and will gradually approach to more advanced transition countries. Finally, we would like to stress that there exists possibilities for researchers to further investigate the most appropriate combination of reforms, which will result with enrichment of state economic structures with SMEs, increasing productivity and employment.
REDETE – ECONOMIC DEVELOPMENT AND ENTEREPRENEURSHIP IN TRANSITION ECONOMIES
21
Reference list
1. Gveroski, M. and Nikoloski, D. (2006) “Some Aspects of the Income Inequality-Case study for Macedonia”, Proceedings from the international conference “Structural Changes and Demographic Trends in South European Countries”, Niš, Serbia, June, 2006;
2. Gveroski M., Risteska A.,Dimeski S.(2010) Small and medium enterprices- drivers of economy development. Belgrade: Faculty of Organizational Sciences.
3. EC, OECD, ETF, EBRD (2009). Progress in the Implementatio nof the European Charter for Small Enterprises in theWestern Balkans. OECD.
4. European Commission (2009) The Western Balkans in Transition. Brusles: Directorate-General for Economic and Financial Affairs European comission.
5. Minchev, O., Lessenski, M., Stojkovski, G., & Ralchev, S. (2010). The Westen Balkans: Between the Economic Crisis and the European Perspective. Sofia: Institute for Regional and International Studies.
6. Nikoloski, D. (2009) “The sustainable rate of unemployment in transition countries – A case study for Macedonia”, VDM Verlag;
7. OECD (2010) Improving new investment finance options in Western Balkans. Summary record, Skopje, 8 June, 2010
8. Penev, S., & Marusic, A. (2009, July – September). Regulatory reform in five Western Balkan countries:Evidence and perspectives. ECONOMIC ANNALS, p. 182.
9. SETimes.com. http://setimes.com/cocoon/setimes/xhtml/en_GB/features/setimes/features/2011/11/29/feature-02. (accessed September 01, 2012).
10. TaxRates.cc. http://www.taxrates.cc/index.html. (accessed September 01, 2012).

REDETE – ECONOMIC DEVELOPMENT AND ENTEREPRENEURSHIP IN TRANSITION ECONOMIES
22
OPENNESS TO TRADE AND VULNERABILITIES OF SMALL TRANSITIONAL ECONOMIES
IN THE GLOBAL ECONOMIC CRISIS
Jelena TEŠIĆ3
Abstract
Global economic crisis that appeared in financial sector in 2007 had adverse impact on pre-crisis trends of international trade at the global level. International trade in 2009 recorded the deepest decrease since the World War II of 12.5% annually, while quarterly drops were sharp, synchronized and sudden, being characterized in the scientific literature as The Great Trade Collapse (Baldwin, 2009). The trade was not the cause of the crisis but one of its main conseq-uences as the crisis started in financial sector. But as it very easily spread to the real sector of economy, it is interesting to assess how international trade could have serve as one of the cha-nnels of crisis transmission across countries. It would mean that more open countries were more vulnerable to foreign shock. There is highly debated issue in the literature upon the ope-nness and vulnerability with still inconclusive answer (Easterly and Kraay, 1999; Bräutigam and Woolcock, 2001; Jansen, 2004; Frankel and Cavallo, 2004, 2008; Edwards, 2004; Fidrmuc and Korhonen, 2008). For the latest crisis, there has been renewed interest in the role of trade as a channel of crisis’ transmission (Keppel and Woerz, 2010; Ateljevic, Tesic, Petkovic, 2012). The problem upon the relation between openness to trade and vulnerabilities to shocks is very important particularly in the case of small economies because they tend to be more open. Moreover, special case exists also in transitional economies as there is still ongoing process of economic and institutional reforms in these countries.
Now, considering the facts that small transitional economies are largely dependent on inter-national trade and that economies of those countries are dominated by small and immature firms and, therefore the extent of vulnerability is supposedly higher, in this study I ask the following question: What was the role of openness to trade in propagation of the latest crisis in the case of small transitional economies?
In this paper, I am particularly interested in 24 small and transitional economies from the Central Europe, the Baltic region, South-eastern Europe, and the Caucasian region focusing on their outward orientation. By the model of multiple regression I quantify the contribution of in-ternational trade for the propagation of shock in the case of recent crisis while controlling for number of other significant variables. Preliminary results indicate that the crisis was not spre-ading primarily through the channel of international trade but that there were some other important factors of crisis transmission.
Keywords: openness to trade, volatility, global economic crisis, crisis transmission, small economies.
3 Faculty of Economics University of Banja Luka, Majke Jugovića 4, 78000 Banja Luka, [email protected]

REDETE – ECONOMIC DEVELOPMENT AND ENTEREPRENEURSHIP IN TRANSITION ECONOMIES
23
1. Developments in international trade during the crisis
Except for the periods of economic crises, the period from World War II has been characteri-zed by constant and fast increase of international trade and constant efforts in its liberalization4. Global economic crisis that appeared in financial sector in 2007 had adverse impact on pre-crisis trends of international trade. International trade in 2009 recorded the deepest decrease since the World War II of 12.5% annually, while quarterly drops were sharp, synchronized and sudden, being characterized in the scientific literature as The Great Trade Collapse (Baldwin, 2009) (graph 1).
Graph 1: World merchandise exports and gross domestic product, annual percentage change 2000-2010
Source: WTO International trade statistics 2011, Based on Table A1.
http://www.wto.org/english/res_e/statis_e/its2011_e/its11_appendix_e.htm
Drop of world trade was synchronized across the world which is evident from the following
graph for the world leading economies.
4 Average annual percentage change of world export in the period from 1950-2010 is 5,7% while the same figure of world
GDP (Gross Domestic Product) is 3,5% (calculation of author based on WTO Statistic Database).

REDETE – ECONOMIC DEVELOPMENT AND ENTEREPRENEURSHIP IN TRANSITION ECONOMIES
24
Graph 2: World merchandise exports for selected world-leading economies, 2000-2011 (millions of dollars)
Source: WTO International trade statistics 2011, Based on Table A6.
http://www.wto.org/english/res_e/statis_e/its2011_e/its11_appendix_e.htm
Practically, all countries in the world experienced sharp drop of foreign trade during the recent crisis. For the small economies which tend to be more open to international trade this drop was even sharpest, what is evident from the following graph for selected small open economies.
Graph 3: Merchandise foreign trade (export plus import) growth rates for selected small open economies (2001-2011)
Source: WTO Statistics database – Time series on international trade,
http://www.wto.org/english/res_e/statis_e/its2011_e/its11_appendix_e.htm
The trade was not the cause of the crisis but one of its main consequences as the crisis started in financial sector. But as crisis very easily spread from financial to the real sector of economy, it is interesting to assess how international trade could have serve as one of the channels of crisis transmission across countries. It would mean that more open countries were more vulnerable to

REDETE – ECONOMIC DEVELOPMENT AND ENTEREPRENEURSHIP IN TRANSITION ECONOMIES
25
foreign shocks. This issue is particularly interested for small open economies as these tend to be more open and highly dependable on the developments in overall world economy.
The problem of openness to trade can be summarized in a question; how to utilize the advantages of an open economy while reducing the disadvantages of greater exposure to external shocks. There has been renewed interest in the role of openness as a channel of crisis’ transmission for the latest world economic crisis (Keppel and Worz, 2010).
The paper proceeds as follows. In section II I briefly review the literature on the advantages and disadvantages of openness to trade, particularly for small open economies. In section III I discuss the data and methodological issues for the sample of 24 smaller and transitional economies. In this section I will assess the role of openness in the crisis transmission in the case of recent crisis for the countries in the sample. Section IV is dedicated to the results and discussion, after I conclude.
2. Literature Review
It is widely believed that an overall economic growth increasingly depends on rapid integration in the world economy mainly through the channel of international trade. As a result, governments of many developing countries have introduced policies to stimulate outward-oriented growth and liberalization of international trade regime. Due to failed attempts of import substitution strategies and the progress experienced in the most of outward-oriented economies existing research suggests that there is positive and strong relation between overall economic growth and rapid export growth (Balassa, 1985; Ram, 1985; Anwer and Samphat, 1997; Ekanayake 1999; Haddad and Shepherd, 2011). Researchers believe that such policies tend to speed up the poverty reduction in backward economies (Daitoh, 2008), and those countries that maintain restrictive policies towards the liberalization of international trade experience slow economic recovery and growth (Sachs and Warner, 1995; Krueager, 1998; Dollar and Kraay; Krugman and Obstfeld, 2009; Kee et al, 2008). Yet, a growing amount of research casts serious doubt on the consistency of the trade-growth relationship (Rodriguez and Rodrik, 2001; Baldwin, 2003, Rodrik et. al., 2002; Rodrik, 2006; Rodriguez, 2006a; 2006b), mach as a result of a lack of conceptual definition of the openness and its measurement (Baldwin, 2003). In addition, high openness to trade ratio, i.e. high integration in the world economy, implies a growing feeling of insecurity and ‘vulnerability’ (Montalbano et all, 2005).
2.1. Openness to trade and volatility
As world trade has experienced exponential growth in recent decades, understanding the relationship between trade and volatility has become increasingly important (di Giovanni, Levchenko, 2008: 4). As many economists argue, openness to trade increase average GDP growth rates, but it also increases output volatility in times of crisis. The relationship between openness to trade and vulnerabilities is highly debatable subject amongst the economists with still inconclusive answer.
There are some who claim that openness to trade reduces vulnerability to crises (Frankel and Cavallo, 2004; 2008) and that trade integration can lead to fewer sudden stops in capital inflows (Edwards, 2004; Fidrmuc and Korhonen, 2008), while Easterly et all (2001) and Kose et all (2003) found that openness increases the volatility of GDP growth. Some other authors (Cavallo, 2007) empirically proved that the net effect of trade openness on output volatility is stabilizing, although only for countries that are more exposed to capital flows. As this author concludes (Cavallo 2007: 33) “it does not appear to be the case that more open economies are necessarily more volatile, as is commonly thought”. Bejan (2006) on contrary empirically proved that trade openness generally increased output volatility, although this effect was stronger and more

REDETE – ECONOMIC DEVELOPMENT AND ENTEREPRENEURSHIP IN TRANSITION ECONOMIES
26
significant during 1950-1975 than during 1975-2000. This author however showed that there are differences between developed and developing countries regarding openness-volatility relationship as more openness increased volatility in developing countries, while it reduced output volatility in developed countries (Bejan, 2006). Similar results can be found in Montalbano et all (2005) on the sample of Eastern European countries as authors proved that these countries “have experienced a deterioration of their macroeconomic wellbeing as a result of the trade shocks of the early 1990” (Montalbano et all, 2005: 18). Research conducted by Haddad et al., (2010) where the authors used diverse set of export diversification indicators suggests, while the effect of trade openness on growth volatility is positive on average, there is strong evidence pointing to an important role for export diversification in reducing the vulnerability of countries to global shocks. The study concludes that those countries more vulnerable to foreign shocks should diversified their export both, across the products and across the markets.
For the latest crisis there has been renewed interest in the role of trade as a channel of crisis’ transmission. Keppel and Woerz (2010: p. 17) have found that higher export orientation is linked to greater downturn in the latest crisis, but in quantitative terms, the marginal effect of export openness is considerably lower than the impact of domestic economic structure on the growth reversal.
2.2. Small economies and openness to trade – pro et contra
In the context of research problem in this paper generally little research is available on small economies5. Generally, it is believed that small countries have modest resource base and thus, they are highly dependent on external trade and external resources. In many cases the country export is highly concentrated in a few sectors as they cannot fully use the benefit from economies of scale, so they are more exposed to exogenous shocks. Small economies also have little global power; their influence on multilateral global trade regime is insignificant (World Bank, 2000). But, there are numerous characteristics of small economies they can benefit from.
As Bräutigam and Woolcock (2001: 3) state “small states are more flexible and can adjust more quickly to rapid changes in the foreign environment”. Asking the question “is small beautiful?”, Streeten (1993) finds that small countries grow faster and have higher productivity than larger countries. His findings on higher productivity have been confirmed also in Easterly and Kraay (1999) who showed that small states have higher per capita GDP than other states due to a productivity advantages.
Still numerous researchers confirmed the greater disadvantage of small economies upon the relation between openness and income volatility. Easterly and Kraay (1999) have shown that despite the fact that the small states in overall are richer than the bigger states, they suffer form greater volatility of annual growth rates. This characteristic of small countries in experiencing more volatile growth rates and being more aid and trade dependent have been also confirmed in Bräutigam and Woolcock (2001). Some other researchers (Jansen, 2004) showed that small economies due to their openness tend to have more volatile income rates while it is proved that income volatility has a strong negative effect on growth (Ramey and Ramey, 1995; Easterly and Kraay, 1999), but this volatility is only partly caused by the openness itself. As author suggests (Jansen, 2004: p. 4) “export concentration is a part of the story, so it may be possible to reduce the share of income volatility caused by export concentration through the use of policies of export diversification”. This was confirmed also by Haddad et al., (2010).
Clearly, the literature review suggests that the existing research does not offer a clear answer upon the relationship between openness and vulnerabilities to foreign shocks. Consequently, there
5 Small economy is hard to define. Some authors and studies use tresholds in terms of population, size or GDP. Definition of
small open economy used in this paper will be given later in.
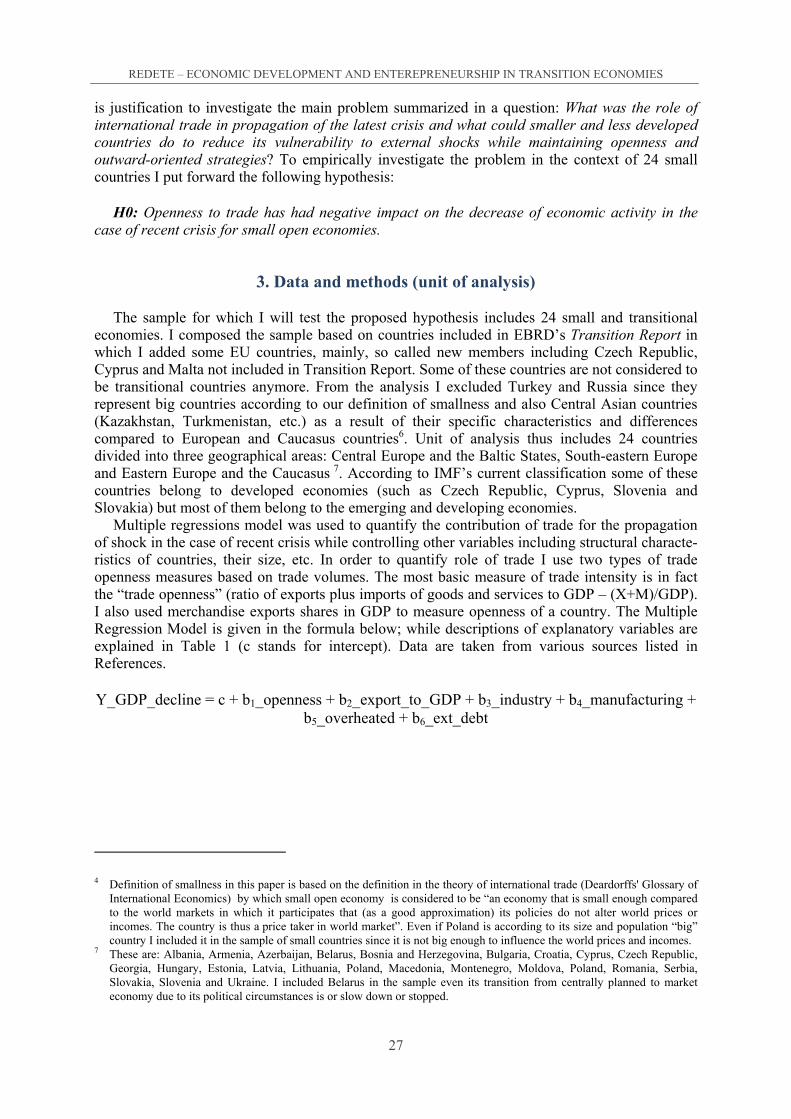
REDETE – ECONOMIC DEVELOPMENT AND ENTEREPRENEURSHIP IN TRANSITION ECONOMIES
27
is justification to investigate the main problem summarized in a question: What was the role of international trade in propagation of the latest crisis and what could smaller and less developed countries do to reduce its vulnerability to external shocks while maintaining openness and outward-oriented strategies? To empirically investigate the problem in the context of 24 small countries I put forward the following hypothesis:
H0: Openness to trade has had negative impact on the decrease of economic activity in the
case of recent crisis for small open economies.
3. Data and methods (unit of analysis)
The sample for which I will test the proposed hypothesis includes 24 small and transitional economies. I composed the sample based on countries included in EBRD’s Transition Report in which I added some EU countries, mainly, so called new members including Czech Republic, Cyprus and Malta not included in Transition Report. Some of these countries are not considered to be transitional countries anymore. From the analysis I excluded Turkey and Russia since they represent big countries according to our definition of smallness and also Central Asian countries (Kazakhstan, Turkmenistan, etc.) as a result of their specific characteristics and differences compared to European and Caucasus countries6. Unit of analysis thus includes 24 countries divided into three geographical areas: Central Europe and the Baltic States, South-eastern Europe and Eastern Europe and the Caucasus 7. According to IMF’s current classification some of these countries belong to developed economies (such as Czech Republic, Cyprus, Slovenia and Slovakia) but most of them belong to the emerging and developing economies.
Multiple regressions model was used to quantify the contribution of trade for the propagation of shock in the case of recent crisis while controlling other variables including structural characte-ristics of countries, their size, etc. In order to quantify role of trade I use two types of trade openness measures based on trade volumes. The most basic measure of trade intensity is in fact the “trade openness” (ratio of exports plus imports of goods and services to GDP – (X+M)/GDP). I also used merchandise exports shares in GDP to measure openness of a country. The Multiple Regression Model is given in the formula below; while descriptions of explanatory variables are explained in Table 1 (c stands for intercept). Data are taken from various sources listed in References.
Y_GDP_decline = c + b1_openness + b2_export_to_GDP + b3_industry + b4_manufacturing +
b5_overheated + b6_ext_debt
4 Definition of smallness in this paper is based on the definition in the theory of international trade (Deardorffs' Glossary of
International Economics) by which small open economy is considered to be “an economy that is small enough compared to the world markets in which it participates that (as a good approximation) its policies do not alter world prices or incomes. The country is thus a price taker in world market”. Even if Poland is according to its size and population “big” country I included it in the sample of small countries since it is not big enough to influence the world prices and incomes.
7 These are: Albania, Armenia, Azerbaijan, Belarus, Bosnia and Herzegovina, Bulgaria, Croatia, Cyprus, Czech Republic, Georgia, Hungary, Estonia, Latvia, Lithuania, Poland, Macedonia, Montenegro, Moldova, Poland, Romania, Serbia, Slovakia, Slovenia and Ukraine. I included Belarus in the sample even its transition from centrally planned to market economy due to its political circumstances is or slow down or stopped.

REDETE – ECONOMIC DEVELOPMENT AND ENTEREPRENEURSHIP IN TRANSITION ECONOMIES
28
Table 1: Variables in regression model
Explanatory Variable Name
Explanatory Variable Description Description and Data
Openness to Trade Openness to Trade Ratio (X+M)/GDP
Ratio is measured in pre-crisis period as the average in three years 2006-2008
Merchandise Export to GDP
Export to GDP ratio (X/GDP) Ratio as measured as average in pre-crisis period in three years 2006-2008
Industry Share of Industry in GDP Data for share of industry are from 2008 Manufacturing Share of manufacturing export in
total merchandise export Ratio measured as average in pre-crisis period in three years 2006-2008
Overheating Average previous growth rates Measured in three pre-crisis years 2005-2007 Ext Debt External debt share in GDP External debt is taken as a stock in 2008 and
divided with average GDP in 2006-2008
Population and absolute GDP were also included in the foundation (initial) model as a control
of the size and specific characteristics of countries, yet they both appeared to be insignificant therefore the model is left with explanatory variables of openness to trade (first two variables), structural characteristic (third and fourth variable), pre-crisis results (overheating) and financial linkages (ext_debt).
Dependent variable is crisis response in the countries under investigation (Y_GDP_decline). In order to include right timing of the crisis (in some countries crisis commenced in 2008 while most of the countries experienced the highest decline in real GDP growth in 2009 (see Keppel and Worz, 2010) I measured the dependent variable as the absolute decline in real GDP growth over the period 2007-2009. It is calculated as the absolute change of average growth rate starting with 2007 from which I subtract growth rates in 2008 and 2009. The real GDP decline is measured in percentages where the highest value shows a strongly negative crisis response. Thus, one could expect all positive coefficients which show the nature of relation between dependent and independent variable. For first two openness measures it is expected to be positively related with dependent variable measured as explained. For measures of economic structure it is expected that the countries with the highest share on industry in GDP and highest share of industry export were hit higher in the crisis. Also, for financial measure of openness in pre-crisis times (external debt share in GDP) I expect that lead to highest growth downturn in crisis as well as for the measure of pre-crisis growth (overheating).
In order to more precisely test the Hypothesis I excluded four economies from the unit of analysis: Cyprus, Malta and Montenegro because of their specific industry structure dominated by the tourism industry, and Azerbaijan due to its underlying differences.8
3. Results and Discussion
Results of the overall significance of the multiple regressions model are presented in Table 2. The overall goodness-of-fit measures, R square is 0.78 confirmed by F-test by which the significance of overall regression was tested. The value of Significance F column/row is 0.001 (0.01) confirming high significance of the Overall Regression Model. What matters more is the statistical significance of individual parameters tested by the p-value of each variable. P-values for first four variables, including openness to trade ratio and export to GDP ratio, are higher than 0.01 or 0.05 that is considered statistically insignificant. This means that neither international trade nor
8 For example, its share of manufacturing in total export is only 2 percent since it exports mainly fuels and minerals. Due to
its natural resources, it is experiencing the highest growth rates in the last years as well as in the years of crisis when it had real GDP growth rate of 9,3% while all countries experienced sharp decline in GDP.

REDETE – ECONOMIC DEVELOPMENT AND ENTEREPRENEURSHIP IN TRANSITION ECONOMIES
29
structure of value added and export did not serve as explanatory variables of the GDP decline in the latest crisis.
As Table 2 exhibits the only significant variables in the model by which the crisis depth could be explained are the last two ones – Overheating (growth rates in three pre-crisis years) and Ext Debt (share of external debt in GDP). The coefficients of these two variables has a positive sign which means that the higher growth rates in pre-crisis period (greater overheating) and higher external debt share in GDP caused higher drop of GDP growth rates in crisis, i.e. higher exposure to crisis.
Thus, the model demonstrated that the crisis was not spreading primarily through the channel of international trade but thorough the financial exposure to the external environment. Also, very high growth rates in pre-crisis period heated up with the financial flows mainly from the outside could have indicated circumstances of overheating which is usually followed by sharp decline of economic activity.
Table 2: Regression model 1- Factors of GDP decrease in crisis
SUMMARY OUTPUT
Regression Statistics
Multiple R 0,887
R Square 0,787
Adjusted R Square 0,688
Standard Error 5,487
Observations 20,000
ANOVA
df SS MS F Significance F
Regression 6,000 1443,765 240,628
7,993 0,001
Residual 13,000 391,371 30,105
Total 19,000 1835,136
Coefficients
Standard Error
t Stat P-value
Lower 95%
Upper 95%
Lower 95,0%
Upper 95,0%
Intercept -38,691 21,995 -1,759 0,102 -86,207 8,825 -86,207 8,8250
Openness to Trade 0,010 0,150 0,067 0,948 -0,315 0,335 -0,315 0,3349 Merchandise Export to GDP
-13,395 27,958 -0,479 0,640 -73,795 47,006 -73,795 47,0058
Industry 20,793 15,756 1,320 0,210 -13,246 54,831 -13,246 54,8313 Manufacturing 0,164 0,323 0,506 0,621 -0,535 0,863 -0,535 0,8626 Overheating 2,787 0,592 4,705 0,000 1,507 4,066 1,507 4,0664 Ext Debt 23,028 5,528 4,165 0,001 11,085 34,972 11,085 34,9715
Table 3 shows the results of our regression model excluding all insignificant variables (openness to trade, export to GDP, share of industry in GDP and manufacturing share in export) leaving in the model only two significant variables in order to gain more freedom degrees9.
9 I performed regression also excluding only variables of structure – share of industry in GDP and share of manufacturing in
export, leaving thus variables of the interest (openness to trade, export to GDP and statistically significant variables – overheating and ext debt), but the model showed again insignificance of measures of openness and significance of overheating and ext debt. Also, due to the high correlation coefficient between the most important variables in the analysis – openness to trade ratio and export to GDP ratio, I performed regression with only one or other of these two variables but

REDETE – ECONOMIC DEVELOPMENT AND ENTEREPRENEURSHIP IN TRANSITION ECONOMIES
30
Table 3: Regression Model 2 - Factors of GDP decrease in crisis
SUMMARY OUTPUT
Regression Statistics
Multiple R 0,8616
R Square 0,7424
Adjusted R Square
0,7121
Standard Error 5,2732
Observations 20,0000
ANOVA
df SS MS F Significance F
Regression 2,0000 1362,4299 681,2149
24,4986
0,0000
Residual 17,0000 472,7060 27,8062
Total 19,0000 1835,1359
Coefficients
Standard Error
t Stat P-value
Lower 95% Upper 95%
Lower 95,0%
Upper 95,0%
Intercept -19,6520 4,3859 -4,4807 0,0003 -28,9054 -10,3986 -28,9054 -10,3986
Overheating 2,5010 0,4609 5,4265 0,0000 1,5286 3,4734 1,5286 3,4734
Ext Debt 20,0089 3,9337 5,0865 0,0001 11,7095 28,3083 11,7095 28,3083
As the results indicate the overall significance of regression is 0.742 (R square), and the value
of Significance F column/row is 0.000 meaning higher significance of the overall regression model. The value of the Adjusted R Square in the second regression (Table 3) is higher that in the first test (Table 2) showing that exclusion of insignificant variables is justified, i.e. variables of openness and structure of value added are not responsible and cannot explain the drop of GDP growth rates in the crisis. The model is by very satisfactory results explained by variables of financial linkages measure (Ext Debt) and pre-crisis growth rates (Overheating). Therefore, I reject the Hypothesis and conclude that trade has no statistically significant impact on the transmission of crisis. As opposed to some previous research (Section 2) which claims that small and open economies are more vulnerable to external shocks as well as international trade is of the channels for transmission of economic crisis this study dismisses such an assumption suggesting that outward oriented strategies have no many alternatives in the post-crises period for the selected countries.
Conclusion
To evaluate the effectiveness of the country’s outward oriented strategy is evidently a challen-ging task. It is not only so because of the fact that in any such undertaking an increasing number of factors or variables could be included but, also due to various discrepancies between countries. In this paper I attempt to examine the phenomenon in the context of small and transitional countries where I manage to move the research frontier a bit forward.
In the case of smaller and transitional countries, as the current study suggests, outward orientation and international trade openness has no alternatives. With regards to the propagation
the model always showed insignificance of the both. Consequently, it can be confirmed that openness in terms of international trade was not the channel of crisis spreading but rather its causality.

REDETE – ECONOMIC DEVELOPMENT AND ENTEREPRENEURSHIP IN TRANSITION ECONOMIES
31
of external shocks, neither trade openness nor the export orientation significantly contributed to the spread of the recent crisis. What really mattered were the financial linkages assessed through external debt and high growth rates in pre-crisis years. These two variables were mainly triggered by the foreign financial flows which stimulated high domestic demand and caused overheating of economies in pre-crisis times.
Finally, I can conclude that quantification of the available data gives only an inequitable answer to the questions put forward at the beginning of this study. Further research should go beyond the statistical calculation and examine contextual factors of individual countries. Future research might consider the following questions: 1) How to enhance export orientation in order to achieve faster development and growth? 2) How fast and under what conditions to liberalize international trade regime? 3) How to alleviate negative effects of too fast openness (for example, domestic firms from smaller and undeveloped countries are not able to compete with large multinational corporations).
Reference List
1. Anwer, S.; Sampath, R. (1997) Exports and Economic Growth, Presented at Western Agricul-tural Economics Association 1997 Annual Meeting, July 13-16, 1997, Reno/Sparks, Nevada
2. Balassa, B. (1985), “Exports, policy choices, and economic growth in developing countries after the 1973 oil shock”, Journal of Development Economics, 18: 23-35.
3. Baldwin, R. E. (2003) Openness and Growth: What’s the Empirical Relationship?. NBER Working Paper No 9578
4. Bejan, M. (2006) Trade Openness and Output Volatility, http://mpra.ub.uni-muenchen.de/-2759/1/MPRA_paper_2759.pdf (Accessed, 6 September 2012)
5. Bräutigam, D.; Woolcock, M. (2001) Small States in a Global Economy, The Role of Institutions in Managing Vulnerability and Opportunity in Small Developing Countries. World Institutes for Economics Development Research WIDER Discussion Paper 2001/37
6. Cavallo, E. (2007) Output Volatility and Openness to Trade: A Reassessment, Inter-American Development Bank
7. CEPR (2008) The Great Trade Collapse: Causes, Consequences and Prospects, eds. Baldwin, R. A VoxEU.org publication, London: Centre for Economic Policy Research
8. Daitoh, I., (2008) Environmental Protection and Trade Liberalization in a Small Open Dual Economy, Review of Development Economics, (DOI:10.1111/j.1467-9361.2008.00455.x) to be completed
9. Deardorffs' Glossary of International Economics, 10. http://www-personal.umich.edu/~alandear/glossary/s.html (Accessed, 05 August 2012) 11. Dollar, D. ; Kraay, A. (2001) Trade, Growth, and Poverty. Development Research Group. The
World Bank 12. Easterly, W; Islam, R.; Stiglitz, J. (2001) Shaken and Stirred: Explaining Growth Volatility. In
B. Pleskovic and N. Stern, eds., Annual World Bank Conference on Development Economics. 13. Easterly. W.; Kraay, A. (1999) Small States, Small Problems? Income, Growth, and Volatility
in Small States. World Bank: http://siteresources.worldbank.org/DEC/Resources/SmallStates-SmallProblems.pdf (Accessed, 15 September 2012)
14. Edwards, S. (2004) Financial Openness, Sudden Stops and Current Account Reversals. NBER Working Paper No. 10277
15. Ekanayake, E. (1999) Exports and Economic Growth in Asian Developing Countries: Cointegration and Error-Correction Models, Journal of Economic Development, vol. 24, No 2
16. Fidrmuc, J.; Korhonen, I. (2008) The impact of the global financial crisis on business cycles in Asian emerging economies. Discussion Papers 11, Bank of Finland, BOFIT Institute for Economies in Transition

REDETE – ECONOMIC DEVELOPMENT AND ENTEREPRENEURSHIP IN TRANSITION ECONOMIES
32
17. Frankel, J.; Cavallo, E. A. (2004) Does Openness to Trade Make Countries More Vulnerable to Sudden Stops, Or Less? Using Gravity to Establish Causality. NBER Working Paper No. 10957
18. Giovanni, di J.; Levchenko, A. (2008) Trade Openness and Volatility, IMF Working Paper WP/08/146
19. Haddad, M.; B. Shepherd (2011). Managing Openness: From Crisis to Export-Led Growth v2.0, In: Haddad M. and B. Shepherd (eds.), Managing Openness: Trade and Outward-Oriented Growth after the Crisis, Washington: World Bank
20. Haddad, M. E.; Lim, J.; Saborowski, C. (2010) Trade Openness Reduces Growth Volatility When Countries are Well Diversified. Policy Research Working Papers 5222 Washington: World Bank
21. International Monetary Fund, World Economic Outlook Database www.imf.org (Accessed, 09 August 2012)
22. Jansen, M. (2004) Income volatility in small and developing economies: export concentration matters. World Trade Organization: WTO Discussion Papers
23. Kee, H.L; Nicita, A; Olarreag, M. (2008) Estimating Trade Restrictiveness Indices, The Economic Journal 119. 172–199.
24. Keppel, C; Worz, J. (2010) The Impact of the Global Recession in Europe - The Role of International Trade, in Contagion and Spillovers: New Insight from the Crisis, eds. Backé,P. et al, Gnan, E. and Hartmann, P., The European Money and Finance Forum. Vienna: SUERF Study 2010/5
25. Kose, M. A.; Eswar S. P.; Terrones, M. E. (2003) Financial Integration and Macroeconomic Volatility,” IMF Staff Papers, Vol. 50, No. Special Issue, pp. 119–41.
26. Krueger, O.A. (1998) Why trade liberalization is good for growth, The Economic Journal, Vol 108, No 450. 1513-1522.
27. Krugman, P.; Obstfeld, M. (2009) Međunarodna ekonomija, Beograd: Datastatus 28. Montalbano, P.; Federici, A. Triulzi, U.; Pietrobelli, C. (2005) Trade Openness and
Vulnerability in Central and Eastern Europe, Research Paper No. 2005/43, United Nation University - WIDER
29. Ram, R., (1985),"Exports and Economic Growth: Some Additional Evidence", Economic Development and Cultural Change 33, 415-423.
30. Ramey, G.; Ramey, V. (1995) Cross-Country Evidence on the Link Between Volatility and Growth. The American Economic Review, No 5.: 1138-1151.
31. Rodríguez, F. (2006a) Trade and Development. (forthcoming in Dutt, A. and J. Ros, eds. International Handbook of Development Economics)
32. http://frrodriguez.web.wesleyan.edu/docs/working_papers/Trade_and_Development.pdf (Accessed, 06 August 2012)
33. Rodríguez, F. (2006b) Openness and Growth: What Have We Learned? Background note for United Nations’ 2006 World Economic and Social Survey
34. Rodriguez, F., Rodrik, D. (2001) Trade policy and economic growth: a skeptic’s guide to the cross-national evidence.
35. Rodrik, D (2006) Goodbye Washington Consensus, Hello Washington Confusion? A Review of the World Bank’s Economic Gorwth in the 1990s: Learning from a Decade of Reform. Journal of Economic Literature 44: 973-87.
36. Rodrik, D.; Subramanian, A. and Trebbi, F. (2002) Institutions Rule: The Primacy of Institutions Over Geography and Integration in Economic Development. NBER Working Paper No 9305
37. Sachs, J.; Warner, A. (1995) Economic Reform and the Process of Global Integration. Brooki-ng Papers on Economic Activity 1: 1-118.
38. Streeten, P. (1993) The Special Problems of Small Countries. World Development, 21:197-202.

REDETE – ECONOMIC DEVELOPMENT AND ENTEREPRENEURSHIP IN TRANSITION ECONOMIES
33
39. World Bank (2000) Small States: Meeting Challenges in the Global Economy. The report of the Commonwealth Secretariat/World Bank Joint Task Force on Small States. Washington: World Bank
40. World Trade Organization, Statistic Database: Time Series on International Trade www.wto.org (Accessed, 3 August 2012)
41. Yanikkaya, H. (2003) Trade openness and economic growth: a cross-country empirical investigation. Journal of Development Economics 72, 57– 89.
Appendix
Country Y Openness To Trade
Export to GDP
ratio
Share of manufacturing
in total merchandise
export
Share of industry in GDP
Average Growth
2005-2007
External Debt
share in GDP
Population 2008
GDP current prices dollars
2008
Albania -4,951 84,100 0,099 0,708 19,500 5,696667 0,142 3181397 13003000000
Armenia 20,951 59,600 0,117 0,550 37,700 13,60433 0,150 3079087 11662000000
Belarus -1,765 121,900 0,536 0,523 46,400 9,362 0,154 9602000 60752000000
Bosnia and Herz. 3,432 97,000 0,271 0,599 25,800 5,344 0,437 3774164 18512000000
Bulgaria 5,733 119,500 0,440 0,536 30,600 6,439 0,823 7623395 51824000000
Croatia 8,882 81,200 0,206 0,679 24,400 4,758667 0,775 4434000 69887000000
Czech Republic 7,816 144,400 0,683 0,894 38,700 6,418333 0,420 10424336 216089000000
Estonia 25,883 152,000 0,533 0,681 29,200 8,971 1,197 1340675 23681000000
Georgia 13,733 83,200 0,119 0,470 29,400 10,447 0,437 4383700 12870000000
Hungary 6,638 159,000 0,687 0,861 37,300 2,524333 0,930 10038188 155444000000
Latvia 32,177 96,200 0,299 0,639 21,000 10,93767 1,220 2266094 33685000000
Lithuania 21,655 126,700 0,472 0,591 28,000 8,495667 0,700 3358115 47297000000
Macedonia 2,050 113,000 0,397 0,747 29,700 5,165667 0,483 2052524 9890000000
Moldova 1,198 120,700 0,287 0,547 20,300 5,083333 0,714 3570107 6055000000
Poland 0,052 82,400 0,325 0,805 33,600 5,543 0,392 38125759 529401000000
Romania 6,046 73,800 0,246 0,791 37,800 6,115333 0,455 21513622 204339000000
Serbia 5,100 82,000 0,226 0,658 22,500 4,8 0,678 7350221 47738000000
Slovak Republic 9,480 155,600 0,758 0,861 35,500 8,558333 0,485 5406626 94945000000
Slovenia 11,241 126,200 0,619 0,866 31,400 5,562 0,858 2021316 54865000000
Ukraine 20,035 100,000 0,359 0,714 34,700 5,998667 0,481 46258200 180116000000

REDETE – ECONOMIC DEVELOPMENT AND ENTEREPRENEURSHIP IN TRANSITION ECONOMIES
34
REMITTANCES AND THEIR EFECTIVENESS FOR POVERTY REDUCTION IN ALBANIA
Dritan SHORAJ 10
Dorina ZENELAJ 11 Mimoza ZENELI 12
Abstract
Following the collapse of communism in 1990-’91, the youngest population of Albania ex-perienced massive immigration. The immigration of active labor force, intellectuals or elite of Albania was certainly associated with its both positive and negative impacts. Since the first five-year immigration period of Albanian young people to different countries of the world, there we-re positive effects of net incomes brought by the families of origin, due to the benefit of immig-rants’ employment. There was a significant impact of remittances on the Albanian economy al-though during recent years, they may be likely reduced under the global crises. In Albania, the current policy focus is drafting of programs strengthening the supporting infrastructure of remi-ttances. On the other hand, following the observations, it does not occur as long as there is no similar structure and the most common channels for inflow of remittances in Albania are the informal ones.
The purpose of this study is the analysis of effectiveness and management of remittances, the impact they produced on reduction of poverty and economic growth of our country. This study will be implemented at theoretical and empirical level, where primary and secondary data will be used. The search ethics criteria will guide our survey from initial stages to the final stage. Quality, validity, integrity, confidentiality and provision of informed consent will be moral and ethical principles pursuing our whole study.
The search methodology will be the quantitative one oriented to a positivist epistemological approach of data collection and statistical analyses. A structured interview will be used for the selected sample of the study, where the same group of topics or questions will be used for each interviewee. The importance of this study lies in the realistic reflection of the impact of remitta-nces for poverty reduction and public awareness of the key stakeholders who may influence the enhancement of their effectiveness.
Based on the results of data to be collected by the end of our study, we will present some fur-ther conclusions and recommendations on the effectiveness of remittances for poverty reduction within the country.
Keywords: remittance, poverty, economic growth, immigration, effectiveness
10 Lecturer, Faculty of Economy, Department of Management, University of Tirana, Albania. [email protected] 11 Lecturer, Faculty of Education Science, University “Aleksander Xhuvani”, Elbasan, Albania. [email protected] 12 Lecturer, Faculty of Economy , "Albania University " and " Logos University ". Albania. [email protected]

REDETE – ECONOMIC DEVELOPMENT AND ENTEREPRENEURSHIP IN TRANSITION ECONOMIES
35
Introduction
In 2004 the Bank of Albania estimated that the flow of remittances of migrants was 13.5% of GDP of Albania. According to ODA (Official Development Assistance) during that period the re-mittances of immigrants were three times higher than foreign direct net investments and doubling official development assistance received by Albania (Bank of Albania, 2005)
It is clear that global economic crises had a significant impact in Albania in terms of reduction of remittances. Many studies expressly indicate this finding and the fact that decline of remittance flows may be also due to a natural cycle of migrants’ deliveries, i.e, the larger the number of years of migration, stronger is immigrants detachment from their families of origin due to socialization with the country they live, raising a new family in the country where they have migrated, con-sidering the migration country as a second homeland, regular employment reducing net incomes compared to illegal labor or beginning of studies for younger people etc (Pulaj, 2011). Facts are important; some classify Albania among main countries of the source of remittances, conseque-ntly they are deemed as a vital tool for country development and reduction of absolute poverty. On the other hand, reportedly remittances do not reach the poorest individuals as a result of high migration costs and so they may have a negative impact on inequality. Even the scale of depen-dence on remittances at micro and macro level constitutes another concern.
Further, this study will introduce empirical and theoretical data to be collected by surveys with randomly selected interviewees who have become part of our study. Theoretical survey will be realized through the review of literature sources and modern authors, as well as statistical data retrieved until 2010 from other private and public associations and agencies.
By this study we will give a clear overview of influence that remittances have or not on pover-ty reduction and the way how they will be managed. Similar basic sources are used such as the Albanian legislation on labor market, reports of World Bank, UNDP, ILO and INSTAT, Bank of Albania, IMF and other well known authors. The study will include statistics about the number of migrants and net incomes from their remittances. Further, it will highlight issues related to delivery of incomes from migrants and their management. The study will be finalized with conclusions and recommendations of authors obtained from theoretical and empirical results of the study which will contribute to the field of studies on remittances and their management.
Literature Review
The high level of remittances registered until 2008 has generally reduced poverty effects and high level of unemployment. Although the level of migrants’ remittances has significantly decreased, they still have a positive impact and play a crucial role for the macroeconomic stability of our country, maintenance of standards of living and alleviation of poverty. These are at least the findings of statistics and surveys of the Bank of Albania and INSTAT.
Alternatively, remittances in Albania have been instrumental to avoid the high level of unemployment through massive immigration of qualified and unqualified workers, especially to Greece and Italy (IMF, 2008). During the period 1998-2003 remittances constituted 10-22 % of GDP, thus representing the main source of foreign currency in Albania (UNDP, 2005; IMF, 2005). In 2004 they represented about 13.5 % of GDP (AGENDA, 2010) while in 2007 the remittances were at the level of 12-13 % of GDP (Bank of Albania, 2008; UNDP, 2008).
According to AGENDA Institute, the Albanian migrants who are mainly settled in the area of European Union are the main senders of remittances with 90.7 %. To a wider extent, the origin of remittances lies in the neighboring countries such as Greece by 41.9 % and Italy by 38.6 %. About 8.1 % of remittances derive from the United States of America (AGENDA, 2011).

REDETE – ECONOMIC DEVELOPMENT AND ENTEREPRENEURSHIP IN TRANSITION ECONOMIES
36
There are different theories on reasons of increase, decrease, positive or negative effects that may be caused by income deliveries of migrants to their countries of origin. Although there are disputes and contradictions between the results of different studies, it is generally believed that remittances have a positive impact on the economy of beneficiary countries. A higher level of demand for goods and services is one of the effects of migrants’ remittances (Pang, 2008). Regar-ding the effect of remittances on economic growth, many studies have concluded that remittances have a positive impact (Faini, 2003; Ekanayake , 2008). However, other studies question this conclusion or have found a negative impact of remittances on economic growth (Chami , 2005).
At micro level, remittances play a vital role for improving the life of beneficiary families. Cash amounts received from remittances are used to pay the received debts to immigrate or for education and to buy more products, in order to make more investments in business and finance education or health services (Rapoport and Docquer 2006). A study in Guatemala has found that families which receive remittances from abroad spend more for investment goods such as education and houses than for consumables (Adams, 2005). Other studies have reported similar positive effects of remittances as for instance the enlargement of entrepreneurship activity in beneficiary families (Yang 2004; Woodruff and Zenteno 2001). On the other hand it seems that the beneficiaries of deliveries reduce their efforts to look for job due to increased incomes (Frank, 2001).
Studies conducted with data about remittances in Albania provide information about the effects of remittances on different aspects of life within the beneficiary families. The results of (Carletto, 2008) demonstrate that immigration of men may cause the empowerment of women through their wider access to employment or self-employment opportunities. In Albania the remittances are mainly used for primary needs and have a mutual relationship with the level of education of senders and beneficiaries (De Souse, Duval, 2009). However, remittances have positive effects on the level of satisfaction of beneficiaries with the general situation (Duval & Wolff, 2009; AGENDA, 2011).
Extensive research is carried out on the microeconomic motives behind remittances that distinguishes between three basic motives for remittances; pure altruism, pure self-interest and informal agreements with family members left in the home country (Smith, 2003; Solimano, 2004; Rapoport and Docquier, 2006; Adams, 2009; Shahbaz and Aamir, 2007; Alba and Soraya, 2009; Shera, Dosti and Shehaj, 2010). The altruistic model hypotheses that the amount of remittances should increase with the migrant’s income, decrease with the domestic income of the family, and decrease over time as the attachment to the family gradually weakens and increase when the home country currency depreciates (Shera, Dosti and Shehaj, 2010).
Jongwanich in 2007 studied the impact of remittances on poverty by decomposing its effect into direct and indirect components, and found that remittances directly reduce poverty through augmenting family incomes, and indirectly through the growth and human capital effects of remittances. He concludes that remittances can generate income even for families who receive no remittances at all mainly through the multiplier effects of expanded spending and such multiplier effect can lead to poverty reduction even for some poor families do not directly get remittances inflows (Jongwanich, 2007). Research suggests that a significant portion of remittances is spent on consumption and a smaller part is saved or invested (Adams, 2004). Remittances may help families to engage in several investment opportunities including investment in human capital, entrepreneurship and property.
Research on the macroeconomic determinants indicates that remittances respond to changes in the interest and exchange rate differentials between home and host country (Glytsos, 2001; Ratha, 2003;Yang, 2004; Shera, Dosti and Shehaj, 2010). These changes may also affect the timing of remittances for investment, which may indirectly effect poverty reduction (Shera, Dosti and Shehaj, 2010).
Theoretical literature on remittances is mainly focused on three aspects; 1) Motives and determinants of remittances, 2) Use of remittances, 3) Impact of remittances on poverty and inequality. According to the first aspect, the most common and acceptable motive to return money

REDETE – ECONOMIC DEVELOPMENT AND ENTEREPRENEURSHIP IN TRANSITION ECONOMIES
37
in the family is altruism as the immigrants are concerned about the well being of family members they have left in their home country. (Start and Lukas, 1985).
Regarding the second theoretical aspect on remittances, many researchers argue that the about 2/3 of remittances are used for consumption, mainly for food and the rest for housing (Massey and Parrado, 1994). Various studies about this aspect of remittances have concluded that even in other countries as Greece, remittances are used for food and housing (Glytsos, 1993). A case study in China has reported that remittances go for investments and savings. (Zhu, 2006). A study conducted in Pakistan during 2001-2003 drew the conclusion that remittances are used for investments in physical capital such as agricultural machinery, agricultural land and human capital as education or schooling (Mausuri, 2007).
According to the third aspect on impact of remittances on poverty and inequality, there are different study perspectives and results. A regression analysis on data taken from 40 villages in India, revealed that immigration increases rural inequality within and between villages. Attraction of migration allows the best immigrants to advance with better jobs while the postponement of immigration weakens the poor. The most common senders of incomes from migration work rarely come from poor rural areas. Accordingly, it is less likely that remittances may influence the reduction of rural poverty (Lipton, 1980). However, according to another study in Egypt, international remittances have a minor but positive effect on poverty. Results show that the number of families living in poverty is reduced by 9.8% when the forecasted per capita incomes of families include remittances which are estimated at about 14.7% of the total incomes for poor families. However, when remittances are included in forecasted per capita incomes of families, inequality is increased (Richard, 1991; Adams, 1993). In a study carried out by IMF for 101 countries during the period 1970-2003, there are similar conclusions as the result has suggested a very strong link between poverty and remittances. However, the impact may seem economically insignificant: 2.5% increase in the ratio between remittances/GDP is related to 0.5% reduction of poverty for people who live in poverty. (IMF, 2005)
As regards the case of Albania for distribution of remittances, following the observations it has resulted that remittances from immigrants represent 13 % of average family incomes while for host families they represent 47 % of family incomes (IMF, 2005). 87% of the total remittances are sent by family members who had left their families since 1990. The rest of 13% is sent by friends or acquaintances (Word Bank, 2008). Evidence on impact of remittances on poverty and inequality for Albania vary, depending on areas, migration models and poverty dimensions.
Research Methodology
The research methodology employed is the quantitative one, where data are collected through the conducted surveys and analyzed by the statistical program SPSS. Quantitative research method will be based on numerical data introduced in the form of statistics and collection through the designed questionnaire and define the measurement accuracy. It is based on figures and concise statistics, both objective and deductive. Data will be collected from the surveys carried out through the questionnaires. Assumptions made regarding the study are as follows:
H0 =>Albanian families are not subject to a reduction of poverty due to remittances. HA => Remittances reduce poverty of the Albanian families.

REDETE – ECONOMIC DEVELOPMENT AND ENTEREPRENEURSHIP IN TRANSITION ECONOMIES
38
Tab.1: The number of emigrants by the respective country 2010
The sample population is
selected according to the in-terests of this study, setting some a sample population only persons who: 1) live and work in Greece, Italy, England, USA 2) persons who have travelled by airlines during August 2012, 3) and persons who have arrived in Albania during the timetables 08.00-20.00 (air-crafts landed to “Mother
Theresa” Airport after that time have not been taken into consideration for our study). According to the World Bank, the largest percentage of the Albanian migrants as demonstrated by the graph, is focused in countries such as Greece, Italy, England, USA and 5 % in other countries (World Bank, 2010). Therefore, the sample population covers immigrants living and working in those countries. The selected sampling is randomly layered where each individual has equal opportunity to be part of this study falling within the sample characteristics. It is deemed random as the selection of case studies was 1 in 5 migrants crossing the only entry gate of the airport of Albania, who are supposed to live and work in the countries specified above. Meanwhile, the layering of sample population consists of the fact that people selected for the study are those travelling by the airline to “Mother Theresa” airport, with destination Tirana/Albania, who have arrived only by the airlines Greece-Tirana, Italy- Tirana, England-Tirana and Munich-Tirana (Munich of Germany was selected as it is one of the largest transit lines of the world, where some of the migrants who have come from the USA or Canada to Tirana, have Munich and then Tirana as the first stop). As mentioned above, this layering is caused by the number of migrants in those countries. Based on these percentages it was reached a decision to interview 47 migrants travelling by airlines Greece- Tirana, 36 from Italy-Tirana, 6 from England-Tirana, 11 migrants to be interviewed from the transit airline Munich-Tirana. The total number of persons identified of interest for our study was agreed to be 101 migrants interviewed, where all interviews were conducted during August 2012.
Due to the failure to conduct long interviews and for the purpose of study convenience, the survey used for the interviewing of selected respondents included 19 alternative questions. The questionnaire was structured where the same questions were applied for the whole sample population. The first questions were of demographic character being further expanded with main questions of our study such as: What are the average monthly incomes of relatives living in Albania? What is the average amount of monthly remittances of migrants sent to their relatives living in Albania? Who are the closest relatives living in Albania? Which city or town are they from ...etc.
Indeed, our study has attached proper importance to the principles of study ethics such as: informed consent is the process of explicitly asking the permit of the subject to be participant in the study, based on his full understanding of the interviewing procedures and its purpose (Blanche and Durrheim,1999; Gubrium, 2002). The confidentiality includes an agreement from the appli-cant to protect the privacy/anonymity of the study participants (Gubrium, 2002). Reporting of results: Study results should be published taking special care of the participants’ rights. At no time the information provided by study participants should be misinterpreted or distorted (Gubrium, 2002). In this study we ensure that the results are fully based on the data obtained from the study participants.

REDETE – ECONOMIC DEVELOPMENT AND ENTEREPRENEURSHIP IN TRANSITION ECONOMIES
39
Empirical data analysis
As we already mentioned, we aimed to carry out 101 surveys with the sample population spe-cified above. During the implementation of surveys with 101 subjects selected for our study sample, 87 surveys/interviews were made available for the purpose of analysis. According to a previously reached agreement, a prerequisite for data analysis included only data obtained from the surveys with subjects/persons who do not interrupt the interview until the end of the questionnaire and persons who refuse this survey would definitely not be part of data analysis. Accordingly, out of 101 planned surveys, 12 were not realized due to refusal of the selected subjects in terms of data collection process. Meanwhile, data obtained from another subject were not taken into consideration due to their low rate of validity.
This person returned to Albania after having served 10 years of his imprisonment sentence in Italy. The respondent in question had lived and worked in Italy for only six months and further he was sentenced by the Italian authorities by a term of 10 years of imprisonment. The data provided by him did not meet the requirements of our study as specified above; therefore they were not taken into account in data analysis. Consequently, it follows that only 87 surveys were taken into consideration for the further data analysis.
All our variables were analyzed through SPSS program, where we will introduce the analysis and relationship between key study variables determining the refusal or not of null hypothesis. Hence, the questions made to the respondents such as age, gender, employment, monthly incomes of their families living in Albania and incomes sent due to work in migration (remittances) etc.., are analyzed as shown below in Table 2 and Table 3, to check the frequencies and relationships between them and respectively between the variables of Averagmonth and Monthinc that are respectively the monthly incomes for each family due to work of migrants, and monthly incomes of the Albanian families provided by the employment in Albania of their relatives.
As we will see the table 2 reports that for 35 cases/subjects, the amount of incomes generated from migration, i.e remittances, prove to amount to 20.000-40.000 ALL, where this amount is uniformly distributed for different values of monthly incomes of the Albanian people employed in the country. In this framework, for one case that amount was added to the incomes of less than 10.000 ALL earned from the local employment. In 7 cases, remittances at 20.000-40.000 are added to the value of 10.000-20.000 of incomes from the local employment. In 17 cases which is also the highest frequency, with monthly incomes of 20.000-40.000 ALL, the same amount of remittances per month is added, where it follows that the total of family incomes is doubled. According to table 2, the amounts of incomes from migration work reaching the Albanian families, amount to a maximum of 10.000-20.000 ALL per month with 22 cases and 20.000-40.000 ALL per month with 35 cases.

REDETE – ECONOMIC DEVELOPMENT AND ENTEREPRENEURSHIP IN TRANSITION ECONOMIES
40
Tab.2: (Monthinc * Averagmonth Crosstabulation)
Tab.3: (Gen * Averagmonth Crosstabulation)
In the meantime, table 3 identifies the incomes of migrants’ work according to gender consi-
derations. This table demonstrates that remittances have higher rates from the migration work of male subjects, where out of 87 respondents, 57 subjects/males bring incomes to their families, where for the most frequent amount of 20.000-40.000 ALL per month, the number of males is 24 compared to 11 females.
Refering to the above table 4 which demonstrates the link between the perception about well being and incomes generated from the migrants, we note that 73 out of 87 interviewees are classified into the group of lowest level of remittances in Albania, i.e 20000-40000 ALL per month. The average remittance of a migrant into the first group of incomes is about 30.000 ALL that is approximate to the monthly salary of an employee in Albania (registered as such). From this perspective we reinforce the above conclusion that the main cause of migration in Albania during recent years is the low economic level.
If we focus on the interviewees of the first group but from the perspective of how they perceive well being, we reach the conclusion that they are moderately optimistic about the increase of well being, since the percentage of interviewees who answer in favor of the increase of well being is a little higher than the one of interviewees who give a negative answer.
We deem that the main part of incomes sent from the migrants is used to meet basic living needs and barely for its improvement. This does not apply to the interviewees of the second group

REDETE – ECONOMIC DEVELOPMENT AND ENTEREPRENEURSHIP IN TRANSITION ECONOMIES
41
of remittances. Considering that their remittances are higher, their perception about the increase of well being is very optimistic. 100% of interrogated persons have been in favor of the well be-ing. In general terms, the perception about well being which indirectly implies poverty reduction from migrants, is positive.
An analysis of the variable on question for which remittances are spent, clearly explains that they have influenced the upgrading of economic level. However, the cross-tabulation analysis between remittances and the way how they are spent, clearly demonstrates that these incomes are used for minimum living conditions such as food, clothing, medicaments or medical exami-nations, where tab.5 shows that about 84 % of incomes up to 40.000 ALL from migration are used for living needs or requirements, 13.8 % are used for house construction or refurbishment or for starting a business and only 1.1 % are saved in bank accounts or they are subject to informal methods.
In the meantime, methods of delivery of remittances basically remain the informal ones, where most of the respondents have admitted that they send them through their relatives or acquain-tances or when they come to Albania and about 47 per cent acknowledge they use Western Union or Express Mail.
Tab.4: Standliving * Averagmonth Crosstabulation
Tab.5: Averagmonth * Spendincom Crosstabulation

REDETE – ECONOMIC DEVELOPMENT AND ENTEREPRENEURSHIP IN TRANSITION ECONOMIES
42
During the study we were interested to examine or prove the hypothesis whether in Albania the
remittances influence poverty reduction. Considering that the perception of migrants about po-verty may be more challenging, via the questionnaire we have asked them about the well being and its improvement, therefore the hypotheses we have raised have been as follows: H0: Re-mittances do not influence the improvement of well being. HA: Remittances influence the im-provement of well being. Refering to the above paragraph, the foregoing hypothesis is equal to the following one: H0: Remittances do not influence poverty reduction. HA: Remittances influence poverty reduction.
Tab. 6: Chi-Square Tests
To verify the hypothesis we have applied the chi –square test (based on cross tabulation) with an importance level of α=0.05. The results of processed data are given in the following table. On the basis of the foregoing we note that Asymp. Sig=0.006 . Given that A.Sig = 0.006 is smaller than α=0.05, then the basic hypothesis H0 is rejected and the alternative hypothesis is accepted, arguing that remittances influence poverty reduction.
Conclusions
Remittances are far from the solution they are supposed to provide. However, they generally have a positive impact on main development aspects, including the creation of human capital, in-vestments, poverty reduction and macroeconomic stability, and even social and political changes.
As a result of the whole analysis of data processed through SPSS-s, it becomes clear that remi-ttances have positive effects on the Albanian reality. Yet, on the other hand, as their consequence women or even men representing active labor force because of additional monthly incomes from remittances, apparently do not develop their competitive skills in the labor market and remittances are used only as a safe means of living.
Firstly, remittances have reduced efforts to find a job. Most of women from families with con-tinuous remittances are unemployed. Secondly, there are reduced efforts for work in agriculture and technology or in other beneficial sectors. The families benefitting remittances generally prefer a more comfortable life. Consequently, the percentages of domestic products are reduced. Thirdly, a real assessment of remittance figures is challenging due to informal deliveries, therefore the effective management and formulation of programs and policies for them has been hard for the Albanian State.

REDETE – ECONOMIC DEVELOPMENT AND ENTEREPRENEURSHIP IN TRANSITION ECONOMIES
43
We emphasize that the Albanian Government should encourage investments of remittances in small businesses, to further continue the improvement of subsequent infrastructures for the development of those businesses. Without these conditions the migrants will find it hard to risk their capital under unsafe business conditions. The government should channel this money to productive and active investments for labor forces. Further, the facilitation of job mobility between the place of source and destination of remittances is probably the most important tool for the increase of inflows of deliveries for developing countries such as Albania and this is realized through the increase of agreements on good migration policies in the host countries of migrants.
Reference list
1. Acosta, P., Calderon, C., Fajnzylber, P., Lopez. H. (2007). What is the Impact of International Remittances on Poverty and Inequality in Latin America. World Development Vol. 36(1), pp. 89-114
2. Adams, R. (2005). Remittances, Household expenditure and Investment in Guatemala. World Bank, Washington, DC. Policy Research working Paper 3(532), pp. 29-37
3. Adams, H. (2009). The determination of International Remittances in Developing Countries. Word Development 37(1), pp. 93-101
4. Adams, R.(2004). Remittances and Poverty in Guatemala. Word Bank Policy- Research paper 3(418), pp. 18-19
5. AGENDA, (2010). The effect of remittances in Albania for 2010-Financed by SOROS. Albania, pp. 6-10
6. AGENDA, (2011). The effect of remittances in Albania for 2011- Financed by SOROS. Alba-nia, pp. 11-26
7. Albanian Bank, (2008). Remittances: Albanian Experience. Remittances Statistics:First. Meeting of the Luxembourg Group. Luxembourg, June 2006, pp. 22-23
8. Carletto, C. and Mendola, M. (2008). International migration and gender differentials in the home labor market: evidence from Albania. University of Milan – Bicocca. Working Paper Series No 148. November 2008, pp. 32-26
9. Chami, R.; Fullenkamp, C.; Jahjah, S. (2005). Are Immigrant Remittance Flowsa Source of Capital for Development? IMF Staff Papers. Vol 52(1) , pp.33-41
10. De Sousa, J., Duval, L., Wolf, F. (2009). Determinants and Implications of Remittances in Albania and Romania. The wiiw Balkan Observatory. Working Papers 080, pp.33-34
11. Durrheim, K. (1999). Research design. In Terre Blanche & K. Durrheim (Eds,) Research in practice: Applied methods for the social sciences . Cape Town: UCT Press, pp.34-49
12. Duval, L., Wolf, F. (2009). Remittances Matter: Longitudinal Evidence from Albania. Albania, pp. 45-47
13. Ekanayake E. M., Mihalis, H. (2008). Do remittances and foreign direct investment promote growth? Evidence from developing countries. Journal of International Business and Economics, Vol (1)2. Pp. 13-17
14. Faini, R. (2002). Development, Trade, and Migration: Revue d’Économie et du Développe- ment. Proceedings from the ABCDe europe Conference, Vol (1) 2, pp. 85–116
15. Frank, R. (2001). Philippine Town Plies a Road to Riches via Monthly Stipends: But are Pozor- rubians turning into Slackers as Relatives Abroad Send Home Cash? Wall Street Journal, Vol (3) 22 , pp.11-12
16. Glytsos. N. P. (2001). Measuring the income effect of migrant remittances: A methodological approach applied to Greece. Economic Development and Cultural Change, Vol. 4(2), pp. 21-17
17. Gubrium, F., Holstein, A. (1997). The New Language of Qualitative Method. New York: Oxford: Oxford University Press, pp. 5-7
18. International Monetary Fund. (2005). Tow current issues facing development countries. Word Economic Outlook. IMF, pp.29-30

REDETE – ECONOMIC DEVELOPMENT AND ENTEREPRENEURSHIP IN TRANSITION ECONOMIES
44
19. International Monetary Fund. (2008). Financial Aspects of Migration: the Measurement of Remittances”. IFC Bulletin No 27, pp.14-16
20. International Organization for Migration. (2008). Migration in Albania: A country Profile 2008, Albania, pp. 2-6
21. Jongwanic. (2007) International Migration and Economic Development: Lesson from low Income Countries, Edward Elgar Cheltenham UK, pp.57-64
22. Kalaj, E. (2010). Remittances and Human Capital Investment: Evidence from Albania. World Bank International Conference on Poverty and Social Inclusion in the Western Balkans, Belgium, December 2010, pp. 123-124
23. Mansuri, G. (2007). Does Work Migration Spur Investment in Origin Communities? Schooling and Health in Rural Pakistan. International Migration, Economic Development and Policy, Vol 3(23)
24. Massey. D. S., Parrado. E. (1994). Migradollars: the remittances and savings of Mexican migrants to the United States. Population research and policy review, Vol.13(3), pp.30
25. Matthews. B. & Ross. L (2010). Research Methods: Pearson Education, London, pp. 35-233, 145- 356
26. Rapoport, H., Docquier. F. (2006). The economics of Migrants’ Remittances: 1135-1199 in S.C. Kolm and J.M. Ythier (eds.) Handbook of the Economics of Giving, Altruism and Reciprocity: Vol 2, North-Holland: Amsterdam, pp. 9-18
27. Ratha, D. (2003). Workers Remittances: An important and stable source of external development finance. Word Development. Vol.14(6), pp. 20
28. Shera, A., Dosti, B., Shehaj, A. (2010). Remittances and the impact of poverty in Albania. Economic and Social Challeges and Problems 2010. International Conference in Alnania. Vol (2), pp.405-428
29. Stark., Lucus, R. (1988). Migration, Remittances and Family. Economic Development and Cultural Change, Vol. 31(1): 191-96
30. Taylor, J. E. (1992). Remittances and Inequality Reconsidered; Direct, Indirect and International Effects. Journal of Policy Modeling, Vol.14 (2), pp. 187-208
31. Woodruff, C., Zenteno, R. (2001). Remittances and Micro-enterprises in Mexico. In Global Economic Prospects. Washington, D.C.: World Bank, pp. 5-7
32. Word Bank. (2005). Word Development Indicator. Washington D.C: The Word Bank, pp. 34-38
33. World Bank. (2010). Albania New Growth Agenda - A Country Economic Memorandum: No-vember 2010.2(3), pp. 7-8
34. Yang, D. (2004). International Migration, Human Capital, and entrepreneurship: Evidence from Philippine Migrants’ exchange Rate Shocks.. Research Seminar in International economics, University of Michigan, pp. 531
35. Zhu,Y. (2006). Migration and the development of source areas: Evidence from China. Instutite for Future Studies Vol.11(2), pp.28-36

REDETE – ECONOMIC DEVELOPMENT AND ENTEREPRENEURSHIP IN TRANSITION ECONOMIES
45
NEW TRENDS AND CHALLENGES OF DEVELOPMENT ECONOMICS
Blagoj GORGIEVSKI13
Jovanka BILJAN14
Abstract
Modern growth theory started with the neoclassical model who showed that in a long run growth cannot be sustained by capital accumulation alone so technological progress and hu-man capital formation are endogenized within general equilibrium models of growth. Develop-ment economists was visionary and dedicated to grand throries and general straregies, so they was almost moralistic, dedicated to a somber realism grounded on fundamental principles of neoclassical economics.
For developing countries, the new growth theory implies a greater emphasis on human capi-tal (including learning), even more than on physical capital, and recognition of the benefits from the international exchange of ideas that accompanies an open eoonomy integrated into the world economy
Cross-country variation in growth rates or income levels to attribute to different kinds of capital or to technology or efficiency as a result of geographical differences, institutions, tec-hnical progress, economic policies, international trade and culture so challenges is focused on quality of development, employment creation, importance of institution, technological conver-gence and cosial capability.
Keywords: economic development, growth theory, neoclassical model, developing countries
13 email: [email protected] St. Kliment Ohridski University – Bitola Faculty of Law, Bitola, R. Macedonia 14 email: [email protected] St. Kliment Ohridski University – Bitola Faculty of Tourism and Hospitality - Ohrid

REDETE – ECONOMIC DEVELOPMENT AND ENTEREPRENEURSHIP IN TRANSITION ECONOMIES
46
Introduction
The big issues of development economics are: how economies and societies grow and change. These issues were the main preoccupation of the work of the classical economists. Classical economists are often regarded as “ pesimistic” in their forecasts of the future development of the economy and came in for heavy criticism from the unlikeliest of sources, the Romantic poets and literary critics such as Ruskin. The classical economists’ search for a ‘theory of value’ and a ‘theory of distribution’ was an attempt to understand the significant economic, political, and so-cial changes of their times, as well as an attempt to understand what would happen in the long run in those economies.
The “biginners" of development economics, writing soon after World War II, were firmly aw-are of these intellectual connections and roots. They initially recognized the heritage of classical growth economics. The biginners were also directly concerned with the role of changing behavior and institutions in the process of development, issues that those working in development eco-nomics have been emphasizing strongly in recent years. It is therefore now of great value for a new generation of development economists to interact with the earlier generations. They have much to learn, not only in terms of ideas and concepts but also in terms of wise judgment on what is important.
Development economists have, throughout the last 50 years, been strongly involved with issues of policy. This involvement implies that the role of the state must be at center stage. On this subject there has been a fundamental change in development thinking. In the early years, following World War II, there was, broadly speaking, a mistrust of markets, including world markets, influenced in large part by the experi- ence of the Great Depression. There was also confidence in the ability of government to take an effective and productive role in directing investment. The experience of the 1950s and 1960s did not sapport this confidence, and the 1970s and 1980s saw strong moves to liberalize and privatize.
By the end of rhe 1990s, we had seen many countries embark on market reform. Again, we have learned from experience. We see that market reforms can be, and on the whole have been, an engine of growth. But we have also seen that if they are not supponed by sound institutions and good governance, they can stall or fail. Hence, the focus now is on the relations between institurions and matkets.
Over the past half-century, we have witnessed an unprecedented effort by the international community to accelerate the development of poor countries. This effort has been based on an evolution in thinking about economic development-its nature, its causes, and the choice of policies fot improving the rare and quality of the development process. Although the development record exhibits many successes, there are also failures and disappointed expectations. And while the first two generations of development economists brought about much progress in the evolution of the subject, many unsettled questions and central issues remain to be resolved by the next generation.
Although different cultures place different values on the various elements of development, broadly defined, most seek improvement in every dimension. Many of the indicators used to measure progress (infant mortality, school enrollment, gender equality in education, indexes of political freedom, and so on) are correlated with income per capita. But the correlation is imperfect. All these factors need to be assessed independently of economic growth.
Policymakers in most developing countries have long recognized that development encom-passes more than rapid income growth. They have often differed, however, about priorities.

REDETE – ECONOMIC DEVELOPMENT AND ENTEREPRENEURSHIP IN TRANSITION ECONOMIES
47
The economic growth theories – new development tendencies
Classical economic analysis envisaged that per capita output would be stationary as the rate of profit declined with diminishing improvements in productivity. The neoclassical tradition also incorporated the idea of falling marginal product of inputs, so that sustained growth was possible only through exogenous technological change (Solow 1957). If countries have access to the same technology, therefore, growth rates would be expected to converge across countries. The recent record of industrial countries offers support for convergence.
Modern growth theory started with the neoclassical model of Solow (1956) and Swan (1956), who showed that in a long run growth cannot be sustained by capital accumulation alone. In their formulation, the diminishing marginal product of capital will always terminate any temporary burst of growth in excess of the growth rate of labour-augmenting productivity. But this perspective has been challenged by more recent endogenous growth theory. In the AK theory of Frankei (1962) and Romer (1986), growth in productivity is functionally dependent on growth in capital, through learning by doing and technology spillovers, so that an increase in investment rates in physical capital can also sustain a permanent increas in productivity growth and hence in the rate of economic growth. In the innovation-based theory that followed AK theory, the Solow model has been combined with a Schumpeterian theory of productivity growth, in which capital accumulation is one of the factors that can lead to a permanently higher rate of productivity growth (Howitt and Aghion, 1998).
In accordance with neoclassical economic theory, the second generation moved from highly aggregative models to disaggregated microstudies in which the units of analysis were production units and households. For offering policy advice, "grand theories" came to be viewed as less useful than highly specific applications. Microstudies, rather than the broader visionary models of the earlier period, could provide more direct policy implications for specific policies such as a change in tariffs or agricultural subsidies (Arrow 1988). There was a marked change from a focus on the process of development to an emphasis on particular features of underdevelopment. Quantitative analytical tools were used more extensively, especially for empirical analysis of microphenomena that were country specific, sector specific, or project specific. The greater availability of microdata sets allowed the modeling of household behavior and of human capital investments in education and health.
The second generation's recognition of new market failures has also renewed interest in the first generation's models that were concerned with issues of investment allocation and coordination activities. So, too, have elements of the new growth theory (knowledge, externalities, dynamic increasing returns), the new institutional economics (information, contracts, response to missing markets), and the new international economics (imperfect competition, strategic trade theory). This new or extended neoclassical analysis provides a basis for increasing returns and coordination of externalities resulting from capital accumulation. There is, accordingly, a return to the first generation's emphasis on the importance of increasing returns and pecuniary external economies arising from the effects of market size.
A major modifcation of neoclasical analysis occurred in the 1980s and 1990s, when "new market failures” were analyzed. The recognition of the existence of imperfect and costly information, incomplete markets, and transaction costs and of the absence of futures markets extended the range of market failures beyond the earlier attention to public goods and externalities that required only selective government intervention (Stiglitz 1989b). Risk and information imperfections in the economy became highly relevant for development analysis. Correction of the new market failures provided a basis for a potential role for more pervasive govemment intervention. Nonetheless, in the 1990s more emphasis was actually given to government failures than to market failures, and concern about policy reform dominated (Krueger 1990). The recognition of risk and information imperfections did, however, improve analysis of two sectors that had been relatively neglected by the first generation: agriculrure and finance.

REDETE – ECONOMIC DEVELOPMENT AND ENTEREPRENEURSHIP IN TRANSITION ECONOMIES
48
By emphazing knowledge and ideas, the new endogenous growth theory of the 1980sand 1990s brought about a marked change in the analysis of aggregate producrion functions (Romer 1986,1989,1990; Lucas 1988). Instead of the early Solow version of diminishing marginal rerums to physical capital and to labor separately and constant returns to both inputs jointly, with technological progress as a residual, the new growth theory examines production functions that show increasing returns because of an expanding stock of human capital and as a result of specialization and investment in "knowledge" capital. Technological progress and human capital formation are endogenized within general equilibrium models of growth. New knowledge is generated by investment in the research sector, and the technological progress residual is accounted for by endogenous human capital fonnation and the increases in the public stock of knowledge. With imperfect comperition, the prospect of monopoly profits induces innovation. Knowledge or information, once obtained, can be used repeatedly at no additional cost. The new production processes and products then create spillover benefits to other firms. “The creation of new knowledge by one firm is assumed to have a positive external effect on the production possibilities of other firms ... (so that) production of consumption goods as a function of the stock of knowledge exhibits increasing returns; morc precisely, knowledge may have an increasing marginal product" (Romer 1986: 1003). This allows aggregate investment in the public stock of knowledge to exhibit increasing returns to scale, to persist indefinitely, and to sustain long-run growth in per capita income.
Now, at the beginning of the 21st century, this view is reiterated in the new or newly rediscovered growth meory that treats knowledge as a non rival good and emphasizes aggregate nonconvexities associated with investment in “knowledge" capital (Romer 1986). The theory explains technical progress as being determined by the “accumulation of knowledge by forward-looking, profit maximizing agents" (Romer 1986: 1003). It thus supplements Solow's model, which emphasized capital accumulation. Almough the “new growth theory" is not literally new, it does emphasize “newness" in production functions and in the goods produced (Romer 1994a, 1994b). The introduction of new goods is important to development and raises the problem of fulfilling total conditions (the introduction of an industry) rather than neoclassical marginal conditions (the production of additional units).
At the outset in the 1950s, development economists were more confident han now.They formulated grand models of development strategy that involved structural transformation and a correlative role for extensive governement involvement in development programming or planning. The models were visionary, looking to the requirements for an increase in per capita real income. Because population-thee denominator-was increasing, thee emphasis had to be on a rapid rate of growth of the numerator gross domestic product (GDP). Capital accumulation, as the necessary requirement, was the central focus of the models. The Harrod-Domar equation although originally formulated for conditions of full growth in an industrial economy, was applied to estimate capital requirements in developing countries.·
Furthermore, development economists was visionary and dedicated to grand throries and general straregies, so they was almost moralistic, dedicated to a somber realism grounded on fundamental principles of neoclassical economics. Harberger could say to the governments of developing countries, "Economics is good for you"-and by economics, he meant neoclassical analysis as the basis for policymaking (Harberger 1993). Governments were admonished not only to remove price distortions but also to "get all policies right." Not differences in initial conditions but differences in policies were now thought to explain the disparate performances of developing coumries. A country was not poor because of the vicious circle of poverty but because of poor policies. Markets, prices, and incentives should be of central concern in policymaking.
Numerous studies critizised prices destorsion, high effective rates of protection, and rent-seeking. Not advers external conditions but inappropriate domestic policies explained why some countries were not taking advantage of their external economic opportunities. In conuast, the East Asian newly industrializing economies were viewed as the success stories of development. The correct policies were to move from inward-looking strategies toward liberalization of the foreign

REDETE – ECONOMIC DEVELOPMENT AND ENTEREPRENEURSHIP IN TRANSITION ECONOMIES
49
trade regime and export promotion; to submit to stabilization programs; to privatize state-owned enterprises; and to follow the dictates of the market price system. Through its guidance toward the correct policies, neoclassical economics was believed to he the safeguard against policy-induced distortions and non market failures.
The growth rates of developing countries, however, have diverged. At first look, this seems to be at odds with the expectation of convergence. But in practice, technological change has not been equal nor has it been exogenously transmitted in most developing countries, because of import and other restrictions. Furthermore, even if all economies have access to the same technology, national growth rates can differ if human capital and the incentives to adopt new technology differ across countries. The “new" growth theories note that technological change is endogenous, and that education and knowledge produce positive externalities or increasing returns (Romer 1986; Lucas 1988).
For developing countries, the new growth theory implies a greater emphasis on human capital (including learning), even more than on physical capital, and recognition of the benefits from the international exchange of ideas that accompanies an open eoonomy integrated into the world economy. The new growth theory is also relevant for the question of convergence. Convergence occurs as the “technology gap" between countries is overcome and poor counuies catch up with rich ones by growing faster. Free mobility of capital among countries will speed this convergence as the rate of diffusion of knowledge increases.
Deeper determinants of growth
Even if we knew how much of the cross-country variation in growth rates or income levels to attribute to different kinds of capital or to technology or efficiency, we would still be faced with the deeper question of why these differences in capital and prroductiyity arise. A large number of candidate explanations have been offered in the literature. These candidates can be classified into four broad categories: geography, institutions, policy and culture.
Geographical differences are perhaps the most obvious. As Sachs (2003) has emphasized, countries that are landlocked, that suffer from a hazardous disease environment and that have difficult obstacles in the way of internal transport, will almost certainly produce at a lower level than countries without these problems, even if they use the same technology and the same array of capital. In addition, the lower productivity of these countries will serve to reduce the rate of return to accumulating capital and to generating new technologies.
Institutions matter because of the way they affect private contracts and also because of the way they affect the extent to which the returns to different kinds of investments can be appropriated by the government. The origin of a country's legal system has been shown by La Porta et a!. (1998) to have an important effect on private contracts. In particular, these authors show that countries with British legal origins tend of offer greater protection of investor and creditor rights, which in turn is likely to affect both capital accumulation and investment in technology by making outside finance more easily available.
Because long-term productivity growth requires technical progress, it depends on political, institutional and regulatory factors that affect the way the conflict between the winners and losers of technical progress will be resolved, and hence affect the incentives to create and adopt new technologies. For example, the way intellectual property is protected will affect the incentive to innovate, because on the one hand no one will want to spend resources creating new technologies that his or her rivals can easily copy, while on the other hand a firm that is protected from competition by patent laws that make it difficult for rivals to innovate in the same product lines will be under less pressure to innovate. Likewise, a populist political regime may erect barriers to labour-saving innovation, resulting in slower technical progress.
Economic policies matter not only because of the way they affect the return to investing in capital and technology but also because of the inefficiencies that can be created by taxes and

REDETE – ECONOMIC DEVELOPMENT AND ENTEREPRENEURSHIP IN TRANSITION ECONOMIES
50
subsidies. But how these policies affect economic growth can vary from one country to another. In particular, Aghion and Howitt (2006) have argued that growth-promoting policies in technologically advanced countries are not necessarily growth-promoting in poorer countries, because innovation and implementation are affected differently by the same variables. For example, tighter competition policy in a relatively backward country might retard technology development by local firms that will be discouraged by the threat of foreign entry, whereas in more advanced countries firms will be spurred on to make even greater R&D investments when threatened by competition.
International trade is one of the policy domains most likely to matter for growth and income differences, because of the huge productivity advantage that is squandered by policies that run coullter to comparative advantage, because protected firms tend to become technologically backward firms, and because for many countries international trade is the only'way for firms to gain a market large enough to cover the expense of developing leading-edge technologies. So it is probably no accident that export promotion has been a prominent feature of all the East Asian countries that began escaping from the lower end of the world income distribution towards the end of the 20th century, whereas import substitution was a prominent feature of several Latin American countries that fell from the upper end of the distribution early in the 20th century.
Culture is a difficult factor to measure. In principle, however, it is capable of explaining a great deal of cross-country variation in growth, because a society in which people are socialized to trust each other, to work hard, to value technical expertise and to respect law and order is certainly going to be thriftier and more productive than a society in which these traits do not apply. Recent work has begun to quantify the role of culture using measures of social capital, social capability, ethno-linguistic fractionalization, religious belief, the spread of Anglo-Saxon culture and many other variables.
Challenges – priorites for action
Although, at the end of the 20th century, the second generation of development economisrs leaves the subject in a far more advanced state than at midcentury, there is clearly much unfinished business and many unsettled questions to be considered by the new generation. It would be presumptuous and unrealisric to dictate a future research agenda, but we may suggest some central topics that deserve consideration.
Emphasis on "quality development"
The new generatation must still begin with an undestanding of the meaning of "economic development." To the old generation, the objective of development was an increase in per capita real income (or in a parchasing power parity index of per capita income), to be attained by growth of GDP. But it was increasingly realized that "development" meant growth plus change and that change implied other objectives beyond simple GDP growth. Emphasis on "quality growth," or a desired pattern of growth, incorporates broader criteria of development such as poverty reduction, distributional equity, environmental protection, or Sen's emphasis on "entitlements" and enhance-ment of "human capabilities" (Sen 1983) and, more recently, development as freedom (Sen 1999). In this broader view "the growth of real income and output has to be put in its place as ultimately an instrumental concern - deeply conditional on its causal role in enhancing more intrinsicaly valued objects" (Sen 1994: 367). Successful development policies need to determine not only how more rapid growth of real income can be generared but also how real incom can be used to achive the other values incorporated in "development."

REDETE – ECONOMIC DEVELOPMENT AND ENTEREPRENEURSHIP IN TRANSITION ECONOMIES
51
Employment creation
When forces in certain types of growth regimes can plunges some groups into poverty, it becomes all the more essential to devise governement policies that are adequate to lift them out of poverrty. A central problem of development will remain surplus labor. The need to create jobs will be especially pressing. given that the world's labor force will increase by 40 percent over the next two decades, with 95 percent of the increase in developing countries, where less than 15 percent of the world's capital investment will occur (Summers 1991: 5). To reduce poverty by increasing productivity and earnings, governments will have to devise appropriate policies in four crucial sectors of the economy: the rural sector, the urban informal sector,the export sector, and the social secror.
Importance of institution
To understanding the heterogeneous expirinace of countries of achieving “ development” in the broad sence, it will be necessery to appreciate more fully the role of arganisation and institutions. It is common to say that institutions matter, and, as advice for overcoming dualism and establishing a robust market price system, it is now common to say "get institutions right." But what is the meaning of "tight"? And how are the right institutions to be established? The mo-del of the oompetitive ideal world is essentially institutionless and provides little guidance fot the actual establishment of efficient markets. These are imponant questions fot the new generation's research agenda.
Oliver Williamson(1995) lalso interprets the new institutional economlcs from the perspective of the institutional environment-the macroanalytics of the political and legal rules of the game-and from the microanalytical perspective of the firm and market modes of contract and organization. Starting from the objective of economizing transaction costs, firms and markets establish institutions for governance of contracts, invesment,and private ordering. There are alrernative models of organization: markets, hybrids, hierarchies, and public bureaus. Each mode establishes different incentives and controls that lead to different degrees of cooperation or competition, credible invesnnent conditions, and credible contracring.
Neoclassical institutional economists have tended to focus on institutions that improve allocative efficency and have consideted relative price changes to be the main motive force for institutional change (Bardhan 1989: 1391-93). Institutional change, however, also involves a redistributive change. This raises issues of collective action, bargaining power, srate capaciry (Evans 1992), and political processes that neoclassical institutional economics has ignored.
A type of "constitutional economics" will be required to detennine what reforms of the politi-cal-institutional parameters will provide appropriate incentives and rules of behavior for persons entering into exchange relationships. In a developing economy it is especially important that insti-tutions both facilitate and adapt to change (Stem and Stiglitz 1997: 273). To do this, and to realize its potential for development, a country must be capable of "much social invention-changes in ar-rangements by which people are induced to cooperate and participate in economic activity" (Kuznets 1966: 5). Or, there must be a sufficiently high level of "social capability" (Ohkawa and Kohama 1989: 207-16).
Technological convergence and social capability
A prominent interpretation of "catch-up” and “convergence" emphasizes the forces of "techno-logical convergence” and "social capability" between the productivity leader and the followers. Abramovitz and David (1996) analyze how these forces relate to a country's growth potential and

REDETE – ECONOMIC DEVELOPMENT AND ENTEREPRENEURSHIP IN TRANSITION ECONOMIES
52
its actual ability "to make the tehnological and organizational leaps" that the convergence hypo-thesis envisages. The constraints on the potentials of countries are divided into two categories. First are limitations of “technological convergence"-limitations that arise because the frontiers of technology do not advance evenly in all dimensions among nations, that is, with the same proportional impact on the productivities of labor, capital, and natural resource endowments, on the demands for the different factors of production, and on tbe effectiveness of different scales of output. The lagging countries have difficulty in adopting and adapting the current technological practices of the leader.
Social capital
Following the successive emphasis on tangible capital, human capital, and knowledge capital, some economists would now add "social capital" to the sources of growth. Collier (1998) charac-terizes "social capital" as the internal social and cultural coherence of society, the norms and values that govern interactions among people, and the instimnons in which they are embedded.
"Government social capital" can incorporate the benefits of law, order, property rights, education, health, and "good government." To the extent that social capital reduces transaction costs and information costs and makes physical capital and human capital more productive, it could be interpreted as a source of total factor productivity (the Solow residual).
The emphasis on social capital--or culture, institutions, and behavioral paltems-should move the explanation of the process of change into a multidisciplinary endeavor. As Nonh (1990, 1997) contends, cultural beliefs are a basic dererminant of institutional structure. Not economics, but psychology, sociology, political science, anthropology, law, and history must then provide the answers regarding the origins of cultural beliefs and how they lead to institutional change and the formation of social capital over time. Interdisciplinary research is needed to understand the obstacles to change in the form of values and insritutions. Only a beginning has been made in this area.
Conclusion
Modern growth theory started with the neoclassical model of Solow (1956) and Swan (1956), who showed that in a long run growth cannot be sustained by capital accumulation alone. In accordance with that, the second generation moved from highly aggregative models to disaggregated microstudies in which the units of analysis were production units and households. The second generation's recognition of new market failures has also renewed interest in the first generation's models that were concerned with issues of investment allocation and coordination activities. So, too, have elements of the new growth theory (knowledge, externalities, dynamic increasing returns), the new institutional economics (information, contracts, response to missing markets), and the new international economics (imperfect competition, strategic trade theory).
Furthermore, development economists was visionary and dedicated to grand throries and general straregies, so they was almost moralistic, dedicated to a somber realism grounded on fundamental principles of neoclassical economics. For developing countries, the new growth theory implies a greater emphasis on human capital (including learning), even more than on physical capital, and recognition of the benefits from the international exchange of ideas that accompanies an open eoonomy integrated into the world economy. The new growth theory is also relevant for the question of convergence. Convergence occurs as the “technology gap" between countries is overcome and poor counuies catch up with rich ones by growing faster. Free mobility of capital among countries will speed this convergence as the rate of diffusion of knowledge increases.

REDETE – ECONOMIC DEVELOPMENT AND ENTEREPRENEURSHIP IN TRANSITION ECONOMIES
53
According to deeper determinants of growth we knew how much of the cross-country variation in growth rates or income levels to attribute to different kinds of capital or to technology or efficiency, we would still be faced with the deeper question of why these differences in capital and prroductiyity arise. A large number of candidate explanations have been offered in the literature. These candidates can be classified into four broad categories: geography, institutions, policy and culture.
Although, the second generation of development economisrs leaves the subject in a far more advanced state than at midcentury, there is clearly much unfinished business and many unsettled questions to be considered by the new generation. It would be presumptuous and unrealisric to dictate a future research agenda, but we may suggest some central topics that deserve consideration such as: emphasis on "quality development", employment creation, importance of institution, technological convergence and social capability and social capital
Reference list
1. Abramovitz, M., David, P. (1996). ”Technological Change and the Rise of Intangible Invest-ments: The US Economy’s Growth-path in the Twentieth Century”, Employment and Growth in the Knowledge-based Economy, Paris: OCDE
2. Aghion, P. and Howitt, P. 1992. A model of growth through creative destruction, Econometri-ca 60, 323-51.
3. Aghion, P. and Howitt, P. 2006. Appropriate growth policy: an integrating framework, Journal of the European Economic Association 4, 269-314.
4. Arrow Keneth J. 1988. "General Economic Theory and the Emergence of Theories of Economic Development." In Kenneth J. Arrow, ed., The Balance between Industry and Agriculture in economic Development, vol. 1, 21-32. New York, St.Martin's press.
5. Bardhan, Pranab. 1989. "The New Institutional Economics and Development Theory: A Brief Critical Assessment." World Development 17 (!I, September):1389-95.
6. Collier, P. and J.W. Gunning (1999), `Explaining African Economic Performance’, Journal of Economic Literature
7. Evans, Piter. 1992. "The State as Problem and Solution: Predation, Embedded Autonomy, and Structural Change.” In Stephen Haggard and Roben R. Kaufman,eds.., The Politcs of economic Adjustment, ch. 3. Princeron, N.J.: Princeton University Press
8. Frankel, M. 1962. The production function in allocation and growth: a synthesis. American Economic Review 52, 995-1022 .
9. Howitt, P. and Aghion, P. 1998. Capital accumulation and innovation as complementary factors in long-run growth. Jourlal of Economic Growth 3, 111-30.
10. Harberger, Arnold C. 1983. "The Cost-Benefit Approach to Development Economics." World Development 11 (10, October): 863-73.
11. Kruger, Anne O 1990. “Govermment Failures in Development”. Journal of of Economic Perspectives 4 (3, summer): 9-23.
12. Kuznets, Simon (1966), Modern Economic Growth, New Haven, CT: Yale University Press. 13. La Porta, R., Lopez-de-Silanes, E, Shleifer, A. and Vishny, R.W. 1998, Law and finance.
Journal of Political Economy 106, 1113-55 . 14. Lucas, Robert E. 1988. “On the Mechanics of Economic Development.” Journal of Monetary
Economics 22: 2–42. 15. Marshal, Alfred. 1890. The Principles of economics. London: Macmillan. 1897. "The Old
Generation of Economists and the New.", Quarterly Journal of economics 11 (2,January): 115-35.
16. Ohkawa, Kazushi and Kohama, Hirohisa, Lectures on Developing Economies, University of Tokyo Press, 1989.
17. Romer, Paul M. 1986. “Increasing Returns and Long-Run Growth.” Journal of Political Economy 94: 1002–37.

REDETE – ECONOMIC DEVELOPMENT AND ENTEREPRENEURSHIP IN TRANSITION ECONOMIES
54
18. Rosenstein-Rodan, Paul N. 1943. “Problems of Industrialization in Eastern and South-Eastern Europe.” Economic Journal 53: 202–11.
19. Rostow, W. W. 1960. The Stages of Economic Growth. Cambridge, U.K.: Cambridge University Press, 1002-37.
20. Romer, Paul M 1986. “Increasing Returns and Long-Run Growth," Journal of Politcal economy 94 (5, October):
21. Romer Paul M 1990. "Endogenous Techinical Change." Journal of Political Economy” 98:71-102.
22. Sachs, J.D. 2003. Institutions don't rule: direcl effects of geography on per capita income. Working Paper No. 9490. Cambridge, MA: NBER.
23. Sen, Amartya. 1983. “ Development: Which Why Now ? “ Economic Journal 93 (December): 745-62
24. Sen, Amartya.1999. Development as freedom. New York: Knopf. 25. Solow, R.M. 1956. A contribution to the theory of economic growth. Quarterly Journal of
Economics 70, 65-94 . 26. Stiglitz, Jozeph E. 1989b. "Markets, Markel Failures, and Development.” American economic
Review 79 (2, May): 197-203. 27. Swan, T.W. 1956. Economic growth and capital accumulation. Ecollomic Record 32,334-61. 28. Williamson, Oliver E. 1995. “ The Institutions and Governance of Economic Development
and Reform.” In procceedings of the World Bank Annual Conference on Development Economics 1994. Washington, D.C.: World Bank

REDETE – ECONOMIC DEVELOPMENT AND ENTEREPRENEURSHIP IN TRANSITION ECONOMIES
55
ECONOMIC CRISIS IMPACT ON DEVELOPMENT OF STRESS AT EMPLOYEES
Ivan PERONJA15 Senka BOROVAC ZEKAN16
Slaven GRIZELJ17
Abstract
This paper outlines theses on the impact of economic crisis on productivity of human resour-ces in an organization. Certain elements of the economic crisis that directly or indirectly influe-nce the employees’ mental health are observed. The consequences of the economic crisis are manifested in the form of stress that is caused by the negative economic effects due to which the organization is suffering very high costs of sick leaves and reduced workers’ productivity. Hu-man resources play a fundamental role in business processes in the organization, regardless of its size, maturity, homogeneity or structure. The above stated implies that a large number of or-ganizations fail to adequately cope with reduced workers ‘productivity at the workplace. The research, which was conducted among the organizations with different number of employees and different ownership structure, confirms the assumption that the economic crisis influences the level and amount of stress at employees which, if not controlled, can result in employees’ depression, bringing the company in situation in which it has to deal with severe costs and a si-gnificant decline in productivity. It is estimated that since the beginning of the crisis, various mood disorders have caused damages of 113.4 billion Euros, and 63% of this amount goes to the cost of low productivity and sick leaves.
Keywords: economic crisis, stress, depression, human resources, workers’ productivity
15 Assistant lecturer, University Centre for Professional Studies in SplitLivanjska 5, 21000 Split, Croatia,
E-mail: [email protected] 16 Assistant lecturer, University Centre for Professional Studies in SplitLivanjska 5, 21000 Split, Croatia,
E-mail: [email protected] 17 Consultant, Stanic&Co, Mostar, Bosna i Hercegovina

REDETE – ECONOMIC DEVELOPMENT AND ENTEREPRENEURSHIP IN TRANSITION ECONOMIES
56
1. Introduction
In the history of mankind there have been various reasons which have led to various crises and wars. The causes and consequences of unusual movements that lead to various types of crisis can almost be observed cyclically. One of the types of crisis is the economic crisis whose evolution can be motivated by different factors on different geographic territories and at different time with a unique level of intensity and duration. We can talk about the crisis when the effectiveness of a given system over a longer period of time is below the expected level18. In the context of organi-zational management, including human resources as part of the organization, crisis can be defined as any deviation from the targeted and realized values, meaning that all parts of the organization should continually be improved in order to avoid underachievement of the targeted values. Damages and negative consequences of the still current economic crisis, since its beginning in 2008, are estimated at 113.4 billion Euros. The current crisis, like every other crisis, has its own period and phases of unfolding crisis cycle, however, the question is how to handle such changed circumstances competently. The aim and function of human resource management are competent personnel actions at the right time in the right place. Products of the economic crisis do not necessarily reflect negatively on the business of the organization. By disposing knowledge and experience, the crisis may be detected on time and intercepted at the very beginning, which can turn potentially negative effects of the crisis into opportunities. Management competencies of each organization should be such as to ensure rapid and efficient transformation of destructive and destabilizing factors into the more demanding aims and challenges of new ways of management and functioning of the organization. Since there are more types of the crisis, for the management dealing with the situation, it is primarily essential to establish the correct diagnosis, i.e. to diagnose whether it is the crisis in question, what form, type or intensity it is, and to define the role of human resources in overcoming the crisis. If the human resources become targets or the participants in the cycle of crisis, or any other form of economic disorder, then the increase in direct and indirect costs cannot be avoided. The division of tasks and responsibilities to management in the organization, apart from creating a flexible organization that will be able to adapt quickly and easily to market changes and deviations, has the task to "develop immunity," and the organizational key segment code and these are its employees. If managers in charge do not detect latent need and enforcement for actions at their employees on time because of the changes conditioned by the economic crisis, it is reasonable to expect the development of uncertainty, anxiety, increased confusion, reduced level of motivation because of uncertain future events, disruptions in business communication, and ultimately the development of stress, depression, psychological and other chronic physical illnesses, and all of the above causes reduced workers’ productivity.
2. Stress, the importance of managing stress in the workplace and the effects of stress
Stress is the reaction of the human body to unusual environmental effects, which lead it into a state of reduced quality of responses to the observed changes. Stress is not an absolute figure, it is dependent upon employees' ability to adapt to unexpected situations which are not prepared or trained. The level of changes that cause stress at employees is not identical for everyone, but it is
18 Pastuović, N., Edukologija: Integrative science of lifelong education and training, Znamen, Zagreb, 1999. pg. 32
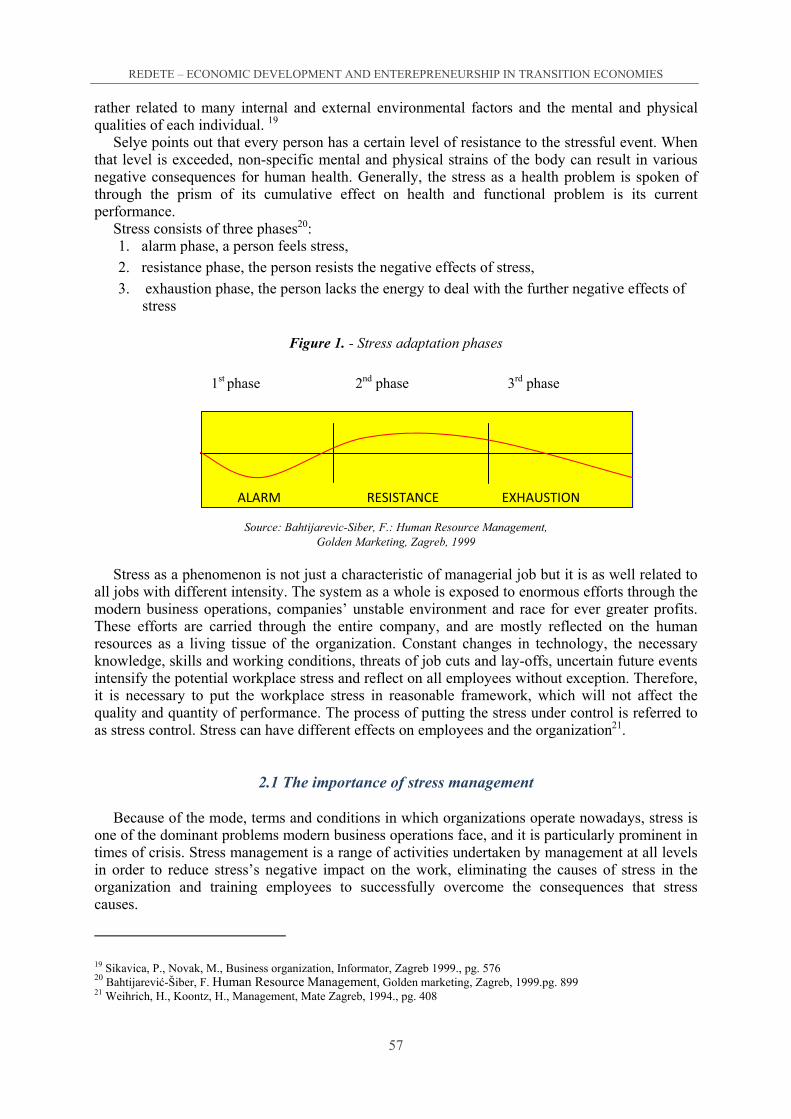
REDETE – ECONOMIC DEVELOPMENT AND ENTEREPRENEURSHIP IN TRANSITION ECONOMIES
57
rather related to many internal and external environmental factors and the mental and physical qualities of each individual. 19
Selye points out that every person has a certain level of resistance to the stressful event. When that level is exceeded, non-specific mental and physical strains of the body can result in various negative consequences for human health. Generally, the stress as a health problem is spoken of through the prism of its cumulative effect on health and functional problem is its current performance.
Stress consists of three phases20: 1. alarm phase, a person feels stress,
2. resistance phase, the person resists the negative effects of stress,
3. exhaustion phase, the person lacks the energy to deal with the further negative effects of stress
Figure 1. - Stress adaptation phases
1st phase 2nd phase 3rd phase
Source: Bahtijarevic-Siber, F.: Human Resource Management,
Golden Marketing, Zagreb, 1999
Stress as a phenomenon is not just a characteristic of managerial job but it is as well related to all jobs with different intensity. The system as a whole is exposed to enormous efforts through the modern business operations, companies’ unstable environment and race for ever greater profits. These efforts are carried through the entire company, and are mostly reflected on the human resources as a living tissue of the organization. Constant changes in technology, the necessary knowledge, skills and working conditions, threats of job cuts and lay-offs, uncertain future events intensify the potential workplace stress and reflect on all employees without exception. Therefore, it is necessary to put the workplace stress in reasonable framework, which will not affect the quality and quantity of performance. The process of putting the stress under control is referred to as stress control. Stress can have different effects on employees and the organization21.
2.1 The importance of stress management
Because of the mode, terms and conditions in which organizations operate nowadays, stress is one of the dominant problems modern business operations face, and it is particularly prominent in times of crisis. Stress management is a range of activities undertaken by management at all levels in order to reduce stress’s negative impact on the work, eliminating the causes of stress in the organization and training employees to successfully overcome the consequences that stress causes.
19 Sikavica, P., Novak, M., Business organization, Informator, Zagreb 1999., pg. 576 20 Bahtijarević-Šiber, F. Human Resource Management, Golden marketing, Zagreb, 1999.pg. 899 21 Weihrich, H., Koontz, H., Management, Mate Zagreb, 1994., pg. 408
ALARM RESISTANCE EXHAUSTION

REDETE – ECONOMIC DEVELOPMENT AND ENTEREPRENEURSHIP IN TRANSITION ECONOMIES
58
There are many reasons why it is important to manage stress because22: - dysfunctional stress causes severe financial losses to companies,
- stress affects the health, quality of life and longevity of employees
- employees under stress are more prone to make mistakes at the work. They are less creative, communicate less with each other, and are reluctant to work in a team, making a total bad influence on organizational businesses performance.
- a great effort and resources are invested in human resources within the company, and if employees are exposed to excessive stress, they do not reach their maximum potential, and are mentally and physically weakened, their years of service are shortened and they have to retire even before they have made their biggest contribution to the company they work for
Decreasing competitive ability by reducing the individual and organizational flexibility, stress
becomes managements’ great interest especially in human resource management. Stress reduces the level of utilization of human resources in achieving organizational goals
effectively. It blocks individual and organizational development, lowers flexibility, creativity and the effects of investment at employees. Aspects of management which have highly stressful effect on employees are the following: poor selection, bad layout and inconsistency of demands of work and individual abilities bad design of work and blocked career. The task of human resource management is the control of causes and the consequences of stress management.
2.2 Sources of workplace stress
Sources of stress are called stressors, and if they appear in the organization we talk about organizational stressors. Some authors even divide them into organizational and life stressors.
Stressors at work are categorized into three levels: 23 1. individual 2. group 3. organizational
1. Individual stressors indirectly and specifically influence every employee. They are
connected to the job, the role that an individual has in the organization and personal career. Considering the work that an individual performs, stressors are caused by:
- specific profession,
- requirements of the job,
- the pressure of deadlines,
- work load,
- responsibility for people
- physical working conditions.
The expected behaviour associated with a particular position in the company represents a role
in the organization, which can often be stressful. The most common stressors related to the role in the organization are:
22 Bahtijarević-Šiber, F.: quotation., pg. 895 23 Bahtijarević-Šiber, F.: quotation., pg. 901

REDETE – ECONOMIC DEVELOPMENT AND ENTEREPRENEURSHIP IN TRANSITION ECONOMIES
59
- role conflict,
- vagueness and ambiguity of a role.
Role conflict occurs when there is a request for cooperation from the people who do not suit
us, and synergy and cooperation are a necessity. Vagueness and ambiguity of roles are the result of unclear or unknown requirements of the
role, or the lack of understanding of the duties that a person has in performing the work. Career is a very important area of workplace stress. Different stages of career development
cause different stress levels. Most often the decision on promotion is made on the basis of performance at previous job. Different situations in employee's promotion can cause different le-vels of stress. When a promotion is too high, when a person comes to the position which is be-yond his or her capabilities, the person might turn from a successful professional into a frustrated manager. Also, if the promotion is too low, people of high potential become frustrated and uninterested in work in general. Every employee should have complete freedom in the realization of their ambitions and development of their full potential through personal career. If that is prevented, then the employee becomes dissatisfied and exposed to chronic stress, which is the least desirable. In fact, then the employee’s phase of resistance is prolonged, making the phase of exhaustion inevitable, and the recuperation of the employee is almost impossible. Job insecurity is often referred to as a major stressor in modern business since it is directly threatening the financial existence of all employees and those who depend on it, and during the economic crisis, job insecurity is most present.
2. Group stressors are a number of relationships within a specific working group. Relationships with colleagues, boss or subordinates, are complex and complicated, especially if the employee is in a position between the hammer and anvil - with senior manager or the owner on one side and subordinates on the other side, whose expectations and requirements can be very contradictory. Interpersonal relationships between the employees of equal level often end in misunderstanding and negative competence due to strong competition, thus causing stress to both sides. In recent years the team work has been more and more preferred as the best type of work, but it brings along ‘so-called’ group pressure to achieve a certain goal. Especially if the group is not properly balanced, there is an increased burden on an individual or on several of them, which are then subjected to stress due to the intensity of load, which is multiplied with personal frustrations.
3. Organizational stressors arise from the essential characteristics of the organization and affect the majority of organizational members. Weak organizational structure, unimaginative design of work, autocratic style of management, intolerant organizational climate and culture produce stressors that devastate human resources at all levels. Even in well-organized companies, deficiencies such as good communication, effective control system and fair organizational policies, may complicate the position of the employee, causing frustration and stress.
3. Stress effects
The stress effects are numerous and are manifested in all spheres of individual and organi-zational life.
They are usually classified into five categories: 24 1. subjective effects, 2. behavioural effects, 3. cognitive effects,
24 Bahtijarević-Šiber, F.: quotation., pg. 914

REDETE – ECONOMIC DEVELOPMENT AND ENTEREPRENEURSHIP IN TRANSITION ECONOMIES
60
4. physiological effects, 5. organizational effects.
The most severe stress effects are health problems; therefore attention is directed to preventing
them or to preparing employees to deal with them. Good quality training and education, as the foundation for the development of skills necessary for performing a particular job, provide employees with sufficient levels of readiness for coping with situations that could be stressful. Thus, the second resistance phase is prolonged. Individual stress effects are manifested in lower performance, poorer success, and negative attitudes towards work, organization and management. They usually result in low employees productivity, organizational inefficiency, poor control of work and poor control of the output product.
Stress affects employees' attitudes, job satisfaction, motivation, morale and loyalty to the organization.
Figure 2 the relationship between stress and impact
Source: Bahtijarevic-Siber, F.: Human Resource Management,
Golden Marketing, Zagreb, 1999, pg. 915
The term functional stress implies the employees' resistance phase, in which the person uses
inner strength and resources to solve specific problem. The person exposed to a particular effort uses internal resources to deal with this effort, which induces specific benefits for both the employee and the organization. The employee has gained an experience for a particular situation, the problem has been solved and organization has achieved certain progress. However, if the resistance phase prolongs considerably, the stress becomes dysfunctional, the employee becomes exhausted and employee’s capacity for further action is reduced. It is said that the employee has wore himself out on a particular problem. Prolonged and intense stress has many negative consequences for both the employee and the organization as a whole.
combustion
low STRESS
high
IMPA
CT
low

REDETE – ECONOMIC DEVELOPMENT AND ENTEREPRENEURSHIP IN TRANSITION ECONOMIES
61
Combustion is a complex syndrome consisting of three specific mental states: 25 1. Emotional exhaustion,
2. Depersonalization 3. Feeling of personal failure.
It is caused by high exposure to workplace stress and its cumulative time. Some employees are
"burned" after a short exposure to intense stress, while others endure much longer. In any case, too long exposure to workplace stress for every employee causes "combustion" at work. The negative stress effects employees’ work performances and it likewise reflects on the ability of the organization as a whole. The stress causes the incompetence of appropriate and timely adequate response to changes in organizational environment. It prevents the creation and maintenance of the organization's competitive advantage on the market; so many organizations these days approach the workplace stress thoroughly.
4. Methodology and research results
The research on the connection between economic crisis and the development of stress at employees' was conducted on the basis of a questionnaire on a sample of 400 respondents in the area of Split and Dalmatia County. Respondents were employees of the organization of various activities with different ownership structure. The collected data were analyzed using conventional statistical methods.
Research results:
Table 1 Display of respondents by gender
Gender Number of respondents Ratio in % Female 217 54,25 Male 183 45,75 Total 400 100,00
Source: Author’s research
Table 2. Display of respondents by status of employment
Status of employment Number of respondents Ratio in % Permanently placement 186 46,50
Fixed-term contract 98 24,50 Independent Contractor 80 20,00
Other kinds of employment 36 9,00 Total 400 100,00
Source: Author’s research
Table 3. Categorization of job
Categorization of job Number of respondents Ratio in % Trainee, prentice 28 7,00
employee, executor 205 51,25 Middle management 130 32,50
Top management 37 9,25 Total 400 100,00
Source: Author’s research
25 Bahtijarević-Šiber, F.: quotation., pg. 915
REDETE – ECONOMIC DEVELOPMENT AND ENTEREPRENEURSHIP IN TRANSITION ECONOMIES
62
Among the respondents, the majority of (73%) expressed that they experience some form of stress at least once a week. 27% of respondents stated that they experience stress at least once a day, and the majority of these is under the age of 35 which indicates a heightened level of external irritability of younger employees who at that age solve other existential problems (buying a an apartment, marriage, young children, etc.). 82% of the respondents replied that due to the economic crisis they feel a greater tension and uncertainty at workplace that causes stress for them during the task performance. Only 18% of them consider it insignificant influence on the organization and workplace. 65% of respondents feel the fear of the economic crisis and consider that the consequences will be long term. Most respondents answered positively to the question whether stress effects at work are felt by their family members. Only 3% of respondents consider that they should seek medical advice and psychological help because of the stress at work and the uncertainty of their employment. When asked about reduced workers’ productivity due to ne-gative psychological consequences of the economic crisis, members of top management declared that it is significantly noticed as well as the decreased employees’ motivation is. They also declared that the costs for the sick leaves in their companies are growing. On the other hand, the employees fear that due to the economic crises their employer might cancel their contract.
5. Conclusion
Management of the organization is exposed to new business challenges because of the theo-retical insights into the causes and types of economic crisis, stress and other psychological de-viance, the increase in direct and indirect costs due to reduced productivity and sick leaves. These business challenges must not be the reductions in salaries, cancellations of contracts, reduction of costs and termination of hiring new staff. There has statistically been confirmed a significant connection between the negative effects of economic crisis and increased level of workplace stress, which leads to reduced employees' motivation, increased uncertainty of future events, redu-ced workers’ productivity, higher rates of sick leaves and increasing business expenses. Because of the expected long-term consequences of the economic crisis, there is the fear of uncertainty among employees which is reflected in reduced tolerance, decline in the quality of business communication, nervousness, irritability, fatigue and sudden mood changes. Simultaneously, a smaller number of employees have serious effects because of chronic workplace stress. It is nece-ssary to approach the new way of training, monitoring and evaluating employees with additional involvement of experts in the psychological preparation and training of employees in complex and demanding operating conditions. Human resource management must develop and implement new and modern systems of monitoring all components of the employees of the organization as its living tissue, conduct practices of the theory of choice and improvement of employee’s own satisfaction. The implementation of new systems and methods of training of employees develops the so-called ‘defensive wall’ which in moments of crisis may prove to be a competitive ad-vantage for of the organization.

REDETE – ECONOMIC DEVELOPMENT AND ENTEREPRENEURSHIP IN TRANSITION ECONOMIES
63
Reference list
1. Alfirevic N., PhD Thesis, University of Economics Split, Split, 2003 2. Bahtijarevic-Siber, F. Human Resources Management, Golden Marketing, Zagreb, 1999 3. Bogdanovic, M., Mateljak, Ž., Economic crisis and human resources: a case study of Croatia,
Collection of papers, Sarajevo, Business and Economics Review 30/2010 4. Buble, M., Management Basics, Sinergija, Zagreb, 2006 5. Djuricic, Z. Jovanovic, K., Djuricic, R., Benchmarking as a tool of modern management, the
International Scientific Conference Management, 2010, Krusevac, 2010 6. Galbraith, J. R., Lawler III, E. E. I sur., Organizing for the future, Jossey-Bass, San Francisco,
1993 7. Paustović, E., Educology: Integrative Science on lifelong education and training, Znamen,
Zagreb, 1999 8. Peter S., The human side of managing people [human resources management in the new era?],
Mozaik Knjiga, Zagreb, 2004 9. Vujic, V. Human Capital Management, University of Rijeka, Rijeka, 2005

REDETE – ECONOMIC DEVELOPMENT AND ENTEREPRENEURSHIP IN TRANSITION ECONOMIES
64
THE EFFECTS OF THE GLOBAL FINANCIAL CRISIS ON DEBT FINANCING: CROATIA VS MACEDONIA
Bisera GJOSEVSKA26 Goran KARANOVIC27
Abstract
The bank-centric nature of the financial systems in Croatia and Macedonia, inherited from their previous economic arrangement under the socialist Yugoslav paradigm, was severely tes-ted with the emergence of the Global Financial Crisis of 2007-2009. Both countries had expe-rienced a boom in economic activity at the beginning of the new millennium, thus neglecting the potential dangers which the bank-centric structure posed to the entire economic system. This paper attempts to examine the evolution of debt financing, given that banks are the primary sou-rce of financing the nascent entrepreneurial activity in these two countries. Taking into conside-ration the ownership structure of the leading banks and the involvement of their European pa-rent companies in the Wall Street turmoil, the authors research their impact on debt financing patterns in Croatian and Macedonian companies, respectively. This is especially in relation to the structural break in 2008, the time at which the Global Financial Crisis spilled over in this region.
The objective of this study is to compare and contrast the lending behavior of banks to com-panies and their influence on the further development of the national economies on their way to emerging on the world stage. The economic and financial data for each country will be separately analyzed and the respective results mutually compared, while keeping in mind the different levels of socio-economic development and the initial stage of their model of credit fi-nancing to the private sector. The purpose of this work is to contribute to the growing literature examining the specific lending patterns in segmented markets and identify the key areas which need improvement in both countries. The expected results of the conducted research can be found in the empirical methods such as time series analysis used to examine bank financing patterns to the private sector. Considering the importance of the relationship between credit financing of companies and its influence on the comprehensive development of the fragile and unbalanced economies of the two countries under observation, the conclusions of this study sho-uld prove the link between bank credit activity and the dynamics of company development, and ultimately the development of the national economies. This paper aims to provide an additional assessment of the impact of the Global Financial Crisis on debt financing and is addressed to the broad scientific and professional community.
Keywords: financial crisis, debt financing, banks, entrepreneurship
26 Balkan Institute of Behavioral Research, [email protected] 27 University of Rijeka, Faculty of Tourism and Hospitality Management, [email protected]

REDETE – ECONOMIC DEVELOPMENT AND ENTEREPRENEURSHIP IN TRANSITION ECONOMIES
65
1. Introduction
This work involves an analysis of the lending behavior of Croatian and Macedonian banks, before and after the last global financial crisis, to the companies and influence on the global eco-nomic development of these two countries. The economies of both Croatia and Macedonia were severely tested and may be said that are still being put to a test— especially knowing the fact that both financial systems of the counties are traditionally bank-centric (Sohinger & Horvatin, 2006; Dalić, 2002; Bogoev, 2010). The test is still on because repercussions of the last global financial crisis are still emerging, but they are appearing in different forms and in different intensities and regions. Given that both countries had seceded and declared their independence from Yugoslavia, they had similarly inherited related economic and financial problems. During the period of the last two decades these two financial and capital systems have developed in parallel, with the goal of reaching the desired development of the idolized western markets, but with a different intensity, from which different results are emerging. Yet, despite the differing development dynamics, according to Dalic (2002); Sohinger and Horvatin (2006) the financial systems in the European transition economies are still bank-centric. Each economy’s development depends on the invest-ments cycle and their intensity, in accordance with which it can be concluded that the economic development of Croatia and Macedonia mainly depends on the banks’ credit activity.
The main purpose of this work is to analyze the role and the impact of the last financial crisis on the bank credit activity in Croatia and Macedonia and its influence on the economic develop-ment of these two countries. This work contains several analyses of the financial and economic data for both surveyed counties for the period of 2003–2011. Considering that significance of the bank capital activity and their lending behavior in these two countries, this study should contribu-te to a better understanding of the banks as the driving force and the main source the financial assets. In addition, it should give an original and novel acknowledgement of the important role the banks play, i.e. what influence they have on the economic development. Finally, it should provide some new ideas and a basis for future economic development.
Both countries have carried out, during the two-decade period of transition, privatization of the banking system and as an outcome of the fact that most of the foreign banks have majority share in total assets of all banks. The banking system in both countries is in the hands of foreign bank groups and according to that, the new investment cycle depends on their financial business politi-cs. Also, the aim of this paper is to give contributions for solving the dilemma that Yilmaz and Koyuncu (2010) had defined, concerning the relationship between foreign bank participation and banking crises, i.e. do foreign banks contribute to financial stability by stabilizing credit supply or bring financial instability by importing financial shocks on the domestic markets?
This work is correlated to recent research and to certain extent it uses well known established scientifically significant factors for the use of debt financing in the entrepreneurial sector. The paper has drown extensively on both scientific and professional literature in the field of finance, which treats debt financing, as well as the lending behavior of the banks in Croatia and Macedonia and their impact on the global economic development of the observed counties.
2. Literature review
The academic economic community worldwide for a long time now is examining reasons for the start of various crises that have emerged through economic history and their impacts on the global economy. The last financial crisis from 2007, dubbed the “Credit Crisis” is one of the strongest and deepest financial crises in modern economic history since the Great Depression of the 1930s. Since the “Credit Crisis” has caused many structural problems and pulled the global economy in recession, many authors, such as Almunia, Bénétrix, Eicheng, O'Rourke, & Rua, 2009; Erkens, Hung, & Matos, 2012; Claessens, Dell’Ariccia, Igan, & Laeven, 2010; Aiginger, 2010 have analyzed various reasons for its beginning, the strategies and applied policies, impacts

REDETE – ECONOMIC DEVELOPMENT AND ENTEREPRENEURSHIP IN TRANSITION ECONOMIES
66
and influences on the global economies and future stability and development of the global and lo-cal economies. Also numerous authors from Croatia and Macedonia have conducted diverse stu-dies of the “Credit Crisis” examined the impact to the economies that have emerged from it, inclu-ding but not limited to Bexheti, 2010; Davcev, 2010; Bucevska, 2011; Zikovic & Aktan, 2009; Mihaljek, 2009; Radosevic, 2012. Due to the spillover of the “Credit Crisis” over the Southeastern European region in 2008 and its impact to regional economies that is still affecting them, especia-lly at the level of entrepreneurial activities, there emerges a need for deeper analysis. It is crucial to emphasize that only few detailed empirical analyses of the crisis impact on the lending beha-vior of banks to the companies in Croatia and Macedonia have so far been conducted.
3. Main Characteristics of the Banking Sectors of Croatia and Macedonia: An Overview
The financial sectors, especially the banking sectors of Croatia and Macedonia had the same starting position in 1991—the years of their independence, but as will be seen, their current positi-on is generally similar, yet with some notable differences. Croatia has emerged from Yugoslavia as far more economically developed country than Macedonia, and this different degree of econo-mic development has had a direct impact on the differences that are so obvious today. It should be mentioned that Croatia has passed through war, which proved to be a significant obstacle for an even greater development of the financial sector and the economy in general. Also, during 2001, Macedonia experience an internal armed conflict, known as the ‘Albanian insurgency’, which also had a great influence on the success of further, already started development of the financial sector, and the economy in general.
In the analysis of the financial and banking sector it is necessary to highlight the importance of the privatization of banks, and to emphasize their influence on the development of the financial sector. Privatization of the banking sector and entry of the banks in foreign ownership on the Croatian financial market started in 1994 and since then has passed through different stages of intensity and volume. It should be emphasized that this process is still in progress, as can be seen in Table 1.
Table 1 Ownership structure of the banks in Croatia in period 2003–2011
Year Type of ownership 2003 2004 2005 2006 2007 2008 2009 2010 2011 Domestic private banks 20 20 18 16 15 16 17 16 13 State owned banks 2 2 2 2 2 2 2 2 2 Foreign banks 19 15 14 15 16 16 15 15 17 Total 41 37 34 33 33 34 34 33 32
In the two-year period of 2003–2004, the number of banks in the domestic ownership was 20,
and most of these twenty banks were small banks which had no significant impact on the financial market. In the next three-year period of 2005–2007, the number of banks in domestic ownership decreased at number of 15, and the main reason for that reduction was the consolidation on the market and ownership takeovers by certain foreign banks. The following three-year period of 2008–2010, the number of banks had grown for one in 2009 and fallen for one in 2010. In the last observed year, 2011, the number of domestic private banks had fallen for the three banks, which fall is a product of the privatization of two banks by banks in foreign ownership and the revoca-tion of license for operation that led to a forced liquidation. The overall fall of the number of domestic private banks in the observed nine year period (2003–2011) is the outcome of a process in which private banks have bought domestic banks for the reason of strengthening their market positions.

REDETE – ECONOMIC DEVELOPMENT AND ENTEREPRENEURSHIP IN TRANSITION ECONOMIES
67
The number of the state-owned banks during the analyzed period remained unchanged at two. The two banks that are in state ownership are the Croatian Bank for Reconstruction and Develop-ment, whose main task is promotion and development of the Croatian economy, and the Croatian Postal Bank (Hrvatska Postanska Banka), a banking organization that is authorized to conduct all banking operations domestically and abroad.
The total number of foreign banks in the 2003–2011 period is reduced only for two banks, but close observation of the data from Table 2 indicates that in the years 2004 and 2005, the number of banks had fallen by 5. As noted, “The reason for this is to be found in the continuation of the consolidation process in the banking sector and mergers of banks with their parent banks” (Jankov, 2004, p. 109). In year 2006, the number of banks in foreign ownership had risen by one, as a result what was the effect of the privatization of one domestic private bank by the bank in private ownership. In period from 2006–2011 the number of banks in foreign ownership has sligh-tly grown and fall what were all effect of privatization and consolidation of the banks in foreign ownership.
Unlike the privatization of the banking sector in Croatia, the entry of foreign- owned banks into the Macedonian financial and banking market had a different intensity. As Tang, Zoli and Klytchnikova (2000, p. 5) state, the number of banks in foreign ownership was three of six banks, overall. The privatization process of the banking sector in Macedonia had started earlier and in the first period of 1990’s of the last century it was much effective and more comprehensive than in Croatia. Table 2 presents data of the reform and privatization process of the most recent period 2003–2011.
Table 2 Ownership structure of the banks in Macedonia in period 2003–2011 (number of banks)
Year
Type of ownership 2003 2004 2005 2006 2007 2008 2009 2010 2011 Domestic private banks 12 12 11 10 9 9 9 9 8 State owned banks 1 1 1 1 1 1 1 1 1 Foreign banks 8 8 8 8 8 8 8 8 8 Total 21 21 20 19 18 18 18 18 17
The total number of domestic private banks in the observed period has declined and in 2011
was eight, which number fall in banks in private ownership is a result of the consolidation and further privatization of the banking sector. Also, the National Bank of the Republic Macedonia in this period revoked operating license for few private banks in major domestic ownership, what also influence on reduction.
Through the whole period, the number of state-owned bank remained the same. The only bank remaining in state ownership is the Macedonian Bank for Development Promotion, whose main goal is to support small and medium enterprises through credits and other formats of support.
It is interesting to note that the number of banks in foreign ownership remained the same during the sample period. That is a result of the previous privatization cycle, however it is nece-ssary to highlight that these banks have consolidated themselves by acquiring banks with major domestic ownership.
For the purpose of comparing the dynamics and structure of the bank ownership structure in Croatia and Macedonia the compared data are presented in Figure 1.

REDETE – ECONOMIC DEVELOPMENT AND ENTEREPRENEURSHIP IN TRANSITION ECONOMIES
68
Figure 1 Ownership structure of banks in Croatia and Macedonia
From the analysis of data in Figure 1 it can be concluded that number of foreign banks in Cro-
atia and Macedonia is considerably different, although Croatia had started the process of priva-tization later, even though the market is larger (4.5 million people) than that of Macedonia (2.1 million people). Also, the more developed economy has a direct influence on the total number of private banks. Moreover, the later started privatization meaning in volume (1998-2002) and consolidation on the market resulted in oscillations on Croatian foreign banks in the period 2003–2011.
The tendency in the number of the domestic private banks is the same, with a decreasing slope, as the Croatian, similarly as the Macedonian market in the analyzed period and the main factor for that process is the effort of the private banks for consolidating their market position and share. It is also noticeable that the number of domestic private banks in Macedonia during the whole period is smaller and in average is 40% of the Croatian domestic private banks. As was already determined, the disproportion in number of banks is not surprising, considering the similar history and economic development backgrounds of both counties, therefore a disproportion in the number of domestic private banks is expected.
The number of state banks in the whole period is unchanged. The only difference is that Croa-tia as a state is in possession of one universal banking organization beside one bank whose main purpose is the development of the domestic economy, but judging from a governmental announ-cement, it will be sold to private investors.
However, in order to better understand these two markets, one must emphasize the following important and significant fact about the participation of foreign and domestic banks in total assets of all banks. In the Croatian market, banks with a majority of foreign ownership had an average share of 90% in total assets of all banks during the period of 2003–2011. In the Macedonian market, banks with a majority foreign ownership had different dynamic and tendency of average share in total assets of all banks during the observed period than banks in the Croatian market. In the 2003–2006 period, the average share of the foreign banks in total assets of all banks was 47%. In the 2006–2011 period that percentage has grown up to 90% on average. These facts signify that in both countries foreign banks have attained a dominant position and that they are the market makers with a huge impact on the GPD, especially in the transition counties.
Jurman analyzes the significance and ovearall influence of banks on the GDP, having determined that there exists a “positive, linear and very close connection between the financial potential and domestic sources of the banks and the Croatian GDP” (2009, p. 60).

REDETE – ECONOMIC DEVELOPMENT AND ENTEREPRENEURSHIP IN TRANSITION ECONOMIES
69
4. Impact of the Global Financial Crisis on Banks’ Investments: A Survey of Croatian and Macedonian Banks
Banks in emerging markets such as Croatia and Macedonia have a main role in the financing of the entrepreneurial activity, something especially noticeable through the credit boom and the influence on investment, as well as to total consumption that both countries experienced in the 2001–2007 period. The capital inflow arrived mainly from Western markets, whether through private banks in Croatian and Macedonian markets or through direct investments. The last Credit crisis had transpired from the banking system of the United States during July and August 2007 and had spilled over in the European banking system; it did not hit Southeast Europe, however, until October 2008 (Berglöf, Korniyenko, Plek, & Zettelmeyer, 2010).
For better understanding of that particular phenomenon, the Table 3 presents credit activity, lending behavior and crisis influence in bank investments in both countries.
Table 3 Bank loan structure in Croatia and Macedonia
Macedonia Loans to enterprises
Year 2003 2004 2005 2006 2007 2008 2009 2010 2011In Denars
405.076
467.950
537.861 643.407 817.882 1.099.011
1.244.309
1.334.737 6.550.233 In Foreign Currency
327.367
368.930
367.943 410.976 516.034 718.374
828.944
872.138 4.410.706
Total 732.443
836.880
905.804 1.054.383 1.333.916 1.817.385
2.073.253
2.206.875 10.960.938
Loans to households In Denars 98.910 158.323 234.977 315.773 474.322 701.923 813.450 835.143 877.042In Foreign Currency 205 1.930 6.579 15.699 23.456 43.282 48.821 51.336 71.597Total 99.115 160.253 241.556 331.472 497.778 745.205 862.271 886.479 948.639
Croatia Loans to enterprises In Kuna
461.859
485.993
542.031 676.473 843.331 937.604
979.661
1.009.523 1.089.712 In Foreign Currency
116.222
124.604
138.841 161.816 157.116 153.675
196.066
237.821 265.242
Total 578.081
610.597
680.872 838.289 1.000.448 1.091.279
1.175.728
1.247.344 1.354.954
Loans to households In Kuna
597.312
706.011
849.094 1.043.028 1.260.733 1.436.782
1.488.971
1.485.992 1.530.172 In Foreign Currency
1.456
2.528
4.100 4.622 4.447 4.051
3.908
4.023 4.100
Total 598.768 708.539 853.194 1.047.650 1.265.180 1.440.833 1.492.879 1.490.015 1.534.271
Analyzing the data from Table 3 and Figure 2, it can be concluded that the “Credit crisis” did not have a large impact on lending behavior of Macedonian banks, as it has seen a continued trend of growth of investments in households at the detriment to investments to enterprises to the total amount of loans. The period of 2008–2010 is marked by slow growth of the total amount of bank loans, and it may be said that the financial crisis has had an impact on that behavior. The period of 2003–2009 was characterized by the decreasing share of bank loans to enterprises. A fall of 80% in 2003 to 59% in 2009 in total loan amount can be attributed to the reduction and privatization of domestic banks. But in 2011, the bank investments, i.e. loans to enterprises denominated in Macedonian Denas had exploded and banks had invested funds in the equivalent of 32,8 million US Dollars, or in total amount of investments in that year it partakes with over 70%. That growth

REDETE – ECONOMIC DEVELOPMENT AND ENTEREPRENEURSHIP IN TRANSITION ECONOMIES
70
can be credited to the effect of the government central bank decisions that have been taken in the previous two year period for securing and stabilizing the market. Similarly to banks in Macedonia, banks in Croatia also did not change their lending behavior despite the crisis. The average participation of total bank loans to enterprises in the period of 2003–2008 had a decreasing tendency, form 49% to 43%, which increased in the period of 2009–2011 slightly to the 47%. That relation of bank loans to households and loans to enterprises is not surprising given that by bank privatization the majority of the bank market is in control of private banks.
In addition, one must emphasize that the analyzed amount of bank loans in both countries are presented in national currency and that Croatian Kuna had an average foreign exchange rate during the observed period ranging from 6,7 to 4,9 per 1 US Dollar, and that the Macedonian Denars had an average foreign exchange rate ranging from 54,3 to 44,1 per 1 US Dollar. For the purpose of comparing the total loan amounts that banks in both countries had invested, the amounts expressed through national currencies are calculated in US Dollars by official exchange rate used from World Bank data. The official exchange rate “is calculated as an annual average based on monthly averages (local currency units relative to the U.S. dollar)” (The World Bank, 2012).
Table 4 Croatian and Macedonian bank loans structure in dollars—total amounts
Macedonia Loans to enterprises
Year 2003 2004 2005 2006 2007 2008 2009 2010 2011In Denar 405.076 467.950 537.861 643.407 817.882 1.099.011 1.244.309 1.334.739 2.340.588In Dollar 7.457 9.471 10.914 13.184 18.285 26.250 28.215 28.713 52.918Loans to households In Denar 99.115 160.253 241.556 331.472 497.778 745.205 862.271 886.479 948.639In Dollar 1.825 3.243 4.901 6.792 11.129 17.799 19.552 19.070 21.447
Croatia Loans to enterprises
In Kuna 578.081 610.597 680.872 838.289 1.000.448 1.091.279 1.175.728 1.247.344 1.354.954In Dollar 86.217 101.187 114.447 143.597 186.493 221.129 222.509 226.872 253.553Loans to households In Kuna 598.768 708.539 853.194 1.047.650 1.265.180 1.440.833 1.492.879 1.490.015 1.534.271 In Dollar 89.302 117.418 143.412 179.460 235.841 291.960 282.531 271.010 287.109
From data presented in Table 4 it can be concluded that the bank loan amounts between Croa-tian and Macedonian banks are in significant disparity. The overall development of the Croatian economy and especially the bank market has had an impact on the total loans amount in the observed period. In the period 2003–2010 Croatian banks had invested to enterprises through loans in average ten to eight times more than Macedonian banks had, while in 2011 it was five times more as household banks had invested through loans, in 2003 almost fifty times more, in 2004 thirty-six times more, in 2005 thirty times, in 2006 twenty-five times, in 2007 twenty times more, and finally in 2011 14 times more.
From the presented data it can be concluded that banks in Macedonia have focused their loans more to households because the increase from 2003 to 2011 is significant in comparison to the Croatian market. For a better insight, the data of total amounts in dollars is presented in the following graph, Figure 2.

REDETE – ECONOMIC DEVELOPMENT AND ENTEREPRENEURSHIP IN TRANSITION ECONOMIES
71
Figure 2 Croatian and Macedonian bank loans structure in dollars
The discrepancy between Croatian and Macedonian bank loan amounts in US Dollars can be
easily observed. Analysis of the graph indicates that banks in Croatia have invested greater amounts of funds in the overall economy. The impact of privatization dynamics and private bank share in total assets of banks, have had a direct influence on the loan amounts in Macedonia. Re-gardless of the global “Credit crisis” and its connection to Croatian and Macedonian private, fo-reign-owned banks to their parent banks in Europe who ran a greater risk of doing business, they did not reduce loans to markets - in contrary, they even raised them. It can be concluded that the main motivation for their continued investments through loans in these two markets is the profit margin, which is achieved through higher interest rates on loans.
5. Banks—A Leading Force in Starting the New Entrepreneurial Cycle and GDP Growth
Given that financial markets in Croatia and Macedonia are shallow, the numerous, yet financi-ally underdeveloped entrepreneurship sector can only obtain the necessary funds for starting the investment cycle only at the banks. The overall economic, historical and societal heritage has had a great influence on entrepreneurial activity in these markets. In former Yugoslavia, the main pur-pose of banks was to finance economic activity and to ensure possibility for further development. Bank profits were not a top priority, but social and economic development. Some banks had even consciously injected money through loans to nonprofit entrepreneurship, for various purposes.
For forty-five years, bank activity was, and still is the main force for further entrepreneurship growth, directly connected to GDP growth in these two markets. Furthermore, as the following reg-ression analysis presents, banks activities have influence on the GDP of both Croatia and Ma-cedonia. GDP data of Croatia and Macedonia in the 2003–2011 period are presented in the Table 5.
Table 5 GDP of Croatia and Macedonia in 2003–2011period
Year Croatia GDP in USD Macedonia GDP in USD 2003 34.143.409.062,04 4.756.221.628,61 2004 41.003.558.915,70 5.514.253.043,38 2005 44.821.408.830,94 5.985.809.059,97 2006 49.855.078.905,41 6.560.546.900,04 2007 59.335.976.948,27 8.159.825.620,39 2008 69.911.233.237,79 9.834.038.366,89 2009 63.435.948.447,17 9.313.573.964,98 2010 60.851.743.540,51 9.137.543.772,87 2011 63.850.068.201,98 10.165.373.218,11

REDETE – ECONOMIC DEVELOPMENT AND ENTEREPRENEURSHIP IN TRANSITION ECONOMIES
72
Presented data of GDP in current USD was obtained from World Bank data (The World Bank, 2012), and matched with the data from the Annual Reports 2003–2011 of Croatian National Bank and the National Bank of the Republic of Macedonia. Through regression analysis, the intensity of the relationship between bank loans to households and enterprises have on GDP of Croatia and Macedonia is examined. Regression analysis results are presented in Table 6.
Table 6 Regression analysis — influence of bank loans on Croatian GDP
Multiple R 0,983938876
R Square 0,968135711
Adjusted R Square 0,957514281
Standard Error 2502375566
Observations 9
ANOVA
df SS MS F Significance F
Regression 2 1,14153E+21 5,70766E+20 91,1492836 3,23529E-05
Residual 6 3,75713E+19 6,26188E+18
Total 8 1,1791E+21
Coefficients Standard
Error t Stat P-value Lower 95% Upper 95%
Intercept 1936767395 305987356 6,3295667 0,00072724 1188043305 2685491484
LE -37701,2845 14882,6069 -2,53324466 0,04448447 -74117,7118 -1284,85727
LH 60997,5581 11696,8890 5,21485309 0,00198605 32376,3016 89618,8146
The proposed model is as follows: GDP=1936767395-37701,2845 (Loans to enterprises) + 60997,5581 (Loans to households) + ε. The regression analysis in which the level of significance is 0.005 showed that adjusted R2 is 0.957, indicating that the installed model explains 95% of variation expressed in GDP, and the very significance of the presented model is very acceptable considering that it is 0.00000323. Both observed variables are highly significant for the tested model given that the value of both variables t is less than the value of F, and is also higher than the one. It also confirmed the significance of the observed variables, the P value that meets the criteria of <0.05.
For the regression analysis of the impact of households and enterprises on the Macedonian GDP, the last year is not taken in consideration because it is an outlier - it deviates considerably and its impact it just to be manifested in full scale in the next years, as can be seen in Table 7.

REDETE – ECONOMIC DEVELOPMENT AND ENTEREPRENEURSHIP IN TRANSITION ECONOMIES
73
Table 7 Regression analysis — influence of bank loans on Macedonian GDP
Multiple R 0,98650473
R Square 0,973191582
Adjusted R Square 0,962468215
Standard Error 376460380,1
Observations 8
ANOVA
df SS MS F Significance F
Regression 2 2,57238E+19 1,28619E+19 90,75429043 0,000117673
Residual 5 7,08612E+17 1,41722E+17
Total 7 2,64324E+19
Coefficients Standard
Error t Stat P-value Lower 95% Upper 95%
Intercept 902151171 155180467 5,81356139 0,00212525 503247082 1301055261
LE -16253,6511 5621,14330 -2,89152051 0,03412624 -30703,2600 -1804,04230
LH 24464,3783 6440,54389 3,79849571 0,01264793 7908,4332 41020,3235
The proposed model is as follows GDP=902151171-16253,6511 (Loans to enterprises) + 24464,3783 (Loans to households) + ε. The regression analysis in which the level of significance is 0.005 showed that adjusted R2 is 0.962, indicating that the installed model explains 96% of variation expressed in GDP, and the very significance of the presented model is acceptable considering that is 0.000117673. Both observed variables are highly significant for the tested model given that the value of both variables t is less than the value of F, and is also higher than one. It also confirmed the significance of the observed variables, the P value that meets the criteria of <0.05.
The presented regression analyses confirm that bank loans have significant impact on the growth or decline of Croatian and Macedonian GDP. These analyses verify the fact that banks have a major impact on the entire economy, especially on entrepreneurial development.
6. Conclusion and Recommendations
From the presented time series analysis of the privatization and transformation of Croatian and Macedonian bank markets and the examined structure of the banking sector structure, i.e. the lending behavior of banks, as well as the presented regression analyses which help study the impact they have on the countries’ respective Gross Domestic Products, it can be concluded that banks are the central finance subjects with a direct impact on the overall economic activity. Banks in Croatia were privatized, and now in possession by Austrian, Italian, France and Hungarian banks, while their counterparts in Macedonia were privatized by banks from Greece, Slovenia, France, Austria and various foreign portfolio investors. Croatian and Macedonian banks were established as subsidiary companies whose EU-based parents were directly or indirectly involved in the global “Credit cisis”.
Despite the perseverance of the financial crisis, one can witness the continued growth of bank loans to enterprises and especially to households. Perhaps the main reasons for the persistence of that phenomenon can be found in the noticeably higher interest rates in the emerging markets of the subsidiary bank companies, when compared to the more mature and developed markets of their parent banks. Although the justifications that banks cite for higher

REDETE – ECONOMIC DEVELOPMENT AND ENTEREPRENEURSHIP IN TRANSITION ECONOMIES
74
interest rates include the existence of higher credit and political risk, the price of money is significantly burdened under the high profit margin that those banks have.
For further and faster development of the entrepreneurial activity and the economy as a whole in both Croatia and Macedonia, it is necessary for private banks that have the main control over the money market and its supply to lower their profit margins, or for governments to guarantee their help with new investments and offer grants and incentives.
References
1. Aiginger, K. (2010). The Great Recession vs. the Great Depression: Stylized Facts on Siblings That Were Given Different Foster Parents. Economics, 4(18), 1-41.
2. Almunia, M., Bénétrix, A. S., Eicheng, B., O'Rourke, K. H., & Rua, G. (2009, November). From Great Depression to Great Credit Crisis: Similarities, Differences and Lessons. NBER Working Paper No. 15524, 1-57.
3. (2011). Annual Report . Skopje: National Bank of the Republic of Macedonia. 4. (2011). Annual Report. Zagreb: Croatian National Bank. 5. Berglöf, E., Korniyenko, Y., Plek, A., & Zettelmeyer, J. (2010). Understanding the crisis in
emerging Europe. Public Policy Review, 6(6), 985-1008. 6. Bexheti, A. (2010). Anti-Crisis Measures in the Republic of Macedonia and their Effects –
Are they Sufficient? 2010 March. Bamberg Economic Research Group on Government and Growth Working Paper Series No. 70 , 1-30.
7. Bogoev, J. (2010). Banks’ Risk Preferences and Their Impact on the Loan Supply Function: Empirical Investigation for the Case of the Republic of Macedonia. Privredna kretanja i ekonomska politika, 20(124), 63-109.
8. Bucevska, V. (2011). The Role of Remittances in Financial Crisis: Empirical Evidence From Macedonia. Ekonomska istraživanja, 24(4), 75-90.
9. Claessens, S., Dell’Ariccia, G., Igan, D., & Laeven, L. (2010). Lessons and Policy Implications from the Global Financial Crisis. IMF Working Paper WP/10/44, 1-40.
10. Dalić, M. (2002). Usporedna analiza hrvatskog financijskog sustava i financijskih sustava naprednih tranzicijskih zemalja. Privredna kretanja i ekonomska politika, 92, 27-52.
11. Davcev, L. (2010). Hidden Socks From the Economics Crisis in Macedonia During. Acta Technica Corviniensis – Bulletin of Engineering, 4, 51-56.
12. Erkens, D. H., Hung, M., & Matos, P. (2012). Corporate Governance in the 2007-2008 Financial Crisis: Evidence from Financial Institutions Worldwide. Journal of Corporate Finance, 18(2), 389-411.
13. Jankov, L. (Ed.). (2004). Annual Report 2004. Zagreb: Croatian National Bank. 14. Jurman, A. (2009). Financijski potencijal hrvatskih banka, obilježja i projekcija rasta.
Ekonomska istraživanja, 22(1), 60-80. 15. Mihaljek, D. (2009). The global financial crisis and fiscal policy in Central and Eastern
Europe: the 2009 Croatian budget odyssey. Financial Theory and Practice, 33(3), 239 - 272. 16. Radosevic, D. (2012). Capital Account Management In Croatia And Debt Crisis In European
Monetary Union: A Reappraisal. Ekonomski pregled, 63(3-4), 127-161. 17. Sohinger, J., & Horvatin, D. (2006). International Capital Flows and Financial Markets in
Transition Economies: The Case of Croatia Sohinger . Other Recent Work, Institute of European Studies, UC Berkeley, 1-27.
18. Tang, H., Zoli, E., & Klytchnikova, I. (2000). Banking Crises in Transition Countries Fiscal Costs and Related Issues. Washington, D.C.: World Bank, Europe and Central Asia Region, Poverty Reduction and Economic Management Sector Unit. Retrieved Septhember 1, 2012, from http://www-wds.worldbank.org/external/default/WDSContentServer/IW3P/IB/2000/12/15/000094946_00111805313297/Rendered/PDF/multi_page.pdf

REDETE – ECONOMIC DEVELOPMENT AND ENTEREPRENEURSHIP IN TRANSITION ECONOMIES
75
19. The World Bank. (2012, September 2). Retrieved from The World Bank Group: http://www.worldbank.org/
20. Yilmaz, R., & Koyuncu, C. (2010). Foreign bank participation and banking crises in transition economies. 23(1), 15-29.
21. Zikovic, S., & Aktan, B. (2009). Global financial crisis and VaR performance in emerging markets: A case of EU candidate states - Turkey and Croatia. Zbornik radova Ekonomskog fakulteta u Rijeci: casopis za ekonomsku teoriju i praksu, 27(1), 149 - 170.

REDETE – ECONOMIC DEVELOPMENT AND ENTEREPRENEURSHIP IN TRANSITION ECONOMIES
76
MEASURING THE QUALITATIVE COMPETITIVENESS OF THE MACEDONIAN ECONOMY
Olivera KOSTOSKA28 Pece MITREVSKI29
Marjan ANGELESKI30 Gjorgji MANCESKI31
Abstract
The empirical evidence on trade patterns clearly indicates the fact that globalization has rapidly altered the international economic space, introducing some new forms of competiti-veness. International marketplace has been increasingly transformed from price to one domina-ted by non-price factors, quality in particular. Products having the price as a major determina-nt of competitiveness have recorded a decreasing market share, which implicitly points towards the possible loss of this kind competitive performance. Innovations and new lines to create value might, therefore, designate higher average prices, as an indicator for a better quality, but at the same time, they lead towards the higher productivity and trade growth. Indeed, creating competitiveness in the targeted sectors is a serious task for national economies distinguished mainly by their rigid production structure and limited funds. These features certainly bound the possibilities for an economy and the supporting sectors (technological infrastructure, R&D capacity, educational policy) to promptly adjust so as to capture the benefits of knowledge and innovation-driven global economy. Hence, this paper, primarily, aims at estimating the qualita-tive competitiveness of the Macedonian economy. At first, “unit value”, the signal of the Mace-donia’s quality position, is to be calculated. This indicator may possibly be defined for exports and imports, and it is available at all levels of disaggregation. Within the analysis made for the Macedonian economy, we will refer to data for the total exports and imports according to 3-digit SITC (0-9). Additionally, we develop a country specific segmentation of markets in line with the concept of revealed price elasticity (REVELAST 1). The findings obtained suggest a low unit value for the Macedonian exports due to the country specialization in those industries to be found at lower levels of “quality ladder”. The analysis made for the product groups subdi-vided into different segments indicates certain deterioration in the competitiveness of the Mace-donian economy, i.e. there is an inadequate position either in levels or the type of competitive performance. Finally, the estimates about the changes of product groups’ number according to SITC sectors point to rather divergent results. It is of particular importance the growth of pro-duct groups’ number in the segment with structural problems, especially in those sectors as considered the most important for achieving a competitive performance with dynamic poten-tials.
Keywords: qualitative competitiveness, Macedonian economy, unit value, revealed price ela-sticity, Standard International Trade Classification
28 Faculty of Economics-Prilep, Republic of Macedonia, [email protected] 29 Faculty of Technical Sciences-Bitola, Republic of Macedonia, [email protected] 30 Faculty of Economics-Prilep, Republic of Macedonia, [email protected] 31 Faculty of Economics-Prilep, Republic of Macedonia, [email protected]
REDETE – ECONOMIC DEVELOPMENT AND ENTEREPRENEURSHIP IN TRANSITION ECONOMIES
77
Introduction – the Importance of Quality
The quality is considered a relatively intricate concept with no generally accepted definition. In a certain context, the high quality product could possibly be regarded like a “good which possesses one or more additional characteristics, which are valued by buyers” (Aiginger, 2000, p.4). These features, usually reflected in higher prices, might be physically measurable (size, speed, etc.) or intangible (reliability, goodwill, etc.). Yet, despite the possible movements of prices up, note that higher quality permits the one not to lose the markets. The possibility to improve the quality depends upon the components such as: the noble materials, skilled labor, R&D etc.
The differentiation of goods in terms of crucial elements or minimal details is to be an impor-tant strategy for businesses to defend their own prices. At the market level, differentiation associates with the possibility to improve the quality of products owing to innovations. The radical shifts which refer to new products with completely new performance make for the changes in the market share and industry structure. The possibility to arrange the products from the highest to the lowest level in line with their quality is commonly referred to as “vertical product differ-rentiation”. It may perhaps be obtained: “along one decisive feature; along a few features, each of which has a wide possible range of (continuous or discrete) values; across a large number of features, each of which has only a presence/absence “flag” (Piana, 2003). In the last two scenarios a certain product may perhaps be better in line with one parameter, but not as good as the other according to another criterion. This imposes strains and trade-offs, with competing firms making efforts to accentuate the relevance of the feature their products are better off. The vertical differentiation is a kind of freehold of the goods offered, yet the observed difference in quality by the customers will have a major influence in decisions they make to buy a certain product. Gene-rally, there is an upward-slopping relationship between the price and quality owing to higher cost of production, as well as benefits the customers expect to obtain. That is to say, consumers having no personal opinion or ability to directly asses the quality may perhaps make an appropriate decision by the price of a product.32 Note that quality is at variance with productivity, since the second is commonly expressed in quantitative terms. The quality refers typically to heterogeneity of outputs concerning the heterogeneous inputs, while productivity relates to the quantity of output with regard to the quantity of inputs for indicators to be as much as homogenous in nature. “If, however, value added is used as a numerator, then the prices and quality of output are taken into account. And if we distinguish between several qualifications for labour, the quality of inputs can be incorporated into the denominator of productivity” (Aiginger, 2000, p.5). Higher quality is, by and large, considered a prerequisite to maintain the competitiveness of producers making higher costs in the production process, since the supply of product with the same quality and higher prices is not to be sustainable in long term. Despite the fact that higher productivity may countervail the higher wages in certain countries nevertheless, such a strategy is not always likely to succeed due to technology and managerial skills diffusion. Hence, the higher quality is considered as an alternative, but also a supplement to higher productivity. Yet, such approach is mostly acceptable in quality-sensitive industries in which certain quality improvements, instead of low prices, define the competitive advantage. Hence, the “quality competition” may be described as “a competitive environment, in which upgrading quality, and increasing the willingness to pay is important relative to competing at low prices” (Aiginger, 2000, p.6).
Considering the aforementioned, this paper is to assess the quality position of the Macedonian economy. At first, we will highlight the concept of quality as regards the theoretical models. The 32 In contrast, horizontal differentiation occurs when products differ along with features that may not be sort through an
objective way. It is related to variations in tastes, colors, etc. Note that difference can be made to elements of the supply structure and those appertain to consumers’ bias. This contributes certain consumers to have a steady preference for one or another kind. If they are not likely to have a steady preference, the consumers behave in a way to often change the selected product, loving variety as such.

REDETE – ECONOMIC DEVELOPMENT AND ENTEREPRENEURSHIP IN TRANSITION ECONOMIES
78
next section defines the methodology implemented to estimate the qualitative competitiveness. Finally, we exhibit the empirical results and the foremost conclusions we obtained thereafter.
The concept of quality in theoretical models
The literature on trade theory is being extremely affluent and diversified, primarily due to freq-uent changes and improvements set off by the necessity to study and adequately explain the socio-economic reality. Its reflection has been expressed in classical authors and several neo-classical variants, for certain evolution to be experienced in the mid-20 century owing to changes in technological development.
The mainstream trade theories are generally founded on the principle of comparative advan-tage. In other words, international trade in goods owns to differences among countries in relative or comparative costs, and, hence, in relative prices. Each country is to export the product in which it has a comparative advantage and import the one with comparative disadvantage.
The principle of comparative advantage stems from the Ricardian model of international trade based on the classical labor theory of value. Under this model, comparative costs are determined by the relative productivity of labor. In his model, Ricardo presumes different production functions with constant returns to scale (Ricardo, 1817). Almost a century after Ricardo had set up the principle of comparative advantage, Eli Heckscher blends international trade with the prices of agents of production, pursuing the tradition of neo-classical school (Heckscher, 1919). Heckscher has actually broadened the Ricardian model including other factors of production into his analysis. Thereat, the assumption of identical technologies across the countries is to be of particular impor-tance for the main propositions of the neoclassical model of international trade (Heckscher-Ohlin model). Principally, Heckscher was mostly interested in the relation between internatio-nal trade and income distribution. He has thereof argued the hypothesis of equalizing the relative prices of the production factors (Heckscher, 1919), which was further elaborated by Samuelson (Samuelson, 1948). Additionally, the Heckscher's model was restructured by Ohlin (Ohlin, 1933), which therefore the neo-classical analysis of international trade became known as Heckscher-Ohlin or Heckscher-Ohlin-Samuelson (H-O-S) theory. The neo-classical model argues that comparative advantage rises out of differences among countries in factor endowments. That is to say, differences in relative scarcity of production factors have an effect on the relative costs, and hence the trade flows. Consequently, the neo-classical trade theory predicts that country will export the products that make relatively intensive use of the most abundant production factors.
During the sixties, the theorists were particularly focused on examining the importance of specific variables, such as technology. In this context, the model on “technology gap” has expli-citly proved the changes set off by the technological developments and their influence on patterns of international trade. The model suggests that process of technological innovations creates com-parative advantage and significantly contributes to international trade. On the other hand, it stimulates the foreign producers (potential competitors) to respond all through the imitation of the country's innovations. The idea that comparative advantage may alter over time was further elaborated in the “product life cycle” model (Goncavles, 1996). At the origins of this theory were the articles of Raymond Vernon, Seev Hirsch and Harry Johnson, while significant contribution to its development was given by the research of Simon Kuznets, with the final elaboration and formalization made by Krugman. The product life cycle theory has played a significant role in further development of international trade doctrine, especially after the replacement of H-O-S theorem achievements, when a new generation of trade models, drawing heavily on the insights of the New Endogenous Growth Theory, comes to develop. Grossman and Helpman developed a model of the product cycle with endogenous innovation and endogenous technology transfer and quality competition (Grossman, Helpman, 1991a, 1991b, 1991c). The theoretical approach is founded on models of endogenous technical change formulated by Romer (1990) and Aghion-

REDETE – ECONOMIC DEVELOPMENT AND ENTEREPRENEURSHIP IN TRANSITION ECONOMIES
79
Howitt (1990) and takes product and process innovation owing to R&D by firms. Furthermore, Grossman and Helpman decide between horizontal and vertical product innovation. The authors set up the concept of “quality ladder” by identifying innovations with the new products having a higher quality as compared to the similar ones. Each product is considered to occupy a certain position on the “quality ladder”. The model defines two countries (“North” and the “South”). The position of North, as innovative country, is jeopardized by the imitations of low cost South. Innovation is the only way for the North to recover its advantage (Wolfmayr-Schnitzer, 1998). “In this process of ongoing product upgrading and imitation the North and South are consecutively climbing up the quality ladder. Or in the words of Krugman (1995, p. 353): “In a North-South set-up, the quality ladder would actually predict a product seesaw rather than a one-way product cycle. When an improved variant is introduced, it would first be exported by high-wage North; when the technology diffuses, the industry would move south; but North would reclaim the industry when a still better variant was introduced" (Wolfmayr-Schnitzer, 1998).
Data and Methodology
One of the indicators we implement to assess the qualitative competitiveness of the Mace-donian economy is the unit value (UV). Additionally, we make use of the revealed price elasticity (REVELAST 1) concept for a country specific segmentation of markets (Aiginger, 1998). The unit value is expressed as ratio of nominal value and some measure of physical volume. For the data applied in this paper it is the value of exports and imports in USD divided by kilogram. The unit value may indicate the qualitative features of competitiveness, i.e. moving toward the dimensions that increase the value (e.g. advertising, service components, etc.). It is available at almost any level of disaggregation and for a huge number of countries. The analysis we make for the Republic of Macedonia is based upon data for the total exports and imports of the three-digit Standard International Trade Classification (SITC 0-9) provided by UN Comtrade database. Generally, the countries with high shares in industries mostly using the physical capital reveal the lower unit values despite those specializing in technology-driven and skill-intensive industries. Yet, reprocessing may cause a problem. Namely, “goods are shipped into low wage countries and return at a somewhat higher unit value, indicating that the high wage country exports the lower quality product (as compared to the re-imported good)” (Aiginger, 2000, p.13). Likewise, there are some restraints about the application of unit values as to the precious metals due to the limited supply in respect to demand. Nevertheless, the high-skill and high-tech industries are generally among those having the highest export unit values (Aiginger, 2000). Hence, a positive correlation may perhaps be expected between GNP per capita and export unit values if those reflect quality in particular and countries constantly improve their production from low to high quality products. Yet, if there is an export driven growth and exports rise due to the lower costs than the quality-growth relationship may possibly fail. On the contrary, if exports are dependent upon the higher quality, the relationship is expected to be stronger. Finally, there is not so straightforward linkage between import unit values and GNP per capita (Aiginger, 1998).
The main problem to use the unit value is that it either be considered a cost indicator (e.g. small unit value reflects low costs) or it may signal the quality and product differentiation (e.g. high unit value as an indicator of greater performance). In order to make a difference between the markets where unit value reflects the quality and those with the costs being notified, we apply the following notion: “If unit values reflect costs and the product is homogenous, than countries with lower costs should be net exporters in quantities and countries with higher costs should be net import countries. If a country is net exporter in quantities despite the fact that is has higher unit values, then this must be due to quality differences. This assertion makes use of the fact that economic theory tells us that under quite broad circumstances demand is price elastic” (Aiginger, 1998, p.98).

REDETE – ECONOMIC DEVELOPMENT AND ENTEREPRENEURSHIP IN TRANSITION ECONOMIES
80
The price elasticity may perhaps be a good sign for the market structure, i.e. it can certainly indicate the predominance of price or non-price factors. The price competition prevails if higher prices impose exports of smaller quantities and vice versa. If however the opposite is true, then the quality competition is said to dominate. Hence, one may split the markets for a certain country along with the prevalence of price or quality competition in accordance with the following criteria (Aiginger, 1998):
- The first segment comprises those industries where export quantities outstrip the imports even with the higher unit values (Qexp>Qimp, UVexp>UVimp). This situation is essentially the result of better quality or it is about the effective specialization in the market segment as considered the most sophisticated one. This is to be a segment one should focus on (successful quality competition);
- The second segment covers the price elastic goods distinguished by the low unit values in the home country. There is a trade surplus attained hereby with the relatively lower unit value (Qexp>Qimp, UVexp<UVimp). It is therefore denoted a segment of successful price competition;
- The third segment includes those products having the high unit values in the home country and therefore they incite a trade deficit. The particular industries have actually lost the price competitiveness in those markets where the prices are of the great importance (Qexp<Qimp, UVexp>UVimp). The vast production costs are considered those causing this part of the deficit, i.e. the segment is designated as deficit in price competitiveness;
- The fourth segment is the one where a trade deficit is being obtained even though the prices are low (Qexp<Qimp, UVexp<UVimp). There are must be some structural problems hereby.
Empirical results
The evidence suggests that unit value of the Macedonian exports has increased from 0.78 USD/kg in 2006 to 1.02 USD/kg in 2010 (Figure 1). Generally, the transitions and less developed countries feature a low unit value of exports, unlike the developed ones where it reaches up to 7.5 USD/kg (Jefferson Institute, 2003). The reasons behind follow on specialization of the Macedonian exports in those groups of manufactures to be found on lower levels of “quality ladder”. Namely, labor- and resource intensive product groups prevail with the structure of the Macedonian exports. The slight increasing tendency in the share of medium-technology exports is not to reflect significantly the technological modernization of the Macedonian manufacturing exports. This is primarily the result of the slow progress in structural reforms during the second half of the nineties.
At the same time, low figures have been also recorded for the Macedonian imports (Figure 1). Generally, the Macedonian imports feature a relatively higher share of human capital intensive industries. Yet, an in depth analysis of this category indicates that the Macedonian economy, throughout imports, incorporates the modern technological content mostly in the segment of medium technology, primarily in the sphere of private consumption. In other words, it is not only that the Macedonian economy cannot produce technology intensive products, but the country is not able to adequately absorb these components. The benefits of modern technologies intended for investment of the businesses are not embedded within the Macedonian imports.

REDETE – ECONOMIC DEVELOPMENT AND ENTEREPRENEURSHIP IN TRANSITION ECONOMIES
81
Figure 1 Unit value of exports and imports
Source: Republic of Macedonia, State Statistical Office and own estimates
The comparative analysis for the product groups subdivided into corresponding segments
points to certain deterioration of the Macedonian competitiveness (Table 1). The number of competitive groups from the first and second sector is much lower than that of
non-competitive segments (Figure 2). It is of particular concern hereby the decreasing number of the product groups from the first segment indicating the successful qualitative competitiveness, i.e. it has been halved in 2011 compared to 1998 along with the declining share of these groups in total exports (45.13% and 58.75%, respectively). The second segment, that where the Macedonian products are relatively cheap and the market is price elastic, has a positive contribution in the trade balance. Note the increasing number of product groups in this segment. There is a certain decline in 2007 compared to 2005 mostly coming from the increased costs of production (e.g. the growth in the import price of electricity) (National Bank of the Republic of Macedonia, 2008). Yet, the number of product groups in this segment is still higher in 2007 than that in 1998 and 2002, followed by the higher percentage share in total exports. Hence, the trade surplus obtained in this segment is moving up, except for the unexpected situation in 2002 and 2011 when the trade surplus decrease despite the higher number of groups in 2002 with respect to 1998 (31 and 25, respectively) and 2011 compared to 2007 (37 and 36, respectively).

REDETE – ECONOMIC DEVELOPMENT AND ENTEREPRENEURSHIP IN TRANSITION ECONOMIES
82
Table 1 Segmentation of the product groups*
Year Segment Number of
3-digit SITC groups
Share in exports (%)
Trade balance (million USD)
1998 First segment UVexp>UVimp, Qexp>Qimp 33 58.75 676.29
Second segment UVexp<UVimp, Qexp>Qimp 25 23.82 251.58
Third segment UVexp>UVimp, Qexp<Qimp 98 10.65 -555.16
Fourth segment UVexp<UVimp, Qexp<Qimp 92 5.91 -551.38
2002 First segment UVexp>UVimp, Qexp>Qimp 25 49.78 492.03
Second segment UVexp<UVimp, Qexp>Qimp 31 26.31 195.39
Third segment UVexp>UVimp, Qexp<Qimp 89 16.49 -547.99
Fourth segment UVexp<UVimp, Qexp<Qimp 109 7.06 -622.93
2005 First segment UVexp>UVimp, Qexp>Qimp 20 42.31 758.08
Second segment UVexp<UVimp, Qexp>Qimp 39 38.29 392.40
Third segment UVexp>UVimp, Qexp<Qimp 81 11.68 -657.78
Fourth segment UVexp<UVimp, Qexp<Qimp 114 7.50 -1680.71
2007 First segment UVexp>UVimp, Qexp>Qimp 19 43.85 1360.22
Second segment UVexp<UVimp, Qexp>Qimp 36 36.19 666.30
Third segment UVexp>UVimp, Qexp<Qimp 83 13.04 -1191.44
Fourth segment UVexp<UVimp, Qexp<Qimp 117 6.87 -2699.56
2011 First segment UVexp>UVimp, Qexp>Qimp 16 45.13 1824.16
Second segment UVexp<UVimp, Qexp>Qimp 37 24.48 325.99
Third segment UVexp>UVimp, Qexp<Qimp 87 17.25 -1243.53
Fourth segment UVexp<UVimp, Qexp<Qimp 112 13.14 -3177.70
*according to three-digit SITC Source: UN Comtrade and own estimates
After the decreasing tendency in the number of product groups, a certain growth has been
recorded in 2007 and 2011 within the segment where the Macedonian exports are relatively expensive and therefore impose a trade deficit. Generally, the number of product groups increases in the fourth segment, followed by the growing trade deficit that amounts to 3.18 billion USD in 2011 (Figure 3). Taking the non-competitive position of the Macedonian exports in this segment despite the low export prices, one may note that the quality of products is the main reason for the negative results obtained.

REDETE – ECONOMIC DEVELOPMENT AND ENTEREPRENEURSHIP IN TRANSITION ECONOMIES
83
Figure 2 Number of product groups according to different segments*
*according to three-digit SITC
Source: UN Comtrade and own estimates
Figure 3 Trade balance of product groups according to different segments*
*according to three-digit SITC
Source: UN Comtrade and own estimates
The analysis about the changes of product groups’ number according to SITC sectors in different segments points to somewhat divergent results (Table 2). Generally, the number of product groups in the segment of successful qualitative competitiveness has recorded either a decreasing or equal movement in 2011 with regard to other periods taken into analysis. It is of particular concern hereby the decline of the product groups’ number within the seventh and eighth SITC sector (2011 compared to 1998), since it implies a loss in the qualitative competitiveness of products with higher processing levels. There is either increasing or equal movements of the product groups’ number in the second segment (2011 compared to 1998). The particular change has been noticed within the “Food and live animals” SITC sector for even the six product groups. In other words, there is a general tendency of growth for the product groups’ number achieving a successful export at low unit value. The number of product groups that lost the competitiveness in markets where the prices prevail has been reduced within the 0 SITC sector (2011 compared to all other periods). By contrast, there is an increasing tendency in the number of product groups in

REDETE – ECONOMIC DEVELOPMENT AND ENTEREPRENEURSHIP IN TRANSITION ECONOMIES
84
sectors with higher processing levels (seventh sector in 2011 with regard to 2007; sixth sector in 2007 compared to 2005). Noteworthy is the growth of the product groups’ number in the segment with structural problems, particularly in the fifth sector (3 product groups), the sixth sector (12 product groups) and the eighth sector (7 product groups) in 2011 compared to 1998. That is to say, there is a huge loss of competitiveness, especially in manufacturing as considered the most important in achieving the competitive performance with dynamic potentials, predominantly followed by the impact of non-price factors.
According to variable structure of the product groups at different sectors, one may note that product groups within the first segment exhibit a kind of “fictional” qualitative competitiveness. Namely, those are the products that are exported, but more difficult to sell in domestic market owing to low purchasing power of domestic demand which is mainly satisfied by lower quality imports (e.g. textile). Furthermore, export of clothing and textile has been largely dependent upon the imports of products for further processing (National Bank of the Republic of Macedonia, 2004) and it still dominates the Macedonian textile industry (University American College, 2011). This segment also comprises several product groups with smaller imports, as well as those in which the qualitative lead of exports is mostly due to natural advantages (e.g. ores and tobacco). Moreover, some of the product groups revealing the price competitiveness are those predominantly sold on the markets of neighboring countries. They may possibly be sold as cheaper products in near locations owing to the high unit costs of transport (e.g. fruit, vegetable, cement, etc.).
The segment with deficit in price competitiveness contains several product groups with poten-tials to improve their performance. In other words, some of them can reach certain levels of price competitiveness and possibly shift to other segment by succeeding to complete a more efficient production and optimize the transportation costs. As mentioned above, the number of product groups within the extremely uncompetitive segment increases along with the growth of trade deficit. Yet, the structure of fourth segment exhibits large variations. That is to say, there are pro-duct groups not to be found in the Macedonian exports, but also those which might have a great importance in exports (e.g. heating and cooling equipment, mechanical handling equipment and telecommunications equipment). Hence, despite these product groups being uncompetitive and generate the highest percentage of trade deficit, the larger inflows of foreign direct investment (FDI) in this segment are supposed to create conditions for restructuring and changing the nature of competitiveness.
Table 2 Number of product groups at different segments according to SITC sectors
1998 2002 2005 2007 2011
Sector I II III IV I II III IV I II III IV I II III IV I II III IV
Food and live animals 2 6 18 10 3 4 14 15 3 8 16 9 3 5 14 14 1 12 12 11
Beverages and tobacco 3 1 0 0 3 1 0 0 3 1 0 1 3 3 0 0 1 2 1 0
Crude materials, inedible, except fuels 8 3 9 14 5 4 8 16 5 8 6 11 4 6 10 12 5 5 8 13
Mineral fuels, lubricants and related materials 0 0 2 7 0 0 5 5 0 2 2 6 0 1 4 5 0 0 4 6
Animal and vegetable oils and fats 0 0 3 1 0 0 1 3 0 0 3 1 0 0 3 1 0 0 3 1
Chemicals 1 1 17 13 1 6 12 14 0 3 13 17 1 3 12 17 1 3 13 16
Manufactured goods classified chiefly by material 10 9 17 14 6 11 18 17 2 12 14 24 2 11 17 22 2 9 15 26
Machinery and transport equipment 2 4 18 26 1 3 20 26 1 3 15 31 1 3 13 33 0 4 20 26
Miscellaneous manufactured articles 7 1 14 6 6 2 11 12 5 2 10 14 5 3 10 13 5 2 10 13
Commodities and transactions not classified in SITC 0 0 0 1 0 0 0 1 1 0 0 0 0 1 0 0 1 0 1 0
Source: UN Comtrade and own estimates
The above analysis points toward a number of disadvantages which negatively affect the Macedonian exports, such as: the high level of rivalry in international markets mostly by the less developed countries; the inferior negotiating position either with suppliers or the buyers; the substitutes continually created by the new technology, etc. Hence, the only way to achieve a better

REDETE – ECONOMIC DEVELOPMENT AND ENTEREPRENEURSHIP IN TRANSITION ECONOMIES
85
structure of the Macedonian foreign trade and higher levels of competitiveness is the possibility to create an adequate environment so as to shift a part of product groups from the fourth segment (especially those generating higher value added) into the first and second segment for them to significantly contribute to dynamics of total exports.
Conclusions
The empirical research indicates that the Macedonian economy features low export unit values owing to the country specialization in those industries to be found at lower levels of “quality ladder”. The imports have also recorded relatively low unit values, which specify the inability of the Macedonian economy to effectively absorb the technology intensive products.
The analysis made for the product groups subdivided into different segments point towards the poor competitive performance. Namely, the number of product groups from the first and second segment is much lower than that of the non-competitive segments. It of particular concern hereby that the number of product groups indicating successful qualitative competitiveness has been halved in 2011 with regard to 1998 together with the decreasing share in total exports. The rising trade deficit along with the general increase in the number of product groups in the segment where the Macedonian exports are not competitive, despite the low export prices, point towards the quality of products as the main reason for the negative results obtained.
The estimates about the changes of the product groups’ number according to SITC sectors in different segments points toward somewhat divergent results. Particularly disturbing is the rise of product groups’ number within the segment with structural problems, especially in the fifth, sixth and the eighth sector in 2011 compared to 1998. In other words, a huge loss in competitiveness has been noted in sectors which are the most important in achieving the competitive performance with dynamic potentials, mostly followed by the impact of non-price factors.
According to variable structure of the product groups at different sectors, one may note that product groups within the first segment exhibit a kind of “fictional” qualitative competitiveness. Those are the products difficult to sell in domestic market owing to low purchasing power of domestic demand or largely dependent upon the imports of products for further processing. Some of the product groups revealing the price competitiveness may possibly be sold as cheaper products in locations nearby owing to the high unit costs of transport. The segment with deficit in price competitiveness contains several product groups with potentials to improve their performance and possibly shift to other segment. Finally, the fourth segment exhibits large variations. There are product groups either not to be found in the Macedonian exports or those should have greater importance in exports. Despite these product groups being uncompetitive and generate the highest percentage of trade deficit, the larger FDI inflows are supposed to create good conditions for restructuring and changing the nature of competitiveness.

REDETE – ECONOMIC DEVELOPMENT AND ENTEREPRENEURSHIP IN TRANSITION ECONOMIES
86
Reference list
1. Aiginger, K. (2000). Europe’s position in quality competition: Background Report for The European Competitiveness Report 2000. DG Enterprise, Commissioned by DG Enterprise, Brussels
2. Aiginger, K. (1998). Unit values to signal the quality position of CEES. The Competitiveness of transition economies. OECD Proceedings
3. Goncalves, R. (1996). The theory of international trade: back to basics. Encontro Nacional de Economica Classica e Politica, 5, pp. 31-37
4. Grossman, G. M., Helpman, E. (1991a). Innovation and Growth in the Global Economy. MIT Press, Cambridge, Mass
5. Grossman, G. M., Helpman, E. (1991b). Endogenous Product Cycles. The Economic Journal. 101 (408), pp. 1214-1229
6. Grossman, G. M., Helpman, E. (1991c). Quality Ladders and Product Cycles. Quarterly Journal of Economics. 106 (2), pp. 557-586
7. Heckscher, E. (1919). The Effect of Foreign Trade on the Distribution of Income. Ekonomisk Tidskrift. 21, pp. 497-512. An bbreviated English translation by Svend and Nita Laursen in available in Howard S. Ellis and Lloyd A. Metzler, eds., Readings in the Theory of Interna-tional Trade, Philadelphia: The Blakiston Co., 1949, pp. 272-300. A complete translation is available in Harry Flam and M. June Flanders, eds., Heckscher-Ohlin Trade Theory, Cambri-dge, MA: MIT Press, 1991, pp. 39-69
8. Jefferson Institute. (2003). Konkurentnost privrede Srbije [Competitiveness of the Serbian Economy]. Belgrade. Serbia
9. Krugman, P. R. (1995). Technological Change in International Trade. in Stoneman, P. (ed.), Handbook of the Economics of Innovation and Technological Change. Blackwell, Oxford, pp. 342-365
10. National Bank of the Republic of Macedonia. (2008). Annual Report 2007. Skopje. http://www.nbrm.mk/WBStorage/Files/web_ANNUAL_REPORT_2007.pdf (accessed 25.08.2012.)
11. National Bank of the Republic of Macedonia. (2004). Annual Report 2003. Skopje. http://www.nbrm.mk/WBStorage/Files/AI_Annual_Report_200 3_ang.pdf (accessed 30.08.2012.)
12. Ohlin, B. (1933). Interregional and International Trade. Cambridge: Harvard University Press
13. Piana, V. (2003). Product differentiation. Economics Web Institute. http://www.economicswebinstitute.org/glossary/product.htm (accessed 01.08.2012.)
14. Ricardo, D. (1817). On the principles of political economy and taxation. London: John Murray 15. Samuelson, A. P. (1948). International trade and Equalization of Factor Prices. Economic
Journal. 58(230), pp. 163-184 16. University American College. (2011). Преглед на надворешната трговија на
Македонија [Review of the Foreign Trade of Macedonia]. Skopje. Macedonia 17. Wolfmayr-Schnitzer, Y. (1998). Trade performance of CEECs according to technology
classes. In The Competitiveness of Ttransition economies. OECD proceedings

REDETE – ECONOMIC DEVELOPMENT AND ENTEREPRENEURSHIP IN TRANSITION ECONOMIES
87
IMPACT OF THE ECONOMIC CRISIS ON ACCOMMODATION ESTABLISHMENTS IN CZECH REPUBLIC
Barbora ANTONOVA33
Abstract
The world economic crisis and later depression gradually struck almost all branches of busi-ness activities both in the USA, where the crisis began and in Europe, where it expanded subse-quently. Over several years hundreds of companies in the Czech Republic had to face lack of funds caused by growth of bad debts, decrease of quality and of reliable contractors and also by decline in customers. Of course, as it is well known, consequences of the crisis are demonstra-ted gradually and differently in each business branch. Over the past years a new discussion ma-tter has appeared - does the crisis have really such a negative effect on Czech businesses or do-es this depression bring also some positives? For example, it allowed firms to examine their present processes and freed hands of managers to apply necessary cost savings. It also helped to clean up the market from the financially unstable companies. A number of independent resea-rch studies discovered that not every enterprise had been influenced by crisis or got to the wor-se position than before 2007. The issues of the depression influence on businesses are being de-alt by not only many economists (eg. Pendery), but also by a lot of international organizations and institutions.
This paper focuses on tourism, especially on accommodation services. The aim of the article is to assess the present situation in public accommodation establishments in Czech Republic, specifically in the Olomouc region, and explore the influence of the economic crisis on these facilities. The situation in accommodation establishments has been analyzed using secondary and primary data. The research of the secondary data was primarily focused on statistic data which recorded a progression of occupancy in public accommodation establishments. Personal interviews with questionnaires were used as a they survey method to collect primary data. The survey aim was to find out what the situation in accommodation establishments was like in 2007 – 2011 compared 2006, i.e. before the crisis broke out. The focus of successively guided inter-views was to gain information about management acting in particular hotels, bed and breakfa-sts, hostels etc. in the years mentioned above. Primary research was performed in the Olomouc region. 80 subjects participated in the survey. Respondents were chosen purposefully, specifica-lly quota sampling. The survey included businesses from all categories of accommodation esta-blishments.
Analyzing secondary data allowed to find out that influence of the world crisis on Czech companies was demonstrated by reduced occupancy in accommodation establishments as well as by reductions of costs related to accommodation services. Analyzing primary data allowed to find out that the economic crisis had direct impact on management of accommodation establish-ments in the Czech Republic and on strategy of accommodation service providers.
Keywords: crisis, tourism, accommodation establishments, management
33 Silesian University in Opava, School of Business Administration in Karvina, Univerzitni nam. 1934/3, 733 40
Karvina, Czech Republic, Europe, Email: [email protected]

REDETE – ECONOMIC DEVELOPMENT AND ENTEREPRENEURSHIP IN TRANSITION ECONOMIES
88
Introduction
Significant changes in the global business environment cause changes in the internal environ-ment of the business entity. The world crisis, which has hit all levels of the global business environment, from the macro-environment down to the micro-environment of enterprises, is the most noticeable change affecting business management. The issue of the global crisis and its impact is now dealt with by a whole range of economists. The current economic recession, refe-rred to by numerous media as “economic crisis”, has hit most economies around the world. To a varying extent, it has affected nearly every industry where business can be done, inducing considerable troubles for quite a number of entrepreneurs.
The purpose of this paper is to contribute to current knowledge regarding the impact of the global economic crisis on entrepreneurial activity in the field of tourism, in particular in the field of accommodation services. The data presented in this paper were obtained through primary research among providers of accommodation services in the Czech Republic, specifically, in the Olomouc region.
The initial section of the paper will discuss the theoretical framework regarding the global eco-nomic crisis as well as its impact on businesses. The theoretical framework leads then to for-mulating hypotheses concerning the impact the global economic crisis has on accommodation service providers in the Czech Republic. The subsequent section will present the methodology used, the data and results from the primary research.
Current economic crisis and its inception
Everything was triggered by the US mortgage crisis, as once the dot-com bubble34 was over in 2001, the US administration opted for a rapid reduction of interest rates, which led to a sharp fall in mortgage costs. Owing to this, there was an increase in the number of applicants for mortgages but these were not verified thoroughly in terms of their credit score (Dorňák, 2009).
In 2004, a dramatic change occurred in the prime interest rate, soaring from the original level of 1% up to 5.25% in December 2005. Because of this, there was also an increase in mortgage interest rates, which, logically, made the monthly mortgage instalments rise, thus dragging the least prosperous households into financial distress. This problem brought along a reduction of household expenditure, and with it a reduction in consumer demand as well as a rise in mortgage unpaid. (Zemánek, 2008).
The current crisis, hitting a rather large number of national economies, dates from about mid-2007. It was linked to the loss of confidence among US investors in the mortgage value. It was followed by transfers of large amounts of money into financial markets by institutions such as the Bank of England, the European Central Bank and the American Fed. In July 2007, featuring some mild fluctuation, the indicator of perceived credit risk in the economy rose when on 10 October 2008, it reached a record 4.65 % (Hospodářská krize, 2008).
In September 2008, stock markets worldwide began plummeting. For example, on 10 Septem-ber, the Prague stock exchange slumped down to its 26 month minimum, while on 15 September, the New York Stock Exchange experienced its largest decline since 11 September 2001. The investment bank Bear Stearns had to close down two large funds at that time, both having invested in highly risky mortgages (Morávek, 2008). The USA have experienced the largest bankruptcy in its history when on 25 September the largest US savings bank, Washington Mutual,
34 Note: The dot-com bubble, or the internet bubble, is a term for a mass boom period of internet companies without a
concise business model that went bankrupt soon, yet managing to attract massive investments. This period represents roughly 1996 to 2001, with investments peaking in 2000. In 2001, the dot-com bubble burst and the overvalued shares lost their value.

REDETE – ECONOMIC DEVELOPMENT AND ENTEREPRENEURSHIP IN TRANSITION ECONOMIES
89
collapsed. At the end of September, the crisis also hit Europe. The governments of the UK, Bene-lux nations, Germany and a few other countries had to intervene (Kovanda, Gallisti, 2008). As far as Europe is concerned, we can state simply that in virtually all countries, the GDP decreased or at least decelerated its growth. Most governments approved a range of measures intended to support their national economies. (ČTK, 2009, Musílek, 2008)
The crisis deepened considerably, resulting in bankruptcies of a large number of financial institutions, whose clients were unable to pay back their mortgages, with their real estate property turning out impossible to sell by banks. Thus, the US mortgage crisis can be said to be the primary cause for the current global economic crisis. However, this was also aided by the high cost level of crude oil in the first half of 2008, leading to a decline in the real GDP and an increase in consumer prices. Oil prices soared in view of speculative deals, weak dollar and a growing de-mand in China before the Beijing Olympics. When the financial crisis hit with full blast in Autumn 2008, it took down the crude oil price, along with top US banks and stock exchange markets.That was the time when panic went global and the US mortgage crisis turned into a global economic one. (Hospodářská krize, 2008)
Crisis consequences in Czech Republic
According to most economists, the global economy is facing the largest decline since the Great Depression that took place in the 1930s. In the last quarter of 2008, the GDP recorded a decrease of 0.6%. The industrial production in the Czech Republic fell by 17.4 %, with aggregate new orders decreasing by 30.2 % of total value (Unihost, 2009).
The primary indicator of the crisis was the collapse of the Czech crown, generating problems particularly to companies active in imports and/or exports of goods from and to the country. The manufacturing industries received the worst impact of the economic crisis. The consequences were most notable in the automotive industry, which is perceived to be a kind of backbone of the Czech economy. Due to the low demand in the market, most car makers had to cut down on jobs and production. In its turn, this led to adverse effects for their suppliers. Major difficulties were also noted in the glass industry, considered a traditional Czech industry. (Hornungová, 2009).
The condition of Czech companies failed to improve in 2009 and the year after. This was in spite of the original assumptions to the contrary, as the original quotation from 2009 shows: “Business people are concerned that the economic recession has not reached its assumed bottom yet. Companies continue to struggle with a considerable decline in orders, and the fact that most companies expect a reversal for the better as late as in 2010 bodes badly for the national econo-my”, said the President of the Czech Chamber of Commerce, Petr Kužel (Unihost, 2009).
Presently, we know for sure that the impact of that crisis has been immense, also beyond the Czech Republic. The symptoms were, in particular, collective redundancies, especially in manu-facturing industries, stricter terms for granting mortgage loans and funds for property develop-ment projects, decreased exports and consumer expenditure. Czech banks are more careful now when providing credits.
Crisis in tourism
As stated above, the economic crisis hit several tens of industries across a number countries the world over. However, this article will focus on the tourism industry, where the crisis began to occur more slowly and later, compared to say the automotive industry.
Based on reports in the Czech media we could date that back to the second half of 2008. That is when the press started reporting on a decline in the Czechs' interest in package tours and a decreasing number of visitors to the Czech Republic. This was later also corroborated by the statistics of the Czech Statistical Office (CSO).

REDETE – ECONOMIC DEVELOPMENT AND ENTEREPRENEURSHIP IN TRANSITION ECONOMIES
90
Towards the end of 2009, the following prediction was offered by Mag Consulting director, Jaromír Beránek: “The crisis in the tourism industry, with its first symptoms recorded by sta-tistical evidence as early as in the second quarter of 2008, will continue at least till the end of 2010. We can assume that small and medium-sized hotels will not withstand the pressure and will have to close down.”(Chamber of Commerce. 18.5.2009). And in this case, he was quite close to reality.
As predicted by him, the number of accommodation providers in the Czech Republic really dwindled. Since the end of 2007 they began to wane in our country. As evidenced by the CSO statistics, the most perceivable decline occurred between 2009 and 2010, reaching nearly 5%. The year 2010 was, of course, the year when the decrease in tourist traffic to the Czech Republic was finally reversed. And Czech entrepreneurs in the tourism industry felt a change in the course of the year 2010 when in the summer foreign tourists started returning to the Czech Republic.
Based on the reasons above, the following hypotheses were drawn. H1: Accommodation service providers recorded a decline in visitor numbers between 2007 and
2011. H2: Accommodation service providers were forced to dismiss some staff between 2007 and 2011. H3: Accommodation service providers reduced prices for services on offer between 2007 and 2011.
Data and Methodology
The aim of the research study was to determine the impact of the global economic crisis on the business activities of providers of accommodation services in the Czech Republic. Because of the aim defined, the choice was made in favour of short-term research of primary data of descriptive and explanatory nature. As a research method, polling was selected, more specifically, oral interviews. A questionnaire was designed as a research tool, to be submitted to managers and directors of lodging facilities. The return of the questionnaires was at 80 %.
To test the hypotheses established, a sample was selected from Czech accommodation service providers operating in the Olomouc region. The selection of informants for the survey was made in the form of an intentional quota selection.
Total 80 businesses took part in the survey, representing all types of lodging facilities. The poll was carried out throughout the Olomouc administrative region in all of its constituent districts, or districts of Jeseník, Přerov, Prostějov, Šumperk and Olomouc, between July and August 2012.
An overview of numbers of particular facilities sorted out to categories is shown in Chart 1.
Chart 1: Informant structure (source: own research)

REDETE – ECONOMIC DEVELOPMENT AND ENTEREPRENEURSHIP IN TRANSITION ECONOMIES
91
The data collected by means of polling were subsequently processed with Microsoft Excel 2007 software application, and the research results are presented in the following section of the paper.
Results
All the data collected were entered in Excel, yielding the following survey results.
Change in staff size
Based on the poll taken among 80 informants from the Olomouc region, it was found that in nearly 30 % of lodging facilities, there was a change in staff size between 2007 and 2011. These figures were largely influenced by the economic crisis, increasing taxes, changes in competition in the area, a reduced attractiveness of the site where the lodging facility is located, and also adverse weather conditions which some operators depend on (such as a mountain hotel).
The survey showed that 19.44 % of businesses were forced to dismiss some staff for one of the reasons just above. The prevailing trend over the past few years of the current economic crisis is that the operators of lodging facilities try to keep staff members who have been employed there for several years. This means they have considerably limited staff recruitment on the part-time basis. Employers are likely to stop offering short-term jobs in the summer/winter high season, mostly due to payroll cost reductions during the crisis.
Unlike this, total 11.11 % lodging facilities noted an increase in staff size. This particular case involves the lodging facilities that were affected by the economic crisis only marginally, those trying to suit the client's wishes at any cost, for instance by extending the service portfolio on offer. In this case, they had to hire additional new staff.
The data just above imply that nearly 70 % of lodging facilities did not have to modify the staff size of their facilities during the crisis. Throughout this difficult period, they coped without resorting to considerable changes in their staff size. This is, however, also due to the fact that a considerable number of the hotels involved in the survey were hotels and boarding houses with a small staff, often made up from family members, or even, the operator was the sole worker. So it was quite impossible to dismiss staff members and change the staff size in any way.
The survey also allowed to find out that, as shown in Chart 2, among all the lodging facilities that dismissed some staff between 2007 and 2011, 64.29 % were microenterprises (up to 10 persons), and 35.71 % were companies with staff size of 11-50 persons (small enterprises). No decrease was noted for a single medium enterprise (a business with staff between 50 and 250 persons).

REDETE – ECONOMIC DEVELOPMENT AND ENTEREPRENEURSHIP IN TRANSITION ECONOMIES
92
Chart 2: Change in staff size (source: own research)
Among the enterprises that raised the staff size during the crisis, a vast majority (75 %) were those employing up to 10 persons, while 12.5 % were small enterprises and the same share was represented by medium enterprises.
Among the huge pool of the lodging facilities where no changes in staff size were noted in the reference period, 92 % were microenterprises and the other 8 % were businesses with a staff of maximum 50.
Changes in pricing
The survey data regarding pricing showed that 41.67% businesses raised their fees for the services on offer during the specific period. Mostly, it was the cost of accommodation, as nearly every enterprise within the reference pool either lumps all services in a single accommodation price or offers no additional services. The rise in prices was not due to the economic crisis solely, but in many cases, due to rise in VAT and energy costs. Thus, for the most part, the price modifications were not substantial, and the increase amounted to several tens of CZK.
Unlike this, there were 11.1 % of lodging facilities which reduced the accommodation cost. This is mostly the way businesses try to attract the clients who are not after luxury but are cost-driven. The other 47.22 % of accommodation providers tried to preserve their pricing unchanged in the crisis period. In some cases, this was also done at the cost of their revenue, owing to the increase in energy costs and the raise in VAT as mentioned above. The accommodation service providers were afraid the price increase would turn off the remaining potential clients, so they decided to wait for an improvement in the market conditions.
As shown in Chart 3, 80 % of the microenterprises opted for a price increase. These are mostly guesthouses or apartments operated by a single person (a hired operator or the owner), or is it a family establishment where each family member gives a helping hand when not busy. In addition, this includes 16.67 % of small enterprises and 3.33 % medium enterprises.
Here, the price increase was mostly due to the increased VAT rate as the operators were unable to subsidize the accommodation with their own funds, left with no alternative but raising the price despite the risk of potentially losing some clients. In some cases, though, there was a significant expansion of services on offer, naturally payable by customers.

REDETE – ECONOMIC DEVELOPMENT AND ENTEREPRENEURSHIP IN TRANSITION ECONOMIES
93
Chart 3: Price modifications (source: own research)
An interesting fact is the number of accommodation providers who decreased the prices for services on offer during the recession, mostly for accommodation. Out of their total number, 87.5 % were microenterprises and 12.5 % were small enterprises. The price reduction was either introduced by a new facility operator who came to the conclusion that their clients were unwilling to pay the previous price, or the service package bundled with the accommodation was reduced, allowing thus for a decrease in the total price.
The pricing level was maintained by 20 % enterprises below the staff of 10, and full 80 % small enterprises. This remarkable prevalence of larger entities may be a proof of a better pricing stability of these facilities in the recession period. Larger firms can often afford not to change the price for their services even despite the looming crisis and their potential loss.
Change in occupancy rate
In 2007-2011, over 83% of those polled noted a change, less or more perceivable, in terms of the total clients using their accommodation facilities. The change was compared to the 2006 figures.
Among these, 62.5 % noted a decline and/or stagnation throughout the reference period, while 13.89 % noted a rise and/or stagnation; The other companies faced both a decrease and increase in the crisis period, in varying sequences. 2.78 % operators faced a decline in visitor figures in the first crisis years. As time went, these facilities consolidated, noting an increase in visitor figures. Contrary to this, 4.17 % of hotels, hostels, boarding houses and like withstood the first echoes of the crisis and actually fared better and better first, only to face a sinking interest among clients in the later years. Thus, they first went through a growth period, and then through a decline. 16.67% accommodation providers perceived no fluctuations in terms of total visitors. The visitor numbers were almost unchanged in these facilities.
Analysing the questionnaires allowed to find out (refer to Chart 4) that the decline and stagnation of ≤ 10% was experienced by 17.78%. Larger fluctuations, up to 30 % of the reference value in 2006, were noted in almost 45% of accommodation service providers. The change below 50% was found out in 28.89 % businesses, and the change over 70 % was noted in 8.89 % of hotels, boarding houses, hostels etc. In some cases, there was a decline right in the beginning of the crisis period, which was overcome by the company, to regain the 2006 level, in other words, that before the crisis. In other situations, things were vice versa. The company perceived the crisis impact only in the last two or three years.
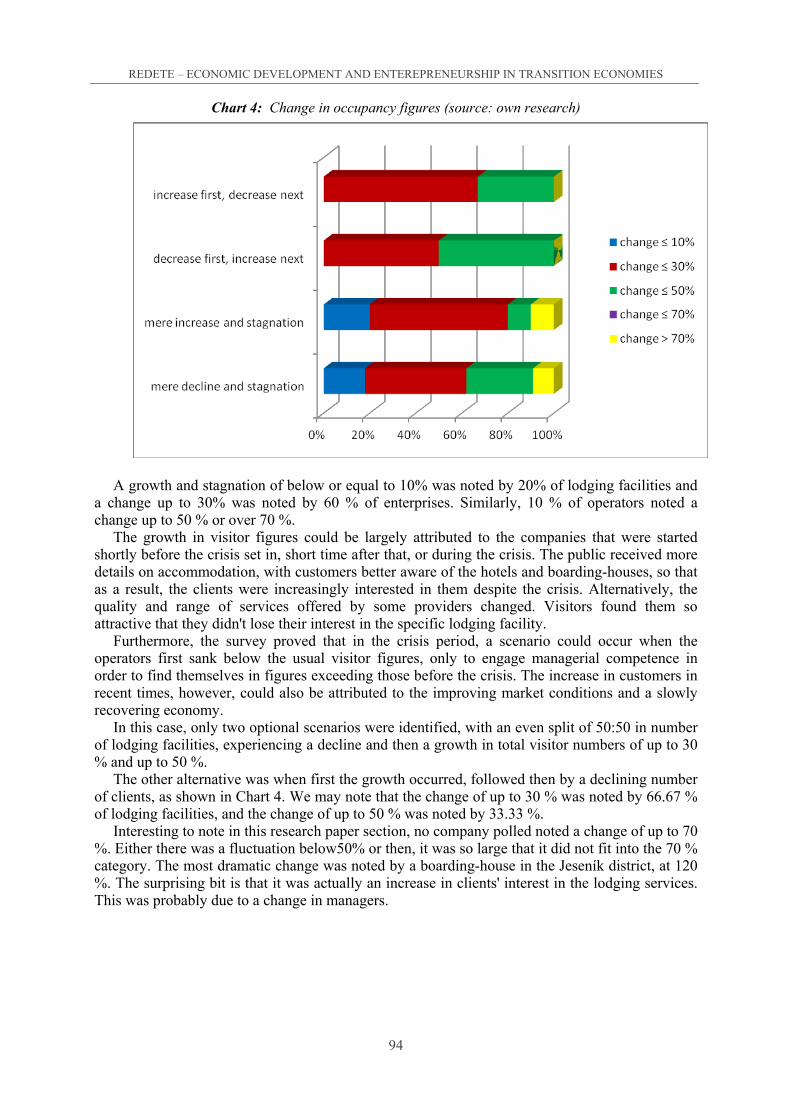
REDETE – ECONOMIC DEVELOPMENT AND ENTEREPRENEURSHIP IN TRANSITION ECONOMIES
94
Chart 4: Change in occupancy figures (source: own research)
A growth and stagnation of below or equal to 10% was noted by 20% of lodging facilities and
a change up to 30% was noted by 60 % of enterprises. Similarly, 10 % of operators noted a change up to 50 % or over 70 %.
The growth in visitor figures could be largely attributed to the companies that were started shortly before the crisis set in, short time after that, or during the crisis. The public received more details on accommodation, with customers better aware of the hotels and boarding-houses, so that as a result, the clients were increasingly interested in them despite the crisis. Alternatively, the quality and range of services offered by some providers changed. Visitors found them so attractive that they didn't lose their interest in the specific lodging facility.
Furthermore, the survey proved that in the crisis period, a scenario could occur when the operators first sank below the usual visitor figures, only to engage managerial competence in order to find themselves in figures exceeding those before the crisis. The increase in customers in recent times, however, could also be attributed to the improving market conditions and a slowly recovering economy.
In this case, only two optional scenarios were identified, with an even split of 50:50 in number of lodging facilities, experiencing a decline and then a growth in total visitor numbers of up to 30 % and up to 50 %.
The other alternative was when first the growth occurred, followed then by a declining number of clients, as shown in Chart 4. We may note that the change of up to 30 % was noted by 66.67 % of lodging facilities, and the change of up to 50 % was noted by 33.33 %.
Interesting to note in this research paper section, no company polled noted a change of up to 70 %. Either there was a fluctuation below50% or then, it was so large that it did not fit into the 70 % category. The most dramatic change was noted by a boarding-house in the Jeseník district, at 120 %. The surprising bit is that it was actually an increase in clients' interest in the lodging services. This was probably due to a change in managers.

REDETE – ECONOMIC DEVELOPMENT AND ENTEREPRENEURSHIP IN TRANSITION ECONOMIES
95
Discussion
All business sectors in the Czech Republic were affected by the crisis to a significant extent. Beyond any debate, it affected the tourism industry, or specifically, the businesses involved in accommodation services. Following the outcome of the previous section of this paper, we may assess the hypotheses listed in its initial part.
Hypothesis H1: In 2007 - 2011, accommodation service providers noted a decrease in visitor numbers. This hypothesis is justified as over 60 % of informants reported a decrease in visitor numbers.
Hypothesis H2: In 2007 - 2011, accommodation service providers were forced to dismiss some staff. This hypothesis must be rejected as the survey results show clearly that only 19.44 % of lodging facilities reported a cut in their staff. A vast majority of companies, here 70 %, is represented by companies that recorded no changes in staff numbers.
Similarly, hypothesis H3 must be rejected as well. Accommodation service providers reduced prices for services on offer between 2007 and 2011. We found out through our survey that slightly over 10 % of accommodation service providers reduced their pricing. On the contrary, over 40 % of accommodation service providers decided to raise the price, and over 50 % of them succeeded in maintaining their price level unchanged over a period of over five years.
Regarding the topic discussion, we might say that as early as the late 2008, there were first echoes of the crisis, as the CSO statistics show that 1 % less visitors stayed in Czech hotels then, compared to 2007. For the Olomouc region, this figure is 2 % less. The first notable decline was recorded in late 2009 as the visitor number fell by 7 % nationwide, and in the Olomouc region, even by 11.5 %. Decreased interest in accommodation services was proved a fact in our survey too, as a decline in visitor numbers was recorded by 62.5 % informants. However, what remains open to discuss is the fact that in the Olomouc region, most changes fit into the category of up to 30 % inclusively. Thus, we might conclude that there is a considerable deviation from the CSO figures.
As reported by the CSO, the worst decline in the Czech Republic was reported by five-star hotels, namely 13.5 %. On the contrary, the lowest decline was noted in boarding-houses. They maintained the lowest occupancy rate in all categories surveyed, namely 24.9 %. Owing to the Olomouc region comprising no five-star hotel, this survey will not allow to either confirm or reject the statement.
Another factor analysed within the present survey was the price modification across the crisis period. As a study by Mag Consultings showed, visitors tended to shorten their stays (the number of overnight stays fell by nearly 9 %), meaning they spent less money, accommodation service providers were made to lower the accommodation cost (Ihned, 2009). In some cases, luxury four-star hotels were sometimes known to offer accommodation starting from EUR 26.00 for a double room with breakfast (Bohatová, 2010).
No price reductions were proved in our survey. Mere 11.11 % of accommodation service providers reduced their fees for services between 2007 and 2011, with just a part of them doing this because of the fear of losing their clients. Conversely, 47.22 % of enterprises did not change their fees, and 41.67 % even raised their fees. The question is whether the increase in prices could have some influence in terms of the falling visitor numbers. No investigation of this was undertaken within the present survey.
In conclusion, we still have to consider the change in staff size which was proved for the period of 2007-2011. Nearly 20% of companies terminated jobs, while 11.11 % recruited new staff. Interestingly, despite the fact that across the Olomouc region, the prevailing trend for the unemployment rate has been increasing over a couple of last years, nearly 70 % of accommo-dation service providers were reported in our survey not to have opted for job reductions over the crisis period. In 2009-2010, the Olomouc region recorded an increase in the unemployment rate of approximate 2 % in a year-to-year comparison. Thus, one might assume this fact to show in our survey. Yet the contrary is true.

REDETE – ECONOMIC DEVELOPMENT AND ENTEREPRENEURSHIP IN TRANSITION ECONOMIES
96
If our considerations are limited to the tourism industry solely, the report by the international professional association World Travel and Tourism Council shows that in 2008-2010, almost 7 % of the 100,000 direct staff left the industry (ČTK, 2010). Again, we cannot say that our findings would relate to the other statements.
Reference list
1. Bohatová, V. (2010). Nad cestovním ruchem zataženo. (Overcast over tourism) http://m.cfoworld.cz/ostatni/nad-cestovnim-ruchem-zatazeno-44 (accessed 9.9.2012).
2. Česká tisková kancelář (2009). Dopady finanční krize na vybrané země. (Impact of the financial crisis on selected countries.) http://www.komora.cz/podpora-podnikani-v-cr/poma-hame-vam-celit-hospodarske-krizi/zpravodajstvi-ze-sveta/dopady-financni-krize-na-vybrane-zeme-.aspx (accessed 8.9.2012)
3. Český statistický úřad (Czech Statistical Office). http://www.czso.cz 4. Dorňák, O. (2009). Světová finanční krize: Co stálo na počátku? (Global financial crisis?
What was in the beginning?) (http://www.investujeme.cz/svetova-financni-krize-co-stalo-na-pocatku/ (accessed 9.9.2012)
5. Klímková, M. (2009). Podnik a štíhlá výroba jako jeden z možných přístupů řešení.“Velká deprese“ a její odraz v ekonomické teorii a praxi. (Business and slim production as a potential solution approach. „Great depression“ and its reflection in the economic theory and practice.) Ostrava, VŠB – Technická univerzita Ostrava.
6. Kovanda, L., Gallisti, V. (2008). Češi zapláčou příští rok. (Czech will cry bitterly next year) Týden. 15 (40), pp. 16-20.
7. Hornungová, J. (2009). Vliv „Velké deprese“ na činnost menších – rodinných firem. “Velká deprese“ a její odraz v ekonomické teorii a praxi. (The impact of „Great depression“ on activities of small family-run businesses.) „Great depression“ and its reflection in the economic theory and practice.) Ostrava, VŠB – Technická univerzita Ostrava.
8. Hospodářská komora ČR (Chamber of Commerce) (18. 5. 2009). Hotely ztratily počátkem roku meziročně 8,4 procenta hostů. (Czech Chamber of Commerce, 18 May 2009. Hotels lost 8.4 % guests in year-to-year comparison) http://www.komora.cz/regionalni-a-oborove-informace/oborove-informace-1/obchod-a-cestovni-ruch-1/informace-z-oboru-obchod-a-cestovni-ruch/hotely-ztratily-pocatkem-roku-mezirocne-8-4-procenta-hostu.aspx (accessed 3.9.2012)
9. Hospodářská komora ČR (Chamber of Commerce) (31. 5. 2009). Příjmy z příjezdové turistiky letos klesnou o pětinu. . (Czech Chamber of Commerce, 31 May 2009. Revenue from incoming tourism will drop by a fifth this year) http://www.komora.cz/regionalni-a-oborove-informace/oborove-informace-1/obchod-a-cestovni-ruch-1/informace-z-oboru-obchod-a-cestovni-ruch/mag-prijmy-z-prijezdove-turistiky-letos-klesnou-o-petinu.aspx(accessed 3.9.2012)
10. Ihned (2009). Kvůli krizi klesá zájem o cestování, nedaří se hotelům ani aerolinkám. (Due to crisis, less interest in flying, hotels and air face bad times) http://byznys.ihned.cz/zpravodajst-vi-cesko/c1-38451170-kvuli-krizi-klesa-zajem-o-cestovani-nedari-se-hotelum-ani-aerolinkam (accessed 3.9.2012)
11. Ihned (2010). Cestovní ruch čeká vlna propouštění, bude muset odejít sedm procent zaměstnanců.(Tourism faces a wave of redundancies, seven percent of staff will have to leave.) http://byznys.ihned.cz/zpravodajstvi-cesko/c1-41501780-cestovni-ruch-ceka-vlna-propousteni-bude-muset-odejit-sedm-procent-zamestnancu (accessed 9.9.2012)
12. Hospodářská krize (2008). http://www.hospodarskakrize.eu. (accessed 18.5.2011) 13. Langová, D. (2010). Masové propouštění už nehrozí, uklidňují personalisté. (No mass dismi-
ssals, HR people reassure). http://finance.idnes.cz/masove-propousteni-uz-nehrozi-uklidnuji-personaliste-pg8-/podnikani.aspx?c=A091229_1310611_zamestnani_bab (accessed 9.9.2012)

REDETE – ECONOMIC DEVELOPMENT AND ENTEREPRENEURSHIP IN TRANSITION ECONOMIES
97
14. Morávek, D. (2008). Krize od počátku až do současnosti. (Crisis, from the start till present) http://www.podnikatel.cz/clanky/krize-od-pocatku-az-do-soucasnosti/ (accessed 3.9.2012)
15. Musílek, P. (2008). Příčiny globální finanční krize a selhání regulace. (The causes for the glogal financial crisis and a failure of regulation). Český finanční a účetní časopis. 3(4), pp. 6-20. (accessed 10.10.2009).
16. Paroubek, J. (2009). Nezaměstnanost ukazuje hloubku hospodářské krize. (The unemployment proves the depth of the economic crisis.) http://blisty.cz/art/45765.html (accessed 9.9.2012)
17. Pendery, D. (2009). Three Top Economists Agree 2009 Worst Financial Crisis Since Great Depression; Risks Increase if Right Steps are Not Taken. <http://www.reuters.com/article/2009/02/27/idUS193520+27-Feb-2009+BW20090227> (accessed 28. 5. 2012)
18. Unihost (2009). Hospodářská krize v ČR. (Economic crisis in Czech Republic) http://www.unihostostrava.cz/www/cz/aktuality/hospodarska-krize-v-cr/#article_8728 (accessed 2.9.2012)
19. Zemánek, J. (2008). Hypoteční krize v USA. Příčiny, průběh, následky (2. Díl) (Mortgage crisis in the USA. Causes, course, consequences. Part 2). http://euroekonom.cz/analyzy-clanky.php?type=jz-usa-hypoteky2 (accessed 8.9.2012)
20. Zíta, D., Pavlíček, T., Rafaelová, L. (2011). Návštěvnost Česka pomalu roste. Cestovní ruch se dostává z krize. (Visitor numbers for the Czech Republic rise slowly. Tourism is getting away from the crisis). http://www.rozhlas.cz/zpravy/domaciekonomika/_zprava/navstevnost-ceska-pomalu-roste-cestovni-ruch-se-dostava-z-krize--849383 (accessed 3.9.2012)
This article is the outcome of the Student Grant Competition grant, project no. SGS9/2012
Světová krize a její dopady na cestovní ruch v Olomouckém kraji – The World Crisis and Its Impact on Tourism in the Olomouc Region.

REDETE – ECONOMIC DEVELOPMENT AND ENTEREPRENEURSHIP IN TRANSITION ECONOMIES
98
THE COMPETITIVE POSITION
OF BOSNIA AND HERZEGOVINA IN THE WESTERN BALKAN REGION
Sanja ALATOVIĆ35
Abstract
Despite the numerous scientific articles and research studies which have been published on the competitiveness of countries, a widely accepted and all-encompassing framework of analy-sis is still lacking. The “Theory of Competitive Advantage”, as developed by M. Porter (1990), is used by the World Economic Forum (WEF) as a framework by which the competitiveness of a state is assessed, and many of its principles ensure a reliable basis for evaluating the competiti-veness at both the regional and local level. To a large extent, this theory is based on the charac-teristics of the microeconomic business environment as seen through the prism of four attributes which, both individually and as a system, are referred to as Porter’s “Diamond of National Ad-vantage”. These factors include: factor conditions; conditions of demand; the connection and support of industries, as well as the strategies of firms; structure and rivalry.
The subject of the research as presented in this paper is the competitive position of Bosnia and Herzegovina in relation to the countries which make up the Western Balkans. According to the measurements of competitiveness which have been made by all relevant international orga-nizations, Bosnia and Herzegovina is one of the least competitive countries in Europe. It is evi-dent that the economic politics in the country do not respect the principles of international com-petitiveness which have led to a relative stagnation in development, as compared to other co-untries in the Western Balkans. It is asserted here that Bosnia and Herzegovina must develop, particularly by strengthening its existing institutional capacity, which is essential for ensuring competitiveness. This assumes that all levels of government as well as the business and acade-mic communities must work together in order to solve the tremendous challenges which Bosnia and Herzegovina faces in regional and global markets. Research that is carried out on the com-petitiveness of a single state emphasizes the connection between the macro and micro dimensi-ons of competitiveness, for not only does the total export capacity of one sector of industry refle-ct an overall success for individual firms, their dynamism and ability to compete, but the beha-viour and success of the firms are conditioned by the complex fusion of structural parameters which characterize the national environment in which they operate.
Taking into consideration the limited available resources which could have a direct effect on improving its competitive position, Bosnia and Herzegovina should consider development based on the cooperation of business clusters, primarily with neighbouring countries, when planning any future policies, especially industrial policy. A small country cannot become “a major pl-ayer” in the international market simply on the basis of the development of individual firms, ra-ther, an all-encompassing cluster is needed which provides economic development for the entire region.
Keywords: competitiveness, Porter’s theory, Bosnia and Herzegovina, Western Balkans, clu-ster initiatives
35 Office Coordinator for Brčko District in the Council of Ministers of Bosnia and Herzegovina, Trg BiH 1, 71000 Sarajevo,
Bosnia and Herzegovina, email: [email protected]

REDETE – ECONOMIC DEVELOPMENT AND ENTEREPRENEURSHIP IN TRANSITION ECONOMIES
99
1. Definition of competitiveness
Competitiveness as a conceptual definition represents a complex problem. Specifically, the va-rious forms of competition and competitiveness (natural and economic competition, price and non-price economic competition, competitiveness at the micro and macro level, national and international competitiveness, competitiveness based on comparative and competitive advantages, and other categorizations) are defined differently and have different specific meanings in particular economies (Leko – Šimić, 1999, p.77).
Competitiveness of a country is an area of economic theory, which analyses the facts and policies that shape the country's ability to create and maintain and environment that creates more value for enterprises and prosperity for its citizens (Garelli, 2009).
Also, in theory and practice, especially in the modern theory and practice, we find that the word competitiveness is very often replaced by words such as: absolute advantage, comparative advantage, revealed comparative advantage, market competence, etc.
Competitiveness can also be defined as a set of institutions, policies and factors that determine the productivity level of a country and it is most often observed at the level of national economies – countries, industry groups and branches and individual commercial entities – companies, or products (OECD, 1996).
Development of conceptual determination of competitiveness begins with economists Adam Smith and David Ricard. The theory of comparative advantages which was developed as the first comprehensive theory of international exchange by Adam Smith basically represents a critique of mercantilism. The postulate of this theory is the international division of labour and specia-lization, i.e. the absolute advantage is the ability of a country to produce a particular product with lower costs than another country or to achieve the lowest opportunity costs. Also, the countries go to international specialization in the production in which they have absolute advantages.
David Ricardo proceeds from the low mobility of factors of production, and mentions the need for each country to specialize and exports those goods in the production of which it is more efficient than other countries, and to import those goods the production of which it is less efficient than other countries.
In addition to these two theories of advantage, there are other theories found in the literature, such as the Heckscher-Ohlin theory of production factor of proportionality, Heckscher-Ohlin-Samuelson theory of international trade, Linder's theory of demand, and Krugman’s theory of market imperfection and economies of scale, Werner's theory of international product life cycle....
2. Porter's theory of national competitive advantage
At the present time, when modern global economy is too complex to be explained by traditi-onal theories that are significant, but not the subject of this paper, a new theory of competitiveness developed by M. Porter assumes that national prosperity is not inherited but created by strategic choices (Porter, 1990). This means that in recent years the international competitiveness derives from advanced factor conditions based on knowledge and developed infrastructure, high technology and innovations, as opposed to the past where the country's development was based on comparative advantages such as cheap labour force and natural resources.
Namely, in the defining of the theory of national competitive advantage, Porter has identified four basic determinants of competitive advantage in a country which represents a complex system. Naturally, this system is dynamic and evolving, and one determinant influences the other.
Porter named the defined components of the system of determinants of competitive advantage
of a country The diamond of national advantage, which includes:

REDETE – ECONOMIC DEVELOPMENT AND ENTEREPRENEURSHIP IN TRANSITION ECONOMIES
100
- Factor conditions (human and physical resources, knowledge resources, capital resources, infrastructure)
- Demand conditions (composition or nature of customer needs, the size and structure of the growth of demand in the domestic market, mechanisms through which local preferences are transmitted to foreign markets)
- Related and supporting industries (related industries include industrial sectors where companies can perform the same activity for several branches or transfer knowledge from one sector the another, and suppliers of the company)
- Firm strategy, structure and rivalry (conditions in the company's host country, which help or hinder the creation and maintenance of its international competitiveness, and Porter emphasizes that no form of management, ownership or operational strategy is universally appropriate but it depends on the situation).
In addition to these four factors, Porter takes two more factors in consideration of competitive advantages of a country, such as chance which includes the events out of the company's influence and refers to a set of circumstances in the environment, the state, government and their policy which has a strong impact on the competitive advantage of countries.
3. The most important methodologies of international ranking of competitiveness by the relevant institutions
Among the most famous models to measure international competitiveness there is the one that was established by the World Economic Forum – The Global Competitiveness Report. These reports have been identified by investors and creators of economic as reference studies in the field of international competitiveness. Also, these reports cover a large number of countries and provide a good picture regarding the position of the domestic economy, and comparison with other countries in the region and the world.
The World Economic Forum bases the competitiveness analysis through the GCI – Global Competitiveness Index, which includes micro and macro-economic grounds of national compe-titiveness (Sala-I-Martin, Blanke, Drzeniek, Geiger, Mia and Paua, 2007, pp. 3-50). This index tracks the various components that are grouped into 12 pillars of competitiveness, as follows:36
1. Institution 2. Infrastructure 3. Macroeconomic environment 4. Health and primary education 5. Higher education and training 6. Goods market efficiency 7. Labour market efficiency 8. Financial market development 9. Technological readiness 10. Market size 11. Business sophistication 12. Innovation
It should be noted that, according to GCI, every country goes through three stages of deve-lopment. In the first phase, called Factor - driven stage, well-functioning of public and private institutions, well-developed infrastructure, a stable macroeconomic framework and sound and on the basic foundations educated labour force are important for the growth of productivity. 36 Competitiveness 2011-2012 Bosnia and Herzegovina, Federal Institute for Development Programming, Sarajevo, October,
2011.

REDETE – ECONOMIC DEVELOPMENT AND ENTEREPRENEURSHIP IN TRANSITION ECONOMIES
101
Efficiency – driven stage is the next stage in the development of a country where the country achieves more efficient production processes and product quality. This stage assumes higher education and professional training, efficiency of goods and labour market, developed financial market, technological strength and developed domestic and foreign markets.
The third stage called Innovation – driven stage assumes that the competitiveness is conditi-oned by factors of high business sophistication and innovation.
Also, the World Economic Forum pays special attention to the more complete integration of the concept of sustainability, which is the subject of attention of economic policy creators, the business community and the public. The Sustainable Competitiveness Index – SCI was introduces in its preliminary version and covers 100 economies for which data were collected (The Global Competitiveness Report, WEF, 2011-2012) which account for the factors of competitiveness that maintain a long-term high level of competitiveness of the economy and society, and this Index includes all the elements that are already covered by GCI, and a number of additional indicators such as social cohesion, environment policy, resource efficiency, renewable resources management and the environment deterioration. GCI index represents a short-term and medium-term view of the future, while SCI represents a long-term view in a period of 20 years, and this approach enables to highlight the relationship between the competitiveness and sustainability.
In 2008, Porter and his associates founded the New Global Competitiveness Index – NGCI, which focuses on the determinants of the productivity level that the economy can sustain, and in calculating of NGCI, public data and a unique questionnaire are used, but through a new and more robust conceptual structure using more rigorous methodology. (Savić and Pitić, 2010).
Here we should note other institutions engaged in research and measuring of the level of com-petitiveness of national economies.
International Institute for Management Development (IMD) publishes The World Compe-titiveness Yearbook (WCY) which consists of two approaches: global ranking that provides a systematic evaluation of the competitiveness, and the profile of the competitiveness of a country that shows how the country is improved and specialized.
The model developed by the World Bank includes 49 indicators that allow a relatively quick assessment of economic performance of the national economy, as well as of the environment for competitive growth, but related to the development of business activities in a country. A similar method of measuring competitiveness that focuses on regulations related to business activities is conducted by the Heritage Foundation.
The Index of competition policy that is published by the European Bank for Reconstruction and Development (EBRD) is available to so-called “transition countries”.
Also, the world knows the studies of competitiveness through the Global Entrepreneurship Monitor – GEM which is based on the data collected by the Adult Population Survey, National Expert Survey, Global Competitiveness report, UN, OECD, World Bank, IMF, ILO, and the Annual National Report...
What is common to all these studies is that in determining the position of a country, in addition to hard statistical indicators, specially designed questionnaires, so-called soft data, are used in order to measure those factors of competitiveness that are not available from statistic data, and are mainly related the efficiency and independence of the judiciary, tendency to innovation, quality of corporate governance, corruption and the influence of the state on business in a particular country (Lovrinčević, Mikulić and Rajh, 2008, p.606).
4. Position of Bosnia and Herzegovina in international competitiveness ranking
In the latest report on competitiveness 2012-2013 (World Economic Forum, 2012), Bosnia and Herzegovina takes 88th position with 3.93 points out of possible seven among 144 ranked coun-

REDETE – ECONOMIC DEVELOPMENT AND ENTEREPRENEURSHIP IN TRANSITION ECONOMIES
102
tries. Compared to the last year's ranking, when it has 3.8 points, Bosnia and Herzegovina has progressed by 12 positions.
The Global Competitiveness Index 2012-2013, World Economic Forum
According to Porter's development stages, Bosnia and Herzegovina is in the Efficiency driven stage, which means that the competitiveness pillars Higher education and training, Goods market efficiency, Labour market efficiency, Financial market development, Technological readiness and Market size have relatively greater importance for the economy competitiveness at that level than other pillars.
According to assessments from the Report, the most problematic factors for doing business in Bosnia and Herzegovina, like in the last year's report, relate to Access to financing (17.2), Policy instability (11.9), Tax rates (11.7), Government instability/coups (11.5), Inflation (11.1), Tax regulations (7.2), Inefficient government bureaucracy (6.4), Foreign currency regulations (4.9), Corruption (3.8), Restrictive labour regulations (3.2), Insufficient capacity to innovate (2.8), Poor work ethic in national labour force (2.7), Inadequate supply of infrastructure (2.3), Crime and theft (1.7), Inadequate educated workforce (0.9) and Poor public health (0.5).
According to the World Bank's report, Bosnia and Herzegovina is ranked as 125th of 183 com-pared economies, because the World Bank ranks the economies according to the degree of adjusting of the business environment to investors, and examines regulations on starting of a business venture, obtaining of building permits, getting electricity connections, registration of property, obtaining credits, the level of protection of investors, paying taxes, foreign trade, the level of contract implementation and solvency. Analysis of individual criteria shows that BiH has the worst rank in terms of obtaining of building permits and start-up of business. (The Centre for Policy and Governance, 2011).
Many analyst find the „statistics guilty“ for such a high jump of 12 positions, because they consider the statistic data in Bosnia and Herzegovina are still “not reliable“. When it comes to specific areas, it is evident that the greatest progress is recorded in the field of Innovation where BiH moved from 104th position to 80th position, and in the field of Institution where it replaced its last-year's 109th position with 85th position this year.

REDETE – ECONOMIC DEVELOPMENT AND ENTEREPRENEURSHIP IN TRANSITION ECONOMIES
103
The latest ranking of the competitiveness, which shows the progress of 12 positions compared to perennial backsliding on those lists, leads to the conclusion that the country has really progre-ssed economically in the previous period and that the system is more efficient. However, is it rea-lly so?
According to some interpretations of the representatives of the Foreign Trade chamber of Bos-nia and Herzegovina, the explanation is that, if you get into the analysis of the indicators in which Bosnia and Herzegovina has shown the best results, we can conclude that it does not match the facts, because, i.e. the best ranking is in the category of health care and primary education... One of the indicators contained in that is, for example, the number of people affected by malaria, something that is the elementary health care, where Bosnia and Herzegovina has a high rating only because there are no such diseases and because some countries, primarily African, have not reached that elementary level yet. (Gavran, 2012).
Based on the above, and based on all international ratings, the fact is that Bosnia and Herzego-vina has no an enviable competitive position. Although the progress is evident, it should be re-membered that there are still poor indicators in the key issues that are essential for the economy, such as Macroeconomic environment, Infrastructure, Goods market efficiency, Financial market development, and Business sophistication, which show what is the future of economic develop-ment of the country and what are the business conditions.
According to the Report – Enlargement Strategy and Main Challenges 2011 - 2012 that is pub-lished by the European Commission, Bosnia and Herzegovina has made little further progress to-wards establishing of a functioning market economy. The emphasis is on the need to continue wi-th significant reform activities to make the state capable deal in long-term with the pressure of competition and the market. It was concluded that the financial and monetary stability has been preserved, that the Currency Board arrangement still enjoys great credibility, and that there have been some improvements in the business environment, especially when it comes to the registering of companies and simplifying of administrative procedures in general. The quality of public finance is still at a low level, with a high share of current expenditures in GDP. There has been a growth in foreign imbalances, in particular the current account deficit, and inflation. The business environment is still affected by administrative inefficiency and the weak rule of law. There was no progress in the planned privatization, restructuring of public enterprises and the liberalisation of network industries. Production capacities and economy competitiveness are still low, since the domestic sources of growth have not been used appropriately, and the unemployment rate remains high.
Like last year, Switzerland is still in 1st position by the criteria of global competitiveness, while Singapore is in 2nd, and Finland in 3rd, having replaced Sweden which was in that position in the last-year's report.
5. Competitive position of Bosnia and Herzegovina in the region of Western Balkans
The Western Balkans is a traditionally weak region, which does not have enough industrial products for export and simultaneously struggles with highly indebted private sector. Given the political instability, the increases interest rates and a relatively high indebtedness, the region is more and more behind the dynamic economies of Eastern and Central Europe.
In the latest report on competitiveness 2012-2013 (World Economic Forum, 2012), Croatia is in 81st position and it regressed five positions compared to the last-year's report. However, it is stated that Croatia is in the Transition phase, i.e. transitional phase between the Efficiency driven and Innovation driven. The most problematic factors for doing business have been identified as Inefficient government bureaucracy, Corruption, Access to financing, Restrictive labour regula-tions, tax rates...

REDETE – ECONOMIC DEVELOPMENT AND ENTEREPRENEURSHIP IN TRANSITION ECONOMIES
104
Serbia is in the 95th position in the latest Report, as in the previous year. Serbia is also in the Efficiency driven phase, and the most problematic factors for doing business, like in Croatia, are Inefficient government bureaucracy, Corruption, Access to financing, Foreign currency regula-tions, Tax rates...
Macedonia (FYR) has regressed 1 position compared to the last year and is now in 80th position. It is also in the Efficiency driven phase, and in Macedonia the most problematic factors for doing business have been identified as Access to financing, Inadequately educated workforce, Corruption, Inefficient government bureaucracy, Inadequate supply of infrastructure...
Montenegro regressed by 12 positions and is now in 72nd position, as opposed to last year when it was in 60th position, and according to GCI 2010-2011 it was in 49th position. It is also still in the Efficiency driven phase. The most problematic factors for doing business were ide-ntified as Poor work ethic in national labour force, Inefficient government bureaucracy, Go-vernment instability/coups, Inadequately educated workforce, Inadequate supply of infrastru-cture...
Albania is in 89th position, as opposed to last year when it was in 78th position. It is also in the Efficiency driven phase, and in Albania, the most problematic factors for doing business are Access to financing, Corruption, Inefficient government bureaucracy, Tax regulations, Policy instability...
Ranking of BiH and Western Balkan countries per the total number of ranked countries37
2004 (104)
2005 (117)
2006 (125)
2007 (131)
2008 (134)
2009 (133)
2010 (139)
2011 (142)
2012 (144)
BiH 81 95 89 106 107 109 102 100 88 Albania - 100 98 109 108 96 88 78 89 Montenegro 89 80 87 - 65 62 49 60 72 Croatia 61 62 51 57 61 72 77 76 81 Macedonia(FYR) 84 85 80 94 89 84 79 79 80 Serbia 89 80 87 - 85 93 96 95 95
It should also be noted that all the Western Balkan countries (except Albania) in 2010 has the
GDP level around or below the level of the far 1989. According to the Transition Report 2010, Albania had the BDP even about 72% higher than in 1989, because 1989 was extremely poor, while Croatia and Macedonia has approximately the same BDP level, and Serbia, Bosnia and Herzegovina and Montenegro a considerably lower level of BDP in 2010 twenty-one years ago. (EBRD, 2010).
Comparative indicators for the Western Balkan countries by key indicators according to The Global Competitiveness Index 2012-2013
Country Population
(millions) (2011) GDP (US$ billions)
(2011) GDP per capita (US$)
Albania 3.3 12.8 3.992 BiH 3.9 18.0 4.618 Croatia 4.6 63.8 14.457 Serbia 10.2 45.1 6.081 Macedonia (FYR) 2.1 10.3 5.016 Montenegro 0.6 4.5 7.317
37 Competitiveness 2011-2012 Bosnia and Herzegovina, Federal Institute for Development Programming, 2011 and The
Global Competitiveness Index 2012-2013, WEF
REDETE – ECONOMIC DEVELOPMENT AND ENTEREPRENEURSHIP IN TRANSITION ECONOMIES
105
The Table above shows that the Western Balkan countries have a population of about 24.7 mi-llion inhabitants. The highest GDP was generated by Croatia with 63.8 million US$, followed by Serbia with 45.1 million US$, Bosnia and Herzegovina with 18.0 million US$, Albania with 12.8 million US$, Macedonia with 10.3 million US$ and as the last Montenegro with 4.5 US$.
In terms of GDP per capita generated in 2011, Croatia recorded the best results with 14.457 US$, followed by Montenegro with 7.317 US$, Serbia with 6.081 US4, Macedonia with 5.016 US$, Bosnia and Herzegovina with 4.618 US$ and in the last place Albania with 3.992 US$.
According to the World Bank, poverty also grows in the countries of South Eastern Europe. In these countries, according to the estimates of the World Bank, 7.8 per cent of the population suffers from extreme poverty and lives daily with less than 2.5 dollars. It is difficult, however, to evaluate the impact of financial crisis on poverty in these countries, since data on this are not fully accessible. An economically difficult year is ahead of the Western Balkan countries, with a note that the unemployment rate in the region is on average 23 per cent, which is twice more than in the EU countries“. (World Bank, Poverty Reduction and Economic Management Unit, 2012).
It should also be noted that the Western Balkan countries consisting of Croatia, Bosnia and Herzegovina, Serbia, Montenegro, Macedonia (FYR) and Albania have a special institutional arrangement with the EU until the creation of conditions for their membership, which was confirmed by the European Council, and in the Thessaloniki Agenda 2003.38
The handicap of these countries is that they have underdeveloped economies with great diffi-culties in transition and deep traces of disintegration of former SFRY, all of which had distimu-lated possible earlier possibilities of establishing of economic ties, which could have had a more effective impact on all countries, having in view a high interdependence of economies that they had in the former common country.
Also, after the failure of Washington Consensus39, possible opportunities for establishing of economic ties were distimulated, as well as the beginning of the world economic crisis, which caused the recession and led to a serious decline in global aggregate demand. Since the beginning of the transition, these countries have opened their economies, which proved to be a bad solution because the weak economies were suddenly exposed to market liberalization and foreign competition, and became highly import- and export-dependent countries. An unfavourable fact is that due to the high political risk, these countries have failed to attract more significant foreign investments.
6. Cluster initiatives in the Western Balkans region as a significant factor in improving competitiveness
A number of economic indicator, including the perceived factors that most influence the (non) competitiveness of six Western Balkan countries, show that these countries have numerous economic and political similarities. Except Croatia, GDP per capita is relatively low, they are all highly export- and import-dependent due to high liberalisation that they have joined in the early stages of transition, and the economic structure is relatively similar. The countries are faced with 38 Thessaloniki Agenda for Western Balkans: Moving towards European integration is a document that the countries in the
stabilisation and accession process (Albania, Bosnia and Herzegovina, Montenegro, Croatia, Macedonia, Serbia and Kosovo under the UN Resolution 1244/99) have accepted and committed to implement at the Thessaloniki Summit 2003. This document envisages the introduction of a series of new instruments and forms of cooperation between the European Union and countries of the stabilisation and accession process, that are based on experience of previous enlargement cycles (the fifth enlargement cycle) with meeting of determined requirements.
39 In the beginning of nineties of the last century, the former socialist countries in reforming of their economies were proposed to lead the economic policy under the principles of so-called Washington Consensus signed by the IMF and the World Bank. Although this package of measures has caused a big damage to the countries in transition in Latin America, this concept was accepted by the governments of the most European transition countries.

REDETE – ECONOMIC DEVELOPMENT AND ENTEREPRENEURSHIP IN TRANSITION ECONOMIES
106
underdeveloped institutions, with high unemployment rates, significant deficits in trade and payment balances, with a high dependence on foreign capital inflow.
Using of new thinking about development could serve as the basis for designing of new development policies for the Western Balkan countries. Although Croatia enters the European Union in 2013, other Western Balkan countries that have signed the trade agreement CEFTA40 will be faced with corresponding tariffs, especially in the non-competitive areas, such as food production and production of products of plant and animal origin.
In this sense, and taking into account the fact that national border are becoming less important, one of the solutions for improvement of economic relations and competitiveness of the Western Balkan countries could be cluster initiatives of producers from those countries. National development needs should result from the knowledge of the countries themselves, and a clearly defined development strategy, with recognising of the competitive advantages of the local area, is crucial.
Clusters are „geographic concentrations of interconnected companies, specialised suppliers, service providers, companies in related industries and related institutions that mutually compete, but also cooperate “(Porter, 2000). Cluster initiatives help the regions to manage their own econo-mic development, and also encourage the communities to focus their efforts on existing industries and represent an additional incentive to the governments and all other public institutions to engage in the promotion of cluster policies.
Bearing in mind the limited available resources, Bosnia and Herzegovina should, in any scenario of future industrial development, consider the cluster-based development, as a small cou-ntry cannot become a world player on the basis of the development of individual enterprises, and a comprehensive cluster approach to economic development is required (Export Council of BiH, 2011).
As already pointed out, Bosnia and Herzegovina according to the level of development of competitiveness has been classified into the group of the countries in the Efficiency driven stage, one of the key factors in the transition into the Innovation driven stage, as the next stage of competitiveness development, relates to the economy clusterisation level.
Clusters are one of the key forms in establishing of economic stability and prosperity in a country, as in the strategy of competitive advantage the clusters increase productivity, the possi-bility of innovation and stimulate new business forms and expansion of the existing range of clusters. Also, the importance of building interregional and transnational clusters is crucial to respond to global competitive challenges. (Conference of the European Cluster Alliance “Pro Inno Europe”, Stockholm, 2008).
This all leads to the conclusion that the key gaps and constraints in a still low level of cluster development, both within each country and especially in the region, are as follows: deficiency and lack of a clear and coherent cluster policy and strategy, the lack of cooperation between business and educational and research institutions, the lack of cooperation between the public and private sectors, as well as forming of a chain of cluster values.
Therefore, cluster initiatives can be an important component of improving the competetiveness of BiH, as well as of other Western Balkan countries. However, an analysis of the existing clusters in BiH indicates that the level of cluster development remains unnoticed. A small number of enterprises is involved in the work of clusters, and a similar situation exists in other Western Balkan countries, except for Croatia which has completed the cluster mapping and adopted the document Strategy of Clusters' Development in the Republic of Croatia 2011 – 2020, and for
40 CEFTA (Central European Free Trade Agreement) as a multilateral trade agreement which improves the regional, and
especially the economic cooperation, in 2006, Bosnia and Herzegovina, with eight other countries (Albania, Bulgaria, Croatia, Macedonia (FYR), Moldavia, Montenegro, Romania, Serbia and UNMIK/Kosovo under the UN Security Council Resolution 1244, became a member of CEFTA. As of 1 January 2007, Bulgaria and Romania are the EU members and thereby they left CEFTA. See: www.ceftaportal.com

REDETE – ECONOMIC DEVELOPMENT AND ENTEREPRENEURSHIP IN TRANSITION ECONOMIES
107
Serbia which made the plan for multi-annual program for cluster development support in 2006 and already has 25 clusters. (Savić and Pitić, 2010, p.147).
7. Conclusion
Raising the level of competitiveness has to be basic idea in implementing measures of eco-nomic policy of Bosnia and Herzegovina. According to authors who wrote about competitiveness, primary task of policy creators in every country is to create a competitive environment that attra-cts foreign companies, promotes learning, transfer of technologies, supports emergence of small and middle-sized enterprises and develops institutions which facilitate export and quality place-ment of products at the market. Bosnia and Herzegovina must develop new ones, and actively use already existing capacities necessary for competitiveness management.
To raise the competitiveness of a country, it is necessary to involve factors which would jointly influence it, and which create macroeconomic, i.e. microeconomic business environment. Accor-ding to measurements of competitiveness carried out by all relevant international organizations, Bosnia and Herzegovina is one of the least competitive European countries, so it is evident that economic policies in the country do not respect principles of international competitiveness what reflects in relative backwardness in relation to other West Balkans countries, although the whole West Balkans region, during past years has not had registered successes which relate to significant improvement of factors which influence the competitiveness of a country. Taking into conside-ration historical, geographical and cultural factors, and perceived similar resource constraints in all West Balkans countries, which influence the improvement of a competitive position, the de-velopment based on a cluster regional initiatives, may become important element of the economic stability of the region.
Reference list:
1. Competitiveness 2011-2012 Bosnia and Herzegovina. (2011). Federal Institute for Develop-ment Programming. Sarajevo. www.fzzpr.gov.ba (accesed 15.08.2012)
2. De Soto, H. (2000). The Mustery of Capital. New York: Basic Books 3. Draft BiH Growth Strategy 2012-2015. (2011). Export Council of BiH 4. European Innova. www.europe-innova.eu (accessed 04.09.2012.) 5. Fischer, S. (1993). The Role of Macroeconomic Factors in Growth. Journal of Monetary
Economics, 32 (3), pp. 485-512 6. Garelli, S. (2009). The Fundamentals and history of competitiveness. IMD World Competiti-
veness Yearbook 7. Gavran, I. (2012). BiH napredovala na listi konkurentnosti, Klix biznis, www.klik.ba/ biznis/-
news (accessed 06.09.2012.) 8. Leko – Šimić, M. (1999). Međunarodna konkurentnost hrvatskog gospodarstva u okruženju
tranzicijskih zemalja srednje i istočne Evrope. Tržište. Ekonomski fakultet Osijek. (11), pp.77 9. Lovrinčević, Ž., Mikulić, D. and Rajh, E. (2008). Usporedba metodologije mjerenja konku-
rentnosti nacionalnog gospodarstva i položaj Hrvatske. Zbornik radova 15. Tradicionalnog savjetovanja Hrvatskog društva ekonomista:Ekonomska politika Hrvatske, p.606
10. OECD. (1996). Technology, Productivity and Job Creation. Paris 11. Porter, M.E. (1990). The Competitive Advantage of Nations. The Free Press, New York 12. Porter M.E. (2000). Location, Competition and Economic Development: Local Clusters in a
Global Economy. EconomicDevelopment Quaterly, 14(1), pp.15-30 13. Porter M.E. (2003b). The Economic Performance of Regions. Regional Studies. Vol.37, No
6/7, pp.549-578 14. Sachs, J. (2005). The End of Poverty. New York:Penguin

REDETE – ECONOMIC DEVELOPMENT AND ENTEREPRENEURSHIP IN TRANSITION ECONOMIES
108
15. Sala-I-Martin, X., Blanke J., Drzeniek M., Geiger T., Mia I and Paua F. (2007). The Global Competitiveness Index: Measuring the Productive Potential of Nations. The Global Competi-tiveness Report 2007-2008. Geneve: World Economic Forum, pp. 3-50
16. Savić, N. Pitić, G. (2010). (ed.) Kuda ide konkurentnost Srbije? FEFA. Beograd, pp. 11-35, p.147
17. The Centre for Policy and Governance. (2011). Analysis of the Competitiveness of Bosnia and Herzegovina in the Contex of the EU Accession Process. www.cpu.org.ba (accessed 06. 08. 2012.)
18. The Global Competitiveness Report 2011-2012. (2011). Geneve: World Economic Forum 19. The Global Competitiveness Report 2012-2013. (2012). Geneve: World Economic Forum,
pp.86, 112, 146, 240, 262, 312 20. Transition Report 2011. (2011). EBRD, www.ebrd.com/transitionreport (accessed 02.09.2012) 21. Transition Report 2010. (2010). EBRD, www.ebrd.com/transitionreport (accessed
01.09.2012.) 22. Western Balkans Policy Review. (2010). Center for Strategic and International Studies.
Washington, D.C. 23. World Bank. (2012). PREM Network, Poverty Reduction and Economic Management Unit.
www.worldbank.org (accessed 02.09.2012.)

PART TWO:
Entrepreneurship, Innovation, Entrepreneurship Infrastructure
REDETE – ECONOMIC DEVELOPMENT AND ENTEREPRENEURSHIP IN TRANSITION ECONOMIES
110
INNOVATION-ORIENTED ENTREPRENEURSHIP AND SOCIO-ECONOMIC DEVELOPMENT
Katja CRNOGAJ41
Miroslav REBERNIK
Abstract
Although the importance of entrepreneurship for economic development is widely recogni-zed, many disagreements exist on the links between entrepreneurship and economic growth and socio-economic development. Opinions vary on the appropriate factors that influence entrepre-neurship processes, how they influence them, and differences between countries as well as the most efficient methods and measures for improving the entrepreneurial potential. This paper aims to determine whether and to what extent the link among entrepreneurship, economic gro-wth, and social progress differs between developed and less developed countries and what po-licy-making suggestions can be made. A longitudinal analysis enabled us to study different areas and the dynamics of change in successive time periods. We focused on particular data that provide information about individuals and countries and examined the impact of entrepreneurial activity (total early-stage entrepreneurship) and its quality (innovation-oriented entrepreneurship) in a sample of 24 high- and low-income countries.
We determined that the effect of entrepreneurial activity on economic growth significantly depends on time period and achieved development stage. Accordingly, governmental measures cannot be the same for all countries; rather, they have to be adjusted to the specific level of national economy development and depend on the entrepreneurship type we wish to promote. Although entrepreneurial activity most explicitly reflects on the GDP as a measure of economic growth, the increase in the quantity of material goods does not always sufficiently fulfill the conditions for the progress of the national economy. In developed economies, the scope of early entrepreneurial activity is also a determinant of personal (human) development, whereas gro-wth and development are mostly fuelled by early entrepreneurs, who approach entrepreneur-ship with the mindset of developing and implementing innovation and change.
Keywords: entrepreneurial activity, innovativeness, economic growth and social developme-nt, entrepreneurship policy
41 University of Maribor, Faculty of Economics and Business, Institute for Entrepreneurship and Small Business Manage-
ment, Razlagova 14, 2000 Maribor, Slovenia, [email protected]; [email protected].

REDETE – ECONOMIC DEVELOPMENT AND ENTEREPRENEURSHIP IN TRANSITION ECONOMIES
111
1. Introduction
Measuring and comparing entrepreneurship in an international capacity and over time is a cha-llenging endeavor. Entrepreneurship is recognized as a complex phenomenon involving indivi-duals, firms, and the environment in which it occurs (Wennekers and Thurik 1999). Neither the environment-centric nor the individual-centric approach toward entrepreneurship is more “corre-ct” than the other (Shane 2003, p. 3). Therefore, it is important to accurately understand influen-tial entrepreneurship factors at different levels before establishing a more holistic framework, which positions entrepreneurship in the core of the competitiveness of a given national economy. According to Venkataraman (1997) and Shane and Venkataraman (2000), entrepreneurship is “an activity that involves the discovery, evaluation and exploitation of opportunities to introduce new goods and services, ways of organizing, markets, processes, and raw materials through organizing efforts that previously had not existed.”
The examination of entrepreneurship outcomes, where the focal point is entrepreneurial active-ty’s influence on economic growth, which translates into stable and sustainable economic and so-cial development, is also complex. According to Caree and Thurik (2003, p. 465), entrepreneur-ship generates growth because it serves as a vehicle for innovation and change and, thus, as a conduit for knowledge spillovers. In a regime of increased globalization, entrepreneurrship not only plays a more important role, but also generates growth. As Audretsch (2007, p. 65) pointed out, entrepreneurship is the missing link between investments in new knowledge and economic growth, making it an important mechanism that permeates the knowledge filter, facilitating the spillover of knowledge and ultimately generating economic growth. Although economic growth has a short-term orientation aimed at quantitative changes in the economy, economic development has a long-term orientation aimed at qualitative changes in society in general (Todaro 2000). As many indicators of economic growth (e.g., GDP) have a limited explanatory power, the research framework must be expanded by also considering indicators of social progress.
Only through a holistic definition and broader understanding can we identify important areas of political decision making that are necessary for the promotion of entrepreneurship and com-petitiveness at the national level. Politics can importantly co-form the environment in which business decisions are made, which requires a whole package of goal-oriented conditions. When forming the relevant foundations for entrepreneurial policymakers, we consider the multidimen-sional framework and use appropriate measurement tools and data sets that allow for a longitu-dinal comparison between countries to contribute to the existing knowledge base. To provide a clearer picture of interdependence between entrepreneurship and socio-economic progress, innovation-oriented entrepreneurship provides the core of our investigation to highlight differ-rences between developed and less developed countries.
2. Theoretical background and hypotheses
Various studies have confirmed the positive outcomes of entrepreneurial activity, leading national policymakers to become increasingly aware of the importance of promoting innovation and entrepreneurship or at least improving the business environment in order to confront new economic, social, and environmental challenges (e.g., Hart 2003; Lundström and Stevenson 2005; OECD 2005). Governments increasingly consider entrepreneurship and innovativeness to be the cornerstones of a competitive national economy and representative of something that can be pursued in two ways (Rebernik et al. 2010): engaging creative individuals in entrepreneurial activities to build new companies and enabling established companies to achieve quality growth and higher development. Insights into the relationship between entrepreneurship and economic development across countries are especially important for policymakers as they provide them with a beacon for their endeavors. Insights into the two revolutions driving the reemergence of entrepreneurship are especially valuable. First, the rise of self-employment is important because it

REDETE – ECONOMIC DEVELOPMENT AND ENTEREPRENEURSHIP IN TRANSITION ECONOMIES
112
increases the flexibility and productivity of the economic system and contributes to a higher degree of job satisfaction, although it also increases insecurity and income inequality for those involved. Second, the upward trend of innovative and/or ambitious entrepreneurship is of particular importance for competitiveness, economic growth, and job creation (Wennekers et al. 2010, p. 4).
Several research projects are now under way at the World Bank (WB), the Organization for Economic Cooperation and Development (OECD), and the Global Entrepreneurship Monitor (GEM) to measure the business formation process across countries (Acs and Szerb 2011, p. 2). Our understanding of the specific role of entrepreneurship in economic growth limits the use of various entrepreneurship measures and economic contexts in which economic growth occurs. Therefore a wide range of literature shows (Capelleras et al. 2008) that the fundamental and central question of how and if the government can positively affect entrepreneurial activity remains mostly unanswered.
Understanding entrepreneurship in one's own country means comparing it with others while being aware of the fact that entrepreneurship has different effects with regard to individual national economic development phases. According to Porter (2002), we can differentiate among factor-driven economics, where development is based on exploiting basic natural resources; efficiency-driven economics, where the development is based on an efficient exploitation of these resources; and innovation-driven economics, whose development is based on innovations. Such a variety in the development of national economics brings about numerous characteristics with re-gard to making decisions about pursuing an entrepreneurship career, entrepreneurship develop-ment, and competition among companies in different environments.
Furthermore, no single indicator can capture something as complex as society. In previous studies on the role of entrepreneurship in economic growth and development, gross domestic product (GDP) has been the most widely used measure of economic activity. International standards exist for its calculation, and much thought has gone into its statistical and conceptual bases. Yet GDP measures primarily market production, although it has often been treated as if it were a measure of economic well-being. Conflating the two can lead to misleading indications about how well-off people are and entail the wrong policy decisions (Stiglitz et al. 2009). Quality of life includes the full range of factors that makes life worth living, reaching beyond its material side, and thus must be taken into account at this point.
The theoretical and empirical evidence reviewed thus far leads to the following hypotheses:
Hypothesis 1: The impact of entrepreneurial activity on macroeconomic growth is significantly
dependent on the achieved development level of the country and time.
According to previous empirical research examining entrepreneurship at different stages of economic development (e.g., Audretsch et al. 2002; Caree et al. 2002; Van Stel et al. 2005; Acs and Varga 2005; Wennekers et al. 2005), entrepreneurship plays a minimal role in less developed countries but on the higher levels of development when institutions become stronger, more and more entrepreneurial activity is shifted toward productive entrepreneurship, thereby strengthening economic development (Acemoglu and Johnson 2005). Similarly, some researchers have shown that entrepreneurship unlocks economic development only if proper institutional settings are in place (Baumol 1990; Boettke and Coyne 2003; Powell 2008; in Stam et al. 2011). Within this context, we might expect that entrepreneurship is always important as it ensures and enables development; yet its importance and influence differ according to an economy’s individual development stages.
Hypothesis 2: The contribution of innovation-oriented entrepreneurship to macroeconomic
growth is more important in the case of entrepreneurship in general.

REDETE – ECONOMIC DEVELOPMENT AND ENTEREPRENEURSHIP IN TRANSITION ECONOMIES
113
The entrepreneurial process is too complex to rely on a limited number of businesses or the prevalence rate of individuals engaged in entrepreneurial activity. In addition to measuring the inclusion of the adult population in entrepreneurship and their demographic characteristics as well as basic framework conditions, it is necessary to study the innovative orientation of business among others (Rebernik et al. 2009, p. 15). Understanding innovative orientation is important as it provides a reference frame through which the company’s competitive potential and opportunity to compete with other companies from different environments, which is particularly important when increasing business globalization, can be determined. We expect that the level of innovative-oriented entrepreneurship in a country is a more relevant driver of economic growth than entre-preneurship in general.
Hypothesis 3: Along with macroeconomic growth, entrepreneurship is positively related to
human development in the long run.
For more than a half century, the most widely accepted measure of a country’s economic pro-gress has been changes in its GDP. By measuring only marketed economic activity, GDP ignores changes in the natural, social, and human components of the community capital on which the community relies for continued existence and well-being. As a result, GDP not only fails to mea-sure key aspects of quality of life, but also in many ways encourages activities that are counter to long-term community well-being (Costanza 2009). Most empirical studies linking entrepreneur-ship to economic development and economic growth have used GDP as a measure of economic performance. However, entrepreneurship’s effect on human development among those involved in entrepreneurial activity as well as other individuals within the national economy remains less explored. Therefore, we provide some new empirical evidence with respect to linking entrepre-neurship and well-being in the long run.
3. Empirical analysis
3.1 Data and methods
For the empirical analysis, we used data from a sample of 24 countries42 participating in the GEM project43 between 2006 and 2010. The GEM national data were complemented with data from other international sources, such as the World Economic Outlook Database (IMF), Human Development Report (UN), and Global Competitiveness Report. The total early-stage entrepreneurial activity (TEA) indicator was taken from the GEM adult population survey, defined as a percentage of adult individuals (18-64 years old) who are either actively involved in starting a new venture or are the owners/managers of a business that is less than 42 months old (Reynolds et al. 2005). Innovative-oriented entrepreneurship (TEANPM) is defined as a subset of TEA—specifically, the percentage of all TEA business entities reporting some new product/market combination, whose product is new to all/most customers and no/few competitors exist. For economic growth, we used real GDP growth rates over a 5-year period. Real GDP data were taken from the World Economic Outlook database, version September 2011. The estimation
42 We included GEM countries for which data for selected variables were available in all studied years (between 2006 and
2010), allowing for a balanced panel database. Innovation-driven economies were represented by Belgium, Denmark, Finland, France, Greece, Iceland, Italy, Japan, Latvia, the Netherlands, Norway, Slovenia, Spain, the United Kingdom/, and the US; efficiency-driven economies were represented by Argentina, Brazil, Chile, Columbia, Croatia, Hungary, Peru, Russia, and Uruguay.
43 GEM is an annual assessment of the entrepreneurial activity, aspirations, and attitudes of individuals across a wide range of countries; initiated in 1999 as a partnership between London Business School and Babson College.

REDETE – ECONOMIC DEVELOPMENT AND ENTEREPRENEURSHIP IN TRANSITION ECONOMIES
114
sample of GDP growth is 2006-2010 (for TEA in 2006), 2007-2011 (for TEA in 2007), 2008-2012 (for TEA in 2008), 2009-2012 (for TEA in 2009), and 2010-2014 (for TEA in 2010).44
We extended the impact of entrepreneurial activity on economic growth to the wider economic and social development. Therefore, as a measure of social development we included the Human Development Index (United Nations Development Programme). We assumed that using HDI is more appropriate for determining social welfare than GDP. In addition to income, HDI includes health and education. To test the relationship, we used a panel database for 2006-2008 as HDI data was available only up to year 2010 (otherwise we could not consider the indicator’s appropriate expected growth rate).
The other variables included in the analysis—GDP per capita (IMF), Growth Competitiveness Index (the Global Competitiveness Report), dummy variables for economic development, and time—are discussed in the next chapter. Hypotheses were empirically tested using ordinary least squares (OLS) regression. The models were gradually refined by controlling for specific characteristics of national development and time using least square dummy variable (LSDV) regressions—also referred to as fixed-effects models (FEM)—which are suitable for analyzing panel data. To test the hypotheses, we built three models, presented in the following section.
3.2 Models for estimation
Hypotheses were empirically tested using three different regression models. The first was based on the assumption that the impact of entrepreneurial activity significantly depends on countries’ achieved development stage and time. The model built on Van Stel’s (2005) and Stam et al.’s (2009, 2011) work, which deal with influences of TEA on GDP growth and showed mixed evidence. In addition to the general TEA index, we used the share of innovative-oriented entrepreneurship (TEANPM) as an independent variable to test whether its impact was higher than entrepreneurship in general. In the second model, we separated TEA variables for different groups of countries to determine different effects for effective-driven and innovative-driven economies. Finally, in third part, we built the model to investigate the link between entrepreneurship and wider social development.
Model 1
In model, 1 we use data sets for 24 countries from 2006 to 2010. We performed a similar regression analysis as Stam et al. (2011, p. 239), using a balanced panel data set based on the TEA index from 2006 to 2010 (t=2010). To limit the potential impact of reversed causality, we added lagged growth of GDP, which refers to the 5 years prior to the dependent variable’s measurement period (average growth rates in 5 years), as an additional control variable. In addition to the general TEA index, we considered innovative-oriented entrepreneurship (TEANPM) to test whether the impact of innovative-oriented entrepreneurship on economic growth is higher than that of entrepreneurship in general. GDP growthi,((t+4)—(t-4)) = a1 + b1 TEAi,((t—(t-4)) + c1 Type of economyi
+ d1 log (GDPpci,(t—(t-4))) + e1 GCIi,((t—(t-4)) + f1 GDP growthi,((t-1)—(t-9)) (1) + g1 Year 2007i + … + g4 Year 2010i + εit
44 We use estimates for GDP growth after 2010 (IMF, September 2011).

REDETE – ECONOMIC DEVELOPMENT AND ENTEREPRENEURSHIP IN TRANSITION ECONOMIES
115
where GDP growth is the dependent variable, calculated as average growth rate of GDP (annual growth rate over a 5-year period), TEA is total early-stage entrepreneurial activity index, GDPpc per capita income (in 1000 USD), and GCI is the Growth Competitiveness Index. In line with Van Stel (2005) and Stam et al. (2011), we used (the log of) countries’ initial income level to correct for catch-up effects and GCI capturing other determinants of economic growth. As additional (dummy) variables, we included type of economy and years, taking into account different development levels of countries and time (the base regression refers to the year 2006).
Model 2
In the second model, we allowed for different effects in innovative-driven economies com-pared to efficiency-driven economies. TEA rates may reflect different types of entrepreneurship depending on the stage of economic development. We used a balance panel data set for 24 countries from 2006 to 2007, which corresponds to 48 observations. We eliminated additional years, which were strongly influenced by the global economic crisis, to avoid the possible negative impact on the empirical results (t=2007). GDP growth ,((t+1)—(t-1)) = a1 + b1 TEAefficiency driven
i ((t—(t-1)) + c1 TEAinnovation driveni,((t—(t-1))
+ b2 TEANPMefficiency driveni ((t—(t-1)) + c2 TEANPMinnovation driven
i ((t—(t-1)) (2)
+ d1 log (GDPpci,(t—(t-1))) + e1 GCIi,((t—(t-1)) + f1 GDP growthi,((t-1)—(t-3)) + εit
where GDP growth is the dependent variable, calculated as average growth rate of GDP (ann-
ual growth rate over a 2-year period).
Model 3
In the third model, we tested whether the (innovative-oriented) entrepreneurship can be considered a determinant of personal (human) development. From the balance panel data set, we excluded observations the last two years (i.e., 2009 and 2010) as otherwise we could not have considered the indicator’s appropriate expected growth rate. Therefore, our estimation sample was 2006 to 2008 (72 observations, t=2008). In model 3, we considered the same independent variables as when investigating their impact on GDP. HDI growthi,((t+2)—(t-2)) = a1 + b1 TEAi,((t—(t-2)) + c1 Type of economyi
+ d1 log (GDPpci,(t—(t-4))) + e1 GCIi,((t—(t-4)) + f1 HDI growthi,((t-1)—(t-9)) (3)
+ g1 Year 2007i + g2 Year 2008i + εit
where HDI growth is the dependent variable, calculated as the average growth rate of HDI (annual growth rate over a 3-year period).
3.3 Empirical results
Table 1 presents the estimation results for testing Hypothesis 1 (i.e., if entrepreneurial activity differs according to achieved development stage of a given economy and time) and Hypothesis 2 (i.e., if innovation-oriented entrepreneurship’s contribution to macroeconomic growth is more important than entrepreneurship in general). Per capita income had an expected negative effect

REDETE – ECONOMIC DEVELOPMENT AND ENTEREPRENEURSHIP IN TRANSITION ECONOMIES
116
that is consistent with the conditional convergence effect (Abramovitz 1986, in Stam et al. 2011, p. 240). GCI was significantly positive and impact of lagged growth significantly negative, which is likely due to the global crisis that occurred between the GDP’s lagged and expected growth. In the second model variant, TEA is positive but has no significant impact on GDP growth. The addition of a linear TEA term decreases the adjusted R2 so we can assume according to Van Stel et al. (2005) that link between TEA rates and GDP growth were not linear. When we added innovative-oriented entrepreneurs (TEANPM) to the model, TEA became non-significantly negative but the effect of innovative-oriented entrepreneurship on GDP growth was positive at the 5% level.
Table 1. Early entrepreneurship activity and economic growth 2006-2010 (dep. variable: GDP growth)
Model 1 (1)
OLS Model 1 (2)
OLS Model 1 (3)
OLS Model 1 (4)
LSDV-Fixed effects a1 12,408 11,676 11,948 8,980 Constant (8,733)c (6,854)c (7,126)c (4,377)c b1 0,027 -0,004 0,050 TEA (0,783) (-0,111) (1,472) c1 -0,692 Type of economy (-0,967) c3 0,030 TEANPM (2,279)b d1 -4,198 -3,983 -4,256 -3,040 log (BDPpc) (-9,755)c (-7,798)c (-8,255)c (-3,768)c e1 0,992 0,951 0,983 0,917 GCI (2,630)c (2,494)b (2,623)c (2,378)b f1 -0,220 -0,216 -0,222 -0,135 Lagged GDP growth (-3,393)c (-3,321)c (-3,465)c (-1,714)a g1 -0,221 Year 2007 (-0,538) g2 -0,809 Year 2008 (-1,895)a g3 -1,011 Year 2009 (-2,415)b g4 0,283 Year 2010 (0,658) R2 0,562 0,565 0,584 0,616 R2 adjusted 0,551 0,549 0,565 0,584 F statistic 48,382c 36,315c 31,178c 19,082c Number of observations
117 117 117 117
t-values are in parentheses; ap ≤ 0,10; bp ≤ 0,05; cp ≤ 0,01. Number of observations is smaller than 120 due to the elimination of those with outliers.
When we included dummy variables for the type of national economy and time (fourth model
variant), the coefficient c1 was not statistically significant; thus, we could not confirm the deve-lopment level’s impact on GDP growth although we could on time. In model 1(4), the regression coefficients g2 and g3 represent the specific characteristics of years 2008 and 2009 that negatively affected national economic growth. Based on these results, we repeated the analysis with data referring to the time period before the global economic crisis. We used data for 24 countries in 2006 and 2007 (TEA index), with the economic growth dependent variable calculated as the average growth rate of GDP (annual growth rate over a 2-year period; Table 2 in the Appendix). GCI was surprisingly not significant, which we assume is a result of the shorter time series. The impact of lagged growth was significantly positive, suggesting a considerable degree of path dependency. As the value of the dummy variable for type of national economy was statistically significant, the constant of some countries increased. Thus, innovative (more developed) countries

REDETE – ECONOMIC DEVELOPMENT AND ENTEREPRENEURSHIP IN TRANSITION ECONOMIES
117
contributed to the 2-year average growth rate, which could be the result of the countries’ specific economic environment. Therefore, we can assume that the relationship between entrepreneurship and macroeconomic growth differs for countries at different levels of development. By separating TEA variables for different groups of countries, we can confirm this assumption. The results of our second model indicate that the effects of TEA and TEANPM are significantly different for efficiency-driven and innovation-driven economies (Table 3).
Table 3. Early entrepreneurship activity according to the type of economy and economic growth 2006-2007 (dep. variable: GDP growth)
Model 2 (1) LSDV-Fixed effects
Model 2 (2) LSDV-Fixed effects
a1 18,836 10,027 Constant (3,471)c (2,782)c b1 -1,210 TEA efficiency-driven (-1,674)a c1 1,929 TEA innovation-driven (2,272)b b2 0,001 TEANPM efficiency-driven (0,025) c2 0,034 TEANPM innovation-driven (0,583) d1 -6,197 -2,988 log (BDPpc) (-3,322)c (-2,260)b e1 0,714 0,330 GCI (0,928) (0,413) f1 0,559 0,522 Lagged BDP growth (4,469)c (3,881)c R2 0,640 0,601 R2 adjusted 0,597 0,554 F statistic 14,926c 12,656c Number of observations 48 48
t-values are in parentheses; ap ≤ 0,10; bp ≤ 0,05; cp ≤ 0,01; Following Van Stel et al. (2005), we assume a constant equal for each of the groups of countries.
Entrepreneurship in general (TEA) had a significantly positive impact in innovation-driven
economies, but significantly negative impact in efficiency-driven economies. These results are consistent with Van Stel et al.’s (2005) and Stam et al.’s (2009) findings. In the second model variant of model 2, we identified the positive effects of the innovative-oriented entrepreneurship (TEANPM) for both developed and less developed countries, but the results were not significant. The more positive effect of innovative-oriented entrepreneurship than entrepreneurship in general corresponded to coefficient c3 in model 1(3). Hence we can conclude that innovative-oriented entrepreneurship has a positive correlation with economic growth and contributed more to national economic growth than entrepreneurs in general. These results support Hypotheses 1 and 2.
Finally, Table 4 presents the results of model 3, which investigated Hypothesis 3 (i.e., the link between entrepreneurship and wider social development, measured by the HDI).

REDETE – ECONOMIC DEVELOPMENT AND ENTEREPRENEURSHIP IN TRANSITION ECONOMIES
118
Table 4. Early entrepreneurship activity and social development 2006-2008 (dep. variable: HDI growth)
Model 3 (1) OLS
Model 3 (2) OLS
Model 3 (3) LSDV-Fixed effects
Model 3 (4) LSDV-Fixed effects
a1 1,829 2,123 2,992 2,975 Constant (5,684)c (5,357)c (6,614)c (6,822)c b1 -0,078 -0,103 -0,078 TEA (-1,259) (-1,766)a (-1,370) c1 0,438 0,368 Type of economy (3,329)c (2,866)c d1 -0,530 -0,586 -0,944 -0,809 log (BDPpc) (-5,632)c (-5,653)c (-6,530)c (-5,512)c e1 0,044 0,052 0,057 -0,006 GCI (0,514) (0,607) (0,709) (-0,080) f1 -0,050 -0,049 -0,007 -0,023 Lagged HDI growth (-0,508) (-0,494) (-0,076) -0,258 g1 -0,137 Year 2007 (-2,096)b g2 -0,179 Year 2008 (-2,681)c R2 0,547 0,557 0,621 0,662 R2 adjusted 0,527 0,531 0,592 0,625 F statistic 27,331c 21,072c 21,612c 17,901c Number of observations 72 72 72 72
t-values are in parentheses; ap ≤ 0,10; bp ≤ 0,05; cp ≤ 0,01. TEA considered as their logarithmic value to ensure the normal distribution of variables.
The global competitive index and lagged HDI growth were not significant, which might be the
result of the smaller number of observations. Despite the statistically insignificant result, we kept all explanatory variables in the model due to the interest in individual influences, not for the exact prediction of the dependent variable. The explanatory variables explained 54.7% of the variability of HDI growth, which is a little less than in the case of the variability of GDP growth. TEA was negative and became statistically significant when considering the type of economy. As the coefficient c1 was statistically significant, the constant of some countries increased. Innovation-driven (more developed) countries contributed to the 3-year average growth rate of HDI, which could be the result of their specific economic environment. These results partly support Hypothesis 3. We found a relationship in HDI growth for early entrepreneurs, but only when considering achieved development level and time.
4. Conclusions and policy implications
Early entrepreneurial activity analyzed in the international environment was positively related to GDP growth and dependent on the national economy’s development level and time. Innovation-driven countries were distinguished from less developed, efficiency-driven countries. In general, the impact of entrepreneurship on economic growth was positive in high-income countries but negative in low-income countries. These results support previous results (Van Stel et al. 2005; Stam et al. 2009; Bjørnskoff and Foss 2008) indicating that the real economic effect can be attributed to the decisions of some people in developed economies to become entrepreneurs. The results outlined herein were expected as we assumed that involvement in entrepreneurial activity by itself does not equate to higher development (Caree et al. 2002; Wennekers et al. 2005). According to GEM, less developed countries show even higher levels of entrepreneurial activity. The prevailing type of entrepreneurship in these countries is necessity-driven entrepreneurship, which contributes little to economic development. Apparently, it is not the

REDETE – ECONOMIC DEVELOPMENT AND ENTEREPRENEURSHIP IN TRANSITION ECONOMIES
119
“quantity” of entrepreneurship that makes a decisive contribution to a nation’s economic and social development, but its “quality”—the entrepreneurial population’s ability to innovate, ensure new markets, and create new jobs. Our findings also suggest that innovative-oriented entrepre-neurship has a greater impact on economic growth than overall entrepreneurial activity. The im-pact was significantly positive in both high- and low-income countries. Therefore, introducing new products, technologies, and knowledge transfer into practice remains a crucial task for eco-nomic policy. These results support Koellinger’s (2008) findings that entrepreneurs in highly de-veloped countries are significantly more likely to engage in innovative startups.
The environment is a significant factor influencing the emergence and development of entrepreneurship, therefore identifying policies leading to appropriate levels of entrepreneurial activity is a big challenge (Bosma 2012, p. 35). Based on our results, policy should be focused on the level of technological development and product innovativeness, educational level, and entrepreneurial ambitions in order to introduce the necessary dynamics and stability into the economy. Irrespective of the development stages of the economy and society, entrepreneurship always remains important. Thus, economic and entrepreneurship policymakers should explore appropriate measures to encourage entrepreneurship. Basic entrepreneurship conditions that will attract foreign investments and allow the exploitation of economies of scale should be developed for low-income countries. It is also necessary to develop additional frameworks to encourage opportunity-based entrepreneurship. Regardless of the economic crisis and adapted economic policy instruments, more emphasis should be devoted to stimulating innovative-oriented entre-preneurship to enable all countries, regardless of their income, to develop further.
Our results indicated that innovative-oriented entrepreneurship is, in the long run, also a deter-minant of social (human) development. Its impact is, thus, more indirect and slightly weaker, as in the case of economic growth. Entrepreneurial activities provide a higher standard of living (thro-ugh education, better healthcare, social services, etc.), but the impact significantly depends on the achieved national development level and time. Thus, given the wider term of social development aiming to identify qualitative changes, a longer period of empirical investigation should be con-sidered.
In sum, governments should—as much as possible—influence the establishment of appropriate levels of entrepreneurship according to country specifics. Understanding entrepreneurship must be an important guideline for economic policy as long-term economic performance also leads to general social well-being. Designing and running such economic policy should rely on evidence, including internationally comparable results, and be built on appropriate models that represent reliable bases for policy-making debates as the effects of entrepreneurship can vary significantly among countries, regions, or even cities. National policymakers must determine what type of entrepreneurship should be supported and to what extent so that appropriate industrial policy leading to economic and social development can be designed and implemented.

REDETE – ECONOMIC DEVELOPMENT AND ENTEREPRENEURSHIP IN TRANSITION ECONOMIES
120
Reference list
1. Acemoglu, D., Johnson, S. (2005). Unbundling Institutions. Journal of Political Economy. 113(5), pp. 943-995.
2. Acs, Z.J., Szerb, L. (2011). Global Entrepreneurship & Development Index, inaugural ed. UK, USA: Edward Elgar.
3. Acs, Z.J., Varga, A. (2005). Agglomeration, Entrepreneurship and Technological Change. Small Business Economics. 24(3), pp. 323-334.
4. Audretsch, D.B. (2007). Entrepreneurship capital and economic growth. Oxford Review of Economic Policy. 23(1), pp. 63-78.
5. Audretsch, D.B. Thurik, R., Verheul, I. and Wennekers, S. (Ed.). (2002). Entrepreneurship: Determinants and Policy in a European – U.S. Comparison. Boston/Dordrecht/London: Kluwer Academic Publishers.
6. Bjørnskov, C., Foss, N.J. (2008). Economic Freedom and Entrepreneurial Actovoty: Some Cross-Country Evidence. Public Choice. 134, pp. 307-328.
7. Bosma, N. (2012). The Global Entrepreneurship Monitor (GEM) and its Impact on Entrepreneurship Research. GEM Working Papers.
8. Capelleras, J., Kevin, M., Greene, F. and Storey, D. (2008). Do more heavily regulated economies have poorer performing new ventures? Evidence from Britain and Spain. Journal of International Business Studies. 39(4), p. 688–702.
9. Carree, M., van Stel, A., Thurik, R. and Wennekers, S. (2002). Economic Development and Business Ownership: An analysis using data of 23 OECD countries in the period 1976-1996. Small Business Economics. 19(3), pp. 271-290.
10. Carree, M.A., Thurik, A.R. (2003). The impact of Entrepreneurship on Economic Growth. In: Z.J. Acs, D.B. Audretsch (Ed.). Handbook of Entrepreneurship Research. GB: Kluwer Academic Publishers, pp. 437-471.
11. Costanza, R., Hart, M., Posner, S. and Talberth, J. (2009). Beyond GDP: The Need for New Measures of Progress. The Pardee Papers, No. 4, January 2009.Boston: Boston University; The Frederick S. Pardee Center for the Study of the Longer-Range Future.
12. Hart, D.M. (2003). The Emergence of Entrepreneurship Policy. Governance, Start-ups, and Growth in the U.S. Knowledge Economy. UK: Cambridge University Press.
13. Koellinger, P. (2008). Why are some entrepreneurs more innovative than others?. Small Business Economics. 31(1), pp. 21-37.
14. Lundström, A., Stevenson, L. (2005). Entrepreneurship Policy – Theory and Practices. ISEN International Studies in Entrepreneurship. New York: Springer.
15. OECD. (2005). Micro-policies for Growth and Productivity, Final Report. Paris: OECD. 16. Porter, M.J., Sachs, J., McArthur, J. (2002). Executive Summary: Competitiveness and Stages
of Economic Development. In: M.J. Porter, P.K. Sachs, J.W. Cornelius, J. Mc Arthur, K. Schwab (Ed.). The Global Competitiveness Report 2001-2002. New York: Oxford University Press, pp. 16-25.
17. Rebernik, M., Tominc, P. and Pušnik, K. (2009). Rast podjetniške aktivnosti v Sloveniji, GEM Slovenija 2008. Maribor: Ekonomsko-poslovna fakulteta, UM.
18. Rebernik, M., Tominc, P. and Pušnik, K. (2010). Slovensko podjetništvo v letu krize, GEM Slovenija 2009. Maribor: Ekonomsko-poslovna fakulteta, UM.
19. Reynolds, P., Bosma, N., Autio, E., Hunt, S., De Bono, N. and Servais, I. (2005). Global Entrepreneurship Monitor: Data Collection Design and Implementation, 1998-2003. Small Business Economics. 24(3), pp. 205-31.
20. Shane, S. (2003). A General Theory of Entrepreneurship. The Individual-Opportunity Nexus. Cheltenham, UK; Northampton, MA, USA: Edward Elgar.

REDETE – ECONOMIC DEVELOPMENT AND ENTEREPRENEURSHIP IN TRANSITION ECONOMIES
121
21. Shane, S., Venkataraman. (2000). The Promise of Entrepreneurship as a Field of Research. The Academy of Management Review. 25(1), pp. 217-226.
22. Stam, E., Hartlog, C., van Stel, A. and Thurik, R. (2009). Ambitious entrepreneurship, high-growth firms and macroeconomic growth. EIM Research Reports H200911, Zoetermeer, EIM.
23. Stam, E., Hartlog, C., van Stel, A. and Thurik, R. (2011). Ambitious Entrepreneurship, High-Growth Firms, and Macroeconomic Growth. In: Minniti, M (Ed.), The Dynamics of Entrepreneurship; Evidence from the Global Entrepreneurship Monitor Data. New York: Oxford University Press, pp. 231-249.
24. Stiglitz, J., Sen, A. and Fitoussi, J.P. (2009). Report by the Commission on the Measurement of Economic Performance and Social Progress; Final report. Commission on the Measurement of Economic Performance and Social Progress.
25. Todaro, M.P. (2000). Economic Development. 7th edition. Essex: Addison Wesley Longman. 26. Van Stel, A., Carree, M. and Thurik, R. (2005). The Effect of Entrepreneurial Activity on
National Economic Growth. Small Business Economics. 24, pp. 311-321. 27. Venkataraman, S. (1997). The distinctive domain of entrepreneurship research: An editor’s
perspective. In: J. Katz, R. Brockhaus (Ed.), Advances in Entrepreneurship, Firm Emergence, and Growth. 3 Greenwich, CT, US: JAI Press, pp. 119-138.
28. Wennekers, S., Thurik, R. (1999). Linking entrepreneurship to economic growth. Small Business Economics. 13(1), pp. 27-55.
29. Wennekers, S., van Stel, A., Carre, M. and Thurik, R. (2010). The relationship between entrepreneurship and economic development: is it U-shaped?. Zoetermeer: SCientific AnaLysis of Entrepreneurship and SMEs.
30. Wennekers, S., van Stel, A., Thurik, R. and Reynolds, P. (2005). Nascent Entrepreneurship and the Level of Economic Development. Small Business Economics. 24, pp. 293-309.
Appendings
Table 2. Early entrepreneurship activity and economic growth 2006-2007 (dep. variable: GDP growth)
Model (1) OLS
Model (2) OLS
Model (3) LSDV-Fixed effects
Model (4) LSDV-Fixed effects
a1 8,982 9,690 13,513 13,604 Constant (3,175)c (2,543)b (3,334)c (3,979)c b1 -0,164 -0,216 -0,045 TEA (-0,281) (-0,385) (-0,096) c1 3,232 2,604 Type of economy (2,180)b (2,068)b d1 -2,446 -2,586 -4,931 -3,468 log (BDPpc) (-2,767)c (-2,531)b (-3,389)c (-2,720)c e1 0,327 0,347 0,469 -0,311 GCI (0,421) (0,440) (0,619) (-0,467) f1 0,496 0,489 0,651 0,661 Lagged GDP growth (4,009)c (3,851)c (4,563)c (5,486)c g1 -1,949 Year 2007 (-4,244)c R2 0,595 0,596 0,637 0,748 R2 adjusted 0,567 0,558 0,594 0,711 F statstic 21,539c 15,836c 14,724c 20,243c Number of observations 48 48 48 48
t-values are in parentheses; ap ≤ 0,10; bp ≤ 0,05; cp ≤ 0,01. TEA considered as their logarithmic value to ensure the normal distribution of variables.

REDETE – ECONOMIC DEVELOPMENT AND ENTEREPRENEURSHIP IN TRANSITION ECONOMIES
122
Bibliography
Katja Crnogaj, Ph.D., is an assistant in the departments of Entrepreneurship and Business Economics at the Faculty of Economics and Business, University of Maribor. As a young researcher and member of the Institute for Entrepreneurship and Small Business Management, she is currently involved in several international research projects. Furthermore, she is a mem-ber of the research group Slovenian Entrepreneurship Observatory and Global Entrepreneur-ship Monitor.
Miroslav Rebernik, P.h.D., is professor of Business Economics and Entrepreneurship. He is the head of the Department for Entrepreneurship and Business Economic and director of the Institute for Entrepreneurship and Small Business Management at the Faculty of Economics and Business, University of Maribor. He has wide experience in entrepreneurship and small business management research and education and has published extensively in international and national journals. Currently, he is leading the Global Entrepreneurship Monitor research for Slovenia and has run the Slovenian Entrepreneurship Observatory since 1999. His bibliography contains over 600 bibliographic units and participation in more than 60 national and international conferences.

REDETE – ECONOMIC DEVELOPMENT AND ENTEREPRENEURSHIP IN TRANSITION ECONOMIES
123
INNOVATION AS THE DRIVING FORCE OF GROWTH IN SMALL ENTERPRISES
Midhat SUBAŠIĆ45
Abstract
Today, more than ever, companies conduct business in a turbulent environment and therefo-re there are less and less factors which can be identified as the actual starters of companies’ growth. However one of the most commonly cited factors of growth in 21st century is – innova-tion. In order for the companies to be innovative they need to continuously invest in different segments/functions of their enterprise. Innovations by themselves do not guarantee output that is the commercial success because the innovation performance and the growth of the company depend on many factors. Therefore companies undertake further steps to stimulate innovation that would result in the growth of the company.
This paper is the result of empirical research within which we attempt to clearly present id-entified dependent factors of innovation that lead to the overall growth of the company. The re-sults of the research are based on extended empirical research of innovation and growth. Many stakeholders demand higher degree of innovation from the companies, innovation of products and innovation of processes. It is also important to state that companies meet higher degree of failed attempts of creating innovations. This can also be concluded on the basis of smaller num-ber of radical innovations in the world. It is by innovation strategy as the only strategy of grow-th that the companies can significantly influence the reduction of failed innovations.
There are often more possibilities for growth by innovation than there are resources for their development and the right decisions must be made. Innovational strategy needs to join decisions with the expected economic benefits and possibilities to determine returns from the innovations.
The paper encompasses different intern starters of innovation where we focused on internal factors. Considering that man is the starter of all activities we have directed special attention to the analysis of influence of employees and their qualifications to the development of innovation. Therefore we observed mutual connection between levels of employee’s education and the com-pany’s innovation, and the mutual connection between the innovation and the growth of a company.
Keywords: innovation, growth, innovative growth strategy, product innovation, process in-novation.
45 Furnir-Fix d.o.o., 74206 Doboj Istok, E-mail: [email protected]

REDETE – ECONOMIC DEVELOPMENT AND ENTEREPRENEURSHIP IN TRANSITION ECONOMIES
124
1. Innovation activities in the field of product and process innovation
Technological and industrial strategies put in focus the low level of technological development of production industry. It is important to note that small and medium enterprises (SME) hold a key position in the structure of industry and economy. Their significance is best recognized thro-ugh their participation rates in gross domestic product, rates in the level of export structure and other similar indicators.
There are many factors on the market that demand higher level of innovative activities from the companies. Innovation activities in the area of product and process innovation in SMEs of wo-od and metal industries have been until 1990s at in the mid level in comparison to the innovation activities globally. One of the goals of this paper is to analyze the current state of innovation activities of the mentioned industries.
A trend of constant investment in the reconstruction of technological equipment by SMEs has been noted and that will enable the enterprises not just to maintain but to expand their competitive advantage.
1.1 Features of small enterprises’ innovation activities
A feature of innovation activities in small manufacturing enterprises is that they conduct only slight changes which are improvements. It is exactly those small changes in product and processes that enable the enterprises to create savings in the cost of product and process. Small enterprises of wood and metal industry are have limited budgets and therefore reach the limits of their innovative actions very fast and thus they are able to realize only small innovative projects while they often lack funds for bigger projects. Inability to implement innovative activities often implies the halt of innovation endeavor which is threatened with an increasing risk of obsolescence.
2.1 Dependencies of innovation ability and its shortcomings
There are conflicting opinions of experts in literature when it comes to dependencies of inno-vation abilities. Some authors consider employee’s creativity as the key factor in launching innovations; others find that it is necessary to have appropriate managerial climate or orga-nizational structure while third believe that the synchronization of all above is required,
Most analysts find it easier to describe the current state from the negative viewpoint. That is why there is a vast number of studies on the causes of inadequate capabilities for innovation in companies.
In many studies (Wahren, 2004) time as an obstacle for innovation is at the top position. Further causes are: lack of resources and creative techniques, little justification or jurisdiction of associates for innovative tasks, and insignificant and insufficient exchange of opinions which includes all departments and sectors. Otherwise the following obstacles for innovation in practice can be established:
- Innovation strategy and innovation goals- Strategy and goals of accompany are not strongly connected. There is no innovation strategy. Views of innovation goals are unfair. There is one sided focus on product innovation.
- Management- Managers do not care for innovation. Inadequate knowledge on shape, intensifying and optimization of innovation processes. Applied managerial methods represent obstacles for innovation.

REDETE – ECONOMIC DEVELOPMENT AND ENTEREPRENEURSHIP IN TRANSITION ECONOMIES
125
- Organization- Centralist, power oriented, partly rigid structures. Insufficient communi-cation and coordination between expert areas. Nonexistent or poorly organized advisory body.
- Climate- High level of norms and regulations which prevent innovation. Dominance of error avoiding activities. Insufficient culture of learning and experimenting. Different way of thinking is deemed as obstruction.
- Use of funds- Tools for efficient structuring of innovation processes are not used or are not used to the full of their potential. Required resources (especially time as well as personal and financial resources) are not at disposal that is they are not used at required places.
- Associates- Minor or total lack of associates input in innovation activities. Insignificant recognition of innovation. Weak associate motivation.
- Information- Insufficient knowledge of surrounding and internal business environment. Insignificant consideration of development and its (possible) consequences.
- Realization- Deficiencies in project management that is in innovation control. Insufficient attention to communication and marketing aspects.
2. Enterprise growth factors
All factors that have effect on the business of a company can be divided to internal and external factors. We will only focus on the effect of key factors on innovation and enterprise growth.
2.1 Investment in research and development
Inexistence of available data on investments in research and development makes the assessment of influence of investment in these activities on innovation complicated.
There is an assumption that small enterprises use basic and/or applied research. In that way mentioned companies attempt to come to new findings and cognitions but without any special intent or goal to apply that new knowledge.
In the sense of Frasctati’s approach (Frascati Manual, 2002) research and development encompasses creative work which is done on a systematic base in order to increase the funds of available knowledge which includes knowledge about people, culture and society as well as the application of that knowledge in creation of new solutions. Salamon considers research and development as a innovation activity which can be undertaken at any stage of innovation process emerging not only as an original source of inventive ideas but as a problem solving tool which can be applied at any stage (within company, in production, or any other part of company) (Salomon, 1996). This paper will turn special attention to investment in and development of staff.
2.2 Profitability of company
Profitability of a company indicates to what extent is the company able to successfully conduct business and it can be measured by comparing profits invested funds. The connection between company’s profitability and its growth is determined by the following series of interdependencies: rate of profitability determines the size of profit, the value of investments are determined by the size of profit, and the growth in business volume or profit depends on volume of investments (Gašparović, 1996). Therefore, if we observe the profitability of the company than we must observe the context between the ratio of profit margin and company’s growth rate. In reality there

REDETE – ECONOMIC DEVELOPMENT AND ENTEREPRENEURSHIP IN TRANSITION ECONOMIES
126
are cases of companies with high profit rates and low growth rate and companies with low profit rates but high growth rate. It is important to note that in the post-war period there have been numerous examples of companies that had high profit and profitability rates. Unfortunately most of them lacked adequate growth strategy which, over time, resulted in the reduction of not only the profitability rate but also in the reduction of profit.
3. Research results
Innovation can be the driving force for different types of company growth. Therefore we can talk about:
- Company’s growth in size
- Growth of sales and sales shares
- Growth of company’s power etc.
Within the scopes of empirical research we have observed the company’s growth from the as-
pect of production volume, capacity size, financial power of company and number of employees. Also our aim was to establish the impact of innovation activities on revenue growth in wood and metal industry.
Innovation and entrepreneurship are the main driving forces of economical growth for the en-tire economy which ultimately results in the increase of revenue of one country. In this section we will analyze whether there actually is a correlation between companies which implemented innovation activities and their income.
Table 1: Correlation between innovation and annual income
Annual income 2008.
Annual income 2009.
Annual income 2010.
Is the company innovative (product and process)?
Spearman Rho -.064 -.094 -.040 Sig. .628 .479 .768 N 59 59 57
Spearman Rho correlation shows that there is a statistically insignificant negative correlation
between innovation and annual income of company. These results indicate that innovation has an effect on annual income but because of no statistical significance between some variables these results can not be considered as relevant. Same data shows us that with the growth of innovation activities in companies there is also a rise in annual income but it is important to state that there is no statistical significance. Therefore it can be said that innovation activities to an extent lead to financial strengthening of a company and that companies gain a certain competitive advantage. Before we analyze the impact of employees and their qualifications on innovation activities we will first observe the specific innovation activities which are invested in according to industry type.

REDETE – ECONOMIC DEVELOPMENT AND ENTEREPRENEURSHIP IN TRANSITION ECONOMIES
127
Figure 1: Investment in specific innovation activities according by type of industry
0
20
40
60
80
100
Internalresearch
Purchase ofservices
Acquisition ofnew
installations
Acquisition ofknowledge
Education Design Marketing
Wood Metal
It can be seen from figure 1 that all companies in wood industry mostly invest in acquisition of plants and equipment while those from metal industry, slightly over 90%, invest considerable funds in acquisition of new plants.
When it comes to education we can see that 60% of wood companies invests fair amounts in education while in metal industry there is only 30% of such cases.
One of the main goals of the research was to determine the correlation between educational structure and innovation of companies. After reviewing the literature on this issue it can be con-cluded that authors have opposite views on the subject. On one side we find authors who take the stand that the company is more innovative if it hires a bigger number of employees with higher qualifications while on the other hand we have those who oppose this attitude. They believe that vast and broad knowledge (experience) represents a sort of obstacle for creativity and with that for innovation. Other group believes that high qualified personnel often take in consideration the possible boundaries and not the abilities and potential results. By doing so, they limit themselves on their path to success. Still knowledge is important when starting innovation and we can therefore agree that both groups of authors are right as long as we differentiate the goals of innovation.
In order to examine the correlation between the increase of educated personnel and innovation
in a company we used a Spearman Rho correlation.
Table 2: Education and innovation
Spearman Rho correlation showed a negative tendency of statistical significance in the
cases of University education for all three years and negative correlation in those years with secondary education.
All correlations are significant on the level of 99% (p=0, 01). Correlation have not been calculated for the PhDs and Master of Science because there were no in the structures of examined companies. Correlations acquired for higher education and unqualified personnel have showed no significance to innovation.
2008. Higher educ.
2009. Higher educ.
2010. Higher educ.
2008. University
educ.
2009. University
educ
2010. University
educ
2008. Secondary
educ
2009. Secondary
educ
2010. Secondary
educ
2008. unq
2009. unq
2010. unq
Inno
vati
on
Rho -.622 -.582 -.609 .198 .196 .226 .382 .396 .356 -.214 -.217 -.177
Sig. .000 .000 .000 .133 .137 .085 .003 .002 .006 .103 .099 .181
N 59 59 59 59 59 59 59 59 59 59 59 59

REDETE – ECONOMIC DEVELOPMENT AND ENTEREPRENEURSHIP IN TRANSITION ECONOMIES
128
Table 3: Correlation of education and innovation in relation to business activity
Industry 2008. Higher educ
2009. Higher educ
2010. Higher educ
2008. Univer educ
2009. Univer educ
2010. Univer educ
2008. Sec educ
2009. Sec educ
2010. Sec educ
2008. unq
2009. unq
2010. unq
Woo
d
Innovation Rho -.351 -.351 -.279 .129 .162 .083 .407 .398 .257 -.295 -.307 -.259 Sig. .062 .062 .143 .505 .401 .667 .028 .033 .178 .120 .106 .174 N 29 29 29 29 29 29 29 29 29 29 29 29
Met
al Innovation Rho -.736 -.669 -.790 .309 .225 .317 .410 .487 .478 -.333 -.333 -.333
Sig. .000 .000 .000 .097 .231 .087 .025 .006 .008 .072 .072 .072 N 30 30 30 30 30 30 30 30 30 30 30 30
Same results from previous table can be seen in table 2. There has been no significant
correlation in wood industry between innovation and employee qualifications structure when it comes to all levels except with secondary education in 2008 and 2009 which indicates that employees with only secondary education contribute to innovation.
When it comes to metal industry the situation is slightly different because it is evident that not only employees with secondary education contribute to innovation but those with university degrees significantly contribute to innovation processes. Considering that the variable is around 44, 80% and 62, 40% we can conclude that it is significantly larger than in previous case. This means that in 2010 innovative activities largely depended on personnel with university degree. Correlations were huge (Rho2008=-0,736; Rho2009=-0,669; Rho2010=-0,790) with statistical significance of p=0, 0001.
Bellow we observed relations between investment in human resources and innovation activities. In order to determine whether there is a correlation between innovation activities and human resource investments for the period from 2008-2010 we used Spearman Rho correlation.
Table 4: Correlation between innovation activities and investment in human resources
Is the company innovative (product and process)
Investment in human resources 2008-2010.
Sperman Rho -.615 Sig. .000 N 59
Spearman Rho correlation showed that there is a statistical significance and close relation
between investment in human resources and innovation for the period from 2008-2010, Rho=-0.615, n=59, p=0.001. The correlation is negative because the innovation is encoded with lower number of non innovativeness which indicates that those companies that are innovative invest greater funds in human resources. In particular those companies that invest in their employee’s education are more innovative.
As educated staff influences innovation of a company that is how investing in education has its connection with innovation. Investment in human resources directly leads to higher level of staff education and educated staff leads to greater innovation. Results of this test show that 37, 8% of variance can be explained with the acquired correlation taking in consideration that without further calculations we can not say how big is the mutual variable of investment in human resources and education (we assume that they overlap). Suggestion for further research is to examine mutual variance of these two variables and to use a model of higher power in order to determine mutual connection of these two variables with company’s innovation (joint variance is usually shown greater than individual one). Reached variance shows that in 37,8 cases we can determine with certainty that innovation depends on the funds invested in human resources in a way that more investments we have the greater the innovation. Assuming that mutual variance of investment and education is huge that is not uncommon.

REDETE – ECONOMIC DEVELOPMENT AND ENTEREPRENEURSHIP IN TRANSITION ECONOMIES
129
Conclusion
Research results showed that the level of education is significant for starting and conducting of innovation activities, but we also saw that it is not crucial considering the results we reached for the wood industry. Results indicate that companies from metal industry display more activity when it comes to innovation of product and/or process. It also transpired that structure of education is a key factor which influences innovation abilities.
Based on the previously displayed results we can conclude that it is necessary for the small businesses to engage their employees as much as possible in the initiation and implementation of innovations. Metal industry has clearly shown that innovation activities are triggered by the employees in production because only those employees know latent reserves for improvement of product and/or processes. In this way any improvement for the company means some form of savings which is further used for company’s growth. We also proved that innovation activities lead to the increase in annual income of company and therefore innovation should be viewed as a continuous process.
Reference list
1. Chesbrough, H., (2006), Open Business Model: How to Thrive in the New Innovation Landscape. Harvard Business School Press, Boston
2. Corsten, H. Gösinger, R. Schneider, H. (2006). Grundlagen des Innovationsmanagements.. Vahlen, Munchen
3. Frascati Manual 2002. (2002). Proposed Standard Practice for Surveys and Research ,, and E xperimental Development. OECD
4. Gašparović, V. (1996). Teorija rasta i upravljenje rastom preduzeća. Školska knjiga. ... Zagreb
5. Salamon, D. (1996). Upravljanje inovativnim potencijalima poduzeća i mreža na .. ... ... podlozi nosivih kompetencija. PhD Disertation. Ekonomski Fakultet. Zagreb
6. Schiling, M. (2008). Strategic Management of Technological Innovation. International eddition. McGraw Hill. New York
7. Wahren, H-K. (2004). Erfolgsfaktor Innovation. Springer-Verlag. Berlin

REDETE – ECONOMIC DEVELOPMENT AND ENTEREPRENEURSHIP IN TRANSITION ECONOMIES
130
THE IMPACT OF BUSINESS INCUBATORS AND INNOVATION CENTERS ON THE DEVELOPMENT
OF THE MACEDONIAN ECONOMY
Miroslav ANDONOVSKI46
Abstract
In the period behind the business incubators have gained considerable publicity and reputa-tion of entrepreneurial initiatives that are very promising. Today's business incubators assist the development of the companies that foster entrepreneurial spirit in order to survive the pe-riod after the commencement of business (this is the period when they are most vulnerable) and of course thereby helping them to expand their business. Within its activities, the business incu-bators to their clients provide diverse services and resources that they need at the time of co-mmencement of business and their emerging at the market, that include: assistance in managing and planning and what is most important for new established companies - financial assistance. One of the primary goals of the incubators of course is providing office space for their custome-rs with affordable rent, office services and equipment etc. .. The main purpose and contribution of the incubators can be found in providing conditions for starting new businesses that will create new jobs which will affect the economic growth and wealth of citizens.
Today, more prevalent are the efforts to find different opportunities and establishing institu-tions for realization of the business ideas, and as on state, also and on local level. Following the example and experience of the highly developed countries, and the experiences of Southeastern Asia, we can come to a conclusion that the initiatives and support on local level can often have primary importance for the establishment and development of businesses of different levels. In Macedonia, lately, mainly at local level more often is the practice of establishing institutions to help entrepreneurs achieve their business ideas. As key institutions of this kind are the business incubators and the centers for innovation in business.
According to the experiences of the countries with longer tradition in establishing incubators and under the other conditions of normative-technical nature, the first business incubator in the Republic of Macedonia was established on 06.03.1997 in Prilep, as a limited liability company under the name Biljana Incubator Ltd - Prilep established by the founders Biljana Predilnica AD - Prilep, Biljana Vatara AD - Prilep and Biljana Confection AD - Prilep.
The centers for business or technical innovation, however, (where they exist) are high-tech version of the incubators for business. In the U.S. (where they are most common), they are usu-ally associated with some of the universities and are designed to assist the local innovators or other entities to commercialize their inventions.
In the Republic of Macedonia as the most important institution of this kind of course is the European Information and Innovation Centre, opened in 2008, as part of Enterprise Europe Network, with which partners are many state institutions.
Keywords: business incubator, center, innovation, economy.
46 University „St. Kliment Ohridski“ – Bitola, Faculty of economics – Prilep, str. ”Gjorce Petrov” b.b., 7500 Prilep, Republic
of Macedonia, [email protected].

REDETE – ECONOMIC DEVELOPMENT AND ENTEREPRENEURSHIP IN TRANSITION ECONOMIES
131
Business incubators according to the international experience
The Incubators as a form for helping the newly established businesses have been developed in the world for a quite a long time, at the beginning as a method of economic development for using the old premises and creating new businesses in the local economies. Business incubators nurture the development of entrepreneurial companies, and also help them to survive the starting period of the business (when they are most vulnerable) and of course, helping them to expand their business. Business incubators enable its clients a variety of services and resources they need in the period when they are young companies. These services and resources include: assistance in management, planning and, of course, financial aid. The incubators also provide their clients workspace with flexible rent, office equipment and services – all in one place. The main purpose of these programs for business incubation is to create new companies that will create new jobs and thus wealth in those regions.
These activities are designed to help the new businesses to overcome the initial stage of star-ting the business and to grow into healthy and independent economic entities. The international experience suggests two basic types of incubators: first, regional incubators; and second, company (within the company) or corporate incubators, located within industrial complexes, and provided with free offices.
Nowadays we can distinguish several different types of business incubators: - as non-profit organizations focused on the economic development (most of them);
- those that are profit oriented;
- “mixed” (the first two types), those that help the enterprises in the early stages;
- increased percentage of business incubators are focusing on the businesses in the IT field;
- smaller part of the business incubators are focused in the area of production;
- even fewer have focused on service businesses47.
However, regardless of their type, their main goal is to help the newly-established businesses.
Basic conditions for the development of this type incubators are the following: - the existence / development of a market oriented economy;
- the readiness of the relevant institutions (governmental and non-governmental, regional and local) to take the incubators’ activity to assist in the establishment of new businesses and development to the stage of maturity;
- the material resources to support the work of the incubator; and
- skilled and motivated managers who will be engaged in creating incubator to provide the necessary services.
According to the experiences of the countries with a long tradition of working with incubators,
the primary task is within the local administrative unit, to support the selection process of entrepreneurial ideas and to make them commercially effective through the implementation of new small and medium businesses.
Today in scientific circles and practice often ask the question: Is the business incubation a new industry?
47 Information taken from http://pretpriemac.mk/, (accessed 08.05.2012).

REDETE – ECONOMIC DEVELOPMENT AND ENTEREPRENEURSHIP IN TRANSITION ECONOMIES
132
No. The term business incubator gained popularity with the new term, so called Internet incu-bators, but the business incubation model dates back to the 1950s. The model has been accepted for a number of reasons, including the increasing employment in economically disadvantaged communities, in some way serving as investors.
According to the experiences of developed countries, this process was inevitably to be trans-ferred to the developing countries, and in the countries that have adopted the transitional reforms after the collapse of the economic and political system of the former socialist countries.
In terms of the provision of the necessary resources as sponsors of the business incubators can be either individuals or entire organizations that wish to support the business incubation programs. There are incubators, so called "hybrids" – that have more than one sponsor.
To create a successful incubation program for those who are working in the incubator and are responsible for its management, you must first invest time and money for preparation of a fea-sibility study. With this you can determine whether the project will have a market, solid financial base and strong support from the environment - all of these are critical factors essential to the success of the incubator. Once you determine these things, the implementation of the project can begin.
But it is interesting to note that once a final decision is made for establishing business in-cubators, then immediately the following question its raised: where or in which administrative part of the state they need to be formed? From existing experience can be noted that they often cover regional or local areas where there are industries whose development process is slow, and in most cases even with a declining trend and high unemployment rates.
But, not only the downward trend in the manufacturing industries impose the need of opening business incubators, also and the technical and technological development of the countries (from the industrialized to the developing countries) its creating structural unemployment, and this unemployment emerges as a main effect of those models. The business incubators are in function for overcoming exactly these problems.
In practice are known three subjects, mostly, they are set up by the business incubators, and they are: local authorities, the business and the universities48. The local authorities are providing office space and basic infrastructure; the business is in charge of the financial aspect; and the universities for the transfer of knowledge. Often there can be made exceptions, so the three partners can realize the initial financial plan.
The time that the entrepreneurs spend in the incubators is determined by the rules of the incubator and in practice it can be different. In fact, in certain cases, entrepreneurs remain in incubators until they develop their idea from prototype to product, after that they are emerging on the free market independently. There are incubators where the entrepreneurial idea is brought up to the stage of commercialization and the company is kept in the incubator until it overcome the weaknesses of the early period (therefore they are called incubators) - until they gain confidence in their business partners and start working completely independently49.
There are no uniformed rules known to the practice about the types of businesses that will be locate in the incubators. Most important is that the offered business plan needs to be good and to offer opportunities for profitable operation.
Certainly, one of the most important activities of the incubators is the offer of services and expertise in one place, but from many areas, i.e.:
- Development of the business plans;
- Assistance in conquering the market (domestic or foreign);
- Financial services and advice;
48 Ph.D. Taki Fiti, Ph.D. Verica Hadzi Vasileva – Markoska, Milford Bateman, Entrepreneurship, University "Ss. Cyril and
Methodius "- Skopje, second edition, p 170. 49 Fuada Stankovic and Nikola Lukmirovic: “ Entrepreneurship”, Novi Sad, 1995, p. 67.

REDETE – ECONOMIC DEVELOPMENT AND ENTEREPRENEURSHIP IN TRANSITION ECONOMIES
133
- Improvement of the technological processes and the production quality;
- Selection of the required technology;
- Accounting and legal services, and so on.
In order to realize their goals the incubators assist their customers in several ways: - Management of their own funds, revolving loans and loans for the small companies.
- Connecting the companies with the investors (business angels).
- Working with venture capitalists and connecting the companies from the incubator with those formal sources of investment.
- Helping the companies with the applying for loans at the banks50.
The contribution of the incubators to the development of the local and regional economy can
be seen in the fact that they create new jobs, revive the neighborhood and promote new tech-nologies, while strengthening the local, regional, and even national economy.
Regarding the issue of the amount of the compensation for the services provided it can be concluded that it is different for various incubators and users.
Business incubators in Macedonia
The business premises for the needs of the incubators in our country is mainly provided by using the factories, halls and warehouses which remained from the bankrupt companies during the transition period. They are adjusted, and depending from the submitted business plan they are given to the entrepreneurs. To support the entrepreneurial activities, the incubators offer special rooms that can be used for various meetings, educational lectures and other infrastructure needs. The common infrastructure provided by the incubators contributes to the reducing costs and achieving greater profitability of new businesses. But the use of the old premises from the bankrupt companies is not the only way for providing office space for the incubators. Also, it can be provided with the construction of new business facilities.
Using to the experiences of the countries with a longer tradition in the establishment of incu-bators and under other conditions with normative-technical nature, the first business incubator in the Republic of Macedonia was established on 06.03.1997 in Prilep, as a limited liability company under the name Biljana Incubator LLC – Prilep, by the founders Biljana Spinning Mill Incorpo-rated - Prilep, Biljana Vatara Incorporated - Prilep and Confection Biljana JSC - Prilep51.
50 Information taken from http://pretpriemac.mk /, (accessed 08.05.2012). 51 The presented data were obtained from the archives of the founder of Biljana Konfekcija AD Prilep in Biiljana Incubator
Ltd. Prilep and interview with grad. lawyer Saso Murgoski proxy holder from the founder of Biljana Konfekcija AD Prilep.

REDETE – ECONOMIC DEVELOPMENT AND ENTEREPRENEURSHIP IN TRANSITION ECONOMIES
134
Table 1: The shareholders of Biljana Incubator LLC Prilep
Name of the shareholder %
Biljana Spinning Mill Incorporated – Prilep 70 %
Biljana Vatara Incorporated - Prilep 15 %
Confection Biljana JSC - Prilep 15 %
Total 100 %
The company had office space of 1.900 m2 and physical capital, consisting of property and
equipment of 18.740.000,00 MKD in total.
Table 2: The capital of the company
Capital %
Equipment 80 %
Property 20 %
Total 100 %
At the beginning there were three employees, and today is only one employee. The companies interested in using the services from the incubator are called participants in the
incubator, and they can use space, equipment, economic and bookkeeping services (with symbolic price), legal services, consulting services and much more.
From the beginning until today, with the business incubator "Biljana" 30 companies had been doing business, mainly from the production area such as production of plastic products, electrical materials, food and textiles, and also with some trading companies. The number of employees in the companies that were supported by this incubator ranges from 2 to 15 employees. The companies that are participants can use the incubator’s services from three to four years. After that they should leave the current premises or stay there by paying the regular rent and the other liabilities. The rent in 1997 was around 1 € – 1,5 € per m2, and after 2010 they increased for 15%.
Table 3: The cost for rent per m2
Year € per m2
1997 1,00 € – 1,50 €
1998 1,00 € – 1,50 €
1999 1,00 € – 1,50 €
2000 1,00 € – 1,50 €
2001 1,00 € – 1,50 €
2002 1,00 € – 1,50 €
2003 1,00 € – 1,50 €
2004 1,00 € – 1,50 €
2005 1,00 € – 1,50 €
2006 1,00 € – 1,50 €
2007 1,00 € – 1,50 €
2008 1,00 € – 1,50 €

REDETE – ECONOMIC DEVELOPMENT AND ENTEREPRENEURSHIP IN TRANSITION ECONOMIES
135
Year € per m2
2009 1,00 € – 1,50 €
2010 1,15 € – 1,75 €
2011 1,15 € – 1,75 €
2012 1,15 € – 1,75 €
It should be noted that the participating companies who have been using the incubator services
during the first three years have provided enough potential for economic independence and further successful operating. Today, more than half of those companies that have used the services are in other offices and some of them are using the offices in the incubator. It should be emphasized that among both, there are profitable companies (LLC Polymers-Prilep, plastic; LLC Afiks Prilep plastic tables; LLC Terracotta Engineering-Prilep, construction).
It is important to mention that none of the companies that have been using the services from the incubator in the initial period is not bankrupt or started a liquidation procedure.
In the establishment of the incubator the Government was also participating. According to the agreement for establishment, the Government was bound to support the incubator for 10 years, until 2007, and after this period the incubator continued to work independently, offering the same services to its participants. After a period of three years, the participants started to pay rent in accordance to the decisions of the incubator, but which still was lowest in the city. The local government did not offered any facilities for the operation of the incubator.
The premises that were given to the new business entities were with complete infrastructure needs (access to electricity, water, drainage). The costs were covered from the participants in the incubator. Depending on the activities of the companies, the business incubator brought the facilities to usable condition.
According to Mr. Murgoski, who stated with regret that this incubator (the last from the first six) will be terminated due to lack of conditions for survival. The reasons are the following:
1. Two of the shareholders ceased to exist due to implemented bankruptcy proceedings and the premises that participated in the incubator can no longer be used for that purpose;
2. The accounting services that the incubator was offering so far will not be available any more for future users. This is due to changes in the legislation in the field of accounting (special license, liability insurance, etc..);
3. The remaining shareholder has no interest to continue with the activity because neither central nor local authority offers some advantages;
4. The business conditions have deteriorated, so it is difficult to find a new user if the current users eventually decide to leave52.
Centers for business and technical innovation
The business or technical innovation centers are high-tech version of the business incubators. In the U.S. they are most common and usually associated with one of the universities and are designed to help the local innovators or other entities to commercialize their inventions. In fact, they help to the start up of the new companies, they offer research labs and the services of the professors. The innovation centers during their operations have established cooperation with the institutions that deal with registration and protection of patents. Also, they developed relations with various institutes for technical services, especially in developing some prototypes or other products, then did some cooperation with institutions that provide financial services and that have
52 Same, the interview was made on 13th September, 2012.

REDETE – ECONOMIC DEVELOPMENT AND ENTEREPRENEURSHIP IN TRANSITION ECONOMIES
136
access to the needed capital, until finding a company that might be interested in the production and further distribution of the newly discovered products or inventions.
First such center in the Republic of Macedonia is the European Information and Innovation Center (EIIC), as a member of EEN53. It is a consortium composed of four institutions, establis-hed in 2008 with support from the European Commission and the Government of the Republic of Macedonia. Coordinator of the Center is the University "Ss. Cyril and Methodius ", and members are the Foundation for Management and Industrial Research, the Agency for Support of Entrepreneurship and Economic Chamber of Macedonia. The reason for the establishment of EIIC is creating a system of organized access to foreign markets for Small and Medium Enterprises (SME). Its goal is to help in transcending the national barriers and in forming international partnerships for cooperation in the fields of business, science, innovation and technological development. The main goal of this project is to facilitate the improvement of the competitiveness and innovation of SME, to increase access to information on doing business and improve their technological level.
EIICM services are designed for small and medium enterprises, but they are available for all business and research centers, and universities in Macedonia. The EIIC helps in establishing cooperation between small and medium enterprises and the scientific, research and development centers. In this way it enables the application of scientific advances in the manufacturing processes through the introduction of innovative technologies. Also the EIIC enables close cooperation of the SME with the international academic potential. The center offers the necessary information on the business opportunities of the European Union to all domestic enterprises that are interested to find the solution to the dilemmas related to the European Union market. Activi-ties that are undertaken are referred to: seeking business partners in business cooperation bases and quick access to the information about the funds, searching partners for technology exchange, individual visits to the companies for evaluation of their needs, organizing national and international fairs, requesting partners for participation in EU FP7 Framework Programme and the European Information and Innovation Centre in Macedonia as part of the European Network of Enterprise (Enterprise Europe Network – EEN), publishing a number of promotional and infor-mational materials on topics related to the EU-entrepreneurship. Representatives of the Centre help the entrepreneurs to understand the European legislation, in the way it is applied in business and how to achieve the maximum of the internal European market and European programs.
According to its position, it is a specialized and practical facilitator for the implementation of many projects related to the competitiveness and innovation, and not only in the domain of scientific centers and enterprises, but also beyond, as it is in direct relation with the European Commission. Namely, through the joint programs that can be implemented. Furthermore, it is a key instrument for the implementation of the CIP program (Competitiveness and Innovation Framework Programme) of the European Union54.
So far EIIC has achieved a lot off successes in their work. The successfully implemented the activities under the Action Plan CIP program of the European Commission, can be distinguished as follows: An internal data-base with internet access for the overall management of the project, as well as records of scientific institutions and enterprises in Macedonia, scanning their needs and problems in order to ease and resolve them, finding partners for science, business and technology
53 Enterprise Europe Network (EEN) is the largest business network linking Europe, which helps the companies to improve
their performance and to innovate through partnerships, information and vocational counseling. This new European network for support SMEs started in January 2008 and was formed with the merging of the two largest European networks that for many years worked in their domains: Network of Euro Info Centres (EIC) and the Network of Innovation Relay Centre (IRC). They were existing no more than 10 years and had developed a number of tools, methods and approaches to the work that today are summarized in a single network. Enterprise Europe Network is present in 45 countries and it is comprised of more than 600 partner organizations, so that its services are available through 25 million companies in the EU and companies from countries that are not EU members but part of the network.
54 EU programs for SMEs in Macedonia, University "Ss. Cyril and Methodius ", 2010.

REDETE – ECONOMIC DEVELOPMENT AND ENTEREPRENEURSHIP IN TRANSITION ECONOMIES
137
cooperation, transfer of technology, continuous promotion of profiles for science, business and technology cooperation in the monthly newsletter and website EIIC (www.een.mk), promoting the EU calls for proposals, assistance in the scientific and business-communication between scientific and business organizations, finding partners for participation in research projects within the FP7 framework program and European programs, on regularly basis to inform the Macedonian com-panies for the European programs and tenders, maintenance, training and organizing events for the scientific and business environment, organizing numerous visits to the companies, answering questions about business opportunities and national and EU legislation set by the Macedonian and European enterprises, organized visiting to the international fairs in order to achieve greater internationalization of Macedonian companies, publishing promotional materials EU topics, and an introduction with services and economic activities of EIIC55.
Therefore, the activities and results of the European Information and Innovation Centre in Macedonia were positively assessed by the Directorate-General for Enterprise and Industry (DG Enterprise and Industry) of the European Commission.
Our country and the countries with similar level of development encourage the competitive-ness of the private sector. Developed economies do the same. One of the measures is the Enterprise Europe Network, as a key instrument of the Competitiveness and Innovation Progra-mme, which supports the activities of the small and medium enterprises.
The inclusion of the Republic of Macedonia in this program will provide networking of the Macedonian companies with over 400,000 companies in the EU where they can find available funds to improve their competitiveness and innovation56.
The European Information and Innovation Centre for Macedonian companies will open the opportunity to connect the companies with business partners, to improve the awareness, to fa-miliarize with European best practices for doing business, to raise the technological level and the degree of innovation, to encourage scientific research and the development component. It should, also, lead to the establishment of strong international links for our small and medium enterprises, and open the possibility of their participation in the implementation of scientific research and innovative projects.
Let's hope that all of this, in the context of meeting the European standards and achieving a functioning market economy, will contribute to a better integration of the Macedonian companies in the competitive single European market.
Conclusion
Following the experiences of the developed countries, either through scientific thought, legis-lation or practice, it can be concluded that the incubators with main goal to utilize the available office space and to create new jobs have played a significant role in the development of the national economies, especially at the local level.
Unfortunately, although using the experiences from the world economy, Republic of Mace-donia has taken appropriate legislation changes and build appropriate institutional infrastructure, but still cannot boast with a high participation of the incubators in the national economy. According to the testimony of one of the direct participants in these incubators in future instead the incubators to develop even more they are going to vanish. Reasons certainly lie in the unwillingness of the central and local governments, to direct their efforts in supporting the Programs. The benefits from this will be felt by all stakeholders (central government, local go-vernments, business sectors, etc.).
55 Same. 56 Same.

REDETE – ECONOMIC DEVELOPMENT AND ENTEREPRENEURSHIP IN TRANSITION ECONOMIES
138
According to what has been done by the normative aspects and organizational structure, it only remains to hope that the innovative centers will contribute for better integration of the Macedonian companies in the competitive single European market, in the context of fulfilling the European standards and achieving a functional market economy.
References
1. Ph.D. Taki Fiti, Ph.D. Verica Hadzi Vasileva – Markoska, Milford Bateman. Entrepreneur-
ship, University "Ss. Cyril and Methodius "- Skopje, second edition, p 170. 2. Enrico Callegati, Silvia Grandi, Glenda Napier (2005). Business Incubation and Venture
Capital-An International Survey on Synergies and Challenges, Instituto per la Promozione Industriale and International Organisatiotn for Knowledge Economy and Enterprise Development, January, 2005, p.9.
3. (2005). Guidelines for the establishment and operation of small business incubators, Ministry of Economy and Entrepreneurship Support Agency of the Republic of Macedonia, Skopje.
4. Information taken from http://pretpriemac.mk/ (accessed 08.05.2012). 5. (2010) EU programs for SMEs in Macedonia, University "Ss. Cyril and Methodius" – Bitola,
Republic of Macedonia. 6. Information taken from http://ec.europa.eu/enterprise-europe-network, (accessed 08.05.2012). 7. Information taken from http://www.mir.org.mk/ (accessed 08.05.2012). 8. Information taken from http://www.apprm/gov.mk/proekti.asp (accessed 08.05.2012). 9. Information taken from http://www.finance.gov.mk/node/1178 (accessed 08.05.2012).

REDETE – ECONOMIC DEVELOPMENT AND ENTEREPRENEURSHIP IN TRANSITION ECONOMIES
139
FOSTERING INNOVATIONS ON FACULTIES AND NEED OF CONNECTING THEM TO THE BUSINESS SECTOR
Danijela PERKUŠIĆ MALKOČ57
Katja RAKUŠIĆ CVRTAK58 Senka BOROVAC ZEKAN59
Abstract
INTRODUCTION
Innovations are the key component of the success of each company and the national econo-my as well. In times of crisis they presents the only lifeline for the tottering economy. The ques-tion is how to reach a successful innovation? Certainly not by not fostering creativity, different ways of thinking, or by creating the atmosphere of fear of mistakes. Innovations emerge in a positive environment that allows mistakes, that values everyone's opinion, environment which encourages and motivates. Faculties today mostly provide theoretical knowledge and real pra-ctical application of this knowledge remains largely not realized. Students are unmotivated and professors are mostly underpaid and overworked with their teaching and other administrative tasks. Only truly enthusiasts are trying to make a difference and begin to build a different app-roach to the role of education today. However, it is inevitable to have the support of the system and important institutions, otherwise it would be Sisyphean work.
The question is what to do to foster innovations on faculties? How to encourage students and professors to think like innovators and entrepreneurs as well? Can faculties be good entre-preneurs? In addition, it is necessary to connect universities with companies in order to achieve mutually beneficial cooperation. In this article we will try to find answers to these questions.
RESEARCH METHOD
Learning a lesson from faculties who have managed to achieve and realize their innovations in practice, we will try to find factors that are crucial for the development of innovations in fa-culties and their successful commercialization in the market. Based on the case study of Croati-an faculty we will give an example of how in the time of recession a successful innovation can be created and how it is possible to achieve a successful collaboration between faculty and bu-siness sector.
RESULTS
The results of this article will be mutualy beneficial to faculties and to business sector as we-ll as they will provide clear guidelines of how to foster innovations on faculties and how to ma-ke them closer to the practice and business sector.
Keywords: innovations, universities, entrepreneurship, business start-ups,
57 University Centre for Professional Studies, Livanjska 5, 21000 Split, e-mail: [email protected] 58 University Centre for Professional Studies, Livanjska 5, 21000 Split, , e-mail: [email protected] 59 University Centre for Professional Studies, Livanjska 5, 21000 Split, e-mail: [email protected]

REDETE – ECONOMIC DEVELOPMENT AND ENTEREPRENEURSHIP IN TRANSITION ECONOMIES
140
Introduction
Although university research in many developed countries has spun-off numerous high impact start-up ventures, most of these companies originated from a small number of highly entrepre-neurial universities. According to a recent study by O’Shea et al. (2005) the average research university in the US generates an average of 1.91 spinoffs per annum. This mean value also masks a highly skewed distribution in the data in which the most productive university, MIT, spawned 31 spinoffs in one year alone (O’Shea et al. 2005).
With increasing pressure on universities to generate economic returns from government research support, how policy makers and academics can stimulate technology-based entrepre-neurship from universities is an important issue. The challenge lies in identifying and replicating the processes that facilitate swift movement of technology from the ivory tower of academia to the front-line of industry (Allen et al. 1979; Allen and Sosa 2004; Birley 2002; Lacetera 2006; Mowery and Shane 2002; Wright et al. 2004a; Markman et al.2004). This growing acceptance of the importance of academic entrepreneurship to national economies has been reflected in the explosion of policy and research publications seeking to better understand and address the forces that shape spinoff activity in higher education institutions. This recent research has served to refine, supplement, and in some cases, challenge our understanding of the complex forces shaping university spinoff creation in higher education institutions.
In this article will be presented the most important determinants of university entrepreneurial activity according to previous researches, it will also be presented a new model of faculty, industry and government cooperation created by the authors of this article. In the end will be shown a good example of cooperation between faculty and industry in a case study of one Croatian faculty.
Determinants of university enterpreneurial activity (spin-off)
We argue that the extant literature can be divided into six distinct research streams: (1) studies that focus on the individual and the personality of the individual as the key determinant of whether spinoff activity occurs; (2) organizational configuration studies that seek to explain spinoff activity in terms of university resources; (3) socio-cultural development studies that explain spinoff activity in terms of culture and the rewards within the university; (4) studies that explain spinoffs in terms of external environmental influences; (5) studies that examine the development and performance of spinoffs; and (6) studies that seek to measure the economic impact of spinoff activity.
Roberts and Malone (1996) define spinoffs as a mechanism in which governments seek to generate economic impact from their R&D by transferring technology from the R&D function to a commercial organization. Similarly, Steffensen et al. (1999) and Rogers et al. (2001) define spinoffs based on the parent R&D. They include the government R&D laboratory, the university, the university research center, and private R&D organizations as examples. Nicolaou and Birley (2003a) and Smilor et al. (1990) take account of the human element and state a spinoff is formed by individuals who were former employees of the parent organization. (Nicolaou and Birley, 2003a) build further on this work and put forward a trichotomous grouping of spinoff formation. Their model looks at the type of network the academics may be embedded in prior to initiation of the spinoff. These are: (1) orthodox—both the technology and the academic inventor(s) spin off from the institution; (2) hybrid—the technology spins out from the institution but the academic inventor(s) place in the university is retained and may hold some other part time position in the company; and (3) technology—only the technology spins out and the academic inventor(s) maintain no connection with new firm but may have equity.
On making that critical career choice, the authors also put forward the notion that academic may exist in either one of two conditions, which are: (1) academic exodus—the inventor leaves

REDETE – ECONOMIC DEVELOPMENT AND ENTEREPRENEURSHIP IN TRANSITION ECONOMIES
141
the university to be solely with the firm; and (2) academic stasis—the inventor stays in the university and may or may not have a position in the company (Nicolaou and Birley 2003b).
Individual attributes as determinants of spinoff activity
A number of studies highlight the importance of entrepreneurial attributes in shaping the in-dividual’s behavior and whether an academic will establish a spinoff. Other researchers have stressed the role of the personality, motivation and disposition play in influencing academic entrepreneurship. (Roberts, 1991) for example, found that academic entrepreneurs with outgoing, extro-verted personalities were more likely to engage in spinoff activity. Furthermore, from a study of almost 130 technical entrepreneurs and almost 300 scientists and engineers, he concluded that personal characteristics such as the need for achievement, the desire for independence and an internal lokus of control were common in both groups.
Tenure in universities, occupational and research skill levels amongst academics were also found to impact university spinoff behavior. (Audretsch’s, 2000) analysis of academic entrepre-neurs found that university entrepreneurs tended to be older and more scientifically experienced than ‘‘typical’’ high-technology entrepreneurs. Similarly, (Zucker et al., 1998a) used data on Cali-fornia biotechnology companies and found scientific ‘‘stars’’ collaborating with firms had substantially higher citation rates than pure academic ‘‘stars’’. Overall, the common theme shared by this stream of research is that spinoff behavior is a reflection of individual actions and the-refore is largely due to the personality, ability, career choice, or willingness of the individual to engage successfully in entrepreneurial behavior.
Organizational determinants of university spinoff activity
One factor that has received attention as one of the organizational determinants of university spinoff activity is the level and nature of funding for R&D activities within the university. For example, Lockett and Wright (2005) found the number of spinoff companies created from UK universities were positively associated with R&D expenditure. Blumenthal et al. (1996) surveyed 2,052 faculties at 50 universities in the life sciences field and found industry-funded faculty members to be more commercially productive.
Faculty quality has also been cited as another factor that influences spinoff activity. Zucker et al. (1998b) linked the intellectual human capital of ‘star’ scientists to the founding of new firms in the American biotechnology industry and to their growth and location. Stuart and Ding (2006) have more recently shown that, although it was distinguished scientists who made the transition into academic entrepreneurship, the professional gap between participants and non-participants in academic entrepreneurship was diminishing over time.
In order to improve university and commercial ties with industry, some universities operate a technology transfer office (TTO) as a vehicle to support the creation of spinoff companies (Hague and Oakley, 2000). Their role has been described as facilitating technological diffusion from university research to industry (Siegel et al. 2003); managing and enhancing the value of the university’s intellectual property (Meseri and Maital 2001); and assisting researchers in disseminating research results for the public good (Carlsson and Fridh 2002).
Roberts & Malone describe the TTO’s involvement as: - assuming the role of principal decision maker while they evaluate the invention;
- making arrangements for the legal protection of the technology;
- directing the entrepreneurs to venture capitalists;
- establishing their representation on the board of the company.

REDETE – ECONOMIC DEVELOPMENT AND ENTEREPRENEURSHIP IN TRANSITION ECONOMIES
142
The TTO role has also been seen in a less positive light with regard to their behavior towards spinoffs. For example, Siegel et al. (2003) found the marketing and negotiation skills of the TTO personnel to be seen as dissatisfactory by 55% of the entrepreneurs, scientists and administrators they interviewed. According to the study, the TTO was shown to be inflexible and conservative in some respects. Markman et al. (2005) found the greater the innovation speed of TTOs, the greater the propensity to generate returns to the university via higher rates of startup formation.
Institutional determinants of spinoff activity
The central tenet of the third stream of research is that university spinoff activity is a reflection of institutional behavior. This research suggests that universities with cultural norms that support commercialization activity will have higher levels of commercialization and higher rates of spinoff activity. For example, O’Shea at al. (2007) argue that MIT’s founding mission and institutional support towards entrepreneurial activities played an important role in the develop-ment of academic entrepreneurship at MIT.
George et al. (2006) took a two-part inductive-deductive study of 796 scientists at a large pu-blic research university. The authors found that the perceptions of institutional support in terms of department norms and technology transfer office (TTO) receptiveness played a crucial role. More specifically, the authors have found that the extent to which institutional factors were viewed as being supportive, the more likely scientists were prepared to participate in technology transfer activity. Kenney and Goe (2004) also contend that ‘the involvement of professors in entrepre-neurial activity is influenced by the social relationships and institutions in which a professor is embedded.
Djokovic and Souitaris (2007) concur with this view that: ‘the changing role of universities towards commercialization activities combined with governmental and institutional support mechanisms is creating a fertile ground for the seeds of university spinoffs’. Louis et al. (1989) also found that local group norms were important in predicting active involvement in comerciali-zation. Thursby and Kemp (2002) found that less than half of faculty inventions with commercial potential are disclosed to the TTO. In some cases this may be because those who are involved do not realize the commercial potential of their ideas, but often it is due to the unwillingness to delay publication that results from the patent and licensing process (Thursby and Kemp 2002). Restrictive leave of absence policies, whereby academics find it difficult to move between academia and the private sector, have also been shown to negatively impact spinoff activity. For example, Di-Gregorio and Shane (2003) found evidence that university technology transfer policies that allocate a higher share of inventors’ royalties decrease spinoff activity because of the increased opportunity cost in engaging in firm formation. In contrast, other research has shown universities that give higher percentages of royalty payments to their faculty members positively impact the efficiency of university technology transfer activities (Link and Siegel 2005).
Universities that lack a culture supportive of commercialization activity may take a number of actions. For example, Stuart and Ding (2006) found strong evidence of the socially and spatially localized spread of commercial science in the US. According to the authors, scientists are more likely to become entrepreneurs when they work in departments where colleagues had previously made the transition, particularly when the individuals who had become commercialists were prestigious scientists. Furthermore, Siegel et al.(2004) propose that in order to foster a climate of entrepreneurship within academic institutions, university administrators should focus on five organizational and managerial factors: (1) reward systems for University Industry Technology Transfer (UITT); (2) staffing practices in the TTO; (3) university policies to facilitate university technology transfer; (4) increasing the level of resources devoted to UITT; and (5) working to eliminate cultural and informational barriers that impede the UITT process.

REDETE – ECONOMIC DEVELOPMENT AND ENTEREPRENEURSHIP IN TRANSITION ECONOMIES
143
External determinants of spinoff activity
The fourth stream of research emphasizes the impact of broader economic factors on acade-mics within universities. Four factors that could impact spinoff activity are access to venture capital, the legal assignment of inventions (or more specifically in the US, the enactment of the Bayh-Dole Act), the knowledge infrastructure in the region and industry structure.
Florida and Kenney (1988) highlight the central role of the availability of venture capital in encouraging the formation of high-technology companies. However, more recent research shows that access to venture capital is the most important resource constraint faced by universities (Wright et al. 2006). In fact, early on in the spinoff process, Wright et al. (2006) found that spinoffs view venture capital as more important than internal funds.
In contrast to this, their findings from venture capitalists showed that they prefer to invest after the seed stage, therefore implying a mismatch between the expectations of spinoffs and venture capitalists. Wright et al. (2004b) have also suggested the involvement of industry functioning as venture capitalists via joint venture spinoffs may facilitate the emergence of university spinoffs as they have the necessary financial resources and commercial expertise to launch successful start-ups.
DiGregorio and Shane (2003) found no evidence that the number of venture capital invest-ments, or the presence of university venture capital funding are related to the amount of university spinoff activity. According to Shane (2004b), another significant impetus in the generation of university spinoffs in the US was the enactment of the Bayh-Dole Act whereby inventions were assigned to academic institutions rather than individual inventors. US universities then became directly involved in patenting and licensing activities and set up TTOs to manage this activity (Sampat 2006), the number of which has dramatically increased since Bayh-Dole (Colyvas et al. 2002). Some European studies show national policies which allow inventions to be assigned to academic inventors, have inhibited spinoff activity (Wallmark1997). Other researchers suggest national policies of assigning inventions to individuals can lead to an anti-entrepreneurial attitude among faculty and university administrators who do not gain from inventors’ entrepreneurial activity (Goldfarb and Henrekson, 2003).
The knowledge infrastructure of a region is also cited as a key factor determining spinoff activity. The phenomenon of entrepreneurial universities supported by incubating technopole regions such as Route 128 and Kendall Square in Cambridge, MA with a strong comercialization tradition is well documented in the literature (O’Shea et al. 2007). However, Feldman and Desrocher’s (2004) study on John Hopkins also highlight difficulties faced by universities’ in promoting academic entrepreneurship with surrounding weak entrepreneurial infrastructure of a region. Feldman and Francis (2003) argue that even though universities seem to be necessary for the development of biotech concentration, the existence of a high ‘knowledge base’ alone might not be enough. Kenney (2000) supports this view and shows that Silicon Valley continues to be successful because of all the ‘regional infrastructure’ elements needed to create new industries exists there.
Triple-heliks model
The Triple Helix thesis states that the university can play an enhanced role in innovation in the increasingly knowledge-based societies. The Triple Helix is a metaphor that stresses the network overlay of communications and expectations that reshape the institutional arrangements among the different strands of the helix universities, industries, and governmental agencies. The emergence of concepts like the academic entrepreneurs and entrepreneurial university reinforce this notion. Increasingly, analysts have embarked on efforts to demonstrate technological, if not industrial, utility of scientific research. The Triple Helix unites different types of research related

REDETE – ECONOMIC DEVELOPMENT AND ENTEREPRENEURSHIP IN TRANSITION ECONOMIES
144
to how university, industry and government interact. Etzkowitz and his colleagues view the Triple Helix as a model of university, industry and government relations that transcends previous models of institutional relationships with the knowledge sector playing only a subsidiary role. In a knowledge-based economy, the university becomes a key element of the innovation system both as human capital provider and seed-bed of new firms (Meyer et al., 2003).
Figure1. Triple-helix and innovation process
Triple Helix concept suggests that entrepreneurship is fast becoming the third mission of universities, in addition to education and research. It also suggests that the different institutions of university, industry and government are closely interwoven, and that at least part of their activities overlap. As outlined earlier, university, industry and government, while still having genuine functions and roles within the innovation process, take over the role(s) of the other institutions or helices to some extent. Thus, the university is primarily the location of education and, more importantly in this context, of research, while industry is still the main user/beneficiary of research. However, universities, at least some of them, have increasingly become inclined to capitalize research results. This often takes the form of patenting certain inventions. Then efforts are undertaken to utilize the technology in one way or another. The university may have a science park or other incubator facilities, or it may run an entrepreneurship program open to science and engineering faculty.
Innovation pool model
Cooperation between universities, industry and government is an important prerequisite for the occurrence of innovation and economic growth of any economy, particularly in developing economies such as Croatia. Innovations that occur at universities often do not find the right application in practice. Mistrust and lack of proper communication between faculty, industry and government leads to a negative climate that is not conducive to establishing a true collaboration. One way to change that is the establishment of technology transfer offices at universities. But
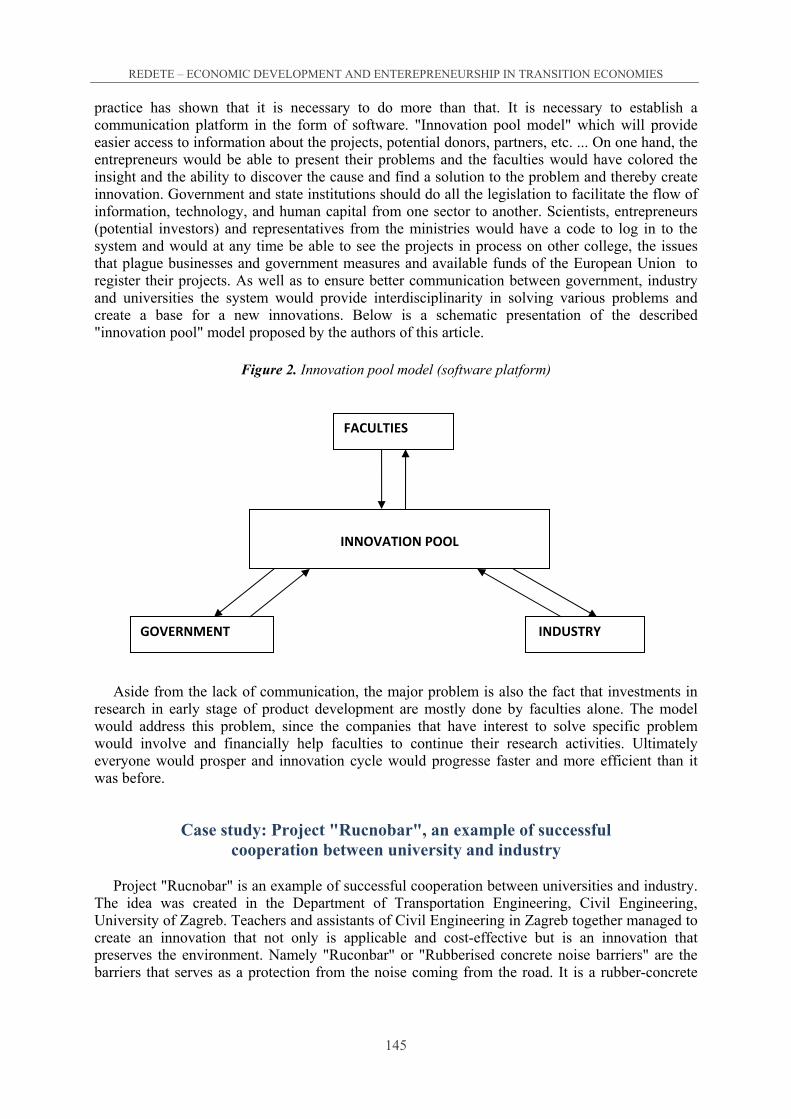
REDETE – ECONOMIC DEVELOPMENT AND ENTEREPRENEURSHIP IN TRANSITION ECONOMIES
145
practice has shown that it is necessary to do more than that. It is necessary to establish a communication platform in the form of software. "Innovation pool model" which will provide easier access to information about the projects, potential donors, partners, etc. ... On one hand, the entrepreneurs would be able to present their problems and the faculties would have colored the insight and the ability to discover the cause and find a solution to the problem and thereby create innovation. Government and state institutions should do all the legislation to facilitate the flow of information, technology, and human capital from one sector to another. Scientists, entrepreneurs (potential investors) and representatives from the ministries would have a code to log in to the system and would at any time be able to see the projects in process on other college, the issues that plague businesses and government measures and available funds of the European Union to register their projects. As well as to ensure better communication between government, industry and universities the system would provide interdisciplinarity in solving various problems and create a base for a new innovations. Below is a schematic presentation of the described "innovation pool" model proposed by the authors of this article.
Figure 2. Innovation pool model (software platform)
Aside from the lack of communication, the major problem is also the fact that investments in research in early stage of product development are mostly done by faculties alone. The model would address this problem, since the companies that have interest to solve specific problem would involve and financially help faculties to continue their research activities. Ultimately everyone would prosper and innovation cycle would progresse faster and more efficient than it was before.
Case study: Project "Rucnobar", an example of successful cooperation between university and industry
Project "Rucnobar" is an example of successful cooperation between universities and industry. The idea was created in the Department of Transportation Engineering, Civil Engineering, University of Zagreb. Teachers and assistants of Civil Engineering in Zagreb together managed to create an innovation that not only is applicable and cost-effective but is an innovation that preserves the environment. Namely "Ruconbar" or "Rubberised concrete noise barriers" are the barriers that serves as a protection from the noise coming from the road. It is a rubber-concrete
FACULTIES
GOVERNMENT
INNOVATION POOL
INDUSTRY

REDETE – ECONOMIC DEVELOPMENT AND ENTEREPRENEURSHIP IN TRANSITION ECONOMIES
146
barrier and the main materials are old tires. As well as protecting the residents from the noise, they also have multiplicative positive environmental impacts such as:
- Using recycled rubber as the main raw material
- Do not use clay, wood, plexiglass or glass that is often used as a barrier against noise
- Have a longer life span
- Are more stable
- Have a greater opportunity of recycling... etc.
Table 1. Comparison with other noise protection barriers
Source: Internal data of Faculty of Civil Engineering, University of Zagreb
The table above shows the ecological and economic benefits of the innovation. It is a light
concrete, which encompasses the 50% rubber derived from recycling old tires, so this form of protection against noise has the following advantages:
- Waste found on road
- Contribution to waste management
- Environmentally friendly product
- Sustainable production
- An innovative product
- Original Croatian patent
From the idea to the testing laboratory samples and prototyping mostly happened at the Civil Engineering Faculty in Zagreb. It was only later when creating the final product and its testing on the roads involve industry. Although there was an initial distrust between the university and industry, in the end cooperation has been established for the mutual benefit. The European Union has stated that there is no competitiveness without cooperation between universities and the industry and that it was this collaboration the strongest engine of economic growth.
CONCRETE recycled
tyres
CONCRETE Expanded
clay
CONCRETE Wooden fiber
Wooden barrriers
Transparencie barriers
Aluminium barriers
Apsorption 4 4 4 5 - 5 Izolation 5 5 5 5 4 5 Design 4 4 4 3 5 5
Duration 5 5 5 2 2 4 Stability 5 5 5 3 2 3
Maintenance 5 5 5 1 3 5 Renewable 4 1 3 3 5 1 Recycable 4 1 2 2 1 1
Reuse 5 5 4 3 1 4 Price 5 4 4 5 1 2
Total score 4.6 3.9 4.1 3.2 2.4 3.5

REDETE – ECONOMIC DEVELOPMENT AND ENTEREPRENEURSHIP IN TRANSITION ECONOMIES
147
Photography 1: “Ruconbar“ noise protection barrier
Source: Faculty of Civil Engineering , Zagreb, internal data
Since this is eco -innovation they applied a project to EU funds accurately for the CIP prog-
ram, ECO-innovation. After making detailed documentation, together faculty and industry mana-ged to get the funds necessary to finance exports to the EU market. They also founded a consortium made up of representatives of Faculty of Civil Engineering and representatives of industry. They used to meet twice a week to arrange the details related to the project. They formed a database and a common e-mail address in order to communicate more easily. They received funding from the European Union and continued to sell their eco-innovation in Croatia and the countries in the region.They are also slowly but surely gaining the markets of the European Union.
Conclusion
There are lots of factors influencing entrepreneurship activities on faculties from individual factors, organizational factors to institutional and other external factors. The major problems are the lack of communication between faculties, industry and government and the lack of financial support in the first stages of product development as well. To overcome those obstacles we suggest implementation of software platforme named “innovation pool model”. This model would collect information and contacts from faculties, industry and government institutions in order to establish better communication and opportunity for innovations to be faster transfered to the industry sector.
In this article it has been presented an example of good cooperation between faculty and in-dustry in creating new innovative product . There is still distrust in entrepreneurship activities on faculties in transition countries, in this case in Croatia, but situation is changing for better every day. If the national economies want to compete in the global market, they have to realize the importance of cooperation between faculties, industry and government in creating new innovative products.
Reference
1. Allen, T. J., & Sosa, M. L. (2004). 50 years of engineering management through the lens of the IEEE Transactions. T-EM Nov. 391–395.
2. Allen, T. J., Tushman, M. L., & Lee, D. M. (1979). Technology transfer as a function of position in thespectrum from research through development to technical services. Academy of Management Journal. 22(4), pp.694–708
3. Audretsch, D. (2000). Is University Entrepreneurship Different? Mimeo, Indiana University. Birley, S. (2002). Universities, academics and spinout companies: lessons from imperial. International Journal of Entrepreneurship Education. 1(1), pp.1–21

REDETE – ECONOMIC DEVELOPMENT AND ENTEREPRENEURSHIP IN TRANSITION ECONOMIES
148
4. Blumenthal, D., Campbell, E. G., Causino, N., & Louis, K. (1996). Participation of life scie-nce faculty in research relationships with industry. New England Journal of Medicine. 335, pp.1734–1739
5. Carlsson, B. & Fridh, A.-C. (2002). Technology transfer in United States universities: a survey and sta-tistical analysis. Journal of Evolutionary Economics, 12, 199–232
6. Colyvas, J., Crow, M., Gelijns, A., Mazzoleni, R., Nelson, R. R., Rosenberg, N., & Sampat, B. N. (2002). How do university inventions get into practice? Management Science, 48(1), pp.61–72
7. DiGregorio, D., & Shane, S. (2003). Why do some universities generate more start-ups than others Research Policy. 32(2), pp. 209–227
8. Djokovic, D., & Souitaris, V. (2007). Spinouts from academic institutions. A literature review with suggestions for further research. Journal of Technology Transfer (forthcoming).
9. Feldman, M. P., & Desrochers, P. (2004). Truth for Its own sake: Academic culture and technology transfer at the Johns Hopkins University. Minerva, 42(2), pp. 105–126
10. Feldman, M. P., & Francis, J. (2003). Fortune favors the prepared region: The case of entrepreneurship and the capitol region biotechnology cluster. European Planning Studies. 11, pp. 765–788
11. Florida, R., & Kenney M. (1988). Venture capital-financed innovation and technological change in theUnited States. Research Policy. 17, pp. 119–137
12. George, G., Jain, S., & Maltarich, M. (2006). Academics or entrepreneurs? Entrepreneurial identity and invention disclosure behavior of university scientists. Paper presented at the Uni-versity Technology Transfer and Commercialization of Research: Antecedents and Consequences Symposium. Academy ofManagement Conference Atlanta, USA.
13. Goldfarb, B., & Henrekson, M. (2003). Bottom-up vs. top-down policies towards the commercialization of university intellectual property. Research Policy. 32(4), pp. 639–658
14. Hague, D., & Oakley, K. (2000). Spin-offs and Start-Ups in UK Universities. Committee of Vice-Chan-cellors and Principals (CVCP) Report.
15. Kenney, M., & Goe, W. R. (2004). The role of social embeddedness in professorial entrepre-neurship: A comparison of electrical engineering and computer science at UC Berkeley and Stanford. Research Policy. 33, pp. 691–707
16. Lacetera, N. (2006). Different missions and commitment power in R&D organization: Theory and evidence on industry-university relations. MIT Sloan School Working Paper, 4528-05
17. Link, A. N., & Siegel, D. S. (2005). Generating science-based growth: An econometric analysis of the impact of organizational incentives on university-industry technology transfer. European Journal of Finance, 11(3), pp.169–181
18. Lockett, A., & Wright, M. (2005). Resources, capabilities, risk capital and the creation of uni-versity spin-out companies. Research Policy. 34(7), pp. 1043–1057
19. Louis, K. S., Blumenthal, D., Gluck, M. E., & Stoto, M. A. (1989). Entrepreneurs in academe: An explo-ration of behaviors among life scientists. Administrative Science Quarterly. 34(1), pp. 110–131
20. Meyer,M., Sinilainet, T.end Utecht, J.T. (2003). Hibrid Triple Helix indicators, Sciento-metrics. 58(2), pp. 321-350
21. Markman, G. D., Gianiodis, P. T., Phan, P. H., & Balkin, D. B. (2004). Entrepreneurship from the ivory tower: Do incentive systems matter? Journal of Technology Transfer. 29(3–4), pp. 353–364
22. Markman, G. D., Gianiodis, P. T., Phan, P. H., & Balkin, D. B. (2005). Innovation speed: Transferring university technology to market. Research Policy. 34, pp. 1058–1075
23. Meseri, O., & Maital, S. (2001). A survey of university-technology transfer in Israel: Evaluation of projects and determinants of success. Journal of Technology Transfer. 26(1–2), pp. 115–126
24. Mowery, D. C., & Shane, S. (2002). Introduction to the special issue on university entrepreneurship and technology transfer. Management Science. 48(1), v–ix.

REDETE – ECONOMIC DEVELOPMENT AND ENTEREPRENEURSHIP IN TRANSITION ECONOMIES
149
25. Murray, F. (2006). Exchange relationships & cumulative innovation: standing on the shoulders of on-comouse. Paper presented at the University Technology Transfer and Commercializa-tion of Research: Antecedents and Consequences Symposium, Academy of Management Conference, Atlanta, USA.
26. Nicolaou, N., & Birley, S. (2003a). Academic networks in a trichotomous categorisation of university spin-outs. Journal of Business Venturing. 18(3), pp. 333–359
27. Nicolaou, N., & Birley, S. (2003b). Social networks in organizational emergence: The university spinout phenomenon. Management Scienc., 49(12), pp. 1702–1725
28. O’Shea, R. P., Allen, T. J., Chevalier, A., & Roche, F. (2005). Entrepreneurial orientation, technology transfer and spinoff performance of U.S. Universities. Research Policy. 34, pp. 994–1009
29. O’Shea, R. P., Allen, T. J., Morse, K. P., O’Gorman, C., & Roche, F. (2007). Delineating the anatomy of an entrepreneurial university: The Massachusetts Institute of Technology Experie-nce. R&D Management ,37(1), pp. 1–16
30. Roberts, E. (1991). Entrepreneurs in high technology, lessons from MIT and beyond. Oxford: Oxford University Press.
31. Roberts, E., & Malone, D. E. (1996). Policies and structures for spinning off new companies from research and development organizations. R&D Management.26, pp. 17–48
32. Rogers, E. M., Takegami, S., & Yin, J. (2001). Lessons learned about technology transfer. Technovation. 21(4), pp. 253–261
33. Sampat, B. N. (2006). Patenting and US academic research in the 20th century: The world before and after Bayh-Dole. Research Policy. 35, pp. 772–789
34. Saxenian, A. (1994). Regional advantage: Culture and competition in silicon valley and route 128. Cambridge, MA: Harvard University Press.
35. Shane, S. (2004a). Academic entrepreneurship: University spin-offs and wealth creation. Cheltenham, UK: Edward Elgar.
36. Shane, S. (2004b). Encouraging university entrepreneurship: The effect of the Bayh-Dole act on university patenting in the United States. Journal of Business Venturing. 19(1), pp. 127–151
37. Siegel, D. S., Waldman, D., & Link, A. (2003). Assessing the impact of organizational practices on the relative productivity of university technology transfer offices: An exploratory study. Research Policy. 32, pp. 27–48
38. Steffensen, M., Rogers, E. M., & Speakman, K. (1999). Spin-offs from research centers at a research university. Journal of Business Venturing. 15, pp. 93–111.
39. Stuart, T. E., & Ding, W. W. (2006). When do scientists become entrepreneurs? The social structural antecedents of commercial activity in the academic life sciences. American Journal of Sociology .112(1), pp. 97–144
40. Thursby, J., & Kemp, S. (2002) Growth and productive efficiency of university intellectual property licensing. Research Policy. 31, pp.109–124.
41. Wallmark, J. T. (1997). Inventions and patents at universities: The case of Chalmers Univer-sity of Technology. Technovation. 17(3), pp. 127–139
42. Wright, M., Birley, S., & Mosey, S. (2004a). Entrepreneurship and university technology tran-sfer. Journal of Technology Transfer. 29(3–4), pp. 235–246
43. Wright, M., Lockett, A., Clarysse, B., & Binks, M. (2006). University spin-out companies and venture capital. Research Policy. 35, pp. 481–501
44. Zucker, L. G., Darby, M. R., & Armstrong, J. (1998a). Geographically localized knowledge: Spillovers or markets? Economic Inquiry. 36, pp. 65–86
45. Zucker, L. G., Darby, M. R., & Brewer, M. B. (1998b). Intellectual human capital and the birth of U.S. biotechnology enterprises. American Economic Review. 88(1), pp. 190–305

REDETE – ECONOMIC DEVELOPMENT AND ENTEREPRENEURSHIP IN TRANSITION ECONOMIES
150
BUSINESS FORECASTING IN THE FUNCTION OF GROWTH AND DEVELOPMENT OF ENTERPRISES BASED ON NEW
TECHNOLOGIES AND INNOVATIONS
Nikola VUKMIROVIĆ60 Drаgаn МILОVАNОVIĆ61
Abstract
In every business, innovations and development are essential for enterprises’ growth. Innovations itself bring change in enterprises’ every-day doing business, replacing previous state of uncertainty and fear with the state of continuous improvement and growth. Business forecasting is significant mechanism for early identification of business constraints in enterprises as well as forecasting mechanism for minting growth and development. Business forecasting is research of future aimed to estimate future values and trends of different internal and external factors influence on enterprises business. Its significance comes from continuous need to increase the level of planed decisions fulfilment and certainty. Strategy of technology development is closely connected with business strategy, and it is influenced with greater number of technological and non-technological factors. The strategy’s importance comes from the fact that technology is factor which mainly determines enterprise’s competitiveness. Optimal strategy of enterprise’s technology development is usually deve-loped in accordance with strategies on higher strategic levels and on the grounds of demonstrated technology development in the past and presence as well as on forecasted and pre-valued technology development alternatives in the future. Innovation is every system of organised and purposeful driven actions focused on inducting change (new product, production process, organisation structure, management style etc.). In the paper, special attention will be given to identification of the role of innovations in enterprises growth and development. In that purpose, an overview of different theoretical opinions on the role of innovations in enterprises growth and development will be given as well as analysis of basic enterprise growth and developments benchmarks. Also, through the paper will be shown and mathematical analysis of innovation effects on growth and development of enterprises. The aim of the paper is to develop accurate mathematical model of valuing innovations effects on enterprises growth and development. Also, the aim of the paper is to, on the basis practical data interpretation and analysis of developed best practices, elaborate possibilities for innovations effects maximisation. In the paper will be used scientific methods of deduction, comparative analysis and analysis of best practices. Interpretation of paper’s results should serve as a base for professional and scientific discussion about business forecasting and its purpose in enterprises growth and development.
Keywords: Business forecasting, innovations management, new technologies, enterprises growh and development.
60Faculty of Economics, University of Banja Luka, Мајkе Јugоvićа 4, 78 000 Bаnjа Lukа, e-mail: [email protected] 61Faculty of Economics, University of Banja Luka, Мајkе Јugоvićа 4, 78 000 Bаnjа Lukа, e-mail: dra-

REDETE – ECONOMIC DEVELOPMENT AND ENTEREPRENEURSHIP IN TRANSITION ECONOMIES
151
Introduction
Innovations are the basis of technological progress and a key factor of technological and eco-nomic development. Models of innovativeness and creativity are excellent tools for sustainable survival and a key of successful doing business of micro, small and medium enterprises. Acco-rding to the Global Innovation Index, it is clearly recognized that the developed countries, and some neighboring countries, more competitive than Bosnia and Herzegovina because in these countries an innovations friendly environment is being gradually created. The rate of growth and progress in our country is very low; hence it is necessary to systematically redefine development policy, in order to reach the level of the European Union where entrepreneurship is dominantly of development character, not social. Innovation creates a resource! Innovation leads to a new resource that has not existed (or has existed, but had no usage value), or provides with possibility for usage of existing resource in a new way. Innovation capability is the most important factor of creating competitive advantage and business success nowadays. Innovations are necessary for survival, growth and development and competitive position progress. By innovating, an enterprise creates a “temporary monopoly”, which allows an enterprise to achieve additional profits on the market. A comparative analysis of B&H with other countries, using statistics data derived from Global Innovation Index, will be given in the form of concluding remarks as well as key reco-mmendations and guidelines for the economy policy improvement in order to strengthen creative thinking and level of B&H enterprises innovativeness. Modern technological progress is reflected in the fantastic development of technology through automatisation, computerization, telecommu-nications, microelectronics, robotization, biotechnology, genetic engineering, and general scien-tification.
1. Innovation sources and B&H enterprises innovativeness
Many researches in the World have shown the existence of strong correlation between innovation, entrepreneurship and economic development of the enterprise and as a result of the country at a whole. Peter Dracker says that innovation is “an organized and systematic work”, accompanied by serious analysis, market research, demographic trends, etc.62 As a consequence of need to measure the impact and effects of innovations on enterprise’s growth and development and thus on country’s growth and development, Global Innovation Index (GII) was created. The GII was created based on one of the most competitive scientific institutes - INSEAD’s methodology, which is supported by the Joint Research of the European Commission (JRC). Global Innovation Index (GII) relies on two sub-indexes: sub-index of scientific inputs and sub-index of scientific outputs, where each relies on specific pillars. Five input pillars include elements that enable innovative activities within the national borders/economy, and these are: institutions, human capital and research, infrastructure, market sophistication and business sophistication. Two output pillars include mechanisms for innovation outputs monitoring, and these are: scientific outputs and creative output. In Table 1 Structure of parameters (variables) that form the Global Innovation Index (GII) is presented.
62 Draker, Piter. Inovacije i preduzetništvo. Privredni pregled, Beograd, 1991, str. 232.

REDETE – ECONOMIC DEVELOPMENT AND ENTEREPRENEURSHIP IN TRANSITION ECONOMIES
152
Table 1: Structure of GII parameters
Innovation Input 3.2.2 Electricity consumption 5.3.1 Royalty and license fees payments 1 Institutions 3.2.3 Trade and transport-related
infrastructure 5.3.2 High-tech imports
1.1 Political Environment 3.2.4 Gross capital formation 5.3.3 Computer and communications service imports
1.1.1 Political stability & absence of violence/terrorism
3.3 Ecological Sustainability 5.3.4 Foreign direct investment net inflows
1.1.2 Government effectiveness 3.3.1 GDP per unit of energy use Innovation Output 1.1.3 Press freedom 3.3.2 Environmental performance 1.2 Regulatory Environment 3.3.3 ISO 14001 environmental
certificates 6 Knowledge and Technology Outputs
1.2.1 Regulatory quality 4 Market Sophistication 6.1 Knowledge Creation 1.2.2 Rule of law 4.1 Credit 6.1.1 National office patent applications 1.2.3 Cost of redundancy dismissal 4.1.1 Ease of getting credit 6.1.2 Patent Cooperation Treaty
applications 1.3 Business Environment 4.1.2 Domestic credit to private sector 6.1.3 National office utility model
applications 1.3.1 Ease of starting a business 4.1.3 Microfinance institutions gross
loan portfolio 6.1.4 Scientific and technical journal articles
1.3.2 Ease of resolving insolvency 4.2 Investment 6.2 Knowledge Impact 1.3.3 Ease of paying taxes 4.2.1 Ease of protecting investors 6.2.1 Growth rate of GDP per person
engaged 2 Human Capital and Research 4.2.2 Market capitalization 6.2.2 New business density 2.1 Education 4.2.3 Total value of stocks traded 6.2.3 Total computer software spending 2.1.1 Expenditure on education 4.2.4 Venture capital deals 6.2.4 ISO 9001 quality certificates 2.1.2 Public expenditure on education per pupil
4.3 Trade and Competition 6.3 Knowledge Diffusion
2.1.3 School life expectancy 4.3.1 Applied tariff rate, weighted mean 6.3.1 Royalty and license fees receipts 2.1.4 Assessment in reading, mathematics, and science
4.3.2 Market access for non-agricultural exports
6.3.2 High-tech exports
2.1.5 Pupil-teacher ratio, secondary 4.3.3 Imports of goods and services 6.3.3 Computer and communications service exports
2.2 Tertiary Education 4.3.4 Exports of goods and services 6.3.4 Foreign direct investment net outflows
2.2.1 Tertiary enrolment 4.3.5 Intensity of local competition 7 Creative Outputs 2.2.2 Graduates in science and engineering 5 Business Sophistication 7.1 Creative Intangibles 2.2.3 Tertiary inbound mobility 5.1 Knowledge Workers 7.1.1 National office trademark
registrations 2.2.4 Gross tertiary outbound enrolment 5.1.1 Employment in knowledge-
intensive services 7.1.2 Madrid Agreement trademark registrations
2.3 Research and Development 5.1.2 Firms offering formal training 7.1.3 ICT and business model creation 2.3.1 Researchers 5.1.3 GERD performed by business
enterprise 7.1.4 ICT and organizational model creation
2.3.2 Gross expenditure on R&D (GERD) 5.1.4 GERD financed by business enterprise
7.2 Creative Goods and Services
2.3.3 Quality of scientific research institutions
5.1.5 GMAT mean score 7.2.1 Recreation and culture consumption
3 Infrastructure 5.1.6 GMAT test takers 7.2.2 National feature films produced 3.1 ICT 5.2 Innovation Linkages 7.2.3 Daily newspapers circulation 3.1.1 ICT access 5.2.1 University/industry collaboration 7.2.4 Creative goods exports 3.1.2 ICT use 5.2.2 State of cluster development 7.2.5 Creative services exports 3.1.3 Governments online service 5.2.3 GERD financed by abroad 7.3 Online Creativity 3.1.4 Online e-participation 5.2.4 Joint ventures / strategic alliances
deals 7.3.1 Generic top level domains (gTLDs)
3.2 General Infrastructure 5.2.5 Share of patents with foreign inventor
7.3.2 Country-code top level domains (ccTLDs)
3.2.1 Electricity output 5.3 knowledge Absorption 7.3.3 Wikipedia monthly edits 7.3.4 Video uploads on YouTube
Source 1: http://www.globalinnovationindex.org

REDETE – ECONOMIC DEVELOPMENT AND ENTEREPRENEURSHIP IN TRANSITION ECONOMIES
153
Table 2 presents ranking of countries by the GII in 2011.
Rank Europe
Rank World
Country Score
1 1 Switzerland 68.24 2 2 Sweden 64.77 3 4 Finland 61.78 4 5 United Kingdom 61.25 5 6 Netherlands 60.55 6 7 Denmark 59.93 7 9 Ireland 58.68 8 11 Luxembourg 57.68 9 14 Norway 56.42
10 15 Germany 56.25 11 16 Malta 56.13 12 18 Iceland 55.73 13 19 Estonia 55.34 14 20 Belgium 54.29 15 22 Austria 53.10 16 24 France 51.75 17 26 Slovenia 49.92
18 27 Czech Republic 49.72 19 29 Spain 47.25 20 30 Latvia 46.97 21 31 Hungary 46.54 22 35 Portugal 45.29 23 36 Italy 44.48 24 38 Lithuania 44.02 25 40 Slovakia 41.37 26 42 Croatia 40.68 27 43 Bulgaria 40.67 28 44 Poland 40.36 29 45 Montenegro 40.15 30 46 Serbia 39.95 31 50 Moldova (Republic of) 39.23 32 51 Russian Federation 37.88 33 52 Romania 37.78 34 62 Macedonia (FYR) 36.18 35 63 Ukraine 36.12 36 66 Greece 35.27 37 72 Bosnia and Herzegovina 34.17 38 78 Belarus 32.93 39 90 Albania 30.38
Source 2:http://www.globalinnovationindex.org
By the criteria of easiness for starting up a business, B&H is ranked at the bottom among other
European countries, at 35th place out of 35 count ries. Ranking among different countries is given in table 3.

REDETE – ECONOMIC DEVELOPMENT AND ENTEREPRENEURSHIP IN TRANSITION ECONOMIES
154
Table 2: Ease of starting a business
Rank Evropa
Rank World
Country Score
1 5 Macedonia (FYR) 97.10 2 7 Belarus 95.60 3 9 Ireland 93.50 4 16 United Kingdom 89.20 5 20 France 86.30 6 23 Denmark 84.10 7 24 Slovenia 83.40 8 25 Iceland 82.70 9 26 Romania 82.00
10 27 Belgium 81.20 11 28 Finland 79.80 12 28 Norway 79.80 13 32 Hungary 77.60 14 33 Estonia 76.90 15 34 Sweden 76.20 16 35 Bulgaria 74.80 17 38 Montenegro 72.60 18 41 Latvia 71.20 19 44 Albania 69.00 20 45 Croatia 68.30 27 65 Serbia 53.90 38 133 Bosnia and Herzegovina 05.00
Source 3: http://www.globalinnovationindex.org
According to a component „Research and Development“, which is one of the components of
GII, B&H is ranked at 108th place out of 134 countries in the world and at the 38th place out of 39 European countries included in the survey for GII. Unfortunately, by this criteria Bosnia is also placed by the end of measurement ladder. Contemporary technological progress is the main factor of change in transition process from industrial to post-industrial society. Technological progress, as a basic wheel of economy progress, means a change in creation of new and improvement of existing technologies, assets and production methods which leads to savings in human capital consumption, development of new and improvement of existing products and improvement of en-terprise’s organisation and management process.
2. The main trends in growth and development of enterprises in B&H
There are several theories on growth and development of enterprises. These theories include mechanistic trials in explaining growth of enterprises (Marx, Biher, Smalenbach and Weber), biological analogies of growth (Alfred Marshal) where the most popular theories are Organic The-ory and Theory of Evolutionary Growth. Small firm can develop through merger and acquisition operations (M&A). The good example of that is company Nestlé which has used these mecha-nisms and instruments what resulted in simplification of complicated procedures which become just “routine”. That enabled this company to obtain competitive advantage upon other companies and enterprises. According to research of doing business environment which implement World Bank and EBRD BEEPS, the main problems of SMEs in B&H are: (1) access to finance; (2) tax and other administrative burden; (3) collection of account receivable and (4) corruption (Business Environment and Enterprise Performance Survey”, World Bank/EBRD, 2008.) In the Report of the World Economic Forum 2011, as a main key factors for further development of B&H are:
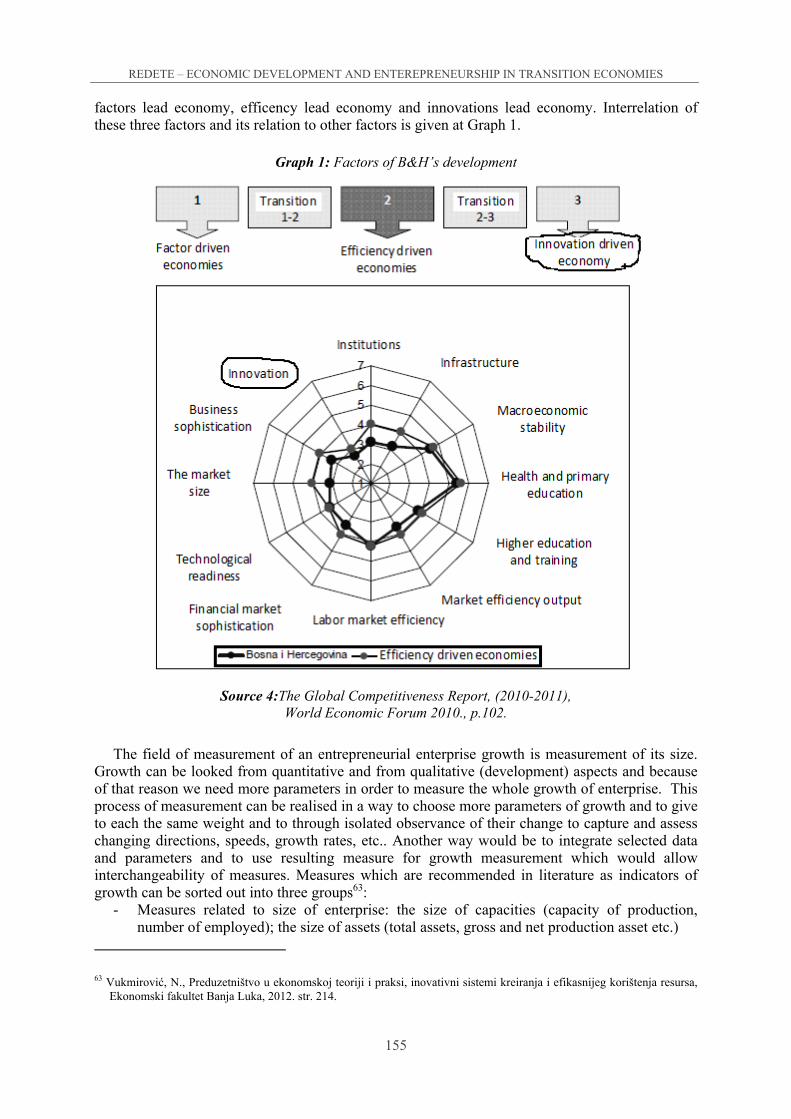
REDETE – ECONOMIC DEVELOPMENT AND ENTEREPRENEURSHIP IN TRANSITION ECONOMIES
155
factors lead economy, efficency lead economy and innovations lead economy. Interrelation of these three factors and its relation to other factors is given at Graph 1.
Graph 1: Factors of B&H’s development
Source 4:The Global Competitiveness Report, (2010-2011),
World Economic Forum 2010., p.102.
The field of measurement of an entrepreneurial enterprise growth is measurement of its size.
Growth can be looked from quantitative and from qualitative (development) aspects and because of that reason we need more parameters in order to measure the whole growth of enterprise. This process of measurement can be realised in a way to choose more parameters of growth and to give to each the same weight and to through isolated observance of their change to capture and assess changing directions, speeds, growth rates, etc.. Another way would be to integrate selected data and parameters and to use resulting measure for growth measurement which would allow interchangeability of measures. Measures which are recommended in literature as indicators of growth can be sorted out into three groups63:
- Measures related to size of enterprise: the size of capacities (capacity of production, number of employed); the size of assets (total assets, gross and net production asset etc.)
63 Vukmirović, N., Preduzetništvo u ekonomskoj teoriji i praksi, inovativni sistemi kreiranja i efikasnijeg korištenja resursa,
Ekonomski fakultet Banja Luka, 2012. str. 214.

REDETE – ECONOMIC DEVELOPMENT AND ENTEREPRENEURSHIP IN TRANSITION ECONOMIES
156
- Measures which measure real performance in some period of time: production performance (quantity, value of production); measure for sell products (sell quantity, value, market share)
- Measures for success of enterprises activity: size (gross and net income and profit, profitability of capital and sales etc.).
Indicators of growth in quantitative terms by Haberlant are asset of enterprise, number of em-
ployed, and engaged as well as achieved volume of results/outputs. This author highlights that as measures for value, value of production assets, capital, engaged value, sale, added value, net value of production and net profit should be used. According to the Law on SMEs Development in the Republic of Srpska, as a criteria for enterprise size and therefore as a measure for enterprise’s gro-wth number of employed, annual total income from sales, and total assets of enterprise are used. The element that entrepreneurial enterprises enable to achieve fast growing, exponential growth is innovation. Innovations lead enterprises to higher levels of firm’s development by generation of new potential for growth (good examples of enterprises that have used innovations as a wheel for exponential growth are Microsoft, IBM, NOKIA, McDonald's, Intel, Hewlett-Packard, Mercedes, Apple, Ikea, Ford, Google, Toyota, Gucci, Loreal, etc.). Mathematical functions which represent exponential growth are exponential functions and they have very broad usage in economics, especially in the field of growth analysis. Its basic version can be shown as follows64:
,
where y is dependent variable, i independent variable (exponent) whole b is used for fixed base
of exponential function. Considering that, it is as follows65: byb
b - value of growth driven by innovations.
In order to measure the impact of independent variable on dependent variable, it is necessary to take assumption that all other variables are constant - non-changeable. Dependent variable y is parameter of enterprises value after implementation of innovation (average number of employed, total annual income from sales, asset of enterprise in Balance Sheet, engaged volume of inputs and realized volume of outputs and value based parameters: capital, engaged values, sales, value added, net value of production and net profit in given period).
The parameter of enterprises value before implementation of innovation is b. Independent variable i - exponent depends on the impact of innovation on variables which have impact on parameter used as a measure of enterprises size. Depending on so defined parameters, it is necessary to introduce additional constraints so that meassuers such as average number of employed, total annual income from sales, asset of enterprise in Balance Sheet, engaged volume of inputs and realized volume of outputs and value based parameters: capital, engaged values, sales, value added, net value of production and net profit in given period do not take negative values. On the basis of previously mentioned mathematical relations, it is possible to draw:
64 Vukmirović, N., Preduzetništvo u ekonomskoj teoriji i praksi, inovativni sistemi kreiranja i efikasnijeg korištenja resursa,
Ekonomski fakultet Banja Luka, 2012. str. 215. 65 Vukmirović, N., Preduzetništvo u ekonomskoj teoriji i praksi, inovativni sistemi kreiranja i efikasnijeg korištenja resursa,
Ekonomski fakultet Banja Luka, 2012. str. 215.

REDETE – ECONOMIC DEVELOPMENT AND ENTEREPRENEURSHIP IN TRANSITION ECONOMIES
157
3. Economic Horizon, Purpose and Usage of Business Forecasting
Forecasting is every-day human activity undertaken in order to get insight and some basic assumptions about neizvesne, nesigurne, nepoznate neizvesne uncertain, unpredictable and unknown future in order to estimate what and how will happen before it definately take place. Business forecasting is process of ispitivanja djelovanja of internal and external factors which impose/have impact on future business performances, with usage of different instruments of forecasting66. Forecasting is necessary when is certain that something will happen. By acquiring knowledge about uncertain future a risk of its impact is decreasing while wrong forecasting for its consequence has wrong-inappropriate decisions with potentially very harmful effects. Never forecasting can be exact and therefore it is always done with some probability of potential outcomes or dotted or intervalnih estimated values of variables.
Prediction of everyday human activity is necessary to advance learn about certain aspects of the uncertain, uncertain, unknown future, to determine what is going to happen and that before the event I ever happens. Business forecasting is the process of studying the activity of internal and external factors that affect the future operations of the company, using different instruments predictions. Prediction is unnecessary when you consider that some event will happen with certainty. Gaining knowledge about the uncertain future reduces the risk that it carries with it, while incorrectly predicting results in making wrong decisions, with possible serious consequences. Prediction can never be exact, but is done with a certain probability of realization of events, possible outcomes, and point sources or assessed value of the interval variables.
Further work on the basis of the planning balance sheet, income statement, planning and cash flow planning will provide an analysis of the ratio to predict the movement of return on total assets (ROA) and return indicators on equity (ROE) hypothetical enterprise AVA. Indicator of return on total assets (ROA) shows the ability of companies to use available assets to generate profit. Of return on equity (ROE) shows the strength of earnings in relation to the investment of shareholders.
In order to more realistic forecasting, financial analysis, forecasting will be done in three versions (scenarios):
- Optimistic variant
- Expected option and
- Pessimistic variant
66 Vukmirović, N., Preduzetništvo u ekonomskoj teoriji i praksi, inovativni sistemi kreiranja i efikasnijeg korištenja resursa,
Ekonomski fakultet Banja Luka, 2012. str.413.

REDETE – ECONOMIC DEVELOPMENT AND ENTEREPRENEURSHIP IN TRANSITION ECONOMIES
158
Table 4. Optimistic prediction of variation (ROA) and (ROE) Ratio analysis
- Optimistic Scenario Want
ed 2012 2013 2014 2015 2016 2017 2018 2019 2020 2021 2022
1) Parameters of liquidity Overall Liquidity Ratio min 2 43.35 32.44 45.87 59.44 73.15 87.00 100.98 115.08 129.30 143.62 162.44 Rigorous liquidity ratio min 1 42.10 31.13 44.56 58.14 71.85 85.70 99.68 113.78 128.00 142.33 161.20 Net working capital (KM) Poz. 358,193 664,775 959,367 1,263,759 1,578,128 1,902,655 2,237,523 2,582,917 2,939,026 3,306,040 3,787,046 2) Indicators fin. structure The gearing ratio max
50% 51.85% 40.96% 34.90% 29.19% 23.83% 18.80% 14.09% 9.67% 5.53% 1.65% 0.67%
The share of long-term sources in total sources
99.61% 99.10% 99.14% 99.18% 99.22% 99.26% 99.29% 99.32% 99.36% 99.38% 99.43%
Short-term financial balance min 1 43.35 32.44 45.87 59.44 73.15 87.00 100.98 115.08 129.30 143.62 162.44 Long-term financial balance max1 0.83 0.71 0.61 0.52 0.43 0.36 0.29 0.22 0.17 0.12 0.08 3) Indicators of profitability Profit margin 45.93% 42.33% 43.07% 43.79% 44.49% 45.19% 45.86% 46.53% 47.18% 47.82% 51.66% The net profit 34.15% 31.34% 32.72% 34.12% 35.51% 36.89% 38.27% 39.65% 41.03% 42.40% 46.46% The coefficient of efficiency 184.96
% 173.41% 175.64% 177.90% 180.16% 182.43% 184.72% 187.02% 189.33% 191.65
% 206.86%
Return on assets 5.61% 12.28% 12.58% 12.85% 13.10% 13.31% 13.50% 13.67% 13.81% 13.93% 14.54% Return on own funds 14.82% 27.02% 25.16% 23.60% 22.26% 21.10% 20.09% 19.19% 18.39% 17.67% 17.98% 4) ROA min
6% 4.42% 9.42% 9.45% 9.47% 9.47% 9.45% 9.42% 9.38% 9.33% 9.28% 9.47%
5) ROE min 4%
9.18% 15.96% 14.52% 13.38% 12.44% 11.64% 10.97% 10.39% 9.88% 9.43% 9.54%
Source: Author
Table 5. Predict the expected variation (ROA) and (ROE)
Racio analiza - Očekivana varijanata
Wanted 2012 2013 2014 2015 2016 2017 2018 2019 2020 2021 2022
1) Parameters of liquidity
Overall Liquidity Ratio min 2 48.24 31.74 42.26 52.99 63.89 74.99 86.25 97.69 109.30 121.06 138.58
Rigorous liquidity ratio min 1 46.93 30.35 40.88 51.60 62.51 73.61 84.88 96.32 107.92 119.69 137.28
Net working capital (KM) pozitivan 314,345 511,309 693,756 883,424 1,080,441 1,284,934 1,497,032 1,716,866 1,944,569 2,180,275 2,527,010
2) Indicators fin. structure
The gearing ratio max 50% 52.87% 43.72% 38.95% 33.98% 28.84% 23.58% 18.25% 12.87% 7.50% 2.17% 0.79%
The share of long-term sources in total sources 99.69% 99.24% 99.24% 99.25% 99.25% 99.26% 99.27% 99.28% 99.30% 99.31% 99.36%
Short-term financial balance min 1 48.24 31.74 42.26 52.99 63.89 74.99 86.25 97.69 109.30 121.06 138.58
Long-term financial balance max 1 0.85 0.76 0.68 0.60 0.53 0.45 0.37 0.30 0.23 0.17 0.11
3) Indicators of profitability
Profit margin 38.17% 33.37% 34.28% 35.17% 36.05% 36.90% 37.74% 38.57% 39.38% 40.17% 45.23%
The net profit 24.76% 21.02% 22.80% 24.60% 26.39% 28.18% 29.96% 31.74% 33.52% 35.30% 40.66%
The coefficient of efficiency 161.73% 150.08% 152.15% 154.25% 156.36% 158.49% 160.63% 162.78% 164.95% 167.14% 182.57%
Return on assets 3.09% 6.46% 7.09% 7.71% 8.33% 8.94% 9.54% 10.12% 10.69% 11.23% 12.48%
Return on own funds 8.34% 15.01% 15.33% 15.55% 15.69% 15.74% 15.73% 15.67% 15.56% 15.43% 16.62%
4) ROA min 6% 2.46% 5.08% 5.54% 6.00% 6.43% 6.85% 7.25% 7.61% 7.96% 8.28% 8.97%
5) ROE min 4% 5.21% 9.03% 9.08% 9.08% 9.04% 8.97% 8.86% 8.74% 8.60% 8.46% 9.04%
Source: Author
Table 6. Pessimistic variant of prediction (ROA) and (ROE)
Source: Author
Racio analiza - Pesimistična varijanta
Wanted 2012. 2013. 2014. 2015. 2016. 2017. 2018. 2019. 2020. 2021. 2022.
1) Parameters of liquidity Overall Liquidity Ratio min 2 68.85 38.61 46.88 55.40 64.16 73.15 82.35 91.77 101.40 111.22 130.25 Rigorous liquidity ratio min 1 67.27 36.91 45.19 53.72 62.48 71.47 80.68 90.11 99.74 109.57 128.72 Net working capital(KM) pozitivan 278,533 385,967 476,356 571,389 671,141 775,688 885,104 999,467 1,118,852 1,243,336 1,475,890 2) Indicators fin. structure The gearing ratio max50% 53.72% 46.22% 43.01% 39.24% 34.87% 29.86% 24.18% 17.81% 10.74% 2.97% 0.86% The share of long-term sources in total sources
99.80% 99.50% 99.48% 99.46% 99.44% 99.41% 99.39% 99.37% 99.35% 99.33% 99.37%
Short-term financial balance min 1 68.85 38.61 46.88 55.40 64.16 73.15 82.35 91.77 101.40 111.22 130.25 Long-term financial balance max 1 0.87 0.81 0.76 0.70 0.64 0.57 0.50 0.43 0.35 0.26 0.18 3) Indicators of ofitability Profit margin 27.68% 21.10% 21.97% 22.81% 23.62% 24.42% 25.19% 25.95% 26.68% 27.39% 33.91% The net profit 11.70% 6.09% 8.55% 11.04% 13.54% 16.03% 18.51% 21.00% 23.48% 25.97% 33.84% The coefficient of efficiency 140.81% 127.84% 129.73% 131.64% 133.56% 135.50% 137.46% 139.43% 141.42% 143.43% 160.44% Return on assets 0.99% 1.30% 1.89% 2.54% 3.23% 3.96% 4.73% 5.54% 6.39% 7.28% 9.33% Return on own funds 2.70% 3.17% 4.43% 5.68% 6.85% 7.95% 8.94% 9.84% 10.63% 11.31% 13.98% 4) ROA min 6% 0.79% 1.04% 1.54% 2.09% 2.69% 3.33% 4.01% 4.74% 5.52% 6.32% 7.90% 5) ROE min 4% 1.70% 1.94% 2.70% 3.44% 4.13% 4.75% 5.29% 5.77% 6.18% 6.52% 7.97%

REDETE – ECONOMIC DEVELOPMENT AND ENTEREPRENEURSHIP IN TRANSITION ECONOMIES
159
From financial parameters, it is possible to see that relevant financial parameters are stable and if purpose of analysis is valuation of an investment, it can be said that investment in the expected scenario fully justified and real data that was used in the equation of balance all positions.
4. Business forecasting and measuring the role of innovation in the development and growth of enterprises
In the following, we give a practical interpretation of the effects of measurement innovation for growth and development of SMEs in Bosnia and Herzegovina. In most developed countries, as the criteria for measuring the size of the company, and thus the growth of the company, taking the average number of employees, total sales per year, and the sum of the balance of the assets. Based on the previously presented theoretical statements, resulting mathematical relation:
Relation 1. (The author)
byb
b - The amount of growth companies based on innovation You can mathematically calculate the growth rate parameter which measures the size of the
company (p) in a given interval of time (for a time). Relation 2. (The author)
p = 100*b
by
y (dependent variable) - This ratio sized enterprises after the innovation (the average number
of employees, total sales revenue annually, the sum of the company balance sheet, the company's assets, engaged quantities and quantities of performance and value of: capital, hired values, sales, creating value, net production value and profit Recurring);
b - Amount of indicators of firm size before innovation; p - the growth rate of the company based on the introduction of innovations (for a time) Depending on the parameters so defined, it is necessary to introduce additional restrictions.
);0( y that. if (average number of employees, total sales revenue annually, the sum of the company balance sheet, the company's assets, engaged quantities and quantities of performance and value of: capital, hired values, sales, create value, net production value and profit Recurring) I can not have negative e values. Also in order to achieve growth, it is logical that the amount parameter which measures the size of the company before the innovation is less than the same parameter after innovation, ie. that (y> b), because otherwise there would be growth companies,
b =0. Example 1. Total sales annually MSA is 5 500 000 KM. The growth rate of the company as measured by
total sales annually formed under the influence of introducing organizational innovations in the production company was 5.55%.
a.) Calculate the total amount of sales per annum of SMEs, following the introduction of innovations.
b.) Calculate the absolute amount of growth in total sales annually SMEs, generated on the basis of innovation.

REDETE – ECONOMIC DEVELOPMENT AND ENTEREPRENEURSHIP IN TRANSITION ECONOMIES
160
a.) p = 100*b
by
0,0555 =(y – 5 500 000)/5 500 000 y = 5 805 250 KM The amount of total revenue on an annual basis MSA, following the introduction of
innovations is: y = 5 805 250 KM.
b.)
byb
5 805 250 – 5 500 000 = 305 250 KM The absolute amount of growth in total sales annually SMEs, generated on the basis of
innovation is 305 250 KM.
Conclusion
Today, research and development (R & D - R & D) is one of the most important sources of innovation. Under the planned survey mean quest to uncover new knowledge that would be useful for the development of new products. Development of a translation of research findings or other knowledge to a plan for a new, improved products. The result of a successful research and development is a knowledge that will benefit businesses and consumers. Well done process research and development is a prerequisite for the success of innovation in the market. Given that the process quite expensive and time consuming, companies often find themselves in a dilemma on how to access the survey, as well as how to perform in the market. Global Innovation Index (GII) is an important indicator of where the country stands with the position of innovation and innovation in relation to other countries. To make the process of research and development conducted successfully, must be fulfilled certain conditions. The research and development must be part of the growth and development of the company and comply with the pace of growth. Otherwise, too much investment in research and development can make the company insolvent and too little will make the company uncompetitive. In addition, it is necessary to provide sufficient funding, adequate human and technical capacities, and to prepare for possible failures in the development of new products. Cooperation with research institutions such as universities, institutes and private companies that have experience in this field, can significantly contribute to increasing the efficiency of the process. Predictions are given assumptions about future events, thus providing a basis for decision making at the time. One of the first steps in the formation of the prediction is the choice of the time horizon. The method that gives the best short-term forecast does not necessarily give good long-term prediction. In order to answer this question, one should take into account the forecast, the stability of historical data and the results of the prediction.

REDETE – ECONOMIC DEVELOPMENT AND ENTEREPRENEURSHIP IN TRANSITION ECONOMIES
161
Reference list
1. Аdižеs, I., Uprаvlјаnjе živоtnim ciklusоm prеduzеćа, Prоmеtеј, Nоvi Sаd, 2002. 2. Bеrbеrоvić, Š.; Јеlić, М., Меnаdžmеnt mаlih i srеdnjih prеduzеćа, Еkоnоmski fаkultеt, Bаnjа
Lukа, 2005. 3. Business Environment and Enterprise Performance Survey”, World Bank/EBRD, 2008. 4. Vukmirоvić, N., Sаvrеmеnо prеduzеtništvо-Nаukа i vјеštinа pоslоvnоg uspјеhа, Еkоnоmski
fаkultеt, Bаnjа Lukа, 2006. 5. Vukmirović, N., Preduzetništvo u ekonomskoj teoriji i praksi, inovativni sistemi kreiranja i
efikasnijeg korištenja resursa, Ekonomski fakultet Banja Luka, 2012. 6. Vukоtić, V., Prеduzеtničkа еkоnоmiја, Еkоnоmski fаkultеt, Pоdgоricа, 2000. 7. Gilder, G., The Spirit of Eneterprise, Penguin Books, New York, 1986. 8. The Global Competitiveness Report, (2010-2011), World Economic Forum 2010., 9. Dеžеlјin, D.; Dеžеlјin, Ј.; Duјаnić, М.; Таdin, H.; Vuјić, V., Pоduzеtnički mеnаdžmеnt:
izаzоv, rizik, zаdоvоlјstvо, М.Е.R.CONSULT, Zаgrеb, 2002. 10. Dоstić, М., Меnаdžmеnt mаlih i srеdnjih prеduzеćа, Еkоnоmski fаkultеt, Sаrајеvо, 2003. 11. Izvještaj o politikama podsticanja malih i srednjih preduzeća u Bosni i Hercegovini, 2010. 12. Draker, Piter F. Inovacije i preduzetništvo - praksa i principi. Beograd, Privredni pregled,
1991, 13. Sirоpоlis, N., Меnаdžmеnt mаlоg pоduzеćа, ,Zаgrеb, 1995. (Izvоr: US Dearment o
Commerce, Enterprise Statistiks) 14. Enterprise Policy Performance Assessment Bosnia and Herzegovina, OECD, 2005. 15. Schumpeter, Joseph A. Business Cycles. New York, McGraw Hill, 1939. 16. Zаkоnu о pоdsticаnju rаzvоја mаlih i srеdnjih prеduzеćа,
Еlеktrоnski izvоri:
1. Dostupno na: URL: http://ec.europa.eu/enterprise/ approach: (15.05.2012.); 2. Dostupno na: URL: http://www.globalinnovationindex.org approach: (15.05.2012.);

REDETE – ECONOMIC DEVELOPMENT AND ENTEREPRENEURSHIP IN TRANSITION ECONOMIES
162
BUSINESS INCUBATORS AS TOOLS FOR DEVELOPMENT OF MICRO AND SMALL-SIZED
ENTERPRISES IN SERBIA
Dragiša MIJAČIĆ67 Blagoje PAUNOVIĆ68 Vesela ĆURKOVIĆ69
Abstract
Development of business support infrastructure in Serbia is in line with the processes of eco-nomic transformation towards a market-oriented economy. The pioneering steps in that regard were initiated through project interventions of numerous international organisations, later on continued through the activities of the line ministry, and development agencies and associations active at a national, provincial/regional or local level. Business support infrastructure in Serbia encompasses business incubators, clusters, industrial zones and technology parts, active on different territorial levels and spread throughout the country.
The paper explores early experiences of business incubation of micro enterprises in Serbia. Business incubators aims at solving problems of local economic development by improving the entrepreneurial base, both in terms of quantity and quality. The main goal is to create a tool for supporting entrepreneurship, reduce unemployment and increase a number of new enterprises. The term incubation incudes providing good conditions for starting new businesses and achie-vement of business ideas encouraging inovation in the development of the entrepreneurial spirit, as well as taking concrete steps to preserve such conditions and resources required for the implementation of the ideas.
Key Words: Business incubators, entrepreneurship, small and medium enterprises, Serbia
67 Dragiša Mijačic is a PhD researcher at the Maastricht Graduate School of Governance, Maastricht University, UNU -
Merit Keizer Karelplein 19, 6211 TC Maastricht, Netherlands. E-mail: [email protected] 68 Blagoje Paunović is a professor at the Faculty of Economics, University of Belgrade, Kamenička 6, 11000 Belgrade,
Serbia. E-mail: [email protected] 69 Vesela Ćurković is a Researcher at the Institute for Territorial Economic Development (InTER), Šajkaška 29/12,
Belgrade, Serbia, E-mail: [email protected]

REDETE – ECONOMIC DEVELOPMENT AND ENTEREPRENEURSHIP IN TRANSITION ECONOMIES
163
Introduction
The small and medium-sized enterprises (SMEs) and entrepreneurship represent an increasin-gly important segment of the Serbian economy. For the past several years these entities were the most effective part of the economy in the Republic of Serbia, and are carriers of the economic growth and employment. With foreign direct investments (FDI), this sector strives to become the most important lever of economic development and the main creator of new jobs.
In last decades, SME development policy has not always been regarded as an integral part of the overall socio-economic development in the Republic of Serbia. The SME sector has often be-en marginalized and regarded as less important dimension of overall economic development. The situation began to change significantly from year 2000 when the socio-economic reforms in Ser-bia started. Since then, significant efforts were given in creating strategic framework for SME de-velopment. The Strategy for the Development of Small and Medium Enterprises in the Republic of Serbia for the period 2003-2008 and the Action Plan for stimulation of the development of sm-all and medium sized enterprises for the period 2005-2007. The following Strategy for Deve-lopment of Competitive and Innovative SMEs for the period 2008-2013 was pointed out that eco-nomic progress and development of the Republic of Serbia requires development of a competitive economy based on knowledge, new technologies and innovations (NARD, 2008). In achieving this goal, entrepreneurship has a big role in economic and social development, especially in coun-tries in transition, like Serbia.
The small and medium enterprises, besides being a vital and the most efficient part of one eco-nomy, have one more important role. That is the implementation of structural reforms, especially in order to open new jobs and revive growth in the overall economy. Created models for develop-men suggest that a business incubator is one of the most successful methods (tools) for supporting innovation and transforming innovations into practical technology. Successful business incubators in the world are those which support small businesses created on the basis of knowledge and technology transfer from the research sector.
Basic Definitions and Concepts
There are many definitions of business incubators. One of the shortest but the most accurate is given by the autors Rice and Matthews: "Business Incubator is an institution whose purpose is development of start-up companies". In a broader sense, the business incubator is an institution which provides commercial, administrative, technical and other services, mostly to the new business, potential entrepreneurs or innovative organizations, making it possible to start their business. As a result, new businesses are not burdened with large investments in infrastructure, and all available resources can focus on running their business and innovation activities. Also, new products and services can quicker find placement on the market. Business incubator usually gives space to new companies, with a subsidized fee, that usually grows progressively until the end of the incubation period, when the price reaches the market value of the premises. The incubation period varies between incubators and usually lasts between three and five years. This kind of length limit is designed to contribute to faster independence of the beneficiary, and leaving the free space for the new service users.
However, business incubators in developed countries have evolved over the time and expanded their range of services, which thay offer to encourage successful business. In the past years, so-called "virtual" incubator services appered. They provide business services without physical incubation services. Customers of the business incubators are often referred to as “tenants”, alluding to the nature of the primary services provided by business incubators in the provision of physical space.

REDETE – ECONOMIC DEVELOPMENT AND ENTEREPRENEURSHIP IN TRANSITION ECONOMIES
164
Business incubation systems are mainly aimed at solving the problems of local economic development through the promotion of entrepreneurial base, both in terms of quantity and quality. The main goal is to create a tool for supporting entrepreneurship, reducing unemployment and establishing a large number of new enterprises. Term incubation involves ensuring good conditions for starting new businesses and developing business ideas, innovation in stimulating the entrepreneurial spirit, as well as taking concrete steps to preserve conditions and resources required for the implementation of the ideas. Business incubators provide direct support to the companies that are just starting to work, at a time when they are most likely to fail. As a result, business incubators directly affect to the degree of success of these companies. Most of the services provided by business incubators are offered by subsidized prices, which positively affect the position of enterprises in the incubator compared to those outside.
Business incubators are among the most important instruments at the local level which can help the development of the new, sustainable enterprises. This is especially important because many companies and entrepreneurs, in the beginning of their work, are facing the problem of lack of seed capital, experience in managing the company and lack of knowledge of the market, in terms of demand for the products offered. This could lead to decreased number of new enterprises, and new jobs at the local level. Business incubators are one of the solutions to this problem in the sense that support start-ups in all aspects of their business.
According to the classification of the UN Economic Commission for Europe, incubators are divided into:
- Classic business incubators/business centers which are often the result of initiatives on regional levels of government, non-governmental institutions and local governments to raise local economic development.
- Industrial parks/zones are new models of business incubators and are developed within, or near by, university centers, research institutes, in order to implement the commercialization of technological innovations.
- Technological and scientific parks are incubators of high technology and are providing a full range of services to universities, research institutions, small and medium enterprises located within the park.
- Virtual office/business incubators are the latest generation in the development of incubators. These incubators associate companies, customers and suppliers, and operational management of the incubator through modern information and communication technologies.
- Internet incubator centers fall within the high-technology incubators, and are organized as separate profit centars, formed in specially equipped premises with the aim of using high-capacity Internet for various purposes. In developed countries, this type of incubator did not exhibit a higher degree of stability and continuity.
Business incubators can also be public or private. Private incubators are profit companies that receive money for the services they provide to their clients. In essence, they are consulting firms specializing in the creation of new business. Since the 80-es, many developed and developing countries have created a system of public business incubators to encourage and assist the development of entrepreneurship. In many cases, business incubators are focused on high technology industries. For business incubators based on science, effective collaboration with universities or research institutions may encourage researchers to take risks and create their own business. As new businesses need money for growth, incubators have close relationships with many types of investors. Since business incubators are a powerful tool for economic development, they are actively working with regional and national governing agencies, from which they often also receive financial support. In many countries there are associations of business incubators at the national level in order to represent the interests of the incubators and organize meetings where they will adopt the best practices from their business.

REDETE – ECONOMIC DEVELOPMENT AND ENTEREPRENEURSHIP IN TRANSITION ECONOMIES
165
Development of Business incubators
Incubator concept was first used in the 50-es in the U.S., and was based on "... the Japanese model of organizing companies, which encouraged the development of small family businesses." Incubators as an organized form of entrepreneurship have emerged during the 80-ies of the last century in England and Germany, and from the 90-es have been recognized as one of the important tool which can contribute to the local economic development in the European Union.
The first business incubator in the world was founded in 1959 in Batavia, New York, U.S. called "Batavia Industrial Center." However, increasing demand for services business incubation occurred with the appearance of the economic crisis in 70-es and especially in the 80-es. From that time a numerous incubators were established, in the most developed countries of the West, as a local response to solving social and economic problems created by the closure of major factories and mines, restructuring and de-industrialization of the economy. One of the first incubators was established in Europe in 1975 in the UK, British Steel Industry Ltd., in response to the collapse of big steel mills, in order to create jobs for workers who have lost their jobs (OECD, 1999).
Today, the number of business incubators in the world is estimated at about 5,000, including more than 1,000 in Asia, about 1,000 in North America, slightly less (about 900) in Europe and the rest on other continents (Zavatta, 2008). Business incubators are gathered in 60 national and regional associations from which the most important is National Business Incubation Association, which brings together over 1,900 members from 60 countries, mainly from the U.S. The largest association of business incubators in Europe, the European Business & Innovation Centre Network, brings together over 240 member states of the European Union and 11 other countries. In Serbia, there is an active network of business incubators, which gathers all business incubators in the country.
Importance of business incubators
The main goal of business incubators is the creation of new small businesses based on innovative and entrepreneurial projects that are being developed in the incubator. Entrepreneurial incubators can be legal or other organizational entities owned by local governments, privately owned, or owned by other institutions.
It is estimated that over 90% of the companies developed in the business incubators in Europe and the United States are still active and growing after the leaving the incubator (in the period after three years). They have a far greater success rate than the companies that have developed without outside help (such a difference can be partially attributed to and careful selection process that allows the company to enter into incubators). Statistics in the U.S. have shown that the survival rate of start up business is 35%, and in the case of companies which began its work in incubators, this rate increases to 87%.
Business incubators are sucessful tool for satisfying various economic and socio-economic political needs, among which can be highlighted:
- Creating new opportunities for employment and wealth creation,
- Support for small companies with high growth potential,
- Transfer of Technology,
- Promoting innovation,
- Improving links between Universities, research institutions and the business community,
- Development of industrial clusters

REDETE – ECONOMIC DEVELOPMENT AND ENTEREPRENEURSHIP IN TRANSITION ECONOMIES
166
Incubators are different in type and structure, but they all share a common mission - to acele-rate the development of small and medium-sized businesses and enhance the profile of the overall business environment. Incubator intents to create jobs, revitalize and relieve the entrepreneurial spirit, commercialize new technologies and strengthen local and regional economies. Business incubation is a dynamic process of development of the economic environment. Incubators raise young companies, helping them to survive and thrive in a start-up period when they are in fact "the most vulnerable". Incubators provide directly support management, access and equity partners, as well as the necessary infrastructure and administrative services. Incubator offers to entrepreneurial companies the office space, access to modern equipment and tools, flexible lease and all under one roof, which is a whole set of infrastructure and competitive advantage all in favor of the entrepreneur.
The results arising from the process of establishing a business incubator are: - Establishment and survival of the enterprises - providing the best start for the new
companies in order to increase their chances for survival and growth;
- Involvement of the various actors - encouraging community development and cohesion, especially in communities with high levels of unemployment;
- Strengthening local entrepreneurial culture - incubators can be a catalyst for major service providers, helping to develop local talents;
- Strong impact on the local economy – encouraging trade among businesses;
- Local pride - demonstration of the partnership and a good source of public relations for the local and regional economy;
- Reconstruction - usually involves renovating of old, unused buildings, or reconstruction of unused industrial buildings;
- Partnership - assist in the development and strengthening of partnerships between national, regional and local levels, public and private sector, the donor community and national partners.
Although the business incubators are usually established as an independent unit with its own
business objectives, initiators can often have long-term goals that reach far beyond the plans for development of entrepreneurs. These goals may include:
1. Using the first business incubator as a prototype for the establishment of other incubators in selected areas;
2. The incubator doesn’t has to be used only for start-up companies, it can also to be adapted to enterprises with export potential;
3. Regions can use an incubator to draw further investment,
4. Business incubators can be used as instruments, which can provide additional informations, such as business information centers, as well as other professional consulting.
An important measure of success of business incubator, as well as an excuse for getting financial funding from the state, is the number of new jobs created, and the future results of the companies after leaving the incubator “tenants” within the wider community.
Forms of Financing
Researches that deal with the structure of the existing network of business incubators have shown that there is great diversity in their structure, support mechanisms, and financing sources. In the early stages of development, funding from the public sector is of vital importance because it
REDETE – ECONOMIC DEVELOPMENT AND ENTEREPRENEURSHIP IN TRANSITION ECONOMIES
167
is often required to pass many years before an incubator can attract the private sector to finance or to create sufficient income from other sources (such as rent) to cover operating expenses. Depending of its type and structure, an average cost of establishing business incubators is from €2 - 4 million. In the transition economies, experience shows that small local incubators can start with a small sum of money as it is €50,000 to €100,000. A typical incubator has operating costs approximately €500,000 per year. Most incubators can cover most of their operating costs (40% - 60%) from the rental income. However, the high level of dependency on income rents can have a negative effect. There are many indicators used to measure success of business incubators:
- The number of companies that have passed through the incubator program;
- The number of new created registered businesses supported by the incubator;
- The total number of jobs created for clients in the incubator;
- The amount of income or revenue growth/profit of businesses;
- The number of businesses that have successfully left the incubator;
- The manner and the speed of growth business in the incubator;
- The number of companies that have demonstrated financial viability and independence after leaving the incubators.
Management of business incubators has a great influence on a functionality of business
incubators, providing their clients with quality and necessary services. In this sense, the concept was developed, with some adjustments, which can be applied everywhere in the world. This concept includes a set of standards that should be followed when defining the type and nature of business incubators, the type and volume of services provided to “tenants”, and physical and functional design of business incubators. Thus, studies are regularly conducted to demonstrate the performance of business incubators that follow generally accepted concept are far more successful from those that have been established outside the approved general “rules”. There are two basic principles that can be a guide for development and sustainability of the business incubators in any economy:
- Business incubator has to go in the direction of a positive impact on the economic recovery of the local community through maximizing the percentage of survival of new established enterprises;
- The incubator is a dynamic model that in many ways resembles any other start-up enter-prise. The success of the new established incubator depends primarily on the commitment of management and business incubators authority to monitor and enforce positive experiences and to adapt them.
Business incubators in Serbia
Development of business incubators in Serbia started with Entranse entrepreneurship development program, funded by the Norwegian government. On the project of development incubators in Serbia, Entranse program has worked closely with state institutions, primarily with the National Agency for SME Development and the Ministry of Economy and Privatization of Republic of Serbia. As a result of that collaboration in 2006 was founded The Centre for supporting business incubators within the Republic Agency for SME Development in order to form a unit with a clear focus on a business incubation. The same year Entranse provided technical assistance to the Ministry of Economy and the Republic Agency for SMEE drafting programs for the development of business incubators and clusters in the Republic of Serbia 2007-2010, which was adopted by the Government of the Republic of Serbia, and which proposes the establishment of at least 15 business incubators and the National Association for business

REDETE – ECONOMIC DEVELOPMENT AND ENTEREPRENEURSHIP IN TRANSITION ECONOMIES
168
incubators. In collaboration with the National Agency for Development of SME and local authorities, Entrance established the first business incubator in Niš in September 2004. The incubator was established in the premises of Machine Industry Niš, spread out to 2,100 m2 and had 14 incubation units and the incubation period was 4 years. In May 2005 was established a business incubator center in the premises of the Factory IMT - Knjaževac. This incubator has been established by associations of citizens "Timočki Club" and is the first private initiative for business incubation in the Republic of Serbia.
However, during 2007 Ministry of Economy and Regional Development didn’t supported incubators as a priority, which led to the development of incubators with ad-hoc initiatives of local governments and individual donors. Among the first incubators established in the following years were incubators in Subotica, Zrenjanin, Prokuplje and Vranje, and then followed the incubators in other towns in Serbia. Austrian Development Agency ADA has supported the development of incubators in Vojvodina through the initiative of BBI (Building Business Incubators) which is implemented in the framework of multi-annual program “Integrated Plan of Regional Development of the Autonomous Province of Vojvodina”. BBI initiatives launched a fundings for the support of business incubators in Vojvodina awarding financial aid to the incubators annually. After the realization of the program the Government of Vojvodina has continued to award grants to incubators in Vojvodina, awarding 9.5 million RSD in 2010. In November 2011 the Government of Vojvodina has announced a new competition for grants funding the development of business incubators in Vojvodina territory in the amount of 12.85 million RSD. USAID has also been active in supporting the development of incubators in Serbia by financing the construction of the physical space or the technical equipment for the incubators in Kruševac, Zaječar, Prokuplje, Novi Sad and Kragujevac (Mijačić, 2011).
OSCE70 also supported incubators in Serbia (investment in Technology Incubator of Technical Faculties in Belgrade), as well as the SPARK71 (investment in incubators in Vranje, Belgrade, Kragujevac and Užice). The Government of the Slovak Republic and EU Exchange program supported the development of incubator in Petrovac. With the grants from the National Investment Plan of the Government of the Republic of Serbia was built a business incubator in Kruševac and adapted incubator space in Vranje. Business Incubator in Vranje was also supported by the BAT72, which funded purchase of substation for the incubator.
Today in Serbia, there are 23 incubators spread across the country. Most incubators were established in the Vojvodina region, eight of them, and in the following cities and municipalities: Novi Sad, Subotica, Zrenjanin, Bački Petrovac, Pančevo, Senta, Kanjiža and Beočin. A larger number of incubators in Vojvodina than in other parts of Serbia are a consequences of BBI and Vojvodina government investment in the development of this sector. In the Eastern and Southern Serbia there were established seven incubators in the following cities and municipalities: Niš, Vranje, Zaječar, Bor, Knjaževac, Rovinj and Medveđa. In this region, there is an initiative for the establishment of two new incubators in Majdanpek and Kladovo. In Šumadija and Western Serbia there are six incubators, four existing and two new initiatives for the development of incubators. They are located in the following cities and municipalities: Kragujevac, Rača, Kruševac, Užice, Valjevo and Kraljevo. In the Belgrade there are two incubators, located in the municipalities Palilula (Beograd) and Rakovica.
The relatively high level of education of the work force in Serbia is the main advantage for establishing business incubators. This especially applies to the areas of technical and technological sciences. It should be emphasized that Serbia has great human resources for the
70 Organization for Security and Co-operation in Europe 71 SPARK began as Academic Training Association (ATA), based in Amsterdam, with one field office in Pristina. ATA
focused on the restructuring and reform of universities in the Balkan region, organising summer universities, student and staff exchanges and English language programmes. In 2007, SPARK emerged from ATA, shifting focus to direct poverty alleviation, through private sector development.
72 British American Tobacco

REDETE – ECONOMIC DEVELOPMENT AND ENTEREPRENEURSHIP IN TRANSITION ECONOMIES
169
development of information technology, as evidenced by fact that the large Western companies are interested in IT professionals from Serbia. For productions based on high technology it’s characteristic that they are specialized for the specific implementation. This decision means that the IT experts from Serbia are competitive on the labour market based on their knowledge in these areas. These are some of the main motivations for domestic and foreign investors who are looking for new ideas to develop new and competitive products. Experience from over the past 20 years shows that developed business incubators are small but important element in stimulating entrepreneurship and small business sector. However, it should be noted that the software for business incubators requires centralized or government support, in addition to regional strategic consensus. The success of a business incubator depends greatly on the ability of management, realistic expectations and resources. Developed economies, as well as economies in transition use traditional incubators as a catalyst in the process of stimulating production.
Conclusion
Business incubators are one of the key programs of economic development in the Republic of Serbia. They give contribution to the competitiveness of local start up companies, strengthen the cooperation between entrepreneurs and academic institutions and create local capacities that are oriented towards practical and innovative models of behavior. For business incubators, in order to become a successfully developed and functioning, it is essential that their establishment is clearly focused on economic and business development objectives. Macroeconomic stability of an economy is also very important for good functioning of small and medium businesses, as well as a system of values that supports successful and enterprising.
The companies that emerge from the business incubators are often on the leading position in the development of new, innovative technologies, which will progressively affect the environment, especially the quality of its products and services. The practice shows that the successful development of business incubators need to develope regional agencies and business support centers. So far, this model has achieved the greatest success in the form of centers linking research and development process, and small and medium enterprises, as well as the integration of private and public sector. It could be applied for the productive use of office space and equipment, which appear in the process of restructuring our economy. The significant role of the business community in transition countries, like Serbia, is in promoting the entrepreneurial spirit and entrepreneurial culture, which focuses on individuals accepting responsibility for their own financial status. This motivates them to accept new forms of engagement, including the "self" as opposed to the decades-rooted habit to expect a complete social concerns and initiatives to secure jobs. With the current high rate of unemployment, job creation, which includes self-employment, is a priority of social effort, in which significant contributions can provide small and medium enterprises. In transition countries business incubators can provide a strong impetus on the creation of new jobs. This is especially important at a time when privatization and restructuring of the economy left many people out of work. Entering in the modern, global trends of business incubation is one way to create new opportunities for growth - both the regions, and the whole national economy. However, the business incubator is needs planned and coordinated approach and above all, support of state and local governments.

REDETE – ECONOMIC DEVELOPMENT AND ENTEREPRENEURSHIP IN TRANSITION ECONOMIES
170
Reference list
1. Eurobarometer Team of the European Commission, (2007) Observatory of European SMEs, Flash Eurobarometer, No. 196, Budapest, European Comission
2. Mijačić, D. (2011). Analysis of Business Support Infrastructure in the Republic of Serbia. National Agency for Regional Development, Belgrade
3. OECD. (1999). Business Incubation: International Case Studies. OECD Local Economic and Employment Development (LEED) Programme, Paris
4. NARD. (2008). Strategy for Development of Competitive and Innovative Small and Medium-sized enterprises 2008 – 2013. National Agency for Regional Development of Serbia. http://narr.gov.rs/ (accessed 19/09/2012)
5. Zavata, R. (2008). Financing Technology Entrepreneurs & SMEs in Developing Countries: Challenges and Opportunities. The International Bank for Reconstruction and Development / The World Bank, New York. www.infodev.org (accessed 19/09/2012)

PART THREE:
Intellectual And Social Capital, Knowledge Economy

REDETE – ECONOMIC DEVELOPMENT AND ENTEREPRENEURSHIP IN TRANSITION ECONOMIES
172
MEASURING INTELLECTUAL CAPITAL IN THE BANKING SECTOR IN THE REPUBLIC OF MACEDONIA
Margarita JANESKA73 Kosta SOTIROSKI74 Suzana TALESKA75
Abstract
The business success of each company depends on its ability to manage all available reso-urces, which may be tangible (material and financial) that are covered by the traditional finan-cial statement, and intangible (intellectual capital). Also, the awareness of the role of intellect-tual capital significantly increases in the newly created value, which cannot be properly expre-ssed in financial statements. In that sense, in order to achieve better business performances and long-term competitiveness banking institutions in the Republic of Macedonia need to measure the intellectual capital. With the application of the existing methods for measuring intellectual capital, such as Intangible Assets Monitor (IAM), Danish Guidelines, Meritum Guidelines and balance of knowledge, it is necessary to define adequate models for measuring and reporting intellectual capital in the banking sector in the R. Macedonia. Depending on the business needs expressed by the key factors of intellectual capital, relevant indicators for measuring intellectual capital in the banking sector in the R. Macedonia should be defined as well. That allows for a comparison between the efficiency of the banking institutions in the R. Macedonia in terms of managing intellectual capital and taking appropriate corrective actions for business.
Considering the fact that the issue has not been explored in the R. Macedonia, this paper will be the first step towards finding ways that will enable the banking sector in the R. Macedonia to better use, manage and develop knowledge which creates new value. That would increase their competitiveness and provide further prosperity.
The purpose of this paper will be:
- to identify the real needs for measuring intellectual capital in the banking sector of the R. Macedonia
- to obtain quality information based on scientific and technological facts that will contribute to better management of intellectual capital.
- to propose measures for improvement and development of intellectual capital in the banking sector in the R. Macedonia.
Keywords: intellectual capital, measuring intellectual capital, indicators, management of in-tellectual capital.
73 Faculty of Economics – Prilep, Gjorce Petrov bb.7500 Prilep, Macedonia, E-mail: [email protected] 74 Faculty of Economics – Prilep, Gjorce Petrov bb.7500 Prilep, Macedonia, E-mail: [email protected] 75 Faculty of Economics – Prilep, Gjorce Petrov bb.7500 Prilep, Macedonia, E-mail: [email protected]

REDETE – ECONOMIC DEVELOPMENT AND ENTEREPRENEURSHIP IN TRANSITION ECONOMIES
173
1. The importance of intellectual capital in creating new value
The time in which we live today is a time of changes. They are profound and rapid, and affect all spheres and areas of working and living. Modern enterprises are confronted with the dilemma how to survive and successfully operate in a business environment whose main features are uncertainty and unpredictability. Nowadays managers of successful enterprises are aware that the competitive advantage of their enterprises primarily depends on what their manager knows, how he/she uses what he/she knows, how he/she can quickly learn something new, and so on.
Successful organizations do not manage only labor and capital. Real managers have to keep an account of one more key resource: knowledge. Knowledge is the only resource that never decreases, but only increases with use.
The dynamics of today’s working wholly affirms the importance of intellectual capital. All business processes and activities are intensified by knowledge, and the goal is to add new value to the product or service and to increase the competitive advantage of the organization. Namely, the strategic orientation and the growing globalization of working increasingly distinguish the intellectual capital as a source for competitiveness of organizations. Knowledge and intellectual capital are the only lasting resource for competitive advantage preservation in the new economy and therefore, they need to be managed. Thereto, the question arises: how to increase human capital? The answer, of course, is the continuous learning process which employees into enter-prises need to go through. Measuring the value of human capital is needed for its management and it is therefore necessary to develop modalities for its usage.76 Organizations should not be discouraged by the lack of standardized metrics and accounting standards for measuring intellectual capital. Organizations must turn to themselves and independently develop methods for monitoring and quantification of intellectual capital. Accurate measurement of intangible value is always possible, but most important is the actual process of measuring. The relationship between intangible and tangible working parameters still cannot be expressed with precise and standardized metrics, but the actual attempt to measure the value of human capital means that the organization is much better acquainted with its employees, their individual values and their contribution to achieving the final goal. Additionally, that way much useful information is discovered, such as, the level of individual initiatives, motivation for work, satisfaction, challenges, experiences, future expectations and needs, and so on.
Intellectual capital is classified as human, structural and relational capital. This is most
commonly used classification of intellectual capital.77 - Human capital - represents all the skills and abilities of the manager who works in the bank.
It includes: employees' efficiency, ability for innovation, creativity, know-how, flexibility of employees, tolerance, motivation, satisfaction, capacity for teamwork, education and sharing knowledge, loyalty, experience, formal training and education, and so on.
- Structural capital - involves system and structure which allows the available resources to be used in the best way possible, or effectively. It includes: organizational routines, corporate culture, innovation of processes and procedures, systems, organizational culture, IC technology, databases, and so on.
-Relational capital - is associated with the external relations of the bank, namely, relations with the clients, business partners, other banks, and it incorporates: image, clients’ loyalty, relations with clients and their satisfaction, power of advertising, activities in the environment, the financial market, money market, and so on. 76 Duffy, D., A Capital Idea: Human Capital, CIO Enterprise Magazine, www.cio.com/archive-enterprise-111599 human
content.html 77 Nordic Industrial Fund : Intellectual Capital - Managing and Reporting, 2001, page 69.

REDETE – ECONOMIC DEVELOPMENT AND ENTEREPRENEURSHIP IN TRANSITION ECONOMIES
174
In other words, value is created with interaction of the individual components of intellectual capital, so to successfully manage intellectual capital it is necessary to improve the performances of each of its categories separately, as well as their mutual interactions.
2. Conducting of research
2.1. Research hypotheses
In accordance with the problems and the objectives of this research, as well as the available information, the following hypotheses were formed:
- H1: There are relevant indicators for measuring intellectual capital in banks in a certain economic environment. Collecting relevant data for the banking sector in the Republic of Macedonia.
- Individual hypotheses:
- H1.1: There are relevant indicators for measuring human capital in banks in a certain economic environment.
- H1.2: There are relevant indicators for measuring structural capital in banks in a certain economic environment.
- Н1.3: There are relevant indicators for measuring relational capital in banks in a certain economic environment.
2.2. Research methods
This research was conducted using a survey questionnaire which included managers (top level and middle level managers) who helped us receive and assess relevant indicators for the abovementioned sector and separately, for each intellectual capital group, whereupon the proposed set of indicators should not be taken as final and it will serve as basis for selection and defining relevant indicators for measuring intellectual capital in other businesses, with certain modifications according to the specific characteristics of each business.
The survey covered 12 out of a total of 17 banks in R. Macedonia. (70.59%) with an appropriate statistical procedure for random selection in SPSS and in Microsoft Excel- Data Analysis). Most of the surveyed respondents, or 23.42% were from "UNI Bankа”, 12.61% were from “NLB-Tutunska Bankа”, and 23.42% were from both “Stopanska and Komercijalna Bankа”. Least respondents were surveyed in “Zirat Bankа”, 1.8%.
During the research, the method of representative excerpt was used, as well as a combination of questions (categorical type questions, where most of them were closed format questions, as well as scaled questions). All that, along with the processing and presentation of data, will be conducted with adequate software support.
2.3. Statistical analysis of factors and variables of intellectual capital in the banking sector in the R. Macedonia
The sequence of factors of the human, structural and relational capital against the impact of the business result and the banks’ success is presented in the following table:

REDETE – ECONOMIC DEVELOPMENT AND ENTEREPRENEURSHIP IN TRANSITION ECONOMIES
175
Table 1. Percentage share of total answers about the important key factors of different types of intellectual capital
Type of intellectual capital Important key factors Percentage of total answers
Human capital
employees’ efficiency 14,84 expert knowledge of the employees 14,84 team work and knowledge transfer 13,55
employee motivation 12,09 employee experience 10,26
Structural capital
organizational structure 14,63 information-communication
technology 13,13
managerial processes/management system
12,95
database (for employees, customers/clients, suppliers, etc.)
10,51
innovative products development 10,32
Relational capital
relations with clients/customers 19,11 image, reputation and brand of the
bank and business network 18,92
business network 12,99 relations with the competition 11,50
relations with stockholders and investitors
10,20
In the next table are presented the extracted main factors in the banking sector and their
individual and cumulative share in the total variance:
Table 2. Cumulative and individual share of the main factors in the total variance (see attachment 2)
F1 F2 F3 F4 F5 F6 F7 F8 F9 F10 F11 F12 F13 F14
0,198 0,271 0,337 0,388 0,436 0,478 0,518 0,555 0,590 0,623 0,653 0,681 0,707 0,731
1 19,8 27,1 33,7 38,8 43,6 47,8 51,8 55,5 59,0 62,3 65,3 68,1 70,7 73,1 2 19,8 7,34 6,52 5,15 4,80 4,16 3,99 3,77 3,48 3,25 3,03 2,80 2,30 2,41
1. Cumulative share in the total variance (in %) 2. Individual share of factors in the total variance (in %)
With factor analysis of the main components, extracted were 14 main factors in the banking
sector. The main factors represent 73.1% of the total variance, i.e. the phenomenon of intellectual capital in banking institutions in the R. Macedonia. The fact that the representation of factor space is almost 75% indicates that the questionnaire is suitable for investigating the phenomenon of intellectual capital of banking institutions in the banking sector, or in other words, the questions in the questionnaire may sufficiently describe the dominant characteristics of intellectual capital in this sector. That way, a possibility of identifying adequate indicators of intellectual capital in the banking sector is created. Having in mind the cumulative share of the main factors, as well as their individual shares in the total variance (Table 1), it may be perceived that the first factor, F1, represents 19.8% of the intellectual capital phenomenon of banking institutions in the banking sector, whereas the share of all other factors together in the total variance is significantly lower (see Table 1). Namely, a decreasing trend of values from 7.34% to 2.41% was perceived. Moreover, the share of the first 7 factors represents 51.8% of the total variance, while the remaining 7 factors represent 21.3% of the total variance (slightly more than the first factor).
The communality of all 42 variables is greater than the determined threshold of 0.6 (see Attachment 2), which means that all determined variables are embedded in the factor space. This

REDETE – ECONOMIC DEVELOPMENT AND ENTEREPRENEURSHIP IN TRANSITION ECONOMIES
176
only confirms that the variables are well chosen, because each of them corresponds relatively well with the phenomenon of the researching the intellectual capital in banking institutions in R. Macedonia.
What follows is a summary of factors and manifest variables, which, statistically speaking, are the most relevant in describing the intellectual capital in banking institutions in R. Macedonia.
At the beginning, a proper formalization of the factors important for IC was conducted i.e. the variables and identification of their basic characteristics, represented by appropriate statistical data. They are a subject to statistical analysis and factor analysis of components and are presented in the following Table:
Table 3. Variables and their statistical data included in statistical and factor analysis
Variables included in statistical and factor analysis
Average value
x
Standard deviation
( x ) x / x F ABS( x / x )*F
1x - Employees have knowledge that is
needed for successful work of the organization
2,84
0,485
5,86
0,519
3,04
2x - It would cause major problems in case
some of the employees decide to leave the organization
1,89 0,938
2,01 -0,271
0,55
3x - In our organization we appreciate the
ability for easy and fast interaction with other employees
2,77 0,567
4,89 0,384 1,88
4x - Employees are very familiar with
business processes and procedures
2,81 0,437
6,43 0,540 3,47
5x - Employees are very familiar with the
market and clients’ profiles
2,72 0,525
5,18 0,365 1,89
6x - Employees independently invest in their
knowledge
2,47
0,872
2,83 0,242 0,69
7x - Employees are individually rewarded
according to their ideas and innovations
2,25
0,986
2,28 0,500 1,14
8x - Employees are motivated to perform
their duties professionally
2,59 0,734
3,53 0,617 2,18
9x - Employees share their knowledge and
experiences with their colleagues
2,80
0,483
5,80 0,321 1,86
10x - Vocational development of employees
is crucial for survival and development of the organization
2,88
0,399
7,22 0,222 1,60
11x - The relations among managers are good
and proper
2,77
0,628
4,41 0,572 2,52
12x - The relations among directors are good
and proper
2,74
0,583
4,70 0,360 1,69
13x - Employees are ready for teamwork
2,78
0,534
5,21 0,459 2,39
14x - Employees continually attend training
(seminars, courses, etc.)
2,46
0,861
2,86 0,541 1,55

REDETE – ECONOMIC DEVELOPMENT AND ENTEREPRENEURSHIP IN TRANSITION ECONOMIES
177
Variables included in statistical and factor analysis
Average value
x
Standard deviation
( x ) x / x F ABS( x / x )*F
15x - Employees have the ability to solve
problems
2,73
0,522
5,23 0,477 2,49
16x - The interest of the organization always
comes before the interests of any employee
2,86
0,537
5,33 0,439 2,34
17x - The business success is a result of the
management methods of the chief manager
2,57
0,627
4,10 0,228 0,93
18x - The organization continuously
innovates processes, products and services
2,83
0,445
6,36 0,648 4,12
19x - The use of information technology
greatly influences communication and cooperation
2,88
0,375
7,68 0,418 3,21
20x - The quality system improves the
operating of the organization
2,96
0,355
8,34 0,431 3,59
21x - There is a system for rewarding good
ideas in the organization
2,60
0,967
2,69 0,445 1,20
22x - There is a motivation system in the
organization
2,45
0,828
2,96 0,577 1,71
23x - Your products/services are recognized
on the market
2,74
0,567
4,83 0,598 2,89
24x - All the procedures are consistently
carried out in the organization
2,83
0,445
6,36 0,500 3,18
25x - There is a complete documentation
system (in terms of work processes, ways of executing duties, specific problems, etc.)
2,96
0,267
11,09 0,495 5,49
26x - Appropriate teams are formed
according to the problem at hand
2,69
0,724
3,72 0,273 1,01
27x - The organization invests in
development and research
2,85
0,741 3,85 0,483 1,86
28x - The organization invests in market
research in order to discover the customers’ needs
2,79
0,648
4,31 0,556 2,39
29x - The knowledge about customers’ needs
and problems is used in order to improve the internal processes and the quality of products
and services
2,84
0,548
5,18 0,529 2,74
30x - There is employees database (in terms
of their knowledge, skills, work experience, etc.)
2,98
0,674
4,42 0,101 0,45
31x - There is customer database (in terms of
their age, loyalty, period of cooperation, etc.)
2,96
0,609
4,86 0,183 0,89

REDETE – ECONOMIC DEVELOPMENT AND ENTEREPRENEURSHIP IN TRANSITION ECONOMIES
178
Variables included in statistical and factor analysis
Average value
x
Standard deviation
( x ) x / x F ABS( x / x )*F
32x - Employees from different parts of the
organization cooperate among themselves (sectors, departments, etc.)
2,80
0,423
6,62 0,506 3,35
33x - The organization organizes training and
education for its employees
2,73
0,602 4,53 0,596 2,70
34x - There is continuous communication
with existing customers/clients
2,90
0,356
8,15 0,251 2,04
35x - There is continuous monitoring of
customer/client satisfaction
2,87
0,495
5,80 0,389 2,26
36x - The competitors’ performance is
continually monitored
2,93
0,583
5,03 0,182 0,91
37x - Long-term customers/clients are
particularly looked after
2,95 0,353
8,36 0,362 3,03
38x - There is good cooperation and
continuous communication with stockholders, investors and business partners
3,06 0,607 5,04 0,221 1,11
39x - There is clear concept for public
presentation of the organization
2,94
0,576
5,10 0,448 2,29
40x - The organization has good sales,
marketing and distribution network
2,75
0,639
4,30 0,592 2,55
41x - The organization has developed good
electronic network
2,83
0,537
5,27 0,644 3,39
42x - The organization has signed contracts
for franchises, licenses, and so on.
3,13
0,945
3,31 0,133 0,44
The review of factors and their significant variables, which, statistically speaking, are the most
relevant means for describing IC in banks, is as follows:

REDETE – ECONOMIC DEVELOPMENT AND ENTEREPRENEURSHIP IN TRANSITION ECONOMIES
179
Factor - component 1: Interdependence of human and structural capital
Variable Proposition ABS( x / x )*F
18x S
The organization continuously innovates processes, products and services 4,12
41x R The organization has developed good electronic network 3,39
8x H
Employees are motivated to perform their duties professionally 2,18
23x S
Your products/services are recognized on the market 2,89
33x S
The organization organizes training and education for the employees 2,70
40x R
The organization has good sales, marketing and distribution network 2,55
22x S There is a motivation system in the organization 1,71
11x H The relations among the managers are good and proper 2,52
28x S
The organization invests in market research in order to discover the customers’ needs
2,39
14x H Employees continually attend training (seminars, courses, etc.) 1,55
4x H Employees are very familiar with business processes and procedures 3,47
29x S
The knowledge about customers’ needs and problems is used in order to improve the internal processes and the quality of products and services
2,74
1x H Employees have knowledge that is needed for successful work of your
organization 3,04
32x S
Employees from different parts of the organization (sectors, departments, etc.) cooperate among themselves
3,35
24x S All the procedures in the organization are consistently carried out 3,18
7x H
Employees are individually rewarded according to their ideas and innovations 1,14
25x S
There is a complete documentation system (in terms of work processes, ways of executing duties, specific problems, etc.)
5,49
Value weight - degree of presence of the factor 48.41
Factor - component 2: Teamwork as factor for increasing intellectual capital and working performances
Variable Proposition ABS( x / x )*F
9x H Employees share their knowledge and experience with their colleagues 1,86
13x H Employees are ready for teamwork 2,39
Value weight - degree of presence of the factor 4.25
Factor - component 3: Good familiarity with employees, competition and customers is the key to success of banking organizations
Variable Proposition ABS( x / x)*F
36xR
The competitors’ performance is continually monitored 0,91
5x H
Employees are very familiar with the market and clients’ profiles 1,89
30x S
There is employees database (in terms of their knowledge, skills, work experience, etc.)
0,45
Value weight - degree of presence of the factor 3.25

REDETE – ECONOMIC DEVELOPMENT AND ENTEREPRENEURSHIP IN TRANSITION ECONOMIES
180
Factor - component 4: Vocational development is the key to survival and development of banking organizations
Variable Proposition ABS( x / x )*F
10x H Vocational development of employees is crucial for survival and development of the organization
1,60
Value weight - degree of presence of the factor 1.60
Factor - component 5: The significance of knowledge management for survival and growth of banking organizations
Variable Proposition ABS( x / x )*F
6x H
Employees independently invest in their knowledge 0,69
2x H It would cause major problems if some of the employees decide to leave the organization
0,55
Value weight - degree of presence of the factor 1.24
Factor - component 6: Business relations as a source for intellectual capital
Variable Proposition ABS( x / x )*F
38xR
There is good cooperation and continuous communication with stockholders, investors and
business partners
1,11
Value weight - degree of presence of the factor 1.11
The most relevant factors for describing the IC in banks in R. Macedonia are presented in the following table:
Factor - component
Name Manifest variables Value weights
1 Interdependency of human and structural capital
18x , 41x , 8x , 23x , 33x , 40x ,
22x , 11x , 28x , 14x , 4x , 29x ,
1x , 32x , 24x , 7x , 25x
48,41
2 Teamwork as factor for increasing intellectual capital and working
performances
9x , 13x 4,25
3 Good familiarity with employees, competition and customers is the
key to success of any bank organization
36x , 5x , 30x 3,25
4 Vocational development is the key to survival and development of
banking organizations
10x 1,60
5 The significance of knowledge management for survival and
growth of banking organizations
6x , 2x 1,24
6 Business relations as a source for intellectual capital
38x 1,11

REDETE – ECONOMIC DEVELOPMENT AND ENTEREPRENEURSHIP IN TRANSITION ECONOMIES
181
Accordingly, the most relevant factors (in statistical sense) for describing IC in the banking sector are:
1. Interdependency of human and structural capital
2. Teamwork as factor for increasing intellectual capital and working performances
3. Good familiarity with employees, competition and customers is the key to success of any bank organization
4. Vocational development is the key to survival and development of banking organizations
5. The significance of knowledge management for survival and growth of banking organizations
6. Business relations as a source for intellectual capital
Comments and concluding observations regarding the research
The purpose of this research is not to identify precise measures of IC for different banks, but to broaden the perspectives of the observed IC in order to generalize those measures and make them usable in the banking sector in the R. Macedonia. They will enable broader application in measuring IC and a possibility of comparison with other companies that do the same or similar work. This research will enable banks in the R. Macedonia to better use and faster develop the knowledge that creates value and thus, they will increase their efficacy and competitiveness and that, in its turn, will provide further prosperity. Basically, the results of this research are important information that would enable banks to more effectively measure, inform and manage their key resource, the intellectual capital. The set of proposed indicators should not be considered as being a final list of indicators relevant for any bank in the R. Macedonia, but they should serve only as a basis for assessing, selecting and defining relevant indicators for measuring IC in different banks in the R. Macedonia, according to their particularities and specificities. It means that the proposed set of indicators for measuring IC in the banking sector should be improved and further developed according to the actual needs of the banks. The result of this research is quality information that will contribute to further development and more effective management of IC in the banking sector of the Republic of Macedonia. Also, the results of this research enrich the existing knowledge and experience in the field of measuring IC. The established class of IC indicators in the surveyed banks included in the extract creates an opportunity for comparing intellectual capital in different banks in the banking sector in the Republic of Macedonia. Based on the provided information, numerous management initiatives and corrective activities may be proposed in order to improve and develop the existing IC. With the report on IC, banks are made aware of their intangible resources; they discover their hidden potentials and reserves, they better use and faster develop their knowledge and become more competitive on the market. It also improves the basis for superior strategic management in banks and making better strategic decisions.
- The interdependency of human and structural capital in the banking sector most relevantly describes the management of intellectual capital. Namely, according to statistical indicators, this factor has value weight of 48.41.
- Human capital is most relevantly described by the second, the fourth and the fifth factor, or in other words, teamwork and employees’ willingness to transfer their knowledge and experiences to others, importance of professional development, as well as effective knowledge management as factors for efficient and effective completion of activities and key resource for achieving competitive advantage.
- Structural capital is most relevantly described by the third factor, namely, database management as a source for permanent growth and development.

REDETE – ECONOMIC DEVELOPMENT AND ENTEREPRENEURSHIP IN TRANSITION ECONOMIES
182
- Relational capital is most relevantly described by the sixth factor which emphasizes the importance of maintaining communication and cooperation with stockholders, investors and business partners.
With analysis of value weight factors it is possible to derive the following conclusions about the degree of presence of certain characteristics on the basis of presence of motivational variables:
- Considering the first factor, the following motivational variables are of greatest importan-ce: The existence of a complete documentation system, good cooperation among employ-yees from different parts of the organization and innovating products, services and processes as variables of structural capital. Motivational variables of human capital that ha-ve greatest importance for this factor are the following: Having employees who possess knowledge required for successful work of the organization, familiarity with business processes and procedures, good relations among managers and motivated employees who perform their duties professionally. It may be concluded that good relations and commu-nication exist in different sectors or departments among managers, as well as among employees. But the motivational factor 12x does not manifest in any of the key factors, even though it refers to relations between directors and employees. This means that although 72.97% of the respondents agree that relations between managers and employees are good and proper, this variable does not have crucial importance for efficient and effective realization of assigned tasks. It is important that the variable 17x - business success is a result of managing methods of the chief manager - does not manifest in any factor, which corresponds with the answers to this question. Namely, half of the respon-dents think that business success is not a result of managing methods of the chief manager. This variable does not exist as key factor in human capital as well. Namely, important key factors of human capital are: employees’ efficiency, expert knowledge of the employees, teamwork and knowledge sharing, motivation and employees’ experience. Good familiarity with business procedures - 4x is a factor for successful work, and it is a result of employees’ professional development - 14x , which is also a good motivational factor. First key factor does not include the variable 16x - the interest of the organization always comes before the interests of any employee, which means that there are no shared values and beliefs within organizations and that may be due to exclusion of the variable 12x - lack of good relations between managers and employees.
It is typical that the motivational factor 22x - in every organization there is a motivational system which is incorporated in the first factor, but obviously motivation is a result of the constant rewarding of employees according to their ideas and innovations - variable 7x , and not a result of existing system for rewarding good ideas, because the variable 21x does not manifest in any key factor.
- Of particular importance is teamwork as factor for achieving better results and working performances. The fact is that teamwork is a modern and flexible way of organizing employees in banking organizations and it has the following advantages: increased employee motivation, increased productivity, greater employee satisfaction, greater commitment to the goals of the organization, better communication among members, improvement of business skills, increased business flexibility, significantly reduced costs, and so on. In teamwork, group of people cooperate in order to participate in the overall success of the organization. Members should understand that priority is mutual and not individual interests. But according to statistical indicators, exactly that is not present in the key factors. In other words, the abovementioned variable 16x is not present in the discovered key motivation variables. Also, the motivational variable 26x - appropriate teams are formed according to the problem at hand - is not present in this context. Here the lack of good relations between managers and employees is apparent. Namely, the combination of knowledge is different for each problem. From that point of view, the

REDETE – ECONOMIC DEVELOPMENT AND ENTEREPRENEURSHIP IN TRANSITION ECONOMIES
183
managing structure should initiate and support the process of creating appropriate teams, which will help to improve the overall working performances.
- The existence of databases for employees is a key factor for intellectual capital, and that is supplemented with the presence of the fifth factor - knowledge management as a key factor for managing intellectual capital. It would cause major problems in case some of the employees decide to leave the organization, is also an important motivational variable of this factor 2x . Namely, if some of the employees leave, there would be an outflow of knowledge in the organization and if the organization does not have nourishing methods, the knowledge of those people will be forever lost. From that perspective, employees in banking organizations should understand the importance of knowledge bases, and thus manage their knowledge. To this is added the fact that the organization consists of employees who contribute to adding value and increasing the total value of products or services. That helps to create personalized relationship with employees which in turn would increase productivity, employees would be more motivated and in general, a better working and friendly atmosphere would be created. If this approach is combined with appropriate methods of rewarding, decentralization of decision-making processes and delegating tasks, a feeling of belonging to the organization, healthy organizational culture, modern management approach, it will increase the working creativity and innovation as well as synergize the goals. In this context, it is important to denote that the variable 31x - there is a database for customers and that is not manifested in any of the key factors, which brings one to the conclusion that employees got very familiar with the market and the customer profile neither on the basis of the existing database nor on the basis of the continuous communication with existing users - variable 34x , nor monitoring the customer satisfaction - variable 35x which also does not manifest in any of the key factors, but on the basis of well-developed electronic network which actually contributes to the development of good sales, marketing and distribution network. With such a developed distribution or sales network, banking organizations can achieve lowering the costs while at the same time increasing the quality of products or services. Hence the conclusion that employees use ICT to get familiar with the market, competition and clients, as well as to nourish knowledge and create a database for employees, but not to increase the level of communication and cooperation - lack of motivational variable 19x .
- Vocational development of employees stands out as a separate key factor for adding new value to products as well as for survival and development of the organization. Namely, because banking organizations constantly improve their processes, products and services, arises the need for continuous upgrading the existing and adopting new knowledge. That is the reason why variables 24x and 20x are present. Namely, the employees are aware of the importance of continuous training (which is some sort of organizational culture), but not only in the field of banking product, services, processes or documentation, but also training that has to do with getting familiar with the market, competition, clients, communication, people, technology, customer satisfaction, and so on. If rewarding is in accordance with the completed trainings, it contributes to devotion and commitment of employees in performing the assigned tasks.

REDETE – ECONOMIC DEVELOPMENT AND ENTEREPRENEURSHIP IN TRANSITION ECONOMIES
184
Reference list
1. Duffy, D., A Capital Idea: Human Capital, CIO Enterprise Magazine, www.cio.com/archive-enterprise-111599 human content.html
2. Fulgosi, A. (1988): Faktorska analiza, Školska knjiga, Zagreb 3. Hair, F., J., Anderson, E., R., Tatham, L., R., Black, C.,W., Multivariate Data Analysis,
Prentice- Hall International, Inc, Fifth Edition 4. Hall, R. (1992): The strategic analysis of intangible resources, Strategic Management Journal,
vol 13, pp135-144. 5. Newbold, P., Carlson, W., Thome, B. (2007). Statistics for business and economics (6th ed.).
New Jersey: Pearson Education, Inc. 6. Nonaka, I.Takeuchi, H. (1995), The Knowledge-Creating Company, Oxford University Press. 7. Nordic Industrial Fund, Intellectual Capital - Managing and Reporting, 2001 8. Sullivan, P.H., Value driven intellectual capital: how to convert intangible corporate assets
into market value, New York: John Wiley & Sons, 2000 9. www.cio.com/archive-enterprise-111599 human content.html 10. www.km.review.com/knowledge-nov 1998/01.htm

REDETE – ECONOMIC DEVELOPMENT AND ENTEREPRENEURSHIP IN TRANSITION ECONOMIES
185
INTELLECTUAL CAPITAL – DEVELOPMENT RESOURCE AND KEY COMPETITIVENESS FACTOR OF 21st CENTURY
Nada TRIVIĆ78
Abstract
The key economical and developmental factor for the agrarian epoch was land, for industri-al was labour, and for the economy of 21 century it is knowledge or its economic equivalent – intellectual capital.
Rapidly changing and progressively uncertain business environment forces companies to assess their competitive advantage and the approach to oppose competition. Competitiveness depends on the knowledge the company encloses, how it puts it into use and how adaptable to new knowledge the company is. New sources of competitiveness should be: valuable, rare and hard or impossible to copy. Stated ability characterizes only intellectual capital. Therefore, ob-taining and maintaining a competitive advantage is only possible by acquiring knowledge, espe-cially in terms of creative vitality.
The intellectual capital, as a resource, is not limited and could not be exhausted. Thus, em-ployment of this resource in the production process leads to continuously increasing revenues and decreasing average costs. This is similar to natural monopoly. It could be argued that the law of diminishing (marginal) returns does not hold for the knowledge as a resource, but the law of (exponentially) increasing returns. However, in production the intellectual capital itself could not be used in isolation and it is combined with land, labour and capital. Thus, that gre-ater use of intellectual capital (rather than the use of land, labour and capital) is more favorab-le for the company.
Sustainable competitive advantage is the goal of every company, as it contributes to the above-average profit that is imperative in the contemporary business world: self-preservation with constant growth and development of a company. It is the result of continuous successful use of intellectual capital. In a dynamic sense, sustainable competitive advantage is the element of intellectual capital that helps achieve sustainable competitive advantage in upcoming condi-tions and changes. That is, above all, the ability of all employees to effectively respond to change.
The fact is that in last two decades the share of intangible assets to total value of companies is increasing, while the role of property is decreasing. Furthermore, in the price structure the increased participation of immaterial factor is noticeable. Nevertheless, intellectual capital is ignored and is regarded as a cost, not as an investment and development potential.
Keywords: knowledge, intellectual capital, innovations, competitiveness
78 The Faculty of Economics, Segedinski put 9-11, Subotica, Serbia; [email protected]

REDETE – ECONOMIC DEVELOPMENT AND ENTEREPRENEURSHIP IN TRANSITION ECONOMIES
186
“Knowledge is power – in every walk of life. The finaly victory belongs to knowledge”
1. Introduction
It seems that the economics is currently facing great changes, based entirely on the new view of the world. Namely, the economic reality in companies and national economies has been inter-preted in a new manner.
Many books and articles have been written on the subject of knowledge and intellectual capital and their role in the creation of value. The intellectual capital has become an influental factor of today’s economic reality. Peter Drucker says: The most valuable assets of a 20th century company were its production equipment. The most valuable asset of a 21st century institution will be its knowledge workers and their productivity.”
It is mainly clear how machinery and equipment increase productivity, generate savings and limit productivity. It is, however, not so clear how human capital and relations can contribute to productivity, replace and add to elements of tangible capital. One of the reasons for this is the fact that intellectual capital is difficult to measure and monitor. It is difficult to incorporate it in an economic theory or to put it in a mathematical expression. If an intellectual capital cannot be quantified or put in the equation, does it mean it does not exist? Economists who adopted a positivist orientation will say NO. However, on the other side, the economic flow interested in this intangible production factor is getting stronger.
In order to move one step forward, employees and their intellectual capital should obtain a key resource status or a status which is identical to the financial and physical capital. Namely, should it be recognized that the intellectual status is the key resource of the 21st century and that nowadays knowledge means the same what once were land, work and money, then it is natural to assign this resource a status it deserves: investment instead of costs. The treatment of employees as an investment is a beginning and ending to the economy based on knowledge.
The main goal of this paper is to present intellectual capital as an active variable which significantly determines company performances, an important component of costs, but with a great impact in creation of values.
2. Concept and Structure of Intellectual Capital
What do intellectual capital or intangible assets actually represent? The intellectual capital is a complex and relatively wide concept. Defining and measuring intellectual capital has been particularly in the focus of numerous discussions in the last two decades.
Taking into account different thinking on the concept of intellectual capital, it could be said that: intellectual capital is made up of people and their knowledge, capabilities, creativity, inven-tiveness, skills, experiences, cultures, motivations (...), with informatics networks which transfer knowledge and information, software, databases, licenses and high quality market relations. Due to the fact that many elements of intellectual capital are invisible, such a capital is defined as invi-sible, impalpable, “hidden”, intangible assets of a company, since it is not completely listed in balance sheets, and it includes things which are in the heads of employees and which remain in the company after employees have left it.
The concept of intellectual capital still does not have complete, accurate and unique definition. It is a relatively new (D. Sundać and A. Pulić, 2001), complex economic category involving all business factors which are not explicitly expressed in traditional financial reports. And yet it significantly influences long term company profitability and competitiveness. The concept of intellectual capital means (Brunsko Z., 2002, p. 115) creative application of knowledge in

REDETE – ECONOMIC DEVELOPMENT AND ENTEREPRENEURSHIP IN TRANSITION ECONOMIES
187
production and any other creative activity. The definition which is frequently emphasized by those who deal with intellectual capital is as follows: intellectual capital is something that cannot be materially determined, but can produce wealth and bring competitive advantage.
The value of a company does not only include physical and financial capital, but intellectual capital as well. For example, Microsoft is a company which has generated huge gains with limited traditional resources (physical and financial capital), but with significant intellectual capital. A kind of a paradox was reported on the stock market: in 1999 Microsoft book value was multiple lower than its market value. This difference alerts to the fact that the value of the company is determined to a great extent by something which is not explicitly stated, but nonetheless has a great value.
When economists use the term “capital” what they most frequently see is a physical (tangible) quality, material resources which comprise of production capacities able to generate future income. The capital means equipment, machinery, tools, vehicles, computers and alike, but the term “capital” can also be extended to include other less tangible resources. Tomer (1999) defines capital as “permanent production capacities, produced by economic subjects for achieving their goals”. Ostrom (2000) points out that the investment process, where the capital is created, “is a self-conscious process which appears as a result of expectations of higher production capacities as well as higher future gains.” He also indicates that capital resources are mainly permanent (used more than one period) and that introduction of new capital always involves opportunity cost (as a sacrificed/forgone alternative of the use of assets).
Therefore, the capital is produced or generated by people, it is permanent, presents production potential/opportunity, implies costs, and is generated consciously for achieving future benefits. These are also the features of intellectual capital or wider concept of intangible capital.
In the long run, features of intangible capital increase production potentials of economy. A significant element in defining intangible capital, as the key factor of production, is its analysis as a condition for economic growth. This opens further a question of concept and designed policy of how to create more and better intangible capital, in order to speed up the economic growth (Edvinsson, L. and Malone, M.S., 1997).
There are numerous and various perceptions of intellectual and intangible capital. Nevertheless, all concepts of intellectual capital are not equally valid, there is a lot of confusion and overlapping categories. Even so, there is a rather solid agreement on the scope and structure of intellectual capital, as well as on the difference between intellectual capital, human, structural and relational capital79. Thus, their explanation and integration is essential.
1. Human Capital – is defined as a combination of knowledge, skills, abilities and inno-vativeness of employees. These employees possess an entire range of individual and collective knowledge, capabilities, views, opportunities, behaviors, experience and emotions. Employees are not human capital per se, but become one only after they have transformed their knowledge and skills in action, in line with the business strategy of the company, which contributes to the creation of tangible or intangible values, benefits for the company (added value, new clients, better image, more successful business organization, profitable product, new and improved product). Human capital is a driver of intellectual capital. The definition of human capital could be extended to individual characteristics given in the table.
In the economy of knowledge the human capital becomes a key factor in business, since knowledge and abilities are invested in the company. Consequently, human capital should not be treated as cost. On the contrary, salaries, trainings should be regarded as an investment. This means changing the whole mindset of both employers and employees. If an employer sees investing in employees as an investment, rather than cost, he will not only expect an intellectual 79On the micro level, intellectual capital refers to non-physical values within a company; human capital refers to experience,
knowledge, skills, training, relational capital refers to customer relations, importance of brand, agreements; structural capital presents the company culture, working environment, intangible rights and alike.

REDETE – ECONOMIC DEVELOPMENT AND ENTEREPRENEURSHIP IN TRANSITION ECONOMIES
188
contribution, but also will appreciate it. It is logical that an “investor” expects his investment to pay off, although sometimes it is not visible in the short term, but eventually, gains are higher than other kinds of investments.
The fact that employees are not, together with machines, equipment, computers and buildings, yet another business asset was a painful discovery for companies which made people redundant during the restructuring process. In this way they have lost precious capital (knowledge, experience, ability, energy). Capable and engaged people are the key asset of a company because their intellectual input and performance “belong” to the company as long as they work there.
2. Structural capital presents an embodiment of human capital and its infrastructural support. In other words, structural capital is everything what remains with the company even after employees have left. Structural capital is an infrastructural support to the human capital. Human and structural capital are correlated – human capital builds the structural capital, and the higher the structural capital, the better chances are that human capital will achieve better results. It is logical, therefore, that companies should strive to increase the share of structural capital, without undermining the absolute growth of human capital.
Structural capital is entirely owned by the company, while only a part of it –intellectual ownership, is presented in balance sheets.

Tab
le 1
. Str
uctu
re o
f int
elle
ctua
l cap
ital
(Su
ndać
, D. a
nd Š
vast
, N. 2
009,
p. 2
4)
IN
TE
LL
EC
TU
AL
CA
PIT
AL
H
UM
AN
CA
PIT
AL
S
TR
UC
TU
RA
L C
AP
ITA
L
RE
LA
TIO
NA
L/C
ON
SUM
ER
CA
PIT
AL
M
anag
emen
t E
mpl
oyee
s In
telle
ctua
l pro
pert
y O
rgan
izat
iona
l pro
cess
es
Bus
ines
s ne
twor
ks
Bra
nd
Con
sum
ers
Ab
ilit
ies
Abi
liti
es
Pat
ents
B
usin
ess
orga
niza
tion
S
ales
, mar
keti
ng a
nd
dist
ribu
tion
netw
orks
; re
latio
ns w
ith
busi
ness
par
tner
s,
supp
liers
and
alik
e;
busi
ness
ass
ocia
tion
s;
elec
tron
ic n
etw
orks
Cre
atio
n of
co
mpa
ny
imag
e;
posi
tioni
ng o
n th
e m
arke
t;
abili
ty to
attr
act
cust
omer
s;
Cre
atio
n of
va
lue
in th
e ey
es o
f cu
stom
ers;
Cus
tom
er
rela
tions
and
co
mm
unic
atio
ns
aim
ing
at
achi
evin
g sa
tisfa
ctio
n an
d lo
yalty
Qu
alif
icat
ion
s Q
uali
fica
tion
s L
icen
ses
Str
ateg
ies
E
xper
ien
ce
Exp
erie
nce
Cop
yrig
hts
Pla
ns
Cre
ativ
ity
Cre
ativ
ity
Fra
nchi
ses
Rul
es
Inn
ovat
iven
ess
Inno
vativ
enes
s S
oftw
are
Doc
umen
ts
Mot
ivat
ion
Mot
ivat
ion
P
roce
ss s
tand
ardi
zatio
n A
ttit
ud
es
Atti
tude
s
Dat
a ba
ses
Dil
lige
nce
D
illig
ence
Org
aniz
atio
nal p
roce
sses
R
esp
onsi
bili
ty
Res
pons
ibili
ty
O
rgan
izat
iona
l cul
ture
P
ersi
stan
ce
Per
sist
ance
S
ucc
ess
in
com
mu
nic
atio
n
Suc
ess
in
com
mun
icat
ion
Ab
ility
to
solv
e p
rob
lem
s A
bilit
y to
sol
ve
prob
lem
s
INT
ER
NA
L C
OM
PA
NY
EN
VIR
ON
ME
NT
E
XT
ER
NA
L C
OM
PA
NY
EN
VIR
ON
ME
NT

REDETE – ECONOMIC DEVELOPMENT AND ENTEREPRENEURSHIP IN TRANSITION ECONOMIES
190
3. Relationship capital presents a relationship between strategic business units within a com-pany, relationships between the company and environment (consumers, distributors, partners and all other interesting parties).
Better related subjects are able to work more efficiently. This means that without proper relations, some activities could not be realized or not as many of them could be realized, while de-veloped relationship capital uses less resources and operational costs are lower80, which con-tributes to the increase of overall efficiency and productivity. Fukuyama (1995, p. 90) says that developed relationship capital “presents an efficient form of organization, which would otherwise be burdened by numerous rules, agreements, bureaucracy and litigations”81.
Customer capital – is a key part of relational capital of a company. It consists of relationship with consumers (customers, clients, guests), consumer database, and in some cases it is extended to relationships with suppliers and partners. The consumer is a beginning and ending of value creation chains (tangible and intangible). The survival of all service and production activities depends on consumers, while insufficient attention is paid to their requests, desires and satisfaction. Serious and systematic dealing with consumers and relationships with them enables a timely reaction to new trends, development of innovative products, and training of people. Therefore, the ultimate goal is the customer satisfaction, which is achieved when their needs are met. Moreover, some theoreticians refer to customers as real corporative employers – “The customer is the only one who can fire us all.”
3. Intellectual Capital:
The Key Factor of Development and Competitive Advantage of the Company
The contribution of intellectual capital to the economic growth has gained more and more attention in theoretical and empyrical analyses. There are many empirical studies investigati-ng whether companies with more intellectual capital have better performances and whether they are more competitive82.
While in the industrial epoch investment in machines and equipment was a basis of crea-ting value and competitiveness, nowadays companies invest in employees who become a key factor to the creation of values and competitive advantage (Pulić, A., 2004, pp 62-68). Actua-lly, competitive comapnies combine two key resources, financial and intellectual capital, which together create value. A rational creation of value is the main goal of every economic
80 The literature gives an educational example of Jews whose relationship capital is very well developed on the diamond
market. Their close and strong relationship within a family, community and region enable high level of trust among diamond merchants, thus enabling easy trade. “Lack of those connections would require studies, insurances or other expensive securities or there would be no transaction at all.” This shows that the relationship capital has provided both efficiency and effectiveness.
81 USA, Japan and Germany are given as examples of high confidence leading to the creation of economically sucessful corporations, which significantly contribute to a great output and growth of their economies.
82 Bannany (2008) points out that relatively good company performance can be improved, due to the fact that a proper attitude towards intellectual capital and strategy to attract customers influences the change in company rating within a respective industry. This means that creation of value using intellectual capital and operational performances of the company positively correlate. Kamath (2008) admits that the concept of intellectual capital is in its initial phase in India. He investigates only domestic pharmaceutical industry and concludes that there is a positive relationship between company performances and intellectual capital. Bannany (2008) indicates that investments in intellectual capital have a significant impact of the banking industry performance in the UK. Royal and O`Donnell (2008) believe that intellectual capital is an important resource in the company’s management system. However, their goal is to show that human capital is a source of improtant power of the compay in the market race, as well as in all its commercial and promotional activities.

REDETE – ECONOMIC DEVELOPMENT AND ENTEREPRENEURSHIP IN TRANSITION ECONOMIES
191
epoch, every company, institution, region or national economy. The same resources can create lower or higher value, so the key question is: is enough value created and if the value is efficiently created?
As a resource, intangible asset or intellectual capital is a valuable, but rare, and cannot be transmitted. It is difficult to copy or imitate, and creation of competitive advantage can signifi-cantly contribute to company assets (Barnej 1991; Wernerfelt 1984).
In the last twenty years the share of intangible assets in the total value of the company is increasing, while the role of tangible assets is decreasing.
Figure 1: Relationship between tangible and intangible assets in the total value of leading global corporations in 2007 (Fortune Magazine, 2007)
Also, the number of employees dealing with intellectual work and producing intangible assets is constantly increasing. According to one estimate, only 6% of employees in the IBM corporation works in factories, while the remaining 94% are engaged in other „intangible“ intellectual activities.
Furthermore, the share of intangible factors in the price structure is growing, while the share of tangible factors is falling. For example: the cost price for a pair of “Nike“ trainers amounts to 25% of their total price (material 15%, 10% transportation costs and packaging). About 75% are intangible factors: marketing, design, advertising.....
Competitive advantage is a special feature which occurs when a company is more effective and more successful than its competition. “The old economy” used to find the basis of its competitive advantage in cheap labor, raw material, energy, technology, machinery, while the “new economy” bases its competitiveness on high technologies, knowledge and innovations, new (global) networking and strategic pooling of large companies.
The increasing number of newly created values is created with knowledge, while less with tangible resources and work. It is the increase in share of knowledge in a newly created value that is the main feature of new economy, “knowledge economy“. The most important resource for achieving competitive advantage in the economy of knowledge (Edvinsson L., 2001) is not the capital, natural resources or work, but knowledge and intellectual capital based on it.
Sustainable competitive advantage is a goal of every company, because it contributes to above average gains which ensures the imperative of today’s competitive business world: self-preservation and constant growth and deveopment of the company. It is the result of constant sucessful use of intellectual capital within a company (Mu Shun Wang, 2011).
Knowledge is a unique resource: since it does not have any limitations (as opposed to all other resources, it is limited only by human mind), it provides endless possibilities for deve-

REDETE – ECONOMIC DEVELOPMENT AND ENTEREPRENEURSHIP IN TRANSITION ECONOMIES
192
lopment. As an economic resource, the knowledge does not wear out, but its value is consta-ntly increasing; not much energy is spent with the use of knowledge and it is environmentally friendly. Resources such as land, work and capital are limited and therefore they can raise gains up to the optimal level of resource exploitation. After this optimum has been reached, gains fall, regardgless of the fact that the quantity of production/sales is growing. Due to the law of diminishing returns, costs increase and there is a decrease in profit per product unit as well as a decrease in total profit. Intellectual capital as a resource is not limited and therefore cannot be exhausted; which is why its use in production leads to the constant increase of profit. Costs are constantly decreasing, both per product unit and total costs. The situation is very similar to natural monopoly. It could be said that this resource is not influenced by the law of diminishing (marginal) returns, but by the law of (exponentially) increasing returns.
As intellectual capital cannot be used alone in production, but is combined with other resources: land, labor and capital, the more extensive use of intellectual capital (and less use of land, labor and capital) is more favorable for the company.
Every company possesses knowledge, capabilities, values and recognition which can be transformed into value on the market. If managing this resource can contribute to competitive advantage, productivity increase and market value increase, it is no longer the choice, but necessity. That is why it is not the question whether managing intellectual capital is necessa-ry, but how it should be done. Once achieved, competitive advantage based on intellectual capital requires continuous investment in intellectual capital – in reasearch and development, education and development of employees, new technology, marketing and alike – since competitive advantage per se is not sustainable. It has to be maintained (through investments in intellectual capital of the company).
4. Necessity of the Intellectual Capital Measurement
Visible property and financial capital are successfully measured and balanced, because the traditional system of measurement has been worked out to perfection. Measurement is a field which in the “new” economy of knowledge shows the highest level of deviation between expected and achieved results.
Namely, tangible assets in company ownership are the only property which accountants list in the balance sheet. However, organizations based on knowledge do not have a lot of tangible assets. For example, in the service sector, the main property is not tangible, so the logical question is how they report on their property and business? Or, annual reports contain data on salaries, but do not contain relevant annual data, indicators or measures on the reputation of company representative and good interpersonal relationship although they are an important element of intangible property (Firer S. and Williams S. Mitchell, 2003, p. 348). Accountancy nowadays leaves out almost complete intangible assets.
The capital is not only financial, it includes everything that creates value. Are there any other measures, apart from traditionally offered ones? Are they clear and precise enough? Tools developed so far to value intellectual capital are not completely clear and commonly used measures such as, GDP, price/earnings ratio are incomplete.
Many intellectual capital experts agree that the traditional financial measurement system is not adequate today. Therefore, measuring “intangible asset”, in the form of intellectual capital, has become a necessity (Leadbeater, C. and London, D., 1999).
What is the essence of the value of knowledge and intellectual property? Patents, copyrights, trademarks and licenses can be the most important asset of a company. Almost nothing of the above mentioned can today be found in the balance sheet. Hence, the gap between the market value of the company and its book value. Otherwise, pricing in case of purchase of a business subject would be simple – the price would be equal to the value stated in the balance sheet.

REDETE – ECONOMIC DEVELOPMENT AND ENTEREPRENEURSHIP IN TRANSITION ECONOMIES
193
However, the reality is much more complex, market and book value of a company are almost never the same. This gap is reflected on the intangible asset value.
“Companies believe that they have a complete list of their assets in the balance sheet: machinery, business premises, bills receivable, working capital and the like. But their real assets are off the balance sheet items. The modern balance sheet is a lie because it omits the company’s most important assets. It is also estimated that as much as up to 80% of the company’s value lies in intangible asset, but it is not on the books. The value of the company plant, equipment, inventory and working capital hardly reflects a true value of a company.“ (Kotler, 2003) The bookkeeping practice should be upgraded, and that is one of the tasks and great challenges for the community studying intellectual capital.
What is the market value of this asset? Many have tried to give the answer to this question, but none was good enough. The problem is that the value of intangibility cannot be shown in common market transactions, as in case of physical assets.
In the past few years numerous attempts have been made in the process of finding a way to put and reflect the intangible assets in financial reports. Over 30 methods for intellectual capital measurement have been registered, but the problem is that ¾ appear as a method only once, that is, they are used by certain authors but after that no one uses them again. Practically, it could be said that generally accepted method for measuring of intellectual capital still does not exist.
Leading names of the intellectual capital movement (Edvinsson, Sveiby, Stewart, Bontis) mostly agree that knowledge should not be on the balance sheet and that it should not be mixed with 500 years old traditional accounting, whose primary purpose is to report on financial capital.
How should then “knowledge organization” balance sheet look like? Their balance consists of a tangible (visible) part and intangible (invisible) part. The tangible part is a “normal” balance sheet which can traditionally be found in companies’ final accounts. And “intellectual capital reports can be seen as an effort to make the key forms of company assets, which are invisible, visible, or more simple: new business identity card“ (Edvinsson, 2001) or annual report supplement.
Some models of intellectual capital measurement have developed in the effort to operationalize the essence, functions and benefits from intellectual capital. The methodological challenge of these models is to find a way to identify intellectual capital and its economic influences as reliable as possible, but at the same time to identify a method for optimizing intellectual capital which will boost economic growth. So far, the best results have been achieved in the development and upgrade of theoretical models, while results of empirical measurement and quantitative studies are rather scarce. A great contribution in this sense was made by Ante Puljić (2000), Thomas A. Stewart (1997), Baruch Lev (2001, 2003), Corrado (2004) and others.
In order to measure the intangible capital, it is necessary to define an adequate measure for all its components, the measure which coresponds with the accepted definition. Accordingly, there should be an indicator (coefficient, index) which would give an objective assessment of business success. It is, primarily, a useful internal information for the management, while, on a macro level, it enables a certain level of comparison as well as the forecast of future possibilities in a relatively objective way.
It seems that, for now, the most accepted indicator of business success is added (created) value (Stahle Pirjo, Stahle Sten, Smuli Aho, 2011, pp 531-551). An added value is an objective indicator of business success and it shows company’s ability to create values, which means that it incorporates investments in all forms of resources. Of course, intellectual capital cannot create value by itself. Consequently, information on efficiency of tangible (physical) capital is necessary. The relationship between a resource and results can be observed as efficiency and can be regarded as resource efficiency index in value creation.
Measuring the efficiency of intellectual capital is important not only on a company level, but on a national level as well. Maybe it is even more important on a national level, since laws and economic policy measures are passed on macro level, they influence company performances as well as the whole economy. That is why it is important to accept a unique measurement system

REDETE – ECONOMIC DEVELOPMENT AND ENTEREPRENEURSHIP IN TRANSITION ECONOMIES
194
applicable on all levels of activities – from individual processes and company organizational units to regional and national economy.
The intellectual capital concept is relatively new, but it is an approach which gains more importance and is a subject of serious scientific discussions. Speaking of transformation of real economy into the “knowledge economy“, it seems logical that intellectual capital is treated as a resource equal with the land, physical and financial capital. This primarily meant that intellectual capital should not be treated as an expense, but as an investment. In addition, it is necessary to use knowledge as a production factor as efficiently as traditional production factors (money, raw material) do.
5. Conclusions
The main conclusion of this analysis and a series of other analyses is that intellectual capital contributes significantly to value creation and business success in certain companies, branches, but it also has a great impact on the community as a whole.
An orientation towards intellectual capital and understanding that added value is closely collerated to intellectual capital, leads to many advantages, which cannot be easily identified in financial reports, but will certainly increase the company market value, improve business competitiveness, performances and the satisfaction of all interested parties.
Nowadays, the worry about these invisible factors, which are crucial for future business activities and their advancement, mainly boils down to individual enthusiasm. However, it should become an everyday activity equal to activities regarding physical/financial capital. The value is created through an interaction between subtypes of intellectual capital. Consequently, it is necessary to constantly improve performances of certain categories of intellectual capital and methods of their interactions. At the same time, factors which prevent optimal exploitation of existing potentials of a company should be eliminated.
Intellectual capital is a valuable and rare resource which is difficult to copy. Nevertheless, not enough attention has yet been paid to intellectual capital, which is most frequently seen as an expense, and not as an investment and developmental potential. There is no more powerful competitive advantage in modern conditions than the one based on intellectual capital. That is why it could justifiably be said that intellectual capital is a basic factor of the company and economy competitiveness.
There are some interesting observations and evidence claiming that intangible (human) factors of all kinds nowadays become relatively more important factors of the output than tangible factors. In industrially developed economies the importance of intangible factors is increasing, and for less developed countries they represent a chance for sustainable development. It could perhaps also be said that the lack of intangible capital (and not physical capital) is the biggest obstacle for these countries to overcome the development gap.

REDETE – ECONOMIC DEVELOPMENT AND ENTEREPRENEURSHIP IN TRANSITION ECONOMIES
195
Reference List
1. Brunsko, Z.(2002). Intelektualni kapital u funkciji razvoja suvremenog gospodarstva, u: Sundać D.: Znanje: temeljni ekonomski resurs. Rijeka: Ekonomski fakultet
2. Deželjin, J. et al. (2002). Poduzetnički menadžment: izazov, rizik, zadovoljstvo. Zagreb: M.E.P. Consult
3. Edvinsson, L. and Malone, M.S. (1997). Intellectual Capital: Realising Your Company’s True Value by Finding Its Hidden Brainpower. New York: HarperCollins
4. Edvinsson, L. (2001). Intellectual Capital: The New Wealth of Corporations. The New Economy Analyst Report 4
5. Fortune Magazine (2007). Annual Report Top 500 companies 6. Firer, S. and Williams, S. Mitchell (2003). Intellectual Capital and Traditional Measures of
Corporate Performance. Journal of Intellectual Capital 7. Kotler, F. (2003). Marketing od A do Z, Adižes 8. Leadbeater, C. and London, D. (1999). New Measures for the New Economy. Amsterdam:
International Symposium: Measuring and Reporting Intellectual Capital: Experience, Issues and Prospects, Technical Meeting
9. Wang, M.S. (2011). Intellectual Capital and Firm Performanse. Annual Conference on Inno-vations in Business and Management, London
10. Ostrom, M. (2000). Social capital: a fad or a fundamental concept?. In Partha Ostrom and Ismail Serageldin: Social capital: a multifaceted perspective, Washington: The World Bank
11. Pulić, A. (2004). Intellectual Capital: does it create or destroy value. Measuring Business Excellence, Vol. 8, Iss. 1
12. Stahle, P., Stahle, S. and Smuli, A. (2011). Value Added Intellectual Coefficient (VAIC): A Critical Analysis. Journal of Intellectual Capital, No. 4, Vol. 12
13. Sundać, D. and Pulić, A. (2001). Intelektualni kapital: ključni resurs 21. stoljeća. Rijeka: I.B.C.C.
14. Sundać, D. (2002). Znanje: temeljni ekonomski resurs. Rijeka: Ekonomski fakultet 15. Sundać, D. and Švast, N. (2008). Značaj i uloga intelektualnog kapitala u proizvođenju
konkurentskih prednosti poduzeća. Zagreb: Hrvatsko Komunikološko društvo 16. Sundać, D. and Švast, N. (2009). Intelektualni kapital. Zagreb: Ministarstvo gospodarstva,
rada i poduzetništva 17. Tomer, F. John (2008). Intangible Capital: Its Contribution to Economic Growth, Well-being
and Rationality. Massachusetts: Edward Elgar Publishing 18. Tomer, F. John (1999). The Human Firm: A Socio-economic Analysis of Its Behavior and
Potential in a New Economic Age. New York: Routledge

REDETE – ECONOMIC DEVELOPMENT AND ENTEREPRENEURSHIP IN TRANSITION ECONOMIES
196
KNOWLEDGE SHARING IN THE ALBANIAN EMERGING ECONOMY
JonidA TETA83 Irma SHYLE84
Abstract
The purpose of this paper is to add to the understanding of howKMimpacts on an small- to medium-sized enterprise (SME) and create a framework of best practice of KM in SMEs.
Design/methodology/approach – One of the aims of the project is to investigate the barriers to sharinginformation in (SME)s
The results of the study will be used to from a model of “information sharing best practice” for SMEwhich are setting up or using KM systems.
The paper will examine the factors influencing sharingof knowledge in the new Albanian emerging economy
Findings – The findings are complex and varied but in the case of the results there is a clearenergy, enthusiasm and commitment to knowledge sharing in order to ensure the success of thebusiness.
Research limitations/implications – Emerging economies are changing economies and so this work forms a snapshot of life at a particular moment in time.
Practical implications – The paper shows that there is a need for an increase in training, and that government support is helpful and enabling.
Originality/value – Knowledge sharing is important and the study described in the paper will allow cross comparisons between different countries. It is intended that a model of best practice will be oneof the outcomes of the project.
Keywords: Knowledge sharing, Emerging markets, Albania, Knowledge management
83 Polytechnic University of Tirana 84 Polytechnic University of Tirana

REDETE – ECONOMIC DEVELOPMENT AND ENTEREPRENEURSHIP IN TRANSITION ECONOMIES
197
Introduction
Knowledge sharing has been identified as a major focus area for knowledge management. The relevance of this themeparticularly derives from the fact that it provides a linkbetween the level of the individual knowledge workers,where knowledge resides, and the level of the organiza-tion,where knowledge attains its (economic, competitive) value.
While being recognized as an important pillar in knowledge management efforts, reports also show that, in practice,knowledge sharing proves to be a significant barrier foreffective knowledge management. Various factors havebeen identified as impediments for knowledge sharing, including inadequate organizational structures, sharing a friendly organizational cultures, and denominational segregation (Davenport and Prusak, 1998; Tissenet al., 1998).Knowledge sharing have been gaining increased attention amongstresearchers and business managers in recent years. Knowledge sharing practices andinitiatives often form a key component of knowledge management programs, in terms of organizational and individual learning (e.g. Alavi and Leidner, 2001; Earl, 2001; Nahapietand Ghoshal, 1998; Nonaka, 1994; Sveiby, 1997).
Lin and Chen (2008) state that knowledge sharing is also relevant and essential to the con-tinuedsuccess of the economy. Albania a developing countries with poor infrastructure, emerging from communismis moving towards stability by creating businesses such as small- to medium-sized enterprises (SMEs).
They are beginning to move towards sharing information both internally and externally to cus-tomers, clients and suppliers.
Information sharing for many is thefirst move towards knowledge sharing and for many businesses these are the stagesbefore a full knowledge management (KM) system can realistically be addressed.
For Albanian companies the concept of information sharing is something to be seriously considered. Many companies are informationrich but resource poor and information sharing can be a way to address difficult issues.
Knowledge sharing is of increasing importance as one of the building blocks ofsuccessful businesses in newly emerging countries.
One critical resource for the organizations is the need of information. Information is required in order to make good quality decisions which assist with the management of the organization and thus can increase overall productivity and profit. Organizations need to adopt and manage KM as a successful KM initiative enables an organization to become “more innovative, better coordina-ted in its efforts, rapidly commercialize new products, anticipate surprises, become more respon-sive to market change and reduce the redundancy of the knowledge” (Gold et al., 2001). However, in order for even the most basic KM system to work effectively, there must be a sense of trust in the organization and this trust is crucial to the open sharing of information.
Sharing only takes place where there is trust and where there is ashared feeling of ownership of goals. The reasons behind the tendency to share arebased on the kind of interpersonal relations between co-workers inherent within theorganization and the effects of social relationships within organizational teams.
Strengthening the social relationships between individuals in the team is crucial in motivating team members to share knowledge. Within a business, this is often done through a framework of knowledge sharing networks.
As many SMEs have static income and rising expenditure there is an increasing need to make
SMEs more efficient. One way of increasing efficiency is to gain as much advantage as possible with what is already available both internally within the organization and externally outside the organization. One commodity, which is always available is that of information. In particular, information which is translated into knowledge. The effective use of the knowledge – and the way in which it is managed can be critical to the success of an organization.

REDETE – ECONOMIC DEVELOPMENT AND ENTEREPRENEURSHIP IN TRANSITION ECONOMIES
198
This research will add to the understanding of how KM impacts on an SME and the results will be used to create a framework of “best practice” of KM in SMEs.
The research takes place in Albania and willprovide a study in a newly emerging economy. Finally, empirical results are presented from the Albanian studies on SME. The paperconcludes with thoughts as to the way forward and considers the future for the sustainable development of information sharing towards robust KM systems.
The exploration of knowledge sharing in Albania: an empirical study
Albanian context
Central Bank of Albania states that the Albanian small and medium-sized enterprise sector has by now become very similar toSME sectors of less developed old EU member states and newly acceded Countries.
Basic structural figures of SMEs have hardly changed or remained the same over recent years, their businesses are characterized by highlabor and low capital intensity.
Research showed that there were three distinctgroups of SMEs each with strong identifiable features. The research results were asfollows:
- The first group consists of approximately 25 per cent of the enterprises. These are in the mature phase of their life cycles. They considertheir situation good and have an optimistic view of the future. They are typicallymicro and small enterprises with legal personality, members of groups ofcompanies or entrepreneurial networks. They use and demand up-to-date, specialized sectorial-professional, technological, business, financial and legal infor-mation from Albania and abroad.
- The second group is made up of nearly 20 per cent of enterprises. These are in the start-up or declining phase of their life cycles. They consider their situationbad and have a bleak vision of the future. Personal income of the entrepreneurs isdeclining. When they need external financial resources, they rely on help fromrelatives or friends. This group also includes some entrepreneurs not verysuccessful due to social, ethnic or age-related disadvantages. They would alsoneed regular counseling by an advisory, supportive institution with a thoroughknowledge of their circumstances and situation. They are potential targets or aneducation in general business studies, and micro credit.
- The third group includes 55 per cent of enterprises, which did not fall into any of the above categories. Their life cycles are varied on a broad range, fromstart-up to maturity. They consider their situation average and do not expect changes, neither improvements nor decline. More than two-thirds are soleproprietors and micro enterprises with single entry Bookkeeping, that is, limitedand general partnerships. Their networking level is lower than that of the firstgroup. They mainly produce for the retail market, but the proportion of thoseselling to other businesses is also significant. They are expanding their staff andsome of them are making investments. They are potential participants ofbusiness strengthening tenders. They are also the target group of microcredit, offinancial institutions operating with mutual guarantee, and of credit associations. Potential customers of banks are among them.
This work was carried out in all three types of SME that were identified by the report. For the project 180 companies were contacted with 160 actually responding and participating. Semi structured interviews took place.

REDETE – ECONOMIC DEVELOPMENT AND ENTEREPRENEURSHIP IN TRANSITION ECONOMIES
199
Results
The results showed the following important factors regarding knowledge sharing 1. Government;
2. Organizational hierarchy;
3. Covert information;
4. Historical culture of secrecy from communism era (that information is not available to you);
5. Fear
6. Individual society, desire to improve at individual level
7. Desire to be better than western counties;
8. Improve the number of information communication technology trainers and
9. providers;
Conclusion
This is a “snapshot” of the results and is not exhaustive, but gives an example of the nature of the factors identified.
Most Albanian enterprises were enthusiasticabout the concepts of knowledge sharing and wanted to find out more about trainingopportunities. The overall impression was one of enthusiasm and the desire tobe seen as enterprising both as individuals but also as a society and a country.
Reference list
1. Ataoguz, C. (2005), Knowledge Management in SMEs: The KM Plus study, University of Fribourg.
2. Berger, C.R. (1975), “Beyond initial interaction: uncertainty, understanding and the develop-ment of interpersonal relationships”, in Giles, H. and St Clair, R. (Eds), Language and SocialPsychology, Blackwell, Oxford, pp. 122-45.
3. Bishop, J., Bouchlaghem, D., Glass, J. and Matsumoto, I. (2008), “Ensuring the effectiveness of a knowledge management initiative”, Journal of Knowledge Management, Vol. 12 No. 4,pp. 16-29.
4. Burke, M. (2003), “Philosophical and theoretical perspectives of organization structures as information processing systems”, Journal of Documentation, Vol. 59 No. 2, pp. 131-42.
5. Burke, M. (2006), “Achieving information fulfilment in the networked society. Part 1: introdu-cing new concepts”, New Library World, Vol. 107 Nos 9/10, pp. 21-6.
6. Burke, M. (2007), “Cultural issues, organizational hierarchy and information fulfilment: 7. an exploration of relationships”, Library Review, Vol. 56 No. 8, pp. 236-45. 8. Chen, C.C., Chen, X.-P. and Meindl, J.R. (1998), “How can cooperation be fostered? The
cultural effects of individualism-collectivism”, Academy of Management Review, Vol. 23 No. 2,pp. 285-304.
9. Choo, C. (2001), “Environmental scanning as information seeking and organizational learni-ng”, Information Research, Vol. 7 No. 1.
10. Dalley, J. and Hamilton, B. (2001), “Knowledge, context and learning in the small business”, International Small Business Journal, Vol. 18 No. 3, pp. 51-9.
11. Davenport, T. and Prusak, L. (2000), Working Knowledge: How Organisations Manage What They Know, Harvard Business School Press, Boston, MA.

REDETE – ECONOMIC DEVELOPMENT AND ENTEREPRENEURSHIP IN TRANSITION ECONOMIES
200
SOCIAL CAPITAL: AN ASSET FOR IMPROVING PUBLIC SECTOR PERFORMANCE
Jovo ATELJEVIĆ85
Ilija STOJANOVIĆ86
“It's not what you know, but who you know” Woolcock, Michael & Deepa, Narayan
Abstract
Social capital has become very important asset for development and economic prosperity of modern society. It appears that society with more social capital is able to improve welfare of their citizens. Some scholars believe there is a link between social capital and good governance. However, it's not easy to explain all dimensions of social capital. Moreover, measuring of influ-ence of social capital on public sector performances is not an easy task.
From 1990s, the paradigm of social capital has great influence on development theory, re-search and policy. An increasing number of scholars and practitioners have questioned on impact of social capital on public sector performance. However, many countries do not take into account the social capital as the basis for economic development through fostering public sector reforms. Simply, it is not recognized the importance of putting this issue on the political agenda. Nevertheless, there is a great need for scholarly research into the problem identified in order to find the best solutions for tackling it. This paper is aimed to answer the following re-search question: Does social capital influence on public sector performance?
The research took an explanatory approach, establishing causal links between the selected variables. Values of the independent variable are presented through the Social Capital Indica-tor of the Legatum Prosperity Index. Values of the dependent variable for different dimensions of public sector performances are presented through data of the Sustainable Governance Indi-cators, World Government Indicators, Doing Business Report and Global Innovation Index.
The data from secondary resources have been most valuable statistical basis. These data wa-re analysed through quantitative statistical techniques to test the hypotheses and observe signi-ficant correlations. More specifically, the methods of correlation and regression were employed to measure the impact of identified indicators and indexes. The conclusions drawn from the preliminary results indicate a high degree of correlation and regression of independent and dependents variables, suggesting a potential theoretical contribution to the existing knowledge and valuable recommendations for practitioners and policy makers.
Keywords: social capital, public sector, performance, efficiency, effectiveness, innovative-ness
85 University of Banja Luka, Majke Jugovica 4, 78000 Banja Luka, Republic of Srpska-Bosnia and Herzegovina, email:
[email protected] 86 University of Banja Luka, Majke Jugovica 4, 78000 Banja Luka, Republic of Srpska-Bosnia and Herzegovina, email:

REDETE – ECONOMIC DEVELOPMENT AND ENTEREPRENEURSHIP IN TRANSITION ECONOMIES
201
1. Introduction
For a long period it was considered that there are three types of capital; land, labour, and financial capital. Only later from the 1960s, human capital is added to the mix (Evans&Syrret, 2007). Social capital is an old concept and can be traced back to Alexis de Tocqueville (1805 - 1859) in the XIX century (Putnam&Goss, 2002; Savignon, 2011). Nevertheless, academic litera-ture on this topic is exponentially growing from the mid-1980s (Savignon, 2011; Horton, 2006). Particular attention of scholars and academic journals on social capital concept has developed in recent years (Coofe&Geys, 2005; Henning&Zarnekow, 2012). Since then the social capital is seen as a special type of capital.
A very important figure in the development of the modern concept of social capital is Robert Putnam with his Making Democracy Work (Boix&Posner, 1996; Horton, 2006). Putnam (1993) has shown difference in the efficiency of regional governments in Italy explaining this phenome-non with the discrepancy in the level of social capital. He has found that the northern part of Italy is more efficient than the southern part referring this to the level of social capital.
In recent years the ongoing debate occurs concerning the socio-cultural component of the local economic development process (Evans&Syrret, 2007). The relevance of the concept of social capital to government policy was already being considered in United Kingdom in the mid-1990s (Horton, 2006).
Although many authors emphasize the importance of social capital on economic performance, there is insufficient research linking this type of capital and public sector performance. Due to the limitations of previous studies, effects of social capital on efficiency, effectiveness and innova-tiveness of public sector remain underdeveloped. Moreover, there is significant research gap in analyzing the impact of social capital on public sector performance in the context of establishing “open governance” model that supports open innovation and inclusion of external users.
Therefore, the social capital will be seen as an incentive to include organized networks of external users in order to improve performance of public sector. In accordance with this view, the study raises the fundamental question: Does social capital may affect public sector performance?
The contribution of this study is two-fold: (i) it provides insights into the relationship between social capital and specific elements of public sector performance, and (ii) it provides an overview on the impact of active and organized networks of external users in the context of social capital. The results of study suggest a potential theoretical contribution to the existing knowledge and valuable recommendations for practitioners and policy makers.
2. Literature Review
According to Putnam (2001), social capital is multidimensional with no single form. Jo-nes&Woolcock (2007) proposed several dimensions of social capital; groups and networks, trust and solidarity, collective action and cooperation, information and communication, social cohesion and inclusion and empowerment and political action. Putnam (1993:167) define social capital as “[...] features of social organization, such as trust, norms, and networks, that can improve the efficiency of society by facilitating coordinated actions”.
Woolcock&Narayan (2000:226) argue that “person's family, friends and associates constitute an important asset”. In order to use social capital, individuals should be connected with other people (Šalaj, 2009). As other types of capital, social capital also provides outputs. Acting collectively, people produce socio-economic benefits for their collective and for themselves (UNDP, 2009; World Bank, 2002). Interesting characteristic is that “unlike other forms of capital, the more it is used the more it grows” (Evans&Syrret, 2007:58).
There are many definitions of social capital. One common determinant for almost all definition is referring to networks as main characteristic of social capital (Andrews, 2012; UNDP, 2009; World Bank, 2002). Franke (2005:7) believes that “social capital refers to social networks that
REDETE – ECONOMIC DEVELOPMENT AND ENTEREPRENEURSHIP IN TRANSITION ECONOMIES
202
may provide access to resources and social support”. According to OECD (2001) social capital represents “networks together with shared norms, values and understandings that facilitate co-operation within or among groups”. Interesting definition is proposed by Woolcock (2001:13) in which he looks at social capital as “the norms and networks that facilitate collective action”.
Besides the difficulty of finding an adequate definition of social capital, there is a problem of its measuring. The first problem which many scholars suggest is referring to lack of universal method of measurement (Henning&Zernekow, 2012) because of its inter-related dimensions that are susceptible to observation (Andrews, 2012). In theoretical and empirical sense there is no single and commonly accepted indicator of social capital (Henning&Zernekow, 2012) which has a consequence of the existence of wide-range of indexes to measure components of social capital (Woolcock&Narayan, 2000).
Additionally to above mentioned facts, there is a lack of suitable data for measuring social capital (Henning&Zernekow, 2012; Woolcock&Narayan, 2000). These are the reasons of the absence of consensus on how to measure social capital (Coffe&Geys, 2005). This is often justified by the scientific community to the fact that the concept of social capital is relatively new (Franke, 2005).
Many authors, however, agree on the types of social capital. Three dimensions of social capital have been identified: these are bonding, bridging and linking capital (Putnam, 2000; Savignon, 2011; Woolcock, 1999; Woolcock&Narayan, 2000; UNDP, 2009; World Bank, 2002). According to above mentioned literature sources, we could explain these types of social capital as follows (Savignon, 2011:3-4):
- bonding capital refers to social connections that build on similarity, informality and inti-
macy. Some illustrations of this form of capital include the bonds between family members and close friends.
- bridging capital refers to links amongst diverse individuals. Bridging networks are charac-terized by both formal and informal relationships.
- linking capital refers to alliances with individuals or groups in positions of power, par-ticularly power over resources needed for social and economic development. Linkages enable individuals and communities to speak directly to those with formal decision-making power. Examples of linking capital include connections between community members and powerful others. Linking capital improves the effectiveness of institutions by providing opportunities for individuals to deliberate with elected representatives.
We should make a distinction between these types of capital, because the external effects of
bridging networks are likely to be positive, while bonding networks (limited within particular social niches) are at greater risk of producing negative externalities (Putnam&Goss, 2002:11). In explaining this difference, these authors stated that „ [...] bonding without bridging equals Bosnia“(op.cit).
According to Putnam&Goss (2002:07) “The idea at the core of the theory of social capital is extremely simple: Social networks matter”. They belive that networks have value for the people who are in them. However, we have taken a different research context that relates to the impact on the performance of the public sector, thus creating value for the entire community. In this sense, we conducted our study in order to examine the influence of social capital to public sector performance.

REDETE – ECONOMIC DEVELOPMENT AND ENTEREPRENEURSHIP IN TRANSITION ECONOMIES
203
2.1. Multi-dimensional effects on public sector performance
According to Henning&Zarnekow (2012) social capital represents a controversial issue in the respective literature in terms of its influence on performance. Coffe&Geys (2005) indicate of only two studies which have analyzed the link between social capital and institutional performance at the local government level with explanation of the influence of social capital on government performance at local level. In the literature, there is no global general approach to establish a casual link between social capital and public sector performance, although researchers have focused ever more attention on the links between social capital and the performance of public organizations (Boix&Posner, 1998; Brooks, 2002; Vigoda, 2002; Pavarina, 2011).
The existing empirical work is mostly oriented to recognizing of the influence of social capital on the economic development of societies and the performance of their institutions (Coffe&Geys, 2005). However, most studies that empirically evaluate the relationship between social capital and some aspects of organizational performance in the public sector were undertaken in single countries, most of them in the United States (Andrews, 2012).
In practice, many countries have nepotism laws, in explicit recognition that personal connec-tions can be used to discriminate unfairly, distort and corrupt (Woolcock&Narayan, 2000). It is therefore essential that governments respect civil liberties in order to avoid negative effects on community life and development projects (Isham&Kaufmann, 1999). In accordance with this view Putnam (2001:2) argues that “there are some forms of social capital that are good for some things and not for others”. Social capital can provide negative not only positive but also negative effects.
Woolcock&Narayan (2000) provide an overview of different theoretical views on social ca-pital. Communitarians believe that social capital is good, and its presence leads to positive effects on community's welfare. The networks perspective indicates on importance of social networks with the aim to act in collective interest of poor minorities. In contrast to the views of the commu-nity and network perspective, where social capital leads to better performance, the institutional view looks at social capital as dependent variable. Institutional view argues that social capital depends of the political, legal and institutional environment. Completely different view is given by the new synergy perspective. This approach combines different perspectives supporting syner-gy between government and citizens actions. This position requires complementarities of different actors which mean mutually supportive relations.
Andrews (2012) introduce key elements of performance in public sector: speed with which services are delivered, the extent to which they meet the needs of service users and capacity wit-hin public sector organizations to do this cost effectively. In order to analyze the impact of social capital on the efficiency, Putnam (1993) performed a comparison in efficiency between the nort-hern and the southern regions in Italy. He found that the northern part is more efficient than the southern part which is result from the discrepancy in the levels of social capital. Additionally, Boix,&Posner (1998) emphasizes the way that social capital reduces the costs of enforcing and implementing governmental policies and regulations. Analyzing the impact of social capital on the efficiency of regions in Italy carried out by Putnam (1993), we set up our first hypothesis which covers a global broader context:
Hypothesis 1: Social capital of the society will lead to more efficient institutions of public sector.
Putnam (1993) also argues on effectiveness of public sector. According to him, engagement of citizens in public affairs and political decision-making provides greater potential for service providers to respond effectively to policy problems and challenges. According to Boix&Posner

REDETE – ECONOMIC DEVELOPMENT AND ENTEREPRENEURSHIP IN TRANSITION ECONOMIES
204
(1998), social capital will produce good governance and contribute to effective governance by facilitating the articulation of citizens’ demands. They believe that social capital promotes institu-tional effectiveness through its effects on the behaviour of policy-making and bureaucratic elites.
However, how social capital influences on governmental effectiveness is unclear (Boix&Po-sner, 1998). These authors believe that political representatives are anxious to please voters and govern according to their wishes. In order to do so, political representatives fosters the ability of government bureaucrats to co-operate with one another in the course of carrying out their duties. This leads to establishment of the concept of networked government that “includes not only effective coordination across government organizations but also the possible integration of both for profit and non profit sector organizations into production systems designed to achieve public purposes” (Moore, 2009:191). With this in mind our second hypothesis is thus:
Hypothesis 2: Social capital of the society will lead to more effective public sector.
Today's world is becoming very open and turbulent. This requires reforming the public sector. According to Potts (2009:36) the public sector “[...] must continually innovate to survive”. However, public sector are not innovative oriented and has problems managing the innovation cycle (Eggers&Singh, 2009). Nevertheless, there is an evidence of linking social capital to greater innovation and flexibility in policy making (Savignon, 2011).
In order to improve innovative capacity of public sector, scholars indicate a need for a new form of innovation in the public sector since bureaucratic ways of innovating do not yield the quantity and quality of innovations necessary to solve emergent and persistent policy challenges (Bommert, 2010). New collaborative innovation presents an answer because it opens innovation cycle to a variety of actors (op.cit.). Nambisan (2008:11) argue that“ collaborative approach to innovation and problem solving in the public sector that relies on harnessing the resources and the creativity of external networks and communities (including citizen networks as well as networks of nonprofits and private corporations) to amplify or enhance the innovation speed as well as the range and quality of innovation outcomes“.
Eggers&Singh (2010) have proposed several innovative models depending on how they opened to external actors that are graphically presented below:
Graph 1: Innovative models in public sector
Source: Eggers&Singh (2010)
Open public sector innovation is an invitation to the public to engage, innovate and create new
public value (Huijboom&Van den Broek, 2011). Having in mind that innovativeness represents important performance of public sector in period of crisis, our third hypothesis is thus as fallows:
Hypothesis 3: Social capital of the society will lead to more innovative institutions of public sector.

REDETE – ECONOMIC DEVELOPMENT AND ENTEREPRENEURSHIP IN TRANSITION ECONOMIES
205
A certain amount of literature suggests on links between political participation and growth of social capital (Pavarina, 2011). Nevertheless, citizens’ preferences are unequally represented in the political arena since only a minor fraction of population is organized in networks. This could lead to exclusion of collective interest in performing public sectors tasks. Pavarina (2011) indicate that ties among just few people leads to the exclusion of others where public institutions may not reflect collective interests. In order to examine influence of active and organized networks of external users in the context of social capital on performance in public sector, we decided to introduce fourth hypothesis:
Hypothesis 4: Social and political participation trough networks, as a core of social capital paradigm, will lead to better performance of public sector.
2.3. Final remarks on literature review
Although in recent years the interest for exploration of the impact of social capital on performance is rising, there is a lack of empirical studies about this topic at more general level. At least to our knowledge, there are not empirical works that deals with more global context of the influence of social capital on performance in public sector. Except of single studies that analyze the impact of social capital in individual countries, the model is not developed in a broader context.
There is the particular lack of a deeper analysis of the impact of social capital on certain elements and characteristics of the efficiency such as; number, duration and cost of procedures in public sector. We did not found any empirical evidence of the influence of social capital on innovativeness in public sector. Today, innovativeness represents a very important performance of public sector in time of change and globalization.
3. Methodology
Our research was realized in two phases: (i) the analysis of the correlation between values of social capital and specific elements of performance in public sector, and (ii) the analysis of influence of social and political participation trough networks, as a core of social capital, on performance in public sector.
The first phase of research was carried out with the analysis of correlation between indepen-dent and dependent variables. The efficiency, effectiveness and innovativeness of public sector were presented as dependent variables, while independent variables in our study were defined as the level of social capital. The research took an explanatory approach establishing causal links between the selected variables.

REDETE – ECONOMIC DEVELOPMENT AND ENTEREPRENEURSHIP IN TRANSITION ECONOMIES
206
Table 1: Operationalization of the variables for first phase
Variable Brief description Impact Source of data
Legatum Prosperity Index: Social Capital
The Social Capital sub-index measures countries’ performances in two areas: social cohesion and engagement, as well as community and family networks.
Independent variable:
Social capital
www.prosperity.org
Sustainable Governance Indicators SGI:Government Efficiency
Ability to delegate implementation tasks efficiently through the levels of the executive, through individual line ministries to departments and agencies.
Dependent variable:
Efficiency of public sector
www.sgi-network.org
Doing Business: Starting a Business- Procedures (number)
A procedure is defined as any interaction of the company founders with external parties (for example, government agencies, lawyers, auditors or notaries). Interactions between company founders or company officers and employees are not counted as procedures. Procedures that must be completed in the same building but in different offices are counted as separate procedures.
Dependent variable:
Efficiency of public sector
www.doingbusiness.org
Doing Business: Starting a Business-Time (days)
Time is recorded in calendar days. The measure captures the median duration that incorporation lawyers indicate is necessary in practice to complete a procedure with minimum follow-up with government agencies and no extra payments. It is assumed that the minimum time required for each procedure is 1 day.
Dependent variable:
Efficiency of public sector
www.doingbusiness.org
Doing Business: Starting a Business-Cost (% of income per capita)
Cost is recorded as a percentage of the economy’s income per capita. It includes all official fees and fees for legal or professional services if such services are required by law.
Dependent variable:
Efficiency of public sector
www.doingbusiness.org
WGI: Government Effectiveness
Perceptions of the quality of public services, the quality of the civil service and the degree of its independence from political pressures, the quality of policy formulation and implementation, and the credibility of the government's commitment to such policies.
Dependent variable:
Effectiveness of public
sector
http://info.worldbank.org/governance/wgi/i
ndex.asp
SGI: Effective Implementation
To what extent can the government achieve its own policy objectives?
Dependent variable:
Effectiveness of public
sector
www.sgi-network.org
Global Innovation Index: Institutions
Nurturing an institutional framework that attracts business and fosters growth by providing good governance and the correct levels of protection and incentives based on innovation.
Dependent variable:
Innovativeness of public
sector
www.globalinnovationindex.org
In the second phase we also used Pearson correlation in order to examine influence of social
and political participation on performance in public sector. In this phase, the efficiency, effect-tiveness and innovativeness of public sector were also presented as dependent variables. The social and political participation were determined as independent variable.

REDETE – ECONOMIC DEVELOPMENT AND ENTEREPRENEURSHIP IN TRANSITION ECONOMIES
207
Table 2: Operationalization of the variables for second phase
Variable Brief description Impact Source of data
Sustainable Governance Indicators SGI:Social and Political Participation
Percentage of citizens as members in labour unions and political parties
Independent variable:
Social and political
participation
www.sgi-network.org
Sustainable Governance Indicators SGI:Government Efficiency
Ability to delegate implementation tasks efficiently through the levels of the executive, through individual line ministries to departments and agencies.
Dependent variable:
Efficiency of public sector
www.sgi-network.org
WGI: Government Effectiveness
Perceptions of the quality of public services, the quality of the civil service and the degree of its independence from political pressures, the quality of policy formulation and implementation, and the credibility of the government's commitment to such policies.
Dependent variable:
Effectiveness of public
sector
http://info.worldbank.org/governance/wgi/i
ndex.asp
Sustainable Governance Indicators SGI: Effective Implementation
To what extent can the government achieve its own policy objectives?
Dependent variable:
Effectiveness of public
sector
www.sgi-network.org
Global Innovation Index: Institutions
Nurturing an institutional framework that attracts business and fosters growth by providing good governance and the correct levels of protection and incentives based on innovation.
Dependent variable:
Innovativeness of public
sector
www.globalinnovationindex.org
Our sample included 207 countries and referred to the period between 2006 and 2011.
However, in the observed period statistical database were not provide complete data. Number of observations was depended on the volume of comparative data for these countries in the period. Therefore, the different number of observations for individual analysis of correlation was conducted.
The data was analysed through quantitative statistical techniques to test the hypotheses and observe significant correlations. More specifically, the methods of correlation and regression were employed to measure the impact of identified indicators.
4. Results and Interpretation
4.1. Influence on performance in the public sector
Table 1 shows correlations between social capital (represented by the Legatum Prosperity Index: Social Capital indicator) and the efficiency in public sector, including its components.

REDETE – ECONOMIC DEVELOPMENT AND ENTEREPRENEURSHIP IN TRANSITION ECONOMIES
208
Table 3: Correlation matrix – Influence of social capital on the efficiency in public sector
EZAnalyze Results Report - Correlation
Matrix
Legatum Prosperity
Index: Social Capital
Sustainable Governance Indicators
SGI:Government Efficiency
Doing Business: Starting a Business-
Procedures (number)
Doing Business: Starting a
Business-Time (days)
Doing Business: Starting a
Business-Cost (% of income
per capita) Legatum Prosperity Index: Social Capital
1
N - P -
Sustainable Governance Indicators SGI:Government Efficiency
,603 1
N 61 - P ,0000 -
Doing Business: Starting a Business- Procedures (number)
-,572 -,329 1
N 61 61 - P ,0000 ,0096 -
Doing Business: Starting a Business-Time (days)
-,249 -,195 ,431 1
N 61 61 1064 - P ,0525 ,1324 ,0000 -
Doing Business: Starting a Business-Cost (% of income per capita)
-,800 -,432 ,169 ,170 1
N 61 61 1064 1064 - P ,0000 ,0005 ,0000 ,0000 -
It can be seen that increase of value of social capital leads to greater efficiency in public sector
(represented by the SGI: Government Efficiency). Pearson coefficient of correlation between these variables equals 0,603. Our analysis is based on 61 observations of comparable data between two variables. In order to test statistical significance, we found that p<0,01. With the risk of less than one percent, we confirm that social capital is in correlation with the efficiency in positive direction. Thus, we could confirm our first hypothesis.

REDETE – ECONOMIC DEVELOPMENT AND ENTEREPRENEURSHIP IN TRANSITION ECONOMIES
209
Graph 2: Social Capital and the efficiency in public sector
Scatterplot of Legatum Prosperity Index: Social Capital and Sustainable Governance Indicators
SGI:Government Efficiency
4
5
6
7
8
9
10
3 4 5 6 7 8 9 10
Sustainable Governance Indicators SGI:Government Efficiency
Leg
atu
m P
rosp
erit
y In
dex
: S
oci
al
Cap
ital
Our further analysis is oriented to finding correlation between the values of social capital and components of the efficiency in public sector. In the previous table, we have shown Pearson coefficient of correlation between social capital and:
- Number of procedures necessary to starting a business (-0,572);
- Days (time) required to starting a business (-0,249);
- Cost that occur in process of starting a business (-0,800).
All coefficients have negative directions. This suggests that increasing of the value of social
capital leads to reducing number of registration procedures, duration of procedures and costs of registration (starting) a business.
The correlation between social capital values and number of procedures indicates on moderate negative direction. Therefore, with increasing of the value of social capital there is a reduction of number of procedures in a process of starting a business. We found p<0,01 which indicates on conclusion with the risk less than one percent that correlation between social capital and number of procedures is really exists.
In a case of correlation between social capital and duration of procedures in public sector, we are not able to confirm this linkage. Although it is evident negative correlation between two variables with Pearson coefficient of -0,249, further significance testing showed that we are not able to take a risk of p<0,05. The reason for this lies in the fact that p=0,0525 exceeding the risk of five percent.
However, in case of correlation between social capital and costs of starting a business Pearson coefficient equals -0,800. This indicates on strong correlation with negative direction. According-ly, increasing value of social capital leads to reducing of costs for starting a business. Further, with the risk less than one percent (p<0,01), we could confirm this strong correlation.
In order to examine the influence of social capital on the government effectiveness, we con-ducted further analysis. Based on Pearson Correlation, we found highly strong linkages between social capital value and value of government effectiveness (represented by WGI: Government Effectiveness). The Pearson coefficient equals 0,937 which indicate on highly strong correlation between two variables. The analyses have been conducted with 30 observations based on

REDETE – ECONOMIC DEVELOPMENT AND ENTEREPRENEURSHIP IN TRANSITION ECONOMIES
210
comparable data. According to the significance testing, we found p<0,01. Thus, we could confirm our second hypothesis which refers to positive influence of social capital on the effectiveness in public sector.
Graph 3: Social Capital and the government effectiveness
Scatterplot of Legatum Prosperity Index: Social Capital and WGI Government Effectiveness
Estimate
4
5
6
7
8
9
10
-2 -1 0 1 2 3
WGI Government Effectiveness Estimate
Leg
atu
m P
rosp
erit
y In
dex
: S
oci
al
Cap
ital
With the aim to additionally confirm our examination of social capital on the effectiveness in public sector, we conducted further statistical observation. This was done with correlation between social capital variable and variable of effective implementation (represented by SGI: Effective Implementation). Based on 61 observations of comparable data, we found that Pearson coefficient equals 0,777. This indicates on high positive correlation between two variables. Taking into account that p<0,01, we could confirm existence of strong positive correlation between social capital and the effectiveness in public sector with the risk less than one percent.
Graph 4: Social Capital and the effective implementation
Scatterplot of Legatum Prosperity Index: Social Capital and Sustainable Governance Indicators
SGI: Effective Implementation
4
5
6
7
8
9
10
3 4 5 6 7 8 9 10
Sustainable Governance Indicators SGI: Effective Implementation
Leg
atu
m P
rosp
erit
y In
dex
: S
oci
al
Cap
ital
A very important performance of public sector in turbulent world is innovativeness. According
to our study, we have highly strong positive correlation between social capital and innovativeness in public sector. Specifically, we found that Pearson coefficient of correlation equals 0,950 which is very strong correlation. Our study was conducted on 30 observations based on comparable data.

REDETE – ECONOMIC DEVELOPMENT AND ENTEREPRENEURSHIP IN TRANSITION ECONOMIES
211
In further statistical analysis, we found p<0,01 which indicate on statistical significance in correlation of two variables. With the risk less than one percent, we could confirm our third hypothesis. Thus, social capital is really influence on increasing innovative capacities in public sector.
Graph 5: Social Capital and the innovativeness in public sector
Scatterplot of Legatum Prosperity Index: Social Capital and Global Innovation Index: Institution
4
5
6
7
8
9
10
2 3 4 5 6 7
Global Innovation Index: Institution
Leg
atu
m P
rosp
erit
y In
dex
: S
oci
al
Cap
ital
4.2. Implication of active and organized networks on public sector performance
Going further, we conducted analysis of influence of social and political participation on public sector performance. Using the Indicator of Social and Political Participation of Sustainable Governance Indicators, we tried to link the networks, as a core of social capital paradigm, and different components of public sector performance.
In the table below, we presented data obtained in correlation analysis between several varia-bles.

REDETE – ECONOMIC DEVELOPMENT AND ENTEREPRENEURSHIP IN TRANSITION ECONOMIES
212
Table 4: Correlation matrix – Influence of social and political participation in public sector
Sustainable Governance Indicators
SGI:Social and Political
Participation
Sustainable Governance Indicators
SGI:Government Efficiency
WGI Government Effectiveness
Estimate
Sustainable Governance
Indicators SGI: Effective
Implementation
Global Innovation
Index: Institution
Sustainable Governance Indicators
SGI:Social and Political
Participation
1
Sustainable Governance Indicators
SGI:Government Efficiency
0,511633736 1
WGI Government Effectiveness
Estimate
0,574403422 0,772450809 1
Sustainable Governance
Indicators SGI: Effective
Implementation
0,522575318 0,833391278 0,847117159 1
Global Innovation
Index: Institution
0,545845896 0,70776019 0,867539693 0,827922719 1
According to our statistical analysis of correlation, we found that social capital in correlation
with the components of public sector performance has values as follows: - Efficiency: Government Efficiency (0,512)
- Effectiveness: Government Effectiveness (0,574);
- Effectiveness: Effective Implementation (0,523);
- Innovativeness (0,546).
All variables of public sector performance correlate positively with the values of social and
political participation in moderate manner. During significance testing, we found for all variables p<0,01. This implies on conclusion that we could confirm our fourth hypothesis. Thus, social and political participation positively affect on increasing public sector performance, respectively on efficiency, effectiveness and innovativeness.

REDETE – ECONOMIC DEVELOPMENT AND ENTEREPRENEURSHIP IN TRANSITION ECONOMIES
213
5. Discussion
With this study we have attempted to point out the influence on the most important perfor-mances of the public sector, especially efficiency, effectiveness and innovativeness. The first two categories in the literature are often mentioned as an important performance of public sector. In recent times in the period of dynamic change and globalization, innovation in public sector is emerging as an important characteristic. Some authors such as Potts (2009) believe that without innovation the public sector can not survive. For this reason we have introduced innovations as a very important performance in public sector.
Our survey results showed a strong link between social capital and performances in public sector. Although Henning&Zarnekow (2012) consider social capital as a controversial issue in terms of its influence on performance, our empirical analysis clearly shows correlation between respective indicators of social capital and public sector performance.
Very interesting analysis of the impact of social capital on the efficiency of the public sector is given by Robert Putnam (1993). Still, this analysis is done within a single country. Hence we believe that our study has further demonstrated the impact of social capital on the efficiency of the public sector in the broader, global context.
In order to further determine the impact of social capital on specific elements of the efficiency, we used a number of procedures, duration and cost of the public sector that produces the performance of their duties. A similar characteristic of performance in public sector has given by Andrews (2012).
As Boix&Posner (2003) point out, the social capital reduces costs in public sector. The results of our study further confirmed this claim. Moreover, we also showed a clear impact on reducing the number of procedures in the public sector which are further enriched insights about the impact of social capital on individual elements of the efficiency.
The most controversial finding in our study refers to a result by which can not be linked social capital and duration of procedures referring to speed of operation of the public sector as one of the elements of the efficiency. In our opinion, the reason for this lies in the fact that the speed of the public sector in the individual procedures depends on day-to-day actions of public servants as insiders in the process. On the other hand, the social networks (as a core of social capital paradigm) not participate in designing of the procedures at daily basis.
The importance of social capital lies in producing good governance and contributing to effective governance by facilitating the articulation of citizens’ demands (Boix&Posner, 1998). At the same time, these authors declare that social capital influences on governmental effectiveness is unclear. Our study has shown clear linkage of social capital with total effectiveness, as well as the effective implementation of governmental policies.
Eggers&Singh (2009) expressed doubts of the possibility of public sector to managing the innovation cycle. Some authors, such as Bommert (2010) argue on the necessity for a new form of innovation in the public sector since based on collaboration with external factors. Therefore, social capital is emerging as an important factor for innovation (Savignon, 2011). In the research, we supported a claim that social capital leads to increasing of innovativenes in public sector.
We will summarize by discussing the importance of social and political participation on growth of social capital (Pavarina, 2011). Evans&Syrret (2007) indicated on the characteristic of social capital which growing with its using. On the other hand, use of social capital depends on the degree of connection between people (Šalaj, 2009). According to Coffe&Geys (2005), in situation when social capital is higher people become more active and effective in demanding good government. Our study has shown that social and political participation definitely affects performance in the public sector. Therefore, we will finish our discussion with opinion that „social networks matter” (Putnam&Goss, 2002:07).

REDETE – ECONOMIC DEVELOPMENT AND ENTEREPRENEURSHIP IN TRANSITION ECONOMIES
214
6. Conclusions and Implications
To surmise, there is a clear linkage between social capital and public sector performance. Therefore, we can conclude that social capital affects public sector performance.
Significant correlation was found between social capital and the efficiency and effectiveness in public sector. However, we have not found sufficient evidence that increasing social capital leads to a shorter duration of procedures in the public sector. Nevertheless, increasing the level of social capital leads to decreasing number of procedures and reduction of costs in performing tasks of public sector.
The ability to adapt to changes is very important for the public sector. Therefore, the innova-tion of the public sector should be seen as one of the elements of performance. As an important source of innovation in the public sector it appears from external environment. Social networks, as a core of social capital paradigm, are an important source of innovation. The empirical results of our study suggest a link between social capital and innovation in the public sector.
Citizen participation through networks is important for performance in the public sector. Furthermore, social and political participation leads to more efficient, effective and innovative public sector. Empirical research in the wider global context is undoubtedly shown a positive impact of active citizens through the networks on the performance of the public sector.
The findings of this study suggest a potential theoretical contribution to the existing knowledge and valuable recommendations for practitioners and policymakers. They point out the need of the application of social capital concept in the political agenda. Social capital is needed to be developed. Social capital in terms of the level of development of social networks should be supported by policy-makers in order to achieve better performance, including innovativeness. They should be seen as a quality source of innovation in the public sector.
7. Limitations and Suggestions for Further Research
Ways of measuring social capital within the public sector remains an important issue to discu-ss. Apart from the improvement in developing indicators to measure innovation, it is necessary to develop a system of measuring the impact of social capital on the efficiency, effectiveness and innovativeness of the public sector. Only on the basis of such systematic analysis can one make decisions relating to public sector reform
Limited statistical data have put limitations on the research. Although the study included a lar-ge number of countries in multi-year period, lack of comparable data put limitation in conducting correlation analysis.
Further research should be directed to find systematic model of measurement different compo-nents of social capital and their influence on different components of performance in public sector. Due to the open question of the impact of social capital on the duration of the procedure that refer to speed of performing tasks in public sector, this can be an interesting research topic. This would clarify the impact of social capital on this particular component of the efficiency in the public sector.

REDETE – ECONOMIC DEVELOPMENT AND ENTEREPRENEURSHIP IN TRANSITION ECONOMIES
215
Reference list
1. Adam, Frane; Ročević, Borut (2003). Social Capital: Recent Debates and Research Trends.
London: SAGE Journals, Social Science Information, Vol. 42, No. 2, p. 155-183 2. Advisory Group on Reform of Australian Government Administration (2010). Ahead of the
Game: Blueprint for the Reform of Australian Government Administration. Canberra: Austra-lian Government and Commonwealth of Australia
3. Andrews, Rhys (2012). Social capital and public service performance: A review of the evidence. London: SAGE Journals, Public Policy and Administration, Vol.27, No.1, p. 49-67
4. Andrews, Rhys et.al. (2008). Supporting active citizenship and public service performance: an empirical analysis of English Local Authorities. Bristol: The Policy Press, Policy & Politics, Vol. 36, No.2, p. 225-244
5. Andrews, Rhys; Brewer, Gene A. (2011). Social capital and public service performance: Does organizational strategy matter? Syracuse, NY: Syracuse University, Public Management Research Conference, (June 2-4, 2011), Conference paper
6. Ashworth, Rachel et.al. (2009). Theories of Public Service Improvement. Oxford: Oxford University Press
7. Bale, Malcolm; Dale, Tony (1998). Public Sector Reform in New Zealand and Its Relevance to Developing Countries. Oxford: Oxford Journals, The World Bank Research Observer, Vol. 13, No. 1, p. 103-121
8. Barrutia, Jose; Echebarria, Carmen (2010). Social capital, research and development, and innovation: An empirical analysis of Spanish and Italian regions. SAGE Publications: Euro-pean Urban and Regional Studies, Vol. 17, No.4, p. 371 -385
9. Bloch, Carter et.al. (2009). Public Sector Innovation Index – A Diagnostic Tool for measuring innovative performance and capability in public sector organisations. Aarhus: Aarhus University
10. Boggs, Carl (2001). Social capital and political fantasy: Robert Putnam's Bowling Alone. Springer: Theory and Society, Vol.30, No.2, p. 281-297.
11. Boix, Carles; Posner, Daniel N. (1996). Making Social Capital Work: A Review of Robert Put-nam's Making Democracy Work: Civic Traditions in Modern Italy. Harvard University, Paper No.96-4
12. Boix, Carles; Posner, Daniel N. (1998). Social Capital: Explaining Its Origins and Effects on Government Performance. Cambridge: Cambridge Journals, British Journal of Political Scien-ce, Vol. 28, No.4, p. 686-693
13. Bommert, Ben (2010). Collaborative innovation in the public sector. New York: Taylor-&Francis, Public Management Review, Vol. 11, No. 1, p. 15-33
14. Bowles, Samuel; Gintis, Herbert (2002). Social Capital and Community Governance. Wiley, The Economic Journal, Vol.112, p. 419-436
15. Boyne, George, Martin, Steve and Walker, Richard (2004). Explicit reforms, implicit theories and public service improvement. New York: Routledge, Public Management Review, Vol. 6, No 2, p.189-210.
16. Brehm, John, Rahn,Wendy, (1997). Individual-level Evidence for the Causes and Consequen-ces of Social Capital. Bloomington: The Midwest Political Science Association, American Journal of Political Science, Vol. 41, No 3, p. 999 -1023
17. Brewer, Gene A. (2003). Building Social Capital: Civic Attitudes and Behavior of Public Ser-vants. Oxford: Oxford Journals, Journal of Public Administration Research and Theory, Vol.13, No.1, p.5-26.
18. Broadband Stakeholder Group (2008). Models for efficient and effective public sector interventions in next-generation broadband access networks. Cambridge: Analysys Mason
19. Brooks, Arthur C. (2002). Does civil society stop the downward spiral of bad government or speed it up? SAGE Journals, Nonproft and Voluntary Sector Quarterly, Vol.31, No.1, p. 140-144

REDETE – ECONOMIC DEVELOPMENT AND ENTEREPRENEURSHIP IN TRANSITION ECONOMIES
216
20. Casey, Terrence; Christ, Kevin (2005). Social capital and economic performance in the Ame-rican States. Wiley, Social Science Quarterly, Vol. 86, p. 96-117
21. Chesbrough, Henry W. (2003). Open Innovation- The New Imperative for Creating and Pro-fiting from Technology. Boston, MA: Harvard Business School Press.
22. Coffe, Hilde; Geys, Benny (2005). Institutional performance and social capital: an appli-cation to the local government level. Wiley: Journal of Urban Affairs, Vol.27, No. 5. p. 485-502.
23. Coleman, James S. (1988). Social capital in the creation of human capital. The University of Chicago Press: American Journal of Sociology, Supplement: Organizations and Institutions: Sociological and Economic Approaches to the Analysis of Social Structure.), Vol. 94, p.95-120.
24. Coleman, James S. (1990). Foundations of Social Theory. Cambridge: Harvard University Press
25. Conaty, Frank (2012). Performance management challenges in hybrid NPO/public sector se-ttings: an Irish case. Emerald Publishing: International Journal of Productivity and Perfor-mance Management,Vol.61, No.3, p.20
26. Couto, Richard; Guthrie, Catherine (1999). Making democracy work better: mediating struc-tures, social capital, and the democratic prospect. Chapel Hill : University of North Carolina Press
27. Cusack, Thomas R. (1997). Social capital, institutional structures, and democratic performan-ce: a comparative study of German local governments. Berlin: Wissenschaftszentrum Berlin für Sozialforschung, Discussion Paper FS III 97-201
28. Dale, Ann; Newman, Lenore (2010). Social capital: a necessary and sufficient condition for sustainable community development? Oxford: Oxford Journals, Community Development Journal, Vol. 45, No.1, p. 5-21
29. Della Giusta, Marina (2010). Social capital and economic development. Wiley, Kyklos, Vol.61, No.3, p.466-499
30. Department for Innovation, Universities & Skills UK (2008). Innovation nation. London: UK Stationery Office, Report to the UK Parliament by Command of Her Majesty
31. Douglas, Daniel; Browne, Anthony (2011). Surviving the Downturn: The Role of Social Capital in the Financial Crisis. Washington: Washington State University, The Western Jour-nal of Black Studies, Vol.35, No.2, p.128
32. Eggers, William D.; Singh, Shalabh Kumar (2009). Innovation State: The Public Innovator’s Handbook. Deloitte Rewiev, Issue 4, Deloitte Research, p.73-85
33. Eggers, William D.; Singh, Shalabh Kumar (2010). The innovator's playbook: Nurturing bold ideas in government. Deloitte Research in the U.S. and Ash Institute for Democratic Gover-nance and Innovation and John F. Kennedy School of Government Harvard University
34. Evans, Mel; Syrett, Stephen (2007). Generating social capital? The social economy and local economic development. London: SAGE Journals, European Urban and Regional Studies, Vol.14, No.1, p.55-74
35. Fafchamps, Marcel (2006). Development and social capital. New York: Taylor&Francis, Jour-nal of Development Studies, Vol.42, No.7, p.1180-1198
36. Fine, Ben (1999). The Developmental State Is Dead-Long Live Social Capital? Wiley: Deve-lopment Change Vol.30, No.1, p. 1-19
37. Fine, Ben (2001). Social Capital versus Social Theory: Political Economy and Social Science at the Turn of the Millennium. London: Routledge
38. Florida, Richard; Cushing, Robert; Gates, Gary (2002). When Social Capital Stifles Innova-tion. Harvard Business Review, Vol. 80, No.8, p.20
39. Franke, Sandra (2005). Measurement of Social Capital: Reference Document for Public Policy Research, Development, and Evaluation. Ottawa: Policy Research Initiative, PRI Project: Social Capital as a Public Policy Tool
40. Fukuyama, Francis (1995). Social Capital and the Global Economy. JSTOR; Foreign Affairs, Vol.74, No.5, p.89-103

REDETE – ECONOMIC DEVELOPMENT AND ENTEREPRENEURSHIP IN TRANSITION ECONOMIES
217
41. Gassmann, Oliver; Enkel, Ellen (2003). Towards a Theory of Open Innovation: Three Core Process Archetypes. Lisabon: Conference paper presented at R&D Management Conference (RADMA)
42. Gittel, Ross J; Vidal, Avis (1998). Community Organising: Building Social Capital as a Deve-lopment Strategy. Newbury Park (USA): Sage Publications
43. Good, Raewyn (2000). Social Capital and Policy Development. Wellington: the Ministry of Social Development, Social Policy Journal of New Zealand, No. 185 (July 2000)
44. Gregory, Robert (1999). Social capital theory and administrative reform: Maintaining ethical probity in public service. Wiley, Public Administration Review, Vol.59, No.1, p.63-75
45. Hean, Sarah (2002). Social capital and its measurement. In H. J F, ed. Canadian Journal of Policy Research. The Sainsbury Centre for Mental Health, p. 41–51
46. Henning, Christian; Zarnekow, Nana (2012). Putnam's Social Capital and Government Per-formance:Empirical evidence from rural communities in Poland. Miami: Second World Congress Of The Public Choice Societies (8-11 March 2012), Conference paper
47. Hippel, Von Eric (2005). Democratizing Innovation. Cambridge, MA: The MIT Press 48. Hogan, David; Owen, David (2000). Social capital, active citizenship and political equality in
Australia. In Social capital and public policy in Australia, edited by Ian Winter. Melbourne: National Library of Australia. p. 74- 104
49. Horton, Sarah (2006). Social capital, government policy and public value: implications for archive service delivery. Emerald, Bingley (UK): ASLIB Proceedings, Vol. 58, No.6, p.502-512
50. Huijboom, Noor; Van den Broek, Tijs (2011). Open data: an international comparison of st-rategies. Brussels: ePractice.eu, European Journal of ePractice No.12, (March/April 2011)
51. Isham; Jonathan; Kaufmann, Daniel (1999). The Forgotten Rationale for Policy Reform: The Productivity of Investemnet Project. Oxford: Oxford Journals, Quarterly Journal of Economics, Vol. 114, No.1, p.149-184
52. Johnson, David et.al. (2003). Communities, Social Capital and Public Policy : Literature Re-view. New York: Taylor&Francis, Review Literature And Arts Of The Americas, Vol. 03, p.1-80
53. Jones, Veronica Nyhan; Woolcock, Michael (2007). Using Mixed Methods to Assess Social Capital in Low Income Countries: A Practical Guide. Manchester: Brooks World Poverty Institute, BWPI Working Paper 12
54. Kay, Alan (2006). Social Capital, the Social Economy and Community Development. Oxford: Oxford Journals, Community Development Journal, Vol. 41, No. 2, p. 160-173
55. Kerma, Hans et.al. (2008). Social Capital and European Democracy. Hoboken: Taylor & Francis
56. Knack, Stephen (2002). Social capital and the quality of government: evidence from the States. Wiley, American Journal of Political Science, Vol. 46, p. 772-785.
57. Knack, Stephen; Keefer, Philip (1997). Does Social Capital Have an Economic Payoff? Cross-Country Investigation. Oxford: Oxford Journals, Quarterly Journal of Economics, Vol. 112, p.1251-1288
58. Landry, Réjean; Amara, Nabil; Lamari, Moktar (2001). Social Capital, Innovation and Public Policy. Isuma Canadian Journal of Policy Research, Vol.1, p.73-79
59. Lang, Robert; Hornburg, Steven (1998). What is social capital and why is it important to public policy? New York: Taylor&Francis, Housing Policy Debate, Vol.9, No.1, p.1–16
60. McElroy, Mark W. (2002). Social innovation capital. Bingley (UK): Emerald, Journal of Inte-llectual Capital, Vol.3, No.1, p.30-39
61. Moore, Mark H. (2009). Networked Government. In Goldsmith, S. and Kettle, D., eds., Unlocking the Power of Networks: Keys to High-Performance Government. Washington: Brookings Institution Press
62. Mulgan, Geoff (2006). Social Innovation. London: Young Foundation 63. Mulgan, Geoff; Albury, David (2003). Innovation in the Public Sector. London: UK Govern-
ment, the Strategy Unit in Cabinet Office. Draft discussion paper, ver 1.9 (Oct.2003)

REDETE – ECONOMIC DEVELOPMENT AND ENTEREPRENEURSHIP IN TRANSITION ECONOMIES
218
64. Nambisan, Satish (2008). Transforming Government Through Collaborative Innovation. IBM Center for the Business of Government.
65. OECD (2000). Government of the Future. Paris: OECD Publishing 66. OECD (2001). The well-being of nations: The role of human and social capital. Organization
for Economic Cooperation and Development: Centre for Educational Research and Innovation 67. OECD (2003). Open Government Fostering Dialogue with Civil Society. Paris: OECD Publis-
hing 68. OECD (2009). Innovation In Public Services: Working Together With Citizens For Better
Outcomes. Paris: OECD-Public Governance and Territorial Development Directorate, Draft Outline for the Report of the Public Governance Committee, 09 October 2009, GOV/PGC/RD(2009)6
69. OECD (2010). Guiding Principles for Open and Inclusive Policy Making. Paris: Expert mee-ting on ”Building an open and innovative government for better policies and service delivery” (Paris, 8-9 June 2010)
70. O'Leary, Rosemary; Blomgren-Bingham, Lisa (2008). The Collaborative Public Manager. Washington: Georgetown University Press
71. Pavarina, Paula Regina (2011). Institutions, social capital and economic development in Latin America. European Regional Science Conference, Paper No. 11
72. Potts, Jason (2009). The innovation deficit in public services: The curious problem of too much efficiency and not enough waste and failure. Maleny: eContent Management Pty: Innovation- Management, Policy & Practice Journal, Vol. 11,p. 34–43
73. Putnam, Robert (1993). Making democracy work: Civic traditions in modern Italy. Princeton, NJ: Princeton University Press
74. Putnam, Robert (1994). Social Capital and Public Affairs. JSTOR, Bulletin of the American Academy of Arts and Sciences, Vol. 47, No.8, p.5-19
75. Putnam, Robert (2000). Bowling alone: The collapse and revival of American community. New York: Simon & Schuster
76. Putnam, Robert (2001). Social Capital: Measurement and Consequences. Isuma: Canadian Journal of Policy Research, Vol. 2, p. 41-51
77. Putnam, Robert (2004). Democracies in Flux: The Evolution of Social Capital in Contemporary Society. New York: Oxford University Press
78. Putnam, Robert; Goss, Kristin (2002) Introduction, in: Putnam, Robert D. (ur.), Democracies in Flux: The Evolution of Social Capital in Contemporary Society, Oxford University Press, New York, p. 3-20
79. Roskam, John (2003). Is Social Capital the New Socialism? Melbourne: Review - Institute of Public Affairs, Vol. 55, No. 3, p.30
80. Rothstein, Bo (2003). Social Capital, Economic Growth and Quality of Government: The Causal Mechanism. New York: Taylor&Francis, New Political Economy, Vol. 8, No. 1, p. 49-71
81. Sabatini, Fabio (2008). Social Capital and the Quality of Economic Development. Wiley, Kyk-los, Vol.61, No.3, p.466-499
82. Savignon, Andrea Bonomi (2011). Linking Social Capital and Government Performance: a Public Management Perspective. Newark, New Jersey: Rutgers University, the Seventh TransAtlantic Dialogue: Strategic Management Of Public Organizations (23-25 June 2011), Conference paper
83. Sørensen, Eva; Torfing, Jacob (2011). Enhancing Collaborative Innovation in the Public Sec-tor. SAGE Journals, Administration Society, Vol. 43, No. 8, p. 842-868
84. Šalaj, Berto (2009). Socijalno povjerenje u Bosni i Hercegovini. Sarajevo: Friedrich-Ebert-Stiftung
85. UNDP (2009). The Ties That Bind: Social Capital in Bosnia and Herzegovina. Sarajevo: Uni-ted Nations Development Programme, National Human Development Report 2009
86. Van Deth, J. (1997). Private groups and public life: Social participation, voluntary associatio-ns and political involvement in representative democracies. London: Routledge

REDETE – ECONOMIC DEVELOPMENT AND ENTEREPRENEURSHIP IN TRANSITION ECONOMIES
219
87. Vigoda, Eran (2002). Administrative agents of democracy? A structural equation modelling of the relationship between public-sector performance and citizenship involvement. Oxford: Oxford Journals, Journal of Public Administration Research and Theory, Vol.12, p. 241-272
88. Walker, Ann (2004). Understanding Social Capital within Community/ Government Policy Networks. Wellington: the Ministry of Social Development, Social Policy Journal of New Zealand, No.22 (July 2004)
89. Wallis, Joe (2001). Government Failure, Social Capital and the Appropriateness of the New Zealand Model for Public Sector Reform in Developing Countries. Elsevier, World Develop-ment, Vol. 29, No.2, p.245-263
90. Woolcock, Michael (1998). Social capital and economic development: Toward a theoretical synthesis and policy framework. Springer: Theory and Society, Vol. 27, No.2, p.151-208
91. Woolcock, Michael (2001). The Place of Social Capital in Understanding Social and Econo-mic Performance. Isuma, Canadian Journal of Policy Research, Vol.2, No.1, p.11-17
92. Woolcock, Michael; Narayan, Deepa (2000). Social Capital: Implications for Development Theory, Research, and Policy. Oxford: Oxford Journals, The World Bank Research Observer, Vol. 15, No. 2, p. 225-249
93. World Bank (2002). Bosnia and Herzegovina: Local Level Institutions and Social Capital Study. Sarajevo: World Bank, ECSSD

REDETE – ECONOMIC DEVELOPMENT AND ENTEREPRENEURSHIP IN TRANSITION ECONOMIES
220
GENERATING INNOVATIONS AND IMPROVEMENT OF PERFORMANCE OF COMPANIES USING KNOWLEDGE
CHAIN MODEL
Lidija MITRAŠEVIĆ87
Abstract
Modern business conditions, characterized by general uncertainty embodied in the permanent and intermittent changes, demand constant innovation from business entities. This is precisely why entrepreneurship and knowledge-based information are in constant focus of the scientific community. As an intangible resource, knowledge possesses unlimited possibilities of application as well as the status of the most valuable personal and organizational asset. It can be understood as encompassing of all that the company knows, the way it uses its knowledge and the speed at which it adopts something new and creates new knowledge. Its share in the increase of the company’s value is growing, which should represent the point of special attention when the management of this resource is in question.
Knowledge management (KM) is a systematic process of organizational creation, storage, sharing and applying of knowledge. Its aim is to create individual knowledge, its transformation into collective knowledge and proper use of all forms of it in order to achieve further innovation and higher profitability of the company. On the one hand, this requires a formalization of tacit knowledge into explicit, and, on the other hand, the use of explicit knowledge to improve existing and create new implicit knowledge.
The efforts of knowledge management, time and investment it requires often face condemna-tion in the context of economic inefficiency. The reason lies in the inability to observe the co-nnection between the activities of knowledge management and organizational performance. Porter's concept of its value chain offered a tool for identifying, analyzing and evaluating the contribution of each activity performed by the company in order to deliver its final value to the customer. The subject of our research is the application and adaptation of Porter's generic va-lue chain in the process of knowledge management. The goal is to create a framework that will enable the identification and observation of the connection between knowledge management ini-tiatives as well as a competitive advantage. The possibility of modeling the knowledge manage-ment activities in order to create a useful tool for their analysis and interpretation is being considered. Such an instrument is called the knowledge chain model and, same as Porter's va-lue chain, includes nine generic activities that the company performs in managing their know-ledge resources. The knowledge chain model is used as bases for the identification of the kno-wledge management activities, their contribution to the degree of influence upon the process of knowledge creation and determination of how valuable they are, how rare, difficult to imitate and sustainable over time. In this way we get an insight into the competitive position which can range from the competitive standstill, through equity and temporary competitiveness to susta-inable competitive advantage which should be every company’s goal.
Keywords: knowledge chain model, knowledge resources, knowledge management, compe-titive adventage, value chain
87 University of East Sarajevo, Faculty of Economics in Brcko, 11 Studentska, 76100 Brcko, Bosnia and Herzegovina,
REDETE – ECONOMIC DEVELOPMENT AND ENTEREPRENEURSHIP IN TRANSITION ECONOMIES
221
Introduction
The success of a company in conditions of general uncertainty depends on uniqueness and the use of resources at its disposal, as well as on the frequency and intensity of the impact of external forces on the determinants of its operations. Resources are relatively fixed set of tangible and intangible assets controlled and exploited by a company in order to create value. The value creation process used to be primarily based on the transformation of physical capital (land, factories and equipment), physical (manual) labor and financial capital into outputs of greater value. However, possession of material assets that can be described as rare, valuable, unable to imitate and non-replaceable is getting harder to achieve in a dynamic, unpredictable and complex environment. This condition initiated the need for companies to focus on other types of resources, primarily non-material assets (Krstić and Vukadinović, 2008; Spinello, 1998).
Intangible assets are often described as intangible property because they have no "rigid" shape, as in case of buildings and equipment. They are also known by the term "hidden assets" because their financial value is not as obvious as in case of tangible assets and the same thing goes for their contribution to value creation (Kolaković, 2003). Worker’s knowledge, patents, licenses, databases, know-how, systems of communication, coordination, controls, information systems and the like are often marked as constituent elements of intangible assets and they are all manifes-tations of explicit88 and implicit89 enterprise knowledge. As an intangible resource, knowledge possesses unlimited possibilities of application as well as the status of the most valuable personal and organizational asset. It can be understood as encompassing of all that a company knows, the way it uses its knowledge and the speed at which it adopts something new and creates new knowledge. Its share in the increase of the company’s value is growing, which should represent the point of special attention when the management of this resource is in question.
Knowledge management is a systematic process of organizational creation, storage, sharing of knowledge and its application. It aims to create individual knowledge, transforms it into collective knowledge and ensures proper use of all its forms of in order to achieve further innovation and higher profitability of a company. This requires, on the one hand, a formalization of tacit knowledge into explicit, and, on the other hand, the use of explicit knowledge to improve existing and create new implicit knowledge.
In order to exploit the competitive potential of knowledge management it is necessary to possess an appropriate model or framework for identifying knowledge management activities that create value. Accordingly, application and adaptation of Porter's generic value chain on the knowledge management process designed so-called knowledge chain model.
The knowledge chain model
The knowledge chain model was developed by a group of experts in the field of knowledge management and based on the principles of Delphi method. As a starting point, they used Porter's generic value chain they illustrated as a set of activities focused on creating value for the customer (products/services) and generating value for owners (operating profit). Generic categories of the value chain were divided into two groups of activities: primary activities (which directly contribute to creating value for the customer and include: inbound logistics, operations, outbound logistics, marketing and sales, and service) and support activities (which contribute to the 88 Knowledge that can be codified, documented and legally protected and materialized in the form of commercialized
products, or equipment and procedures that the company uses in its business process. 89 Knowledge that is informal, vaguely articulated and carried by an individual. Its presence is evident in the relationship
among employees, organizational routines, organizational culture, etc.

REDETE – ECONOMIC DEVELOPMENT AND ENTEREPRENEURSHIP IN TRANSITION ECONOMIES
222
effectiveness and efficiency of the primary activities and include: procurement, technology development (including R & D), human resource management, and infrastructure) (Porter, 1985). Grouping of value-making activities was based on the principle of their strategic and technolo-gical distinctiveness rather than their functional attributes.
Analogous to Porter’s value chain, the knowledge chain model consists of five primary groups of activities that are performed in the process of knowledge resource management and four secon-dary groups of activities that support and guide the performance of primary activities (Figure 1).
Figure 1: The knowledge chain model (Holsapple and Jones, 2004, p. 158; Holsapple and Jones, 2005, p. 5)
Displayed groups of activities are constitutive elements of the of knowledge management process. These activities are performed by processors (embodied in the form of people or machines) using resource knowledge and initiating costs whose level must be lower than the value of the process (Amaravadi and Lee, 2005). The results of the knowledge management process are manifested in the form of organizational learning (i.e., increasing levels of organizational knowledge) and projections (i.e., placing company’s resources with the component of knowledge in the business environment). In addition to nine categories of activities, the results of the knowledge management process can be influenced by other resources controlled by the company as well as by the environment inside which it operates. The level of enterprise competitiveness depends on the degree by which it can increase its organizational knowledge and place it in the environment.

REDETE – ECONOMIC DEVELOPMENT AND ENTEREPRENEURSHIP IN TRANSITION ECONOMIES
223
The primary activities of the knowledge chain model
The primary activities of the knowledge chain model are the stages in the knowledge ma-nagement process. Although Figure 1 indicates the sequential nature of the links between these activities, they can be executed in a different order and even overlap, thanks to the specific features of knowledge resources. Depending on the type of enterprise and the knowledge management needs, each of the featured categories of primary activities can be divided into immediate, more distinctive activities. On the other hand, all categories of primary activities are, to a certain level, general which means that they can be identified inside all companies that im-plement knowledge management.
Primary activities include five generic categories (Holsapple and Jones, 2004): 1. Knowledge acquisition is a phase of the knowledge management process that begins with
the identification of knowledge in the external environment and ends with his transfor-mation into a form that the company can use in its operations. Direct acquisition refers to activities that are directly aimed at the acquisition of knowledge, such as obtaining/licensi-ng data sets; obtaining/licensing patents, copyrights, using competitive intelligence, look-ing for windows of opportunity, obtaining trade secrets, soliciting knowledge from exter-nal sources; reviewing professional literature; monitoring technological advances; recei-ving external training; participating in collaborative acquisition. Unlike direct acquisition, indirect acquisitions are created by means of performing the companies’ activities that are not primarily oriented toward achieving the knowledge acquisition targets, but still lead to it. This includes activities such as: hiring an employee, recruiting those with expertise, improving processes through purchase of technology, informally collecting comments from clients, using relationships for acquisition of information, etc. In general, all indirect acquisition activities can be divided into indirect acquiring knowledge en masse and indirect acquiring knowledge on an individual level.
2. Knowledge selection encompasses a set of activities aimed introvert, in contrast to exter-nally oriented knowledge acquisition. These are the activities that serve as the basis for identification of knowledge within the existing resources of companies’ knowledge and then provide its availability - in an appropriate form - for all participants/activities where necessary. We can distinguish action-oriented knowledge selection and archival knowled-ge-oriented selection. Action-oriented knowledge selection refers to knowledge absorption from the process of ongoing knowledge creation, that is, absorption of knowledge that has not yet received its final form. These are activities such as: participating in in-house trai-ning; seeking out people's know-how, know-what and know-way; awareness of processes and events in the organization, observing behaviors of participants in an organization. On the other hand, archival-oriented knowledge selection implies the acceptance of know-ledge from the source where it has been kept, such as selecting an appropriate procedure for forecasting, extracting needed information from a repository, using an organizational memory system, etc.
3. Knowledge generation includes two sub-activities: knowledge discovery and knowledge derivation. Knowledge discovery refers to the creation of knowledge based on creativity, imagination and synthesis. Here we have: devising/developing a strategy, developing new products and processes, data mining, creating, generating through collaboration, etc. Also, the creation of new knowledge can be achieved through application of analytical and deductive methods upon the existing resource of knowledge, which has been known as knowledge derivation. Inside this subset of activities we can classify: improving processes through experience in use, improving processes through process analysis, constructing a software routine, etc.
4. Knowledge assimilation involves activities that change the company’s knowledge level based on internal distribution and storage of knowledge gathered from external and

REDETE – ECONOMIC DEVELOPMENT AND ENTEREPRENEURSHIP IN TRANSITION ECONOMIES
224
internal sources, as well as knowledge created by the company. These activities may have a one-way flow (publishing), or they can be multidirectional/ have return flow (intera-ction). In the first case, we make distinction between so-called formal internal publishing (e.g., publishing a policy manual) and informal internal publishing (e.g., posting an idea on an intranet), and in the second case, we distinguish a formal internal interaction (e.g., bringing experts and people with similar interests together) and informal internal interaction (e.g., mentoring).
5. Knowledge emission is the last stage in the knowledge management process that incorpo-rates a resource of knowledge into the company’s outputs which will be placed in the business environment. It's a case of extrovert oriented activities and it stands opposite to knowledge assimilation activities where knowledge is retained within the company. Knowledge emission can be formal or informal, as well as one way emission or multicas-ting. In this sense, we make distinction between formal external publishing (e.g., developing an advertisement), informal external publishing (e.g., using ad hoc press releases), formal external interaction (e.g., providing technical support) and informal external interaction (e.g., using unscripted interviews).
Secondary knowledge chain model activities
Interaction between certain categories of primary activities as well as sub-category interaction inside one category is under the influence of the external environmental factors, company controlled resources and the means of execution of secondary knowledge chain model activities. The contribution of secondary activities in achieving effectiveness and efficiency of primary activities is reflected in enabling, facilitating, supporting, coordinating and motivating the performance of primary activities.
Secondary knowledge chain model activities include the following categories (with associated sub-activities) (Holsapple and Jones, 2005):
1. Knowledge measurement incorporates the set of activities used for evaluating the process of knowledge management. All activities (i.e., both primary and secondary), used resources, processors and generated results are assessed, as well as the overall knowledge management contribution. Knowledge measurement is carried out in two phases. The first phase determines the subject of the measurement (what is supposed to be measured) and dimensions of measurement (whether we measure quality or quantity or both). The results are then used for the development of qualitative/quantitative measure. This includes acti-vities such as benchmarking, establishing success metrics early, identifying most impor-tant key performance indicators (KPI), using different measures for different stakeholders, etc. Then comes the second stage - applying measures which encompass activities such as: measuring knowledge resources, measuring KM abilities/skills, measuring KM activities, tracking information stakeholders, valuing knowledge, managing/monitoring KM, measu-ring effects of KM.
2. Knowledge control is the group of activities used to ensure that knowledge resource and knowledge processors are available in the required quantity and quality, with respect to requirements related to safety. Some of these activities are more focused on resources, while others are concerned with managerial aspects of control. Accordingly, there are two sub-groups of activities: KM resource control and governance. KM resource control acti-vities include: controlling financial resources available for KM, controlling KM proce-ssors, quality controlling, auditing knowledge, while governance sub-group activities include: protecting/providing access controls, using a standard risk management, managing/monitoring KM.

REDETE – ECONOMIC DEVELOPMENT AND ENTEREPRENEURSHIP IN TRANSITION ECONOMIES
225
3. Knowledge coordination is a harmonized act of creation of a satisfactory outcome while, at the same time, it strives to avoid an unsatisfactory outcome. It is related to the alignment of the interdependent links between the individual elements of the knowledge management process. The focus of knowledge coordination activities is placed on the relations between knowledge resources and other resources (financial, human and mate-rial), relations between specific knowledge activities as well as upon relations between knowledge resources and knowledge management activities. The goal is to award the appropriate skills to the various activities of knowledge chain model, to properly schedule the aforementioned activities, and to properly integrate the knowledge management pro-cess and other organizational processes. Activities such as: establishing communication patterns, building infrastructure, structuring knowledge work, allocating knowledge workers are aimed at establishing a structure on the basis of which knowledge manage-ment will be implemented and, therefore, they are called structuring efforts. The second group of activities are marked as securing efforts and it includes: explaining KM to employees, establishing incentives and motivating employees, securing sponsorship.
4. Knowledge leadership encompasses a set of activities that aim to establish the conditions for enabling, motivating and ensuring the implementation of knowledge management. The set can be divided into activities that are carried out before the implementation of knowledge management, and activities that carry out implementations. For example, the first group of activities (planning) includes: analyzing the business case, aligning KM with business strategies, KM establishing guidelines, and the second one (executing) includes: creating a KM culture, delegating activities, sharing the leader's knowledge.
The impact of knowledge resources and the knowledge management process upon innovation
and organizational performance of the company
The knowledge chain model focuses on knowledge resources and activities aimed at the cre-ation and manipulation of those resources. The model enables the identification, design and implementation of individual activities and sub-activities of the knowledge management processes, as well as the analysis of their performance, their relationship and connection with other processes and the company’s activities, resources engaged, initiated costs and the value they create. In this way it is possible to diagnose the areas in which a knowledge resource can be ade-quately and fully utilized in order to improve performance, enhance competitive position, or at least, avoid the competitive gap.
Figure 1 indicates that the final result of knowledge management represents an increase in the level of organizational knowledge and its distribution in the company’s environment with the distinct knowledge component. The acquisition of knowledge itself (organizational learning) is a necessary but not a sufficient output of the knowledge management process. While knowledge can be created without obvious intention to be used, projections/innovations ensure benefit for the company through the commercialization of knowledge incorporated in the company’s output. Accordingly, the knowledge management process and its formalization in terms of the knowledge chain model has an obvious contribution to the introduction, adoption and intensification of innovative behavior of the companies.
The output of the knowledge management process can be manifested in the form of product knowledge, customer knowledge, and managerial knowledge (Tanriverdi and Venkatraman 2005, in Holsapple and Wu, 2008). Product knowledge allows the company to use existing product research and product development results as well as operational knowledge in the field of new product development, shorten cycle times and reduce overall costs. Awareness regarding the cus-tomer needs, its preferences and purchasing behavior improves the quality of provided services

REDETE – ECONOMIC DEVELOPMENT AND ENTEREPRENEURSHIP IN TRANSITION ECONOMIES
226
and contributes to sale increase because satisfied customers will buy again. Finally, the know-ledge management practices, policies and processes can contribute to productivity increase (by reducing waste and avoiding the repetition of mistakes and preventing duplication of operations) and improve agility through faster response to the constant changes in the environment.
With regard to all the aforementioned, we can conclude that the implications of knowledge management initiatives exert a positive effect on organizational performance, i.e., the results (effects) of its operations. The knowledge chain model greatly facilitates the identification of this relation, whether we consider the performance in terms of competitive performance or in terms of financial performance. Achieving superior competitive performance could be reached by placing the focus of the knowledge management process on: improving productivity, improving agility, encouraging innovation and improving reputation. On the other hand, the design of adequate knowledge chain model activity, in order to achieve higher levels of organizational learning and innovation, improves financial performance expressed in the form of profit ratios (as return/assets, return/sales, or operating income/employee) and cost ratios such as operating expense/sales or cost of goods sold/sales. The goal of the company is to maximize profits ratio and minimizes the cost ratio.
Conclusion
Uncompromising demands of contemporary business conditions force companies to focus on knowledge resource and its proper management simply because the ability to learn and innovate holds a key to survival and progress. Regardless of this fact, it is evident that there are some companies that lack a grasp of logic and do not comprehend the significance of knowledge management. Also, there are some companies that do not go beyond the intuitive understanding of knowledge management’s essential elements. This paper presents a conceptual framework which, in a structured and categorized way, illustrates and analyzes the process of manipulation of knowledge resources in order to outline the importance of its implementation and points out a proper way to design its key elements (activities, processes, resources).
The knowledge chain model, the same as Porter's value chain, promotes an analysis based on activities. Activities, as separable sequences of processes, consume time and resources while crea-ting value and, therefore, influence the relative cost position and/or differentiation of the compa-ny. The knowledge chain model allows us to determine which specific activities of the knowledge management process should be considered in order to improve performance and ensure favourable competitive position, since the knowledge and its effective management are the main factors which determine the level of organizational performance and the degree of competitive advantage.

REDETE – ECONOMIC DEVELOPMENT AND ENTEREPRENEURSHIP IN TRANSITION ECONOMIES
227
Reference list
1. Amaravadi, C.S., Lee, I. (2005). The Dimensions of Process Knowledge. Knowledge and
Process Management. Volume 12, Number 1, pp. 65–76. 2. Holsapple, C.W., Wu, J. (2008). In search of a missing link. Knowledge Management
Research & Practice. 6, pp. 31–40. 3. Holsapple, C.W., Jones, K. (2004). Exploring Primary Activities of the Knowledge Chain.
Knowledge and Process Management. Volume 11, Number 3, pp. 155–174. 4. Holsapple, C.W., Jones, K. (2005). Exploring Secondary Activities of the Knowledge Chain.
Knowledge and Process Management. Volume 12, Number 1, pp. 3–31. 5. Kolaković, M. (2003). Teorija intelektualnog kapitala. Ekonomski pregled. 54 (11-12), pp.
925-944. 6. Krstić, B., Vukadinović, D. (2008). Upravljanje znanjem kao izvor održive konkurentnosti
preduzeća. Ekonomske teme. XLVI, br. 3, pp. 85-98. 7. Porter, M. E. (1985). Competitive Advantage: Creating and Sustaining Superior Performance.
The Free Press. New York. USA 8. Spinello, R.A. (1998). The Knowledge Chain. Business Horizons. Vol. 41, Issue 6, pp. 4–14.

PART FOUR:
External Findings, Eu And Other Funds, Private-Public Partnership

REDETE – ECONOMIC DEVELOPMENT AND ENTEREPRENEURSHIP IN TRANSITION ECONOMIES
229
DEVELOPMENT OF MORE COMPLEX STRUCTURE OF FINANCIAL MARKETS' INSTITUTIONS
IN BOSNIA AND HERZEGOVINA
S. KRESO90 H. KARAMUJIC91
Abstract
The current structure and functioning of financial markets in the developed countries is the product of an extensive evolutionary process. On the other hand, capital markets in Bosnia and Herzegovina (B&H), as well as in the other countries in transition, have been abruptly introdu-ced. This was primarily caused by rapid and extensive privatization. At the same time, the mo-ney market in B&H is almost non-existent. The financial intermediation in B&H is more or less exclusively done through the banking system. As of late 2011, the total net assets of all comme-rcial banks in B&H equated to more than 85 per cent of the financial sector’s total assets. Irrespective of the importance of the banking sector, this utterly one-dimensional financial ins-titutions composition operating in B&H is unsustainable. It is therefore necessary to act quickly in building more effective financial system that entails a number of other performing financial institutions but banks. To make this possible a number of things need to happen. In this paper we will try to answer and propose several recommendations for the following two questions: (i) how to do this? and (ii) whether all levels of B&H Executive Governments92 (in the rest of the text referred to as Government) can help?
Keywords: Financial markets structure, Bosnia and Herzegovina, Commercial banks, Tra-nsition countries
90 The University of Sarajevo, School of Economics and Business, 71000 Sarajevo, Bosnia and Herzegovina, Email:
[email protected]) 91 The University of Melbourne, Victoria 3010, Email: [email protected] and The University of Sarajevo, School of
Economics and Business, 71000 Sarajevo, Bosnia and Herzegovina, Email: [email protected]) 92 Municipal, Cantonal, District Brcko, Entities, and Council of Ministers.

REDETE – ECONOMIC DEVELOPMENT AND ENTEREPRENEURSHIP IN TRANSITION ECONOMIES
230
1. Contemporary Financial Markets in B&H - a Reflection of the Privatization
Financial markets can be defined as markets where buyers and sellers participate in the trade of financial products (assets e.g. equities, bonds, currencies, commercial papers, derivatives...) at pri-ces that reflect supply and demand.93 With respect to functioning of the whole economy, financial markets are typically seen as it’s most important and sensitive component.
The development of financial markets has a very long history. With respect to the developed economies, the current state of their financial markets clearly indicates that they are the product of settled and non-linear evolutionary process which took place over few centuries.94
Today, financial markets for highly developed economies (such as United States of America (USA), European Union (EU) and Japan) are well established and integrated into the network of international financial markets. Currently there is nothing else powerful, promptly reactive and important for the development of those economies, as well as the global economy, as the global financial market. Therefore, the health of the global financial market is seen as vital for prosperity of individual economies as well as the global economy.
At the same time, it is well known that market economies, from time to time, tend to generate cyclical instability (economic crisis). More precisely, we are all witnesses to the spontaneous emergence of economic crisis in which financial markets play a significant role. In this context, we should mention the latest global financial crisis (GFC), which still seriously threatens to turn into a "double bottom" depression. So, no matter how important and powerful is influence of fi-nancial markets to the economic development and the development of the society as whole, finan-cial markets are at the same time the source of spontaneous imbalances and crises. Consequently, in order to overcome these problems, the Government intervention is needed. This will be discussed in details in the rest of the text, especially from the perspective of B&H.
Unlike the state of development of financial markets in the developed countries, which is characterised by gradual, evolutionary development process that unfolded over few centuries, the development of financial markets in the developing countries took quite a different course. In fact, financial markets in the developing countries are presently influenced by "express" transformation of their economies (and social structures) under pressure of globalization, i.e. subsuming these economies (and societies) into the dominant (neo)liberal framework of the world economy.
The size and reach of the contemporary globalization are such that it reaches practically all countries, though to a varying degree, of the world without exception. In doing so, the process does not pay much attention to the diversity of individual countries (e.g. their individual charac-teristics and corresponding special needs). This is particularly the case for smaller economies. More precisely, everything points to the fact smaller the country, the globalization process will care less for the individual particularities of the country and impose schematised framework. So, for a transition of individual economies to the market economy, several well-defined paths of financial and wider economic infrastructure transformations are typically utilised. At the face value, their aim is to get it all implemented as soon as possible and as "effective" as possible, i.e. instigate the economic mechanism based on private property and less regulated market. So, the magic word concerning the transition process is privatization, and in relation to market function-ning a deregulation.
93 For more see authors such as Mishkin & Eakins (2005) and Viney (2007). 94 It is important to have in mind that financial markets even in those developed economies sometimes significantly differ
with respect to a number of characteristics, such as institutional solutions adopted, products available and the volume of the market trade.

REDETE – ECONOMIC DEVELOPMENT AND ENTEREPRENEURSHIP IN TRANSITION ECONOMIES
231
The transition process in the developing countries is dominated by a relatively small number of players on their financial markets, principally strong foreign banks. This is done either through privatization of existing domestic banks, or (but less frequently, at least according to experiences of countries in the South Eastern European Region (SEE) region) through the establishment of their own subsidiaries. Therefore, the result of the transition of the financial system for countries such as B&H, as well as countries in the region with little variation, is the bank-centric financial system dominated by foreign banks operating in the region or beyond (mostly domiciled in Austria, Italy and Germany).
We want to emphasize that this development of banking industry has also brought a lot of benefits. This particularly refers to the development of a modern commercial banking system, which restored confidence of the population and the economy, the development of many new products, and a perception of less risky financial environment. This happened even though banks in transition countries are generally legally separate entities to their parent banks, hence responsible to their depositors only up to the level of capital that they hold in that particular country. Parent banks are as such exposed to reputation risk only.
However, as much as it is needed for the countries in transition to develop commercial banking sector in the manner discussed above, it is equally important to develop other financial institutions. The share of other financial institutions (e.g. leasing companies, investment funds, insurance and re-insurance and micro-credit organizations) in the market of these countries is marginal, which reduces a possibility of an adequate competition in attracting funds and creating modern and functional products that would better satisfy needs of the market participants.95
At the end of 2011 total assets in the consolidated balance sheet of commercial banks in B&H stood at 21.9b KM, which represented over 85 per cent of the total assets of the B&H financial sector. All other financial institutions are kept below 15 per cent of the total financial potential. It clearly illustrates the dominance of the banking sector, in particular banks with majority of foreign capital (for more details see reports from FBA and ABRS).96
Given the fact that we have a distinct dominance of bank-centric financial system in B&H, banks are practically the only place where free financial funds could be invested. As previously stipulated, other financial intermediaries are weak and do not offer attarctive features and/or products. For example, during the process of privatization in the Federation B&H, which was based on certificates, almost all privatization investment funds (PIFs) were under the control of the capital from Slovenia.
Following the logic of profit alone, without any respect for other social aims owners of funds were often targeting the assets of privatized companies, without any ambition to restructure acquired companies or hire additional, or even retain existing workers. As such, the privatization has predominantly been exhibited in different trading strategies of the existing capital, instead of reenergising, restructuring and re-launching the obtained companies. By no means, we do not claim that privatization is not a basis for future more efficient operations, but it is now very clear that the exhibited practice has not been as efficient and effective as anticipated and expected. Spontaneous privatization without the proper role of Government has not resulted in (at least so far) expected tangible benefits.
This is reflected in the B&H stock market, which is very weak, though who through its registers is serving a huge number of securities created through privatization that are only symbolic in value and typically never traded. Non-initiation of adequate economic growth made the stock market institutions chronically anaemic. Bad situation turned even worst with the onset
95 According to Ortiz (2012): “In eastern Europe, foreign subsidiaries accounted for more than 70 per cent of total assets, but
recently foreign banks have been reducing their exposure there“. 96 For more see: FBA Information on the Banking System of the Federation of Bosnia and Herzegovina as of 30. 06. 2012,
Table 2, and АBRS, Report on Condition of Banking System of Republic Srpska, for the Period from 01.01.2011 to 31.12.2011, Banja Luka, page 9.

REDETE – ECONOMIC DEVELOPMENT AND ENTEREPRENEURSHIP IN TRANSITION ECONOMIES
232
of the GFC that made the stock market almost completely paralysed. Furthermore, a very modest offer of financial products (for example in the area of life insurance) directed a large number of domestic funds outside the country (mainly to Austria). That in turn meant that a large amount of high-quality long-term financial resources ended outside the country, so that financial markets in B&H (especially capital markets) were left without significant resources and hence opportunity to be utilised for domestic economic development.97 This process is very much still ongoing.
When it comes to the money market, it practically currently does not function in B&H. On the one hand, functioning of the Central Bank of B&H (CBBiH) is based on the currency board principle which eliminates the possibility of implementing the open market operations.98 However, in our view this is a smaller part of the problem since open market operations are not the only contributor to the development of the money market.99 Historically the money market started as a mechanism of redistribution of financial liquidity, especially amongst banks, and even before that, as a result of searching for short-term funds. But in our "general state of disarray and inaction" how anybody dare to give money for the "promise of payment". The problem is "weak regulation and unwilling and ineffective Government". The question of non-functioning money market (even capital markets) to a large extent can be explained by (i) unwilling attitude of the re-gulator regarding the establishment and the implementation of the specific functioning legal system; (ii) almost complete lack of the highest level Government’s presence in the money market and capital markets regarding the public offering of securities (both short and long term, e.g. treasury bills and bonds). On the other hand, B&H’s entities and even some local communities (municipalities and towns) have recently issued securities.
2. Consequences of One-dimensional Institutional Infrastructure of Financial Market in B&H
We have already stipulated the fact that financial markets in B&H, in the institutional sense, are almost exclusively reliant on commercial banks and that they represent almost the only option for holding of available funds. The fact that monetary policy is based on the principle of the currency board with fixed exchange rate to the euro (1 EUR = 1.955830 KM), for the most part (with respect to EURO zone) removes the foreign exchange risk, and, among other things, is conducive to saving.100 Furthermore, the currency board functioning works in the way to stabilises inflation in B&H, relating it to the developments in euro zone. This, in principle, may somewhat contribute to a creation of a positive attitude for prospective investors.
As previously mentioned banks operating in B&H are crucial financial institutions as they have the dominant influence on the creation a general perception of, the atmosphere and the risk profile of the financial system. At the same time, banks established with foreign capital provide information on developments in the country to their clients. In particular, they give advice to their clients, especially foreign investors, how to adjust to local conditions and optimise their investment aspirations. In this way, they have critical influence on the development of financial
97 Some may argue that the international community (whatever that means), supplied international aid for post-war
reconstruction and the development and so brought the resources needed to revive the economy and financial system of the country. We say it is by far not sufficient ie these funds represented only a small part of war damages, lost GDP and so on.
98 As much as this is subject to criticism, in our situation, we strongly support functioning CBBiH on the principle of the currency board, for the simple fact that it represents an oasis of peace and stability. If the CBBiH, in the current conditions, would abandon the mechanism of "discretionary" rule of governance, it would only bring chaos and instability of the monetary system.
99 For more see Perišin (1989), Perišin (1990), Perišin (1994a) and Perišin (1994b). 100The foreign exchange risk can be defined as the risk that an investor will have to close out a long or short position in a
foreign currency at a loss due to an adverse movement in exchange rates.

REDETE – ECONOMIC DEVELOPMENT AND ENTEREPRENEURSHIP IN TRANSITION ECONOMIES
233
markets in B&H, not only through its financial operations but also via informing and as such creating communication standards with foreign investors. The following facts illustrate this:
1. Banks without a doubt are in control of determining the level of interest rates and as such the spread between active and passive interest rate levels. Normally, this is directly related to risk which, to a large extent, should be related to the country risk. Having said that, the observed levels of B&H’s and Greece’s lending interest rates do not make sense, except for political influences and monopolistic behaviour of the banks. Greece has significantly lower interest rates as well as the country credit risk rating compared to B&H (almost two times the level of Greece’s interest rates and significantly better credit rating).101
Table 1: Spread between active and passive interest rates, in per cents, annual basis
31 Dec. Year
The credit rating
of B&H
Lending Commercial Banks’ Interest Rates in KM
Demand and T&S Deposits Rates in KM
Sh. term lend. rat. in KM
Long-term lending rates in KM
Demand Dep. Rates in KM
T&S Dep. Rates in KM
Private Enterprises
House holds
Private Enterp.
House Holds
Private Enterp.
House holds
Private Enterp.
House holds
2002 12,07 - 10,59 - - 1,44 - 4,38
2003 10,54 - 9,18 - - 0,96 - 3,4
2004 B3
9,92 9,78 8,23 10,78 0,54 0,77 2,42 4,02
2005 9,03 9,32 7,69 9,91 0,45 0,63 3,41 3,63
2006 7,66 9,55 7,39 9,34 0,37 0,49 3,75 3,48
2007 B2 7,03 10,54 7,13 9,95 0,33 0,35 3,65 3,98
2008 7,42 9,14 7,36 10,93 0,37 0,32 2,99 3,61
2009 8,1 9,79 7,78 8,26 0,3 0,25 3,6 3,57
2010 7,84 9,67 8,25 9,1 0,17 0,15 3,38 2,89
2011 B2 7,18 9,71 7,48 8,49 0,13 0,08 2,14 2,72
Note: For B&H’s credit rating see Box 1. Source: Central Bank B&H.
As shown in Table 1, during the last decade, the short-term business lending interest rate
spread, on an annual basis, ranged in favour of banks from 7 per cent (2008. 7.42 per cent - 0.37 per cent) to 9.4 per cent (2004. 9.92 per cent - 0.54 per cent). For personal lending, the spread was usually much higher, with a maximum of 10.2 per cent in 2007 (10.54 per cent - 0.35 per cent). For the long-term business lending, the annual interest spread in favor of the banks in 2004 was 5.8 per cent, 5.3 per cent of 2011, while for personal lending in 2004 and 2010 it was 6.7 per cent and 6.2 per cent respectively. In addition to these very high yields it is especially conspicuous to observe that the movement of interest rates is not directly related to the relevant country credit rating score.
Linking data presented in Table 1 and the facts about credit rating after 2004 for B&H (Box 1), it can be seen that as the interest rates on short-term loans to households from 2005-2007 increased by 1.2 per cent, and interest rates on long-term loans from 2006 to 2008 by 1.6 per cent, just at the time when credit rating of B&H grew from B3 to B2. During the period 2007-2009, similar thing happened with the interest rate on short-term business loans, when the interest rate increased by 1 per cent per annum, as well as long-term loans from the 2007-2010, when interest rates increased by 1.1 per cent per annum.
101 For more see Table 1 and Box 1; also see Attachment 1a: Lending spreads of monetary financial institutions – loans to
non-financial corporations and households and Attachment 1b: Greece credit rating cut by S&P on 'likely default').

REDETE – ECONOMIC DEVELOPMENT AND ENTEREPRENEURSHIP IN TRANSITION ECONOMIES
234
Box 1: The Credit Rating of Bosnia and Herzegovina
Published: Sarajevo 12/07/2012 The international rating agency Moody's Investors Service has announced on 10 July 2012 that the credit rating of Bosnia and Herzegovina remains B3. What has been changed compared to the previous rating assessment is the Outlook, as the Negative Outlook has been replaced with the Stable Outlook. Source: CB BiH, http://cbbh.ba/?id=844&lang=en, accessed on 03/09/2012. Published: Sarajevo 26/12/2011 Moody's Investors Service maintained the same credit ratings of Bosnia and Herzegovina, B2 with negative outlook. Source: CB BiH, http://cbbh.ba/index.php?id=790&lang=en, accessed on 03/09/2012. Published: Sarajevo 18/09/2008 Moody's Investor Service announced today, on September 18, 2008 that Bosnia and Herzegovina's credit rating, will remain the same, B2 with a stable outlook. Source:CB BiH, http://cbbh.ba/index.php?id=558&lang=en, accessed on 03/09/2012. Published: Sarajevo, 05/06/2007. International Rating Company Moody's Investor Service has announced today, June 5, 2007, that Bosnia and Herzegovina's credit rating will remain the same - B2 with Stable Outlook. Source: CB BiH, http://cbbh.ba/index.php?id=133&lang=bs, accessed on 03/09/2012. Published: Sarajevo, 17.05.2006. Moody’s Investor Service has upgraded today, May 17, 2006, Bosnia and Herzegovina’s credit rating from B3 with positive outlook to B2 rating with the stable rating outlook. Source: CB BiH, http://cbbh.ba/index.php?id=164&lang=en, accessed on 03/09/2012. Published: Sarajevo, 29.03.2004. Moody's Investor Service, international rating agency worked last few months on evaluation of credit rating for Bosnia and Herzegovina... Bosnia and Herzegovina was given today, March 29, 2004, the B3 credit rating with a positive outlook. This positive outlook is a clear indication that the Rating Agency expects that BH's rating will be upgraded in the next six to eighteen months. Source: CB BiH, http://cbbh.ba/index.php?id=247&lang=en, accessed on 03/09/2012.
2. Another large revenue source for the banking industry stems from the payment system fees collected. In this area banks also have a monopoly position. Immediately after the war there was a strong campaign to remove the Public Accounting Services (Služba društvenog knjigovodstva - SDK). SDK was deemed as an inappropriate institutional framework for the development of the market economy. With this we can fully agree. But at the same time we should remember that SDK was providing payment services in association with commercial banks. The system was more stable and reliant. From the cost perspective, the amount of commission was strictly controlled. The main grounds for criticism of this institutional approach was based on the assumption that banks can perform these activities more efficiently and less expensively. Not denying that the system of payment based on the role of commercial banks is potentially more effective, we openly question whether the payment system conducted by the banking industry alone is cheaper? In this sense, we present the fact that (large) banks charge service payments on any transaction, even internal transfers within the bank (e.g. charging 1.5 KM for paying bills to service providers that hold the account with the bank). We have to wonder what kind of reasons can approve such behaviour. Legal entities face equally high costs for payment services. Finally, the highest fees are the fees for international transactions, which for smaller companies and general population can costs up to 10 per cent of the transaction value.

REDETE – ECONOMIC DEVELOPMENT AND ENTEREPRENEURSHIP IN TRANSITION ECONOMIES
235
3. Banks in B&H are not consistent enough in the scope, content and depth in implementing the "Vienna Initiative".102 The accord somewhat reduced the negative consequences of the GFC on the financial system of B&H, compared to what would happen in the event of its absence. This is especially the case in terms of reducing the risk of a sudden withdrawal of large amount of funds or even international banks from the country. Haas et. all. (2012) payed a particular attention to this issue in their research.103,104 As always others have the opposite view (Ortiz, 2012, Ricka, 2012) and emphasize the fact that the international banks during the GFC only focused on their own financial harmonization and consolidation, withdrawing funds from their subsidiaries in developing countries and countries in transition105.
So, while the GFC was coming to "hit" with the full force, long-term loans volume in B&H in 2008/2007 increased by 1.6 b KM (17,4 per cent annually) and short-term loans for 1b KM (35,8 per cent annually) (CBBH, 2011). Subsequently in 2008-2009 negative pressures on the B&H’s financial system intensified. Specifically, long-term loans granted by commercial banks in
102 According to EBRD (2012) 'Vienna Initiative' is explained as: 'The European Bank Coordination “Vienna” Initiative
(EBCI) was launched at the height of the financial crisis to provide a framework for coordinating the crisis management and crisis resolution of financial sector issues that were highlighted by the economic downturn and involved large cross-border bank groups systemically important in the emerging Europe region.'
103„We use data on 1,294 banks in Emerging Europe to analyze how bank ownership and the so-called Vienna Initiative impacted credit growth during the 2008-09 crises. As part of the Vienna Initiative western European banks signed country-specific commitment letters in which they pledged to maintain exposures and to support their subsidiaries in Emerging Europe. We show that in general both domestic and foreign banks sharply curtailed credit during the crisis, but that foreign banks that participated in the Vienna Initiative were relatively stable lenders. We find no evidence of negative spillovers from countries where banks signed commitment letters to countries where they did not. In February 2009, the European Bank for Reconstruction and Development (EBRD), European Investment Bank (EIB), and the World Bank Group launched, within the context of the VI, a ‘Joint IFI Action Plan in support of banking systems and lending to the real economy in Central and Eastern Europe’. The goal was to mobilize resources from these institutions to avert a banking crisis and support bank lending in the region. This support was integrated with IMF and European Union macro financial support programs to Bosnia and Herzegovina, Hungary, Latvia, Serbia, and Romania. In return for these countries’ commitment to keep their programs on track and for financial support under the Joint IFI Action Plan, a number of multinational banks signed country-specific commitment letters in which they pledged to maintain cross-border exposures and to continue to provide credit to firms and households. To do so, banks confirmed that they would keep subsidiaries adequately capitalized and provide them with sufficient liquidity. The VI thus developed into a comprehensive public-private partnership that combined macro-financial support by the IMF and the EU (a ‘bail-out’) with funding by various development institutions and a coordinated ‘bail in’ of private lenders. Although a large-scale, uncoordinated withdrawal of banks from Emerging Europe did not materialize––and the VI can therefore be considered successful stricto sensu––as yet virtually no empirical analysis has been undertaken to assess its impact.2 No evidence is available on the role played by banks that were part of the VI versus those that were not. Likewise, for those multinational banks that were part of the VI, no comparison has been made between their lending behavior in countries where they signed commitment letters and countries where they did not. It also remains unclear whether signing commitment letters may have led to negative spillovers to other countries“ (De Haas, et.all. 2012. p. 2).
104 Also see Attachment 2: The Vienna Initiative. 105 „When global banks first expanded into emerging markets, the idea was that they would bring greater efficiency and foster
competition. And there is evidence it did – for a while. But the financial crisis changed that: faced with the need to deleverage and meet higher capital requirements, they are now reducing their exposure to emerging markets, prompting damaging credit crunches, and using profits obtained from subsidiaries to recapitalize parent banks“(Ortiz, 2012). „The transition region continues to be affected by the fallout from the Eurozone sovereign debt crisis, with capital outflows and parent bank de-leveraging, resulting in credit contraction. This is somewhat mitigated by bank funding from additional deposits, which in turn may stem from a rise in savings since the pre-2008 levels. Transition region experienced net capital outflows in Q3 2011 for the first time since 2009. High frequency data suggests that outflows have continued at least through February 2012, even though at a decreasing pace. Parent bank de-leveraging appears to have started in the fall of 2011. Data on bank exposures from the BIS show that assets of international reporting banks in emerging Europe dropped sharply by USD 33 billion in Q3 2011, following a net increase by USD 47 billion in the first half of the year. More recent BoP data show that banks in central and south-eastern Europe continued to lose cross-border funds through Q4 2011. Credit growth has turned negative in almost all of the new EU members by late 2011 and early 2012. This is consistent with worsening credit conditions in Q3 and Q4 of 2011 in Emerging Europe as a whole“(Ricka, 2012).

REDETE – ECONOMIC DEVELOPMENT AND ENTEREPRENEURSHIP IN TRANSITION ECONOMIES
236
October 2008 have reached volume of 10.9b KM, which by February 2010 reduced to 10.3b or around 632m KM less. It is evident that the main lever for funding the development in B&H was materially reduced. This is evident by the fact that the long-term loans in June 2008 equated to 10.3b KM, while after nine quarters, in September 2010, reached slightly higher level of 10.4 b KM. This shows the intention to preserve liquidity by short-term funding against possible explosive advances of the crisis. The short-term loans granted by commercial banks amounted 3.7b KM in November 2008, and then continued to grow (as opposed to the long-term loans) to 3.9b KM, in May 2009. This was not a large increase in the volume, i.e. it was not material with respect to injecting necessary funds to provide an additional stimulus to the economy. It only provided a face value benefit to the economy (due to an enormous spread and consequent high interest rates the economy was getting weaker) and provided tangible benefits to the banking sector only (liquidity and hence the survival). All of this inevitably creates an ugly, depressing picture, with people at the "end" of patience, angry, prone to hostility, seeking solutions outside of hard work, which for the Balkan historically represents a very sensitive issue. Daily newspapers and other media are filled with such information, which are sensationalist in nature, often partially presented to give very bad picture. Consequently, it all results in negative perception of the country to both domestic and foreign investors. All of this gives the impression of increased risk and results in lower credit rating of the country. According to the latest estimates from the Moody's Investors Service Agency, on 10 July 2012, the credit rating of B&H returned to 2004 level of B3 (see Box 1). Without any doubt the banking sector cannot be the only to blame. Nevertheless, as the most powerful and influential players in the financial system, there is no doubt in their direct responsibility. Once again, we are sure that the market mechanism is necessary but also inadequate to solve all the issues, particularly once relating to the development funding. This is especially the case when things do not go as expected (the recent GFC provide a good example).
5. What are the consequences? Furthermore, is everything described as it looks at the first sight? Table 2 clearly shows that the strong portfolio investments (2001-2003) was preceded by a relatively long period of stronger foreign direct investment (FDI) in B&H (2004 to 2008), which was cut short by the GFC. We would like to point that the first phase of stronger foreign portfolio investment occurred during the time of growing presence of foreign banks at B&H’s financial markets. Caused by the new institutional composition of the B&H financial system and parallel intensification of the privatization process, the strong wave of FDI took place. This was followed by a sharp increase in foreign portfolio investment (2008-2010). Is it a strong signal of yet another wave of FDI?, especially for the fact that the GFC created a very favourable condition for possible takeover of numerous assets/companies in B&H. The austerity policy, which during the stabilization phase is typically imposed as a solution all over the globe, in B&H was adopted in its more drastic form. The logical question is: could it be different? Yes, of course, it could and it should. The compulsory condition for that is to have better organized and functioning Governments at all levels, capable and/or keen to make a difference (funding economic development, stimulating competitive behaviour and appropriate usage of locally present competitive advantages106), something that spontaneous market forces on its own could never achieve.
106 For more see Kreso (2012).

REDETE – ECONOMIC DEVELOPMENT AND ENTEREPRENEURSHIP IN TRANSITION ECONOMIES
237
Table 2: Direct & Portfolio Investments in B&H
Note: Sarajevo, 30/8/2012, According to the Central Bank of Bosnia and Herzegovina (CBBH) data, the inflow of foreign direct investments (FDI) in 2011, amounted to 566.9m KM, or 2.2 per cent of GDP, which is more than in 2010, with the
recorded inflow of 430.9m KM. Source: CB BiH, http://cbbh.ba/index.php?id=848&lang=en, assessed on 03/09/2012.
3. Possible Directions of Government Intervention
Thus far we showed serious shortcomings in the functioning of the nearly one-dimensional financial infrastructure of the financial system in B&H. Therefore, among other things, we require thorough and profound changes in the promotion of: competition and efficiency, the institutional infrastructure and deepening and increasing liquidity of financial markets.
Strengthening of financial markets in B&H could be achieved by emission of Government securities of different maturities. By this we are not restricting the proposal to only the highest level of Government (B&H), which until now was completely absent from these activities. Therefore, what we propose here reefers to all levels of Government. The funds collected should be invested primarily into the necessary infrastructure, which would give an impetus to numerous other economic activities. In particular, the construction sector, which has a high multiplicative effect for the initiation of other industries and associated employment opportunities. To avoid mobilized funds being used irrationally, it is of utmost importance to appropriately prioritise investments. This should eventually increase the funds available for capital budgets. These budgets are currently marginal in its impact on economic growth, employment and overall social development.
At the same time, it is at least equally important to emphasize the urgent need for the necessary reforms/restructuring of Government spending and effective use of already available resources managed by all levels of Government (both financial (budget), and all others (e.g. natural resources, land, constructed buildings, the existing infrastructure and etc.)).
The consistent implementation of these reforms should not only result in significant additional growth opportunities but should also reflect a materially different experience of the country in terms of investors' appeal. The result of the reform would be a general increase in the confidence and investment. Consequential increased aggregate demand, would not only raise the level of eco-nomic activity and increase employment, but would also create conditions for increase in budgets for all levels of Government. The initial problem to make all of this possible is the country's credit rating and, in particular, the issue of lack of public belief that the money invested in the Government securities is safe (the problem of deposits and savings from former Yugoslavia). To
Year Direct investment
Portfolio & other
investment 1998 117 -495 1999 325 -412 2000 310 -134 2001 260 1.925 2002 551 584 2003 660 1.141 2004 1.106 1.076 2005 964 1.979 2006 1.189 930 2007 2.932 264 2008 1.227 1.470 2009 359 824 2010 25 1.185

REDETE – ECONOMIC DEVELOPMENT AND ENTEREPRENEURSHIP IN TRANSITION ECONOMIES
238
do this it may be possible to get support from wealthy partners in the form of a not too expensive guarantees (e.g. from Austria, based on a large volume of outflow of life insurance funds from B&H, the EBRD, IDB, Islamic countries rich in oil, countries interested in certain concessions in B&H, and may also be offered as collateral what we will build or already existing infrastructure). All this could strongly affect the positioning of the Governments at all levels as a very respectable participant at financial markets, with the capacity to attract available funds.107 This should increase competition at the market place i.e. would undermine a monopolistic position of the existing banks.
As an idea, all levels of Government could initiate the development of new and/or improved housing funding modalities and enticement to small banks to enter the market. Housing funding is relevant since this area, particularly regarding the funding modalities available, is very poorly developed. Consequently, it is necessary to build an appropriate institutional infrastructure, enhance and expand the capabilities and funding mechanisms and develop appropriate forms of support from all levels of Government. This would require engagement of significant financial resources, which in turn will strongly contribute to the strengthening of financial markets. In doing so, we could benefit from experiences from several other highly developed economies, which have, during the initial stages of development of their economies, utilized this mechanism for their development needs. In particular, here we draw attention to the experiences of Germany, the Netherlands and the USA.108 All of these countries individually, respecting their economic and social circumstances, developed appropriate institutions / funding models / financial mechanisms that have strongly assisted their housing and construction sectors.
Yet another proposal is to entice a number of other foreign banks to enter the market or to support existing smaller banks in order to facilitate increase in competition. In this sense, a possible Government support can be to direct most of their available financial resources and transfer most if not all of their accounts to those small banks. Furthermore, small banks can be supported by giving them an access to state controlled networks, such as postal network.109 Even if large lending funds are needed, small banks could be enticed to make a consortium. As such the large existing banks would face increased competition, at least for a certain segment of the existing activities.
4. Conclusion
The analysis provided in the paper strongly indicates that at the present time B&H’s financial markets necessitate urgent and robust intervention from Government at all levels. In particular, this is needed in order to improve the institutional infrastructure, competition and efficiency, and to deepen and increase the scope and liquidity of B&H’s financial markets. This paper provides several interesting suggestions, which by no means pretend to be exhaustive.
107 For example, it would help to the insurance industry in B&H, which could instead of holding its deposits with banks (in
the Federation of B&H it holds 90 per cent of its reserves in deposits with banks) invest it in Government securities. 108 „Housing plays an important role in a country’s economy, typically accounting for 10 to 20 per cent of the total economic
activity. In addition, housing is often an individual’s biggest asset. The availability of housing finance is, therefore, crucial for overall economic development as well as for a household’s welfare and its quality of life... three specific financing instruments used in different parts of the ECE region today, namely the “Bausparkassen” system, representing a contractual savings scheme, the Danish mortgage bond technique and the United States variety of mortgage-backed securities (MBS). They are the systems currently most often considered for application in countries in transition. These countries therefore need guidance and practical tools to carry out their own analysis to select those instruments and models most suitable for their country and their particular context.
109 In B&H postal network is Government controlled.

REDETE – ECONOMIC DEVELOPMENT AND ENTEREPRENEURSHIP IN TRANSITION ECONOMIES
239
Reference list
1. АBRS, (2012). Izvještaj o stanju u bankarskom sistemu Republike Srpske za period 01.01. - 31.12.2011. http://www.abrs.ba/publikacije/Izvjestaj_o_stanju_bankarskog_sistema-_RS_31122011.pdf. accessed on August 2012.
2. CB BiH, (2012). Bilten 4, 2011. http://www.cbbh.ba/files/bilteni/2011/bilten_-4_2011.pdf. accessed on September 2012.
3. De Haas, R., Korniyenko, Y., Loukoianova, E., Pivovarsky, A. (2012). Foreign Banks and the Vienna Initiative: Turning Sinners into Saints?, MoFiR working paper n° 62, March 2012, http://dea2.univpm.it/quaderni/pdfmofir/Mofir062.pdf. accessed on August 2012.
4. EBRD (2012). Vienna Initiative – moving to a new phase, http://www.ebrd.com/downloads/research/factsheets/viennainitiative.pdf, accessed on September 2012.
5. ECB, European Systemic Risk Board, ESRB Risk Dashboard, Frankfurt, 20 September 2012, 120920_ESRB_risk_dashboard[1].pdf , accessed on September 2012.
6. Economic Commission for Europe, Geneva (2005): Housing finance systems for countries in transition - principles and examples, United Nations, New York and Geneva, 2005. http://www.unece.org/fileadmin/DAM/hlm/prgm/hmm/hsg_finance/publications/housing.finance.system.pdf. September 2012.
7. FBA, (2011). Informacija o bankarskom sistemu 31. 12. 2011. http://www.fba.ba/images/Publikacije_Banke/Informacija_Bank_31122011_bos_new.pdf, September 2012.
8. Kreso, S. (2012). Globalna finansijska kriza i imperativ korištenja raspoloživih prirodnih resursa u formuliranju nove razvojne strategije. FINRAR, Sedmi međunarodni simpozijum, Banja Vrućica. 21 i 22. Jun 2012.
9. Mishkin F., Eakins S. (2005). Financijska tržišta i institucije, Mate, Zagreb 10. Ortiz G. (2012). Emerging markets must lead banking reform, Financial Times, March 4,
2012, http://www.ft.com/cms/s/0/80da1a4e-6486-11e1-9aa1-00144feabdc0.html#axzz209k-DXsvy, pristup: 09.07.2012. September 2012.
11. Perišin, I. (1994a). Transakcijsko tržište – pretpostavke i zamke razvitka, Slobodno poduzetništvo, broj 8, TEB, Zagreb
12. Perišin, I. (1994b). Složena konfiguracija susteva financiranja, Privredni vijesnik, broj 20, TEB, Zagreb
13. Perišin, I. (1990). Zabune i istine o transakcijskom tržištu i burzi, Privredni vijesnik, broj 20-21, TEB, Zagreb
14. Perišin, I. (1989). Financijski mehanizam, Suvremeni ekonomski problemi, svezak 10, Zagreb 15. Ricka, F. (2012). Economic Focus: Are Banks De-leveraging in Emerging Europe?, (By
Franto Ricka, Jonathan Lehne and Peter Tabak) Posted on: April 5, 2012, EBRD blog, http://www.ebrdblog.com/wordpress/2012/04/economic-focus-are-banks-de-leveraging-in-emerging-europe/. accessed on September 2012.
16. Viney, C. (2007). Financial Institutions, Instruments and Markets, McGraw-Hill, Australia.

REDETE – ECONOMIC DEVELOPMENT AND ENTEREPRENEURSHIP IN TRANSITION ECONOMIES
240
THE CAPITAL MARKET DEVELOPMENT IN THE FUNCTION OF EFFICIENT PORTFOLIO
MANAGEMENT IN THE REPUBLIC OF MACEDONIA
Dragica ODZAKLIESKA110 Gordana VITANOVA111
Gordana TRAJKOSKA112
Abstract
The Capital Market takes an important place in every national economy. It has a direct effe-ct on the efficient function of the business entities, on the improvement of the standard of living of the population as well as on the economic growth of the country. The stage of development of the capital market is an indicator of the involvement of the national economy in the contempo-rary world economic processes. The efficient functioning of the capital market is in a close co-rrelation with the function of the portfolio management, which understands establishing a sys-tem of those securities that would maximize the return at a certain risk rate or, it would minimi-ze the risk at a certain return rate. By this an efficient allocation of the capital is provided in other words, its orientation towards those investing projects that at the particular economic mo-ment are most profitable, that is, it provides the highest return rate of the invested capital.
The research of this paper is focused on the capital market development as precondition for efficient managing the securities portfolio. The efficient portfolio management represents a cru-cial factor for dynamic economic growth for every country, especially the countries in transiti-on, because it allows with the available capital to achieve higher efficiency of the investment in the national economy, which leads to an increase of the profitability of the economy itself, as well as to a greater prosperity of the population. This is particularly important for the countries with chronic lack of capital, mostly the countries in transition among which the Republic of Macedonia.
Keywords: capital market, portfolio management
110 Faculty of economics, Prilep, [email protected] 111 Faculty of economics, Prilep, [email protected] 112 Faculty of economics, Prilep, [email protected]

REDETE – ECONOMIC DEVELOPMENT AND ENTEREPRENEURSHIP IN TRANSITION ECONOMIES
241
1. Capital market in Republic of Macedonia
Capital market in the Republic of Macedonia comprises: Macedonian Stock Exchange and the credit market. His development in our country is very slow, despite the fact that the capital market is one of the necessary preconditions for the successful functioning of any market economy. There are many factors that determine the functioning of the capital market in the Republic of Ma-cedonia, of which the most significant are the following:
- the development of the Macedonian Stock Exchange, as a part of the capital market;
- level of savings in the national economy;
- size of the inflow of foreign direct investment in the country;
- the role and importance of investment funds as specialized institutions dealing with portfolio management.
The first few years of functioning of the Macedonian Stock Exchange are characterized by
very low activity and low stock turnover. Starting from 1999, the stock market had a role as a market infrastructure that helps the privatization of the social and state capital, and the consolidation of structures created by privatization. In the last couple of years, efforts have been made in order Macedonian Stock Exchange to become a place where domestic and foreign investors will be able to invest free funds and to carry out the optimization of the structure of their portfolios. This means that the Stock Exchange should be a place where businesses would be able to reach the required capital through the issue of securities. However, non-financial companies in the Republic of Macedonia show a small interest in financing its activities through exchange on the stock market. Thus, in 2011, enterprises had no new issue of shares.On the other side,banking institutions have carried out three new share issues, which in total amount of emissions generated securities accounted for 61.6% (Table 1). For companies there is also indifference for issuing bonds. This is due, primarily, to the lack of sufficient expertise related to the structuring and promoting this type of securities. However, on the primary capital market most active issuers of securities were other financial companies, with seven new share issues, although their value is far lower than the value of the emission of shares of banks. Also the supply of financial instruments in which investors can invest their funds is limited. Thus, the Macedonian Stock Exchange has not yet traded with derivative financial instruments. This is due to the fact that the appearance of these financial instruments is a process that requires highly-developed financial markets.
In this context, we could mention the negative impact of the global financial and economic crisis on the functioning of the Macedonian Stock Exchange.On the stock market in the past few years was seen an influx of foreign institutional investors, in terms of dealing with the effects of the global crisis in their national economies, trying to maintain their liquidity and solvency, were forced to to slow investment in Macedonian market securities, which significantly reflected the liquidity of trading in securities on the Macedonian Stock Exchange.

REDETE – ECONOMIC DEVELOPMENT AND ENTEREPRENEURSHIP IN TRANSITION ECONOMIES
242
Table 1. Value and structure of realized emissions of securities
In million denars Realized emissions securities 2009 2010 2011
Emission value of realized securities 1,423 1,848 1,845 1. Two years continuous bonds 10 0 0 2. Three years continuous bonds 0 0 0 3. Five years continuous bonds 0 0 1,168
4. Denationalization bonds 1,413 1,848 677 Emission value of realized long-term non-state securities 5,395 3,327 3,531
1. Corporate Bonds 0 0 0 2. Shares 5,395 3,327 3,531
Issued from bankes 0 414 3,314 Issued from toher financial institutions 226 17 217 Issued from non financial institutions 5,170 2,897 0
Total value of realized emissions of securities 6,818 5,175 5,376 Source: Securities and Exchange Commission on the website of the Ministry of Finance
and Central Bank of Republic of Macedonia
National savings are in fact the savings of businesses and savings of the population.In Mace-
donian economy, the savings ability of businesses is very low, due primarily to the low level of economic development, lack of use of working facilities, market constraints, etc.. This reduces the supply of capital and constrains the development of the capital market.
Savings of the population is also on a very low level. On the amount of savings a big influence has the size of the realized income, the development of instruments for saving, saving motives and psychological point of view, ie the population's willingness to storage their own saving in separate banking institution. There is still a significant lack of trust in banking institutions, primarily as a result of unresolved problem with the old foreign currency savings which means, failed savings due to the bankruptcy of several institutions.
Weaknesses in the implementation of the supervision of banks and other financial institutions have led to the emergence of pyramid schemes, and that negatively affect the development of the capital market. This is why we need to take some measures and actions to improve the unfa-vorable conditions in the banking system. Some of the measures and actions can be mentioned:
- application of international supervisory standards in the banks;
- reform legislation, which will apply to the protection of the interests of capital and savers in order to boost confidence in the banking system;
- entry of foreign capital from reputable international financial institutions;
- cost savings in the banks;
- reduce interest rates on loans
- introducing new instruments to stimulate savings.
The lack of foreign investors in the Macedonian economy has a limiting influence on the func-
tioning of the capital market. Low interest to invest in the Macedonian economy is due to several reasons, including:
- non defined legislation concerning the protection of the interests of investors;
- high levels of corruption;
- low absorption power of the Macedonian market
- macroeconomic instability;
- rejection of foreign investors by the existing structures of the enterprises that are privatized

REDETE – ECONOMIC DEVELOPMENT AND ENTEREPRENEURSHIP IN TRANSITION ECONOMIES
243
- institutions that are not enough developed to attract foreign direct investment;
- Limited offer of securities.
Within each national economy non-deposit financial institutions (investment funds, insurance
companies, and pension funds) have a great importance for the development of the capital market. The main task of these financial intermediaries is to provide a reliable and suitable disposal of the small savings of the population.
Investment funds represent a significant financial institutions that contribute to the expansion of capital investment alternatives in the market. Very important is their role in relation to the co-llection of funds from small investors who often do not possess sufficient knowledge and financial resources to achieve a satisfactory degree of diversification of their individual portfolio. They are specialized institutions dealing with portfolio management, ie the professional management of the portfolio of securities. Efficient investment of funds from investment companies cares professional manager or a professional team of people that represent the company's portfolio management. In Macedonia the establishment and operation of investment funds is regulated by the Law on Investment Funds. First Equity Act was enacted in 2000 ("Official journal of RM", br.9/2000) and it regulates the conditions for the establishment of investment funds and fund management investment funds, the way of working, terms of choice depository bank, as well as control over their operations. However, despite many years of the existence of a legal framework, the first investment fund in the Republic of Macedonia was established in November 2007. One of the reasons for this was the high core capital required for the establishment of investment funds (open and closed). Therefore, in 2007, some changes and amendments were made to the Law on Investment Funds ("Official Journal of the Republic of Macedonia", br.29/2007). Considering this law, in our country investment fund may be established for pooling funds for investment of do-mestic and / or foreign individuals and legal entities, through public tender or private offering, which are managed by the management company for controlling of the investment funds. With the amendments to the Law on Investment Funds, was made reducing the capital required to establish open and closed investment fund, from EUR 1,000,000 to EUR 500,000. It is also carried out a reducing of the capital required for the establishment Investment Fund Management Company, which is to 100,000 EUR, and for each new investment fund basic principal increases by EUR 50,000.
Another important change that was made by this law, was providing an opportunity to establish a new kind of investment funds, or more precisely, private funds (Private Equity Funds). Co-llecting money in private funds is done through private offering, designed to a predetermined targeted group of investors. In private funds invest well informed investors, such as: banks, pension funds, insurance companies, state, some business entities, etc. In order to establish private fund is not required getting approval from the Securities and Exchange Commission, because if an investor is well informed, then he does not need protection by the state. Securities and Exchange Commission is not responsible for controlling the operations of private funds; also the data for the owners of the documents, payments and disbursements in operating funds are treated as confidential. The private fund may be established for a definite period of time which can not be less than 8 years and the minimum amount of any single investor can not be less than 50,000 Euros in Denars.
Functioning of private investment funds should enable the progress of the economy in the Republic of Macedonia, with restructuring and the entry of new major investment, so that the pattern of private investment funds can become a driving force of the economic development.
To overcome the barriers associated with the operation of investment funds,in Macedonia were made some changes to the Law on Investment Funds. These amendments provide greater protection of the shareholders and greater competition in the capital market. It also reduces the principal amount required to establish open and closed investment funds, from 500,000 EUR to 300,000 EUR.

REDETE – ECONOMIC DEVELOPMENT AND ENTEREPRENEURSHIP IN TRANSITION ECONOMIES
244
2. Current situation of portfolio management in the Republic of Macedonia
The emergence and development of the function of portfolio management in Macedonia should be observed through the prism of the reforms that should be implemented in the financial and economic system of the country, in order to emerge from decades of stagnation and to ensure steady growth and development. Efficient portfolio management is a decisive factor for the dynamic economic development of every country especially of the in countries transition. The portfolio management function involves establishing a system for the selection of those securities that will maximize the yield in a particular rate risk and allows the available capital investment to achieve greater efficiency in the national economy. In this way increases the profitability of the economy itself, as well as the economical well-being of the population. Therefore, in the Republic of Macedonia should provide all the necessary conditions that will enable development of portfolio management function.
One of the most important prerequisites for the effective functioning of portfolio management in the Republic of Macedonia is the emergence and active trading with many financial instruments Macedonian Stock Exchange. However, as previously pointed out, the situation in this aspect is unsatisfied. There is a limited supply of financial instruments on the capital market in the Republic of Macedonia in which investors can invest free funds. More specific, on the Stock Exchange in Macedonia, the options, futures and other derivative financial instruments are not yet traded. But in the developed capital markets they are used as instruments for increasing the performance of the portfolio, or, as instruments for controlling the risk.
For normal functioning of the portfolio management there must be adequate statistical system that provides data, indicators and publications relating to the operation of financial markets. Particularly important are the indicators that are giving the relationship between stock price and earnings per share, the relationship between different types of financial ratios and equity trading volume, maturity terms of individual securities, the current market prices of financial instruments etc. In developed financial markets are published data for beta and alpha coefficients, which are used to measure the performance of the portfolio, as well as delta, gamma and theta coefficients, which are important for estimating the value of derivative financial instruments, but unfortunately it is not the case in our country.
The degree of knowledge of the public about the advantages of the existence and development of portfolio management is crucial for further affirmation of this function. Investors must be aware of the terms and conditions for alternative placement of free funds on the financial markets, which will allow them to maximize yield in a particular rate risk. Employees in the financial institutions have to know the functioning of portfolio management in the market, which will allow them to increase efficiency and to offer different services to its clients. Knowing the function of portfolio management and other sophisticated mechanisms in the financial markets is important for businesses, because they can make good placements of free funds, but also to provide fresh capital that will finance ongoing activity and development.
Finally, we had to mention the importance of the general monetary stability for the development of the function of portfolio management. Investors, when investing the free funds in financial instruments in international financial markets, have to take into account the stability of the national currency, the inflation rate, developed financial infrastructure and legal security. In fact, here we speak about the factors that significantly affect the attraction of foreign direct investment (FDI) and foreign portfolio equity investment (FPPEI) in transition countries. The difference between these two forms of foreign investments is in the concentration of purchased equity and the role that the foreign investor has in the governance of the company.
Portfolio investment refers to transactions with shares and also with other securities of the companies listed on the local stock exchanges. They affect the price rising of the shares of domestic enterprises, improve the liquidity of the domestic financial system and encourage the

REDETE – ECONOMIC DEVELOPMENT AND ENTEREPRENEURSHIP IN TRANSITION ECONOMIES
245
development of national capital markets. However, we should keep in mind that foreign portfolio investment reacts very quickly to market instabilities, so that in their rapid reaction the domestic crisis is becoming deeper. Thus, in the Republic of Macedonia, under the influence of the global financial crisis, the number of portfolio investments has decreased.
3. Conceptions and possibilities for development of the capital market and improve the portfolio
management situation
Considering the limiting factors that affect the capital market in the Republic of Macedonia, in the further presentation we will present the possibilities and the perspectives for development of the capital market and portfolio management function in our country.
1. Macedonian Stock Exchange, for now, has still not play the expected role in the development of the capital market. In fact, a large part of the population still is not aware of the advantages of investing in securities. In order to achieve a satisfactory level of knowledge of the functioning of the capital market, as well as the advantages of using a portfolio management function, it is necessary to include a number of subjects from the educational system. For example, different seminars and special courses can be organized for people who want to invest free funds in financial instruments, but also for employees in the financial institutions who deal with investment in securities, so they can increase efficiency in operations, and to increase the number of services they offer to their customer. Innovative subjects should be introduced in the education system, and undergraduate and postgraduate studies, which will provide knowledge about: the principles of functioning of financial markets; the advantages of investing in securities; and the role of portfolio management for the development of the national economy.
2. It is also important to make changes in the legislation, which will be aimed primarily at stimulating investment portfolio, creating the conditions and possibilities for trading with de-rivative financial instruments. This will significantly enrich the domestic capital market and enable active management of securities portfolios in order to optimize their structure, which me-ans achieving maximum yield at a certain level of risk.
3. Investment funds, as institutions specializing in portfolio management, help small and uninitiated investors actively to engage in transactions in financial markets. They attract the funds of individual investors who, in turn, emit shares, or provide certificates for participation in the fund's financial assets. The income from investment funds is invested in domestic or international financial markets in different financial instruments, creating thereby a diversified investment portfolio. In order to have efficient investment of their funds, the companies should have profe-ssional manager or a professional team that will represent the portfolio management of the com-pany. In Macedonia the establishment and operation of investment funds is regulated by the Law on Investment Funds. First Equity Act was enacted in 2000 ("Official Journal of RM", br.9/2000) and it regulates the conditions for the establishment of investment funds and the management of investment funds, the way of working, terms of choice of a depository bank, and all other ope-rations. Despite many years of the existence of a legal framework, the first investment fund in the Republic of Macedonia was established only in November 2007. One of the reasons for this was the high principal capital required for establishing open and closed investment funds. The amendments to the Low in 2009 reduced the capital required for the establishment of investment funds. However it is necessary, further reducing the principal, in order to encourage the estab-lishment of new investment funds. Also it is important to encourage the trading in securities on international financial markets, because in that way, we can increase the opportunities for investment in derivative financial instruments that, unfortunately, are not yet available in the domestic capital market. This can significantly contribute to increasing the rate of return and minimize risk in the management of portfolio securities. Functioning of investment and private

REDETE – ECONOMIC DEVELOPMENT AND ENTEREPRENEURSHIP IN TRANSITION ECONOMIES
246
funds, is contributing to the expansion of the supply of investment alternatives in the domestic financial market, and greatly encourages the development of portfolio management function. Non existence of competent authority in the Republic of Macedonia, which would have followed and controlled the operation of the authorized management companies with private funds, involves taking increased risks by potential investors in this type of funds. Therefore, it is crucial to set up a Compensation investor’s fund, which would enable the provision of investor claims, when a member is unable to realize its commitments to customers, in accordance with the agreement signed between the two sides.
4. Pension funds also have a significant role in the development and affirmation of the function of portfolio management. .Pension funds represent powerful investors in financial markets, affecting the increase of transactions, ie increase of market liquidity. Through active management of the portfolio of securities, they generate the necessary revenue to pay its obligations to the policy holders. Given the fact that pension funds have conservative investment policy, they avoid high-risk speculative activities; they contribute to the stability of the exchange rates of the securities or financial market stability. One of the main potential risks in the operation of pension funds on medium and on long term, is the possible prolongation of the negative effects of the global economic crisis and further slowing of the economic growth. Pension funds should develop a strategy that will be focused on investing in financial instruments with a lower level of risk, and to protect against adverse movements in financial markets.
5. Developing of the portfolio management function imposes the need for reform of the statistical system, which would be directed mainly towards collecting new data related to the operation of securities, and the movement of prices of all financial instruments, the introduction of innovative methods for data processing, the establishment of institutions that will carry out the collection, processing and publication of these data, as well as the affirmation of new indicators and publications. Statistical system should provide the information that investors will use when making decisions related to the optimization of the structure of their portfolios.
Globalization of the financial system imposes foreign exchange of statistics data related to the operation of domestic and international financial markets, which will enable better information and easier access to foreign portfolio investors in the domestic financial markets. This way ensures stability of the economic flows and more rapid development of the national economy.
Conclusion
Portfolio management is a function of management with investment securities that is needed for the banks, savings banks, insurance companies, pension funds, broker-dealer companies, investment funds and individual investors who are interested to invest free funds in securities. Promotion and development of the portfolio management function is extremely important for the functioning of each national economy, because it allows the available capital to achieve greater efficiency investments.
Basic prerequisite for effective management of the portfolio of securities is developed capital market and an active market with a large number of securities. Unfortunately, on Macedonian Stock Exchange there is a limited supply of financial instruments in which investors can invest free funds. Therefore, it is important to increase knowledge of business entities for portfolio management and other sophisticated financial market mechanisms. In that way they can, in a very simple way, provide additional capital to finance their investment projects or to maintain their current liquidity. This would significantly increase the supply of securities in the financial market. Also it is needed to protect the fundamental rights of shareholders in all privatized enterprises through specific institutional decisions. However, despite these measures, the long term development of the securities market and portfolio management function will largely depend on economic growth and profitability of Macedonian businesses.

REDETE – ECONOMIC DEVELOPMENT AND ENTEREPRENEURSHIP IN TRANSITION ECONOMIES
247
Reference list
1. Chance D.M. (2004). An Introduction to Derivates&Risk Management, Thomson, South-Western. Ohio
2. Gitman L.J., Joehnk J. (2006). Fundamentals of Investing, Pearson Addison Westley, New York
3. Mishkin S. F., Eakins G. S. (2006). Financial Markets&Institutions, Pearson Addison Westley. New York
4. Reilly F. K. and Brown K. C. (2000). Investment Analysis and Portfolio Management, The Dryden Press. New York
5. Vitanova G. (2003). Financial market and Institution. Faculty of Economics. Prilep 6. Šoškić D.B. (2010). Hartije od vrednosti: upravljanje portfolijom i investicioni fondovi,
Ekonomski fakultet. Beograd 7. www.finance.gov.mk (accessed 11.09.2012) 8. www.nbrm.gov.mk (accessed 11.09.2012) 9. www.mse.org.mk (accessed 11.09.2012) 10. www.sec.gov.mk (accessed 11.09.2012)

REDETE – ECONOMIC DEVELOPMENT AND ENTEREPRENEURSHIP IN TRANSITION ECONOMIES
248
PARTNERING UNIVERSITIES AND COMPANIES IN RUSSIA: EFFECTS OF NEW GOVERNMENT INITIATIVE
Irina DEZHINA113
Yuri SIMACHEV114
Abstract
The paper presents the results of 2-year survey conducted in 2011-2012 among Russian uni-versities and companies who jointly implement R&D projects aimed at development high-tech manufacturing. The joint projects represent a new government instrument to stimulate the deve-lopment of linkages between universities and companies by giving matching grants for R&D to companies with obligation to order R&D to university-partner.
The objectives of the survey included analysis of motivation for cooperation both from side of universities and companies; primary effects and side-effects of such initiative; changes that may be introduced to the government regulations concerning matching grants.
Total 38 teams were surveyed. Our findings show that major motivations from side of uni-versities were possibility to get new and valuable research tasks from companies, selection of most competitive teams of researchers who may work with companies, and strengthening repu-tation in business environment. Companies were interested in getting government funding in or-der to solve their technological problems; to strengthen, due cooperation with universities, their research capacity, and to use modern research infrastructure located at universities.
The analysis allowed identification of the major effects of the matching grants mechanism. They included: strengthening of university orientation towards solving practical tasks which are of interest to business; institutionalization of relations between universities and business in the sphere of innovation activity; broadening of research cooperation and the formation of resea-rch consortiums; harmonization of research and educational tasks in universities, and orienta-tion of the parties towards continuation of cooperation in the innovation sphere.
Keywords: STI Policy Evaluation, Public R&D Subsidies, Matching Grants, University-Industry Linkages, Behavioural Additionality, Innovations
JEL classification: D22, H25, I23, O31
113 Ph.D., Head of Division, Institute of World Economy and International Relations, Russian Academy of Sciences, e-mail:
[email protected] 114 Ph.D., Deputy Director-General, Interdepartmental Analytical Center, e-mail: [email protected] The paper contains some preliminary results of the project on the analysis of Russian enterprises’ innovation
activities and government policy towards their support, which has been performed by the Interdepartmental Analytical Center for the Ministry of Education and Science of the Russian Federation. The authors are grateful to Michail Kuzyk, Head of Division at Interdepartmental Analytical Center, for his comments during discussions of the survey methodology and paper draft.

REDETE – ECONOMIC DEVELOPMENT AND ENTEREPRENEURSHIP IN TRANSITION ECONOMIES
249
1. Fundamental principles for the origin of R&D subsidies
In past decades radical changes in conditions for innovative activity have occurred. Governments all over the world substantially transformed their approach to innovations . With globalization and growing international competition, this policy towards innovations has shifted from being neutral to more active and direct state stimulation of the innovation processes.
There are wide variety of instruments in support of innovations that have been applied in various countries. These include tax exemptions, target credits, state subsidies, etc. Subsidies to companies for R&D occupy a special place in the list of instruments.
At the beginning of 1990s, the neo-classical theory of growth was widened in a number of research papers (see Romer, 1990; Segerstrom et al., 1990; Grossman, Helpman, 1991; Aghion, Howitt, 1992) which illustrated the fact that subsidies for R&D stimulate the companies to channel more resources for research and development resulting in a positive effect on economic growth. Later, a number of theoretical models were developed (see Howitt, 1999; Segerstrom, 2000) to evaluate the effect of subsidies on R&D in the long-run rate of economic growth.
Teubal (1996, 2002) pointed out that the successful penetration and dissemination of R&D in the new industrial countries was based on intensive group training (“learning by others”) and multi-discipline training with the positive results of such learning cumulative through time. Exactly neutral and mass support of R&D at its initial stages makes it possible in the future to identify real market slumps on the basis of sector specifics and to switch to a more selective policy to stimulate innovations.
Within the framework of the evolution approach Bach and Mats (2005) believe that learning failures are basic and interpret them as a limit or constrain to the use of the cognitive capacity of agents and groups of agents. In this connection they draw attention to such problems as lack of coordination between agents, poor development of institutions for the joint development and dissemination of knowledge. This also includes poor tuning and de-synchronization of institu-tional changes with the current technological changes, codification complexity (lack of standards and platforms), barriers to absorption, etc. It is also noted that support for corporate R&D should be treated, on the one hand, as a mechanism mitigating risks and sharing expenditures, while on the other as a method for developing network interaction and the creation of new collective knowledge.
Since the middle of the 1990s, the practice of public subsidies to companies for R&D began to spread out to the new industrial countries and then to the developed countries. During the last two decades, the R&D subsidies to companies remain an important instrument of state innovation policy of the EU countries, Israel, and the USA. To a substantial degree this provided a broad ba-sis for empirical studies of effects enjoyed by companies from R&D subsidies and also for com-paring their results with other instruments for stimulating innovations.
2. Effects of public subsidies for R&D on companies: evidence from abroad
The effectiveness and results of various instruments for support of R&D investments is one of the key questions in government innovation policy, particularly in the situation of growing bud-get limitations in many countries.
Data for EU countries show that in comparison with tax exemptions public financing of R&D at business sector results in more long-term effects (Guellec, y Van Pottlesberghe, 2003). The advantage of R&D subsidies is also associated with their potential in “compensating” for compa-nies market uncertainty. This was empirically confirmed by Czarnitzki and Toole (2007) on the basis of data for production firms in Germany. Therefore if tax exemptions promote primarily the

REDETE – ECONOMIC DEVELOPMENT AND ENTEREPRENEURSHIP IN TRANSITION ECONOMIES
250
expansion of existing innovation projects, subsidies are directed at the launching new and more long-term projects. Berube and Mohnen (2007) pointed out that the firms receiving grants are more often innovators of an international level and are more successful in commercialization as compared with recipients of only tax exemptions.
Matching grants have other advantages in comparison with other financial instruments to support R&D at companies. They are extremely important for startups and for firms that have launched innovation programs (Hall, Maffioli, 2008). These grants lower the start barrier, promote cooperation and simplify access to outside knowledge.
Hall and Maffioli (2008) systematized the results of evaluating grant programs in Argentina, Brazil, Chile, and Panama and noted that in all these countries there were visible positive effects in raising innovation activity of companies, in particular in boosting corporate expenses for R&D. The participation of firms in these programs also stimulated positive behavioral changes – a much more active approach by the owners of these firms to innovations and broadening of foreign cooperation. However with regards to improvement of outcome indicators, the results were much more modest. The authors pointed out that possibly this was due to the short period of time. Nevertheless, no statistically reliable empirical data were obtained to testify any positive impact on the number of patents or the sale of new products. With regards to improvement of the overall company competitiveness indicators of – such as larger market share, higher productivity – they turned to be indefinite. From one hand there was a positive correlation with the company growth, but from the other - no tangible improvement in productivity.
With the widening practice of R&D subsidies to companies, including those based on “inter-country transfer” and accumulating of subsequent experience, there were identified new problems and risks associated with the application of such instruments. A number of researchers – David, Hall, Toole, 2000; Klette, Moen, Griliches, 2000 pointed out that the effectiveness of public support to company R&D could stimulate rent seekers behavior among economic agents with the possible substitution of public funds by private resources. In the course of analysis of the Small Business Innovation Research (SBIR) program effectiveness, Wallsten (2000) discovered a similar substitution effect (it was more evident with the growing number of company personnel). Wallsten noted that the low demonstrative impact of subsidies may limit the multiplicative effect of spent resources.
One of the issues discussed was the influence of subsidies on boosting company innovation activities (growing investments in R&D). But that not always leads to improving company end results, such as sales of new products, its market share, and labour productivity. It was assumed, for instance, that additional company resources could be used to raise wages of researchers without any changes in the end result of their activity (David et al. , 2000). Besides, Catozzella and Vivarelli (2011) have discovered that with state support R&D expenditures of the companies are higher, however the effectiveness of these expenses is lower (with regards to product innovations).
The effects from R&D subsidies to companies are being actively discussed in Latin America, the newly industrialized countries, and the EU countries --Germany, Belgium, Italy, Finland, Austria (see, e.g.: Aerts, Czarnitzki, 2004; Czarnitzki, Hussinger, 2004; Czarnitzki, Licht, 2006; Czarnitzki et al., 2007; Takalo et al.,2008; Wanzenbock et al., 2011; Czarnitzki, Bento, 2011).
The systematic study conducted by Guellec and v Van Pottlesberghe (2003) occupies a special place in research aimed at evaluating the influence of R&D subsidies on companies in EU countries. The study examined the effect of state financing of company R&D expenses in 17 EU countries for the 20-year period. The researchers also discovered a positive influence of subsidies on R&D financing from side of business. It was noted that target programs for financing companies’ R&D ensured better perception and the use by these companies of knowledge generated by the universities.
Cerulli and Poti (2010) examined the influence of subsidies on Italian firms and found out their overall positive influence – both at the stage of increasing R&D financing and the end result – in form of growing number of patents. According to their assessments due to subsidies the additional

REDETE – ECONOMIC DEVELOPMENT AND ENTEREPRENEURSHIP IN TRANSITION ECONOMIES
251
growth of expenditures on R&D was 40% while the number of patents increased by 3.5%. Mean-while, the authors identified substantial differences between the two groups of firms: the first group demonstrated positive changes while the second one was associated with the substitution of state resources for private finances. The first group was moiré oriented on obtaining patents and increasing its fixed capital. This group included a big number of large firms but at the same time it shared features of the second group in terms of R&D intensity, structure of expenses, and other indicators of corporate finances. The authors concluded that such results may be explained by two factors. First, larger firms are able to rely on the effect of size, namely they have larger potential for specialization, for entry into networks, for absorption of outside knowledge, for acquiring credits. Second, larger firms have more extended planning horizon, their strategy is more oriented at long-term capitalization. Small Italian firms constitute the traditional family property model combined with the fear to lose strategic control; finally, their owners give priority to current earnings.
Priority in research was given not that much to numerical effects of company activities, as to changes in their behavioral pattern with regard to innovations. On the basis of studies of 1,200 Austrian firms conducted in 2003, Falk (2006) undertook an integrated analysis of effects with emphasis on changes in their behavior. It was noted that large firms demonstrate more often positive changes in their behavior. With continued support there is greater probability for such changes due to their cumulative nature. Wanzenbock, Scherngell, Manfred (2011), studied the activities of 155 firms in Austria and received somewhat different results related to the nature of firms that are ready for a change. The conclusion is as follows: young, small, and technologically specialized firms are much more ready to change their behavior than companies with larger resources for R&D. In this, authors’ conclusions are close to those made by Hall and Maffioli (2008).
In terms of assessing possible demonstration effects it would be interesting to note that in his studies Falk (2006) identified some positive effects already at the stage when firm applies for subsidy (even if later the application is rejected). For some firms the very participation in the competition serves as additional motivation to pay more attention to relevant issues.
The highly original study conducted by Aschhoff (2009) deserve special mentioning. It was based on data covering German firms during the period from 1994 to 2006 and was assessing the influence of grants on supporting of research projects at companies (DPF grants - Direct R&D Project Funding grants). It was shown that the effect of subsidies depends on their size – small grants are less effective. The conclusion was also made that companies with a history of state support (grant recipients) are more inclined to increase their private investments in R&D. However there were no tangible signs that firms with regular public support are less efficient. Aschhoff assumed that this may be associated with the planning effect, i.e. firms may take risk while being aware (based on its previous experience) that the support will be provided later on.
Clarysse, Wright, Mustar (2009) studied the factors which determine the essence of behavio-ral patterns on the basis of a poll survey of 194 companies representatives that had received subsidies within the framework of the IVVT program (Belgium, 2001-2004) and 84 companies of the control group (that conduct innovation activity but did not received subsidies). The result underlined the importance of the learning effects and identified the fact that inter-organizational interaction stimulated behavioral changes. At the same time the authors ahve discovered that the learning effect becomes less important with the growing number of projects realized by the company with the support of the federal money. This somewhat contradicts to the conclusions of other experts who generally positively assessed the influence of repeated support procedures (Falk, 2006; Aschhoff, 2009).
Overall, matching grants are being considered by experts of international development institutions (Goldberg et al.,2011) as one of the best practices in government innovation policy which deserves special attention and dissemination in countries with an underdeveloped innovation system.

REDETE – ECONOMIC DEVELOPMENT AND ENTEREPRENEURSHIP IN TRANSITION ECONOMIES
252
What is noticeable is the mostly positive attitude of experts and consultants towards R&D subsidies to companies which is based on numerous studies. At the same time it is pretty uncertain that this given instrument is “universally positive. On the basis of research papers presented in review on the subject of subsidies and their impact on corporate R&D (Alonso-Borrego et al., 2012) it appears that out of the 76 empirical micro-level studies 48 cases confirmed the hypothesis about attracting additional resources for R&D. But in 15 cases there were effects of substitution of public funds by private investments. In 13 cases there were no clear effects. If one takes in consideration not only micro-level studies but also research based on sectors and branches of industry, then 71 studies confirm positive effect of R&D expenses, 23 studies identify the substitution effect, and 24 studies show no effect at all. Thus we see a broad range of studies which have failed to identify even such a basic effect as growing R&D expenses as a result of subsidies.
Most likely, these results are highly dependent on local conditions in each country concerned, on the exact design of a mechanism to subsidize corporate R&D. There are remaining serious problems regarding methodology of assessment of state support effects. There still remain many aspects related to influence of matching grants that require deep studies.
3. Mechanism of matching grants in Russia
The last five years Russian innovation policy was sufficiently developing. During the period of 2006 – 2008, with Russia’s growing government resources, the goal was set to move towards innovation path of development. Judging from the actual measures undertaken, there was a shift towards the model of stimulating a demand for innovations. At that time a number of important tax exemption acts were adopted for business, major financial development institutions were set up, and active steps taken to “build up” the innovation infrastructure (see, eg.: Zasimova et al., 2008; Simachev et al., 2012).
During the acute phase of the crisis (2008 – 2009), the task of stimulating innovation lost its priority and the budget allocations plus individual instruments of the innovation policy were partly “retargeted” to compensate losses caused by the crisis (Simachev et al., 2009). However, it was at this period that there occurred a federal level “re-evaluation” of the role of innovations in terms of ensuring competitiveness of Russian economy. As a result the subject of modernization has been finally rooted as one of the main declared government priorities.
Starting from the second half of 2009, there was a re-activation of the innovation policy and not only within earlier implemented directions (tax stimulation of innovation, building up of the system of financial development institutions ) but also aimed at initiation of basically new measures (the Skolkovo innovation city, technological platforms, “push to innovations” applied to major state-owned companies, and the mechanism of matching grants). A specific feature of the Russian innovation policy during the post-crisis period was the growing attention to cooperation among the major actors of the innovation process, the development of networks and partnerships within the innovation sphere, and the development of research activity at the universities.
In 2010 in Russian government innovation policy there appeared a radically new instrument for stimulating linkages among various participants of the innovation process. On April 9, 2010, the Government of the Russian Federation adopted decree # 218 “On measures of state support for developing cooperation between Russian institutions of higher education and the organizations which implement integrated projects aimed at creating high technology production”. This decree identified the mechanism of competition-based subsidies to production businesses with the aim of financing integrated projects for the organization of high tech production which implemented jointly by production enterprises and higher education institutes (universities).
The Russian mechanism of matching grants incorporates the following parameters: - A competition based support from the federal budget – subsidy recipients are selected on
the basis of an open competition;

REDETE – ECONOMIC DEVELOPMENT AND ENTEREPRENEURSHIP IN TRANSITION ECONOMIES
253
- The commercial nature of projects - realization of an integrated project aimed at creating a high tech production is supported;
- Support of partnerships and motivation for companies’ demand on R&D. The project is carried out jointly by the company and university. The recipient of the subsidy is the production enterprise which uses the funds to finance R&D conducted by the university within the framework of the joint project;
- A substantial research component in the project. The subsidy is provided for a period of one to three years in the amount of 100 million rubles annually with the aim of financing R&D conducted by the Russian higher education institute;
- Co-financing and distribution of risks. The production enterprise should invest into the project amount of money equal to at least 100% of the subsidy. The organization of a new high tech production facility is financed from the own company’s resources and at least 20% of this sum shall be used for R&D;
- Expected duration of the project and its monitoring. The production enterprise shall provide information on high tech products developed under the project during at least 5 years after the closure of the subsidy contract.
By December 1, 2011, a total of 95 companies and 87 higher education institutes participated in projects aimed at creating of high tech production.
The mechanism for providing subsidies under Government decree # 218 is the first instrument in Russia conceptually similar to the “matching grants” mechanism which is used to stimulate innovation development in a number of foreign countries. Although there are many basic similarities with foreign practice, there are some insignificant specifics of the Russian mechanism with regard to “matching grants”:
- Only higher education institutes are allowed to be R&D partners for business in order to obtain government subsidies;
- Emphasis is not made on supporting projects from private companies;
- No provision to support consortia of enterprises;
- No regular (permanent) procedure for the receipt, evaluation, and support of joint projects by business and universities;
- There exist a number of barriers for participation of small and rapidly growing companies in the formation of new partnerships.
Although “matching grants” usually constitute a mechanism aimed at stimulating business
demand for innovation and R&D results, in case of Russia it has developed to a considerable extent into an instrument urging on institutes to cooperation with business. In fact, this mechanism is seen by the government as a method of “teaching” and adapting institutes to the R&D demand from the side of business.
4. Methodology and basic hypotheses
The research results presented in this paper are based on informal and problem-focused in-terviews with representatives of companies and universities implementing joint projects on the basis of matching grants.
The use of company and university representatives as initial data sources seems very important when the accent is given to evaluation of behavioral changes. First, in such case there is less probability of encountering a respondent that is on guard since behavioural additionality is outside of the sphere of government monitored results. Second, behavioural effects are basically open and
REDETE – ECONOMIC DEVELOPMENT AND ENTEREPRENEURSHIP IN TRANSITION ECONOMIES
254
hence it would not be rational to use close-ended questions and a formalized questionnaires. Third, behavioural additionalities are poorly digitalized and require qualitative evaluations, the latter naturally vary depending on which side of the fence is the respondent , the degree to which the respondent is involved in the corresponding processes.
The preliminary results of the study are based on the analyses of interviews conducted in 2011-2012 -- 38 detailed interviews covering 28 projects which received federal support in 2010 within the mechanism of matching grants (27 interviews with representatives of 15 institutes and 11 interviews with representatives of 8 companies).
The main directions of study of effects of the mechanism of matching grants were based on the following questions:
How did the “design” (the normative framework) of matching grants mechanism affect the composition of the participants in the project ? What were the main “anti-motivations” and constraints for participation? Who was the main initiator for the subsidy application ?
What were the main initial motivations of the parties (the universities and companies) for participation in realizing projects within the framework of the matching grants mechanism?
How can we evaluate the changing importance of various problems in the process of adaptation of the parties in the process of project implementation? What problems are temporary and which ones are of a long-term nature?
What are the main effects (both positive and negative) of participation in projects ? What are the conclusions made by its participants and how do they assess the prospects for further cooperation ?
What can be done in order to improve the matching grants mechanism and to increase its efficiency, and what recommendations may be made regarding application of this mechanism in the future?
The following preliminary assumptions were made for further studies and clarification: 1. It is the universities who will come out with initiative for subsidy application since they
are interested in receiving substantial budget money. Within the framework of the projects it is business that is mostly interested in the engineering services provided by the universities.
2. In the course of the projects there appear both positive and negative behavioral effects within the companies and the universities involved in the project. The most conflict generating factor with substantial behavioural additionalities is the transition of control over the research results from the government to the company-recipient of the subsidy.
3. The interaction between the universities and companies in the course of realization of joint projects will display many aspects due to the inter-influence of scientific and educational processes. The subsidies will have a most substantial effect on the univer-sities since the latter have better facilities for accumulating results and demonstrating effects.
5. The results of the analysis
5.1. Motivations of companies and universities
An analysis of responses to direct and indirect questions about the stimulus for participation in the competition for matching grants reveals a broad spectrum of reasons, both from universities and the companies.
Most of university representatives pointed out that this is the first measure due to which the university could receive substantial resources for realization of a major research project with

REDETE – ECONOMIC DEVELOPMENT AND ENTEREPRENEURSHIP IN TRANSITION ECONOMIES
255
serious results. Despite the fact that many universities have sufficient financial resources they are nevertheless limited financially in conducting R&D.
The second important aspect was receiving practical tasks from business, identifying necessary directions for the development of research and engineering competences, the selection of the most competitive research groups. The representatives of a number of universities also pointed out that participation in such projects strengthened reputation of the university among potential business clients.
Third – the projects became a measure to set or restore cooperation with business. Fourth – considerable number of university representatives see the matching grants mechani-
sm more as a method of support for their research activities. The competitions were also viewed as one of the opportunities to acquire federal support for university development.
As far as companies’ motivation is concerned, they are, according to our assessments, associa-ted with the following factors. Due to the fact that most companies are not ready to invest into R&D, particularly at the pre-competitive stage, they are more interested in dealing with techno-logical and engineering tasks when it comes to identifying the content of the project.
A successful company is mainly motivated by the perspective to acquire new technology whi-ch would increase company’s competitiveness, broaden the volume of sales and will allow entering new markets.
Smaller companies are highly motivated by prospects for expanding their research and engine-ering personnel. In addition, for business it is important to use modern technological equipment within the framework of the project. In a number of universities there were major improvements not only in terms of updating research equipment but also of considerable development their technological and testing facilities.
According to our observations big companies were less motivated by the prospects to get additional resources for innovation activity, while it was a major factor for small firms.
5.2. Effects of the matching grants mechanism
We do not examine here direct effects which are associated with the targeted project results (e.g. growing R&D expenses by companies, additional volumes of innovation product, etc.). We believe it is more important to evaluate the external, institutional effects brought by the matching grants mechanism.
The positive effect of matching grants associated with the orientation of universities on R&D demand from business has been cited by many university representatives at various levels of authority. For university presidents this is an important factor from the point of view of market demand for university services. It also means diversification of institutional activity and for the university researchers - an opportunity to be involved in implementation of practical tasks. The real interest displayed by business in a number of projects appears as a major result of matching grants mechanism.
Here are some quotations derived from interviews with university representatives: “… I see a sincere interest of company when I communicate with businessmen. I feel whether
people have genuine interest or not. In one project this interest is pronounced – these people have shining eyes and they want to know what the university can do for them within the framework of the project”;
“…. They got more deeply involved in the projects which promise real product. This entails greater responsibility and higher quality … This confirms that working for the sake of making a product calls for special responsibility. There should be high standards set for the project implementation.”
Participation in joint projects also allowed universities to identify the most productive researchers. In a number of cases this were the companies who selected university researchers for

REDETE – ECONOMIC DEVELOPMENT AND ENTEREPRENEURSHIP IN TRANSITION ECONOMIES
256
the joint project and for this reason the matching grants mechanism gave an opportunity to support the best university specialists.
In a number of cases this mechanism opened the way to institutionalizing partner relations between universities and business. In one of the interviews a university representative pointed out that in the past the partner companies who needed a specific work to be done preferred to sign contracts directly with the researchers. This form of relations inevitably resulted in conflict of interests.
The realization of projects stimulated the formation of joint research groups, to the pooling of their potentials. “Does the university structure allow realization of this project? It does, because the partner university constitutes a conglomerate of its research department and the company. Accordingly, there is no shortage of personnel. If the project would involve only university researchers, then the deficit of the personnel would occur since there would be no engineers and designers involved in the project. They are all in the company-recipient of the subsidy”.
An important effect is that matching grants mechanism has stimulated the process of institutionalizing research groups : “One of the ultimate tasks following the completion of the project is to retain some kind of professional group”, “we would like these ties to develop into some kind of laboratory that would be capable to perform interesting research tasks”, “ since this is a real project we see a personnel mix and the involvement of young specialists”, “there came forth the idea of setting up a center of competence”.
In the course of their contacts with universities, some of the companies activated their interaction with other higher education institutes as well. In a number of cases the practical tasks of the projects could not be implemented only by the partner universities. This was the prerequisite for expanding the number of project participants and the formation of research consortiums – “An important result was that in the course of the project implementation the company-recipient of the subsidy created a network of partner universities. Since this is a principally new task it turned out that it was necessary to recruit specialists from various institutes all over the country. The partner university did not have all the required specialists”.
The realization of a number of projects stimulated harmonization and enrichment of research and educational activity: at first, several projects were initiated by companies which personnel used to study in respective university. Later, the university was able to attract students to research activities within the framework of the project with the ultimate goal of problem-oriented development of their competence and employment at the partner company. The representatives of many universities expressed their interest in further employment of their graduates in companies, and this was one of the motivations to take part in the project.
“A positive factor for the university - additional financing which helps to develop R&D, allows setting tasks to graduate and MA degree students. Later, these researchers will be able to get a job at the enterprise”.
“What do we expect within the next 2-3 years? The launching of a technological line at the plant which will be the source of further activity (training of students and promotion of R&D, adaptation of production)”.
The companies also displayed interest in the development of lecture courses for students and even new directions for their training. “University science suffers from huge financial limitations. The Government fails to resolve this problem and no one knows what is to be taught and what will be the cost of such education. For this very reason the company-recipient of subsidy thinks over starting a lecture course on logics at the physics faculty of the partner university”.
In conclusion it may be pointed out that most of the respondents positively assessed the mechanism of matching grants. They stated that this instrument stimulated interaction between universities and companies. Direct contacts with business are much more interesting and productive for future development. This may be considered as one of the most important positive effects. Of no less importance is the fact that the matching grants encouraged universities to deal

REDETE – ECONOMIC DEVELOPMENT AND ENTEREPRENEURSHIP IN TRANSITION ECONOMIES
257
with industry and drew attention of business to possible partnership with universities in the inno-vation sphere.
6. Discussion and suggestions
First. On the basis of analysis the following major effects of the matching grants mechanism may be identified:
- Strengthening of university orientation towards solving practical tasks which are of interest to business ;
- institutionalization of relations between universities and business in the sphere of innova-tion activity;
- broadening of research cooperation and the formation of consortiums ;
- harmonization of research and educational tasks ;
- orientation of the parties towards continuation of cooperation in the innovation sphere.
Second. In the course of matching grants mechanism application, companies and universities
are in a positive conflict with each other. Overall we see positive attitudes to possible cooperation between companies and universities. At the same time the following problems may become sharper:
- distribution of intellectual property rights and its commercialization;
- co-ordination of various interests within the universities in planning R&D and comerciali-zation of research product.
Third. The matching grants mechanism turned to be more important for the development of
applied and engineering skills at the universities. It is important for this instrument to be as close as possible to the actual demand from companies, but at the same time it should inspire business to invest more in R&D.
It is important to accentuate the inter-relation and mutual consolidation of various instruments directed at the development of linkages between universities and companies, at the development of university infrastructure, and the commercialization of R&D results.
Fourth. It is essential to ease access to matching grants mechanism so that to stimulate participation of small and rapidly growing companies. It would be worthwhile to examine the possibility of creation of companies’ consortia under matching grants. Such consortia may be established, for example, in innovative clusters.
Fifth. This instrument is intended for a demonstration effect. In order to develop stable and positive developments within the innovation sphere it must be applied during a longer period of time. Therefore it is important to stimulate the “transition” of this instrument to the category of permanent measures of government support of innovation activity. It is essential to examine the possibility of applying the mechanism of matching grants to the activity of selected government financial institutes for development with the goal to implement a continuous cycle of search, evaluation, and selection of innovative projects.
The matching grants mechanism is extremely valuable for its indirect, accompanying effects. Evaluation of the results of its implementation should be constructed having in mind this factor, allowing in particular measuring qualitative changes in behavioral additionality.

REDETE – ECONOMIC DEVELOPMENT AND ENTEREPRENEURSHIP IN TRANSITION ECONOMIES
258
Reference list
1. Aghion, P., Howitt, P. (1992). A Model of Growth Through Creative Destruction. Econome-trica, 60, 323-351.
2. Alonso-Borrego, C., Galan-Zazo, G., Forcadell, F., Zuniga-Vicente, A. (2012). Assessing the effect of public subsidies on firm R&D investment : a survey. Economics Working Papers 12-15, Universidad Carlos III, Departamento de Economia.
3. Aschhoff, B. (2009). The effect of subsidies on R&D investment and success: do subsidy history and size matter? ZEW Discussion Paper 09-032, Mannheim.
4. Bach, L., Mats, M. (2005). From economic foundations to S&T policy tools: a comparative analysis of the dominant paradigms. In M. Matt & P. Llerena (eds), Innovation Policy in a Knowledge-Based Economy: Theory and Practice. Springer Verlag
5. Berube, C., Mohnen, M. (2007). Are Firms That Received R&D Subsidies More Innovative? CIRANO Working Paper 2007s-13, CIRANO.
6. Catozzella, A., Vivarelli, M. (2011). Assessing the Impact of Public Support on Innovative Productivity. DISCE Working Paper 77. Universita Cattolica del Sacro Cuore, Dipartimenti e Istituti di Scienze Economiche.
7. Cerulli, G., Poti, B. (2010), The differential impact of privately and publicly funded R&D on R&D investment and innovation: the Italian case. Working Papers 10, Doctoral School of Economics, Sapienza University of Rome.
8. Clarysse, B., Wright, M., Mustar, P. (2009). Behavioural additionality of R&D subsidies: A learning perspective. Research Policy, 38, 1517-1533.
9. Czarnitzki, D., Hussinger, K. (2004). The Link between R&D Subsidies, R&D Spending and Technological Performance. ZEW Discussion Paper 04-56, Mannheim.
10. Czarnitzki, D., Licht, G. (2006). Additionality of Public R&D Grants in a Transition Economy: The Case of Eastern Germany. Economics of Transition, 14 (1), 101–131.
11. Czarnitzki, D., Toole, A.A. (2007). Business R&D and the interplay of R&D subsidies and product market uncertainty. Review of Industrial Organization 31(3), 169–181.
12. Czarnitzki, D., Ebersberger, B., Fier, A. (2007). The Relationship between R&D Collaboration, Subsidies and R&D performance: Empirical Evidence from Finland and Germany. Journal of Applied Econometrics, 22 (7), 1347–1366.
13. Czarnitzki, D., Bento, C. (2011). Innovation Subsidies: Does the Funding Source Matter for Innovation Intensity and Performance? Empirical Evidence from Germany. ZEW Discussion Paper 11-053, Mannheim.
14. David, P., Hall, B., Toole, A. (2000). Is Public R&D a Complement or Substitute for Private R&D? A Review of the Econometric Evidence. Research Policy, 29, 497-529.
15. Falk, R. (2006). Measuring the Effects of Public Support Schemes on Firms’ Innovation Activities. WIFO Working Paper, Austrian Institute of Economic Research, Vienna.
16. Goldberg, I., Gobbard, G., Racin, J. (2011). Igniting innovation: rethinking the role of government in emerging Europe and Central Asia. World Bank, Washington DC.
17. Grossman, G., Helpman, E. (1991). Quality Ladders in the Theory of Growth. Review of Economic Studies, 58, 43-61.
18. Guellec, D., y Van Pottlesberghe, B. (2003). The impact of public R&D expenditure on business R&D. Economics of Innovation and New Technologies, 12 (3), 225-244.
19. Hall, B.H., Maffiolly A. (2008). Evaluating the Impact of Technology Development Funds in Emerging Economies: Evidence form Latin America. NBER Working Paper 13835, National Bureau of Economic Research, Inc.
20. Howitt, P. (1999). Steady Endogenous Growth with Population and R&D Inputs Growing. Journal of Political Economy, 107, 715-730.
21. Klette, T., Moen, J., Griliches, Z. (2000). Do Subsidies to Commercial R&D Reduce Market Failures? Micro Econometric Evaluation Studies. Research Policy, 29, 471-495.
22. Romer, P. (1990). Endogenous Technological Change. Journal of Political Economy, 98, S71-S102.

REDETE – ECONOMIC DEVELOPMENT AND ENTEREPRENEURSHIP IN TRANSITION ECONOMIES
259
23. Segerstrom, P., Anant, T., Dinopoulos, E. (1990). A Schumpeterian Model of the Product Life Cycle. American Economic Review, 80, 1077-1092.
24. Segerstrom, P. (2000). The Long-Run Growth Effects of R&D Subsidies. Journal of Economic Growth, 5, 277-305.
25. Simachev, Yu., Yakovlev, A., Kuznetsov, B., Gorst, M., Daniltsev, A., Kuzyk, M., Smirnov, S. (2009). An Assessment of Policy Measures to Support Russia's Real Economy. Working Papers of the Research Centre for East European Studies 102, Bremen.
26. Simachev, Yu., Kuzyk, M., Ivanov, D. (2012). Russian development institutions: The rise and main challenges on the path towards improvement of their performance. MPRA Paper 40851.
27. Takalo, T., Tanayama, T., Toivanen, O. (2008). Evaluating innovation policy: a structural treatment effect model of R&D subsidies. Research Discussion Papers 7/2008, Bank of Finland.
28. Teubal, M. (1996). R&D and technology policy in NICs as learning processes. World Development, 24 (3), 449-460.
29. Teubal, M. (2002). What is the systems perspective to Innovation and Technology Policy (ITP) and how can we apply it to developing and newly industrialized economies? Journal of Evolutionary Economics, 12 (1), 233-257.
30. Zasimova, L., Kuznetsov, B., Kuzyk, M., Simachev, Yu., Chulok, A. (2008). Problemy Perekhoda Promyshlennosti na Put’ Innovatsionnogo Razvitiya (Problems of Switching Industry to Innovation-Driven Path). Scientific Reports: Independent Economic Analysis Series, Paper No. 201. – Moscow: MONF (Moskovskiy Obshchestvennyy Nauchnyy Fond).
31. Wallsten, S. (2000). The Effects of Government-Industry R&D Programs on Private R&D: The Case of the Small Business Innovation Research Program. RAND Journal of Economics, 31, 82-100.
32. Wanzenbock, I., Scherngell, T., Manfred, F. (2011). How do distinct firm characteristics affect behavioural additionalities of public R&D subsidies? Empirical evidence from a binary regression analysis. ERSA conference paper, European Regional Science Association.

REDETE – ECONOMIC DEVELOPMENT AND ENTEREPRENEURSHIP IN TRANSITION ECONOMIES
260
CAPACITY FOR ACCEPTANCE AND USE OF PRE-ACCESSION FUNDS
OF THE REPUBLIC OF MACEDONIA
Nikolche JANKULOVSKI115 Katerina BOJKOVSKA116
Monika ANGELOSKA DICHOSKA117
Abstract
The integration process of the Republic of Macedonia towards the European Union is clear and unambiguous interest and priority goal. Republic of Macedonia within the integration processes from 16.05.2007 has the status of a candidate for membership in the European Union. Thus it has the right to use financial funds from the pre-accession funds in order to meet the criteria for membership in the European Union, and harmonization of national legislation in the European. The paper has a goal to give preliminary assessment of the current capacities in the Republic of Macedonia for absorption of resources from EU funds. The legislative framework and the administrative capacity for absorption of EU funds for economic and social cohesion are also covered. Assessment of the absorption capacity on the Republic of Macedonia will be reduced to the administrative-institutional capacity and the legislative framework for effective absorption of the EU funds.
Keywords: capacity, administration, harmonization, fund, absorption
115 Postgraduate student, [email protected] 116 Postgraduate student, [email protected] 117 Postgraduate student, [email protected]

REDETE – ECONOMIC DEVELOPMENT AND ENTEREPRENEURSHIP IN TRANSITION ECONOMIES
261
1. INTRODUCTION
Within the public finances of the European Union (EU), absorption capacity is defined as the degree to which a country (member or not member of the EU) is able to spend allocated funds in effective and efficient way. Based on the experience acquired over time the European Commissi-on has concluded that states have limited absorptive capacity of foreign investment support effective and efficient way118.
For this reason a special attention is paid on the issue about the concept of absorptive capacity and analysis of the factors that have influence on its determination.
On the absorption capacity for cohesion purposes of EU members state or candidate country for EU membership can affect three main factors119:
- Macroeconomic situation-macro-economic absorption capacity is defined and measured through GDP. Experience gained over time has led the Commission to conclude that the EU member states have limited macroeconomic absorptive capacity of foreign investment support effective and efficient way. During the current medium-term financial perspective of the EU, the upper limit for cohesion goals is set at 4% of GDP of the state, so the same figure the Commission proposes for the next medium term financial perspective.
-The state co-financing- financial absorption capacity can be defined as the ability for co-financing of programs and projects supported by EU to plan and guarantee these national contributions in perennial budgets, and to collect these contributions from multiple partners involved in a particular program or project and
- Administrative-institutional capacity- This capacity can be defines as the ability and skills of states and local authorities for timely preparation of appropriate plans, programs and projects, selection of programs and projects, establishing the conditions for coordination among the main partners, to fulfill the requirements regarding the administration and reporting, as well as funding and implementation of proper control, avoiding anomalies.
After conducting an analysis and understanding of good absorption capacity and factors affecting its size an assessment of the absorption capacity of Republic of Macedonia should be made. The assessment should be for the funds for cohesion purposes. Therefore, the Republic of Macedonia needs to analyze the problems of absorption capacity of the Baltic countries as well as those from the southeastern Europe, which now are members of EU, in order to improve its positions in terms of making greater possible absorption capacity.
2. CAPACITY TO TRANSPOSE THE LEGISLATION
Capacity to transpose the legislation concerning the use of funds from European funds and subject to the requirement of full harmonization of national legislation of the Republic of Macedonia with the legislation of the European Union (EU120). Accordingly, one of the constituent part of the country’s capacity to use funds from EU funds, a legal framework. Harmonization and adoption of laws by the legislature must not remain only on their formal
118 EU funds for development of the Republic of Macedonia, Mojmir Mrak, Vanco Uzunov, Governmental Sector for
European Integration, Skopje, 2005, ppt.69. 119 Ibid ppt.87. 120 European Commission: On the Implementation of Commitments Undertaken by the Acceding Countries in the Context of
Accession Negotiations on Chapter 21 – Regional Policy and Coordination of Structural Instruments, Commission Staff Working Paper, Annex to the Communication from the Commission to the European Parliament and the Council, COM (2003)433 fi nal, Brussels, 16.07.2003, ppt.2.

REDETE – ECONOMIC DEVELOPMENT AND ENTEREPRENEURSHIP IN TRANSITION ECONOMIES
262
vote in the legislature. The same need to be carried out to determine the effect on their appli-cation.
The laws and bylaws, which are of great importance, for absorption capacity is related to public procurement, state aid, protection of competition, financial control and management, environmental protection and equal opportunities. In all these areas the Republic of Macedo-nia has achieved significant progress on the necessary legal harmonization. However, special attention should be to measures necessary to implement the legislation.
3. ADMINISTRATIVE-INSTITUTIONAL FRAMEWORK
When we look at the issue of creating a project, an initial part of the administrative-institutio-nal absorptive capacity of a country represents the demand side. It means the ability to convert ideas into tangible projects with a clear structure, clear goals, clear momentum for achieving the general and specific objectives, a package that should be taken to achieve goals, complete list of entities involved in project implementation, benchmarks for measuring results and detailed analysis of costs and benefits.121
Turnkey project should be fully developed with a group of standards and in accordance with financial documents and the priority objectives of EU funds in order to constitute consistent whole.
On the other hand, administrative-institutional capacity includes the supply side, which refers to the state’s capacity to implement project. In this section question arise about the existence of an appropriate structure, human resources, and systems and tools necessary to effectively and efficiently manage the implementation of projects. Specifically the existing administrative-institutional absorptive capacity in Macedonia is not sufficient for effective use of financial resources from EU funds. It can be concluded based on the fact that the state still has the power of managing financial assets, but it performs the office designated by the European Commission. RM problems in the phase of creating projects for application and stage of implementation. It proved in the past with the use of funds from programs CARDS, PHARE and SAPARD, which offered funds were used partly.122
When using these funds the following weaknesses were identified:123 - Lack of long-term strategy of the government in terms of priorities and what must be done
in the future;
- There is limited demand for specific projects by potential users and the European Commission office in the country is in position to be the main driving force for generating projects;
- Sometimes employees in ministries and other institutions do not understand sufficiently the meaning of the projects and programs sponsored by the EU and
- in the Republic of Macedonia there is a lack of ownership of the programs financed by EU mainly due to the role of the European Commission office in the country that performs some functions that should be within the bodies of the Republic of Macedonia under the decentralization system of implementation od assistance.
121 EU funds for development of the Republic of Macedonia, Mojmir Mrak, Vanco Uzunov Governmental Sector for
European Integration, Skopje, 2005, ppt.79. 122 Evaluation of the Assistance to Balkan Countries under CARDS, Regulation 2666/2000, Synthesis Report, Vol. I Findings
of the Evaluation, June 2004, ppt. 23. 123 Ibid ppt.80.

REDETE – ECONOMIC DEVELOPMENT AND ENTEREPRENEURSHIP IN TRANSITION ECONOMIES
263
To eliminate these drawbacks a continuous work on retaining administrative staff is needed, as well as employment of young, highly educated personnel, ongoing training, both domestically and in the EU.
3.1. Capacity for generating projects
In terms of the demand of administrative-institutional capacity of a country, it is determined by its capacity to create a good list of projects that will contain enough well-planned and formulated proposals. Although this phase as the demand phase is initial in the project cycle, in Macedonia, or phase in public institutions and the private sector, facilities for the preparation of professionals entrusted projects are not yet sufficiently developed.
Unfavorable position of the state in the process of drafting the project is conditioned by several reasons:124
- In many cases the use of public (or private) funds is not conditioned by the existence (i.e. construction) quality project proposals. Consequently, almost no pressure, no such in-centive, those who finance their projects require preparation, and explanation (i.e. defense);
- The state officials and other public officials are rarely requires to prepare projects in their daily activities, and justification of sustainability and the importance of the proposals for public policies, however, often made on the basis of lack of clear criteria;
- In Macedonia there is no state institution that has generating projects as their sole or one of its key responsibilities, creation of private (consulting) firms whose professional orientta-tion is preparing the project has started recently. Hence, it will take time before their expertise (aside from that of foreigners) to mature to international standards of quality and
- There is an obvious lack of regular education, even at university level, associated with the preparation and evaluation of projects, hence such skills, in case of need, are gained by practice (learning-doing).
It is necessary to strengthen the demand side of the administrative-institutional capacity, or power-generating projects by animating the public about the importance of the projects, the existence of public bodies will provide information necessary for their development, and proactive approach to educational institutions to increase knowledge of young professionals for project development.
3.2. Capacity to implement projects
After completing the process of creating projects, their implementation is the next step. Macedonia as a state candidate for membership in the European Union is of increasing importance in managing the funds of pre-accession funds. Thus, from an institutional standpoint, the role of coordinating and managing the financial and technical assistance from the EU has the national foreign aid to the Republic of Macedonia, who is also Deputy Prime Minister of the Republic of Macedonia responsible for European Affairs. In addition to his managerial role, it is more active approach to its devolution to more efficient and effective utilization of EU assistance funds.
In implementing projects, there is the problem of managing human resources in the public sector. This problem manifests itself in the high degree partitioned administration or human resources that are heavily to political influence. The institutional problem is still present on the
124 EU funds for development of the Republic of Macedonia, Mojmir Mrak, Vanco Uzunov ppt.81.

REDETE – ECONOMIC DEVELOPMENT AND ENTEREPRENEURSHIP IN TRANSITION ECONOMIES
264
stage of evaluation applications for work applicants, to the employment of inadequate human resources, without requiring knowledge and knowledge of foreign languages.
Creating detailed and complete projects of a state is a crucial factor for attracting foreign technical and financial assistance so that the EU, thus ensuring the development of the country. Structural funds for member states and pre-accession assistance to candidate countries are channeled to the respective countries based on previously developed programs in the medium and long term. An important link in economic management in many of the economically developed countries is the development of program activities.
Given the fact that policy in Macedonia often not based on medium or long term strategic plans and documents, but rather that application of provisional measures or “ad hoc” solutions, medium term programming in the country are rarely applied.
The reasons for weak capacity to generate medium and long term strategic development plans in the Republic of Macedonia are the following:125
- The existence of a limited number of qualified staff with appropriate skills for preparing programming documents;
- Lack of institutions-research institutions, centers or other entities of its kind-whose permanent assignment will be the research and preparation of draft policies and the fact is that the existing lack of personnel and resources for proper performance of those activities and
- Lack of real ( not just formal) demand for such documents from those decisions.
When programming the strategic documents and projects should be included multiple partners
because anyone stakeholders126 have different needs, different wisdom, but the same goal-creating a program that will provide significant absorption of foreign funds to achieve comprehensive development of the country.
The experience of many of the countries that were countries-candidates, and now are members of the EU shows that after approval of projects, their implementation has proceeded with series of weaknesses. It indicates that the state should continually build its institutional-absorptive capacity. Unlike the central and local government has more pragmatic and dynamic approach in implementation the pre-accession funds.
Monitoring and evaluation of the implementation of projects as part of regular duties of public institutions in Macedonia are not sufficient developed. For better monitoring and evaluation requires good information monitoring system that will consistently provide timely and updated information about the progress of projects. Control audit of the financial management of projects, however, is solid considering the quality and availability of local human resources to financial management and audit skills.
125 EU funds for development of the Republic of Macedonia, Mojmir Mrak, Vanco Uzunov Governmental Sector for
European Integration, Skopje, 2005, ppt.83. 126 Public, private and civil society (NGO) sector.

REDETE – ECONOMIC DEVELOPMENT AND ENTEREPRENEURSHIP IN TRANSITION ECONOMIES
265
4. Analysis of the funds from IPA pre-accession assistance
The first component of IPA (Component 1), which is entitled as “transition assistance” and institution building is aimed to strengthen the administrative capacity of the institutions that conduct reforms required by the EU accession process, i.e. for fulfilling the Copenhagen criteria for full membership of Macedonia in EU. The funds from this component will help the country to strengthen its institutional capacity, (the Central government and the state authorities as well as the syndicates, employers’ organizations, economic chambers, civil organizations etc.) for effective and timely use of the funds from the other four IPA components.
Macedonia and all the other candidate countries and potential candidates for EU membership have the opportunity to use the funds from IPA’s first component, which are part of the national program that is, the money from the pre-accession funds for each country separately, as well as from the Multi-Beneficiary (regional) IPA. The IPA’s Multi-Beneficiary portfolio is smaller than the amount which is distributed for the national program and the amount is around €1milliard i.e. around 10% from the total IPA budget for the period from 2007-2013 which is € 11.6 milliard.
4.1. The first component of IPA for institution building
The fund allocations from the first component of the national IPA program are known in advance for each of the seven years from the current financial perspective 2007-2013 and they are part of the multi-annual indicative financial framework (MIFF). Therefore, the overall budget in the framework of the first component for this period of seven years is €242.8 million and the distribution of these funds is the following (Table 31).:
Table 1. Funds estimated for the I-component for Macedonia in MIFF (€ million)
I-component 2007 2008 2009 2010 2011 2012 2013
Transition assistance and institution building
41,64 41,12 39,31 36,91 28,80 27,20 27,94
Total €242,8 million Source: Data retrieved from the EU delegates in the Republic of Macedonia.
If we look at the numbers we notice that the allocated funds in the first year (2007) are biggest,
and in each of the following years they gradually decrease. The logic is that in the first years of the use of the new financial instrument, the country will have bigger needs for investment in the strengthening and institution building, but later, in 2012 and 2013 it is expected the biggest part of larger investments to be finished and the funds for this purpose to decrease. This does not mean that the overall support from IPA (for all components) decreases, but on the contrary, the overall support increases almost double (from €58.5 in 2007 to €117.2 in 2013) On behalf of the decreased amounts in the I component, in the last years of the financial perspective the funds in the other four components have increased significantly, especially in the third, fourth and fifth component, (Table 2).

REDETE – ECONOMIC DEVELOPMENT AND ENTEREPRENEURSHIP IN TRANSITION ECONOMIES
266
Table 2. (MIFF) Financial frame of components and years for the Republic of Macedonia (€ million)
IPA components € in million 2007 2008 2009 2010 2011 2012 2013
Transition assistance and institution building
42 41 39 36 29 28 28
Cross-border cooperation 4 4 4 5 5 5 5
Regional development 7 12 21 29 39 42 52 Human resources development 3 6 7 8 9 10 11
Rural development 2 7 10 13 16 19 21 Total 58 70 81 91 98 104 117
Source: Information gathered from EU Delegation in the Republic of Macedonia.
After determining the financial allocations, the next step is preparation of multi-annual
indicative planning document (MIPD) which is delivered by EC and prepared in consultation with the Government, the other donors and the civil society for a period of three years. It is a strategic document which functions as a landmark for IPA’s programming per year and per component. MIPD 2011-2013 is current at the moment, and the funds’ programming for 2011, 2012 and 2013 should show the priorities and the sectors quoted in it.
The following priorities for EU financial support in Macedonia over this period have been identified:
1. Support the economic and social development
2. Improve good governance and reduce the corruption
3. Anti-discrimination and respect the human rights
4. According to sectors, MIPD 2011-2013 lists the following seven support setors:
5. Public administration (€21.33 million);
6. Justice, Home Affairs and Fundamental rights (€24.38 million);
7. Private Sector Development (€45.71 million);
8. Agriculture and Rural Development (€67.04 million);
9. Transport (€60.95 million);
10. Environment and Climate Change (€54.85 million);
11. Social Development (€30.47 million).
After MIPD is brought, the Government, in collaboration with EC, begins to prepare the sector
and project proposals (the so called “fiche”) with the help of which the IPA’s first programs for the current year are programmed. At the moment, the Republic of Macedonia is preparing the fiches for 2012 and 2013 together, which, because of the finishing of the financial perspective, the following year (2013) is an exception- the previous years the fiches were prepared only for the current year. The process of preparation of the sector and project fiches is coordinated by SEP and means serious consultation between SEP and the other state authorities i.e the potential beneficiaries of the assistance. The consultation of the Government with the other interested parties in the process-donors, non-governmental organizations, syndicates, chambers etc., is also compulsory segment in the programming. In organization of the Mission of EU there are such consultations in Macedonia and in the last few years representatives from SEP are present at these consultations.
The funds from the first component 1 are programmed in year “n”, and are supposed to be spent at the latest in the year “n+2”, that is the funds programmed in I-component from the National IPA 2007 for example are supposed to be spent at the latest in 2009. If the projects that

REDETE – ECONOMIC DEVELOPMENT AND ENTEREPRENEURSHIP IN TRANSITION ECONOMIES
267
were programmed from IPA 2007 didn’t start with the spending until 2009, the funds are lost, that is the state loses the money and they are returned to the EU budget. The practice shows that the pace of spending the funds from IPA’s I component- with respect to some exceptions-is very slow and the announcement of the calls usually happens at the end of n+2 year.
The table below, (Table 3 and 4) shows the percent of funds’ spending from I-component up to and including 31.12.2010.
Table 3. Status of implementation of IPA financial assistance (I-component, up and until 31 December, 2010 (€ million).
Macedonia Estimated Concludedagreements
ConcludedAgreements % Paid Paid %
IPA 2007 34,90 32,87 94% 27,79 82% IPA 2008 37,12 34,41 93% 19,92 54% IPA 2009 37,06 0,15 0% 0,09 0% IPA 2010 36,91 0. 0% 0 0% Total 145,99 67,43 46,18% 47,71 70%
Source: Information gathered from the EU Delegation in the Republic of Macedonia
Table 4. Status of implementation of IPA financial assistance (I-component, up and until 31 December, 2010 (€ million),
According to the annual program
Macedonia Estimated Concluded agreements
Concluded Agreements %
Paid Paid %
IPA 2007 34,02 30,71 90,27% 18,76 55,14% IPA 2008 37,12 19,13 51,54% 6,23 16,78% IPA 2009 37,06 0 0% 0 0% IPA 2010 36,91 0 0% 0 0% Total 145,11 49,84 34,35% 24,99 17,22%
Source: Annual Report on the Financial Assistance for Enlargement 2010.
The comparison of spending the funds shows drastic increase of the percent of the funds
namely, concluded agreements from IPA 2008 at the end of 2010 with the end of 2011, and the increase is from 51,54% to 93% appropriately, as well as the increase of the percent of the paid funds from IPA 2008 from 16.78% in 2010 to 54% in 2011. These numbers are just an illustration that the agreements are concluded very late and very slowly. It is obvious that the funds were managed to be saved by now because of the EU intern rule according to which the funds can be reserved. If we compare the funds which are programmed by the National IPA 2007, 2008 and 2009 to the amounts planned by MIFF (see the Table above I-3), the conclusion is that with the IPA 2007 were programmed and spent €6.7 million less than the estimated, with the IPA 2008, almost €4 million less, and with the IPA 2009 the difference between the estimated and the programmed Euros is € 2 million. The question is whether Macedonia used less funds from those it had on disposal, or whether the funds, in total amount of €13 million, which is the difference for three years (2007, 2008, 2009) remained because some consultant firms tendered with lower bid. If it is the second case in question, then it is not known whether the funds were spent for some other purpose in the framework of the programmed national programs in the part for estimated for transition assistance and institution building or something else is in question.
The management of money from IPA’s I-component, from 1 January 2010, is conducted in accordance to the System for decentralization managing of the assistance, known as DIS-System (Decentralized Information System). Previously, that is in the period 2007-2009, the EU Mission in Macedonia was responsible for the IPA’s money managing. Decentralized system of assistance managing means that the appropriate institutions in the country which are part of the structure for

REDETE – ECONOMIC DEVELOPMENT AND ENTEREPRENEURSHIP IN TRANSITION ECONOMIES
268
money managing, that is the Government is responsible for transparent spending of the funds. In that way, the Central Financing and Contracting Department (CFCD), as a part of the Ministry of Finance is a key body responsible for managing and implementing projects in line with the principle of sound financial management. This sector is a body in charge of announcing tenders, concluding contracts and executing payments upon concluded contracts for projects financed within the IPA’s components 1-4. The Agency for Financial Support in Agriculture and Rural Development is in charge for managing of the funds from the V component (agricultural and rural development). Apart from CFCD, in each Ministry responsible for separate components, (in the case of the I-component that is SEP) there are so-called IPA coordinators who are responsible for programming, technical conduct and for monitoring the conduct of projects.
In the programming process of IPA 2012-2013 there are €52.95, funds estimated for the IPA’s first component for 2012 and 2013 in accordance to MIFF 2011-2013. From these funds €2.7 million are for projects financed through the regional program and that is for TEMPUS €1 million, for nuclear security €1.2 million and for civil society €0.5 million. For project proposals which should be supported with the national IPA these two years there are €50.25 million. During the consultations (at the end of January, 2012) the total amount of the project proposals was €69.634 million which is for €19.38 million more than the available €50.25 million. This means that some of the project proposals will definitely be rejected.
In order to improve the situation of this IPA component, in the process of programming of the funds, the country has to take the following matters into account:
1. The state institutions have to posses national development plan in order to know where are they going to and what did they need the European money for and for what reforms they can use the other sources of funds (for example, bilateral assistance, loans, credits from financial institutions etc;
2. The national development plan has to include the European agenda as its priority, and especially the European strategy 2020. If the Republic of Macedonia has an intention to improve its absorption capacity for the period 2014-2020 it has to work on determination of the priority areas in the reforms;
3. The content and the directions of the strategic documents for European integration such as the priorities for accession partnership, the problems and weaknesses noted by the EC, the goals and the activities of the national program for adoption of the European legislature and the Multi-annual indicative planning document have to be taken into account in all strategic and development documents of Macedonia;
4. In the case of the sectors for which institutional and legal approximation to EU is necessary, there have to be sector politics and strategies in short term, that is in long term. Because the state authorities that program the assistance are not visionaries and they do not have mandates to make political decisions, the authority has to establish tools which will help the programming. In that way the administration will know what to support in the following two years and not to plan how to spend the money at the moment of programming ;
5. )A special attention should be paid in the establishment of administrative capacity of the institutions and organizations which absorb the funds from the other four components as well as from the Community programs which the state has on its disposal and
6. Great coordination is necessary during the programming of IPA’s funds and the funds that Macedonia receives from other bilateral assistance in order to avoid overlapping and duplication of the projects.

REDETE – ECONOMIC DEVELOPMENT AND ENTEREPRENEURSHIP IN TRANSITION ECONOMIES
269
5. Conclusion
Given the fact that one of the basic perquisites for EU membership is the institutional and structural readiness of the country, experience shows that the best way for achieving the and for quality preparations of one country for EU membership are the pre-accession structural funds. Their use means adequate preparation for improvement of the absorption capacity that usually lasts three years. The experiences show that much money from EU funds lapse because of insufficient information of the subjects and weak support from the institutions. Some of the detected problems are extensive and complex applications, lack of professional assistance and untimely and inadequate information of the subjects.
References
1. Anthony Saunders, Maricial Millon Coornett (2003). Financial institutions management. A Risk Management Approach, Fourth edition, McGraw - Hill Irwin.
2. Bertelsmann Foundation and World Bank (2002). Local Economic Development Developing and Implementing Local Economic Development Strategies and Action Plans.
3. Bexheti, A.(2007). Financat Publike, fq 422, UELJ-Arberia Design, Tetove, Qershor. 4. Bishev G., Parat D. (1998). Money and Banking Idioms, Phrases and Articles. English-
Macedonian. Danimaks, Skopje. 5. Mojmir Mrak, Vanco Uzunov (2005). EU funds for development of the Republic of
Macedonia. Governmental Sector for European Integration, Skopje. 6. Evaluation of the Assistance to Balkan Countries under CARDS (June 2004).
Regulation 2666/2000, Synthesis Report, Vol. I Findings of the Evaluation.

REDETE – ECONOMIC DEVELOPMENT AND ENTEREPRENEURSHIP IN TRANSITION ECONOMIES
270
DOES LEASING WORK IN DEVELOPING ECONOMIES
Azur MUHAREMOVIĆ Izudin KEŠETOVIĆ
Abstract
Although some classify it into the new forms of financing, the first case of leasing was recor-ded in the distant past. Leasing was for the first time found in the Statute of Wales, in the year 1284. The first finance leasing company was founded by Henri Shofeld, in 1952, in the United States.
Law on leasing in the Republic of Srpska was adopted in 2007 and in the Federation of Bos-nia and Herzegovina in 2009. In each of these entities leasing companies were formed many years before the law was introduced. Currently, in Bosnia and Herzegovina there are 9 licensed leasing companies, seven of which are located in the Federation of Bosnia and Herzegovina and two in the Republic of Srpska. At the end of year 2011 the total balance sum of leasing companies in Bosnia and Herzegovina was 766.92 million KM, representing a growth of 3.32% in comparison to the end of the year 2010. Although at the end of 2011 the leasing sector of Bosnia and Herzegovina suffered a loss, this loss is still considerably lower than it was in the year of 2010. A loss of 11.70 million KM was generated, which made a decline in loss of 88.52%.
Why is leasing so important for developing economies? There are many reasons for this. The most important is the fact that leasing is a tool that brings money from developed economies and invests it into high-potential sectors of developing economies. From the user perspective, leasing expands financing options. This is very important for developing economies because many of them do not have a credit history and have no fixed assets to set as collateral. Leasing can be easily adjusted to those clients and provide them with necessary funds without having the high costs that the traditional ways of financing have. Leasing is a simple and fast way of collecting money for business projects, and it can bring several tax benefits.
It is evident that in developed economies leasing is increasingly becoming an important form of financing, and leasing companies are growing and achieving greater success, but if this is the case in developing economies is questionable. Sometimes models that are widely present in de-veloped economies are not acceptable for developing economies.
This paper explains all the benefits that the use of leasing can have for small and medium enterprises as well as for the economy as a whole. It presents the key figures that the leasing sector in Bosnia and Herzegovina has achieved in the last 2 years, and analyses why leasing can or cannot work in developing economies.

REDETE – ECONOMIC DEVELOPMENT AND ENTEREPRENEURSHIP IN TRANSITION ECONOMIES
271
Definition and basic characteristics of leasing
Leases can be defined as written contracts between two parties: the leasing companies (leasing provider) and the user of equipment (leasing recipient). In this form of business the transaction leasing grantor acquires the subject of lease (movable or immovable property) and lets the recipient use the lease for a certain period of time, with the obligation to perform periodic payments to the leasing provider in accordance with the contract.127
The definition given by the International Accounting Standard 17 (IAS 17) reads: "Leasing is a contract whereby a lease provider (lessor) provides the leasing recipient (lessee) the right to use the funds on the agreed period of time in return for a payment or series of payments.128 AS 17 immediately after that defines financial leasing as leases that substantially transfer all the risks and rewards arising from ownership of the asset. "Ownership of the property may or may not be passed on at the end of the contract period. Further on it defines “operational lease” as a lease other than a finance lease or a lease that does not transfer substantially all the risks and rewards arising from the ownership of the asset.
The process of leasing may be described in the following five steps: 1. A company (recipient of leasing) needs new equipment. It specifies the details relating to
the equipment, such as its model, features, etc., and the price agreed upon with the manu-facturer.
2. The recipient of the leasing with the leasing company (leasing provider) arranges the deta-ils of the contract, such as: rate height, duration of the contract and the price of equipment at the end of the lease.
3. The equipment is provided. The recipient of leasing and the leasing company conduct a review of whether the equipment is according to the contract. The leasing company buys the equipment.
4. The recipient pays the rent to the leasing company.
5. At the end of the leasing contracts, the leasing recipient decides whether to extend the contract for the lease or to buy the equipment.129
When we talk about the role of leasing as a financing model we must emphasize its importance
in providing medium and long term funding. This model represents an economically efficient solution for procurement of funds to businesses. In this way, small and medium enterprises, as well as newly founded companies that usually have big problems in raising funds because they do not have an acceptable credit rating or adequate collateral, have the ability to obtain equipment or modernize it, and thus become efficient and competitive. We must emphasize that these compa-nies otherwise would not have been able to raise funds for investment in modernization. These and many other reasons have led to the development of the leasing industry and brought it the support of many countries as an important method of financing especially for investments based on new creative ideas.
The presence of leasing in the economy of a country is desirable because then entrepreneurs have an additional opportunity to improve production by investing in the modernization of equipment. However, it does not end here. In the entire process each side can record a few essential both advantages and disadvantages, which arise from leasing.
127 Effective risk management in finance leasing companies, Proceedings 4, V Symposium of the Association of Internal
Auditors in Bosnia recognized as IIA in BiH by the IIA Global, held in Dubrovnik from 15th to 17th April 2010. , Sarajevo, April 2010.
128 International Accounting Standard 17 – IAS 17, EC staff consolidated version as of 24 March 2010 129 Walker, T., „Managing lease portfolios“, John Wiley & Sons, Inc., Hoboken, New Jersey, 2006., p. 2

REDETE – ECONOMIC DEVELOPMENT AND ENTEREPRENEURSHIP IN TRANSITION ECONOMIES
272
The basic advantages for lessor (leasing provider)
In the leasing business security is much higher than in bank loans, where collateral has main role in ensuring returns. Increased security for the leasing provider in contrast to credit activities is derived from the ownership of equipment and a simpler procedure for returning the funds.
Simpler documentation represents a significant advantage because fewer resources are spent on processing documentation necessary to perform the leasing business. Therefore, leasing com-panies are able to achieve higher levels of efficiency.
Smaller regulations are characteristic of leasing companies because leasing companies in general do not accept deposits, and therefore do not risk public funding, and thus have a broader impact on the financial system of an economy. This fact frees them from many types of controls and restrictions that banks are exposed to daily. Less control and fewer limitations the expand range of activities and, therefore, should lead to greater efficiency.
Approaching clients of different risk profiles is the key to the success of leasing companies, and is enforceable because in order to conclude the lease leasing companies require less insu-rance, unlike banks where this insurance is the basic condition for loan approval. For this reason, leasing companies are able to offer their services to a larger number of clients, and even to those that would be unacceptable from the banking point of view.
Basic benefits for lessee (leasing recipients)
During the entire process theleasing company retains ownership over the subject of lease, which gives it the ability to liberate the leasing recipient of numerous security procedures that would otherwise be necessary in the banking business. In the case of repayment problems, the leasing company can easily come into possession of the subject of leasing, and therefore has less need for additional forms of security. It is true that the risk management department requires certain aspects of security, but they are far less small than the requirements set by the Bank for a cash equivalent.
The ease and the speed of entering into a leasing agreement, represent a significant advantage for the user of leasing. Individual leasing companies build their competitive advantage on the speed of processing and approving the lease. Some are able to approve the lease agreement in just 24 hours from the time of application. The reduced need for security measures provides the po-ssibility for leasing companies to free their customers of many procedures, thus creating an additional advantage in business.
Adaptability to clients is developed to such an extent that in some cases the leasing model provides the ability to start or develop a business with minimal initial investment. The repayment plan of leasing is flexible to the needs and possibilities of leasing users. Given that leasing companies have a great reputation with suppliers and repairers of the leasing items, users can maintain funds obtained by leasing at much more favorable terms. Sometimes the same assets are cheaper to purchase in cooperation with the leasing company, rather than in our own arrangement.
According to the author of the book "Managing lease portfolios," Townsend Walker, there are four distinct advantages that make leasing attractive to the recipient of leasing:
1. Regular cash flow from rents. 2. Layout for making a profit from the sale of equipment after the expiry of the lease. 3. Tax deduction based on the depreciation of equipment. 4. The ability to increase the value of additional leases with creative financial structuring.130
130 Walker, T., „Managing lease portfolios“, John Wiley & Sons, Inc., Hoboken, New Jersey, 2006., p. 3

REDETE – ECONOMIC DEVELOPMENT AND ENTEREPRENEURSHIP IN TRANSITION ECONOMIES
273
Types of leasing and their characteristics
It is possible to identify significant differences between the different types of leasing. In recent years, many hybrid arrangements are occurring, which are sometimes difficult to describe because they go beyond the standard descriptive terminology. Uncertainties about the existing leasing arrangements can be eliminated only when identifying and understanding the basic characteristics of various forms of leasing.
Leases can be initially divided into two groups: financial leasing and operational leasing. Financial leasing usually means, leasing over the long term, while every other leasing that does not fall into the category of financial leasing may be classified as an operational lease based on its short term. Within these two main categories there can be found certain variations such as: leveraged leases, non-leveraged, service lease, etc. Sometimes we can get a false sense that they are a separate category of leasing, whereas they are, in essence, just variations of financial or operational leasing.
Financial leasing
Financial leasing is the most commonly used form of leasing and is reflected in the following: the leasing provider, with an agreement with the recipient of the leasing, purchases equipment from a supplier and gives it to the recipient. The recipient of the lease uses this equipment in business and earns an income on that basis, which will enable him to pay the contractual liabilities toward the leasing provider.
"Usually, the total cash flow of rates throughout the period of leasing, tax savings, the residual value of the equipment or the value of re-lease uses will be sufficient to pay the leasing provider for the investment, to cover administrative expenses, pay off debts and commissions based on the equipment and to produce profits. Since this is a long term commitment, with financial leasing, the leasing company imposes significant penalties in case of early ending the contract by the recipient of leasing, the value of which will provide a return on the investment and profits, at least until the scheduled expiration date of the contract."131
Due to its financial nature financial leasing is usually a net lease. This means that the basic obligations of ownership, such as maintenance and repair, mandatory insurance, taking care of the equipment, and the use of taxes, are transmitted to the user of leasing. For net lease it is characteristic that, only the leasing company finances the purchase of assets, and for this reason, this form of leasing is largely similar to the loan for the purchase of equipment that is offered by banks.
It is important to note that the repayment of financial leasing in most cases is approximate to the life of an acquired asset and, therefore, the primary risk in leasing – the risk of obsolescence of equipment – is transferred to the lessee, while the equipment remains in the legal ownership of the leasing provider. Upon the expiration of the contract, the lessee may decide to return the equipment to the provider, or to buy it for a price that is much lower than the expected market value of the equipment. In practice, usually (but not required) the contract is drawn in such way that by paying the last rate of leasing the recipient automatically becomes the legal owner of the object of leasing. Financial leasing is often defined as an alternative form of financing new investment of firms.
131 Richard, M. Contino, „The Complete Equipment-leasing Handbook“, AMACOM, a division of American Management
Association, 1601 Broadway, New York, 2002., p. 9

REDETE – ECONOMIC DEVELOPMENT AND ENTEREPRENEURSHIP IN TRANSITION ECONOMIES
274
Operational leasing
The basic difference between operational leases and other types of leasing is that the duration of this arrangement is much shorter than the shelf life of the equipment. Equipment, such as planes or trains, can have a shelf life of 25 to 30 years. The leasing company usually provides the money for the purchase of such equipment and rents it out for 5 to 7 years. In this case, the leasing company monitors the ability of the user to perform the lease rent payments, and in comparison to other arrangements is less worried, because it owns valuable equipment that can simply be leased to someone else. A greater issue than the individual difficulty of the leasing receiver is the downward phases of the conjuncture cycle in the industry.132
When the lease duration is significantly shorter than the lifetime of the equipment, we are talking about an operational lease. Operational leases typically take several months to several years, and sometimes even just a few hours. Given the relatively short duration of the lease, the leasing company usually is not able to repay the investment through a single operational lease arrangement. However, the leasing company shall sell the equipment and give it back under a lease at attractive terms, in order to work profitably. In this case, the risk of obsolescence of equipment is the dominant risk. The leasing company will strive to repay their investment as soon as possible, by charging higher rents than in the case of financial leasing. Short term contracts and the simplicity of the cancellation of the same, make operational leasing desirable in some situations. One such situation is when the user intends to use the equipment for shorter period of time, as is the case with trains and planes. Another situation in which the operational lease is desirable is when the user wants to have the ability to replace the equipment if something better appears on the market. Due to ongoing technological improvements, computer equipment is usually financed through operational leases.
Other variations of leasing forms
Leveraged leasing is just another variation of financial leasing. The basic difference is reflected in the fact that the leasing company does not bear all the cost of purchasing equipment. Between 60% and 80% of the equipment in this case is financed by a bank or insurance company. Leasing company finances only a small percentage of the value of the equipment, while the return is based on 100% of the equipment, and for this reason it is called a "lease with the lever." Since the leasing company owns the equipment, on the basis of this model it has tax benefits and the right to sell the equipment after the expiry of the contract, but it is not responsible for paying the expenses of the rest of the funders in the situation when the user stops paying rents.
Very often in developed economies a type of leasing labeled TRAC (Terminal Rental Adjustment Clause) is used. This type of lease is legally restricted to road vehicles: tractors, trucks, buses, cars. The basic difference between this form of leasing and others is that the leasing company does not bear the risk of the equipment at the end of the arrangement. The ultimate value of the equipment is set at the start of the lease contract. If the market price is higher than the contracted vehicles, the user receives a leasing discount.133
Recently there has been a growing need for leasing with the service – the form of leasing in which the leasing company, besides financing, keeps equity commitments, such as maintenance, repair, insurance, record keeping or paying taxes on the property. A lease with the service is typically short-term leases.134 Due to the short term of the contract, the obvious fact is that the leasing service is just a variation of operational leasing.
132 Walker, op. cit., p. 5 133 Walker, op. cit., p. 5 134 Richard, M. Contino, op. cit , p. 11

REDETE – ECONOMIC DEVELOPMENT AND ENTEREPRENEURSHIP IN TRANSITION ECONOMIES
275
Direct leasing is a business transaction in which funds are raised using one contract. The con-tract is created between the two sides: producers and users of leasing. Taking into account the direct relationship between the producers and the users of leasing, the manufacturer must solve the problem of their own funding. He does so by addressing the financial institution (bank, factoring company, etc.) and selling their receivables. The user pays the rent for the financial ins-titution and the manufacturer remains the debtor of financial institutions, until the user fully fulfills its obligation.135
LEASING IN BOSNIA AND HERZEGOVINA
In Bosnia and Herzegovina 9 leasing companies have the operating permit for leasing, seven of which are located in the Federation of Bosnia and Herzegovina, and two leasing companies have their headquarters in the Republic of Srpska. Three leasing companies that are registered in the Federation have 5 branches in the Republic of Srpska. The branches of these leasing companies are spread across all the main centers of Sarajevo, Banja Luka, Tuzla, Mostar, Bihać, Zenica, etc.
The three leasing companies in B&H Hypo-Alpe-Adria Leasing, Raiffeisen Leasing and Volksbank Leasing, established the Association of Leasing Companies in Bosnia and Herzegovina in February 2005. The Association officially started to work in April 2005. In January 2006, Euroleasing from Mostar and NLB Leasing joined the Association. From 2007 to 2009 UniCredit Leasing, S Leasing and ASA ABANKA Leasing also joined the Association.
Main goals of the Association are the following:136 1. Mutual correlation of the Association members in order to improve and develop leasing
and work technologies to apply modern technological and technical achievements;
2. Exchange of experience among the members and promotion via media and other professional publications for achieving goals of the Association;
3. Studying and tracking the status of leasing development and current issues in this area;
4. Professional education and assistance to the members through organization of seminars, courses, trainings and similar;
5. Initiation of adoption and amendments of legal regulations related to leasing business with authorized bodies;
6. Collection and record of statistical data of common interest for the Association members;
7. Representing the members on international assemblies;
8. Cooperation with similar associations and other organs and organizations in the country and worldwide.
The legal framework of leasing business in Bosnia and Herzegovina
In Bosnia and Herzegovina, leasing is regulated by two laws: the "Law on Leasing of Federa-tion of Bosnia and Herzegovina (FB&H)" and the "Law on Leasing of the Republic of Srpska (RS)." Banking Agencies of FB&H and RS oversee and license the leasing companies.
These laws define the manner and the conditions of the leasing company, the way of doing business, the rights and obligations of persons involved in the leasing business, risk management, financial reporting, supervision of leasing companies, as well as the procedures and conditions under which there is a cessation of existence of the leasing company. 135 http://www.cbbh.ba/index.php?id=684&lang=bs, visited 11.02.2011. 136 http://www.leasing.org.ba/bs/content/udru%C5%BEenje-dru%C5%A1tava-za-leasing-u-bosni-i-hercegovini, visited
25.10.2011.

REDETE – ECONOMIC DEVELOPMENT AND ENTEREPRENEURSHIP IN TRANSITION ECONOMIES
276
Umbrella supervisory authority over the participants in the leasing business in B&H are entity banking agencies, which carry out the issuance and revocation of licenses to conduct leasing business, as well as the supervision of the very societies. Banking Agencies supervise the leasing companies through "off-site" control (by controlling the financial statements which leasing com-panies regularly deliver to the banking agencies) as well as through on "on-site" control, which is conducted in the premises of the leasing company. These controls of leasing companies are conducted at least quarterly, and more frequently if necessary.
Entity banking agencies have issued a total of ten licenses for operating leasing up to 31.12.2011., eight of which were issued in FB&H and two in RS. After the Federal Banking Age-ncy in 2011 revoked the license for Hypo Alpe-Adria-Leasing, the company has met the necessary legal prerequisites, committed the registration in the Republic of Srpska and has continued to operate. Currently in B&H 9 leasing companies operate:137
1. ASA Aleasing LLC Sarajevo;
2. Euroleasing LLC Mostar;
3. NLB Leasing LLC Sarajevo;
4. Raiffeisen Leasing LLC Sarajevo;
5. S-Leasing LLC Sarajevo;
6. UniCredit Leasing LLC Sarajevo;
7. VB Leasing LLC Sarajevo;
8. New Leasing a.d. Banja Luka;
9. Hypo Alpe-Adria-Leasing LLC Banja Luka.138
After licensing the leasing companies, the process of actively monitoring their operations
initiated. Besides the individual monitoring of compliance with the applicable regulations of business, financial conditions and analyzing financial statements of each leasing company, the complete leasing sector in B&H is monitored.
Analysis of the balance sheet structure of leasing in Bosnia and Herzegovina
On December 31, 2011 the overall Balance sheet amount of leasing companies in FB&H amo-unted to 761.72 million, representing an increase of 20.23 million KM or 2.73% as compared to 2010. On the same day, the total balance of the companies in the RS was 5.2 million, mainly due to the balance sheet sum of the newly established leasing companies. If we exclude from the analysis the newly established leasing company, and we consider only the leasing companies already operating in the RS and whose balance sum is 1.3 million, we see that the RS actually achieved a balance amount of the total decline of 53% compared to the end of year 2010. According to this, we see that the overall balance of the leasing companies in B&H as of 31 December 2011 amounted to 766.92 million, representing an increase of 3.32%.
The biggest item in B&H assets of leasing companies with a share of 65.70% belongs to net receivables arising from financial leasing in the amount of 503.5 million. In FB&H, this item increased by 0.91%, while in the RS on the same basis it recorded a growth of 34%.
Although the law on leasing does not allow leasing companies to deal with credit transac-tions, the assets of leasing companies as of December 31, 2011 were 123.99 million KM net
137Information on the leasing sector in the Federation of Bosnia and Herzegovina December 31,2011. Federal Banking
Agency, Sarajevo, March 2012. year, p 4 138 A report on the state of the banking system of the Republic of Srpska for the period from 01.01. - 30.09.2011. p 69

REDETE – ECONOMIC DEVELOPMENT AND ENTEREPRENEURSHIP IN TRANSITION ECONOMIES
277
receivables arising from loans, or 16.28% of total assets, down from 9.66%. Participation loa-ns in the assets of leasing companies have been declining constantly and will remain present until the expiry of their terms of approval.
Operational leases on the entire territory of B&H cover a substantially smaller share of total assets. The net value of assets financed through operational leases amounted to 34.33 mi-llion, an increase of 2.57% compared to the end of 2010. Financing through operational leases is present only in the practice of leasing companies registered in FB&H.
The following table shows the position of all the assets of leasing companies from the FB&H and their changes during the period from 31.12.2010 to 31.12.2011.
Table 3. Position of assets of leasing companies in FB&H (000 KM)
Balance positions 31.12.2010 Participation in
assets 31.12.2011
Participation in assets
31.12.2010/ 31.12.2011
Financial Leasing 496.093 67% 500.626 66% 0,91%
Operational Leasing 33.473 5% 34.333 5% 2,57% Loan 137.249 19% 123.994 16% -9,66%
Other Assets 74.675 9% 102.766 13% 37,62% Total Assets 741.490 100% 761.719 100% 2,73%
(Source: Information on the leasing sector in the Federation of Bosnia and Herzegovina December 31,2011. Federal Banking Agency, Sarajevo, March 2012., P 7)
There was an increase in the total value of assets in the amount of 20.23 million, which repre-
sents an increase of 2.73% compared to the end of 2010. The most significant growth was re-corded in Other Assets with an increase of 28.09 million, or 37.62%. Most funds have been invested in financial leasing, in the amount of 500.63 million, with a slight upward trend of 0.91%.
The following table provides an overview of consolidated balance amount of the financial sector of FB&H under the supervision of Federal Banking Agency, which means that it omits the sector of insurance companies. The analysis includes the conditions of the banking, leasing, and MCO sector at end of 2010 and 2011.
Table 4. Participation in balance sheet sum of financial sector of FB&H139
(000 KM)
31.12.2010 Participation 31.12.2011 Participation 31.12.2010/ 31.12.2011
Banking Sector 15.075.697 91,96% 14.969.650 92,21% -0,70%
Leasing Sector 741.490 4,52% 761.719 4,69% 2,73%
MCO Sector 576.217 3,51% 502.579 3,10% -12,78% Total Assets 16.393.404 100% 16.233.948 100% -0,97%
(Sources: Information on banking system of the Federation of Bosnia and Herzegovina December 31,2011 Federal Banking Agency, Sarajevo, March 2012. p 18; Information on leasing sector in the Federation of Bosnia and Herzegovina December
31,2011. Federal Banking Agency, Sarajevo, March 2012. p 7; Information on microcredit system of the Federation of Bosnia and Herzegovina December 31, 2011. Federal Banking Agency, Sarajevo, March 2012. p 9)
139 Balance sum of the banking sector with December 31, 2011. was 15.2 billion KM up by 1% or 115 million KM than at the
end of 2010. The effect of these events due to the transition to the new methodology (hereafter under IAS) from December 31, 2011. Is the increase in balance sum of 221 million KM. If we analyze the changes in balance amount by the previous methodology, compared to 2010. it recorded a fall of 0.7% or 106 million.

REDETE – ECONOMIC DEVELOPMENT AND ENTEREPRENEURSHIP IN TRANSITION ECONOMIES
278
The banking sector holds the largest part of the financial sector with a share of 92.21% for 2011 with a total balance sum of around 15 billion. The leasing sector is 4.69% of the balance amount of the financial sector, with the potential for growth of 2.73% compared to the same period in 2010. A 3.10% share in the sum balance belongs to the sector of microcredit organi-zations with a tendency to fall by 12.78% compared to the end of 2010.
From the following table we can see the structure of new loans according to the type and subject of leases at the end of 2010 and 2011. The financial leasing is far ahead of operational leasing with a share of 92.56% in the overall structure of concluded contracts, and the share of financial leasing much higher compared to 2010. A thorough analysis tells us that in FB&H most financial purchases done by the leasing method are for vehicles with 66.56%, followed by equipment with 21.67%, and then real estate with a share of 11.77%. Investments in vehicles showed an increase of 30.39 million, which is 20.99% higher compared to 2010. The item of equipment is greater for 24.40%, while real estate decreased by 42.92%.
Table 5. Structure of new loans by type and subject of leases
(000 KM) 2010. 2011. Financial
Lease Operational
Lease TOTAL Financial
Lease Operational
Lease TOTAL
Vehicles 133.521 11.291 144.812 157.380 17.821 175.201 Equipment 45.614 246 45.860 55.275 1.774 57.049 Ral Estate 30.082 24.208 54.290 30.989 0 30.989
Total 209.217 35.745 244.962 243.644 19.595 263.239 (Source: Information on the leasing sector in the Federation of Bosnia and Herzegovina December 31,2011.
Federal Banking Agency, Sarajevo, March 2012., P 8)
In order to avoid a false impression that the FB&H largely financed passenger vehicles for
personal use, we will enter into a detailed analysis. Through financial leasing most funds have been invested to finance cargo and passenger vehicles with a share of 30%. Then machines and equipment with a share of 28% and passenger cars with 22% and real estate with 18% participation. We see that passenger vehicles for personal use occupy less than 50% of the funds allocated for the financing of vehicles.
Chart 1. The structure of financial leasing by the leasing subject December 31,2011.
(Source: Information on the leasing sector in the Federation of Bosnia and Herzegovina December 31,2011.
Federal Banking Agency, Sarajevo, March 2012., P 7)

REDETE – ECONOMIC DEVELOPMENT AND ENTEREPRENEURSHIP IN TRANSITION ECONOMIES
279
The positive thing is that leasing is largely used for financing the business, which can be seen on the next chart.
Chart 2. The structure of financial leasing, according to the leasing users December 31,2011.
(Source: Information on the leasing sector in the Federation of Bosnia and Herzegovina December 31,2011.
Federal Banking Agency, Sarajevo, March 2012., P 7)
Participation in financial leasing in FB&H to customers leases belongs mostly to corporate
clients with a share of 85%, after which individuals come with a share of 13%. The structure of financial leasing, the user and the leases in 2011 has not experienced a significant change compared with the previous business period.
Financial results of leasing sector
As in most other sectors, the global economic crisis has affected the sector of leasing. During 2009 in B&H a significant reduction has been recorder in the value and number of concluded contracts. Many wanted to see an improvement of the situation in 2010, but the downward trend has continued, and leasing companies in FB&H at the end of 2010 made a loss of 101.96 million.
The following chart shows the movements of profit / loss in the reporting period. We see that leasing sector operated at a loss since the beginning of 2010. The biggest loss was recorded at the end of 2010 in the amount of 86.23 million, after which the situation begins to normalize and begins to approach the limit of coverage.

REDETE – ECONOMIC DEVELOPMENT AND ENTEREPRENEURSHIP IN TRANSITION ECONOMIES
280
Chart 3. The Movement of profit/loss by period
(Sources: Information on the leasing sector in the Federation of Bosnia and Herzegovina 30.09.2010. Federal Banking Agency, Sarajevo, November 2010. p 18; Information on leasing sector in the Federation of Bosnia and Herzegovina
30.09.2011., Agency Banking Federation, Sarajevo, November 2011., p 11; Information on leasing sector in the Federation of Bosnia and Herzegovina December 31,2011. Federal Banking Agency, Sarajevo, March 2012, p 10)
In addition to the global financial crisis, loss reported during the indicated periods is largely
influenced by the provision for bad and doubtful debts. Leasing companies failed to adequately create a reserve for financial leasing contracts, prior to obtaining the license for performing leases by the Agency. After obtaining the license, leasing companies are obliged to apply the decision of the minimum amount and method of formation, management and maintenance of reserves for losses and risk management. The largest increase in the amount of the provision is recorded for loas that were granted before the Law on Leasing came into force.140
In the following table we can see how the performance indicators moved in 2010 and 2011. We see that there has been a fall in the average interest rates on interest-bearing assets to 8.22%recorded for 2011, while it was 7.18% in 2010. The deposit interest rate has experienced a 3.45% increase from the end of 2010 to 3.76% at the end of 2011. While the decrease of negative return on average assets from -1.64% recorded at the end of 2010 to -1.54% recorded for 2011, is positive, in reality it was still a negative yield. Although the image is very negative it should be mentioned that there was an improvement of return on equity from the -34% recorded at the end of 2010 year, to -21% recorded for 2011. In 2011 leasing companies in FB&H were reducing their debt.
Table 6. Business indicators for 2010 and 2011
BUSINESS INDICATORS 31.12.2010 31.12.211
Return on Average Assets (ROA) -1,64% -1,54% Return on Average Equity (ROE) -34,00% -21,00%
Average lending interest rate 8,22% 7,18% Average deposit interest rate 3,45% 3,76%
Total liabilities to equity 15,05 13,37 (Source: Information on the leasing sector in the Federation of Bosnia and Herzegovina December 31, 2011.
Federal Banking Agency, Sarajevo, March 2012., P 11)
In the following table we can see the average weighted nominal and effective interest rate, and
the amount of funding to the object of leasing on December 31, 2011. Weighted average effective interest rate on short-term leases amounted to 12%, while the weighted average effective interest rate for long-term leases amounted to 10.01%. The total effective interest rate was 10.13%.
140 Information on the leasing sector in the Federation of Bosnia and Herzegovina 31.03.2010. Banking Agency of Federation
of Bosnia and Herzegovina, Sarajevo, 2010., pp. 10 to 11

REDETE – ECONOMIC DEVELOPMENT AND ENTEREPRENEURSHIP IN TRANSITION ECONOMIES
281
Table 7. The average weighted nominal and effective interest rates
(000 KM) Amount of
Funding Weighted
nominal IR Weighted
effective IR
Short-term leases by the lessee 10.950 6,64% 12,00% Passenger Vehicles 9.218 6,460% 12,38% Vehicles to perform (cargo and passenger) 856 6,65% 12,11% Machinery and equipment 874 5,45% 7,95% Other 2 7,00% 9,39% Long-term lease by the lessee 232.694 7,66% 10,01% Passenger Vehicles 75.002 8,04% 11,10% Vehicles to perform(cargo and passenger) 72.310 7,14% 9,60% Machinery and equipment 54.383 7,82% 10,11% Real Estate 30.989 7,64% 8,18% Household appliances 4 7,00% 8,56% Other 6 9,00% 14,37% TOTAL 243.644 7,61% 10,13%
(Source: Information on the leasing sector in the Federation of Bosnia and Herzegovina 31.12.2011. year, the Federal Banking Agency, Sarajevo, March 2012. year, p 12)
Given that the interest rate is the cost of funds, it is interesting to compare the interest rates at
which their funds are offered by different financial institutions. On the following chart average weighted nominal and effective interest rates in the banking, micro-credit and leasing sector in the Federation in 2011 are presented.
We can notice a slight decline in both nominal interest rates (NKS) and in effective interest rates (EKS) in the banking and leasing sectors, while interest rates in the microcredit sector osci-llate. Given the very small change in interest rates during the reporting period, it can be said that interest rates are stagnating.
Chart 4. Overall average nominal and effective interest rates of financial sector
(Sources: Information on banking system of the Federation of Bosnia and Herzegovina, the Federal Banking Agency,
Sarajevo, information on the leasing sector in the Federation of Bosnia and Herzegovina, the Federal Banking Agency, Sarajevo; Information on microcredit system of the Federation of Bosnia and Herzegovina, the Federal Banking Agency,
Sarajevo)141
141A number of publications of FBA , which cover banking, leasing, and MKO sector through the reporting periods were used
as the source . Due to the lack of precise information EIR for MFIs sector are calculated by the principle of average, while information concerning NCS were not disclosed.

REDETE – ECONOMIC DEVELOPMENT AND ENTEREPRENEURSHIP IN TRANSITION ECONOMIES
282
It is important to note that there is not such a great difference between the interest rate on loans and the interest rates on leasing. The reason for that can be found in the fact that the leasing com-pany is owner of the object of the leasing as opposed to a bank that has slower mechanisms for enforcing. This fact significantly reduces the risk that the leasing company assumes, and makes leasing a more attractive and accessible form of financing to different segments of customers.
THE KEY TRENDS OF LEASING ENVIRONMENT IN BOSNIA AND HERZEGOVINA
If we ignore the negative effects of the global economic crisis, we can say that the leasing sector in B&H has greatly progressed. It should be noted that on January 3, 2009 the Act on leasing came into force, which has greatly improved the infrastructure of the leasing sector. The law ordered the leasing companies to synchronize their operations, and to submit a request for approval of a license to conduct leasing operations to the Banking Agencies. They were granted a deadline of 12 months for the indicated adjustment, which proved to be enough considering that all leasing companies have met the legal prerequisites in that time period, and have successfully obtained the solution of the approval to conduct leasing operations.
An oversight of the leasing sector was annexed to the Federal Banking Agency and the Banking Agency of the Republic of Srpska, and it can be said that the Banking Agencies are performing oversight of the leasing sector very professionally. In favor of the Agencies goes the quarterly publication on the conditions of the leasing sector, which constitutes a detailed picture of the financial sector.
With the help of Banking Agencies, leasing companies have in 2011 made a breakthrough in terms of combating money laundering and financing of terrorist activities, adopting policies and procedures that define the duties and work to prevent them. Each leasing company has the persons responsible for managing activities in combating money laundering and financing of terrorist activities, and thus the leasing companies have provided the essential prerequisite for the reduction of risks arising from these actions.
Although leasing in B&H has existed for many years, we can say that B&H population knows very little about this form of financing. It is not uncommon for users to go for leasing for all the wrong reasons, sometimes given advice by aggressive sellers, and sometimes encouraged by their own desire for a comfortable life. Leasing is often viewed as a credit, and the primary benefits of leasing are not fully exploited and people are even unnecessarily exposed to higher costs. To avoid all of this, it is necessary to educate the population of Bosnia and Herzegovina, and increase economic literacy regarding the leasing business, as well as other forms of obtaining financial resources. Solving this problem can be made by forming an agency for the economic and legal literacy of the population, whose task would be, without personal interest, to disseminate infor-mation about the economic and legal issues, provide consulting services and give instructions.
The development of a secondary market has a great impact on the future value of the equipment. Developed secondary market accelerates selling assets, thereby increasing the liquidity of the leasing companies, as well as the selling price of leasing assets. Although it is a simple form of market, in B&H there is only some form of secondary market, which is most developed in the automotive sector. We can say that it is a decentralized market, whose parts are often formed by individuals and at the "ad-hoc" basis. It would be much more acceptable for the leasing provider, as well as for the leasing user, if the secondary market could be centralized in terms of availability of information. With the ever wider use of electronic media, especially the Internet, an even bigger presence of online secondary market can be expected.
A poorly developed secondary market would harm the development of operational leases the most, which in B&H lags considerably behind the financial leasing. We can say that in the domain of non-standard equipment, the secondary market almost does not exist, which makes the operational lease undesirable by leasing companies. This is made worse by the fact that the B&H

REDETE – ECONOMIC DEVELOPMENT AND ENTEREPRENEURSHIP IN TRANSITION ECONOMIES
283
market as a whole is one of the least active ones in the region, which is disastrous not only for the leasing sector, but also for the entire financial sector in B&H. It is necessary to develop the infrastructure that would attract foreign investment and contribute to the development of more liquid and active market. Legislative infrastructure has to be sympathetic to the small and medium business, and the registration process itself must be considerably simplified.
Judging by the reports of the project for collecting and analyzing information about the ease of starting and doing business in countries around the world (Doing Business), B&H is at 125th place out of 183 countries.142 The above information is detrimental and will most certainly demotivate potential investors. In order to encourage market activity, and thus encourage the development of B&H it is necessary to facilitate the procedures for the registration of companies, as well as to reduce the tax obligations that are imposed onto the newly formed companies.
One of the major problems leasing companies in B&H face every day is the treatment of VAT. Unlike with interest on loans charged by the bank where the payment of VAT is not mandatory, the interest in the leasing sector is required to calculate and pay the VAT of 17%. This fact makes it difficult for business by leasing companies and makes leasing a less competitive form of financing compared to bank loans. The business trip of VAT is identical to the one of the funds that are given by leasing. If the leasing contract clauses incorporated buyout funds then in terms of VAT we are talking about the delivery of goods, which means VAT will be calculated and paid first to supplier, producer and retailer of the resources that are granted under the lease. The VAT is a burden to the supplier, while at the same time it is a benefit for the leasing provider. Leasing provider is obliged to calculate and pay VAT on the invoices that are sent to the recipient of leasing, which apart from the initial value of the leases includes interests and other costs charged by the leasing provider. The above model has a different effect depending on whether the leasing user is in the VAT system or not, or whether it is the case that the asset is used in non-production purposes.
A problem that currently occurs is one with real estate leasing customers, who decide to lease this same property or to sub-lease it. Although the donor of leasing has allowed these business activities in the contract with the leasing user, inspection authorities do not wish to accept these business activities, arguing that the leasing company that owns real estate only has a legal right to lease the property.
From this we can see that the leasing sector in B&H had, and still has, a lot of negative points. Most of the negativity is not directly related to the leasing sector and cannot be solved by leasing companies, which further complicates the development of the leasing sector. Overall legal and institutional framework in B&H is very slow and hinders the development of the leasing sector, thereby hindering the overall development of the B&H economy.
Conclusion
Though some classify it into the new forms of financing, leasing has for many years been showing remarkable results. For a developing economy such as the one of B&H, its importance is even greater, since the leasing sector accounts for about 4% of the total assets of the financial sector, putting it on the second place. If we add the fact that the B&H economy, is a developing economy, and that the existence of institutions that will be able to secure the funds for higher risk groups is necessary, we can conclude that the existence and importance of leasing is unquestionable. It is necessary to make additional efforts in the development of the leasing sector.
As a bright spot, it should be noted that the supervision of the leasing sector was granted to the Banking Agency of the FB&H and the RS Banking Agency, which was the only logical solution, taking into account the fact that these agencies have extensive experience in the supervision of
142 http://www.doingbusiness.org/data/exploreeconomies/bosnia-and-herzegovina, visited 5.3.2012.

REDETE – ECONOMIC DEVELOPMENT AND ENTEREPRENEURSHIP IN TRANSITION ECONOMIES
284
financial institutions. It can be said that the Banking Agency oversight of leasing sector is performed very professionally. This can be seen from the quarterly publication on the conditions of the leasing sector which provides in detail financial picture of the sector. Representatives of the banking agencies regularly conduct comprehensive on-site controls, visiting the leasing companies and entering into their practice, and giving them tips to improve operations.
Leasing companies in B&H have had a lot of problems over the past year related to the under-developed legal infrastructure in the sectors that are directly related to the subjects of leasing. The problems often occurred for vehicle registration in which the users were not the owners of the vehicles, and therefore were not even registered in the registration decision. The problem was solved when new rules on the registration of vehicles came into force and the registration system was further elaborated.
The B&H leasing sector, and the leasing sectors of neighboring countries are dominated by the foreign leasing companies, banks and financial groups, who share their knowledge and experience and pass it on to our market, making leasing sector advanced, but also unified in terms of development of internal policies and methods of work with the ones present in developed countries. This fact is an advantage for B&H on its road to the European Union due to the fact that it is not necessary to make significant improvements to the leasing companies themselves, since they are already based on the practices of the European leasing companies.
Reference list
1. Walker, T., „Managing lease portfolios“, John Wiley & Sons, Inc., Hoboken, New Jersey, 2006.
2. Richard, M. Contino, „The Complete Equipment-leasing Handbook“, AMACOM, a division of American Management Association, 1601 Broadway, New York, 2002.
3. AMACOM, a division of American Management Association, 1601 Broadway, New York, 2002.
4. International Accounting Standard 17 – IAS 17, EC staff consolidated version as of 24 March 2010.
5. Effective risk management in leasing companies, Proceedings 4, V Symposium of the Association of Internal Auditors in Bosnia and Herzegovina, recognized as the IIA in B&H by the IIA Global, held in Dubrovnik from 15th-17.aprila 2010th , Sarajevo, April 2010.
6. A report on the state of the banking system of the Republic of Srpska for the period 01.01. - 30.09.2011.
7. Information on the leasing sector of the Federation of Bosnia and Herzegovina 30.09.2010., the Federal Banking Agency, Sarajevo, November 2010.
8. Information on the leasing sector of the Federation of Bosnia and Herzegovina 30.09.2011., the Federal Banking Agency, Sarajevo, November 2011th
9. Information on the leasing sector of the Federation of Bosnia and Herzegovina 31.12.2011., the Federal Banking Agency, Sarajevo, March 2012.
10. Information on the banking system of the Federation of Bosnia and Herzegovina 31.12.2011., the Federal Banking Agency, Sarajevo, March 2012.
11. Information on the banking system of the Federation of Bosnia and Herzegovina 31.12.2010., the Federal Banking Agency, Sarajevo, March 2011.
12. Information on microcredit system of the Federation of Bosnia and Herzegovina 31.12.2011., the Federal Banking Agency, Sarajevo, March 2012.
13. Information on microcredit system of the Federation of Bosnia and Herzegovina 31.12.2010., the Federal Banking Agency, Sarajevo, March 2011.

REDETE – ECONOMIC DEVELOPMENT AND ENTEREPRENEURSHIP IN TRANSITION ECONOMIES
285
Laws:
1. Zakon o leasingu Federacije Bosne i Hercegovine 2. Zakon o leasingu Federacije Republike Srpske 3. Zakon o porezu na dodatu vrijednost 4. Zakon o cestovnom prijevozu Federacije Bosne i Hercegovine 5. Odluka o jedinstvenom načinu obračuna i iskazivanju efektivne kamatne stope za ugovor o
finansijskom lizingu 6. Uputstvo za primjenu odluke o jedinstvenom načinu i metodu obračuna i iskazivanja efektivne
kamatne stope za ugovor o finansijskom lizingu
Internet:
7. http://www.fba.ba 8. http://www.cbbh.ba 9. http://www.uino.gov.ba 10. http://www.leaseurope.org 11. http://www.doingbusiness.org 12. http://www.wikipedia.org 13. http://www.krediti.rs 14. http://www.investinobrenovac.com 15. http://www.ebslfinance.co.uk 16. http://www.fbibusiness.com/history_of_leasing.htm 17. http://www.kredit-lizing-leasing-kreditni-biro.info 18. http://www.thefreedictionary.com
List of tables:
19. Table 1. Position of assets of leasing companies in FB&H 277 20. Table 2. Participation in balance sheet sum of financial sector of FB&H 277 21. Table 3. Structure of new loans by type and subject of leases 278 22. Table 4. Business indicators for 2010 and 2011 280 23. Table 5. The average weighted nominal and effective interest rates 281
List of charts:
24. Chart 1. The structure of financial leasing by the leasing subject December 31,2011. 278
25. Chart 2. The structure of financial leasing, according to the leasing users December 31,2011. 279
26. Chart 3. The Movement of profit/loss by period 280 27. Chart 4. Overall average nominal and effective interest rates
of financial sector 281

REDETE – ECONOMIC DEVELOPMENT AND ENTEREPRENEURSHIP IN TRANSITION ECONOMIES
286
INTERNATIONAL TRADE OF GOODS AS A DETERMINANT
OF GDP GROWTH IN CROATIA
Ivan KOVAČ143 Mirko PALIĆ144
Abstract
The main purpose of this paper is to determine an impact of international trade, mainly the exports on the GDP growth in the Republic of Croatia in the period between 2001 and 2010. The paper analyses the influence of the exports of goods on the real GDP growth. The results show that the exports of goods have the lowest positive contribution to the GDP growth rate in the Republic of Croatia in comparison to other countries in the region. The paper explores the level of international trade of goods, imports dependency, exports propensity, degree of openness and involvement of the Republic of Croatia in the international trade of goods. The paper indicates that for the growth and development of the Croatian economy it is necessary not only to increase the exports but also to stress the importance on exports with a higher value added.
Keywords: international trade, exports, GDP growth, Croatia
JEL classification: F40
143 Ph.D., Director General, Croatian Bureau of Statistics, Ilica 3, 10 000 Zagreb, Croatia, e-mail: [email protected] 144 Ph.D., Assistant Professor, Faculty of Economics and Business, University of Zagreb, Trg J.F. Kennedya 6, 10000
Zagreb, Croatia, e-mail: [email protected]

REDETE – ECONOMIC DEVELOPMENT AND ENTEREPRENEURSHIP IN TRANSITION ECONOMIES
287
1. Introduction
Presently almost all national economies are internationalized to a large extent. Globalization and free flow of capital, goods and services are the results of the internationalization of corporate operations according to Albaum et al (1989) who consider it as the evolutionary process of deve-lopment of exports activities of business enterprises. A more comprehensive integration into the international division of labour should be the primary goal for each national economy. Interna-tionalization of business in national economies is determined by the level of internationalization of their economic entities, especially those largely involved in total exports and imports, i.e. in the international trade of a specific country. All countries find themselves to the certain degree immerged into global economy. The importance of international trade to a nation’s economic welfare and development has been the topic of great interest in the economics research since Adam Smith’s (1999(1776)) pioneering work about the wealth of nations. Smith’s main underlying principle was the need of economies to export goods and services in order to generate revenues to finance imports. Gross domestic product (GDP) is one of the key indicators for a nation’s economic strength since it represents an estimation of the value of goods and services produced by an economy in a given period. The principle that international trade can influence GDP growth has been the topic of research for many theoretical economists culminating in the export based growth thesis. This means that as export sales increase the GDP of a nation will rise too, provided other variables remaining equal. This relationship suggests that export performance has a stimulating effect on a nation’s economy (Marin, 1992). The export-led growth thesis predicts export growth will cause economy-wide productivity gains in the form of higher levels of GDP (Temple, 1994) as well as improved balance of payments.
The success of any country on the international market is determined by the competitive ability of all its entrepreneurial subjects involved in the international trade. It is crucial, in all that, to assume competitive advantage which means greater profitability (Grant, 2010). Only companies that are able to create greater economic value in comparison to their competitors can achieve competitive advantages on a global level (Barney, 2008).
In the last three decades many studies have been conducted on the relationship between internationalization and business performance of business enterprises. As Hayes and Abernathy (1980) pointed out the nation’s trade deficit cannot always be well explained by the macro-economic phenomena. The behaviour of enterprises might also play a significant role. In contrast to the international trade and FDI theories, internationalization theories endeavour to explain how and why the companies engage in international activities and how the dynamic nature of such behaviour can be conceptualized. Recent literature which covers topics of international ventures and international business entities, recognizes the inherent complexity of operating business in a global market environment, and indicates the factors which enable faster internationalization (Loane et al, 2007). Most of the authors highlight the emergence of new communication technologies and processes, increased trade liberalization, regional economic integration and growth of international networks (Knight, 2000; Knight & Cavusgil, 1996; Petersen et al, 2002). It is generally accepted that the internationalization of activities can significantly benefit the business entity engaged in it and as such it is the main initiator of their international expansion, and consequently international expansion of global national economy it belongs to (Gomes & Ramaswamy, 1999).
Internationalization is an important pathway through which new and small ventures can achieve their growth potential (Pangarkar, 2008). In addition to increasing the profitability it can achieve benefits of specialization and flexibility in the development of economies of scale and scope, stimulating the production efficiency, faster compensation of investment, access to foreign marketing, technological and managerial skills. It is not surprising that politicians at national level and beyond (e.g. EU), promote and encourage new and small international ventures (OECD, 2000). Internationalization is vital for further growth and development of new and small invest-

REDETE – ECONOMIC DEVELOPMENT AND ENTEREPRENEURSHIP IN TRANSITION ECONOMIES
288
ments in transitional countries of middle and east Europe, particularly since they have a relatively small domestic demand (Manolova et al, 2010).
Specialization is the most common strategy, and often a success guarantee of each national economy on international market. It is necessary to emphasize the significance and importance of international specialization as a crucial precondition for initiating and developing of the interna-tionalization of national economy. In terms of strong globalization, economic success of each national economy is closely related to its global market integration, and thus their success in the exchange of goods, services, capital, technology and knowledge on the global market.
Globalization has been one of the dominant themes in both the academic and business circles in the last few decades along with internationalization. The fact that global business is constantly growing and is characterized by complexity and diversity leads to an increase in scientific research for businesses entities operating internationally (Fahy, 2002).
2. Research objectives and methodology
The objective of the research was to identify the impact of exports of goods, which are mostly industrial products, on the GDP growth in the Republic of Croatia in the period between 2001 and 2010 and to compare it to the selected European countries for the same time period. In other words the export-led growth hypothesis has been tested in the Croatian context.
Although, the export-led growth hypothesis has been the subject of considerable research and empirical scrutiny in the last several decades, the link between exports and economic growth hasn’t been confirmed without a doubt. There are numerous arguments in literature about the validity of export oriented economic strategies such as (1) relocation of resources to more productive export sector, (2) increased specialization based on comparative advantage, access to advanced technologies, know-how and better management practices that may result in productivity gains and (3) faster growth because of export earnings that allow for import of essential goods important for development (Mahadevan, 2007). The focus of most researches has been on the relationship between exports and GDP, while some studies have looked at the relationship between exports and total factor productivity (TPF) growth, or the relationships between exports and labour productivity growth.
In literature that deals with the international economy stresses out a strong cause-effect relationship between the growth of a gross domestic product and foreign trade. This primarily refers to the importance and significance of the level of competitiveness of the exports sector of each country. Econometric models that aim at determining the effect of exports on GDP growth are often found in literature (Kravis, 1970). Among different authors there are different levels of the calculated coefficients determining the relationship between export revenues and the gross domestic product growth depending on the sample size, selection of different variables and their number (Balassa, 1970).
There are numerous factors determining the role and contribution of international trade to economic prosperity of a country's economy. Many analyses indicate that the rapid growth of gross domestic product in the case of a country which is very open to foreign trade is the result of a big share of exports in GDP, assuming that exports grow more progressively than the growth of imports. Michalopulos and Jay (1973) in their paper calculated that the exports growth by 1% leads to growth of gross national product between 0.58% and 0.77%. However, the positive correlation between economic growth and exports has been found only when exports contributed to the technological development, inflow of foreign capital and higher general productivity of national economy (Islam, 1998).
This study investigates direct linkage between exports of goods and GDP growth in Croatia and as such adds valuable contribution to the testing of export led growth hypothesis. According to the export-led thesis the main research hypothesis were:
REDETE – ECONOMIC DEVELOPMENT AND ENTEREPRENEURSHIP IN TRANSITION ECONOMIES
289
H1: Export of goods significantly and positively contributes to the growth of GDP in Croatia.
H2: Export of goods contribution to the Croatian GDP is similar to that of the Central
European Countries such as Slovenia, Check Republic and Slovakia.
In order to calculate results regarding export contribution to GDP, data on the aggregate Croatian economy in the period 2001 to 2010 on value-added GDP were obtained from the Croatian Bureau of Statistics. Publications such as Statistical Yearbook of Republic of Croatia, First release – Foreign trade in goods for relevant years, First release – Export and import price indices of the Republic of Croatia for relevant period, as well as GDP and export price indices were obtained from the Croatian Bureau of Statistics. Data regarding other European countries have been obtained from EUROSTAT database and Europe in figures – Eurostat yearbook. Data on trade variables such as export and import price indices, total exports, and total imports were downloaded from the World Development Indicators CD-ROM. All variables are expressed in constant prices.
The importance of international trade of goods in the Republic of Croatia is analysed in order to better understand the structure and trends of the Croatian international trade in the section 3 of the paper. The fourth section entitled “The contribution of exports of goods to the real GDP growth in the Croatian context” presents results of calculations of export of goods contribution to the GDP of Croatia and several selected countries. Hypothesis validation and brief discussion about results are placed in the concluding remarks at the end of the paper.
3. International trade of goods in the Republic of Croatia during period 2001-2010
The Republic of Croatia in the economic sense belongs to a group of small countries, and in terms of its resources it is a medium-rich country. Consequently, international business, above all exports of goods and services on international market, represents the utmost importance for its faster and stronger economic growth and development. However, it should not be forgotten that several aggravating circumstances are still present in the Croatian economy in terms of exports, mainly: fragmented production of the Croatian economy, insufficient production capacities, more difficult access to global capital, problems associated with the transfer of new technologies and knowledge, etc. According to the literature the success of export mostly depends on access to financial resources (Ling-yee & Ogunmokun, 2001). However, the dominant issue related to the Croatian international trade is its low level of competitiveness on international markets. For many years one of the strategic goals of Croatian policy has been to strengthen export as well as the overall competitiveness of the Croatian economy. Exports are undoubtedly among the most important and fastest growing activity with a growth rate greater than production in the international economy (Lee & Habte-Giorgis, 2004).
In terms of export structure of the Croatian economy it is very important to emphasize the share of products with high value added in relation to exports of raw materials, lohn production, and products of lower value added. Only a large share of exports of products whose value added is high would ensure the benefits for Croatian economy. They generate income, provide long-term competitiveness, employment, and thus contribute to the welfare of the general Croatian economy. For growth and development of Croatian economy in terms of international trade it is extremely important to increase exports with favourable structure related to products with high value added as well as greater coverage of imports by exports.
To achieve export growth, it is essential that every business entity develop its own competitive strategy on the international markets based on its own potentials, which represents

REDETE – ECONOMIC DEVELOPMENT AND ENTEREPRENEURSHIP IN TRANSITION ECONOMIES
290
a long-term comparative advantage, and thus provide an increase of value-addition to its products and services. By using different modalities of international marketing, business entities learn effectively how to successfully export to international markets, and how to gain international experience (Grbac, 2009; Root, 1987). When analysing the value added of export products, the most important factors are related to the application of knowledge and innovation and the use of new technologies. Equally important is the application of the latest knowledge related to marketing, sales and distribution. For the success of the Croatian economy as a whole, in terms of international trade, the most significant factor represents the transfer of knowledge and technologies and strategic links with international business entities.
The main focus of this study is foreign trade of goods, not services as a way of analysing the development and competitiveness of Croatian industry and its integration in the international specialisation. Such approach significantly facilitates the analysis of the exports capabilities of Croatian industry. In Croatian foreign trade analysis it is necessary to distinguish international trade of goods from international trade of services because exports of services made up a larger part of international trade in period from 2001 to 2010, which is displayed in table 1. The biggest and most important part of exports of services is tourism, which comprises 72.3% of total exports. Within the framework of international trade in the last 10 years, along with transportation, tourism and insurance service, some new types of services have become more important, especially those related to modern telecommunications. Comparing the Croatian structure of exports with the structure of the world trade in 2003 it is possible to observe that the share of services is around 20% in the total world trade. Goods, on the other side, make up 80% of total world trade, amongst which dominate products of manufacturing industry (Krugman & Obstfeld, 2009). This emphasizes the main difference between the World’s and Croatian exports structure.
Table 1: Share of exports of goods and services in GDP in Croatia for the period 2001 – 2010 (%)
Year Exports of goods and services
Exports of goods
Exports of services
Imports of goods and services
Imports of goods
Imports of services
2001 43,4 20,7 22,8 47,4 38,5 8,9 2002 40,9 18,8 22,1 49,3 39,9 9,4 2003 42,6 18,4 24,1 50,4 41,5 9,0 2004 42,9 20,0 22,9 49,3 40,3 9,0 2005 42,3 20,0 22,2 48,7 40,9 7,9 2006 42,7 21,3 21,4 49,8 42,3 7,5 2007 42,1 21,2 21,0 49,8 42,9 6,8 2008 41,7 20,5 21,1 49,9 43,1 6,8 2009 35,4 16,9 18,6 39,4 33,1 6,3 2010 38,3 19,8 18,5 38,8 32,8 6,1 Data source: Authors’ calculation based on different data sources (CBS, First release ‘Revision of annual Gross domestic product, 1995-2007’, CBS, First release ‘Quarterly Gross domestic product estimate since first quarter 2000 until fourth
quarter 2010’, Newsletter of Croatian National Bank, No. 171, table H-6, exports-imports of services 2008-2010, authors’ calculation of exports-imports of services for period 2008-2010)
The structure of total exports indicates that exports of services make up for more than half of
total export, except in years 2007 and 2010. This type of export registers a constant decline since 2003. On the contrary, imports of goods are far more prevalent than imports of services (more than 80% of total imports is import of goods), and they grew slightly during the whole observed period until the beginning of the recession.
As already outlined in the text, the level and growth of exports is not the only important issue. The structure of exports in terms of share of products with high value added, raw materials, lohn businesses and products with low value added should also be observed. Table 2 shows the share of export of 56% after internal production in 2001, which mainly presents lohn businesses, while

REDETE – ECONOMIC DEVELOPMENT AND ENTEREPRENEURSHIP IN TRANSITION ECONOMIES
291
this share in 2008 dropped to 31.8%. That indicates positive trend in exports structure, but on the other side, it shows that the lohn businesses share is still very high in the total Croatian exports structure, what is, certainly, still very adverse compared with other countries which are more successful in international trade.
Table 2: Exports of goods of Croatia according to statistical procedures (million USD)
2001 2002 2003 2004 2005 2006 2007 2008 2009 2010
TOTAL EXPORTS 4 666
4 904
6 187
8 024
8 773
10 377
12 364
14 124
10 492
11 811
11. Normal exports 1 743
2 018
2 902
4 218
4 985
6 240
7 629
8 903
7 096
7 710
13. Exports for outward processing
182 119 346 297 309 440 587 739 153 242
15. Exports after inward processing (suspension
system)
2 636
2 760
2 938
3 508
3 478
3 697
4 147
4 482
3 242
3 857
16. Exports after inward processing (drawback
system)
104 5.7 1.3 1.3 0.7 0.03 - - 0.7 0.9
Data source: Author's calculation based on CBS data
Analyzing the imports of goods (Table 3) in the period since 2001 when it value reached 9.1
billion USD and 2008 when it was 30.7 billion USD, it is evident that in contrast to the exports which in this period increased by 202%, imports grew by as much as 235%. However, this is not a rare phenomenon. It can be observed for example in the case of the United States where, since 1980, exports as well as imports have steadily increased as a share of GDP. After this period U.S. exports highly varied in relation to imports and had a lower growth (Krugman & Obstfeld, 2009).
Table 3: Imports of goods of Croatia according to statistical procedures (million USD)
2001 2002 2003 2004 2005 2006 2007 2008 2009 2010
TOTAL IMPORTS 9 147 10 722
14 209
16 589
18 560
21 502
25 839
30 727
21 205
20 067
11. Regular imports 7 469 9 320 12 402
14 536
16 393
19 099
23 091
27 529
19 270
18 127
13. Imports after outward processing
56 025
34 485
36 866
39 107
63 912
60 406
64 504
94 725
61 056
77 406
15. Imports for inward processing (suspension
system)
1 620 1 367 1 770 2 013 2 103 2 343 2 683 3 104 1 873 1 862
16. Imports for inward processing (drawback
system)
1.29 0.49 0.25 0.52 0.20 0.04 0.06 - 0.62 0.52
Data source: Author's calculation based on CBS data
In years 2009 and 2010 there was a decrease in imports by more than 30% compared to the year 2008, which also, as well as for exports, indicates the reduction in economic activity caused by the global economic crisis. Comparing the trends in exports and imports it is evident that imports, as opposed to exports, have not returned to the levels before the crisis, meaning the level of exports in 2007 and 2008.
International trade of goods of Croatian economy in 2001 (exports + imports) amounted to 60.45% of gross domestic product, which represents the level of involvement of the country, or the involvement of the national economy to international trade. Such involvement grew through the time and in year 2008 rose to 64.17% of gross domestic product. With the appearance of the

REDETE – ECONOMIC DEVELOPMENT AND ENTEREPRENEURSHIP IN TRANSITION ECONOMIES
292
global economic crisis, the degree of involvement of Croatian economy in international trade fell to 49.83% and in 2010 again started to rise and reached 52.36% of gross domestic product. For each country, especially for small countries such as Croatia, involvement and better integration into the global economy through international trade is extremely important. However, the relationship between exports and imports and achievement of a positive trade balance are even more important.
Despite a relatively successful process of convergence towards the developed countries in the region, Croatian industry which makes products for most of the analysed international trade in the observed period, continually decreased its share in Gross value added (GVA - difference between gross output and intermediate consumption) so the increase of international trade of goods is more the result of an import growth than export growth. Import of goods recorded a high growth levels until 2008, while in year 2009 recession had a strong impact on reducing the volume of foreign trade as well as in the case of other European countries.
During 2010 a recovery in Croatia was slower than the international trade recovery in other EU countries. This was confirmed by comparison of Croatian international trade in 2009 with similar countries. Namely, Croatia had the smallest overall international trade (31.7 billion USD) compa-red to Slovenia (46.1 billion USD) and Czech Republic with 217.7 billion USD (World Statistics Pocketbook, 2010). Low Croatian export represents a consequence of lower competitiveness of Croatian companies, while on the other side lower imports represent a slow recovery as a result of still weak domestic demand, both for the consumer and investment goods.
In terms of economic growth the most important role in the Croatian international trade belongs to the exports of goods since it presents a picture of competitiveness of Croatian economy in relation to the overall level of the competitiveness of the global economy. Analyzing the exports in the period 2001-2010 it is evident that they were constantly growing since year 2001 when they reached the value of 4.6 billion USD, until year 2008 when it was 14.1 billion USD. The exports in the observed eight years grew by more than 200%. When recession hit Croatia the decrease in exports followed by 25.8% in 2009 in comparison with the previous year. For example, the Czech Republic (22.7%) and Slovenia (22.1%) recorded a lower decrease (Monthly Bulletin of Statistics). The Croatian exports in year 2010 compared to 2009 rose by 12.5%, which may indicate a gradual recovery of export.
For many years the Croatian economy has recorded a negative trade balance, which implies that exports demand is not a generator of economic growth in Croatia, but rather a domestic demand that for many years has been financed with debt. This indicates a negative contribution of the international trade to GDP growth in the Croatian case. The degree of coverage of imports by exports is less than 1. When the coverage of exports by imports of Croatian economy is compared to strong export-oriented economies of other countries such as China, whose exports coverage by imports in 2002 amounted to 2.11, then 1.85 of Indonesia, Malaysia 1.48 and Thailand 1.38, it is obvious that Croatian economy has a low export orientation (Mikic & Gilbert, 2008). In 2009 the exports of the Republic of Croatia amounted to 2 376 US$ per capita, while the exports in Czech Republic amounted to 10 887 US$ and in Slovenia amounted to 11 062 US$ per capita. This indicates a low level of Croatian exports per inhabitant in comparison to those two countries (Monthly Bulletin of Statistics).
The level of openness of a country in relation to the international trade is measured by various indicators. Most often the share of exports of goods and services in gross domestic product is observed as an indicator that determines exports propensity of the national economy. Another typical indicator is imports dependency, which is calculated as the share of imports of goods and services in gross domestic product, and an indicator of the level of involvement of each country in the international trade. It is calculated as the share of exports and imports of goods and services in gross domestic product.
In the period before 2008, the Croatian economy has recorded an increased share of imports in the GDP. However, exports did not follow the dynamics of imports, which led to an increased deficit in the balance of payments. The recession has led to a significant reduction in imports

REDETE – ECONOMIC DEVELOPMENT AND ENTEREPRENEURSHIP IN TRANSITION ECONOMIES
293
dependency, but it should be viewed in the context of the reduction of the total international trade of goods. The index of imports dependency in the Republic of Croatia ranged from 32.97% (2010) to 43.97% (2007).
The last two observed years (2009 and 2010) recorded a significant decrease in imports dependency (from 43.94% 2008 to about 33% in 2009 and 2010). However, this decline should not be attributed to the reduction of imports dependency of the Republic of Croatia, but the overall decline of the international trade of goods of the Croatian economy in those years. Exports propensity of goods ranged from the low 16.49% in 2009 to the high 21.11% in 2006. In general, the share of exports in the GDP places Croatia on the global market among the countries with lower exports growth, unlike for example the Netherlands, where the exports of goods amounted to mostly over 50%, in 2008 and over 60% in 2010. In the past 10 years Hungary has significantly improved its share of exports in GDP which grew from 51.2% in 2003 to 71.7% in 2010. Switzerland and Austria have also progressed in this area well - before the recession. Among the selected countries only the Republic of Croatia had exports propensity of goods below 25% in the whole analysed period145.
The average share of exports in GDP in the Republic of Croatia amounted to 19.48%, while the average imports dependency in the same period was twice as large (40.26%). All the above indicates the extreme import orientation of the Croatian economy as a whole. The share of exports in the GDP in the period from 2001 till 2008 fluctuated around the same level until the emergence of a recession, and as a result of decrease in the overall international trade there has been a significant reduction in the share of exports in the GDP. Average openness of the Republic of Croatia in the analysed period amounted to 59.74%. This is far from the best countries in the field such as Singapore which has an openness of more than 300%, followed by Malaysia with openness of more than 170% and Thailand with 120% (Mikic & Gilbert, 2008).
4. The contribution of exports of goods to the real GDP growth in the Croatian context
One of the fundamental macroeconomic questions is how much the real growth of exports of goods contributes to the rate of real GDP growth. GDP by the expenditure approach consist of the sum of final consumption expenditure of households, final consumption expenditure of general government, gross fixed capital formation, plus the exports of goods and services, minus the imports of goods and services. Considering the fact that for each listed category real growth is calculated and the sum of all categories (minus imports) makes the real GDP growth, it is possible to calculate the contribution of exports of goods to the real GDP growth rate, which is done in this paper.
To calculate the contribution of individual categories on GDP growth rate the following formula has been applied (Lequiller & Blades, 2006)
Using a simplified example, let us assume there are only two aggregates in GDP: household consumption, denoted by Ct and exports, denoted by Xt. GDPt will denote GDP in year t. Δ will be used to indicate the variation in an aggregate, so that ΔGDP will signify the variation of GDP between t and t+1. Using this notation, the GDP growth rate can be written as ΔGDP/GDPt. Contribution of a component to GDP growth has been calculated as the real growth rate of this
145 See: http://epp.eurostat.ec.europa.eu/portal/page/portal/national_accounts/introduction

REDETE – ECONOMIC DEVELOPMENT AND ENTEREPRENEURSHIP IN TRANSITION ECONOMIES
294
component weighted by the share of this component in the GDP in the previous year for current prices. Thus, contributions reflect two effects: the speed with which a component changes and the relative importance of the component in total GDP. The contributions of individual demand components to GDP growth depend on their shares in GDP in the previous year and their growth rate in the current year (Havlik et al, 2011).
The above formula shows the contribution of GDP growth rate which is result of changes in
export if other components remain unchanged. We used a simplified formula with assumed only one aggregate in GDP: exports, denoted by Xt. GDPt denoted GDP in year t. Δ was used to indicate the variation in an aggregate, so that ΔGDP signified the variation of GDP between t and t+1.
Graph 1 presents results of contribution of exports of goods to the real GDP growth rate in Croatia. The highest contribution was in years 2004 and 2010 with 2.5 percentage points, while the lowest contribution was in 2009 with -3.7 percentage points which was due to the strong recession of that time.
Graph 1: Contribution of exports of goods to the real GDP growth rate in Croatia (in percentage points - bars) vs. GDP growth rate (in % - line)
For the research purpose of this paper several EU countries (from Table 4) were selected in
order to analyze the impact of exports of goods on the real GDP growth rate for each of these countries. After calculating the contribution of exports of goods to the rate of real GDP growth in Croatia, the data have been analysed and compared.
To get an idea of the ten years period of economic developments in these countries, Table 4 shows the rates of real GDP growth of selected countries in the period 2001 to 2010, since not only the amount of the contribution rate of exports of goods to the GDP growth is important, but also the height of the real rate of GDP growth.

REDETE – ECONOMIC DEVELOPMENT AND ENTEREPRENEURSHIP IN TRANSITION ECONOMIES
295
Table 4: Real GDP growth of selected countries in the period 2001-2010 (%)
Country/Year 2001 2002 2003 2004 2005 2006 2007 2008 2009 2010
Belgium 0,8 1,4 0,8 3,2 1,7 2,7 2,9 1,0 -2,8 2,2
Czech Republic 2,5 1,9 3,6 4,5 6,3 6,8 6,1 2,5 -4,1 2,3
Denmark 0,7 0,5 0,4 2,3 2,4 3,4 1,6 -1,1 -5,2 1,7
Hungary 3,8 4,1 4,0 4,5 3,2 3,6 0,8 0,8 -6,7 1,2
Netherlands 1,9 0,1 0,3 2,2 2,0 3,4 3,9 1,9 -3,9 1,8
Austria 0,9 1,7 0,9 2,6 2,4 3,7 3,7 1,4 -3,8 2,3
Slovenia 2,9 3,8 2,9 4,4 4,0 5,8 6,9 3,6 -8,0 1,4
Slovakia 3,5 4,6 4,8 5,1 6,7 8,5 10,5 5,8 -4,8 4,0
Switzerland 1,2 0,4 -0,2 2,5 2,6 3,6 3,6 2,1 -1,9 2,7
Croatia 3,7 4,9 5,4 4,1 4,3 4,9 5,1 2,2 -6,0 -1,2
Data source: http://epp.eurostat.ec.europa.eu/portal/page/portal/statistics/search_database (September 19th 2011)
Table 5 displays the results of a calculation regarding contribution of exports of goods to the
real GDP growth rate for the selected countries. It shows that in a decade long period the Croatian export of goods had the smallest contribution to the realized growth rate of GDP compared to the selected countries. If Croatia is compared to Slovenia, it is obvious that the real growth of Slovenian exports of goods contributes much more to the real GDP growth rate than in the Croatian case. The average rate of real GDP growth for Slovenia in the period 2001-2007 amounted to 4.4%, while the average contribution of exports of goods in the same period amounted to 4.94 percentage points. The same negative indicators were present when Croatia was compared to Hungary which in the period 2001-2007 recorded an average real GDP growth of 3.4%, while the average contribution of exports to real GDP growth amounted to 7.4 percentage points. During the same period, the average real growth rate of the Croatian GDP amounted to 4.6%, while the average contribution of exports of goods to the real growth rate amounted to 1.2 percentage points. When the average growth rate of GDP of selected countries in the period 2001-2007 is compared, it can be observed that countries which have the highest average growth rate of GDP (6.2% of Slovakia, Czech Republic 4.5%, Slovenia 4.4%, Hungary 3.4%), also have the highest average contribution rate of exports of goods to the GDP real growth rate. The exception is Croatia, which in the period from 2001 till 2007 with relatively high average growth rate of 4.6% had one of the lowest average contributions of exports of goods to the GDP growth which amounted to 1.2 percentage points. The explanation lies in the fact that in this period, the largest positive contribution to the realised growth rate of GDP was contributed by a real growth of households (4.9%). The contribution of households amounted to 3.0 percentage points on average, and the real growth of gross fixed capital formation with the average growth rate of 12.3% and the average contribution of 2.9 percentage points.

REDETE – ECONOMIC DEVELOPMENT AND ENTEREPRENEURSHIP IN TRANSITION ECONOMIES
296
Table 5: Contribution of exports of goods to the real GDP growth rate for selected EU countries (in percentage points)
Country/Year 2001 2002 2003 2004 2005 2006 2007 2008 2009 2010
Belgium 0.2 2.0 0.9 4.5 2.7 3.5 2.2 0.5 -7.8 7,8
Czech Republic 7.6 3.0 4.9 14.1 7.3 11.0 11.1 3.8 -8.5 12,9
Denmark 0.8 1.4 -0.6 1.3 1.8 1.4 -0.2 -0.2 -3.1 1,6
Hungary 4.1 3.1 4.9 10.2 6.4 11.6 11.3 3.9 -7.7 12,0
Netherlands 1.0 0.6 1.1 4.8 3.3 5.1 3.9 1.5 -4.8 7,8
Austria 2.2 1.8 0.3 4.8 2.5 3.0 4.3 0.1 -5.9 4,2
Slovenia 3.2 2.9 1.9 6.1 5.2 7.3 8.0 0.3 -8.3 5,7
Slovakia 3.9 3.1 13.8 5.1 6.4 16.5 11.7 2.7 -9.6 13,9
Switzerland 0.5 0.5 0.0 2.5 2.0 4.2 3.3 1.0 -4.0 3,6
Croatia 0.8 -0.2 1.3 2.5 1.4 2.2 0.6 0.03* -3.7* 2.5*
Data source: authors' calculations *Croatian GDP for the years 2008, 2009 & 2010 has been approximated from the addition of quarterly reports
The lowest result of contribution to the realized GDP real growth rate in Croatia comes from
very high import rate with the average real growth rate of 8.6% which represents an average negative contribution of 4.1 percentage points. In the period 2001-2007 the contribution of domestic demand to the GDP real growth rate amounted to 6.4 index points, while the contribution of net external demand (exports of goods and services minus imports of goods and services) was negative and amounted to 1.7 percentage points. From the above it can be concluded that in the observed countries, which had high rates of GDP growth, exports of goods were certainly one of the components that positively contributed to the high growth of GDP in the period 2001 to 2007. On the other hand, the Croatian exports of goods, in comparison to the countries in the region, had significantly smaller positive contribution to the real GDP growth (1.2 percentage points). The following graph shows a 10 year average contribution of exports of goods to the real GDP growth rate displayed for selected countries. As it can be observed Denmark and Croatia had the lowest contributions while the Czech Republic and Slovakia had the highest.

REDETE – ECONOMIC DEVELOPMENT AND ENTEREPRENEURSHIP IN TRANSITION ECONOMIES
297
Graph 2: Contribution of exports of goods to the real GDP growth rate for selected EU countries (in percentage points) – 10 year average (2001-2010)
Table 6 shows the share of the contribution of exports of goods to the rate of real GDP growth from which it is obvious that the Republic of Croatia had one of the smallest share of the contribution of exports of goods to the rate of real GDP growth in the observed period.
Table 6: Percentage of the contribution of exports of goods to the real GDP growth rate (%)
2001 2002 2003 2004 2005 2006 2007 2008 2009 2010
Belgium 23.3 144.8 111.5 142.2 159.5 131.1 75.9 54.3 279.4 356.5
Czech Republic 304.4 158.1 137.4 312.8 115.3 162.5 181.6 152.5 206.3 559.8
Denmark 112.5 280.3 -151.8 55.5 76.1 41.8 -12.1 18.3 58.7 93.0
Hungary 108.6 75.1 121.6 227.4 198.5 321.9 1409.4 487.1 115.4 998.0
Netherlands 50.1 648.6 358.7 218.0 167.4 149.8 99.8 77.8 122.3 434.2
Austria 240.3 104.1 38.5 182.9 104.7 80.0 115.9 9.2 154.3 184.3
Slovenia 110.2 76.0 67.1 138.1 130.9 126.7 115.4 7.5 103.6 407.9
Slovakia 112.8 67.5 287.1 100.9 95.2 194.2 111.1 46.0 200.2 348.0
Switzerland 39.6 115.6 16.2 99.1 78.6 116.7 92.7 49.3 212.9 133.3
Croatia 21.8 -4.6 23.9 61.0 31.7 44.8 11.6 1.6 62.2 -211.0
Data source: authors' calculations
The research results and the conducted analysis point toward several important conclusions: - Exports of goods do not significantly contribute to the growth of the GDP in Croatia (and
sometimes it is actually negative). This leads to the rejection of the first proposed hypothesis. From the presented data it seems that Croatia deviates from the dominant export-led GDP growth theory of international trade.
- As such Croatian export of goods contribution to the GDP growth is not similar to that of the comparable European countries such as Slovenia, the Czech Republic and Slovakia which leads to the rejection of the second proposed hypothesis in this paper.
- The reasons for Croatian deviation from the export-led GDP growth theory can be found in the fact that low competitiveness of the Croatian exporters resulted with a low-value added

REDETE – ECONOMIC DEVELOPMENT AND ENTEREPRENEURSHIP IN TRANSITION ECONOMIES
298
of exported goods. At the same time Croatian growth model has been based on domestic consumption demand that was in large part satisfied through ever increasing imports in comparison to the other observed countries in this paper. The impact of global recession on international trade has been negative and strong but the recovery speed of national economies has been in correlation to their export strengths and growth. Croatia had also a negative GDP growth in 2010 as a result of a significantly lower contribution of exports to the real GDP growth rate than the other observed countries (with exception of Denmmark).
5. Conclusion
The paper focuses on the last decade which is characterized by the global economic crisis and the rising importance of international trade as an instrument of a faster recovery from the rece-ssion. Consequently, exports of goods are extremely important for Croatia’s stronger economic growth and development.
International business or international trade of each country affects the dynamics of its economic growth and development. The paper showed that the exports of goods were certainly one of the components that had a high positive contribution to real GDP growth in the analyzed countries. On the other hand it was also established that Croatian exports of goods, compared to the observed countries had significantly less positive contribution to real GDP growth (1.2 percentage points or 0.7 if recession years are added into calculation).
In order to obtain a true image of the international trade trend from 2001 till 2010 the paper separately analyses the period before the economic crisis (2001 to 2008), the year of crisis (2009) and the year of recovery (2010). The analysis of the Croatian international trade in the period 2001 - 2010 indicates a low commodity export propensity of the Croatian industry. At the same time the average goods import dependency was twice as large compared to export dependency. It is evident from the above mentioned that there is the low coverage of imports by exports, which on average amounts to 0.49 in the period from 2001 till 2010. All of the above indicates the extreme import orientation of the Croatian economy as a whole. In the period from 2001 till 2007 the contribution of domestic demand to the GDP real growth rate amounted to 6.4 percentage points, while the contribution of net external demand (exports of goods and services minus imports of goods and services) was negative and amounted to 1.7 percentage points.
The recession has led to a significant reduction in import dependence, but not as a result of positive changes but rather as a consequence of the reduction of trade in the total international trade of goods. In the Republic of Croatia there are several factors that brought about the poor competitiveness of the Croatian economy in the international market. Those are for example the fragmented production of the Croatian economy, inadequate horizontal and vertical links of interest business entities, insufficient production capacity, lack of foreign investment and weak technological development. Namely, imports of products of high technological level result in an increase of the technological base of the domestic economy and in a rise in domestic competiti-veness and exports. In the case of the Croatian economy, the process of technology transfer was slow in comparison to the new EU member countries. The exports did not follow the pace of import growth, which led to an increase in the deficit in the balance of payments.
One of the main strategic objectives of the Croatian economy in recent years has been asso-ciated with export growth, and hence higher competitiveness of the economy. In order to promote growth and development of Croatian economy it is necessary to increase exports (especially products with high value added), and thus the higher coverage of imports by exports. Only such continuous export orientation can lead to GDP growth, which will lead to long-term growth of the living standards and thus positively affect the further development of Croatian economy. The results of the conducted research indicate the need for faster development of the Croatian economy and society through more effective integration into the international specialization and overall globalization of the Croatian economy.

REDETE – ECONOMIC DEVELOPMENT AND ENTEREPRENEURSHIP IN TRANSITION ECONOMIES
299
Reference list
1. Albaum, G., Strandskov, J., Duerr, E., & Dowd, L. (1989), ‘International marketing and export management’; Wokingham, UK; Reading, MA: Addison Wesley
2. Balassa, B. (1970), ‘Export and economic growth’, Journal of Development Economics, North – Holland Publising Company, No. 5, 181-189
3. Barney, J., B. (2008), ‘Strategic Management and Competitive Advantage’, 2nd ed., Pearson Prentice Hall
4. CBS, First release ‘Revision of annual Gross domestic product, 1995-2007’, 5. CBS, First release ‘Quarterly Gross domestic product estimate since first quarter 2000 until
fourth quarter 2010’, 6. Fahy, J., (2002), ‘A resource-based analysis of sustainable competitive advantage in a
global environment’, International Business Review 11, 57–78 7. Gomes, L., & Ramaswamy, K. (1999), ‘An empirical examination of the form of the
relationship between multinationality and performance’, Journal of International Business Studies, 30(1), 173–198
8. Grant, R., M., (2010), ‘Contemporary strategy analysis’, 7th ed., Wiley & Sons, United Kingdom
9. Grbac, B. (2009), 'Izazovi međunarodnog tržišta', Faculty of economics Rijeka, Rijeka, 161-169
10. Havlik, P. et al. (2011), Economic Prospects for Central, East and Southeast Europe: Recovery – in Low Gear across Tough Terrain, The Vienna Institute for International Economic Studies
11. Hayes, R.A. & Abernathy, W.J. (1980), “Managing our way to economic decline”, Harvard Business Review, July-August, pp. 67-77
12. Islam, M., N. (1998), ‘Export expansion and economic growth: testing for cointegration and causality’, Applied Economics, London, Routledge, Vol. 30., No. 3, 415-424
13. Knight, G. (2000), ‘Entrepreneurship and marketing strategy: The SME under globalization’, Journal of International Marketing, 8(2), 12–32
14. Knight, G., & Cavusgil, S. T. (1996), ‘The born global firm: A challenge to traditional internationalization theory’, Advances in international marketing (8), Greenwich, CT: JAI Press. 11–26
15. Kravis, I. (1970), ‘Trade as a handmaiden of growth: Similarities between the nineteenth and twentieth centuries’, Economic Journal, No. 9+80., 870-872
16. Krugman, P.R., Obstfeld, M. (2009), ‘Međunarodna ekonomija’, seventh edition, Mate, Zagreb
17. Lee, J., Habte-Giorgis, B. (2004), ‘Empirical approach to the sequential relationships between firm strategy, export activity, and performance in U.S. manufacturing firms’, International Business Review 13, 101–129
18. Lequiller, F., Blades D. (2006), 'Understanding National Accounts', OECD, 61 19. Ling-yee, L., Ogunmokun, G., O. (2001), ‘Effect of Export Financing Resources and Supply-
Chain Skills on Export Competitive Advantages: Implications for Superior Export Performance’, Journal of World Business / 36(3) / 260–279
20. Loane, S., Bell, J.D., McNaughton, R. (2007), ‘A cross-national study on the impact of management teams on the rapid internationalization of small firms’, Journal of World Business 42, 489–504
21. Mahadevan, R. (2007), “New Evidence on the Export-led Growth Nexus: A Case Study of Malaysia”, The World Economy, Journal compilation, Blackwell Publishing, pp. 1069-1083
22. Manolova, T.S., Manev, I.M., Gyoshev, B.S. (2010), ‘In good company: The role of personal and inter-firm networks for new-venture internationalization in a transition economy’, Journal of World Business 45, 257–265
23. Marin, D. (1992), “Is the export-led growth hypothesis valid for industrialized countries?”, The Review of Economics and Statistics, Vol. 74, pp. 678-88

REDETE – ECONOMIC DEVELOPMENT AND ENTEREPRENEURSHIP IN TRANSITION ECONOMIES
300
24. Michalopoulos, C. and K. Jay, ‘Growth of Exports and Income in the Developing World: A Neo-classical View’, A.I.D discussion paper, 28, Washington, D.C, 1973
25. Mikic, M., Gilbert, J. (2008), Trade Statistics in Policymaking: ‘A handbook of commonly used trade indices and indicators’, available at: http://www.scribd.com/doc/57309387/9/Export-Import-Coverage
26. Monthly Bulletin of Statistics, Issue No. 1081, Vol. LXV, No. 7 27. Newsletter of Croatian National Bank No. 171 28. Organization for Economic Cooperation and Development (2000), ‘Enhancing the
competitiveness of SMEs in transition economies and developing countries in the global economy and their partnership with SMEs of OECD countries’, Paris, France: OECD
29. Petersen, B., Welch, L. S., & Liesch, P. W. (2002), ‘The Internet and foreign market expansion by firms’, Management International Review, 42(2): 207–221
30. Pangarkar, N. (2008), ‘Internationalization and performance of small-and-medium sized enterprises’, Journal of World Business, 43: 475–485
31. Root, F.R. (1987), ‘Entry Strategies for International Market’, Lexington MA: Lewington Books
32. Smith, A. (1999 (1776)), The Wealth of Nations Books I-III, Penguin Classics, London. 33. Temple, P. (1994), “Overview: understanding Britain’s economic performance: the role of
international trade”, in Buxton, A. Chapman, P. and Temple, P. (Eds), Britain’s Economic Performance, Routledge, London, pp. 31-56
34. World Statistics Pocketbook, (2010) 35. Data on the real GDP growth:
http://epp.eurostat.ec.europa.eu/portal/page/portal/national_accounts/introduction
Appendix: Exports of goods of Croatia according to statistical procedures (thousand USD)
2001 2002 2003 2004 2005 2006 2007 2008 2009 2010 TOTAL EXPORTS 4 665
908 4 903 584
6 186 630
8 024 157
8 772 553
10 376 964
12 363 930
14 123 675
10 491 835
11 810 676
11. Normal exports 1 743 386
2 018 119
2 901 781
4 218 307
4 984 616
6 239 963
7 629 343
8 903 311
7 095 866
7 710 119
13. Exports for outward processing
182 333
119 523
345 791
296 741
309 068
439 859 587 152 738 661 152 804 242 250
15. Exports after inward processing (suspension
system)
2 635 909
2 760 255
2 937 750
3 507 854
3 478 164
3 697 112
4 147 435
4 481 703
3 242 434
3 857 416
16. Exports after inward processing (drawback
system)
104 280
5 687 1 308 1 256 705 30 - - 731 891
Data source: Author's calculation based on CBS data
Imports of goods of Croatia according to statistical procedures (thousand USD)
2001 2002 2003 2004 2005 2006 2007 2008 2009 2010
TOTAL IMPORTS 9 147 130
10 722 045
14 209 035
16 589 172
18 560 367
21 502 494
25 838 828
30 726 987
21 204 851
20 067 005
11. Normal imports 7 469 465
9 320 364
12 401 917
14 536 410
16 392 845
19 099 398
23 091 278
27 528 713
19 270 291
18 127 153
13. Imports after outward processing
56 025 34 485 36 866 39 107 63 912 60 406 64 504 94 725 61 056 77 406
15. Imports for inward processing (suspension
system)
1 620 352
1 366 702
1 770 001
2 013 132
2 103 405
2 342 655
2 682 985
3 103 548
1 872 885
1 861 925
16. Imports for inward processing (drawback
system)
1 289 494 250 523 204 35 61 - 620 520
Data source: Author's calculation based on CBS data

REDETE – ECONOMIC DEVELOPMENT AND ENTEREPRENEURSHIP IN TRANSITION ECONOMIES
301
Calculation results 2005 2006 2007 2008 2009 2010
European Union (27 countries) 1,5848 2,9898 1,52 0,3744 -3,807 3,978
European Union (25 countries) 1,6131 2,9596 1,52 0,3744 -3,834 3,9345
European Union (15 countries) 1,4575 2,7156 1,3185 0,2408 -3,7296 3,6918
Euro area (17 countries) 1,49 2,9072 2,1384 0,2282 -4,0572 4,1265
Euro area (16 countries) 1,485 2,9072 2,1384 0,2282 -4,0572 4,1265
Euro area (15 countries) 1,4455 2,8574 2,0865 0,1938 -4,0278 4,043
Euro area (13 countries) 1,4504 2,8574 2,093 0,1938 -4,0278 4,056
Euro area (12 countries) 1,4455 2,8483 2,0544 0,1932 -4,0131 4,043
Belgium 1,9424 3,6598 2,6814 0,7908 -9,6192 6,54
Bulgaria -7,47 43,4478 2,7218 1,7589 -3,819 8,9631
Czech Republic 5,9064 8,05 6,7032 1,644 -5,85 9,7983
Denmark 1,824 1,419 -0,1938 0,333 -2,9205 1,1359
Germany 2,698 5,0048 3,4595 0,9476 -5,7213 6,0344
Estonia 12,3889 3,9546 0,9702 0,679 -9,6096 17,0877
Ireland 0,508 -0,1389 2,0378 -0,135 -2,6082 2,9792
Greece 0,6678 0,5457 0,4387 -0,0428 -1,3659 0,54
Spain 0,1914 1,1748 1,3725 -0,3186 -1,95 2,4888
France 0,5616 1,333 0,3408 -0,1704 -2,3892 2,3718
Italy 0,7488 1,887 1,6685 -0,351 -3,5144 2,8122
Cyprus 2,5576 -1,1704 -0,3468 0,595 -1,003 0,9174
Latvia 6,9759 0,9856 2,3738 0,285 -3,0388 7,5042
Lithuania 6,7044 6,2578 2,262 6,6825 -5,2717 10,224
Luxembourg -0,8085 3,8907 -0,362 0,4048 -5,82 2,9328
Hungary 6,1149 11,41 10,7231 3,8248 -8,2268 11,5893
Malta -0,7776 7,2787 2,9323 -1,9964 -5,31 11,3004
Netherlands 3,3489 5,0895 3,8935 0,732 -4,77 7,725
Austria 2,5152 2,9592 4,2867 0,1287 -5,8598 4,2401
Poland 2,6628 4,7334 2,38 2,5896 -2,7795 4,6243
Portugal -0,1484 2,2932 1,3328 -0,1428 -2,48 2,1922
Romania 1,4787 1,8815 1,7301 0,9158 -0,8856 6,0501
Slovenia 5,2324 7,3432 7,9647 0,2685 -8,2898 5,709
Slovakia 6,384 16,5308 11,6874 2,6748 -9,6368 14,0238
Finland 2,0374 5,3424 2,3424 0,7455 -6,552 3,1719 Sweden 1,8309 2,9406 1,35 0,266 -5,6898 5,0315 United Kingdom 1,4534 2,379 -1,3502 0,3344 -1,968 1,8746 Croatia 1,36 2,1939 0,5936 0,0342 -3,73383 2,532251

REDETE – ECONOMIC DEVELOPMENT AND ENTEREPRENEURSHIP IN TRANSITION ECONOMIES
302
ECONOMIC DEVELOPMENT IN TRANSITION ECONOMIES: WHAT AND HOW IS NEEDED TO BE IMPROVED
IN THE AREA OF SOCIAL VALUES?
Mario BOGDANOVIĆ146
Culture is the key to survive!
(dr. Slavko Kulić-director of American Institute for World problems for Europe)
Abstract
Attending from the thesis that according to dominant virtues of some society can be predic-ted his economic success, the social values of each society are crucial for his economic develop-ment. By internalisation of specific sets of social values could be given a significant support for economic development in transition economies. According to resolve the societal problems of inappropriate values in transition economic which are incompatible with economic developme-nt, this paper deals with the goals: 1) defining the social values important for economic develo-pment; 2) defining the agents for social change in a function of economic development in transi-tion economies.
The first goal is reached by the list of attributes and values of an ideal and economic prosper societies versus attributes and values of economic stagnant societies according to the evidence of historical economic analysis. The second goal is reached by defining the agents for social ch-ange in the function of economic development in transition economies by the elements: a) socio-economic orientation as a agent for social adjustment; b) education as a agent for social adjust-ment; c) social adjustment of governing-administrative institutions; d) general social adjust-ment.
The results has shown that for transition economies can be suggested: the production-creati-on conception of economic development, internalisation of a value of the competitive ability in international sense with clear national economic identity; internalisation of connected humanis-tic (right activity, truth, love, peace and nonviolence) and economic-developmental values (dis-cipline, responsibility, hardworking, persistence and efficacy) in educational system, social adjustment of governing-administrative institutions according to the efficacy, responsibility, kindness and hardworking; general social adjustment to the culture of work, love and learning.
Economic systems of transitional countries for his economic development could adjust in the area of social values and institutional climate in order to strength the motivation of his human capital. Without strengthening the critical social values it is not possible to achieve the inter-national competitiveness. Namely, the wealth of nation is a product of specific system social values of some social area.
Key words: values for economic development, values of economic stagnation, internalisation of values by the institutions, social adjustment for economic development, transition economies.
146 Faculty of Economics University of Split, Republic of Croatia, E-mail: [email protected]

REDETE – ECONOMIC DEVELOPMENT AND ENTEREPRENEURSHIP IN TRANSITION ECONOMIES
303
1. INTRODUCTION
Modern political, social and economic problems can not be isolated from values, so “vitality of the nation” is primary the value problem (Clesse according to Landes, 2003).The selection of the economic system at the end depends on the sociological and political philosophy which decides on the selection of the dominant scale of values as the dominant moving force. Namely, economic system depends about social and political philosophy which support him and decide about dominant value system (Lukšić, 1995). Cultural values are key of human and economic life (Kulić, 2009). Without appropriate cultural values the nations are convicted to extinction (Kulić, 2011), and about people and their cultural values depends functioning the institutions which are basic for socio-economic development (Bogdanović&Cingula, 2012, North, 2003). The values in general represent moral standards which tell people how they should feel (feeling component), what they should aim for (motivational component), how they should behave (behavioral component). The values also show why people do certain things (synthesis of the purpose of action), and if those things are acceptable or unacceptable from some value-moral point of view, and the values are represented with the individuals, groups, organizations, societies (Bahtijarević-Šiber, Sikavica, Pološki-Vokić, 2008, 535), but also globally so we can talk about universal values.147 Economy participates in the society’s system of values and accepts the dominant codex of values (Lukšić, 1995, 185). Therefore, identification and understanding of the basic elements of the economic development includes analysis and mobilization of modern political, social and economic problems, which are inseparable from the values. Namely, the conclusion of the researchers on the subject of people’s wealth/poverty is that since the age of Adam Smith there has been no new light on the above mentioned problem, it is primarily in the culture (Landes, 2003) or in the defined system of values. Developed countries (i. e. Germany, Japan) realizes that values (i. e. reliability, punctuality, discipline) should be educated because they are crucial for economic growth (Herzog according Jašić, 2000). According to Khandel&Mohendra (2010, 20) the values in this context can be viewed on the macro concept (the level of the society) or the micro concept (the level of the individual) even though the values can be studied on the mezzo level (the level of the organization and social groups of different sizes). Namely, it is practically impossible to speak about only one level of values because personal values (micro level of values) is interwoven with the values of different social groups where there is, for example, business organization (mezzo values) and national and universal values (macro level of values). Psychologist stated that personal values are essential for human motivation because they determines emotional-motivational orientation and mediates the ways of living and working (Pastuović, 1999.).
Within the approach of studying the culture or “vitality of people” (Clesse according to Landes, 2003, 12) which can be studied on different stages of aggregation (individual, social gro-ups/business and other organizations or people/nations) special attention is drawn by “diferentia specifica” or that difference between people which leads to wealth or poverty, which can basi-cally be reduced to differences in values. Because, if we rationally (and based on empirical evi-dence) suppose that among members of different people there are no important difference in genetic-anatomical-physiological sense, because all people that came from the common ancestor
147 Defined universal cultural values which are present in all cultures and all time periods are: wisdom and knowledge
(curiosity, desire to learn, open mind and critical thinking, creativity), boldness (persistence-diligence, integrity-natural behavior-honesty/fairness, vitality-enjoying life-passion-enthusiasm), humanity (generosity, love for others and letting others love us, social/emotional and personal intelligence), justice with different contents: social responsibilities with sub elements (being a citizen, social responsibility without personal gain, loyalty, team work, craftsmanship); honesty and morality; the ability of leadership as a part of character, moderation which contains: self-control and self regulation of someone’s behavior, common sense (the ability to predict the consequence of our decisions) modesty/humbleness and forgiveness/charity) and transcendentalism (gratitude, hope and optimism, humor and playfulness, respect for beauty and excellence, spirituality/religion). Cf. Miljković&Rijevec, 2006; Rijevec&Miljković, 2006.

REDETE – ECONOMIC DEVELOPMENT AND ENTEREPRENEURSHIP IN TRANSITION ECONOMIES
304
are one species, then the differences in the economic development of societies (nations) should be assigned to the specific characteristics of these societies in cultural, value and institutional sense (Bogdanović, 2011, 68).
Cultural characteristics of individual societies come from the way of life of their members that is from the way of dealing with problems of life and living. The way of life and the corresponding socialization (upbringing) form socio-psychological characteristic of individuals and groups which then form the economic thought and systems. Therefore socio-psychological characteristics formed that way (upbringing) are considered to be the crucial factor of the economic develop-ment. Culture (and values) can be seen as the key of human and economic life (Kulić, 2009). Na-mely, it is becoming more and more clear that the ethics of everyday behavior or the codex of be-havior (for example: rationality, diligence, take-charge attitude, honesty, seriousness, thriftiness, efficiency, patience, urgency, neatness, etc.) lead to the economic success, and the opposite characteristics to the economic failure. Hence for the purpose of the economic development the key element is upbringing of people of certain characteristics. Also, the deciding factor of the economic and any other society’s success is the quality of those who make and carry out decisions, so their value socialization is very important from the economic point of view (Bogdanović, 2012). Functioning of institutions which are basis of the socio-economic develop-ment also depends on people and their system of values. (North, 2003). According to the definition upbringing is thought to be learning of motives, values and interests, where the stronger component is will and attitudes where the stronger component is the emotional one. This is important because it determines the emotional-motivational direction and it mediates the ways of life and work (Pastuović, 1999). For example, for the economic development it is not irrelevant in what kind of “spirit” most people in a certain society were socialized, if the dominant philosophy is “Live to work” or the other way around “Work to live”. In the context of the formation of the human capital the upbringing is considered to be the key factor for the economic advancement and development, so the key element of the education and development is orientation towards values (for example Germany and Japan) through which the virtues which have meaning for the development like, for example, reliability, punctuality and discipline are mediated (Herzog according to Jakšić, 2000, 199). Then according to the dominant virtues of a certain society (internalization of certain important values is considered to be a part of human capital) we can predict well their economic success, wealth or poverty (Landes, 2003). Ethics which internalizes specific values and culture for the purpose of the economic development should be seen as the regulation system of the human behavior in the sense of “the philosophy of desirability”. In order to develop important economic characteristics of human capital (for example, take charge attitude which is characterized by many economic initiatives) they need to be formed and supported by specific generally accepted cultural values (for example, the sense of duty, responsibility for those beneath and above you, diligence, work, integrity and similar) which will guide them towards socially valuable aims (for example, the production of quality goods and services) and form social, economic and political supporting institutions.148
Personal initiative can be encouraged (for example, supported enterprise, personal freedom, autonomy, individuality and economic security) or discouraged (for example, autocratic, oppre-ssive, exploitative, arrogant and rapacious behavior of the elite operational through the institu-tions). Different cultural climate is formed by the government which is trying to attract enterprise and its income from the climate formed by indifferent, arrogant and rapacious one (corruptive and based on rent). Therefore the first step for the economic development is to set and internalize the primary social goal of the economic prosperity with the help of its own (national) forces (so from
148 This way, for example it is considered that industrialization (without which there would be no modernization and
significant economic leap) cannot succeed without customs protection, exemption from taxes, discounts in carriage, cheap energy, special credit privilege for certain sectors, educational politics (...) which can be only given by the government which enjoys a great deal of political and fiscal independence (Issawi according to Landes, 2003, 511).

REDETE – ECONOMIC DEVELOPMENT AND ENTEREPRENEURSHIP IN TRANSITION ECONOMIES
305
within and relying on itself) which is a value category. If that is the goal, then in order to achieve it we need to form people of certain characteristics (raise and educate), and if, at the beginning, that is not enough, we should attract such people with different benefits. While doing that the basic principal of every rational economic development is that it is desirable to build the society and its economy on the culture of work and creation, and not on the culture of plunder, rip-off and demanding of rent (redistribution).149
The conclusion of this short literature overwiev is that economic development can not be achieved without social (cultural development) this means without specific value system.
This paper deals with two main problems: 1. problem of defining the cultural values for economic development (which values are
important for economic development?);
2. problem of determination the means/tools for cultural change (adaptation to socio- economic prosperity) which is the problem of key value internalization in a function of socio-economic development (what should be done to improve the national cultural capital?).
2. METHODOLOGY
The purpose of this paper is to define the key values and the institutional value framework and the behavior that is essential for the economic development. The aim of the society with economic developmental goals is to remove the reasons for the sub optimal economic exits. Therefore, by locating the problematic in the sub optimal culture (development of the contraindicated values which are not enough to support the economic growth) it is important to do the transformation in the direction of its stronger support to the economic growth and development.
For the first problem (definition of cultural values for the economic development) it is adapted the methodology of economic history, and the analysis of key humanistic values in a function of socio-economic development. This is the method which analyses values of economic prosperity and stagnation through human history.
Starting with the thesis that for the development of a respectable economy it is necessary to fulfill conditions in the form of non materialistic values of social goals, culture and institutions (whose function depends on social goals and internalized culture), their definition, by determining of the means for cultural change (primarily by rising social motivation of human resources on a higher level of functionality) the paper deals with enabling the basic support to economic development with the help of human resources. The method that was used for the second problem was the synthesis of important cultural values with social tools for value internalization (incorporation).
3. SOCIO-ECONOMIC ORIENTATION AS A MEAN OF CULTURAL ADJUSTMENT FOR ECONOMIC DEVELOPMENT
Analysis of prosper economies showed us that for economic development basically is needed: 1. Specific socio-economic orientation for economic development with specific internalized
prosperity values (social goals for rational, ordered, productive and creative society).
2. Production and creative concept is preferable. 149 The culture of plunder can be described as the society in which at the top there is a small group which rips off without
problem, and at the bottom there are masses which humbly scratch out a living. This kind of society is historically known as autocratic despotism.

REDETE – ECONOMIC DEVELOPMENT AND ENTEREPRENEURSHIP IN TRANSITION ECONOMIES
306
3. Emphasis should be on large and powerfull industries (Horvat 2002, Bogdanović, 2011, Santini 2012) not on the small and medium ones. Namely developed countries have one or more multinational companies which determines its total development. So for national development is important to abandon the myth that development should be grounded on small and medium enterprises and there concentrate the national resources (Santini, 2012).
4. Competitiveness should be the key national goal, with developed national economic identity (what produce?).
5. Governing-administrative institutions should also be cultivated according specific cultural values.
6. Integrity and ethics are also very important element of successful society. Namely, ethics is an omnipresent phenomenon of social systems; it is present in all life situations at different levels of aggregation (personal, family, group, corporate, civil, social, intercontinental and global civilization level). It is strategically important because it has the role of activator or deactivator of human resources, since it can speed up or slow down the achievement of desired goals (Bogdanović, 2012, 541).
7. There can not be economic development without social development, so it is needed general cultural adjustment to the culture of work, love, learning.
In the context of the economic development for every nation it is to be suggested the produc-tion-creation concept of development with the highlight on big and strong industrial complexes (principal of multinational companies and the economy of volume) and in that context internalization of values of competitiveness as internationally acknowledged virtue, with taking in consideration of the individual national economic identity (Horvat, 2003, Bogdanović, 2011, 74-76). Namely, national wealth does not consist only of that what the country has, but also what it can produce. If there is no ability to produce, there is no socio-economic development. Non materialistic values of social goals, culture and institutions are very important for the economic development, so when they are formed and efficient as the necessary conditions, the economy really creates itself (principal “lassaiz faire”). Established social institutions, as well as permanent goods, should be kept functional and they should be adjusted to developmental goals when it is needed. Despite the fact that the most successful societies of today suffer from deficit in their functioning, (for example, some kind of corruption, unsuccessful management and private rent seeking, lack of integrity) the ideal society of growth and development should be capable of making (production) of goods and services and have the following characteristics (Landes, 2003, 278-281):
- To know how to make means for the production, to handle and manage them and adjust and learn new techniques which belong to the latest technology.
- To be able to give the above mentioned knowledge and craftsmanship to the young, through formal education or on the job training.
- To choose people according to their competences (promote/demote based on the results).
- To give opportunities to individual and group enterprise, encourage initiative, competitiveness and desire to reach or surpass others.
- To let people enjoy and use the fruits of their labor and enterprise.
- To ensure the right to private property (entice saving money and investing).
- To protect personal freedoms (to protect from tyranny and private unlawfulness, like criminal or corruption).
- To ensure the realization of contractual rights.
- To stabilize the government by the law of principal, and not persons (people).
- To form the government that reacts (the government that listens to the complaints and sorts out injustice).

REDETE – ECONOMIC DEVELOPMENT AND ENTEREPRENEURSHIP IN TRANSITION ECONOMIES
307
- To form a fair government (inclination and position should not bring rent)
- To have a moderate, efficient and non-greedy government (keeping the taxes low, lesser demands for extra profit, avoiding benefits).
- To put into action equality between sexes.
- To get rid of every discrimination on irrelevant criteria (for example, race, sex, religion and similar).
- To prefer scientific rationalities (means-goal) rather than irrationalities (superstition and magic).
- The value of honesty should be incorporated into laws, but also internalized like desirable behavior.
- To make easier and encourage the following rationalities: geographical and social ability to move, to prefer the new versus the old, vitality versus experience, change and risk versus security, equal distribution of income, big middle class, equality, homogeneity in everyday behavior and communication regardless class.
In order to be able to get close to the above mentioned ideal and to enable rational, organized, creative (productive) society the key is upbringing that would internalize the key values of a good society. Today’s global market more and more demands authentic (genuine) supply as a value. Therefore, in this kind of market environment the only true wealth is the ability to produce authentic products and services. That is the basic global, business, and also personal value (so called: genera).150
The economy which dominantly has to offer only the products of cheap human labor dominan-tly exports only the so called “live labor” and basically just sells off its accumulated and natural wealth. The economic, political and social world through history understood the best the production for which there is demand (competitiveness as the global economic value), because from it comes the power (the power to be free, equal and excluded from the autocracy of those in power). In the international economic relations there is a clear consensus about that value. Competitiveness is a general global economic value which is highly appreciated. Therefore it is important to produce and sell and be competitive in that respect, and buy economically because that is something everyone can do. The value of competitiveness goes along with the question of a good society (because it is not possible without the economic strength and internalized core values like, for example: battle against poverty, social security, health care, care for the personal reproduction (demography), good public administration, good education, healthy living environ-ment and international position and image (Pupavac, 2006).
On the values of a good society lie the values of good enterprise and organization, good mana-gement and employees and a good home (family) and at the end good people, a good man and “vice versa”. So with values and their fulfillment on different levels of aggregation (macro, me-zzo, and micro) a quality of socio-economic system is formed. Given that all the levels are connected the system is build form above (macroeconomic) and the middle (the level of sec-tor/enterprise) and the economic level of family, individual (personal economy). Cultural values manifested in everyday life are important on every level of aggregation, which means in sort of a cultural climate of the society.
For more concrete definition of the cultural values which are stimulating for the economic development it is important to differentiate between the values connected with economic
150 In the framework of the universal, individual human value fairness, and within it social responsibility we can talk about
production as the value of processing some good things and some good people. Namely, from the middle aged people it is expected to give something to the world around them, in their family life and work, which means having children, being productive at work, create artistic, scientific and technological work and direct the strength towards making the world a better place for the future generations (Miljković &Rijavec, 2006.)

REDETE – ECONOMIC DEVELOPMENT AND ENTEREPRENEURSHIP IN TRANSITION ECONOMIES
308
prosperity and economic stagnation. Table 1. shows cultural values which characterize societies of economic prosperity and those which characterize societies of economic stagnation.
Table 1. Cultural values of economic prosperity and stagnation
THE CULTURE OF ECONOMIC PROSPERITY THE CULTURE OF ECONOMIC STAGNATION
Education is on high level, it creates informed and able work force, prone to learning and self improvement.
It does not create informed and able work force. Rejects/doubts new ideas and technologies. Society is not prone to learning and self improvement; it does not appreciate the knowledge of its members.
Dedication to work, diligence, thriftiness, no pretentiousness, honesty, neatness.
Attachment to wealth, laziness, wastefulness, pretentiousness, dishonesty, untidiness.
Very busy society, constantly on the move and changing. Static, rigid, underemployed society, society in an “intellectual cage”, changes don’t happen easily.
Efficient government, it recognizes strong sides of other nations and it adjusts to that
Inefficient, incompetent government, corruption, bribe, rip-off “normal” social occurrences, the existence of kleptocracy.
It emphasizes equality and larger middle class. It emphasizes hierarchy (a few people at the top and large low class ).
It develops institutions with representatives. Despot institutions. Productivity and efficiency are the most important. “It does not matter if the cat is black or white, it is important that it catches mouses.”!
It discriminates based on irrelevant criteria (sex, religion, race, etc.) Intolerance, superstition, ignorance.
Encouraging initiative, urgency and competition, excitement about something new.
Suffocating initiative, nourishing hypocrisy and not being open.
Suppression of pride for the greater good, fear of dependence on foreign production.
Pride, self content paradox of the complex of superiority, not learning from others.
Optimistic and open culture. Pessimistic closed culture. People live to work. People work to live. Rational, important facts and the truth. Irrational, the motive and ideology are important. Thriftiness, rational use of resources. Lavishness, irrational use of resources. Positive attitude towards modernization and industry. Negative attitude towards industry and modernization. Valuing work and sense for the goal. Indifference/contempt towards common wellbeing,
good management and man . Enterprise as an important and respected social factor. Insecurity of enterprise. Sense of commitment and duty. Sense of obedience, satisfying vanity, spiritual
homogeneity, doing something behind someone’s back, being mean, feeling hopelessness, desperation.
Resourcefulness, imagination, full of ideas. Lack of ideas and imagination. Without prejudice. A lot of prejudice. Flexible, skilful. Rigid, unskillful. Inclination to earning and saving. Inclination to spending and hedonism. Curiosity, enterprising spirit, resourcefulness, being energetic, activity.
Passiveness, lack of activity
Productivity Lack of productivity. Social, cultural and technological preparedness to use the money efficiently.
Lack of ability to use the money efficiently.
Direction to concrete, details and precision, clarity is emphasized.
Direction to general, abstract, not being precise, being unclear, manipulation.
Good relations between workers and management. Bad relations between workers and the management. Institutions are inclined to entrepreneurs. Institutions are not inclined to entrepreneurs. Entrepreneurs have financial support from the institutions. Financial institutions are not interested in helping
entrepreneurs. Work, profit and operational social value. Contempt towards business and economy (store and
office). Enterprise is a general trend, a part of culture. Enterprise based on distinctive individuals. Society which has a program and a vision of the economic development.
Society which hasn’t got a program or a vision of economic development.
Creative-productive orientation . Retail orientation. Source: Landes (2003).
REDETE – ECONOMIC DEVELOPMENT AND ENTEREPRENEURSHIP IN TRANSITION ECONOMIES
309
The core of these systems is in human resources and their culture (good upbringing), and social
institutions that have been founded on them. The key for the economic development are people with internalized values, social goals and institutional values that are shown in the left column of Table 1. If the mentioned values are accepted as immanent for boosting socio-economic develop-ment, there is a question of their internalization (attitudes, values and habits of the wide base of human resources) through upbringing.
The above mentioned internalization via institutions could start with: a) education, because with education we can get the strongest internalized value effects; b) supporting behavior of administrative institution; c) internalization of the culture of work, love and knowledge on all levels.
4. EDUCATION AS A MEAN OF CULTURAL ADJUSTMENT
Institution of education qualifies for reproduction of the future in the context of taking on di-fferent social roles, from which the economic one is really fundamental. Socio-economic orient-tation as a cultural adjustment is also a subject of educational internalization. Because of that the quality of workforce (and with it the developmental-economic vision which is in people) depends the quality of educational system and its suitability to qualify people for concrete economic roles. Education is always in function of a goal and some values that it wants to internalize to young generations. So, in the theory of the humanistic curriculum school needs to teach to think and liberate (raise to love, be happy and have a free spirit), to qualify for humane problem solving. Even though people realize the importance of moral and ethical behavior for the economic development (Lauc, 2000, Landes, 2003., Pupavac, 2006, Bogdanović, 2011&2012) there are still relatively few practical instructions for teaching and developing such moral and ethical skills, while at the same time it is expected for them to be internalized. Also, the persons that should raise (parents, teachers, key social figures and all those that are responsible for the upbringing and psycho-social formation of young people) are not systematically taught how to raise children according to those values (especially not those important for the economic development) and how to practically internalize them.151
That’s why it is important, not only from the point of upbringing, but also economy, to see which values could be crucial and to show how they could be internalized. It is desirable to start with the internalization of cultural values for the economic development already in primary school because that is the time when we internalize fundamental values which have a big motivational strength of directing future behavior. The values which are internalized in primary school should have both humanistic and developmental-economic dimension which generally go in the same direction (they are not contradictory)152. In the humanistic sense those are the values which are internalized as economically important honesty, fairness, authenticity, trust, unity (social coheren-
151 How to raise someone is a difficult philosophical question and it depends on the values that are desirable in a society and
on which there is an agreement. If in a society for the survival or a normal life of an individual we need a certain amount of immoral behavior (for example cruelty and hypocrisy, should we teach that?) If the status in life largely depends on the respect of hierarchy without question, flattering the boss and his/her vanity, should young generations be raised in that kind of spirit or not? In this paper we presume that the basic economic values are generally fixed categories which should be present for a longer period of time and in all global cultural societies (values are, of course, not absolutely fixed because they can be transformed in the function of time and circumstances). Values are not relative either, but they are relational, i.e. they give a judgment on personal relations (Lukšić, 1995, 170).
152 Values can go in different directions. It is often wrongly thought that the values are functional at all times and for all situational contexts, and that they operate in the same general direction. So, for example, the value of hedonism can contradict enterprise, the value of peace can contradict creativeness; humanistic values can contradict economic-developmental ones. The values are not absolutely independent from the context and moderation (some values can also stop being functional if they are not applied in moderation).

REDETE – ECONOMIC DEVELOPMENT AND ENTEREPRENEURSHIP IN TRANSITION ECONOMIES
310
ce), relaxation, goodness, altruism, imagination, social responsibility which can be reduced to five fundamental humanistic values: doing the right thing, truth, love, peace and non violence (Žanko, 2005, 34). In developmental-economic sense these values are definitely: discipline, responsibility, diligence, persistence and efficiency (Landes, 2003).
In the context of humanistic values in primary schools the values of doing the right thing, truth, love, peace and nonviolence could be internalized (these are primarily also Christian values which are declaratively already present in Christian societies) or some similar values through which could be internalized the economically important contents of honesty, fairness, authenticity, trust, unity (social cohesion) relaxation, goodness, altruism, imagination, social responsibility. The explanation of the mentioned humanistic values follows.
1. Doing the right thing. Honesty, fairness in achieving goals, that does not harm others (for example, the opposite of this value is gaining assets or any other advantage using discredit of others, ripping off, dividing material, non material or symbolic resources based on a saying “It doesn’t dawn on me until it happen evil to the other”. Doing the right thing is the same as “deep morality in human thoughts, feelings and behavior.” The value of doing the right thing, for example, can be seen in group activities. That way we can mediate the physical and work aspect of doing the right thing. In everyday work that would mean that the man (regardless his material, social, educational or any other status) is treated in a maximally human way, that the work is done correctly and according the laws of the profession (without procrastinating and complicating) and all that in a way that a man in question can freely claim „That people were nice to work with”. That is the real expression of deep morality. In educational system the value of doing the right way can be internalized through joined activity, the work that says:”You are valuable because you are a part of joined work”.153
2. Truth. Even though truth is a difficult philosophical category, for the purpose of its’ internalization in the educational system it is enough to say that we should be able to say what is correct (truth as harmony between reality and thoughts about it), and what isn’t (untruth), we should tell apart right from wrong, be conscious about things. We should know the truth in order to function as authentic people. If people don’t know the truth, don’t want to know the truth and they give the control to others (“they know better”), they become victims of manipulation. Namely, untruth or its’ suppressing is deeply incorpo-rated into the life of today’s civilizations (of course, those that are not ideal), because it is a mean to gain something. However, to internalize the truth it is necessary in spite of out of school socialization, at least in organized educational system, to insist by practice and example on this value category. The value of truth can be seen in practice in wise quota-tions from the rich human history. Proverbs show intelligence, intuitive understanding, and they also give comfort, motivate and convey the most profound knowledge. Typical example is “Lies have short legs”.
3. Love. Besides being a value category, it is one of basic human needs so its content like consideration for others, nobility, support, sharing, joy, affection, attachment and help should be basic value content in the educational system. The value of love and togethe-rness can be experienced through, for example, group singing154 and at the same time we can mediate spontaneity and compassion. Group singing brings people together, makes people happy, and develops harmony and love. Love teaches spontaneity.
153 Civilization usually only praises exceptional achievements (which is maybe good in science and for adults). Primary
educational system should teach the belief “You are good and valuable if you are a part of the community and not only if you achieve something exceptional”, and with that we at the same time internalize the value of support to team work.
154 In cooperation with the teachers from the Netherlands, on one gala dinner after a job well done, author was delighted by their singing, and then he became aware of the force of togetherness which obviously has an important part in their national economic development.

REDETE – ECONOMIC DEVELOPMENT AND ENTEREPRENEURSHIP IN TRANSITION ECONOMIES
311
4. Peace. In modern societies which prefer busyness, a lot of people and intensity of infor-mation, as limited human beings, people often don’t manage processing numerous information that they are daily exposed to. Because of the fast rhythm of life and bigger and bigger need for competitiveness, basic human activities like playing games, spending time together and free time are becoming of lesser importance. Even though people become more educated, they often degrade emotional and value components. Then the problem of adjusting to such pace of life and constant stressful work hours arises, so relaxation becomes more and more important. One of the solutions on individual level is to practice techniques which bring peace (quiet) into our lives, at least for a certain period of time. The advantage of this technique is that people in silence relive the events that occurred that day; discipline their mind and develop concentration and memory. An old saying is “The one who has peace is the richest!” and not the one who has money. It is not possible to respect yourself and others if people don’t learn the values of peace and medi-tation (relaxation) as the basic strength for relocating and better use of psychophysical resources. The value of peace can be experienced by sitting or lying in silence and in that way people can mediate the things they feel and experience. If there is no peace in individuals, there can be no peace in their surroundings. People should also want to totally acknowledge one another (peace in relations). The one that gives something up can be peaceful (compromise is the base of peace and respect). Peace means letting other people say what they want without feeling offended. The goal of sitting or lying in silence is inner peace, that way it is easier to distinguish the important from the unimportant, to get rid of anxiety, to experience true self, to gather energy, to think on a higher emotional level, to sort things and events out. Given that in modern busy lives events “fly by” (lack of time for active processing) peace becomes very important. Only with learning the value of peace it is possible to learn how to enjoy life (achievements) and to be a vital creator of new values.155
5. Nonviolence. It is behavior that does not harm others physically or to their reputati-on.156Self-control, kindness and compassion (altruism), and care for others are important moral attitudes of the 21st century. The value of nonviolence can be realized through te-lling instructive stories, and with it you mediate humanity and ingenuity.157 In nonviolence as a value there is no punishment or revenge. On the contrary, nonviolence is taught through positive things with positive thoughts and by expressing positive words. That’s why the hate talk is a forbidden category. The stories directly show us the true values.
With the help of the above mentioned humanistic values it is possible to internalize basic eco-
nomic values of honesty, fairness, authenticity, trust, unity (social cohesion) relaxation, goodness, altruism, imagination, social responsibility.
For the economic system in the context of quality workforce besides humanistic values it is im-portant to internalize economic-developmental values of discipline, responsibility, diligence, persistence and efficiency. That can be achieved by disciplined, responsible, orderly fulfillment of duties and work assignments in school (because this way we internalize important economic contents: the culture of work, diligence, tidiness, thriftiness, honesty, persistence, urgency, patien-ce and efficiency). Namely, the economic development is contraindicated with the promotion of discipline and work anarchy where the students internalize the value of irresponsibility (the 155 One of the purposes of achievement is to take time and enjoy it. If the people are constantly restless, they cannot enjoy
their achievements, consolidate their thoughts and emotions, things and events just “fly by” and people go through life without being fully aware of it.
156 Badmouthing is also a kind of violence, because speaking about someone without his or her presence has the purpose to harm him/her.
157 In this context there is for example a radio show on Croatian radio 1 that can be educational: “Stories for big and small”, it is on at 19.50.

REDETE – ECONOMIC DEVELOPMENT AND ENTEREPRENEURSHIP IN TRANSITION ECONOMIES
312
attitude “we’ll do it easily, don’t worry”), and the teacher looses power and authority. This way the teachers loose the important function of a role model, their educational effect is minimized and they are perceived as less successful (marginal) social persons. Economically harmful habits become internalized with it: irresponsibility, idleness, disrespect of role models and general value vacuum (ethical relativism).
So what kind of workforce should pedagogical work in schools be subordinate to? Everywhere in the world for economic development we need honest, moral, diligent workforce that is dedi-cated to work and not wealth, which lives beneath (and not above) its social status, which chooses the truth, responsibility, urgency and togetherness. Besides that, for the economic development we need workforce which is informed and capable, which accepts new techniques and ideas, which accepts knowledge gained at home and abroad, which is inclined towards enterprise, which is orientated on better life, which is socially responsible. Also, for innovation that is an important part of economic development we need people which have imagination and initiative, which un-derstand the essence of economy, the methods of production and machines in organization. We also need consciousness on social level that people are more important than money.158 Only then the value conversion of population towards the cultural climate of enterprise becomes possible, and the most efficient way is to internalize such values in the educational system.
In the above mentioned way we can integrate conceptions of educational psychology in the function of economy which are interwoven in economic development. This way we confirm Shumpeter’s thesis. He excellently noticed that economy, as every other humanistic science, should in its basics start from psychology as a real base with whose terminology we can give every detail explanation (Bahtijarević-Šiber, 1999, 6) and advancement.
5. BEHAVIORS THAT SUPPORT ADMINISTRATIVE INSTITUTIONS
Institutional behavior should by definition of its purposefulness make the economic efficacy easier by regulating key transactional relations. If on the other hand administration functions as the master of its clients, and expects to be bribed and ingratiated in order to do something that is its official duty the economic growth is harmed (Radošević, 2003, Horvat, 2002). The economic growth is limited when physical and legal survival depends strictly on the decisions from “above” or “aside”, because that is a preview of a culture where the political power becomes the most important activity in the society. For that reason there are no problems in economic development if the wealth and power come from work and its results, and there are problems if they come from frauds, thefts and corruption (Landes, 2003). It is desirable to regulate the suboptimal efficiency of the administrative institutions, according to the laws of psychology of upbringing (Pastuović, 1999; Čudina-Obradović, 1991), and here we firstly mean the following suboptimal qualities: ensuring the rent and asking for income that is bigger than our contribution (Radošević, 2003), suboptimal criteria of rewarding and advancement (Čengić, Dragojević and Vidačak, 2004), arrogance, irresponsibility, sloppiness (Horvat, 2002, 126), administrative pathology with the characteristics of envy, rigidity, divided responsibility, exaggerated paperwork and bifurcation of attachment (Županov, 2002). Fairness is the most important virtue of social institutions, and no matter if the laws and institutions are efficient and well organized they should be reformed or dissolved if they are unfair (Matulović, 1996, 113-145). Based on this humanistic thinking it is becoming more and more evident that long term economic success depends on the virtue of institutional fairness. Slow development is actually the result of a cultural climate which is characterized by spiritual homogeneity, obedience, ideological correctness and satisfaction of vanity, opposed to appreciation of initiative, professionalism and diligence. So it is very important 158 Good, very disciplined workforce is scarce, far more scarce than capital.

REDETE – ECONOMIC DEVELOPMENT AND ENTEREPRENEURSHIP IN TRANSITION ECONOMIES
313
in the context of the economic development that administrative institutions do their jobs following the criteria of efficiency, readiness to help, consciousness and diligence. Such culture in administ-rative institutions should be taught and motivationally rewarded with compensations and promo-tion, because the entire economic efficiency and development depends on it.
6. GENERAL ADJUSTMENT TO THE CULTURE OF WORK, LOVE AND LEARNING
The most important specific values important for the economic development of every society are that work should beat idleness, honesty exploitation, love hate and rational irrational. Namely, in the conditions of inappropriate values individual and social relations get complicated and then they are characterized with idleness, selfishness, dishonesty, ignorance, vanity, envy, mythical consciousness, misanthropy, and similar undeveloped qualities. Such values then affect negative human feelings which then become sources of business and economic problems. Namely, in the situation of unsatisfied needs which are not satisfied with work, love or learning (or cannot be properly satisfied that way) occur behaviors which are value inadmissible. Love159, work and knowledge are the sources of human and economic life. Regardless the inability to give definite, exclusive and optimal value answer economically functional cultural climate for the 21st century should definitely do some value adjustments to the culture of work, love and knowledge/learning like:
- Building the prosperity on hard work (it is necessary to master difficult and complicated work in order to achieve competitiveness and economic success).
- Internalizing values “It is easy to buy, that we can all do, it is difficult to produce and sell!”
- Internalizing values of productivity, thriftiness, persistence and patience.
- Supporting enterprise, initiative, reactivity, enthusiasm, intrinsic motivation.
- Nourishing practicality and economic solution of problems.
- Internalizing love/attachment to coworkers, company and nation.
- Nourishing non formal communication and minimizing the influence of status and hierarchy on problem solving (it is more important what is said, i.e. content, than who said it).
- Internalizing rational/scientific approach to solving problems (goals-means).
- Nourishing and advancing the culture of learning (knowledge and know-how, professionalism, competence, successfulness).
- Supporting curiosity, independent thinking and intellectual activity.
- Nourishing easy and fast acceptance of change, new knowledge and ideas.
If the dominant cultural climate was directed towards the above mentioned values which in short terms promote the culture of work, love and learning it could have a very positive effect on the motivation of human resources on all levels of aggregation and in that way advance all economies, and especially those of transitional countries.
159 Love can here be defined as a value of serving to a greater purpose over the one defined by an individual ego and vanity.

REDETE – ECONOMIC DEVELOPMENT AND ENTEREPRENEURSHIP IN TRANSITION ECONOMIES
314
7. CONCLUSION
According to the dominant virtues of a certain society we can predict its economic success, wealth or poverty. Immaterial values of a culture are crucial for the economic development so by internalizing a certain set of social values we support the economic development by acting on the motivational component of human resources. This paper has offered the characteristics of an ideal society for the economic prosperity and it listed the basic values and characteristics which distinguish the society of economic prosperity from that of economic stagnation. In regard to the desire for a sustainable economic development in the context of adjustment to cultural values which would be the support, before defined cultural goals of ideal and economically prosperous societies, they are made operational with the means for adjustment. These are:
1. Socio-economic orientation as a cultural adjustment. Productive-creative conception with emphasize on big and strong industrial complexes, internalization of values of competi-tiveness as internationally acknowledged virtue, with the appreciation of individual natio-nal economic identity is suggested.
2. Education as a means of cultural adjustment. Internalization of interconnected humanistic and economic-developmental values is suggested. When we talk about humanistic values we mean the values of doing the right thing, truth, love, peace and nonviolence with the purpose of internalizing the economically important honesty, fairness, authenticity, trust, togetherness (social cohesion), relaxation, goodness and altruism, imaginativeness and social responsibility. When we talk about economic-developmental values we mean the values of discipline, responsibility, diligence, persistence and efficiency. That can be achieved by disciplined, responsible, orderly fulfillment of duties and work assignments in school (because this way we internalize important economic contents: the culture of work, diligence, tidiness, thriftiness, honesty, persistence, urgency, patience and efficiency).
3. Cultural adjustment of administrative institutions. Adjustment based on the criteria of result, consciousness, readiness to help and diligence is suggested.
4. General adjustment to the culture of work, love and learning. The cultural adjustment ba-sed on the following values is suggested: Building the prosperity on hard work (it is necessary to master difficult and complicated work in order to achieve competitiveness and economic success); internalizing values “It is easy to buy, that we can all do, it is difficult to produce and sell!”; internalizing the philosophy “Live to work”. Work, the results of work and achievements are the reasons for human existence; internalizing the values of productivity, thriftiness, persistence, and patience; supporting enterprise, initiative, reactivity, enthusiasm, intrinsic motivation; nourishing practical and economical problem solving; internalizing the values of honesty, trust, ethics (the value of truth, doing the right thing, love, peace and nonviolence); internalizing love/attachment to coworkers, company and nation; nourishing non formal communication and minimizing the influence of status and hierarchy on problem solving (it is more important what is said, i.e. content, than who said it); nourishing and advancing the culture of learning (knowledge and know-how, professionalism, competence, successfulness); supporting curiosity, independent thinking and intellectual activity; nourishing easy and fast acceptance of change, new knowledge and ideas.
The economic systems of transitional countries could adjust for the challenges of the 21st
century on the field of the cultural and institutional climate and in that way motivationally strengthen their human capital because only with human capital it is possible to reach international competitiveness. Namely, the nations’ wealth is the product of the motivated human resources, which have their basic source exactly in the cultural climate of a certain social area.

REDETE – ECONOMIC DEVELOPMENT AND ENTEREPRENEURSHIP IN TRANSITION ECONOMIES
315
References
1. Bahtijarević-Šiber, F. (1999). Management of Human Potentials. Golden marketing. Zagreb. 2. Bahtijarević-Šiber, F., Sikavica, P., Pološki-Vokić, N. (2008). Modern Management: Skills,
Systems and Challenges. Školska knjiga. Zagreb. 3. Bogdanović, M. (2012). Basic Roots of Managers' Ethical Competencies. In: Wolfgang
Amann& Agata Stachowicz-Stanusch (Editors), Integrity in Organizations: Building the Foundations for Humanistic Management. Palgrave MacMillan Publishing House. Internatio-nal Edition. pp. 541-575 (proof ).
4. Bogdanović, M., Cingula, D. (2012). Institutional cultural adjustment in a function of economic development, In: Proceedings of the 3rd Review of Management and Economic Engineering International Management Conference A new dilemma: between East and West, Cluj-Napoca 13.-15. September 2012., pp. 35-41.
5. Bogdanović, M. (2011). The Adjustment of the Croatian Cultural Climate for the Economic development. Economic review, 62, 1-2, pp. 67-85.
6. Bogdanović, M. (2005). Economic Democracy of the Croatian Economy. Economic review, 56,1-2, pp. 79-91.
7. Čengić, D., Dragojević, S., Vidačak, I. (2004). Croatian Administrative Elite and the Problems of Management. Društvena istraživanja, (13), 1-2, pp.3-25.
8. Čudina-Obradović, M. (1991). Motivational Impact of Reward and Punishment. In: Vladimir Kolesarić, Mirjana Krizmanić, Boris Petz (ur.), Introduction into Psychology-Contemporary Scientific and Applied Psychology. Grafički zavod Hrvatske. Bjelovar. pp. 137-174.
9. Horvat, B. (2002). What Kind of State we Have and What Kind We Need? Prometej. Zagreb. 10. Jašić, Z. (2000). Education in Croatia at the Verge of the 21st Century. In: Collection of papers
“Croatian Economy for 21. century”. Nakladni zavod Matice hrvatske. Zagreb. pp. 195-203. 11. Khandelwal, K. A., Mohendra, N. (2010). Espoused Organizational Values, Vision, and
Corporate Social Responsibility: Does it Matter to Organizational Memebers? The Journal for Decision Makers. Vikalpa. 35 (3), pp. 19-35.
12. Kulić, S. (2009). ”Culture is the Key of Survival”. U: Aleksandar Stanković (ur.) Nedjeljom u dva, HTV 1, 19th July 2009., interview.
13. Kulić, S. (2011).“Croats will extinct like Illirians in the 70 years period”. http://www.scribd.com/doc/49046106/Kulic-Slavko-Hrvati-ce nestati-intervju-2011 (Intervju, 30. 01. 2011., accessed 18. 08. 2012.).
14. Landes, D. S. (2003). Wealth and Poverty of nations: Why some are so Rich and Others so Poor. Masmedia. Zagreb.
15. Lauc, A. (2000). Methodology of the Humanistic Sciences. Pravni fakultet Osijek. Osijek. 16. Lukšić, B. (1995). Law and Ethics: Relationship between the Essence and Value. Hrvatsko
filozofsko društvo. Zagreb. 17. Matulović, M. (1996). Human Rights: Introduction into the Theory of Human Rights.
Hrvatsko filozofsko društvo. Zagreb. 18. Miljković, D., Rijavec, M. (2006). Psychology of a Positive Person: Who are the Good
People?. IEP-D2. Zagreb. 19. North., D. C. (2003). Institutions, Intuitional Change and Economic Success. Zagreb: Masme-
dia. 20. Papa Ivan Pavao II (1991). Hundred Years, Centesimus annus. Enciklika. Kršćanska sadaš-
njost. Zagreb. 21. Pastuović, N. (1999). Educational Science: Integrative Science about the System of Lifelong
Learning. Znamen. Zagreb. 22. Pende, H. (2003). Social Environment and Corporational Culture in Croatian Tourism (1) &
(2). Business Analysis and Management, Intus-bit. Zagreb. 23. Pupavac, D. (2006). Ethics for Managers. Veleučilište u Rijeci. Rijeka.

REDETE – ECONOMIC DEVELOPMENT AND ENTEREPRENEURSHIP IN TRANSITION ECONOMIES
316
24. Radošević, D. (2003). New Developmental Paradigm-is the New Model of Economic and So-cial Development Appearing: “Post-Washingtonski konsenzus?” Economic review, (54), 11-12, pp. 882-903.
25. Rijavec, M., Miljković, D. (2006). Positive Psychology which Time has Come. Društvena is-traživanja, Zagreb: Institut društvenih znanosti Ivo Pilar, vol. 84-85, br. 4-5, pp. 621-641.
26. Santini, G. (2012). “Preludium to economic policy-another way”. http:// www. rifin.com/za-to-se-zalagati/1659-preludij-ekonomskoj-politici-drugi-put (accessed 26. 12. 2012.).
27. Žanko, N. (2005). „Teaching Values to the School and Preschool Children”. In: Vladimir Kolesarić, (ur.) Knjiga sažetaka 13.-te godišnje konferencije hrvatskih psihologa: Vrijednosti, odgovornosti i tolerancija u društvu koje se mijenja, Osijek, 12.-15. 10. 2005.
28. Županov, J. (2002). From the Communist Hell to the Wild Capitalism: Chosen Discussions and Essays (1995.-2001.). Hrvatska Sveučilišna naklada. Zagreb.

REDETE – ECONOMIC DEVELOPMENT AND ENTEREPRENEURSHIP IN TRANSITION ECONOMIES
317
VENTURE CAPITAL AND PRIVATE EQUITY ACTIVITIES IN WESTERN BALKANS COUNTRIES
Bojan CUDIC160
Abstract
Venture Capital relates to the equity financing of companies with expected high-growth po-tential during their early growth stages. Every Venture Capital review with regard to the men-tioned topic must include a perspective of the US experience due to its historical leadership and importance. The importance of the Venture Capital in the US may be justified due to its leading position in the development of Venture Capital. The comparison between the European and US Venture Capital market needs to be done on the basis of a harmonized definition of the notion of Venture Capital. The European Private Equity and Venture Capital Association (EVCA) defines Venture Capital as “a subset of Private Equity investments made for the launch, early develop-ment or expansion of a business” and Private Equity as “Equity capital to enterprises not quo-ted on a stock market”.
Obtaining Private Equity is very different from raising a debt or a loan from a lender, such as a bank. Lenders, who usually seek security such as a charge over the assets of the company, will charge interest on a loan and seek repayment of the capital. The Venture Capital fund makes money by owning equity in the companies it invests in, which usually have a novel tec-hnology or business model in high-technology industries. This type of investment provides fi-nance to companies with promising but untested business models, that are confronted with high levels of uncertainty as regards their future prospects. For this reason, Venture Capital also provides important technical expert support to these companies, including consultancy services, financial advice, marketing strategy, etc. Such financing significantly increases firms’ chances of survival in their early years and speeds up their investment and growth.
The Venture Capital funds are present in the Western Balkans countries since 1997. The market was started with the support of international financing institutions (mainly IFC, EBRD and EIB). The potential for Venture Capital activity in the Western Balkans is expected to incre-ase as the countries’ economic and institutional environment converges towards the EU. There is an observed absence of seed, early stage, and expansion capital in all Western Balkans coun-tries justifying public intervention to play a role in making the supply of equity finance more visibly and broadly available to SMEs in early stages of development. The individual country markets in the Western Balkans are per se too small and immature to offer a critical mass of operations to sustain the deal flow of sizeable commercial venture capital fund. It is therefore recommended to implement the regional rather than the national approach as a means of creating a successful public-private vehicle, able to catalyze private investments by providing investors with the maximum amount of portfolio diversification by size of investments, stage, location and sector. The European Investment Fund recommended setting up of a regional Venture Capital Fund focusing on seed, then early stage, and expansion capital in the Western Balkan states, but only if implemented as part of the reforms designed to create enabling environment and supporting ecosystem for the functioning of the Venture Capital.
Keywords: Venture Capital Funds, Western Balkans Countries 160 Republic Agency for Development of SMEs, [email protected]

REDETE – ECONOMIC DEVELOPMENT AND ENTEREPRENEURSHIP IN TRANSITION ECONOMIES
318
Introduction
From the early beginnings in the aftermath of the World War II, and rapid expansion from the mid 1970s, the Venture Capital (hereinafter: VC) industry has evolved from an ad hoc collection of pioneering investors into a sophisticated, fast paced and highly specialised industry. During this period, Venture Capitalists (hereinafter: VCs) have provided the fuel for entrepreneurs to create a generation of companies that have changed the face of the planet. The exponential growth (and occasional dramatic decline) of the computing, communications, biotechnology and internet sectors has placed the VC industry firmly in the limelight, and subsequently under the spotlight, as volatile capital markets have taken their toll. The question of how the VC industry works, however, remains a mystery for many novice entrepreneurs, and the dynamics of VC deals are challenging for those without first-hand experience (Pearce and Barnes, 2006, p. 3).
VC has developed as an important intermediary in financial markets, providing capital to firms that might otherwise have difficulty attracting financing. These firms are typically small and yo-ung, hampered by high level of general uncertainty and large differences between what entrepre-neurs and investors know. Moreover, these firms typically possess few tangible assets and operate in markets that change very rapidly. VC organizations finance these high-risk, potentially high-reward projects, purchasing equity or equity-linked stakes while the firms are still privately held. The VC industry has developed a variety of mechanisms to overcome the problems that emerge at each stage of the investment process. At the same time, the VC process is also subject to various disturbances from time to time, which can create problems for investors or entrepreneurs.
VC was first used as a term by Jean Witter in his presidential address to the 1939 Investment Bankers Association of American Convention. However, for Witter, VC was not a specialized area of finance like modern concept focusing on early-staged technological enterprises. Rather, it was a traditional component of some wealthy individuals’ portfolios, i.e. investment in businesses in experimental stages.
Over the past sixty years, the VC industry has experienced dramatic development, and during that time it has become well established and professionalized. The definition for this special form of investment is more standardized.
According to the definition of the US National Venture Capital Association (NVCA), VC is ‘money provided by professionals who invest alongside management in young, rapidly growing companies that have the potential to develop into significant economic contributors. VC is an important source of equity for start-up companies’. Although the terms Private Equity (hereinafter: PE) and VC, in the mind of policy-makers, are used interchangeably globally both statistically and in the legislative sense, the definitions for VC investment share many commo-nalities with the “American model“. For example, according to the European Venture Capital Association (EVCA), VC is ‘Professional equity co-invested with the entrepreneur to fund an early stage (seed and start-up) or expansion venture. Offsetting the high risk the investor takes is the expectation of higher than average return on the investment’.
Normally, three major groups of stakeholders are involved in VC investment, i.e. the investors of VC funds, VCs and the entrepreneurs. The investors of VC funds are normally private or public pension funds, endowment funds, foundations, corporations, wealthy individuals and foreign investors, etc. In the context of VC investment, an entrepreneur is normally a person who runs a venture, with usually short history, and cannot raise funds from a bank or public capital market. In this case, the entrepreneur normally gives up a certain portion of equity and control rights to gain the capital from VCs to support the growth of the venture.

REDETE – ECONOMIC DEVELOPMENT AND ENTEREPRENEURSHIP IN TRANSITION ECONOMIES
319
1. Venture Capital Investment
The modern VC industry is highly sophisticated and explicably difficult to understand, but it is really very simple. VCs are aiming for a single thing - capital gains. VCs are professional fund managers who invest cash in high risk start-ups in return for equity (i.e. shares), with the aim of generating substantial capital gains by selling those shares at a later date through some form of exit event, such as trade sale or trading shares on the stock market after an initial public offering (IPO). In the sense of VC, the golden rule of investment “buy low, sell high” is modified to sound “buy very low sell very high”, as to take for the high level risk profile of such businesses. Additionally, VCs employ a wide range of legal and financial instruments to manage the high level investment risks they are prone to (Pearce and Barnes, 2006, pp. 3).
VC is a subset of risk capital, in which the risk taken by the investor is leveled up by participation in future success of a firm, with risk takers becoming co-owners. The concept of VC as a source of investment is functional as long as there are people prepared to put part of their wealth at risk for a potential gain.
Gompers and Lerner (1999) present the VC investment process as being composed of three different stages:
- Fundraising;
- Investing;
- Exiting.
Figure 1. The VC model.
Source: The author
VC Fund
Venture
Exit
Profits
Advice and Engegement
€
€€
Limited partners

REDETE – ECONOMIC DEVELOPMENT AND ENTEREPRENEURSHIP IN TRANSITION ECONOMIES
320
Research on the VC process focuses on how the VCs and the entrepreneur develop businesses together. It is important to clearly delineate actors and relationships involved in order to understa-nd the VC process. The main actors are investors, VCs and entrepreneurs.
Figure 2. The VC process
Source: by author
Source: The author
A VC investment is generally characterised by the following key aspects (OECD, 2007): - VC shares the business risk with the entrepreneur;
- Investment is generally long term, between 3 and 7 years;
- As the capital is at risk, VCs work in a partnership with the entrepreneurs. They assist at the strategic level and provide support and advice to the entrepreneurs, based on their expertise, experience and contact base. In short, VCs add value to their equity investment to maximise the long-term return;
- VCs scan a company’s market, the strategy and above all the management and entreprene-urial team before looking at the financial side of a prospective investment;
- VC has no special need for dividend returns, and investment returns are harvested primarily in the form of capital gains at the exit, when the company is listed on a stock market or when it is sold to another investor.
2) Deal flow Opportunity creating activities Recognise and identify entrepreneurial
opportunities
3) Investment decision Screen and evaluate deals Select/deselect deals Valuate and negotiate structure deals
4) Business development/ value adding Strategy development Active board membership Outside expertise Other stake holders, management Contact and access to info for the people,
institutions Staging and syndicating investment
5) Craft and executing exit strategies Sale IPO Merger Liquidation Alliances
1) Establish fund Determine investment objectives Raise capital for investment

REDETE – ECONOMIC DEVELOPMENT AND ENTEREPRENEURSHIP IN TRANSITION ECONOMIES
321
Figure 3. The VC investment process
Source: Pearce, Rupert and Barnes, Simon: Raising Venture Capital. John Wiley & Sons Inc., 2006.
The VC process usually ends with one of the following exit mechanisms: - Initial Public Offering (IPO)
- Acquisition (or trade sale): The whole venture is sold to another company.
- Secondary sale: The VC firms sell their part of the venture’s shares only.
- Buyback or MBO: Either the entrepreneur or the management of the firm buys back the VC company's shares of the firm.
- Reconstruction, liquidation or bankruptcy: If the project fails, the VC firms’ last resort is to restructure or close down the venture.
A VC company has, almost by definition, a time limit for the investments they enter (i.e. their
business idea is to buy, develop and sell). The time span can range from 3-4 years up to 10 years, usually depending on the VCs investment strategy. VCs which, for instance, has chosen to invest in start-ups will usually be engaged in that investment for a longer period of time in comparison to the VCs specialised in mezzanine investments. VCs will not consider investing unless they have a good strategy for a possible exit scenario.
Phase 1:
Initial engagement
Phase 2:
Preliminary Due diligence
Phase 3:
Completion
Signed term sheet Consensus to proceed Legally binding deal
1. Screening: VC assesses fit with fund, size of deal, sector, stage and location
2. Kick off meeting: Presentation to one or two partners and/ or associates with subsequent work to position the business for a presentation to a broader selection of partners in the firm
1. Evaluation: VC will carry out due dilligence involving external research, internal discussions at the firm, additional presentations, and talking to „the network“ of existing portfolio companies and advisors
2. Negotiate terms: The principles and shape of the deal are discussed
1. Final due diligence: VC will continue with detailed analysis including checks on the team, intellectual property, financials and legal due diligence
2. Legal closing: Legal work to turn
the term sheet into a legally binding deal

REDETE – ECONOMIC DEVELOPMENT AND ENTEREPRENEURSHIP IN TRANSITION ECONOMIES
322
1.1. Taxation and Venture Capital Investment
Tax policy has an impact on VC activity either by increasing the supply of funds invested or by positively affecting the incentives of individuals to become entrepreneurs. Many theorists have analyzed the link between capital gains taxation and VC activities. They have argued that the supply of funds is unlikely to be greatly affected by lower taxes, because more than half of venture investors are tax-exempt. However, they showed that lower capital gain taxes might increase the interest of VC for investing, thereby increasing the incentive for individuals to pursue entrepreneurial ventures. Consistent with existing analysis, Gompers and Lerner (1999) provide empirical evidence in according to which lower capital gain tax rates are followed by larger amounts of VC fundraising. Due to the fact that this increased fundraising comes from both taxable and tax-exempt investors, the authors suggest that the effect of capital gain taxes have an impact on the level of fundraising. Based on an analysis of R&D financing, Hall generalizes a model which systematically explains how taxation impacts the development of VC investment (Hall, 2002). Comparing the costs of capital for an early stage investment under different taxation systems, this model shows that venture financing is relatively more expensive for R&D projects than for an ordinary investment, and also that a lack of collaterals further reduces the possibility of debt finance. So, reducing capital gain tax might be a helpful solution to encouraging VC investment in newly established R&D-oriented companies.
1.2. Agency Problems in Venture Capital Investment
From the introduction on VC investment, it can be seen that VC investment is associated with serious agency problems due to the severe information asymmetry problems and high level of uncertainty. Principal-agent problems normally arise when a person (an agent) acts on behalf of another (the principal). Specifically, the delegation of authority onto the agent may result in the agent taking actions that are not in the principal’s best interest which are unknown to the principal. The fundamental assumption of agency problem is that individuals are self-interested and will act opportunistically. When there is a conflict between the interest of an agent and a principal, the agent might act in his/her own self-interest.
In the context of VC investment, there are two sets of agency relationships involved, i.e. the relationship between the VCs and the investors of VC funds, and the relationship between the VCs and the entrepreneur. In a relationship between the VCs and the entrepreneurs, VCs act as agents who invest the capital on behalf of the investors, whereas the investors of venture funds act as principals who delegate their authority to VCs. In the VCs - entrepreneur relationship, VCs act as principals who provide capital to entrepreneurs, whereas entrepreneurs act as agents who are involved in daily management of the ventures on behalf of VCs. Agency problems can be more serious when the contracts are written in a world with more severe information asymmetry and higher level of uncertainty.
Information asymmetry occurs when one party in a process has more or better information than the other party. When the agent has better information about his/her own options and on how well the investment is made than the principal, it is hard for the principal to monitor and assess the performance of the agent, who may act inappropriately (from the principal’s view). In addition, a higher level of uncertainty may also lead to more serious agency problems. Researchers suggest that even when the information is symmetric for the two parties, contracts may not be implemented in reality due to the possibility of contractors having opposite views. The contract difficulties are more serious when a transaction is more uncertain. In this case, therefore, the more uncertainty the investors encounter, the more serious the agency problems are.
VC investment may encounter severe problems related to information asymmetry and face a high level of uncertainty, what can make agency problems more serious. Primarily, as stated, while the VC is highly specialised in investing, the entrepreneurs are usually more familiar with

REDETE – ECONOMIC DEVELOPMENT AND ENTEREPRENEURSHIP IN TRANSITION ECONOMIES
323
managing specific businesses. At the same time, there are also severe information asymmetry between VCs and the entrepreneurs they back, that is, it is very hard for VCs to fully observe given recommendations and proposals and monitor efforts made by the entrepreneurs in the projects implementation. Firstly, the information disclosure rule for private companies is not as rigorous as it is for public companies. Secondly, it is normally more difficult to check the quality of information since the companies are young in existence and lack adequate records. Finally, the uncertainty associated with VC investment is very high, since young companies to be invested in normally face lack of adequate information about technology, product and service, market acceptance and management capability, etc. than mature ventures.
In summary, the severe information-related problems and high level of uncertainty that go along VC investment induce serious agency problems in both fund raising and capital investment processes. Almost all the widely used mechanisms of VC investment are therefore focused on how to overcome.
2. Venture Capital/Private Equity activity in Western Balkans compared to CEE and EU-27 countries
The availability of risk capital in all its variants is a critical resource for a modern and adaptable economy. New knowledge have to be wisely and effectively exploited in order for domestic economy to gain maximum benefit out of the process of commercialisation, the process highly conditional upon the availability of skilled, informed and risk-taking investors, who may come as individual investors (concept known as Business Angels) and professionals (VCs). Instigating the VC financing as a result has a number of important benefits, including the ability to promote the economy’s growth and competitive position through increased innovation, entrepreneurship and job creation. Experience of the majority of developed countries shows that public support to the VC industry is considered critical to offset the development of VC market (European Investment Fund, 2011).
The VC funds are present in the Western Balkans countries since 1997. The market for the VC investment opened with the support of international financing institutions (IFIs, mainly EBRD) and international development-oriented institutions (USAID). Several regional pioneering VC funds were negatively affected by the economic crisis in 2008, and are no longer active. Out of 10 funds that were and/or are still active, 8 of them were the funds pursuing opportunistic deals, and 2 remaining have focused on innovation and technology sectors (RSG Capital, Poteza Innovation & Growth Fund, both Slovenian).
Contrary to the buyout funds in the region, there are very few cross-border transactions in the sphere of venture capital investment. However, there are few good examples including Quaestus Private Equity Capital investing in food production companies in Croatia (Hlad) and Serbia (Vulic & Vulic, Imlek, Bambi, Victora Group); CC Partnership LP investing in delivery companies in Croatia (Oversees Express) and Serbia (Overnight Express). In addition, we are witnessing consolidation within the country of the original investment (Adriatic Kabel was pure a consolidation play making over 13 acquisitions in the Croatian market).
Private Equity activity in the Western Balkans compared to CEE and EU-27 countries is at an embryonic stage of development. The available statistics from EVCA/PEREP_Analytics and Thompson Reuters are shown in the table below:

REDETE – ECONOMIC DEVELOPMENT AND ENTEREPRENEURSHIP IN TRANSITION ECONOMIES
324
Table 1. Private Equity investments in CEE, 2007 – 2009 (in EUR thousands and as percentage of GDP)
Total investment Investment as a % of GDP
2007 2008 2009 2007 2008 2009
Bosnia-Herzegovina 456 4.208 6.267 0.004% 0.036% 0.052%
Bulgaria 563.374 90.477 184.003 1.950% 0.265% 0.543%
Croatia 7.150 100.875 28.154 0.017% 0.213% 0.061%
Czech Republic 182.368 434.553 1.396.299 0.143% 0.294% 1.017%
Estonia 36.316 14.972 4.507 0.232% 0.093% 0.033%
Hungary 214.682 476.104 213.637 0.208% 0.422% 0.223%
Latvia 23.654 63.084 997 0.111% 0.273% 0.005%
Lithuania 151.661 0 1.183 0.531% 0.000% 0.004%
FYR Macedonia* 13.500 0 14.388 0.233% 0.000% 0.217%
Moldova 15.050 0 0 0.462% 0.000% 0.000%
Montenegro* 0 25.000 0 0.000% 0.809% 0.000%
Poland 440.715 633.210 268.094 0.141% 0.167% 0.089%
Romania 318.089 289.371 220.881 0.239% 0.205% 0.189%
Serbia 105.718 8.402 0 0.649% 0.049% 0.000%
Slovakia 24.700 31.145 0 0.040% 0.046% 0.000%
Slovenia 1.554 2.853 79.130 0.004% 0.008% 0.227%
Ukraine 245.021 305.745 38.244 0.230% 0.232% 0.045%
TOTAL CEE 2.344.007 2.479.998 2.455.783 0.190% 0.201% 0.239%
TOTAL Europe 71.445.012 52.674.787 22.690.468 0.570% 0.394% 0.181%
Source: EVCA/PEREP_Analytics for investment data and Thomson Reuters for GDP data
The statistics concerning the Private Equity activity in the Western Balkans need to be
interpreted with caution. Frequently, one large buyout transaction can significantly influence investment figures. For example, EUR 106 million Private Equity investment in Serbia in 2007 is almost exclusively due to one large buyout deal (SBB acquisition led by Mid Europa). Similarly, EUR 101 million Private Equity investment in Croatia in 2008 is mostly due to two very large buyout/recapitalisation transactions (Sunce/Blue Sun Hotels & Resorts investment by Marfin Investment Group and NCH Media recapitalisation by Vienna Capital Partners). The only shown Private Equity activity for Montenegro in the amount of EUR 25 million is due to large buyout of Niksic Steelworks by Ethamba Capital in 2008.

REDETE – ECONOMIC DEVELOPMENT AND ENTEREPRENEURSHIP IN TRANSITION ECONOMIES
325
Figure 4. Private Equity annual investments in CEE, 2007 – 2009 (no bank leverage included) (in EUR millions)
Source: EVCA/PEREP_Analytics
*Bosnia&Herzegovina, Macedonia, Moldova, Montenegro
In 2011, in Europe, more than 4,800 companies received investments, out of which SMEs
accounted for 85%, with an average investment per company accounting for three million euros. More than 60% of these investments were attributed to VC. The three most targeted sectors by number of companies in 2011 were Life sciences, Computer & consumer electronics and Communications together accounting for 50% of the total.
Figure 5. Private Equity annual investments as percentage of GDP for Europe, CEE and selected European countries, 2011
Source: EVCA/PEREP_Analytics
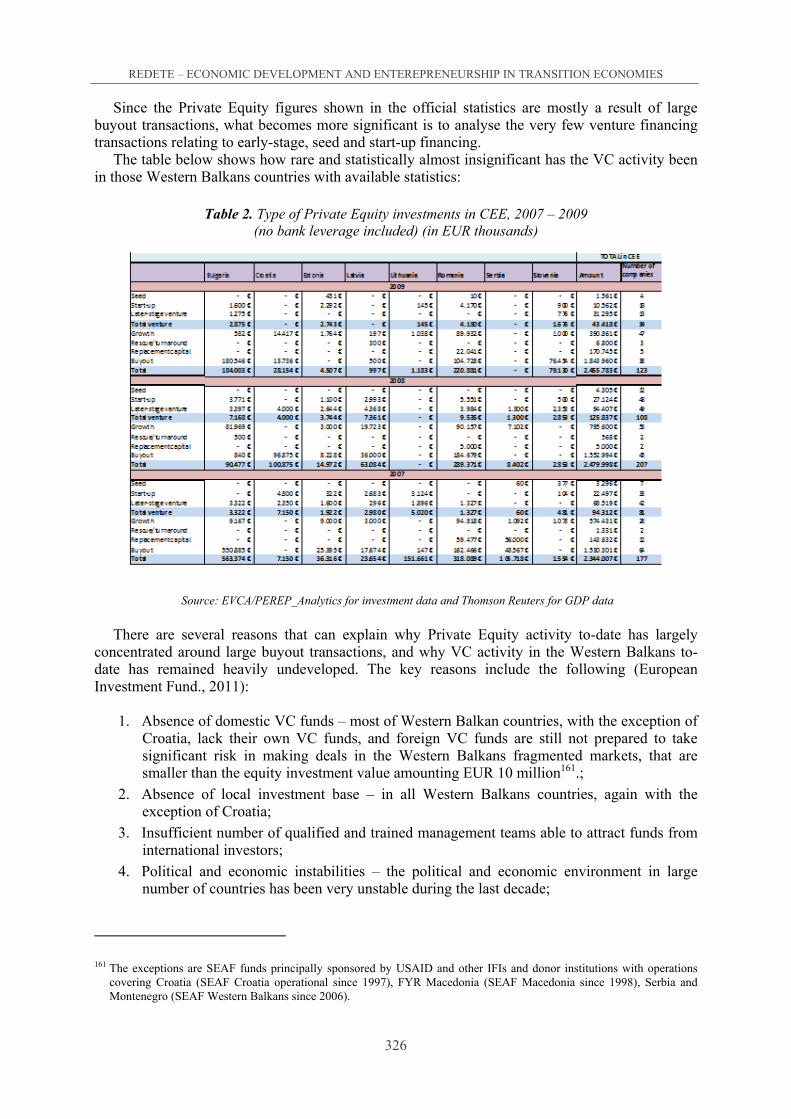
REDETE – ECONOMIC DEVELOPMENT AND ENTEREPRENEURSHIP IN TRANSITION ECONOMIES
326
Since the Private Equity figures shown in the official statistics are mostly a result of large buyout transactions, what becomes more significant is to analyse the very few venture financing transactions relating to early-stage, seed and start-up financing.
The table below shows how rare and statistically almost insignificant has the VC activity been in those Western Balkans countries with available statistics:
Table 2. Type of Private Equity investments in CEE, 2007 – 2009 (no bank leverage included) (in EUR thousands)
Source: EVCA/PEREP_Analytics for investment data and Thomson Reuters for GDP data
There are several reasons that can explain why Private Equity activity to-date has largely
concentrated around large buyout transactions, and why VC activity in the Western Balkans to-date has remained heavily undeveloped. The key reasons include the following (European Investment Fund., 2011):
1. Absence of domestic VC funds – most of Western Balkan countries, with the exception of
Croatia, lack their own VC funds, and foreign VC funds are still not prepared to take significant risk in making deals in the Western Balkans fragmented markets, that are smaller than the equity investment value amounting EUR 10 million161.;
2. Absence of local investment base – in all Western Balkans countries, again with the exception of Croatia;
3. Insufficient number of qualified and trained management teams able to attract funds from international investors;
4. Political and economic instabilities – the political and economic environment in large number of countries has been very unstable during the last decade;
161 The exceptions are SEAF funds principally sponsored by USAID and other IFIs and donor institutions with operations
covering Croatia (SEAF Croatia operational since 1997), FYR Macedonia (SEAF Macedonia since 1998), Serbia and Montenegro (SEAF Western Balkans since 2006).

REDETE – ECONOMIC DEVELOPMENT AND ENTEREPRENEURSHIP IN TRANSITION ECONOMIES
327
5. Absence of enabling environment – most of Western Balkans countries lack stimulating environment to support development of SMEs and innovation, including technology transfer funds, business angels financing, etc.;
6. Absence of venture friendly culture – lack of proper business-related awareness and entrepreneurial culture, with surrendering ownership control in one’s own enterprise presenting a significant problem for the development of VC financing in the Western Balkans. The entrepreneurs’ attitudes are slowly but steadily changing over time, and sharp decrease in available funds from the crisis-affected banking sector make the SMEs look for the alternative if to sustain long-term.
The potential for the VC activity in the Western Balkans is expected to increase as the coun-
tries’ economic environment is being reformed and adapted to new realities and their institutions built up in the context of EU integration. However, there are still many challenges for the Western Balkans in developing VC activity. Most of the Western Balkans countries based their high growth in 2007 on the consumption-led growth model, rather than by increasing competitiveness and investing in innovation capacities. The effects of global economic and financial crisis are visible in all Western Balkans countries. Going forward, it is expected that countries of the region will not have equal success in attracting Private Equity and VC activity.
Since 1997 to this date, the volume of the VC investment is estimated at EUR 107.8 million in 74 transactions (an average VC investment amounting EUR 1.5 million per company portfolio).
The following table provides details on the existing VC funds, summary investments and status:
Table 3. VC funds in Western Balkan countries
Fund Established
Estimated volume of investment (m EUR)
Min-Max Investment
(m EUR)
No of Investments since inception of the fund until Q4
2010
Status
Nexus Alpha 2008, Croatia 11,0 1-10 3
Not fully invested, total committments were EUR 36 million, but we estimate the fund has EUR 15 million capital available for new investments and could be fully invested in 2011
Quaestus Private Equity Capital Capital 2003, Croatia 26,5 1-10 7
Fully invested, total committments were EUR 35 million, the fund has realized 1 exit so far.
RSG Capital* 2008, Slovenia 1,5 0,3-1,5 1
1 investment in Croatia, possiblitiy to invest in the whole WB region. Total committed capital is EUR 19 million and we estimate there are EUR 15 million available for investments in Slovenia and WB.
SEAF South Balkan Fund 2005, Serbia, Macedonia, Montenegro 7,1 0,3-1,5 7 7 investments in Serbia, fully invested, total
committed capital was EUR 13 million
SEAF Macedonia 1998, Macedonia 10,4 0,3-1,5 14 Fully invested, four companies still in the portfolio.
SEAF Macedonia, SIF 2007, Macedonia 1,0 0,3 3
Recycling of profit from SEAF Macedonia invested in 3 Macedonian comapnies. Fully invested. Possible follow-on arrangement in Q1 2011 in estimated amount EUR 1 million.
SEAF Croatia 1997, Croatia 6,3 0,3-1,5 22 Fully invested, winding-down stage, three companies still in the portfolio.
Poteza Innovation & Growth Fund 2007, Slovenia 1,0 0,3-2 1
1 investment in Croatia, fund is not active any more as a result of problems with investors
Horizonte Ventures 2001, Austria 20,0 1-10 88 investments in Bosnia&Herzegovina, Serbia, Croatia, in winding down stage, exits realized from most investments.
CC Partnership LP 1997, Poland 23,0 1-10 88 investments in Croatia and Serbia, exits realized by 2007, fund does not exit anymore.
TOTAL 107,8 74 Source: Croatian Private Equity and Venture Capital Association (CVCA) and Venturexchange Ltd.

REDETE – ECONOMIC DEVELOPMENT AND ENTEREPRENEURSHIP IN TRANSITION ECONOMIES
328
The VC investment activity suffered a serious setback as a result of the recent economic crisis from 2008. Going forward, it will be challenging to restart VC activity especially as a result of progressive exit of international development-oriented institutions (USAID, SEAF Funds). Nonetheless, the following six VC funds are expected to come to the market:
Table 4. VC funds in Western Balkan countries
Fund Focus Estimated amount (m EUR)
Min-Max Investment (m EUR)
Nexus FGS Croatia only 52 1-10 Quaestus Private Equity II Croatia only 73 1-10 Prosperus FGS Croatia only 52 1-10 Aleternative FGS Croatia only 25 1-7 Honestus FGS Croatia only 25 1-7 Blue Sea Capital Croatia only 30-50 1-10 SEAF Macedonia, SIF II WB plus Slovenia 2,5 0,2-0,3 Total Macedonia ONLY 259-279
Source: Croatian Private Equity and Venture Capital Association (CVCA)
From the total of six VC funds expected to be launched, five are expected to be launched in
Croatia due to the Croatian Government’s initiative to support the VC market by public funds under the programme Economic Cooperation Funds (FGS). Blue Sea Capital has an important backing by one of the largest buyout funds in CEE region, Mid Europa Partners, and its experienced team. Therefore, it is expected that Blue Sea Capital will also manage to form a fund. SEAF Macedonia is expected to launch its second small business investment facility (SIF II), recycling the profits realized in the fund. In total, seven new funds are expected to come to the market in 2012, with an estimated commitment exceeding EUR 250 million.
Conclusions
VC is particularly important for the small and medium enterprises, since it provides finance to companies with promising but uncertain business models facing high risk in their future endeavours.
VC thus helps to stimulate innovation, drive economic growth and job creation. It has a lasting positive effect on the economy as it enables stable investment. Moreover, VC backed companies often create high quality jobs as VC supports creation of some of the most successful and innova-tive businesses of our time, since it is in their best interest to invest wisely and provide their best know-how to the business they support. According to the recent research, an increase in VC investments is associated with an increase in the real GDP growth. Additionally, the impact of the VC investment on the SMEs early stage development has even more pronounced effect on crea-ting of healthy and stimulating SMEs environment, in the end resulting in notable economic growth.
When taking into account where Europe stands now in terms of its competitive position in research and innovation sectors, there is a recognition that more could be done to make VC funding more available, with respect to its significance for the overall economic development. Such funds are crucial for new technology-based firms and promoting innovation.
The fragmentation of markets for VC is an issue that requires immediate action. This is why the present consultation focuses on the creation of an internal market for VC. As announced in the Communication on the Single Market Act, the immediate priority is to enlarge a geographical base in which VC funds can be raised and capital invested. In light of the circumstances, the creation of a single market for VC is the immediate priority to be dealt with in this consultation.

REDETE – ECONOMIC DEVELOPMENT AND ENTEREPRENEURSHIP IN TRANSITION ECONOMIES
329
The Western Balkans countries should consider undertaking institutional, legal and fiscal reforms, as well as measures to improve the “finance-readiness” for risk capital (VC, PE) of SMEs. A dynamic entrepreneurial environment creates conditions for successful start-ups and development of competitive firms that create new jobs and strengthen economic and social cohesion. Western Balkans businesses still lag behind the EU countries in terms of quality, equipment, efficiency and innovation. The measures to enhance entrepreneurial and investment climate and to develop cooperation between the academic R&D base and industry should constitute key supplementary remedies for market imperfections and failures in the equity financing. Without considerable “institutional building” in all fields relevant to equity finance, public intervention scheme will not be successful in developing equity finance market.
Reference list
1. Bronwyn H. Hall (2002) The Financing of Research and Development. Oxford Review of Economic Policy, Oxford University Press, vol. 18
2. Cochrane, J.H. (2005) The risk and return of venture capital. Journal of Financial Economics 3. European Investment Fund (2011) Western Balkans Venture Capital Market Assessment 4. Fulghieri, P., Sevilir, M., (2004) Size and focus of venture capital portfolios. Working paper.
University of North Carolina 5. Gompers, P.A., Lerner, J., (1998) Venture capital distributions: short-run and long-run
reactions. Journal of Finance 6. Gompers, P.A., Lerner, J., (1998). What drives venture capital fundraising? Brookings
Proceedings on Microeconomic Activity 7. Gompers, P.A., Lerner, J., (2000) Money chasing deals?: the impact of fund inflows on the
valuation of private equity investments. Journal of Financial Economics 8. Gompers, P.A., Lerner, J., (2004) The Venture Capital Cycle. MIT Press, Cambridge, MA and
London 9. Kaplan, S.N., Schoar, A., (2005) Private equity performance: returns, persistence and capital.
Journal of Finance 10. Kaplan, S.N., Stromberg, P., (2004) Characteristics, contracts, and actions: evidence from
venture capitalist analyses. Journal of Finance 11. Moncada, J. (2011) A new European regime for Venture Capital. European Commsion 12. OECD (2007) Innovation and Growth 13. http://www.oecd.org/dataoecd/2/31/39374789.pdf (accessed 25/08/2012) 14. Pearce, Rupert and Barnes, Simon (2006) Raising Venture Capital. New Jork: John
Wiley&Sons 15. Svaljek, S. (2007) Ulaganje u privatni vlasnicki i rizicni kapital u Hrvatskoj: porezno i pravno
okruzenje. Zagreb: Privredna kretanja i ekonomska politika 16. World Bank (2011) Annual Report 17. http://web.worldbank.org/WBSITE/EXTERNAL/EXTABOUTUS/EXTANNREP/0,,menuPK:
1397243~pagePK:64168427~piPK:64168435~theSitePK:1397226,00.html (accessed 20/08/2012)
18. EVCA (2012) Activity Data on Fundraising, Investments and Divestments by Private Equity and Venture Capital Firms in Europe
19. http://www.evca.eu/uploadedfiles/home/press_room/Yearbook_2012_Presentation_all (accessed 25/08/2012)
BUSINESS STRATEGIES FOR COMPANIES IN TRANSITION COUNTRIES AT GLOBAL CONDITIONS
Alma ĆEHAJIĆ162,
Eldin BEGIĆ163, Fatima VELADŽIĆ164
Abstract
The global economic crisis appearance brought a high rate of inflation, unemployment and an efficiency decrease of economic systems in many countries. With this problems enhanced the need to implementate transition in some countries. This implies an economic system transit and a society transit from a system of planned economy to a system of market economy. The plain goal of radical industrial restructuring is to ensure survival in a global open-market environ-ment. Countries which have started the transition process faced suddenly with an additional problem, with global competition. The global economic crisis has reduced and slowed down economic relations even in developed countries, which was and still is an opportunity for com-panies in transition countries to take some steps to increase the development gap to global competitors.
Nevertheless, most transition countries have not reached the possible level of economic de-velopment as well as the possible level of development in other life areas. Companies in this countries must search for possibilities to be competitive with global companies. Because si-tuations in which companies exist, it is necessary to notice the main problems and contem-porary characteristics of business enterprise in transition countries under global economic con-ditions. The aim of this paper is to find optimal business strategies for companies in transition countries in their efforts to increase international competitiveness and achieve economic deve-lopment at global conditions.
Optimal business strategies should lead to global competitiveness for companies in transiti-on countries. The complexity of business and trade, often caused by various limitations in tran-sition countries, is the basic problem by developing companies and establishment of new com-panies in this countries. Especially, the contemporary global conditions are increasing the sign-ificance of efficient economic system functioning in which the company exists. Although, compa-nies in transition countries are facing on one side sluggish surroundings and in the other side expeditious global surroundings. This contrasts led to difficulties of labor, sustention, business and management in transition companies. Often there are misunderstandings between coopera-ting managers and companies in transition countries and in developed countries. The contribu-tion of this paper will be a help for transition managers. They will be able to find in this paper optimal management strategies for their companies which are influenced by the contemporary economy globalization.
Keywords: strategies, business, companies, transition, globalization
162 University of Bihać, Biotechnical Faculty, Luke Marijanovića bb, 77 000 Bihać, Bosnia and Herzegovina,
[email protected] 163 University of Bihać, High School of Medicine, dr. Irfana Ljubijankića bb, 77 000 Bihać, Bosnia and Herzegovina,
[email protected] 164 Finace Ministry of Federation BiH, Central Office, Husrefa Redzića 4, 71 000 Sarajevo, Bosnia and Herzegovina,

REDETE – ECONOMIC DEVELOPMENT AND ENTEREPRENEURSHIP IN TRANSITION ECONOMIES
331
Introduction
Considering that the prompt method of transition and privatization failed in most transition countries it is necessary to research economic development in transition economics, but under glo-bal conditions with which are faced this countries. Industrial restructuring should ensure survival for companies in transition countries in the global market. To ignore the development and flow of ideas as a component of economic globalization is to miss a central feature of the globalization process (Goldin and Reinert, 2012, p.243). Starting from the eighties, in Europe there was a tendency towards privatization (Stiglitz, 2000 p.5), transformation of state enterprises into private.
A business strategy can be defined as a plan, a form of behaviour and a perspective which help the companies main goals, policies and activities to integrate in an unity. A strategy is a basic roadmap for current and future goals (Boyd and Walker, 1990 p.43). The essence of each business strategy is to determinate a way to develop the company and to increase the competitiveness, of which will depend the business performance at the temporary global conditions. Therefore, the selection of optimal business strategies uder indicated circumstances is crucial for business success, especially under global conditions.
There are, as we have seen, many examples of comapnies that have driven growth during challenging economic times. They had the courage and confidence to back their judgment about where opportunities could be exploited (Rhodes and Stelter, 2010, p.168). Management teames are acutely aware of the increased pressure that comes with global conditions. At this circumstances decision making slows down managers seek extra reassurance before taking action and leaders become more reucutant to empower their management teams. It is very important to know how well does the company understand the potential of gobal economy, even in transition countries and which elements of business economics can be fundamentally challenged in order to change the competitiveness.
General strategies for companies
Almost everyone says that there is a need for regulation or at least for more than there was before the transition. Figuring out what to do in an economy in freefall is not easy (Stiglitz, 2010, pp.1-32). Over and obove, in most transition countries appears an another economic freefall, a long continuous transition. Developing a company under this conditions is very difficult, but at the same time it is challenging.
It seems impossible to find development strategies for companies in transition countires under global conditions at this circumstances. The expeditious global surroundings are not favorable for companies in transition countries and their business. Howeever every crisis is a challenge and a chance to establish or develop a company, while competitors are preoccupied with struggling on economic crises. Searching for new strategies at crises time is significant to for companies at this turbulent and uncertain times.
According to conditions to which this paper is related, we appreciate that general types of strategies (Porter, 1980) still are cost leadership strategy, differentiation strategy and market segmentation strategy or focus strategy, which shows figure 1.

REDETE – ECONOMIC DEVELOPMENT AND ENTEREPRENEURSHIP IN TRANSITION ECONOMIES
332
Figure 1. Porter's Generic Strategies
Strategies for companies in transition countries
Considering the circumstances in transition countries at global conditions we appriciate that under the auspice of general strategies possible strategies could be:
- Defensive strategies;
- Offensive strategies.
This strategies can be divided, which shows the next figure. In this paper, we will explain each of these strategies.
Figure 2. Defensive and Offensive strategies for companies in transition countries at global conditions
This strategies prove that it is possible to improve business even in conditions of transition.
There is tremendous scope for improvement even in good institutional environments (Banerjee
Defensive Strategies Offensive Strategies
Protect financial fundamentals
Protect business fundamentals
Protect revenue
Focus on innovation
changes in the ext. environment
Unleash marketing and advertising
Fight to the competitors
Invest in the future
Changing strategies

REDETE – ECONOMIC DEVELOPMENT AND ENTEREPRENEURSHIP IN TRANSITION ECONOMIES
333
and Duflo, 2012 p.271) and some margin for action even in bad one. Ideas are the most vital determinants of whether a developing country will be able to achieve long term dynamic growth (Lin, 2009 p.92). With the guidance of right ideas, a developing country will be able to exploit the advantage of backwardness, achieve dynamic growth and converge with developed countries.
Defensive Strategies
In a damaged economy defense must come first (Rhodes and Stelter, 2010). In such an envi-ronment, weak business models will be revealed, and weak companies will find themselves under disproportionate pressure as margins are squeezed and profits drop accordingly. Companies can practice a sort of defensive strategy that can get them through the worst economic times and continue to serve them well as conditions improve slowly. Such companies aim to do three things:
- Protect financial fundamentals
- Protect business fundamentals
- Protect revenue.
Protect financial fundamentals. Even companies with strong cash positions can be cau-
ght off-guard by economic fluctuations. In unstable times, companies that do not pay close attention to their cash position will find themselves flirting with danger. The amount of liqui-dity and the form it should take constitute the topic of working cash managament (Levi, 2009 p.387). The new circumstances are forcing companies to face a new realitiy in terms of their financial fundaments. The current climate in most transition countries may be a good oppor-tunity to invest in new initiatives, but not if the cash position of a company is unstable. At turbulent times, it may be necessary to slow down or postpone spending. Nevertheless, many companies are oveleveraged. For some companies, paying down debt may be a necessity rather than an option.
Protect business fundamentals. There is nothing particularly profound about individual actions to protect the business fundamentals and that are things that any company can do. This strategy refers to play strong defensive and is preparing to a potent offense. Reducing costs for a long term is critical for protecting business fundamentals. But in the same time, these costs cuts must be done in a way that protects the core. During the transition some companies have gone about labor force reduction, opted to reduce pay, but such strategies are not com-monplace during transition times. Maintain a flexible business model allows quick adjustmen-ts to changing economic conditions. One obvious way to accomplish this is to avoid a vertically integrated business model.
Protect revenue. Business in transition countries should not expect a quick return to pretransition levels of spending. There is the possibility of a poverty trap when investments pay off relatively little for those who can invest little (Banerjee and Duflo, 2012 p.139). Se-veral major macroeconomic trends have affected consumer behaviour in the downturn. Altho-ugh the obvious response to increased consumer price sensitivity is to reduce prices, busine-sses should do so only if they enjoy a cost advantage. Cutting prices without a cost advantage undermines margins andst little potentially leads to a destructive price war. Pricing is a key strategic lever. It is not necessary to lower the actual price point on a product. It is often po-ssible to lower the preceived price point without sacrificing revenue.

REDETE – ECONOMIC DEVELOPMENT AND ENTEREPRENEURSHIP IN TRANSITION ECONOMIES
334
Offensive Strategies
It is only by exploiting offensive strategies that companies can thrive in a low-growth, highly competitive economy. These strategies include following:
- Focus on innovation
- Capitalize on changes in the external environment
- Unleash marketing and advertising power
- Take the fight to the competitors.
- Invest in the future
- Changing strategies.
Focus on innovation. In economics there is a big importance in developing techologies. Developing a company is possible on the basis of capital intensive production, which usually requires a huge amount of capital investment. Countries can not effectively use technology only by opening to global trade flows, technology or capital (Lall, 2004). Techology includes physical creations as well as knowledge and ability possessed by people for developing, application and improvement (Pavitt, 1999, p.14). This confirms that the key strategic resource for managing a company is knowledge, even more in crisis times.
Capitalize on changes in the external environment. The external environment can be divided into social environment and business environment (Wheelen and Hunger, 1998 p.12). The company must recognize the shifts early and adapt their products to capitalize on the opportunities such changes present. Whereas in the environment are positive and negative trends and changes, (Kotler, et al, 1996. p.134.) companies, using their own research, must be accompanied by changes in the environment and timely respond by adopting new strategies according to the changes.
Unleash Advertising and Maketing Power. During the transition, the cost of advertising drops significantly. The companies that continue advertise aggressively capture a larger share of voice at relatively favorable rate. The heart of marketing is relationships (Berry et al, 2006), and nurturing long-term relationships should be the goal of marketing practice.
Take the fight to the competitors. Companies will have to expect new rivals to come from many places as a result of globalization. In such an environment, companies can not rely solely on defensive strategies. It is essential that they take the fight to their competitors. A domestic firm with market power can raise prices above competitive levels and import competition can erode this market power (Goldin and Reinert, 2012 p.52). This evidence comes from the examination of price cost of firms in countries where trade liberalization has taken place.
Invest in the future. One of the most formidable weapons that companies can use is the restructuring of the operate portfolio, either growing it through mergers and acquisitions or pruning it through strategic divestments. Often the most effective strategy to acchieve growth in a sluggish industry is to acquire weaker competitors. Nevertheless divestments can become an important source of capital when resources are limited.
Changing strategies. Economists trained in the structuralist tradition hold that development requires economic transformation or the “ability of an economy to constantly generate new dynamic activities” (Ocampo, 2005) characterized by higher productivity and increasing returns toscale. Changing strategies are, in essence, forms of fundamental business model innovation. There are many examples of business model innovation, but we will describe the following models:
- Low-Cost Business Model
- Shift from selling products to selling services
- Deconstruction

REDETE – ECONOMIC DEVELOPMENT AND ENTEREPRENEURSHIP IN TRANSITION ECONOMIES
335
Low-Cost Business Model. During the transition could be the right time to develop a low-cost business model. This models promote management discipline nad unambiguous value propositions for customers and can even generate customer loyalitiy. Current practices can be enhanced, however, and new tools can be introduced at low costs (Claessens, 2010 p.87). There are four essential elements to operating a typical low-cost business model:
- Relentlessly pursue the lowest possible price.
- Focus on cost savings in all areas except for advertising and marketing
- Devote attention to delivering the basics
- Make flexibility and a broad job definition the norm.
Shift from selling products to selling services. This model turns the equation on its head by using the product to sell either a service or a specific outcome. Positive reallocation gains were due to the fact that services have relatively high average productivity (Codrina and Taylor, 2006 p.9). In the slower growing regions, direct contributions of services to economy-wide productivity were weak but rising demand still created jobs.
Deconstruction is an approach that disassembles the value chain and then looks to develop a solution that can provide faster, lower-cost and more reliable products and servicces. Thereby, human capacitiy, knowledge and creative potentials become inherently the most valuable strategic weapon (Peters, 1988 p.515). This business model innovation can take three forms:
- Shared development – lowers capital intensity and shares product risk across a range of suppliers
- Orchestration – leverages a network of suppliers, providing more flexibility and lower costs while often offering a superior product.
- Facilitation – connects the buyers of products directly with a range of suppliers, allowing a company to facilitate rather than intermediate between buyers and suppliers.
Conclusions
It falls to a company's leader to define not only how well the company gets through a difficult environment but also how its competitive position can be improved for the future. So the fight to sustain company performance during transition at global conditions is not just about short term survival, it is also about long term positioning in the industry. This is clearly a battle worth fighting.
This process of Creative Destruction is the essential fact about capitalism. It is what capitalism consists in and what every capitalist concern has got to live in. (Schumpeter, 2008, p83.). At transition times or at crisis times the company must attend to the basics, to protect the financial fundamentals, the business fundamentals and revenues. But after attending to the basis executives should look for areas to attack. In sports, a victory may be built on strong defense. However, no team can put tigether a winning season without an effective offensive strategy, too (Rhodes and Stelter, 2010 p.111). It is not different in business. Early and decisive actions to secure the financial and business fundamentals lay the foundation for future success.
Companies in transition countries must adapt to an economic recovery that will be as slow as the downturn was deep. Companies that can stabilize themselves and adapt quickly to the new realities will find find that the damaged economy presents some new opportunities.
In the past, consumers could be counted on to spend an economy out of a recession. But no longer. A whole generation will start to spend less for two reasons: one, because its members either can not or do not want to borrow more; and two, because the times of easy wealth creation in stock markets and real estate are essentially over. Consumer behaviour is changing rapidly, with an emphasis on so-called trading down – that is, shopping for bargains and purchasing lower-

REDETE – ECONOMIC DEVELOPMENT AND ENTEREPRENEURSHIP IN TRANSITION ECONOMIES
336
cost alternatives to the premium goods they once favored (Rhodes and Stelter, 2010, pp.52-53). The abrupt economic slowdown, along with the return of protectionism and other forms of economic nationalism, will have a clear impact on the political climate, as follows: Social unrest and Political instability.
We must design policies at the global, regional, national and local or community levels that ensure that the benefits of globalization reach the billion and more people who are currently marginalized (Goldin and Reinert, 2012 p.283) and who have not benefited from the fruits of globalization. Economic policies that are connected to the social realities of their respective countries, not to economic textbooks that do not pay sufficient attention to countries marked by poverty and inequality (Santiso, 2006 p.5-6) are successful policy improvements.
Reference list
1. Banerjee, A.V. and Duflo E. (2012). Poor Economics. Penguin Books. London 2. Berry, L.L., Wall, E., Carbone, L. (2006). Service clues and customer assesment of the service
experience. Academy of Management Perspectives. 20(2), pp 43-57 3. Boyd, H.W., Walker, O.C. (1990). Marketing Management: A Strategic Approach, Irwin
Hommewood. Illinois. USA 4. Claessens, S. (2010). Reasons for Limited Sovereign Risk Management and How to Improve
It in the Debate. Overcoming Developing Country Debt Crises. Oxford University Press. New York. pp.70-91
5. Codrina, R., Taylor, L. (2006). Developing and Transition Economies in theLate 20th Century: Diverging Growth Rates,Economic Structures, and Sources of Demand. DESA Workink paper No.34
6. Goldin, I. and Reinert, K. (2012). Globalization for Development: Meeting New Challenges. Oxford University Press. New York
7. Kotler P., Wong, V., Saunders J., Armstrong, G. (1996). Principles of Marketing.Fourth Euro-pean Edition. Prentice Hall, London
8. Lall, S. (2004). Globalization and Industrial Performance. Proceedings of the First Globelics Academy. Lisbon
9. Levi, M.D. (2009). International Finance. 5th Edition. Routledge. London 10. Lin, J.Y. (2009). Economic Development and Transition: Thought, Strategy, and Viability.
Cambrodge University Press, Cambridge 11. Ocampo, J.A. (2005). Beyond Reforms, Structural Dynamics and Macroeconomic Vulnera-
bility. Stanford University Press,Stanford, CA. 12. Pavitt, K. (1999). Technology, Management and Systems of Innovation, Edward Elgard Publi-
shing. Cheltenham 13. Peters, T. (1988). Thriving on Chaos: A Handbook for a Management Revolution. Macmillan.
London 14. Porter, M.E. (1980). Competitive Strategy: Techniques for Analyzing Industries and
Competitors. Free Press, New York 15. Rhodes, D. and Stelter, D. (2010). Accelerating Out of the Great Reccesion: How to Win in a
Slow-Growth Economy. McGraw-Hill. New York 16. Santiso, J. (2006). Latin America's Political Economy of the Possible. MIT Press. Cambridge 17. Schumpeter, J. (2008). Capitalism, Socialism, and Democracy. Harper Perennial Modern
Classics. New York 18. Stiglitz J.E. (2010). Freefall: America, Free Markets, And the Sinking of the World Economy.
W.W. Northon & Company. New York 19. Stiglitz, J.E. (2000). Economics of the Public Sector. 3rd Edition. W.W. Northon & Company.
New York 20. Wheelen, L.T., Hunger, J.D. (1998). Strategic Management and Business Policy: Entering
21st century global society. Sixth Edition, Addison-Wesley, Boston.Massachusetts

REDETE – ECONOMIC DEVELOPMENT AND ENTEREPRENEURSHIP IN TRANSITION ECONOMIES
337
HIGH GROWTH ENTREPRENEURSHIP IN BOSNIA AND
HERZEGOVINA – IMPORTANCE, CURRENT STATE AND PERSPECTIVES
Bahrija UMIHANIĆ165 Majda MUJANOVIĆ166 Mirela OMEROVIĆ167
Abstract
Focus of this paper are high-growth enterprises which attached considerable attention from policy makers from whole world, which is result of their positive effect on national wealth and job creation. OECD defines high-growth enterprises as firms with average annual growth in employees or in turnover greater than 20% a year over a three-year period, and with ten or mo-re employees at the beginning of the observation period. Enterprises that fulfill these require-ments and which operate less than five years are named „gazelles“. High-growth enterprises are rare, but number and share of jobs that those enterprises create is large. There is a wide a-cknowledgement on importance of defining and implementing the appropriate polices that wo-uld foster further operations of high-growth enterprises, which is also a case for Europe and European Union. A number of highly respected and honorable European experts concluded that there is a high-priority need for European-wide dedicated framework that addresses the high-growth, or gazelle phenomenon [Europe Innova Gazelles Panel Summary Report, 2008]. Evide-nt is a lack of representative, large-scale, longitudinal micro-level datasets for research purpo-ses. However, the world’s largest academic and research project from the field of entrepreneur-ship the Global Entrepreneurship Monitor - GEM provided its contribution to analysis of high-growth enterprises. This paper contains authors’ overview of the main GEM results related to this topic. High-growth enterprises are important for all countries, especially for developing co-untries like Bosnia and Herzegovina, since those enterprises have above average impact on new jobs creation, wealth creation and the development of entrepreneurial role models. It is of cru-cial importance for governments in Bosnia and Herzegovina to identify and support high-grow-th enterprises in order to foster economic development of the country. Taking in consideration above mentioned, authors of the paper present developed methodology for identification of hi-gh-growth enterprises – “gazelles” implemented on territory of Federation of Bosnia and Her-zegovina. Willing to make contribution in this field, this paper contains proposed methodology for identification of gazelles for territory of Bosnia and Herzegovina, which implementation wo-uld contribute to creation of adequate incentives for support to those enterprises. Proposed methodology is defined on basis of EU good practices and good practices from countries from the region related to this field. Paper finishes with recommendations for policy actions aimed at further development of high-growth enterprises in Bosnia and Herzegovina and their greater impact on reduction of unemployment and economic development of the country.
Key words: high-growth enterprises, entrepreneurship policies, economic development
165University of Tuzla, Faculty of Economics, Univerzitetska br. 8, 75 000 Tuzla, Bosnia and Herzegovina,
[email protected] 166Centre for Entrepreneurship Development, Trg slobode bb, 75 000 Tuzla, Bosnia and Herzegovina,
[email protected] 167Centre for Entrepreneurship Development, Trg slobode bb, 75 000 Tuzla, Bosnia and Herzegovina,

REDETE – ECONOMIC DEVELOPMENT AND ENTEREPRENEURSHIP IN TRANSITION ECONOMIES
338
Introduction
Until 1970’s it was mainly believed that large enterprises create the most of the jobs in the eco-nomy. This statement seemed logical and undisputed until David Birch, an American economist, wrote a book in 1979 entitled The Job Generation Process. His researches discovered that it was actually high-growing small and medium enterprises that create most of new employment (Birch, 1979). The interest of policy makers as well as researchers for small and medium high-growth enterprises has grown ever since. The trend was especially noticeable in recent years of economic downturn, recession and major job cuts, when these enterprises were seen as key to recovery, because of their significant positive effect on economy growth and development.
The world’s largest academic and research project from the field of entrepreneurship, the Global Entrepreneurship Monitor - GEM provided its contribution to analysis of high-growth enterprises around the world through definition of special measures. Additionally, relying on GEM data, Centre for High-Impact Entrepreneurship at Endeavor (C-HIE) conducted an analysis and published a report on high-growth enterprises. One of the key findings of the report was that high-growth entrepreneurs represent only 4% of the total entrepreneurs, yet the businesses they have founded or co-own created close to 40% of the total jobs generated (Morris, 2011).
However, there is still a limited understanding of this phenomenon in Bosnia and Herzegovina, especially on how Bosnia and Herzegovina performs in terms of the number and characteristics of high-growth enterprises and according policies.
High unemployment, low rates of economic growth and development and unfavorable business environment are acute economic problems in Bosnia and Herzegovina. Therefore high-growth enterprises could play an important role in rise of country’s growth and development rates, based on their significant contribution to production growth, growth of employment and their tendency to be more innovative than other enterprises. Consequently, particular attention from the policy makers should be paid at these enterprises.
Important step towards creation of policies aimed at high-growth enterprises is development of methodology for identification of high-growth enterprises. This methodology was recently developed in Bosnia and Herzegovina on the basis of EU good practices and good practices from countries from the region related to this field.
Although governments, in most of the countries, are increasingly aware of the importance of high-growth entrepreneurship, it is difficult to design effective policies, because these enterprises experience specific problems (Suddle et al, 2007). Nevertheless, there are some basic guidelines and criteria which should be met and taken into consideration when designing these policies.
The purpose of this work is to emphasize the importance of high-growth enterprises in Bosnia and Herzegovina, as well as to present the current state concerning this topic and give useful recommendations for policy makers on how to support the emergence of high-growth enterprises in Bosnia and Herzegovina in the best possible manner and how to best capitalize on them for job creation and innovation.
Importance, current state and perspectives of high-growth enterprises
Many different definitions of high-growth enterprises can be found in practice, but authors of this paper decided to use the definition of high-growth enterprises and gazelles given by Orga-nization for Economic Co-operation and Development (OECD). The OECD defines high-growth enterprises, as enterprises with average annual growth in employees or in turnover greater than 20% a year, over a three-year period, and with ten or more employees at the beginning of the observation period. High-growth enterprises have often been referred to as ‘gazelles’ although the

REDETE – ECONOMIC DEVELOPMENT AND ENTEREPRENEURSHIP IN TRANSITION ECONOMIES
339
term is now increasingly taken to refer only to young, and usually small, high-growth enterprises. The OECD defines gazelles as “the subset of high-growth enterprises which are up to five years old” (OECD, 2011).
High-growth enterprises have a number of particularities, but it is hard to identify a definite list of common characteristics they share (Schreyer, 2000). Nevertheless, some facts can be highligh-ted. High-growth enterprises usually represent only a small share of the total population; typically up to 6% when measured by employment growth, but they generate a disproportionately large share of all new jobs (OECD, 2011). Their contribution to job creation is especially appreciated during recessionary periods, because large enterprises make significant job cuts in such periods. Although, most of the high-growth enterprises are small, large enterprises can also be important creators of jobs, particularly a sub-group of so called ‘gorillas’ (Mason et al., 2010). Plausibly, high-growth industry of high-technology may seem particularly suitable for emergence and development of high-growth enterprises, but they are actually equally likely to emerge in all industry sectors, and high proportion of high-growth enterprises is also found in services (Autio et al., 2008). Finally, high-growth enterprises do not have a steady growth rate; instead they grow sharply in one period, declining in another, and then start growing again (Birch, 1987).
Employment is not the only way how high-growth enterprises affect the economy. This can happen in many ways but there are at least three ways identified in the economic literature: through productivity growth, innovation or employment change (Acs et al., 2008).
It is common that high-growth enterprises have above average productivity levels in comparison with the industry that they operate in. This higher level of productivity actually leads to the growth of the enterprise itself. However, if an enterprise does not achieve sustainable growth it cannot be profitable in the long term and have rather negative effects to the economy (Department for Business Enterprise and Regulatory Reforms of UK Government, 2008). High-growth enterprises also have tendency to innovate and move towards innovation, which consequently increases productivity in the economy as a whole. Studies use different datasets and definitions of high-growth which results in different levels of importance of high-growth enterprises to employment creation. Though, it is an overall finding that high-growth enterprises are responsible for the majority of employment growth.
Importance of defining and implementing the appropriate polices that would foster further operations of high-growth enterprises, is recognized by governments which is the case in Europe and European Union. A number of highly respected and honorable European experts concluded that there is a high-priority need for European-wide dedicated framework that addresses the high-growth, or gazelle phenomenon (Autio et al., 2008). Therefore, the key policy priority for Bosnia and Herzegovina, as a potential EU member, should also be creation and implementation of policies and incentives aimed at a small number of high-growth enterprises, which could considerably contribute to job creation and economic growth and development.
In order to deal with the specific needs of high-growth enterprises in the best way, according policies should be horizontal. High-growth enterprises do not appear exclusively in any specific industry, size or geographic area. Therefore, horizontal policy programs might be best solution to address the phenomenon. A direct consequence of the horizontal nature of high-growth enterprises policy is that they involve much coordination across policy departments. It could also be useful to consider policy coordination needs alongside enterprise life cycle stages. At the pre-start-up stage, relevant policies to foster high-growth enterprises would be mainly concerned with the regulation of entry. At the start-up, policies designed to foster high-growth enterprises would primarily focus on facilitating the mobilization of resources to pursue entrepreneurial opportunities. And in more mature stages, policies should focus on removing barriers to growth. The disproportionate economic impact of high-growth enterprises suggests the need of selectiveness in the support measures. Support measures should therefore demand explicit, credible evidence of growth motivation as a selection criterion. High-growth enterprises policies should not be seen as a subset of small and medium enterprise policies, but they should be

REDETE – ECONOMIC DEVELOPMENT AND ENTEREPRENEURSHIP IN TRANSITION ECONOMIES
340
addressed by a special policy framework. The nature of high-growth enterprises makes them a very demanding object of policy support (Autio et al, 2008).
Global Entrepreneurship Monitor (GEM) analysis of high-growth entrepreneurship
Global Entrepreneurship Monitor (GEM) report measures the job (growth) expectation, innovation, and internationalization profiles of entrepreneurs. GEM methodology uses Adult Population Survey to identify entrepreneurs among general population, and gather data on their attitudes, activities and aspirations about entrepreneurship. In order to determine job (growth) aspirations participants are asked about the number of jobs provided at the moment of the survey as well as their expected number of jobs five years ahead. On the basis of the expected number of jobs, five years ahead entrepreneurs are classified as follows:
- Solo early-stage entrepreneurial activity (SEA): expects no jobs (i.e. outside the entre-preneur);
- Low job expectation early- stage entrepreneurial activity (LEA): expects between 1-4 jobs;
- Medium job expectation early-stage entrepreneurial activity (MEA): expects between 5-19 jobs;
- High job expectation early-stage entrepreneurial activity (HEA): expects 20 jobs or more.
According to the latest GEM B&H report from 2011, the most entrepreneurs (29,9) in Bosnia and Herzegovina expect to experience medium growth of more than 5 new jobs in five years ahead, which is significant increase from only 14,3 of entrepreneurs in 2010. On the other hand, only 0,2 of surveyed entrepreneurs expect high growth of 19 or more jobs in five years ahead, which is 5 times more than only 0,04 entrepreneurs in 2010 (Umihanić et al., 2012). In general, only few entrepreneurs in Bosnia and Herzegovina expect high growth of jobs in five years ahead, but their number increases over the years.
Additionally, a series of analyses have been recently conducted on the basis of GEM data about attitudes, activities and aspirations concerning entrepreneurship, gathered from over 800.000 randomly selected adults in more than 60 countries over the five years period, in order to get better understanding of high-growth entrepreneurship. The respondents were classified into three groups: (1) entrepreneurs, (2) nascent entrepreneurs and (3) general population. More than 70.000 identified “entrepreneurs” were then classified in three sub-groups of “entrepreneurs” by estimated rates of growth, the age of their enterprises and the number of people employed: (1) high-growth entrepreneurs (2) moderate-growth entrepreneurs and (3) low-growth entrepreneurs. High-growth entrepreneurs were defined as “entrepreneurs” who own enterprises that have experienced estimated revenue growth of 20% or more per year. The analyses seek to determine main attributes of low-, medium- and high-growth entrepreneurs and to compare them with each other, as well as to compare high-growth entrepreneurs with each other and with nascent entrepreneurs and general population. Major finding of the analyses was that “entrepreneurs” with high estimated growth rates create significantly more jobs than other “entrepreneurs”. High-growth entrepreneurs represent only 4% of the total entrepreneurs who responded to the GEM surveys, yet the businesses they have founded or co-own created close to 40% of the total jobs generated by all entrepreneurs who responded to the survey (Morris, 2011).

REDETE – ECONOMIC DEVELOPMENT AND ENTEREPRENEURSHIP IN TRANSITION ECONOMIES
341
Methodology for identification of high-growth enterprises in Bosnia and Herzegovina
Bosnia and Herzegovina lacks representative, large-scale, longitudinal micro-level datasets which can be used as base for empirical researches and for creation of appropriate policies by the governments. Although, GEM project provided important insight into state of high-growth entrepreneurship in Bosnia and Herzegovina, there is still a need for specially developed methodology for identification of high-growth enterprises within a country.
Implementation of such methodology allows better understanding of these enterprises and helps policy makers develop appropriate approaches and policies to support the emergence and development of high-growth enterprises in Bosnia and Herzegovina in the best possible manner.
This kind of identification methodology was recently developed and used in Bosnia and Herzegovina for the first time, as a part of selection process for BH Business Award “Gazelle” 2011. Main purpose of the methodology was to identify high-growth enterprises – “gazelles” on territory of Federation of Bosnia and Herzegovina in order to award the best high-growth micro, small and medium enterprise from each canton. Methodology was developed by members of methodology team, consisted of number of renowned experts in the field of entrepreneurship and development in Bosnia and Herzegovina, on the basis of EU good practices and good practices from countries from the region related to this field, with respect to specific circumstances concerning economy in Bosnia and Herzegovina. These specifics can be seen when comparing this methodology to methodologies used in Croatia and in European Union. For instance, methodologies used in European Union and Croatia apply criteria of 20% annual growth in comparison with Bosnia and Herzegovina which applies criteria of 10% growth.
The dataset used for identification of high-growth enterprises is based on annual financial statements of businesses gathered at Agency for Financial, Information and Mediation Services of Federation of Bosnia and Herzegovina (AFIP).
Therefore, the first criteria that high-growth enterprises needed to meet is to be legally registered in the Federation of Bosnia and Herzegovina and in AFIP, and that all required data (number of employees, total income, total assets) are available for the observation period.
According to methodology it is important to ensure that enterprises are market oriented, not state-owned or financial institutions, for that reason all legal entities which have the following core business are excluded: financial intermediation; public administration and defense; oblige-tory social security; other community, social and personal services; health and social work; buying and selling real estate for own account; rental of real estate for own account and real estate agencies.
Also, according to definitions of high-growth enterprises and gazelle, enterprises must be at least five years old, and have a 10% growth for three consecutive years in the period of last five years. Omitted are the enterprises that operated with a loss in any of the last three years.
In order to classify enterprises by their size, the methodology uses adapted EU definitions presented in Table 1.
Table 8. Classification of enterprises by its size168
Enterprise size Number of employees
Total income (BAM)
or Total assets
(BAM) Medium enterprises 50 – 249 20.000.000 - 94.999.999 20.000.000 – 85.999.999
Small enterprises 10 - 49 4.000.000 - 19.999.999 4.000.000 – 19.999.999 Micro enterprises 0 - 9 0 - 3.999.999 0 - 3.999.999
168 BH Business Award “Gazelle” - www.gazela.ba (accessed on 06.09.2012.)

REDETE – ECONOMIC DEVELOPMENT AND ENTEREPRENEURSHIP IN TRANSITION ECONOMIES
342
Process of filtering micro, small and medium enterprises from AFIP dataset starts with filtering enterprises by the number of employees. If an enterprise does not belong to any of three size groups in the first stage of filtration, it proceeds to the second filter. This filter will test whether it is possible to filter an enterprise in terms of total income or total assets. If an enterprise does not meet any of the above range for ranking, it is not taken into further consideration.
In the next stage, enterprises are excluded if they had a rate of growth in total revenues lower than 10% in the past three years and David Birch Employment Growth Index (DaBEG) lower than zero (i.e., negative index). In the following stage, enterprises are excluded if they had a rate of growth lower than 10% in the past three years, or if they do not meet the criteria of range of 1-250 employees.
The remaining enterprises are identified as high-growth enterprises in Federation of Bosnia and Herzegovina.
Previously mentioned David Birch Employment Growth Index is an economic indicator of employment presented by David Birch in 1987. The index multiplies absolute enterprise job gro-wth by relative enterprise job growth, which reveals the employment-creation power of differently sized enterprises. The index used in the methodology is adapted for observation period of three years and is calculated by the following formula, where z stands for the absolute number of employees in a given year (t).
DaBEG = 3-t
t3tt
z
zzz
Considering the simplicity of application of previously presented methodology for identify-
cation of high-growth enterprises and importance of such methodology in creation of high-growth enterprises policy, authors of the paper suggest the application of the same methodology on the whole territory of Bosnia and Herzegovina. In that case, a simple enterprise dataset consisting of data on: number of employees, total revenue and total assets, should be gathered from registries in Republic of Srpska and Brčko District, also. Next stage in identification of high-growth enterprises in Bosnia and Herzegovina would be application of the developed methodology on the dataset. Application of the methodology and further analyses would continuously provide relevant quantitative and qualitative information about high-growth enterprises in Bosnia and Herzegovina and their specific needs in the best possible manner.
The methodology is a vibrant category and it can be subject of minor changes and improve-ments in accordance with the growth of experience and development of this field in the following years, and the methodology team has already foreseen such possibilities.
Recommendations for policy actions aimed at further development of high-growth enterprises in Bosnia and Herzegovina
High-growth enterprises are important even in developed countries and communities such as European Union, where the key policy priority for the EU, therefore, should be achieving high rates of enterprise growth rather than achieving high-rates of new enterprise entry (Autio et al, 2008). The need for additional attention to be paid at these enterprises is even larger in developing countries such as Bosnia and Herzegovina. The authors of the paper tend to give their contribution to additional development of the field of high-growth entrepreneurship in Bosnia and Herzegovina through recommendations for policy actions presented below.
Continuous quantitative and qualitative analyses of high-growth enterprises Previously presented methodology which was used to identify high-growth enterprises on
territory of Federation of Bosnia and Herzegovina, should be adapted for application on the te-

REDETE – ECONOMIC DEVELOPMENT AND ENTEREPRENEURSHIP IN TRANSITION ECONOMIES
343
rritory of Bosnia and Herzegovina as a whole. It should be modeled after Slovenian model. The best high-growth enterprise for the whole Bosnia and Herzegovina should be identified from the set of previously identified best high-growth enterprises for each of lower administrative-territorial units (Federation of Bosnia and Herzegovina, Republic of Srpska and District of Brčko). Application of that methodology would allow further qualitative analyses of high-growth enterprises in the sense of their specific features concerning typical size, number of employees and their educational structure; industries; geographical areas and markets they dominate; tech-nologies and funding they use. Better familiarity with these enterprises allows policy makers to develop appropriate approaches to maximize the chances of potential high-growth enterprises to develop.
Continuous assessment of high-growth enterprises’ needs In order to help new high-growth enterprises to emerge and the existing ones to develop, it is
important for policy makers to be continuously aware of their needs. Once high-growth enter-prises are identified, it should be fairly simple to identify the greatest obstacles in sustaining and fostering high-growth in the existing enterprises. Additionally, effort should be made to identify greatest obstacles faced by other enterprises in the economy which prevent them to become high-growth enterprises. BH business practice has so far shown that high-growth enterprises usually do not need financial help or loan, but more often administrative relief, so their needs are very specific and have to be taken into account when developing according policies.
Creation of policies to foster high-growth enterprises Bosnia and Herzegovina has underdeveloped strategies and policies aimed at small and
medium enterprises sector at all administrative levels, and such strategies and policies are almost non-existent when it comes to high-growth enterprises. Regarding disproportionate economic im-pact of high-growth entrepreneurship on country economic growth and development, it is of cru-cial importance for governments in Bosnia and Herzegovina to foster high-growth enterprises and therefore create policies which would be based on continuous qualitative and quantitative analyses and assessment of high-growth enterprises needs, previously recommended. Such policies would remove existing barriers for enterprise growth and intensify job creation, productivity levels and tendency to innovate.
Promotion of high-growth enterprises When business environment is as complex and unfavorable, as it is in Bosnia and Herzegovina,
the most of population has a great fear of failure and avoids entering at entrepreneurial activities, unless no other option for employment is available. Promotion of high-growth enterprises would promote entrepreneurship as desirable career choice, encourage general population to start their own business, and additionally persuade existing entrepreneurs that high growth is possible in their business environment. BH Business Award “Gazelle” is an excellent promotion method of best high-growth enterprises. This prize was first awarded in the beginning of 2012 for a total of thirty micro, small and medium enterprises from the territory of Federation of Bosnia and Herzegovina, three from each canton, of which one from each size category. Awarded enterprises proved high growth, significant employment and social responsibility in observation period. Good practice should be continued and taken to a higher level through selection and promotion of best high-growth enterprises from the territory of whole Bosnia and Herzegovina.
Conclusion
Bosnia and Herzegovina is facing a number of problems such as high unemployment rates, slow economic progress and development, as well as multi-level political and administrative stru-ctures which additionally complicate the existing unfavorable business environment. Mentioned
REDETE – ECONOMIC DEVELOPMENT AND ENTEREPRENEURSHIP IN TRANSITION ECONOMIES
344
issues, and additional ones contribute to poor state of high-growth entrepreneurship in Bosnia and Herzegovina, characterized by the lack of adequate data, analyses and the support to its deve-lopment.
It would be of great importance to support high-growth enterprises in Bosnia and Herzegovina, because of their disproportionate large share of all new jobs, tendency to innovate and higher levels of productivity in comparison with other enterprises and industry in general, all of which significantly contribute to economic development of the country. Thus, policies aimed at support, promotion and development of these exceptional and rare enterprises should be one of the priorities for policy makers in Bosnia and Herzegovina.
Basic steps towards creation of such policies have been made with development of methodlogy for identification of high-growth enterprises on territory of Federation of Bosnia and Herzegovina. Further methodology adaption for its application on the territory of whole Bosnia and Herzegovina would be an excellent base for relevant and continuous quantitative and qualitative analyses of high-growth enterprises in Bosnia and Herzegovina, as well as constant assessment of their specific needs.
Proposed regular data collection would enable valuable researches whose results would additionally emphasize the importance of high-growth enterprises and help improve the current state and perspectives of high-growth enterprises in Bosnia and Herzegovina through creation of policies which would foster the high-growth enterprises in the best possible manner based on existing needs and obstacles faced by these enterprises.
References
1. Acs, Z., Parsons, W. and Tracy, S. (2008). High-Impact Firms: Gazelles Revisited. Small Bu-siness Research Summary No.328
2. Autio, E., Hölzl, W. (2008). Addressing Challenges for High-Growth Companies Summary and Conclusions of the Europe INNOVA Gazelles Innovation Panel. Office for Official Publications of the European Communities. Luxembourg
3. Birch, D. (1987). The Job Generation Process. Free Press. New York 4. Department for Business Enterprise and Regulatory Reforms (2008). High growth firms in the
UK: Lessons from an analysis of comparative UK performance. Paper No. 3. 5. Mason, C. and Brown, R. (2010). High Growth Firms in Scotland. Scottish Enterprise 6. Mitusch, K. and Schimke, A. (2011). Gazelles High-Growth Companies. Europe INNOVA –
Sectoral Innovation Watch 7. Morris, R. (2011). 2011 High-Impact Entrepreneurship Global Report. Centre for High-Im-
pact Entrepreneurship at Endeavor 8. OECD (2011). Entrepreneurship at a Glance 2011. OECD Publishing 9. Pšeničny, V. (2009). A Longitudinal Comparison of the Growth Factors of Slovenian Fast
Growing Enterprises, Economic And Business Review, 11 (3), pp. 265–283 10. Schreyer, P. (2000). High-Growth Firms and Employment. OECD Science, Technology and
Industry Working Papers. OECD Publishing 11. Stangler, D. (2010). Kauffman Foundation Research Series: Firm Formation and Economic
Growth High-Growth Firms and the Future of the American Economy. Ewing Marion Kauff-man Foundation
12. Suddle, K. and Hessels, S.J.A. (2007). High-Growth Support Initiatives. SCientific AnaLysis of Entrepreneurship and SMEs (SCALES)
13. Teruel, M., de Wit, G. (2011). Determinants of high-growth firms: Why have some countries more high-growth firms than others. EIM
14. Umihanić, B., Tulumović, R.,Omerović, M., and Simić; S. (2012). GEM BiH 2011: Razviti i ojačati poduzetnički duh u BiH, Centar za razvoj poduzetništva Tuzla

REDETE – ECONOMIC DEVELOPMENT AND ENTEREPRENEURSHIP IN TRANSITION ECONOMIES
345
Online sources:
1. BH Business Award “Gazelle” - www.gazela.ba (accessed on 18.09.2012.) 2. EU gazelle - http://www.europes500.eu/criteria.html (accessed on 18.09.2012.) 3. Project Gazelle Croatia - http://www.business.hr/gazele/kriteriji-za-odabir-i-rangiranje-tvrtki-
gazela-2011 (accessed on 18.09.2012.) 4. Project Gazelle Slovenia – http://gazela.dnevnik.si/sl/O+projektu/Metodologija (accessed on
18.09.2012.)

REDETE – ECONOMIC DEVELOPMENT AND ENTEREPRENEURSHIP IN TRANSITION ECONOMIES
346
GROWTH ASPIRATIONS OF THE EARLY-STAGE ENTREPRENEURS: EMPIRICAL INVESTIGATION
OF THE SOUTHEAST EUROPEAN COUNTRIES
Širec KARIN169 Dijana MOČNIK170
Abstract
The aim of the paper is to provide a clearer insight into the characteristics of early-stage en-trepreneurs in Southeast European countries (SeEC) (Bosnia and Herzegovina, Croatia, Gree-ce, Hungary, Macedonia, Montenegro, Romania and Slovenia) concentrating on the relations-hip between a firm's innovative orientation and international orientation and its growth aspira-tions. Innovative orientation (e.g., the newness of products/services a firm is offering or availa-bility of technologies and procedures required for the product/service) and international orient-tation (e.g., firm's customers from other countries) are referred as the most important dimen-sions of the growth aspirations and can be used for strengthening of a firm from SeEC. As ope-rational measure of entrepreneurial growth we used a firm's aspirations about the future emplo-yment. The data for our analysis are obtained from the 2010 Global Entrepreneurship Monitor Adult Population Survey (APS) in which 1 106 early-stage entrepreneurs from eight countries were identified. The results of the binary logistic regression show that for early-stage entrepre-neurial firms’ innovative orientation is negatively related to the firms' growth aspirations. This means that the adoption of new technology as well as offering new products/services weakens the growth aspirations of the early-stage entrepreneurial SeEC's firms. The predictor of inter-national orientation, too, is negatively and significantly associated with the growth aspirations. This means that internalisation of the SeEC early-stage entrepreneurial firms impedes their growth aspirations. The results also show that firms from innovation-driven countries have less negative growth aspirations compared to those from efficiency-driven countries. According to results 6 percent of the variability of the growth aspirations is explained by the firms’ innova-tive and international orientation and their country of origin. The hypothesized positive asso-ciations between the SeEC early-stage entrepreneurial firms’ growth aspirations and their inno-vative and international orientation have not been approved by our empirical analysis.
The obtained empirical results can have important entrepreneurial policy implications, na-mely that supporting measures should not be directed towards general support of entrepre-neurship, but rather focus on the firms who are motivated for growth and who have high growth aspirations, because firms that want to grow have many specific needs that must be addressed with flexibility and agility.
Keywords: growth aspirations, Global Entrepreneurship Monitor, Southeast European co-untries, early-stage entrepreneurs
169University of Maribor, Faculty of Economics and Business, Razlagova 14, 2000 Maribor, Slovenia, e-mail:
[email protected]. 170 University of Maribor, Faculty of Electrical Engineering and Computer Science, Smetanova 17, 2000 Maribor, Slovenia,
e-mail: [email protected].

REDETE – ECONOMIC DEVELOPMENT AND ENTEREPRENEURSHIP IN TRANSITION ECONOMIES
347
Introduction
Firm growth is critical to economic development and the creation of wealth and employment. Indeed, small firm growth—the focal point of this paper—is neither a self-evident phenomenon nor a matter of chance. Rather, it is the result of an owner’s/entrepreneur’s clear, positively moti-vated business intentions and actions, driven by the belief that (s)he can produce the desired outcomes (Maki and Pukkinen, 2000). Consequently, exploring issues and challenges facing ambitious entrepreneurs, may offer valuable insights into promoting firm growth.
The current paper stemmed from the desire to explore the perceived difference in growth aspirations among early-stage entrepreneurs in Southeast European countries (SeEC) as well as the perception that not all elements of innovation and internationalisation activities in a company positively affect them. The research concentrates on the relationship among various dimensions of entrepreneurship (e.g., company attributes like product/services novelty, availability of tech-nologies and procedures required for the product/service, firm's customers from other countries) and one possible operational measure of entrepreneurial performance - growth aspirations about the future employment. Data for our research were derived from the Global Entrepreneurship Monitor (GEM) research. In 2010 SeEC that participated in the GEM were Bosnia and Herzego-vina, Croatia, Greece, Hungary, Macedonia, Montenegro, Romania and Slovenia. GEM focuses on the individual and the entire spectrum of factors influencing relationships between entrepre-neurs, entrepreneurship and society and their development. Enterprises are created by individuals while the individual’s preference towards entrepreneurship is shaped by a number of factors of a country’s institutional framework, such as the attitude of a society towards entrepreneurship, cultural values, etc. These factors differ according to the level of the individual country’s eco-nomic development. That is why Porter’s (Porter et al., 2002) typology of factor-driven economies, efficiency-driven economies and innovation-driven economies was incorporated into GEM research for the first time in 2008. The role of entrepreneurship differs in each of these types of economies, which, consequently, requires a different response from the bodies in charge of economic policy and the promotion of entrepreneurship (Rebernik et al., 2010). The basic characteristics of the countries in these three groups are (Kelley et al., 2011):
- Factor-driven economies: from subsistence agriculture to extraction of natural resources, creating regional scale – intensive agglomerations.
- Efficiency-driven economies: Increased industrialisation and economies of scale. Large firms dominate but supply chain niches open up for small and medium enterprises. Bosnia and Herzegovina, Croatia, Hungary, Macedonia, Romania and Montenegro are in this group.
- Innovation-driven economies: R&D, knowledge intensity, expanding service sector, greater potential for innovative and entrepreneurial activity. Slovenia and Greece are in this group.
Although not all expectations materialize, growth aspirations have proven to be a good pre-
dictor of eventual growth (Davidsson and Wiklund, 1999; Liao and Welsch, 2003). At least part of the explanation for this phenomenon may be found in the characteristics of entrepreneurs’ firms, especially with regard to the extent of their innovative and international orientation. This paper proceeds as follows. After presenting theoretical background a framework is established for the study based on the review of prior research in the area. The section that follows outlines the research method. Finally, the findings of the research are presented, followed by the discussion and some policy implications arising from this investigation.

REDETE – ECONOMIC DEVELOPMENT AND ENTEREPRENEURSHIP IN TRANSITION ECONOMIES
348
THEORETICAL FOUNDATIONS AND PROPOSED HYPOTHESES
Theoretical background
Previous research has demonstrated that growth intentions and likely eventual growth impact are not evenly distributed across entrepreneurial firms’ populations. The GEM research on high-expectation entrepreneurship indicated that high growth entrepreneurs represent only 4 percent of the total entrepreneurs, yet the business they have founded or co-own created close to 40 percent of the total jobs generated by all entrepreneurs (Morris, 2011). In the United Kingdom, Storey (1994) found that a mere 4 percent of new firms established in any given year accounted for 50 percent of all the jobs created by the surviving firms within the cohort after 10 years had elapsed. Thus, it appears that the capability of an economy to grow and employ is significantly dependent on the capability of that economy to create gazelles (i.e., fastest growing firms). Autio (2005) reported that in the United States gazelles represented only about 3 percent of the firm population, but accounted for more than 70 percent of employment growth between 1992 and 1996.
Entrepreneurship is a complex phenomenon involving the individual, the firm, and the envi-ronment in which it occurs (Begley, 1995, in Solymossy, 1998). Although this is easy to recogni-ze, the nature of the relationship among these three elements is not understood (Solymossy, 1998, p. 5). A review of basic definitions emerging from the development of entrepreneurship and innovation theory demonstrates that it is much easier to find common points than to define limits between any two of them; indeed, innovation and entrepreneurship are often regarded as a single phenomenon. The origin of this view lies in the work of Schumpeter (1934), who defined an entrepreneur as an individual who carries out new combinations—namely, innovations. The func-tion of an entrepreneur is to innovate; as such, the Schumpeterian view is that the entrepreneur is not a risk bearer. A risk bearer is a capitalist who lends his funds to an entrepreneur. In the past, many definitions of entrepreneurship have been formulated in the economic literature on entre-preneurship, but taking them together, Davidsson (2003) distinguished two main social realities. The first is represented by the view of an entrepreneur as a self-employed person, in which certain elements of innovation are needed at start up and some degree of innovativeness is needed to survive over time; in other words, innovations are not central to this phenomenon. In the second view, entrepreneurship refers to the creation of new economic activities and organizations as well as the transformation of existing ones, making innovations central to this phenomenon.
Yet Schumpeter had no doubts: The one who innovates (i.e., introduces new combinations) is an entrepreneur. Schumpeter assigned to the entrepreneur the role of innovator and drew a demarcation line between invention and innovation. His definitions of entrepreneur and enterprise are clear: “The carrying out of new combinations we call ‘enterprise’; the individuals whose function it is to carry them out we call ‘entrepreneurs’” (Schumpeter, 1934, p. 74). The definition of enterprise as a carrying out of new combinations stresses the importance of a very specific human property: the ability to think, be creative, and innovate. For an enterprise to exist, an entrepreneur is needed. For an enterprise to grow, prosper, and develop, an entrepreneur must constantly carry out new combinations of resources at his/her disposal. He/she must innovate (Rebernik, 2002).
Shane (2004) identified five necessary conditions for entrepreneurship: (1) entrepreneurial opportunities, (2) difference between people in their ability and willingness to act upon an opportunity, (3) risk bearing, (4) organizing/exploiting opportunity, and (5) innovation. In other words, entrepreneurial activity depends upon the interaction between the characteristics of opportunity and the characteristics of the people who exploit them. Although the literature that explains different aspects of an individual’s occupational choice and circumstances that lead to entrepreneurship is extensive (Evans and Jovanovic, 1989; Gupta et al., 2009; etc.), much less is

REDETE – ECONOMIC DEVELOPMENT AND ENTEREPRENEURSHIP IN TRANSITION ECONOMIES
349
known about the choice of an entrepreneur to aspire for growth, albeit much is known about the characteristics of growth-oriented entrepreneurs. They tend to be relatively young, male, highly educated and rather wealthy in terms of household income (Autio and Acs, 2010; Bosma, 2009; Terjesen and Szerb, 2008).
Small firm growth is neither a self-evident phenomenon nor a matter of chance. According to the literature, various factors affect firm growth. In line with the Penrosean theory of growth (Penrose, 1959) it is widely agreed that growth occurs when—in addition to motivation and opportunity—proper strategy and corresponding resources are also in place (Gilbert et al., 2006). Cassar (2007) showed that an entrepreneur’s growth aspirations are influenced by opportunity costs related to the use of human and financial capital. Some recent studies (Autio and Acs, 2009) have also suggested that the deployment of human and financial capital is influenced by national conditions that regulate the appropriateness of expected returns from capital deployment.
Research propositions
From the policy implications’ point of view it is very important that supporting measures are not directed towards general support of entrepreneurship, but rather be focused particularly on those entrepreneurs who are motivated for growth and who have high growth aspirations. At least part of the answer to the question of growth may be found in the characteristics of entrepreneurs’ firms, especially regarding the extent of their innovative and international orientation.
The growth aspirations of early-stage entrepreneurs are their goals; as they are self-estimated, they are not necessarily objectively possible. As such, it is very likely that entrepreneurs in the early stages of entrepreneurship are subjectively projecting higher potential growth than those who have been entrepreneurs for a longer period. Research results indicate that some early-stage entrepreneurs estimate that their businesses have high growth potential for the wrong reasons (e.g., incompetence, over-optimism) whereas others are more modest. It is also more likely that the first group will sooner abandon their start-up business than the latter (Davidsson, 2006).
Innovative orientation impacts structural renewal in the long term. Innovation is viewed from the perspective of the market and industry, in line with Schumpeter’s view of innovative entrepreneurship as new product-market combinations destructing older, obsolete products and services and pushing the production frontiers forwards (Schumpeter, 1934). Entrepreneurs can estimate future growth more realistically if the characteristics of their products/services, competition, etc., are taken into account. Terjesen and Szerb (2008) find that, aspiration for growth go together with aspirations in terms of innovation, exports, outside investment and the estimated size of the start-up capital required for starting the firm. In our research, the potential of entrepreneurs’ ventures to grow was based on their perception to what extent entrepreneur’ product/service is new to some or all customers, were few or no business offering the same product/service and have the technologies or procedures required for this product/service been available before. We tested whether early-stage entrepreneurs form their growth aspirations about future employment on the characteristics of their businesses that enable business growth. In other words, by increasing the competitive offering of new products and services and by using innovative and new technologies and/or procedures, entrepreneurs contribute towards greater market efficiency. In addition, many entrepreneurs are important agents of innovation (Bosma and Harding, 2007), and the growth potential of their businesses is expected to be higher on average. The following hypothesis (H1) was formed:
H1: Innovative orientation of the early-stage entrepreneurial firm is positively related to a
firm's growth aspirations. In an ever more globalizing economy, economies’ global trade becomes increasingly
important. Not only multinational enterprises have international orientations; new and smaller

REDETE – ECONOMIC DEVELOPMENT AND ENTEREPRENEURSHIP IN TRANSITION ECONOMIES
350
firms are, using the latest technologies, increasingly well equipped to broaden the scope of their business. Entrepreneurs seek international markets for a variety of reasons. They may have products or services that are more suitable for international markets. Their internal markets may be too small or immature. They may face intense local competition that motivates them to pursue customers outside their borders. Alternatively, internationalization may be motivated by a desire to more broadly leverage substantial investments in their businesses. Geographic factors, like country size or location, as well as connections with strategic partners in new locales, can also affect their cross-border activities (Kelley et al., 2011). Verheul and Van Mil (2011) find that international orientation is significantly correlated with growth ambition. A specific GEM measure assesses the extent to which entrepreneurs sell to customers outside their economies. Internationalization is – on average – lowest in the factor-driven economies, increasing with economic development level (Bosma et al., 2012). It represents an aspect of globalisation that measures trade flows, foreign direct investment and portfolio investments, impact barriers and capital restrictions. Sometimes this element is referred to as the most important dimension of growth aspirations (Tominc and Rebernik, 2011). The following hypothesis (H2) was formed:
H2: International orientation of the early-stage entrepreneurial firm is positively related to a
firm's growth aspirations
DATA, VARIABLES AND MODEL
Data
Data for our research were derived from the GEM research. Full explanation of the content and procedures of the GEM study is to be found in Reynolds et al. (2005). GEM is a large-scale entrepreneurship research program launched with ten countries in 1997. By 2011, the coverage was extended to 59 countries from all over the world, and over the years more than 80 countries have participated. In 2010, GEM conducted a survey of 54 countries, gathering data from adult-population data surveys with a minimum of 2000 respondents. In all surveyed countries 166 468 adults have been interviewed. Table 1 is showing the total number of interviewed adults in selected countries between 18 and 65 years of age. Interviews were conducted using the Computer Assisted Telephone Interviewing (CATI) method. Analysis herein is based on the sample of 1 106 cases from the eight SeEC represented in Table 1.
Table 1: Sample description
Southeast European Countries Early-stage
entrepreneurs Percent
Adult population survey sample size
Bosnia and Herzegovina 125 11.3 2 000 Croatia 109 9.9 1 614 Greece 99 9.0 1 996 Hungary 154 13.9 2 000 Macedonia 295 26.7 2 002 Montenegro 138 12.5 2 000 Romania 61 5.5 1 669 Slovenia 125 11.3 3 012 Total 1 106 100.0 16 293
Source: Adult population survey (APN), GEM 2010.

REDETE – ECONOMIC DEVELOPMENT AND ENTEREPRENEURSHIP IN TRANSITION ECONOMIES
351
Variables
This section describes measurements for all investigated categories, which have been drawn from GEM research. We are presenting criterion variable – growth aspirations and two predictors – innovative and international orientation. Additional dummy variable is described.
Criterion variable
Growth aspirations of early-stage entrepreneurs were assessed by considering their antici-pation of an increase in the number of new jobs. All identified early-stage entrepreneurs were asked the following two questions:
- Right now, how many people—not counting the owners but including exclusive subcontractors—are working for this business?
- How many people—not counting the owners but including all exclusive subcontractors— will be working for this business when it is five years old?
The difference between the two numbers represents the entrepreneur’s anticipation of an
increase in the number of new jobs. The criterion variable has been made. We have coded 1 (Yes) all the respondents who have been identified as those increasing the number of employees for more than 5 in next five years. A code 0 (No) was given to all the others (this is the reference regression).
Predictors
The model has two predictors: innovative and international orientation. Both have two parameters: 0 and 1. The first, Innovative orientation was assessed by determining the early-stage entrepreneur’s opinion on issues asked with the following questions:
- Will all, some, or none of your potential customers consider this product or service to be new and unfamiliar?
- Right now, are there many, few, or no other businesses offering the same products or services to your potential customers?
- Have the technologies or procedures required for this product/service been available for less than a year, or between one to five years, or longer than five years?
All early-stage entrepreneurs exhibiting any kind of inclination to innovative behavior through
questions addressed have been coded 1 (Yes), whereas all the others have been coded 0 (No) (this is the reference indicator).
The second predictor, International orientation was assessed by asking the early-stage entrepreneurs the following question:
- What proportions of your customers normally live outside your country? Is it more than 90%, more than 75%, more than 50%, more than 25%, more than 10%, or 10% or less.
We have coded 1 (Yes) all the respondents with at least some customers from other countries,
the code 0 (No) was given to all the others (this is the reference indicator). We also added a dummy variable for the country orientation to check whether there is any significant country's impact on the growth aspirations. The country dummy variable has two parameters: 0 and 1. If a

REDETE – ECONOMIC DEVELOPMENT AND ENTEREPRENEURSHIP IN TRANSITION ECONOMIES
352
country derives from efficiency-driven economies, the value is 0 and 1 if a country derives from innovation-driven economies. We also check whether we can improve the model by inclusion of the interaction terms between the country dummy variable and both predictors as well as among predictors themselves. However, the model was not improved.
Model
We build a binary logistic regression model, in which we assume that the criterion variable is a linear combination of the three predictors, of which one is the country dummy variable. The model for estimation reads:
Li = a+b1 Innovative orientation.i + b2 International orientation.i + d Country orientationi + ei
Where L is the criterion variable: the binary logit estimate for growth aspirations; a is the
binary logit for the regression constant; b1 is the binary logit estimate for the Innovative orientation regression coefficient; b2 is the binary logit estimate for the International orientation regression coefficient; d is the binary logit estimate for an innovation or efficiency-driven country dummy regression coefficient; i index for the number of cases (N = 1 106).
Results
As Table 2 shows the intercept a of -0.769 (Wald = 12.856, p = 0.000) stands for the binary logit estimate for the growth relative to no growth aspirations when the predictor variables in the model are evaluated at zero. Thus, the firms with growth aspirations have for 0.769 unit smaller growth aspiration compared to firms with no aspirations for growth, assuming that all the predictors are held to zero. The binary logit estimate for the Innovative orientation is negative and significant at the 0.10 significance level (b1 = -0.307, p = 0.058). Since the logit estimate compares the innovative orientation to the no innovative orientation for growth aspirations the negative value means that firms with the innovative orientation less likely have growth aspirations given all other predictor variables in the model are held constant. The last column in Table 2 represents Exp (B), which are the odds ratios (=exponentiation of the regression coefficients) for the predictors. The odds ratio of the Innovative orientation is smaller than 1, which indicates that the risk of the growth aspirations of the firms with the innovative orientation is smaller compared to non-innovative firms (or the odds of the last group have to be multiplied by 0.735).
Table 2: Results of the binary logistic regression
B
Standard Error
Wald p-Value Exp(B)
a Intercept
-0.769 0.214 12.856 0.000 0.464
b1 Innovative orientation
-0.307 0.162 3.600 0.058 0.735
b2
International orientation -0.876 0.161 29.711 0.000 0.417
d Country orientation
0.418 0.183 5.215 0.022 1.519
-2Log likelihood = 1 160.394 (estimation terminated at iteration number 4); Cox & Snell R Square = 0.042; Nagelkerke R Square = 0.060.

REDETE – ECONOMIC DEVELOPMENT AND ENTEREPRENEURSHIP IN TRANSITION ECONOMIES
353
The binary logit estimate for the International orientation comparing firms that have at least some customers from other countries to those that have not such customers is significantly negative (b2 = -0.876, p = 0.000). Thus, the binary logit for the International orientation is for 0.876 unit smaller for firms that have growth aspirations compared to those that have not growth aspirations given all other predictor variables in the model are held constant. The odds ratio of the International orientation is 0.417. This means that the risk of the growth aspirations of the firms with at least some customers from other countries is smaller compared to the risk of the growth aspirations of the firms without such customers (i.e. the odds of the last group have to be multiplied by 0.417). In other words, firms that have at least some customers from other countries less likely have growth aspirations. The binary logit estimate of a country orientation dummy coefficient is positive and significant (d = 0.418, Wald = 5.215, p = 0.022). This means that firms from innovation driven countries have for 0.418 unit smaller negative growth aspirations compared to the firms from the efficiency driven countries. For the value of the dummy variable the intercept of the firms from the innovation driven countries therefore amounts to -0.351 (-0.769 + 0.418 = -0.351). The odds ratio of the dummy variable of 1.519 shows that the risk of the growth aspirations of the firms from the innovation driven countries relative to the efficiency driven countries is greater (i.e. the odds of the last group has to be multiplied by 1.519). In other words, firms that come from Slovenia and Greece more likely have growth aspirations.
According to the results, we did not confirm our hypotheses. We did not empirically confirm that innovative orientation of the early-stage entrepreneurial firm is positively related to the firm's growth aspirations. This relationship proved to be negative, although not significant beyond the 0.05 significance level. We also were unable to confirm the second hypothesis by which we presuppose the positive association between international orientation and growth aspirations. Our results show that this relationship is significantly negative.
Discussion and policy implications
Innovativeness, internationalisation, and firm growth aspirations—the focus of our research—are complex, multidimensional issues in both scope and character. Thus, increased understanding of the described phenomenon is important for different target groups. From a theoretical perspective, such knowledge is needed for strengthening the empirical micro-level basis of theories of entrepreneurship and theories of innovation. From a societal perspective, there is good reason to seek more knowledge about the factors that promote and impede entrepreneurship and innovativeness in SMEs. From the policy implications’ point of view, it is necessary that supportive measures not be targeted at entrepreneurship in general, but be more focused, selective towards those individuals and companies motivated for growth and with high growth aspirations.
There is a growing evidence that certain types of entrepreneurs matter more than others when comes to fostering long-term economic growth. Ambitious entrepreneurs are the individuals that launch and led companies with above average impact in terms of job creation, wealth creation and the development of entrepreneurial role models (Morris, 2011). Thus the focal interest of our investigation was to seek the understanding of characteristics and attributes of the SeECs' early–stage entrepreneurs regarding their growth aspirations. The results of the binary logistic regression show that for the early-stage entrepreneurial firms’ innovative orientation is negatively related to the firms' growth aspirations. This means that the adoption of new technology as well as offering new products/services weakens the growth aspirations of the early-stage entrepreneurial SeEC's firms. The predictor of international orientation, too, is negatively and significantly associated with the growth aspirations. This means that internalisation of the SeEC early-stage entrepre-neurial firms impedes their growth aspirations. The results also show that firms from innovation-driven countries have less negative growth aspirations compared to those from the efficiency-driven countries.

REDETE – ECONOMIC DEVELOPMENT AND ENTEREPRENEURSHIP IN TRANSITION ECONOMIES
354
One possible explanation of such results lies in the overall well-known lag of SeECs behind EU innovation leaders and the deficit of innovation potential. Other explanations may be found in the company’s age. Forty-two months (defining the early-stage entrepreneurs) is a time period in which many companies have not been able to develop innovative products yet; thus, we may expect them to be developed in coming years, when the company life cycle is going to force them to change their products/services in order to be competitive and survive in global economy. We should also take into account that the SeEC economy is semi-developed, and many business opportunities still exist in the area of traditional, well-proven products and services. There is still no urge for a company to survive and grow to have new innovative products/services. Still another reason may lie in the very nature of the entrepreneurial process. Results from Slovenia for example stated, that a great majority of entrepreneurs have established their companies while still employed (Rebernik et al., 2010). Being an entrepreneur is initially more like a test of entre-preneurial abilities and earned income from entrepreneurial activity more like a bonus to a regular salary. We should also not reject the fact that, if an early-stage entrepreneur is a full-time emplo-yee, it is more convenient to be engaged in additional activity that does not occupy too much time and energy, which is the case for new innovative products/services that still have to be developed.
Another part of the explanation may be found in the so called ‘quality’ of the investigated entrepreneurs. In the SeECs people less likely start firms to increase their income – independence is more important. Fear of failure is also very prevalent. Only one in five respondents started their firm in order to take advantage of an opportunity to increase incomes (Morris, 2011). Thus we can conclude the majority of identified early-stage entrepreneurs in investigated region are sole owners, having few international customers, started their business because they felt they had no choice. According to Morris (2011), the SeECs' ambitious entrepreneurs are more likely to have started their business before reaching the age of 26, and they are 40 percent less likely to have any level of post-secondary education. When promoting the entrepreneurial aspirations, education is an important prerequisite for the most successful entrepreneurs.
This certainly isn’t just the SeEC phenomena. According to Economist (2012) the entire con-tinental Europe has a problem with creating new businesses destined for growth. First possible explanation might be in the fact that many aspiring entrepreneurs simply leave their home countries. One of the things they find abroad (for example in Silicon Valley is a freedom to fail). A second important hurdle is finance. The third big obstacle is the labour law. If young firms are to survive near-terminal mistakes, or fluctuating demand, they need to be able to reduce staff costs quickly and cheaply when necessary. That is far harder in many SeECs than elsewhere. All these limits have left the SeECs with a dearth of the sort of entrepreneurial successes which would serve to inspire others.
Therefore the governments should try to boost entrepreneurship. To achieve the necessary progress from an efficiency-driven to innovative–driven economies of most SeEC the govern-mental activities to promote technological and ambitious entrepreneurs play a vital role. They need to establish a broad based ‘enterprise policy’ that focuses on providing the correct incentives and signals to owner-managers. Growth is significantly based on the mindset of the entrepreneur. A decision to grow must be accepted first, followed by the whole array of activities to be undertaken. Policymakers should also consider that mindsets are different and that many different cultural, economic, and social factors influence their formation. The existing evidence from New Zeeland for example shows that the assistance should be focused more on growth firms than on start-ups (Greene, 2012)). The policy aim should change cultural perception, which might be done through the tax system or changes to labour market laws.
The conclusions of this paper lead us to establish a series of proposals for future studies. A possible line of research would be its extension on comparison between selected countries (for example Western and Northern European countries). In order to verify the reliability of the self-reported measures of growth aspirations included in study, the calculation of correlation between these measures and objective measures of growth (sales, employment and assets growth) would be recommendable. The development of a longitudinal study would allow us to use multiple clocks

REDETE – ECONOMIC DEVELOPMENT AND ENTEREPRENEURSHIP IN TRANSITION ECONOMIES
355
to evaluate the influence of several variables on entrepreneurs’ growth aspirations. The focus of our research was early-stage entrepreneurs. It would be interesting to make a comparison between different groups of entrepreneurs (for example established entrepreneurs, serial entrepreneurs or different age groups of entrepreneurs). Finally, we consider it to be of great importance to study in depth, from a configurational approach, the relationship between the early-stage aspirations of entrepreneurs and their companies’ long term success.
Reference list
1. Autio, E. (2005). Global Entrepreneurship Report, 2005, Report on High-Expectation Entrep-reneurship. London, U.K.: London Business School and Babson Park, MA: Babson College: GEM
2. Autio, E. and Acs, Z. (2009). Institutional influence on strategic entrepreneurial Behaviours. In: Jena Economic Research Papers in Economics. Jena: Max Planck Institute, 2009-080
3. Autio, E. and Acs, Z.J. (2010). Intellectual property protection and the formation of entrepreneurial growth aspirations. Strategic Entrepreneurship Journal, 4(3), pp. 234-251
4. Bosma, N. and Harding, R. (2007). Global Entrepreneurship Monitor, 2006 Executive Report, London, U.K.: London Business School and Babson Park, MA: Babson College
5. Bosma, N., Wennekers, S. and Amorós, J.E (2012). Global Entrepreneurship Monitor, 2011 Extended Report: Entrepreneurial employees across the globe .’ Babson Park, MA, US: Babson College, Santiago, Chile: Universidad del Desarollo, Kuala Lumpur, Malaysia: Universiti Tun Abdul Razak, London, UK: Global Entrepreneurship Research Association
6. Bosma, N. (2009). The Geography of Entrepreneurial Activity; Multilevel analyses for Dutch and European Regions, Dissertation, Utrecht University
7. Cassar, G. (2007). Money, money, money? A longitudinal investigation of entrepreneur career reason, growth preferences and achieved growth. Entrepreneurship & Regional Development, 19(1), pp. 89-107
8. Davidson, P., Delmar, F. and Wiklund, J. (2002). Entrepreneurship as Growth: Growth as Entrepreneurship. In: Hitt, M.A., Ireland, R.D., Camo, S.M., & Sexton, D.L. (Eds.), Strategic Entrepreneurship, creating a new mindset (pp. 26-44). Oxford: Blackwekk Publishers
9. Davidsson, P. (2003). The Domain of Entrepreneurship Research: Some Suggestions. In: Katz, J. A. & Shepherd, D. (Eds.), Cognitive Approaches to Entrepreneurship Research, Advances in Entrepreneurship, Firm Emergence and Growth (pp. 315-372). Oxford: Elsevier/JAI Press
10. Davidsson, P. (2006). Nascent entrepreneurs: Empirical studies and developments. Foundations and Trends in Entrepreneurship, 2(1), pp. 1-70
11. Davidsson, P. and Wiklund, J. (1999). Theoretical and Methodological Issues in the Study of Firm Growth [Online]. In: Jonkoping International Business School Working Paper Series 1999-6, Sweden. http://www.ihh.hj.se/eng/research/publications/wp/jibs_workingpaper-1999.htm (accessed 13.05.2007)
12. Delmar, F. and Wiklund, J. (2008). The effect of small business managers’ growth motivation on firm growth: A longitudinal study. Entrepreneurship Theory and Practice, 32(3), pp. 437-457
13. The Economist: European entrepreneurs: Les miserable, Jul 28th 2012, Berlin, Madrid and Paris. http://www.economist.com/node/21559618 (accessed 05.09.2012).
14. Evans, D. and Jovanovic, B. (1989). An estimated model of entrepreneurial choice under liquidity constraints. Journal of Political Economy, 97(49), pp. 808-827
15. Gilbert, B. A., McDougall, P.P. and Audretsch, D.B. (2006). New Venture Growth: A Review and Extension Global. Journal of Management, 32(6), pp. 926-950
16. Gupta, V.K., Turban, D.B., Wasti, S.A. and Sikdar, A. (2009). The Role of Gender Stereotypes in Perceptions of Entrepreneurs and Intentions to Become an Entrepreneur. Entrepreneurship Theory and Practice, 33(2), pp. 397-417

REDETE – ECONOMIC DEVELOPMENT AND ENTEREPRENEURSHIP IN TRANSITION ECONOMIES
356
17. Kelley, D., Bosma, N. and Amoros, J. E. (2011). Global Entrepreneurship Monitor, 2010 Glo-bal Report, Babson College, Universidad del Desarrollo, London Business School, and GERA
18. Liao, J. and Welsch, H. (2003). Social Capital and Entrepreneurial Growth Aspiration: a Com-parison of Technology- and Non-technology-based Nascent Entrepreneurs. Journal of High Technology Management Research, 14, pp. 149-170
19. Maki, K. and Pukkinen, T. (2000). Barriers to Growth and Employment in Finnish Small Enterprises. In: ICSB World Conference 2000. June 2000, Brisbane, Australia
20. Morris, R. (2011). 2011 High-Impact Entrepreneurship Global Report (2011). Ernst & Young, Center for High-Impact Entrepreneurship at Endeavor. http://www.gemconsortium.-org/docs/download/295 (accessed 05.09.2012).
21. Penrose, E.T. (1959). The Theory of the Growth of the Firm. New York: John Wiley 22. Porter, M. J., Sachs, J. and Mc Arthur, J. (2002). Executive Summary: Competitiveness and
Stages of Economic Development, In: Porter, M. J., Sachs, P. K., Cornelius, J. W., Mc Arthur, J., Schwab, K. (Eds.), The Global Competitiveness Report 2001-2002, New York: Oxford University Press, 2002, pp. 16-25
23. Rebernik, M. (2002). Business economics and entrepreneurship at the crossroads. Ekonomický časopis, 50(3), pp. 471-488
24. Rebernik, M., Tominc P. and Pušnik K. (2010). Podjetništvo v letu krize (Entrepreneurship in the Year of Crisis). Maribor: EPF, University of Maribor
25. Reynolds, P., Bosma, N., Autio, E., Hunt, S., De Bono, N., Servais, I., Lopez-Garcia, P. and Chin, N. (2005). Global Entrepreneurship Monitor: Data Collection Design and Implemen-tation 1998-2003. Small Business Economics, 24(3), pp. 205-231
26. Schumpeter, J. A. (1934). The Theory of Economic Development. Cambridge, MA: Harvard University Press
27. Shane, S. (2004). A General Theory of Entrepreneurship. The Individual-Opportunity Nexus. Cheltenham: Edward Elgar
28. Solymossy, E. (1998). Entrepreneurial Dimensions: The Relationship of Individual, Venture, and Environmental Factors to Success [dissertation]. Cleveland, Ohio: Department of Marketing and Policy, Weatherhead School of Management, Case Western Reserve University
29. Storey, D. (1994). Understanding the Small Business Sector. London, New York: Routledge 30. Terjesen, S. and Szerb, L. (2008). Dice thrown from the beginning? an empirical investigation
of determinants of firm level growth expectations Estudios De Economia, 35(2), pp. 153-178 31. Tominc, P. and Rebernik, M. (2011). Entrepreneurship and development in Southeast Europe:
Global Entrepreneurship Monitor evidence. In: Proceedings of the International scientific conference, Faculty of Economics Tuzla, 8 and 9 December 2011. Tuzla: Univerzitet, Ekonomski fakultet
32. Verheul, I. and Van Mil, L. (2011). What determines the growth ambition of Dutch early-stage entrepreneurs? International Journal of Entrepreneurial Venturing, 3(2), pp. 183-207
33. Greene, F. (2012). Should the focus of publicly provided small business assistance be on start-ups or growth businesses? Ministry of Economic Development Occasional Paper 12/02, pp. 1-52.

REDETE – ECONOMIC DEVELOPMENT AND ENTEREPRENEURSHIP IN TRANSITION ECONOMIES
357
Bibliography
Karin Širec, Ph.D. Karin Širec, Ph.D., is an Assistant Professor of Business Economics and Entrepreneurship at
the Faculty of Economics and Business, University of Maribor. As a member of the Institute for Entrepreneurship and Small Business Management she carries out research in the fields of entrepreneurship, business economics, female entrepreneurship and high-growth entrepreneurship.
Dijana Močnik, Ph.D. Dijana Močnik, Ph.D., is an Associate Professor at the University of Maribor’s Faculty of
Electrical Engineering and Computer Science. She teaches courses in economics, economics and management, media economics, entrepreneurship, business policy and strategic management, and service management.

REDETE – ECONOMIC DEVELOPMENT AND ENTEREPRENEURSHIP IN TRANSITION ECONOMIES
358
THE DEVELOPMENT OF CONCEPT OF CALCULATION COST MODEL FOR THE COMPANIES OF THE TRANSITIONAL
ECONOMIES
Sado PUŠKAREVIĆ171 Amra GADŽO172
Abstract
The research of the level of accounting function organization in the companies of Bosnia and Herzegovina in terms of possibilities that contemporary profitability management offers, led to the cognition that this level was unsatisfactory. The main disadvantages revealed in the sample of companies of Tuzla Canton related to the fact that the companies did not have the modern model of operating cost arrangement by customers, nor the adequate system of selling price management. The research results also showed that a small number of companies made any effort to modernize the organization of accounting function.
Considering the fact that the basic part of profitability analysis is based on the form and the content of the calculation cost model, which gives inputs to the analysis, the research is focused on the development of adequate concept of calculation cost model which serves as the foundati-on of the accounting model of profitability analysis of the management of companies in transiti-on economies. This concept would represent the theoretical framework for designing the calcu-lation cost model in the companies of transition economies. It should enable the focus of the analysis on the information relevant to this business environment.
The initial hypothesis of this paper is: „It is possible to develop the modern concept of calcu-lation cost model in the companies of transition economies, which would enable successful ma-nagement of the profitability of business activities. “To prove this hypothesis we will research the specificity of transition economy relevant to the development of the model concept, than choose the basis for the concept development, determine development stages and adjust the model to the needs of the customer portfolio management.
The methods which will be used in the development of the model concept are: analysis and synthesis, induction and deduction, observation as well as the comparison using the statistics and the results of our previous researches. The development of the concept will be based on personal experiences in solving the problems of cost management in Bosnian companies, as well as on the knowledge of the possibilities of modern practice of managerial accounting ac-quired from the scientific researches of leading world economies.
Keywords: costing, transition economy, customer profitability analysis.
171 Ekonomski fakultet u Tuzli; e-mail: [email protected] 172 Ekonomski fakultet u Tuzli; e-mail: [email protected]

REDETE – ECONOMIC DEVELOPMENT AND ENTEREPRENEURSHIP IN TRANSITION ECONOMIES
359
1. Specifics of the transition economy relevant to the development of the calculation cost model concept
What is business ambience like in the transitional countries? When we are discussing transiti-onal economies, we take into account undeveloped economies, not only in the economic sense but in the sense of social development, political ambience, that are falling behind the developed coun-tries. There are series of system weaknesses that are making this ambience inadequately regulated or unfavorable for domestic companies in the sense of legal, financial, institutional or any other timely support for survival, transformation, growth and development of companies. Usually, countries go through transformation from present to a new political system, which means that, through the battlefield of party hierarchies and privatization manipulations, the little amount of resources that are left over for companies to use is irrationally allocated.
Former socialistic companies, in this process of transition from command to market economy, are entering conditions of inter competition, and with open and free trade, they are entering into conditions with growing international competition. Having that in mind, in this period the gap that objectively exists when comparing economic subjects of domestic economies to those of deve-loped economies, should be overcome. All that should be accomplished in the shortest time po-ssible. Unfavorable economic and social structures are slowing down this process, so it is not hard to notice following types of consequences: drastic fall of the industrial production, symbolic in-vestments, loss of market participation, small shifts in taking over new markets, increase in unem-ployment, increase in poverty, etc. The government plays a role of a co-owner of larger systems that are promising profit sources for its own uses. It also plays a role of a co-owner of large sys-tems that are in a huge economic lapse, without a market and with a large number of unemployed workers. From that, the government co-finances companies of its own that are having hardships, but at the same time, through privatization, it is trying to transfer the load of real unemployed workers to new owners of the privatized companies.
This ambience within a company collects inherited inefficiency, ineffectiveness, and the bur-den of social problems that are transferred to company from the incompetent, nonfunctional, and inappropriate administrative social extension. In such ambience, it is hard consider real effects of actions taken by the management in order to conserve the company. From that, one of the fund-amental assignments of the cost calculation system is to distinguish between present (inherited) negative effects (the effects from inherited resources, technology and organization) and effects of inefficient organization of the work environment from the effect of the actual management actions. This should be a foundation for appropriate priority setting for resource investment and weakness elimination. Besides adequate cost allocation, this model should enable and alleviate the connection of the company value creation chain. Only this chain could show the real efficie-ncy and effectiveness of the company operations.
When this condition in this area is fixed, greater competition between the economic subjects would be achieved, which would be spread throughout the whole B&H economy. This is extre-mely important as research shows that fundamental challenge of the B&H economy is indeed non competition. “B&H belongs to the least competitive region of Europe, which is made up of transi-tional economies of the South-East Europe. On the other hand, in order to become a member of the EU, it is necessary that a country fulfills the “Copenhagen criteria”, meaning that it has to have a competitive economy. For B&H to reach the standards of the least competitive member country of the EU, it will need at least 8 to 10 years, because the countries at the same level of development as B&H improve their position in average of 2 to 4 places annually.“173
What are the specific attributes of the transitional economy that, besides the mentioned need to ensure the greater competition of companies and the whole economy, should be taken into
173 Komparativna analiza konkurentne pozicije BiH ekonomije sa implikacijama za oblikovanje politika, Ekonomski institut
Sarajevo, Sarajevo, avgust/kolovoz 2009., str. 9.

REDETE – ECONOMIC DEVELOPMENT AND ENTEREPRENEURSHIP IN TRANSITION ECONOMIES
360
account in the development of the concept? Considering the present business internal and external ambience for operations, it is possible to show the following:
a) Money deficiency – it affects the scope of the actions that are available to take in the seg-ment of development and implementation of the developed models, constraining the development of the model concept. On the other hand, it creates an ambiance for subordination of all activities that ensure the inflow of money to maintain the liquidity, which takes this issue out of the priority zone;
b) Available labor resources – they affect the development in two ways also. The first aspect relates to the knowledge of modern problem solutions. Namely, “old” workers are not in step with modern solutions, and the new workers have degrees but lack real practical knowledge because of the education system. The second aspect relates to lack of team work in development and implementation of the cost calculation model. Both aspects should be taken into account as a constraining factor in the concept development;
c) Unreadiness for serious changes, that is, focusing on smaller changes in the operations – even though, B&H companies are not participation on active market for a while now, due to implications of war, they have not taken any steps in the sense of benchmarking. They are mostly dealing with worker issues and the issues of ensuring the flow of production for which the external market has been already lost and domestic market provides many better and cheaper similar items. The above mentioned is requesting greater dynamics and serious changes, but com-panies are not ready. This is the reality that has to be taken into account when developing the concept;
d) Over-numerousness of labor – Labor excess (as a consequence of decrease in capacity usage, the previous policy of socialistic way of hiring where the real need for labor have not been taken into account, etc.) is in the way of real changes, because everything is seen as unpopular loss of available work spaces. In the concept development, it should be ensured that this is seen as a contribution to success instead as a model of work spaces decrease and nonselective reduction of costs;
e) Absence of cooperation between various interested groups for company operations – the concept implies that various interested groups have interest in model development that will objectively point to sources of loss and to places that need allocation of restricted resources for the good of all;
f) Influence of political (party) currents on the forming of more/less quality administrative and supervisory bodies – this factor is significant for companies that are in part government-owned. As parties change in the government administration, members of the administration and management structures of the company change as well. Everybody, when gets appointed to the management position of the company, is aware that he/she will be there until his/her party is leading in the government. From that point, they rarely have interest in the company to take actions to implement serious changes, that would show results after longer period of time and would save the company from the crisis;
g) Apathy of the most responsible, that takes them to achieve only personal interests and away from the common and general goals – in conditions where a lot of external factors affect the operations of a company, the management falls into a hopeless and apathetic state that transforms an agile, proactive manager to a apathetic one led on by own personal interests. The concept should ensure trust that with internal changes we can persuade external participants that decisions and changes in operations of the company are appropriate;
h) Rigorous and un-motivating legal sanctioning that lessens the creativity but points in the direction of avoiding responsibility and formal performance of duties – unfortunately, legal system is such that it can impute legal burdens for anything, and creates belief that you will be worse off if you are not guilty. Legal procedures are long lasting and exhausting. Laws and regulations could be interpreted in many ways and you are never sure if someone will impute legal actions against you and expose you to expensive, lasting court procedures. All of the above mentioned formalizes management actions too much, to the point that the end goal gets lost in the

REDETE – ECONOMIC DEVELOPMENT AND ENTEREPRENEURSHIP IN TRANSITION ECONOMIES
361
end. Public firms are exposed the most, where formalization is focused on so much that it becomes birocracy. On the other hand, in the operations of such companies, great value is lost that no one is taken responsibility for because the formal condition is alright.
2. Choosing Basis for Cost Calculation Model Concept In Accordance With „CP“ Analysis
In the theory and practice of developed economies, the answer to growing needs of the modern management for detailed information about costs is the concepts of the so called “modern models of cost calculation”. Models in theory gain detailed guidelines for development, and with hand-on elaboration within a company gain their real form. From that, every one of the models, with their attributes, is presented separately but at the same time it belongs to a family of models that are founded on common attributes.
One of the ideas that are actively researched on in theory and practice is cost monitoring at their activity level (in the wide or narrow context), after which their connection to effects those activities make. Those models that have those common determinants are known as “ABC” models. Every one of those models has this common basis as well as attributes of its own. This also happens in theory where various authors state various numbers of steps that should be taken in their development for certain company. These models from leading authorities of research in this field are taken as appropriate basis for “CP” analysis, that is, customer profitability analysis. 174
Considering and systematization up to date knowledge in this area, we have noticed that for our companies, this level of analysis in cost calculation would be satisfactory for objective consideration of this issue. It:
- Gives sufficient flexibility for defining units that will be used to monitor cost movement in the function that will increase cost-effectiveness and operations profitability as well;
- Gives solid foundation for consideration of the company flow of value, especially “sources that increase value” and “sources that decrease value”;
- Enables insight into necessary changes at the operative, tactic, and strategic level;
- Alleviates management action selection by priorities that are in accordance to present operation ambience.
From the reasons stated above, continuing our work on the model concept, we will choose
foundations on which “ABC” models are based.
3. Development of „Activity Based Costing“ Model Concept for Transitional Companies
Considering the needs for insuring adequate information for profitability management in transitional companies, for creation of the design of the cost allocation model based on activities, we acknowledge the importance of the following steps:
174 For example, see: Cooper, R., Kaplan, R., The Design of Cost Management Systems, Text and Cases, Second Edition,
Pretince Hall, New Jersey, 1999,

REDETE – ECONOMIC DEVELOPMENT AND ENTEREPRENEURSHIP IN TRANSITION ECONOMIES
362
1. Identification, definition, and systematization of relevant activities of a company,
2. Organization of activities through activity centers and their locating in the organizational structure,
3. Transitional classification and ranking of the activity centers,
4. Identification of cost structures for activity centers,
5. Determining drivers for cost attribution by activity centers and individual activities
6. Identification of cost carriers,
7. Selecting drivers for cost allocation of activities on end carriers, and
8. Accumulation of costs by carriers
In the following paragraphs, we will consider in detail the justification of this thesis.
3. 1 Identification, Definition, and Systematization of Relevant Activities of a Company
The number of activities is a function of model’s purpose, and an organization’s size and complexity. For our model concept, its purpose is real consideration of its achieved rentability, which will request an identification of a greater number of activities from the point of a possibility to connect their costs to requests of individual buyers in these activities. It should be taken into consideration that greater information potential of the model will request greater costs of its set up and maintainance.
The first phase in the development of a model, besides the identification and definition of relevant activities, has to be supplemented with compulsory systematization of activities which would group all the activities as in Table #1. It is primary, for this classification, to consider buyer demands and the market supply of a company. Comparison between those two will give an answer to if we have a market and what is the value that we are offering for buyers of our goods or services, and how is that value matched with its present and future demands.
Table #1 Systematization of Activities in a Transitional Economy Company
No.
Activity Added Value Effect on Competitive Position of a Company
Activity Description
Activity Type
Cost Price (i.e. Performance
Price)
YES
(on the basis of what)
NO
No
Effect
Effect
Avoidable Non-avoidable
Effect Basis
Positive Effect
Negative Effect
3.2 Organization of Activities through Activity Centers and Their Location in the Organizational Structure
Activity centre represents a group of activities for which the management requests separate cost reports. During the grouping of activities into activity centers, it is important to consider two significant criteria: activity significance (materiality) and cost profile. 175
Defining activity centers starting from activity significance and cost profile criteria, would provide an opportunity to consider matching of a present organizational structure of a company to defined activity centers. The important activity, also, is consideration of acceptance of accounting
175 About, see: Douglas T. Hicks, Activity-Based Costing for Small and Mid-Sized Businesses, John Wiley & Sons, Inc.,
USA, 1992, str. 46.

REDETE – ECONOMIC DEVELOPMENT AND ENTEREPRENEURSHIP IN TRANSITION ECONOMIES
363
logging and reporting to the present as well as needing structure that is made up of above defined activity centers.
Activity centers by definition are already responsibility centers, if we take into consideration the control aspect of realization of those activities. They are also narrower parts of responsibility centers in an organization. This means, that the efficiency of activity centers directly affects on the efficiency of responsibility centers, and this is one way to increase general efficiency, and even effectiveness. This approach significantly affects regulating relations between responsibility centers. Primarily, we think of internal prices by which the internal results are transferred. The question of internal price quality is tightly connected to the quality of the cost calculation model. Its solutions directly affect accuracy and preciseness of the internal result prices, but they also affect management of selling price policy on the external market.
It is significant to mention the fact that necessary decentralization of an organization by the responsibility centers in the light of transitional turmoil, privatization, and such, from the worker side, is seen as isolation of the profitable parts of a company that would be easy to sell. This leaves workers on a street, payless, and without possibility to take care of their families. When activity centers are introduced as familiar units of an organizational structure, and after the consideration of their efficiency and effectiveness, the burden would be lifted off and it would be easier for management to find ways to pull the company out of desperate economic and social position.
As with the previous step, a table of activity centers should be developed, as well as the algorithm of their connections in the light of organizational structure that is composed of responsibility centers (an example could be seen in Table #2).
Table #2 Preview of Activity Centers, Their Connection and Attachment to Responsibility Centers
No. Activity Centre Connection to Other Activity Centers
Attachment to Responsibility
Centre Title Includes
Activities: Receives Centre
Results Provides Centre
With Results
Development of algorithm requests greater detail in connection of centers in the frames of a company in which the concept would be implemented.
3.3. Transitional Classification and Ranking of Activity Centers
The greatest number of companies in a transitional economy needs information related to its own transformation and adaption to changes in the environment and in the new ambience that is expected from them. The existent models of cost calculation do not provide information for such purposes, in a matter of scope nor in a matter of quality. Model concept that we are developing, already with the two above mentioned steps, gives significant contribution in that direction. The first table should give a clear picture of individual activities, and the second table gives a clear picture of activities through which the company operates. Starting from that, for the sake of these needs, we believe that it is useful to develop table classification and ranking of the identified activity centers as follows:
1. Classification of activity centers starting from their attachment to responsibility centers that exist and especially to those that should be formed within a company. This would classify all activity centers into: cost, income, profit, and investment responsibility centers that exist, and then to those that are needed within an organizational structure of a company. This systematization would be used as a foundation and orientation in the advancement of the organizational structure

REDETE – ECONOMIC DEVELOPMENT AND ENTEREPRENEURSHIP IN TRANSITION ECONOMIES
364
of a company. The formed tables would be, therefore, a foundation for strategic decision making that is crucial for development of organizational structure of a company.
2. Ranking of the activity centers by the criteria of technological obsolescence in relation to competition. Acquired table again represents relevant foundation for strategic decisions. The sequence acquired through ranking defines the priorities and should adequately direct rational investment of limited resources.
3. Ranking of the activity centers by the negative effects on current performances. 4. Ranking of the activity centers by significance, i.e. priorities of taken actions in the
consolidation of position and re-engineering.
Starting from the mentioned criteria, all centers should be put in the table in a way showing in the following table (Table #3).
Table #3 Transitional Classification and Ranking of Activity Centers
No Activity Centre
Attachment to Responsibility
Centre
Technological Obsolescence
Negative Effect of a Centre on Current
Performances
Actions Needed to Be Taken
Transitional Rank
Existing
Needed
Basis for
Obsolescence
Level of
Obsolescence
Rank
Nature (Foundation)
of the Effect
Am
ount (Intensity) of the E
ffect
Rank
Nature of the A
ction
Level of U
rgency
Available R
esources
Rank
The level of technological obsolescence as seen in the table would show us how much we are lagging in relation to competition (for example, 30% means that only 30% of the competitors are using modern technological solutions). The nature of negative effects would describe a way in which a centre negatively affects performance of company operations (for example, negative effect on the basis of greater costs of performance of the activity or on the basis of quality of performed activity, and such). Actions would be described by description of the problem that needs to be solved by taking a certain action, from the point of level of urgency (high level, medium, low level, and non-urgent action), or from the point of available resources that would insure a certain action would be performed.
The individual ranks would be set on the basis on the most objective management projection and they would rank from the lowest value – zero, to the highest value – ten. The rank value would always be a whole number.
From all of the mentioned, it can be seen that the last column would show the transitional rank for an activity centre. This indicator would be calculated as an average of all three rankings, as follows:
RTZ + RNU + RPA TR = --------------------------------
3 where, TR- Transitional Rank, RTZ – Technological Obsolescence Rank, RNU – Negative Effects on Current Performances Rank RPA – Needed Action Rank.

REDETE – ECONOMIC DEVELOPMENT AND ENTEREPRENEURSHIP IN TRANSITION ECONOMIES
365
The established ranking list of the centers would be adopted by the management of a company. This would make projections demanding but more methodologically correct and more objective, approved and agreed upon between the owners and the management of the company. This list would be used as basis for transitional management of a company. Establishment of the transitional rank could be used, by the same logic, for individual activities between each one of the activity centers, if there would be a need for it.
What is the significance of the “transitional rank”? This variable was developed with the desi-re that analysis of the real needs of a company in transitional economy finally gets effectively expanded from the formalized analysis of the regulatory accounting reports. Namely, by determining the transitional rank of a company, it would finally be brought to a position that the appropriateness of its organizational structure could be assessed. It would have to systematize its activity centers and their significance would be put into a table for systematization in order for transitional ranking to be objectively defined. Therefore, for all who are interested to bring resou-rces into a company, for the purpose of its transformation according to the needs of transition in process, these transitional rank lists would show how much the projects taken on by a company are remedying its position, in which activity centers, and in which priorities of the transitional rank. This would, for example, with all transitional ranks calculated for all centers, determine the transitional rank as an average of all transitional ranks that would advance the position of a company. Of course, before this step, new ranks for all the centers would be calculated according to advancements offered by a project. Rank of such project would provide useful information to investors, creditors, donators, authorities, about how and how fast would the condition of a company change. Every activity could be forecasted in the sense of technological change, current company performances, and company’s risk management.
3.4. Identifying Cost Structure for Activity Centers
Identifying cost structure has a goal to determine cost structure by types of costs and to classify cost on direct and indirect costs. In the development of the model concept it would be necessary to do the following:
a) Labor Costs – should be systematized as shown in Table #4. From this table, it is possible
to take out information that is relevant to consideration of cause for discrepancy within those costs in relation to competition.
Table #4 Preview of Labor Costs by Activity Centers
No.
Activity Centre
Salary at the Current
Employment Level
Salary for Optimal Employment Level at:
Salary Difference
Net
Gross
Current T
echnical-T
echnological Equipm
ent
Average T
echnical-T
echnological E
mploym
ent
The B
est Technical-
Technological E
quipment
(5 - 4)
(6 - 4)
( 7 – 4 )
1 2 3 4 5 6 7 8 9 10
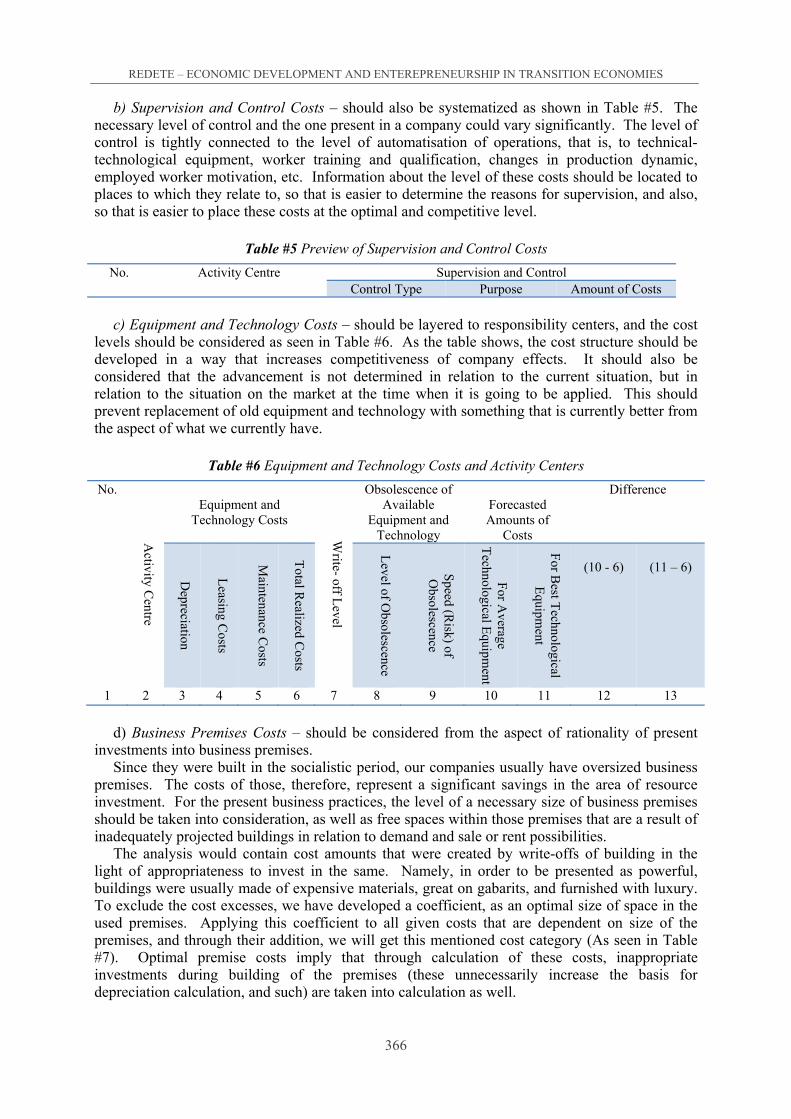
REDETE – ECONOMIC DEVELOPMENT AND ENTEREPRENEURSHIP IN TRANSITION ECONOMIES
366
b) Supervision and Control Costs – should also be systematized as shown in Table #5. The necessary level of control and the one present in a company could vary significantly. The level of control is tightly connected to the level of automatisation of operations, that is, to technical-technological equipment, worker training and qualification, changes in production dynamic, employed worker motivation, etc. Information about the level of these costs should be located to places to which they relate to, so that is easier to determine the reasons for supervision, and also, so that is easier to place these costs at the optimal and competitive level.
Table #5 Preview of Supervision and Control Costs
No. Activity Centre Supervision and Control Control Type Purpose Amount of Costs
c) Equipment and Technology Costs – should be layered to responsibility centers, and the cost
levels should be considered as seen in Table #6. As the table shows, the cost structure should be developed in a way that increases competitiveness of company effects. It should also be considered that the advancement is not determined in relation to the current situation, but in relation to the situation on the market at the time when it is going to be applied. This should prevent replacement of old equipment and technology with something that is currently better from the aspect of what we currently have.
Table #6 Equipment and Technology Costs and Activity Centers
No.
Activity C
entre
Equipment and
Technology Costs
Write- off L
evel
Obsolescence of Available
Equipment and Technology
Forecasted Amounts of
Costs
Difference
Depreciation
Leasing C
osts
Maintenance C
osts
Total R
ealized Costs
Level of O
bsolescence
Speed (R
isk) of O
bsolescence
For A
verage T
echnological Equipm
ent
For B
est Technological
Equipm
ent
(10 - 6)
(11 – 6)
1 2 3 4 5 6 7 8 9 10 11 12 13
d) Business Premises Costs – should be considered from the aspect of rationality of present
investments into business premises. Since they were built in the socialistic period, our companies usually have oversized business
premises. The costs of those, therefore, represent a significant savings in the area of resource investment. For the present business practices, the level of a necessary size of business premises should be taken into consideration, as well as free spaces within those premises that are a result of inadequately projected buildings in relation to demand and sale or rent possibilities.
The analysis would contain cost amounts that were created by write-offs of building in the light of appropriateness to invest in the same. Namely, in order to be presented as powerful, buildings were usually made of expensive materials, great on gabarits, and furnished with luxury. To exclude the cost excesses, we have developed a coefficient, as an optimal size of space in the used premises. Applying this coefficient to all given costs that are dependent on size of the premises, and through their addition, we will get this mentioned cost category (As seen in Table #7). Optimal premise costs imply that through calculation of these costs, inappropriate investments during building of the premises (these unnecessarily increase the basis for depreciation calculation, and such) are taken into calculation as well.

REDETE – ECONOMIC DEVELOPMENT AND ENTEREPRENEURSHIP IN TRANSITION ECONOMIES
367
Table #7 Preview of Business Premises Costs
No.
Activity C
entre
Size of Premise
Business Premise Costs (depreciation, property insurance, maintenance, hygiene, utilities, etc.)
Used P
remise
Optim
al Size
Coefficient (4/3)
Costs of U
sed S
pace
Cost of O
ptimally
Sized S
pace
Optim
al Costs
of Prem
ises
1 2 3 4 5 6 7 8
e) Costs of Other Departments Support (Activity Centers) – should be considered as a significant component of the effect price.
In the already given table (Table #2), we have already presented a preview of activity centers, where we predicted a column in which their interconnection would be described. Using data from this table, we can see where the effects of certain activity centers go, and in what amount. What is left is to determine cost prices of their effects and to determine secondary costs for certain activity centers using an adequate calculation methodology.
f) Other Indirectly Associated Costs of Activity Centers Support – should be previewed in a
table and their development significance and dynamics should be determined as a percentage.
3.5 Driver Determination for Allocation of Costs to Activity Centers and Individual Activities
In this step, it is necessary to determine adequate bases for allocation (cost drivers or cost indicators) of indirect costs, that is, costs that are in relation to more than one activity centre. Besides that, for cost allocation on individual activities within activity centers, it is necessary to determine the cost drivers (transactional drivers, per driver duration, and intensity drivers or by their direct load).
Determined drivers should be put into tables in which they will be allocated by activity centers and then by individual activities within those centers.
3.6. Cost Carrier Identification
What are cost carriers? It is usual for traditional approach to see effects in a form of a products or services, and those are the final cost carriers. Starting point of modern approaches are cus-tomer wishes and demands as final points to which activities of a company are subject to. Using this logic, final cost carriers are customer wishes. Therefore, a product or a service is a projection of customer wishes. Since different customers have different wishes, their projection, i.e. accep-table product or service, have different qualitative and quantitative dimensions. What are the pro-jections acceptable to a company? What are customer groups that a company should focus on? The answer to this question gives a value of realized profit by customers.
If we appoint this as a final object to a customer wish, different customer categories become final cost and income carriers, as well as carriers of realized profit. As a temporary cost carrier, product or service will be appointed in the model. To this temporary carrier, we can tie costs. When those costs are realized, in addition to new service costs in the area of distribution, pro-motion, post sale services, and such, we can transfer those to buyers – final carriers. This will enable the formation and management of a customer portfolio.

REDETE – ECONOMIC DEVELOPMENT AND ENTEREPRENEURSHIP IN TRANSITION ECONOMIES
368
Companies that have a small number of customers will tie each service cost to the appropriate individual customer. On the other hand, companies that deal with a large number of customers will be forced to form groups of like customers, and those groups will become cost carriers. Companies that service final customers through an expanded network of own distribution cha-nnels, will measure profitability by those distribution channels. Therefore, for various companies, there will be various cost carrier structures set up.
3.7. Driver Selection for Activity Cost Allocation to Final Carriers
Cost drivers for activity cost allocation to final carriers have to match the level of cost hierarchy and the level of associated activities. For example, using unit cost drivers (machine hours) for non-unit activities (machine set up for new production series) would bring to distortion in the cost calculation system, where a great number of series and complex products would be over-valued, and small number of series and simple product would be under-valued.
3.8. Cost Accumulation by Carriers
In this phase, cost would be accumulated by determined carriers, temporary carriers first, then final carriers. Cost accumulation by customers, groups of like customers, or channels of distribution, as final carriers, represents summing of all costs created from one business transaction, or in a certain time period of operating business with a customer as a cost carrier. In this phase, time dimension of operating business with a customer is emphasized. Alongside, we can use: historic cost value, present cost value of serving customers, or cost value incurred in certain time period of serving customers. Cost accumulation by customers is an important foundation for creation of price politics on the basis of activity-based pricing, planning future cash flows by customers, monitoring their flow on the customer life span curve, and valuation of a total company customer portfolio.
Conclusion
Conducted research has justified the set hypothesis, showing that the specifics of transitional economy could be adequately embraced in development of the cost calculation model concept. The following question is left to be answered: “Why develop a model that would distinguish between effects of inherited and current infectivity and inefficiency within the organizational scope of an organization?”. The answer to this question is connected to dynamics of changes that transitional process of a country involves. If we would permit extreme action of market laws without involvement of the government, and without desire to consolidate companies in time, than this question would not even make sense. By analyzing practices in transitional countries, it could be noted that dynamics of changes within a transitional process is on the slow side, so that the need to develop such model is great. It assumes that an individual company individually perceives greatest drawbacks to its own survival, growth and development, and that is takes actions on its own to allocate limited resources in order to get maximal effects.

REDETE – ECONOMIC DEVELOPMENT AND ENTEREPRENEURSHIP IN TRANSITION ECONOMIES
369
Reference list
1. Albu, C.N., Albu, N., Faff, R., (2008). The Changing Role of Accountants in Transition Eco-nomy – Evidence from Romania, http://www.oeconomica.uab.ro/lucrari/1020081/5.pdf (acce-sed 20.04.2012.)
2. Căpuşneanu, S., Cokins, G., Barbu, C-M. (2011). The importance of activity-based costing method (ABC) In Romania’s business environment changes. MPRA. http://mpra.ub.uni-muenchen.de/33152/ (accesed 05.06.2012.)
3. Cokins G., (2001). Activity-Based Management – An Executive's Guide, John Wiley&Sons, Inc.
4. Hopwood, A.G., (2007), Whither Accounting Research?, The Accounting Review, Vol. 82, No.5. pp. 1365-1374. http://www.personal.psu.edu/sjh11/ACCTG597E/Class02/Hopwood-TAR07Whither.pdf (accesed 08.08.2012.)
5. Komparativna analiza konkurentne pozicije BiH ekonomije sa implikacijama za oblikovanje politika, Ekonomski institut Sarajevo, Sarajevo, (2009).
6. Lianabel, O., (2004). Designing Strategic Cost Systems, John Wiley&Sons, Inc., Hoboken, New Jersey.
7. Tuyen, N., Barbu, E. M., (2010). Accounting as Catalyst of Economic Transition: An Overvi-ew of the Twenty-year Progression from a Communist to Capitalist Accounting System. Unité Mixte de Recherche CNRS/Université Pierre Mendés France Grenoble 2, http://cerag.org/-cahiers_recherche/2010-02-E2.pdf (accesed 05.06.2012.)

REDETE – ECONOMIC DEVELOPMENT AND ENTEREPRENEURSHIP IN TRANSITION ECONOMIES
370
REVITALIZATION STRATEGY OF COMPANIES IN CRISIS
Valentina DUVNJAK176
Abstract
In contemporary conditions of business activity, the crisis is a phenomenon the companies are often faced with. During the period of crisis, it is necessary to take appropriate actions to formulate and implement revitalization strategy of company. By researching the indicators and causes of the crisis in the companies, the solutions i.e. strategies that would enable the revitali-zation and prevent the deepening crisis and eventual liquidation of the company have been established. Indicators of efficiency decline are classified as: market, financial, managerial, and behavioral as well as indicators of the external environment. In an effort to overcome the limi-tations of traditional systems of measuring the inefficiency indicators, an analytical framework called the Balanced Scorecard (BSC) proved to be the best, and it enables the actions and stra-tegic objectives of the company to be translated into a set of indicators of company perfor-mance. Numerous techniques and models have been developed to foresee business failure in or-der to implement preventive measures and to prevent negative consequences of failure at the le-vel of individual company and overall economy. When foreseeing the company failure, the ratio numbers are the basis for the development of all statistical models, and the most accurate and most used is the Altman Z-score.
By researching the companies in crisis on global level, 10 components of revitalization stra-tegy of company have been identified and classified into four categories: solid elements, soft elements, external elements and elements aimed to increase internal efficiency. The strategy of revitalization represents specific activities which can restore normal business operations. These activities include covering of primary problems, addressing the causes of the crisis and appropriate detailed analysis and depth analysis in addressing all major issues. The choice of strategy depends on the severity of the crisis, of the factors that have caused it, of the attitudes of key stakeholders, of the previous corporate strategies, of cost and price structure, of situation in the external environment, of the characteristics of industry as well as of the stage of the deve-loping crisis. The process of revitalizing the company in crisis condition implies adequate finan-cial and organizational restructuring.
The aim of the research of companies in the Republic of Srpska was to investigate ways of restructuring the companies in accordance with established legal framework, the factors that caused the insolvency and expectations of Manager regarding the success of the process. Re-search of the companies in the Republic of Srpska has shown that internal factors, primarily inadequate financial policy, largely contributed to the company plunging into crisis. Therefore, the process of revitalization should mostly be focused on eliminating the internal causes of the crisis, emphasizing the measures of financial policy. The most important external factor causing the company to plunge into a crisis is obsolete technology, which demands necessary moder-nization of facilities. The Government is the main regulator of the market as well as creator of conditions for business activity. Because of that, companies in crisis should be provided with
176 University for Business Studies Banja Luka, [email protected]
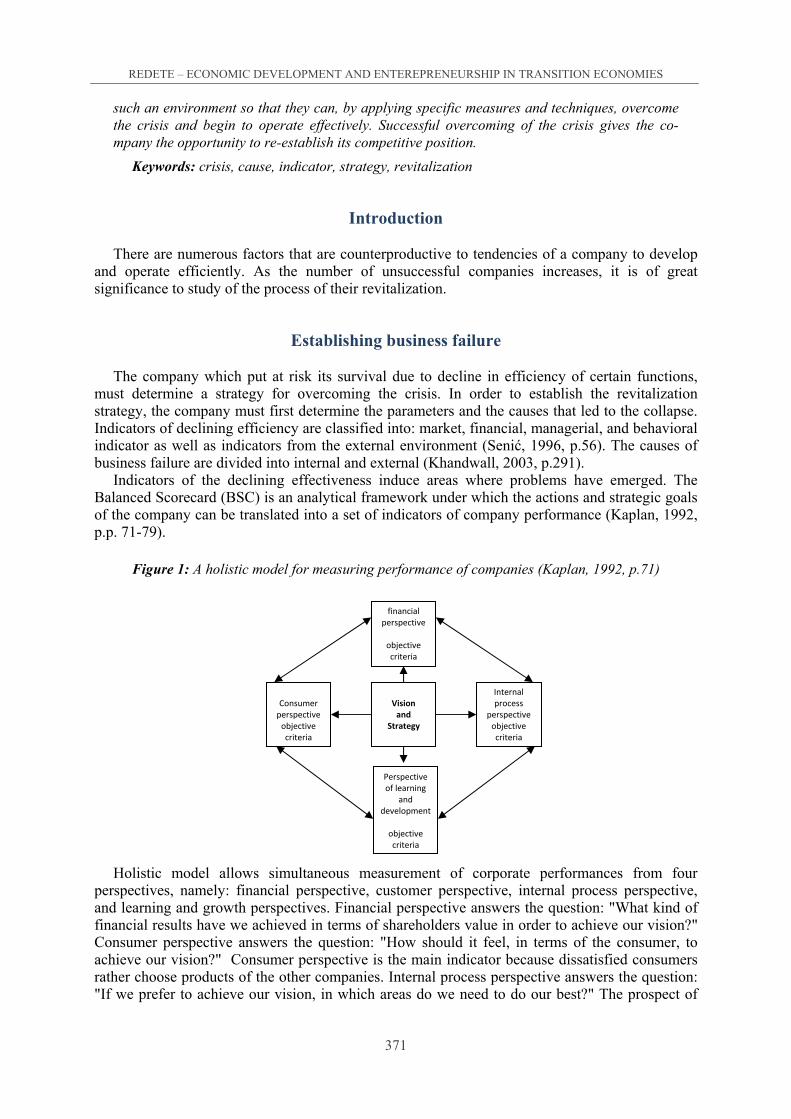
REDETE – ECONOMIC DEVELOPMENT AND ENTEREPRENEURSHIP IN TRANSITION ECONOMIES
371
such an environment so that they can, by applying specific measures and techniques, overcome the crisis and begin to operate effectively. Successful overcoming of the crisis gives the co-mpany the opportunity to re-establish its competitive position.
Keywords: crisis, cause, indicator, strategy, revitalization
Introduction
There are numerous factors that are counterproductive to tendencies of a company to develop and operate efficiently. As the number of unsuccessful companies increases, it is of great significance to study of the process of their revitalization.
Establishing business failure
The company which put at risk its survival due to decline in efficiency of certain functions, must determine a strategy for overcoming the crisis. In order to establish the revitalization strategy, the company must first determine the parameters and the causes that led to the collapse. Indicators of declining efficiency are classified into: market, financial, managerial, and behavioral indicator as well as indicators from the external environment (Senić, 1996, p.56). The causes of business failure are divided into internal and external (Khandwall, 2003, p.291).
Indicators of the declining effectiveness induce areas where problems have emerged. The Balanced Scorecard (BSC) is an analytical framework under which the actions and strategic goals of the company can be translated into a set of indicators of company performance (Kaplan, 1992, p.p. 71-79).
Figure 1: A holistic model for measuring performance of companies (Kaplan, 1992, p.71)
Holistic model allows simultaneous measurement of corporate performances from four perspectives, namely: financial perspective, customer perspective, internal process perspective, and learning and growth perspectives. Financial perspective answers the question: "What kind of financial results have we achieved in terms of shareholders value in order to achieve our vision?" Consumer perspective answers the question: "How should it feel, in terms of the consumer, to achieve our vision?" Consumer perspective is the main indicator because dissatisfied consumers rather choose products of the other companies. Internal process perspective answers the question: "If we prefer to achieve our vision, in which areas do we need to do our best?" The prospect of
financial perspective
objective criteria
Vision
and Strategy
Internal process
perspective objective criteria
Consumer
perspective objective criteria
Perspective of learning
and development
objective criteria
REDETE – ECONOMIC DEVELOPMENT AND ENTEREPRENEURSHIP IN TRANSITION ECONOMIES
372
learning and development responds to the questions: "How do we maintain the ability to change and innovate to achieve our vision?"
The prediction of business failure
In predicting of the failure of enterprises, ratio numbers are the basis for development of statistical models and can explain the first and most commonly used Altman Z-score.( Z-score is an index that is used to predict potential failures).
Z = 1,2 x X1 + 1,4 x X2 + 3,3 x X3 + 0,6 x X4 + 1,0 x X5
Where: X1 = working capital / total assets (the company that suffers operating losses will experience reduction in current assets to total assets).
X2 = retained earnings / total assets (this ratio will be lower in relatively young companies because they have not had time to accumulate profit).
X3 = earnings before interest payments and taxes / total assets (Since the existence of the company is based on its ability to capitalize their assets, this ratio is very useful to make conclusions about a possible bankruptcy).
X4 = market value of equity / total liabilities (This ratio shows how much money the company loses, of its value, before the liabilities exceed the assets of the company and it becomes insolvent).
X5 = sales / total assets According to Altman, lower limit is 1.81 and the company will go bankrupt if the Z-score is
below this value. The company has a high Z-score if it has a strong property base, but business may decline. Altman's Z-score is a multivariate model for predicting bankruptcy and is used to identify the financial viability relative to its profitability, productivity, market value and mana-gerial skills to maintain competitiveness.
Revitalization strategy
The crisis in the company consists of its beginning, culmination, turning point and ending (Smith, 1990, p.260). Components of the strategy of revitalizing of the company are classified into four categories: solid elements, soft elements, external elements and elements aimed at increasing internal efficiency (Khandwall, 2003, p.150).
1) Solid elements include: - change in management;
- significant reduction of costs and assets through: divestitures, downsizing, closure of non-profitable factory, a spin-off;
- tight financial control and financial injection. Tight control refers to cash, procurement, logistics, credits, inventory liquidation, reduction of long-term loans and other liabilities. The injection of additional funds is done by long-term and short-term loans and the sale of securities.
Solid elements are components of the strategy that changes the management team to establish effective relationships with all stakeholders and eliminate unpleasant surprises related to business. Solid elements are building blocks of the strategy guiding organizational restructuring to reduce

REDETE – ECONOMIC DEVELOPMENT AND ENTEREPRENEURSHIP IN TRANSITION ECONOMIES
373
costs and speed up rehabilitation and financial restructuring that allow achieving revitalization and solvency.
2) Soft elements include: - transformational changes including the following actions: expert opinion to formulate
strategies for revitalization, the involvement of external stakeholders in the process of revitalization, mobilization of employees and changes in organizational culture;
- employees restructuring and empowerment of employees can be done through better management of human resources, delegation, creating new business units and departments and affirmation of teamwork;
Soft elements are components of a strategy that seeks to avoid resistance to changes in business. If a company has problems that threaten its functions, it should hire external agents who will recreate the structure, outputs, systems, procedures, technology so that it takes employees to adjust to these changes.
3) External elements of the revitalization strategy include: - a strategic turn including: mergers, acquisitions, joint ventures, product development,
differentiation, pricing and market competitiveness and technological innovation;
- refocusing of products and markets including: changes of product range and capacity expansion,
- improving sales through the following activities: new promotional campaigns, pricing poli-cy, expansion of distribution channels, improving customer service;
External elements are components of a strategy which aims to increase and strengthen the
competitiveness of companies through merging companies, introduction of new products and scie-ntific and technological progress. These elements can be used by companies with a stable finan-cial position.
4) The elements aimed at increasing internal efficiency include: - improving operational efficiency through increased productivity, automatization service,
modernization, reengineering, computerization, improved work discipline and process standardization;
- savings, excluding layoffs, include: reducing the cost of promotion, salary reduction, reducing of maintenance costs, reducing of administrative costs, saving energy and reducing costs for research and development.
Elements aimed at increasing internal efficiency are components of the strategy largely stem
from an organizational restructuring focused on improving productivity, quality and efficiency. The strategy depends on the severity of the crisis, the factors that have caused it, attitudes of
key stakeholders, the previous corporate strategy, cost structure and price conditions in the external environment, characteristics of the industry as well as the development phase of the crisis.
Restructuring Strategy
Restructuring strategies include activities in the market, organizational and financial restru-cturing. Market restructuring can be defined as a redefinition of the target markets, reorganization of proffer structure, strategy adaption to companies’ goals, repositioning of role of the marketing in the mix of business functions, in order to gain and maintain a competitive advantage and

REDETE – ECONOMIC DEVELOPMENT AND ENTEREPRENEURSHIP IN TRANSITION ECONOMIES
374
market attraction (Todorović, Janošević, 1997, p.602). Financial restructuring is the process cau-sing significant changes and discontinuity of capital structure on the basis of changes in the rela-tionship between equity and long term debt. Organizational restructuring of the companies is rep-resented by the radical internal changes and reorganization of the structure. Organizational restru-cturing activities, aiming to revitalize a company, are: organizational transformation, downsizing, outsourcing and business process reengineering. Organizational transformation represents a complete change of strategy and organizational changes in order to adopt the enterprise to the environment (Janićijević, 2004, p.85). Downsizing is a strategy that requires a set of activities as: organizational action, staff reductions, the impact on work process that leads to its redesigning and guidance to the effectiveness and efficiency of the company. Outsourcing strategy consists of focusing on profitable processes, in which the company has a comparative advantage, and referral of the remaining processes to other suppliers, in order to achieve lower costs, higher quality and reduced time to obtain rehabilitation. Re-engineering is a process that entails to start all over again to come up with new basic business process.
The process of revitalization of the company takes place gradually and consists of the follo-wing phases: change in management, evaluation phase, the phase of emergency actions, stability operations phase and the phase of returning the company to its normal activities. The main reason for management change is a belief that the reason for the crisis is a manager who could not solve the problems. In the evaluation phase, the new manager assesses the possibility of revitalizing and based on the indentified problems a required strategy is chosen. Urgent action is applied to stop further deterioration of the company, consisting of: cash flow analysis, financial projections on a daily basis, developing an action plan to generate cash, strong financial controls, reduce costs in all areas and, if necessary, divestitures. Stability operations phase aims to set a platform for future growth, increase profitability and efficiency of operations. Firstly, it is needed to increase profits, then to increase cash flows and ultimately to increase sales. While in the process of stabilization, existing market and the company are used up to its maximum, in the phase of returning to com-pany’s normal operations, enterprise is oriented to product development and market expansion.
Analysis of business enterprises in the Republic of Srpska
Keeping in mind that companies in the Republic of Srpska dwell in a specific situation which is characterized by a general lack of liquidity, losses and threatened existence of most companies, the aim of the research was to explore the possibilities of their revitalization (Duvnjak, 2011, p.p.209-229). 47.37% of surveyed managers consider their company is in crisis, 36.84% consider that they are not in a crisis, while 10, 53% suggest indicators of entering the company into crisis are visible. Exiting the crisis means that the company is doing better and there are 5.26% of such companies (see Figure 2).
Figure 2. Companies in crisis
Do you think your company is in crisis?
36.84%
10.53%5.26%
47.37%
Yes
No
Before thecrisisPassed

REDETE – ECONOMIC DEVELOPMENT AND ENTEREPRENEURSHIP IN TRANSITION ECONOMIES
375
Determining the nature of the crisis, and segments in which it is present, is necessary to deter-mine the appropriate strategy and recommendations for its solution. The results show that 52.64% of managers believe the present crisis is in the financial sector, and 21.05% in sales and publicity, 15.79% in manufacturing or services, 5.26% in organizational segment and 5.26% managerial ownership (see Figure 3).
Figure 3. The character of the crisis
The crisis in the business segments
The crisis in most companies is caused by multiple factors acting simultaneously. These are:
inadequate financial policy, management crisis, inadequate organizational structure, loss of market share and outdated technology. The factors that cause the company to enter into a crisis and their ranking according to the severity of impacts are shown in Figure 4.
Figure 4. The strongest impact of factors causing the entry of companies into crisis
The main reason for entering the company into a crisis- the strongest influence?
16.16%
37.25%
50.00%
15.38%9.09%
0.00%
10.00%
20.00%
30.00%
40.00%
50.00%
60.00%
Loss of market Old technology Indebtedness Crisismanagement
Inadequateorganizational
structure
Inadequate financial policies caused the high level of indebtedness, which resulted in over-indebtedness, and lack of long-term financing and working capital in most of the surveyed companies, 50% in particular. Out of the total number of returned questionnaires, 52.64% of
manifactur. and serv.
financial sales and marketing
managerial ownership
organizational
0
10
20
30
40
50
60
70
80
90
Number of enterprises %

REDETE – ECONOMIC DEVELOPMENT AND ENTEREPRENEURSHIP IN TRANSITION ECONOMIES
376
managers assess that the crisis is of financial character and that inadequate financial sector policies are leading cause of companies’ insolvency. The nature and causes of the crisis, which are mainly present in the financial sector, suggest that the financial restructuring is of great importance for guiding the company out of the crisis.
Management crisis is a factor which, according to this study, included direct management responsibility for the poor performance of the company. 5,26% of managers consider that the character of the crisis is associated to managerial-ownership relation. Given that the questionnaire was designed for managers, it can be said that this was the cause of the relatively high rank, because in 15.38% of cases its impact was assessed as strong.
According to the 9.09% of managers, inadequate organizational structure had a strong influence on the occurrence of the crisis, while 5.26% of managers believe that the crisis had organizational character. These numbers indicate there are bureaucratic problems in organizations. This internal cause of the crisis is in the responsibility of management. Changes in organizational structure may be more critical than the policy changes in the phase of stabilization of companies and are not recommended because of the time pressure. Loss of market share has had an intermediate impact on the emergence of the crisis in 66.66% and a strong influence in 16.66% of cases. This is an external factor that can hide other factors. Penetrating new markets and expanding product portfolio is a strategy that can be used for revitalization of companies with stable financial position. Given the insolvency of companies surveyed, it is not really expected to use this strategy to exit the crisis. This strategy can be implemented after the establishment of regular operations as a way for a company to grow.
Outdated technology, according to the 37,5% of the cases, is assessed as the cause that had a strong influence on the crisis emergence (the second-ranked after indebtedness). Technological changes are the external cause of the crisis, which manifests in products obsolescence and higher production costs compared to competition. 5,26% of managers have estimated that the crisis had organizational character.
Modernization of capacities is important to revitalize the companies where outdated techno-logy was a significant cause of entry into crisis. The implementation of this strategy involves high financial investments. Activities envisaged under the financial restructuring include a range of activities (see Table 1).
Table 1. Activities within the financial restructuring
Ord. Measures Number of companies
1. A payment deferral or reprogramming of companies’ debt 64,28% 2. Transfer of liabilities from one subsidiary to another within the related companies 7,14% 3. Write-down of principal, accrued interest and other receivables 7,14% 4. Conversion of monetary claims of creditors, which are mainly government owned, in
company’s equity -
5. Other measures (asset restructuring, ensuring liquidity of assets and reduction of operating costs)
21,43%
According to the majority of surveyed managers - 64.28%, financial restructuring is considered
as deferral of debt payment or debt reprogramming. In 52,64% of cases, the character of crisis is of financial nature, and 50% of cases consider that the cause of the crisis is a strong indebtedness. Thus, inadequate financing policy is the primary cause of the crisis, and debt write-downs mean that managers who did not perform well would be rewarded rather than penalized. This form of financial restructuring slows down the process of revitalization of the company, because the company's financial discipline is poor. Other measures such as costs reduction and generating revenue from selling some parts of the company should be allowed to return parts of debt. A deferral of debt payment or debt reprogramming is an option for companies that have the potential which will generate revenue to service debt in the near future. However, given the financial

REDETE – ECONOMIC DEVELOPMENT AND ENTEREPRENEURSHIP IN TRANSITION ECONOMIES
377
situation of majority of the surveyed companies, there is a legitimate question if this measure, which is expected by 64.28% of surveyed managers, could contribute to the revitalization of the company. It is believed that the number of companies that have a real chance, through debt rescheduling, to provide a basis for establishing solvency is much smaller than the expectations which managers expressed. Transfer of liabilities from one subsidiary to another aims to motivate potential investors to buy part of the company and is scheduled for 7.14% of the surveyed companies. Debt for equity substitution in the company is undertaken only by creditors which are mainly government owned, in order to collect the company's liabilities.
Instead of a Conclusion
Based on the survey and analysis conducted, it can be concluded that the companies in which the assessment was undertaken, have elements of the crisis.
Reduced efficiency of enterprises is designated by managerial, financial, and market indicators in the external environment, while behavioral indicators are less frequent.
There are several internal and external factors that have caused the company to fall into the crisis. Managers in RS, in order to recognize the internal causes of the crisis, in addition to consideration of the overall vitality of the company, should assess the following: financial posi-tion, the existing organizational structure and human resources in the company. The financial re-sult, well interpreted, shows the activities of the company, while the analysis of the organizational structure shows the stability of relations and aspects of businesses that are within its operations.
The strategy of revitalization that will be applied in RS depends on the stage of development of the crisis. Stages in the development of the crisis are defined as a maximum percentage reduction of the total income. For companies that are in early stages of crisis, a strategic turn gives the most effective results. To overcome the wounds of the crisis, one can use the restructuring of employees, sales promotion, significant cost reduction and investing in property. These fund savings, despite the retention of the current number of employees, may be used until the final stages of the crisis but a serious control and financial injection are more appropriate for later stages of the crisis. If the crisis is of medium intensity, it is necessary to improve operational efficiency. When the crisis becomes more serious, it reduces the use of the property and there is a significant reduction in costs, and increases the use of a higher degree of financial control and financial injections. In the most serious crisis, there is reduced use of strategic turnaround, and increased use of sales promotion activities as well as to ease the crisis and increase the transformational changes.
One of the reasons the company enters a crisis in the RS is the loss of market share. In order to analyze the competitive ability of the company in crisis, it is necessary to consider the nature and structure of the industry and the competitiveness of companies in the industry. Companies should be simultaneously connected with enterprises from abroad that could be competitors, in terms of execution of joint operations or joint ventures engaged in the same or similar activities, which would eliminate foreign companies’ competition.
Scientific and technological progress requires new economic conditions. In order to strengthen competitiveness, companies in RS need to monitor changes in a timely manner and to restructure and strive for a strong position with the high rate of technological progress. The optimal strategy is an offensive and broad investment in research and development. Bankruptcy can occur in case companies make wrong decisions regarding technologies that generate first serious crisis in the firm. The most common cause of the crisis of many companies in RS is the transition from the old to the new technology.
Government is the main regulator of the market and creator of business conditions. As a result, for companies in a crisis, the state should create environment, using certain measures and techni-ques, to overcome the crisis and to begin to operate efficiently. For this, it is enough to look at the measures taken by the Government of the most developed countries with market economies. In

REDETE – ECONOMIC DEVELOPMENT AND ENTEREPRENEURSHIP IN TRANSITION ECONOMIES
378
addition to facilitating the adoption of business regulations, there is a resort to the methodology of direct financial support for companies in crisis, and even to re-privatization or takeover of shares in those companies.
Successful overcoming of the crisis and revitalizing the company gives the company the opportunity to re-establish its competitive position.
References list
1. Janićijević, N. (2004). Management of organizational change, the Center for Faculty of Economics. Belgrade.
2. Kaplan, R. S. and D. P. Norton. (1992). The Balanced Scorecards-measures that drive performance. Harvard Business Review. p.p. 71-79.
3. Khandwalla, p. (2003). Turnaround Excellence: Insights from 120 Cases. Response Books, New Delhi. p.291.
4. Senic, R. (1996). Crisis management. BGM, Belgrade. 5. Smith, D. (1990). Beyond contingency planning: toward a model of crisis management.
Industrial Crisis Quarterly, No.4. 6. Todorovic J., D Đuričin., S Janošević. (1997). Strategic Management. IZIT Belgrade. 7. Duvnjak, V.(2011). Research of companies in crisis: Doctoral Dissertation: Revitalization
of an enterprise- a strategy to eliminate a crisis. Faculty of Business and Economics 8. Bijeljina, University of East Sarajevo, p.p. 209-229.

REDETE – ECONOMIC DEVELOPMENT AND ENTEREPRENEURSHIP IN TRANSITION ECONOMIES
379
AN ANALYSIS OF COMMODITY TRADE BETWEEN POLAND AND BOSNIA AND HERZEGOVINA
Lukasz KLIMCZAK177
Abstract
The aim of this paper is to present scope and nature of the commodity trade between Poland (PL) and Bosnia and Herzegovina (B&H), with relevant figures from the European Union (EU) trade used as a benchmark. In 2011 Poland was seventh most important trade partner for Bos-nia among the EU-countries – both for export and for import – following three “old-Europe” (EU15) and three “new-Europe” (EU12) countries. In the past 10 years Polish export to Bos-nia & Herzegovina grew 4 times, reaching a level of 109 mln EUR in 2011, whereas Bosnia’s export to Poland grew almost 9 times, exceeding 38 mln EUR.
At an industry level, the top 10 product categories at 3-digit SITC sections were presented. It seems that in 2011 the top export categories from PL to B&H were:
- 791, Railway vehicles (15% of total PL export to B&H) - 821, Furniture and parts thereof (8%) - 642, Paper and paperboard (5%), - whereas for export from B&H to PL: - 281, Iron ore and concentrate (33% of total B&H export to PL) - 523, Salts and peroxysalts (19%) - 684, Aluminium (11%).
The analysis shows much greater commodity concentration in the Bosnia’s export to Poland, than reverse. First five product groups at 3-digit SITC sections account for 36% of the Polish export to Bosnia, and as much as 76% of the B&H export to PL. It seems particularly high com-pared to the EU export to B&H, in case of which first five products account only for 19% of total export, showing great trade diversity. This concentration analysis is further supplemented by an analysis of the Herfindahl-Hirschman Index (HHI) which re-confirms that observation.
The intra-industry trade (IIT) share of total trade between Bosnia and Poland in 2011 was only 8%, which means 92% of their trade was inter-industry, characteristic for developing eco-nomies. The benchmarked trade of Bosnia with the European Union showed 37% of the IIT with a constantly growing tendency over the last decade.
In terms of factor endowment, the structures of the Poland’s trade does not correspond tota-lly with the structure of the EU’s trade with Bosnia and Herzegovina. In case of Bosnia’s export to Poland “raw materials” was the main export group (52% share). In case of Bosnia’s export to the EU, it were “labour-intensive goods” that accounted for 44% of trade, making “labour” the most important export production factor. An interesting thing is that the same factor domi-nated Bosnia’s import from the EU.
The analysis of the bilateral Revealed Comparative Advantage (RCA) showed that the number of industries with the RCA in case of Bosnia and the European Union is levelling over time, which is not the case of Bosnia’s trade with Poland.
177 Cracow University of Economics, [email protected]

REDETE – ECONOMIC DEVELOPMENT AND ENTEREPRENEURSHIP IN TRANSITION ECONOMIES
380
Introduction
A lot of analysis have been made to show trade structures between the European Union (EU) and developing countries of Central-East (CEEs) or South-East (SEEs) Europe. Much less atten-tion is being put to trade relations of certain CEE with SEE countries. This paper is an attempt to fill-in this gap by analysing commodity trade between Bosnia and Herzegovina (B&H) and Poland (PL).
It is an obvious thing to say that the end of the XX-th. century brought dramatic changes to people in both countries: Bosnia and Herzegovina proclaiming independency in 1992 and su-ffering a war, Poland overcoming communist regime and turning to democracy and market eco-nomy. However, this context must be signalled, to cast a light on scope and type of economic relations between the two countries, especially in the 90-ties. According to United Nations data base (http://unctadstat.unctad.org), in 1996 Bosnia’s export to Poland was 0.26 mln USD, whereas import 7.73 mln USD, which seems marginal. Thus, in this paper a period from 2000 to 2011 is analysed, which should make the results of comparison in time more adequate.
In case of Bosnia and Herzegovina and Poland, both being small, open economies in understanding of international relations science, volume of international trade and its structure can be perceived as a proxy of country’s stability and openness. In other words, the more stable and open a country is over time, the faster its trade grows. For this reason, a simple analysis of a foreign trade in case of economies like Bosnia and Herzegovina and Poland can be a signal of more complex changes taking place.
In the analysed period, two main processes took place which could influence bilateral trade between Bosnia and Poland. Namely, the year 2000 brought a free access to the market of European Union for almost all products originating from the Western Balkans, including Bosnia and Herzegovina. It was granted on a basis of Interim Agreements on Trade and Trade-Related Matters, being a part of the Stabilisation and Association process. As Poland joined the EU on May 1st., 2004, it applied the external tariff regime of the Union against the third countries, including Bosnia. This made the year 2004 a natural census for the bilateral trade analysis.
The aim of this paper is to assess scope and nature of the bilateral trade between Bosnia and Herzegovina and Poland, putting Bosnia’s trade with the European Union as a benchmark. This will allow to settle the Bosnian – Polish trade in the right perspective. It seems particularly interesting, because Poland is a part of the EU since 2004 and in the same time a developing economy, like Bosnia. This paper is also an attempt to discover the bilateral trade pattern of Poland and Bosnia and Herzegovina in the light of international trade theory. This would allow to say more about the importance of traditional, inter-industry trade, characteristic for developing economies, and intra-industry trade, characteristic for developed ones.
The following part of the paper includes theoretical issues connected with the trade patterns, especially Ricardo’s comparative advantage, Heckscher-Ohlin factor endowment theorem and Intra-Industry Trade (IIT) model. It also presents different empirical studies on the subject, including the ones from Central Europe and Western Balkans. The second part comprises of the B&H-PL and B&H-EU trade analysis, in terms of volumes, shares, balance and dynamics. In the third part a more detailed study is made on product groups and product concentration of trade. Finally, the fourth part checks for trade patterns in a meaning of comparative advantage, factor endowment and intra-industry trade, employing respective analytical tools.
Theoretical background and hypothesis
The first, rather descriptive part of the analysis employs simple measures of shares, dynamics, balance and ratio of the B&H – PL trade, which are compared to B&H – EU trade. As for the reasons described in the Introduction bilateral trade was minimal before 2000, it is expected to grow intensively, as stability and openness of both economies increased. Especially Bosnia’s

REDETE – ECONOMIC DEVELOPMENT AND ENTEREPRENEURSHIP IN TRANSITION ECONOMIES
381
export to the EU is expected to grow after it joined the free market access policy of the EU, based on the Interim Agreement. Regarding Poland’s place in the Bosnian trade with the EU, we could come from assumptions of gravity models (not analysed in this paper) that the trade depends mostly on countries’ GDPs and the distance between them. If so, Poland as a partner of Bosnia and Herzegovina should place itself after Italy, Germany, France, Austria, Slovenia, Hungary, Ro-mania and perhaps Greece. Relatively smaller and/or more distant countries like Czech Republic, Slovakia, Bulgaria or the Baltic states should be of smaller relevance.
The second analytical part, also descriptive, casts a light on product groups being traded between Bosnia and Herzegovina and Poland. The aim of this part is to investigate what products both countries trade with and also to present a database for the further analysis.
An attempt is made in the last two analytical parts to use trade measures characteristic for the two different patterns of international trade: inter-industry and intra-industry trade. The Ricardian comparative advantage and The Heckscher-Ohlin trade theory are said to explain well the first of those patterns [Kandogan, 2003]. On the other hand, it is commonly understood that IIT cannot be explained on the basis of Ricardian comparative advantage theory because of the constant returns assumption on which it is based. The IIT is strongly associated with imperfect competition and increasing returns, with only some contradictive research proving that the above connection is not authorized [Davis 1995]. Thus in this paper a clear division will be kept for trade arising from comparative advantage, factor endowment and from different factors resulting in intra-industry trade.
Ricardian Comparative Advantage
Introduced by David Ricardo [1817], the comparative advantage model (so-called Ricardian model) is still one of the most important concepts explaining inter-industry trade patterns. Its main principle is that a nation will export the goods or services in which it has its greatest compa-rative advantage and simultaneously import those of the least comparative advantage. Gains from trade follow from allowing the economy to specialise .
The standard Ricardian model is 2-country, 2-commodity case, although attempts were made to improve it. Haberler [1936] presented a 2-country, many-commodity model, Dornbusch, Fisc-her and Samuelson [1977] extended the analysis to continuum of commodities. Viner [1937] tes-ted many-country, 2-commodity case. Shiozawa [2007] extended it to many-country, many-commodity one, incorporating intermediate goods.
Comparative advantage model has some limitations, though. Firstly, it uses labour as the only production factor, excluding trade with intermediate goods from any analysis. It would be releva-nt, if all production costs were borne inside the country. Secondly, comparative advantage model does not allow to analyse technical change and development. Thirdly, increasing returns and pro-duct differentiations are not accounted, which makes it impossible to explain eg. the phenomenon of intra-industry trade.
Empirical evidence exists that the comparative advantage theory explains well contemporary trade of catching-up economies [Widodo, 2009], as it consists mostly of the inter-industry trade. Thus, one of the objectives of this paper is to compare the number of product groups with Revea-led Comparative Advantage (RCA) for Bosnia’s trade with Poland and with the European Union. As these numbers are in relation with the economy size, it is expected that the EU and PL will appear to have bigger number of the product categories with RCA over Bosnia then reverse. Studying the changes of RCA would be all the more important that trade between Bosnia and Poland and the EU undergone liberalisation processes, which usually have effects on RCA values and structures.
The measure of Revealed Comparative Advantage was first proposed by Bela Balassa [1965]. Since then it has been applied in numerous reports (e.g. UNIDO, World Bank and other) and

REDETE – ECONOMIC DEVELOPMENT AND ENTEREPRENEURSHIP IN TRANSITION ECONOMIES
382
academic publications, dealing with international trade specialisation. In bilateral trade the RCA index is calculated as follows:
where: RCAij – Revealed Comparative Advantage in an industry i in trade with country j; Xi/ Mi – export/ import in industry i, to/from country j; X/ M – total export/ import to/from country j. On the assumption that the commodity pattern of trade reflects the inter-country differences in
relative costs as well as in non-price factors, this is assumed to “reveal” the comparative ad-vantage of the trading countries. The factors that contribute to movements in RCA are economic: structural change, improved world demand and trade specialisation [Batra, Khan 2005].
Factor endowments
The Heckscher-Ohlin model employs comparative advantage to explain the pattern of trade basing on factor endowments of a country or a region (in a contrary to single-factor Ricardian theory). According to it, the country will export those types of goods which utilise most intensively the factor that is abundant and which price is relatively low. On the other hand, it will import goods produced with use of a factor which is scarce in that country. Increased trade lowers the price of the imported good, which leads to a reduction in its domestic production. That frees up more of the factor it uses relatively intensively than is demanded elsewhere in the economy at existing prices.
The measurement of trade pattern following Heckscher-Ohlin (H-O) theory of factor endowments allows to use several measures. Differences among them come from diversified understanding of the “factors endowments” and their role in production and trade. Traditionally the H-O model employs three factors: land, capital and labour. Currently other factors are proposed, especially human capital (or skilled labour) and technology. Leamer [1984] presents even eleven factors: capital, three types of labour (professional, semiskilled, and unskilled),four types of land (tropical, temperate, dry, and forested), coal, minerals, and oil. For the analytical purposes Krause [1987] classifies product categories in four groups: natural-resource-intensive, unskilled-labour-intensive, human-capital-intensive (skilled-labour-intensive) and technology-labour-intensive. He drops “physical capital” because of its international mobility. This brings, however, a question if one of the main production factors can be omitted in a factor analysis. On the other hand, the UNCTAD STAT data base provides another four groups: Labour-intensive and resource-based manufactures and Manufactures with low (or medium or high) skill and technology intensity. Here the division according to production factors doesn’t seem to be clear enough. Thus, the following grouping of products versus production factors is used in this paper (see Yilmaz [2003]):
- Raw material- intensive goods [SITC 0, 2-26, 3-35, 4, 56] - Labour-intensive goods [SITC 26, (6-62, 67, 68), (8-87, 88)] - Capital- intensive goods [SITC 1, 35, 53, 55, 62, 67, 68, 78] - Easily imitable, research-oriented goods [ SITC 51, 52, 54, 58, 59, 75, 76] - Difficultly imitable, research-oriented goods [ SITC 57, 7-( 75, 76, 78), 87, 88].
The above grouping should allow to give answers about major factors in the analysed trade
flows.

REDETE – ECONOMIC DEVELOPMENT AND ENTEREPRENEURSHIP IN TRANSITION ECONOMIES
383
Intra-Industry Trade
Apart from comparative advantage or factor endowments (which explain mostly the inter-industry trade), contemporary studies appoint intra-industry trade as one of the most important explanations of the growing part of the total trade, especially in case of the developed countries. The IIT is a part of a wider group of so-called “New Trade Theory”. The first to describe the IIT as simultaneous export and import of goods within the same industry between two partners were Bela Balassa and Pieter Verdoorn in 1960s [Verdoorn 1960; Balassa 1965]. They described reciprocal trade in the same industries in the trade of the European Economic Community (EEC). Herbert Grubel and Peter Lloyd [1975] provided the definitive empirical study on the importance of IIT and how to measure it. Since then both the scope of the intra-industry trade and the theoretical framework behind it grew intensively. The phenomenon was connected to increasing returns to scale, which imply that countries will specialise in the production of different goods within one industry. The desire of consumers for variety generates demand for foreign brands. The result is international trade in the same industry in which similar goods are being exchanged in both directions.
In general, three main reasons for the growth of the IIT are most often presented [Misala, Plucinski, 2000]:
- growing diversity of the consumer, investment and purchasing demand structures;
- development of commercial and ownership relations between companies from different countries;
- liberalisation of trade and decreasing costs of transport, communication etc.
- Three different types of intra-industry trade are usually being distinguished, each warranting a different type of explanation:
- horizontal trade in similar products with differentiated varieties (e.g. cars of a similar class and price range);
- trade in vertically differentiated products distinguished by quality and price (e.g. export of high-quality clothing and import of lower-quality clothing);
- vertical specialisation of production that results in trade in similar goods at different stages of production.
As explained in an OECD report on IIT [2002], horizontal intra-industry trade enables coun-
tries with similar factor endowments to benefit from economies of scale by specialising in “niche” products. Trade in vertically differentiated products would reflect different factor endowments, particular skills of the workforce or high fixed research and development costs. Vertical specialisation of production across countries may be driven by comparative advantage, for example to use cheap unskilled labour for assembly purposes or specialised personnel for research and development. However, the inclusion of vertical specialisation into the scope of intra-industry trade is problematic, as in case of highly disaggregated data goods at different stages of produc-tion do not come into the same analytical sections.
To estimate the degree of intra-industry trade a variety of measures were purposed in the litera-ture. Among them the most widely adopted one was developed by Herbert Grubel and Peter Lloyd [1971], which is therefore known as Grubel-Lloyd (or the G-L) index:

REDETE – ECONOMIC DEVELOPMENT AND ENTEREPRENEURSHIP IN TRANSITION ECONOMIES
384
where Xij and Mij refer to country’s exports and imports respectively, of industry i to/from country j. This measure takes values between zero and one and increases in the increasing share of IIT.
The Grubel-Lloyd indices can be aggregated across all industries, as a trade-weighted average of the industry indices [Greenaway et al, 1995]:
The above model is used in the following part paper to calculate the share of IIT between Bosnia and Herzegovina and Poland, and the European Union as well.
Several hypothesis were so far confirmed regarding the intra-industry trade. Linder [1961], Bergstrand [1990] and Hummels and Levinsohn [1995] found out, that countries that have similar per capita income level have much more IIT, due to individual preferences becoming more important, as bigger part of income is left after compulsory spendings. The IIT is also positively correlated with per capita income level of both trading partners. The same relation is supposed to occur in case of economy size, being measured by GDP [Helpman, Krugman 1987; Hummels and Levinsohn 1995]. In other words, the bigger and the richer economies are, and the more similar in these measures, the higher share of IIT in their trade.
Another trace led economists to discover that economic integration also results in a higher IIT share. Grubel and Lloyd proved this relation in case of the European Community [1975], Balassa for Latin America Free Trade Association (LAFTA) and Central American Common Market (CACM) [1979], Molendowski for Central European Free Trade Association [2007b]. Regarding the European Union, majority of studies acknowledge the positive influence of economic integration on the share of IIT [Brülhart, 2008; Brülhart and Elliot, 1998; Aturupane, Djankov and Hoekman, 1999]. However, there are opposite conclusions also [Greenaway, 1987; Greeaway and Hine, 1991; Globerman and Dean, 1990].
Another hypothesis has been so far agreed upon, that distance is an obstacle to intra-industry trade. Similarly to the theory behind the gravity model, distance can be understood as geographi-cal distance (expressed in kilometers or in transport cost) or cultural distance (different language, dominating religion, etc.). Studies on this subject were performed by Grimwade [2000] or Sen et al. [2009], confirming negative correlation between distance and share of IIT.
Studies on foreign trade of Bosnia and Herzegovina and of Poland
An analysis was conducted on the intra-industry trade of the whole region of the Western Bal-kans by Madras and Nikas [2008a; 2008b]. Authors find out that its level was very low, especially for Bosnia, due to political instability. It is supposed to be rising as trade liberalisation and inte-gration process with the EU goes on. Botric [2012] examines intra-industry trade of the Western Balkan countries with the European Union, dividing the latter for “new EU” and “old EU”. Unsurprisingly, the trade with the “old EU” is of much higher values and IIT-shares. The study points out that the trade is very low and too much concentrated, with the IIT almost missing. The pattern of the Bosnia’s export was analysed by Maric [2011]. The author comes to a conclusion, that majority of it is represented by inter-industry trade, driven by comparative advantages mostly in raw materials (iron, steel, aluminium, wood) or labour-intensive industries. Mercan and Yergin [2012] analyse the intra-industry trade between Bosnia and Turkey coming to a finding, that there was no such type of trade until 2008 (due to small export from B&H). Then it would rise in three years to a level of 96% (in 2011). This surprising finding can be however explained by an extremely low aggregation of data – authors analyse 1-digit level SITC sections.

REDETE – ECONOMIC DEVELOPMENT AND ENTEREPRENEURSHIP IN TRANSITION ECONOMIES
385
As for the trade of Central-European countries, Molendowski [2007a; 2007b] discovers rising shares of the IIT in the total trade of countries that signed as first the CEFTA agreements. As for the factor endowment, the author finds out that the four analysed countries turned from “Difficultly imitable, research-oriented goods” to “Labour-intensive goods” and “Easily imitable, research-oriented goods”, which can’t be seen as a progress. Examining transition countries, Kandogan [2003] proves strong influence of income similarity and common border on the IIT.
Cieslik [2006] utilizes a hybrid incomplete specialisation model with both differentiated and homogenous goods to evaluate the pattern of the Poland’s trade. The outcome is an integrated model of factor proportions and monopolistic competition that would characterise it in the best way. The IIT between Poland and the European Union was measured by Misala and Plucinski [2000]. It seems that the share of the IIT was very small in the 1990’s, particularly in case of technology-intensive products. Laaser et al. [2008] conduct a survey of Poland’s trade pattern and determinants with EU and non-EU countries between 1999 and 2004. Is seems that with the partners from the European the intra-industry trade was taking a dominant position, which can suggest a strong catching-up process of the Poland’s economy, resulting in a higher share in the international division of labour. On the other hand, the trade with non-EU countries was more of an inter-industry type, being a heritage of the past. Czarny and Lang [2002] predicted, basing on comparative advantage theory, a declining role of Poland’s human capital- and capital-intensive goods after the EU accession.
Cernosa and Moczulski [http://www.bibliotekacyfrowa.pl/dlibra… (accessed: 13.08.2012)] study trade relations between Poland and Slovenia, coming to a conclusion, that the trade pattern corresponds mostly with vertical IIT, which is supposed to be a result of income, country size, FDI and technological differences.
Place of Poland in the Bosnia and Herzegovina’s trade with the European Union
In 2011 Poland was Bosnia’s 7th biggest partner in the European Union for export (2% of export to EU) and for import (3% of import from EU) after three “old-EU” and three “new-EU” countries: Italy, Germany, Austria, Slovenia, Hungary and Czech Republic.
Place of Poland has changed significantly since 2000: as an import partner it changed from 10th position, outpacing France, the UK and the Netherlands. As an export destination the development was much more spectacular, as in 2000 Poland was only 14th biggest partner for B&H, with very low export values. Bosnia’s export to Poland stayed on a very low level until 2005, which can be associated with Poland’s accession to the EU a year before. In just two years, from 2004 to 2006, the export grew 10.3 times.
Bosnia’s import from Poland developed more steadily, with fastest growth of 2.5 times between 2000 and 2002. The EU-accession didn’t seem to have any bigger influence on Bosnia’s import from Poland.
An average growth rate over analysed 12 years was higher in case of Bosnia’s export to Poland (70%) than import from Poland (23%).
Over the analysed period just in one year (2006) Bosnia had a trade surplus with Poland (of 1.2 mln EUR). The highest trade deficits B&H recorded in 2002, 2003 and 2011, each time exceeding 70 mln EUR.
The export/import ratio of Bosnia in trade with Poland stayed at a very low level between 0.05 and 0.14 in years 2000 – 2004. Its trade surplus in 2006 resulted in export/import ratio of 1.02, followed by another downturn to 0.48 in 2007. Years 2008 – 2011 were characterised by sta-bilised value of the index between 0.27 and 0.37.

REDETE – ECONOMIC DEVELOPMENT AND ENTEREPRENEURSHIP IN TRANSITION ECONOMIES
386
Table 1. B&H export to the EU Table 2. B&H import from the EU
Source: Eurostat and own calculations Source: Eurostat and own calculations
Source: Eurostat and own calculations Source: Eurostat and own calculations
Source: Eurostat and own calculations
EU countries B&H export
values (mln EUR)
Dynamics
2000 2005 2011
2011/ 2000
2011/ 2005
SLOVENIA 63 291 604 9,5 2,1
ITALY 256 338 494 1,9 1,5
GERMANY 109 241 459 4,2 1,9
AUSTRIA 48 130 408 8,5 3,1
HUNGARY 4 104 105 27,9 1,0
CZECH REP.
2 19 50 20,9 2,5
POLAND 4 31 38 8,7 1,2
REST of EU 136 178 244 1,8 1,4
EU countries B&H import
values (mln EUR)
Dynamics
2000 2005
2011
2011/ 2000
2011/ 2005
GERMANY 356 573 736 2,1 1,3
SLOVENIA 408 556 703 1,7 1,3
ITALY 342 467 586 1,7 1,3
AUSTRIA 182 294 332 1,8 1,1
HUNGARY 194 233 259 1,3 1,1
CZECH REP.
57 107 143 2,5 1,3
POLAND 31 96 109 3,6 1,1
REST of EU 305 545 668 2,2 1,2

REDETE – ECONOMIC DEVELOPMENT AND ENTEREPRENEURSHIP IN TRANSITION ECONOMIES
387
Source: Eurostat and own calculations
Table 3. Poland – Bosnia and Herzegovina trade indicators, 2000 - 2011
2000 2001 2002 2003 2004 2005 2006 2007 2008 2009 2010 2011
B&H export to PL (mln EUR)
4.4 5.2 5.0 4.3 5.3 31.2 54.5 31.7 28.1 23.0 24.2 38.5
B&H import from PL (mln EUR)
30.7 46.3 77.1 78.0 69.0 96.0 53.2 66.2 76.9 85.5 85.8 109.1
B&H trade balance with PL (mln EUR)
-26.3 -41.1 -72.1 -73.7 -63.7 -64.7 1.2 -34.6 -48.8 -62.5 -61.6 -70.7
B&H - PL export/import ratio
0,14 0,11 0,07 0,05 0,08 0,33 1,02 0,48 0,37 0,27 0,28 0,35
B&H export to PL (year to year dynamics)
- 118% 96% 85% 123% 593% 174% 58% 89% 82% 105% 159%
B&H import from PL (year to year dynamics)
- 151% 167% 101% 89% 139% 56% 124% 116% 111% 100% 127%
Source: Eurostat and own calculations
Source: Eurostat and own calculations
REDETE – ECONOMIC DEVELOPMENT AND ENTEREPRENEURSHIP IN TRANSITION ECONOMIES
388
Sectorial analysis of Bosnia and Herzegovina’s trade with Poland and the European Union
Regarding the product groups, Bosnia’s export to Poland in 2011 differs from its export to the European Union. From the main SITC sections, “2 – Crude materials, inedible, except fuels” account for as much as 45% of the total export to Poland. It is mostly a result of 33% of total ex-port being completed within a section “281 – Iron ore and concentrates”, 9% within “285 – Alu-minium ores and concentrates (including alumina)” and 3% within “248 – Wood, simply worked, and railway sleepers of wood”.
The second main section in Bosnia’s export to Poland is “5 – Chemicals and related products, N.E.S.”, with 22% share. Within this section, the top product groups are “523 – Salts and peroxysalts, of inorganic acids and metals” accounting for 19% of total exports to Poland and “522 – Inorganic chemical elements, oxides and halogen salts” accounting for 2%.
Those two main sections seem not to be of highest importance in case of Bosnia’s export to the European Union, though. They account for only a small part of it: section “2” – 14% and section “5” – 5%. Much higher values come with section “8 – Miscellaneous manufactured articles” with 32% share and section “6 – Manufactured goods classified chiefly by material”, with 24%. This may suggest different determinants of Bosnia trade with Poland and the EU as a total.
The situation is different in case of imports from Poland and the EU. Namely, the same two main categories appear as the most important in both cases. Section “7 – Machinery and transport equipment” accounts for 32% of import from Poland and for 28% of import from the EU. At the same time section “6 – Manufactured goods classified chiefly by material” means 2 per cent points less in both directions.
Regarding product groups in 3-digit SITC level, in case of Bosnia’s import from Poland the sole leader appears to be the section “791 – Railway vehicles (including hovertrains) and associated equipment”, accounting for 15% of the total import. From section “6” there are as much as four product categories at 3-digit level in the top 10 of the imports from Poland, details in the Table No. 6.
The analysis shows much greater commodity concentration in the Bosnia’s export to Poland, than reverse. First five product groups at 3-digit SITC sections account for 36% of the Polish export to Bosnia, and as much as 76% of the B&H export to PL. It seems particularly high compared to the EU export to B&H, in case of which first five products account only for 19% of total export, showing a great trade diversity.
The analysis of the Herfindahl-Hirschman Index (HHI) of product categories at 3-digit SITC sections confirms this observation. In 2011, Bosnia’s export to Poland showed a very high concentration index value of 0.1718, compared to 0.0429 of imports from Poland, 0.0439 of exports to EU and 0.0147 of imports from EU.
Over the analysed period of 2000 – 2011 those values of HHI were changing significantly. Especially the concentration of Bosnia’s export to Poland was fluctuating, presenting instability of export trade connections with Polish importers. In 2005 the HHI index reached the highest level of 0.3929. It was mainly connected with the beginning of exporting products from section “281 - Iron ore and concentrates” which with the value exceeding 18 mln EUR made over 40% of all Bosnian export to Poland. In case of the reverse flow, a downward trend between 2000 and 2011 can be observed (from 0.1585 to 0.0429), which is a result of growing diversity of products imported from Poland. The same observation can be made on the HHI index of Bosnia’s export to the European Union, in case of which the index value dropped from 0.0887 to 0.0439. On the other hand, Bosnia’s import from the EU is the only analysed trade flow which showed rising product concentration between 2000 and 2011 (from 0.0107 to 0.0147).

REDETE – ECONOMIC DEVELOPMENT AND ENTEREPRENEURSHIP IN TRANSITION ECONOMIES
389
Table 4. Commodity trade by main SITC groups, 2011 (mln EUR)
SITC SECTIONS B&H export
to PL B&H import
from PL B&H export
to EU B&H import
from EU Value Share Value Share Value Share Value Share
0 - FOOD AND LIVE ANIMALS 1.3 0,03 16.2 0,15 44.0 0,02 323.3 0,09
1 - BEVERAGES AND TOBACCO 0.1 0,00 1.1 0,01 4.8 0,00 41.7 0,01
2 - CRUDE MATERIALS, INEDIBLE, EXCEPT FUELS
17.2 0,45 1.2 0,01 335.3 0,14 108.2 0,03
3 - MINERAL FUELS, LUBRICANTS AND RELATED MATERIALS
1.4 0,04 2.1 0,02 76.9 0,03 199.2 0,06
4 - ANIMAL AND VEGETABLE OILS, FATS AND WAXES
0.0 0,00 0.0 0,00 9.6 0,00 33.6 0,01
5 - CHEMICALS AND RELATED PRODUCTS, N.E.S.
8.3 0,22 7.5 0,07 129.5 0,05 534.7 0,15
6 - MANUFACTURED GOODS CLASSIFIED CHIEFLY BY MATERIAL
7.8 0,20 32.6 0,30 572.2 0,24 912.8 0,26
7 - MACHINERY AND TRANSPORT EQUIPMENT
1.0 0,03 34.4 0,32 448.1 0,19 986.4 0,28
8 - MISCELLANEOUS MANUFACTURED ARTICLES
1.2 0,03 14.0 0,13 772.9 0,32 367.9 0,10
9 - COMMODITIES AND TRANSACTIONS NOT CLASSIFIED ELSEWHERE IN THE SITC
0.0 0,00 0.0 0,00 7.1 0,00 13.1 0,00
TOTAL 38.5 1,00 109.2 1,00 2404.1 1,00 3 535.2 1,00
Source: Eurostat and own calculations
Source: Eurostat and own calculations

REDETE – ECONOMIC DEVELOPMENT AND ENTEREPRENEURSHIP IN TRANSITION ECONOMIES
390
Source: Eurostat and own calculations
Table 5. Bosnia’s export to Poland in 2011 - Top 10 from 3-digit SITC categories
No. SITC category SITC category description
Value (thousand EUR)
Share Share (cummulated)
1 281 IRON ORE AND CONCENTRATES 12 696 0,33 0,33
2 523 SALTS AND PEROXYSALTS, OF INORGANIC ACIDS AND METALS 7 410 0,19 0,52
3 684 ALUMINIUM 4 283 0,11 0,63
4 285 ALUMINIUM ORES AND CONCENTRATES (INCLUDING ALUMINA) 3 327 0,09 0,72
5 334 PETROLEUM OILS AND OILS OBTAINED FROM BITUMINOUS MINERALS
1 442 0,04 0,76
6 061 SUGARS, MOLASSES AND HONEY 1 234 0,03 0,79
7 821 FURNITURE AND PARTS THEREOF; BEDDING, MATTRESSES, MATTRES
1 196 0,03 0,82
8 248 WOOD, SIMPLY WORKED, AND RAILWAY SLEEPERS OF WOOD 1 188 0,03 0,85
9 522 INORGANIC CHEMICAL ELEMENTS, OXIDES AND HALOGEN SALTS
830 0,02 0,87
10 685 LEAD 723 0,02 0,89 TOTAL 38 497 1,00 1,00
Source: Eurostat and own calculations

REDETE – ECONOMIC DEVELOPMENT AND ENTEREPRENEURSHIP IN TRANSITION ECONOMIES
391
Table 6. Bosnia’s import from Poland - Top 10 from 3-digit SITC categories
No. SITC category SITC category description
Value (thousand EUR)
Share Share (cumulated)
1 791 RAILWAY VEHICLES (INCLUDING HOVERTRAINS) AND ASSOCIATED EQUIPEMENT 16207 0,15 0,15
2 821 FURNITURE AND PARTS THEREOF; BEDDING, MATTRESSES, MATTRES SUPPORTS, CUSIONS AND SIMILAR STUFFED FURNISHINGS
8694 0,08 0,23
3 642 PAPER AND PAPERBOARD, CUT TO SIZE OR SHAPE, AND ARTICLES OF PAPER OR PAPERBOARD 5962 0,05 0,28
4 625 RUBBER TYRES, INTERCHANGEABLE TYRE TREADS, TYRE FLAPS AND INNER TUBES FOR WHEELS OF ALL KINDS
4368 0,04 0,32
5 001 LIVE ANIMALS OTHER THAN ANIMALS OF DIVISION 03 3916 0,04 0,36
6 682 COPPER 3819 0,03 0,39
7 073 CHOCOLATE AND OTHER FOOD PREPARATIONS CONTAINING COCOA, N.E.S. 3354 0,03 0,42
8 612 MANUFACTURES OF LEATHER OR OF COMPOSITION LEATHER, N.E.S. 3078 0,03 0,45
9 553 PERFUMERY, COSMETIC OR TOILET PREPARATIONS (EXCLUDING SOAPS) 2292 0,02 0,47
10 778 ELECTRICAL MACHINERY AND APPARATUS, N.E.S. 2273 0,02 0,49 TOTAL 109157
Source: Eurostat and own calculations
Table 7. Product concentration in foreign trade: Herfindahl–Hirschman Index values for B&H, PL and EU trade
Flow 2000 2001 2002 2003 2004 2005 2006 2007 2008 2009 2010 2011 B&H export to PL
0,1953 0,1261 0,1199 0,1108 0,1380 0,3929 0,3499 0,3442 0,2274 0,1383 0,0896 0,1718
B&H import from PL
0,1585 0,1300 0,1660 0,1536 0,1406 0,1501 0,0667 0,0570 0,0459 0,0457 0,0373 0,0429
B&H export to EU
0,0887 0,0731 0,0722 0,0618 0,0607 0,0521 0,0467 0,0442 0,0405 0,0504 0,0479 0,0439
B&H import from EU
0,0107 0,0107 0,0114 0,0120 0,0132 0,0132 0,0172 0,0128 0,0148 0,0135 0,0141 0,0147
Source: Eurostat and own calculations
Source: Eurostat and own calculations

REDETE – ECONOMIC DEVELOPMENT AND ENTEREPRENEURSHIP IN TRANSITION ECONOMIES
392
Testing for trade explanations
Comparative advantage
Ricardo’s comparative advantage theory gives a background for analysing the Revealed Comparative Advantage (RCA), as presented in previous parts of this paper. In this analysis the RCA is calculated for pairs of countries (or group of them, as in case of the European Union). Using a 3-digit SITC sections a number of industries is counted in which a country has a Revealed Comparative Advantage against its partner.
It is expected that the bigger a country (or group) in terms of GDP, the more industries with RCA it has. The analysis confirms this expectation.
Figure 9. shows quite constant number of industries in which EU had RCA against Bosnia. It dropped slightly from 202 in 2000 to 187 in 2011. On the other hand, Bosnia’s number of industries with RCAs against the EU rose from 56 to 77 during the same period. This shows a constant development of Bosnia’s industry, assuming that production capabilities of the European Union do not change so fast.
A different trend can be observed in Poland – Bosnia case. Poland’s number of industries with a RCA against Bosnia grew from 96 in 2000, to 162 in 2011. In the same time, Bosnia’s numbers dropped from 42 to 28, respectively. This would suggest a faster development of industry in Poland, then in Bosnia.
Table 8. Number of product groups with Revealed Comparative Advantage
RCA type 2000 2001 2002 2003 2004 2005 2006 2007 2008 2009 2010 2011
PL against B&H 96 118 106 115 143 155 159 146 153 159 135 162
B&H against PL 42 38 38 49 34 25 19 23 25 28 41 28
EU against B&H 202 208 201 203 199 198 193 191 189 185 185 187
B&H against EU 56 49 55 55 57 59 63 67 72 78 72 77
Source: Own calculations
Source: Own calculations

REDETE – ECONOMIC DEVELOPMENT AND ENTEREPRENEURSHIP IN TRANSITION ECONOMIES
393
Factor endowment
In order to investigate factor endowments in traded products there had to be done a division of industries, as reported by SITC, to groups corresponding with the production factors. As mentioned before, in this paper the following grouping of products versus production factors is used:
- Raw material-intensive goods [SITC 0, 2-26, 3-35, 4, 56]
- Labour-intensive goods [SITC 26, (6-62, 67, 68), (8-87, 88)]
- Capital-intensive goods [SITC 1, 35, 53, 55, 62, 67, 68, 78]
- Easily imitable, research-oriented goods [ SITC 51, 52, 54, 58, 59, 75, 76]
- Difficultly imitable, research-oriented goods [ SITC 57, 7-( 75, 76, 78), 87, 88].
The first three categories do not require any explanation. Easy and difficultly imitable –
research oriented goods are categories corresponding to human capital. Coming to the analyse, Bosnia’s trade with Poland shows great changes in goods traded, as
they are grouped by production factors. In Bosnia’s export there must be reported an enormous rise in volume and share of “raw material intensive” goods, especially of the aforementioned section “281 – Iron ore and concentrates”. In years 2005-2006 the raw materials accounted for as much as 83% of Bosnia’s export to Poland, appointing for the “land” as definitely most important factor of export production. Then its share dropped and in 2011 it was 52% of total export. There was also a rising volume and share of “easy imitable, research oriented” products, to 22% of total export in 2011. Those figures do not match with Bosnia’s export to the European Union, with dominant and rapidly rising volume of “labour – intensive” products (44% share in 2011), which appoints for “labour” as the main export production factor. Then come “raw materials” (19%), “capital intensive” goods (16%) and “difficultly imitable” products of 15% (in export to Poland – just 3%).
Bosnia’s import from Poland also has a very unstable character. Especially big changes could be seen in case of “raw materials” and “capital-intensive” goods. In the peak (2001), the first of the two had a share of 57% of all imports from Poland. The peak for the “capital – intensive goods” was in 2005, when it reached the level of 43%. Over the analysed period there can be seen a constant growth of “difficultly imitable, research based” items, with 30% share in 2011. Together with “labour-intensive goods” (32%) it was the main product group imported from Poland, presenting not clear image of the factor endowment.
On the other hand, Bosnia’s import from the European Union presents quite stable structure over time. The most important factor seemed to be “labour”, as “labour-intensive goods” accounted for 30% of total trade in 2000 and 27% in 2011. “Capital-intensive goods” were also well-represented, with its share rising from 20% (2000) to 23% (2011). The least important factor in Bosnia’s import from the EU seemed to be “easy-imitable, research oriented” goods, with its share of 13% in 2011.
The biggest difference between the factor endowment trade structure of Bosnia and Herzegovina with Poland and with the European Union could be seen in Bosnia’s export. The analysis shows, that Bosnia exports to Poland mostly raw materials, whereas to the EU – labour-intensive goods. Most unexpected results come however if we look at Bosnia’s import from the EU. It appoints labour as the main European export production factor, with technology at the very bottom.

REDETE – ECONOMIC DEVELOPMENT AND ENTEREPRENEURSHIP IN TRANSITION ECONOMIES
394
Table 9. Factor endowment in B&H – PL and B&H – EU trade, 2000 and 2011 (mln EUR)
Products by factor endowment
B&H export to PL
B&H import from PL
B&H export to EU
B&H import from EU
2000 2011 2000 2011 2000 2011 2000 2011
Raw material intensive Value 1.8 20.0 12,6 19,5 149.6 459.3 411.4 653.5
Share 41% 52% 41% 18% 24% 19% 22% 19%
Labour intensive Value 0.9 3.8 13,3 34,6 262.7 1060.8 546.6 960.0
Share 20% 10% 43% 32% 42% 44% 30% 27%
Capital intensive Value 0.0 5.3 2,0 19,4 165.8 394.7 370.0 812.8
Share 2% 14% 6% 18% 27% 16% 20% 23%
Easy imitable, research oriented
Value 0.1 8.3 0,6 3,3 9.6 117.5 177.8 438.8
Share 2% 22% 2% 3% 2% 5% 10% 13%
Difficultly imitable, research oriented
Value 1.6 1.0 2,3 32,4 31.4 361.3 339.9 643.5
Share 35% 3% 7% 30% 5% 15% 18% 18%
Source: Own calculations

REDETE – ECONOMIC DEVELOPMENT AND ENTEREPRENEURSHIP IN TRANSITION ECONOMIES
395
Source: Own calculations Source: Own calculations
Source: Own calculations Source: Own calculations
Intra-industry trade
As mentioned in the theoretical part of the paper, a rising share of an intra-industry trade in the total trade between two countries (or group of countries) would suggest two things. Firstly, it would say that the traditional trade explanations (comparative advantage and factor endowment) lose on their meaning in that case. Secondly, that parties are getting more and more rich (with “richness” measured by GDP per capita) and more similar (by the same measure).
In the period between 2000 and 2011 the share of the IIT in Bosnia – EU trade has constantly risen, from 20% to 37%. Assuming that the European Union economy does not change very rapidly, it can be said that the rise in the share of the IIT is a consequence of the rise in Bosnia’s GDP per capita, which got closer to the EU-avarage.
A totally different situation could be seen in case of the trade of Bosnia and Herzegovina and Poland. Firstly, the share of the IIT in the total trade was much smaller, ranging from just 2% in 2005 to 14% in 2007. The fluctuations do not show any particular trend, which is characteristic for trade between two developing economies. Taking into consideration the first and the last record (2000 and 2011), the share of the IIT in total trade rose by just 2 percentage points, from 6% to 8%, presenting very low level and not a big improvement over time.
Table 10. Intra-industry trade share in total trade
2000 2001 2002 2003 2004 2005 2006 2007 2008 2009 2010 2011
B&H - EU 0,20 0,22 0,21 0,23 0,26 0,27 0,30 0,36 0,37 0,36 0,36 0,37
B&H - PL 0,06 0,09 0,05 0,05 0,03 0,02 0,07 0,14 0,11 0,13 0,16 0,08
Source: Own calculations

REDETE – ECONOMIC DEVELOPMENT AND ENTEREPRENEURSHIP IN TRANSITION ECONOMIES
396
Source: Own calculations
Concluding remarks
The beginning of 1990s was both for Bosnia and Herzegovina and for Poland the time to start independent, market-driven reforms of economy. The ways of both countries were not easy and differed a lot one from another. However, there has been a common goal of leaving the past problems in the past, developing their economies and integrating with the European Union.
Being in half of the above mentioned ways, both countries could be in 2011 still described as “developing economies”, with quite large distance to the EU-average in terms of GDP per capita. This determined their patterns of trade. As analysed in the previous part of the paper, the intra-industry share of total trade between Bosnia and Poland was in 2011 only 8%, which means 92% of their trade was inter-industry, characteristic for developing economies. The benchmarked trade of Bosnia with the European Union showed 37% of the IIT, with a constantly growing tendency over the last decade.
In terms of factor endowment, the structures of the Poland’s trade does not correspond totally with the structure of the EU’s trade with Bosnia and Herzegovina. In case of Bosnia’s export to Poland, it was the SITC category “281 – Iron ore and concentrates” that dominated with 33% share and made “raw materials” the main export group (52% share). In case of Bosnia’s export to the EU, it were “labour-intensive goods” that accounted for 44% of trade, making “labour” the most important export production factor. Interesting thing is that the same factor dominated Bosnia’s import from the EU.
The analysis of the Revealed Comparative Advantage showed that the number of industries with the bilateral RCA in case of Bosnia and the European Union is levelling over time. The Union, as a much bigger entity used to have a much higher number of industries with RCA, namely 202 in the year 2000. This number dropped to 187 in 2011, which corresponded with analogical rise in number of Bosnia’s industries with RCAs against the EU - from 56 to 77. In case of Bosnia’s trade with Poland the trend was reverse – Poland gained comparative advantage in additional industries, apart from having more of them even in the year 2000.
Looking at particular product groups being traded, it seems that Bosnia’s export is much more concentrated than import, which concerns both Poland and the European Union. The analysis of the Herfindahl-Hirschman Index over the last decade shows that the trade is getting more diverse

REDETE – ECONOMIC DEVELOPMENT AND ENTEREPRENEURSHIP IN TRANSITION ECONOMIES
397
in all cases apart from Bosnia’s export to Poland. That flow does not seem to undergo any particular trend. One can associate it, again, with the SITC category “281 – Iron ore and concentrates” that dominated Bosnia’s export to Poland (33% in 2011). It was followed by “523 – Salts and peroxysalts, of inorganic acids and metals” (19%) and “684 – Aluminium” (11%). Poland’s export to Bosnia was much less concentrated and its main sections in 2011 were “791 – Railway vehicles (…)” (15%) and “821 – Furniture and parts thereof (…)” (8%).
In most general level it should be underlined that Poland was Bosnia’s seventh most important partner in the European Union in 2011, both for export and for import. The volumes of bilateral trade were fluctuating over the period of 2000 – 2011, with a general rising tendency. The trade balance was negative for Bosnia in all the period, except 2006. However, the export/ import ratio of Bosnia’s trade with Poland was much higher in the second part of the decade, than in the first, which could mean a tendency of getting the trade more balanced.
Reference list
1. Aturupane, C., Djankov, S., Hoekman, B., (1999). Horizontal and Vertical Intra-Industry Tra-de Between Eastern Europe and the European Union, Review of World Economics, 135(1): 62-81
2. Balassa, B. (1965). Trade liberalisation and “revealed” comparative advantage, The Manchester School of Economic and Social Studies 33: 92–123.
3. Balassa, B., (1966). Tariff Reductions and Trade in Manufactures among the Industrial Countries, American Economic Review, 56: 466-473
4. Balassa, B., (1979). Intra-Industry trade and the integration of developing countries in the World Economy, in H. Glersch (ed.), On the economics of intra-industry trade, 245–270. (Tubingen: J. C. B. Mohr.)
5. Balassa, B., (1986). Intra-industry specialisation, European Economic Review, Vol. 30: 27–42 6. Balassa, B., Bauwens L., (1987). Intra-lndustry Specialisation in a Multi-Country and Multi-
Industry Framework, Economic Journal, 97: 923-939 7. Batra A., Khan Z., (2005). Revealed comparative advantage: an analysis for India and China,
Indian Council for Research on International Trade Relations, Working Paper No. 168, August 2005
8. Bergstrand, J. H., (1990). The Heckscher–Ohlin–Samuelson Model, the Linder Hypothesis and the Determinants of Bilateral Intra-Industry Trade, Economic Journal, 100(403): 1216–1229.
9. Botric, V., (2012). Intra-industry Trade between the European Union and Western Balkans: A Close-up, EIZ Working Papers, Zagreb
10. Brodzicki T. (2009). Product Variety and The Export Pattern of Poland 1999 – 2006, Analizy i Opracowania KEIE UG, nr 3/2009 (002), Oct. 2009
11. Brülhart M., (2008). An Account of Global Intra-industry Trade, 1962-2006, The University of Nothingham, Research Paper 2008/08
12. Brülhart, M., Elliott R. J. R., (1998). Adjustment to the European Single Market: Inferences from Intra-Industry Trade Patterns, Journal of Economic Studies, 25: 225-247.
13. Cieslik A., (2006). International trade under monopolistic competition: Evidence from Polish bilateral trade data, European Trade Study Group, Papers 2006
14. Czarny E., Lang G.,(2002). Accession Poland’s to the EU: Some Lessons from International Trade Theory, Bank i Kredyt, vol. 33 (2002) / nr. 2., pp. 20 – 30.
15. Debaere P., (2005). Monopolistic competition and trade, revisited: testing the model without testing for gravity, Journal of International Economics, 66 (2005),p. 249 – 266.
16. Davis D.R.,(1995). Intra-industry trade: A Heckscher-Ohlin-Ricardo approach, Journal of International Economics 39 (1995) 201-226

REDETE – ECONOMIC DEVELOPMENT AND ENTEREPRENEURSHIP IN TRANSITION ECONOMIES
398
17. Dornbusch R., Fischer S., Samuelson P., (1977). Comparative Advantage, Trade and Payments in a Ricardian Model with a Continuum of Goods, American Economic Review, 67, 823–839.
18. Globerman, S., Dean J., (1990). Recent Trends in Intra-Industry Trade and their Implications for Future Trade Liberalisation, Review of World Economics, 1990, Volume 126, Number 1, Pages 25-49
19. Greenaway, D., (1987). Intra-Industry Trade, Intra-Firm Trade and European Integration. Journal of Common Market Studies, 26(2): 153-172.
20. Greenaway, D., Hine R. C., (1991). Intra-Industry Specialisation, Trade Expansion and Adjustment in the European Economic Space, Journal of Common Market Studies, 29(6): 603-622.
21. Greenaway, D., Hine R. C., Milner, C., (1995). Vertical and Horizontal Intra-Industry Trade: A Cross Industry Analysis for the United Kingdom, The Economic Journal, Vol. 105, No. 433 (Nov., 1995), pp. 1505-1518
22. Greenaway D., Milner C. (1983). On the Measurement of Intra-Industry Trade, The Economic Journal, Vol. 93, pp. 900-908.
23. Grimwade, N., (2000). International Trade: New Patterns of Trade, Production and Investment, 2nd ed., (London: Routledge).
24. Grubel H, Lloyd P.(1971). The Empirical Measurement of Intra-Industry Trade, The Economic Record, Vol. 47, pp. 494-517.
25. Grubel, H., Lloyd P. J., (1975). Intra Industry Trade: The Theory and Measurement of International Trade with Differentiated Products, (London: Macmillan)
26. Haberler, G., (1936). Theory of International Trade, translated from the German 1933, edition by A. Stonier and F. Benham, London: William Hodge and Co.
27. Helpman, E. Krugman P., (1987). Market Structure and Foreign Trade: Increasing Returns, Imperfect Competition, and the International Economy. Boston: MIT Press.
28. Hummels, D., Levinshon, J., (1995). Monopolistic Competition and International Trade: Reconsidering the Evidence, Quarterley Journal of Economics, 110(3): 799-836.
29. Hummels, D., Ishii, J.,Yi, K., (2001). The nature and growth of vertical specialisation in world trade, Journal of International Economics, Vol. 54, No. 1.
30. Kandogan Y., (2003). Intra-Industry Trade of Transition Countries: Trends and Determinants, The William Davidson Working Paper Number 556, May 2003
31. Krause L., (1987). The Structure of Trade in Manufactured Goods in the East and the Southeast Asian Region, [in:] Bradford C., Branson W. (ed.), Trade and Structural Change in Pacific Asia, University of Chicago Press
32. Laaser C.-F., Schrader K, Heid B., (2008). Trade Integration in an Enlarged European Union – Poland’s Road to Success?, Warsaw School of Economic, World Economy Research Institute, Working Paper No. 286, Warsaw 2008
33. Leamer, E. E. (1984). Sources of International Comparative Advantage: Theory and Evidence. Cambridge, Mass.: MIT Press
34. Linder, S. B., (1961), An Essay On Trade And Transformation, New York: John Willey&Sons 35. Madras, D., Nikas,C., (2008a). Economic Integration and Intra-industry Trade Between the
European Community and the Western Balkan Countries, South East European Issues, (2008) 15: 511-523
36. Madras, D., Nikas,C., (2008b). European Integration, Intra-industry Trade in Vertically Differentiated Products and the Balkan Countries, International Advanced Economic Research (2008) 14: 355-368
37. Maric Z., (2011). Intra-industry trade and economic development (case of Bosnia and Herzegovina), Tranzicija / Transition, Journal of economic and politics of Transition, 2011, Br. 27
38. Mercan, M., Yergin, H., (2012). Analysis of Intra-Industry Trade Between Turkey – Bosnia and Herzegovina and Alternative Index, International Journal of Business and Social Science, Vol.3, No. 1., Jan 2012

REDETE – ECONOMIC DEVELOPMENT AND ENTEREPRENEURSHIP IN TRANSITION ECONOMIES
399
39. Misala J., Plucinski E.M., (2000). Handel wewnatrzgaleziowy miedzy Polska a Unia Europejska, Dom Wydawniczy Elipsa, Warszawa, 2000
40. Molendowski E., (2006). Intra-Industry Trade of Poland and CEFTA Countries and EU Members in Period of Preparation to the EU Membership, [in:] Transformation Process in Poland and Ukraine, edited by J. Teczke, Cracow University of Economics – Kyiv National University of Trade and Economics, Cracow 2006.
41. Molendowski E., (2007a). Intra-Industry Trade between CEFTA Countries and EU Members – Main Tendencies in 1992-2003, EMERGO – Journal of Transforming Economies and Societies, Vol. 12, No 1 (2007)
42. Molendowski E., (2007b). Liberalizacja wymiany handlowej krajów Europy Środkowowschodniej w okresie transformacji ze szczególnym uwzględnieniem doświadczeń krajów CEFTA, Wydawnictwo Uniwersytetu Ekonomicznego w Krakowie, Krakow, 2007
43. OECD, (2002). Intra-Industry and Intra-Firm Trade and the Internationalisation of Production. Economic Outlook No. 71, Chapter 6: 159-170.
44. Ricardo D., (1817). On The Principles of Political Economy and Taxation, John Murray, London
45. Sen A., Saray M.O., Karagoz M., (2009). Intra-Industry Trade between Turkey and OECD Countries: A Panel Data Analysis, Zagreb International Review of Economics & Business, Vol. 12, No. 2, pp. 77-90, 2009
46. Shiozawa Y., (2007). A New Construction of Ricardian Trade Theory—A Many-country, Many-commodity Case with Intermediate Goods and Choice of Production Techniques, Evol. Inst. Econ. Rev. 3(2): 141–187 (2007)
47. Utkulu U., Symen D.,(2004). Revealed Comparative Advantage and Competitiveness: Evidence from Turkey vis-à-vis the EU/15, European Trade Study Group 6th Annual Conference, ETSG 2004, Nottingham, September 2004
48. Verdoorn, P.J., (1960). Intra-block trade of benelux. In: Robinson, E.A. (Ed.), Economic Consequences of the Size of Nations. Macmillan, London
49. Viner J., (1937). Studies in the Theory of International Trade, London: George Allen & Unwin.
50. Yilmaz B., (2003). Turkey’s competitiveness in the European Union: A comparison with five candidate countries – Bulgaria, The Czech Republic, Hungary, Poland, Romania – and the EU15, Ezoneplus Working Paper No. 12, Feb. 2003.
51. Widodo T., (2009). Comparative advantage: theory, empirical measures and case studies, Review of Economic and Business Studies, Alexandru Ioan Cuza University, No. 4, 2009, p. 57-82.
Internet
1. http://www.wto.org/english/res_e/reser_e/cadv_e.htm (accessed: 20.07.2012) 2. Cernosa S., Moczulski M., Intra-Industry Trade Inside European Union: The Case of Poland
and Slovenia. http://www.bibliotekacyfrowa.pl/dlibra/docmetadata?id=35530&from=publication (accessed: 13.08.2012)

REDETE – ECONOMIC DEVELOPMENT AND ENTEREPRENEURSHIP IN TRANSITION ECONOMIES
400
COMPARATIVE ANALYSIS OF PRESENT MARKETING STRATEGY: DAVID VS. GOLIATH
IN CONFECTIONERY INDUSTRY
Tamara JOVANOV MARJANOVA178
Abstract
SMEs and large corporations differ in many ways: size by number of employees, finance, management style, organizational structure, target market, marketing strategy… Yet, one thing is in common – the general importance for the national and global economy, expressed in the summed number of employees, share of GDP, etc. This paper provides insight into existing marketing strategies in national SMEs and large companies from the confectionery industry in Republic of Macedonia. Due to the fact that national companies have lost the battle for market share – one of the few ways for making more profit on the highly fragmented and mature market, the main pragmatic objective of the paper includes the social dimension of the useful-ness of the results, presented through detection of the key factors that determine this unfavorab-le situation and application of the most effective elements that affect the improvement of the competitive market position. The scientific aim of the paper is to offer unbiased, complete and systematic scientific description of the addressed subject of marketing, i.e. marketing strategy, as a crucial step in the process of conceiving and developing a competitive position on the market, especially for SMEs. The research is based on data gathered with both secondary and primary research. With the secondary research data were gathered from relevant trade, busine-ss, and government sources, as well as company literature and corporate annual reports. Pri-mary research entailed personally distributed structured questionnaires to a 38% of the registe-red companies in the industry and follow up consultation through telephone interview and electronic questionnaires sent via e-mail, as well as on-site examination of the retail environ-ment. Data were processed and analysed with IMB SPSS software. The details from the resear-ch reveal the main mistakes of SMEs in the process of marketing strategy creation, and a sur-prising fact about the poor strategy planning in the largest national companies. The research indicates serious weaknesses in the segmentation – targeting – positioning (STP) process, as well as in the creation and calculation with the 4P instrument of the marketing mix, especially regarding product portfolio and product characteristics, pricing and communication i.e. promotion of the product. The paper presents suggestions for improvement based on relevant literature and best practices.
Keywords: marketing strategy, SMEs, STP process, marketing mix.
178 Faculty of Economics – Shtip, University “Goce Delcev” – Shtip, Republic of Macedonia, [email protected]
REDETE – ECONOMIC DEVELOPMENT AND ENTEREPRENEURSHIP IN TRANSITION ECONOMIES
401
Introduction
SMEs and large businesses are different in many aspects. The first and main difference stems from the generally accepted definition of the size of the enterprise, where an enterprise with over 250 employees belongs to large enterprises. Furthermore, differences arise from: 1. the area of activity, 2. the market and the number of consumers (a small enterprise operates in the local market, without a dominant position which results in a smaller consumer base, while a large enterprise operates on a greater area / market and a bigger number of consumers); 3. ownership, i.e. management (the owner in the small enterprise is in charge of decision making, and is also the manager which can be the cause of a number of errors in the managing of the company. However, in a large enterprise there are governing bodies that do not allow development of management of only one person). In fact, small enterprises have special features in the process of management that differ from large enterprises. Business and marketing strategy of a small enterprise may arise from the personal structure of the management of the small enterprise and result in two alternative types of strategic behavior (OECD, 1993, pp.20-25): 1. Reactive behavior, when a business is short-term oriented toward solving internal problems and adapting to changes in the economic environment; 2. Proactive behavior, when a business wants growth, accepts risk, seeks new markets, embraces new technologies in order to become a leader.
Research Methodology
The basic hypothesis which is presented in the paper, related to marketing strategy, is that "The size of the company is directly related to the progressive use of marketing strategy", i.e. that on the Macedonian market the domestic large companies pay more attention to marketing strategy and its application when compared to small ones. The data for implementation of marketing strategy in the domestic enterprises was based on primary research of a target sample of 19 or 38% of registered enterprises of the confectionery industry, with the technique of a structured 5 degree Likert scale questionnaire for managers’ attitudes. Key points, i.e. claims arising from the questionnaire, result from the basic elements and activities that are included in a marketing strategy - segmentation, targeting and positioning in the market, as well as the 4 elements of the marketing mix - product, price, promotion and distribution (Graham J. Hooley et.al., 2008, pp.34-35). At the beginning the analysis provides a descriptive representation of enterprises according to their primary activity, size, profitability179, budget for marketing activities etc. A deeper understanding of the intensity of the implementation for each of the separate elements of a marketing strategy is provided by the analysis of the level of significance/frequency in usage in comparison with the market trend and benchmarking, i.e. best practices of leaders in the industry180.
179 Profitability or company profits in 2010, as mentioned in Section 1 of labor is measured on a subjective scale
of 11 degrees, that is, on a scale of 0-10, where: Disastrous – 0, Extremely bad – 1, Very bad – 2, Bad - 3, Mostly Bad - 4, Neither bad nor good – 5, Mostly good – 6, Good – 7, Very good – 8, Extremely good – 9, Absolutely remarkable - 10.
180 Conclusions on the extent of the application of an item are made on the basis of the arithmetic environments of the answers provided by the type of measurement scale - five - degrees Likert (interval) measurement scale, where the intensity of exercise on certain elements of the five degrees indicate the following: 1- never, 2-rarely, 3- occasionally/sometimes, 4-often, 5-always. To determine the significance of certain elements of the questionnaire the five degrees mean: 1-small, 2-small significance, 3-secondary importance, 4-important, 5-very important. For more info: Del Siegle, (2010), Neag School of Education – University of Connecticut, http://www.gifted.uconn.edu/siegle/research/Instrument%20Reliability%20and%20Validity/Likert.html (19.11.2011)

REDETE – ECONOMIC DEVELOPMENT AND ENTEREPRENEURSHIP IN TRANSITION ECONOMIES
402
Current state of art
Descriptive statistics shows that 13 or 68% of the companies included in the survey are micro, small and medium enterprises181 and the rest are large. Of these, 8 or 42% are of the area of pro-duction and their own stores for confectionery trade, and the remaining 3 (16%) in the area of tra-de in confectionery. Moreover, in 31.6% of the surveyed enterprises’ profit is moderately good, in 26.3% it is moderately bad, and from the made cross-tables it can be seen that the profitability of SMEs varies from poor to moderately good. From the presented we can see that the financial situation is poor, which often cannot allow the survival of an enterprise and even less reinvest-ment in the company, usually necessary for growth and development. One of the reasons for the reduced profitability, as pointed out by owners is the insufficient domestic and foreign demand for the products. In this context, it should be emphasized that they cannot just wait for the demand to happen, but have to plan and organize it well to introduce it to the market. In the market there are numerous examples of companies that have created a need, rather than to seek it182. In most enterprises - 42.1% or 8, the budget for marketing activities on a year basis, as a percentage of sales revenue, is less than 5% and only 5.3% or a company invests 25%, which indicates generally small investments in marketing by domestic enterprises, especially by small ones - 3 of 4 (75%) and large ones - 3 of 6 (50%). Small investments in marketing by large enterprises are an unexpected data, and on the other hand the fact that 4 of 7 (57%) medium enterprises invest 10% or more of sales revenue annually, comes as a surprise. Compared with the market leaders that apply aggressive marketing activities, budgets of domestic enterprises can be characterized as meager and inadequate for following the practices of leaders, which further exacerbates the situation of many domestic enterprises, especially if we take into account that the confectionery market is fragmented and highly differentiated, with rapid changes in products and technology.
The reliability of the test used to evaluate marketing strategy is good with a value of Cronbach alpha 0.862. From the analysis it can be seen that our domestic enterprises often, as a way of segmenting the market, use geographic segmentation with an average value of 4.53 and, occasionally, demographic (3.11) and psychographic (3.21) segmentation. There is a general tendency of market segmentation mainly on geographical and/or demographic basis while psychographic features are a less used base for market segmentation and market targeting, despite the fact that for the right choice of the primary target market it is necessary to know the values and lifestyle which condition the behavior of consumers when buying. In this regard, the most limited are micro and small enterprises1838 of which 67% (4 of 6) always segment markets on the basis of geographical features, the same percentage sometimes uses demographic segmentation, and a small number (one company) rarely and sometimes – psychographics segmentation. Medium-sized enterprises 57% (4 of 7) always use geographic segmentation, 43% - sometimes segment the market based on consumer demographic characteristics and 57% sometimes apply psychographics segmentation. As for large enterprises 67% often segment the market on a geogra-phic basis, 33% often use demographic characteristics and the same percentage never uses them, and 50% often use psychographic characteristics to segment the market.
As for target markets of domestic enterprises in geographic terms, Macedonia is pointed out as the most important market (domestic market) with an average value of 4.74, then the Balkans as of medium significance (3.58), EU is regarded as weakly significant – of medium significance (2.53), while others - North America (1.58) and Australia (1.63) are ranked as insignificant - weakly significant, and Asia is pointed out as a totally insignificant market. According to size, micro, small and medium enterprises pointed to the domestic market as the most significant, and in a smaller number they pointed to the Balkans, while more large
181 Cumulative percentage for the three categories of enterprises according to size. 182 Cumulative percentage for the three categories of enterprises according to size. 183 Cumulative percentages of responses to the owners of micro and small enterprises.

REDETE – ECONOMIC DEVELOPMENT AND ENTEREPRENEURSHIP IN TRANSITION ECONOMIES
403
enterprises, in addition to domestic and regional market, emphasize the EU market as being of secondary significance. It is certain that according to manufacturing and servicing capabilities in the market, there is a logical flow in the choice of the geographical region that will be ser-ved by the surveyed enterprises.
The analysis of the confectionery market situation shows that the fastest growing and most attractive two market segments are market products from chocolate and flour products (Euromonitor, 2010 and 2011). In that direction, to see the range of products available to our companies, a survey of the categories of products that are included in the range is made and it is determined that 58% of companies always contain chocolate in its range, 63% always produce/sell flour products, 42% always include sugar products and 26% always produce and/or sell chewing gum, so it can be said that in terms of production/ sales inventory, domestic manufacturers follow the trend in the market, that is, for the most part they always produce flour and chocolate products. According to size, statistical analysis showed that 67% (4 of 6) of the micro and small enterprises184 always produce chocolate products, 28% (2 of 7) of medium-sized enterprises said that they always and often have chocolate products in their range of products, 83% (5 of 6) of large enterprises on the other hand said that they always produce chocolate products. 67% (4 of 6) of micro and small, 57% (4 of 7) of medium and 67% (4 of 6) of large companies always produce flour products. Insignificant is the percentage of 16.7% (1 of 6) of micro and small enterprises that produce sugar products, 43% (3 of 7) of medium-sized enterprises and 67% (4 of 6) of the large ones always have sugar products. 16.7% of micro and small enterprises always include chewing gum in their range, 29%of the middle-sized and 33% of the large enterprises responded that their range always includes chewing gum185. From the cross-examination by product categories according to the size of enterprises, a deviation from trend can be observed in the fastest growing chocolate market, whereas with the micro, small and medium enterprises the flour products have the advantage, rather than chocolate, and also in medium-sized enterprises more prevalent are the less requested sugar products at the expense of chocolate products. Major carriers producing chocolate and sugar products are large enterprises.
In terms of price, the main point of the analyses was to define the way that companies determine it, i.e., the method that is commonly used to determine the final cost of the product. Namely, it was determined that the largest percentage (74% always and 21% often) of companies use the method "cost plus income", based on the total cost which the company has to produce a certain product; to that value is then added a certain percentage mark-up, usually defined as the industry standard level. In a smaller percentage the "competitive prices" met-hod is used (32% always and 21% often) under which prior to the decision, the competition prices are observed first, with the final cost of the product that can be on the same level as the competition, higher or lower than the competition.
The method "value for consumers" that allows the final price to be formed according to the opinion of the consumer based on the conjoint analysis186 is least applied (21% always and 21% often). According to the size of the enterprises, it can be said that all micro and small enterprises always apply the method of "cost plus", and only a small part of those 16.7% (1 of 6) always use the other two methods. Out of medium-sized enterprises, 71% always and 21% often apply the method of "cost plus", while 43% of them always compare prices with those of the competition,
184 Cumulative percentage for micro and small enterprises 185 Percentage accounted the response of the companies that perform commerce, in addition to the production of
confectionary products. 186 Conjoint analysis means measuring and comparing the price in terms of other characteristics of the product,
which describe the characteristics of the product from which consumers choose the preferred characteristics and based on that it leads to the optimal price, and experimentation fits in test-marketing, where the product is offered in different stores, in a different price, in areas where consumers with similar characteristics live, with the same promotional campaigns, ceteris paribus, a then sales are monitored.

REDETE – ECONOMIC DEVELOPMENT AND ENTEREPRENEURSHIP IN TRANSITION ECONOMIES
404
and only 14% always take into consideration the opinion of the consumer in determining the final price. Large enterprises equally apply all three methods of determining prices (33.3% always and 33.3% often). From this data it can be seen that our companies prefer product pricing based on costs and keep an eye on the rate of profit that they want to accomplish, as well as comparing the price with the competitive prices which results in setting the price at a lower level or the level of the competitors, but never higher than the competitive price. As for the growth in demand for an economic category of products as a market trend, our companies generally offer products at an affordable price, but the cost is usually low at the expense of product quality, which in turn makes them uncompetitive on the market. Additional pressure on our companies occurs when we take into account the forecast for future growth in demand of quality products that fall into a higher price category, as well as the fact that the market leaders are manufacturers/products that are better in quality than the national ones, and in a higher price category than the domestic. On the other hand, by applying the method of "consumer value" a price higher than predicted can be achieved due to the positive perceptions of consumers themselves about the characteris-tics/attributes of a particular product (Tamara J. M., 2009, pp.162-164), and at the same time, a significant correlation is established between the use of this method and profitability of enterprises.
The trend in the distribution as an element of the marketing mix and part of a marketing strategy has been moving in the same direction for a long period of time - a constant need of intensive distribution of confectionery products, with preference and common choice of major super and hypermarkets and discount stores as a place to perform everyday purchases, mostly due to the wider sales range that allows for saving time and often lower prices compared to the small colonial stores. The analysis shows that 100% (6 of 6) of the large, 71% (5 of 7) of the medium and only 16.7% (1 of 6) of micro and small enterprises always use the channel of "zero" level, i.e. its own retail as a method of distribution, while 31% (2 of 7) of the medium, 67% (4 of 6) of the micro and small enterprises never place products without any mediator in the channel. One level channel, i.e. placing products on the market through wholesale is used always by 33.3% (2 of 6) and frequently - 16.7% (1 of 6) of large enterprises, 43% (3 of 7) - always and 14% (17) - often by medium-sized enterprises, and 67% (4 of 6) - always small and micro enterprises. Through retailers 33.3% and 16.7% of large enterprises always - often place their products, 43% of medium-sized enterprises always and 14% often, 16.7% of micro enterprises - always, while 16.7% of small enterprises do that sometimes and / or rarely use a two-level distribution channel. In terms of the method of distribution that our companies choose, we can say that for the most part, i.e. 63% of the surveyed enterprises always place products through their own retail network, 47% always use the services of wholesales, and 32% always sell products through retailers, which is contrary to the trend of purchasing in discount stores and supermarkets which consumers dictate, and to the distribution strategy of leaders who place products mainly through networks of retailers.
In evaluating the type of distribution that enterprises apply the data obtained is that 50% (3 of 6) of the large, 43% (3 of 7) of the medium and 16.7% (1 of 6) of the micro and small enterprises fully agree that their type of distribution is exclusive - through their own retail outlets, while 16.7% (1 of 6) of the large, 57% (4 of 7) of the medium and 33.3% (2 of 6) of the micro and small enterprises do not agree that they practice exclusive distribution. Selective distribution is applied by 67% (4 of the 6) of the micro and small enterprises (50% completely agree and 17% agree) and 43% (4 of the 7) of the medium (14% fully agree and 29% agree), while only 16.7% (1 of 6) of large enterprises agree that their type of distribution is selective. On the other hand, 50% (3 of 6) of the large enterprises do not agree completely that they apply the selective distribution type. Intensive distribution is applied by 33% (2 of 6) of large (completely agree), 28% of medium-sized enterprises (14% completely agree and 14% agree) and 16.7% (1 of 6) of micro and small ones, and 50% of large enterprises do not agree completely, 28% of medium ones and 50% of micro and small enterprises. Generally, the type of distribution that is applied by most enterprises (especially micro, small and medium) is the selective distribution with 42% (21% completely

REDETE – ECONOMIC DEVELOPMENT AND ENTEREPRENEURSHIP IN TRANSITION ECONOMIES
405
agree and 21% agree). Exclusive distribution is medium present with 37% of those who comple-tely agree, and the least present (especially in micro and small enterprises) is the intensive type of distribution with 26.5% (15.9% - fully agree and 10.6% - agree). This situation is again inversely proportional with the trend and best practices which for this type of products are in favor of intensive distribution, because of easier access for consumers and better visibility of the products.
As part of marketing strategy which domestic enterprises apply, promotional strategy is also analyzed. Descriptive statistics through arithmetic means and/or frequencies for the most commonly used elements argues that (4.58) or 84% always use sales promotion and (3.37) or 37% always spend money for economic propaganda. Additionally, the preferred medium of promotion is the traditional medium of mass communication - television (3.58) or 52% always used television for transmitting promotional messages. For a detailed insight into the elements of promotion most commonly used by SMEs, cross-tables were designed for each of the elements of promotion and media used individually by size of the enterprises. Namely, based on the results it can be noted that economic propaganda is always (5) used by 67% (4 of 6) of the large and 43% (3 of 7) of medium enterprises, by 33% (2 of 6) of the micro and small businesses - sometimes (3), and only 16.7% (1 of 6) of micro and small enterprises - very often (4). Sales promotion is always used by 83% of large, of all surveyed businesses, and the majority (67%) of small and micro enterprises. What is distinctive in this part is that a sales promotion is often aimed at distributors or retailers within the so-called push strategy, i.e. pushing products to the final consumer by stimulating merchants to secure better positions in retail facilities or promoting products of the manufacturer187. Direct marketing (promotion through mail, email, social media, etc.) is not used by as much as 75% of medium-sized enterprises, and 50% of small and micro enterprises. This type of promotion is always used by 33% of large enterprises, 50% of them apply it sometimes. Surprising is the result that says that none of the micro and small enterprises do not use public relations and publicity as a meaningful way of communicating with customers and the general public, while this situation improves in medium-sized enterprises of which 57% said they often use this form of promotion, and 50% of large companies always use it. Research shows that companies, regardless of size, essentially act in the same or similar way in terms of the promotional strategy, that is, most of them are coming on the market with the same elements of the promotional mix, or a combination of the two promotional items - economic propaganda and sales promotion, while others are rarely used. This way of entering the market reduces the differentiation in their working from competitive one and reduces the chance to be noticed by consumers. SMEs need to pay more attention to the selection of specific elements of promotion in terms of choice of those which mean lower costs and long-term results in building the identity of the enterprise on the market. Economic propaganda, significantly used by SMEs, is the element that carries the most expenses and is also the most risky to use, keeping in mind that if the message is not with an adjusted content in terms of target audience and not streamed through the appropriate medium and in an appropriate time period, it may be completely ineffective. In terms of choice of media, it can be said that the use of traditional mass media is still prevalent, mostly in favor of television as the preferred medium for placing promotional message to the final consumer. Namely, 67% (4 of 6) of large, 57% (4 of 7) of medium-sized enterprises and 33% of micro and small ones always use television as a medium. The use of radio as a medium of communication with consumers is significantly lower compared to television, or 57% of medium, 67% of micro and small enterprises that were surveyed said they do not use it, while 33% of large companies always use radio transmission of messages to customers. Also, as for the print media, there is a reduced intensity, i.e. micro and small enterprises stated that they did not use the press to transfer the message at all, while with the medium-sized enterprises the situation is slightly different, i.e. 43% of them rarely use it, and 14% use it often and always, while large enterprises
187 Internal data from the management of the enterprises.

REDETE – ECONOMIC DEVELOPMENT AND ENTEREPRENEURSHIP IN TRANSITION ECONOMIES
406
use it always with 33% and often with 16.7%. The data on the use of the Internet as a medium by businesses in the confectionery industry shows its significant usage by large (50% always) and medium (14% always and 43% sometimes) companies, and a less frequent use by small and micro enterprises (16.7% always and sometimes, 50% - never). After the survey, on SMEs, regardless of the target audience, it can be concluded that in their working they apply a highly selective and limited use of the available media for promotion, and they mostly advertise through traditional mass media, especially television. Although on the Macedonian market consumers are still mostly (77%) informed by television as a medium (Broadcasting Council of the Republic of Macedonia, 2009, pp.6-23), in the context of the fact that SMEs have limited financial resources and have a small budget for marketing activities, there is a danger that this medium, which is also one of the most expensive ones, can become inefficient and not meet the promotional purpose of the enterprises.
Conclusion
Based on the previously conducted analysis several deductions and suggestions can be made in relation to the challenges of SMEs operations:
- The budget for marketing activities of Macedonian companies is relatively small and limited primarily by poor financial results. Smallest are the investments in marketing of the micro and small enterprises, and unexpectedly, medium enterprises allocate more funds for marketing activities than large enterprises. Bearing in mind that in this industry the pace of marketing activities is dictated by the leaders and it is characterized by rapid changes and aggressive approach to the market, it is suggested that in their working SMEs cannot afford to bypass the marketing strategy, governed by the thesis that marketing activities are an expense, as opposed to the thesis that the cost of marketing is an investment;
- In terms of the range of products, they should continue to follow the trend and further production of flour and cocoa products, with cocoa products as favoring, as the potentially fastest growing market segment. They should avoid copying other market participants and introduce innovative and quality products in higher price categories, which will target younger consumer groups;
- In determining the final cost of the product, they should take into consideration the opinion of consumers, not just internal factors, such as cost of operation;
- In terms of distribution activities, they should take into account the fact that for these products easy availability is preferred, and that there is a need for intensive distribution, especially for products of large and/or medium-sized enterprises that can more easily provide entry into the retail, or possibly exclusive distribution, especially for products of micro and small enterprises, whose sales should be based on the quality and uniqueness of the product for a narrow group of consumers, for which it will be justified to make the extra effort at the time of purchase. Also, instead of selectively applying the strategy of pushing products along the marketing channel, parallel application of the pull strategy aimed at the final consumer should be applied;
- Our domestic enterprises still mostly use traditional and rigorous selective approach in creating promotional strategies, as well as in the selection of media to promote the company and products. Instead of choosing the traditional elements of promotion that have a short-term impact, such as sales promotion and advertising, they should be focused on

REDETE – ECONOMIC DEVELOPMENT AND ENTEREPRENEURSHIP IN TRANSITION ECONOMIES
407
entrepreneurial approach to promotion188 - guerrilla marketing189, so-called Buzz marketi-ng, and viral (virus) marketing or organizing events, creating viral commercials, propagan-da from "mouth to mouth" etc., which directly involve the consumer and the general public in their transfer and in long-term are changing and building the company's identity in the minds of consumers. In terms of media, the choice should not only be made on the basis of their ratings (ratings, circulation, etc.) and the assumption of the watching of that media content by the consumers, but they should mainly keep an eye on the target consumers of the company in terms of their demographic, geographic and psychographic features, i.e. on the probability that the selected media will reach them, which can be found out through market research. They should also get involved in spreading the message and new media such as the Internet (social networks), and not just traditional mass media, which can greatly reduce the cost of promotion, and, at the same time, reach exactly the target consumers, i.e. the target audience;
- Within the marketing strategy equal attention should be given to all the elements that it covers - product, price, distribution and promotion, and enterprises should not selectively pay more attention and resources to just one or a few elements, such as product and/or price.
- The development of marketing strategy is vital for any business and without strategy; each company's efforts to attract customers are likely to be random and inefficient. To achieve long-term and loyal customers, the consumer should always be in the focus of the company, regardless of its size. The only way to create a market-oriented enterprise is planned combination and calculating the elements of the marketing mix from the perspective of the target consumer.
188These techniques strive for low cost, and highly influential marketing activities that allow small companies
and/or individuals to act as large companies. It is an attempt to achieve broad results with atypical low utilization of resources acting as a guerrilla. The goal is the message recipient to have exercised empathy, which will stimulate further distribution.
189Guerrilla marketing is designed to be surprisingly effective, rebellious, infectious, even spectacular, and it transcends conventional perceptions and leads to the so-called "Wow factor".

REDETE – ECONOMIC DEVELOPMENT AND ENTEREPRENEURSHIP IN TRANSITION ECONOMIES
408
Reference list
3. Broadcasting Council of the Republic of Macedonia, (2009), “Program preferences of TV and radio audience: Investigation of the audience 2009“, pp. 6-23
4. Country Report, (Nov. 2011), „Packaged Food in Macedonia“, http://www.euromonitor.com/packaged-food-in-macedonia/report (10.05.2012)
5. Country Report, (November 2010), „Chocolate Confectionery in Macedonia“, http://www.euromonitor.com/chocolate-confectionery-in-macedonia/report (16.06.2011)
6. Country Report, (November 2010), „Chocolate Confectionery in Macedonia“, http://www.euromonitor.com/chocolate-confectionery-in-macedonia/report (16.06.2011)
7. Country Report, (November 2010), „Sugar Confectionery in Macedonia“,http://www.euromonitor.com/sugar-confectionery-in-macedonia/report (16.06.2011)
8. Country Report, (November 2011), „Biscuits in Macedonia“, http://www.euromonitor.com/biscuits-in-macedonia/report (16.06.2011)
9. Country Report, (November 2011), „Gum in Macedonia“,http://www.euromonitor.com/gum-in-macedonia/report (16.06.2011)
10. Del Siegle, (2010), Neag School of Education – University of Connecticut, http://www.gifted.uconn.edu/siegle/research/Instrument%20Reliability%20and%20Validity/Likert.html (19.11.2011)
11. Graham J. Hooley, Nigel F. Piercy, Brigitte Nicoulaud, (2008), „Marketing Strategy and Competitive Positioning“, 4th ed., Pearson Education Limited, pp.34-35
12. Organization for Economic Co-operation and Development (OECD), (1993), “Small and Medium-Sized Enterprises: Technology and Competitiveness”, Paris, pp.20-25
13. Tamara J. Marjanova, (2009), Master thesis “Research of the chocolate market for better com-petitive positioning of Ltd. “Evropa” Skopje”, USCM, Faculty of Economy Skopje, pages 162-164

REDETE – ECONOMIC DEVELOPMENT AND ENTEREPRENEURSHIP IN TRANSITION ECONOMIES
409
APPLICABILITY OF THE PORTER’S VALUE CHAIN TO THE SERVICE SECTOR:
EXAMPLE OF THE BANKING SECTOR
Dana KORUGA190 Dragana DOŠENOVIĆ191
Abstract
Drawing upon the theory of competitive strategy, this study attempts to ‘reinvent’ Porter’s v-alue chain, a popular tool for diagnosing an organisation’s sustainable competitive advantage. Even though the concept was developed in the 1980s (Porter, 1985) it is highly relevant in the business environment of the 21st century. The key rationale underpinning the value chain frame-work are organisation’s activities linked together to develop the value of the business. By a sys-tematic analysis of these activities it is possible to see where the value is created, thus maximisi-ng value creation and minimising the costs of the firm. While much is known (from both theory and practice) regarding how the value chain framework works for the manufacturing sector where individual business activities are often clearly separated (Feller et al., 2006, p. 5), ma-nagers struggle to see its applicability in the service sector. Apart from a few attempts (Gereffi and Fernandez-Stark, 2010; Elisante, G., n.d.; Ming, 2002) by individual scholars, this still re-mains a moot point amongst researchers. Existing literature provides little guidance regarding how the concept could be reconstructed and adapted to the service sector where individual fir-ms endlessly seek for conceptual tools of that kind.
Against this backdrop the following research question was put forward: Is Porter’s analyti-cal framework applicable in the service sector and if it is, how does its shape look like? More specifically the ultimate aim of this research is to analyse the applicability of the Value Chain concept within the banking industry, precisely in the banking sector of Bosnia and Herzegovina. This led the research problem to another two important questions: What are the key determina-nts of the banks’ competitive strategy to secure better position in the volatile market place? Can, and to what extent, the logic of the value chain framework improve the banks’ sustainable competitive strategy? By the case study approach and interviewing the employees of one bank, the answer on the question of where in the overall business, the value is created.
Keywords: Value chain framework, business activities, service sector, banking sector, transi-tional countries, creating value, competitive advantage.
190 University of Banja Luka, Faculty of Economics, email: [email protected] 191 Postgraduate student at University of Banja Luka, Faculty of Economics, email:[email protected]

REDETE – ECONOMIC DEVELOPMENT AND ENTEREPRENEURSHIP IN TRANSITION ECONOMIES
410
Introduction
In the eighties of the last century, American professor from Harvard, Michael Porter brought in the theory of strategic management the value chain concept (Porter, 1985). It was created in order to allow companies to locate the source of competitive advantage. The entire business is broken down into nine strategic activities. This analytical approach enables companies not to analyze their business as a whole, but have individually access to every activity that make up the business. Finding places or activities in a company where value is created, pointing out their associated costs and benefits, and enable enterprises to reach the targeted profit level. Managers in the company have opportunity for strategic and entrepreneurial approach to each business activity and can make a choice or combination of choices between the cost advantages strategy and differentiation strategy (Porter, 1985). Porter's value chain is cited by many authors dealing with the theory of management and marketing. This concept is highly relevant today as before, mostly because of increasing competition in all business areas, the business becoming complex in terms of internationalization and changes brought by the information technology development (Feller et al., 2006, p. 5). The problem is that the concept of the value chain is largely used to explain the business of manufacturing firms. That’s why the aim of this paper is to shape the value chain concept for service sector, more specifically, the banking sector. The service as a product is quite different from the physical tangible product. The specificity is reflected in the fact that services are delivered and consumed simultaneously, they can’t be stored and they are difficult to standardize. They are not tangible, not created from the material substance and that’s at least the one reason which primary activities in the generic value chain lead to a question. The question is how to define the inputs and outputs of the service production process (Elisante, n.d.; Milma and Hjalmarson, 2002, p. 12-13). The challenge of shaping the service value chain is even bigger considering that empirical frame is set in Bosnia and Herzegovina which represents the transition country. Therefore the banking sector of this country has its own peculiarities. While the sector experienced significant growth and profitability from late 1990s until 2008, it has now reached the maturity stage, and according to some indictors, some of the banks moved into the process of stagnation (Pavlevski, 2011). This led the banks in position to struggle for the competitive advantage in very difficult conditions. Therefore, trying to point out managerial options in banking industry, this research was based on using case study method and interview technique. The employees from different departments of the selected bank were interviewed and thus made it possible for marking the business activities and business flows crucial in bank. Based on this, the purpose is to create the form of banking value chain, as well as prove the fact that this tool is quite significant for use in managing and analyzing banking business activities. The mentioned analytical approach allows detecting of the points where value is created, costs should be reduced and differentiation strategy applied.
1. Review of Related Literature
Competitive Advantage and Porter’s Value Chain
Observing and analyzing business conditions in today's market, one can easily say that the best way to create success is to create a competitive advantage. The main reason for this is the fact that the business environment of each company is so changeable that the true happiness is existence in the market. Competitive advantage is defined in different ways, but the essence of all definitions is that competitive advantage can be compared with possession of a gun in the battle of knives. It can be said that a company has a competitive advantage if it has a base ability that allows better coping with market forces, which can help to achieve distinct advantages and favourable industry position in relation to other industry competitors and market participants. It means that companies

REDETE – ECONOMIC DEVELOPMENT AND ENTEREPRENEURSHIP IN TRANSITION ECONOMIES
411
possess a competitive advantage over their rivals when they sustain profits that exceed the average for their industries.
Michael E. Porter raised the issue of competitive advantage. He believes that there are two sources from which companies can create competitive advantage. The first source is a low cost, and the other is differentiation (Porter, 1985). Every company can achieve competitive advantage by delivering the same value to customers at lower cost than industry rivals or by providing greater value to customers with the industry average costs. After analysing these two sources of competitive advantage, each company comes to doubt about the choice of methods and strategies by which to create competitive advantage, and thus achieve its goals. Many tools are designed for companies to help them decide on the choice of a strategy, enabling the analysis of factors that affect the company operations the operations of the companies, along with their inputs and outputs. One of them is surely the value chain.
In the introductory paragraphs it was mentioned more about the creator of this concept, its historical development and purpose. The value chain can be defined most simply as a set of related activities carried out within one business unit.
Figure 1 The Generic Value Chain
(Source: Porter, 1985, p. 37)
As can be seen in the Figure 1, the value chain identifies nine strategic, relevant activities that
create value and costs in a business enterprise. These nine strategic activities are divided into primary and secondary activities. The primaries are related to the production process and its logistics: procurement of raw materials, production, marketing and sales, after-sales service. The secondary activities support the whole enterprise: infrastructure, information technology, human resources, procurement for the company. The second group of activities represent support for the first group, but it is not directly involved in the production and logistics. The primary activities are to be in the order in which the process runs: receiving and storing inputs, warehousing, inventory control; mashing, packaging, equipment maintenance, testing, printing; physically distributing, delivery vehicle operation, order processing, scheduling; advertising, promotion, sales force, channel selection, pricing; installation, repair, training, product adjustment (Porter, 1985, p. 40). The secondary include: purchasing all the other items needed in the firm; know-how, R&D;

REDETE – ECONOMIC DEVELOPMENT AND ENTEREPRENEURSHIP IN TRANSITION ECONOMIES
412
recruiting, hiring, training, development of personnel; number of activities related to management, accounting, planning, finance, government affairs, and quality management (ibid., p. 41-43).
This analytical approach to the business coverage allows for that the strengths and weaknesses in certain activities to be pointed out. It is known that a certain degree of strength or weakness of the company creates competitive advantage. Companies can use value chain to analyze the sources of competitive advantages that can be found in all primary and support activities. As previously mentioned here are two approaches - low costs approach or uniqueness approach, or two main strategies given by Porter - strategy of cost leadership and differentiation strategy (Porter, 1985). When it comes to strategy of cost leadership, a company pursuing a cost leadership strategy attempts to gain a competitive advantage primarily by reducing its economic costs below its industry competitors. There are different sources of cost advantage and they depend on the structure of the industry, so a company should find and exploit all these sources. A differentiation strategy implies the development of the product or service that offers unique attributes which are valued by customers and that is the way the company tries to be unique in its industry. The value that is added by uniqueness may allow a company to charge a premium price for it because buyers perceive selected product dimension as very valuable and important. No matter which of these strategies firms choose, the aim is the same – higher margin. By giving the highest value to their consumers and that is possible if generic activities are organised in effective way, the distance between income and expenses are larger which further leads to higher profit margins.
Analysis of company's resources and capabilities involves an interpretation in order to obtain an answer to the question of whether they contribute to the production and sale of products at lower costs than the competition, or they allow sales at higher prices and higher sales at the same price. This analysis comes down to identify the specific resources and capabilities as a driver of costs or uniqueness. Considering that resources and capabilities are changeable, with their transformation, companies create conditions for a new strategy and competitive advantage.
Finding places or activities in a company where value is created by pointing out their associated costs and benefits, enables enterprises to reach the targeted profit level. Managers in a company have an opportunity for strategic and entrepreneurial approach to each business activity and to make a choice or combination of choices between the cost advantages strategy and differentiation strategy (ibid., p. 20).
Characteristics of the Banking Business and the Banking Services
The service sector plays an important role in creating of the gross domestic product (GDP) of the economies of many countries. In highly developed countries it accounts for around 70% and in developed countries 50% of GDP (Lovelock et al., 2004, p. 6). In Bosnia and Herzegovina the service sector generates 64% of the gross domestic product (Janković, 2012).
The services represent the value exchange between the service provider and the service consumer. The exchange is intangible, is not accompanied by ownership, but can be accompanied by physical products or other objects that are physically visible. “A service is any act or performance one party can offer to another that is essentially intangible and does not result in the ownership of anything. Its production may or may not be tied to a physical product” (Kotler and Keller, 2012, p. 356). According to international classification of services there are the following classes: Advertising and Business, Insurance and Financial, Building Construction and Repair, Telecommunications, Transportation and Storage, Treatment of Materials, Education and Entertainment, Computer and Scientific, Hotels and Restaurants, Medical, Beauty & Agricultural, Personal (North Carolina Trademarks Registry). This paper is about financial services, more specifically, the banking services and the skills of managing them in order to create and deliver maximum value.
The banking services have the same characteristics as all other services: intangibility, simultaneity of production and consumption, variability and perishability of output (Sasser et al.,

REDETE – ECONOMIC DEVELOPMENT AND ENTEREPRENEURSHIP IN TRANSITION ECONOMIES
413
1978 cited in Lovelock et al., 2004, p. 15). Specifically, unlike the pure physical product that has its dimensions, appearance, taste, odour, colour and packaging, services are basically intangible. In that way, assigning tangible features to services represents the biggest challenge for managers. Indivisibility implies simultaneity of production and consumption. The production, delivery and consumption take place at the same time purporting the simultaneous interaction between employee, automat and consumer. As can be noticed this process does not consist of successive phases of production and logistics - procurement of raw materials, production processes, storage and delivery of finished products, sales and marketing and, finally, the product consumption. The variability is reflected in the inability to standardize the process of providing and consuming the service. Its quality depends on many factors and circumstances, such as the knowledge and kindness of person who delivers the service, the knowledge and personality of person who receives the service, as well as on time and place where the value exchange goes on. That is the reason why in the process of reaching the highest quality, one of the most important challenges in managing the services, is to get them standardized. As it is said, “Whereas physical goods are manufactured, then inventoried, then distributed, and later consumed, services are typically produced and consumed simultaneously” (Kotler and Keller, 2012, p. 359). They can’t be stored. If one of the parties missed the exchange period, both processes, production and delivery of services would not have happened. In accordance with all the above mentioned features of services, there is another one left - the lack of ownership. There is no physical substance to which one could take property such as apartment, a car, a piece of clothing and so on. Certainly, the service may have a bundled document as evidence of its own occurrence which may provide some rights to the client, but the main thing that stays in the memory of the consumers are their experience and the degree of satisfaction after the consumption. In addition to everything that applies to all services, the banking services are determined by mutual trust of both sides in trade process. In this specific topic, the object of exchange is money and when it comes to the money management, people tend to make decisions based exclusively on trust.
Banking is a part of financial services which fall into a category of increasingly developing services. The main role of a bank is to collect and invest money, pay fees and interest for this activity, as well as charge for same. In other words, a bank connects customers that have capital deficits to customers with capital surpluses (Types of banks, Wikipedia). That is, simply put a main role of a bank.
Banking business which resembles the most the way we bank today dates from the 14th century. Today there are different types of banks. Considering their market, the main division of banks could be made to commercial and investment banks; however, there is still a more detailed division to: retail banks, private banks, corporate banks, business banks, investment banks, combination of these types and other (ibid.). The development of information technology has greatly changed the role of a bank, so today we can speak of exclusively virtual banks, those whose business is entirely based on web relations. Even if we focus on simple commercial banks, the development of technology introduced them to a different spectrum of services, influenced the brand change, given them different methods of communication and other.
As already previously mentioned, banking services have the same characteristics as other services, with banking service being based on money, which adds insecurity and caution from consumers, and creates additional effort to the bank in terms of brand creation, which, along with the direction of quality, accuracy, flexibility, has to go in a direction of gaining trust and security. Also, intangibility of the banking service is followed by tangible appearing forms such as a contract or some other form of an order which, actually, represents a proof of a business agreement or transaction. There are services which assume a duration (Vasiljev, 2005, p. 389), or maturity, in terms of credits, deposits or some other type of service. That which is a characteristic for most banking services is that they happen promptly, in other words, there exists a simultaneous production, delivery and consumption, by way of communication between the front office and service user, or between an ATM and other internet communications, as well as media for delivering banking services and users. The business transaction between a bank and a user

REDETE – ECONOMIC DEVELOPMENT AND ENTEREPRENEURSHIP IN TRANSITION ECONOMIES
414
comes down to money transfer (cash, non-cash, wire transfer), based on different services: savings, loans, payments, investment activities and other. As already mentioned, for money management services banks charge interest and fees. A conventional method of service delivery is through tellers, or by participation of the front office. In addition, it is possible to join the use of banking services via internet-by way of electronic banking, mobile banking, as well as through ATMs. Banks have at their disposal, as well as the other types of organizations, different forms of communication and promotion: advertising, sales in person, public relations, sponsorships, sales improvement.
So that a bank or its employees could operate transactions or provide services, it is necessary for them to be equipped with hardware and software and connected. Namely, there are numerous banking programs, or bases used by certain banks to record a service or transaction, i.e. a payment, a charge, or any change. Also, in addition to good quality software, it is important that employees have an inter-connected communication and system, since that makes them more efficient in providing services and correction of any irregularities and obstacles, which may happen in a particular moment of delivery of the service.
Additional characteristics of the banking sector and banking business, whether the business is of an international character or connected to a particular national region, are that banks represent big and complex systems with many employees. Banks are, mainly, organized in accordance with divisional and matrix organizational form characterized by a deep hierarchical level. In that sense, it is important for a banking organization that its organizational structure is in the function of value delivery to the consumer,i.e. that all organizational units are connected by a common goal, which is customer satisfaction. That is what really represents a motto of all organizations wishing to accomplish positive business effects in the market (Schuller, 1988, p. 59). Poor organizational structure leads to poor connectivity of the parts of an organization, and then the role division is inefficient as well, and time efficiency, no success in the exchange of ideas, slow decision making etc. (Corkindale, 2011). In a situation like that, both managers and employees cannot perform their jobs adequately because it will, inevitably, be slow and inefficient to delegate and conduct job tasks, as well as long waiting periods for approvals of particular jobs or an actions, and, as a final result, again, there is a poor quality and standard of delivery of the supply towards the consumer.
Applicability of the Value Chain Concept in the Service and Banking Sectors
Although the value chain concept is cited by many authors, generally the scholarly research is not much involved in applying this concept to the business activity in the services sector. In the field of marketing this concept is seen as a “tool for identifying ways to create more customer value” (Kotler and Keller, 2012, p. 34). The essential thing for creating and delivering the highest value to customers is to do the proper value selection inside the firm and thus, by mapping and analyzing of nine strategic activities which constitute the value chain. Theorists in the field of management are more focused on strategic abilities to diagnose (Johnson et al., 2006, p. 297), and on competitive advantage through the issue of where costs can be reduced and differentiation created (Thompson, 2001, p. 349). According to mentioned authors the main role of the value chain is improving the strategic position of organization. The explanations of the concept are usually based on case studies of the manufacturing companies, which represent the original purpose of the value chain, as Professor Porter said himself (Elisante, no year).
When it comes to the services sector, here are several assertions and examples of how the authors see the role of the concept in this area. Examining how value is added in the stream of activities involved in providing m-commerce (the commerce via mobile) to the consumer, Barnes (2002, p. 91) uses the m-commercial value chain as platform for future strategic analysis of the industry. He emphasizes the significance of the technology in the adding value process because it

REDETE – ECONOMIC DEVELOPMENT AND ENTEREPRENEURSHIP IN TRANSITION ECONOMIES
415
is constantly affected by new waves of inventions. Also, in the bank services domain, there are recommendations diverting bank's attention to take into account the development of information technology, which brings new competitive members on the market (Wright, 2001, p. 71). Because of that, the priority is a reconfiguration of their value chains in order to survive in the new competitive landscape. Besides the increase of the commoditization of banking products and services, there are new types of banks on the market, such as internet or virtual banks. By the reconfiguration of the value chain, Wright recommends new business strategies such as outsourcing internet technology functions, forming alliances with technology providers and so on. Both Barns and Wright consider their observations on the network value chain and the supply chain, not specifically on the value chain of the m-commerce provider and the bank. In addition, there are several examples of the value chain adjustment for companies that do business on an international level faced with outsourcing and offshoring of business activities (Gereffi and Fernandez-Stark, 2010). Also, the case which proves that successful business internationalization might be based on logic of this concept (Ming, 2002). The group of authors emphasize the meaning of the front office in service sector, pointing out the fact of interdependence between value delivered to customer and the value of workers productivity. “Value is created by satisfied, loyal, and productive employees”. (Hesket, et al., 1994, p. 164). The higher value delivered to customer implies the satisfied customer which further leads to the higher profit.
A concrete form or shape of the service value chain applicable to service sector was given by Professor Elisente who constructed the value chain for higher education (Elisente, n.d.) and, in addition, a few authors that formed the banking industry value chain. Elisante’s expressed doubts about generic value chain’s applicability in service sector. In order to confirm the fact about non-applicability of this concept in service sector, mentioned author contacted even Professor Porter. Example of his value chain is shown in Figure 2.
Figure 2 The Value Chain (for HE sector)
(Source: Elisante, 2006, p. 11)
Pointing out the fact that the economy changed from the period of the generic value formation and that there is no operational inbound and outbound in service sector, Elisante pointed the changes out in features of the primary and secondary activities or services, as he named them.
Also, an interesting example of the banking value chain is offered by a consulting firm from United States of America - Lion's Share. Because of the intellectual property rights and inability of transferring the figure, the banking value chain can be viewed on its web address. It is noted in

REDETE – ECONOMIC DEVELOPMENT AND ENTEREPRENEURSHIP IN TRANSITION ECONOMIES
416
the figure that the support activities stay same as in generic value chain, but the primary activities are mapped in accordance with banking business characteristics. The main difference is in the existence of the field “External Factors” which represents the sources of money inflow, and the filed “Revenue Streams” (instead of “Distribution Channels”), which represents the services and product as a base of generating revenue. The second example of the banking value chain is the generic banking value chain created by the group of authors (Lammers et al., n.d., p. 6). The form of chain is showed in Figure 3.
Figure 3 The Generic Banking Chain
(Source: Lammers et al., no year, p. 6)
Considering the figure, it might be noted the same with Lion’s value chain – the supportive or
secondary activities are the same as Porter’s value chain, but the primary activities are quite different. The basis for fundraising and creating the money portfolio are grouped in the field “Products”, but the pure process of cash flow movement such as payment, trading and others can be found in the field “Transactions”. However, the opinion of this group of authors is that the value chain concept is better capable to analyze activities with regard to sourcing decisions than other strategic techniques (ibid.).
2. Empirical Research
Banking Sector in Bosnia and Herzegovina
The empirical frame of this study is located in Bosnia and Herzegovina. Bosnia and Herzego-vina is a country in transition. The banking sector has been built up from scratch after the civil war in the early 1990s. By implementing a common currency of Bosnia and Herzegovina in 1997, inducting the euro, establishing of Banja Luka Stock Exchange and Sarajevo Stock Exchange, the financial sector has become more stable and this has created favourable conditions for the foreign capital entry. Since 2000 foreign banks have actively entered this market mostly by taking over the local banks. The foreign banks origin is mainly from Austria and Italy (Magel, 2005). Besides the mentioned chronological events, the population and the economy needed the money and investments, which implies the inflow of foreign capital as a logical sequence of the events. Today in Bosnia and Herzegovina operates 29 banks, of which 19 in the Federation of Bosnia and Herzegovina, and 10 in Republic of Srpska (Central Bank of Bosnia and Herzegovina). The competition between the banks is very high. The market of banking services has been experien-

REDETE – ECONOMIC DEVELOPMENT AND ENTEREPRENEURSHIP IN TRANSITION ECONOMIES
417
cing saturation. The population of this country reach the top of its ability to use most of the ban-king services. This situation was significantly caused by the global financial crisis that had begun 2008. Therefore, from the beginning of 2010, the competition within this industry has markedly increased and banks have problems with distinguishing between their market positions (Smaji-lović, 2011, p. 486). In such circumstances, it is difficult for the banks to maintain and retain certain competitive positions and achieve greater value for customers and greater margins.
Research Methodology
After discussing the literature that defines the concept and essence of the value chain, as well as its possible practical applications, for further clarification of the research problem, a field research has been done.
The research question: Is Porter’s analytical framework applicable in the service sector and if it is, how does its shape look like? The purpose of this study is to confirm the possible applicability of the generic value chain to the banking business by finding its possible shape. The primary task was establishing the primary and secondary activities in the banking business as well as their associated costs and benefits, and thus with the purpose to give the answer on the following question: Can, and to what extent, the logic of the value chain framework improve the banks’ sustainable competitive strategy?
In this study the method of inquiry was used and conducted through the interview technique. The interview consists of 10 groups of questions. The all interviewed employees have been asked all 10 groups of questions. Each group of questions has a purpose to bring to light one of the value chain fields. For example, if we want to know more about “Human Resources” field, the related group of questions consists of questions such as: “How clearly did your recruiter explain the details of the job to you? How knowledgeable you are about the company's goals? Have you previously carried out similar or different tasks? Did you have any training for improving your skills or capabilities? If you did, how often it was held? Does anyone evaluate your knowledge? If does, could you describe that process?”. The sample was biased which means that interviewed employees were chosen by considering the department in which they work and their position in the hierarchy. The interviewed group includes the following sectors/employees: Director, Human Resources, The Commercial Division (Sector for Sales and Marketing, Branches), Risk Control Sector, Information Technology Sector, Sector of Internal Control, Department of Procurement and Administration, Sector for Legal Representation.
The bank in which the research is conducted is a bank with 220 employees, 33 branches and counters in 30 cities in Bosnia and Herzegovina with head office in Bosnia and Herzegovina. The ownership structure makes foreign capital. The interview included 26 employees or 10% of total respondents. The interviewing process was done during four working days.
Empirical Results
The obtained data were analyzed by descriptive method. By processing and analyzing the responses of interviewed employees, a picture was taken of how the current business processes flow in the bank. Mapping the flows enables the creation of the banking value chain as well as constructing its new shape. According to that, some new fields of activities appear. The main changes happened in the primary activities segment. The created new banking value chain is shown in the Figure 4.
As can be viewed, the supportive or secondary activities are pretty similar to those in the generic value chain. What is different from the original value chain is that there are two additional groups of secondary activities – the financial management group and the legal affairs group. Accounting, auditing, planning and analyzing, reporting, provide a numerical breakdown (or

REDETE – ECONOMIC DEVELOPMENT AND ENTEREPRENEURSHIP IN TRANSITION ECONOMIES
418
intersection) of business result. The outputs of mentioned activities are the financial reports and information which represent the basis for further decisions making. There is the importance of inducting the “Financial management” filed. The banking accounts for one of delicate business activities, based on trust. Flows of confidence are concerning the two segments of relations – the relation between the bank and its customers and the relation between the bank and its employees. For properly maintaining the mentioned relations, the bank's operations should always be in accordance with the law, which makes the legal matters a very important group of activities of the secondary segment of the value chain.
Figure 4 The Banking Value Chain based on research conducted in one bank in Bosnia and Herzegovina
According to everything that has already been said about the services features, the banking
business, as well as other services businesses, doesn’t imply the existence of “classical” production process. Therefore, it is hard to specify the inputs, and it's much harder to separate the process of procurement of supplies used for the entire bank, from the procurement of direct inputs intended for “production process”. The groups of items, which are commonly specified by employees as inputs needed to perform the job, are: tangible items (salaries, fuel, paper, office supplies and other necessities), overhead items (water, electricity, telephone, internet), their own time and the time of their colleagues, knowledge, hardware, software (Microsoft Office Outlook, the banking system, tools and applications), the use of an automobile fleet; These items are purchased at the level of the entire bank, which means they do not belong to the segment of the primary activities.
The money represents the „pure” input. The reports and information are pointed out as well as inputs, but they are outlined by dashed lines with the arrows in two directions. This means that they represent the items needed in the same time for secondary and for primary activities. The self made statements, reports and documentation from other business units, and other internal information (invoices, purchase requirements, the decision proposal for preferential tariffs amount, deposits balance, loans balance, other information about customers user behaviour, balance sheets of legal entities, the financial statements, the result of sales, information from supervisors and others. Most of these items represent the inputs for the secondary segment of the value chain, but the reports and documents such as the decision proposal for preferential tariffs amount, balance sheets of legal entities, deposits balance, loans balance, and other information about customer behaviour can be specified as the primary business processes input. This information directly affects the decisions about conditions under which the services are offered.

REDETE – ECONOMIC DEVELOPMENT AND ENTEREPRENEURSHIP IN TRANSITION ECONOMIES
419
The external information and reports (information from Reuters regarding the movement of interest rates, the media, professional journals, statistics, websites, analysis of the field, reports of the Banking Agencies, reports of Deposit Insurance Agency of Bosnia and Herzegovina, reports from The Central Bank, accounting standards, the requirements of the clients, the legal changes and others) mainly belong to the secondary segment of the value chain.
Now, it is necessary to explain this line – financial market, back office, outputs. The sources of the “pure” input – money are the financial market and the banking services themselves. The sou-rce of money for a bank represent its own services, such as savings, repayment of loans, investment banking services, trade and emission of securities, as well as dealer operations that are key to a successful liquidity of a bank. That is the reason why between back office and outputs stays two arrows with both directions. Inputs for creating outputs come from left side, but also, in the direction form right to left outputs provide inputs for other kind of outputs (services). Also, the role of “Back office” filed is very interesting. This group of activities represent sort of connection or transition from secondary activities to primary activities. They are representing the filter for inputs. The employees that work on this group of activities don’t have direct contact with consumers, but they are building the platform so that could have happened. Dealer operations are the operations that are performed with the aim of maintaining the liquidity of the bank, and they include the following: futures and currency exchange operations, interbank deposits, the determination of passive and a-vista interest rates, trading of derivatives, the proposals for exchange transactions tariffs, managing the nostro and loro accounts etc. Operational activities include: preparation of error reporting, the cancellation of the orders, account control, control of illogical balances, treasury operations, support of the payment processes, deposit transactions, conduct activities which are related to letters of credit and guarantees, support the loans system, as well as payment card system, bookkeeping, bank statements and salaries, SWIFT transacttions, penalty interest accounting, regulating the interest payments in advance and others. Loans processes include: regulation of internal legal documents, approving loans to the branches up to certain limits, blockade of accounts, sending cease and deceased orders, coordination with the debt collection agency, collecting documentation for pressing charges against clients and more. Considering all these activities and tasks, it is obvious how important the roll of back office is. It has a really significant impact on outputs, especially trough cooperation with front office. This cooperation is very important and very delicate because it represents a spot in a bank where secondary and primary activities collide. From the aspect of creating value with the lowest possible cost it is very significant for the relation between front and back office to be working fluently.
Further, through the sales channels bank delivers created outputs. The outputs are divided into three groups of banking products (services): products for retail, products for legal entities and investment banking products. The channels of distribution, as outlined, include: branches and counters, ATMs, cards, mobile phones, call centre and the internet (e-banking). The distribution channels represent, at the same time, the channels of promotion because they deal simultaneously with delivering and allow providing information about current offers, services, terms of favourable conditions, promotional actions and other information.
Marketing has an integrational role in the value chain, as well as in bank’s whole operations. Its role is to gather market information, internal information and to pass information to stakeholders (employees, consumers, and business partners, public). By gathering internal information and information about the market, marketing is in a position to design services in a way consumers want, but also in accordance with bank’s internal resources and capabilities.
After the banking chain is constructed and explained, it is possible for a bank to implement the mentioned Porter’s strategy – the strategy of differentiation and the strategy of lower costs. Also, by analyzing the whole business applying this strategic tool, every bank has an opportunity to mark the spots and places of creating values, as well as the places where some problems exist or where it is possible to apply different approach to execution of tasks. The bank that participates in this research was given the recommendations about some activities and internal relationships, but

REDETE – ECONOMIC DEVELOPMENT AND ENTEREPRENEURSHIP IN TRANSITION ECONOMIES
420
also commended on the good ways of conducting business. The recommendations and praises are not listed here in order to protect the integrity of the bank that has conceded premises and employees for this study. Also, this is the reason the name of the bank is not indicated.
Conclusion
As a conclusion of this study, a fact is drawn that the Porter’s value chain can be applicable to service business, but not in its original form. Some adjustments have to be done, especially in domain of primary activities. That is natural because of the features of services which imply special relations between production processes, delivery processes and consumption. As opposite to manufacturing, the mentioned processes and phases happen at the same time. Besides that, the banking services are not tangible and the essence of their existence is money, which all together gives additional reason for complexity when it comes to defining the primary activities of the value chain.
Even though this research is dealing with a relatively old strategic model, it has proved that an analytical approach to business is always useful. Even if the physical shape of the generic value chain does not match the banking business, the essence of this concept is applicable to the banking business. After all, there is no obstacle for additional shaping of the chain if its core logic contributes to better business.
The empirical frame is set in a country in transition and in a sector in which there exists a high degree of competitiveness, but regardless of the geographical framework and specific banking industry climate, this research has yielded a useful base for creating banking chains that will certainly vary from bank to bank. This variation may be generated by different types of banks, their size, geographical location and geographical spread of business which is partially demonstrated by the examples of banking value chain previously listed in the study. The adaptation of the frame is not impossible and useless as long as the business activities and processes are well known by creators of the new value chain. In any case, considering different types of business and/or different business locations, analytical approach and mapping the business activities make the quality platform for strategic decision making.
References
1. Barnes, J., S. (2002) The mobile commerce value chain: analysis and future developments, International Journal of Information Management, vol. 22, no. 2, April, pp. 91–108.
2. Corkindale, G. (2011) The Importance of Organizational Design and Structure, Harvard Business Review, Retrieved from: http://blogs.hbr.org/corkindale/2011/02/the_importance_of_organization.html (02/02/2012).
3. Central Bank of Bosnia and Herzegovina, Banks in Bosnia and Herzegovina, Retrieved from: http://www.cbbh.ba/index.php?id=7&lang=en (05/05/2012).
4. Daft, L., R. (2006) The New Era of Management, International Edition: Thomson South-Western.
5. Elisante, G. (no year available) Value chain for services – A new dimension of Porter's Value Chain, Retrieved from: http://www.docstoc.com/docs/3638198/Value-Chain-for-Services-A-new-dimension-of-Porter-s (30/12/2011).
6. Feller, A., Shunk, D. and Callarman, T. (2006) Value Chains versus Supply Chains, BPTrends, Retrieved from: http://www.ceibs.edu/knowledge/papers/images/20060317/2847.pdf (26/01/2012).

REDETE – ECONOMIC DEVELOPMENT AND ENTEREPRENEURSHIP IN TRANSITION ECONOMIES
421
7. Gereffi, G. and K., Fernandez-Stark (2010) The Offshore Services Global Value Chain, Centre on Globalization, Governance & Competitiveness, Duke University, Retrieved from: http://www.cggc.duke.edu/pdfs/CGGC-CORFO_The_Offshore_Services_Global_Value_Chain_March_1_2010.pdf (27/01/2012).
8. Heskett, J. L., T. O. Jones, G. W. Loveman, W. Earl Sasser, and L. A. Schlesinger. "Putting the Service-Profit Chain to Work", Harvard Business Review 72, no. 2 (March–April 1994): 164–174.
9. Janković, S. (2012) Marketing usluga, The University of Sinergija, Retrieved from: http://predmet.sinergija.edu.ba/pluginfile.php/794/mod_folder/content/1/VJE%C5%BDBE%20II.pdf?forcedownload=1 (02/05/2012)
10. Johnson, G., Scholes, K. and Whittington, R. (2006) Exploring Corporate Strategy, 7th edition, England: Prentice Hall, Financial Times.
11. Kahreh, M., S., Ahmadi, H. and Hashemi, A. (no year) Achieving competitive advantage through empowering employees: An empirical study, Retrieved from: http://www.fareastjournals.com/files/FEJPBV3N2P3.pdf (04/05/2012).
12. Kotler, P. and Keller, K., L. (2012) Marketing Management, 14th ed., New Jersey, Prentice Hall.
13. Kotler, P., Vong, V., Sonders, J. and Armstrong, G. (2007) Principles of Marketing, Beograd: Mate.
14. Lion’s Share, Banking Value Chain, Retrieved from: http://www.lionsshare.com/chart.html (03/03/2012).
15. Lovelock, C., Patterson, P. and Walker, R. (2004) Services Marketing – An Asia-Pacific and Australian perspective, 3rd ed., Pearson, Prentice Hall.
16. Magel, T. (2005) The Banking Sector of Bosnia and Herzegovina: The Dominant Role of Austrian Banks. Retrieved from: www.oenb.at/de/img/feei_2005_2_special_focus_4_tbanking_tcm14-33490.pdf (28/01/2012).
17. Milma, A., P. and Hjalmarsson, L. (2002) Measurements of Inputs and Outputs in the Banking Industry, Retrieved from: http://www.tanzanet.org/int/journal/tznetjournal_12_2002_measurement_of_inputs.pdf (04 /05/2012).
18. Ming, Chu Yee, (2002) Value chain strategies helping banks regionalise, Asian Banking and Finance. Retrieved from: http://www.synovate.com/businessconsulting/insights/whitepaper/docs (28/01/2012).
19. North Carolina Department of the Secretary of State, North Carolina Trademarks Registry – Services Classes, Retrieved from: http://www.secretary.state.nc.us/trademrk/pdf/ServiceClasses.pdf (06/06/2012).
20. Olla, P. and Patel, V., N. (2002) A value chain model for mobile data service providers, Telecommunications Policy, vol. 26, no. 9–10, October–November, pp. 551-571.
21. O'Sullivan, L. and Geringer, J.,M. (1993) Harnessing the power of your value chain, Long Range Planning, vol. 26, no. 2, April, pp. 59-68.
22. Pavlevski, A. (2011) Decreasing liquidity a risk to Balkan banks, economies, Southeast European Times, Skopje, Retrieved from: http://setimes.com/cocoon/setimes/xhtml/en_GB/features/setimes/features/2011/11/29/feature-04 (31/01/2012).
23. Peppard, J. and Rylander, A. (2006) From Value Chain to Value Network: Insights for Mobile Operators, European Management Journal, vol. 24, no. 2–3, April–June, pp. 128-141.
24. Porter, M. (1985) Competitive Advantage: Creating and Sustaining Superior Performance, New York: The Free Press (MacMillan).
25. Ruyter, de Ko, Wetzels, M., Lemmink, J. and Mattson, J. (1997) The dynamics of the service delivery process: A value-based approach, International Journal of Research in Marketing, vol. 14, no. 3, July, pp. 231–243.

REDETE – ECONOMIC DEVELOPMENT AND ENTEREPRENEURSHIP IN TRANSITION ECONOMIES
422
26. Schuller, R., S. (1988) A Case Study of the HR Department at Swiss Bank Corporation: Customerization for Organizational Effectiveness, Asia Pacific Journal of Human Resources November 1988 26: 59-76.
27. Schnurr, L. (2012) Businesses add jobs, service sector growth dips, Retrived from: http://www.reuters.com/article/2012/04/04/us-usa-economy-employment-adp-idUSBRE8330JL20120404 (04/05/2012).
28. Smajlović, E. (2011) Research Positioning Of Banks In Bosnia And Herzegovina Market, The Faculty of Economics, Tuzla, Retrieved from: http://www.icei.epk.ba/admin/dokumenti/7438%20ERMINA%20SMAJLOVIC.pdf (06/05/2012).
29. Stabell, C., B. and Fjeldstad, Ø., D., (1998) Configuring value for competitive advantage: on chains, shops, and networks, Journal of Management Studies, vol. 19, no. 5, May, pp. 413–437.
30. Thompson, L., J. (2001) Strategic Management: awareness and change, 4th edition, London: Thomson.
31. Vasiljev, S., (2005) Marketing principi, Novi Sad: Prometej. 32. Weill, L. (2003) Banking efficiency in transition economies, Economics of Transition, vol. 11,
no. 3, September, pp. 569–592. 33. Types of banks, Wikipedia, Retrieved from:
http://en.wikipedia.org/wiki/Bank#Types_of_banks (02/02/2012) 34. Wright, A. (2002) The changing competitive landscape of retail banking in the e-commerce
age, Thunderbird International Business Review, vol. 44, no. 1, January/February, pp. 71–84. 35. Yin, R. K. (1984) Case study research: Design and methods. Newbury Park, CA: Sage.

REDETE – ECONOMIC DEVELOPMENT AND ENTEREPRENEURSHIP IN TRANSITION ECONOMIES
423
BUSINESS ETHICS AND COMPANY PERFORMANCE
Zoran LUKIĆ192 Dragana DOŠENOVIĆ193
Abstract
Business entities were in different forms and under influence of various factors within di-fferent phases of their historical development. One of the main preconditions for successful bu-siness and unhindered development was institutionalized form of organization. One of business organizational forms which has solid basis for successfully operating business is Corporation and A joint-stock company within it. At the same time, within modern market economy, special attention is paid to large business forms, such as Holding and Corporation. Corporation, as a unique business form, represents basis for development of any economy. Functioning of corpo-rations is regulated by many normative acts, and we are specially processing segment of corpo-rate management. Corporate management represents complex managerial mechanism for ma-naging any business successfully. Corporate management is affected by significant number of factors. We want to emphasize the importance of business ethics on business performance. Non-material elements of management were neglected in earlier periods, such as influence with all sub-functions and organizational behaviour. With development of technology and productive-ness to their limits, some additional sources in work were discovered just in those new elements of business, where business ethics and social responsibility have prominent position.
Key expressions: joint-stock companies, big business systems, corporations, corporate go-vernance, non-material elements of management, business ethics, ethical principles, code of conduct.
192 University of Banja Luka, Faculty of Economics, Email: [email protected] 193 Postgraduate student at University of Banja Luka, Faculty of Economics, Email: [email protected]

REDETE – ECONOMIC DEVELOPMENT AND ENTEREPRENEURSHIP IN TRANSITION ECONOMIES
424
Introduction
A business entity operating is under the impact of large number of internal and external facto-rs. Some new fields rise from development of many disciplines, or the importance of some tra-ditional ones become evident for companies’ performance. In these times, ethics has even larger importance for business entities operating in contemporary conditions and especially in the period of global crisis that is connected to certain moral norms. Ethics implies adopting various ethical principles, i.e. moral norms in business world.
Therefore, codexes of business ethics are more applied, somewhere formally and somewhere essentially, which can be beneficial to the companies in the following: improvement in society reputation, improvement in risk and crisis management, improvement in communication with interests holders, development of corporative culture, putting accent on corporative values along with planned avoiding of conflicts within company as well as misunderstandings with business partners.
This work is aimed at examining and proving certain assertions related to codex of business ethics, therefore we marked main problem of research and it refers to examining impact of business ethics on business success in large business systems, i.e. corporations.
Considering defined problem of research which is economic as well as legal, the subject of research can be defined as field of economy, especially related to corporate governance, field of law related to legislations on economic bodies and their performance on capital markets as well as field of sociology, psychology and other sciences that research problems of ethics and moral.
Aims of research are complex as well and refer to presentation of basic notions on corporati-ons, corporate governance, business ethics as well as defining and revealing presence of causes and effects between business ethics and business success along with elaborating impact of bu-siness ethics upon business success. At the same time, we will examine and point out the current situation in Republic of Srpska related to corporate governance as well as to business ethics.
Starting point of our research refers to setting in which adopting and applying different principles of business ethics can influence positively business success of large business systems, ie. in this case corporations.
1. Emergence of modern corporation and corporate governance.
1.1 Emergence and concept of corporation.
Examining contemporary terms of business, it is easily noticeable that large business systems have enormous importance for economy of every country. Although the importance of today’s small and medium enterprises can not be denied,
it must be acknowledged that their success as well as survival is largely due to large companies without whom the business world would be inconceivable.
Reviewing large business systems around the world, we can come to the conclusion that the most frequent form of them is corporation. That is how it represents dominant organizational form in developed countries within market economy, in which there are those business systems which act as unique entities within business as well as proprietary sense.
Initial forms of corporate companies were established in 16th century in England and Spain, but we can say that modern corporations were established in mid-19th century, when some legal solutions were introduced within this domain in Great Britain. In 20th century, this form of organization becomes dominant in world economy and emerges in all spheres of business. That is how corporations, bringing themselves a large number of innovations (that reflects in ownership release from liability in relation to obligations of corporations, establishment and development of

REDETE – ECONOMIC DEVELOPMENT AND ENTEREPRENEURSHIP IN TRANSITION ECONOMIES
425
capital market along with detaching management from ownership), become subject of larger interest and intensive research.
This form of organization differs from others in its specific characteristics. That is how corpo-ration represents joint-stock company based upon its institutionalized structure and determination, which means that corporation researches and finds capital, necessary for its performance, through emitting and selling off stocks. In this way, principal (share) capital is acquired as well as some additional one, if there is a need for that. Second characteristic of corporation is that it represents unique entity in business and proprietary sense, i.e. makes complete business and organizational system that has a status of legal person. Legal person has its property, capital, trade and management bodies. One of the characteristics is that regardless of corporation size, it represents billing control unit against the society, therefore establishing business results and monitoring tax and other obligations is performed on corporate level only.
When internal organization is in question, we can say that large business systems, organized as corporations are more or less decentralized. Basic concept of internal organization is based upon profit decentralization. Corporations are composed of large number of business units of different type and level of autonomy in operating, being formed in different segments of performance that are mostly made of separate, complete, business and market units, such as business activities, lines of manufacturing, groups of products, manufacturing stages etc.
Business units formed on that base are profit centers, strategic business units, cost centers, investment and other centers.
Considering the fact that corporation is a unique system in business and proprietary sense, all the capital is in the possession of corporation and divided on shares owned by individual owners, which are named at company. Managing decisions related to capital and performance is made by managing bodies, formed on corporate level, and they are: shareholders’ meeting, administrative board and very often auditing committee.
Main players of corporate governance system are shareholders, i.e. owners of a corporation, managers along with professional head of corporation activities and corporation itself has to provide maximizing of three long-term economic benefits for shareholders, and those are: profit maximizing, dividend maximizing and maximizing of shares market value.
On the basis of above mentioned, we can conclude that distribution of corporations is caused by its various advantages, compared to other forms of organizing. Great advantage certainly is limited liability of its owners, who are accountable for only the range of shares value that they own. Within those shares value, owners bear the risk and are not personally responsible for corporation’s debt. Easy transfer of property is one of the advantages in this form of organizing and implies possibilities for the shares owner to sell them completely or partially when he wants to. Another advantage is possibility of collecting huge amount of financial means from various individuals, which enables undertaking important business ventures. By means of emission and selling of shares, powerful financial corporations are formed and they often have massive number of shareholders, given in millions.
1.2 Corporate governance
It can be said that there is no unique definition of corporate governance. International financial corporation defines it as ‘structure for leading and control of economic bodies’ 194 Although there are numerous definitions, depending on the institution, country or legal tradition, each one of them claims that corporate governance is essentially a system of relations, defined in structures and processes. These relations can encompass parties with different and sometimes opposite
194IFC – International Financial Corporation, Corporate governance, Guide book for companies in Bosnia and Herzegovina,
IFC Sarajevo, 2009.

REDETE – ECONOMIC DEVELOPMENT AND ENTEREPRENEURSHIP IN TRANSITION ECONOMIES
426
interests, which have to be carefully observed and kept in balance. To achieve that, it is necessary for all parties to participate in managing and controlling of society, in some way, which will lead towards proper distribution of rights and liabilities with the final outcome in enlarging long-term value for shareholders, i.e. corporation owners.
In the last few years, numerous regulations were brought, containing the best practices and pri-nciples of corporate governance; one of those very important principles are OECD principles which are focused upon the whole framework of business. They are developed to provide advices on proper management and are accepted worldwide. Principles were issued in 1999 and reviewed in 2004. Framework of corporate governance by OECD principles is based on four basic values: impartiality, obligation, transparency and liability. First value refers to protection of rights and equal treatment for all the shareholders, majority and minority shareholders as well as foreign ones. Obligation relates to acknowledgement of rights to all interest holders and encouraging of active cooperation between them and corporation itself. The third value implies timely and correct revealing of information on all for company important issues, whereas liability incorporates strategic directing of the company, efficient monitoring of administration by the board as well as responsibility of board towards the company and shareholders.
In order to provide control of corporation management and its effects along with managers’ work success, various mechanisms of corporate governance are created; they can be divided in two groups: internal and external mechanisms. Internal mechanisms refer to separation of management from ownership, which represents assumption for establishing this system of management, strategic planning, effective and timely reporting, professionalizing of manager’s position and bodies, defining standards (norms) of performance effects, measuring and valuing managers’ work success, creating reward system for managers, concentration of ownership, establishing administrative boards of shareholders, establishing and maintaining relations with internally influential groups, as well as issuing information and financial transparency. External mechanisms of corporate governance are: market for corporate management which disciplines managers and makes them use corporate resources effectively for the interest of their shareholders, legal infrastructure (well structured framework), protection of minority shareholders and competitiveness.
Corporate governance has its own two models: open model of corporate management and closed model of corporate management.195 Basic differences between those two models are in systems of allocation of socio-economic power, ways of marking the efficiency of managers’ performance and positions, i.e. relationship between managers and corporation owners. Open model of corporate management is also recognized as Anglo American, market or outsider’s. Capital market has got main monitoring role within it, and it conducts observing over corporation performance as well as control of effectiveness and successfulness in managers’ performance. Means for evaluating are growth or decrease of share prices, whereas shift of unsuccessful managers is not done by shareholders, as it is the case with closed model of corporate management. It is being done by opponents and other transferees through replacement of unsuccessful one with the new effective management, increasing profitability in that manner. Fear from takeover leads to managers using all available resources effectively and therefore increase the value of shares and corporation itself. In this model, managers are key players in corporation management; they have important role and therefore, decide upon important issues; they focus on their own benefits and welfare. Closed model of corporate management is also named internal (insiders), continental or continentally Japanese. Main characteristic of this model is high ownership concentration and along with that also dominant position of corporation shareholders. Shareholders are main conductors of monitoring and control of performance and successfulness in
195 Babić,M., Lukić, 3.; Management,Theories,Functions, Institutional Aspects and Corporate governance, Faculty of
Economy, Banja Luka, 2008.

REDETE – ECONOMIC DEVELOPMENT AND ENTEREPRENEURSHIP IN TRANSITION ECONOMIES
427
managers’ work. Successful managers are rewarded, and the ones, who are not successful, are punished and replaced; monitoring of their success is based upon internal and not external indicators, like with open model. Institutional investors are less important with this model, and business banks have important role, which are creditors and share owners at the same time.
Important characteristic of this model is detachment of auditing role, conducted by auditing board, and operative-administrative, done by top management.
2. Concept and importance of business ethics
2.1 Business ethics
To define meaning of business ethics, we have to first define term of ethics itself. This term originates from Greek word ethos, which means custom, habit, character, philosophy of moral. Ethics represents science on moral and its creator is Greek philosopher Socrates; ethics in its basis was philosophic discipline for him, which defines notions of human virtues such as: righteousness, bravery, humaneness, goodness and above all separates good from bad and true from lie. Ethics can be defined as philosophy of moral that researches meaning and aims of moral norms, main criteria for moral valuation as well as the science itself along with moral sources. Ethics belong to philosophy and deals with researching man’s natural behaviour, that helps him to express his customs, habits and moral in given time and space. That is how man depicts an image of himself, his character and moral to his interlocutor.
If work was defined as acting with goal or as a mission, and ethics, as a science that regulates and determines rules of human behaviour, therefore business ethics could be defined as applying and acknowledging of ethical principles in all business activities. Foundation of business ethics is behaviour in accordance with laws, which incorporates providing transparent information, fair approach towards competition, employees, shareholders, partners as well as focusing upon social responsibility and sustainable development. From the above mentioned, we can learn that business ethics is not present only in relations between a company and environment; relationships within the company itself are also very important. That is how relations between employer and management, as well as relation towards employees, should be perceived through the prism of business ethics and moral behaviour. There are multiple benefits that organization gets from business ethics implementation along with ethical behaviour. They are beneficial in the long run, because such business manner affects not only reduction of costs, which appeared as the consequence of non ethical behaviour of employees and other members of economic body, but in that manner ethical climate within organization is developed and teamwork is improved which overall affects positive image of organization in public.
Main question raised, in relation to business ethics, is identifying the border which determines whether some matter in business is moral or not. Defining the border is challenge for every individual. ‘It is the matter of personal decision, personal perception of situation, needs, interests and motifs, the question of personal moral integrity but also the question of cultural inheritance, expectations and pressures that come from the company and environment’.196
In today’s global world, business ethics became irreplaceable part of business practice and main condition for reaching business success in short as well as long period. Business ethics acquires strategic role, because it helps organization to create management system, based upon ethical principles, which enables quality response to claims of all interest groups, which are directly and indirectly related to the organization. It is believed that successful organizations are
196 Šijaković, I; Business Ethics, (internet), available at http://www.sijakovic.com/02/poslovnaetika/, (site visited on 25th
August 2012), 2008

REDETE – ECONOMIC DEVELOPMENT AND ENTEREPRENEURSHIP IN TRANSITION ECONOMIES
428
only the ones who: ‘do not separate ethics from profitability, but harmonize it successfully in its performance’ (Aleksić, 2007)
In order to regulate business ethics, it is necessary to define its principles. This is enabled through codexes of business ethics, also named as codexes of business behaviour or ethical codexes. These codexes refer to collection of formal and informal rules, schemes, regulations and good practises in business conduct and serve as frame to follow, in order to formally aid operating in much more complicated conditions on the market.
We can say that business ethics represents ’soul’ of socially responsible conduct in a company, but not only in form of approved regulations and ethical codexes; they have to be real reflection of synergy and communication with internal and external environment.
2.2 Codex of business ethics
In order to explain importance and role of business ethics codex, it is best to describe all fields regulated by the codex. Majority of these codexes has the same or similar content in countries that adopted it and legally regulated. Therefore, in the following text, some parts of the codex, approved in Republic of Srpska, will be presented along with the ones from neighboring countries.
Codex of business ethics serves to establishing higher moral level of business entities within the organization itself. Through this codex, values are defined and expected eligible conducts based upon those values, as well as the ones that are not going to be tolerated. Codex of business ethics along with codex of corporate management should represent basis for business policy of business entities in some country.
Majority of business ethics codexes is composed of few separate units that regulate certain segments of company business, so it can be divided into more parts that are going to be separately elaborated in this paper.
First part of the codex mainly refers to basic provisions, and they incorporate questions such as: domain of codex implementation, principles and rules of business ethics, purpose of the codex and individuals that codex refers to.
Apart from domains stated above, basic terms used in codex are defined in basic provisions of the codex, such as: 197
1. Moral – represents a group of norms (rules) that regulate people’s behaviour, through directing towards realization of some interest, which is spontaneously created and autonomously accepted within social community.
2. Business ethics – refers to those moral norms (rules) that are relevant in business relations; incorporates principles and standards, spontaneously created or established, based upon moral virtues and professional well-being; they regulate conduct of individuals that codex refers to.
3.Activity of business entity – implies conducting activities approved by the law.
4. Competition – are natural or legal persons conducting the same or similar activities on the market aiming at profit generation.
5. Consumer – is person who buys the product or uses the service of other business entity as final user.
Second part of the codex defines basic principles, such as: principle of personal responsibility,
legal business, fairness and conscientiousness, prohibition of legal misusage, principle of respect
197 Board of trade of Republic of Srpska; Ethical codex, (internet), available at
http://www.komorars.ba/pkrs/static/92/regulativa_PKRS, (site visited on 17th August 2012), 2012.

REDETE – ECONOMIC DEVELOPMENT AND ENTEREPRENEURSHIP IN TRANSITION ECONOMIES
429
for business partners, negotiating, creating of contract provisions, prohibition of concluding false contracts, principle of duty to fulfill and execute obligations, principle of realizing rights and principle of peaceful settlement of disputes.
Third part of the codex is dedicated to internal affairs within business entity and incorporates several segments. It is used to define rights and liabilities of employees as well as the position of members of business entity bodies, i.e. employees and persons employed on the basis of contract, i.e. different persons participating in society activities in any way. These persons imply: directors, members of administrative, auditing and executive board along with revision board, internal controller and other members of economic body. This part also defines protection of business entity’s ownership as well as keeping business and minute-books.
Apart from internal relations, codex also regulates external relations. In this part, we can find information and rules for regulating different relations such as: relationship with consumers, customers, supplies, financiers, owners as well as public relations and relations with state bodies.
Fifth part of the codex, related to protection of free competition, defines several fields: prohibition of actions that violates free competition, collecting information about competitors, prohibiting of violation of business reputation of other business entities, prohibiting of support to products and services of competition companies, prohibiting boycott, prohibiting misusage of dominant position, prohibiting misusage of monopoly agreements, prohibiting misusage of monopoly position, prohibition of dumpers, prohibition of speculations and limiting of market.
Codex of business ethics defines protection of environment, and therefore defines res-ponsibility of business entities, obliged to raise the awareness on importance of environment protection, which is provided through improving of work process through system of scientific research and technological development and popularization of environment protection.
After all the above mentioned, every codex also contains part that refers to rules of its implementation, where implementation is defined along with monitoring of the same.
2. Corporate governance and regulation of business ethics in Republic of Srpska
Although it is considered that today’s corporate governance is one of the key elements for improvement of economic efficiency, for growth and development of companies and also for improvement of trust and attracting investors, it is relatively new occurrence in Republic of Srpska. However, to insure persuasive and understandable corporate governance, and therefore to gain numerous benefits, it caries with itself, it is necessary to bring adequate laws and other legal acts to regulate this matter.
When legal regulation of corporate governance and business ethics is in question, in Republic of Srpska, it is necessary to mention valid law that regulates performance of all business entities. That is the Company Law 198 used to arrange establishing economic bodies, managing bodies, rights and liabilities of founders, partners, members and shareholders, networking, reorganizing and liquidation of economic bodies. Economic bodies imply legal persons who establish legal and/or natural persons for conducting activities in order to gain profit.
As a legal form of economic bodies, joint-stock company is defined according to this law, article 179, as: ‘economic body that is established by one or more legal and/or natural persons, as shareholders for conducting certain activities, under the same business name, whose principal capital is determined and distributed into shares’.199 This law regulated various issues related to corporations and corporate governance.
198This Law is published in Official Gazette of Republic of Srpska; 31/12/2008. It came into effect eight days after issuing
and its implementation started from 01/07/2009. 199Official Gazette of Republic of Srpska (127); Company Law, Banja Luka, 2008.

REDETE – ECONOMIC DEVELOPMENT AND ENTEREPRENEURSHIP IN TRANSITION ECONOMIES
430
When business ethics is in question, article 309 of this law, refers to codex of conduct and relates to its implementation. The first paragraph of article mentioned, states that administrative board of open joint-stock company, whose shares are included in official stock market, is obliged to bring its codex of conduct in writing or accept standards of corporate governance that committee for securities administration of Republic of Srpska brings.
In second paragraph of this article, it is stated that joint-stock company issues codex of conduct on their internet page, whereas third paragraph defines regulation of administrative board that obliges them, on every annual general meeting and in annual report on performance, to give statement upon compatibility of organization and acting in compliance with codex of conduct and elaborates every mismatch of company with codex if it occurred.
Apart from the Company Law, the question of ethics for companies in Republic of Srpska is regulated through codex of business ethics of Board of trade in Republic of Srpska 200 which obliges business entities, members of Board of trade in Republic of Srpska, employyees, members of bodies and persons employed on the basis of contract within business entity. This codex obliges business entities, its subsidiaries and regional offices in Republic of Srpska and abroad, and it was issued on 15th March 2006.
Question of business ethics is also regulated with Ordinance on reporting and issuing information by issuer of securities that are the subject of public offering. This ordinance is issued on 10th October 2007, and complemented on 31st December 2011.
However, when the situation of corporate sector in Republic of Srpska is realistically reviewed, it is noticeable that there are numerous problems. One of it is surely centralized ownership, i.e. controlling of the company by smaller group of shareholders, which creates larger possibility for misusage by minority shareholders. In addition to that, this sector also has the problem of very small detachedness of ownership from control, and it is not rare occurrence that persons, who own controlling interest, are usually general managers or members of board in the company. It is not only that their objectiveness is questionable here, but expertise as well. In this manner, inexpe-rienced and inadequate corporate bodies are created, which results in inefficient management, and therefore lower possibility for achieving business success. On the basis of analysis, we can say that the level of applying corporate governance in companies in Republic of Srpska is very low, and companies do not show any will to run the company transparently and promote good corporate management. It is thought that in these companies, activities of corporate governance come from legal regulations that were imposed by authorized institutions which do not have enough expertise upon corporate governance. Small number of companies really understands depth and complexity of this topic, therefore reforms of corporate governance are often introduced superficially and are rather used as promotional activity than a mean for introduction of structure and process that enables company to acquire trust of its shareholders, to manage risks and improve possibilities for access to capital.
In addition to problems named, through analysis of observed sector, we can conclude that one of the causes of insufficient business successfulness in corporations certainly is business ethics. Reason for that is in the fact that majority of companies from this sector in Republic of Srpska do not even have codex of business ethics. On the other hand, large percentage of those companies which are in the opposite group, created their codex only for the legal obligation.
200Board of trade in Republic of Srpska – nongovernmental, independent, professional, business organization, independent
and non-profitable public and legal association of business entities and economic associations in the area of Republic of Srpska, based upon Law of Board of trade in Republic of Srpska (Official Gazette of Republic of Srpska, number 65/08).

REDETE – ECONOMIC DEVELOPMENT AND ENTEREPRENEURSHIP IN TRANSITION ECONOMIES
431
4. Importance of business ethics for business success.
Frequently asked question is how business ethics can influence company’s business success-fulness. Certain researches conducted around the world as well as in our country state various ways.
Since the purpose of business ethics is to contribute completion of various business activities in compliance with business moral, good business customs and principles of conscientiousness and fairness; business ethics focuses on liability of business entities related to all the employees along with all other business partners towards whom company has to show respect and acknow-ledgement. Respect for human dignity and appreciation of human rights makes basics of all relationships among employees. All the employees have the right on clean and sound working environment, protection at work as well as encouraging conditions for creative work and voca-tional training. In accordance with qualifications, experience, working conditions and working hours, every employee has the right on salary and limited working hours. Their political rights and free choice out of working hours and out of working environment must be respected, and within the work position, they have the right to organize themselves and act within union. Employees have the right on privacy related to all the information about them. All this affects employees’ motivation. On the other hand, all employees as well as members of bodies in business entity have duty to act in the best possible interest for the company. All the above mentioned persons have duty to make conscientious business evaluations and have duty to avoid conflict of interests. It is of crucial importance for business quality to protect ownership of business entity, therefore there is liability of above mentioned persons for protection, accumulation and rational usage of property owned by business entity.
When external relations of a company are in question, its relations with consumers are very important; company has to treat them with respect and put effort into meeting their needs, where deceit of consumers is strictly forbidden. Business entity is also obliged to develop quality cooperation with suppliers, fulfilling arranged obligations regularly. In case those third parties are financiers, results and business plan have to be presented objectively and all obligations must be fulfilled. Relation towards owners is especially important, therefore compliance with business ethics implies running business in responsible way towards owners, and all that to protect their rights and investments. All the shareholders have the right on timely presented, quality and truthful information and to influence business strategy development through general meeting and company bodies. All the shareholders, minority ones along with foreign ones, have the above mentioned rights because of obligation of the company to respect equal treatment of owners. Business entity is also obliged to contribute social development through its activities, through encouraging employees and members of bodies to actively participate in social life. When public is in question, very important obligation is the one related to timely, regular and reliable informing upon business performance.
Business ethics also regulates protection of free competition through different restrictions, such as: forbidding actions that infringe free competition, forbidding violation of business reputation of other business entities, prohibition of support to products and services from competition compa-nies, prohibition of boycott, prohibition of misusage of dominant position, prohibition of monopo-ly agreements and misusage of monopoly position, prohibition of dumpers, prohibition of speculations and limitations to the market.
Adoption and acknowledgement of business ethics principles provide image improvement, i.e. society image improvement, and they make non material part of assets. It is also useful for directing attention of all employees in a company towards potential problems, which can prevent total crisis. That is the way which enables development of corporate culture and focusing on corporate values. This codex is used for improvement of communication with interest holders and for avoiding court litigations that are result of different frauds, conflict of interests, corruptions, bribing etc.

REDETE – ECONOMIC DEVELOPMENT AND ENTEREPRENEURSHIP IN TRANSITION ECONOMIES
432
All the above mentioned advantages that are brought by adoption and acknowledgement of certain business ethics principles, directly or indirectly affect increase of profits or decrease of costs, and it is finally going to lead to increase of business successfulness in those companies which not only define but apply those principles.
Conclusion
Performance of any company, and especially corporations, must be established with all necessary normative acts, regardless if it is necessary or as a result of realistic needs. Performance of modern companies and especially successful performance can be related to appliance of certain moral and ethical standards. Aiming at that, business ethics represents important, and in public companies obligatory, segment of normatively regulated business performance. Business ethics can be defined easily as adoption and appliance of ethical principles in all business activities.
If global conditions of business performance are perceived, we can conclude that business ethics has growing influence for all business entities, and especially for the ones who emit their securities at capital markets. Numerous reasons brought to the situation where ethics became ire-placeable part of business practice and main precondition for realization of business success in short period of time as well as in the long run. It gains strategic importance, because it helps orga-nization to create management system that is based on ethical principles, and it enables quality response to all claims from interest groups, being directly or indirectly connected to organization.
Adopting and issuing of codex of business ethics, that defines rules, principles, and good customs in business conduct, is one of the most efficient means for achieving organizational go-als. Codex influences better reputation, improvement of risk and crisis management, improvement of communication with interest holders, development of corporate culture and focusing on corpo-rate values; codex influences avoiding court litigations of business entity, reduction of costs directly or indirectly as well as increase of profits and consequently realized profits. Starting point of this work was problem of impact of business ethics upon business success in large business systems, especially in corporations; on the basis of represented theoretical and practical know-ledge, we can conclude that presence and appliance of principles and rules of business ethics, positively affects company’s business success from the observed sector; it can be confirmed by starting basis of research in this work.
Reference list
1. Babić, M., Lukić, Y.Č Management, Theories, Functions, Institutionalised Aspects and
Corporate governance, Faculty of Economy, Banja Luka, 2008. 2. IFC - International Financial Corporation, Corporate governance, Guide Book for Companies
in Bosnia and Herzegovina, IFC Sarajevo, 2009. 3. Board of Trade Republic of Srpska; Ethical Codex,(internet), available at :
http://www.komorars.ba/pkrs/static/92/regulativa_PKRS, (site visited on 17th august 2012), 2012.
4. Official Gazette Republic of Srpska (127); Company Law, Banja Luka, 2008. 5. Official Gazette Republic of Serbia (1/006),; Codex of Business Ethics, Belgrade, 2006. 6. Šijaković, I.; Business Ethics, (internet), available at: http://www.sijakovic.com/02/poslovna-
etika/ , (site visited on 25th August 2012), 2008.

PART SIX:
Business Competiveness, Business Organization

REDETE – ECONOMIC DEVELOPMENT AND ENTEREPRENEURSHIP IN TRANSITION ECONOMIES
434
INFORMAL ORIGIN, FIRM PERFORMANCE AND CONDUCT IN THE BALKANS
Ourania DIMITRAKI201 Leora F. KLAPPER202
Georgios A. PANOS203 *
Abstract
In the last two decades, the Balkan counties have been a laboratory of business environment and financial sector reform in the post-communist and the post-conflict transition processes. The main aim was to support formal business operation and performance, as well as to prevent the old norms of informal business conduct. Using data from more than 5,000 firms in eight Ba-lkan countries we examine three hypotheses related to the performance and behaveour/conduct of firms that stemmed from the informal sector. Our results indicate that firms of informal ori-gin perform better in terms of sales and employment growth, as well as exporting activity. Mo-reover, we find a moderate positive relationship between access to finance among informal fir-ms and their performance, which becomes stronger for young firms of informal origin. We in-terpret this as in accordance with a competitive view of informality in the Balkans. Finally, we test whether informal forms of conduct persist among formerly informal firms. Our results st-rongly reject this hypothesis.
Keywords: Informal sector, Balkans, firm performance, access to finance, informal norms.
201 University of Essex, [email protected] 202 The World Bank, [email protected] 203 University of Stirling, CELMR and CER, [email protected] * Corresponding Author: Economics Division, Stirling Management School, University of Stirling, Room 3B79 Cottrell
Building, FK9 4LA Stirling, United Kingdom. Telephone: +44(0)1786 467480, Fax: +44(0)1786 467469, e-mail: [email protected]. This paper’s findings, interpretations and conclusions are entirely those of the authors and do not necessarily represent the views or policies of the World Bank, their Executive Directors, or the countries they represent.

REDETE – ECONOMIC DEVELOPMENT AND ENTEREPRENEURSHIP IN TRANSITION ECONOMIES
435
1. Introduction
In the last two decades, the Balkan counties have been a laboratory of business environment and financial sector reform and social change, which were essential parts of the post-communist and the post-conflict transformation processes. The main aim was to support formal business operation and performance, as well as to prevent the old norms of informal business conduct. Mo-reover, job creation and a viable entrepreneurial environment are among the primary policy ob-jecttives within this region. One source of growth in the region is the operation of small and me-dium-sized firms that dominate the enterprise sector and have contributed to net job creation in several countries (World Bank 2005; 2006). Although these new micro businesses represent a dynamic section of the enterprise sector—with some experiencing very rapid sales growth—there has also been concern about the ability of these firms to survive in the longer term and to secure necessary financing for growth and thus promote constant and continuous job creation (World Bank 2007).
However, in the Balkan countries, like the transition economies of Eastern and Central Europe, large and active informal sectors are present. The prolonged typically considered as the lower tiers of segmented labour markets, where unmatched employees queue for good jobs and/or find a shelter out of necessity. The poor regulatory environment tends to keep formal sector wages in urban areas above market-clearing levels, and the low-productivity informal sector provides a subsistence shelter for unmatched employees (Lewis, 1954; Harris and Todaro, 1970; Lucas, 1978; Rauch, 1991; Chandra and Khan, 1993; Loayza, 1994, 1996). However, very often entrepreneurs operate informally to avoid the burdens of bureaucracy and corruption. Large cross-country studies suggest that increases in regulation and its enforcement are associated with larger informal sectors (Johnson et al., 1998, 1999; Friedman et al., 2000; Loayza et al., 2006).
Firm operation in the informal sector is a major policy concern as policy reforms in countries with high levels of informal activity are difficult to implement efficiently in the short term (Cantens, 2012). Moreover, it is also considered that the unfair competition to formal firms by firms operating informally, along with the existence of norms that encourage informality induces lower levels of formal business registration and provides fewer incentives for formal start-ups. A number of reforms targeted the regulatory and business environment with the aim to support formal business operation and the performance of new SMEs. The desired outcome was to incentivize firms operating in the informal sector to register formally.
Given this unique background, this study examines the behaviour and performance of firms which stemmed from informal sector operation in eight Balkan counties. It is of primary interest to attempt to identify whether operation in the informal sector should be seen as disguised unemployment or as a potential outlet for latent entrepreneurs in poor regulatory and financial environments. The dynamics of firms with prior experience in informal markets—including their performance into formal entrepreneurial activity, the interaction of performance and access to finance, and the behaviour and attitudes towards informal means of business conduct—are important research and policy issues. However, little is known about these dynamics, particularly in the Balkans.
Our results indicate that firms of informal origin perform better in terms of sales and employ-ment growth, as well as exporting activity. We find a moderate positive relationship between access to finance among informal firms and their performance. That relationship is stronger for young firms of informal origin, and we interpret it as in accordance with a competitive aspect of informality in the Balkans. Finally, we show that firms of informal origin are not more likely to engage in informal forms of business conduct, i.e. informal payments and gifts as part of business, compared to their counterparts that did not stem from informality.
Taking into account Baumol’s (1990) view of the existence of a fixed pool of entrepreneurial talent, this study contributes to the debate on the role of the informal sector in the Balkans. This debate has important policy implications related to the treatment of informality, i.e. whether this

REDETE – ECONOMIC DEVELOPMENT AND ENTEREPRENEURSHIP IN TRANSITION ECONOMIES
436
should target its banning and prosecution or if opportunities should be sought aiming at the reallocation of talent in more efficient markets.
The remaining of this paper is structured as follows. Section 2 presents the theoretical back-ground and a literature review of the issues of relevance to this study. Then, Section 3 uses this motivation to introduce the three main hypotheses of interest. Section 4 discusses the empirical strategy and methodology that is used in this study and presents the data. Section 5 presents the results along with their detailed discussion and Section 6 concludes.
2. Background and Literature Review
Until the late 1990s, the Balkan countries were centrally planned economies governed by vast numbers of laws, strict and sometimes unrealistic rules and regulations (Goldman, 1972)204. However, the Balkan countries constitute a specific case when it comes to entrepreneurial spirits and activities. Anecdotal evidence viewed individuals from the region as highly entrepreneurial and business oriented, both at home and abroad. For instance, compared with most centrally planned economies in Eastern Europe, the regime in the counties of former Yugoslavia had a somewhat different treatment of small businesses, mostly those related to crafts and services. Before the war, the region had a large entrepreneurial middle-class. These were encouraged and provided with financing mostly from local government-owned banks. Their interests were further supported through the formation of local and politically influential crafts unions. Furthermore, the former regime directed heavy manufacturing industries - on which socialist regimes placed a huge emphasis - in regions such as Bosnia and Herzegovina (BiH). However, the war in the former Yugoslavia region and the post-communist transition process altered the environment in all eight countries, and together with the destruction of the massive state operated factories, unemployment skyrocketed (World Bank, 2002).
In the Balkans a significant amount of economic activities takes place in the ‘shadow’ econo-my (figure 1). To an extent, informality became a ‘tool’ of necessity indicating evasion, often opposition of the laws, and a shelter used to cope with the day to day activities (Grødeland and Aasland, 2007). Other arguments view informality in post-communistic countries as part of the transition process, indicating resistance to reform (Mungiu -Pippidi, 2005) (the ranking of infor-mality in the countries under study can be seen in figure 2, 3). Furthermore, political scientists su-ggested that informality might be deeply entrenched in the national culture as a result of historical events and social norms, and hence cannot easily be transformed (Grødeland and Aasland, 2007). Individuals and governments might be willing to accept informality to a certain extent, in order to avoid the potential social tension and turmoil that can arise as part of the transition process (Miller et al., 2001; Cantens, 2012). Hence, it might be the case that informality (as part of culture) will not easily adjust on externally imposed values and norms of conduct. Culture is an inherent set of values that shape human behaviour and behavioural scientists have for long recognised that adaptation to new sets of values is difficult to occur in the short run.
Figure 1 presents figures for the size of the informal sector in Eastern and Central Europe, as estimated by Schneider et al. (2010) and Schneider (2012). In the eight Balkan countries that will be examined in this study, namely, Albania, Bosnia and Herzegovina, Bulgaria, Croatia, FYROM, Serbia, Montenegro, and Croatia, the size of the informal sector is systematically above 35% of the country’s GDP, with the only exception of Slovenia (28%).
204 Informality was looked by many angles such as efficiency of laws, tax evasion, and shadow economy labor force, among
others (Marceli et al., 1999; Marcelli, 2004; Chen, 2004; Williams and Windebank, 1998; 2001a; b; Flaming et al., 2000; 2005; Alderslade et al., 2006; Brück et al., 2006; Schneider et al., 2010; Schneider, 2012).

REDETE – ECONOMIC DEVELOPMENT AND ENTEREPRENEURSHIP IN TRANSITION ECONOMIES
437
Figure 1. The size of the informal sector
0.0% 10.0% 20.0% 30.0% 40.0% 50.0% 60.0% 70.0%
Slovenia
Slovak Republic
Montenegro
Serbia
Romania
Poland
Moldova
FYROM
Lithuania
Latvia
Hungary
Georgia
Estonia
Czech Republic
Croat ia
Bulgaria
Belarus
Bosnia and Herzegovina
Albania
28.0%
19.7%
38.8%
38.8%
36.3%
28.0%
45.8%
37.6%
31.9%
41.7%
25.8%
68.8%
38.5%
19.8%
34.7%
38.5%
49.8%
34.6%
36.3%
Source: Schneider et al. (2010) & Schneider (2012); Figures for Serbia and Montenegro
are only available for 2002/2003.
Figure 2 presents the rankings of 16 Europe and Central Asia countries in terms of total and new business entry densities. The data source is the 2008 World Bank Group Entrepreneurship Survey205 and averages for the years 2002–2004 are presented as shown by Demirgüç-Kunt et al. (2011; 2012). New entry density is shown on the vertical axis and overall business density is shown on the horizontal. Both figures are given per 1,000 of working age population. The performance of Balkan countries with respect to total and new firm density diverges from
205 The 2008 World Bank Group Entrepreneurship Survey measures entrepreneurial activity in over 100 developing and
industrial countries over the period 2000–2007. It is a joint effort by the World Bank Development Research Group, the IFC and the Kauffman Foundation in its third year. The database includes cross-country, time-series data on the number of total and newly registered businesses, collected directly from the registrar of companies. For more details, see Klapper et al. (2007) and http://rru.worldbank.org/businessplanet/default.aspx?pid=8. The 16 countries presented in Figure 1 are: Albania, BiH, Bulgaria, Croatia, Czech Republic, Georgia, Hungary, Latvia, Lithuania, Moldova, Poland, Romania, Russian Federation, Serbia, Slovak Republic, Slovenia and Ukraine. Averages (2002–2004) are presented so that the time period coincides with the initiation of the EBRD-World Bank Business Environment and Enterprise Performance Survey (BEEPS) data that will be introduced in the next section.

REDETE – ECONOMIC DEVELOPMENT AND ENTEREPRENEURSHIP IN TRANSITION ECONOMIES
438
particularly low figures for Albania, Bosnia and Herzegovina and Serbia, to much higher levels of formal business and new start-up activity in countries such as Bulgaria, Croatia and Slovenia.
Figure 2. Total and new entry density in ECA
AlbaniaBiH
Bulgaria
CroatiaCzech Republic
Georgia
Hungary
LithuaniaMoldova
Poland
Romania
Russian Federation
Serbia
Slovak RepublicSlovenia
Ukraine
0.00.51.01.52.02.53.03.54.04.55.05.56.0
0 5 10 15 20 25 30 35 40 45 50 55 60
New Entry Density(per 1,000 working age
population)
Total Density (per 1,000 working age population)
Source: World Bank Group 2008 Entrepreneurship Database (2002–2004 averages); Available at: http://rru.worldbank.org/businessplanet/default.aspx?pid=8
Figure 3 presents selected business environment indicators, denoting the ranking of the eight
Balkan countries of our next sections in the World Bank’s Doing Business indicators for the year 2011, in a total of 183 countries206. Evidently, BiH, Serbia and Albania rank lower compared to the neighbours in terms of the ease of doing business, starting a business, paying taxes, trading and enforcing contracts. The situation was similar in earlier versions of the data. FYROM, Cro-atia, Slovenia and Bulgaria appear to be doing better, even ranking at the top 60 countries with respect to some of the indicators of interest.
206 The World Bank’s Doing Business project looks at small and medium-size companies and measures the regulations
applying to them through their life cycle. The 2011 report covers 10 indicators sets in 183 economies with the goal of providing an objective basis for understanding and improving the regulatory environment for business. Doing Business provides a quantitative measure of regulations for starting a business, dealing with construction permits, employing workers, registering property, getting credit, protecting investors, paying taxes, trading across borders, enforcing contracts and closing a business, as they apply to domestic small and medium-size enterprises.

REDETE – ECONOMIC DEVELOPMENT AND ENTEREPRENEURSHIP IN TRANSITION ECONOMIES
439
Figure 3 Selected doing business rankings
0 20 40 60 80 100 120 140 160 180
Slovenia
Serbia
Montenegro
FYROM
Croat ia
Bulgaria
Bosnia and Herzegovina
Albania
Ease of Doing Business Start ing a Business Paying Taxes
Trading Across Borders Enforcing Contracts
Source: World Bank Group Doing Business Indicators (2011; total of 183 countries); Available at: http://rru.worldbank.org/businessplanet/default.aspx?pid=1.:
Hence, despite the fact that some countries doing better in terms of the business environment
and business registration, informality is still a widespread phenomenon in all eight of our Balkan countries. In the next sections we will examine the relationship between grey market experience and firm behaviour and performance. The impact of informal sector experience on the latter is a debatable issue, and this debate has important policy implications for the treatment of the informal sector after economic liberalization in the process of economic development (Kaufmann and Kaliberda, 1996; Johnson et al., 1997)207.
207 The debate does not neglect the fact that informality involves tax evasion and unfair competition to the formal sector,
which are significant impediments to growth. Moreover, the informal sector is characterized by low-pay and low-job security among its employees and a large amount of informality in an economy is an indicator of corruption and of poor regulatory, financial and labour market environments.

REDETE – ECONOMIC DEVELOPMENT AND ENTEREPRENEURSHIP IN TRANSITION ECONOMIES
440
3. Hypotheses
3.1 Informal origin and firm performance
Global evidence shows that total firm registrations and entry rates are significantly higher in countries with a smaller informal sector, suggesting a substitution effect and a larger informal sec-tor in countries with higher entry barriers (Klapper et al., 2007). However, informal micro-enter-prises might not lag behind formal micro-enterprises in terms of growth or dynamism and infor-mal entrepreneurs might not lack in ability (Blau, 1985). Moreover, studies of Latin America su-ggest that in developing counties, with low levels of formal sector labour productivity, entrepre-neurs with low levels of human capital might optimally choose to operate in the informal sector (Maloney, 2004).
The job-specificity and skill transferability literature also suggests the potential of human capi-tal acquisition through informal operation. Individuals are more likely to gain in capital, know-ledge and ability while working rather than when out of the labour market (Evans and Jovanovic, 1989). Informality can be thought to allow a leader to explore the potential profitability of an in-dustry without incurring significant sunk costs (Bennett and Estrin, 2007). This entrepreneurial human capital could be of vital importance to the development process where the uncertainty abo-ut the future profitability of new ventures is higher, and several adaptations are required to support ‘new’ production methods (Iyigun and Owen, 1998; Hausman and Rodrik, 2003; Hausman et al., 2007). The last two views are also compatible with the view of entrepreneurs as ‘jacks of all trades’ (Lazear, 2004), and one could perceive the informal sector as an incubator for formal sec-tor entrepreneurship when the business environment improves. Guariglia and Kim (2006) provide some evidence in favour of that view by establishing a relationship between dual-job holding and self-employment in Russia.
Our first hypothesis attempts to shed some light on the discussion about the characteristics of firms in the informal sector, by comparing the performance of firms that stemmed from the infor-mal sector to those that did not. Specifically:
Hypothesis 1 (H1): Prior informal sector market experience is negatively related to subsequent
formal firm performance
The counterfactual hypothesis would suggest that grey market experience is positively related or unrelated to firm performance. In the next section we describe in detail our set of firm perfor-mance indicators, and the methodological treatment of issues related to the comparison of firms with and without prior informal market experience.
3.2 Informal origin and access to finance
A more recent finance-based view stresses the role of the financial market and the regulatory environment in competitive labour markets when entrepreneurs and/or workers are heterogeneous in both the formal and the informal sector (Maloney, 1999, 2004; Pratap and Quintin, 2006; de Paula and Scheinkman, 2007; Galiani and Weinschelbaum, 2007). In a moral hazard framework with credit rationing the decision to operate formally or informally is shaped by the interaction between the cost of entry into formality and the relative efficiency of formal vs. informal credit mechanisms and their related institutional arrangements (Straub, 2005). Amaral and Quintin (2006) model the costs associated with producing in the informal sector as resulting from a

REDETE – ECONOMIC DEVELOPMENT AND ENTEREPRENEURSHIP IN TRANSITION ECONOMIES
441
limited access to formal means of contract enforcement. In economies under transition, the regulatory environment might not foster formal entrepreneurship and entrepreneurial individuals might choose to operate in the informal sector or shadow economy. Indeed, Djankov and Murrell (2002) document the existence of significant entry costs into formality, in the form of registration and licence fees.
Hence, our second hypothesis suggests that:
Hypothesis 2 (H2): Access to formal finance does not exert a higher impact on the performance of firms of informal origin,
compared to the firms without an informal origin
The counterfactual is that access to finance exerts a higher impact on firms that stemmed from the informal sector, compared to their counterparts without ‘grey market’ experience.
3.3 Informal origin and informal norms
Grødeland and Aasland (2007) suggest that informality might be deeply entrenched in the national culture as a result of historical events and social norms. Hence, informal behaviour (as part of culture) will not easily adjust on external imposed values. Culture is an inherent set of values and social norms which do not easily amend. There can be little doubt that human behaviour is shaped by social norms208, i.e. behavioural regularities that are based on a socially shared belief about how one ought to behave. Hirschman (1982) suggests that institutions can enforce social norms and induce specific behaviours which may finally become part of the behavioural profile of the individual209. Such profiles may entail self-centered, opportunistic, reciprocal and cooperative behaviour. In some occasions, acquired preferences can be internalized and become constraints on behaviour (Ariely, Loewenstein and Prelec, 2003; 2006; Carpenter, 2005). In response to social dilemmas, social norms are ubiquitous (Ostrom, 1998). Social norms also have a decisive impact on the functioning of markets, by either deterring or encouraging socially beneficial behaviour.
Hence, however acquired, preferences in some occasions may be internalized, taking on the status of general motives or constraints on behaviour. Values which become durable attributes of individuals may explain behaviours in novel situations. The idea that preferences are not well defined, but become articulated in the process of making a decision is consistent with a large body of research on what decision researchers refer to as “constructed preferences” (Slovic, 1995; Hoeffler and Ariely, 1999). Furthermore, preferences may become generalised through a process termed dissonance reduction (Festinger, 1957)210. 208 A social norm describes: (i) a behavioural regularity; that is (ii) based on a socially shared belief of how one ought to
behave; which triggers (iii) the enforcement of the prescribed behaviour by informal social sanctions (Fehr and Gächter, 2000).
209 The idea that economic institutions shape the preferences of individual agents has a long history in economic thought even if it has not had much impact on economic theory (Bowles, 1998; Carpenter, 2005). Hirschman (1977, 1982) was among the first to illustrate the statements of the cultural effects of markets. The author suggests that institutions can enforce social norms and induce specific behaviours which may finally become part of the behavioural profile of the individual. Bowles (1998) explains how markets and other economic institutions also influence the evolution of values, tastes, and personalities, apart from just allocating goods and services, and provides an overview of the mechanisms via which such a process can take place.
210 The cognitive elements in dissonance could be one’s values and behaviour, as when one is doing something which is inconsistent with one’s values. Festinger (1957, pp. 271-73) used this reasoning to explain “specific ideological changes or opinion changes subsequent to the change in a person’s way of life”, such as a sudden change in the job which a person does. Dissonance reduction thus provides another explanation for how economic circumstances may induce new preferences, and why the new preferences might become general reasons for behaviour. Simon (1997) identifies an

REDETE – ECONOMIC DEVELOPMENT AND ENTEREPRENEURSHIP IN TRANSITION ECONOMIES
442
Based on these views on how institutions shape social norms and behaviour, along with the internalization of preferences, we specify our third hypothesis, according to which:
Hypothesis 3 (H3): Firms with informal market experience are not more likely to
engage in behavior of informal business conduct, such as informal payments to tax authorities, customs etc.
The counterfactual states that firms of informal origin will not easily adapt their values to the new
environment and hence will be more likely to engage behaviours of informal business conduct. The next section discusses our empirical strategy for testing our three main assumptions, along
with a number of methodological and robustness tests.
4. Empirical Strategy
We use the EBRD-World Bank Business Environment and Enterprise Performance Survey (BEEPS) data to examine the behavior and performance of firms in eight Balkan countries, name-ly Albania, Bosnia & Herzegovina, Bulgaria, Croatia, FYROM, Montenegro, Serbia, and Slove-nia. The BEEPS was conducted in four years, i.e. 2002, 2005, 2007, and 2009, with repeated ob-servations for part of the sample. Importantly, the aim of the study is to compare the performance and behavior of firms with prior informal sector experience to those of firms without any grey market experience in the past. We employ the sub-sample of firms that were initiated during or after 1984, i.e. firms which were operating during the period in which most of the reforms took place and younger than 25 years in 2009.
4.1 The Sample
We define Informal Origin as a binary variable capturing informal sector experience in the past. Informal Origin takes the value 1 if the firm manager does not reply positively to the question “Was the firm formally registered when it began operations in the country?” Moreover, it takes the value 1 if the manager reports a year of registration later than the year in which the firm began its operations in the country. Finally, an additional question asks the managers to report the year in which the firm began its exporting activity. We consider the few cases of firms that reported a year for the initiation of exporting that was earlier than the year of registration as firms of informal origin.
Table 1 presents the descriptive statistics for our sample of firms. Our sample comprises of
5,756 firm-years, from firms operating less than 25 years in 2009. There are 5,103 firms in the sample, 569 of which have repeated observations for more than one year in the sample. Out of the 5,756 firm-years: 325 (5.6% of the sample) are from 275 firms of informal origin according to the above definition, and 5,431 are from 4,828 firms which have no prior grey market experience. The distributions by year shown in Table 1 indicate that there is more or less a balanced sample of firms for every year in the data, i.e. 1,089 firms in 2002, 1,300 in 2005, 1,778 in 2007 and 1,589 in 2009211.
important characteristic related to social learning that can be justified to contribute to the fitness of socially dependent human beings. ‘Docile’ people tend to adapt their behaviour to norms and pressures of the society.
211 The number of firms with informal origin is higher in the samples for 2005 (9.9%) and 2009 (6%). It is worth noting that there is no data for 2007 for the following five countries: Serbia, BiH, FYROM, Slovenia and Montenegro.

REDETE – ECONOMIC DEVELOPMENT AND ENTEREPRENEURSHIP IN TRANSITION ECONOMIES
443
Table 1: Sample descriptive statistics
All years 2002 2005 2007 2009
All countries Total 5,756 [100.0%] 1,089 {18.9%} 1,300 {22.6%} 1,778 {30.9%} 1,589 {27.6%}
Informal 325 (5.6%) 33 (3.0%) 129 (9.9%) 68 (3.8%) 95 (6.0%)
Formal 5,431 (94.4%) 1,056 (97.0%) 1,171 (90.1%) 1,710 (96.2%) 1,494 (94.0%)
Albania Total 702 [12.2%] 156 {22.2%} 191 {27.2%} 302 {43.0%} 53 {7.5%}
Informal 50 (7.1%) 3 (1.9%) 7 (3.7%) 36 (11.9%) 4 (7.5%)
Formal 652 (92.9%) 153 (98.1%) 184 (96.3%) 266 (88.1%) 49 (92.5%)
Serbia Total 660 [11.5%] 171 {25.9%} 211 {32.0%} - 278 {42.1%}
Informal 55 (8.3%) 4 (2.3%) 26 (12.3%) 25 (9.0%)
Formal 605 (91.7%) 167 (97.7%) 185 (87.7%) 253 (91.0%)
Bosnia & Herzegovina Total 549 [9.5%] 127 {23.1%} 149 {27.1%} - 273 {49.7%}
Informal 35 (6.4%) 0 (0.0%) 14 (9.4%) 21 (7.7%)
Formal 514 (93.6%) 127 (100.0%) 135 (90.6%) 252 (92.3%)
FYROM Total 608 [10.6%] 139 {22.9%} 154 {25.3%} - 315 {51.8%}
Informal 47 (7.7%) 5 (3.6%) 27 (17.5%) 15 (4.8%)
Formal 561 (92.3%) 134 (96.4%) 127 (82.5%) 300 (95.2%)
Slovenia Total 533 [9.3%] 153 {28.7%} 160 {30.0%} - 220 {41.3%}
Informal 18 (3.4%) 3 (2.0%) 7 (4.4%) 8 (3.6%)
Formal 515 (96.6%) 150 (98.0%) 153 (95.6%) 212 (96.4%)
Bulgaria Total 1,659 [28.8%] 185 {11.2%} 246 {14.8%} 974 {58.7%} 254 {15.3%}
Informal 84 (5.1%) 12 (6.5%) 35 (14.2%) 30 (3.1%) 7 (2.8%)
Formal 1,575 (94.9%) 173 (93.5%) 211 (85.8%) 944 (96.9%) 247 (97.2%)
Croatia Total 908 [15.8%] 145 {16.0%} 175 {19.3%} 502 {55.3%} 86 {9.5%} Informal 24 (2.6%) 6 (4.1%) 12 (6.9%) 2 (0.4%) 4 (4.7%)
Formal 884 (97.4%) 139 (95.9%) 163 (93.1%) 500 (99.6%) 82 (95.3%)
Montenegro Total 137 [2.4%] 13 {9.5%} 14 {10.2%} - 110 {80.3%}
Informal 12 (8.8%) 0 (0.0%) 1 (7.1%) 11 (10.0%)
Formal 125 (91.2%) 13 (100.0%) 13 (92.9%) 99 (90.0%)
Notes: The data is from the EBRD-World Bank Business Environment and Enterprise Performance Survey (BEEPS) II-IV. The sample comprises of firms that started operations on or after 1984. Percentages in parentheses indicate fractions
of firms in a given country-year, percentage is brackets indicate fractions of the total number of firms in all countries-years, and percentages in braces indicate fractions of a firms in all years for each country. Informal refers to informal origin and
formal to no informal origin.
With respect to the distribution of the country sub-sample firm-years: 702 (7.1% informal
origin) are from Albania, 660 (8.3% informal origin) are from Serbia, 549 (6.4% informal origin) are from Bosnia and Herzegovina, 608 (7.7% informal origin) are from FYROM, 533 (3.4% informal origin) are from Slovenia, 1,659 (5.1% informal origin) are from Bulgaria, 908 (2.6% informal origin) are from Croatia, and 137 (8.8% informal origin) are from Montenegro.
Table 2 presents the summary statistics for the main variables in our study. Column 1 presents
averages for the pooled sample of firms with and without informal origin, and then. Columns 2 and 4 present averages for each of the two groups. Signs and levels of significance from a t-test of

REDETE – ECONOMIC DEVELOPMENT AND ENTEREPRENEURSHIP IN TRANSITION ECONOMIES
444
difference in averages between firms with and without informal origin are also presented. Finally, column 3 presents averages for one additional sub-sample of firms, i.e. that of firms with informal origin who are operating for less than or 5 years. Two-sided t-tests between those firms and firms with no informal origin are also presented.
Table 2: Summary statistics
(1) (2) (3) (4) t-tests
Pooled Informal origin Young inf. origin No informal origin (2)vs(4) (3)vs(4) No. of observations 5,756 325 48 5,431 Firm characteristics Foreign 12.9% 10.2% 10.4% 13.0% [ -] [ -] Firm age 10.55 11.39 4.08 10.50 [+] *** [ -] *** SME 85.7% 91.1% 97.9% 85.3% [+] *** [+] ** Performance indicators Total sales 4,816,406 4,917,244 2,906,116 4,810,542 [+] [ -] %3-year sales growth 31.6% 35.6% 98.3% 31.4% [+] [+] *** Full-time employment 64.36 38.26 18.58 65.93 [ -] ** [ -] %3-year employment growth 19.4% 24.3% 36.6% 19.1% [+] ** [+] *** Exporter 33.0% 38.8% 20.8% 32.7% [+] ** [ -] * %Exports 14.4% 15.5% 5.4% 14.3% [+] [ -] ** Total factor productivity 2.11 1.96 1.73 2.12 [ -] [ -] Informal payment indicators Frequency: Customs/imports 2.02 1.95 1.65 2.02 [ -] [ -] Frequency: Courts 1.97 2.01 2.00 1.97 [+] [+] Frequency: Taxes/tax collection 1.98 2.02 2.03 1.98 [+] [+] Frequency: General 2.38 2.51 2.59 2.37 [+] [+] # Informal payments (out of 6) 1.02 1.25 1.74 1.01 [+] ** [+] *** # Informal payments (out of 10) 0.98 1.14 1.59 0.97 [+] * [+] ***
Value of informal payment 50,407 61,196 27,118 49,782 [+] [ -] % sales for informal payments 1.5% 2.0% 1.7% 1.5% [+] ** [+] Access to finance Access to finance 3.68 3.53 3.42 3.69 [-] ** [-] Formal finance 30.9% 38.5% 17.1% 30.3% [+] ** [ -] * Both formal & informal finance 4.5% 5.3% 2.9% 4.4% [+] [ -] Informal finance 9.9% 7.5% 8.6% 10.1% [ -] [ -] No finance 54.7% 48.7% 71.4% 55.2% [ -] * [+] * Supply credit 8.5% 11.0% 4.9% 8.3% [+] [ -] Bank services: 0 3.1% 8.8% 14.6% 2.6% [+] *** [+] *** Bank services: 1 28.6% 25.7% 37.5% 28.9% [ -] [+] Bank services: 2 35.8% 32.9% 31.3% 36.1% [ -] [ -] Bank services: 3 32.5% 32.6% 16.7% 32.4% [+] [ -] ** Industry Manufacturing 35.0% 29.5% 20.8% 35.3% [ -] ** [ -] ** Electricity, gas, steam & air cond, 0.3% 0.0% 0.0% 0.3% [ -] [ -] Water supply; sewerage, waste mng. 1.5% 1.2% 2.1% 1.5% [ -] [+] Wholesale & retail trade; repairs 7.3% 8.0% 6.3% 7.3% [+] [ -] Transportation and storage 34.3% 39.7% 43.8% 34.0% [+] ** [+] Accommodation and food service 5.2% 8.9% 16.7% 5.0% [+] *** [+] *** Information and communication 4.9% 8.0% 2.1% 4.7% [+] *** [ -] Financial and insurance activities 0.6% 0.3% 0.0% 0.6% [ -] [ -] Professional, scientific & technical 7.7% 2.8% 6.3% 8.0% [ -] *** [ -]
Arts, entertainment and recreation 1.9% 0.0% 0.0% 2.0% [ -] *** [ -] Other industries 1.5% 1.5% 2.1% 1.5% [+] [+]
Notes: * p<0.10, ** p<0.05, *** p<0.01: from t-tests of differences in averages.
The average firm age in our sample is 10.55 years, with firms of informal origin being slightly
older on average (11.4 years) compared to formal firms (10.5 years). 12.9% of the firms in our sample have foreign affiliation in terms of having a fraction of the company owned by foreign individuals, companies or organizations. 85.7% of the firms are SMEs (firms with less than 100 employees). Firms of informal origin are significantly more likely to be SMEs (91.1% versus 85.3% of formal firms). 10.2% of the firms of informal origin have a foreign owner, compared to 13% of firms without informal origin (the difference is not statistically significant at conventional levels). In terms of the industrial composition of the sample, using 1-digit ISIC codes, 35% of the

REDETE – ECONOMIC DEVELOPMENT AND ENTEREPRENEURSHIP IN TRANSITION ECONOMIES
445
sample are manufacturing firms, 7.3% are in trade and repairs, 34.3% are in transportation and storage, 5.2% are in accommodation and food service, 4.9% in information and communication, 7.7% in professional, scientific and technical services, and there are smaller fractions of firms in utilities, financial and insurance services, arts & entertainment etc.
The remaining list of main variables for this study comprises of (a) four sets of performance indicators, (b) four sets of “access to finance” indicators, and (c) three sets of informal payment indicators. These sets along with their variations are presented in Table 2, under the respective headings.
4.2 Performance indicators
Our first set of performance indicators comprises of total sales in USD, and 3-year sales gro-wth. The average firm in the sample has USD 4.8 million in sales, with a much lower median of 569.2 thousand212. The average firm has 31.6% sales growth in the last three years. There are no statistically significant differences in terms of the total sales figures between firms with and without informal origin (this is also the case between young informal and firms with no informal origin). The sales growth figure in the last 3 years is 35.6% for firms of informal origin, compared to 31.4% for firms with no informal origin. Young former informal firms have a sales growth figure of 98.3%, and they are significantly more likely to grow faster, compared to all other firms.
Our second set of performance indicators comprises of full-time employment and 3-year full-time employment growth. The average number of employees in the sample is 64, with firms of informal origin being smaller in size compared to their formal counterparts. The former employ 38 employees on average, compared to 66 for firms of no informal origin. The difference is significant at the 5% level. Young informal firms employ 18 full-time workers on average. The average 3-year employment growth rate in the sample is 19.4%, with firms of informal origin growing at a 24.3% rate, young former informal firms growing at a 36.6% rate and firms of no informal origin growing at a 19.1% rate. The differences in average employment growth rate are statistically significant213.
Our third set of performance indicators comprises of a binary variable identifying exporters and a continuous variable capturing the percentage of sales from exports. Table 2 shows that 33% of the firms in the sample are exporters, with an average volume of exports equal to 14.4% of total sales. Firms of informal origin are more likely to be exporters compared to firms of no informal origin (38.8% versus 32.7%). The difference in the percentage of sales exported between the two groups is not statistically significant at conventional levels. Reasonably, young former informal
212 The sales figures are windorized at the 3rd and the 97th percentile by country. 213 Following Davis and Haltiwanger (1992), we compute employment growth for a particular firm, j, as:
where: The growth rate, gi,t, is the difference between the number of employees in firm i at time t, Ei,t, and the number of employees in the previous point in time, Ei,t-3, in proportion to the average number of employees within the three-year period, Xi,t. Gjerløv-Juel and Dahl (2011) suggest that the advantage of using the average employment level, Xi,t, over the initial employment level, E i,t-3, is that it allows for job creation and job destruction by entry and exit, respectively, and it is symmetric around zero for job creation and job destruction. Using E i,t-3 instead would overestimate the growth rate for job creation (gj,t > 0) and underestimate the growth rate in the case of job destruction (leading to a numerically smaller gi,t). The equation for gi,t also takes into account the intuitive correlation between size and growth. A business with only one employee, which recruits additionally two employees, would have a growth rate of 200% using Ei,t-3 and just 100% using Xi,t, whereas a business with an initial employment level of 50 employees and an equivalent increase in staff by two employees by comparison would have a growth rate of 4 and 3.92%, respectively. For exactly this latter reason, we use this same framework to compute 3-year sales growth. In this latter case, the significance of the results is robust to the replacement of Xi,t with Ei,t-3 in the denominator.

REDETE – ECONOMIC DEVELOPMENT AND ENTEREPRENEURSHIP IN TRANSITION ECONOMIES
446
firms are less likely to be exporters and export a lower fraction of their sales, compared to both firms with and without informal origin.
Our final performance indicator is total factor productivity (TFP). We estimate the production function using the technique proposed by Olley and Pakes (1996)214. The estimation results are shown in the Appendix, Table A1, and total factor productivity is predicted as an outcome of this regression. Table 2 shows that the difference in TFP between firms with and without informal origin is not significant. This pattern is robust to a number of variations in the estimation of TFP (using 2nd polynomial expansion, using firm age instead of its log etc).
4.3 Access to finance indicators
Our first indicator approximating access to finance is an ordinal variable asking firms to evaluate how easy is to obtain finance. The variable takes the value 1 if the managers respond “very severe obstacle”, 2 if “major obstacle”, 3 if “moderate obstacle”, 4 if “minor obstacle”, and 5 if they respond “no obstacle”. Firms with informal origin give an average ranking of 3.53, which is significantly smaller compared to the ranking by firms with no informal origin (3.69). The average ranking for young former informal firms is 3.42.
Our second send of variables comprises of 4 binary variables denoting: (i) access to formal finance only, by state or private banks (30.9% of firms), (ii) access to both formal and informal finance (4.5%), (iii) access to informal finance only, e.g. from moneylenders, friends, relatives, neighbors etc. (9.9%), and (iv) no access to finance (54.7%). There is also an independent indicator capturing access to supply credit by suppliers (9.9%). Firms of informal origin are more likely to have acquired finance from a formal institution compared to firms without an informal origin. They are less likely not to have any financing means. The opposite is true for young informal firms, who are less likely to have acquired formal finance and more likely not to have any finance, compared to firms without an informal origin.
Our third financial access indicator approximates customer affiliation with financial institutions, measuring the number of positive responses to questions related to whether a firm has access to a bank account, overdraft facility, and/or a line of credit. The variable ranges from 0 to 3, and Table 2 indicates that 3.1% of the firms have access to zero services, 28.6% have access to one service, 35.8% have access to two services, and 32.5% have access to all three services. Firms of informal origin are more likely to have access to zero services and young informal firms are less likely to have access to all three services.
4.4 Informal payment indicators
Our first set of informal payment indicators comprises of four ordinal variables stemming from questions asking firms to evaluate the frequency with which informal gifts and payment are required towards: (i) customs/imports; (ii) courts; (iii) taxes/tax collection; (iv) in general. The response categories range from 1 (never) to 6 (always). Table 2 indicates that there are no significant differences in the average ranking of the frequency of informal payments between firms with and without an informal origin.
214 We use the opreg command in Stata, by Yasar et al. (2008). Olley and Pakes (1996) introduced a novel approach to
address the simultaneity and selection problems while estimating the production function parameters and firm-level productivity. The simultaneity problems are addressed by using investment to proxy for an unobserved time-varying productivity shock, and the selection problems are addressed by using survival probabilities.

REDETE – ECONOMIC DEVELOPMENT AND ENTEREPRENEURSHIP IN TRANSITION ECONOMIES
447
Our second set of informal payment indicators comprises of two count variables, capturing the number of informal payments made. The first variable counts out of 10 items (electricity, water, phone, certificate, permit, construction, inspection, government contract, imports, and licenses). The second variable counts out of 6 items, to avoid missing variable problems (electricity, phone, permit, inspection, government contract, and licenses). The t-tests indicate that firms with an informal origin are more likely to engage in informal payments during the last year.
The third and final set of informal payment indicators measures the value of informal payments made in USD and as a fraction of the firm’s sales. The average value is higher for firms with an informal origin, compared to formal firms, although the mean difference is not statistically significant. Firms with informal origin pay 2% of their sales on average to informal payments, compared to a figure of 1.5% of the sales of firms without an informal origin.
Retrospectively, the statistics in Table 2 suggest firms stemming from the informal sector are more likely to perform better in terms of sales and employment growth, as well as exports. There are no significant differences in TFP, while the averages for access to finance and informal payments produce mixed insights215. Hence, it is interesting to examine the determinants of these indicators in a regression setting, in order to see whether these differences persist or not. In the next section, we examine our three hypotheses of the previous section and present three sets of estimates for: (a) the impact of informal origin on our performance measures, (b) the impact of the interaction between informal origin and access to finance on our performance measures, and (c) the impact of informal origin on the frequency, number, and value of informal payments. Linear regression models are used for continuous dependent variables, i.e. for the logarithms of sales, employment, and value of informal payments, as well as for the percentage employment and sales growth, the percentage of sales exported, the percentage of sales paid in informal payments and TFP. Non-linear models are used for binary, count and ordinal outcomes. Specifically, probit models are used to estimate the likelihood of being an exporter, poisson models are estimated for the count of informal payments, and ordered probit models are estimated for the ordinal access to finance variable, and the frequency of informal payments.
5. Results and Discussion
Table 3 presents our estimates of the determinants of firm performance. The dependent variables are: the natural logarithm of total sales in column 1, percentage sales growth in column 2, the logarithm of the number of full-time employees in column 3, percentage employment growth in column 4, a binary variable taking the value 1 if the firm is an exporter in column 5, the percentage of sales exported in column 6, total factor productivity in column 7, and an ordinal variable capturing self-assessed access to finance, ranging from 1 (very severe obstacle) to 5 (no obstacle), in column 8. The specification in all columns incorporates a binary variable capturing informal sector origin, a dummy variable for SMEs, one for foreign ownership, the logarithm of firm age, 11 dummy variables for 1-digit ISIC codes, 8 dummy variables for country, four year dummies and a constant term.
215 The Appendix Table A2 presents averages for the main variables for each of the eight countries in our sample. It is shown
that firms in Albania, Croatia and Slovenia have higher total sales on average compared to firms in the remaining countries. Firms in Albania, FYROM and Bosnia and Herzegovina have higher sales growth compared to the remaining firms. The Appendix Table A3 presents the pairwise correlation matrix for the main variables in our study, and stars for significance at the 5% level.

REDETE – ECONOMIC DEVELOPMENT AND ENTEREPRENEURSHIP IN TRANSITION ECONOMIES
448
Table 3: Informal origin and firm performance
Log (Sales)
% Sales growth
Log (Employe
es)
% Empl. growth
Exporter
%Exports
TFP Access to finance
(1) (2) (3) (4) (5) (6) (7) (8) Informal origin -0.115 0.117*** -0.080 0.071*** 0.123**
*
0.037** -0.225 -0.095*
[0.171] [0.044] [0.063] [0.025] [0.032] [0.016] [0.145] [0.057] SME -
2.263*** -0.111*** -
2.671*** -0.046*** -
0.187***
-0.112***
-0.313**
*
-0.212***
[0.102] [0.030] [0.037] [0.016] [0.021] [0.014] [0.091] [0.046] Foreign affiliation 0.644*** 0.013 0.399*** 0.006 0.272**
* 0.176*** 0.111 0.271***
[0.111] [0.031] [0.042] [0.018] [0.023] [0.015] [0.103] [0.048] Log(firm age) 0.355*** -0.356*** 0.221*** -0.115*** 0.047**
* -0.011 0.678**
* 0.038
[0.073] [0.023] [0.027] [0.013] [0.014] [0.008] [0.073] [0.031] Countries (Ref.: Montenegro)
Albania 0.778** 0.654*** 0.110 -0.028 0.174***
0.076*** -0.365 -0.481***
[0.331] [0.104] [0.086] [0.043] [0.064] [0.018] [0.517] [0.114] Serbia 0.773** 0.272*** -0.067 -0.105** 0.251**
* 0.022 -0.477 -0.833***
[0.314] [0.102] [0.087] [0.042] [0.063] [0.016] [0.505] [0.113] Bosnia & Herzegovina
0.492 0.413*** -0.016 -0.106** 0.215***
0.055*** -0.358 -0.544***
[0.328] [0.101] [0.088] [0.042] [0.064] [0.017] [0.510] [0.114] FYROM 0.279 0.432*** -0.152* -0.108** 0.262**
* 0.109*** -0.305 -0.588***
[0.323] [0.102] [0.088] [0.043] [0.063] [0.018] [0.511] [0.115] Slovenia 2.134*** 0.592*** -0.178** -0.134*** 0.453**
* 0.133*** -0.377 -0.296**
[0.308] [0.100] [0.090] [0.043] [0.056] [0.019] [0.502] [0.116] Bulgaria -0.166 0.366*** -0.043 -0.165*** 0.128**
0.067*** -0.639 -0.518***
[0.315] [0.100] [0.085] [0.041] [0.059] [0.016] [0.506] [0.111] Croatia 1.501*** 0.579*** -0.196** -0.168*** 0.216**
* 0.047*** -0.709 -0.428***
[0.317] [0.101] [0.088] [0.042] [0.063] [0.017] [0.507] [0.117]
Prediction 13.11 31.63% 2.91 19.36% 30.60% 14.42% 2.11 - No. of observations 4,927 4,883 5,729 5,395 5,744 5,744 3,414 5,571 No. of firms 4,488 4,456 5,076 4,780 5,091 5,091 3,012 4,918 Adjusted R2/ Pseudo R2
0.273 0.212 0.57 0.05 0.156 0.19 0.091 0.014
F-stat/Wald χ2 -11034.3 -5148.8 -7755.1 -2290.3 -3077.8 -504.5 -6679.3 -7970.7
Notes: Linear models, with the exception of column 5 (probit) and column 8 (ordered probit). The specification also includes 1-digit ISIC codes (11 industries), year dummies and a constant term. * p<0.10, ** p<0.05, *** p<0.01
The results in Table 3 show that firms of informal origin have higher 3-year sales and employ-
ment growth, and are more likely to be exporters, as well as to export a higher fraction of their sa-les. Moreover, they are less likely to report that they have no obstacles in accessing finance, com-pared to their counterparts without an informal origin. The effects are of considerable magnitude, and statistically significant at the 1% level, with the exception of columns 5 and 8 in which the coefficients for firms with informal origin are significant at the 5% and the 10% level respect-tively. Specifically, firms of informal origin have 11.7 percentage point higher sales growth, 7.1 percentage point higher employment growth, 12.3 percentage point higher probability to export and 3.7 percentage point higher fraction of their sales exported. Given the sample predictions at the bottom of the table, the magnitude of the effect is in the order of 37 percent higher sales and employment growth, 40 percent higher exporting probability, and 25 percent higher fraction of sales exported.
Among the other interesting findings, SMEs perform worse in all performance indicators, and foreign firms have higher volumes of sales and employment, but do not grow faster. The latter are

REDETE – ECONOMIC DEVELOPMENT AND ENTEREPRENEURSHIP IN TRANSITION ECONOMIES
449
also more likely to export and have easier access to finance. Ceteris paribus, firms in Slovenia, are the top performers in terms of sales, sales growth and exports, and firm in Montenegro and Albania are the top performers in terms of employment, employment growth, and access to finance. The contrast between firms of informal origin and the SMEs in terms of performance is of great interest, as SMEs in Eastern and Central Europe are often claimed to be responsible for most of the employment growth. The results contradict this view for the Balkans, and highlight the higher performance of firms with informal sector experience in the past.
This particular latter result could be very misleading if firms of informal origin tend to die younger, because of initially worse performance. This survivorship bias would bias our estimates upwards. In order to mitigate such concerns as much as possible given the available data, we perform three specific robustness exercises, presented in Table 4. In Panel A, we match firms of informal origin with similar firms without informal origin. To accommodate that firms of informal origin may not survive as long as those without any prior informal sector experience, we use regression weights. Weights are calculated using 5 nearest-neighbor propensity score matching; the outcome variable is the informal origin dummy variable, and controls are the socio-demographic characteristics used in the specification of Table 3216. In Panel B we include an interaction term between informal origin and firm age lower than or equal to five years (Young). The firm age variable is replaced with Young in this specification. Finally, in Panel C, we present estimates for the sub-sample of firms with age less than or equal to five years.
216 We use the psmatch2 package in Stata.
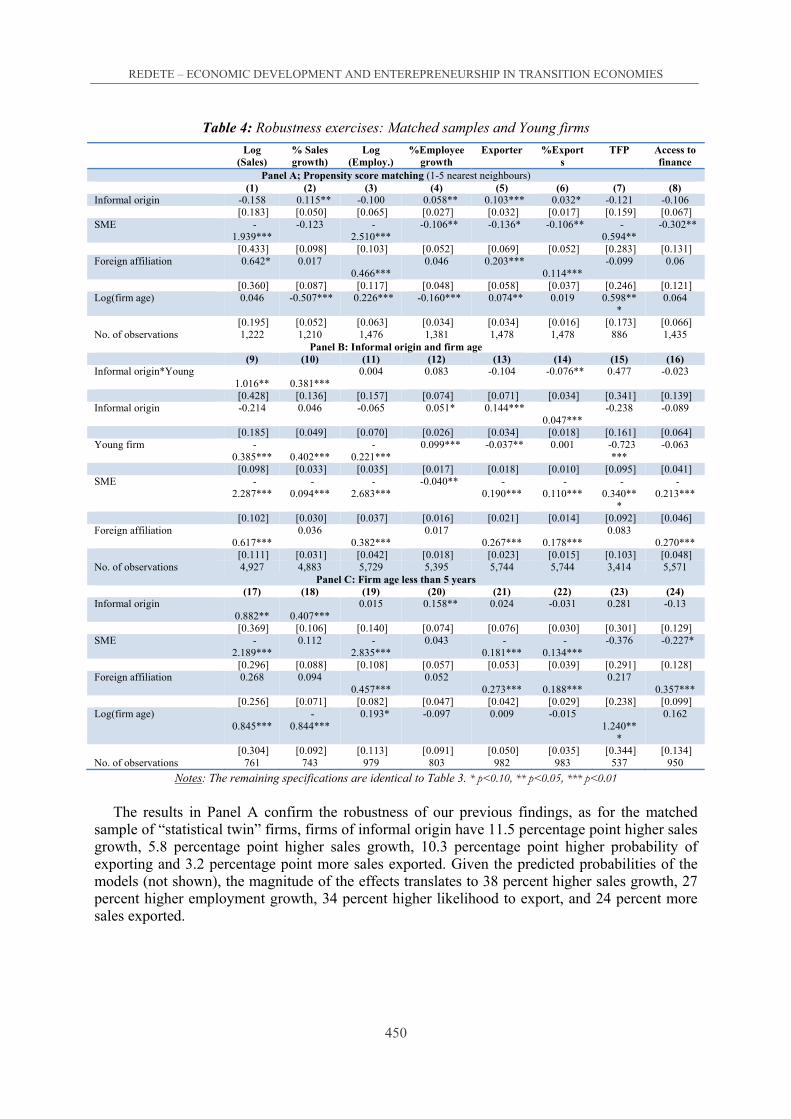
REDETE – ECONOMIC DEVELOPMENT AND ENTEREPRENEURSHIP IN TRANSITION ECONOMIES
450
Table 4: Robustness exercises: Matched samples and Young firms
Log (Sales)
% Sales growth)
Log (Employ.)
%Employee growth
Exporter %Exports
TFP Access to finance
Panel A; Propensity score matching (1-5 nearest neighbours) (1) (2) (3) (4) (5) (6) (7) (8) Informal origin -0.158 0.115** -0.100 0.058** 0.103*** 0.032* -0.121 -0.106 [0.183] [0.050] [0.065] [0.027] [0.032] [0.017] [0.159] [0.067] SME -
1.939*** -0.123 -
2.510*** -0.106** -0.136* -0.106** -
0.594** -0.302**
[0.433] [0.098] [0.103] [0.052] [0.069] [0.052] [0.283] [0.131] Foreign affiliation 0.642* 0.017
0.466*** 0.046 0.203***
0.114*** -0.099 0.06
[0.360] [0.087] [0.117] [0.048] [0.058] [0.037] [0.246] [0.121] Log(firm age) 0.046 -0.507*** 0.226*** -0.160*** 0.074** 0.019 0.598**
* 0.064
[0.195] [0.052] [0.063] [0.034] [0.034] [0.016] [0.173] [0.066] No. of observations 1,222 1,210 1,476 1,381 1,478 1,478 886 1,435
Panel B: Informal origin and firm age (9) (10) (11) (12) (13) (14) (15) (16) Informal origin*Young
1.016**
0.381*** 0.004 0.083 -0.104 -0.076** 0.477 -0.023
[0.428] [0.136] [0.157] [0.074] [0.071] [0.034] [0.341] [0.139] Informal origin -0.214 0.046 -0.065 0.051* 0.144***
0.047*** -0.238 -0.089
[0.185] [0.049] [0.070] [0.026] [0.034] [0.018] [0.161] [0.064] Young firm -
0.385***
0.402*** -
0.221*** 0.099*** -0.037** 0.001 -0.723
*** -0.063
[0.098] [0.033] [0.035] [0.017] [0.018] [0.010] [0.095] [0.041] SME -
2.287*** -
0.094*** -
2.683*** -0.040** -
0.190*** -
0.110*** -
0.340***
-0.213***
[0.102] [0.030] [0.037] [0.016] [0.021] [0.014] [0.092] [0.046] Foreign affiliation
0.617*** 0.036
0.382*** 0.017
0.267***
0.178*** 0.083
0.270*** [0.111] [0.031] [0.042] [0.018] [0.023] [0.015] [0.103] [0.048] No. of observations 4,927 4,883 5,729 5,395 5,744 5,744 3,414 5,571
Panel C: Firm age less than 5 years (17) (18) (19) (20) (21) (22) (23) (24) Informal origin
0.882**
0.407*** 0.015 0.158** 0.024 -0.031 0.281 -0.13
[0.369] [0.106] [0.140] [0.074] [0.076] [0.030] [0.301] [0.129] SME -
2.189*** 0.112 -
2.835*** 0.043 -
0.181*** -
0.134*** -0.376 -0.227*
[0.296] [0.088] [0.108] [0.057] [0.053] [0.039] [0.291] [0.128] Foreign affiliation 0.268 0.094
0.457*** 0.052
0.273***
0.188*** 0.217
0.357*** [0.256] [0.071] [0.082] [0.047] [0.042] [0.029] [0.238] [0.099] Log(firm age)
0.845*** -
0.844*** 0.193* -0.097 0.009 -0.015
1.240***
0.162
[0.304] [0.092] [0.113] [0.091] [0.050] [0.035] [0.344] [0.134] No. of observations 761 743 979 803 982 983 537 950
Notes: The remaining specifications are identical to Table 3. * p<0.10, ** p<0.05, *** p<0.01
The results in Panel A confirm the robustness of our previous findings, as for the matched sample of “statistical twin” firms, firms of informal origin have 11.5 percentage point higher sales growth, 5.8 percentage point higher sales growth, 10.3 percentage point higher probability of exporting and 3.2 percentage point more sales exported. Given the predicted probabilities of the models (not shown), the magnitude of the effects translates to 38 percent higher sales growth, 27 percent higher employment growth, 34 percent higher likelihood to export, and 24 percent more sales exported.

REDETE – ECONOMIC DEVELOPMENT AND ENTEREPRENEURSHIP IN TRANSITION ECONOMIES
451
The estimate for the interaction term between young firms and informal origin in Panel B shows that young former informal firms have higher sales and higher sales growth. They have 152 percent higher sales217 compared to the remaining firms and 120 percent (38 percentage point higher sales growth). Moreover, they are less likely to export in high volumes. Finally, the estimates for the sample of firms with age less than or equal to five years suggest that among the young firms, those with informal origin have higher volume of sales, higher sales growth and higher employment growth. The magnitude of the effects is 125 percent higher volume of sales, 129 percent (40.7 percentage points) higher sales growth, and 82 percent (15.8 percentage points) higher employment growth.
All three panels confirm that, to the extent that survivorship bias can be mitigated by matching firms and examining young firms, firms of informal origin grow considerably faster in terms of sales and employment. Taken together, our results strongly reject hypothesis 1, providing evidence of the contrary, i.e. firms of informal origin in the Balkans perform better in terms of sales growth and employment growth, as well as in the likelihood and volume of sales exported.
The competitive view of the informal sector stresses the role of the interaction between informality and access to finance for performance. In the following two tables, we examine the importance of this interaction term in three distinct settings, using the three sets of variable approximating access to finance described in the previous section. In Table 5, columns 1-7 we estimate the specifications of columns 1-7 of the previous two tables, including an interaction term between informal origin and ease of access to finance, i.e. the ordinal variable that ranks from 1-5, with 5 denoting that access to finance is no obstacle. The inspection of the results indicates that firms of informal origin with easier access to finance have higher 3-year sales growth, compared to their counterpart firms with more obstacles in access to finance.
217 The calculation of the effect of dummy variables in models with log-transformed dependent variables is based
on the following formula: 100(exp(Coef. - )-1)

REDETE – ECONOMIC DEVELOPMENT AND ENTEREPRENEURSHIP IN TRANSITION ECONOMIES
452
Table 5: Informal origin, access to finance and firm performance
Log (Sales)
% Sales growth)
Log (Employ.)
%Employ. growth
Exporter %Exports
TFP
(1) (2) (3) (4) (5) (6) (7)
Informal origin -0.095 -0.404 -0.132 0.311 0.055 0.032 -0.481 [0.526] [0.328] [0.176] [0.998] [0.092] [0.047] [0.445] Access to finance (1-5) 0.012 -0.043** 0.019* -0.152** -0.005 0.001 0.033 [0.028] [0.020] [0.011] [0.063] [0.006] [0.003] [0.026] Informal origin*Access to finance
0.003 0.153* 0.013 0.160 0.017 0.001 0.085
[0.142] [0.083] [0.054] [0.262] [0.023] [0.013] [0.125] No. of observations 4,808 2,864 5,557 4,241 5,571 5,571 3,341 No. of firms 4,369 2,729 4,904 3,843 4,918 4,918 2,939
(8) (9) (10) (11) (12) (13) (14) Informal origin -
0.502*** 0.083* -0.121 0.078***
0.155*** 0.031* -0.197
[0.184] [0.048] [0.081] [0.029] [0.038] [0.018] [0.135] Formal finance 0.421*** 0.119*** 0.317*** 0.092*** 0.062*** 0.015 0.116 [0.100] [0.030] [0.045] [0.017] [0.023] [0.011] [0.086] Both formal and informal finance
0.219 0.088 0.347*** 0.151*** 0.092* 0.01 -0.04
[0.182] [0.057] [0.103] [0.041] [0.051] [0.023] [0.127] Informal finance -0.092 0.114*** 0.054 0.045* 0.048 0.029* -0.185* [0.134] [0.043] [0.067] [0.027] [0.037] [0.017] [0.111] No finance {Ref.} {Ref.} {Ref.} {Ref.} {Ref.} {Ref.} {Ref.}
Supply credit 0.379** 0.011 0.252*** 0.025 0.083**
0.040**
0.248
[0.173] [0.052] [0.067] [0.028] [0.035] [0.018] [0.162] No. of observations 2,412 2,378 3,013 2,872 3,011 3,017 1,773 No. of firms 2,019 1,995 2,429 2,325 2,433 2,433 1,411
(15) (16) (17) (18) (19) (20) (21) Informal origin -0.141 0.122** -0.046 0.067*
0.099** 0.017 -0.023
[0.213] [0.060] [0.088] [0.034] [0.040] [0.020] [0.171] Formal finance
0.487*** 0.106*** 0.303*** 0.073*** 0.036* 0.007
0.183** [0.099] [0.030] [0.045] [0.017] [0.020] [0.011] [0.086] Informal origin*Formal finance -0.840** -0.087 -0.190 0.033 0.080 0.037 -0.428 [0.381] [0.096] [0.169] [0.058] [0.066] [0.038] [0.263] No. of observations 2,412 2,378 3,013 2,872 3,017 3,017 1,773 No. of firms 2,019 1,995 2,429 2,325 2,433 2,433 1,411
(22) (23) (24) (25) (26) (27) (28) Young informal -0.288 0.174 -0.162 0.063 0.087 -0.025 0.199 [0.521] [0.136] [0.172] [0.078] [0.084] [0.030] [0.438] Formal finance
0.387*** 0.101*** 0.279*** 0.077***
0.047** 0.011 0.135
[0.097] [0.029] [0.044] [0.017] [0.019] [0.011] [0.082] Young informal*Formal finance
2.477*** 0.344* 0.435 0.145 0.005 0.012 0.031
[0.794] [0.199] [0.433] [0.198] [0.205] [0.073] [0.769] No. of observations 2,412 2,378 3,013 2,872 3,017 3,017 1,773 No. of firms 2,019 1,995 2,429 2,325 2,433 2,433 1,411
Notes: The remaining specifications are identical to Table 3. * p<0.10, ** p<0.05, *** p<0.01
Columns 8-14 incorporate a set of four dummy variables, capturing access to formal finance
exclusively, access to both formal and informal finance, access to informal finance only, and no access to finance, respectively. The results in all columns indicate that access to formal finance exerts a positive impact of a large magnitude to the majority of our performance dependent variables. Columns 15-21 present estimates which include an interaction term between informal origin and access to formal finance exclusively. The interaction term is insignificant in all specifications and exerts a negative impact on sales in column 15. This pattern is reversed when we include an interaction term between formal finance and young firms of informal origin in columns 22-28. In columns 22 and 23, the interaction term exerts a positive impact of large

REDETE – ECONOMIC DEVELOPMENT AND ENTEREPRENEURSHIP IN TRANSITION ECONOMIES
453
magnitude to both total sales and 3-year sales growth. Hence, young informal firms with access to formal means of finance perform much better in terms of sales and sales growth compared to their counterparts without access to formal finance.
In Table 6, we test the robustness of our findings with respect to the importance of access to finance by presenting estimates which incorporate a proxy for customer affiliation with financial institutions, i.e. the number of banking services used, ranging from zero to three. The results in columns 1-7 show that the number of banking services used is positively related to the vast majority of our performance indicators, with the only exception of the fraction of sales exported. In columns 8-14, we incorporate an interaction term between informal origin and the number of banking services used. The interaction term exerts an insignificant impact in all seven perfor-mance measures. Finally, columns 15-21 present results from specifications which incorporate an interaction term between young firms of informal origin and number of banking services used. The results show that young former informal firms who use more banking services have significantly higher sales growth and employment growth figures.
Table 6: Informal origin, customer affiliation with financial institutions and firm performance
Log
(Sales) % Sales growth
Log (Employ.)
%Employ. growth
Exporter %Exports TFP
(1) (2) (3) (4) (5) (6) (7) Informal -0.037 0.084* 0.011 0.051* 0.122*** 0.032* -0.214 [0.185] [0.051] [0.058] [0.026] [0.037] [0.018] [0.165] No. of bank services 0.408*** 0.074*** 0.239*** 0.064*** 0.058*** 0.002
0.168*** [0.053] [0.016] [0.020] [0.008] [0.011] [0.006] [0.050] No. of observations 3,657 3,647 3,788 3,492 3,802 3,802 2,316 No. of firms 3,334 3,334 3,320 3,057 3,334 3,334 2,026
(8) (9) (10) (11) (12) (13) (14) Informal origin -0.196 0.135 -0.127 0.029 -0.018 -0.024 -0.637** [0.375] [0.115] [0.124] [0.054] [0.054] [0.031] [0.309] No. of bank services 0.401*** 0.076*** 0.232*** 0.062*** 0.040*** -0.001
0.146*** [0.055] [0.017] [0.021] [0.008] [0.009] [0.006] [0.053] Informal origin*No. of bank services
0.079 -0.025 0.071 0.011 0.057** 0.029* 0.217
[0.172] [0.050] [0.055] [0.026] [0.026] [0.015] [0.141] No. of observations 3,657 3,647 3,788 3,492 3,802 3,802 2,316 No. of firms 3,334 3,334 3,320 3,057 3,334 3,334 2,026
(15) (16) (17) (18) (19) (20) (21) Young informal 0.768 0.313 -0.26 0.07 0.097 -0.005 -0.29 [0.717] [0.247] [0.209] [0.107] [0.125] [0.055] [0.612] No. of bank services 0.407*** 0.075*** 0.237*** 0.064*** 0.048*** 0.003
0.161*** [0.053] [0.016] [0.020] [0.008] [0.009] [0.006] [0.050] Young informal*No. of bank services
0.083 0.134* 0.131 0.142** -0.071 -0.034 0.347
[0.373] [0.0766] [0.112] [0.057] [0.065] [0.028] [0.283] No. of observations 3,657 3,647 3,788 3,492 3,802 3,802 2,316 No. of firms 3,334 3,334 3,320 3,057 3,334 3,334 2,026
Notes: The remaining specifications are identical to Table 3. * p<0.10, ** p<0.05, *** p<0.01
Altogether, the results of this section provide moderate positive evidence rejecting hypothesis
2, i.e. the interaction between informal origin and access to formal finance does exert a positive impact on some of our performance indicators, such as sales growth, but the effects are higher and more significant for young firms of informal origin. We interpret this evidence as favourable to the competitive view of the informal sector in the Balkans.
Our final set of estimates test our third and final hypothesis which is related to informal origin and the persistence of informal forms of business conduct. Table 7, columns 1-8 present the estimation results from specifications which use the same set of independent variables as in Table

REDETE – ECONOMIC DEVELOPMENT AND ENTEREPRENEURSHIP IN TRANSITION ECONOMIES
454
3. For reasons of space we present the estimates which use one distinct feature, i.e. incorporating two dummy variables for firms of informal origin with age less than (or equal to) five years, and firms with informal origin which operate for more than five years. The reference category comprises of firms without informal origin. The dependent variable in column 1 is the frequency of informal payments in general, ranging from 1 (least frequent) to 5 (most frequent). Then, the dependent variable is the frequency of informal payments (1-5): to tax authorities in column 2; to courts in column 3; and to customs in column 4. The dependent variable in column 5 is the count of informal payments in a total of 10 items, and the count out of 6 items in column 6 (fewer missing observations). Columns 7 and 8 have the percentage of sales given in informal payments and the logarithm of the value of informal payments in USD as dependent variables.
Table 7: Informal origin and informal norms & payments
General Taxes Courts Customs
#Inf. paym.(10)
#Inf. paym.(6)
%Sales Log(Inf. paym.)
(1) (2) (3) (4) (5) (6) (7) (8)
Informal origin*Firm age≤5
0.010 -0.171 -0.244 -0.553*** 0.245 0.190 0.002 -0.150
[0.174] [0.189] [0.217] [0.203] [0.165] [0.180] [0.004] [0.450]
Informal origin*Firm age>5
0.064 0.066 0.006 -0.003 0.038 -0.022 0.005* 0.493
[0.081] [0.086] [0.082] [0.082] [0.099] [0.102] [0.002] [0.303]
No informal origin {Ref.} {Ref.} {Ref.} {Ref.} {Ref.} {Ref.} {Ref.} {Ref.}
SME 0.137** 0.191*** 0.190*** 0.161** 0.239*** 0.297*** 0.005*** 0.166
[0.058] [0.067] [0.064] [0.065] [0.072] [0.073] [0.001] [0.167]
Foreign -0.009 -0.086 0.027 0.108* -0.040 -0.039 -0.001 0.134
[0.055] [0.065] [0.062] [0.063] [0.060] [0.061] [0.002] [0.160]
Log(Firm age) -0.009 -0.049 -0.021 -0.053 -0.03 -0.027 -0.001 -0.008
[0.043] [0.047] [0.046] [0.046] [0.047] [0.048] [0.001] [0.112]
Countries: (Ref.: Montenegro)
Albania 1.040*** 1.388*** 1.331*** 1.201*** 1.321*** 1.322*** 0.021*** 2.029***
[0.127] [0.135] [0.157] [0.132] [0.229] [0.229] [0.006] [0.477]
Serbia 0.700***
0.873***
1.128***
0.667***
0.886*** 0.896*** 0.006 1.793***
[0.121] [0.129] [0.150] [0.126] [0.232] [0.233] [0.006] [0.487]
Bosnia & Herzegovina 0.538***
0.872***
1.108***
0.737***
0.887*** 0.878*** -0.001 1.703***
[0.121] [0.129] [0.150] [0.125] [0.233] [0.232] [0.006] [0.499]
FYROM 0.386***
0.307** 0.866***
0.295** 0.539** 0.542** 0.001 0.945**
[0.122] [0.131] [0.150] [0.128] [0.235] [0.235] [0.006] [0.478]
Slovenia -0.338***
-0.470***
-0.146 -0.563***
0.003 0.005 -0.004 0.836*
[0.129] [0.142] [0.158] [0.136] [0.250] [0.251] [0.006] [0.471]
Bulgaria 0.515***
0.601***
0.867***
0.528***
0.878*** 0.873*** 0.007 2.445***
[0.120] [0.127] [0.149] [0.125] [0.230] [0.230] [0.006] [0.489]
Croatia 0.156 0.098 0.429***
0.009 0.373 0.343 0.001 2.028***
[0.130] [0.139] [0.159] [0.138] [0.240] [0.241] [0.006] [0.481]
Years (Ref.: 2002)
Year 2005 -0.054 -0.064 0.081 -0.148***
-0.086* -0.096** -0.006***
-0.056
[0.046] [0.050] [0.052] [0.051] [0.044] [0.044] [0.001] [0.038] Year 2007 -0.143 -0.206 -0.093 -0.441 -1.794*** -2.008*** 0.001 -0.097
[0.337] [0.397] [0.391] [0.384] [0.068] [0.069] [0.002] [0.131]
Year 2009 -0.239***
-0.189***
0.016 -0.293***
-1.017*** -1.200*** 0.003 3.840***
[0.050] [0.057] [0.056] [0.056] [0.067] [0.069] [0.002] [0.211]

REDETE – ECONOMIC DEVELOPMENT AND ENTEREPRENEURSHIP IN TRANSITION ECONOMIES
455
General Taxes Courts Customs
#Inf. paym.(10)
#Inf. paym.(6)
%Sales Log(Inf. paym.)
No. of observations 3,829 3,731 3,670 3,666 5,252 5,148 4,371 5,744
No. of clusters 3,178 3,078 3,019 3,018 4,599 4,495 3,741 5,091
Pseudo/Adjusted R2 0.045 0.077 0.054 0.072 - - 0.066 0.129
Wald χ2 / F-statistic 448.91*** 616.08*** 1027.99*** 589.99*** 1701.66*** 2048.67*** 14.47*** 16.81***
Notes: * p<0.10, ** p<0.05, *** p<0.01. The models estimated are ordered probit in columns 1-4, poisson regressions in columns 5-6, and linear regressions in columns 7-8.
The inspection of the results provides a strong positive answer to our Hypothesis 3, indicating
that firms of informal are not more likely to engage in any type of informal payments. Young informal firms are even less likely to frequently give informal payments to customs. We interpret this result with caution, as we have seen that young informal firms are less likely to be exporters in the first place. Moreover, older former informal firms give a slightly higher fraction of their sales to informal payments, compared to firms without informal origin. However, the vast majority of coefficients for firms of informal origin, both younger and older, are insignificant at all conventional levels. Hence, the hypothesis that norms of informality persist in the future is strongly rejected by the data.
6. Concluding Remarks
In the last two decades, the Balkan counties have been a laboratory of business environment and financial sector reform in the post-communist and the post-conflict processes. Within this interesting environment of reform, we examine three important hypotheses related to the performance and behaviour/conduct of firms that stemmed from the informal sector. Specifically, we examine whether formerly informal firms perform better or worse compared to their counterparts without any informal origin. Our results indicate that they actually perform better in terms of sales and employment growth, as well as exporting activity. These findings are robust to a number of features, and even strengthened when comparing statistically similar and younger firms. Secondly, we examine the interaction of access to finance and informal origin, an interplay which is pivotal to testing the recently expressed view of the competitive role of the informal sector in some counties. Our results indicate a moderate positive relationship between access to finance among former informal firms and their performance. That relationship is stronger for young firms of informal origin, and we interpret this as in accordance with a competitive aspect of informality in the Balkans. Finally, we test whether informal forms of conduct persist and are stronger among formerly informal firms. Our results strongly reject this conjecture.
These results can be thought to support the perception of the informal sector as a potential incubator for viable formal entrepreneurship in the early years of transition, through which individuals acquire skills that can facilitate their future entrepreneurial activities. Our finding that experience in ‘grey’ or ‘unofficial’ markets may be seen as an outlet to latent entrepreneurship might be considered in the policy dialogue on the treatment of the informal sector after economic liberalization in the process of economic development (Kaufmann and Kaliberda, 1996; Johnson et al., 1997). Given Baumol’s (1990) view supporting the existence of a fixed pool of entrepreneurial talent, the findings contribute to the debate on the treatment of informality in the Balkans, i.e. whether this should target its banning and prosecution or if opportunities should be sought aiming at the reallocation of “jack of all trades” talent (Lazear, 2004) in more efficient markets.

REDETE – ECONOMIC DEVELOPMENT AND ENTEREPRENEURSHIP IN TRANSITION ECONOMIES
456
References
1. Alderslade, J., J. Talmage and Y. Freeman (2006). ‘Measuring the Informal Economy: One Neighborhood at a Time’. Discussion Paper, The Brooking Institution Metropolitan Policy Program, Washington D.C., September 2006.
2. Amaral, P. S. and E. Quintin, (2006). ‘A Competitive Model of the Informal Sector’. Journal of Monetary Economics, 53, pp. 1541–1553.
3. Ariely, D., G. Loewenstein and D. Prelec (2003). ‘‘Coherent Arbitrariness’: Stable Demand Curves without Stable Preferences’. Quarterly Journal of Economics. 118(1), pp. 73-105.
4. Ariely, D., G. Loewenstein and D. Prelec (2006). ‘Tom Sawyer and the Construction of Value’. Journal of Economic Behavior and Organisation. 60, pp. 1-10.
5. Baumol, W. J. (1990). ‘Entrepreneurship: Productive, Unproductive, and Destructive’. Journal of Political Economy. 98(5), pp. 893–921.
6. Bennett, J. and S. Estrin (2007). ‘Informality as a Stepping Stone. Entrepreneurial Entry in a Developing Economy’. IZA Discussion Paper No. 2950, Bonn: IZA.
7. Blau, D. M. (1985). ‘Self-employment and Self-selection in Developing Country Labour Markets’. Southern Economic Journal. 52(2), pp. 351–363.
8. Bowles, S. (1998). ‘Endogenous Preferences: The Cultural Consequences of Markets and Other Economic Institutions’. Journal of Economic Literature. 36(1), pp. 75-111.
9. Brück, T., J.B. Haisten-DeNew and K.F. Zimmermann (2006). ‘Creating Low-Skilled Jobs by Subsidizing Market Contracted Household Work’. Applied Economics. 38(4), pp. 899-911.
10. Cantens, T. (2012) ‘Informal Trade Practices’. WCO Working Paper, No 22. 11. Carpenter, J. P. (2005). ‘Endogenous Social Preferences’. Review of Radical Political
Economics. 37(1), pp. 63-84. 12. Chandra, V. and M. A. Khan (1993). ‘Foreign Investment in the Presence of an Informal
Sector’. Economica, 60(237), pp. 79–103. 13. Chen, M. (2004). ‘Rethinking the Informal Economy: Linkages with the Formal Economy and
the Formal Regulatory Environment’. Paper presented a EGDI-WIDR Conference ´Unleashing Human Potential: Linking the Informal and Formal Sectors, Helsinki, Finland, 2004.
14. de Paula, A. and J. Scheinkman (2007). ‘The Informal Sector’. NBER Working Paper No. 13486, Cambridge, MA: NBER.
15. Demirgüç-Kunt, A., L. F. Klapper, and G. A. Panos (2011). ‘Entrepreneurship in Post-Conflict Transition: The Role of Informality and Access to Finance’. Economics of Transition. 19(1), pp. 27-78.
16. Demirgüç-Kunt, A., L. F. Klapper, and G. A. Panos (2012). ‘Entrepreneurial Finance in the Western Balkans: Characteristics of the Newly Self-Employed in Albania, Bosnia and Herzegovina, and Serbia’. In: Cull Robert, Demirgüç-Kunt Asli, and Jonathan Morduch (Eds). Banking the World: Empirical Foundations of Financial Inclusion. Boston, MA: MIT Press: Forthcoming.
17. Djankov, S. and P. Murrell (2002). ‘Enterprise Restructuring in Transition: A Quantitative Survey’. Journal of Economic Literature. 40(3), pp. 739–792.
18. Evans, D. S. and B. Jovanovic (1989). ‘An Estimated Model of Entrepreneurial Choice Under Liquidity Constraints’. Journal of Political Economy. 97(4), pp. 808–827.
19. Fehr, E., and S. Gächter (2000). ‘Fairness and Retaliation: The Economics of Reciprocity’. Journal of Economic Perspectives. 14(3), pp. 159-181.
20. Festinger, L. (1957). A Theory of Cognitive Dissonance. Stanford, CA: Stanford University Press.
21. Flaming, D., B. Hayolamak and P. Jossart (2005). Hopeful Workers, Marginal Jobs: LA’s Off-The- Books Labor Force. Economic Roundtable, Los Angeles, CA, 2005.

REDETE – ECONOMIC DEVELOPMENT AND ENTEREPRENEURSHIP IN TRANSITION ECONOMIES
457
22. Fleming, M.H., J. Roman, and G. Farrel (2000). ‘The Shadow Economy’. Journal of International Affairs. 53(2), pp. 64-89.
23. Friedman, E., S. Johnson, D. Kaufmann, and P. Zoido-Lobaton (2000). ‘Dodging the Grabbing Hand: The Determinants of Unofficial Activities in 69 Countries’. Journal of Public Economics. 76, pp. 459-93.
24. Galiani, S. and F. Weinschelbaum (2007). ‘Modeling Informality Formally: Households and Firms’. CEDLAS Working Paper No. 47, La Plata, Argentina: Centro de Estudios Distributivos, Laborales y Sociales, Universidad Nacional de La Plata.
25. Goldman, M. (1972). The Spoils of Progress: Environmental Pollution in the Soviet Union. Cambridge: Massachusetts.
26. Grødeland, Å. B and A. Aasland (2007). ‘Informality and Informal Practices in East, Central and South East Europe ́ Complex Europe’. CERC Working Papers Series. No 3/2007.
27. Guariglia, A. and B.-Y. Kim (2006). ‘The Dynamics of Moonlighting: What is Happening in the Russian Informal Economy’. The Economics of Transition. 14(1), pp. 1–45.
28. Harris, J. R. and M. P. Todaro (1970). ‘Migration, Unemployment and Development: A Two Sector Analysis’. American Economic Review. 60(1), pp. 126–142.
29. Hausman, R. and D. Rodrik (2003). ‘Economic Development as Self-discovery’. Journal of Development Economics. 72, pp. 603–633.
30. Hausman, R., J. Hwang, and D. Rodrik (2007). ‘What you Export Matters’. Journal of Economic Growth. 12(1), pp. 1–25.
31. Hirschman, A. O. (1977). The Passions and the Interests: Political Arguments for Capitalism before its Triumph. Princeton, NJ: Princeton University Press.
32. Hirschman, A. O. (1982). ‘Rival Interpretations of Market Society: Civilizing, Destructive, or Feeble?’ Journal of Economic Literature. 20(4), pp. 1463-84.
33. Hoeffler, S., and D. Ariely (1999). ‘Constructing Stable Preferences: A Look into Dimensions of Experience and their Impact on Preference Stability’. Journal of Consumer Psychology. 8(2), pp. 113-139.
34. Iyigun, M. F., and A. L. Owen (1998). ‘Risk, Entrepreneurship, and Human Capital Accumu-lation’. American Economic Review Papers and Proceedings. 88(2), pp. 454–457.
35. Johnson, S., D. Kaufmann, A. Shleifer, M. I. Goldman, and M. L. Weitzman (1997). ‘The Unofficial Economy in Transition’. Brookings Papers of Economic Activity. 1997(2), pp. 159–239.
36. Kaufmann, D., and A. Kaliberda (1996). ‘Integrating the Unofficial Economy into the Dynamics of Post-socialist Economies. A Framework of Analysis and Evidence’. World Bank Policy Research Working Paper No. 1691, Washington, DC: The World Bank.
37. Klapper, L. F., R. Amit, M. F. Guillén, and J. M. Quesada (2007). ‘Entrepreneurship and Firm Formation Across Countries’. World Bank Policy Research Working Paper No. 4313.
38. Lazear, E. P. (2004). ‘Balanced Skills and Entrepreneurship’. American Economic Review Papers and Proceedings. 94(2), pp. 208–211.
39. Lewis, A. W. (1954). ‘Economic Development with Unlimited Supplies of Labour’. The Manchester School. 22, pp. 139–191.
40. Loayza, N. V. (1994). ‘Labor Regulations and the Informal Economy’. World Bank Policy Research Working Paper No. 1335, Washington, DC: The World Bank.
41. Loayza, N. V. (1996). ‘The Economics of the Informal Sector: A Simple Model and Some Empirical Evidence from Latin America’. Carnegie-Rochester Series on Public Policy. 45, pp. 129–162.
42. Loayza, N., Oviedo, A. M. and Serven, L. (2006). ‘The Impact of Regulation on Growth and Informality: Cross-country evidence’. In: Guha-Khasnobis, B., Kanbur, R. and Ostrom, E. (Eds.), Linking the Formal Economy: Concepts and Policies. United Kingdom: Oxford University Press.
43. Lucas, R. E. (1978). ‘On the Size Distribution of Business Firms’. Bell Journal of Economics. 9, pp. 508–523.

REDETE – ECONOMIC DEVELOPMENT AND ENTEREPRENEURSHIP IN TRANSITION ECONOMIES
458
44. Maloney, W. F. (1999). ‘Does Informality Imply Segmentation in Urban Labor Markets? Evidence from Sectoral Transitions in Mexico’. World Bank Economic Review. 13(2), pp. 275–302.
45. Maloney, W. F. (2004). ‘Informality Revisited’. World Development. 32(7), pp. 1159–1178. 46. Marcelli, E.A. (2004). ‘Unauthorized Mexican Immigration, the Labour and other Lower-
Wage Informal Employment in California’. Regional Studies. 38(1), pp. 1-13. 47. Marcelli, E.A., M. Pastor jr. and P.M. Joassart (1999). ‘Estimating the Effects of Informal
Economic Activity: Evidence from Los Angeles County’. Journal of Economic Issues. 33, pp. 579-607.
48. Miller, W. L, Å. B Grødeland, and T. Y Kochechkina (2001). A Culture of Corruption? Coping with Government in Post communistic Europe. Budapest: Central European university Press.
49. Mungiu-Pippidi, A. (2005). ‘Deconstructing Balkan Particularism: The Ambiguous Social Capital Of Southeastern Europe’. Southeast European and Black Sea Studies, 5(1), pp. 49-68.
50. Olley, G. S. and A. Pakes (1996). ‘The Dynamics of Productivity in the Telecommunications Equipment Industry’. Econometrica. 64, pp. 1263–1297.
51. Ostrom, E. (1998). ‘A Behavioral Approach to the Rational Choice Theory of Collective Action: Presidential Address, American Political Science Association, 1997’. The American Political Science Review. 92(1), pp. 1-22.
52. Pratap, S. and E. Quintin (2006). ‘Are Labor Markets Segmented in Developing Countries? A Semi-parametic Approach’. European Economic Review. 50(7), pp. 1817–1841.
53. Rauch, J. E. (1991). ‘Modeling the Informal Sector Formally’. Journal of Development Economics. 35, pp. 33–47.
54. Schneider, F., A Buehn, and C.E Montenegro (2010). ‘Shadow Economies all over the World: New Estimates for 162 countries from 1999 to 2007’. Paper presented at the 2010 Annual Meeting of the European Public Choice Society (Izmir, Turkey).
55. Schneider, F. (2012). ‘The Shadow Economy and Work in the Shadow: What Do We (Not) Know?’ IZA Discussion Paper No. 6423.
56. Simon, H. A. (1997). Models of Bounded Rationality (vol. 3): Empirically Grounded Economic Reason. Cambridge, MA: The MIT Press.
57. Slovic, P. (1995). ‘The Construction of Preferences’. American Psychologist. 50(5), pp. 364-371.
58. Straub, S. (2005). ‘Informal Sector: The Credit Market Channel’. Journal of Development Economics. 78, pp. 299–321.
59. Williams, C.C. and J. Windebank (1998). Informal Employment in the Advanced Economies: Implication for Work and Welfare. Routledge, London.
60. Williams, C.C. and J. Windebank (2001a), ‘Beyond Profit Motivated Exchange: Some Lessons from the Study of Paid Informal Work’. European Urban and Regional Studies. 8, pp. 49-61.
61. Williams, C.C. and J. Windebank (2001b). ‘Reconceptualizing Paid Informal Exchange: Some Lessons from English Cities’. Environment and Planning. 33, pp. 121-140.
62. World Bank (2002). ‘Labor Market in Postwar Bosnia and Herzegovina - How to Encourage Businesses to Create Jobs and Increase Worker Mobility’. Report No. 24889-BiH, Human Development Unit, South-East Europe Country Unit, Europe and Central Asia Region.
63. World Bank (2005). ‘Bosnia and Herzegovina, Labour Market Update: The Role of Industrial Relations’. Report No. 32650-BA, Human Development Sector Unit, Europe and Central Asia Region.
64. World Bank (2006). ‘Serbia: Labor Market Assessment’. Report No. 36576-YU. Human Development Sector Unit, Europe and Central Asia Region.
65. World Bank (2007) ‘Enterprise Activity, Labor Market Outcomes, and Welfare: Bosnia and Herzegovina 2005-2006’. Mimeo.
66. Yasar, M., R. Raciborski and B. Poi (2008). ‘Production Function Estimation in Stata Using the Olley and Pakes Method’. Stata Journal, 8(2), pp. 221–231.

REDETE – ECONOMIC DEVELOPMENT AND ENTEREPRENEURSHIP IN TRANSITION ECONOMIES
459
Table A1: Total factor productivity
Dev. Var.: Log(Sales)
Log(Firm age) -0.608*** [0.233] Log(Capital) 0.285*** [0.041] Log(Labour) 0.502*** [0.027] Log(Raw materials) 0.137*** [0.023] Albania 1.003*** [0.387] Serbia 1.606*** [0.314] Bosnia & Herzegovina 1.495*** [0.416] FYROM 1.656*** [0.304] Slovenia 1.796*** [0.218] Bulgaria 1.733*** [0.330] Croatia 1.848*** [0.284] Montenegro {Ref.}
Year 2005 0.142*** [0.044] Year 2009 -0.079 [0.081] No. of Observations 3,963 No. of Individuals 3,626
Notes: * p<0.10, ** p<0.05, *** p<0.01. The total cost of electricity is used as a proxy variable in the first stages.
The results presented are robust to the use second-degree polynomial expansion (available upon request).

REDETE – ECONOMIC DEVELOPMENT AND ENTEREPRENEURSHIP IN TRANSITION ECONOMIES
460
Table A2: Country summary statistics
(1) (2) (3) (4) (5) (6) (7) (8) Albania Serbia BiH FYROM Slovenia Bulgaria Croatia Montenegro
Firm characteristics Informal origin 7.1% 8.3% 6.4% 7.7% 3.4% 5.1% 2.6% 8.8% Foreign 14.8% 14.7% 10.8% 13.2% 13.0% 13.1% 11.9% 5.1% Firm age 8.18 10.89 9.94 10.54 12.21 10.46 11.70 10.55 SME 90.6% 83.8% 88.9% 89.3% 83.9% 82.6% 85.0% 88.9% Performance indicators Total sales (thousands) 11,125 2,798 1,726 1,526 5,714 2,449 8,927 2,387 %3-year sales growth 47.3% 18.9% 37.5% 45.0% 29.6% 24.1% 33.0% 22.9% Full-time employment 51.22 86.41 44.20 43.95 72.31 72.89 67.67 39.14 %3-year employment growth 30.1% 20.7% 22.1% 21.6% 16.1% 16.3% 13.3% 34.3% Exporter 27.8% 34.1% 28.6% 32.9% 52.2% 30.6% 35.4% 13.9% %Exports 14.7% 8.2% 10.5% 16.4% 19.4% 17.1% 13.5% 3.9% Total factor productivity 2.05 2.05 1.99 2.22 2.07 2.16 2.09 2.49 Frequency of unofficial payments/gifts expected to deal with: Customs/imports 3.13 2.22 2.35 1.84 1.21 2.09 1.59 1.51 Courts 2.62 2.30 2.30 2.02 1.22 1.99 1.59 1.32 Taxes/tax collection 3.10 2.30 2.31 1.70 1.22 1.98 1.57 1.46 In general 3.25 2.69 2.47 2.30 1.60 2.47 2.10 1.83 # Informal payments (out of 6) 1.76 1.40 1.35 0.97 0.61 0.83 0.61 0.45 # Informal payments (out of 10) 1.70 1.37 1.28 0.92 0.60 0.78 0.58 0.41 Value of informal payment 3.1% 1.5% 0.8% 1.0% 0.5% 1.7% 0.9% 1.0% % sales for informal payments (thous.) 338.3 28.6 47.2 29.3 20.7 72.3 43.2 18.9 Access to finance Formal finance 22.1% 24.4% 42.9% 30.2% 41.7% 23.4% 29.8% 52.9% Both formal and informal finance 0.6% 3.0% 2.7% 3.1% 5.0% 6.5% 11.1% 4.7% Informal finance 9.1% 6.7% 8.8% 10.7% 11.5% 11.8% 12.4% 5.9% No finance 68.3% 65.9% 45.6% 56.0% 41.9% 58.4% 46.7% 36.5% Supply credit 4.4% 10.1% 23.2% 5.4% 4.7% 5.3% 10.0% 24.7% Bank services: 0 2.5% 3.1% 3.8% 10.8% 0.0% 1.5% 1.7% 12.5% Bank services: 1 12.0% 19.1% 21.5% 32.1% 10.1% 46.8% 15.5% 22.3% Bank services: 2 41.3% 36.2% 36.4% 43.3% 40.4% 26.8% 43.2% 43.8% Bank services: 3 44.3% 41.6% 38.3% 13.9% 49.5% 24.9% 39.6% 21.4% Industry Manufacturing 33.6% 24.6% 27.7% 22.2% 26.6% 45.5% 44.6% 20.4% Electricity, gas, steam & air condition 0.0% 0.5% 0.0% 0.0% 0.2% 0.0% 1.0% 1.5% Water supply; sewerage, waste mng. 4.0% 1.2% 2.7% 2.0% 0.9% 0.1% 1.0% 3.7% Wholesale and retail trade; repairs 10.3% 5.9% 7.1% 7.4% 13.5% 3.7% 9.6% 5.1% Transportation and storage 33.2% 42.4% 41.4% 42.1% 29.3% 28.6% 30.6% 51.1% Accommodation & food service activ. 8.1% 4.7% 7.8% 6.6% 5.3% 3.9% 2.5% 8.0% Information and communication 5.1% 7.4% 3.3% 5.8% 6.4% 4.1% 3.5% 5.1% Financial and insurance activities 1.1% 0.8% 0.7% 0.8% 0.8% 0.4% 0.3% 0.0% Professional, scientific and technical 2.4% 8.3% 2.2% 4.0% 13.1% 12.3% 6.1% 2.9% Arts, entertainment and recreation 2.1% 3.9% 2.6% 1.6% 2.4% 1.5% 0.7% 0.7% Other industries 0.0% 0.3% 4.6% 7.6% 1.5% 0.0% 0.1% 1.5%

REDETE – ECONOMIC DEVELOPMENT AND ENTEREPRENEURSHIP IN TRANSITION ECONOMIES
461
ENCOURAGE ECONOMY DEVELOPMENT BY GREEN TECHNOLOGY INTRODUCTION
Dragana VUKADINOVIĆ218 Bogdan ĆIRIĆ219
Abstract
Traditional concept of development which is based on production growth and increase of na-tural resources consumption has come to its final stage. Economic crisis caused by the price in-crease of fuels and depletion of natural resources has conditioned the development of new tech-nologies and the need of more efficient use of the existing resources, in order to overcome the biggest problems or, at least, affect their reduction. One way how to overcome problems with fossil fuels is to use renewable energy sources and to develop environmentally friendly techno-logies. Such type of development inevitably contributes to creation of new jobs and stimulation of economic growth.
Investments into “clear” energy and “green technologies” which nowadays contribute to energy efficiency may help countries under development and the countries affected by economic crisis to set off towards economic development. In order to make it happen, it is necessary to make investments into pharmaceutical development, chemical and other industries which could develop new products and new technologies which fall into domain of clean and green techno-logies. The use of fossil fuels is coming to its end, making thus these technologies desirable and required.
In addition to this, it is necessary to introduce ecological planning methods into all forms of business operations which will establish the balance between economy and environment. Ecolo-gical principles may be present in all forms of industry, energy, traffic, trade, construction and agriculture. Such type of adjustment is necessary because Serbia is in the phase of EU pre ace-ssion, and thus compelled to harmonize its legislation with European standards in this area and to carry out overall reforms. Since some neighboring countries have become member states of EU, Serbia should use their experience and shortened the path of accepting new rules of con-duct.
Serbia has potentials for renewable energy sources development, especially in the field of mini hydro power plants construction, wind mills, by the use of solar energy and bio diesel.
The aim of this paper is identification of potentials of Serbia for use of renewable energy so-urces and indication to the significance of green technology for the development and growth of economy and the necessity to use ecological principle system in all areas of business operations since green technologies stand for the future machinery which shall enable economic growth to underdeveloped and developing countries.
Keywords: green technologies, renewable energy sources
218 Monolith Innovation Group ltd. Šumadijska 1, Niš, Serbia, E-mail: [email protected] 219 Faculty of Occupational Safety, Carnojevica 10 A, Niš, Serbia, E-mail: [email protected]

REDETE – ECONOMIC DEVELOPMENT AND ENTEREPRENEURSHIP IN TRANSITION ECONOMIES
462
1. Introduction
There is a prejudice that the protection of the environment is in the conflict with the interests of economic development, growth of GDP, standard of living and job creation. However, the practice of most developed countries and developing countries, over the last decade, shows the opposite: the traditional concept of development that is focused on growth in production and at the same time to increasing of consumption of natural resources has reached its limits. The so-called 'external costs' that produces pollution, depletion of resources and damage to human health are beginning to outstrip the benefits that bring further growth. Capital is now increasingly investing in environmental protection, energy conservation and other resource protection, and development of environmental friendly technologies. In these areas has opened many new jobs. Less developed countries have no choice, they have to follow that path. Sustainable development should be encouraged by fiscal measures at the local level, which aims to prevent pollution and waste of natural resources. Economy and society must get rid of traditional opinion and mentality that is present in business systems of our country regarding the unlimited natural resources and the possibility of an endless, unpunished and free use of them in economic activities (Milosavljevic, Nestorovic and Milanovic, 2010, p.355). Investment in environmental impro-vement and pollution control in the new factories, as well as increasing energy efficiency, offers new opportunities for profit in the global market.
Natural resources such as water, clean air, land, which are available for free and does not require any expenditure, once has treated as 'free goods'. However, it is clear that environmental goods are qualitatively different from the products that have a price. Clean water, unpolluted air and land are not available for 'free' in nature now. For this reason, ecological economics and environmental management involved in considerations of environmental clean-up costs and protection of natural resources for ensuring long-term sustainability (Milosavljevic, Nestorovic and Milanovic, 2010, p.357). The awareness that environmental resources are limited and have their price is not yet widespread, as well as the belief that environmental protection does not have to restrict competition, but could even increase it.
Forecasts of experts indicate that the world in the next thirty years shall face a shortage of energy. One way to ensure energy efficiency is development of renewable energy sources. Projects of development of energy efficiency and energy independence are vital for any country. That kind of investments is the future of Serbia, because it’s developing clean energy which will help in the development of the local community. The using of renewable energy sources (RES) contributes to more efficient use of own resources in the production of energy, the reduction of "greenhouse gases", reducing the import of fossil fuels, the development of local industry and job creation. Technically usable renewable energy potential in Serbia is significant and estimated at over 4.3 million tonnes of oil equivalent (toe) per year, of which about 2.7 million in biomass, 0.6 million in unused hydropower, 0, 2 million in wind energy and 0.6 million in solar energy (Decree on Amendments, 2009).
2. Green Energy and Green Technologies
Climate changes, economic and energy crisis causing the need for radical socio-economic changes in the direction of encouragement of so-called "green economy." Concept of green economy involves extensive use of renewable energy sources, increasing the number of jobs and investment in so-called ‘’green industries’’. Green economy is defined as one that emits little carbon, efficient use of natural resources and that is socially inclusive. Green economy creates great opportunities for sustainable development, including rising incomes, reduce poverty and improve the quality of life. Green economy, particularly renewable energy is crucial for poverty reduction, especially a significant problem in developing countries.

REDETE – ECONOMIC DEVELOPMENT AND ENTEREPRENEURSHIP IN TRANSITION ECONOMIES
463
The business community of each state must create conditions to green economy as an integral part of the broader concept of sustainable development to become one of the answers to the challenges facing the contemporary humanity. Estimates of the United Nations about investments allocation for 2011 are $ 362 billion in energy supply, while the $ 194 billion invested in development of the "greening" of the transport sector and by 134 billion dollars in the construction and tourism sectors (UNEP, 2011, p.39). These investments will be, at least, double for the next 20 years.
The sector of energy has been recognized as the backbone of each national economy. In this sense, it is necessary to increase renewable energy sources, promoting energy efficiency and promotion of investments. The most important thing is that clean energy, green jobs, economic competitiveness, and investments in renewable energy are benefits for everyone in the country. It is important to remember that each country has to adopt its own approach to a green economy in line with what its development prospects and the specific conditions. Green economy is not a substitute for sustainable development, but its integral part.
Energy directly affects important and different branches of the economy such as industry, transport and agriculture, and the economy as a whole, the social and political conditions in the environment. Also various factors of human activities have reverse effect to the terms and development of energy technologies.
"Green technology" contributes to energy efficiency. Announcements of investment in the de-velopment of "green" technologies are coming from all over the world, even in countries that are rich in fossil fuels. This is one of the priorities of the Serbian Energy Development Strategy until 2015 year, as a condition for EU membership. In the following decade, in the field of energy efficiency, Serbia could approach the developed countries, if the appropriate measures shall have been implemented, since it lags behind most developed countries up to five times. Serbia had three times less energy efficiency than the average for the countries of the Organization for Economic Cooperation and Development, which brings together about thirty most developed countries. This situation should change by the implementation of programs to increasing energy efficiency. Energy efficiency projects are the greatest potential for increasing the economic strength of Serbia, which has to be used, as well as the opportunities offered by recycling waste. Serbian per capita consumes 40 percent more energy for heating than the European average. Therefore, the state is considering subsidizing the model of house thermal insulation to reduce energy consumption and improve energy efficiency. In addition to energy saving and increase of energy efficiency, this model could initiate production of building materials and increase employ-ment of construction workers.
On the other side, "green technology" protects the environment. Global warming will comple-tely change the configuration of the planets in the future, and hence life on it. This is a very im-portant subject that attracts, to the same degree, the attention of major European and world parliaments. When it comes to the production of "green" technologies, there are funds to help countries with strategies and concrete actions. Those funds are not available to Serbia yet, because she is the passive observer, but that is about technology for the future and she must to capitalize that opportunity on the best way.
Using renewable energy is important because: 1. Reducing dependence from energy imports 2. Increasing employment opportunities for the local workforce 3. Extension of reserves of primary energy sources 4. Positive attitude towards the human environment 5. Energy diversification
The issue of energy security and stability has become the cardinal question in recent years of the entire world's economic, social, and economic systems. EU, despite its high development and evolution of its relationship to the issue of energy security is also faced with the problem of
REDETE – ECONOMIC DEVELOPMENT AND ENTEREPRENEURSHIP IN TRANSITION ECONOMIES
464
reducing their impact on the environment and their role in reducing human impact on the climate. Correlation between the energy sector and the competitiveness of the European economy or any other economies, leads to lightly readiness to their economic "well-being" run down the importan-ce of the struggle for the creation of legal, institutional, technical, economic and social conditions for successful and sustainable combat climate change. In the energy sector the most important mechanisms to combat climate change are increasing energy efficiency and the introduction of renewable energy sources in the production, transmission, distribution and consumption / meeting energy needs.
RES lead to the creation of new jobs, the decentralization of the energy sector, scientific and technical innovation, reducing macroeconomic instability, social cohesion and solidarity, inclusion of lower strata of society, achieving the Millennium Development Goals, etc.
3. The need of adjusting the legislative framework
Strategy of the Energy Development of Republic of Serbia until 2015 under Priorities of selec-tive use of renewable energy sources particularly indicate that there are particular conveniences and needs in Republic of Serbia for organized use of RES in so called ‘decentralized production of thermal and electric energy’ (biomass and solar energy) and (construction of small, mini and micro hydro power plants), to meet the needs of local consumers, and for the delivery of surplus electricity to the local network electrical power system of Serbia.
Strategy that regulate the Economic development of the Republic of Serbia 2006-2012 as a priority also recognizes the selective use of new and renewable energy in order to slow down the rate of energy imports, reduce the negative impact on the environment and opening up additional activities for local industy and local jobs, including adjustment of practices and regulations EU in this area. National Environment al Protection Program in order to preserve the natural values of great importance, to recognize the substitution of fossil fuels and non-renewable energy sources and the need for greater use of renewable energy sources in order to reduce the negative influence of energy sector to the environment.
In the process of accession to the EU it is necessary a lot of effort to implement reforms and harmonization of national legislation with European standards, which includes the adjustment of the energy sector with "Energy - EU climate package". The experience of neighboring countries, which joined the EU, could be of great use to Serbia for shortening the time of application and implementation of reaching the required standards. The process requires harmonization of legislative and institutional changes, and personnel upgrade a large investment in those energy sectors are the biggest emitters of greenhouse gases.
Although the adjustment process is difficult and requires a lot of effort, the EU provides fun-ding and incentives for these activities. Recommendation to the Serbian companies to 2020 is the adaption to new market and energy principles, including greater use of renewable energy, energy efficiency and reduced emissions of gases into the atmosphere. One of the requirements of the EU, which Serbia needs to fulfill, is the increased production of energy from renewable sources by 20 percent by 2020 and the implementation of projects for energy efficiency increasing.
Ratification of the Treaty establishing the Energy Community, Serbia, among other things, accepted the obligation to adopt and implement a plan of implementation of Directive 2001/77/EC on the promotion of electricity produced from renewable energy sources and Directive 2003/30/EC on the promotion of biofuels and other fuels from renewable energy sources in the transport sector (Decree on Amendments, 2009).

REDETE – ECONOMIC DEVELOPMENT AND ENTEREPRENEURSHIP IN TRANSITION ECONOMIES
465
Directive 2001/77/EC defines renewable energy sources (RES): - National target for the production of electricity from renewable energy,
- A program of measures to achieve them,
- Guarantees of Origin - for electricity produced from renewable energy sources,
- Simplification of the legal framework for the construction and operation of plants,
- Liability for transmission and distribution operators to take over and transport the electricity from RES,
- Defining the conditions and tariffs for connecting to the network.
Directive 2003/30/EC defines biofuels: - provide a certain amount of biofuels appear on the market - 5.75% of the total fuel used in
traffic until 2010
The Republic of Serbia has adopted the following legal regulations in the field of renewable energy sources:
- Energy Law;
- Development Strategy of the Republic of Serbia until 2015;
- The Energy Sector Development Strategy of Serbia from 2007-2012;
- Regulation on conditions for acquiring the status of privileged power producers and the criteria for assessing the fulfillment of these conditions;
- Decree on Incentives for the production of electricity using renewable energy sources and combined production of electricity and heat energy;
- Model of contracts for the purchase of electricity from privileged producers.
The Republic of Serbia has become at the 26th January of 2009 the member and founder of the International Renewable Energy Agency (IRENA), as the first international (intergovernmental) organization that focuses exclusively on renewable energy and will continue to actively participate in the work of the agency in accordance with the Statute of the Agency and its interests in the area in and use of renewable energy sources (Decree on Amendments, 2009).
4. Potentials of renewable energy sources in Serbia
When we talk about renewable energy sources and their potential use should take into account the following matters:
- What quantity of the resources are present in the environment;
- At what purpose and when you can use it;
- What is the impact on the environment and
- Cost and economic viability and likely important ethical and political issue in some cases (biofuels) and that is: food or biofuels? (Cakic, Veljkovic and Stamenkovic, p.2)
Renewable energy sources are the backbone of the energy independence of Serbia in the future. The total potential energy from renewable sources can meet a quarter of the annual needs of Serbia, and is a huge potential for energy savings in all sectors. The general impression is that Serbia has good renewable energy: an assessment of wind power cites figures of 10,000 MW, and the potentials for small hydro power plants are estimated to be at least 500 MW. However, these estimates are related to the physical, rather than economic resources (Decree on Amendments, 2009).

REDETE – ECONOMIC DEVELOPMENT AND ENTEREPRENEURSHIP IN TRANSITION ECONOMIES
466
Information about the profitability of renewable energy sources in Serbia are very limited, and estimate of the physical potential. For example, in the case of wind energy, there is not a compre-hensive atlas of the wind speed at a height of 30-50 feet, and it has to be determined.
Apart from hydropower and geothermal energy limited in scope and biomass, other renewable energy sources in Serbia are not used. Hydroelectric Power Plants in Serbia are mostly large hydro power plants with a capacity greater than 10 MW. Annual production is about 10.3 TWh (25 200 TJ) and is based on the installed capacity of 2,831 MW.
Of the 900 potential sites in Serbian rivers, including the smallest rivers, there are opportunities for small hydro power (up to 10 MW) with an installed capacity of 1,800 GW / year, with 90% of the power plant was under 1 MW. The potential of small hydro power plants is 16.7 PJ. The total technical potential of energy from renewable sources is about 160 PJ per year (Strategy of Energy Development in Serbia).
The aim of the Government of Serbia to the end of 2012 is to increase the share of electricity produced from renewable energy in total energy consumption by 2,2 percent. Of all the potential of renewable energy sources in Serbia, 63 percent covers biomass, which corresponds to consumption of 2.4 million oil equivalent. The energy potential of biomass from forestry and wood processing industry is estimated at about one million tonnes of oil equivalent, while the rest belong agricultural biomass or agricultural residues and wastes from farming. Instead of burning agricultural residues in the fields, farmers in Serbia could use these rests to energy production from biomass. And forest residues end up in landfills and rivers, and one of them could settle electricity or thermal energy. Estimated amount of biomass in Serbia, which can be used as fuel, is about five and a half million a year loss-making enterprises (Decree on Amendments, 2009).
Wind Power. Based on existing and available studies and analyzes real potential for wind energy in Serbia is estimated at installed capacity of about 1300 MW. Assessment of the energy potential was calculated on the basis of Republic Meteorological Station data, collected by measurements at meteorological towers up to 10 meters, where it was concluded that the most promising locations for wind power: mountain Midžor, Suva Planina, Breg Vrsac, Stara Planina, Deli Jovan, Krepoljin, Tupiznica, and Juhor (Decree on Amendments, 2009).
For accurate assessment of feasibility of the construction of a wind power plant at a given location is necessary to conduct detailed measurements of wind direction and speed in order to produce wind atlas.
Hydro energy. The potential of small streams, where they can build small hydropower plants is about 0.4 million toe - or 3% of the total potential of renewable sources in Serbia. Small hydro energy facilities up to 10 MW and fall into the category of privileged power producers. Reutilization of the total energy potential of small hydro power plants can produce about 4.7% of the total electricity production in the Republic of Serbia (Decree on Amendments, 2009).
Geothermal energy.Geothermal energy refers to heat the inside of the Earth. This heat can be used in the form of steam or hot water and used to heat buildings or produce electricity. The most practical for the exploitation of geothermal energy are the areas where wells are located close to the mass of our planet's surface. Geothermal energy is a renewable energy source because the heat is continuously produced inside the Earth's various processes. When it comes to stone geothermal energy, today's technology is limited to a drilling depth of 10 km, and thus the possible exploi-tation by those depths. In the greater depths, this energy is much higher. In the immediate future and until the time when it was a technology that will enable the use of this energy, the only source of energy remains is the hydro-geothermal energy. It has a much smaller, but its great technical applicability and economic feasibility of exploitation.
According to data of Ministry of Mines and Energy of the Republic of Serbia, if we use exploatation of the depth of 3 km, hydro energy reserves are about 2,000 times more than the reserves of coal. Most of the energy carriers has a temperature lower than 100 ° C (about 88%), and only a small part has a temperature above 150 ° C (about 3%).
The advantages of geothermal energy are:

REDETE – ECONOMIC DEVELOPMENT AND ENTEREPRENEURSHIP IN TRANSITION ECONOMIES
467
- The use of geothermal energy causes a negligible impact on the environment, and does not contribute to the greenhouse effect,
- Geothermal power plants do not take up much space and thus little impact on the envi-ronment,
- It is a huge energy potential (provides unlimited power supply) - Eliminates the need for fuel - When the geothermal power plant was built, the energy is almost free, with less local
consumption, - Ability to multi-purpose use of resources (affects the economic feasibility exploitation). Solar energy. The average intensity of solar radiation on the territory of the Republic of
Serbia, ranged from 1.1 kWh / m² / day in the north to 1.7 kWh / m² / day in the South - in Janua-ry, from 5.9 to 6.6 kWh / m² / day - in July. Annually, the average value of global radiation energy on the territory of the Republic of Serbia is 1200 kWh / m² / year in northwestern Serbia, to 1550 kWh / m² / year in southeast Serbia, while the middle part is about 1400 kWh / m² / year. Radiati-on efficiency depends on the characteristics of embedded heat receiver, so we can adopt the ave-rage value of useful energy available in the Republic of Serbia of 700 kWh / m² per year. In the Republic of Serbia to the census at 2011 year, there are about 2.5 million households (Statistical office of the Republic of Serbia). If, on average, every fifth household installed solar receiver area of 4 m2 per year will generate about 1750 GWh of thermal energy that would largely replace the consumption of electricity and fossil fuels mostly used for domestic hot water, and allow the reduction of carbon dioxide emissions by 2.3 million tons per year.
In the future it is necessary to implement activities aimed at promoting the use of solar energy for domestic hot water and space, and the development of solar power to generate electricity. The energy that the sun emits during the year to 1 m² roof of a house in Serbia is equal to the energy gained by burning 130 liters of oil - and when it is completely free. The greatest potential for solar energy has cities in the southern part of Serbia - Nis, Kursumlija, Vranje (Decree on Amend-ments, 2009).
Biomass energy. Biomass is the biodegradable part of products, waste and residues from agriculture, forestry and wood industry - plant and animal - whose energy use is permitted in accordance with the regulations governing the protection of the environment.
The total biomass energy potential in Serbia is estimated at 2.7 million toe and make it remains in the forestry and wood industry (about a million toe), and residues in crop, livestock, orchards, vineyards and primary processing of fruits (about 1.7 million toe). Biomass energy potential in livestock that is suitable for biogas production is estimated at 42 000 toe. Available quantities of liquid manure in poultry and cattle farms, medium and high capacity allow for the production of biogas energy value of 42 200 toe. This amount of slurry with appropriate add-agricultural biomass residues to the real installed capacity of biogas plants to be up to 80 Mwe (Ministry of Mines and Energy of the Republic of Serbia). The production of biogas from liquid manure has an energy importance, but also ecologically. As a result of the production of anaerobic digestion, biogas is obtained in addition to the rest of the liquid that is used as a fertilizer. Given the high defragmentation farms in the Republic of Serbia, it is recommended that one energy plant collects and treats the manure collected from several farms.
Biofuels. In Serbia, there are conditions for the production of biofuels - ethanol and biodiesel. Bioethanol: Ethanol production in Serbia today is based on molasses (about 50%) and grains
(about 50%). Available amount of molasses can not satisfy the needs of the current generation: the overall capacity of the existing sugar factories generate about 200,000 tons of molasses per year, of which 50,000 tons are used, while the remaining approximately 150,000 tons may be considered for other purposes and the production of bioethanol. Insufficient quantity of molasses for ethanol production would have to be imported, in terms of large fluctuations in price and available quantities on the world market.

REDETE – ECONOMIC DEVELOPMENT AND ENTEREPRENEURSHIP IN TRANSITION ECONOMIES
468
Biodiesel: The Republic of Serbia as a raw material for the production of bio-diesel can be used-oilseed sunflower, soybean and canola, and waste cooking oil. Total area under oilseeds is estimated at 668,800 ha, of which the cultivation of oilseeds for biodiesel could be getting done at 350,000 ha.
Conclusion
The energy stored in the nature is of strategic importance for sustainable energy development, because its potential is about 25 percent of the total annual consumption of primary energy. If we create the conditions for greater use of renewable energy sources, Serbia has the potential to become a key player in Europe in the area and the cornerstone "green" energy in the region.
Republic of Serbia is obligated to follow guidelines of EU, both in the application of conventional and renewable energy sources, not only because of its aspirations to join the EU, but also because of all the positive consequences in this regard derived from such a policy. Taking into account the lack of knowledge and practice of this important issue from the standpoint of rational use of energy, conservation of primary energy, reduced emissions from conventional energy sources to reduce dependence on imported energy, increasing the level of employment, ily increased use of renewable energy is a choice that no alternative.
Renewable sourcess are getting closer to a race to get to conventional. Price of technology used in converters of renewable energy in electricity daily decline. Alternative sources of fuel for the charge, and the fuel price of conventional power is variable and subject to laws always deceptive global energy market.
Reference list
1. Decree on Amendments and Supplements to the Decree on Program for the realization of the Energy Sector Development Strategy of the Republic of Serbia until 2015 for the Period 2007 -2012, (2009), www.ssl-link.com/mre/cms/mestoZaUploadFajlove/ Uredba_o _-izmenama_i_dopunama_POS-modul_13_-_OIE.pdf (accessed 04.08.2012)
2. Energy Sector Development Strategy of the Republic of Serbia by 2015 www.ssl-link.com/mre/cms/mestoZaUploadFajlove/Serbian_energy_strategy_-fianl__EN.pdf (accessed 01.08.2012)
3. Milosavljević Z. Nestorović O. Milanović J. (2010). Management and Ecology in Sustainable Development, International scientific conference, Krusevac, pp. 354-358
4. Ministry of Mines and Energy of the Republic of Serbia, www.mem.gov.rs (accessed 01.08.2012)
5. Statistical office of the Republic of Serbia, http://media.popis2011.stat.rs/2011/prvi-rezultati.pdf (accessed 17.08.2012)
6. UNEP (2011). Towards a Green Economy: Pathways to Sustainable Development and Poverty Eradication - A Synthesis for Policy Makers, www.unep.org/greeneconomy/ Portals/88/documents/ger/GER_synthesis_en.pdf (accessed 15.08.2012)
7. UNEP (2011). Renewable Energy Investing in Energy and Resource Efficiency www.unep.org/greeneconomy (accessed 04.08.2012)
8. UNEP (2011). Finance, Supporting the Transition to a Global Green economy www.unep.org/greeneconomy/Portals/88/documents/ger/6.0_RenewableEnergy.pdf (accessed 04.08.2012)
9. Veljković V. Cakić M. Stamenković O. (2009). Renewable Energy Resources: Creation of University Enterprise Cooperation for Education on Suistainable Technologies, 158989-Tempus-1-2009-1-BE-Tempus-JPHES

REDETE – ECONOMIC DEVELOPMENT AND ENTEREPRENEURSHIP IN TRANSITION ECONOMIES
469
TECHNOLOGICAL EVOLUTION IN THE FINANCIAL SERVICES MARKETING CONCEPT
Dragan VOJINOVIĆ220
Abstract
The main objective of all economic entities as well as the objective of financial institutions is to achieve planned profit that provides growth and development while strengthening its market position compared to the competition; to satisfy current and future customer needs through the production and to sale financial products and services in the markets. Financial institutions ba-sed on market principles and their profit orientation requires a constant battle for market po-sition through an adequate range of products and services.
The primary orientation of the financial institution is to research needs and desires of consu-mers and the ability and means to satisfy them. In order to successfully meet the needs of consu-mers and thereby ensure continued development, financial institutions have to build business activities on marketing ground.
The approach to marketing and marketing concept experienced a transformation, caused by environment changes and the development of market economies. Developed business activities require greater productivity, higher levels of knowledge in the manufacturing and service sec-tor. Along with that comes a customer expectations increase regarding products and services quality.
Nowadays, in a completely different environment, the revised market structure, marketing relationships occur in a different way. The use of information technology gave the basic tone to the modern concept, through the function of long term relationship with its financial institution clients. In terms of digital business, a new marketing concept known as relationship marketing is developed which is achieved through a strategic competitive advantage, not only on the quality of its products and services.
Customer Relationship Management emphasizes the necessity of identifying customers and their observation as a consumer, rather than a simple purchase transaction. Differentiation is made according to customers’ values and their needs into broader clusters, which have the hig-hest value and greatest potential for achieving business goals and company growth. The mana-gement of relationships requires an immediate round relationship with customers.
Collected information allows financial institutions to adapt products and services to custo-mers’ needs. The collection of information is in fact the market research. It provides insight into the consumer's desires and how they can be met.
The technological revolution and particularly strong computer technology development have led to changes in the lives of individuals as well as corporate environments. Innovative Commu-nication, Internet and mobile phones are changing the conditions and manner of operation, so new principles and rules are established. Communication and business based on direct contact and paper documentation has undergone its modification by applying new technologies and the introduction of e-business. The role of technology and implementation electronic commerce has
220 Komercijalna banka AD, Banja Luka, email: [email protected]

REDETE – ECONOMIC DEVELOPMENT AND ENTEREPRENEURSHIP IN TRANSITION ECONOMIES
470
led to the strategic adjustment of marketing functions and shift power to the client, but also cre-ates the possibility of better understanding and clients’ needs understanding.
Marketing activities targeting individuals in the service and customers have direct recourse to direct marketing communications. They provide opportunities for individual bids, better rela-tionships, greater customer loyalty and repeat purchases. Financial institutions apply the pro-cedure of direct marketing communications in order to establish direct contact with consumers segmented. The aim is to establish long-term business cooperation with clients, using direct ma-rketing, to achieve satisfaction in them, which is manifested through repeated transactions and long-term loyalty.
Keywords: Marketing Management, E-commerce, Internet marketing, Mobile marketing

REDETE – ECONOMIC DEVELOPMENT AND ENTEREPRENEURSHIP IN TRANSITION ECONOMIES
471
1. Marketing management of financial services in the electronic world
Marketing management can be seen as a process of analysis, planning, implementation and control, decision making and demand process management. The purpose of marketing manage-ment is to provide necessary information for defining business objectives, adoption and imple-mentation of marketing plans for strategic planners . Marketing management involves making several successive decisions, coupled with other business decisions and decisions about other elements of the marketing mix.221
Modern technologies enable a new kind of cooperation between suppliers and consumers of services, which leads to more subtle communication relationship. Main achievements are the development of new distribution channels, forming the classic external network connections with developed capabilities and accepts that allow the financial institutions to have an easier and faster way to access services to consumers .
Electronic transactions, though not so long ago introduced to the system of financial institu-tions, very quickly found its application and has set the challenge for those involved in marketing activities and strategies used in their capabilities and processes of electronic transactions. Finan-cial institutions had marketing activities even before the advent of electronic commerce, however things have changed and upgraded.
The advent of information and communication technology - ICT and application of electronic means in communication leads to expansion of the marketing concept and definition of electronic and Internet marketing.
Financial services represent a wide and diverse range of services. Financial institutions meet the needs of their consumers using these services . We can talk about banking services, services of insurance companies, stock exchange services, broker-dealer, etc. Most of these services have characteristics of intangibility, inseparability of production and consumption, heterogeneity and viability.
Let's single out a banking and insurance companies, which hold the most important position in the markets where electronic commerce and largely achieved its effect. These services are intan-gible. Conducting current, transactional, and foreign bank accounts of legal entities and individu-als, lending and financing in the short and long period of time, financial and operational leasing, financial transactions in the country and abroad, electronic banking, credit card business, foreign exchange transactions and depositing funds with turnover securities and brokerage services, money exchange, treasury services and advisory banking services are the basis of interactional relations between banks and their customers. In insurance, the basic service is a division of the property and life insurance. All these services have no material basis of production, nor any visual or sensory perception effect. In the insurance business it is even more expressed, because it provides insurance mainly for those events which are uncertain to happen.
Communicating with consumers and promotional activities are difficult because of intangibi-lity of services. How can you create some picture for the that something, which is not material, will bring a certain value and meet their needs. How can we "make the consumer to prefer our service" in comparison with the same or similar services of other institutions in very developed competitive relationships? A simple example: which marketing skills should be used tin order that the user of the card decides to take that card in "our bank". Technology solutions for electronic payment card or cash boot are unified in all banks, so there is the question how to 'make' the cardholders to make payments within the terminal was published in "our bank" or raises cash
221 Lovreta, S. and Petković, G., 2010, page. 309.

REDETE – ECONOMIC DEVELOPMENT AND ENTEREPRENEURSHIP IN TRANSITION ECONOMIES
472
from an ATM of "our bank". In the process of production and consumption of these services, the presence of the consumer is essential whether that is achieved by engaging staff or through technical equipment, where the main problem is to keep a certain level of quality of service standards in the long run. Un-sustainability as a service feature means that it can not be stored or placed under physical control, which requires compatibility process of supply and demand.
Specific characteristics of financial services in the process of marketing management impose different approaches, such as:
1. creating value of services to the consumer is the most important step in active relationship with the producer,
2. manner and process of creating services are closely related to the technical and technological equipment of financial institutions,
3. development of the financial services industry can thank to the progress and application of technological solutions,
4. marketing activities are not new to the financial markets, however, they have had to change and adapt thanks to the change of relationship
5. services are no longer created only in direct contact between employees in the institution premises during business hours,
6. the process of creating and selling is timely unlimited and independent of direct contact in space and time.
Adoption and application of technology in the entire system of financial services is of
fundamental importance, but it should be noted that: - no matter how advanced and powerful can be techniques , it is still managed by man,
- financial institutions have had evolutionary development and application of technological solutions and this development was mainly equal,
- technology used in providing services for financial institutions is of approximately same quality and ability to satisfy the needs of producers and consumers,
- attention should be paid to the question: why aren't all consumers of one type of service present in one institution that produces them, but are arranged more or less in all of institutions which offer this kind of service,
- choice of technology, and software solutions, which are acquired and applied, depends directly from senior managers.
The technical and technological solutions directly affect the type, range, quality, and
distribution channels,but also on the level of prices and possibilities of marketing activities. The man is a ruler and a user of technology either in the role of producer or customer services. First contact in the realization of the process of buying and selling services is produced in the direct contact between the seller and buyer.
When marketing system in a banking institution motivate potential clients to use their products, the first question for the banking officer: "What do you offer to me?". It may be a client that has not been used at all banking services, which is rare, or the client of "other banks". In these decisive moments quality and competence of workers should be emphasized. The worker should be able to present the value of products and services of the bank in the particular period of time and in such a manner that future consumers will not have the opportunity to hesitate while making decision.
Distribution services should solve the problem of availability of service to the customer. Financial services are directly related to the user, so the user has to be present at the point of service. Institutions that provide these services are able to carry out the distribution in two ways.

REDETE – ECONOMIC DEVELOPMENT AND ENTEREPRENEURSHIP IN TRANSITION ECONOMIES
473
The first is the extensive network of its organizational units, where employees perform placement services. Another method is the use of equipment and technical achievements that are a function of e-commerce.
2. The impact of electronic media on marketing strategy
Development of technology and its application, and in particular the development of the Inter-net, provide new opportunities for access to customers, market research and communication im-provement, i.e e-marketing. Electronic marketing in the broad sense is marketing that is carried out with the use of electronic media and based on them and Technology. Direct marketing is an interactive electronic subsystem of the electronic marketing that uses one or more electronic media in order to achieve greater response. In addition to phones, radio, television and other electronic media in traditional direct marketing, it is increasingly used modern electronic media, such as cable TV, cell phones, computers, the Internet and other network technologies.
Direct marketing is an interactive approach, which means that there is two-way communication between participants in the communication process. Direct marketing implies the immediate response of acceptors or customer reaction. Customer reaction is reflected in the searches, phone calls, return e-mail response, sending orders, etc. The result confirms the offer of direct marketing is measurable and can be expressed in the form of response rate, which reflects the share of the number of customers who have responded in the total number of contacted customers. The highest priority of all is to identify the advantages and disadvantages of new media.For traditional institutions, Internet and electronic marketing activity on the net provide affordable means for marketing workers who use them to communicate with existing and latent customers. Advantages of direct electronic marketing are quickly demonstrated. Its ability and compliments were not groundless. Direct marketing is addressed to well-defined, targeted segments of actual customers. It is a great opportunity to control the media, messages, and other elements of the campaign. It is also rapid response to possible changes. Direct marketing is well protected from the impacts and competition. Modern database management systems make it possible to isolate the most profitable customers of any product or service, which reduces the cost of sales.
In direct marketing there is the possibility of testing all the variables that affect the success of your campaign. These can be lists of responses to the e-mail, telephone number answers, the number of visits to the site, etc. The advantage of direct marketing is the analysis of the data which leads to information on other consumer needs. On this basis we can activate the cross-selling and long-term maintenance loyalty. Direct marketing has its disadvantages, reflected in the high initial cost of acquiring the customers and the high cost of promotion, if used for a single sale. Certain forms of direct marketing such as direct mail, can be intrusive and interfere with the privacy of the customer.Besides these possible disadvantages, there are other challenges faced by actors in direct marketing while working with electronic media. Technology development is carried out very quickly, there is no enough time for training and learning of employees, making them more oriented toward technology, and not to the client. On the web site changes can happen quickly, but the quality, fully functional Web site is complicated and complex to design as well as direct marketing campaigns.
Marketers have key role. Beside the adoption of breakthrough technology, marketers should retain the traditional methods of marketing in customer relations. Institutions in these relationships have to develop internal marketing and to adequately evaluate the system rewarding efforts. A problem that can occur in institutions is a lot of new staff, who are just trying to understand what they should do, what their task is and what are the goals. On the other hand, there are incompetent clients who do not know to use all the advantages of this process. This is a relatively new area, it is assumed that some of their customers and employees do not have enough experience.

REDETE – ECONOMIC DEVELOPMENT AND ENTEREPRENEURSHIP IN TRANSITION ECONOMIES
474
Promotion of Internet sites a few years ago brought a lot of optimism for electronic marketing, which is becoming cautious due to high costs. It determines that the business plan for a Web site is based on the regular clients. Financial institutions, This model provides a lot of information for financial institutions, as a natural part of doing business, which can be used to provide more value to customers and to ensure preservation.
Marketing activities through email is a popular way of establishing one to one relationship with clients and potential customers. Informants are sent via e-mail messages that contain the target can be customized to each client. Electronic mail can be used to quickly respond to customer queries.
In practice, while using electronic mail, one should keep in mind some basic rules: - us only list with permission to receive e-mail,
- avoid the use of electronic mail for winning new clients,
- electronic mail has to avoid the problem of obtrusion,
- test constantly, so that e-mail does not end up as undesirable,
- synchronize capabilities between techniques and creations e-mails,
- use the tactic of feedback.
We still mostly communicate via telecommunications. Telemarketing is a professional, pla-
nned use of telecommunications in the promotional and sales efforts. We're talking about the input and output telemarketing.
Input marketing occurs during directed calls, by telephone, initiated by the customer due to ad-vertising or other promotional activities, or to clients' needs for information, appeals and com-plaints. Output telemarketing occurs in the case of outgoing telephone calls directed to your custo-mers. In addition to marketing tasks this model is used to fill the database.
Telemarketing currently provides information. It is accomplished through personal contact which allows the execution of the strong influence through the flexibility and compatibility with other forms of promotion. Electronic media carry their advantages, but also the requirements for marketing workers. The changes were never easy. Marketing strategies have to be adapted to the general navigation requirements dictated by the technology, which has been accepted by customers. It should be understood that the competition is not idle at all.
2.1. Internet marketing
Information technologies have changed the marketing approach and its nature. Internet marke-ting has emerged in the recent past and parallel with the emergence of the Internet. Changes in information technology have also affected the financial institutions and their customers. Using their abilities, they accepted and applied specific electronic business in building relationships with customers and their long-term development.
Let it simplify, the term Internet marketing includes online marketing, which is related to the implementation of marketing activities through public international, Internet computer network. The basic principles of marketing remain the same, creating value for the customer and achieving competitive advantage, while specificity is reflected in the quality of new networking relationshi-ps and direct immediate, simultaneous relationship between consumers and institutions. In recent years, financial institutions are increasingly using Internet marketing as a means of direct commu-nication with customers.

REDETE – ECONOMIC DEVELOPMENT AND ENTEREPRENEURSHIP IN TRANSITION ECONOMIES
475
Internet technologies have changed the traditional marketing in several key ways:222 a) Power moved from seller to buyer. As never before, customers are becoming more
demanding, whether they are individuals or organizations, due to the fact that only one "click" are away from a huge number of suppliers-competitors who are competing to be available for customers. In this environment, customer's attention is rare, and establishing good relationships with customers is the most valuable asset.
b) Distance is no longer important. Geographic location is no longer a decisive factor in the cooperation between business partners, companies in the supply chain or consumers, or just conversation between friends. Internet makes places less important and allows many buyers and sellers to avoid traditional intermediaries.
c) Time is a critical factor in Internet communication between the company and its customers. Online communication is possible 24 hours, 7 days a week. People can communicate when their schedules permit, and time zones disappear for managers who work with partners in other continents.
d) The database becomes a critical success factor. It is easy in the digital world of information to collect, store and analyze information about customers. Marketing managers can operate with results as soon as the marketing program is applied, through receiving sequential statements. Ho-wever, the creation of useful information and knowledge from huge databases is the greatest cha-llenge managers are faced with.
e) The focus has become interdisciplinary, because marketers have to understand the technology they use.
f) The importance of intellectual capital is increased, in the sense that imagination, creativity and entrepreneurship are becoming more important resource than finance.
Advantages of online marketing are:223 a) Comfort and practicality Customers can place orders 24 hours a day, wherever they are. They do not have to drive to the
point of sale; they don not have to look for place for parking or walk through the numerous shops to find and examine the goods they want to buy. It also means that customers do not have to pass the full path to the store only to find out that the desired product has disappeared from the market, or that it is not in stock.
a) Reducing incovenience Online shopping is easy and it is done in private. With online services, customers do not have
to deal with vendors or to be exposed to persuasion and various emotional pressures. b) Information Customers can find a number of comparative information about companies, products and
prices without leaving their office or home. They can focus on objective criteria such as price and method of payment, quality and availability, speed of delivery, etc.
c) Interactivity and immediacy Customers can "surf" the site to find accurate information, product or service that they want,
and then immediately ordered or downloaded it to the screen, or computer disk. Receiving and sending information is fast in comparison to the express delivery or fax.
222 Afuah, A. and Tucci, C., 2001, page 127-130. 223 Brkić, N., 2003, page. 456-458

REDETE – ECONOMIC DEVELOPMENT AND ENTEREPRENEURSHIP IN TRANSITION ECONOMIES
476
d) The aim of marketing The main advantage of the Web is ability to target a very specific group of individuals with a
minimum of waste. As a result of the precise targeting, messages can be designed and tailored to affect the specific needs and desires of the target audience.
e) Building interrelationships Considering the fact that online marketing considers "one-on-one," relation, that is interactive,
it is a valuable tool for building a good long term relationships with customers. Companies can talk to consumers and learn a lot from costumers for their own business, and enter costumers' knowledge into their database. Marketers can also recharge their system by useful reports or their free demo software or a free sample of their newsletter. Consumers then can "pull" all of these into their computer's mailbox.
f) Quick adaption to market conditions Companies can quickly add and modify its offer price and product descriptions. For example,
if you send a paper catalog, products, prices and other Stock elements are fixed until you create and send a new catalog. However, an online catalog can be constantly adapted considering product range, price and promotion in order to comply with changes in the market situation.
g) Reducing costs and increasing efficiency Online marketers avoid opening their shop and its associated costs of renting space, insurance,
equipment and other. Considering the fact that customers contact directly with sellers, online marketing often results in lower costs and improved efficiency in distribution and logistics functions, such as customer order processing jobs, handling inventory, delivery and encouraging trade. Finally, e-communication often costs less than a printed communication materials through the mail. Companies, namely, make a digital (electronic) catalog with a lot less money in comparison with the cost of printing and mailing paper catalogs.
h) Market potential and global media Internet grows extremely fast. As a number of home PC is growing, so grows the awareness
and interest for the Internet. This is why the market potential is constantly increasing. It also allows buyers and sellers go around the world from one country to another in a second, just by "one click". Online marketing can be used by both small and large companies.
Despite many advantages, online marketing can not be applied for each product and service.
Disadvantages of online marketing are:224 a) Problems with the measurement of efficiency The relative novelty of the medium, sophisticated and universally acceptable testing methods
for auditing and measuring effectiveness are not yet confirmed. Various research firms use different methodologies for research on the Internet. This is the reason for frequent discrepancies in the results of measurements of the same phenomenon, for example, the number of Internet users.
b) Characteristics of the audience Web is not good marketing channel for every company because there are reasons for Internet
to be slower adapted toi certain markets ( language, costs, infrastructure...)
224 Brkić, N., 2003, page. 458.

REDETE – ECONOMIC DEVELOPMENT AND ENTEREPRENEURSHIP IN TRANSITION ECONOMIES
477
c) Web-time Sometimes the time required to access the Web and information is inappropriately long and
appear "dead spots" in online communication and web servers local network, which can slow down the search for specific information.
d) Information congestion As the number of ads in the web increases, the probability that a customer notes the ad
company is reduced. One study showed that only 7.2% of Internet users often "clicks" on the banner advertiser for more information, while half said that they never did it.
e) Costs and production of limited quality Many advertisers believe that the Internet / web is efficient media for the expensive things, but
also not so efficient for low-cost products for the consumer. The relatively high costs of advertising and delivery limit web application. Internet / Web advertising can not offer the ability of many competing media from the point of production. Web site does not have a high quality television or print reproduction, i.e TV and print graphics.
f) Data privacy Refers to data collected on the Web.
Progress and capability of technology, with extremely rapid growth in the number of users, has
led to the fact that online communication find their application in financial organizations. There was a direct relationship between institutions and customers at different points of
contacts in the markets, but it is significantly increased with the Internet. Beside the direct communication, relationship with customers was build by sales agents, marketing service, telephone and through retail representatives, and now every customer can get acquainted with the products and buy them through the website. Most financial institutions has its own Web sites used for communication purposes and marketing activities.
The advantage of web marketing is reflected in the establishment of two-way communication between institutions and users of web site. Information are sent to visitors and simultaneously co-mments, criticisms and suggestions can be sent, which leads to a better understanding of customer behavior and presentation of high quality offerings. In addition to Web marketing, the most important form of online marketing is e-mail marketing or electronic mail. Electronic mail uses functions and capabilities of the Internet and computer networks in the processes of commu-nication. With its speed and flexibility of electronic mail, it is the most popular way of sharing information and certainly the fastest growing communication medium in the world. It has changed the way of communication among people, removing many barriers while writing. Millions of people and institutions have opportunity to participate in an interactive dialogue in a fast and convenient way.
Flexibility allows mail forwarding, sending e-mail to a large number of users, sending one e-mail to a specific group of users, requesting that the recipient of an e-mail confirms that the me-ssage has been received etc. E-mail is a powerful tool in the marketing activities conducted by financial Institutions. By email, institutions presented their products and services, build their image, interaction is realized during 24 hours, etc.
Electronic mail as a mean of direct marketing and communications, offers many unique advantages, such as:225
- marketing ability - "one to one", making a separate e-mail lists and messages aimed at spe-cific segments of the market,
225 Brkić, N., Unkić, F., 2009, number 29., page. 165.

REDETE – ECONOMIC DEVELOPMENT AND ENTEREPRENEURSHIP IN TRANSITION ECONOMIES
478
- unique communication tool with the ability to use different types of media for the trans-mission of messages in the most efficient manner, including video, animation, music and speech,
- efficiency and low cost of marketing activities,
- advanced capabilities for monitoring and providing reports for activities marketing cam-paign should include.
E-mail is immediate, efficient, fast, inexpensive means of communicating and conducting mar-
keting activities in the process of understanding customer behavior, personalization services and building long-term loyalty. Using Internet technology with the development and its application creates added value for the customer. Internet technologies have the ability to integrate with exis-ting infrastructure systems, telecommunications and information systems, so that there is a basis for the realization of advanced communications through the connection of different media.
Understanding consumer behavior and their familiarity with the mass market in terms of complex communication with the advent of e-commerce sites is becoming more efficient. A single transaction is also recorded, not only successful one, or type and quantity of purchased products and services, and the repetition of frequency of purchase, dates of transactions, etc. It is important to determine the attitudes of individual customers, the sphere of their interests, to look over the items on the web and what services they are interested in .
In terms of the necessary costs in the process of recording and analyzing data considering customer behavior, Internet has proven to be an effective technology. And for the customer, it represents the simplest and most economical offer of possible suppliers. Mutual communication and customer relations institutions provide sufficient data, which are aggregated and distributed to users and analyzed in order to define the preferences and habits of customers and formed a flexible, high-quality package deals. Personalization of products and services, which can be realized through the Internet or mobile phone, is particularly favorable in terms of distribution and delivery and adaptation in real time. We should not ignore the much lower cost of transactions carried out electronically, which represents a significant savings for a customer.
2.2. Mobile marketing
Mobile telephony is a part of everyday life in recent years , mobile phones are always with the users. Users of this advanced communication techniques are persons of all ages, regardless their social, economic, cultural and educational differences. Today it is impossible to see any contact address to without a mobile phone number. Mobile devices have become a solid basis for the implementation of marketing plans and activities considering their basic characteristics, mobility and functionality,. Thanks to them, the basic function of telephone services is changed. They were used to interconnect locations, and now they connect people, through various forms of information exchange. Apart from the direct speech between two sides, it is also used for SMS and MMS service.
SMS (short message service) is used to send text messages to customers' mobile phone , while the MMS (multimedia message service) is used to send messages that include multimedia content such as music, videos, pictures and other. Marketing professionals have quickly discovered significant potential of the mobile phone as a channel of direct communication. So, they started to use mobile marketing in their marketing campaigns, sending a text message to existing and potential customers' mobile phones.
The banking sector made the greatest improvement in this marketing field. They provide some of their services using mobile telephony. The complexity of the process of mobile phones communication in comparison with other forms is reflected in the existence of multiple mobile

REDETE – ECONOMIC DEVELOPMENT AND ENTEREPRENEURSHIP IN TRANSITION ECONOMIES
479
operators, and mobile campaign takes you through all the mobile network, in order to reach Tar-geted users.
The biggest advantage of mobile marketing company is reflected in the fact that users carry their devices with them, we can say 24 hours a day at all locations. The monitoring of mobile customer is enabled. A buyer may request and receive services in different locations, while on the other hand the service provider can follow the customer and his reaction as it takes time to respond to an ad, respond to text messages and respond to the information provided or the services delivered.
Communication and interaction between financial institutions, primarily between banks and insurance companies range from simple messages about changing balances or receiving payments for insurance to complex marketing activities through direct communication with individual customers. Mobile telephony and mobile marketing provides several strategic advantages:
- mobile devices are cheaper and more widespread than other telecommunication devices and these devices are the in constant expansion,
- communicate directly with cooperative clients is the most efficient in terms of cost,
- there is no time limitation for sending SMS messages and establishing two-way dialogue,
- when the first attempt to make contact that does not work, both the client and institution receive a notice when it is possible to do, so it removes an unnecessary waste of time
- with digital transaction tracking, analysis of information and their usage, mobile techno-logy provides excellent conditions for the implementation of CRM strategies in the short terms and in places that suit the customer.
The use of mobile telephony in financial institutions while dealing with customers and building
long-term relationships through it is expanding. The decline in the price of SMS messages by institutions as clients is noticed, some are even free of charge, which shows the importance of this service and confirms that it is the most effective system of communication if we consider costs.
Reference list
1. Afuah, A. and Tucci, C. (2001), Internet Business Models and Strategies, New York, McGr-aw-Hill/Irwin,
2. Brkić, N., Unkić, F. (2009), Electronic mail as a mean of direct company marketing in Bosnia and Herzegovina, number 29, Proceedings of the Faculty of Economy in Sarajevo,
3. Brkić, N. (2003), Marketing Communication Management, The Faculty of Economy, Sarajevo,
4. Lovreta, S., Petković, G. (2010), Trade marketing, CID The faculty of Economy, Čugura, Beograd.

REDETE – ECONOMIC DEVELOPMENT AND ENTEREPRENEURSHIP IN TRANSITION ECONOMIES
480
THE COST OF CAPITAL IN THE REPUBLIC OF SRPSKA
Tajana SERDAR* Dijana SREDIĆ**
Abstract
The price of capital by definition is compound of the price of shareholder capital (dividend rate) and the price of loans (interest rate). In this paper the focus is on the price of the capital in the Republic of Srpska. Researching published data, there are few joint share companies which pay dividends to their shareholders. Therefore, the interest rate is the most important part of ca-pital price in the observed country. To face with financial crisis the state government has adop-ted set of measures to decrease the negative crisis effects on a national economy and the most important role in that policy is confined to the development funds. It is symptomatic that first development funds from the domestic sources were founded in 2006, but became operative in 2008, at the beginning of global financing crisis. The purpose of this paper is to compare the price of capital before and after beginning of the crisis, that corresponds to the comparison of the level of interest rates before and during the establishment of development funds. The divi-dend payments are insignificant, but there will be shown a review of payments in the relevant time period. In this paper it will be discussed the market share of development funds in the total credit portfolio of banking sector in Republic of Srpska and the interest rates of loans from de-velopment funds and the average interest rate in banking sector. The two hypotheses are going to be proved. The first one is that market share of the developing funds has a tendency of incre-asing as the growth rate of the country is decreasing. The second hypothesis is that with intro-ducing the development funds the average interest rate decreases and furthermore the lowest interest rate boundary is moved down. The testing of these hypotheses will be undertaken with the usage of correlation and regression analysis. Afterwards, it will be presented the ways of fi-nancing from state funds in neighbor countries with particular data concerning the terms of loans. In conclusion, we are going to display results of proving hypothesis and give the overvi-ew of possible ways of loans condition's improvement. Also, there will be demonstrated that the main cost of capital in the transition countries is the interest rate.
Keywords: cost of capital, interest rate, development funds, capital structure
* Faculty of Economics, University of Banja Luka, [email protected] ** The Republic of Srpska Investment-Development Bank Banja Luka, [email protected]

REDETE – ECONOMIC DEVELOPMENT AND ENTEREPRENEURSHIP IN TRANSITION ECONOMIES
481
Commercial banks Nonbanks lenders Suppliers Bond holders
Common stockholders Retained earnings (internal funds of the company)
Preferred stockholders
Debt financing
Rd
Equity financing
Re
Hybrid equity
financing Rps
Instead of introduction: The terms of capital cost
The cost of capital is the cost of each financing component used by the firm to fund its projects multiplied by that component's percent of the total funding amount. The company has several sources of funds: commercial banks, nonbank lenders, owners of the company, preferred stockholders, suppliers and the cash flow from company s operations. The liability accounts are classified as debt financing. The owners' equity accounts, preferred shareholders, common shareholders and retailed earnings are called equity financing. Selection of different financing components of debt and equity form capital structure of the firm.
Preferred stock of the company's are called hybrid equity financing. It is hybrid form of equity financing because it is treated like debt in terms of payment with the set rate annual dividend and like equity, because the principal is typically not repaired. Therefore preferred stocks are considered financing between debt and equity financing.
Figure 1: Sources of Company's Capital: Debt, Equity and Hybrid Financing (Brooks, R., 2010, pp. 321)
As it is obvious on the previous graph, capital of the company consists of three parts: debt, equity and hybrid equity, which have different costs. In the Republic of Srpska, cost of debt is the most important part of capital price. Therefore, the debt financing and especially development funds are in the center of calculating the cost of capital in the Republic of Srpska.
This paper focuses on the comparison of capital prices before and after beginning of the crisis, which is related to the comparison of the interest rates' level before and during the establishment of development funds in Republic of Srpska. In the article we claim that market share of the developing funds has a tendency of increasing as the growth rate of the country is decreasing. As well, with introduction of development funds the average interest rate decreases and furthermore the lowest interest rate boundary is moved down. In order to confirm this conclusion, we theoreticaly consider terms of capital cost, then impact of development funds in contries in region, characteristics of loan financing and finally structure of capital cost in Republic of Srpska.

REDETE – ECONOMIC DEVELOPMENT AND ENTEREPRENEURSHIP IN TRANSITION ECONOMIES
482
1. Structure of the cost of capital
In order to calculate Weighted Average Cost of Capital (WACC) it is necessary to determine the cost of debt, the cost of equity capital and the cost of preferred stocks. There is a cost associated with each type of debt that a company uses. If a company borrows money by selling bonds, the yield to maturity on bonds is the cost of bond. On the other hand, if the financing includes loans, cost of debt is the interest rate. Cost of equity capital or cost of common stock can be defined as a minimum yield company has to achieve on certain investment funded from equity capital in order to keep market price of common stock from decreasing.
1.1 The cost of a bond
The cost of debt for a publicly traded bond is estimated using the yield to maturity calculation. The yield to maturity is discount rate that makes present value of the coupon and principal payments equal to the price of the bond. In order to find yield to maturity we should start at following equation (Brooks, R., 2010, pp. 320):
PB = i1
C1 2
2
i)(1
C;
i)(1
F Cnnn
where PB is the price of the bond, C is the coupon, F is the principal payments and i = kBond is the cost of a bond.
We could use financial calculator and solve for i to find yield to maturity. The effective annual interest rate (EAR) must be calculated to obtain the actual annual cost of this debt:
EAR = ;1)m
k1( Bond m
EAR is the annual rate of return required by the market on this bond, which is known as the
effective annual yield on Wall Street.
1.2 The cost of a loan
Calculation of the cost of long-term bank loan or other private debt is not as direct as estimating the cost of bond because financial analysts can not observe the market price of private debt. Anyway, this observation is not needed, so interest rate from a banker provides a good estimation of the cost of private loan. In many countries companies can deduct their interest payment for tax purposes. The after-tax cost of the loan is (Rodić, J. and Filipović, M., 2010, pp. 232):
kDebt after-tax = kDebt pretax x (1 – t); This after-tax cost of debt is the cost company use to calculate WACC. The reason for this is
that investors are interested in what they actually have to pay for capital and the actual cost is reduced by tax break that government provides.

REDETE – ECONOMIC DEVELOPMENT AND ENTEREPRENEURSHIP IN TRANSITION ECONOMIES
483
1.3 The cost of a preferred stock
The owner of a preferred stock is entitled to receive perpetual constant dividend each year based on original par value of the preferred stock and the contracted dividend rate. Also, this type of securities do not have an expiration date. Mentioned characteristics of preferred stocks reveal that constant dividend model is suitable for the cash flow that owner of this stock can anticipate receiving (Parino, R. and Kidwell, D., 2009, pp. 446).
Pps = Dps / kps;
where Pps is the present value of the expected dividends, Dps is the annual preferred stock dividend and kps is the cost of the preferred stock.
kps = Dps / kps This is a rate of return at which the present value of the annual cash flows equals the market
price of preferred stock. However, CAMP model also can be used to estimate cost of preferred equity.
1.4 The cost of equity
a) CAMP model (Capital Asset Pricing Model) There are several methods to calculate a cost of common share. The approach a financial
analyst chooses will depend on what information is available and how reliable the analyst beleives it is. In CAMP model, the cost we are referring is the rate of return that investors require for investing in the stock at a particular time, having in mind its systematic risk (Van Horne, G.and Wachowicz, J. M., 2007, pp. 73).
E (Ri) = Rrf + βi [ E (Rm) – Rrf)] where E (Ri) is the cost of common stock capital used by a company; E (Rm) – Rrf) is the market risk premium; Rrf is the risk-free rate and E(Rm) is expected return on the market. From previous equation, we draw out kes:
kes = Rrf + (βes x Market risk premium)
b) Constant-growth dividend model If a dividend received by the owner of a share of common stock are expected to grow at a
constant rate in perpetuity, the value of that share today can be calculated using following equation (Parino, R. and Kidwell, D., 2009, pp. 441):
P0 = D1 / (R-g);
where D1 is the dividend expected to be paid one period from today, R is required rate of return and g is annual rate at which dividends are expected to grow in perpetuity.
We can replace R in equation with kes which is estimated expected rate of return for investing in common stock or cost of equity. Then, kes is (Krasulja, D., 1977, pp. 162):

REDETE – ECONOMIC DEVELOPMENT AND ENTEREPRENEURSHIP IN TRANSITION ECONOMIES
484
kes = (D1/P0) + g; This approach is useful when company pays dividends and it is reasonable to assume dividends
will grow at a constant rate, which can be estimated. Estimating the long-term rate of growth in dividends can be related to long-term growth rate of economy (dividends can not grow faster then growth rate of economy - inflation plus about 3%).
c) Multistage-growth dividend model Using a multistage-growth dividend model in comparison with constant-growth dividend
model allows varying dividend rates growth in the near term, followed by a constant long-term growth rate. General model for market valuation of common stock could be translated into next equation (Parino, R. And Kidwell, D., 2009, pp. 442):
where P0 is current price of common stock, g is annual rate at which dividends are expected to
grow, D1 is the dividend in first period, and kes is the required rate of return on common stock. We could solve this equation for kes using trial and error calculation. The major issues we have
to be concerned about when using growth dividend model are: choosing the right model and estimating the reasonable growth rates.
In practice, most used model for estimating the cost of common equity is CAMP. CAMP tells managers what rate of return investors should require for equity having the same level of systematic risk that the company's equity has. Onwards, CAMP does not require financial analysts to make assumptions about future growth rates in dividends.
1.5 Calculating Weighted Average Cost of Capital (WACC)
Whereas the prices of each component in capital structure have been set, they have to be weighted according to certain criteria in order to obtain the weighted average cost of capital for the company as a whole. A specific problem of determining the average cost of capital is the selection of objective weights' system (Brooks, R., 2010, pp. 562). The question is how the weights for different sources of capital should be defined: do these weights should reflect the existing capital structure or base on optimal capital structure? Due to difficulties inherent in measuring optimal capital structure, it is usually taken weights which anticipate existing capital structure can be satisfying, if that structure is not distorted. WACC is weighted average of company's after-tax cost of debt, cost of preferre stock and cost of common equity, presented in equation (Parino, R. And Kidwell, D., 2009, pp. 447):
WACC = xDebt k Debt pretax (1 – t) + xps kps + xes kes;
where xDebt + xps + xes = 1 The sum of multiplication of capital from each source and the cost of additional capital after
tax gives weighted average cost of capital. Financial experts will use market value rather than the accounting book values of debt, preferred and common stock to calculate the weights. The reason is that the basic principles of discounting process require the costs of the different financing sources are weighted by their relative market value.
1
tes
t1
tes
t1
2es
21
1es
11
0 )k(1
g)1(D
)k(1
g)1(D....
)k(1
g)1(D
)k(1
g)1(DP
t

REDETE – ECONOMIC DEVELOPMENT AND ENTEREPRENEURSHIP IN TRANSITION ECONOMIES
485
2. Impact of financing from development funds on cost of capital
Financing decisions require efficient planning, pragmatic solutions and innovative answers to the problems and challenges of the modern enterprises. Using resources from state development funds significantly lowers the cost of capital. However, in order to be able to apply for deve-lopment funds' resources, company has to consider the conditions and limitations development funds set in granting their resources provided for investment' financing.
Benefits of development funds for company entail easier access to loans with most favorable credit conditions and usually include the provision of technical assistence in preparing loan applications. Benefits for a bank are reflected in reducing the investment risk, while local community providing targeted assistance to the SME, contribute to job creation, better filling of the budget and economic development of the community.
In Republic of Srpska, legal conditions for establishment of credit guarantee funds were created by adoption of the Guarantee Fund Law of the Republic of Srpska (Official Gazette of the Republic of Srpska 50/10). Ability to secure funding sources from development fund, which are basically cheaper than the market ones, leads to significant increase in profitability of planned investment and at the same time decreases the cost of capital in the company.
The following table lists the interest rates of development funds' credit lines for bussiness and entrepreneurs in the Republic of Srpska, the Federation of Bosnia and Herzegovina, Serbia, Croatia and Slovenia.
Table 1: Comparative analysis of development funds' interest rates in region
The Republic of Srpska Investment-Development Bank (IRBRS)
Basic interest rate 5.4%
For the projects implemented in the territory of underdeveloped and extremely underdeveloped municipalities
4.9%
For projects from the field of processing and power generation industry 5.1%
For cluster members 5.1% For projects encouraging tourism industry 5.1% For export preparation (short term loans) 4.4% Cumulative decrease 4.6%
The Development Bank of Federation of Bosnia and Herzegovina
The credit line for long-term financing to boost employment from the funds of Federal Employment Institute
Industry, manufacturing and services Agriculture
4.0% 3.0%
The credit line for long-term financing of performed export
5.0%
Loans for development of entrepreneurship If a collateral for a loan is promissory note of commercial bank In other cases
2.0% 3.5%
Loans for legal entities Short-term loans Investment loans Loans for permanent working assets
3.0% 2.8% 3.0%

REDETE – ECONOMIC DEVELOPMENT AND ENTEREPRENEURSHIP IN TRANSITION ECONOMIES
486
The Development Fund of Republic of Serbia
Loans for stimulating balanced regional development – legal entities and entrepreneurs For territory of a third group of underdevelopment:
If a collateral for a loan is promissory note of commercial bank In other cases
For territory of a fourth group of underdevelopment: If a collateral for a loan is promissory note of commercial bank In other cases
1.5% 2.5% 1.0% 2.0%
Start-up loans – legal entities and entrepreneurs 3.0% Financing of old artistic crafts 1.0%
Loans for female entrepreneurship If a collateral for loan is promissory note of commercial bank
In other cases
2.0% 3.0%
The Croatian Bank for Reconstruction and Development
Program for financing of invention 2.0% or 4.0%
Agriculture Program for financing of agriculture and small business in the area
of special state concern Loans for preparation of agriculture production Program for financing island development - entrepreneurs
2.0% or 4.0% 3.00% 2.0% or 4.0%
Export Loans for financing exporters from funds of IBRD
Loan for financing suppliers in export transactions and Credit lines for banks of foreign buyers
Six-months LIBOR for EURO + margin CIRR + margin 0.2 – 2.0% or LIBOR/EURIBOR + margin
Tourism Program for tourism financing Program for financing the preparation for the tourist season
2.0%. 4.0% or 6.0% Three-months EURIBOR + 3.75%
Loans for legal entities 2.0%, 4% or 6% Small and medium enterprises
Female entrepreneurship Permanent working assets Loans for financing development of small and medium enterprises
Loans for small and medium businesses with the support of the EU
4.0% 4.0% or 6.0% 2.0% or 4.0% One-month, three-months or six-months EURIBOR + margin
Loans for projects of environment protection, energy efficiency and renewable energy
4.0%
Infrastructure Program for communal infrastructure financing Credit line for financing projects of water supply and sanitation in
Croatia
4.0% 3.0%
Start-up loans for entrepreneurs 4.0% Loans for Financial Restructuring
Agriculture Other legal entities
5.0% 6.0%

REDETE – ECONOMIC DEVELOPMENT AND ENTEREPRENEURSHIP IN TRANSITION ECONOMIES
487
Working assets Loans for improving liquidity Program for financing permanent working assets for empowering
business
4.0% 4.0% or 6.0%
The Slovenian Export and Development Bank
Financing of small and medium-sized enterprises operating - financing working assets of SME
Six-months EURIBOR + 2.7%
Financing internalization of small and medium-sized enterprises EURIBOR + 2.0%
max
Financing SME investment in environmental protection EURIBOR + 2.0%
max
Financing investment in research, development and innovation EURIBOR + 2.0%
max
Financing of medium and large enterprises – preparation of export financing Six-months EURIBOR + 2.7%
Loans to suppliers – export financing Market interest rate, including LIBOR/EURIBOR
Loans to buyers – financing foreign buyer of Slovenian goods and services Market interest rate, including LIBOR/EURIBOR
Sources: http://www.irbrs.org (accessed 9/15/2012)
http://www.rbfbih.ba(accessed (accessed 9/15/2012) http:// www.fondzarazvoj.gov.rs (accessed 9/15/2012)
http://www.hbor.hr (accesssed 9/15/2012) http://www.sid.si (accessed 9/15/2012)
When we compare IRBRS and the Development Bank of Federation of Bosnia and Herzego-
vina, it is obvious that the second one offer lower basic interest rate, 4.0% in comparison to 5.4% for IRBRS. This is compensated with a shorter period of repayment of the loans in Federation of BiH. Further, neither development fund in Bosnia and Herzegovina has branched structure of interest rates by the types of loans. The Development Fund of Republic of Serbia offers loans for development of entrepreneurship and loans for legal entities by much lower interest rate than our domestic development funds. The difference in height of interest rates is especially noticeable with loans for stimulating balanced regional development in Serbia. The interest rate is 1.5% for investment in underdeveloped regions and only 1.0% for the most underdeveloped regions, which is the lowest interest rate in region. The Development Fund of Republic of Serbia decreased interest rate for legal entities and at the moment it amounts 2.8% in comparison with the last year when it was 4.5%.
The Croatian Bank for Reconstruction and Development has the largest number of loans' types. The lowest rates are in program for financing of agriculture and invention – from 2.0% to 4.0%. Croatian development fund paid special attention to small and medium entrepreneurship. Loans for small and medium businesses with the support of the EU are related with the EURIBOR movements. Likewise, loans for financing export and tourism vary in correlation with movements of EURIBOR or LIBOR.
In Slovenia, interest rates in programs for financing legal entities are mainly linked to EURIBOR, LIBOR or CIRR, which is not the case with development funds in Republic of Srps-ka, Federation of Bosnia and Herzegovina and Serbia, which fix their interest rates. Deadlines for majority of loans offered by Slovenian export and development bank amount 10 or 12 years. It should be noted Croatian Bank for Reconstruction and Development gives their companies longer repayment periods, similar to Republic of Srpska Investment-Development Bank, while Develop-

REDETE – ECONOMIC DEVELOPMENT AND ENTEREPRENEURSHIP IN TRANSITION ECONOMIES
488
ment Fund of Republic of Serbia and Development Bank of Federation of BiH limit these periods to a maximum of 7 years.
Hence, harmonization of financial structure is of the crucial importance from the point of forming a capital price as a financial standard for evaluation of investment project effectiveness and company's value. Only financial structure that provides the minimum average cost of capital is the optimal financial structure. Optimal capital structure enables a efficient use of total capital, which not only affects the maximization of company's value as a primary business goal, but it increases the welfare of a society in whole.
3. Study: The cost of capital in Republic of Srpska
The financial system in Bosnia and Herzegovina is specific in the sense that, in the country with population of approximate 3.5 million citizens, exist two separate stock exchanges (Banja Luka Stock Exchange- BLSE and Sarajevo Stock Exchange- SASE) and two agencies for moni-toring banking sector (the Banking Agency of Republika of Srpska and the Banking Agency of the Federation of BiH).
Analysis in this paper is based on data for the Republic of Srpska and has been performed on the private companies that have publicly issued shares on Banja Luka Stock Exchange. As it is mentioned, a cost of capital consists of a dividend rate and an interest rate that companies pay on debt. In accordance with that, the research part of the paper will be organized. The intention is to give an overview of dividend rates and interest rates in the period 2007 - 2012. This period of time has been chosen because the financial crisis began in 2007, and data are relevant nowadays. Furthermore, all available data sources are comparable until the 4th quarter of 2006. Before this date, there were not publicly available statistical data and summary financial statements.
Publicly available data have been gathered from three sources: the Banking Agency of the Republic of Srpska, the Central Bank of Bosnia and Herzegovina and from financial statements of companies listed at the BLSE.
839 different securities have been listed at BLSE on 4th September 2012. There are 775 shares among them, including regular and preferred shares (other securities are t-bills and bonds). It is possible to trade with 519 shares, while others are suspended. The reason for suspension is a process of liquidation or process of pre-liquidation in the company or not-submitted financial report for the preceding year.
Data concerning financial reports contains information about 569 companies other than financial institution. Financial institutions are not subject of our inquiry, since we have intention to give an overview of cost of capital in real economic sector. All companies, regardless to the initiated process of liquidation, are subject of inquiry.
3.1 Dividend Yield
Dividend Yield is the ratio between dividend per share and current market price. It measures investor’s dividend revenue. There have been 101 dividend payments since 2006 in the capital market of Republic of Srpska, out of which 84 cash dividends payments and 17 shares dividends payments.
Dividends are paid on preferred and common shares listed at BLSE. Banks and insurance companies have been paying dividends on preferred shares, mostly because of state support against global crisis. Namely, state developing funds (organized as the IRBRS) have possibility to invest in the preferred shares of financial sector, which minimal annual dividend rate has to be 8%. Consequently, in 2012 there were 3 dividend payments on the basis of 8% annual dividend rate.

REDETE – ECONOMIC DEVELOPMENT AND ENTEREPRENEURSHIP IN TRANSITION ECONOMIES
489
Omitting those 3 payments, 14 companies paid dividends on regular shares in 2012. Average dividend rate is 9.2% including one extremely high dividend rate of 49.99%. When this number is omitted, the average rate is 6.06%.
Figure 2: Dividend Rate on Regular Shares in 2012
As it is mentioned, the dividend is paid on only 17 of 775 shares. It suggests that inquiry of
interest rate is much more needed in developing countries. Furthermore in theory, only big companies pay dividends. Comparing asset value, companies that pay dividend are not the biggest of the listed companies, except one.
Facts below are enough to conclude that the financial market in the Republic of Srpska is ban-king orientated and not capital market. Our further analyze is focused on research of the interest rates.
3.2 Credit Market in the Republic of Srpska
Banks in the Republic of Srpska have obligation to submit quarter reports to the Banking Agency of the Republic of Srpska. Based on analytical data, the Agency publishes reports with aggregated data for the disbursement of the banks located in the Rebulic of Srpska. According to the Reports About of the Banking System in the Rebulic of Srpska, made quarterly, credit replenishment to the private sector can be compared to the total credit replenishment.

REDETE – ECONOMIC DEVELOPMENT AND ENTEREPRENEURSHIP IN TRANSITION ECONOMIES
490
Figure 3: Loan Amount in the Republic of Srpska in the Period 01/01/2007- 03/31/2012
Trend of total loans and loans to the private enterprises have recorded growth during total
observing period. Loans to the private enterprises participates in the total loan amount less than 50%. This suggests that loans are mostly used for the final consumption.
Development funds are established in 2007 from the asset retained in the privatization process. Lending from these sources became operative in the second quarter of 2008 and it is shown in the next figure.
Figure 4: Development Funds Replenishment
Unfortunately, available development funds are limited and they depend on the cash inflow of
privatization of the companies (which are less than in previous decade since the most of the companies are sold) and on the returns of loans. The demand for those funds is high, which is supported by the fact of plan realization of more than 100%. Unfortunately, there is not available data concerning demand on the loans which is not possible to meet.
Observing changes in replenishment of development funds on quarter basis, it is not possible to conclude in which direction next quarter replenishment will move. The growth index of total

REDETE – ECONOMIC DEVELOPMENT AND ENTEREPRENEURSHIP IN TRANSITION ECONOMIES
491
banking sector replenishment has been moving in a range from 92.78 to 111.06, while the growth index of development funds replenishment has been moving in a range from 36.88 to 220.60. Any data could not be used to predict future available sources of development funds or the future level of replenishment.
Figure 5: Growth Index IRBRS and Growth Index of Total Banking Sector
We have mentioned in the abstract that we would prove hypothesis: market share of the developing funds has a tendency of increasing as the growth rate of the country is decreasing. Next, we compare the growth rate of real GDP226 with the growth index of replenished development funds.
Table 2: Comparative analysis of development funds growth index and GDP growth rate
Year IRBRS Disbursement
in 000 BAM
Index
Real GDP (growth rate in
percents) 2008 136,610 N/A 5.6
2009 199,499 1.4604 -2.9
2010 180,827 0.9064 0.7
2011 153,298 0.8478 1.3
It is obvious from the data that as GPD decrease replenishments increases. In order to illustrate the cost of loans, we gathered data from quarter reports published by the
Banking Agency of the Republic of Srpska.
226
http://www.cbbh.ba/index.php?id=32&lang=en

REDETE – ECONOMIC DEVELOPMENT AND ENTEREPRENEURSHIP IN TRANSITION ECONOMIES
492
Figure 6: Interest Rates of Long-term Loans in the Republic of Srpska
Interest rate fluctuation decreased since the second quarter 2009. Also spread between
effective and nominal interest rate dropped from 1.5 to 0.54, but the provisions on the loans are still significant.
Intending to use several data sources, we extracted data from the quarter reports of the Banking Agency of the Republic of Srpska and from the statistic review of active deposit money bank interest rates on the web site of the Central Bank of Bosnia and Herzegovina.
Figure 7: Interest Rates of Private Companies' Long-term Loans
Discrepancy between data from two sources is far most obvious in recent years. We assume
that the difference derive from different methodologies in data summing. Discrepancy became less significant since the first quarter of 2010. The discrepancy in the last available quarter, the first quarter of 2012, has the smallest recorded amount of all observed data. It amounts to 0.54 percentage points. From that fact, we could assume that both data sources are relevant nowadays.
On the other hand, there are the financial reports of companies which contain data relevant for lending analysis. Available for usage are financial reports submitted to the BLSE, and there are 569 reports accessible in 2011. From summarized financial reports, we extracted data for interest expenses from the income statement, and the short-term and long-term loans from the balance sheet. Out the population of 569 units, 104 companies have zeroes on the three explored positions, pointing on there is not lending activities in those subjects. The data which is surprising is existence of the interest expenses in the statements of 128 companies while zeroes are in the position of the short-term and long-term loans. The reasons could be either companies have not properly obey bookkeeping policies or they have accrued interest on the statement position even the law on banks does not allow lending with the interest rates to other institutions than banks. For

REDETE – ECONOMIC DEVELOPMENT AND ENTEREPRENEURSHIP IN TRANSITION ECONOMIES
493
information, number of companies with the interest expenses higher than 1,000 BAM and without any loans, are 70, while those with the interest expenses higher than 10,000 are 31. The highest is the interest expense of 5.875.411 BAM, while the observed company has no indebtedness. Out of 569 companies, 364 operate without short-term indebtedness in 2011 while 333 of them operate without long-term indebtedness.
In order to calculate average interest rate paid according to the financial statements, from the population of 569 units, we have extracted 294 units with data concerning indebtedness: have figures in the position of the interest expenses and the short-term or long-term loans. After that we have introduced ratio the interest expenses to sum of the short-term and long-term loans, representing the interest rate paid on debts. Averaging mentioned ratio for the 294 units, we have got a number of 32.29%. The sample contains extremely high positions (for example the interest expense of 43,631 BAM, while the sum of short-term and long term debt amounts to 2,502 BAM, giving the ratio of 1,743.84%). In the ratio calculation 53 figures have value greater than 20%, which we consider as extremely high percentage. Omitting the ratios for 38 companies which ratio amounts to percentage higher than 20, we have got the average ratio of 10.40% (241 companies is included in calculation).
From the previous paragraph, we could conclude that the companies’ financial statements indicate average ratio of 10.40% that could be regarded as the average interest rate.
The goal of the previous analysis was to show that the interest rate on the loans from developing funds are lower that the rates publicly declared by the Central Bank and the Agency. Moreover, mentioned interest rates are much lower than the interest rates derived from the financial statements.
Conclusions
Analyzing cost of capital in the Republic of Srpska, we could conclude that the cost consists mostly of the interest costs. Only 14 companies paid dividends on regular shares in 2012, while 3 companies have paid dividends on preferred shares. Average dividend rate on regular shares is 9.2% including one extremely high dividend rate of 49.99%. When this number is omitted, the average rate is 6.06%. Dividend rate on preferred shares is 8%.
Next stage of analysis is inquiry into the interest rates. Nominal rate on the private loans in the first quarter of 2012 amounts to 7.97 while effective rate amounts to 8.51% according to the Banking Agency of the Republic of Srpska; interest rate in the first quarter of 2012 amounts to 7.80% according to the Central Bank of Bosnia and Herzegovina
We could conclude that the companies’ financial statements indicate average ratio of 10.40% that could be regarded as the average interest rate by this source.
Summing all data concerning interest rates, and comparing them to interest rates on loans from developing funds, favorableness of the last is more than apparent. Hypothesis that market share of the developing funds has a tendency of increasing as the growth rate of the country is decreasing is proven by the fact of decreasing BDP in compare to increasing development funds replenishments.
The second hypothesis: introducing the development funds the average interest rate decreases and furthermore the lowest interest rate boundary is moved down, is also proved. The lines in the figure 6 dropped sharply after 2008, which is concerned as the beginning of the crisis. Moreover, the development funds have been introduced for the first time in the Republic of Srpska.
Evidently, the high demand for the loans from development funds is not meet. Summarizing all mentioned ahead, the interest rates for entrepreneurship are at the level on which demand is higher than available funds. Consequently the focus must be on the providing new sources of funds in the future.

REDETE – ECONOMIC DEVELOPMENT AND ENTEREPRENEURSHIP IN TRANSITION ECONOMIES
494
Reference list
1. Brooks, R. (2010). Financial Management: Core Concepts. London: Pearson Education 2. Banking Agency of the Republic of Srpska. (2007-2012). Reports on the Situation in Banking
System of the Republic of Srpska http://www.abrs.ba/publikacije/publikacije.htm (accessed during September 2012)
3. Central Bank of Bosnia and Herzegovina. (2007-2012). Bulletins for 2007, 2008, 2009, 2010, 2011 and 2012. http://www.cbbh.ba/index.php?id=35&lang=en (accessed during September 2012)
4. Damodaran, A. Corporate Finance. New York: John Willy and Sons Inc., 2001. 5. Friedlob, G.; Schleifer L.; Plewa F. Essentials of Corporate Performance Measurement. New
York: John Wiley & Sons, Inc., 2002. 6. Jolly, A.; Burmajster, A. The Handbook Of International Corporate Governance. London:
Kogan Page, 2009 7. Krasulja, D. (1977.) Finansijska efektivnost i finansiranje investicija. Beograd: Naučna knjiga. 8. Parino, R.; Kidwelll, D. (2009.) Fundamentals of Corporate Finance. New York: John Wiley&
Sons, Inc, pp. 441 9. Rodić, J.; Filipović, M. (2010.) Poslovne finansije. Belgrade: Beogradska poslovna škola –
visoka škola stručnih studija 10. Summarized Financial Reports of the Companies Listed at Banja Luka Stock Exchange.
http://www.blberza.com/v2/Pages/othermarketinfo.aspx?group=1. (accessed during September 2012)
11. Van Horne, C. J, Wachowicz, J. M. Jr. .Osnovi finansijskog menadžmenta. Beograd: Data Status, 2007.
12. http://www.irbrs.org (accessed 9/15/2012) 13. http:// www.fondzarazvoj.gov.rs (accessed 9/15/2012) 14. http://www.hbor.hr (accesssed 9/15/2012) 15. http://www.rbfbih.ba(accessed (accessed 9/15/2012) 16. http://www.sid.si (accessed 9/15/2012)

REDETE – ECONOMIC DEVELOPMENT AND ENTEREPRENEURSHIP IN TRANSITION ECONOMIES
495
TYPICAL PROBLEMS OF REORGANIZATION
IN SERBIAN ENTERPRISES
Peter HARMATH227 Jelena ANDRAŠIĆ228
Abstract
Each region can be characterized with specific managerial attitudes towards organizational questions, processes and measures of development but especially towards organizational prob-lems. In the case of commonwealth countries the questions of organizational development seems to be based on a highly comprehensive and historically continual social and economical develo-pment process versus what happened in the majority of Western Balkan Countries (WBC) but especially in Serbia.
In the last two decades the Serbian enterprises have run into plenty of organizational prob-lems connected with building or establishing market economy. This advancing process makes the problems more and more comparable with current problems of e.g. common wealth countri-es. The necessary transition processes cause a continual need for monitoring the change. With-out a clearly defined approach for monitoring the organizational change processes, now it has become very hard to create the right vision of change needed for further reorganization in Ser-bian enterprises.
The aim of this work is to offer a brief overview of typical problems of Serbian enterprises at the time of performing of organizational change. The study is based on collected and aggrega-ted cases of problems those that can be considered as “typical inside the process of reorganiza-tion”. The article involves two fairly similar patterns of considering and benchmarking the ch-ange process obstacles. These two approaches differ by the authors, in time and place but not in the way of thinking.
As a result it was recognized that there are much more possibilities to diagnose the causes of mistaken change processes. They can be sorted e.g. according to behavioral, structural and co-ntextual origin. Many discrepancies can be found between the undertaken measures and the ex-actly needed solution of the real problem. Usually it was the right (needed) action that was mis-sing. Some of the reasons could be that usually people act according to their own view of what is rational for them (individually) but in a complex system with a turbulent (unpredictable, equi-vocal sometimes hostile) environment it can lead to contradictory situations. In some cases the different interests of stakeholders make it impossible to reach a consensus in strategy, organiza-tional structure, decentralization delegation, standardization, communication, motivation, etc.
Having considered and benchmarked the limiting factor of reorganization, the authors con-cluded that the problems in the acceptance of organizational changes of Serbian companies are generally the same. It can be stated with considerable certainty that the proposed methodologi-cal solution is applicable to all sectors of the economy, and at every organizational level of en-terprise. The presented experience of Serbian enterprises can serve as the basis for anticipating some negative (limiting) factors. It could be crucial for increasing the competitiveness of enter-prises in other transition economies too.
Keywords: Reorganization, Organizational Change, Organizational Development, Economies in transition
227 Faculty of Economics in Subotica, Segedinski put 9-11, 24000 Subotica Serbia, [email protected] 228 Faculty of Economics in Subotica, Segedinski put 9-11, 24000 Subotica Serbia, [email protected]

REDETE – ECONOMIC DEVELOPMENT AND ENTEREPRENEURSHIP IN TRANSITION ECONOMIES
496
Introduction
Serbian enterprises are experiencing sticky change processes that were caused by different unfavorable conditions. As a matter of fact some of those circumstances were predictable but were not improved because of the antagonistic political interests. Some others were settled back because of the dominating selfishness – individual interests. In more than two decades of con-tinual attempts of transformation and change processes in our economy we have plenty of (un-fortunately bad) cases, examples to study.
One of the major waves of the change of Serbian enterprises was caused by privatization steps started in early 90s, but were confronted with so many obstacles. The next stage was the new law in 1997 as a starting point of redefined steps. But something went wrong again. It was realized soon that privatization only is not enough to solve the basic economical and organizational problems, such as different problems of inefficiency, obsolete technology, lost market positions, inadequate management tradition, etc. The newly privatized organizations led with inherited ma-nagement structure were not able to solve the problems.
After privatizing the big state owned companies there was not enough power in the private sector to absorb (employ) the rising number of unemployed workers. The “new private firms and or local owners are not yet fully prepared for market economy and competition, which is in line with previous findings the new private firms do not appear as dynamic as expected and are not necessarily the leading sector.” (Cerovic 2006). The reorganization processes started in the meantime failed to change all of the contingency misfits and maladjusted organizational properti-es. Unfortunately, the majority of those management issues that were the initial problem to start reorganization process remained at the time of reorganization and well after the transition processes. Those can be listed, for example, as signs of intended poor management (or abuse of manager positions), difficulties with organizational communication systems (mainly hidden or ignorance in information) problems with organizational structure (and existence of predominant informal structure undermining the formal one), obsolete technology, overcapacity (or just easi-ness), problems with workforce (a wide range of possible reasons), diverse legal and political influence on business, etc. These symptoms seem to be systematically produced.
Materials and Methods
The necessary Information base was the authors` case study collection based on field research and some published quantitative and qualitative data. Approximately 100 enterprises were included into analyses from the region of Vojvodina (Province of Serbia, period 2009 - 2012). Data collection was based on simple open question, what kind of problems they faced or considered as basic organizational problems during the reorganization (or change) and what kind of possibilities – solutions they see or have done to solve the mentioned problems.
After a relatively short period of study we found that something went wrong with the transformation processes. Why so many of good solutions that were made, at first glance, failed. What is the reason, where are the breakes of transformation processes?
To have a model or a framework to make diagnoses of change processes we have chosen two fairly similar methods. For Marjanovic’s table of resistant behavior symptoms (Marjanovic 1989) see table 1 and for Pugh’s OD matrix see table 2 (Pugh 1986), these were selected and in some aspects reinterpreted. These models are based on similar elements presented only in slightly different ways or coincidences. Each of them seems to be helpful ensuring most of the aspects considering change processes offering viewpoints that suit the typical circumstances. These circumstances usually depend on the business environment, institutional culture, and specific individual preferences – goals (e.g. employers or employees personal selfishness).

REDETE – ECONOMIC DEVELOPMENT AND ENTEREPRENEURSHIP IN TRANSITION ECONOMIES
497
Table 1. Table 1 Overview of symptoms and diagnosis with adequate treatment (Marjanovic 1989, p. 99.)
Symptoms Diagnosis Treatment – cure “not willing to do it” Heterogeneity of individual goals Change of individual goals.
Change of mutual goals Motivation
“cannot do it” Does not have an overview of the mutual goal
Mutual goals are too far
Setting achievable goals Improvement of staff
Change of mutual goals “do not know how to do it” The mutual goal is not defined
Uninformed Defining and perpetuating the tasks
Information support “is unable to do it” Lack of skillfulness
Incapacity, inability Training and facilitating
Asset change, change of work conditions and liabilities
Workforce selection
In comparison with Pugh’s table (shown as Table 2) Marjanovic’s table (Table 1) shows potential to be extended to all of the considered levels such as individual, group, inter-group and organizational level of Pugh’s matrix. However the columns “diagnosis” and “treatment” involve fewer behavioral, structural, and contextual aspects in comparison with Pugh’s OD matrix, but Marjanovic’s approach also underlines the importance of managing the goals and differences in symptoms made by individual qualification, knowledge and skills of the members of organization. Motivational background can also be estimated and developed uncovering the right symptoms.
Table 2 Pugh OD matrix - Diagnosis and methods of initiation of change
Behaviour (What is happening now?)
Structure (What is the required system?)
Context (What is the setting?)
Organizational level
General climate of poor morale, pressure, anxiety,
suspicion, lack of awareness of, or response to, environmental
changes. survey feedback,
organisational mirroring
poorly defined or inappropriate Systems goals;
inappropriate and misunderstood strategy;
inappropriate organization structure; centralization,
divisionalization, standardization: inadequacy of
environmental monitoring mechanisms.
change the structure
Geographical setting, market pressures, labor
market, physical conditions, basic
technology. change strategy, location,
physical set-up, culture (by saturation OD)
Inter-group level
Lack of effective co-operation between sub-units, conflict,
excessive competition, limited war, failure to confront differences in priorities,
unresolved feelings. inter-group confrontation (with third party as consultant), role
negotiation
Lack of integrated task perspective; sub-unit
optimization, required interaction difficult to
achieve. redefine responsibilities,
change reporting relationships, improve co-
ordination and liaison mechanisms
Different sub-unit values, life style, physical
distance. reduce psychological and
physical distance; exchange roles,
attachments, cross-functional social overlay
Group level
Inappropriate working relationships, atmosphere,
participation, poor understanding and acceptance
of goals, avoidance, inappropriate leadership style,
Task requirements poorly defined; role relationships unclear or inappropriate; leader's role overloaded, inappropriate reporting
procedures.
Insufficient resources, poor group composition for cohesion, inadequate
physical set-up, personality clashes. change technology,

REDETE – ECONOMIC DEVELOPMENT AND ENTEREPRENEURSHIP IN TRANSITION ECONOMIES
498
Behaviour (What is happening now?)
Structure (What is the required system?)
Context (What is the setting?)
leader not trusted, respected; leader in conflict with peers
and superiors. process consultation, team
building
redesign work relationships (socio-technical systems),
autonomous working groups
layout, group composition.
Individual level
Failure to fulfill individual's needs; frustration responses;
unwillingness to consider change, little chance for
learning and development. counseling, role analysis,
career planning
Poor job definition, task too easy or too difficult.
job restructuring/modification, redesign, enrichment, MbO
Poor match of individual with job, poor selection or
promotion. Inadequate preparation and training,
recognition and remuneration at variance
with objectives. Personnel changes,
improved selection and promotion procedures, improved training and
education, bring recognition and
remuneration in line with objectives.
At first glance Marjanovic’s approach seems to deal only with the individual level. But, it co-
uld be applied as a diagnosis tool also in upper levels of e.g. group level or even on organizational level. The extension can be made by reviewing who (on which level of management) was “confronted” with the given symptom. The methodology of extension can be based on a simplified table (see Table 3) just asking the different levels of managers (top, middle, and lower) to evaluate in what percentage their subordinates “referred symptoms”. For example, if the CEO was told “we cannot do/make it” from their subordinates (e.g. functional directors) it may show the problem to be cured on organizational level. In this case, we can suspect that the goals are too far from the viewpoint of subordinates or they do not have an overview of them. As a remedy, the top manager should set achievable - real goals. According to Table 3 discovered frequencies of symptoms underlines the need for therapy. As a result a managerial attempt to cure the situation (not always right or successful) was uncovered. These observations also fitted to the aim of the research. It is very important to discover that in many cases the symptom describes faults of leaders especially when we diagnose those less willing to do or “cannot do”. When the answerers refer to impossibility – “cannot do it” may be the problem of education or exercise and in the case of unable we can diagnose the situation so that not the right man was placed in right work- place.
Table 3 Measuring the frequency of unfavorable symptoms-reactions observed by managers
Estimate what the frequency of symptoms is as a reaction to your orders from your subordinates Subordinates reaction – symptom Percentage of appearance of symptom in your
subordinates’ reaction – behavior “not willing to do it“
“cannot do it“ “does not know how to do it“
“unable to do it”
If the negative symptoms or reactions of subordinates perpetuities, the professional and adequate resetting, necessary adjustment of change process should be done. It is advisable for managers to consider Kotter’s suggestion (Kotter 2011) about people with resistance to change.

REDETE – ECONOMIC DEVELOPMENT AND ENTEREPRENEURSHIP IN TRANSITION ECONOMIES
499
“They have to be got out of the way, from the process of change no matter who they are in terms of power, relationship and other aspects, because they will always resist if you let them in tent, ... they could make so much damage that the change could be undermined.“ So, the stepwise refinement approach of change seems to be less efficient because of frustrated and struggling managers and the additional costs of motivation and conviction of wobblers.
The listed problems of behavioral, structural and contextual aspects in Pugh’s OD matrix can be found in Marjanovic’s table, too, as a similar way of symptoms and suggested therapy. Of course Pugh’s OD matrix is offering more sophisticated ways of considering all levels of orga-nization while in Marjanovic’s table simply listed under e.g. “failure to fulfill individual’s needs - goals”, “poor job definition”, “too easy or too difficult task”.
Results
Table 4 summarizes the basic problems or symptoms found in the examined organizations together with an overview of typical actions undertaken
Table 4 Some of the most typical problems during the change processes
Problem faced Action taken by management Missing the right strategic approach to navigate the
change. )(Nobody sees the goal of change, Heterogeneity of individual goals.
Management is gradually leaving the change process, without additional efforts made to reduce the redundancy the main objectives disappear.
Inadequate personnel qualification structure (lack of skillfulness,
Incapacity, inability
In more than half of the cases there are ambitious plans of implementation of new technology, extended product lines, etc without training courses for employees. Weak
standardization, inadequate differentiation and job description.
Redundant workers in privatized companies not willing to take part in any type of change at all..The
employees’ morale is as low as the trust is.
Motivation and rewards are given in inequitable fashion.
Nothing changes really, but the level of conflict rises. (Lack of information, nobody really cares about
change)
Only cosmetic change happens. No sufficient power is engaged to forward the process of change
Coordination, communication and control problems inside and outside of the organizational borders.
In spite of the existing great proportion of the efforts spent on organization and coordination activities the firm
remains infective and inefficient (Stefanovic et al, 1997).
Old bureaucratic structures are maintained, instead of replacing them with new flexible structures.
Lack of professional awareness Intimidation The organizations are trying to find the fastest way to
escape the problem Undertaken measures are not sustainable until the end of the change processes. Soon they sink to another trouble.
Slow and sometimes confusing privatization transformation processes
Making the company value lower than its real market price on purpose.
Mistaken privatization methods Going in the wrong direction without attempt to change. Everything becomes rigid – simply impossible to
change. General resistance because of fear of the unknown
Too slow change process Too small and insecure steps those cannot solve the urgent need for faster change.
Chronic lack of working capital
In spite of all financial problems, some investments are always tried or made, usually worsening the position.
The lack of financial power combined with the willingness to undertake new huge investment programs
is an obvious mistake and not proven by the market.

REDETE – ECONOMIC DEVELOPMENT AND ENTEREPRENEURSHIP IN TRANSITION ECONOMIES
500
Problem faced Action taken by management The real process (the nature of business) in the
organization is unknown. Turbulent actions or no action at all taken.
Overlapping functions and processes Corporate governance system, with a lot of
particularities.
Laziness and (or exhaustion) of management and workers to invest more efforts into intensity and
work results.
No action taken.
The investigation was conducted through one hundred cases collected from Serbian
enterprises. Answers were classified according to the Pugh OD matrix. Results of an investigation are presented separately for each of the four levels of the analytical focus (seen in Tables 5,6,7,8.):
Table 5. Nature of the problem at organizational level
Nature of the problem
Structure (%)
Nature of the problem Structure (%)
Nature of the problem
Structure (%)
Behaviour 100 Structure 100 Context 100 Poor morale 47 Poorly
defined System goals 19 Wrong
geographical setting
15
Pressure 12 Inappropriate and misunderstood Strategy
32 Market pressures
17
Lack of awareness 10 Inappropriate Organizational structure
39 Inadequacy of labour market
11
Lack of response to environmental
changes
31 Inadequacy of environmental monitoring
mechanisms
10 Wrong strategy 57
At the organizational level, 47% of the respondents reported bad morale as the basic behavior
problem. Next, 39% of the respondents believed that the inappropriate organizational structure was the main structural problem at the organizational level. Finally, 57% considered the wrong strategy as the most important context problem at the organizational level.
Table 6. Nature of the problem at inter-group level
Nature of the problem
Structure (%)
Nature of the problem Structure (%)
Nature of the problem Structure (%)
Behaviour 100 Structure 100 Context 100 Lack of effective
cooperation 42 Lack of integrated task
perspective 47 Different sub-unit
values 34
Conflict 38 Physical distance 9 Excessive
competition 15 Required interaction
difficult to achieve 53 Psychological
distance 15
Unresolved feelings 5 Lack of cross- functional social
overlay
42
At the inter-group level, 42% of the respondents reported the lack of effective cooperation as
main the behavior problem. Regarding the structure, 53% of the respondents considered that the required interaction is very difficult to achieve. Finally, regarding the context of problems, 42% of

REDETE – ECONOMIC DEVELOPMENT AND ENTEREPRENEURSHIP IN TRANSITION ECONOMIES
501
the respondents believed the lack of cross-functional social overlay as the basic problem at the inter-group level.
Table 7. Nature of the problem at group level
Nature of the problem
Structure (%)
Nature of the problem Structure
(%) Nature of the
problem Structure
(%) Behaviour 100 Structure 100 Context 100
Inappropriate working
relationships
35 Task requirements are poorly defined
19 Poor resources 38
Inappropriate atmosphere
24 Leader’s role is overloaded
12 Poor group composition
19
Poor acceptance of goals
13 Inappropriate reporting procedures
27 Inadequate physical set-up
13
Leader not respected
28 Lack of good relationships between
groups
42 Personality clashes
30
At the group level, a large number of respondents (35%) reported inappropriate working
relationships as the basic behavior problem. Regarding the structure, the majority of them (42%) considered the lack (i.e. non-existence) of good relationships between groups as what was causing the main problem. Finally, regarding the context, 38% believed that poor resources were the basic problems at the group level.
Table 8. Nature of the problem at individual level
Nature of the problem Structure
(%) Nature of the
problem Structure
(%) Nature of the problem
Structure (%)
Behaviour 100 Structure 100 Context 100 Unwillingness to consider change
30 Poor job definition 61 Poor match of individual with job
30
Failure to fulfill individual needs
34 Poor selection or promotion
28
Little chance for learning and development
24 Task too easy or too difficult
39 Inadequate preparation and
training
17
Frustration responses 12 Recognition and remuneration at variance with
objectives
25
At the individual level, the failure to fulfill individual needs was reported as the basic behavior
problem by the majority of the respondents (34%). Similarly, 61% of the respondents considered the poor job definition as the main problem. Finally, regarding the context, the poor match of individual with the job was reported by 30% of the respondents as the main problem on the individual level.
the Results of the conducted investigation show that non-implementing of organizational changes occur mainly because of problems at the individual level followed by problems at the group level the intergroup level and, finally, at the organizational level.
One of the major symptoms found was the misfit between planned and undertaken actions to solve the problems. This circumstance might come out of inadequate management skills and knowledge (mistaken diagnosis or poor change management), but unfortunately rather frequently some hidden personal interests (packed into different types of resistance and obstruction). Those individual interests very often derailed the whole process of organizational change.

REDETE – ECONOMIC DEVELOPMENT AND ENTEREPRENEURSHIP IN TRANSITION ECONOMIES
502
Discussion
During the change processes, Serbian organizations have to deal with continually shifting market conditions, customer demands, technologies, and fairly unstable legal and political background. It is a greater challenge thus it cannot be solved without professional management skills. Inappropriateness of strategy and goals are extremely dangerous in such contingencies.
Various factors such as sudden changes in the organization’s environment, big differences in leadership styles and (missing) management skills, organizational culture, can in many cases make organizational change a lot more difficult than it used to be. It is also worth considering the elements of “the 8 steps of change” by J Kotter’s pattern. (J. Kotter, Rahthberger 2006) Most of those defined phases are missing in Serbian management practice. According to Serbian practice these derailed steps can be listed with the following short descriptions:
- It has become a difficult task to “create a sense of urgency” – Very often because of the perpetualised change processes and more or less unsuccessful transition attempts, the members of Serbian organizations are becoming indifferent (“tired of listening to promises - exhausted” D. Heath 2010) and are losing the necessary sense for urgency and warning.
- “Pulling together guiding team” becomes a sophisticated task solvable only in orgaizations with developed human resource management concept. In Serbian enterprises this function was not adequately developed. Usually it was limited to some administration, just opera-tive tasks of staffing.
- To “Create a change vision and strategy” also seems to be problematic. The symptoms show us the lack of clearly defined vision and strategy. That manifested itself in the lack of comprehensive goals of change.
- When the focus is on overcoming resistance to change, it is usually connected with perfor-ming political force, constrains and obligations for subordinates and employees. It goes way beyond “engaging” employees:
- “Empower the other to realize change vision” – becomes a problem as the level of dele-gation is inadequate. Too much responsibility in unwarranted positions and roles.
- Produce short time wins – “In other cases, people don’t even try because they believe that one can’t produce major change and short-term performance results. Finally, the lack of short-term wins can often be traced back to insufficient management expertise on the Guiding Coalition or a lack of commitment by key managers to the change initiative.” This is obviously connected with the symptoms of can’t do or“not willing to do according to Marjanovic
- Don’t give it up – But it happens in some cases because of “Exhaustion”
- To “Anchor change in culture” seems to be also a difficult task. (“Our national culture with its characteristics influence on organizational culture creates unfavorable contextual conditions for organizational change”- Sapic et al., 2009, p 401). Accepting this statement the managers of change and the researchers should know more about characteristics of such business environment.
If managers do not have a clear view of the wider group of stakeholders, they may lose the necessary insight to the circumstances, and could endanger the future change undertakes. It could indicate the symptom of disappointment for the whole organization. Disappointed workers become indifferent to change and “more expensive” to be motivated. The whole organization may soon become exhausted. “Run out of energy of self control no more power but exhausted for change. So it is not always the case or question of laziness. What looks like laziness could be exhaustion. ... Change wears people out—even well-intentioned people will simply run out of fuel.” (Heath 2010) For sure we can accept the argumentation that what looks like laziness is

REDETE – ECONOMIC DEVELOPMENT AND ENTEREPRENEURSHIP IN TRANSITION ECONOMIES
503
actually exhaustion. In Serbian enterprises managers and subordinates had many of circumstances when the wider sense of self-supervision was needed. Our society is full of changes that require always adoption and applying the new behavior and self control. That is enough to mention changes in required communication channels, new ownership, and new relations abandoned routines of everyday work... And that burns self-control of involved people but in some aspect the whole nation. Change wears people out—even well-intentioned people will simply run out of fuel.” After over thinking the business and political environment it could easily happen that Serbian managers are overloaded with everyday struggle that needs so much self control that they become exhausted. It could be the situation with employees also. So many promises that they heard and had to believe without any real turnover for better conditions, they took all their strength so they can also be considered exhausted. To draw the conclusion, under such circums-tances the management has to economize with promises not to generate early disappointments. This all causes desirable exhaustion not only at the end of the working day but in the long run it reduces the wish to change. The challenge of change appears as a tiring job until all the activities connected with change become a way of feeling or wish. We should heed the suggestion of John Kotter (Kotter, Cohen 2002) the need to work on irrational sensible part of the brain to prepare our readiness to feel like change. Relying only on the mind’s “thinking side area” but much less on the “feeling mind’s side” could undermine the necessary behavioral change in organization. So, additional need for challenge in self control appears, but no chance for filling up. It is one of the reasons why so many fellow citizens are inflicted with erred nerves.
Contradiction can be found in the relation between management’s efficiency and battle for staying in the position. Regardless of the failures they made, the majority of top managers are keeping themselves in their hierarchical position or even more, climbing upstairs. This can be connected with the national cultural properties, described with paternalistic and autocratic leader styles in our organizational culture. Regardless of what has happened, and what he has done, the leader, (his personality) has to be followed, even if he made obvious mistakes. This “mistake” often carries intended abuse of position. Migration of managers from one position to another is the only consequence. (Until some radical changes would not happen in upper level.) Quite often, for example functional area managers change their position between each other regardless of their skills or “merits”, so they save their influence and “authority”. This unfavorable rotation of managers between functional areas starts together with crises and becomes part of a maladjusted reorganization. Beside all such rotation develops “unusable or useless” leaders on functions that were never experienced before. (Adizes 2007).
Serbian managers do not have the tradition of making formal strategic plans. They do create some, but they hold it in their mind and their knowledge and information is not shared with employees. (80% of top-management is involved in information gathering and interpreting the information. It shows considerably high level of microinvolvement (Burton, Obel 2005) .
Conclusions
According to the two of applied approaches it can be concluded that the majority of Serbian enterprises are struggling with multidimensional problems. Multidimensional in the sense that it refers to more levels not only individual but there are on group, inter-group and organizational level. The problems track behavioral structural and contextual origin. Practically in the majority of enterprises one can find symptoms defined in any of the cells of e.g. Pugh matrix or in Marjanovic’s table.
In spite of the fact of unstable environment Serbian leaders must develop more long-term attitudes that involve commitment from the top and attention only on essential change. To avoid derailing the process of change there should be a plan for conducting it. It is also useful, if possible, to simulate different cases and outcomes to control the processes of change.

REDETE – ECONOMIC DEVELOPMENT AND ENTEREPRENEURSHIP IN TRANSITION ECONOMIES
504
Some of the needed actions of managers to be taken to solve the problems of organizational change processes
- The managers have to make sure that everyone understands the new roles (hopefully as they do)
- The radical change will not happen overnight. Setting short-term goals and monitoring them step by step could be the solution. Serbian leaders of change processes should develop adequate culture of change that includes easy short term goals that could help cut down the resistance and also motivate the members of organization. It could be partly made with advertising and rewarding those involved to change. Feedback from stakeholders and benchmarking activities could help not only in monitoring the change process but to get involved and informed all rebellions.
- All the complaints could mean valuable feedback information that is worth considering converting them to action.
- Personal responsibility and accountability is needed from each member of organization
- The leaders must delegate not only responsibilities but also authorization on the adequate level together with improving the work culture in organization or developing a new behavior.
- The endless and meaningless meetings should be reduced in all levels of organization.
- The precise standardization is needed for existing and all new processes and procedures
- Documentation of all events is necessary, but especially in order to improve transparency of actions
Serbia as a WBC has different transition processes that caused a different social and cultural
conditions or environment for the acceptance of “western type of management systems” Serbian business environment has become characteristically underdeveloped in organizational and working culture, lacking in management culture and knowledge. A very young layer of owners is not really interested in long range thinking and planning in very unstable environment. Everything is oriented to the short run profit achievement. Some of the managers have simply assumed the right to trade, lease, merge or even sell their firms, assets, often for their own enrichment and to the fury of the public. It is obvious that the lack of rapid but transparent mechanisms for selling the firms can cause many additional problems. Fierce struggle of privatization became closely connected with the term of individual gaining fortune.
The used methods made visible the origin of problems of reorganization and change processes in Serbian enterprises. But it should be noted that the analyzed problems do not belong to Serbian enterprises only. For sure, the used sources – references assure us we suffer fairly similar circumstances like the others. But why do we suffer more? The answer seems to be simple. The only way that could lead us to the success will be work responsibility, honor, trust, and diligence.
“These principles should be the common measures if we shall use them in future. But, until that time we can debate and explain our missed opportunities, but they will, we are afraid, remain a shy prove to our failures.

REDETE – ECONOMIC DEVELOPMENT AND ENTEREPRENEURSHIP IN TRANSITION ECONOMIES
505
Literature
1. Adizes I. (2007),. Adizes News No. 36, p 2-7 Adizes SEE, Novi Sad. 2. Burton M. R. & Obel, B. (2005), Strategic Organizational Diagnosis and Design, The
Dynamics of Fit, (3rd ed.), Springer. New York, 3. Cerović, Božidar (2006), Privatization in Serbia, Evidence and Analyses, Faculty of
Economics in Belgrade, Belgrade. 4. Heath Dan, (2010), Why Change Is So Hard: Self-Control Is Exhaustible
http://www.fastcompany.com/video/why-change-is-so-hard-self-control-is-exhaustible, (accessed 26.01.2012).
5. Kotter J,, Holger Rathgeber (2006), Our iceberg is Melting, Macmillan, p 130 6. Kotter J. (2011), http://www.kotterinternational.com/booksandresources/videos - Dealing with
resistanche to change, http://www.youtube.com/watch?v=Wdroj6F3VlQ Accessed 20.08.2012 7. Kotter J., Cohen Dan S (2002) The Heart of Change: Real-Life Stories of How People Change
Their Organizations, Harward Business School, www.kotterinternational.com/kotterprinciples/changesteps/ ...step1-8 accessed 25.08.2012
8. Marjanović Slavko (1989), Priručnik za rad organizatora i rukovodilaca, Sloboda, Beograd, p 99.
9. Pugh Derek (1986) OD matrix http://www.jiscinfonet.ac.uk/infokits/change-management/pugh-od-matrix, (accessed 05.08.2012)
10. Pugh Derek S., Mayle David (2009). (eds. and contributors), Understanding and Managing Change Through Organizational Development Change Management, vol. 2, Sage UK, pp. 61-68,
11. Šapić, Srđan,. Erić, Jelena, Vesna Stojanović Aleksić (2009),The Influence of Organizational and National Culture on the Acceptance of Organizational Change: Empirical Study in Serbian Enterprises, Faculty of Economics, Sociologija, Vol. 51, br. 4, p. 399-422

REDETE – ECONOMIC DEVELOPMENT AND ENTEREPRENEURSHIP IN TRANSITION ECONOMIES
506
DIGITAL MARKETING IN THE VIRTUAL SPACE – CHALLENGES FOR COMPANIES IN MACEDONIA
AND WESTERN BALKANS
Snezana MOJSOVSKA SALAMOVSKA229 Violeta GLIGOROVSKI230
Abstract
The aim of this scientific paper is to analyse the level of utilization of virtual space in proce-sses of design and implementation of marketing strategies in Macedonia and the wider region of Western Balkans. Digital marketing is the present and the future of business marketing for all companies worldwide. But is it perceived as a business opportunity to the extent that it deserves to be perceived by companies in this region? The goal of this scientific research is to identify the stage in exploitation and utilization of benefits of virtual space in business context, and to further analyse the power of virtual space in creating the brand equity as one of most sophisti-cated and important intangible assets in contemporary environment. It is inevitable that local companies in the region are significantly endangered by strong global companies and global brands. In the processes of creating and maintaining the brand equity, virtual space has signi-ficant business power that needs to be unlocked and turned into competitive advantage.
To what extent are companies in this region using the benefits of virtual space in their every-day operations, especially in performing marketing activities? Do they incorporate in their business strategies the consistencies and patterns of global trends of shifting from traditional towards digital marketing? What are consequences of this ongoing process for marketing bud-gets allocation? Are marketing agencies in Macedonia ready to respond to companies’ require-ments in this context? What is the level of awareness that companies in this region are experie-ncing regarding the ultimate business power of virtual space?
These are some of key issues that this paper will try to elaborate, using the scientific methods of comparative analysis, literature review, survey, internet research, etc. in order to present not only secondary data, but also to gather and analyse primary data that would be further used for final conclusions.
Key words: Digital Marketing Strategy, Virtual space, Customer Engagement, Brand Equity
229Assistant Professor at University of “St. Kliment Ohridski “ - Bitola, Faculty of Economics - Prilep
[email protected] 230 University of “St. Kliment Ohridski “ - Bitola, Faculty of Economics – Prilep, [email protected]

REDETE – ECONOMIC DEVELOPMENT AND ENTEREPRENEURSHIP IN TRANSITION ECONOMIES
507
1. Digital Marketing and Contemporary Business
Digital Marketing as a part of the global trend towards digitalization is a phenomenon that challenges the traditional marketing worldwide, in terms of virtually dictating the need of restructuring the traditional business marketing concept. The impact of digitalisation in doing business worldwide is enormous. Re-orientation from traditional business marketing towards digital marketing worldwide is a consistency that has been dramatically expressed in the global business environment, and needs to be taken in consideration in strategy design and implemen-tation processes. Marketing mix strategies are seriously affected by digitalization of the business, and they require permanent strategic audit in order to better respond to the sophisticated consumer’s requirements and needs. Consumers are becoming increasingly demanding as a result of digital media development. Development of personal media networks leads to increased level of personalisation of marketing messages as well as instantly generated responses from the customers. In that way, companies are literally urged to design and implement an integrated digital marketing platform that would enable maximum customer acquisition and retention, but also customer engagement as a key element in digital marketing strategy, leading to maximum marketing performance.
The potential of digital marketing exceeds the limits of traditional business, for it is directly related to the enormous potential of the virtual space, as the virtuality penetrates in all segments of the world economy and contemporary business processes. But, as the famous Canadian communications theorist and philosopher Marshall McLuhan half a century ago notes in his seminal book Understanding Media, “It is instructive to follow the embryonic stages of any new growth, for during this period of development it is much misunderstood, whether it be printing or the motor car or TV”. 231
Marketing communication, marketing finance, marketing metrics and accountability are some of the key areas that have been virtually redesigned as a result of implementation of digital marketing globally. While the overall marketing budgets are decreasing, financial resources allocated for digital marketing purposes are being constantly increased. Relevant statistics demonstrate strong commitment of companies worldwide for further increasing of marketing budgets for digital marketing, despite the global trend of decreasing the overall marketing budgets. The economic value of this enormous activity remains largely unknown. Current estima-tes rely mainly on brute measures, such as the number of searches performed or advertising revenues reported by search companies themselves.232 According to the statistics from global media agency, Maxus, the digital market space in the GCC region has experienced a remarkable growth over the last two years; while marketers have reduced their expenditures on traditional media, investments on digital media has grown by more than 500 percent.233
“Online is already a mainstream component of consumer behavior and media consumption. The fundamental purpose of communication strategy remains unchanged, but marketing must urgently harness interactive media and the behaviors it induces,” said Rob Norman, global CEO of GroupM Interaction 234. According to the survey results released in May 2012, 52% of 1,500 executives consider that digital marketing and social tools are at least a top 10 corporate priority, including 25% indicating this trend to be at least among their top 3 strategic priorities, and 8% claim that it is the top priority of their organization235 .
As a result of a global study conducted by E-consultancy and Exact target in 2010, with more than 350 businesses participated in the survey, based in the US (45%) or UK (33%), dr. Dave
231 Ryan and Jones, page 2 232 http://www.mckinseyquarterly.com/Marketing/Digital_Marketing/Measuring_the_value_of_search_2848 233 http://www.dubaicityguide.com/site/features/index.asp?id=4206 234 http://www.marketingcharts.com 235 http://www.marketingcharts.com/direct/digital-marketing-becoming-a-corporate-priority-for-c-suite-execs-22213/

REDETE – ECONOMIC DEVELOPMENT AND ENTEREPRENEURSHIP IN TRANSITION ECONOMIES
508
Chaffey236 indicates the shift of marketing budgets from traditional channels to digital channels will continue to rise 237. Analysis on the changes in overall budgets compared to changes in digital budgets shows that 28% of marketers are realocating at least some of their overall marketing budgets from traditional to digital channels 238. Also, according to the same source, marketers who focus on "brand reputation" and similar measures of marketing effectiveness are the most likely to be shifting budgets from traditional to digital channels.
Figure 1 - Proportion of marketing budget spent on digital marketing.
(Source: http://econsultancy.com/mk/reports/marketing-budgets-2010)
According to Boston Consulting Group (BSG) 239, the Internet economy growth in the Group
of 20 economic industrialized countries, will reach 4.2 billion to the year of 2016 , or 1.8 times above from 2.3 billion in 2010 year. According to the same source, specific development of the Internet in the future will have a major role in developing countries, which is very important factor in the context of this scientific research, and needs to be taken in consideration as an extremely favorable factor for market development in this dommain. The number of Internet users is forecasted to be increased by 200 million each year and for four years three billion people will be connected to the global info-network, compared to 1.9 billion registered in 2010 year. According to analysts, 80 percent of users, in four years, instead of using personal computers to connect to the Internet they will use mobile phones. Another important trend is the possibility of any electronic device to join the internet, not just smart phones and computers 240. The research data analysis leads to conclusion that the growing proportion of internet and mobile advertising in the overall global advertising mix will rise from around 12% in 2008 to 19% in 2013. 241 In addition, Forrester Research expects marketer spend on display media, search, email, mobile and social media to reach nearly $55bn by 2014, which is remarkable figure.242
236 Recognised by the Chartered Institute of Marketing as one of “50 marketing “gurus” worldwide who have shaped
the future of Marketing“ 237 http://econsultancy.com/mk/reports/marketing-budgets-2010 238 Source: Marketing Budgets 2010: Effectiveness, Measurements and Allocation Report, ExactTarget, February 2010 239 http://www.bcg.com/ 240 http://www.bcg.com/ 241 Source: PricewaterhouseCoopers 242 Source: Forrester Research

REDETE – ECONOMIC DEVELOPMENT AND ENTEREPRENEURSHIP IN TRANSITION ECONOMIES
509
2. The Impact of Digitalization on Contemporary Brand Management
It is obvious that digitalization as a global trend has a strong impact that is equally evident in developed countries, as well as countries in development. Consumers are permanently exposed to the sophisticated marketing programmes designed by global companies, that are using the benefits of digitalization in this context to the extent of perfection. In a processes of brand building, digital media enable immediate response and almost perfect feed back from customers and consumers worldwide.
Customer engagement is a process that is extremely important in modern marketing and especially in contemporary brand management, where consumers need to develop strong emotional attachment to the brands, and to maintain that relationship – it requires sophisticated management and continuous tracking and adjustments in terms of brand associations, feelings , judgments, and, finally, to reach the top of the brand management pyramid - to become brand ambassadors or brand evangelists 243.
Figure 2 – Brand Equity Pyramid
CBBE Pyramid
Brand Salience
Consumer-BrandResonance
ConsumerJudgments
ConsumerFeelings
BrandPerformance
BrandImagery
4 Intense, Active Loyalty
1 Deep Broad Brand Awareness
2 Points of Parity and Points of Difference
3 Positive Accessible Reactions
THIS is Where the
InsightLives
Source: Kevin Keller, “Strategic Brand Management”,
II International Edition, Prentice Hall 2007, p. 77
As one of major tasks of brand management is building and maintaining the brand equity,
digital marketing has almost unlimited potential in this context. As consumers are becoming more dependent on IT devices and applications, their expectations in terms of establishing and maintai-ning communications with the companies are rapidly changed, compared to the past decade, or even five years ago. Traditional communication media do not offer opportunity to get customer
243 Kevin Keller, “Strategic Brand Management”, Building, Measuring and Managing Brand Equity, Second International
Edition, Prentice Hall 2007, p. 93

REDETE – ECONOMIC DEVELOPMENT AND ENTEREPRENEURSHIP IN TRANSITION ECONOMIES
510
engaged, and on the other hand, one-way marketing communication is not an option in building and maintaining customer loyalty and brand equity.
Following these trends is a serious challenge for all companies worldwide, especially for com-panies in countries of development, because the opportunity for utilization of new ICT applica-tions is much greater for financially strong companies in developed countries. The fact is that the pace of technology development is faster than ever, and ICT inventions and innovations are being instantly adjusted for business marketing purposes. It is impossible for any company to imple-ment traditional marketing strategies only, expecting that the consumers will recognize corporate traditional core values and stay loyal to the generic products and services, or brands that do not communicate with them in the way they expect . Consumers are becoming more demanding, and their brand loyalty could be easily transformed in brand mobility, if a substitute brand develops and maintains relationship with them by using the unlimited potential of digital marketing media.
3. Implementation of Digital Marketing in Macedonia
Utilization of virtual space in Macedonia in digital marketing context is an issue that needs to be analysed in order to determine the stage of implementation of this concept by companies in Macedonia and to compare research data to the world trends . In this context, a scientific research has been conducted in 2012, on a sample of 62 Macedonian companies244, and also an internet research of 10 most important marketing agencies in Macedonia, local and affiliations of globally recognised marketing agencies, as well as the ones specialized in digital marketing. We presume that today’s marketing agency should have incorporated their digital marketing services in their offer and they should be presented on their web sites, therefore we take this as a criteria for analyzing the state of the digital marketing in Macedonia. The objective of the research was to analyze to what extent are Macedonian companies and marketing agencies utilizing the benefits of digital marketing, or, the virtual space in general.
Official statistics from UN Agency for Information and Communication Technology (ITU) indicate that in Macedonia there are 1,057,400 Internet users (51.0% of the population) as of June 2010. Statistics presented below clearly present the “explosion” in internet usage in Macedonia in past 4 years 245.
Year Number of Internet Users
in Macedonia Population in Macedonia
% of Internet Users
Source
2000 30,000 2,016,060 1.5 % ITU
2002 100,000 2,016,060 5.0 % ITU 2006 392,671 2,056,894 19.1 % SSO
2010 1,057,400 2,056,894 51.0 % ITU
In the chart bellow, the division of above mentioned number of users divided by age groups is
presented:
244 Micro businesses 36 %, 51% medium –sized businesses , and 13% large companies, according to Macedonian legislation
related to the categorization of businesses 245 http://www.internetworldstats.com/eu/mk.htm

REDETE – ECONOMIC DEVELOPMENT AND ENTEREPRENEURSHIP IN TRANSITION ECONOMIES
511
According to the official national statistics for the first quarter of 2010, 46.1% of Macedonian households had access to the Internet. Also, 84.1% of the enterprises in the financial and non-financial sector, with 10 or more employees, as well as 99.4% of the entities in the public sector (central and local authorities) had Internet access. 246 The number of Internet hosts for 2010 is 60,533, and a country comparison to the world is 85 247. Non-official statistics are in line with these forecasts, and in many cases, they exeed the most optimistic figures.
External environment analysis results indicate that the existing digital infrastructure is very favorable factor that enables implementation of digital marketing strategies by Macedonian companies. This is an extremely important fact, that needs to be taken in consideration in furt-her analyses, because, according to the research, companies very often are not aware of the potentials that are at their disposal, due to the lack of innovational spirit and relying mainly on traditional managerial methods.
According to the research results, he digital marketing landscape in Macedonia is roughly shaped in this way:
- well established ICT infrastructure that enables further digitalization and implementation of IT for business purposes;
- consumers that are devoted to ICT implementation in they everyday lifes, very keen to communicate via most sophisticated digital devices and applications, age structure of internet users extremely favourable for designing marketing strategies for various product categories and brands ;
- companies that are trying to understand new consumer behavior models derived from the digital era, and in the same time have at their disposal relatively affordable ICT equipment that could be incorporated in business and marketing processes;
- marketing agencies that are demonstrating commitment towards adopting new trends in media development in designing offers for their clients, but steel putting efforts to utilize traditional electronic media, mainly for financial purposes. Digital media are inexpensive and affordable from customer’s point of view, but traditional media are generating profits for marketing agencies, so that’s why steel in marketing agencies offers traditional media are present to a large extent, according to the research conducted;
Despite the fact that large part of companies maintain websites, and also advertise themselves on other web portals , 56% of surveyed companies steel have only medium expectations of internet advertising benefits! Only 11% of surveyed companies expect a very good effect of internet advertising, and claim that it leads to increased financial performance . 246 http://www.stat.gov.mk/english/statistiki_eng.asp?ss=14.04&rbs=1 247 https://www.cia.gov/library/publications/the-world-factbook/geos/mk.html

REDETE – ECONOMIC DEVELOPMENT AND ENTEREPRENEURSHIP IN TRANSITION ECONOMIES
512
Analyses indicate that 30% of sample companies consider internet advertising as a tool for expanding on new markets, and 19% as a tool for strengthening the position on the existing market. There are also divided opinions related to the use of virtual space and its correlation with the success and financial performance of modern companies. Thus, almost a half of the companies believe that the success of the company is not implicated of the using the virtual space.
This is an organisational behavior pattern that needs to be taken in consideration as an impediment for further implementation of digital marketing strategies, caused mainly by the resistance to changes, and trying to force traditional values, based on tangible assets and capital, trying to minimise the participation of intangible assets and importance of virtual space in their everyday operations. But the only strategy that will offer sustainable competitive advantage in this context is redesigning of organisational architectures so that they will be open for adoption and implementation of ICT in business processes, especially in marketing.
Reference list
1. Damian Ryan, Calvin Jones, “Understanding Digital Marketing : Marketing Strategies for En-gaging the Digital Generation“, Kogan Page Limited, Great Britain/ United States , 2009
2. Leland Harden, Bob Heyman “Digital Engagement: Internet Marketing that Captures Custo-mers and Builds Intense Brand Loyalty “, American Management Association, 2009
3. Heinonen,K. And Michelson, T.(2010) “The use of digital channels to create customer rela-tionship”, Int.J. Internet Marketing and Advertising, Vol.6, No.1, pp1-21
4. Kevin Keller, (2009) “Strategic Brand Management”, Building, Measuring and Managing Brand Equity, Second International Edition, Prentice Hall 2007Macedonia in figures, State Statistical Office of the Republic of Macedonia,
5. Snezana Mojsovska Salamovska, (2008) “Promotional activities as a factor for increasing the organizational efficiency and effectiveness”, University of “St. Kliment Ohridski” Bitola, Fa-culty of Economics – Prilep,
6. Violeta Gligorovski, (2012) “The virtual space and its economic power”, University of “St. Kliment Ohridski” Bitola, Faculty of Economics – Prilep
7. Marketing Budgets 2010: Effectiveness, Measurement and Allocation Report , Econ-sultancy.com Ltd 2010
8. http://digitalmarketinginstitute.ie/(accessed 29.09.2012) 9. www.internetworldstats.com(accessed 29.09.2012) 10. www.cia.gov/library/publications/the-world-factbook/geos/mk.html (accessed 29.09.2012) 11. http://www.futura.net.mk/ (accessed 30.09.2012) 12. http://www.publicis-mk.com/(accessed 30.09.2012) 13. http://www.ideaplus.com.mk/(accessed 30.09.2012) 14. http://www.nuvo.mk/(accessed 30.09.2012) 15. http://www.newmoment.com.mk/thefinal5_content.html 16. http://www.mccann.com.mk/ 17. http://www.saatchi.com.mk/ 18. http://www.studiomarketing.si/mk/agencije/predstavitev/ 19. www.smmri.com.mk 20. http://www.globaledge.co.uk/real-estate-partners/macedonia/marketing-
agencies/1265-10959

REDETE – ECONOMIC DEVELOPMENT AND ENTEREPRENEURSHIP IN TRANSITION ECONOMIES
513
CORRELATION BETWEEN COMPETITIVENESS AND QUALITY SYSTEM IN LARGE CROATIAN COMPANIES
Damir MIHANOVIĆ248 Darija IVANDIĆ-VIDOVIĆ249
Abstract
This paper highlights the connection between competitiveness and quality system in large Croatian companies. The importance and perception of quality has changed significantly over years. Having stepped out of certain organizational sectors, quality nowadays demands that a company have comprehensive strategy. The ultimate goal is to achieve competitiveness and business excellence through quality management systems. This paper presents the results of the survey conducted in large Croatian companies. The purpose of the study is to determine and establish a correlation model between competitiveness and quality system. As the primary ins-trument used for gathering data required for conducting this research, a survey was sent to se-nior management or to the Boards of all companies included in the basic set of the research. Number of employees of 250 or more was used as a dominant quantitative criterion for defining company size. Statistical data processing was based on the sample of 49 out of 136 major Cro-atian companies, which makes a total feedback of 36%. The starting point during research con-duction was the assumption that the possession of ISO standard, i.e. active engagement in the process of acquiring ISO standard, will have a positive effect on company competitiveness. In that effect, the relationship between the rating of company’s competitive position for groups of companies with and without ISO standard has been studied. Research results show that it is not possible to draw a conclusion about a discernible difference between competitive position of companies with and without ISO standard. Therefore, one must reject the thesis which states the correlation of the process of ISO certification and the perception of business efficacy and leading position in the market, at least in business conditions and the environment attributive to large Croatian companies. A management which has to lead and believe in achieving quality for customers and clients, regarding it as its primary goal whilst not forgetting that this goal is to be reached only by synergy with all employees, is the assumption of the success of quality system and is still not sufficient enough. The precondition of safe future is the improvement of quality of its products and services, thereby ensuring the satisfaction and loyalty of its custo-mers. Croatian economy is burdened with a series of other problems and that the models and techniques of quality management systems, which have been established in the surveyed compa-nies, still haven't produced expected results in the matter of company's competitiveness. Natu-rally, the study of this correlation and the reasons for its (non)affirmation in Croatian economy remains a significant future research task.
Key words: competitiveness, quality management system, business efficacy, major Croatian companies
248 Kraš d.d., business management, Ravnice 48, 10000 Zagreb, Croatia, e-mail: [email protected], tel.
0038512396111, fax. 0038512322084 249 Croatia osiguranje d.d., business management, Miramarska 22, 10000 Zagreb, Croatia, e-mail:
[email protected], tel. 00385911830082, fax. 0038516332753

REDETE – ECONOMIC DEVELOPMENT AND ENTEREPRENEURSHIP IN TRANSITION ECONOMIES
514
1. Theoretical basics of quality management system
The aim of modern quality approaches is to generate permanent improvement of process and product, and the measure to estimate and optimise work is “customer satisfaction“ (Heller, 2003). A number of authors have dealt with quality and quality management system. So, American scien-tist Deming (1992) thinks that a product or service has quality only if it serves someone and has a good market (Dujanić, 1995). Dongelaar (1993) believes that the only product that has quality is the one that with minimal expenses in the life cycle maximally contributes to the purpose and hea-lth of the people included in its production, distribution, use, maintenance and recycling, and with minimal expenses of all resources and acceptable impact on society and environment (Krakar, 1993). Watrin (1998) explains the word quality with two different concepts which can be descri-bed as performance quality (the best) and coherence quality (Kondić, 2000). American guru of quality J. M. Juran simply specifies that quality means meeting the demands (Gryna and Juran, 1999). Japanese pioneer of quality movement K. Ishikawa gives a very wide definition of quality. In its narrow sense, quality means product quality, and in its broad sense, it represents quality of work, services, information, process, departments, people, systems, goals, etc. (Kondić, 2000). Even the legendary H. Ford II declared the famous notion that “Quality means doing it right when no one is looking“ (Bakija, 1991). From then on, it has become a duty of each worker in “Ford” factories, but also of all of his subcontractors.
During the 40s in the last century, American consultant W. Edwards Deming significantly improved quality in America by applying statistical supervision of processes instead of control. Hence, Pike and Barnes (1994) rightfully call him the father of the revolution known as complete quality management (Pike and Burns, 1994). His ideas and thoughts were definitely confirmed when Deming (1992) went to Japan in 1950 to help the reconstruction of the destroyed Japanese economy. Deming (1992) shaped the constant improvement into a cycle called P-D-C-A (Plan-Do-Check-Act) (Deming, 1992). He emphasised the importance of employees trained to under-stand the processes and causes of variations, as well as the need for team work. His approach to quality management is based on the famous quality trilogy: quality planning, quality control and quality improvement (Juran, 1999). During the 60s, Philip B. Crosby presented one of the most cited concepts – “zero defects”. This concept is the fundamental part of Crosby's philosophy of absolute quality. Crosby finds the opinion that errors are inevitable unacceptable (Crosby, 1996).
In professional literature dealing with quality problems, one can often encounter the term service quality, which is something completely different from the term product quality. According to Juran (1988), service represents work completed for someone else. Service activities include: financial services (for example banking and insurance), media, public information, government services, medical services, energy services, public transport, telephone communications etc. Nowadays, quality represents a global phenomenon which, in its full meaning, and after Japan and America, had taken over Europe as well, and in the last 20 years has attempted to take over Croatia too. The European Quality Charter, which was passed in the first European quality convention in Paris in 1998, illustrates the European notion of quality in the best way. Croatia joi-ned the action around ISO 9000 standard practically from its beginnings; consequently, in the se-cond half of the 80s, there were already several experts in quality from Croatian major economic subjects who regularly, actively and zealously participated in the work of JUSK commission for validation of ISO 9000 standard. Following Croatia's independence and restoration of all quality related activities, there was a need to implement quality management system, particularly in those companies that were doing business with countries abroad (Kondić, 2000).
According to Gryna and Juran, quality management is a process that recognises and ma-nages the activities needed to achieve quality objectives of an organisation. Another definition states that quality management is a set of actions of a general managing function which deter-mines the policy of quality, objectives and responsibilities and, in the terms of quality system, realises them by planning quality, monitoring quality, ensuring quality and improving quality

REDETE – ECONOMIC DEVELOPMENT AND ENTEREPRENEURSHIP IN TRANSITION ECONOMIES
515
(Gryna and Juran, 1999). Basic strategic goals of every organisation that wants to improve the quality of its products and services and thus increase its profit and amend its market position are: to achieve complete engagement of management; to develop quality culture; to accom-plish effective employee participation; to establish partnership with suppliers and customers; to develop and implement effective quality system; to develop strategy of constant improve-ment (Bureau Veritas, (1994). As a rule, each norm has the following structure (Injac, 1999): (1) introduction, where the norm, its emergence, key words and content are described; (2) purpose and area of implementation; (3) relation to other (similar) norms; (4) basic concepts; (5) content; attachments (if necessary). Overall quality management approaches are accepted in the USA and Europe in 1985 (Avelini-Holjevac, 1998)
2. Competitiveness and quality
The competitiveness of a certain business agent, as well as overall national economies, represents an unomittable indicator that determines the position on the global scale of economic success. The term competitive advantage is often cited alongside terms competitiveness or its more specific version – organisation’s competitive advantage. This terminology dilemma may be resolved in such a way that competitiveness be regarded as an absolute term, namely, that it implies “absolute advantages that lead to the increase in market share“ (Radošević, 1994 p.37).On the other hand, relative character of competitive advantage defines it in a way that it is gained or maintained in relation to other subjects (competitors), that is, it is realised within the context of competitive struggle exclusively. It is manifested by possessing or acquiring a certain feature which serves as a distinguishable attribute when compared to its competitors and, at the same time, it generates customer demand.
Porter's model of competitive advantages (forces) appears as one of the most famous traditional models. It emphasises specialised factors of competitive advantage related to spe-cific industry, which are therefore unsuitable for imitation. According to it, the economic progress itself happens as the result of rising economic advantages. Porter differentiates advantages to those which result from lower expenses, unlike higher advantages which result from the construction of one's own technological advantages, reputation made by the custo-mers, product differentiation, brand recognition and so on. Furthermore, Porter's model of five competitive forces is based on the thesis that long-term profitability of industry and the company within it depends on the following factors (Buble et. al., 2005, pp.20-22): (1) rivalry within the affiliation – represents the most important competitive force and determines the choice of company's competitive strategy; (2) new competitors’ entry – it is manifested as disturbance in competitive market, where the effect of competitive threat depends on the cha-racter of entry barriers and the reaction of threatened companies; (3) competitive power of substitutes – the occurrence of usually cheaper, substitute products, demands an adequate differentiation, and, in some circumstances, price reduction, from the manufacturers of prima-ry product; (4) competitive power of suppliers – it represents one of the crucial competitive forces; (5) competitive power of customers – the impact of customers increases with their ne-gotiating power. Their greatest strength is realised in situations where a small number of cus-tomers buys great amounts of goods, where there is a great or dominant customer, and where there is a possibility of simultaneous purchase by more manufacturers. Joint impact of these five competitive forces defines the industry's profit potential as well as differences in long-te-rm profits among industries. "Industry’s profitability is greater if the industry has stable competitive structure, more favourable position towards suppliers, customers and substitute industries and less danger of other companies’ entry. On the other hand, industry’s profita-bility is smaller if the industry has changeable and undefined competitive structure, weaker

REDETE – ECONOMIC DEVELOPMENT AND ENTEREPRENEURSHIP IN TRANSITION ECONOMIES
516
position towards customers, suppliers and substitute industries and if there is a risk of other companies’ entry" (Tipurić et. al., 1999, p.9).
Companies that wish to achieve competitive advantage stand before a choice of the type of the advantage they wish to accomplish and a choice of market area of action. For this purpose, Porter identifies three generic strategies (Porter, 1980, p.39):
- Cost leadership strategy – by means of this strategy, company is oriented to constant cost reduction in all segments of business. “Low cost culture“ needs to be developed, costs of research and development, marketing activities and accompanying services need to be reduced, but also all sources and drivers of costs in company’s value chain need to be identified.
- Differentiation strategy – accomplishing competitive advantage by way of this strategy is based on the uniqueness of company's position within the industry. Differentiation offers something unique to the customers and it creates a certain “quasi-monopoly where the price policy is not based on costs only" (Buble et. al., 2005, p.147)
- Focus strategy – represents the way in which the company builds competitive advantage in certain industrial segment. By limiting business activities to one segment, company adjusts its strategy and develops unique abilities according to the needs of the segment in question. The point of strategy is to use profit differences between a certain chosen segment and the whole industry. Although the company does not hold competitive advantage at the level of the whole industry, it achieves it in its segment.
As the attributes crucial for identifying competitive advantage, the following are mostly cited
(Alfirević, 2003, p.86): (1) competitive struggle context; (2) strong connection with business strategy and; (3) consistent formation of higher level of added value and/or higher level of profit.
2.1. Advantages and disadvantages of implementing quality management system
Demands for quality of globalised market have become the imperative of successful business. Having this awareness, with indirect engagement of all employees, management in particular, is a prerequisite of survival in the modern market. Significance of quality, as the indication of greater concern for quality, should be reflected in better business result and better competitive position of company (Grubišić and Čerina, 2001, p.9). Present perception of quality does not apply to the fulfilment of once set demands, but it represents the starting point of company's strategic planning, and it includes: (1) fulfilment of all expressed and unexpressed product/service expectations; (2) services of installing, surveying/maintaining and providing care for the product; (3) keeping deadlines and maintaining prices; (4) conducting administrative processes; (5) after sale service (Segetlija and Lamza-Maronić, 1998).
Still, like every other system, quality management system generates negative effects and occurrences. If an organisation had certified quality system only for the certificate itself, most often it did not create nor implement it. Companies introduce ISO standards for the following reasons (according to their significance) (Corsten, 2000): (1) improving customer satisfaction; (2) norm as the marketing instrument; competitive advantage; (3) expected customer pressure; (4) market internalisation; (5) improving product quality; (6) improving motivation of associates; (7) reducing complaints; (8) increasing confidence in time limits. Possible negative effects and disadvantages of implementing ISO quality system are (Kvaliteta, 2002): (1) increasing the volume of administrative work which raises overall costs but still, its implementation may be futile because it may result in “bureaucratic quality only on paper”; (2) implementation procedure and quality system maintenance create additional costs; (3) applying the certificate only for the

REDETE – ECONOMIC DEVELOPMENT AND ENTEREPRENEURSHIP IN TRANSITION ECONOMIES
517
sake of customers and market without taking into consideration the real significance of the certificate; (4) inadequate and sudden change of organisational structure; (5) choosing a poor certification agency; (6) prolonged certificate acquirement; (7) active and passive employee resistance to changes; (8) employee fear of additional duties and responsibilities.
2.2. Quality management in the function of creating and maintaining competitive advantage
Traditional notion of quality used to focus its attention towards performances of final product, without taking into account the overall performance of business process. From this point of view, it has been attempted to achieve quality by hiding errors without the intention of eliminating them because “it was considered that higher quality costs more and as such has an unfavourable affect on production and cost-effectiveness“ (Skoko, 1999). On the other hand, modern quality approac-hes are based on preventive action towards the sources of incompatibility, simultaneously sprea-ding responsibility for its creation on all parts of the company. In this way, quality is achieved by improving performance quality of all organisational units (research and development, marketing, supply etc.) without limiting itself to immediate production any more. Consequently, quality ne-eds to be “installed in the product by removing all causes of error emergence and other inconsistencies before they appear, with the acceptance of primary aim which is production without errors ("zero defects"), namely, making a good product in the first attempt ("make it right the first time") (Skoko, 1999). In order for these goals to be achieved, changes in the orga-nisational culture are necessary, for example: horizontal cooperation of functions and departments (cross-function teams), decentralisation of control function and wide participation of employees (Buble, 2000). Also, it is essential that the system acts based on the following principles (Skoko, 1999): (1) focus on achieving customer satisfaction; (2) demand for permanent and continuous improvement of certain processes, and the whole company too; (3) demand for encouraging complete participation of all employees; (4) long-term implementation and application of comp-lete quality management system.
The establishment of quality system reached its peak during the eighties of the last century, but analysis results of the success of applying modern quality approaches have shown that significant part of the company did not consider that concept acquisition had important effect on their competitive position. However, primary causes of failure lie in the fact that “many companies regard quality management as a “programme“ instead of viewing it as the means to achieve their business goals. In that way, quality improvement and maintenance aspire to be isolated from everyday business operations“ (Skoko, 1999). Another reason that affected poorer success of quality system consists in the time gap between activity and result, which demand continuous (long-term) application but also the development of this concept. However, quality, as the most important market factor, also becomes basic means to defeat competition. Previously mentioned determinants refer to general association of quality and higher level of competitiveness which is, by its definition, displayed in achieving above-average financial results over a longer period of time (Grant, 2002), which derives from continuous improvement of products and processes. In this sense, one can make an assumption of correlation between key management principles, which arise from efficient quality management in a company (and which are associated with basic values of quality implementation, as defined by (Buble, 2000) as “entry“ values, and subjective estimate of competitive position, that is company's financial success, which competitiveness is reflected upon. Previously defined principles are generally adopted in the business world, considering they are proscribed by International Standards Organization (ISO), so a questionnaire was structured according to them and it was used to conduct the research. They are (International Standards Organization; 1994): (1) Customer focus; (2) Market leadership; (3) Involvement of people; (4)

REDETE – ECONOMIC DEVELOPMENT AND ENTEREPRENEURSHIP IN TRANSITION ECONOMIES
518
Process approach; (5) System approach to management; (6) Continuous improvement; (7) Factual approach to decision making; (8) Mutually beneficial supplier relationships.
During the planning phase, management needs to determine: judgement area, performance time, judgement makers, judgement goals and criteria and duration length. During judgement preparation, one needs to perform: a review of reports on previous judgements and a review of delivered documentation for areas to be judged. During judgement procedure, one needs to check whether quality system exists and if it is complete, whether it works properly and if it is successful. Judgement makers look for answers to the following questions (Hrvatska norma, 1996): (1) who performs the action, who is responsible?; (2) how and what (guidelines, instructions)?; (3) where and when (work environment, fulfilled conditions)? (4) by what (means, material)? According to the brochure of Bureau Veritas certification agency, some characteristics of employees who establish and develop quality culture are (Bureau Veritas: “ISO 9000, 1994): (1) self-satisfaction and strong personal vision of perfection/excellence; (2) high level of knowledge and competence; (3) high integrity and ethics and agreement with goals and principles of organisation itself.
3. Research methodology
Large companies registered in Croatia, as defined by relevant legislature, represent the basic set for conducting the research. Defining the term large company faces the obstacle of various existing criteria which can be used for classification. Two types of criteria are normally used: (1) quantitative: economical, technical, financial and natural indicators of production, and (2) qualitative: ownership form and organisational structure. When further analysed, quantitative criteria include: production amount, employee number, sale volume and different financial indicators and alike. Qualitative criteria primarily refer to the characteristics of large companies such as: market position, number of organisational units, number of management levels, level of formalisation, and level of work distribution and so on. Quantitative criteria are more often used in practice, and the criterion of employee number appears to be the most represented one. In Croatia, the criteria determining company size are defined by the Accounting Act (Official Gazette, no. 90/92). According to it, in order to be regarded as large, Croatian company has to fulfil at least two out of three criteria: (1) yearly employee average of: minimum of 250; (2) sum of balance after deducting the loss displayed in assets in the value of 4.090.335 Euros, (3) 12-month income prior to drawing up the balance in the value of 8.180.670 Euros. In terms of this Act, large entrepreneurs include banks, financial organisations and insurance as well as reinsurance companies.
As the primary instrument for gathering the data needed to conduct the research, a postal survey was used, namely a survey questionnaire, which was sent to the Boards of all companies included in the basic set of the research. As the dominant quantitative criterion for defining company size, employee number of 250 or more was used. The sample, which statistical data analysis is based on, refers to 49 of 136 large Croatian companies, which makes a total return of 36%. Not one of the companies was in the process of bankruptcy during the survey. Survey questionnaire consisted of 17 questions grouped in 7 parts. Since most of the questions included a certain number of additional questions, a total of 57 questions or statements needed to be answered or marked. The first part of the questionnaire refers to general company data such as ownership structure, activity type, employee number, total incomes, profit prior to taxation, assessed market position and (non)possession of ISO certificate. The second part refers to customer orientation, the third to top management activities, the fourth to employee participation, the fifth to systematic management approach, the sixth to decision making process and the seventh to supplier relationships.

REDETE – ECONOMIC DEVELOPMENT AND ENTEREPRENEURSHIP IN TRANSITION ECONOMIES
519
4. Research results
While conducting the research, an assumption was made that possessing ISO certificate, or being actively involved in the process of acquiring it, would positively effect company's competitiveness. In that sense, the relationship between the rating of company's competitive position for groups of companies with and without ISO certificate was studied. Research results related to the estimate of company's competitive advantage (estimated by the surveyed managers themselves) for companies with ISO certificate have been shown in Table 1, where it is obvious that there is not one ISO certified company perceiving its competitive advantage negatively.
Table 1: Competitive position of companies with ISO certificate
Freq. %
1 We are market leaders 9 50.0%
2 We are at the very top 9 50.0%
3 We are average 0 0.0%
4 We lag behind the best 0 0.0%
Total 18 100.0%
Source: Research results
The distribution of the mentioned variable has been graphically presented in picture 1.
Picture 1: Competitive position of companies with ISO certificate (Source: Research results)
0
1
2
3
4
5
6
7
8
9
1 2 3 4
1
2
3
4
50,0%50,0%
0,0%
0,0%
1
2
3
4
On the other hand, companies without ISO certificate perceive their competitive position as being significantly worse, considering the fact that 9,7% of the sample describes the position as “average” (which can be explained in the terms of nonexistent permanent competitive advantage), while 12,9% describes it as “lagging behind the competition” (see table 2).

REDETE – ECONOMIC DEVELOPMENT AND ENTEREPRENEURSHIP IN TRANSITION ECONOMIES
520
Table 2: Competitive position of companies without ISO certificate
Freq. %
1 We are market leaders 11 35.5%
2 We are at the very top 13 41.9%
3 We are average 3 9.7%
4 We lag behind the best 4 12.9%
Total 31 100.0%
Source: Research results
The distribution of the mentioned variable has been graphically presented in picture 2.
Picture 2: Competitive position of companies without ISO certificate (Source: Research results)
0
2
4
6
8
10
12
14
1 2 3 4
1
2
3
4
35.5%
41.9%
9.7%
12.9%
1
2
3
4
Although it seems that companies with ISO certificate have, in average, better competitive position than those without it (or those not included in the process of certification), taking into account that not one of certified companies declares itself as “average”, or “ lagging behind the best”, this statement ought to be supported by adequate statistical methods.
Considering that company’s competitiveness was measured by means of ordinal variable, as well as the existence of ISO certification/certification process, this correlation would at first be most simply determined with the help of the crossing procedure of mentioned variables and the calculation of empirical value of chi-squared test. However, this statistical procedure has generated table 3.
Table 3: “Crossing” of variables of competitive position and ISO certificate possession
ISO certificate Total
No Yes
Competitive position
Leader 11 9 20 Has
advantage 13 9 22
Average 3 0 3 Lags behind 4 0 4
Total 31 18 49
Source: Research results

REDETE – ECONOMIC DEVELOPMENT AND ENTEREPRENEURSHIP IN TRANSITION ECONOMIES
521
The table contains 4 fields (that is 50% of all table fields obtained by crossing) with absolute frequency lower than 5, which disables the conduct of chi-squared test. Therefore, it is useful to merge variable categories describing competitive position whose frequencies are relatively low. Thus, table 4 has been obtained.
Table 4: Modified table of “crossing” the variables of competitive position and ISO certificate possession
ISO certificate Total
No Yes Competitive
position
Leader 11 9 20 Has advantage 13 9 22 Average or lags
behind 7 0 7
Total 31 18 49
Source: Research results
With empirical value of chi-squared test of 4,817, the significance of 0,090 was determined
implying that the conclusion on the correlation of the mentioned variables in the surveyed sample of large Croatian companies cannot be reached.
Nevertheless, it will be attempted to confirm the mentioned result with the help of previously conducted nonparametrical tests (Mann-Whitney U and Kolmogorov-Smirnov Z test) which help to determine whether there is a significant difference between the value of variable related to competitive position in two groups of companies (with and without ISO certificate).
The following results have been obtained:
Table 5: Results of nonparametrical testing
Mann-Whitney U Test significance Kolmogorov-Smirnov Z Test significance
Competitive position 207,000 0,103 0,762 0,607
Source: Research results
In view of significancy values for mentioned tests which are too high, again, the conclusion on
perceivable difference in competitive position between companies with and without ISO certificate cannot be reached, which confirms the previously stated results, although – considering the relatively small sample size – it is not possible to determine whether this is an indisputably significant result.
Therefore, one must dismiss the thesis on the connection of ISO certification process and the perception of business efficacy and leader position in the market, at least in business conditions and environment which are characteristic for large Croatian companies. Naturally, studying the mentioned connection and the reasons of its (non)affirmation in Croatian economy remains as the significant future research task.
5. Conclusion
The starting point during research conduction was the assumption that the possession of ISO standard, i.e. active engagement in the process of acquiring ISO standard, will have a positive effect on company competitiveness. With the mentioned advantages and disadvantages of imple-menting quality system, it is useful to mention another influence which could be classified as both advantage and disadvantage, depending whether it is viewed long-term or short-term. It is the

REDETE – ECONOMIC DEVELOPMENT AND ENTEREPRENEURSHIP IN TRANSITION ECONOMIES
522
comprehensiveness of system implementation. Ultimately, it is the comprehensiveness itself that is the source of the increase in organisation’s competitiveness. Namely, improving the quality as a permanent task is a lasting process that generates conditions for continuous increase in produc-tion, specifically, competitiveness (Mencer, 2001).
Research results show that it is not possible to draw a conclusion about a discernible difference between competitive position of companies with and without ISO standard. Therefore, one must reject the thesis which states the correlation of the process of ISO certification and the perception of business efficacy and leading position in the market, at least in business conditions and the environment attributive to large Croatian companies. A management which has to lead and believe in achieving quality for customers and clients, regarding it as its primary goal whilst not forgetting that this goal is to be reached only by synergy with all employees, is the assumption of the success of quality system and is still not sufficient enough. The precondition of safe future is the improvement of quality of its products and services, thereby ensuring the satisfaction and loyalty of its customers. The implementation of quality management system contributes to many positive effects within a company, more important ones being the improvement of communication and understanding of customer needs; greater customer satisfaction; the promotion of good business practice and company reputation on the market; business system documentation; defined responsibility on all levels; consistent supervision of processes affecting quality; preventive employee education; increasing productivity and profit; potential participation in European Union market and world market, respectively.Croatian economy is burdened with a series of other problems and that the models and techniques of quality management systems, which have been established in the surveyed companies, still haven't produced expected results in the matter of company's competitiveness. Naturally, the study of this correlation and the reasons for its (non)affirmation in Croatian economy remains a significant future research task.
Reference list
1. Alfirević, N. (2003). Konkurentska sposobnost velikih poduzeća i upravljanje organizacijskim promjenama. doktorska disertacija. Ekonomski fakultet Split
2. Avelini-Holjevac, I. (1998). Kontroling – upravljanje poslovnim rezultatom. Hotelijerski fakultet Ika. Rijeka
3. Bakija, I. (1991). Quality assurance according to ISO 9000. Privredni vjesnik. Zagreb 4. Buble, M. (2000). Management. Ekonomski fakultet Split, Split 5. Buble, M. (ur.) et al.. Strateški menadžment. Sinergija. Zagreb. 2005. 6. Bureau Veritas. (1994). ISO 9000: How to obtain the certification? Brochure. Faculty of
Economics. Rijeka 7. Crosby, P. B. (1996). Quality is Free. Privredni vjesnik. Zagreb 8. Deming, W. E. (1992). Quality, Productivity and Competitive Position. MIT Center for
Advanced Engineering Study. Cambridge. Mass 9. Dujanić, M.. (1995). Complete quality management. Conference proceedings – University of
Rijeka. Faculty of Economics Rijeka. 10. Grant,, R. M. (2002). Contemporary Strategy Analysis. Blackwell, Oxford 11. Gryna, M.F., Juran, M.J. (1999). Quality planning and analysis. Mate. Zagreb 12. Grubišić, D., Čerina, D. Kvaliteta proizvoda kao faktor uspješnosti poduzeća i pretpostavka
konkurentnosti. 4. Međunarodna konferencija: Poduzetništvo u tranziciji. Ekonomski fakultet Split; 2001
13. Heller, R. (2003). Priručnik za menadžere. Profil. Zagreb 14. Hrvatska norma, (1996). HRN EN ISO 8402. Državni zavod za normizaciju i mjeriteljstvo 15. Injac, N. (1999). Sustavi kvalitete 2000 – velika revizija normi ISO 9000. Oskar. Zagreb. 16. International Standard ISO CD2 9000 (1999). Draft: Quality management systems –
fundamentals and vocabulary.

REDETE – ECONOMIC DEVELOPMENT AND ENTEREPRENEURSHIP IN TRANSITION ECONOMIES
523
17. International Standard ISO 9004-1 (1994). Quality management and quality system elements – Part 1: Guidelines
18. Juran, M. J. (1988). Juran's Quality Control Handbook, McGraw-Hill Inc. New York 19. Juran, M. J. (1999). Juran's Quality Handbook; McGraw-Hill Book Company; New York 20. Juran, M. J. (1999). Quality planning and analysi. Third edition. MATE. Zagreb. 21. Kvaliteta (2002). Infomart. No.6 Zagreb 22. Kondić, Ž. (2000). Quality and ISO 9000. Tiva. Zagreb. 23. Krakar, Z. (1993). Upravljanje kvalitetom. Infotrend broj 12/7/ 24. Mencer I. (2001). Osiguranje kvalitete. Ekonomski pregled br. 11-12, Zagreb. 25. Pike & Barnes. (1994). TQM in action; Chapman & Hall; London. 26. Porter, M.E. (1980). Competitive Strategy: Techniques for Analysing Industries and
Competitors. Free Press. New York 27. Corsten, D. (2000). Qualitätsmanagement, Produktion/Unternehmenssimulation, Zyklus 9,
11/2000., St. Gallen 28. Radošević, S. (1994). Konkurentski izazov Hrvatske, koncepcijski ogledi i empirijska
istraživanja. Ekonomski institut; Zagreb 29. Segetlija, Z., Lamza – Maronić, M. (1998). Kvaliteta i oblikovanje maloprodajnih poslovnih
jedinica. Suvremena trgovina, br.2, 1998. 30. Tipurić, D. et al. (1999). Konkurentska sposobnost poduzeća. Sinergija. Zagreb

REDETE – ECONOMIC DEVELOPMENT AND ENTEREPRENEURSHIP IN TRANSITION ECONOMIES
524
BUSINESS FORECASTING AS A FUNCTION OF RESTRUCTURING COMPANIES IN CRISIS WITH SPECIAL EMPHASIS ON COMPANIES
IN BOSNIA AND HERZEGOVINA
Drаgаn МILОVАNОVIĆ250
Аbstract
In a world of constant technological and market changes in the global financial crisis, as a condition of growth, development and survival of the company, primary is the need for business forecasting operational restructuring of the company based on innovation. The environment in which businesses operate is becoming more dynamic, different, difficult, dangerous and full of discontinuities. Companies operating in the time of faster, more dramatic, complex and unpre-dictable changes, all of which significantly influence behavior, operations and management ser-vices. The main task of management becomes actively responding to change, and quickly find and use new business possibilities and opportunities that are offered to avoid business risks. Forward-looking statements represent an important mechanism for the early detection and diagnosis of business problems in companies, as well as the mechanism for the prediction of growth / development of the company. One of the most important role of business forecasting is to minimize risk and uncertainty in business. The choice of method which will be used to predict activity depends on subject it belongs, variables that provides, goals, conditions, degree of innovation and other factors to be applied in the model. The company in its life cycle passes through various phases, which necessarily require change and adaptation, in each phase. In a word, restructuring the organization in modern conditions is a matter of growth and develop-ment of the companies, as well as the condition for the recovery and survival. Restructuring, reorganization and other major changes are very common in companies trying to grow or survive. Continual restructuring of the activities is undertaken by the organization from time to time, when they have the need for change, that is when they are unhappy with the current situ-ation, structures or strategies,so they work to increase the general level of performance. One of the main reasons for deterioration and inability to provide growth and development of the company is certainly a lack of innovation and inadequate management of innovation. In this pa-per we pay special attention to the role of forecast in enterprise restructuring. Section will effect the basic theoretical views on the role of forecast operational restructuring and revitalization of the company, as well as the analysis of basic parameters. In this paper, we perform a mathe-matical analysis of the evaluation effects of forecast operational restructuring and revitalization of the company. The aim of this study was to quantify the value impact of forecast to the effects of restructuring and revitalization of companies in crisis. Aim is also based on the practical interpretation of the evaluation of forecast operational restructuring and revitalization of the company and analysis of good practices abroad, to elaborate the possibilities for improving the effects of restructuring and revitalization of the company. The paper uses the scientific method of deduction, comparative analysis, logit model, model of discrimination analysis and analysis of best practices. For data processing, for the purpose of empirical research, it is used the sta-
250 Еkоnоmski fаkultеt, Univеrzitеt u Bаnjој Luci, Мајkе Јugоvićа 4, 78000 Bаnjа Lukа, E-mail:

REDETE – ECONOMIC DEVELOPMENT AND ENTEREPRENEURSHIP IN TRANSITION ECONOMIES
525
tistical software Statistica 6.0. Interpretation of results should serve as a basis for professional and scientific discussion of the business in order to improve predictions of the effects of res-tructuring and revitalization in Bosnia and Herzegovina.
Keywords: Business forecasting, restructuring, revitalization, growth/development company;
Introduction
Business forecasting statements represent an important mechanism for early detection and diagnosis of business problems in companies, as well as a mechanism for the prediction of growth / development of a company. One of the most important business forecasting is to minimize risk and uncertainty in business. The choice of used methods to predict the activity will depend on which entity it belongs, anticipated variables, objectives, requirements, innovation and other factors that will make a model when applied. The company in its life cycle goes through different phases, which necessarily require change and adaptation, in each of the phases. In a word, the restructuring of the organization in modern conditions is a condition of growth and development of the companies, as well as the condition of their survival and recovery. Restructuring, reorgani-zation and other major changes are very common in companies trying to grow or survive. Con-tinual restructuring of the activities are undertaken by the organization from time to time, when they feel the need for change, that is, when they are dissatisfied with the status quo, structures or strategies that work to reduce the overall level of performance. One of the main reasons for deterioration and inability to achieve growth and development of the company is certainly a lack of innovation and inadequate management of innovation. The most commonly used models in prediction of difficulty (stability enterprises) in practice are: Beaver model, Altman's Z-score model, Zeta model, Kralicek's Quickest, Ohlson's logic model. Prediction is the process of exploring the future, in order to reach the appropriate assumptions and attitudes that would allow certain factors affect the company's operations in the future. It is necessary to point out the essential difference between planning and forecasting. While forecasting is aimed at ensuring the performance of the conditions for realization of activity, planning involves making planning decisions on the basis of which actions in the future should be taken. Prediction explores a much broader direction and flow of an event opposed to planning which aims to concretize behavior of a certain subject. This means that the prediction is trying to comprehensively examine the past and present to provide reliable information about possible developments in the future. In this way, it tries to minimize the risk that is very present when dealing with the future. At the same time, planning aims to choose the best solution related to the future. The instruments include a wide range of forecasting methods that are grouped differently by different authors. Two important parameters are affecting the prediction of the risk and uncertainty, as inseparable facts of entrepreneurial venture, since in practice the degree of uncertainty is associated with the estimates of the variables.
1. Companies in Bosnia and Herzegovina is in crisis due to a lack of innovation
Companies in Bosnia and Herzegovina are engulfed by the financial and economic crisis. According to data from the Tax Administration of the Republic of Srpska, only in the small and medium-sized enterprises, the number of companies decreased for 219 in 2010. compared to year 2009. According to the statistics and taking into account the classification of the company, it is estimated the companies have lost their ongoing on that basis. One of the crucial problems burdening companies in Serbia is certainly the low liquidity, as well as a long, slow process of

REDETE – ECONOMIC DEVELOPMENT AND ENTEREPRENEURSHIP IN TRANSITION ECONOMIES
526
debt collection. In doing business, Bosnia was ranked at 124-178th place in the world economy, and in the last four years, there were no significant improvements. Analyzing the absolute amounts of the basic indicators available in the financial statements of the companies in the Republic of Srpska listed on Banja Luka Stock Exchange; we conclude that there is a downward trend in key indicators of financial position and business success of companies. The situation in the companies is like this due to the entry of the company into business difficulties, inadequate preparation and response to the global economic crisis, untimely and inadequate implementation of strategy shift occurred in the business difficulties, and as a result of many other factors that affect the company's operations. Research of famous company "Dunn & Bradstreet" has shown that as much as 96% of businesses in the U.S.A. eventually fail because of poor management of companies when entering into business difficulties. More than 7,000 companies and current actions according to the Federal Tax Administration are closed in Federation of Bosnia and Herzegovina in the last year (2011). Of this number, 303 are company whose shutdown puts the key in the lock, even in 1394 business units. However, most of those who could not stand the pace of all the ruthless competition in BiH, as many as 5406, are craftsmen. Initial steps in the development of the theory of innovation made Joseph Schumpeter, one of the greatest economists in history, the forth of the twentieth century. According to the research of many experts in the field of economics, is one of the crucial reasons for the degradation of businesses here, it is certainly a lack of innovation. Peter Drucker states that: "Innovation is the act that endows resources with a new capacity to create wealth." Innovation, in fact, creates a resource251. There is no such thing in the world, such as "resource," as long as one does not find a use value of something in nature and not something to bestow economic value. Global Innovation Efficiency Index is a component of the Global Innovation Index. In Table 1, the values of Innovation Efficiency Index are shown for year 2011.
Table 1. Innovation Efficiency Index values for 2011. year
Evropa Rank
World Rank Country Score
1 3 Moldova (Republic of)
01.08
2 4 Malta 01.03 3 5 Switzerland 01.01 4 7 Serbia 00.93 5 8 Estonia 00.93 6 9 Netherlands 00.92 7 11 Germany 00.91 8 14 Ukraine 00.90 9 18 Sweden 00.88
10 20 Slovenia 00.88 11 22 Czech Republic 00.87 12 28 Iceland 00.83 13 29 Luxembourg 00.83 14 30 Finland 00.83 15 33 Latvia 00.83 16 41 Hungary 00.82
251 Draker, Piter F. Inovacije i preduzetništvo - praksa i principi. Beograd, Privredni pregled, 1991, str. 56.

REDETE – ECONOMIC DEVELOPMENT AND ENTEREPRENEURSHIP IN TRANSITION ECONOMIES
527
17 43 Russian Federation 00.80 18 44 United Kingdom 00.80 19 45 Belgium 00.80 20 48 Austria 00.79 21 49 Bulgaria 00.79 22 50 Montenegro 00.78 23 52 Denmark 00.78 24 58 Norway 00.76 25 62 Lithuania 00.75 26 63 Croatia 00.75 27 64 France 00.75 28 65 Slovakia 00.75 29 66 Belarus 00.75 30 67 Portugal 00.75 31 71 Ireland 00.74 32 75 Italy 00.73 33 77 Romania 00.72 34 80 Poland 00.71 35 87 Spain 00.69 36 93 Macedonia (FYR) 00.68 37 102 Bosnia and Herzegovina 00.65 38 112 Albania 00.62 39 124 Greece 00.60
Source: http://www.globalinnovationindex.org/gii/main/analysis/rankings.cfm?vno=a1 (Access: 20.05.2012.)
Based on previous data, we can see that Bosnia and Herzegovina is located in the bottom of the
list of European countries ranked by the Innovation Efficiency Index, the index of the value of 0.65. On this basis, all the countries in the region are located in front of Bosnia and Herzegovina. In Table 2, the ranking of countries are shown according to the criteria of research and development.

REDETE – ECONOMIC DEVELOPMENT AND ENTEREPRENEURSHIP IN TRANSITION ECONOMIES
528
Table 2. Ranking of countries according to the criteria of research and development
Rank Evropa
Rank World Country Score
1 3 Finland 79.26 2 4 Iceland 76.71 3 5 Denmark 69.67 4 7 Sweden 68.95 5 8 Switzerland 67.65 6 11 Germany 60.68 7 13 Norway 57.64 8 14 Austria 54.86 9 17 United Kingdom 53.19
10 18 France 53.04 11 19 Portugal 52.21 12 21 Belgium 50.73 13 23 Ireland 49.56 14 24 Netherlands 47.96 15 25 Slovenia 46.88 16 27 Estonia 45.58 17 28 Luxembourg 45.34 18 29 Czech Republic 43.27 19 30 Spain 40.74 20 31 Hungary 40.44 21 35 Lithuania 35.27 22 40 Italy 31.95 23 41 Russian Federation 31.85 24 42 Croatia 30.03 25 45 Montenegro 28.75 26 46 Poland 28.74 27 49 Latvia 27.88 28 53 Slovakia 25.95 29 56 Serbia 25.38 30 57 Ukraine 25.15 31 58 Malta 25.10 32 70 Bulgaria 21.76 33 71 Greece 21.74 34 78 Romania 19.61 35 92 Macedonia (FYR) 16.97 36 100 Moldova (Republic of) 15.65 37 104 Belarus 15.25 38 108 Bosnia and Herzegovina 14.27 39 129 Albania 08.89
Izvor: http://www.globalinnovationindex.org/gii/main/analysis/rankings.cfm?vno=a1 (pristup: 20.05.2012.)

REDETE – ECONOMIC DEVELOPMENT AND ENTEREPRENEURSHIP IN TRANSITION ECONOMIES
529
According to this criterion, Bosnia and Herzegovina is on the penultimate place in Europe, and 108th in the world, which is insufficient for achieving growth and development of companies in Bosnia and Herzegovina.
2. Corporate restructuring in crisis
Owing to global phenomena in business and development organizations, the consequences of the economic crisis and other parameters that follow the global economy the last two years, the company's management require the application of different strategies and mechanisms for survival and growth. Restructuring, reorganization and other major changes are very common in compa-nies trying to grow or survive. In a word, the restructuring of the organization, in modern terms, is a condition of growth strategy and development of company, as well as the condition of its sur-vival and recovery. The Organization Restructuring is a model that includes a much broader range of measures in order to achieve raising the internal capabilities of the organization and its market competitiveness. Width of restructuring the organization is based on a wide range of measures such as closing or selling unprofitable parts of the company (reduction of property), the control and reduction of costs, strong financial control, reduction of the number of workers, relocation of some production lines to other cheaper locations, the restructuring of the organizational structure, debt restructuring and the like. Restructuring is also often used not only in emergencies but also in changes of the ownership structure. The new management model through the innovative strategy shift is done to increase the performance of the company and its market value. As part of the ove-rall process of company restructuring, financial restructuring can be implemented as a result of previous use of other forms of restructuring, or to facilitate the use of other forms of restructuring. In the literature, the concept and practice of financial restructuring is related to discontinuation and causing significant changes in the capital structure based on changes in the relationship between equity and long term debt, or a change in the internal relations of each of these two sources of funding.
In his book, The Corporate Finance, Where Theory Meets Practice, Chew, D. H., in conside-ring the width and the terms of restructuring, gave more than 130 definitions for restructuring252. The term is most often used as a synonym for undertaking various changes in the company and its operations. Hence, a method of restructuring strategies and radical changes in the companies must not be seen only as a one-time occurrence or event. Continual activity should be undertaken by the organization from time to time, when they feel the need for change, that is when you are dissatisfied with the status quo, structures or strategies that work to reduce the overall level of performance. The restructuring involves a continuous process of modifying existing structures, strategies and / or position of the company, to increase the efficiency and effectiveness of operations, which should result in the creation of prosperity for the owners253.
3. Business forecasting as a function of growth and development of the company
In an environment where the future is full of uncertainty, every business decision is based on knowledge of future events. Every business decision has an element of prediction, because each business decisions are related to the future. When we talk about the future we have to say that
252 Chew D., H., The Corporate Finance, Where Theory Meets Practice, McGraw-Hill, New York, 1993. 253 Erić, D., Strategije restrukturiranja preduzeća, Ekonomski fakultet, Beograd, 1995. str. 23.

REDETE – ECONOMIC DEVELOPMENT AND ENTEREPRENEURSHIP IN TRANSITION ECONOMIES
530
prediction is not an end itself, but it is a mode to minimize the uncertainty that awaits us in the future. If the court provides reliable prediction of the future, planning will be facilitated. Each company tries to ensure the most reliable prediction of the future, and thus gains a certain ad-vantage over other business systems in the region. Business forecasting is the process of studying the activity of internal and external factors that affect the future operations of the company, using different instruments predictions. Prediction is essentially basis for planning. As a result we have a prediction planning assumptions, because they can not find a definitive stance on the factors that will determine the behavior of the company in the future. Planning assumptions are the basis on which decisions are planned. Quality planning assumptions affect the quality of planning deci-sions.
Stages included in business forecasting254: - Formulation of the problems. It defines the goals and decisions in achieving them, and then
presents a structural problem that could occur. Analysts researches and forecasts the results that would be useful.
- Obtaining information. In the second phase, it is necessary to identify the sources of information, to gather information and prepare them for the process of prediction.
- The third phase of the prediction is related to the application of forecasting methods on how to choose the first method, then implement, integrate and combine on the way you can get more information than using a single method.
- Evaluation of forecasting methods includes evaluation and assessment of credibility and trust in a prediction.
- The use of prediction, as the last phase, includes the presentation of results and analysis of the facts that will improve prediction.
Business difficulties imply a situation where the company has problems with the servicing ob-
ligations, the impossibility of carrying out the production process, no opportunity to realize sales, incompetent management and others255. Prediction is the process of exploring the future, in order to arrive at appropriate assumptions and attitudes that would allow certain factors to affect the company's operations in the future256. Every business decision has an element of prediction, because each business decision is related to the future. The process of prediction is realized at certain stages. After formulating the problem and providing a corresponding set of information, the next possible choice of different prediction methods should be developed and then applied on forecasting and evaluating the results. Accepted results are used in decision making, while not accepted calls back to one of the previous stages. Stages of prediction are shown in the following scheme 1257.
Scheme 1. Stages of prediction
254 Vukmirović, N., Preduzetništvo u ekonomskoj teoriji i praksi, inovativni sistemi kreiranja i efikasnijeg korištenja resursa,
Ekonomski fakultet Banja Luka, 2012. str.413. 255 Arnold, G., Corporate Financial Managment, Pearson Education Limited Prentice Hall/Financial Times, 2001., str. 822. 256 http://www.informatickoupravljanjerazvojempreduzeca973 257 Armstrong, J., S., Structured analogies for forecasting, ScholarlyCommons, 2003., str. 243.

REDETE – ECONOMIC DEVELOPMENT AND ENTEREPRENEURSHIP IN TRANSITION ECONOMIES
531
Business forecasting statements represent an important mechanism for early detection and diagnosis of business problems in companies, as well as a mechanism for prediction of growth and development. Business forecasting is an exploration of the future, in order to arrive at reliable planning assumptions and attitudes about the relevance and nature of the effects of external and internal factors on the future performance of the company258. The importance of forecast is predominantly determined by the need to increase the certainty of implementation of planning decisions. Business forecasting involves research effort, which means you should respect funded scientific research methods. On the other hand, business-oriented approach is for predicting the future in terms of the chances, and it points to the dangers which could be formed in the future. Business predicting of the future is linked to the company's operations in order to facilitate the adoption and implementation of planning decisions. Also, business forecasting statements include taking a position on the anticipated flow of future events, which means that no prediction is the key premise of making business decisions. One of the most important goals of business forecasting is minimizing the risk and uncertainty in business. The choice of methods to be used to predict the activity will depend on which entity it belongs, variables that are anticipated, objectives, requirements, innovation and other factors. There are many prediction models used in various fields of human endeavor. In the literature, there are several different ways of grouping prediction methods. In the following work, we point out more general classification of predictions' models, depending on which category they belong. The criteria for membership in the group of qualitative, quantitative, temporal, "naive", econometrics, models of reasoning, artificial intelligence and so on, are following:259
1. Qualitative methods belong to subjective forecasting techniques. Based on the opinion or judgment of the consumer/or expert. Especially used in cases where there are no data about the demand for the product / service in the past.
2. Quantitative methods are used to predict future demand as a function of past data. Thus, data from the past should be available.
3. "Naive" model. "Naive" prediction model is the most efficient and cost-effective objective prediction model because it provides a benchmark by which to compare more sophisticated models.
4. Methods of time series. These methods have a wide range of applications not only in the business of predicting, but also in statistics, mathematics, finance, system and electrical engineering, etc.
5. The method of assessment. This method is also called the method of reasoning, judgment and includes the prediction based on intuition (feelings, experiences), which is the subjective opinion of the character and the likelihood of subjective judgment.
Prediction business problems in companies were the subject of a large number of studies since
the mid-sixties of the twentieth century. The first such study used a multiple linear discriminate analysis to define the term for the prediction business problems. Then research of enterprise's business problems introduces logistic regression - logit model260. These models shown the ability of early detection of operational problems, several years before the company had came to business
258 Milisavljević, M., Todorović, J., Planiranje i razvojna politika preduzeća, Savremena administracija, Beograd, 1995., str.
296. 259 Vukmirović, N., Preduzetništvo u ekonomskoj teoriji i praksi, inovativni sistemi kreiranja i efikasnijeg korištenja resursa,
Ekonomski fakultet Banja Luka, 2012. str.414. 260 Altman, E.: “Financial Ratios, Discriminant Analysis and the Prediction of Corporate Bankruptcy”, Journal of Finance 4,
589-609, 1968.

REDETE – ECONOMIC DEVELOPMENT AND ENTEREPRENEURSHIP IN TRANSITION ECONOMIES
532
difficulties261. If we assume that the process is "weakening" a dynamic process, early detection of operational problems leads to the opportunity "turnaround" in the company and avoidance of bankruptcy or liquidation.
In the survey of business forecasting in practice, commonly used models in prediction of difficulty (the stability of the company) are: Beaver model, Altman's Z-score model, Zeta model, Kralicek's Quicktest, Ohlson's logit model. Beaver shows the first modern economic-statistical model for the prediction of business problems. It is a model based on financial ratios, on which we made the prediction in the enterprise business problems. Ratio of 30 shown that the first three prediction business difficulties are namely: cash flow / total assets, net income / total debt and cash flow / total debt. In Altmans Z-score model used in calcula-ting the score, the five financial ratios are: working capital / total assets, retained earnings / total assets, net income / total assets, equity / total liabilities, total revenue / total assets. After Z-score model of Altman, Haldeman and Narayanan create ZETA model. The purpose of ZETA model is to analyze and test the classification of companies whose business is difficult into those with the risk of bankruptcy and those without it. The model is successful in cla-ssifying the companies five years before they will end up with bankrupt business difficulties. The final model consists of the following seven parameters: Return on assets - profit / total assets, earnings stability, profit / total interest paid, cumulative profitability - retained earnings / total assets; Liquidity - Total current assets / total current liabilities;-capitalization equity / total capital, company size - measured by total assets of the company. The purpose of Kralicekovog quick test is to evaluate the success and profitability of enterprise systems.
It uses the special relationship that is four coefficients to measure the riskiness of funding, liquidity, profitability, and success. These coefficients are calculated single score from 1 to 5 on the basis of the conclusions dependent and expressed through business difficulties or failure of the company. Logit model is also convenient for classification when the dependent variable has nature binary character and there are only two possible values - the company has no operational problems (0) or the company has business difficulties (1). The logit model's predicted values of the dependent variable will never be less than or equal to 0, or greater than 1 or equal to 1, regardless of the value of the independent variables.
4. Forward-based Z-score model
Altman Z-score model is an economic-statistical model for predicting scrolling business problems that make use of multivariate analysis and discriminate analysis. As a result of this model, there are obtained scores as a measure of the best contrast between successful companies and those who have business problems. In the following paper we will give a practical interpretation of the prediction based on quantitative model Z-score model. Z score analysis model will show the hypothetical example of a company AXA. Suppose that the company AXA will make forecasts of trends of financial statements (balance sheet, income statement and statement of cash flows) in the future. Analysis of prediction-based Z-score model is given in Tables 3, 4, and 5. In order to achieve more realistic forecasting, financial analysis and forecasting will be done in three versions (scenarios):
- Optimistic variant;
- Expected option and
- Pessimistic variant.
261 Aziz, A., D. Emanuel and G. Lawson: “Bankruptcy Prediction – an Investigation of Cash Flow Based Model”, Journal of
Management Studies 25, 419-437, 1988.
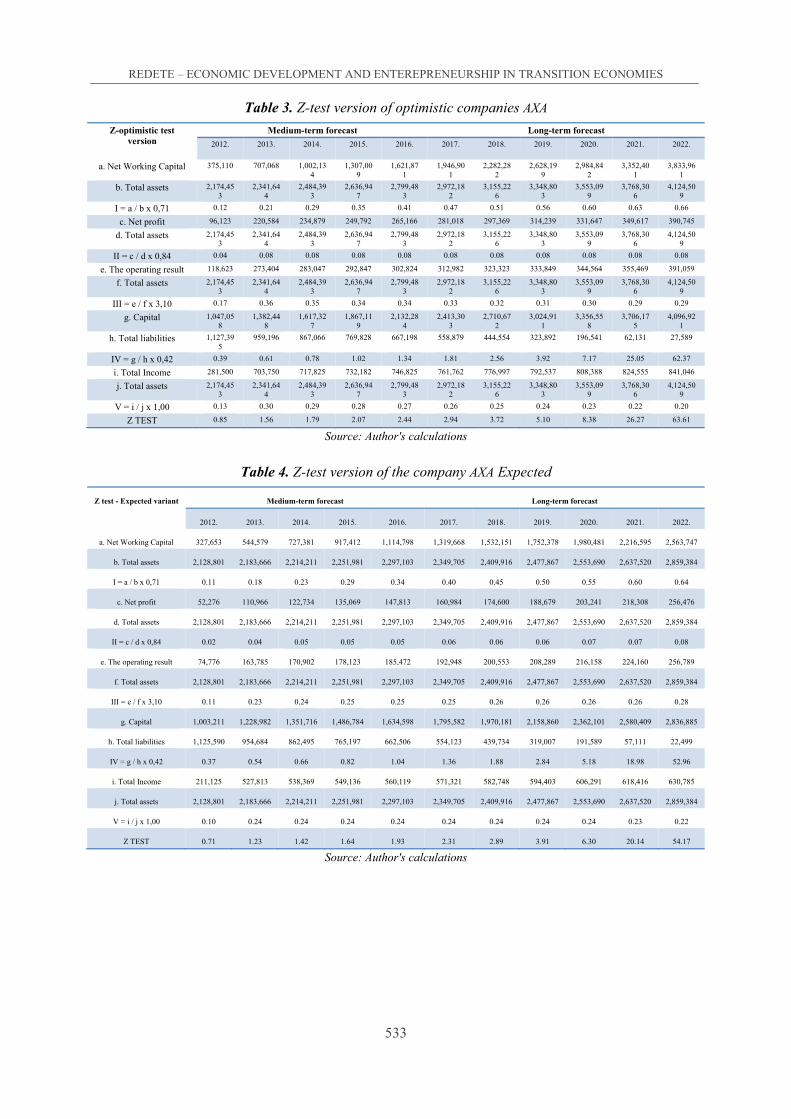
REDETE – ECONOMIC DEVELOPMENT AND ENTEREPRENEURSHIP IN TRANSITION ECONOMIES
533
Table 3. Z-test version of optimistic companies AXA
Z-optimistic test version
Medium-term forecast Long-term forecast
2012. 2013. 2014. 2015. 2016. 2017. 2018. 2019. 2020. 2021. 2022.
a. Net Working Capital 375,110 707,068 1,002,134
1,307,009
1,621,871
1,946,901
2,282,282
2,628,199
2,984,842
3,352,401
3,833,961
b. Total assets 2,174,453
2,341,644
2,484,393
2,636,947
2,799,483
2,972,182
3,155,226
3,348,803
3,553,099
3,768,306
4,124,509
I = a / b x 0,71 0.12 0.21 0.29 0.35 0.41 0.47 0.51 0.56 0.60 0.63 0.66
c. Net profit 96,123 220,584 234,879 249,792 265,166 281,018 297,369 314,239 331,647 349,617 390,745
d. Total assets 2,174,453
2,341,644
2,484,393
2,636,947
2,799,483
2,972,182
3,155,226
3,348,803
3,553,099
3,768,306
4,124,509
II = c / d x 0,84 0.04 0.08 0.08 0.08 0.08 0.08 0.08 0.08 0.08 0.08 0.08
e. The operating result 118,623 273,404 283,047 292,847 302,824 312,982 323,323 333,849 344,564 355,469 391,059
f. Total assets 2,174,453
2,341,644
2,484,393
2,636,947
2,799,483
2,972,182
3,155,226
3,348,803
3,553,099
3,768,306
4,124,509
III = e / f x 3,10 0.17 0.36 0.35 0.34 0.34 0.33 0.32 0.31 0.30 0.29 0.29
g. Capital 1,047,058
1,382,448
1,617,327
1,867,119
2,132,284
2,413,303
2,710,672
3,024,911
3,356,558
3,706,175
4,096,921
h. Total liabilities 1,127,395
959,196 867,066 769,828 667,198 558,879 444,554 323,892 196,541 62,131 27,589
IV = g / h x 0,42 0.39 0.61 0.78 1.02 1.34 1.81 2.56 3.92 7.17 25.05 62.37
i. Total Income 281,500 703,750 717,825 732,182 746,825 761,762 776,997 792,537 808,388 824,555 841,046
j. Total assets 2,174,453
2,341,644
2,484,393
2,636,947
2,799,483
2,972,182
3,155,226
3,348,803
3,553,099
3,768,306
4,124,509
V = i / j x 1,00 0.13 0.30 0.29 0.28 0.27 0.26 0.25 0.24 0.23 0.22 0.20
Z TEST 0.85 1.56 1.79 2.07 2.44 2.94 3.72 5.10 8.38 26.27 63.61
Source: Author's calculations
Table 4. Z-test version of the company AXA Expected
Z test - Expected variant Medium-term forecast Long-term forecast
2012. 2013. 2014. 2015. 2016. 2017. 2018. 2019. 2020. 2021. 2022.
a. Net Working Capital 327,653 544,579 727,381 917,412 1,114,798 1,319,668 1,532,151 1,752,378 1,980,481 2,216,595 2,563,747
b. Total assets 2,128,801 2,183,666 2,214,211 2,251,981 2,297,103 2,349,705 2,409,916 2,477,867 2,553,690 2,637,520 2,859,384
I = a / b x 0,71 0.11 0.18 0.23 0.29 0.34 0.40 0.45 0.50 0.55 0.60 0.64
c. Net profit 52,276 110,966 122,734 135,069 147,813 160,984 174,600 188,679 203,241 218,308 256,476
d. Total assets 2,128,801 2,183,666 2,214,211 2,251,981 2,297,103 2,349,705 2,409,916 2,477,867 2,553,690 2,637,520 2,859,384
II = c / d x 0,84 0.02 0.04 0.05 0.05 0.05 0.06 0.06 0.06 0.07 0.07 0.08
e. The operating result 74,776 163,785 170,902 178,123 185,472 192,948 200,553 208,289 216,158 224,160 256,789
f. Total assets 2,128,801 2,183,666 2,214,211 2,251,981 2,297,103 2,349,705 2,409,916 2,477,867 2,553,690 2,637,520 2,859,384
III = e / f x 3,10 0.11 0.23 0.24 0.25 0.25 0.25 0.26 0.26 0.26 0.26 0.28
g. Capital 1,003,211 1,228,982 1,351,716 1,486,784 1,634,598 1,795,582 1,970,181 2,158,860 2,362,101 2,580,409 2,836,885
h. Total liabilities 1,125,590 954,684 862,495 765,197 662,506 554,123 439,734 319,007 191,589 57,111 22,499
IV = g / h x 0,42 0.37 0.54 0.66 0.82 1.04 1.36 1.88 2.84 5.18 18.98 52.96
i. Total Income 211,125 527,813 538,369 549,136 560,119 571,321 582,748 594,403 606,291 618,416 630,785
j. Total assets 2,128,801 2,183,666 2,214,211 2,251,981 2,297,103 2,349,705 2,409,916 2,477,867 2,553,690 2,637,520 2,859,384
V = i / j x 1,00 0.10 0.24 0.24 0.24 0.24 0.24 0.24 0.24 0.24 0.23 0.22
Z TEST 0.71 1.23 1.42 1.64 1.93 2.31 2.89 3.91 6.30 20.14 54.17
Source: Author's calculations

REDETE – ECONOMIC DEVELOPMENT AND ENTEREPRENEURSHIP IN TRANSITION ECONOMIES
534
Table 5. Z-test pessimistic variant company AXA Z test -
pessimistic variant
Medium-term forecast Long-term forecast
2012. 2013. 2014. 2015. 2016. 2017. 2018. 2019. 2020. 2021. 2022.
a. Net Working Capital
286,744 406,493 497,119 592,394 692,393 797,191 906,864 1,021,488 1,141,140 1,265,896 1,498,727
b. Total assets 2,090,440 2,051,952 1,990,380 1,933,455 1,881,251 1,833,843 1,791,308 1,753,722 1,721,161 1,693,702 1,801,314
I = a / b x 0,71 0.10 0.14 0.18 0.22 0.26 0.31 0.36 0.41 0.47 0.53 0.59
c. Net profit 16,464 21,435 30,676 40,434 50,549 61,038 71,918 83,207 94,923 107,087 142,294
d. Total assets 2,090,440 2,051,952 1,990,380 1,933,455 1,881,251 1,833,843 1,791,308 1,753,722 1,721,161 1,693,702 1,801,314
II = c / d x 0,84 0.01 0.01 0.01 0.02 0.02 0.03 0.03 0.04 0.05 0.05 0.07
e. The operating result
38,964 74,255 78,844 83,488 88,207 93,001 97,871 102,817 107,840 112,939 142,608
f. Total assets 2,090,440 2,051,952 1,990,380 1,933,455 1,881,251 1,833,843 1,791,308 1,753,722 1,721,161 1,693,702 1,801,314
III = e / f x 3,10 0.06 0.11 0.12 0.13 0.15 0.16 0.17 0.18 0.19 0.21 0.25
g. Capital 967,399 1,103,639 1,134,316 1,174,749 1,225,298 1,286,336 1,358,254 1,441,460 1,536,384 1,643,471 1,785,765
h. Total liabilities 1,123,041 948,313 856,064 758,705 655,953 547,507 433,055 312,262 184,777 50,231 15,550
IV = g / h x 0,42 0.36 0.49 0.56 0.65 0.78 0.99 1.32 1.94 3.49 13.74 48.23
i. Total Income 140,750 351,875 358,913 366,091 373,413 380,881 388,498 396,268 404,194 412,278 420,523
j. Total assets 2,090,440 2,051,952 1,990,380 1,933,455 1,881,251 1,833,843 1,791,308 1,753,722 1,721,161 1,693,702 1,801,314
V = i / j x 1,00 0.07 0.17 0.18 0.19 0.20 0.21 0.22 0.23 0.23 0.24 0.23
Z TEST 0.59 0.92 1.05 1.21 1.41 1.69 2.10 2.80 4.44 14.78 49.37
Source: Author's calculations
Based on the results of the prediction using the Z test, it can be stated that the company in the
following years will be in the area that provides complete security of company being brought in business difficulties. In practice, the most important thing when making important decisions is to seek the implementation of several methods of forecast-sectional; then, based on these results, the decision is being made.
Conclusion
Business forecasting is aimed for ensuring the performance of the conditions in which the action is necessary to realize the goal of business. It means to look forward comprehensively on the past and present in order to provide reliable information about possible developments in the future. In this way, the risk of trying to achieve the set target in the future will be reduced to a minimum. In an environment where the future is full of uncertainty, every business decision is based on knowledge of future events. As can be seen, each company has various available options for the future. Which way will be used depends primarily on current and long-term possibilities of the company, as well as on the desire to achieve the goals of development. Width of business horizon depends on many factors, and one of the most important is the size of the company.
However, the spatial aspect of the predictions should not be taken as an unchanging size. The company can expand its influence on spatial horizon exchanging information with its environ-ment. This exchange of information can be done through appropriate agencies, special requests, publications and specialized business publications. Activity of the company is also important to define the business aspect of the predictions. Companies whose production is object of fluctu-ations in the market, or under the influence of natural factors, has no need to seek and expand the business aspect of the predictions.
Qualitative forecasting methods use managerial judgment, experience, relative data and an implicit mathematical model. Qualitative methods should be used when the data from the past are not reliable for future requirements. Nowadays, special attention is given to prediction, especially when it comes to planning the development of the company. This enables the company to move from standing stage in new, more efficient stage, and at the same time trying to adapt to a variable environment. Based on the mentioned above, it can be concluded that the prediction is solely concerned to formulate the basis for substantiated expectations. However, the one large area of interest is the prediction uncertainty and the consequences of present decisions.

REDETE – ECONOMIC DEVELOPMENT AND ENTEREPRENEURSHIP IN TRANSITION ECONOMIES
535
When decision makers possessed adequate information about future time, decision making would be relatively easy. Due to the existence of uncertainty in decision-making, one must pay a series attention to actions for better analysis of the time business decision applies. As a result of a research, we tried to draw conclusions bearing in mind everything mentioned, respecting widely known facts in economic theory and practice, and bringing some new scientific truths.
Literature
1. Аdižеs, I., Uprаvlјаnjе živоtnim ciklusоm prеduzеćа, Prоmеtеј, Nоvi Sаd, 2002. 2. Arnold, G., Corporate Financial Managment, Pearson Education Limited Prentice
Hall/Financial Times, 2001., стр. 822. 3. Altman, E.: “Financial Ratios, Discriminant Analysis and the Prediction of Corporate
Bankruptcy”, Journal of Finance 4, 589-609, 1968. 4. Armstrong, J., S., Structured analogies for forecasting, ScholarlyCommons, 2003., стр. 243. 5. Aziz, A., D. Emanuel and G. Lawson: “Bankruptcy Prediction – an Investigation of Cash
Flow Based Model”, Journal of Management Studies 25, 419-437, 1988. 6. Bеrbеrоvić, Š.; Јеlić, М., Меnаdžmеnt mаlih i srеdnjih prеduzеćа, Еkоnоmski fаkultеt, Bаnjа
Lukа, 2005. 7. Business Environment and Enterprise Performance Survey”, World Bank/EBRD, 2008. 8. Chew D., H., The Corporate Finance, Where Theory Meets Practice, McGraw-Hill, New
York, 1993. 9. Vukmirоvić, N., Sаvrеmеnо prеduzеtništvо-Nаukа i vјеštinа pоslоvnоg uspјеhа, Еkоnоmski
fаkultеt, Bаnjа Lukа, 2006. 10. Vukmirović, N., Preduzetništvo u ekonomskoj teoriji i praksi, inovativni sistemi kreiranja i
efikasnijeg korištenja resursa, Ekonomski fakultet Banja Luka, 2012. 11. Vukоtić, V., Prеduzеtničkа еkоnоmiја, Еkоnоmski fаkultеt, Pоdgоricа, 2000. 12. Gilder, G., The Spirit of Eneterprise, Penguin Books, New York, 1986. 13. Dеžеlјin, D.; Dеžеlјin, Ј.; Duјаnić, М.; Таdin, H.; Vuјić, V., Pоduzеtnički mеnаdžmеnt:
izаzоv, rizik, zаdоvоlјstvо, М.Е.R.CONSULT, Zаgrеb, 2002. 14. Draker, Piter F. Inovacije i preduzetništvo - praksa i principi. Beograd, Privredni pregled,
1991, 15. Milisavljević, M., Todorović, J., Planiranje i razvojna politika preduzeća, Savremena
administracija, Beograd, 1995., str. 296. 16. Sirоpоlis, N., Меnаdžmеnt mаlоg pоduzеćа, ,Zаgrеb, 1995. (Izvоr: US Dearment o
Commerce, Enterprise Statistiks) 17. Schumpeter, Joseph A. Business Cycles. New York, McGraw Hill, 1939. 18. Erić, D., Strategije restrukturiranja preduzeća, Ekonomski fakultet, Beograd, 1995. str. 23. 19. Enterprise Policy Performance Assessment Bosnia and Herzegovina, OECD, 2005.
Еlеktrоnski izvоri:
20. Dostupno na: URL: http://www.globalinnovationindex.org/gii/main/analysis/rankings.cfm-?vno=a1 (pristup: 20.05.2012.)
21. Dostupno na: URL: http://www.informatickoupravljanjerazvojempreduzeca973 22. (pristup: 20.05.2012.)

REDETE – ECONOMIC DEVELOPMENT AND ENTEREPRENEURSHIP IN TRANSITION ECONOMIES
536
TANGIBLE FIXED ASSETS ACCOUNTING
Luka MLADINEO262 Nenad VUDRIĆ263
Abstract
Tangible fixed assets represent the most important part of an entity’s assets for most compa-nies. According to International Financial Reporting Standards entrepreneurs are supposed to classify tangible fixed assets considering its purpose as: property, plant and equipment or as property investments or fixed assets for sale and ending of business. In this paper classification and measurement of tangible fixed assets considering the in different companies is going to be analyzed using questionnaires.
Keywords: tangible fixed assets, cost model, revaluation model, book value, fair value
262 University of Split, University Department for Vocational Studies, Split, Croatia 263 Libertas Business College, Zagreb, Croatia

REDETE – ECONOMIC DEVELOPMENT AND ENTEREPRENEURSHIP IN TRANSITION ECONOMIES
537
1. Introduction
After the initial recognition of tangible fixed assets by purchase price its value is being reduced by passing of time and use. According to International Standards the management is supposed to choose the depreciation method that is going to reflect actual use of the fixed asset and which is going to transfer its purchase price (or purchase price reduced by residual value, if there is any residual value) to costs during its useful life.
However, the way it’s used or changes in market conditions can additionally reduce or increase the value of the fixed asset in relation to its book value. In that case the management determines the way of measuring tangible fixed assets by accounting policies and chooses between the Cost Model and the Revaluation Model.
2. Cost Model
According to the Cost Model the entrepreneur, after the initial recognition of the tangible fixed asset, is going to record it by acquisition costs less any accumulated depreciation except in cases when there are reasons for further reduction in value. When there are reasons for further reduction, the entrepreneur is supposed to estimate the recoverable amount on the date of the report and compare it to the book value. If the recoverable amount is less the book value, value of the asset is supposed to be reduced to recoverable amount and impairment loss should be recognized in the profit and loss statement.
If the entrepreneur uses the Cost Model and determines that the recoverable amount is higher than the book value, the value of the asset isn't going to be increased.
Increase in value is only possible if the value of the asset has earlier been reduced and it should be increased to its recoverable amount. That increase should be registered as an income in the pro-fit and loss statement.
The shortcoming of the Cost Model is that there is a possibility the book and fair value of the asset are different and the purpose of accounting is that the assets are shown as realistically possi-ble in financial reports. To avoid those problems the management can choose the Revaluation Model.
3. Revaluation Model
Unlike the Cost Model where the book value can be reduced in relation to the recoverable amount, in the Revaluation Model the book value can be reduced or increased regarding the fair value.
If the fair value of the asset is less than the book value on the revaluation date, the value of the asset should be further reduced. The reduction is recognized as the expense of the period and it is shown in the profit and loss statement if there is no revaluation surplus.
When the value of an asset is increased as a result of revaluation, revaluation surplus is created. It represents unrealised profit that isn't taxable in the period in question but is going to be included in the tax basis in the period in which the revaluation surplus is going to be realized.
If the revaluation surplus has been created as a result of a previous revaluation, the decrease in value will first affect the surplus that will be reduced. If the decrease in value is higher than the existing surplus, the difference between the decrease that is higher than the surplus is recognized as an expense of the period. The reduction in value to the existing revaluation surplus is registered
REDETE – ECONOMIC DEVELOPMENT AND ENTEREPRENEURSHIP IN TRANSITION ECONOMIES
538
in the other comprehensive profit statement and the amount that exceeds the surplus is shown in the profit and loss statement.
When choosing the Revaluation Model the entrepreneur registers the subsequent increase or reduction in value of the asset. When the value of an asset has earlier been reduced and is after-wards being increased, the increase can be recognized as income only to the extent of the previous revaluation decrease and the rest is recognized as revaluation surplus. The amount recognized as an income leads to the increase of the profit of the accounting period. The income will increase the tax basis and result in higher company income tax, while the revaluation surplus won't affect the company income tax. When the value of an asset that has earlier been increased and where a revaluation surplus has been created is being decreased, the revaluation surplus is reduced first which doesn’t influence the profit or the company income tax. However, if the decrease is higher than the revaluation surplus the amount over the surplus shall be recognized as an expense of the period and will be treated as loss in the profit and loss statement which will result in lower profit in the accounting period.
Since the expense that is a result of a decrease in value of the tangible fixed assets is tax deductible, the entrepreneur will pay lower company profit tax in the period in question.
Property, plant and equipment that are included in the IAS 16 and CFRS 6 are registered in the above mentioned way. Unlike those assets, investments in real estate and fixed assets for sale are revalued according to the fair value model where its book value is compared to the fair value (less the sales cost). The difference that occurs is registered directly in the profit and loss statement which directly influences the profit and the company income tax liability of the accounting period.
Parallel overview of revaluation and its impact is shown in the following tables:

Tab
le 1
Rev
alua
tion
Mod
el (
fair
val
ue)
in c
ase
of in
crea
se in
val
ue o
f the
ass
et
Fai
r va
lue
12.0
00.0
00,0
0 ku
na le
ss th
e sa
les
cost
200
.000
,00
kuna
Rev
alu
atio
n M
odel
(fa
ir v
alu
e) in
cas
e of
incr
ease
in v
alu
e of
th
e as
set
Acc
oun
tin
g S
tan
dard
B
ook
Val
ue o
f th
e B
uild
ing
(bef
ore
the
valu
e ad
just
men
t)
Fai
r V
alue
(R
eval
uatio
n M
odel
)
Boo
k V
alue
of
the
Bui
ldin
g (a
fter
the
valu
e ad
just
men
t)
Dep
reci
atio
n is
ca
lcul
ated
(Y
ES
/NO
)
Dif
fere
nce
(Rev
alua
tion
Mod
el)
Impa
ct o
n pr
ofit
Impa
ct o
n co
mpa
ny
inco
me
tax
1 2
3 4
5 6-
3-2
7 8=
7x20
%
IAS
16
(in
crea
se in
va
lue)
10.0
00.0
00,0
0 12
.000
.000
,00
12.0
00.0
00,0
0 Y
ES
2.00
0.00
0,00
R
eval
uatio
n su
rplu
s –
unre
alis
ed p
rofi
t
- -
IAS
16
(su
bse
qu
ent
ded
uct
ion)
12.0
00.0
00,0
0 9.
000.
000,
00
9.00
0.00
0,00
Y
ES
2.00
0.00
0,00
D
ecre
ase
of th
e re
valu
atio
n su
rplu
s 1.
000.
000,
00
Los
s fr
om th
e de
crea
se in
the
PL
S
- 1.
000.
000,
00
- 20
0.00
0,00
IAS
40
8.00
0.00
0,00
12
.000
.000
,00
12.0
00.0
00,0
0 N
O
4.00
0.00
0,00
In
com
e fr
om th
e in
crea
se in
val
ue in
th
e PL
S
+
4.00
0.00
0,00
+
800
.000
,00
IFR
S 5
7.80
0.00
0,00
11
.800
.000
,0026
4 11
.800
.000
,00
NO
4.
000.
000,
00
Inco
me
from
the
incr
ease
in v
alue
in
the
PLS
+
4.00
0.00
0,00
+
800
.000
,00

RE
DE
TE
– E
CO
NO
MIC
DE
VE
LO
PM
EN
T A
ND
EN
TE
RE
PR
EN
EU
RS
HIP
IN
TR
AN
SIT
ION
EC
ON
OM
IES
54
0
Tab
le 2
Rev
alua
tion
Mod
el (
fair
val
ue)
in c
ase
of d
ecre
ase
in v
alue
of t
he a
sset
265 F
air
valu
e 8.
000.
000,
00 k
una
less
the
sale
s co
st 2
00.0
00,0
0 ku
na
Rev
alu
atio
n M
odel
(fa
ir v
alu
e) in
cas
e of
dec
reas
e in
val
ue
of t
he
asse
t
Acc
oun
tin
g S
tan
dard
B
ook
Val
ue o
f th
e B
uild
ing
(bef
ore
the
valu
e ad
just
men
t)
Fai
r V
alue
(R
eval
uatio
n M
odel
)
Boo
k V
alue
of
the
Bui
ldin
g (a
fter
the
valu
e ad
just
men
t)
Dep
reci
atio
n is
ca
lcul
ated
(Y
ES
/NO
)
Dif
fere
nce
(Rev
alua
tion
M
odel
) Im
pact
on
prof
it
Impa
ct o
n co
mpa
ny
inco
me
tax
1 2
3 4
5 6=
3-2
7 8=
7x20
%
IAS
16
(dec
reas
e in
val
ue)
10
.000
.000
,00
8.00
0.00
0,00
8.
000.
000,
00
YE
S -2
.000
.000
,00
Los
s fr
om th
e de
crea
se in
th
e PL
S
- 2.
000.
000,
00
- 40
0.00
0,00
IAS
16
(su
bse
qu
ent
incr
ease
)
8.00
0.00
0,00
11
.000
.000
,00
11.0
00.0
00,0
0 Y
ES
2.00
0.00
0,00
In
com
e fr
om th
e in
crea
se in
va
lue
in th
e P
LS
1.
000.
000,
00
Rev
alua
tion
surp
lus
– un
real
ised
pro
fit
+ 2
.000
.000
,00
+ 4
00.0
00,0
0
IAS
40
10.0
00.0
00,0
0 8.
000.
000,
00
8.00
0.00
0,00
N
O
-2.0
00.0
00,0
0 L
oss
from
the
decr
ease
in
the
PLS
- 2.
000.
000,
00
- 40
0.00
0,00
IFR
S 5
10.0
00.0
00,0
0
7.80
0.00
0,00
265
7.80
0.00
0,00
N
O
-2.2
00.0
00,0
0 L
oss
from
the
decr
ease
in
the
PLS
- 2.
200.
000,
00
- 44
0.00
0,00

REDETE – ECONOMIC DEVELOPMENT AND ENTEREPRENEURSHIP IN TRANSITION ECONOMIES
541
During the revaluation of property, plant and equipment the calculation of the depreciation isn't interrupted. In case of fixed assets for sale and property investments the calculation of deprecia-tion is stopped and the revaluation is carried out on the date of the balance sheet when the book value is compared to the fair value.
4. Questionnaire
1. Which accounting standard are you obliged to follow? a) Croatian Financial Reporting Standard (CFRS) b) International Financial Reporting Standard (IFRS) 2. Do you carry out revaluation of fixed assets? a) Yes b) No 3. If you carry out revaluation of fixed assets, which model do you use? a) Cost Model b) Revaluation Model 4. Do you reclassify tangible fixed assets according to its use? a) Yes b) No
The purpose of the questionnaire was to find out which accounting standards and which acco-
unting policies within those standards Croatian companies use in their business activities. The answers have shown that about half of the companies use Croatian Financial Reporting Standards and the other half use International Financial Reporting Standards.
Revaluation is carried out by 75% of the companies that were a part of the survey and it seems to be quite a high percentage. However, the situation in the tangible fixed assets market, especia-lly real estate has gone through dramatic changes in the last ten years. Prices have fluctuated from very high to very low and because of that the percentage of the companies that carry out reva-luation could have been higher.
The question about the model used when undergoing revaluation of assets had very interesting answers. The companies that use Croatian Financial Reporting Standards use equally the Cost Model and the Revaluation Model while the companies that use International Financial Reporting Standards use only the Revaluation Model.
We were very surprised to find out that all the companies that were a part of the survey don't carry out reclassification of the tangible fixed assets.
5. Conclusion
When undergoing the revaluation of tangible fixed assets the management can choose the Cost Model or the Revaluation Model as the value adjustment model of tangible and intangible fixed assets within the accounting policies.
In this paper the authors have tried to show the models that can be used in the reduction in value of tangible fixed assets and its impact on the operating result of the company. The value of revaluated tangible fixed assets registered in financial reports is closer to its real value and as such gives more useful information. In spite of that fact, half of companies that use Croatian Financial Reporting Standards use the Cost Model.
Considering the intended use of the tangible fixed asset there are different ways of accounting treatment of revaluation. In case of an increase in value of the asset, the difference between book and fair value is shown as income in the profit and loss statement or as a revaluation surplus.

REDETE – ECONOMIC DEVELOPMENT AND ENTEREPRENEURSHIP IN TRANSITION ECONOMIES
542
Entrepreneurs that are obliged to follow IFRS evident the revaluation surplus in the other compre-hensive profit statement while those that are obliged to follow CFRS evident it in the notes.
Taking into consideration those regulations, it seems incredible that none of the companies in the survey reclassify tangible fixed assets.
Literature
1. Belak, V. (skupina autora): Računovodstvo poduzetnika – s primjerima knjiženja, VIII. izdanje, RRiF plus, Zagreb, 2012.
2. Belak, V.: Računovodstvo dugotrajne materijalne imovine, Belak excellens, Zagreb, 2009. 3. Odluka o objavljivanju Hrvatskih standarda financijskog izvještavanja (HSFI), Nar. nov. br.
30/08. 4. Odluka o objavljivanju Međunarodnih standarda financijskog izvještavanja (MSFI), Nar. nov.
br. 140/06. i 136/09. 5. Cirkveni, T.: Računovodstveni postupci revalorizacije dugotrajne imovine, Računovodstvo,
revizija i financije, br. 7/2008., RRiF plus, Zagreb, 2008. 6. Gulin, D. (skupina autora): Primjena Hrvatskih standarda financijskog izvještavanja – s
poreznim propisima, HZRFD, Zagreb, 2008.

REDETE – ECONOMIC DEVELOPMENT AND ENTEREPRENEURSHIP IN TRANSITION ECONOMIES
543
FINANCING OF CULTURE IN POLAND AND IN FRANCE – COMPARATIVE ANALYSES
Adam MATEUSZ SUCHECKI266
Abstract
This article will show the major reforms and changes in public administration system in Po-land and France according to changes in the sphere of culture in the years 2001-2010 and the final form of the culture finance system. The reason for choosing this time span is practical. The data from Before year 2001 are incomplete according to the spatial regional reforms in the local administration systems in Poland. I will try to show the effects of the changes, such as how the new administration and local governments use culture as a part of economic capital of the regions and cities, I will also show changes in public expenditures on culture and new possibi-lities and plans of financing this sphere in Poland.
In the analysis Poland will be compared to France as the major country in cultural policies in European Union, with one of the highest levels of public funds spent on culture. I have cho-sen France to my comparatives analysis because France has had one of the longest traditions of cultural policy in Europe and, the French model of cultural policy and culture financing system have been a background for reforms of Polish cultural policy. Moreover, both countries have the same model of territorial administration. Finally, France has reformed its public financing system by introducing performance-based budgeting and similar reforms will be implemented in Poland in the next few years.
Key words: Economy, culture, performance-based budgeting, Poland, France
266 University of Lodz, Department of Economy and Sociology, P.O.W. St 3/5, 90-255 Lodz, Poland,

REDETE – ECONOMIC DEVELOPMENT AND ENTEREPRENEURSHIP IN TRANSITION ECONOMIES
544
Introduction
The development of the cultural sector in each country depends on the sources of financing. In spite of the differences between particular models, the common element in each of them is the sta-te’s patronage over this sector. It is the extent of state’s interventionism that allows for determi-ning five main models of organizing and financing culture:
1. central organization and financing of culture (e.g. France),
2. central organization and fund financing of culture (e.g. Scandinavian countries),
3. subcentral organization and mixed financing of culture (e.g. UK, Netherlands),
4. central and regional organization of culture support and central financing system (e.g. Germany, Austria, Canada),
5. central and regional organization of culture support and decentralized financing system (e.g. Switzerland) (Golinowska, 1991, pp. 5-6).
The transformation process connected with the organization and financing of culture in Poland
is closely connected to the change in the field of economy management systems. Year 1989 mar-ked the transformation of Polish economy from command-and-quota system, which was charac-teristic for all the countries of the people’s republics block, to the market economy system. Such a drastic change of rules necessitated complex reforms concerning all the economy, including the sphere of culture, which was treated as a part of the social service sector.
Major changes in Polish public administration system including the organization and financing of culture took place after 1989. Starting point for the reforms aimed at decentralization was to restore the core administrative division of the country (which had already existed in the interwar period) and reject the unity principle which was effective in the times of the Polish People’s Re-public (PRL) (Kornaś, 2005, p. 138). As a result of the decentralization process, contributions of particular public entities towards organizing and financing culture have changed. The obligation to organize and finance culture lies now primarily with the Ministry of Culture and National Heritage, which is the main organizer of national cultural institutions’ activities. As of March 8, 1990, when the Act on the Territorial Government was enforced, local government organs have been obliged to fulfill the collective needs of the local community, including their cultural needs (Przybylska, 2007, pp. 52-55).
In France changes in the organization and financing of culture were mainly connected with reorganizing central culture administration by deconcentration decentralization. Until 2007 the ad-ministrative system represented by the Ministry of Culture was characterised by extensive internal structure, which did not contribute to the effective enforcement of cultural policy, as well as resul-ted in overlapping ranges of authority and the increase in expenditure on implementing public policy in the field of culture (Riou, 1993, p. 49). Between 2007 and 2010 the number of departme-nts and branches within the ministry was reduced from 9 to 5.
To complete its tasks at a local level France had to decentralize them. To accomplish that goal on March 14, 1986 under a decree 86-538 in each of the 26 regions Regional Directorates of Cultural Affairs (DRAC) were established. They are responsible for introducing state cultural policy in regions and departments.
Before implementing the decentralization process, the obligation to assure equal cultural deve-lopment in each and every region was both Ministry of Culture and Communication and Presi-dent’s responsibility. In the course of this process all the levels of local authority were obliged to archive and then store their own archive resources. Departments were given the right and oblige-tion to finance centrally managed libraries (Greffe and Flieger, 2009, p. 64). Local councils recei-ved most rights in the field of cultural heritage and cultural education. Communes were obliged to conduct artistic and cultural education in primary teaching as well as educate amateurs. Depart-ments became responsible for drawing up the network of artistic educational system as well as

REDETE – ECONOMIC DEVELOPMENT AND ENTEREPRENEURSHIP IN TRANSITION ECONOMIES
545
participating in financing artistic education at a primary level. Regions started to organize and finance primary and vocational artistic education.
In 2001 France enforced a new act on public spending – LOLF (La Loi Organique aux Lois de Finances). It reformed both budgetary system and public management by introducing rules for performance-based budgeting, such as basing the construction of the budget on the principle of management by results and using a yearly result plan.
Performance-based budgeting is a method of managing public funds, which stands for conso-lidated expenditure plan for the units of public finance sector that is drawn with further than a yearly perspective within the function of state, budgetary tasks and sub-tasks together with the indicators determining the performance level (Postuła and Perczyński, 2010, p. 26). Performance-based budgeting allows for formulating and prioritising aims with respect to tasks, orienting tasks and public spending for aims, measuring aims with result indicators and connecting them with tasks and public spending (Lubińska, 2009, p. 60).
Performance-based budget of France was divided into 34 missions, 133 programs and 500 tasks. The financing of the programmes and tasks may be based on the permission to engage fun-ds (autorisation d’engagement, autorisations de programmes) and an open credit (credit de paiement).
In 2006 Polish government decided to launch the process of working on public spending re-form in order to implement modern method of budgeting and budget management that would be goal- and result-oriented and based on long-term planning called performance-based budget. In the second half of year 2006 it was decided to make an attempt to draw the first model of per-formance-based budget in two budgeting areas, namely Science and Higher Education. Work on the project was finished in Spetember 2006. Owing to this fact, the results of the work could be attached as a Justification for budget act draft 2007. In 2008 the structure of performance-based budget consisted of tasks defined by the owners of public funds. Within each task suitable sub-tasks were determined. Legal justification for budget act 2009 focused on determining a functional structure that would allow for grouping the expenditures. Proposed performance system outlined 22 state’s functions which are the main task classification units and group expenditures of all the fund owners according to the policies adopted by the state.
Financing culture from the state budget in Poland in years 2000 to 2010
The main burden of financing tasks related to culture in Poland lies with the Ministry of Cultu-re and National Heritage. Although other ministries and state agencies participate in the enforce-ment of the state cultural policy, the scope of financing culture by these institutions takes a differ-rent place in the hierarchy of importance, which is determined by the level of expenditures and participation in the culture budget expenses.
Within the given period, state budget expenditures on the sector of culture and national heri-tage were constantly on the increase until 2009, when they reached 1592,79 million PLN. Howe-ver, next year the figures dropped by 144,64 million PLN. Basing on the data presented in Table 1 it can be inferred that the expenditures of the Ministry of Culture and National Heritage (part entitled “Culture and the Protection of National Heritage”) are dominant in comparison with the expenditures of ministries responsible for the other parts of the budget. In period 2000 – 2010 the percentage share of this ministry in general expenditures on section 921 of the state budget fluctuated between 52,49% in 2002 and 85,29% in 2009 accompanied by a systematic rise in general expenditures on culture.
Apart from the Ministry of Culture and National Heritage, the expenditures on culture in Pola-nd over the period in question focused on the President’s Cabinet, where a decrease in expenditu-res could be observed from the beginning, from the initial 6,27% in 2000 to 2,64% in 2009, whileat the same time there was an increase in nominal values and in the Ministry of Foreign

REDETE – ECONOMIC DEVELOPMENT AND ENTEREPRENEURSHIP IN TRANSITION ECONOMIES
546
Affairs (0,81% in 2001 and 2002; 1,98% in 2007). A significant rise in the percentage share of expenditures in culture budget expenses in 2001 – 2004 was pronounced in the area “National Defence” (8,48% in 2004 to 10,65% in 2001). This rise was sudden and momentary, which could have been connected with attuning Polish army to the requirements of NATO, which Poland joined in 1999. Graphic illustration of the percentage share in the state budget expenditures on culture and preservation of national heritage with the division into budgetary parts, however, excluding the part which belongs to the Ministry of Culture and National Heritage is presented in chart 1. The percentage share of other ministries in culture budget expenses over the given period was insignificant. Chart 2 shows that the dynamics of changes in expenditures on culture and protection of national heritage in individual resorts varied and it has been very difficult to observe clear tendencies there. It is also proved by information presented in Table 3 concerning the rate of change in expenditures on culture and preservation of national heritage by various entities taken into consideration in the state budget.
The detailed characteristic of macroeconomic conditions in cultural sector in Poland in the period 2000-2010 was presented in Table 4. Basing on the information contained there, it may be inferred that the share of state budget expenditures in GDP was characterised by a high degree of changeability. It is possible to distinguish four sub-periods in the analysed time span. The first one, characterised by the upward trend, encompassed the period from 2000 to 2002, while the second one, which lasted until 2006, pronounced the downward trend. Between 2006 and 2008 the share of state budget expenditures revealed a substantial growth until it reached 22,48%. The fourth period which lasted since 2008 was characterised by another decrease reaching in 2010 (20,84%) the level very close to the share of state budget expenditures in GDP in 2004 (20,88%). These regularities point out changes in government budgetary policy by limiting total expenditure of the central budget.
Table 1. Expenditures on culture in Poland in 2000-2010 with respect to participation in state budget expressed in millions PLN
2000 2001 2002 2003 2004 2005 2006 2007 2008 2009 2010 Total 622,3
3 937,7
3 801,2
0 886,2
6 1034,0
2 1009,3
5 1088,7
5 1276,2
8 1466,3
0 1592,7
9 1448,1
5 Culture and Heritage 412,0
9 543,3
7 420,5
8 490,1
4 752,05 825,67 894,05 1045,5
6 1213,0
4 1358,5
7 1196,2
0 President of Poland 39 30,72 29,17 29,90 30,50 30,50 37,50 45,50 44,30 42,00 42,00 Science 0 0 0 0 0 0 6,03 5,93 15,96 15,68 21,67 National Defence 0 82,07 85,36 84,26 87,64 18,26 0 11,62 18,39 15,17 23,07 Education 0 0 0 0 0 0 0 1,48 2,09 2,71 *6,00 Labor 0 1,67 2,63 1,51 1,66 1,66 1,80 2,58 1,97 1,84 1,61 Agriculture 3,04 3,22 2,87 3,49 4,69 4,60 4,63 4,80 5,73 5,37 5,87 Treasury 0 4,12 1,03 1,26 4,87 4,00 3,95 3,95 4,04 2,50 2,50 Religions 0 0 0 0 0 5,89 10,61 11,57 11,48 11,19 11,04 Foreign Affairs 7,94 8,20 6,95 12,72 12,55 17,18 19,50 25,27 25,75 25,87 26,16 Health 4,59 5,13 4,00 4,58 6,08 7,42 7,24 7,78 7,49 8,51 8,51 Office for the Veterans
0 0,97 0,92 1,09 1,00 0,52 0,40 0,39 0,67 0,59 0,58
PAN 8,92 9,19 8,98 9,00 10,87 15,14 9,97 12,10 11,95 13,12 12,61
Source: the Ministry of Finance

REDETE – ECONOMIC DEVELOPMENT AND ENTEREPRENEURSHIP IN TRANSITION ECONOMIES
547
Table 2. The structure of expenditures on culture in Poland in 2000-2010 with respect to participation in state budget (in percentage)
2000 2001 2002 2003 2004 2005 2006 2007 2008 2009 2010 Total 100 100 100 100 100 100 100 100 100 100 100 Culture and Heritage 66,22 57,95 52,49 55,30 72,73 81,80 82,12 81,92 82,73 85,29 82,60 President of Poland 6,27 3,28 3,64 3,37 2,95 3,02 3,44 3,57 3,02 2,64 2,90 Science 0,00 0,00 0,00 0,00 0,00 0,00 0,55 0,46 1,09 0,98 1,50 National Defence 0,00 8,75 10,65 9,51 8,48 1,81 0,00 0,91 1,25 0,95 1,59 Education 0,00 0,00 0,00 0,00 0,00 0,00 0,00 0,12 0,14 0,17 0,41 Labor 0,00 0,18 0,33 0,17 0,16 0,16 0,17 0,20 0,13 0,12 0,11 Agriculture 0,49 0,34 0,36 0,39 0,45 0,46 0,43 0,38 0,39 0,34 0,41 Treasury 0,00 0,44 0,13 0,14 0,47 0,40 0,36 0,31 0,28 0,16 0,17 Religions 0,00 0,00 0,00 0,00 0,00 0,58 0,97 0,91 0,78 0,70 0,76 Foreign Affairs 1,28 0,87 0,87 1,43 1,21 1,70 1,79 1,98 1,76 1,62 1,81 Health 0,74 0,55 0,50 0,52 0,59 0,74 0,66 0,61 0,51 0,53 0,59 Office for the Veterans 0,00 0,10 0,11 0,12 0,10 0,05 0,04 0,03 0,05 0,04 0,04 PAN 1,43 0,98 1,12 1,02 1,05 1,50 0,92 0,95 0,81 0,82 0,87
Source: Calculations based on Table 1
Chart 1. The structure of expenditures on culture in Poland in period 2000-2010 according to participation in state budget (in percentage)
.
Source: Calculations based on Table 1.
Table 3. Yearly rates of changes in the expenditure on culture (part 24) in Poland in the period 2000-2010 according to participation in state budget (in percentage)
2001 2002 2003 2004 2005 2006 2007 2008 2009
Total 50,68 -14,56 10,62 16,67 -2,39 7,87 17,22 14,89 8,63
Culture and Heritage 31,86 -22,60 16,54 53,44 9,79 8,28 16,95 16,02 12,00
President of Poland -21,23 -5,05 2,50 2,01 0,00 22,95 21,33 -2,64 -5,19
Science 0,00 0,00 0,00 0,00 0,00 . -1,64 169,21 -1,75
National Defence . 4,01 -1,29 4,02 -79,16 . . 58,26 -17,51
Education 0,00 0,00 0,00 0,00 0,00 0,00 . 41,11 30,04
Labor . 57,80 -42,47 9,65 -0,12 8,88 43,04 -23,54 -6,74
Agriculture 5,99 -10,84 21,46 34,45 -1,94 0,72 3,69 19,33 -6,20
Treasury . -75,03 22,62 , -17,86 -1,18 0,00 2,30 -38,18
Religions 0,00 0,00 0,00 0,00 . 80,19 8,98 -0,72 -2,54
Foreign Affairs 3,27 -15,16 82,84 -1,27 36,84 13,50 29,59 1,92 0,45
Health 11,68 -21,98 14,54 32,68 22,13 -2,51 7,45 -3,65 13,56
Office for the Veterans . -5,42 19,44 -8,76 -47,60 -23,71 -1,25 71,07 -12,46
PAN 2,99 -2,31 0,27 20,76 39,28 -34,16 21,36 -1,23 9,84
Source: Calculations based on Table 1.

REDETE – ECONOMIC DEVELOPMENT AND ENTEREPRENEURSHIP IN TRANSITION ECONOMIES
548
Chart 2. Yearly rates of changes in the expenditure on culture in Poland in the period 2000-2010 according to participation in state budget expressed in percentage
Total Culture and Heritage President of Poland
Science National Defence Education
Labor Agriculture Treasury
Religions International Affairs Health
Office for the Veterans PAN
Source: Calculations based on Table 1.

REDETE – ECONOMIC DEVELOPMENT AND ENTEREPRENEURSHIP IN TRANSITION ECONOMIES
549
Table 4. The realisation of macroeconomic assumptions including GDP, the expenditure of the state budget and the Ministry of Culture and National Heritage and others
in the period of 2000-2010 (current prices, share expressed in percentage).
In thousands
zl
GDP State budget expenditures
MCNH expenditures
Done including: Culture
including: Others
2000 744378000 150323559 1093433 412095 681338
2001 779564000 172832808 1186675 543372 643302
2002 808578000 182064364 1108155 420581 687574
2003 843156000 188124283 1243649 490140 753509
2004 924538000 193019512 1497467 752049 745418
2005 983302000 203771458 1645036 825675 819361
2006 1060030000 220250298 1750659 894048 856611
2007 1176740000 249654809 1946941 1045559 901382
2008 1275430000 273985890 2209103 1213039 996064
2009 1343370000 298028478 2448896 1358569 1090327
2010 1415360000 294893878 2341561 1196200 1145361
Shere in %
SBE/GDP MCE/GDP MCE/SBE MCEC/MCE MCEO/MCE
2000 20.19 0.15 0.73 37.69 62.31
2001 22.17 0.15 0.69 45.79 54.21
2002 22.52 0.14 0.61 37.95 62.05
2003 22.31 0.15 0.66 39.41 60.59
2004 20.88 0.16 0.78 50.22 49.78
2005 20.72 0.17 0.81 50.19 49.81
2006 20.78 0.17 0.79 51.07 48.93
2007 21.22 0.17 0.78 53.70 46.30
2008 21.48 0.17 0.81 54.91 45.09
2009 22.19 0.18 0.82 55.48 44.52
2010 20.84 0.17 0.79 51.09 48.91
Source: Central Statistical Office
The changes in public finance policy, which also influence the enforcement of government
cultural policy, are reflected in the irregular rate of changes in total expenditure of the ministry of Culture and National Heritage as well as its components – cultural expenses in broad sense and other expenses connected with them. This situation is characterized by the information included in Table 5 and Chart 3.

REDETE – ECONOMIC DEVELOPMENT AND ENTEREPRENEURSHIP IN TRANSITION ECONOMIES
550
Table 5. The rate of GDP change, state budget expenditures and the Ministry of Culture and National Heritage expenditures in the period 2000-2010.
Growth rate prev. year=100
GDP State budget expenditures MCNH expenditures
Done Inc. Culture Inc. Others
2001 4.73 14.97 8.53 31.86 -5.58
2002 3.72 5.34 -6.62 -22.60 6.88
2003 4.28 3.33 12.23 16.54 9.59
2004 9.65 2.60 20.41 53.44 -1.07
2005 6.36 5.57 9.85 9.79 9.92
2006 7.80 8.09 6.42 8.28 4.55
2007 11.01 13.35 11.21 16.95 5.23
2008 8.39 9.75 13.47 16.02 10.50
2009 5.33 8.78 10.85 12.00 9.46
2010 5.36 -1.05 -4.38 -11.95 5.05
Source: Calculations based on Table 4.
Chart 3. The rate of GDP change, state budget expenditures and the Ministry of Culture and National Heritage expenditures on culture with the division into expenditure on culture
and others in 2000-2010
Source: Calculations based on Table 5.
In both cases, the least beneficial situation was observed in 2002 as compared to 2001 and in
2010 as compared to 2009. General analysis of the rate of change in the expenditure of this ministry indicates changes in cultural policy, which stem from restrictions on both budget funds and funds earmarked for cultural activity by the Minister of Culture.
Carrying out similar analysis with respect to the realization of macroeconomic assumption as far as the Ministry of Culture and National Heritage’s expenditure is concerned, it can be stated that the share of total nominal expenditure of this ministry in GDP (also in current prices) in period 2000-2010 pronounced stable trend and fluctuated between 0,14% (2002) and 0,18% (2009). Also the share of the Ministry of Culture and National Heritage in budget expenditure reached very low level with the peak of 0,82% in 2009.
Basing on the data in Table 6, it may be concluded that the highest amounts of money in the expenditure on culture and preservation of national heritage were allotted to grants and subsidies, although it is worth mentioning that in the period 2007-2010 their share in total expenditure on this sphere decreased. The upward trend could on the other hand be observed in expenses connected with financing projects with the European Union. The biggest amounts were spent in 2009 and comprised 16,55% of total expenditures of the Ministry of Culture. Among other groups

REDETE – ECONOMIC DEVELOPMENT AND ENTEREPRENEURSHIP IN TRANSITION ECONOMIES
551
of expenditures a significant share belonged to the current expenses of budgetary units and material expenditure, whose highest level was observed in 2008.
Table 6. The realization of state budget expenditure on culture and preservation of natural heritage with respect to economic groups in the period 2007-2010.
In thousands zl
Economic groups 2007 2008 2009 2010
Donnations and Subventions 897834 964852 968347 966264
Benefis for Individuals 3348 3172 3235 3528
Current expenditure of the budget items 174841 191645 204428 203899
Capital expenditure 149832 244994 145645 157189
EU Projects 50429 61637 262137 117266
Total 1276284 1466300 1583792 1448146
In %
2007 2008 2009 2010
Donnations and Subventions 70,35 65,80 61,14 66,72
Benefis for Individuals 0,26 0,22 0,20 0,24
Current expenditure of the budget items 13,70 13,07 12,91 14,08
Capital expenditure 11,74 16,71 9,20 10,85
EU Projects 3,95 4,20 16,55 8,10
Total 100,00 100,00 100,00 100,00
Source: The Ministry of Finance
Table 7. The expenditure of local council units on culture and preservation of national heritage in millions of PLN
year total communes towns with district rights districts regions 2001 2580 1120 729 79 652 2002 2609 1022 905 54 627 2003 2629 1047 864 55 663 2004 2997 1165 1006 61 766 2005 3437 1328 1197 62 850 2006 4239 1690 1421 82 1046 2007 4731 1810 1683 79 1159 2008 5412 2035 2001 84 1292 2009 6354 2400 2285 97 1573 2010 7006 3092 2482 135 1297
Source: Central Statistical Office
When analysing culture financing on a local level in the given period, an upward trend in
expenditures of particular local council units is easily observable. The biggest increase in cultural expenditure in the analysed period was observed in commune budgets (from 1,120 million PLN in 2001 to 3,092 million PLN in 2010) as well as in the budgets of the towns with district rights (from 729 million PLN 2001 to 2,482 million PLN in 2010). The lowest increase in the culture expenditure following the gradual decline until 2008 was observed on the district level with 79 million PLN in the first year of the research period and 135 million PLN in the last one.

REDETE – ECONOMIC DEVELOPMENT AND ENTEREPRENEURSHIP IN TRANSITION ECONOMIES
552
Budgetary financing of culture in France in period 2000-2010
In the analyses connected with the organization and financing of culture in France central position belongs to the Ministry of Culture and Communication. The privileged position of this ministry stems from historical background. When analysing the evolution of financial and cultural policy in the sphere of culture it is worth mentioning that since 1960 the importance of the cultural budget related to the total state budget, especially its share in public spending, and very often was subject to fluctuations which resulted from the differences between the budget which was approved by the parliament and the one that was realised. Between 1999 and 2004 the share of this ministry’s expenditure varied from 45,5% in 1999 to 40% in 2003. Over the researched period, the level of expenditures counted in millions of Euros was systematically growing . Apart from the Ministry of Culture and Communication, culture expenditure concentrate in the Ministry of Education, where a systematic growth in expenses was noted from about 20% in 2000 to about 23% in 2004, and in the Ministry of Foreign Affairs (20,5% in 1999; 17,2% in 2004).
Table 9 contains the process of shaping the GDP value in current prices and basic prices from 1995 in order to determine the real extent of the change in production and GDP deflator, which informs about the change in prices in the whole economy over the span of 1980-2004 . Between 1980 and 2004 French GDP revealed a growing tendency both in current and basic prices, however the rate of the growth varied in different periods. Among many other factors, it is proved by a very significant differentiation of dynamics indices.
Table 8. State budget expenditure on culture with respect to the ministries in millions of Euros in period 1999-2004
Ministry 1999 2000 2001 2002 2003 2004
1. Culture and Communication 2392 2448 2545 2602 2490 2632 2. National Education 1 120 1 118 1238 1321 1351 1478
3. Foreign Affairs 1 083 1 035 1070 1 083 1 107 1 108
4. Higher Education and Research 239 245 271 312 309 304
5. Prime Minister's Office 149 269 463 545 584 563
6. Economy, Finance, Industry 285 294 294 293 293 294
7. Defence 14 19 23 22 43 31
8. Youth and Sport bd 20 bd 26 23 24
9. Justice 18 19 18 16 8 17
10. Others 20 14 16 6 4 4
Total in million EUR 5 274 5 501 5962 6227 6224 6429
Source: Budget de l’État.

REDETE – ECONOMIC DEVELOPMENT AND ENTEREPRENEURSHIP IN TRANSITION ECONOMIES
553
Table 9. GDP in France 1980-2004 and the dynamics of change
GDP
Year in million EUR Dynamics of annual growth rate
in %
GDP Deflator
Current prices
Constant prices
Current proces values
Constant proces values
1980 440480 880149 13,13 1,69 0,5005 1981 495409 888267 12,47 0,92 0,5577 1982 568314 909873 14,72 2,43 0,6246 1983 629827 920746 10,82 1,19 0,6840 1984 685689 934414 8,87 1,48 0,7338 1985 735950 950381 7,33 1,71 0,7744 1986 793799 973684 7,86 2,45 0,8153 1987 836144 997881 5,33 2,49 0,8379 1988 901469 1043764 7,81 4,60 0,8637 1989 970067 1087225 7,61 4,16 0,8922 1990 1021998 1115965 5,35 2,64 0,9158 1991 1058600 1127298 3,58 1,02 0,9391 1992 1095986 1142703 3,53 1,37 0,9591 1993 1102800 1132263 0,62 -0,91 0,9740 1994 1142407 1157347 3,59 2,22 0,9871 1995 1181849 1181849 3,45 2,12 1,0000 1996 1214153 1194971 2,73 1,11 1,0161 1997 1253896 1221710 3,27 2,24 1,0263 1998 1309524 1264508 4,44 3,50 1,0356 1999 1353364 1306247 3,35 3,30 1,0361 2000 1425986 1357324 5,37 3,91 1,0506 2001 1481193 1382495 3,87 1,85 1,0714 2002 1532025 1396686 3,43 1,03 1,0969 2003 1577791 1411874 2,99 1,09 1,1175 2004 1642468 1446751 4,10 2,47 1,1353
Source: INSEE 2010
Chart 4. The dynamics of GDP (PIB)1981-2004 (the previous year = 100%), dpibp – the dynamics of GDP in expressed in current prices,
dpib – the dynamics of GDP in basic prices.
Source: Calculations based on Table 9.

REDETE – ECONOMIC DEVELOPMENT AND ENTEREPRENEURSHIP IN TRANSITION ECONOMIES
554
Chart 5. The value of GDP (PIB) in current prices (expressed in millions of Euros) an basic prices in 1995 (expressed in millions of Euros) 1981-2004
Source: Calculations based on Table 9.
Public funds designated for culture were mostly concentrated in the Ministry of Culture and Communication, as it was pointed out earlier in the text. However, precise determination of the ministries budget was connected with a lot of problems from the very beginning of its existence. These problems stemmed from the extension of its scope, which impacted the financial condition. For instance, in 1975 the Ministry took over duties connected with promoting reading, in 1982 it also took over the National Library and 1996 it created the Department of Architecture. Those changes caused the increase in budget funds spent on culture. In 1993 the budget of the Ministry of Culture and Communication constituted 1% of the state budget. In the following years the share of this ministry’s budget in the total budget fluctuated between 0,9% and 1%.
Over the analysed period of time the ministry received substantial grants, which translated into the increase in expenditure on cultural activity. At present, French government do not see the need to reduce the budget funds earmarked for implementing public cultural policy to less than 1%. The extent of culture financing from the budget of the Ministry of Culture and Communication from 1980 to 2004 is characterised by the figures in Table 10.
Table 10. The budget of the Minister of Culture and Communication 1980 – 2004.
Year Total Regular
Exp. Open
Credits
Funds for the implementation of
programs in the following years
The percentages in total exp.
dynamics: annual rates
growth (in %)
in mln Euro Regular Exp.
Open Credits
Total Regular Exp.
Open Credits
1980 405 297 108 145 73,33 26,67 1981 454 329 125 144 72,47 27,53 12,10 10,77 15,74 1982 914 684 230 297 74,84 25,16 101,32 107,90 84,00 1983 1066 816 250 549 76,55 23,45 16,63 19,30 8,70 1984 1227 877 350 415 71,48 28,52 15,10 7,48 40,00 1985 1306 875 431 567 67,00 33,00 6,44 -0,23 23,14 1986 1467 866 602 640 59,03 41,04 12,33 -1,03 39,68 1987 1371 885 485 338 64,55 35,38 -6,54 2,19 -19,44 1988 1345 926 419 305 68,85 31,15 -1,90 4,63 -13,61 1989 1518 1092 426 500 71,94 28,06 12,86 17,93 1,67 1990 1598 1165 433 547 72,90 27,10 5,27 6,68 1,64 1991 1845 1235 610 878 66,94 33,06 15,46 6,01 40,88 1992 1975 1294 681 866 65,52 34,48 7,05 4,78 11,64 1993 2107 1358 749 746 64,45 35,55 6,68 4,95 9,99

REDETE – ECONOMIC DEVELOPMENT AND ENTEREPRENEURSHIP IN TRANSITION ECONOMIES
555
Year Total Regular
Exp. Open
Credits
Funds for the implementation of
programs in the following years
The percentages in total exp.
dynamics: annual rates
growth (in %)
1994 2059 1311 748 560 63,67 36,33 -2,28 -3,46 -0,13 1995 2067 1392 675 570 67,34 32,66 0,39 6,18 -9,76 1996 2368 1708 660 589 72,13 27,87 14,56 22,70 -2,22 1997 2306 1822 484 470 79,01 20,99 -2,62 6,67 -26,67 1998 2309 1787 522 565 77,39 22,61 0,13 -1,92 7,85 1999 2395 1852 543 539 77,33 22,67 3,72 3,64 4,02 2000 2452 1908 543 565 77,81 22,15 2,38 3,02 0,00 2001 2549 1987 562 602 77,95 22,05 3,96 4,14 3,50 2002 2610 2073 537 568 79,43 20,57 2,39 4,33 -4,45 2003 2497 2176 321 568 87,14 12,86 -4,33 4,97 -40,22 2004 2639 2216 423 568 83,97 16,03 5,69 1,84 31,78
Source: MDCPFPRE/DEPS
There are two components of the total expenditure of the Ministry of Culture and Communi-
cation. These are current expenses (depenses ordinaires) and open credits (credit de payement). The latter constitute the upper limit to the investment expenses commissioned or realised during the year. They are taken to cover the liabilities concerning investment expenditure expected in the following years within the permissions to engage funds (autorisations d’engagement, autori-sations de programme).
These permissions are grantem for one year in order to realize programmes specified in the budget plan. It means that according to the finance discipline open credits should not exceed the amount permitted. However, based on the presented data and charts it can be noted that in the time of traditional budgeting this rule was not entirely obeyed (e.g. in the period 1987-1998 and 1993-1996).
Information from Table 10 shows that in the analysed period the main part of the ministry’s expenditure consisted of current expenses. Moreover, these expenses pronounced an upward trend. The lowest value of current expenses share in total culture expenditure (67%) was observed in 1985, whereas the highest value (87,14%) was noted in 2003.
The highest (41,04%) share of open credits in total culture expenditure designated for invest-ment was noted in 1986, while the lowest (12,86%) in 2003. The analysis of these figures reveals changeability caused by different prioritization of particular Ministers of Culture and the lowering share of open credits in the total expenditure of the Ministry of Culture and Communication.
Since 2005 France has been using performance-based budgeting. Within the performance-based budget one of its missions is Culture. In further analyses, the scope of the total financing of culture will encompass the budget of the Ministry of Culture and Communication due to its central role both in implementing cultural policy of the state and financing cultural activity defined in the mission and programmes. Data from Table 11 characterise the budget of the ministry realised over the period of 2005 – 2010.
Table 11. The budget of the Ministry of Culture and Communication (2005-2010).
Year Open
Credits Permission to engage
Open Credits
Permission to engage
in mln Euro Growth Rate in % 2005 2805 2823 2006 2947 3031 5,06 7,37 2007 2839 2911 -3,66 -3,96 2008 2915 3038 2,68 4,36 2009 2941 3004 0,89 -1,12 2010 3079 3042 4,69 1,26
Source: MBCPFPRE/DEPS

REDETE – ECONOMIC DEVELOPMENT AND ENTEREPRENEURSHIP IN TRANSITION ECONOMIES
556
Considering presented figures it may be inferred that – apart from year 2010, whose values we-re estimated on the basis of year 2009 – the value of permissions to engage funds granted for a year and attributed to specific programmes accepted in the budget plan every year exceeded the value of open credits, which determined the upper limit of expenditure that could be commissio-ned or paid within the liabilities incurred to engage funds. This situation indicates that the discipli-ne of public finance was obeyed the granted funds were effectively and efficiently used to realise particular programmes, which were the basic classification units that grouped the expenditure that could be realise only by one ministry.
Conclusion
To sum up the above discussion, it is necessary to state that the enforcement of the principles of cultural policy in Poland and in France were to a large extent dependent on the macroeconomic situation of the state economy and the dynamics of the economic growth indicated by the nominal value of gross domestic product. Moreover, the results of empirical analyses showed a significant correlation between the shape of general state budget expenses (including expenditures on culture and protection of national heritage) and the nominal values of GDP.
It should also be highlighted that despite assigning the task of enforcing cultural policy mainly to the Minister of Culture, some action over the period 2000 – 2010 was taken by other institution of government administration. The dynamics of expenditure changes in particular resorts varied and it was difficult to notice any clear tendencies in enforcing long-term and precise cultural policy of the country. It is also reflected in individual budget positions connected with culture in a yearly financial scheme, which constitute limits of funds designated for putting into practice actions that do not have a common goal. In France, the purposefulness of actions undertaken in the sphere of culture by institutions other than the Ministry of Cluture and Communication is more conspicuous and depends on political decisions. Both countries included in this analysis are characterised by a high level of grants and subsidies as far as the expenses in the sphere of culture are concerned, which may lead to the conclusion that extrabudgetary resources are poorly used in this sector.
The process of decentralization of public administration contributes to a better condition of the sphere of culture. It is proved by local councils’ growing expenditures on culture in Poland. This tendency stems from the fact that more and more frequently cultural development is perceived as an important factor in the regional development. Only the district level has not turned out to be a good culture organizer because of its limited financial scope. Nowadays depriving districts of the obligation to organize and finance cultural activity.
Since the introduction of performance-based budgeting in France, the budget of the Ministry of Culture and Communication has increased. The ministry is the only holder of the budget funds earmarked for culture also on the local level through DRAC. Basing on the conducted analyses it may be concluded that implementing principles of performance-based budgeting in France allo-wed for the increase in budget expenditures on culture and restricted the problem of overlapping authority. It may also prove that this budgeting method is effective in countries characterized by central organization and public financing of culture, such as post-socialist countries, including Poland.

REDETE – ECONOMIC DEVELOPMENT AND ENTEREPRENEURSHIP IN TRANSITION ECONOMIES
557
Reference list
1. Golinowska A. (1991). Sektor prywatny w finansowaniu kultury. IK. Warszawa 2. Kornaś J. (2005). Administracja publiczna w Polsce. PWN. Warsaw 3. Przybylska J. (2007). Finansowanie działalności kulturalnej w Polsce. Wydawnictwo AE.
Poznan 4. Riou A. (1993). Le droitt de la culture et le droit á la culture. ESF. Paris 5. Greffe X., Flieger S. (2009). La politique culturelle en France. La documentation Française.
Paris 6. Postuła M., Perczyński P. (2010). Budżet zadaniowy w administracji publicznej. Ministry of
Finance. Warsaw 7. Lubińska T. (2009). Nowe zarządzanie publiczne – skuteczność i efektywność.Difin, Warsaw

REDETE – ECONOMIC DEVELOPMENT AND ENTEREPRENEURSHIP IN TRANSITION ECONOMIES
558
COMPETITION AND ITS PROTECTION ON SERBIAN RETAIL MARKET
Gordana RADOSAVLJEVIĆ267
Ljiljana MAKSIMOVIĆ268 Katarina BORISAVLJEVIĆ 269
Abstract
Nowadays, the market structure of most industries is characterized by companies’ conside-rable market power, which results in high prices and the loss of consumer welfare. A characte-ristic of the retail of developed countries is a high degree of capital concentration, so the retai-lers have an increasingly important role on the market. The market power of retailers is con-tinually growing, which results in growing attention paid to the protection of producers and consumers, as well as the analysis of competition in this sector. Competitive analysis can be do-ne by establishing the degree of market concentration. If the market is less concentrated there are numerous participants of approximately equal market power, which allows consumers gre-ater choice and higher consumer surplus on the market.
The aim of the paper is to analyze the level of competition on the retail market of Serbia, sta-rting from the analysis of the trade sector in Serbia and theoretical aspects of determining the degree of concentration. The growth of concentration is evident through the increased partici-pation of large firms in trade and reduction of the number of small firms. Based on the ava-ilable data on the total turnover of goods in non-specialized retail trade and revenues of the biggest retail companies in Serbia, the first part of the paper analyzes the concentration degree in the retail sector by determining certain concentration indicators. The obtained results are the basis for making conclusions on competition state on the retail market of Serbia.
The second part concerns the problems of competition protection in Serbia. The problem of effective competition protection is the legal framework (Competition Law) in which economic principles and economic analyses are not implemented. This primarily relates to the need for the introduction of tests for determining the relevant product market, relevant geographic mar-ket and concentration indexes. The third part of the paper is about the limitations in research of concentration level in retail market in Serbia.
Keywords: retail, competition, concentration, market share, competition policies
267 Faculty of Economics, University in Kragujevac, e mail: [email protected] 268 Faculty of Economics, University in Kragujevac, e mail: [email protected] 269 Faculty of Economics, University in Kragujevac, e mail: [email protected]

REDETE – ECONOMIC DEVELOPMENT AND ENTEREPRENEURSHIP IN TRANSITION ECONOMIES
559
Introduction
Structural changes in trade developed in the long period of time and influenced the whole mar-ket structure therefore they influenced the total range of relations between companies in the mar-ket. Role of big retail companies strengthened in the market while at the same time the role of small and medium retail companies diminished. Therefore, small and medium enterprises are for-ced to join a numerous forms of cooperation at horizontal and vertical levels in order to be able to compete big retail chains.
Retail sale in Serbia is influenced by great number of factors and certainly the most important is foreign retailers entrance. The entrance influenced: competition increase and trade concentra-tion process, joining the trade with the production sector, change in consumption structure, change in consumers behavior, as well as there was influence in rise of activities connected with consu-mers protection.
Relation between trade concentration and competition becomes up-to-date during the end of the nineties in conditions of abrupt market liberalization and globalisation of economic activities. External growth of companies through the merger and fusion processes especially influenced the strengthening of their market power.
1. The retail conditions analysis in the Republic of Serbia
During the first decade of the 21st century important changes happened in trade. These chang-es relate to: new organizational forms growth, big retailers domination, retail internationalization growth, development of new methods for satisfaction of changeable consumers needs, increase in management profesionalism in business activities performance (Freathy, 2003).
Trade network structure in certain EU countries is characterized by presence of numerous retail formats. EU retail formats life cycle analyses show that department stores as trade business formats, were beaten by their competitors which was measured by the indicators relating to the sales volume and profit margin thus taking the declining position on life cycle curve. As far as traditional self-service shops are concerned, in EU market they are in the maturity phase, measured by the same indicators while innovations in the self-service field-hypermarkets occupy the growth position. (Leknes and Carr, 2004). Exponential growth in sales and profits is observed with discount stores, specialized stores, whereas electronic retail is at the beginning of the life cycle, recording the first important growth in sales and profits (Picture 1).
The position of trade in Serbia was very unfavourable in the time period 1990-2000. Many factors influenced the trade position such as: general economic unstability, recession, sanctions, low level of life standard, inflation, exchange rate instability, low level of application of new technologies in trade, undevelopment of financial markets, developed grey economy, corruption, financial indiscipline, low level in service quality and such like. During 1990-2000 Serbian trade developed in noncoordinated and irrational manner, with no clear concept with its trends, contrary to trade movements in the developed countries (Radosavljević, Maksimović and Borisavljević, 2011, pp.48-52).

REDETE – ECONOMIC DEVELOPMENT AND ENTEREPRENEURSHIP IN TRANSITION ECONOMIES
560
Picture1: Retail formats life cycle (Leknes and Carr, 2004, pp.38)
Development Introduction Growth Maturity Decline Grocery formats Department Stores Clothing and Special Stores Multi format Category Killers Electronic retail
According to the Office for National Statistics and the Business Registers Agency, the trading companies represent around 41,7% of total enterprises in Serbia. The ownership transformation has changed the structure of trade to a large extent. The fragmentation of trade has been reflected in the number of 34385 commercial firms in Serbia. The diversity of commercial firms in terms of size (Table 1) comes out in favor of micro, small and medium-sized enterprises that make up 99.8% of trading companies, while large companies represent the remaining 0.2%.
Table 1: Total number and size structure of trading companies in Serbia in 2010
Total
Company size in terms of number of employees
Micro (0-9)
Small (10-49)
Medium (50-249)
Large (250 or more)
Serbia (total) 82 355 70 340 9 202 2 289 524 Trade (total) 34 385 31 002 2 885 425 73 Wholesale trade 25 114 22 849 1 981 244 40 Retail trade 6 159 5 365 624 140 30 Vehicle retail & repair
3 112 2 788 280 41 3
Source: Statistical Yearbook, Office for National Statistics, 2011.
The number of stores almost doubled in the time period 1999-2006. Concerning the fact that in
2006 the number was about 101 910 and in 2010 the number was 90 690, mild decline is noted in a number of stores which is necessarily a part of the processes of trade net modernization (Table 2).
Table 2. Number of stores in Serbia in period 1990-2010
Year 1999 2006 2007 2008 2009 2010
Number of stores 52.943 101 910 96 660 100 233 96 188 90 690
Source: Statistical Yearbooks, Office for National Statistics, 2011

REDETE – ECONOMIC DEVELOPMENT AND ENTEREPRENEURSHIP IN TRANSITION ECONOMIES
561
One of the main reasons for decrease in the number of small stores is the entrance of big retail chains into the Serbian sales net. Retail chains act in accordance with the strategy of combined retail net and are presented in smaller stores (usually up to 400 m2), supermarkets (400-2000 m2), hypermarkets (over 2000 m2) and Cash & Carry systems.
In comparison with the European countries, retail in the Republic of Serbia is still small in size and not sufficiently developed. Transition process influenced the change in retail structure, especi-ally during the last couple of years. Modern retail formats appeared, and these resulted in increase in number of retail stores and decreased the role of wholesales in the sales channels. Supermarkets and hypermarkets market share increased whereas smaller trade stores share decreased.
2. Concentration analysis in Serbian retail market
2.1. Theoretical aspects of concentration analysis in retail market
Concentration presents one of the most common indicators for market structure, and measures the competition level and monopolistic powers of a company in certain market. In retail and other activities, market share concentration does not necessarily mean the existence of monopolistic position. Monopolistic power is defined as the ability of a company to influence the price and offer, whereas the dominant position occurs when there is no competition for demand and offer or when there is no exposure to significant competition, consequently leading to possible market disruptions (Ilić, Savić, Cvetanović and Arsovski, 2003, pp.188). Therefore, it is important to establish by the concentration analysis in retail market whether the market participant occupies the dominant posititon. Market power measuring factors include: relevant market, dominant (leading) position treshold and market participants concentration. Relevant market presents a type of activities where market power of certain market participant is manifested. Relevant products market is the set of products or services which the consumers regard as exchangeable under the acceptable conditions. Relevant geographical market is the territory where the same conditions exist in the market game for all participants. The level of the dominant position treshold is defined diferently within the national rights of different countries. In big countries treshold is lower (25-30% market share) whereas in smaller countries treshold is higher (35-50% market share). In Serbia, treshold is 40%, and for oligopoly 50%. (Đuričin, Lončar and Rajić, 2008).
Analysis of the concentration level in the retail market shows how fierce the market game could be between the competititors in the market. If retail market is less concentrated there is a greater number of participants with similar market power, which offers the market consumers greater choice. When determining the concentration level, market participants participation is mainly used. Concerning the fact that market share increase results in profitability increase, individual retail companies continualy strive to raise their market participation.
2.2. Market concentration measuring in Serbian retail market
In the procedure of concentration level measuring in Serbian retail market it is necessary to establish relevant market and to gather the data about the participants who perform business activities in the market. The magnitude of the relevant market is defined by products and geographical spread of the market. Relevant market from products aspect is retail market, and as relevant geographical market the whole teritory of the Republic of Serbia is observed in the paper. Variable which is used for measuring of offer concentration is market share of companies in retail market, measured by the total sales revenues.
General retail sales turnover in Serbia, realized in 2009 and 2010 based on the available data provided by the Statistical Office of the Republic of Serbia is presented in the table 3.

REDETE – ECONOMIC DEVELOPMENT AND ENTEREPRENEURSHIP IN TRANSITION ECONOMIES
562
Table 3: General retail sales turnover in Serbia, in 2006- 2010 (EUR,000)
2006 2007 2008 2009 2010 Retail trade
turnover 10022 12889 13902 11792
11651
Source: author`s calculation based on the data provided by the Statistical Yearbooks, 2011
Based on the total retail sales revenues and gains from retail companies divestment in certain
year, the information about the realized retail market shares of its greatest participants in Serbia could be acquired. In charts, the leading companies in the retail market and their market share in 2009 and 2010 are presented (Table 4).
Table 4: Ten leading retailers list and their market share in Serbia in 2009 and 2010 (EUR, 000)
No. Retailers Total sales revenues (2009)
Market share in %
Total sales revenues (2010)
Market share in %
1 DELTA MAXI 698.252 5,9 724.552 6,2 2 MERKATOR 440.118 3,7 457.903 3,9 3 IDEA 364.113 3,1 390.115 3,3 4 C MARKET 233.861 2 227.987 1,96 5 METRO
CASH&CARRY 215.967 1,8 215.522 1,8
6 PTP DIS 158.868 1,3 165.270 1,4 7 UNIVEREXPORT 143.548 1,2 142.559 1,2 8 DELTA SPORT 129.560 1,1 134.526 1,2 9 ŠTAMPA SYSTEM 89.684 0,8 88.318 0,8
10 LILY DROGERIE 77.876 0,7 80.100 0,7 TOTAL 11.791 100, 00 11 651
Source: Econom:east media group- annual special edition , 2011 (www.emportal.rs)
Important market participants in Serbian retail market are companies: Delta Maxi, Mercator,
Idea, C market and Metro, which take from 15 to 20% market share. In 2010, retailers market share increased comparing to 2009, therefore retail market concentration level is increasing insignificantly. Although retail market has a low concentration level, in the last couple of years the concentration level is increasing and the market is becoming the market with moderate concentration.
Economic theory developed numerous methods for offer concentration measuring. In the paper, ratio concentration indicator will be used and the indicator calculation gives a clear picture about Serbian retail market concentration level. Ratio concentration indicator is applied here, because of the specific retail market and establishing the general turnover for certain groups of commodities and trade activities. Bearing in mind research restrictions for retail market concentration level the paper will not provide the calculation for other market concentration level indexes.
2.3. Calculation of retail market concentration index
By adding the n – market shares of the biggest companies in this market, concentration ratio (CRn) is calculated:
n
in XiCR
1
, i=1,2...n
where Xi is single market participation of i- company

REDETE – ECONOMIC DEVELOPMENT AND ENTEREPRENEURSHIP IN TRANSITION ECONOMIES
563
Concentration ratio can be calucalted for four, six or eight biggest companies. If the coefficient value is zero (CR4=0), the perfect competition is present in the market, and if CR4=100, the monopoly exists in the market. According to EU standards, high concentration level exists when the index exceeds value 25. In the USA, markets where the index is below 25 are non concentrated, and if their index is over 50 their markets are higly concentrated.
In the retail market, a great number of companies exists and perform their activities, and there is also great competition, therefore the concentration coefficient is lower. Based on the available data of realized market shares of the biggest retailers in Serbia, concentration ratio in 2009 was 14,4 (CR4=14,4), and 2010 concentration ratio value was 15,23 (CR4=15,23).
Observed index of retail market concentration in 2009, shows that there is no big concentration or market restrictions, since the market share of four biggest companies is about 14%. In 2010 concentration coefficient was 15 %, which shows that there was minor increase in concentration level on retail market. Based on this, the conclusion can be drawn that there was a minor increase in Serbian retail market concentration level and the trend will continue.
Based on the indicator, it can be concluded that four biggest companies in retail trade (Delta Maxi, Mercator, Idea, SC Market) participate the market share in the value of 15%. Concerning the fact that coefficient concentration value is less than 40, we conclude that monopolistic competition is present in Serbian retail market .
When calculating concentration coefficient, a greater number of leading retail companies can be observed. Concentration index value for six and eight biggest companies in Serbian retail market in 2009 was:
CR6=17,8; CR8=20,1 Concentration index value for six and eight biggest companies in Serbian retail market in 2010
was: CR6=18,56; CR8=20,96
Values of these coefficients also confirm gradual incerease in concentration level in Serbian
retail market during the observed period. However, the main defect of the coefficient is that it does not take into account all the com-
panies that are doing business activities in the certain market, as well as participation dispersion of all participants. The coefficient only shows total market share of four, six or eight biggest companies. Also, market shares of other companies, that are not included in the caluculation, have the influence on offer concentration. The problem can be solved if greater number of companies is included, but therefore the index calculation simplicity will be disturbed.
Research results (Stojanović, Stanišić and Veličković, 2010, pp.57-66) within the Project-Development of competitive advantage in Serbian trade companies (2009) showed that the non-specialized retail market in Serbia is farther away from perfect competition theory model. Based on the realized research in 2009, the conclusion is reached that 15 big retail companies control more than one third of the market. According to certain criteria in concentration measuring, it can be proved that the non-specialized retail market has characteristics of oligopoly market, e.g. ``loose oligopoly``. Concentration coefficient value for non-specialized retail market is significantly greater and in the last few years its value is around 30 %. If the tendency continues, it is expected that Serbian retail market becomes moderate concentrated market.
Based on some results of retail market research in Croatia (http://www.icei.epk.ba/admin-/dokumenti/4107%20MARIJAN%20KARIC.pdf) similar conclusion can be drawn. In 2009, concentration level showed that four biggest retailers in Croatia took about 44% of market share, which is significantly higher than previous years. Based on the comparative analysis results of the Serbian and Croatian retail market research, it can be concluded that these are monpolistic, competitive markets.

REDETE – ECONOMIC DEVELOPMENT AND ENTEREPRENEURSHIP IN TRANSITION ECONOMIES
564
Also, certain research results showed that the concentration level is significantly greater in the specialized retail market comparing to the total retail market in Serbia. If we take as a re-levant market specialized goods market in Belgrade`s area, concentration measuring results showed significantly higher concentration index (even about 50%). Therefore, in 2006 four biggest retailers (Delta, Merkator, Rodić, Idea) covered together around 51% of relevant market.
3. Competition protection in Serbian economy
Institutionalization of competition protection in Serbia started in 1996, by enacting the anti-monopolistic law. Till 2005, competition protection problem was dealt by Anti-monopolistic De-partment with Ministry of Economy, tourism and services. Intensifying the oligopoly process in numerous economy segments, contributed to the necessity of efficient institutionalization of com-petition protection in Serbian market. Therefore, a new law on competition protection is adopted in 2005. The law précised forming the Commission which was authorized to prevent cases of competition disturbance, dominant position abuse and restrictive (cartel) agreements. By adopting the competition protection law in 2009, competition protection policy is at great extent adjusted with EU regulations in the field. The law prescribes that competition protection commission is within the competence for determining the competition violation and establishing the measures for its elimination.
Strengthening of the market power of companies, oligopoly and cartel processes of numerous segments of Serbian economy speaks volumes about the insufficient efficiency of competition protection in Serbia. The statement relates to all branches of industry, as well as to the trade. Ma-ny economist experts stress that involvement of politics in competition protection sphere, is the main reason for different analyses on the concentration level given by experts and the Commi-ssion representatives. The example of such divergence is retail sphere in Serbia: while the Commission started the proceedings against company Danube Food Group and tried to impose a ban on buying Hellenic Sugar by foreign company Sunoko, circles proved that foregoing com-panies do not disturb the competition. (Stojanović, Radivojević and Stanišić, 2012, pp.129)
Illustration of competition state in Serbian retail market is enacting the Regulation on margins restrictions applied on basic life necessities. If greater competition had existed in the market, the margin would have been formed within normal limits, therefore Regulation enactment would be unnecessary. This implies that the State had to apply intervention measure (margins restrictions for basic life necessities), by which the State indirectly influenced retail prices formation, since the instruments for competition protection policy were not efficient. The stated Regulation had negative effect for the small retailers, since their business is directly linked to mentioned margin.
It is obvious that Serbia is losing pace with creating law basis and adequate institutions for competition protection. In order that the competition protection policy to be efficient in all busi-ness segements, it is necessary to improve appropriate law regulation and institutions, but also it is necessary to eliminate political preasures.
In competition protection domain, positive actions have been taken but at the same time some good solutions are lacking. Such a positive step forward presents significant base limit increase which is the obligation to announce the concentration. On the other hand, the Law omitted appli-cation of the hypothetical monopolist test in defining the relevant products market and relevant geographical market, as well as the application of concentration test by Herfindahl Hirschman Index. (Maksimović and Radosavljević, 2012, pp.179-199) These deficiencies make possible for the analyses of concentration level in the certain market given by the different analysts to be contradictory. The fact brings to expensive, long-lasting and confusing court proceedings between the Comission and companies which by their activities limited significantly the competition.

REDETE – ECONOMIC DEVELOPMENT AND ENTEREPRENEURSHIP IN TRANSITION ECONOMIES
565
4. Limitations in research of concentration level in retail market
In competition research in Serbian retail market there are numerous limitations. Firstly, access to certain data on trade companies turnover is denied. Respectively, the data which can be obtained with The Serbian business registers agency, Statistical office of the Republic of Serbia, Solvency centre of the National Bank of Serbia, Administration of public revenues are limited. Secondly, trade companies are registered for one type of business activity but they realize their profit by performing other activities as well. These companies are listed according to one activity code and this does not represent their core activity. Thirdly, there are limitations in defining the relevant market based on different criteria and also there are limits in calculating the participants market share in the observed market. One can obtain needed data only by combining the available data and estimated approximations. Based on this, we can conclude that in research of concentra-tion level in Serbian retail market we can find many limitations and difficulties in calculating important indexes for market concentration.
Conclusion
Analysis of work showed that trade concentration in Serbia has tendency of increase. Accor-ding to the trends in the developed countries, can be concluded that retail concentration will continue through acquisitions, strategic connecting and such like. These will be influenced by business interests, and aspiration of market participants to realize better performances. On one side, concentration can positively influence strenghtening of retail in the market, on the other side it can influence and cause an abuse of the dominant position and competition restrictions.
Serbian aspiration to join European integration processes is conditioned by harmonization and coordination between competition protection policy in Serbia and competition policy in EU. However, recent experiences in realization of competition protection policy in Serbia, tell us what is necessary: improvement of competition regulation and implementation into the law framework and improvement of regulation of economic analysis of concentration level. Introducing concentration test by Herfindahl Hirschman Index into the law frame, this would contribute to more objective estimation of concentration level and more sucessful implementation of measures for competition protection.

REDETE – ECONOMIC DEVELOPMENT AND ENTEREPRENEURSHIP IN TRANSITION ECONOMIES
566
Reference list
1. Đuričin, D., Lončar, D., Rajić, V., (2008), Merenje koncentracije tržišta:primer sektora preh-rambene maloprodaje Beograda, Kopaonik biznis forum, Savez ekonomista Srbije, Beograd
2. Freathy, P., 2003, The Retailing Book:Principles and Aplications, Prentice Hall 3. Karić, M., Kristek, I., Komparativna analiza koncentracije maloprodajnog tržišta u Republici
Hrvatskoj i Evropskim zemljama (http://www.icei.epk.ba/admin/dokumenti/4107%20MARI-JAN%20KARIC.pdf)
4. Leknes, M.H., Carr, C., (2004), Globalization, International Configurations and Strategic Implications: The case of Retailing, Long Range Planning, 37(1), pp.29-49
5. Maksimović, Lj., Radosavljević, (2012), Mikroekonomska teorija kao osnova politike za zaštitu konkurencije, Srpska politička misao, 19(36), Beograd, str.179-199
6. Radosavljević, G., Maksimović, Lj., Borisavljević, K., (2011), Development of retail market in Serbia, Perspectives of Innovations, Economics and Business, 9(3), pp. 48-52.
7. Statistical Yearbooks, Office for National Statistics, 2011 8. Stojanović, B., Radivojević, V., Stanišić, T., (2012), Institucionalne pretpostavke efikasnosti
zaštite konkurencije, Ekonomski horizonti, 14(2), str.l21-131 9. Stojanović, B., Stanišić, T., Veličković, M., 2010, Problem zaštite konkurencije u trgovini na
malo u Srbiji, Škola biznisa, Niš, str.57-66 10. www.emportal.rs

REDETE – ECONOMIC DEVELOPMENT AND ENTEREPRENEURSHIP IN TRANSITION ECONOMIES
567
PODLASIE BUSINES ACTIVITIES ON THE EXAMPLE OF THE COMPANY „SAMASZ”
Magdalena ICKIEWICZ-SAWICKA270
Abstract
This article describes the activities of traders on the example of Podlasie's "SaMasz". The text consists of an introduction and four substantive parts, along with the final conclusions.
The first part contains a theoretical discussion of entrepreneurship. Entrepreneurship is the most positive sense of self destructive process, because new ideas to attract imitators who are saturating the market to eliminate short-term profits, new entrepreneurial activities, destroying old markets and provide new products, great value for buyers. Entrepreneurship is the foundation and prerequisite for innovative economic development, improving the life of society and individual wealth. Provides revenue growth of population, and especially entrepreneurial. The second part of tne article develops the concepts initiated by subjecting them to a deeper analysis named: Entrepreneurship - selected theoretical constructs One of the described conce-pt is that, entrepreneurship is a characteristic action to ensure rational and effective coordinati-on of economic resources of the company. In practice, the concept of entrepreneurship is un-derstood as a form of work or as a fourth (in addition to labor, land and capital) factor of production. The main features of traders are primarily the ability to see needs and improve the ideas, the ability to grasp opportunities to use and willingness to take risks The third part of the article presents the work of the Entrepreneurship and Innovation in the Podlasie region.
In the last, the fourth part of the text has been described and undertaking "Shamash" as an example of local entrepreneurship, which, without complexes compete with other larger centers on Polish territory, developing not only a national but also an international sales network. Firms Partner Network SaMASZ includes 70 companies in Poland, retail and more than 50 companies abroad (Germany, Austria, Lithuania, Latvia, Estonia, Great Britain, Denmark, Finland, Russia, Belarus, Spain, Czech Republic, France, Iceland, Saudi Arabia , Croatia, Slo-venia, Slovakia, Italy, Greece, Iceland, Australia, Mexico, Norway, Spain, Sweden, Uruguay, Hungary, Romania, Ukraine, Albania, New Zealand, Belgium, Bulgaria, the Netherlands, Japan, Uganda, Panama, Kazakhstan, Iceland, South Korea, Algeria.
This information are evidence of that the local company can be highly developed agricultu-ral machinery manufacturing industry, the cooperation between them and the proximity of the eastern markets. Generally the eastern region of Podlasie, despite stereotypical and often pe-joratively marked by role, area of peripheral and largely rural nature has considerable growth potential, which should be observed by both local and central decision-making bodies.
Keywords: Podlasie region, economic development, entrepreneurship, innovation, local business
270 Tehnical University of Bialystok, Department of Economics and Social Sciences , Faculty of Management , Tarasiuka
Srteet 2 , 16-001 Bialystok-Kleosin, e-mail: [email protected]

REDETE – ECONOMIC DEVELOPMENT AND ENTEREPRENEURSHIP IN TRANSITION ECONOMIES
568
Introduction
Podlasie is a historical region extending to the Polish Podlasie Lowland, covering the southern part of the Podlasie region and the northeast and north region of Lublin. In this text the term Podlasie area will be understood within the present region of Podlasie.
The rest of the country is treated as a green land of Podlasie (also known as green lungs Polish), the last place of the original European forest, a kind of museum of Polish-Belarusian border. Very rarely Podlaskie is identified as an area of modern, innovative, open to change. The reasons for this stereotypical perception of Podlasie has to be sought in the history of the region, which for centuries was seen as a periphery of Western civilization and culture, and extremely backward farming, in other European granary and a source of cheap labor. This image was captured Podlasie and continues to this day, rarely is positively verified. In this ar-ticle we will present examples of the Podlasie economic initiatives, contradict the above ste-reotype.
In the region of Podlasie are the following companies (selection): The company "Bartosz" - Bialystok, Company "Shamash" - Bialystok, Polmos - Bialystok, Company "Metalfach" – Sokół-ka, Company "Steller" - Sokółka, factory windows - Sokółka, company "Pronar "- Narew Podla-sie province), Company" POM "- Augustow, Company" Kruszbet "- Suwalki, Company" Caesar 1 "- Elk, Company" Pfefander "- Ghaziabad, Company" Litpol "- Suwalki, Company" Malow "- Suwalki, Company" Unihause "- Bielsk Podlaski, company" Hamech "- Hajnówka, Company" PSS "- Lomza, Company" PSS "- Bialystok.
The above description indicates that the Podlasie companies specialize in certain fields of activity. Among these should be distinguished food industry (especially the processing of milk - a cluster of companies creating Podlasie dairy. The definition of an industrial cluster is as follows: Industrial cluster (called cluster, a bunch of other names, the light industries, the local production system, the pole of competence) - spatially concentrated group of companies, institutions and or-ganizations connected network of vertical and horizontal relationships, often of an informal nature, which by focusing specific resources can be achieved these enterprises sustainable compe-titive advantage. Industrial cluster concept was formulated by American economist Michael Porter, a precursor for her to be regarded British economist Alfred Marshall (A. Marshal, Princi-ples of economics: an introductory volume, London 1920, http://exam.pp22.cn/ Articles/Up-load/20051009211733609/THE PRINCIPLES OF ECONOMICS.pdf, M. Groszkiewicz, Clusters Podlaskie http://www.adam-europe.eu/prj/4471/prj/Klastry% 20woj.% 20Podlaskiego.pdf, acesed 04.28.2012, the Internet source, see the bibliography). Podlasie specific production are also agricultural (production of agricultural machinery and equipment), wood processing, clothing (especially lingerie industry), etc. This review shows that entrepreneurship is growing in Podlasie creating a thriving industrial plants with a diversified nature.
Entrepreneurship - selected theoretical constructs
The term "entrepreneurship" first appeared in the late eighteenth and early nineteenth century, with the accelerated economic development in the form of the industrial revolution and the pioneering period of capitalism. Then also initiated research on the development of entreprene-urship in the context of science. It was connected with the emergence of new forms of manage-ment, management and economization of social life, through the appropriate use of the potential capital, technical, raw material and human. However, the allocation of capital accompanied by a fairly significant investment risk. On the one hand, it meant the possibility of getting rich quick in the form of high returns, on the other hand was associated with an equally high degree of risk lea-ding to the collapse and even bankruptcy of the company. This period is commonly called the period of "wild capitalism". Entrepreneurship has been explained in the work of economic and

REDETE – ECONOMIC DEVELOPMENT AND ENTEREPRENEURSHIP IN TRANSITION ECONOMIES
569
social representatives of liberal thought. With its precursors shall be: A. Smith, JB Say, and J. Schumpet (Potocki, 2007, p. 113, Glinka B., Godkova S , 2011, pp.5-10). and entrepreneurship is contemporary exponents: M. Crozier, PF Drucker, RM Kanter.
The first one (Crozier) argues that entrepreneurship is an art of conducting a good calculation, reducing the risk of business undertaken. The second, in turn, points out that entrepreneurship is the interdependence of entrepreneurial and innovative activities that lead to success. Any changes should be introduced gradually and should be flexible to respond to needs. RM Kanter points out that management understands the entrepreneurial flexible organization, able to minimize costs by reducing the levels of management (Potocki, 2007, p. 113). B. Wawrzyniak combines entrepre-neurial and management with an active response to globalization, requiring managers learn new skills (Potocki, 2007, p. 113) and abilities. General theories of entrepreneurship have evolved over the years. From the twenties of the previous century to contemporary times.
Kinght Frank H. (1921), he stated that the advantage of intercourse, the abolition of uncertainty and risk. Joseph A. Schumpeter (1934), and defined entrepreneurship as carrying out new combi-nations in the organization of the company (new products, new services, new sources of raw materials, new production methods, new markets, new organizational structures). Hostelitz HB (1952), argued in turn that entrepreneurship is the coordination of productive resources and innovation. A. Cole (1959) identified entrepreneurship as an intentional act leading to the deve-lopment of a business that generates maximum profits. McClelland and M. Casson (1961), in turn, drew attention to the fact that entrepreneurship is associated with a moderate risk-taking and the ability to make decisions and coordinate the management of scarce resources.
The eighties of the twentieth century created a new management science theories of entrepre-neurship, basing them on the ability to create new organizations (W. Gartnet -1985), and finding new opportunities regardless of resources currently managed (HH Stevenson, MJ Roberts and HI Grousbeck -1989)- (Borowiecki, Jaki, 2010)
The nineties of the twentieth century is a continuation of the search of novel solutions in the science of management and entrepreneurial determination. Kamil Janus (1992) proposed the introduction of the described concept of the new philosophical and cultural experience, and has included the theory of games involving the statutory accounts of Mathematics and Physics. The Hart MM, HH Stevenson and J. Dail (1995) - (John R. Schermerhorn, 2008) identified entre-preneurship as the search for new opportunities regardless of resources currently managed, however, limited by earlier decisions of the owners.
The variety of definition of entrepreneurship shows that this concept is continuous change and modification, thus consuming the basic assumption namely continuous innovation. The present study used an expanded definition proposed by A. Isachsena entrepreneurship and C. Hamilton. According to its creators, "entrepreneurship is an economic" pulse "of society, which measures the rhythm and how to meet your needs. Entrepreneurship ensure that economic decisions can be coordinated in accordance with the best interests of market participants. This is because the economic man, as a consumer, knowing price levels and personal income, is guided by the highest utility, and economic man as a producer, knowing the price levels and its own production capacity, committed to the highest possible profit using their resources efficiently (Koch, 1997).
Entrepreneurship is the most positive sense samoniszczącym process, because new ideas to attract imitators who are saturating the market to eliminate short-term profits, new entrepreneurial activities, destroying old markets and provide new products, great value for buyers. Entrepre-neurship is the foundation and prerequisite for innovative economic development, improving the life of society and individual wealth. Provides income growth of the population, particularly enterprising (Koch, 1997, p.15)

REDETE – ECONOMIC DEVELOPMENT AND ENTEREPRENEURSHIP IN TRANSITION ECONOMIES
570
Entrepreneurship - characteristics of the concept
Entrepreneurship - a characteristic action to ensure rational and effective coordination of economic resources of the company. In practice, the concept of entrepreneurship is understood as a form of work or as a fourth (in addition to labor, land and capital) factor of production. The main features of traders are primarily the ability to see needs and improve the ideas, the ability to grasp opportunities to use and willingness to take risks (Bellow B.., 2011 pp. 10-20 ,Encyklopedia PWN,: http://encyklopedia.pwn.pl/haslo.php?id=3963281, accesed 28..04.2012, the Internet source, see the bibliography).
Entrepreneurship is a key driver of economic activity in each country. It can be defined as a set of innovative behavior, based on the ability to recognize the needs of the environment and the ability to grasp opportunities to use and bear the market risk associated with their implementation. It is objective in nature and is characterized by creativity and the creative nature of the means (Grzegorzewska - Mischka, Wyrzykowski, 2009, Christiensen C, 2011).
Entrepreneurship should be viewed in two dimensions: the first is entrepreneurship as a process, the second is a set of characteristics that determine the specific activity. The process is presented as an act of creating and building a new company. In this context, entrepreneurship is a structured process-oriented activities under the circumstances to use innovative ideas to generate market advantage. In our process of building the essential features are manifested in the form of the ability to use innovative ideas and take risks in implementing their (Janowski, 1998).
Entrepreneurship in the context of traits indicates the following characteristics: dynamism, activity, ability to adapt to changing conditions, perceptions of opportunities i use (innovative and motor activity), and the propensity to take risks (Janowski, 1998, pp.10-20)
In summary entrepreneurship is characterized by expansiveness (the pursuit of ambitious goals, generating benefits) and innovation (the introduction and continuing to seek creative solutions to modernization) - (Janowski, 1998, pp.10-20)
Entrepreneurship is also a way of conduct involving the willingness to take new, risky and unconventional tasks, and the continual demonstration of initiative in seeking and implementing them into practice. The nature of the activity is directed at the development, features a innovative way. This way of understanding the business, refers to its economic dimension understood as: the creation of more efficient forms of organization, introduction of new factors of production, the acquisition of new markets and supply and the introduction of new wyrobów (Kortan, 1997, pp. 77-78).
The concept of establishment shall include the personal characteristics of a man's mental con-ditioning to be a good entrepreneur, that is achieving success in managing the company (Marek, 1998, p.28). Entrepreneurship is an individual characteristic of the human personality, distingui-shed by intelligence, innovation, ability to see the conditions and the relationship between eco-nomic phenomena and the ability to organize activities of commercial, industrial and service provider revenue advantage over the cost of obtaining (Marek, 1998, s. 28)
Entrepreneurship is the novelty consists in looking for differences, finding more efficient ways of doing things in the market, offering the higher utility of the products and services and greater economic efficiency. It is by nature a competitive activity, in relation to the conduct of other companies (Fabiańska, 1986, s. 20-30).
The places of occurrence are primarily entrepreneurial businesses but also households, govern-ment agencies, generally the entire market. Summarizing the above considerations entrepreneur-ship is an innovative (see more: Trompenaars Alfons, 2012), creative and innovative way of doing business.

REDETE – ECONOMIC DEVELOPMENT AND ENTEREPRENEURSHIP IN TRANSITION ECONOMIES
571
The Entrepreneurship and Innovation in Podlasie
The Entrepreneurship and Innovation (Entrepreneurship and Innovation Programme) is one of the programs implemented under the Framework Programme for Competitiveness and Innovation Programme (CIP). This program is supported by the European Commission and is a tool to support innovation and SMEs in the EU.
The main objectives of the program are in particular: 1) Facilitating access to financial resources to establish and develop business and encourage 2) Investment in innovation activities; 3) Creating an environment favorable to cooperation between SMEs, in particular at the level
of cooperation; 4) Promote all forms of innovation in enterprises; 5) Promoting eco-innovation; 6) Promoting a culture of entrepreneurship and innovation; Support the economic and
administrative reform of enterprise and innovation (Podlaski Fundusz Przedsiębiorczości, http://www.pfp.frp.pl/index.php?option=com_content&view=article&id=110&Itemid=138, accesed 2.05.2012, the Internet source, see the bibliography, see more: Jóźwik, Sagan, 2012).
In summary, the program will also serve policy makers to provide support through the disse-
mination of research results on the latest trends and developments in various economic sectors, as well as European and global markets.
The construction company as an example of the company "Shamash"
Enterprise "SaMasz" under Polish regulations on economic activity (Article 106 of the Act on Freedom of Economic Activity), is a medium-sized enterprise (see more: Adamik, 2011), and the average entrepreneur is the one that at least one of the two most recent fiscal years: employ fewer than 250 employees and an annual net turnover from sales of goods, products and services and financial transactions not exceeding the PLN equivalent of EUR 50 million and the total assets of the balance sheet at the end of one of these two years not exceeding the PLN equivalent of EUR 43 million.
The company is a separate legal, organizational and economic entity engaged in economic activity. Frequently defined goal of the company is to achieve a profit by satisfying consumer needs. It may include more or less distinct entities, called plants. The company has an economic self-reliance, and can have legal personality.
On the basis of the Civil Code, the company organized a team of intangible and tangible assets intended for economic activity (Article 551 of the Polish Civil Code) - (Articles 104-106 of the Polish Act of 2 July 2004 on freedom of economic activity).
It includes in particular: 1. Individuating mark the company or its separate parts (name of company);
2. Immovable or movable property, including equipment, materials, goods and products, and other
3. Rights in rem in immovable or movable property;
4. Rights under the lease agreements and lease of real estate or chattels;
5. Claims, the law on securities and cash;
6. Concessions, licenses and permits;
7. Patents and other industrial property rights;
8. Economic rights and property related rights;

REDETE – ECONOMIC DEVELOPMENT AND ENTEREPRENEURSHIP IN TRANSITION ECONOMIES
572
9. Business secrets;
10. Books and documents relating to the conduct of economic (Articles 104-106 of the Polish Act of 2 July 2004 on freedom of economic activity).
The functioning of the undertaking will be presented as an example of the company "Shamash"
from Bialystok. The company was founded in 1984 by engineer Antoni Stolarski and at first it was a car repair shop located on the street Kirkor in Bialystok. Soon created the first machine designed and built by the owner, it was a potato digger elevators, and even in the same year is started production and is sold 15 copies of the diggers. After a few months the plant already employed 5 employees.
Then in 1986, is designed first mower, at the same time continued sale diggers (90 pieces). From 1984 to 1988, leaving a total of 267 plant diggers. In addition, in 1988, the firm employs 12 people, with the offer of both diggers and drum mowers.
In 1991, the plant will be moved to the street grass, and in 1994 SaMasz 1417 launches mowers and international cooperation begins sending its products to Germany. A year later, the production increased to 2,704 mowers and Fricke has become a major trading partner of SaMasz.
In 1996, he will be put into operation a new office building, and the company introduces new products are new drum cultivator mowers with conditioner; sale goes back to 3390 lawnmowers, of which 44% of production is exported. Then, in 1998, the company offer shall be increased by mowers and export sales already exceed 60% of total production. In 2000, the company continued to expand its operations, adding to the offer mowers front, drum and disc.
In 2001-2002, exports of SaMasz exceeds 57% and is continuing to expand its commercial mowers for another. There are also new foreign customers. It begins with the cooperation with Russian companies. At the same time, to have a wide range of lawnmowers, join mowers with roller conditioner for legumes, the company also introduced the flail mowers on the market.
In 2004, the company celebrated its twentieth anniversary SaMasz existence. Then export already reached 68% of total production. In addition, the plant received ISO 9001 certification and certification for Russian mowers. In 2007, the company introduced a new generation of disc mowers are characterized by the strongest and most durable on the market-sided blade. This year there is a new foreign partner Finland, which is the second largest export market after Germany. Firms Partner Network SaMASZ includes 70 companies in Poland, retail and more than 50 companies abroad (Germany, Austria, Lithuania, Latvia, Estonia, Great Britain, Denmark, Fin-land, Russia, Belarus, Spain, Czech Republic, France, Iceland, Saudi Arabia , Croatia, Slovenia, Slovakia, Italy, Greece, Iceland, Australia, Mexico, Norway, Spain, Sweden, Uruguay, Hungary, Romania, Ukraine, Albania, New Zealand, Belgium, Bulgaria, the Netherlands, Japan, Uganda, Panama, Kazakhstan, Iceland, South Korea, Algeria.
Another year of the company is further enhanced products enriching the already existing production capacity (the plant has already launched the 50,000 mowers).
In 2009 there was a reorganization of the distribution network in Poland, the effect was to reduce by half the number of trading partners, which in turn resulted in a significant increase in sales on the Polish territory (20% compared to the previous year). SaMasz has also established cooperation with Metalfach - Sokółka. The result was the debut of the two companies to the largest exhibition of agricultural machinery in the world - AGRITECHNIKA Hannover 2009.
As shown in the above information, the company SaMasz through continuous investment in modern machinery and highly qualified engineering team achieved the position of the largest Polish and one of the leading European manufacturers of agricultural machinery and utilities, and snow plows to Currently, the company offers about 120 different types of machines: drum mower, disc, tedder, rake, flail mowers, boom mowers ands now plows.
Continuous development of new products is confirmed by the plant. Virtually every season are introduced to the market new designs. However, the main product of the company SaMasz are all kinds of mowers. Since its inception, the company has produced and sold more than 75 000

REDETE – ECONOMIC DEVELOPMENT AND ENTEREPRENEURSHIP IN TRANSITION ECONOMIES
573
mowers and several thousand other agricultural machinery. The offer also includes utility machi-nes and plows.
The company provides its clients a comprehensive service and mail-order sales of spare parts, offering the only manufacturer in Europe, a two-year warranty on mowers. Moreover, according to industry estimates, the company SaMasz manufacturers of agricultural machinery in the Podlaskie generates annually from the export of over 300 million PLN. The financial success of the company contribute to the increase in employment and decrease in unemployment in the territory of Poland. Podlaskie and effectively promote the region. At the same time successive cooperative partnership with five other (local) companies, has resulted in the creation of 60 jobs.
Cooperation and Promotech SaMasz company has also led to the transfer of cooperative relations between them. Another of the company have been associated with the purchase of state-owned BPIE, its modernization and the start of production. In the newly created department organized more than 100 new jobs, with earnings of emerging national average. At that time, there was also significant growth in international transport providers and companies SaMasz. Quality of products described plant equal quality to products of world renowned brands and thus Podlasie farmers gained access to high-quality equipment at a very attractive price (50-60% cheaper compared to the offer from Western countries).
All of the above information on the company, "SaMasz" comes from a presentation entitled "Trade Podlasie province after the accession to the European Union - the presentation of export activities" by Karol Wdziękoński - not published, which is the property of the company.
In general, as emphasized by both employees and managers of the shaman, the source of the success of the company is to maintain a high quality of production and services. Create a high quality and successful products, effective management and top-class specialists operating new technologies.
Unfortunately, the stereotypical perception of the Podlaskie region as service and tourist region is not conducive to the zone qualifying him modern industry and innovation center. Still, the region's development strategies (provincial and local government) do not take this point of view, and there are increasing efforts to promote Polish (Podlasie) products sales broader markets.
Therefore, there should be a more effective system of co-Podlasie business trips to interna-tional fairs and business missions. In addition, the promotion of entrepreneurship Podlasie should also include a meeting organized by the Ministry of Agriculture or other state authority with rep-resentatives from Africa, Asia or South America. This action would enhance the competitiveness and efficiency of Podlasie entrepreneurs.
Sumarry (Conclusion)
Summarizing the above considerations should be explicitly stated that the development of entrepreneurship and business Podlasie inhibit the following barriers:
1. None of the required road infrastructure,
2. No local airport,
3. Geographical location away from the more industrialized regions.
4. Competition (instead of cooperation) between manufacturers in the industry,
5. Poor image of the region - the eastern wall is associated mainly with rural tourism,
6. Lack of qualified engineers capable of innovation - to develop closer cooperation with the technical universities,
7. Unstable Euro exchange rate (Conclusions drawn also from a presentation entitled "Trade Podlasie province after the accession to the European Union - the presentation of export activities" by Karol Wdziękoński).

REDETE – ECONOMIC DEVELOPMENT AND ENTEREPRENEURSHIP IN TRANSITION ECONOMIES
574
On the other hand, a chance for the Podlasie companies can be highly developed agricultural machinery manufacturing industry, the cooperation between them and the proximity of the eastern markets. Generally the eastern region of Podlasie, despite stereotypical and often pejoratively marked by role, area of peripheral and largely rural nature has considerable growth potential, which should be observed by both local and central decision-making bodies.
Bibliography:
Book references:
1. Adamik A. (2011), Kształtowanie konkurencyjności i przewagi konkurencyjnej małych i średnich przedsiębiorstw, C. H. Beck
2. Bellow B.R., (2011), Przedsiębiorczość, pp. 10-20 3. Glinka B., Godkova S (2011)., Przedsiębiorczość, pp.5-10 4. Borowiecki R., Jaki A. (2010), Restrukturyzacja w obliczu nowych wyzwań gospodarczych,
Kraków. 5. Godlewska- Majkowska H.(2011), Atrakcyjność inwestycyjna przedsiebiorstw w Polsce,
pp.120 6. Grzegorzewska–Mischka,Wyrzykowski W.(2009), Przedsiębiorczość, przedsiębiorca,
przedsiębiorstwo, Bookmarket. 7. Christiensen C.(2011), The innovators dilemma: the reductionary book that will change the
way you business, pp. 12 -20 8. Janowski A. (1998), Słownik ekonomiczny, Kraków. 9. Jóźwik B., Sagan M. (2012). Rozwój Polski Wschodniej: ograniczenia i wyzwania, Difin 10. Koch R. (2007), Słownik Zarządzania i Finansów. Narzędzia, terminy ,techniki od A do Z,
Kraków, Wydawnictwo Profesjonalnej Szkoły Biznesu. 11. Schermerhorn J. R., (2008), Zarządzanie. Kluczowe koncepcje, Warszawa, Polskie
Wydawnictwo Ekonomiczne. 12. Trompenaars A. (2012), Kultura innowacyjności: kreatywność pracowników źródłem sukcesu
firmy, Wolters Kluwer Business.
Articles references:
13. Kortan J. (1997), Podstawy ekonomiki i zarządzania przedsiębiorstwem, C. H. Beck, Warszawa, pp. 77 - 78.
14. Marek S. (1998), Podstawy ekonomiki przedsiębiorstw, Zrzeszenie Studentów Polskich, Szczecin, pp. 28.
15. Potocki A. (2007), Podstawy zarządzania przedsiębiorstwami w gospodarce opartej na wiedzy, Warszawa, pp. 113.
Internet sources:
16. Encyklopedia PWN, hasło przedsiębiorczość: http://encyklopedia.pwn.pl/haslo.php?id=3963281 accesed 28.07.2012.
17. Groszkiewicz M., Clusters Podlaskie http://www.adam-europe.eu/prj/4471/prj/Klastry% 20woj.% 20Podlaskiego.pdf, accesed 04.08.2012
18. Makieła Z., Szromnik A. (2012) Miasto innowacyje: wiedza, przedsiębiorczość, marketing, http://skpzk.czasopisma.pan.pl/84-studia-kpzk/wydania/247-no-142-2011, accesed 04.08.2012.

PART SEVEN:
Government And Economic Development, Government Policies

REDETE – ECONOMIC DEVELOPMENT AND ENTEREPRENEURSHIP IN TRANSITION ECONOMIES
576
APPLICATION OF PRINCIPAL COMPONENT ANALYSIS IN MONITORING INDEBTEDNESS AND EVALUATION
OF CHANGES IN PUBLIC DEBT IN BIH
Branka TOPIĆ-PAVKOVIĆ271 Darko MILUNOVIĆ272
Abstract
In the last two years, the tendency of growth of public debt is present in most of the countries worldwide. Issue of public debt was highlighted in the current global financial crisis. The bi-ggest world economies - the United States and European Union have a high rates of debt and low growth rates of GDP. The problem of public debt has in particular escalated in the Euro-pean Union, where the current hot spots greatly affect the stability of the European Monetary Union, which shows the consequence of growth of public debt.
In times of crisis government revenues are reducing and expenditures continues to increase. This is due to several reasons: rising unemployment, increasing demands for fiscal incentives, rising interest rates, low growth rates of GDP which all increasing deficit, and thus the growth of public debt. History shows that different economies differently cope with the debt burden - sometimes a crisis can occur at low share of public debt to gross domestic product, while some national economies function well even if their debt exceeds the value of gross domestic product. In Bosnia and Herzegovina macroeconomic indicators have similar trends as in the neighbor countries in Europe, mostly due to crisis. Public debt in past two years in Bosnia and Herzego-vina has also tendency of growth, indicating importance of continuous analysis and evaluation of changes in public debt in B&H.
In our research we used statistical methodology. First we have, based on principal compone-nt analysis, to separate the most important factor (we selected three the most important indica-tors), and then we are using multiple correlation analysis to describe the relationship of the re-levant factors and ratios determining the level of the public debt. Level of the public debt and indicators of indebtedness are monitored in the period right before current crisis and during crisis period.
The specificity of the public debt management in Bosnia and Herzegovina reflects in the ina-bility to use active monetary policy and exchange rate policy, since monetary policy in BiH is based on the principles of the monetary board. Given the above, the dominant segment in the management of public debt belongs to the fiscal policy. In the current debt crisis a question of public debt took a significant place. The importance of public debt indicators is highly useful as some of the most significant ones indicates the possibility of servicing the debt. The analysis of these indicators in Bosnia and Herzegovina will describe the current and future tendency of debt growth and hence, possibility of servicing the debt.
Keywords: public debt, indicators of indebtedness, principal component analysis, multiple regression analysis
271 University of Banja Luka, Faculty of Economics, e-mail: [email protected] 272 University of Banja Luka, Faculty of Economics, e-mail: [email protected]

REDETE – ECONOMIC DEVELOPMENT AND ENTEREPRENEURSHIP IN TRANSITION ECONOMIES
577
1. Introduction
In this paper we study the indicators of indebtedness as a determinant factor of debt sustain-nability analysis. In the last two years, the tendency of growth of public debt is present in most of the countries worldwide. The biggest world economies - the United States and European Union have a high rates of debt and low growth rates of GDP. The problem of public debt has in parti-cular escalated in the European Union, and greatly affects the stability of the European Monetary Union, which shows the consequence of growth of public debt. Issue of public debt is directly related to budget deficit. The deficit in the balance of payments occurs in response to temporary shocks, inflow of foreign savings and a reflection of the budget deficit and imbalance of savings and investment in the private sector (Rosen and Gayer 2009).
In our research we will give a theoretical overview of the concept and forms of debt, as well as debt management significance. We will classify indicators of indebtedness according to the main macroeconomic parameters.
Our main goal is to present the main indicators of indebtedness and current trends in terms of public debt in our country. We focused on the movement of the level of public debt, at a certain fixed values and independent variables. Debt management in BiH is based on projections of key macroeconomic indicators and analysis of public debt sustainability through indicators of indebtedness. After the theoretical part we used statistical methodology. First we have, based on principal component analysis, to separate the most important factor, and then we are using multi-ple correlation analysis to describe the relationship of the relevant factors and ratios determining the level of the public debt. Level of the public debt and indicators of indebtedness are monitored in the period right before current crisis and during crisis period.
2. Theoretical basis and conceptual framework
2.1. Concept and characteristics of public debt
One of the most important objectives of the macroeconomic policy is the achievement of sustainable economic growth, together with the presence of price stability and foreign trade balance (Laurens and Piedra, 1998). In times of crisis government revenues are reducing and ex-penditures continues to increase. This is due to several reasons: low growth of GDP, rising unem-ployment, increasing demands for fiscal incentives, rising interest rates which all increasing de-ficit, and thus the growth of public debt. Thus, the optimal management of public debt is affected by the economic policy instruments - fiscal, monetary and exchange rate policy, as well as debt sustainability analysis. The debt is the total amount due at a particular time, or the sum of all pre-vious deficits. Accordingly, in the year in which the deficit grows the level of the debt increases, and in the year in which there is a surplus, debt is reduced. In terms of time, the debt situation is variable, and the deficit or surplus has variable flow. Public debt can be financed by fiscal policy (taxation); borrowing in the domestic financial market (borrowing from banks or issuing securities and bond values between the home market) or on international financial market (borrowing from financial institutions or issuing securities in foreign debt capital markets denominated in other currencies) or the sale of assets (revenues from privatization).
Depending on the source of funds, public debt can be internal and external. Internal debt is the amount that the state owes to its citizens. The internal debt does not create a burden for future ge-nerations. Members of future generations simply owe to each other (Lerner, 1948). External debt is the amount that the state owes to foreigners. The internal state loans, opposed to external bo-rrowing, do not increase the supply of funds available to the group as a whole (Musgrave, 1973). Borrowing allows the import of real resources and thus the state provides additional equipment

REDETE – ECONOMIC DEVELOPMENT AND ENTEREPRENEURSHIP IN TRANSITION ECONOMIES
578
without the immediate reduction in funds for other purposes, for consumption, or the accumu-lation. The realization of the opportunity costs are deferred when the debt is repaid, thus causing an outflow of funds at that time. The burden of debt is going to burden future generations to pay or refinance debt.
Budget deficit arises because of the structural nature (finance project costs), cyclical move-ments (stimulating the economy in decline phase) and political nature (increased spending before the election). The deficit in the balance of payments occurs in response to temporary shocks, inflow of foreign investments, and imbalances in of savings and investment in the private sector (Rosen and Gayer 2009). Financing of public spending through borrowing is justified if it contri-butes to future taxable income, and if it comes to overcoming the problems of the current deficit, with much less negative effects than temporary changes in tax rates. Depending on the cause and size of the budget deficit, it will depend on the choice of monetary policy and fiscal policy. The consequences of deficits and surpluses, although they may be important, they are difficult to measure. Even if we know exactly their effects, the implications for the policy of borrowing wou-ld still be dependent on the ethical attitudes to intergenerational income distribution. Bearing in mind the aforementioned, quality debt management means: reducing the burden of debt service due to the time of borrowing and the interest rate, i.e. the term structure depending on economic trends; intergenerational equitable sharing of the burden of debt and ensuring macroeconomic stability would not appear as a limiting factor in economic development.
2.2. Public debt management
Public debt management can be defined as a set of procedures and decisions to be taken in order to obtain the necessary state funding. Some of the most decisions that are made are the ones pushing the size of the debt, the repayment term, the currency structure etc. (Carracedo and Dattels, 2007). It is very important to pay attention to the risks and costs that result from these decisions. During the 1990s, public debt management acquired a status of a separate public policy, with particular objectives focused on the principle of costs minimization (Wolswijk and Haan, 2005).
Other debt management objectives are (World Bank and IMF, 2007): - improving the structure of public debt;
- recognizing the benefits of clear objectives in public debt management;
- setting exposure limits to borrowings;
- development of financial reasonable and healthy institutional structures and policies to
- reduce operational risk;
- establishment of sustainable development and sourcing of funds for development projects;
- reduces the risk to the private sector, and reducing the effects of contagion and financial risk;
- limits financial impact of exogenous shocks on the state budget and financial stability;
- maintain the country's credit rating, and others.

REDETE – ECONOMIC DEVELOPMENT AND ENTEREPRENEURSHIP IN TRANSITION ECONOMIES
579
2. Indicators of indebtedness
There are various indicators for determining a sustainable level of external debt. While each has its own advantage and peculiarity to deal with particular situations, there is no unanimous opinion amongst economists as to one sole indicator. These indicators are primarily in the nature of ratios i.e. comparison between two macroeconomic parameters. These indicators can be thought of as measures of the country’s “solvency” in that they consider the stock of debt at certain time in relation to the country’s ability to generate resources to repay the outstanding balance. Examples of debt burden indicators (Berensmann, 2004) include the debt to GDP ratio, foreign debt to exports ratio, government debt to current fiscal revenue ratio etc.
This set of indicators also covers the structure of the outstanding debt including the share of foreign debt, short-term debt, and concessional debt in the total debt stock.
A second set of indicators focuses on the short-term liquidity requirements of the country with respect to its debt service obligations. These indicators are not only useful early-warning signs of debt service problems, but also highlight the impact of the inter-temporal trade-offs arising from past borrowing decisions. Examples of liquidity monitoring indicators include the debt service to GDP ratio, foreign debt service to exports ratio, government debt service to current fiscal revenue ratio etc.
The final indicators are more forward looking as they point out how the debt burden will evolve over time, given the current stock of data and average interest rate. The dynamic ratios sh-ow how the debt burden ratios would change in the absence of repayments or new disbursements, indicating the stability of the debt burden. An example of a dynamic ratio is the ratio of the average interest rate on outstanding debt to the growth rate of nominal GDP.
In our research we will focus on the next indebtedness indicators in forms of ratios: - Total external debt to exports - a useful indicator of long trend that is closely related to the
country's ability to meet its obligations; This Ratio (World Bank, 2003), classifies country as follows:
TED / E ≤ 132% less indebted country 132% < TED / E ≤ 220% average indebted country TED / E > 220% highly indebted country
- Total external debt to GDP - a useful indicator linking debt with a source of resources
allowing to focus on the production of export-oriented industries to contribute to a greater ability to pay the debt;
- Payments of interest rate to Exports - shows how much of the revenue from exports of goods and services should be set aside for payment interest on foreign debt. This indicator is actually a measure of the cost of foreign borrowing and frequently observed in a group of heavily indebted countries renegotiated their debts, since that interest is not usually renegotiated than just the principal. Therefore, the change liabilities arising from interest payments due to changes in the principal amount of reprogramming debt or changes in benchmark interest rates. This indicator was reduced in conditions when the growth rate of exports of goods and services is greater than the average interest rate on foreign borrowing and vice versa.
- Debt repayment to Public debt - As a country's debt to GDP ratio rises, it is often a sign that a recession is underway. That's because a country's GDP decreases in a recession. This causes taxes, and federal revenue, to decline at exactly the same time the government spends more to stimulate its economy. If the stimulus spending is successful, the recession will lift, taxes (and federal revenues) will rise, and the debt to GDP ratio should level off.

REDETE – ECONOMIC DEVELOPMENT AND ENTEREPRENEURSHIP IN TRANSITION ECONOMIES
580
- Total public debt to GDP - a useful indicator linking debt with a source of resources and ability to pay the debt;
- Payments of interest rate to GDP - Ratio of the annual interest liabilities on foreign debt to gross domestic product, represents a relationship based on interests and the course of overall economic activity in the economy debtor country, or what percentage of economic activity should be separated to repay interest. If we increase the interest payments in relation to gross domestic product, this means that repayment and the interest of ordinary economic activity becomes more burdens on the local economy. Public debt rises when interest rates rise as well as the primary deficit, and decreases when increasing the growth rate of GDP.
- Public debt and Tax revenues - the ratio of debt to tax revenue is particularly important to gauge the country's repayment capacity.
- Debt repayment to Export - shows the annual debt burden in relation to the export of goods and services, which is the main source of income in foreign currency needed to repay foreign debt. For this indicator, the numerator is the value actually paid liabilities arising repayment of foreign debt, not total value of outstanding liabilities. The difference between the actual paid and outstanding obligations is accrued unpaid obligations, whose inclusion in the numerator avoids unrealistic increase in value indicators. It is generally believed, based on experience with indebted countries and countries that have had problems with repayment of debts, the acceptable debt ratio and current revenues from exports of goods and services are less than 10%. If this ratio is greater than 20%, there is real danger of the problems with foreign liquidity of the country.
- FDI as a percentage of GDP - A series of indebted countries succeeded reduce its external debt, or at least stabilize the use of revenues from foreign direct investments to pay off its debt or to finance the deficit on the current accounts. FDI in the same time make additional capital for the development and transfer of technology and knowledge. Therefo-re, it should create favorable conditions for their engaging learning, and this means above all an efficient legal system that protects property, customer rights, macroeconomic sta-bility, and transparency in monetary and fiscal policy in the long run. Favorable investment climate implies equal status at home and foreign partners, a variety of tax deductions in investment, imports of equipment, free of duty, etc.
It should be noted that no indicator is perfect, and it is necessary to find and use those indica-
tors which are stable and relatively easy to use. It should be taken into account when formulating a benchmark, in order to distinguish different types of debt and their impact on the external balance and exposure. According to this statement our research is focused on analyzing the most determinable indebtedness indicators in Bosnia and Herzegovina. Since indicators are primarily in the nature of ratios, in Table No. 1, we present the most important macroeconomic indicators for Bosnia and Herzegovina in observed time period which will be used in our analysis of debt indicators.

REDETE – ECONOMIC DEVELOPMENT AND ENTEREPRENEURSHIP IN TRANSITION ECONOMIES
581
Table No. 1: Macroeconomic indicators for Bosnia and Herzegovina (in million BAM)
Sources: Bosnia and Herzegovina Ministry of Finance and Treasury, Central Bank of BH and Agency for Statistics of Bosnia and Herzegovina
4. Data and methodology
4.1. Principal component analysis
For practical reasons, we make our base of potential factors (which determine the level of public debt) reduced, so that we have less than 9 original variables, which preserve the maximum possible amount of information. For this purpose, we used factor analysis and the procedure of main components, which reduces our base to a smaller number of variables (Stanić, Račić and Milunović, 2012).
Since factor analysis is using the correlation between variables, before the beginning of the procedure we had to check if the variables were correlated, and for this purpose we used the Bartlett's Test of Sphericity.273 If Bartlett test is not statistically significant application of factor analysis does not make sense (no strong theoretical justification). Table No. 2 (below) gives us the results of Bartlett's test. As we see from line Sig., it is statistically significant, which means that we can use the results of the factor analysis.
Table No. 2: KMO and Bartlett's Test of Sphericity
Source: Calculation by authors, in the software IBM SPSS Statistics 19.0
The following table (Table No. 3) provides key information on number of factors that we have reduced in our base variables. This information contains data, such as the eigenvalues of factors, 273 Tests the null hypothesis that the variance matrix of variables is embedded in a matrix of identity procedure, ie all
correlations between variables are equal to zero
YEAR
INDICATORS 2007 2008 2009 2010 2011
TOTAL EXTERNAL DEBT 3,961 4,240 5,234 6,289 6,660
EXPORT 8,123 9,102 7,734 9,196 10,306
GDP 21,836 24,759 24,051 24,584 25,390
ANNUAL INTEREST RATE LIABILITIES 103 111 98 93 108
SERVICING LIABILITIES - DEBT REPAYMENT 244 254 252 307 349
PUBLIC DEBT EXTERN+INTERNAL 8,826 7,401 8,272 9,491 9,974
NET TAX INCOME 4,655 4,927 4,431 4,802 4,996
INTERNAL DEBT 4,865 3,161 3,038 3,202 3,314
FOREIGN DIRECT INVESTMENT 2,598 1,337 361 344 567
Kaiser-Meyer-Olkin Measure of Sampling Adequacy. ,407
Bartlett's Test of Sphericity Approx. Chi-Square 265,861
Df 28 Sig. ,000

REDETE – ECONOMIC DEVELOPMENT AND ENTEREPRENEURSHIP IN TRANSITION ECONOMIES
582
eigenvalues presented as percentages of the total variance and its cumulative share. In the first th-ree columns (Extraction Sums of Squared Loadings) we gained data only on those factors that meet the criteria to be retained. As the most commonly used criterion is percentage in variability (where the cumulative percentage of participation factors explain the variability, which should reach the appropriate level - often taken to be 70%), in this paper we choose to use this one.274
As we noticed from the table, the first factor accounting for about 63.8% of the total variability of all 9 original variables (which is an extremely high percentage), the second contains an additional 23%, and the third almost 10% of the total variability.
Important information about these 3 factors, is that they explain significantly more than 70% of the total variability (namely 96.85%), which is enough to choose them as "representatives" of all the original variables.
Table No. 3: Total Variance Explained
Compone
nt
Extraction Sums of Squared Loadings Rotation Sums of Squared Loadings
Total % of Variance Cumulative % Total % of Variance Cumulative %
1 5,743 63,808 63,808 3,711 41,228 41,228
2 2,095 23,275 87,083 3,068 34,094 75,322
3 ,879 9,764 96,846 1,937 21,524 96,846
Extraction Method: Principal Component Analysis. Source: Calculation by authors, in the software IBM SPSS Statistics 19.0
In the last three columns in Table No. 3, we observe the eigenvalue of rotated factors (if a rota-
tion was assigned). Factor analysis generated multiple solutions for the same set of data. Each so-lution is one rotation. Therefore, in each rotation we have other coefficients and different interpre-tation.275 It is important to mention that during the rotation the cumulative percentage of variation explained by both factors is kept, but at the same time the variability allocates to selected com-ponents or factors. Major changes in the coefficients indicate that factors are easily interpreted. In the general case, when the rotation is changing loadings, they simultaneously should give clearer interpretation. Hence, the mentioned interpretation is listed below, in Table No. 4.
Table No. 4: Selected components
Rotated Component Matrixa
Component 1 2 3
External debt to exports ,909 ,397 ,098 The ratio of interest payments to GDP -,905 -,141 -,212 FDI as a percentage of GDP -,881 ,093 -,455 Servicing debt to export ,699 ,674 ,157 External debt to GDP ,640 ,622 ,445 The ratio of public debt to GDP -,063 ,988 -,140 The ratio of public debt and tax revenues ,488 ,869 ,018 Servicing liabilities to total public debt ,190 -,244 ,934 The ratio of interest payments and exports -,335 -,501 -,748 Extraction Method: Principal Component Analysis. Rotation Method: Varimax with Kaiser Normalization. a. Rotation converged in 4 iterations.
Source: Calculation by authors, in the software IBM SPSS Statistics 19.0
274 There are also other criteria: a rule of thumb, the diagram of dispersal, etc. 275 There is an orthogonal (varimax rotation or rectangular) and non orthogonal (often referred as leaning rotation).

REDETE – ECONOMIC DEVELOPMENT AND ENTEREPRENEURSHIP IN TRANSITION ECONOMIES
583
It is very important to analyze the previous table, in order to name the determine factors or to choose the most significant original variables for our model (researchers can instead of this factor scores, i.e. linear combinations, to use "surrogate" variable, which means that for every factor chosen by one original variable that has the greatest correlation with this factor, actually presents this factor) (Soldić-Aleksić and Krasavac, 2009). Table No. 4 shows that the first factor is most correlated with the original variable "External debt to exports" the other factor with a variable "The ratio of public debt to GDP ", and the third with the variable "Servicing liabilities to total public debt". We use these variables as follows. After this selection of specified variables that have the highest correlation between the selected components, describing the extremely high percentage of the total variability, we can trace their relationship to public debt (the dependent variable in our model).
4.2. Multiple regression analysis
In continue, we follow the public debt as a function of selected factors from previous section, using a multiple regression analysis. In order to monitor and analyze the relationship between public debt and the independent variables (external debt to exports, the ratio of public debt to GDP and servicing liabilities to total public debt), we preliminarily check the statistical validity of the model. Statistical methods - ANOVA gives a positive answer to the question, which can be seen in the following table (Table No. 5).276
Table No. 5: ANOVA
ANOVAb
Model Sum of Squares df Mean Square F Sig.
1 Regression 4092105,646 3 1364035,215 25661,795 ,005a
Residual 53,154 1 53,154 Total 4092158,800 4
a. Predictors: (Constant), 1. Servicing liabilities to total public debt 2. External debt to exports 3. The ratio of public debt to GDP. b. Dependent Variable: The public debt
Source: Calculation by authors, in the software IBM SPSS Statistics 19.0
When we have a statistical base for the use of multiple linear regression equation, we apply the
model. The model can be defined as follows:
Y = b0 + b1X1 + b2X2 + b3X3 + random error
Where: Y - dependent variable (Public Debt) b0 - constant (shows the value of the dependent variable when the independent variables are
equal to zero), b1, b2 and b3 - coefficients with independent variables (shows the public debt shift due to uni-
tary movement of certain independent variable; with two other constant independent variables).
276 The value in the column Sig. is less than 0.05 (which means that the realized value "to the alternative hypothesis" in the
testing procedure, which is desirable.

REDETE – ECONOMIC DEVELOPMENT AND ENTEREPRENEURSHIP IN TRANSITION ECONOMIES
584
X1, X2 and X3 - the independent variables (External debt to exports, The ratio of public debt to GDP and Servicing liabilities to total public debt).
Specifically in our case, the coefficients with the independent variables and constant, values the indicators in the following table (Table No. 6).
Table No. 6 - The coefficients of multiple regression model
Coefficientsa
Model Unstandardized Coefficients
Standardized Coefficients
t Sig.
B Std. Error Beta (Constant) -5282,133 63,697 -82,926 ,008
External debt to exports 19,665 ,385 ,207 51,032 ,012 The ratio of public debt to GDP 224,785 1,008 ,967 223,109 ,003 Servicing liabilities to total public debt
-1472,113 14,087 ,436 104,499 ,006
a. Dependent Variable: Public debt Source: Calculation by authors, in the software IBM SPSS Statistics 19.0
5. Research results and discussion
Before we interpret the results, it should be noted that all coefficients are statistically significa-nt (column Sig.), which gives a relevant meaning. Specifically, the coefficient of the first inde-pendent variable (X1) shows that the unitary increasing of foreign debt to exports (increasing the share of external debt in total exports by 1%), public debt will increased by an average of 19.665 million. This conclusion is absolutely logical, given the fact that the parameter "External debt to exports" only increases over the next three (negative) scenarios:
- If the foreign debt is growing faster than exports,
- When external debt is increasing at a constant export or
- When exports decline with a constant level of external debt.
Each of these three scenarios must be caused by the growth of public debt. The coefficient b2, which amounts to 224.785, shows that the increase of the share of public debt in GDP by 1% will increase the average absolute value in public debt for 224.785 million. Since this parameter also increases only in the case of negative trends, our result is not surprising. The third coefficient, b3, shows that the increase in servicing liabilities to public debt in the amount of 1% will impact on average reduction of public debt in the amount of 1472.113 million, wherein implies that the other two independent variables constant.
And finally, amount of constant has no real meaning in real terms, since it assumes the level of public debt at zero amounts of other variables (which is not realistic and possible), so we will not consider this interpretation.
The significance of the obtained models is mainly reflected in the fact that it provides the opp-ortunity to evaluate the movement of the level of public debt, at a certain fixed (most desirable) values of the independent variables.

REDETE – ECONOMIC DEVELOPMENT AND ENTEREPRENEURSHIP IN TRANSITION ECONOMIES
585
6. Conclusion
As our analysis has shown the most influential and significant indicators of indebtedness in our country are External debt to exports, the ratio of public debt to GDP and Servicing liabilities to total public debt. The ratio of debt to gross domestic product can be useful indicator of indebted-ness, connecting debt funds with the basis for the repayment of public debt. Public debt rises when interest rates and the primary deficit rise, and decreases when the growth rate of GDP increasing. Indicator of debt to exports ratio has the advantage of being an export basis to settle the debt. However, as our analyze showed, the indicator the ratio of debt to gross domestic product may give indication of the possibility of servicing the debt, so the resources are used to production of goods for export.
Looking at the total indebtedness level of Bosnia and Herzegovina we can notice that the percentage ratio of the total debt and GDP for the period 2007-2011. has tendency of growth (39,3% in 2011) but still below the upper limit of indebtedness under the Maastricht criteria. On the other hand, according to the International Monetary Fund and the World Bank criterion, it can be concluded that the B&H is considered moderately indebted. Ratio of external debt service to exports of 4.2% in 2011, still points to an acceptable state of capacity to repay debt (the critical value is of 30%). The ratio of external debt to exports (81% in 2011), puts our country into the category of low-indebted economies. Looking at macroeconomic indicators and indicators of indebtedness for the period 2007-2011 it can be concluded that the sustainability of the public debt of the Bosnia and Herzegovina satisfacts criterion, but borrowing in the coming period must be approached cautiously, given the effects of the global economic and financial crisis.
Given that the estimates' indebtedness directly depend on the level of public debt trends and requirements for debt service by level of increase / decrease in GDP, exports, and disposable income to service the debt, decisions on further borrowing will have to take into account their impact on relevant macroeconomic indicators. In this context, the new debt should be associated with the production projects, or to finance projects that would contribute to the acceleration of reforms as a basis for further economic growth.
In assessing the level of stability and sustainability of debt and potential risk, many countries use the indicators of indebtedness. Specificity in public debt management in the Bosnia and Herzegovina reflects in the inability to apply active monetary policy and exchange rate policy, given that monetary policy in BiH is based on the principles of the Monetary Board. Given the above, the dominant segment in the management of public debt belongs to fiscal policy and to policy of expenditure control. One of the major threats of B&H is lowered credit rating which influences the decrease in foreign direct investment, as well as the worsening of conditions and borrowings from international financial institutions. This also means an increasing shift towards the possibilities of borrowing on the domestic market, but should take into account the constraints on domestic capital accumulation. A large impact on the level of domestic investments has transfers from abroad, which means that the economic situation in the countries of Western Europe largely affects the economic movements in Bosnia and Herzegovina.

REDETE – ECONOMIC DEVELOPMENT AND ENTEREPRENEURSHIP IN TRANSITION ECONOMIES
586
References list
1. Anderson P., Silva A. and Velandia-Rubiano. (2010). Public Debt Management in Emerging Market Economies - Has This Time Been Different. World Bank, Research papers. http://treasury.worldbank.org/bdm/pdf/PDMinEM_HasThisTimeBeenDifferent Anderson.etal.pdf (accessed 04.08.2012.)
2. Agency for Statistics of Bosnia and Herzegovina http://www.bhas.ba/ (accessed 15.08.2012.) 3. Berensmann, K. (2004). How to ensure debt sustainability beyond the HIPC -Initiative?
German Development Institute, Bonn, Germany. http://www.un-ngls.org/orf/cso/-cso2/001%200304-Hearings-CS-KB-debt.pdf (accessed 19.08.2012.)
4. Carracedo, M. and Dattels, P. (1997). Survey of Public Debt Management Frameworks in Selected Countries, in V. Sundararajan, P. Dattels and H. J. Blommestein Coordinating Public Debt and Monetary Management. Washington D.C.: International Monetary Fund, 96-123.
5. Central Bank of Bosnia and Herzegovina, http://www.cbbh.ba/ (accessed 15.08.2012.) 6. Laurens, B., Piedra, E. (1998). Coordination of Monetary and Fiscal Policies. IMF Working
Paper, IMF http://www.imf.org/external/pubs/ft/wp/wp9825.pdf (accessed 05.08.2012.) 7. Rosen, S.H. and Gayer, T. (2009). Public Finance, Eighth Edition. Belgrade: Faculty of
Economics, Centre for publishing 8. Musgrave R. (1973). Theory of Public Finance. Belgrade: Scientific books. 9. Stanić, S., Račić, Ž., Milunović, D.: Application of principal components analysis and i –
distance method in process of ranking; Sym – op – is 2012, VGGŠ Belgrade. 10. Leong D.(1999). Debt Management Theory and Practice. Treasury Occasional Paper.
http://www.dmo.gov.uk/docs/research/international/treasury OccasionalPaper10.pdf (accessed 10.09.2012.)
11. Lerner, A.P. (1948). The Burden of the National Debt. Income, Employment, and Public Policy: Essays in Honor of Alvin H. Hansen, ed. L.A. Metzler et al. New York: W.W.Norton.http://highered.mcgraw-hill.com/sites/dl/free/0070897875/48078/ rosen2_ichap3.pdf (accessed 10.09.2012.)
12. Musgrave, Richard A. (1985). Brief History of Fiscal Doctrine. Handbook of Public Economics, vol. 1, ed. Alan Auerbach and Martin S. Feldstein. Amsterdam: North-Holland, http://highered.mcgraw-hill.com/sites/dl/free/0070897875/48078/ rosen2_ichap3.pdf(accessed 02.09.2012.)
13. Ministry of Finance and Treasury, Bosnia and Herzegovina. http://www.mft.gov.ba/ (accessed 01.08.2012.)
14. Soldić-Aleksić, J., Krasavac B. (2009): Quantitative techniques in market research application of SPSS computer package. Belgrade: Faculty of Economics.
15. Wolswijk, G., Haan, J. (2005). Government debt management in the euro area – recent developments and changes in practices. Occasional paper series, No. 25. European central bank
16. World Bank and International Monetary Fund. (2003). Guidelines for Public Debt Manage-ment. http://treasury.worldbank.org/bdm/htm/resource_publications.htm (accessed 12. 08. 2012.)
17. World Bank and International Monetary Fund. (2007). Strengthening Debt Management Practices: Lessons from Country Experiences and Issues Going Forward. http://www.imf.org/external/np/pp/2007/eng/032707m.pdf (accessed 12.08.2012.)

REDETE – ECONOMIC DEVELOPMENT AND ENTEREPRENEURSHIP IN TRANSITION ECONOMIES
587
PLEDGE FOR A CHANGE IN EDUCATION OF TODAY’S ECONOMISTS
Aleksandar KEŠELJEVIĆ277
Abstract
The crisis that erupted in 2007 has significantly intensified controversy about the status of the mainstream economics because of its failure to adequately grasp it. The global financial and economic crisis raises the question how this should be reflected in education system of today’s economists and their curriculum. In the article the author argues that mainstream economics consolkidated its monopoly position, within economics and in the broad framework of social sciences, mainly through the education process by dictating strict methodological rules. The use of such an scientific language reduces the diversity of methodological approaches and opinions within economic theory (lack of pluralism) and impedes better cooperation with other scientific disciplines (lack of holism). The author pledges for a change in the way economists are educated today. Education is thus on one side the main factor of domination and social irrelevance of the neoclassical paradigm and on the other the main channel for introducing more pluralism and holism in economics in order to better understand and resolve today’s problems.
Keywords: neoclassical paradigm, methodological normativism, pluralism, holism.
277 University of Ljubljana, Faculty of Economics, Kardeljeva ploščad 17, Ljubljana, Slovenia, [email protected]

REDETE – ECONOMIC DEVELOPMENT AND ENTEREPRENEURSHIP IN TRANSITION ECONOMIES
588
1. Introduction and literature review
Modern neoclassical theory centers the attention on the workings of the market, prices, and equilibria which compels heavy use of mathematics and objectification of knowledge. Neoclassi-cal school has consolidated its monopoly position within economics mainly through strict metho-dological rules, unity of introductory economics textbooks and academic programmes. However, the crisis that erupted in 2007 has significantly intensified controversy about the status of the mai-nstream economics because of its failure to adequately grasp it. The global financial and eco-nomic crisis raises the question of how this should be reflected in the education system of today’s economists and their curriculum.
The main purpose of the article is fourfold. I argue that neoclassical school has consolidated its monopoly position within economics and in the broad framework of social sciences mainly by di-ctating strict methodological rules (1). I shall argue that methodological normativism of the neo-classical school has become because of freedom restrictions a source of subordination within eco-nomic community (lack of pluralism) (2). I seek to point out that self-sufficiency and uncom-promising forays into other fields are effectively destroying the foundations for more fruitful cooperation with other scientific disciplines (lack of holism) (3). I pledge for more pluralism and holism in economics curriculum for better understanding of the real economy and today’s problems (4).
These aspects have not been simultaneously addressed in the literature so far. Several authors have discussed mainly the lack of pluralism within economic scientific community (Mearman 2007; King, 2004; Freeman, 2010; Soderbaum, 2008; Fernández and Pessali, 2001; Dow, 1990, 2008; Goodwin, 2008), and less the lack of holism regarding the cooperation of economics with other scientific disciplines. The pledge for a change in the education system has been addressed on one side by academians (Becker, 2004; Soderbaum, 2008; Barone, 1991; Goodwin, 2008; Me-arman, 2007; Freeman, 2010; Hodgson, 2011) and on the other by students (Post-autistic mo-vement).
Article is structured as follows. In section two the methodological normativism of the neocla-ssical school is presented. The aim of section three is to point out the self-sufficiency and un-compromising forays into other fields and misunderstanding of the real world by the neoclassical paradigm. In the section four we point out the importance of freedom in forging new methodo-logical approaches and the pledge for more holism in economics. The last section concludes by summarizing the main findings.
2. Neoclassical methodology as an ideal for the majority of contemporary economists
The unity of introductory economics textbooks, academic programmes and articles in reputable professional academic journals illustrate the high level of domination of the neoclassical school within economics. It has also succeeded to elevate its reputation by the increasing influence of neoclassical economists on the key economic policy decisions. Thus, in the economic scientific community the domination of the neoclassical paradigm is often asserted (Johnson, 1983; Dow, 2008; Goodwin, 2008).
The methodology employed by the mainstream starts with economic axioms (e.g. rationality) from which equilibrium as the solution of agent maximization problems is inferred through dedu-ctive logic. Neoclassical methodology is mostly based on deductive reasoning, bold testing of hy-potheses, and checking the hypotheses against empirical facts. With its extensive use of mathe-matical formalism and statistical techniques the neoclassical school has adopted the methodology

REDETE – ECONOMIC DEVELOPMENT AND ENTEREPRENEURSHIP IN TRANSITION ECONOMIES
589
of natural sciences in order to prove its scientific character by providing objectivity and coherence (Blaug, 1992; Hassard, 1993; McCloskey, 1994). Neoclassical school has developed such a methodology in order to specify certain standards on which achievements in economics are eva-luated. It seems that mathematics, a discipline that represents the apex of scientific purity, has become the “lingua franca” of modern economics.
Domination of the neoclassical paradigm means that economics has reached a high level of methodological unity. McCloskey (1983) maintains that most economists accept the same methodological rules regardless of whether they may belong to the mainstream camp within the neoclassical school or whether they are their main opponents (e.g. heterodox school). Similarly
Dow (2008) argues that pluralism in economics is mainly understood at the level of theory and not at the level of method. It may be viewed as a paradox that the ideas of the neoclassical school, unacceptable to many from the aspect of contents, were perfectly acceptable from the aspect of methodology. Obviously the neoclassical methodology is an ideal for the majority of con-temporary economists. Even more, neoclassical economic theory argues that economic rationality can be applied to all fields of human life where scarce resources and problems of choice appear.
3. Economic imperialism of the neoclassical paradigm
If the purpose of economics as a science is not novelty, then the only sensible direction is re-search into the depth of the paradigm, and focus on other scientific fields, which is also charac-teristic of the neoclassical paradigm. Its economic imperialism is manifest in its drive to conquer other scientific fields, due to four reasons.
Firstly, objectification of knowledge at the epistemic level allows a systematic and transparent organization of theoretical knowledge; thus, the rationality is extended to the very theory of science as well (Kovač, 2001). Rational science is thus connected with the economic models of rational behaviour of economic agents, which allowed the economic theory to a great extent to break to other non-economic fields. Secondly, divisions and institutionalization of science within particular scientific communities created the circumstances for the venture of economics into other, traditionally non-economic fields. Application of rationality to new fields (such as study of family, fertility, human capital, criminal, history) has led many to recognize in economics an universal science (Eichner, 1983). Thirdly, neoclassical paradigm succeeded to develop its competitive advantage due to the influence of orthodoxy economists on the adoption of key decisions in the society. Fourthly, neoclassical paradigm succeeded to develop its competitive advantage due to the unity of economic textbooks and academic programmes. All this enables greatly neoclassical economic theory to win the status of universality not only in economic theory, but also in the broad framework of social sciences.
Neoclassical school consolidated its monopoly position within economics by strict methodlo-gical rules, paying little attention to alternative methodological approaches within economics. Also, rather than conceding its errors in order to better understand today’s problems economics it paradoxically breaks also into other, traditionally non-economic fields. Rigorous methodology renders it adverse also to both, internal pluralism within its own scientific community (lack of pluralism) and external pluralism in the wider scientific community (lack of holism).
REDETE – ECONOMIC DEVELOPMENT AND ENTEREPRENEURSHIP IN TRANSITION ECONOMIES
590
4. Pledge for more pluralism and holism in education of today’s economists
Shaping a more uniform methodology appeared sensible, if not requisite at the end of the 19th century with economics. Economics adopted the methods of positivism in order to free itself from the dogma, superstition, and everyday experience. However, in its subsequent development, espe-cially in the second half of the 20th century, economic theory seeking greater unity simply aban-doned the understanding of the importance of freedom. By employing mathematical formalism, economics has ruled out any possibility of exceedingly free formation of methodological approac-hes. However, more freedom allowed emancipation of many sciences, including economics (Rich, 1981).
The neoclassical dominance leads scientists into intellectual imbecility argues McCloskey (1983) and into intellectual slavery (Eichner, 1983). Kristensen (2001) believes that scientists have become, through the dominance of the neoclassical paradigm, free slaves. Therefore, I strongly believe that a mutual exclusiveness between freedom and neoclassical paradigm exists. Commitment and silent consensus in the economic scientific community regarding the prevailing methodology obviously preclude the freedom. Many economists, facing the urge to publish and the desire for recognition, adopt the neoclassical methodology because this makes it easier for them to publish. A neoclassical institutional environment determines their work by controlling the top graduate schools, journals and research institutions. Scientists in turn often provide feedback through their findings to further consolidate the position of the neoclassical paradigm and to reproduce its rigid structure. Thus, the exclusive membership in a neoclassical community means inability to express dissent and a lack of self-reflection. Such restriction of freedom in the economic scientific community is akin to the political despotism in a totalitarian society.
Also with its scientific language, application of rationality to new fields and uncompromising forays into other fields, neoclassical economics is effectively destroying the foundations for deeper cooperation with other scientific disciplines. With such "uninvited" advances into other scientific fields, economics clearly presents its lack of interest in more interdisciplinary approaches that would allow economics deeper understanding of today’s problems.
The postmodern holism views the lack of pluralism within economics and the problem of divi-sions in the scientific community as synonymous for partial analyses of problems and mutual exclusion of ideas. I believe that the importance of freedom in forming more pluralistic metho-dological approaches in economics should be particularly emphasized, as only freedom can enable a departure from the methodological normativism of the neoclassical school. Freedom to form one's own (methodological) approaches is at the very heart of the theory of science. At the epistemological level Feyerabend's methodological pluralism (1999) allows the highest degree of freedom, promoting free formation of methodological approaches within economics in order to foster intellectual openness. This would enable a more democratic debate within economic discipline and at the same time contribute significantly to better understanding of the real econo-my since decision-makers would have a range of different policy scenarios at their disposal.
Another key goal of post-modernism is also to promote cooperation between different scientific disciplines in order to reap mutual benefits. Looking at the same problem from different scientific communities improves the student’s understanding of the problem. Thus, the reading materials should be a combination of different theoretical traditions in order to bring out coope-ration between different scientific disciplines (e.g. sociology, politics, philosophy, psychology). Thus, teaching of economics should include today more readings of economic classics as well as relevant topics from other scientific disciplines. More pluralistic and holistic education would undoubtedly increase students' capacity for critical, controversial and original thinking in order to avoid the mistakes of their teachers.

REDETE – ECONOMIC DEVELOPMENT AND ENTEREPRENEURSHIP IN TRANSITION ECONOMIES
591
6. Instead of the conclusion
The unity of introductory textbooks and academic programmes clearly illustrate the high level of domination of the neoclassical school in economics. Its monopoly position is mainly perpetuated through the education process as strict methodological rules are dictated which have become an ideal for the majority of contemporary economists. Use of rigorous language also expresses its desire for universal application of neoclassical methodological approaches in broad framework of social sciences.
On the one hand, use of a scientific language within the neoclassical paradigm reduces the diversity of methodological approaches and opinions within economic theory; on the other hand, it impedes better cooperation with other scientific communities in order to understand and solve today’s problems. Economic theory has lost the capacity of an anthropocentric view of the world, which has lead to social irrelevance of the neoclassical paradigm. Academic economists have elevated their discipline beyond relevance for the real world.
Departure from the methodological normativism of the neoclassical school and more democratic debate within economic scientific discipline would contribute significantly to a better understanding of the real economy problems. Post-modern holism goes beyond the traditional divisions in the scientific community by promoting cooperation between various scientific communities for a profound grasp of today’s problems.
This, students should be exposed to different streams of thought within economics and to different scientific traditions in order to be able to appreciate varieties of perspectives within and beyond economics. More holism and pluralism would contribute significantly to more democratic and interdisciplinary debate leading to better understanding of the real economy since decision-makers would have a range of different policy scenarios at their disposal. More holistic education would undoubtedly increase students' capacity for critical, controversial and original thinking in order to avoid the mistakes of their teachers
Literature
1. Barone C. (1991.) Contending perspectives: curricular reform in economics. Journal of Economic Education, 22(1), pp.15–26.
2. Becker S.G., (1976.) The Economic Approach to Human Behaviour. Chicago : Chicago University Press.
3. Blaug, M. (1992.) The Methodology of Economics. Cambridge : Cambridge University Press. 4. Dow S.C. (1990.) Beyond Dualism. Cambridge Journal of Economics, 14, pp. 143-157. 5. Dow S. (2008.) A Future for Schools of Thought and Pluralism in Heterodox Economics, J.,
T., Harvey, R.F., Garnett (Ed.): Future Directions for Heterodox Economics, The University of Michigan Press, 2008, pp. 9-26.
6. Eichner, A. (1983.) Why Economics is not yet a Science? New York : M.E. Sharpe. 7. Fernandéz, R., Pessali, H. (2001.) The Rhetoric of Economics and the Non-Mainstream
paradigms, XXVIII Annual Meeting of the History of Economics Society-Wake Forest, NC, USA, 2001.
8. Feyerabend, P. (1999.) Proti metodi. Ljubljana : Studia Humanitatis. 9. Freeman A. (2010) The Economists of Tomorrow: The Case for Assertive Pluralism in
Economics Education. American Journal of Economics and Sociology, 69(5). 10. Goodvin, N. (2008) From Outer Circle to Center Stage; The Maturation of Heterodox
Economics, J.T. Harvey, R.F. Garnett, (Ed.): Future Directions for Heterodox Economics, The University of Michigan Press, 2008, pp. 27-52.
11. Hassard, J. (1993) Sociology and Organization Theory-Positivism, Paradigms and Postmodernity. Cambridge : Cambridge University Press.

REDETE – ECONOMIC DEVELOPMENT AND ENTEREPRENEURSHIP IN TRANSITION ECONOMIES
592
12. Hodgson G. (2011.) Reforming Economics after the Financial Crisis. Global Policy, 2(2), pp. 190–195.
13. Johnson L. (1983.) Economic Paradigmas: A Mising Dimension. Journal of Economic Issues, 17(4), pp. 1097-1107.
14. King J.E. (2004.) Three Arguments for Pluralism in Economics, Post-autistic economics review, 23(January).
15. Kovač B. (2001.) Kriza vizije ekonomske vede v 21. stoletju. Economic and Business Review, 3(December), pp. 109-134.
16. Kristensen, P.H., (2001), “Denmark an Experiment Laboratory of Industrial Organization”, Zbornik The Corporative Study of Economics Organisation, Portorož, 1: 17-84.
17. McCloskey D. (1983.) The Rhetoric of Economics. Journal of Economic Literature, 21(June), pp. 481-517.
18. McCloskey, D. (1994) Knowledge and Persuasion in Economics. Cambridge : Cambridge University Press.
19. Mearman, A. (2007.) Teaching heterodox economics concepts. University of the West of England : Published by The Economics Network.
20. Rich, R., (1981), “Knowledge in Society”, in Rich, R., ed., The Knowledge Cycle, (London, Sage Publications), 11-39.
21. Söderbaum P. (2008.) Only pluralism in economics research and education is compatible with a democratic society. Int. J. Green Economics.

REDETE – ECONOMIC DEVELOPMENT AND ENTEREPRENEURSHIP IN TRANSITION ECONOMIES
593
ELIMINATION OF RISKS IN THE CONTEXT OF CURRENCY FLUCTUATIONS
Sylvie RIEDEROVÁ278,
Pavlína PINKOVÁ279
Abstract
In today's uncertain times when the major European economics have to deal with the danger of bankruptcy, the risk management has become for financial managers a highly complicated issue, in which the crucial role plays the accepting of personal responsibility for each decision leading to the elimination of risk. Thus, it seems to be particularly important for corporate fina-ncial managers to identify the types and sources of potential risks that fundamentally affect the-ir business activities. The historical development of risk is associated with uncertainty in a ne-gative sense. Nevertheless, in the course of time, the authors have applied the concepts of chan-ce or opportunity to express a positive sense of risk. The clarification of this terminological am-biguity is important for both research and practical applications. The elimination of risk can be achieved only by the proper understanding of the nature of risk. Currency risk is one of the risks that can be seen uncontrollable from the perspective of enterprises. However, one of the poten-tial variants of financial management is to eliminate the currency risk arising from the volatility of exchange rates through the use of currency derivates. The objective of the paper is to exa-mine the importance of individual steps within the entire process of currency hedging for export oriented companies in a small open economy, namely the Czech Republic. The purpose of the paper will be primarily achieved through the analysis of the development of the currency pair CZK/EUR in years 2000 to 2010. Time series regression analysis will be performed both for the exchange rate and for the volatility of exchange rate, and the future development will be pre-dicted. The proposed study will use data from the Czech Statistical Office, the Czech National Bank and the Thomson Reuters database. Consequently, on the basis of a model enterprise, different exchange rate hedging strategies will be applied. Results from this approach should show whether it is beneficial to hedge in given conditions. In case of economic efficiency of hedging, it seems to be necessary to identify the financial managers' attitudes towards the exc-hange rate hedging, particularly the attitudes to risk in general, depending on whether the com-pany is hedged or not, and the relation between managers' education and used hedging strate-gies. These primary data will be gained by the questionnaire survey realized among the Indus-trial enterprises of the South Moravian Region. The data will be processed by standard methods of descriptive statistics and other mathematical statistical methods, such as the chi-square test. In conclusion, the recommendations for owners and financial managers concerning the compre-hensive look at the currency risk elimination with the help of financial derivates will be de-veloped. The paper summarizes the theoretical aspects necessary for the understanding of the issue and their application to the corporate sector in terms of a small open economy.
Key words: risk management, currency risk, exchange rate, hedging, currency derivatives
278Department of Business Economics, Mendel University in Brno, Zemědělská 1, 613 00 Brno, Czech Republic,
[email protected] 279Department of Business Economics, Mendel University in Brno, Zemědělská 1, 613 00 Brno, Czech Republic,

REDETE – ECONOMIC DEVELOPMENT AND ENTEREPRENEURSHIP IN TRANSITION ECONOMIES
594
Introduction
The current situation in the global markets, especially the lingering financial crisis, has brought into the focus more than ever before the issue of risk management in corporate environment. According to Pulchart (2011), the risk management process definition implies that the key ele-ments of the whole process are people, their education, skills, competencies and their perception of risks. The risk management process depends on management and its sharing across the com-pany. CFO in export-oriented companies having costs in local currency (e.g. in CZK) and receiva-bles in foreign currency (e.g. EUR) tries to minimize the risk of this open position, which is affectted by the fluctuations of key financial market variables, especially the volatility of excha-nge rates, interest rates, commodity prices and other factors. The real opportunity how to manage these risks with regard to corporate cash-flow and economic result is the use of currency deriva-tives. The decision itself whether to hedge or not is regarded to be highly problematic. It is closely associated not only with market variables mentioned above, but also inside the company, it is related to attitudes towards risks and to education, as well as competencies, of financial managers (Hula, 2012).
The Greek word “Rhiza”, the Latin word “Riscum” or the Arabic word “Risq” emerged alre-ady in 12th century; nevertheless, their meanings have been developed since then. The concept of risk usually referred to an unfavorable event, for example the loss of the cargo during the course of the voyage (Fotr and Hnilica, 2009; Tichý 2006). In the Middle Ages, as the Pope Gregory VIIII mentions, the term risk is associated with lending money and with creditor-debtor relationship (Gregorius VIIII, 1227-1241). It can be assumed that risk is used for situations which individuals undergo voluntarily and knowingly and at the same time they take the responsibility for the final result of a transaction that is uncertain.
For a long time, the concepts of risk and uncertainty have been considered to be equivalent. However, Knight (1921) argues for a clear conceptual distinction between these two terms. The author concludes that risk is a measurable variable; whereas uncertainty cannot be measured. This finding is also supported by Merna (2007) who claims that risk is statistically predictable and uncertainty refers to unknown, generally unpredictable events. The results of transactions can be both positive and negative, since the risk is (perfectly) quantified uncertainty (Althaus, 2005). Tichý (2006) defines risk as the expected value of loss, expressed in monetary or other units, caused to recipients or risk-bearers by implementation of risk scenarios. It can be concluded that the acceptance of risks involves either positive scenario, i.e. unplanned profit, or negative scenario, i.e. unplanned loss.
Almost every business transaction between the companies of different countries is accompani-ed by currency exchanges. After the break-up of Bretton Woods system, the exchange rates of cu-rrencies are frequently fluctuating, which leads to the increase of currency risk of all participants. (see Henderson, 2002, Choi, 2010)
The company’s decision whether to hedge currency exposures, or not, is influenced by two main determinants. First, how significant the potential risk is regarded to be. Next, what the attitude towards risk is (Coyle, 2000). This relation to risk can be neutral, averse or risk-seeking and is dependent on decision maker's preferences, which are affected by many other factors, including past experience or environment development (Martinovičová et al., 2010). Yet, the empirical studies have shown that the company’s attitude to risk is independent of real hedging decisions (Donoso, 1995).
Likewise, the issue of currency risk management appears to be even more complex, due to difficulties with the understanding of exchange rates fluctuations. As Beltratti et al. (2004) state, the long-term trend does not enable to find the stable relations among variables. Consequently, the short-term perspective is necessary to be considered as well (Subramanian, 2011).
The proper hedging strategy enables to minimize or even eliminate the currency risk (Riederová, 2010). However, the hedging does not systematically improve the returns, the invest-

REDETE – ECONOMIC DEVELOPMENT AND ENTEREPRENEURSHIP IN TRANSITION ECONOMIES
595
ment horizon and the currencies of choice are significant determinants of the final result (Sub-ramanian, 2011).
The Czech companies, either exporting or importing, are closely dependent on the overall trends of the European economy. The current financial markets are extremely sensitive (see Kolb, Overdahl, 2010) and the exchange rate development has both direct and indirect impact on busi-nesses. Consequently, in terms of hedging, the right decisions are highly important. The objective of the paper is to examine the importance of individual steps within the entire process of currency hedging for export oriented companies in a small open economy, namely the Czech Republic.
Methods and Resources
The real historical data of the currency pair CZK/EUR from 2000 to 2010, based on the daily fixing of the Czech National Bank (CNB), have been used for the purposes of our study. First, the long term trend of the CZK/EUR development has been generated with the help of linear regression analysis. Next, the whole period of ten years has been divided into one-year periods, in which the linear regression has been performed to mark differences between the long-term and short-term trends.
For the time series analysis the most common form of linear regression model has been applied. The plain linear regression is used to simulate linear dependencies between variables. According to Yan and Gang Su (2009), the equation takes following form:
y = β0 + β1x + ε,
where β0 and β1 represent the parameters of the model (β1 is gradient), y represents depending variable, x is independent variable and ε represents the statistical error.
Based on Anderson (2010), the equation for E(y) can be written as follows:
E(y) = β0 + β1x,
where the graphical representation is straight line.
To test the hedging profitability, the artificial exporting company is considered. On the ba-sis of guided interviews with the representatives of financial organisations (HSBC Bank plc, Commerzbank AG and Komerční Banka, a.s.), the average exporting company has been de-fined and the following assumptions have been made:
- The company’s exposure is €50 million.
- The net exposure is €24 million = €50 million - €26 million (natural hedging).
- The company enters one FX deal every month, in the amount of €1 million. The maturity date is on 20th of each month or the first following business day.
- The budgeting procedure determines the company’s net exposure to October 3 of each year.
- The company hedges 100% of open position.
For the hedging of considered artificial company, the outright forward has been used. The for-ward points, defined as a premium or discount added to or subtracted from the spot rate (Chis-holm, 2010), are calculated on the basis of real market data, which were obtained from Thomson Reuters database. These forward points are determined according to Jílek (2005), as:

REDETE – ECONOMIC DEVELOPMENT AND ENTEREPRENEURSHIP IN TRANSITION ECONOMIES
596
= 1 + 0; 3601 + 0; 360
The hypothetical example of the hedging of future cash-flows (namely 1.000.000€ for the
period of one year) is applied to demonstrate the comparison of various hedging instruments. The hedging prices, as well as the hedging rates, are the real market values provided by banks to cre-ditworthy companies. Two different exchange rate predictions based on the appreciation and dep-reciation of Czech crown are defined to determine the advantageousness of hedging instruments. The calculations are based on the fact that the hedging, not the speculation, is considered (see Henderson, 2002) and the amount of hedged foreign currency corresponds to net foreign exchange exposure (see Homaifar, 2003).
The identification of financial managers' attitudes towards the exchange rate hedging has been done through the questionnaire method. The questionnaire survey has been realized among the industrial enterprises of the South Moravian Region in the Czech Republic in the period from September to October 2011. The sample consists of 195 companies with more than 100 emplo-yees belonging to CZ-NACE division 13. The secondary data are obtained from the Amadeus database, Albertina database, and the Czech Statistical Office and Intrastat system. The primary data are processed by standard methods of descriptive statistics and other mathematical statistical methods, such as the chi-square test.
Results and discussion
Firstly, the development of the currency pair CZK/EUR, during the monitored period of time, is to be analyzed. The long term trend is generated, and the long-term trend (marked as LR_10Y) and short-term trend (marked as LR_1Y) are compared.
Fig. 1 presents the development of CZK/EUR in the period 2000 – 2010. The particular values are based on the daily fixing rate as reported by the Czech National Bank. The blue line represents a graphical expression of the linear regression results. This long-term trend clearly identifies the appreciation slope of CZK during the examined period. Under consideration of first (35,805) and last (34,111) LR values, the appreciation rate of CZK/EUR for the last ten years is approximately 3, 7%, which is more than 20% higher, compared to the appreciation target announced by the CNB in year 2000.
Since, the trend is empowering and the appreciation rate is higher than was expected by the CNB, it seems to be apparent that the use of hedging for exporting companies in the conditions of the Czech Republic is justifiable. Nevertheless, in certain periods, the exchange rates fall dramatically.
Figure 1: CZK/EUR for 2000 – 2010 (Source: Own calculations based on the CNB)

REDETE – ECONOMIC DEVELOPMENT AND ENTEREPRENEURSHIP IN TRANSITION ECONOMIES
597
Development of year 2000
From the currency point of view, the year 2000 can be considered to be calm. Fig. 2 shows that the long-term trend is almost parallel to the short-term trend.
Figure 2: CZK/EUR for 2000 (Source: Own calculations based on the CNB)
The currency hedging was established in year 2000. The exchange rate of October 3, 2000 at 35,585 CZK/EUR has been used as the entry level for the hedging forwards. The interest rates quoted on October 3, 2000 are presented in Tab. 1.
Table 1: Interest rates quoted on October 3, 2000 (Source: Komerční banka, a.s.)
Interest rates for CZK Interest rates for EUR 1M 3M 1Y 1M 3M 1Y 5,32 5,37 5,74 4,78 4,99 5,16
The interest rates for corresponding periods are taken into consideration for the calculation of
the forward basis points (BIBS). No difference between the bid and offer rates is considered, thus, the mid-rate is applied. The same procedure has been performed as well for the following years.
Development of year 2001
Similar development to previous year can be seen in 2001. However, in the end of the year the financial market experienced turbulences and the CZK appreciated dramatically, which is repre-sented by the crossing of long-term and short-term trends. Tab. 2 reports that the hedging in 2001 was effective.

REDETE – ECONOMIC DEVELOPMENT AND ENTEREPRENEURSHIP IN TRANSITION ECONOMIES
598
Figure 3: CZK/EUR for 2001 (Source: Own calculations based on the CNB)
Table 2: Evaluation of 2001 and 2002 (Source: Own calculations)
Development of year 2002
Year 2002 was very turbulent. In spite of the fact that the slopes of long-term and short-term trends are almost parallel, significant fluctuations occurred during this period. The short-term trend was lying under the long-term, due to a big rise in previous year 2001. This development implies the high efficiency of hedging in 2002. The potential risk for the near future is the upward trend of exchange rate in the end of the year, signalling the weakening of CZK.
As expected, the hedging for the year 2002 was successful and the company realized profit of about CZK 39.068.100, 74 CZK (see Tab. 2).
Exchange rate on SPOT 35,585 Year 2001
Nominal Maturity EX_Rate FWD_Rate Profit/Loss
1 000 000 € 22.1.2001 35,240 35,633 393 039,75
1 000 000 € 20.2.2001 34,655 35,644 989 308,33
1 000 000 € 20.3.2001 34,585 35,653 1 068 204,58
1 000 000 € 20.4.2001 34,250 35,656 1 406 170,00
1 000 000 € 21.5.2001 34,295 35,670 1 375 107,46
1 000 000 € 20.6.2001 33,915 35,687 1 772 010,33
1 000 000 € 20.7.2001 33,895 35,702 1 807 430,50
1 000 000 € 20.8.2001 34,045 35,718 1 673 443,75
1 000 000 € 20.9.2001 34,290 35,738 1 448 312,04
1 000 000 € 22.10.2001 33,525 35,763 2 237 925,00
1 000 000 € 20.11.2001 33,165 35,809 2 643 592,42
1 000 000 € 20.12.2001 31,940 35,826 3 885 791,83
20 700 336,00Grand Total 2001
Exchange rate on SPOT 33,63 Year 2002
Nominal Maturity EX_Rate FWD_Rate Profit/Loss
1 000 000 € 21.2.2002 32,295 33,773 1 477 759,35
1 000 000 € 20.2.2002 31,950 33,824 1 873 933,00
1 000 000 € 20.3.2002 31,290 33,877 2 586 620,00
1 000 000 € 22.4.2002 30,165 33,934 3 769 351,50
1 000 000 € 20.5.2002 30,570 33,993 3 422 923,75
1 000 000 € 20.6.2002 30,485 34,054 3 568 738,00
1 000 000 € 22.7.2002 30,360 34,122 3 761 838,75
1 000 000 € 20.8.2002 30,685 34,199 3 513 907,50
1 000 000 € 20.9.2002 29,965 34,270 4 304 978,90
1 000 000 € 21.10.2002 30,560 34,331 3 771 185,50
1 000 000 € 20.11.2002 30,580 34,395 3 815 082,50
1 000 000 € 20.12.2002 31,260 34,462 3 201 782,00
39 068 100,75Grand Total 2002

REDETE – ECONOMIC DEVELOPMENT AND ENTEREPRENEURSHIP IN TRANSITION ECONOMIES
599
Figure 4: CZK/EUR for 2002 (Source: Own calculations based on the CNB)
Development of year 2003
The weakening of the CZK in relation to EUR was characteristic of year 2003, which is against the long-term trend. At the beginning of June 2003, the short-term curve crosses the long-term curve and the gap between them expands. In the context of this development, the hedging was not successful and the company realized losses (see Tab. 3).
Figure 5: CZK/EUR for 2003 (Source: Own calculations based on the CNB)
Table 3: Evaluation of 2003 and 2004 (Source: Own calculations)
Exchange rate on SPOT 30,385 Year 2003
Nominal Maturity EX_Rate FWD_Rate Profit/Loss
1 000 000 € 20.1.2003 31,285 30,354 -930 764,81
1 000 000 € 20.2.2003 31,610 30,345 -1 264 500,50
1 000 000 € 20.3.2003 31,710 30,337 -1 373 109,58
1 000 000 € 22.4.2003 31,675 30,329 -1 346 212,25
1 000 000 € 20.5.2003 31,470 30,321 -1 148 808,50
1 000 000 € 20.6.2003 31,490 30,312 -1 177 924,00
1 000 000 € 21.7.2003 32,250 30,308 -1 942 481,75
1 000 000 € 20.8.2003 32,435 30,304 -2 131 026,67
1 000 000 € 22.9.2003 31,975 30,297 -1 678 015,22
1 000 000 € 20.10.2003 31,785 30,294 -1 490 547,30
1 000 000 € 20.11.2003 31,855 30,288 -1 567 105,40
1 000 000 € 22.12.2003 32,460 30,280 -2 180 284,03
-18 230 780,00Grand Total 2003
Exchange rate on SPOT 31,965 Year 2004
Nominal Maturity EX_Rate FWD_Rate Profit/Loss
1 000 000 € 20.1.2004 32,910 31,959 -951 153,26
1 000 000 € 20.2.2004 32,640 31,957 -682 991,25
1 000 000 € 22.3.2004 33,165 31,955 -1 209 589,50
1 000 000 € 20.4.2004 32,540 31,954 -586 187,75
1 000 000 € 20.5.2004 31,900 31,952 51 947,63
1 000 000 € 21.6.2004 31,870 31,950 80 083,00
1 000 000 € 20.7.2004 31,305 31,946 640 821,00
1 000 000 € 20.8.2004 31,650 31,944 293 690,00
1 000 000 € 20.9.2004 31,360 31,941 580 679,96
1 000 000 € 20.10.2004 31,490 31,930 439 838,50
1 000 000 € 22.11.2004 31,090 31,903 812 668,25
1 000 000 € 20.12.2004 30,455 31,875 1 420 498,00
890 304,58Grand Total 2004

REDETE – ECONOMIC DEVELOPMENT AND ENTEREPRENEURSHIP IN TRANSITION ECONOMIES
600
Development of year 2004
The year 2004 showed the clear strong appreciation trend without significant fluctuations. The rate of appreciation was higher than in the long-term trend, which led to the convergence between short and long-term trends.
As is demonstrated in Tab. 3, the year 2004 for the first time showed both positive and negative results. Nevertheless, the final result remains positive. The profit could be achieved as the consequence of more significant appreciation.
Figure 6: CZK/EUR for 2004 (Source: Own calculations based on the CNB)
Development of year 2005
Both trend lines in the year 2005 are nearly identical. The CZK was appreciating in expected way and without significant fluctuations within the whole period. The year evinces only positive results (Tab. 4).
Figure 7: CZK/EUR for 2005 (Source: Own calculations based on the CNB)
Development of year 2006
The low fluctuations and slower appreciation rate have become key factors since 2006. The whole curve is under the long-term trend and therefore the slower appreciation is understandable. High entry level for forwards is the main success factor for positive result of hedging operations (see Tab. 4).

REDETE – ECONOMIC DEVELOPMENT AND ENTEREPRENEURSHIP IN TRANSITION ECONOMIES
601
Table 4: Evaluation of 2005 and 2006 (Source: Own calculations)
Exchange rate on SPOT 29,61 Year 2006
Nominal Maturity EX_Rate FWD_Rate Profit/Loss
1 000 000 € 20.1.2006 28,580 29,583 1 002 758,80
1 000 000 € 20.2.2006 28,410 29,573 1 163 481,00
1 000 000 € 20.3.2006 28,590 29,564 974 351,25
1 000 000 € 20.4.2006 28,460 29,555 1 095 221,50
1 000 000 € 22.5.2006 28,290 29,546 1 256 091,75
1 000 000 € 20.6.2006 28,480 29,537 1 056 962,00
1 000 000 € 20.7.2006 28,350 29,528 1 177 832,25
1 000 000 € 21.8.2006 28,140 29,519 1 378 702,50
1 000 000 € 20.9.2006 28,435 29,508 1 073 487,05
1 000 000 € 20.10.2006 28,335 29,500 1 165 146,90
1 000 000 € 20.11.2006 28,005 29,496 1 491 124,88
1 000 000 € 20.12.2006 27,420 29,491 2 071 165,20
14 906 325,08Grand Total 2006
Figure 8: CZK/EUR for 2006 (Source: Own calculations based on the CNB)
Development of year 2007
There were a lot of fluctuations in 2007. After the weakening phase with the peak in July 2007, the steep appreciation followed. These high fluctuations are reflected in Tab. 5; the primary profits were transformed into three months losses and finally turned to the final profit phase.
Figure 9: CZK/EUR for 2007 (Source: Own calculations based on the CNB)
Exchange rate on SPOT 31,526 Year 2005
Nominal Maturity EX_Rate FWD_Rate Profit/Loss
1 000 000 € 20.1.2005 30,375 31,575 1 199 944,12
1 000 000 € 21.2.2005 29,930 31,594 1 664 306,33
1 000 000 € 21.3.2005 30,140 31,614 1 474 010,08
1 000 000 € 20.4.2005 30,175 31,636 1 461 025,74
1 000 000 € 20.5.2005 30,240 31,657 1 416 570,18
1 000 000 € 20.6.2005 29,985 31,679 1 694 426,53
1 000 000 € 20.7.2005 30,220 31,703 1 483 333,75
1 000 000 € 22.8.2005 29,450 31,730 2 280 393,57
1 000 000 € 20.9.2005 29,350 31,758 2 408 057,63
1 000 000 € 20.10.2005 29,750 31,783 2 032 936,90
1 000 000 € 21.11.2005 29,245 31,812 2 566 862,01
1 000 000 € 20.12.2005 28,930 31,846 2 915 988,90
22 597 855,74Grand Total 2005

REDETE – ECONOMIC DEVELOPMENT AND ENTEREPRENEURSHIP IN TRANSITION ECONOMIES
602
Table 5: Evaluation of 2007 and 2008 (Source: Own calculations)
Exchange rate on SPOT 27,59 Year 2008
Nominal Maturity EX_Rate FWD_Rate Profit/Loss
1 000 000 € 21.1.2008 26,320 27,502 1 181 712,00
1 000 000 € 20.2.2008 25,305 27,476 2 171 288,33
1 000 000 € 20.3.2008 25,495 27,453 1 957 867,48
1 000 000 € 21.4.2008 25,090 27,431 2 341 449,47
1 000 000 € 20.5.2008 25,070 27,412 2 342 034,28
1 000 000 € 20.6.2008 24,165 27,395 3 229 621,93
1 000 000 € 21.7.2008 22,970 27,379 4 409 212,40
1 000 000 € 20.8.2008 24,410 27,366 2 955 805,70
1 000 000 € 22.9.2008 24,075 27,354 3 279 401,84
1 000 000 € 20.10.2008 25,000 27,345 2 345 000,80
1 000 000 € 20.11.2008 25,635 27,338 1 702 602,59
1 000 000 € 22.12.2008 26,370 27,332 962 207,21
28 878 204,03Grand Total 2008
Development of year 2008
Year 2008 was accomplished with high fluctuations and unexpected changes. The CZK reacted swiftly on the crisis. The rapid strengthening of CZK was followed by a huge fall, related to the start of crisis. According to Tab. 5, the hedging was efficient, but it should be noted that the July result represents 15% of the total profit.
Figure 10: CZK/EUR for 2008 (Source: Own calculations based on the CNB)
Development of year 2009
The first half of 2009 was characterized by the overall crisis and high uncertainty. The wea-kening of CZK was the expected reaction. The following correction, in beginning of April, eliminated the dip and the CZK returned to the appreciation trend.
However, the results of hedging operations show clearly negative figures (see Tab. 6); thus, it was very unprofitable for the company to make a currency hedging in this year.
Exchange rate on SPOT 28,225 Year 2007
Nominal Maturity EX_Rate FWD_Rate Profit/Loss
1 000 000 € 22.1.2007 27,805 28,167 362 491,56
1 000 000 € 20.2.2007 28,105 28,150 45 308,29
1 000 000 € 20.3.2007 27,810 28,134 324 118,11
1 000 000 € 20.4.2007 28,035 28,119 83 921,04
1 000 000 € 21.5.2007 28,165 28,105 -60 282,93
1 000 000 € 20.6.2007 28,730 28,092 -638 493,80
1 000 000 € 20.7.2007 28,255 28,079 -175 711,56
1 000 000 € 20.8.2007 27,700 28,068 368 063,77
1 000 000 € 20.9.2007 27,485 28,058 572 832,21
1 000 000 € 20.10.2007 27,210 28,049 838 593,75
1 000 000 € 20.11.2007 26,690 28,040 1 350 348,39
1 000 000 € 20.12.2007 26,360 28,033 1 673 096,13
4 744 284,98Grand Total 2007

REDETE – ECONOMIC DEVELOPMENT AND ENTEREPRENEURSHIP IN TRANSITION ECONOMIES
603
Figure 11: CZK/EUR for 2009 (Source: Own calculations based on the CNB)
Table 6: Evaluation of 2009 and 2010 (Source: Own calculations)
Exchange rate on SPOT 25,455 Year 2010
Nominal Maturity EX_Rate FWD_Rate Profit/Loss
1 000 000 € 20.1.2010 25,890 25,529 -360 925,95
1 000 000 € 22.2.2010 25,755 25,554 -200 800,92
1 000 000 € 22.3.2010 25,465 25,580 114 540,94
1 000 000 € 20.4.2010 25,305 25,605 300 099,65
1 000 000 € 20.5.2010 25,920 25,631 -289 124,81
1 000 000 € 21.6.2010 25,765 25,657 -108 132,42
1 000 000 € 20.7.2010 25,350 25,683 333 076,80
1 000 000 € 20.8.2010 24,800 25,710 909 502,86
1 000 000 € 20.9.2010 24,670 25,736 1 066 145,76
1 000 000 € 20.10.2010 24,500 25,763 1 263 005,50
1 000 000 € 22.11.2010 24,695 25,790 1 095 082,08
1 000 000 € 20.12.2010 25,265 25,817 552 375,49
4 674 844,99Grand Total 2010
Development of year 2010
The short term trend line of 2010 was above the long term, but almost parallel. The appreciation was therefore very similar to the long-term expectations. After a very turbulent year of 2009, the CZK reacted immediately, even to usually weak factors. Regarding the hedging strategy, the positive forward points contributed to the final positive result (see Tab. 6).
In conclusion, the currency hedging for the artificial exporting company can be considered as successful, with the cumulated profit of CZK 95.196.015, 95.
Exchange rate on SPOT 24,79 Year 2009
Nominal Maturity EX_Rate FWD_Rate Profit/Loss
1 000 000 € 20.1.2009 27,905 24,708 -3 197 364,78
1 000 000 € 20.2.2009 28,810 24,679 -4 130 774,57
1 000 000 € 20.3.2009 26,625 24,650 -1 974 661,81
1 000 000 € 20.4.2009 27,010 24,621 -2 389 026,48
1 000 000 € 20.5.2009 26,625 24,591 -2 033 868,59
1 000 000 € 22.6.2009 26,015 24,561 -1 454 188,14
1 000 000 € 20.7.2009 25,840 24,530 -1 309 985,13
1 000 000 € 20.8.2009 25,585 24,499 -1 086 259,55
1 000 000 € 21.9.2009 25,165 24,467 -698 011,40
1 000 000 € 20.10.2009 25,720 24,435 -1 285 240,70
1 000 000 € 20.11.2009 25,885 24,402 -1 482 947,43
1 000 000 € 21.12.2009 26,360 24,369 -1 991 131,60
-23 033 460,19Grand Total 2009

REDETE – ECONOMIC DEVELOPMENT AND ENTEREPRENEURSHIP IN TRANSITION ECONOMIES
604
Figure 12: CZK/EUR for 2010 (Source: Own calculations based on the CNB)
Fig. 13 confirms the turbulent development of CZK/EUR. This development, i.e. weakening of
CZK, caused problems to majority of the exporters hedged. Two scenarios have been used for the model example. Scenario 1 means the weakening to the level of 27,000 CZK/EUR, scenario 2 means the strengthening to the level of 25,000 CZK/EUR.
Figure 13: CZK/EUR for 1/2008 – 2/2010 and the scenario determination (Source: Own calculations based on the CNB)
The selection of five typical hedging strategies frequently used among the exporters has been
made. All data were gained from Komerční banka, a.s. Tab. 7 briefly summarizes the main features of derivatives (see Henderson, 2002, especially chapter 7, for an overview of hedging strategies). The “SPOT” column presents a reference value of CZK/EUR valid at the moment of strategies creation. The premium is the option premium paid. Columns marked with a minus sign (-Call; -Put) denote the strike prices of sold options.
22,00 22,50 23,00 23,50 24,00 24,50 25,00 25,50 26,00 26,50 27,00 27,50 28,00 28,50 29,00 29,50
01.08 03.08 05.08 08.08 10.08 12.08 03.09 05.09 08.09 10.09 12.09
MONTH
CZK/EUR
CNB 40-day average
200-day average
Scenario 1
Scenario 2

REDETE – ECONOMIC DEVELOPMENT AND ENTEREPRENEURSHIP IN TRANSITION ECONOMIES
605
Table 7: Comparison of hedging strategies for € 1.000.000 on February 23, 2011
Druh zajištění SPOT STRIKE Premium STRIKE
-Call STRIKE
- Put
1 Forward 25,750 25,885 0€ 2 Nákup PUT EUR 25,750 25,885 36.900€ 3 Leveraged synthetic FWD 1: 2 25,750 26,450 0€ 26,450 4 Seagull 25,750 25,900 0€ 26.500 24,800 5 Knock In Forward
(Leveraged 1:1,5), KI 26,850 25,750 26,050 0€ 26,050
1. Forward – The exporter is hedged at level of 25,885 CZK/EUR and is obliged to deliver €
1.000.000 to the agreed date. The premium is not paid.
2. Purchase PUT EUR – The exporter is hedged at level of 25,885 CZK/EUR. It has the right, but not the obligation, to realize hedging. For this right 36.900 € is paid.
3. Leveraged synthetic Forward 1:2 – The exporter is hedged at level of 26,450 CZK/EUR. For this right, however, the obligation is applied (i.e. counterparty's right) to exchange on the invitation (i.e. implementation of sold option) twice the volume, i.e. € 2.000.000 for 26,450 EUR.
4. Seagull – If the exchange rate at the date of implementation is within <24,800; 25,900>, the exporter is hedged at level of 25,900 CZK/EUR. If the CZK is weaker, it can benefit up to 26,500 CZK/EUR. If the CZK is stronger, the exporter receives 1.000.000 * 1,100 (i.e. 25,900 – 24,800) = 1.100.000 CZK.
5. Knock in Forward, leveraged 1:1, 5, KI 26, 850 – The exporter is hedged at level of 26,050 CZK/EUR (i.e. right). However, if 26,850 CZK/EUR is traded (activation barrier), it has the obligation to exchange on the invitation of counterparty (i.e. implementation of sold option) € 1.500.000 for 26,050 EUR.
Tab. 8 summarizes the impact of above strategies for given exchange rate predictions. The “In
Total” column presents the overall results, including the paid option premium. The model is based on standard assumptions that each party uses its option right, provided it is advantageousness.
Table 8: Overall impact of derivatives at predicted rates (Source: Own calculations)
Hedging strategy Scenario 1 Scenario 2 Loss In total Sold Profit In total Sold
1 Forward -1.150.000 -1.150.000 1.000.000€ 885.000 885.000 1.000.000€ 2 Purchase PUT EUR 0 -955.000 0€ 885.000 -70.000 1.000.000€ 3 Leveraged synthetic FWD 1:
2 -1.100.000 -1.100.000 2.000.000€ 1.450.000 1.450.000 1.000.000€
4 Seagull -500.000 -500.000 1.000.000€ 900.000 900.000 1.000.000€ 5 Knock In Forward (Leveraged
1:1,5), KI 26,850 -1.900.000 -1.900.000 2.000.000€ 1.050.000 1.050.000 1.000.000€
Tab. 8 shows that scenario 1 (i.e. the strengthening of CZK) leads in all case to the loss. This
result is, of course, predictable, since the exporter is hedged against strengthening and not weakening of CZK. The amount of the loss can be reduced by the selection of appropriate derivative. The forward with its firm commitment to fulfill the term does not offer many opportunities. Strategy 2 means the loss of 0 CZK (non-implementation of option) and the total loss is equal to the option premium paid. This loss would be constant even under the catastrophic weakening of CZK. The leverage effect of strategy 5 has very negative impact. Due to the break-through of action barrier (27,000 › 26,850), the counterparty has acquired the right to purchase €

REDETE – ECONOMIC DEVELOPMENT AND ENTEREPRENEURSHIP IN TRANSITION ECONOMIES
606
2.000.000 for a favorable rate. In case of unexpected weakness, strategy 4 seems to be most ad-vantageous, since the wide opening of seagull that protects against weakness.
Scenario 2 leads, as expected, in all cases to exchange rate profit. When using strategies 1 and 2, the profit remains the same. Nevertheless, the option premium paid causes the overall loss. Strategy 4 offers a slightly better result than forward and due to the absence of option premium is generally interesting.
With respect to the outcomes, the most attractive are the strategies with financial leverage, namely strategies 3 and 5. Concerning strategy 3, the realized exchange rate profit is approxima-tely 64% higher than in case of forward. As demonstrated in scenario 1, this option is associated with a high risk in case of the CZK strengthening. It confirms a fundamental law financial markets that high profits are linked with high risk.
The overall findings indicate that the final result is influenced not only by non-suggestible factors of the financial market, but also by the suitable selection of hedging method. The selection of hedging instrument is one of the key aspects of hedging effectiveness. This selection is dependent on managers, usually financial managers, on market information but also on education of managers and their attitudes towards risks.
The questionnaire survey was conducted on managers of industrial companies in South Moravian region in order to determine whether these companies monitor the risks to which they are exposed. The outcomes of the survey are presented in Fig. 14 and Fig. 15.
Figure 14: The overview of monitored risks in industrial companies (Source: Own elaboration)

REDETE – ECONOMIC DEVELOPMENT AND ENTEREPRENEURSHIP IN TRANSITION ECONOMIES
607
Figure 15: Attitude of managers towards risks (Source: Own elaboration)
The results indicate that the most frequently monitored risks associated with the rising costs
arising from changes in inputs prices. Therefore, it is likely that companies control their suppliers and monitor input markets. It has been observed that firms do not reflect financial, legal, environmental or information risks. Despite the rather financial crisis and several month long shortage of liquidity, it seems rather surprising that companies do not consider financial risks. Further research should investigate whether the companies include the potential exchange rate risks, which may be linked to the prices of their inputs (or outputs as well), into the prices of inputs. The prevailing attitude towards risk among observed firms is neutral. This finding can be viewed as a form of passivity rather than proactive negotiations aiming to take advantages of possible opportunities. It is therefore conceivable that risks that are monitored and subsequently controlled are related to this attitude.
Figure 16: The relation between managers' education and used hedging strategies (Source: Own elaboration)
:

REDETE – ECONOMIC DEVELOPMENT AND ENTEREPRENEURSHIP IN TRANSITION ECONOMIES
608
Table 9: Results of Chi-square test between education of managers and hedging against exchange rate risk (Source: Own calculations)
Pearson Chi-square test H0: Variables are independent. H1: Variables are dependent.
Chi-square: 14.58912 DF: 3
P-value: 0.00220
The relation between managers' education and the company's hedging has been tested in
examined industrial enterprises in the Czech Republic (see Fig. 16). The chi-square test has been performed with a significance level £= 0.05. The null hypothesis was rejected since p-value is lower than the level of significance. The test has proved that the education of the employee, who makes decisions about the hedging against exchange rate risks, influences whether the company is hedged or not. The managers' education is a significant aspect that has to be taken into consideration within the process of currency hedging.
Conclusions
According to the Henderson (2002), the management of the currency risk is to be a part of the corporate financial strategy. Nevertheless, our study substantiated that in the field of currency risk management, there exist many situations which are extremely difficult to predict. Taleb (2007) describes these situations, which led to unexpected jumps and discontinuities, as “Black Swans”,
For a serious consideration of hedging strategy as a part of financial strategy in the Czech environment, the long term and short term analysis of CZK/EUR development is to be done. Based on the long term analysis (ten years), the long term appreciation rate has been calculated for CZK/EUR. With help of the artificial company, the hedging procedure was simulated to compute the overall efficiency. After ten simulations, the conclusion is that for an exporting company, the use of currency hedging makes sense.
We can argue to add the hedging strategy to overall financial strategy. However, in times of crisis and unexpected weakening of the CZK, high losses occur. This “impact of highly improbable” (see Taleb, 2007) is one of the biggest risks of hedging and the company has to be strong enough to overcome these unexpected periods. The unpredictable situations, or their impact, have to be considered and solved as the part of hedging strategy.
The results clearly indicate that hedging against exchange rate risk is relevant. The essenti-al prerequisite for successful hedging is the accurate knowledge of net foreign exchange expo-sure (see Homaifar, 2003), without which the attempt to hedge can become mere speculation. The creation and compliance of a directive for the implementation of hedging transactions should be self-evident. This is also related to the issue of managers, their education and com-petencies. The research shows that in the context of competitiveness the company must very carefully choose a manager and develop further education to be able to manage and eliminate currency risks.
The findings confirm that from the standpoint of economic efficiency, the easiest hedging in-strument does not have to be the most advantageous one. The forward contract is well-known, widely used and easy to understand, nevertheless, the options are limited. In times of economic crises, when the predictability of future cash-flows decreases (i.e. from the point of view of the absolute amount and timing), it is appropriate to deal with more complex products that give the exporter more opportunities if the prediction fails and cash-flow develops unfavorably. In this case, the possibility of options, respectively the possibility of their non-utilization, represents the way how to mitigate the cumulative negative impact of a cash flow loss.
The manager who has developed a risk management strategy should focus on exchange rate risk and monitor regularly its potential impact. The economic crisis has brought the increased uncertainty and high volatility of currency markets into the financial planning. Yet,

REDETE – ECONOMIC DEVELOPMENT AND ENTEREPRENEURSHIP IN TRANSITION ECONOMIES
609
it does not mean that the businesses no longer deal with the issue of exchange rate hedging. By the knowledge and selection of suitable financial instruments, the company may convert the unilateral dependence on currency development into the comparative advantage.
Acknowledgement
This paper was worked out thanks to Internal Grant Agency of Faculty of Business and Eco-nomics, Mendel University in Brno project No. 33/2012.
Reference list
1. Althaus, C. E. (2005). A Disciplinary Perspective on the Epistemological Status of Risk. Risk Analysis. 25(3), pp. 567-588
2. Anderson, D. R. et al. (2010). Statistics for Business and Economics. South-Western College Pub
3. Beltratti, A., Laurent, A., Zenios, S. A. (2004). Scenario modelling of selective hedging strategies. Journal of Economic Dynamics and Control. 28(5), pp. 955-974
4. Coyle, B. (2000). Hedging Currency Exposures. Financial World Publishing 5. Chisholm, A. M. (2010). Derivatives demystified: a step-by-step guide to forwards,
futures, swaps and options. New York: John Wiley & Sons 6. Choi, M. S. (2010). Currency risks hedging for major and minor currencies: constant hedging
versus speculative hedging. Applied Economic Letters. 17, pp. 305-311 7. Donoso, G. (1995). Exporting and hedging decisions with a forward currency market: the
multiperiod case. The Journal of Future Markets. 15(1), pp. 1-11 8. Fotr, J., Hnilica, J. (2009). Aplikovaná analýza rizika. Praha: Grada Publishing, a.s. 9. Gregorius VIIII (1227-1241). Decretalium Complatio. http://www.documentacatholicaomnia.
eu/01p/1227-1241,_SS_Gregorius_VIIII_Decretalium_Compilatio,_LT.pdf (accessed 1.10.2011.)
10. Henderson, C. (2002). Currency strategy. New York: John Wiley & Sons 11. Homaifar, G. A. (2003). Managing Global Financial and Foreign Exchange Rate Risk. New
York: John Wiley & Sons 12. Hula, J. (2012). Možnosti využití spotů a derivátů v podnikové praxi. Finanční management.
10(2), pp. 41-42. 13. Jílek, J. (2005). Finanční a komoditní deriváty v praxi. Praha: Grada Publishing 14. Knight, F. H. (1921). Risk, Uncertainty and Profit. Cambridge: The Riverside Press Houghton
Mifflin 15. Kolb, R. W., Overdahl, J. A. (2010). Financial derivatives – Pricing and risk management.
New York: John Wiley & Sons 16. Martinovičová, D., Beranová, M., Polák, J., Drdla, M. (2010). Teoretické aspekty kategorizace
rizik. Acta universitatis agriculturae et silviculturae Mendelianae Brunensis. LVIII(3), pp. 131-136
17. Merna, T. (2007). Risk management. Brno: Computer Press 18. Pulchart, V. (2011). Lidé a jejich kompetence v managentu rizik. Finanční management. 9(2),
pp. 41-42. 19. Riederová, S. (2010). Currency hedging with help of derivates. Acta universitatis agriculturae
et silviculturae Mendelianae Brunensis. LIX,(4), pp. 273-280 20. Subramanian, R. A. (2011). The importance of currency returns and currency hedging. MSCI
Barra Research Paper No. 13. http://ssrn.com/abstract=1915325 (accessed 30.05.2012.) 21. Taleb, N. N. (2007). The Black Swan: The Impact of the Highly Improbable. Random House 22. Tichý, M. (2006). Ovládádní rizika. Praha: C.H. Beck 23. Yan, X., Gang Su, X.(2009). Linear regression analysis: Theory and computing. World
Scientific Publishing Co.

REDETE – ECONOMIC DEVELOPMENT AND ENTEREPRENEURSHIP IN TRANSITION ECONOMIES
610
THE EFFECTS OF DIRECT TAXATION ON ECONOMIC OPERATORS IN ROMANIA
Chirculescu MARIA FELICIA280
Dobrota GABRIELA281
Abstract
In Romania, on the fond of inclusion of the national economy on the market economy path, policymakers have taken a series of measures which have affected, on the one hand, the replace of system taxation and on the other hand, the its subsequent adjustment. These, by more often than not have achieved its intended purpose or even, in some cases, had effects contrary to tho-se desired. The analysis undertaken in Romania, on the horizon 1995-2010 evaluates quantita-tive and qualitative effects generated by direct taxation on the activity of economic operators. At the level of the enterprises, the implications to direct taxes aims: the number and the con-figuration of economic operators, their legal structure, territorial dispersion and their size but and the economic and financial performance – (turnover, value added, gross investment). So, we have in mind that direct taxation determine a variety of effects, in particular on adminis-trative and organizational structure of the companies and of the results achieved by them. The paper is structured as follows: introduction, literature review, tax measures adopted in Roma-nia after 1990, the effects of fiscal policy promoted on the legal form of the active companies, on the size of the active companies, on the economic and financial results of the active compa-nies, concluding remarks.
The results obtained from the analysis performed allow detachment the following ideas: the transition from one system to another to the revenues and profits performed, even if brought in real mode, a reduction in the tax burden for companies and individuals, has not led to an increase in the number of this type of economic subjects, recording even important discounts of its; there has been a continuous increase of the number of companies registered and o the active companies on the timeframes in which they have received exemptions from point of view of taxation; the fluctuations of macroeconomic parameters, on amid slow by fiscal relaxation in certain periods of time, can be explained by "strange" behaviours of the taxpayers from taxes, characterized by the proliferation of the tax evasion, but also by the passage of some companies in the "gray area" of the economy.
Keywords: direct taxation, economic operators, financial performance, fiscal policy
280 Constantin Brâncusi University from Târgu Jiu, Faculty of Economics and Bussines Administrations,
[email protected] 281 Constantin Brâncusi University from Târgu Jiu, Faculty of Economics and Bussines Administrations,

REDETE – ECONOMIC DEVELOPMENT AND ENTEREPRENEURSHIP IN TRANSITION ECONOMIES
611
1. Introduction
The tax system changes in recent years, resulting in permanent need to adapt to new trends and mechanisms in the real economy, in turn, have produced multiple effects on the activities of businesses, generating a veritable fiscal revolution.
Through the analyzes made, we aim to provide answers to the problem of contradiction bet-ween the growing need of budget revenues on the one hand, which entails a continuous amplifi-cation of taxation, and on the other hand, the need to stimulate the economic development activi-ties that but can not do without them have significantly increased resources to thrive in an en-vironment of increasing competition.
In this way the paper contains an analysis based on statistical series of direct taxation impact on economic activity.
The economic operators are sensitive to the tax obligations incumbent on them, because they affect the remaining resources and decisions on the use of tax revenues. In general, the impact of direct taxation on economic activity is present in the following aspects:
- level taxes resizes businesses and households incomes, influencing consumer demand;
- levying and collecting taxes provides state financial resources to support growth economic policies;
In Romania the most current income is the income of a fiscal nature, so the direct taxes and
indirect taxes.
2. Literature review - Theoretical considerations on direct taxation and its implications on economic operators in literature
If indirect taxation requires a high degree of harmonization, as the free movement of goods and freedom to supply services, the same can be said about direct taxation, which is why the treaty which establishes the European Community does not provide specific alignment of direct taxes. Certain aspects of direct taxation "does not actually require any harmonization or coordination and are left entirely to the Member States, according the principle of subsidiarity" (P. Brezeanu, Taxation: Concepts, theories, politics,and practical approaches Publishing Wolters Kluwer, pp. 452, Bucharest, 2009).
Tulai Constantine Professor in his work "Public Finance and Taxation" (Tulai Constantin Public Finance and Taxation, Publishing House Book of Science, Cluj Napoca, 2003, pp. 258-261) supports the operation of a tax system based on two categories of taxes (direct taxes and indirect taxes), saying that „direct tax has advantages and disadvantages which are recognized for a long time. But its advantages are falling today, while shortcomings are becoming more sensitive, so it is increasingly criticized”.
Taxes, especially business, is one of the few areas of Community policyin which the Council may adopt legislative measures than unanimously. For this reason, measures in this field has proved difficult. Initially, two directives only a convention were in force, all three are taken at the Council meeting on 23 July 1990. Subsequently, on 1 December 1990, the Council adopted a package of measures to tackle harmful tax competition, aimed at instilling a new dynamism fiscal coordination within the EU for both business and individuals.
Within the European Union Member States, national authorities may take decisions in the field of direct taxation. The European Economic Community Treaty (Treaty establishing the European Economic Community (EEC Treaty) Rome, 25.03.1957, in force as of 01.01.1958) is provided direct tax harmonization across Member States. The provisions of the Treaty is aimed at ensuring the free movement of workers, establishment in a Member State, the movement of capital, the

REDETE – ECONOMIC DEVELOPMENT AND ENTEREPRENEURSHIP IN TRANSITION ECONOMIES
612
functioning of the common market, preventing distortion of competition and elimination of dou-ble taxation in the community.
Most of the provisions relating to direct taxes within the European Union is a vast network of bilateral tax agreements concluded between Member States and third countries covering the area of taxation revenue streams.
Determining the characteristics of direct taxes was left to the Member States in accordance with the subsidiarity principle (principle of subsidiarity requires transfer tax competition nationna-lly and internationally should appear only where aims can not be achieved by national measures. According to this principle EU Institutions issued regulations only when Member States agree that the actions taken by each country, also in areas where EU institutions have no competence will act only when the aims envisaged can not be brought out by Member States), but the situation is different when these taxes have an impact on the four freedoms under the EC Treaty (free movement of goods, persons, services and capital) and the right of establishment of natural and legal persons in a Member State.
In the field of direct taxation, fiscal policy in the European Union, has the following objectti-ves: prevention of fiscal evasion (tax within interest) and the elimination of double taxation( through conventions on dividend payments to non-residents persons).
Structure and evolution of direct taxes in EU Member States (According to data presented in "Structures of the Taxation Systems in the European Union", Luxembourg, Office for Official Publications of the European Communities, 2011) indicates major differences between countries. Thus, between 1995 - 2002 the share of direct taxes in total tax liabilities vary between 31,5% and 33,5% for EU 25 and EU 15 and between 22,2% and 29,1% for November 10 States. Any member state of the European Union for personal income taxes are the most significant share in total direct taxes.
The total record of revenues from direct taxes and the entirely collect of full tax liability can not be achieved only under conditions where there is adequate cooperation between tax administrations of the Member States. In this respect, the provisions of Council Directive 77/799/EEC concerning mutual cooperation between national tax authorities are appreciated as compliance leads to increased cooperation between national tax administrations.
3. Tax measures adopted in Romania
Measures that have been adopted in the frame of tax reforms have varied from period to period and had different motivations. Although the most common adopted measure was to reduce tax rates, there are disparities from one period to another in the levels of these shares.
According to the Government Programme for the period 2005 - 2008, through taxes it aimed to ensure economic growth and development,the fiscal consolidation and development of the middle class.
In other words, for the current period is envisaged reduce exemptions and exemptions from taxes and fees, more transparent business environment and broadening the tax base.
The main measures in the area of policy adopted during 2005 - 2008 (According to the Government Programme 2005-2008, December 2004) were considered to support economic growth, aiming particularly relaxing taxation on earnings on wages, capital, lower contribution rates social security, in order to eliminate the underground economy.
Projections of future fiscal policy aims to respect the neutrality taxatation principles (ie tax shall not cause asymmetric shocks to the economy subjects) fiscal efficiency (tax must exert an impact on economic behavior concerned), equal tax treatment (ie economic subjects similar economic functions in a certain period of time, receive the same tax treatment), fiscal sustaina-bility (which assumes that tax matters can be stimulated by tax, for extrusion, stability and achieve its transparency) .

REDETE – ECONOMIC DEVELOPMENT AND ENTEREPRENEURSHIP IN TRANSITION ECONOMIES
613
The fiscal relaxation has been proposed for the period 2005 - 2008 was followed to ease the business environment and encourage formalization underground economy. Based on these considerations was adopted also the flat 16% personal income tax and corporation tax, in the hope that such a level of quota will increase the tax base through developing existing businesses through increased foreign direct investment and so on.
Government's view on fiscal policy was focused on ensuring a stimulating role of taxes in order to increase the economic growth, fiscal consolidation and development of the middle class.
Tax law reform envisages continuous reduction of exemptions and exemptions from taxes and duties in order to increase business transparency, improve competition and expanding the base of taxation (According Government Programme 2005 – 2008).
The main features of fiscal policy in the last period, which were subordinate objectives of economic growth and reduce inflation, were related mainly to:
- establishing general government deficit at a level correlated with macroeconomic objectives and reduce quasi – fiscal in balance, to support efforts to reduce inflation in line with the nominal convergence criteria;
- supporting the convergence of Romanian economy to European economies;
- relaxation of taxation on income (especially on labor) and capital;
- reduce social welfare rates to eliminate competitive disadvantage and reducing fiscal economy;
- further harmonization of tax legislation with EU norms.
By using measures of fiscal loosening it was wanted to ease the business environment, stimulating private initiative and encourage formalization hidden economy, stimulating economic growth by expanding the tax base.
Currently supporting the existence of income tax or a flat tax is argued that this does not contradict the community acquis , representing an incentive for employment.
A proportional tax on income or profit is characterized by simplicity, transparency and effi-ciency in collection. With this type of tax is not an extra factor stimulates production against another (eg, labor against capital) as tax rate is equal to the income tax rate.
Reducing corporate tax rate in Romania with nine percentage points from the previous system of tax (from 25% to 16%) aimed to stimulate investments, discourage speculation and encourage investment trading business generating productive jobs.
Studies in this area have shown that the rate of 16% for profits tax has managed to increase the gap already between businesses already established in the market and small economic agents, in many cases, new businesses entrants, and more , the latter could not face competition of big agents, with great profit, because they were taxed equally.
Introduction of a flat tax has been achieved in terms: - increase gas and electricity tariffs (instrumental elements in production costs and services,
household consumption expenditure in level and structure of commodity prices and tariffs for services);
- requirement to increase excise duties in order to line up at the EU level;
- changes in exchange rates between national currencies and major currencies (euro and dollar) in a different way, with lightning fast direct impact on the development of exports;
- introducing numerous compensatory measures leading to balance the state budget.
Worldwide there is a change in tax philosophy in the sense that it has increased the importance of indirect taxes, ie those taxes paid by all taxpayers, without discrimination. In theory, reducing tax rates allow increasing the tax base, as relaxing reduces tax evasion, benefiting the creation of new jobs.

REDETE – ECONOMIC DEVELOPMENT AND ENTEREPRENEURSHIP IN TRANSITION ECONOMIES
614
In Romania, according to existing government program for the next period, there will be no legislative changes relating to the tax rate of profitability of businesses (where the amount to be paid from the state budget with tax title, calculated by application rate for base exceeds the amount provided for each tranche of profit provided by GEO no. 49/2009 on regulations of financial and fiscal measures, published in Official Gazette no. 249/14.04.2009), although this level the statutory corporate tax rate places Romania among the last countries in the European Union (10% Bulgaria, Cyprus 10%, Ireland 12.5%, Latvia 15%, Lithuania 15%, Romania 16%, Poland 19%, Slovakia 19% - other Member States practicing corporate tax rate of over 20%).
4. Effects of fiscal policy promoted on the legal form of active companies, the size of active companies, results and cash management of active companies
In Romania, in the frame of national economy on track amid joined market economy, policy-makers have taken a number of measures that affected, on the one hand, the restoration of the system of taxs, on the other hand, further refinement.
Firm-level taxation direct tax implications concern: the number and configuration of economic, legal structure, territorial dispersion and size, and also financial- economic performance (turn-over, gross investment, value added).
The analysis in this respect in Romania, the horizon of time 1995 - 2010, I tried to highlight the quantitative and qualitative effects resulting from direct taxation on various macro and micro-economic measures.
Effects of fiscal policy on the legal form of the active companies are generated by the practice of exemptions or exemptions or partial taxable profits in certain times and for certain geographic areas (eg exemptions on certain times and for certain geographic areas considered "disad-vantaged"). If the short term, these measures include an increase in the use of resources and social ease tensions by reducing unemployment, with direct impact on consumption in the medium term these commitments will positively influence public budget tax revenues by extending taxable matter and long term, it will be contrary, leading to an increase in "false" in the number of companies and thus we see an escalation of tax evasion.
Based on these aspects, most entrepreneurs are moving towards the establishment of capital companies, which in terms of fiscal view, confers on the one hand, a lower constraint, on the other hand, greater leeway in the profit taxable income through deductions. During 1995-2010 the development of active companies in Romania is
Tabel no. 1. Evolution of active companies in Romania, during 1995-2002
No. crt.
Companies 1995 1996 1997 1998 1999 2000 2001 2002
1. State companies 346 281 275 183 153 154 144 136 2. Companies
registered to Trade Register
503645 553.378 598214 619.465 676.876 710.614 751.705 802.884
3. Active companies 304.013 311.786 316.476 318.193 318.583 307.910 323.147 314969 4. Private
entrepreneurs 226.407 255.030 263.940 318.037 367.173 394.868 403.333 398612
- family associations 64.205 82.533 90.944 120.043 128.265 133.610 142.573 152389 - independent persons 162.202 172.497 172.996 197.924 238.908 261.258 260.796 246223
Source: Romania Statistical Yearbook

REDETE – ECONOMIC DEVELOPMENT AND ENTEREPRENEURSHIP IN TRANSITION ECONOMIES
615
Tabel no. 2. Evolution of active companies in Romania, during 2003-2010
No. crt.
Companies 2003 2004 2005 2006 2007 2008 2009 2010
1. State companies
145 136 127 126 110 115 116 112
2. Companies registered to Trade Register
877.971 968.783 1.061.947 1.154.176 1.259.288 1.362.817 1.414.400 1.546.784
3. Active companies
348916 394383 432.903 461.686 499.747 533.861 519.325 470.080
4. Private entrepreneurs
407210 410642 381.468 324.700 330.438 306.879 307.777 312.579
- family associations 160866 164236 147.024 116.421 115.728 46.855 32.262 31.378
- independent persons
246344 246406 234.444 208.279 214.710 260.024 275.515 281.201
Source: Romania Statistical Yearbook
Analyzing the data presented in table no. 1 and 2 we conclude the following issues: - tax reductions for certain periods of time resulted in companies increasing of 1,04 times in
1997 compared to 1995 and 0,63% in 1999 compared to 1997;
- in the period 1999 - 2000 amid direct fiscal constraints, the response was the contraction of number of active operators, namely from a number of 318.736 in 1999 to 308.064 in 2000, which meant the relative size a reduction in the number of active companies with 3,35 percentage points;
- next period, fiscal relaxation was accompanied by consecutive increases in the number of active companies, as follows: 1,24 times in 2002 compared to 2001, with 13,02% in 2004 compared to 2003, and in the period 2004 - 2010 the number of active companies rose 35,35% aproximately;
We see that the overwhelming weight of the total active companies in terms of legal form of ownership,belong to limited liability companies is on average about 93%, followed (after 2001) of the joint stock companies and other legal firms types.
In dynamics, it is found that the number of limited liability companies increased from 275.012 in 1995 to 533.976 in 2008, which was a 94,16% growth of the and the evolution of limited liability companies has been increasing over the interval 1995 - 1999 from a total of 10.603 in 1995 to 12.678 in 1999, while between 2000 to 2008 the number of stock companies active fell from 12.536 in 2000 to 9.354 in 2008 which relative size meant a reduction of 25,38%.
Effects of direct taxation on the size of companies active in Romania is that "when the eco-nomy there are a large number of small companies, consolidation and a more competitive market position ... requires increasing their financial strength by concentrating activities” (Corduneanu Carmen, Tax system in finance science, Codecs Publishing House, Bucharest, 1998, page 463).
Companies size can be influenced by fiscal policy measures, especially by: - tax measures adopted over time in the taxation of capital companies according to size;
- taxation of mergers and divisions procedures of companies;
Adoption of the first steps is a specific practice in developing countries, who want to form a sector of small and medium-sized firm that will provide a basis for future sustainable development of the national economy. In countries that practice this differentiated taxation, usually, benefits of small and medium companies are taxed more lightly than those of larger companies. In Romania, this method of stimulating the formation of a strong SME sector was implemented during 1995-1996, when there was a difference in small and medium taxpayers (Government Ordinance no. 70 of 29 august 1994, published in Official Gazette no . 246 of August 31, 1994).

REDETE – ECONOMIC DEVELOPMENT AND ENTEREPRENEURSHIP IN TRANSITION ECONOMIES
616
As of September 1, 2001 (Government Ordinance no. 24 of august 17, 2001, published in Official Gazette no. 472 of August 17, 2001), Romania is practiced impose differential capital companies, depending on their size. Thus, the enterprises were given an opportunity, called on the legal text micro (enterprises with annual incomes up to 100.000 euros (RON), with 1 to 9 employees, entirely private capital) to prefer instead to pay tax a tax of 1,5% of total revenue (3% as of January 1, 2005).
Table no. 3 presents the structure of active companies from Romania, during 1995 - 2010 on four size classes, by number of employees.
Tabel no. 3. Dimensions of active companies in Romania, during 1995-2002
No. crt.
Indicators 1995 1996 1997 1998 1999 2000 2001 2002
1. Total number of active companies, which from:
304.359 312.067 316.751 318.376 318.736 308.064 311.260 315.105
2. up to 9 employees included
283.997 286.035 284.052 283.128 282.341 270.843 271.713 274.674
3. by 10 up to 49 employees included
13.400 18.160 23.202 25.626 26.764 28.085 29.888 30.418
4. by 50 up to 249 employees included
4.384 5.259 6.692 7.034 7.324 7.145 7.702 8.067
5. over 250 employees 2.578 2.613 2.805 2.588 2.307 1.991 1.957 1.946 Source: Romania Statistical Yearbook
Tabel no. 4. Dimensions of active companies in Romania, during 2003-2010
No. crt.
Indicators 2003 2004 2005 2006 2007 2008 2009 2010
1. Total number of active companies, which from:
349.061 394.519 433.030 461.812 499.857 533.976 519.441 470.192
2. up to 9 employees included
305.024 348.881 383.892 408.160 441.791 476.395 465.885 424.482
3. by 10 up to 49 employees included
33.581 34.823 38.175 42.510 46.536 46.112 43.673 37.498
4. by 50 up to 249 employees included
8.459 8.840 9.068 9.302 9.687 9.633 8.312 7.114
5. over 250 employees 1.997 1.975 1.895 1.840 1.843 1836 1.571 1.098 Source: Romania Statistical Yearbook
As seen from the data presented in Table. 4, very small companies with less than 9 employees
have major share in the total number of active companies, averaging about 89%, followed by businesses, with 10 to 49 employees including the share in total 8%, then companies with 50 to 249 employees including the share of 2% and of the very large, accounting for less than 1%.
Effects of direct taxation on results and cash management of active companies. Macroeco-nomic parameters on which ficalitaty expresses significant direct effect (turnover, gross invest-ment and value added) are presented in table. 5.

REDETE – ECONOMIC DEVELOPMENT AND ENTEREPRENEURSHIP IN TRANSITION ECONOMIES
617
Tabel no. 5. Turnover, direct investments, value added of active companies in Romania during 1995-2010
- billion lei -
Indicators Year
Turnover Gross investments Gross added value
(current prices) (current prices) (current prices) 1995 324.111 12.996 66.599 1996 406.757 20.945 101.854 1997 437.749 60.450 124.714 1998 594.973 140.643 157.436 1999 907.649 234.122 157.436 2000 1.396.332 265.650 336.959 2001 2.023.201 393.710 443.683 2002 2.675.915 412.743 520.535 2003 3.457.431 423.853 664.413 2004 4.508.430 627.490 892.590 2005 5.126.140 736.680 1.048.590 2006 6.275.350 874.570 1.278.500 2007 7.699.050 1.458.790 1.600.820 2008 9.547.900 1.431.020 2.211.560 2009 8.524.240 990.480 1.934.440 2010 7.112.452 689.452 1.745.245
Source: Romania Statistical Yearbook
The data presented in table. 5 we observe that the turnover recorded a value increasing, but the
smallest change in this regard was registered in 1997 (with only 7,62% compared to 2006), and the highest growth in 2000 (by 53, 84% compared to 1999). The study period (1995 - 2006) gross investment showed an increasing trend with fluctuations different from an increase of 188,62% in 1997 compared with 1996, an increase of 2,69% (in 2003 compared to 2002). Also the period 2007-2010 in the three indicators analyzed there was a progressive decrease from year to year.
We believe that these fluctuations of macroeconomic parameters amid slow tax relief for some period of time, can be explained by "strange" behaviors of tax payers, characterized by the proliferation of tax evasion, and the passage of companies in the economy "gray zone”
5. Conclusions
In a market economy, when a country reaches a level of development, economic processes should be self-regulating, and taxes can be characterized by neutrality (they do not favor, nor hinder investment, production, consumption, export and so on). In developing countries, taxes may perform an active role to influence economic activity. In recent years, the tax burden on direct taxes has declined in the European Union. We also be-lieve that there has been a concern for harmonization of direct taxes, the recent measures taken in this direction as a reaction to the existence of double taxation. In the transition countries there are a lot of implementing various tax reform and harmonization process has not yet reached the end.
Direct taxation is not only some rules, but is one of the values underlying the design and implementation of economic behavior and reactions. Therefore, a simple analysis of direct taxation is not sufficient to extract and evaluate its multifactorial impact on the whole society.
The importance of this chapter lies in the possibility that, through this analysis, to learn some conclusions with character of generality in terms of how direct taxation affects economic and financial performance of companies. Economic and financial performance has and has been a major concern for every trader, because it represents an essential criterion of supervision. However the notion of performance remains a problem as long as the company's performance nuanced definition is depending on the interests of users of information.

REDETE – ECONOMIC DEVELOPMENT AND ENTEREPRENEURSHIP IN TRANSITION ECONOMIES
618
As a whole the work is intended to be, on the one hand, one analytical work, and on the other hand an objective and practical work, able to create not only a more complete picture of the evolution of direct taxation on economic and financial performance at the micro level and to provide a basis for future solutions to tax practice in Romania. All this is necessary, as is noted that the fiscal measures necessary to achieve precise studies and documentation both on Romania's fiscal experience as tax effects can not be measured only in practice and the experience of other Member States' tax European Union, as tax effects of states close to the economic situation of Romania, can only be a fiscal barometer of attention. In conclusion, we believe that under a tax system always perfect and in constant motion, it is difficult to analyze the impact of direct taxation on the behavior of economic agents, since it is actually the result of the combined effects of all taxes and isolating the effects specificities of each fiscal instrument is difficult. In other words, the correlation values can not be judged separately, but as a whole system of direct and indirect influences that simplifies their statistical and mathematical exercise, relative to providing paradoxical , some logical and even acceptable results.
Reference list:
1. Burgio B., (1995) L’Union européenne et la fiscalité directe des entreprises, Revue des affaires européennes, LGDJ, nr.2
2. Corduneanu Carmen, (1998), The tax system in tax science, Codecs Publishing House, Bucharest
3. Dibout P., (1998), L’Europe et la fiscalité directe, Petites Affiches, 23 décembre, n°153,
4. Lăcrița N. Grigorie, (2007) Taxation. Debates and solutions, Irecson Publishing House, Bucharest
5. Moșteanu Narcisa Roxana, (2008) Taxation.Taxes.Case studies Universitara Publishing House, Bucharest
6. Nandra Elena Ramona, (2008) Tax Competition: Hell and tax havens S.C. Sfera Publishing House, Cluj-Napoca
7. Nica A., Şerbănescu C., (2008) Taxation.From law to practice (the V th edition), CH Beck Publishing House, București
8. Popeangă V., Popeangă V. N., (2006) Direct taxes, Focus Publishing House, Petroşani
9. Talpoş Ioan, (1997), Romanian finances, The III th edition, Sedona Publishing House, Timișoara
10. Tulai C. I., (2003) Public finances and taxation, Publishing House Book of Science, Cluj-Napoca
11. Tulai C., Şerbu Simiona, (2005) Comparative taxation and tax harmonization, Science House Book Publishing House, Cluj Napoca,
12. Vintilă Georgeta, (2006) Taxation, methods and tax techniques, Economic Publishing House, Bucharest
13. ***www.insse.ro (accessed 20.08.2012.) 14. ***www.taxeimpozite.ro (accessed 28.09.2012.) 15. ***www.mfinanţe.ro (accessed 20.08.2012.)

REDETE – ECONOMIC DEVELOPMENT AND ENTEREPRENEURSHIP IN TRANSITION ECONOMIES
619
ТHE IMPACT OF LOCAL GOVERNMENT IN LOCAL DEVELOPMENT WITH PARTICULAR EMPHASIS ON THE
REPUBLIC OF MACEDONIA
Florije MIFTARI282, Mirko TRIPUNOSKI283, Marina TOPALOSKA284
Abstract
Local Economic Development (LED) is a process by which the local government cooperates with public and private institutions to create favorable conditions for economic and social development. It focuses on the existing resources, such as access to various activities at the local and regional level to provide economic and social welfare, better living standards as well as reducing the unemployment and poverty.
The impact of local economic development in the region primarily is determined by national factors, of the central government, such as national development policies, the security situation in the country and the region, the country's geostrategic position, macroeconomic policy, fiscal policy, financial policy and the development of market economy. The local authorities, depen-ding on the level of their fiscal autonomy, financial capacity, administrative capacity, the geog-raphical position of the unit of local government, natural resources, municipal infrastructure, the educational structure of people, may significantly affect the promotion of their region to attract international and local investment to support the new and existing enterprises by creating conditions for business development, increased employment, improved living conditions, increase municipal budget revenues derived from business and other incomes. The aim of this study is not only to survey the rural and local development, but to analyze the impact of functional and fiscal decentralization in supporting and promoting the local and regional economic development in the Republic of Macedonia.
Keywords: local economic development, rural economic development, local government, decentralization, the Republic of Macedonia
282 Faculty of Economics, FON University, Skopje, Macedonia , [email protected] 283 Faculty of Economics, FON University, Skopje, Macedonia , [email protected] 284 Faculty of Economics, FON University, Skopje, Macedonia , [email protected]

REDETE – ECONOMIC DEVELOPMENT AND ENTEREPRENEURSHIP IN TRANSITION ECONOMIES
620
1. Introduction
One of the basic responsibilities and competences of the local government is the local econo-mic development. The local economic development is the most frequently used term in the local government units, and especially “misused” during the electoral campaigns by the Mayoral candi-dates with the full promise that they would commit to the local economic development. Unfortu-nately, most of them don’t even know what the concept implies.
With the transfer of the responsibilities, many of the local government units were able to take over the responsibility of the local economic development, as a process where the municipalities would influence the improvement and the promotion of the environment for the economic development of the region in order to improve the quality of living for the citizens. The goals of the local economic development will be realized by the local government in cooperation with the central government, the material sector, the citizens, the non-governmental organizations and other organizations in the country and abroad through complete utilization of the natural resour-ces, the creation of conditions for opening new businesses, creation of conditions for attracting fo-reign investments, the support for the small and medium enterprises as a major generator of the creation of the material assets.
The economic crisis of the 90s contributed to the local government units understanding that the policies and the economic responsibilities for development and growth are not only a duty of the state, but also significantly assisted by the influence and the performance of the lo-cal government. An efficacious and effective local government would be the one which crea-tes better conditions for the life of the citizens on the territory it represents. The improvement of the living standard depends on the possibility and the capability of creating new jobs, the preserving of the current employment, the creation of infrastructure for economic prosperity of the municipalities and the region. It is the private sector that creates material values in the local government units, however, their success depends on the facilitations of the local con-ditions which have an impact on their performance. The local government units have an important role in the creation of the conditions for successful performance. Namely, the local economic development can be defined as the growth of the capacities of the local economy which creates riches for the citizens and thus promotes the quality of life through increasing employment, increasing profits, the increase in quantity and quality of local services etc. Particularly the local economic development is a process of strategic planning of the coopera-tion among the local government, the private sector and the non-governmental organizations oriented towards the encouragement of a long term economic development of the local community.
The conditions and the possibilities of local economic development vary from country to country, and the differences are even evident among the local government units within a na-tional economy. The implementation of the policies and the priorities of the local developme-nt depends on several factors, and the following are the major ones:
- The level of fiscal decentralization ;
- The legal framework defining authority;
- Skills and qualifications of the local administration and government;
- Natural, institutional and human resources
- Central government support;
- Local government transparency,
- Public-private partnership development etc,
Most of these factors have a local and a central dimension and should be viewed in a parallel manner in both levels of government.

REDETE – ECONOMIC DEVELOPMENT AND ENTEREPRENEURSHIP IN TRANSITION ECONOMIES
621
In the Republic of Macedonia, with the process of decentralization of the local government, which was implemented in June 2005, with the Local Government Law285 within transferred res-ponsibilities, the local economic development is central on the list of transferred responsibilities. Namely, according to the law, all municipalities in the Republic of Macedonia in the domain of local economic development are responsible for the planning of the local economic development, the establishment of development and structural priorities, the local economic policy; the support for the development of small and medium enterprises and the entrepreneurship on a local level and in that context the participation in the establishment and the development of the network of institutions and agencies in the promotion of partnerships286. In practice, however, even after five years since the implementation of the second phase of the fiscal decentralization, a small number of municipalities are capable of realizing this important responsibility. The reasons for the lack of implementation of the responsibility that we identified through surveys in the larger municipaliti-es, are various, such as: the collection of relevant data (number of employed, number of unemplo-yed, the range of turnover in the small and the medium enterprises, the development of the work market etc); the low level of fiscal decentralization, the lack of financial means, responsibilities not clearly defined between the central and the local government, the municipalities do not own construction ground, unqualified local administration workers, the lack of marketing strategies in the promotion of the advantages and the conditions for the investment in the local community, a weak vertical and horizontal cooperation between the municipalities etc. In other words, we can say that in the R. Macedonia the environment for the complete implementation of the concept of local economic development does not exist yet, in the way it is implemented in other countries.
2. Legal and institutional framework for the support of the local economic development
The basic issues in the local economic development and the decentralization of the local government are as follows: the range of the authorization and the responsibilities of the local government and the financial resources available to the municipalities. The regulatory framework for LED is defined with the republic laws and the decisions brought on a local level.
The implementation of the responsibilities requires from the municipalities the realization of the following activities significant to the economic development:
- Programs for space planning and construction
- Strategies for local economic development
- Budget and final accounts
- Development programs
- Programs for communal activities
- Determination of the local resources income for the financing of the municipality within the legal framework
The Law on local government significantly increases the responsibilities of the local units and
LED is one of the first obligations transferred to the local level. In article 22 of the Law on local government, LED is envisaged as a responsibility of the local government and the municipalities are given space in order to create planning and implementation strategies concerning LED. The legal framework also enables the cooperation between the municipalities, between local government, the private sector, the NGOs and the stimulation of the economic growth. 285 The Law on local government, 286 Law on local government, official gazette no 5/2002, article 22

REDETE – ECONOMIC DEVELOPMENT AND ENTEREPRENEURSHIP IN TRANSITION ECONOMIES
622
Тable 1. The responsibility of the local economic growth
Responsibility Municipality City of Skopje Municipalities in the city of Skopje
Local economic development
Planning of LED; Establishment of the
development and structural priorities;
Local economic policy;
Support of the
development of small and medium enterprises
Planning of LED Establishment of the
development and structural priorities;
Local economic policy;
Support of the
development of small and medium enterprises
Planning of LED Establishment of the
development and structural priorities;
Local economic policy;
Support of the development of small
and medium enterprises
The responsibilities of the local economic development is the same in all municipalities in the
urban as well as the rural municipalities and the city of Skopje as a separate unit of local government, regardless of the large development regional and municipal disparities in the domain of the economic development.
Another significant part of the legal framework on LED is the Law on equal regional development of 2007287, which aims to define the goals, the regulations and the holders of the policy on planning of economic development, the financing and the allocation of funds on equal regional development, evaluation and monitoring of the implementation of the development plans and projects and other related issues. Although the Law on equal regional development was passed in 2007, the strategy for equal regional development as a planning document, according to which the development should be carried out, was brought at the end of September 2009. The late arrival of the Strategy shows how little the authorities are interested in doing something for the support of the equal development. In this sense there were the objections of the EU on the weak coordinative capacities of the Council of equal regional development.
The regional development is supported financially by the budget of the R. Macedonia; the budgets of the units of local government, the EU funds, donations and sponsorships and other sources. The stimulation of the equal regional development, according to the Law, requires the financial means of 1% from the GNP but in reality this percentage is much less than 1%. The funds are allocated for the financing of projects for the development of the planned regions, 70%, for the financing of the regions with specific development needs with 20% and for the financing of the projects of the rural development with 10%288.
Таble 2. Administrative planned regions in Macedonia:
Region Population Nr. of municipalities
GDP/per capita (in denars)*
Eastern 179 822 11 206 770 Northeastern 175 266 6 108 664
Pelagonija 233 628 9 225 437 Polog 315 964 9 98 848
Skopje 605 899 17 314 809 Southeastern 173 056 10 219 714 Southwestern 221 517 13 155 572
Vardar 153 822 9 206 667 * According to the medium exchange course of the Bank of Macedonia 1euro=61,5 den
Source: The state institute of statistics of RM “ Regions in the Republic of Macedonia 2012
287 Law on balanced regional development, official gazette of R.M. number.63/2007

REDETE – ECONOMIC DEVELOPMENT AND ENTEREPRENEURSHIP IN TRANSITION ECONOMIES
623
From the aspect of the development of the local government units the division of the regions is based on their specific needs for development. The basic criteria for the division of the regions are as follows: the level of economic development, the geographical location, the demographic in-dicators, the social infrastructure etc.
3. How does local government stimulate economic growth and which are the most basic limitations?
The local government plays an important role in the creation of a positive environment for the business development. Each unit of local government has its specific local conditions which will increase or decrease the potential for local economic growth. The initial activities for the support of the local economic growth, the municipalities in Macedonia, supported by USAID and UNDP and other international organizations, are organized within the offices for local economic development, however, their activities were limited in that period from the aspect of finances, human resources etc.
Later, after the implementation of the process of decentralization, the activities of the local economic development were organized within the units of the urban municipalities, while in a small number of municipalities with greater financial and staff capacities special sectors for local economic development are formed. In the rural municipalities, there are no special units for LED, only officials for LED. However, regardless of the organizational form, their activities are at a very low level. Namely, the data on the level of the implementation of the decentralization show that the local government units in Macedonia have a low rate of implementing the responsibility of local economic development. There’s a large number of reasons for this situation, starting from the fact that the responsibility of the local economic development is de facto mutual for both the local and the central government, and in such circumstances there is no specific address for the responsibilities and the obligations. The partial fiscal decentralization left many of the respon-sibilities and obligations of the local government units uncovered by financial funds, thus increa-sing the financial dependency from the central government. The rudimentary financial funds do not enable the increase in the local capital investments. The capital investments are rather oriented towards the sustainability and the construction of infrastructure, which is also important for the improvement of the conditions of the development of business in the community. The minimal utilization of the pre-accession aid, the IPA funds, especially the component on regional and rural development, the component on cooperation between states. The local government units do not have instruments and rights for the attraction of new investments, namely, they do not own construction sites, currently, the state is the owner of these construction sites and the procedures for its transfer from the state aren’t functioning well or are very slow. Also, the municipalities do not have fiscal autonomy for the tax exemptions and relief except for the right to be exempt to pay certain local taxes and fees, as an instrument for the stimulation of new businesses and invest-tments. This seriously limits the local development and the promotion of the new investments, and thus the creation of new enterprises and the employment on local levels.
4. At what level the functional and fiscal decentralization stimulate the local economic development
The fiscal decentralization implying the transfer of the fiscal responsibilities to the lower levels of local government is a question which is discussed in many developed countries and countries in development. The huge interest on this issue is a result of the fiscal decentralization being a contributing factor in the increase of the efficiency of the local and regional management and stimulating the local and regional economic development. The theoretical studies in the literature

REDETE – ECONOMIC DEVELOPMENT AND ENTEREPRENEURSHIP IN TRANSITION ECONOMIES
624
by many authors (Lin and Liu (2000) emphasize the influence of the level of fiscal decentra-lization in the local and regional economic development, since the fiscal decentralization can increase the efficacy of the allocation of the resources.
The process of decentralization in Macedonia started late and behind other transition countries, it wasn’t until 1999 that the Government passed the Strategy for local government, while the true functional and fiscal decentralization started partly after 2005 and 2007. The process of decen-tralization in R. Macedonia was planned in phases, as follows: the first phase was implemented in June 2005, and in this period there was the decentralization of the responsibilities in the sphere of urban planning and development, ecology and environment, local economic development, ele-mentary and secondary education, social protection, fire departments, administration of local taxes and fees, sport and culture. Together with the transfer of the responsibilities there was the transfer of the administrative workers, work premises and other means within the responsibilities of decentralization. The second phase started in June 2007 with the transfer of certain responsibilities within the elementary and secondary education as well as social welfare for children and culture. The fiscal and financial aspects of the process of decentralization remain the most significant and the most complex challenge because the lack of resources hinders the implementation of the transferred responsibilities at local level, which is evident at the local economic development because of the complexity of the responsibility. The financial capacities of the municipalities are still not in congruence with the transferred responsibilities.
Several of the subsequent reports of the European Commission point to the fact that in the domain of fiscal decentralization there are still general challenges which deserve further attention, and they are significant to the local economic development. For example, the Report on the progress of the Republic of Macedonia in 2010 the following was stated289:
- There should be equality of the regional development, the decrease of the current disparities between the local government units and the planned regions, as well as adequate solutions for the dynamic improvement of the local and regional development;
- The transparency and the coordination of the central financing of the municipal projects should be strengthened significantly, in terms of achievement of the goal of equal regional development;
- There should be significant efforts made at central and local level in order to strengthen the administrative capacities of some municipalities. This, above all, refers to finances, strategic planning, human resources and economic development
5. Conclusions and recommendations
The general conclusion is that the domain of LED shows the weakest performance in the de-centralization in comparison to the other responsibilities of the municipalities. A significant number of municipalities follow a systematic approach in the planning of LED. There’s a signifi-cant increase of the number of municipalities which made plans for LED, for the largest part covering a period of 5 years.
In the encouragement of the economic development, a large number of municipalities in R. Macedonia, especially the rural municipalities, lagged behind only in the development of stra-tegies for local economic development. A large number of plans and programs remain on paper as a result of several factors: the lack of funds and fiscal dependency from the central government. In the implementation of the responsibilities for a positive investment climate, the municipalities fo-cus the most on the improvement of the local infrastructure, the promotion activities (campaigns,
289 EC Progress Report, Republic of Macedonia (2010), available from-
http://ec.europa.eu/enlargement/pdf/key_documents/2010/package/mk_rapport_2010_en.pdf

REDETE – ECONOMIC DEVELOPMENT AND ENTEREPRENEURSHIP IN TRANSITION ECONOMIES
625
fairs) and the standardization of the administrative procedures. Only a small number of them have taken up activities for public private partnership, regional economic networking and the decrease of the communal fees (the possibility of lowering the local taxes by the local government is limited, as the municipalities do not have the autonomy for the fiscal rights to exemption and relief) of the legal entities as key requirements for the attraction of local and foreign investors.
Even though the Law on equal regional development provides an annual minimum of 1% of the GDP from the Budget of the country to be allocated for this purpose, very few municipalities claim to have received funds from the central budget of equal regional development and that the criteria for the distribution of these funds are not transparent. This leads to the general conclusion that the financial aid for the equal regional development offered by the state budget is far from the legal level, and therefore the central government failed to fulfill its obligations.
Since we emphasized that the responsibility within LED is a mutual responsibility of the local and the central government, the very concept of the definition of LED as activities taken in cooperation with the business sector and non-governmental sector for the improvement and the promotion of the economic growth of the community, our recommendations for the participants in LED are as follows:
- The fulfillment of the legal obligation for financing the equal development (1% of GDP) and transparent funds allocation
- Fiscal decentralization in accordance with the transferred responsibilities
- The increase of the ability of the municipalities for the access to the capital markets (inclu-ding the crediting capability),
- Maximum utilization of the donated means for the rural and regional development.
- Strengthening of the administrative capacities of the state authorities
- The Government should make more serious efforts for the implementation of the Strategy for equal regional development.
- Strengthening of public-private partnerships which will accelerate the local economic de-velopment.
Activities that the local government should carry out as support for the local economic deve-
lopment: - Support for the current and attraction of new investments via permanent contact with local
and foreign investors
- Creating and maintaining the database for the available qualification structure of the work force, data on local enterprises, data on the possibilities of privatization, data on free sites (state owned or privately owned) ideal for industrial investment, data on local and foreign investors, data on taxes and fees etc.
- Marketing strategies for the promoting of municipalities through preparation and dis-tribution of promotion material, organization of promotional events, participation at fairs, promotional campaigns on the possibilities and the advantages of the investments in the local community, the presentation of the local government for the activities about LED in the regional, state and international rankings.
- Contacts and direct support of the local business community through daily contacts with the local entrepreneurs, direct involvement of the entrepreneurs in the development pro-grams, the organization of training for new entrepreneurs, training for small and medium enterprises on the development of projects, business plans etc.
- The stimulation of the financing through the contacts with the banks for data on the finan-cial market for adequate informing of the representatives of the business sector,

REDETE – ECONOMIC DEVELOPMENT AND ENTEREPRENEURSHIP IN TRANSITION ECONOMIES
626
- Rational development of the local budget funds, with a special accent on the long term planning of capital investments at local level.
- The utilization of municipal bonds as financial instruments for the collection of financial funds.
- The development of solid relationships with the state institutions for economic develop-ment
- The acceptance of public-private partnership on efficient management of the public utilities
- Initiatives on the opening of free economic zones, the establishment and planning of bu-siness locations, incubators, industrial parks in their regions.
Reference list:
1. Anwar Shah Fiscal Federalism and Macroeconomic Governance:For Better or For Worse? World Bank
2. Bahl, Roy W. and Johannes F. Linn (1992), Urban Public Finance in Developing Countries, New York: Oxford University Press.
3. Bird, Richard M. and Cristine Wallich (1993), “Fiscal Decentralization and Intergovernmental Relations in Transition Economies: Towards a Systematic Framework of Analysis.” Country Economics Department Working Paper, Washington D.C: World Bank.
4. Christian Lessmann Fiscal Decentralization and Regional Disparity: A Panel Data Approach for OECD Countries, Ifo Working Paper No. 25, March 2006
5. Cheryl Gray,Tracey Lane, Aristomene Varoudakis “Fiscal Policy and Economic Growth”Lessons or Eastern Europe and Central Asia The World bank, Washington DC, 2007
6. Davoodi, Hamid and Heng F. Zou (1998), “Fiscal Decentralization and Economic Growth: A Cross-Country Study.” Journal of Urban Economics, 43, 244-257.
7. Edward Blakely, Ted Bradshaw “Planning Local Economic Development” analysis and practice, third edition, 2002.
8. Jorge Martinez –Vazques, Robert M McNab “ Fiscal Decentralization and Economic Growth” International Studies Program, Working Paper 01-1, 2001.
9. Jorge Martinez Vazquez , Robert .M.McNab “Fiscal Decentralization, Macrostability and Growth” P.T.N.11/03 .
10. Nobuo Akai and Masayo Sakata ”Fiscal decentralization contributes to economic growth: evidence from state-level cross-section data for the United State, Journal of Urban Economics 52 (2002) 93–108.
11. Jr-Tsung Huang, An-Chih Cheng “The Role of Fiscal Decentralization in Regional Economic Growth in China” National Chengchi University Taipei
12. UNDP Policy Paper “How to Make Local Development Work” Selected Practices from Euro-pe and the CIS, Bratislava, september 2002.
13. UNDP, “FYR Macedonia Local Governanace and Decentralization” ,Project Assessemnet 2011.
14. Law on local government, official gazette no 5/2002, article 22. 15. Law on financing of municipality, official gazette of R.M. no.61/2004 ,96/2004, 67/2007,
156/2009, 47 /2011) 16. Law on balanced regional development, official gazette of R.M. number.63/2007 17. Balanced regional development strategy, 2009. 18. EC Progress Report, Republic of Macedonia (2010), available from:
http://ec.europa.eu/enlargement/pdf/key_documents/2010/package/mk_rapport_2010_en.pdf

REDETE – ECONOMIC DEVELOPMENT AND ENTEREPRENEURSHIP IN TRANSITION ECONOMIES
627
DECENTRALIZATION IN A FUNCTION OF REGIONAL DEVELOPMENT IN SERBIA
Sonja MILUTINOVIĆ290
Ana BOJOVIĆ291
Abstract
Decentralization is a question of sovereignty of citizens, human rights and freedom since it is concerned with each individual's right to actively participate in creation of public politics and making decisions that impact his everyday life but also the possibility to plan his children's future. Decentralized government is in position to be much better and more completely informed about condition, needs and aspirations of citizens and to reply more efficiently to those needs, creating in this way favourable conditions for development of society. Therefore, the main goals of decentralization are increasing levels of public service efficiency and effectiveness, as well as encouraging local and regional economic development. Decentralization has advantages and disadvantages, which are going to be presented in the paper. Advantages will dominate over the disadvantages, only if there is found and carefully implemented the right form of decentrelizati-on, which needs to be adjusted to a particular country. In other case decentralization will be a bad solution for citizens and serve to people who are against it. In the process of decentrelizati-on it is necessary to recognize capacity and potential of local community and region for starting integration from the highest level of government. Only acceptable model of decentralization is to give bigger authority and budget for local government where they can be more efficiently used and can solve problems of citizens better from the central authority, and not just transfe-rring the part of central authority to regional level. To speed up the process of decentralization, the key point is to obtain the support from citizens and political elite through organized participation of local authority which will help the central authority to better understand that decentralization will increase the functionality of state organization from one side, and from the other, to make public believe that decentralization is the process which will make life better for all citizens of Serbia.
Decentralization of Serbia is not a new subject. It has been spoken about for a long period of time, and since 2000, decentralization is often prioritized in political programs of democratic government. However, until 2009, decentralization process was conducted by sectors and fragments, without any coordinated access and institutional mechanisms for managing decen-tralization. Leading by the need for clear vision and strategic commitment about this question, in March 2009, Serbian government created an institutional framework for making and imple-menting Decentralization strategy. Governmental bodies, which are in charge of making this strategic document, were established and their responsibilities, composition and operation were defined.
The aim of this paper is to indicate how much decentralization is important and necessary for further development of Serbia, and also to indicate on its close connection with regionnali-zation. Furthermore, the concept and forms of decentralization, as well as its advantages and disadvantages will be highlighted. Local government will be pointed out as the most important
290 Associate for scientific field General economy at the Faculty for Hotel Management and Tourism Vrnjačka Banja
University of Kragujevac, Vojvodjanska bb; e-mail: [email protected] 291 Small Banking Business Consultant at Eurobank EFG Kragujevac, Kralja Petra I 54; e-mail: [email protected]

REDETE – ECONOMIC DEVELOPMENT AND ENTEREPRENEURSHIP IN TRANSITION ECONOMIES
628
way of decentralization and state approximation to citizens. At the and, it will be discussed ab-out achieved level of decentralization in Serbia.
Key words: decentralization, regional development,local government, central government, democracy
Introduction
Decentralization in organizational sense means managing the organization from more centers. It stands for a system in which certain organizational units and authorized individuals are relative-ly independent in conducting a specific group of tasks and businesses. Therefore, decentralization represents the delegation of authorizations to the lower units which enjoy some level of indepen-dence regarding the time when the task will be performed as well as the selection of necessary means. The most important form of decentralization is the local government, but there are also re-gional, city and municipal decentralization.
Decentralization is at the same time a way to meet the market economy and market rules. Without decentralization and local community affirmation, entrepreneurs and economic structures exponents do not have relevant information, or access such information very late, so as to more seriously consider market positioning of local specificities, and more importantly, to activate on the market and realize local potentials. Decentralization is also a process of one society's demo-cratization. Without decentralization it is impossible to develop democratization process, espe-cially with all disadvantages of indirect democracy, where citizens' representatives often come into position to put their interests before the interests of those who elected them. Decentralization makes it possible to efficiently resolve the problems that follow democracy development. Regio-nalization is an integral form of decentralization process, and as a such it represents a manner for citizens to more efficiently realize their common interests than on the lowest forms of centralized authorities.
This work will encompass the concept of decentralization, its forms, advantages and disadvan-tages, and also the idea of local government as the most important decentralization form. Furt-hermore, it will highlight how much decentralization is important and necessary for the further country development. A special attention will be drawn to decentralization process in Republic of Serbia.
The concept of decentralization
Development history of human living organizing forms is characterized by continuous cyclical interchange of centralized and decentralized types of society regulation. Decentralization is the antipode of centralization – another form of organizing the work of state agencies. The idea of centralized state implies that all public works are coordinated from one centre, ensuring the unity in the management. This type of organizing is symbolically presented as a pyramid, with decision making and management functions on the top. This construction, however, has just a theoretical importance since it is practically infeasible and nowhere exists in its absolute form.
Contrary to centralization, decentralization refers to increasing authority of the lower, periphe-ral state agencies and non-governmental organizations, whereas those institutions remain subor-dinated to the higher authority levels. Decentralization is an institutional process representing the transfer of authority and responsibility for public functions from the central to other power levels (Lai and Cistulli, 2000, p. 2). Under decentralization, responsibilities such as planning, management, and resource raising and allocation may be transferred from central government to:
1. field units of central government ministries or agencies; 2. subordinate units or levels of government;

REDETE – ECONOMIC DEVELOPMENT AND ENTEREPRENEURSHIP IN TRANSITION ECONOMIES
629
3. semi-autonomous public authorities or corporations;
4. area-wide regional or functional authorities; or
5. organizations of the private and voluntary sector.
With decentralized system authorities are better informed about the condition, needs and aspi-
rations of citizens and can therefore better and more completely respond to those needs, creating this way a positive climate for the overall society development. Therefore, the main decentre-lization goals should be increasing the level of efficiency and effectiveness in providing public services, as well as encouraging local and regional economic development. Regionalization represents an integral part of decentralization process. It overcomes inefficiency problems of centralized state by transferring a part of state jurisdiction to regional level. Regionalization achieves the right effect if emerges as an integral part of local authority development process and if recognizes regional interests of particular municipalities. Decentralized and regionalized country is the one in which any individual is given the opportunity to actively participate in public policy creation and making decisions that affect his everyday life, as well as the possibility to plan his children's future. The probability of such participation is greater if decisions regarding the qua-lity of life are made on such authority level which is the closest to the citizens.
There are various motives for decentralization. In Eastern European countries (EEC) rigid and centralized dictatorships and planned economies required decentralization when trying to imple-ment market democracy under the existing legal framework. In Latin America decentralization was introduced to strengthen democracy after the collapse of dictatorship (Čorbić, 2010, p. 2). European countries are now more decentralized than they were a few decades ago. Naturally, there are huge differences among them in the level and type of decentralization. The only exception of decentralization in Europe is the European Union, which encourages decentralization of its member states while at the same time centralizes its policies in Brussels. There is a pressure on governments worldwide to give the regions administrative power and fiscal resources.
Economic and political crisis may initiate large decentralization processes, especially after the collapse of authoritarian and cetralized regime. In the last two decades this was the case in Russia, Indonesia and the Philippines, which were affected by deep crisis and far-reaching institutional and political changes. Democratic reform in all three states was supported by increased regional autonomy.
Advantages and disadvantages of decentralization
Decentralization is not an unambiguous process. It offers some advantages but at the same time brings certain risks. The main decentralization advantages are the following:
- Central authorities can not posses such a good information about local issues as local authorities can.
- The convenience of local elections over central assignment of officers comes from the local electors' interest in what local officers do, because they have a power to elect or replace the officers.
- States were and remain too complex to be successfully managed from one single center.
- There is no need to conduct an array of policies uniquely for a particular territory because its problems are various. Some areas are mountainous, other lowland, some rural, other urban, some densely while other thinly populated, some with animal husbandry predomi-nance and other with services, etc. Diverse areas therefore require different packages of public policies and not one centralized policy. Decentralization enables lower authority levels to obtain those public policies and services which are the most needed.

REDETE – ECONOMIC DEVELOPMENT AND ENTEREPRENEURSHIP IN TRANSITION ECONOMIES
630
- Fiscal decentralization ensures independence and security of local finances, and also encourages more responsible behaviour of local authorities. It also makes it easier for local power units to obtain financial resources (Prokopijević, 2010, p. 6).
- Decentralization enables better decision-making processes for minority groups. The word is about small minority groups which are negligible on the state level.
Besides those mentioned, there are certain decentralization advantages which however do not
have universal importance. Decentralization enables adaptation of policies to local needs and pre-vents the excessive uniformity of state life. It is an important factor of legal-political order demo-cratization in one country. Decision-makers are closer to decision subject, especially in case of territorial decentralization; easier and simpler decision-making activities are better directed beca-use of simpler organization of subnational administrative authorities. Also, detecting mistakes is easy and fast – the result of bigger transparency of the work conducted, and simpler communi-cation between higher and lower levels.
Decentralization disadvantages: - There is no sense for decentralization if it is not followed by a reform, because a weak
management is just condescended to the lower level.
- Decentralization increases inefficiency, corruption, and local taxes. Principally, it is easer to have competent central than local administration. When it comes to corruption, there is no unambiguous evidence.
- Local authorities very often overcome problem of financial shortages by increasing local taxes. It happens also that raising finance through property tax is not enough so they decide to increase a tax on firm's existence, affecting mostly the small entrepreneurs.
- Decentralization, especially the fiscal one, may lead to uncontrolled borrowing. It is therefore important to have precise rules for authority units' borrowing both on central as well as on local level (Prokopijević, 2010, p. 6).
- Decentralization indeed increases administrative apparatus especially if political parties try to employ its members through such administrative apparatus.
- There is one more disadvantage, namely, if some details are neglected, decentralization may lead to excessive fragmentation leading further to increased costs.
Forms of decentralization
There are various decentralization forms, such as political, administrative, fiscal and market decentralization.
Political decentralization stands for a transfer of authority to regional bodies, and is connected with the increasing power of citizens and their public representatives in decision-making process.
Administrative decentralization represents a transfer of responsibility for planning, financing, and managing certain public functions from central to regional or functional authorities, field units of government agencies, subordinated authority levels or units, semi-autonomous public corpora-tion or authorities. There are three ways to implement administrative decentralization:
- Dispersion refers to widening the jurisdiction for decision making, fiscal, and management responsibilities between different levels of central authority. It is considered as the weakest form of decentralization because it moves responsibility from one officer to the other.
- Delegating is a transfer of responsibility for decision making and public functions admini-stration from central authority to semi-autonomous organizations, which are controlled by the central authority, although not completely.

REDETE – ECONOMIC DEVELOPMENT AND ENTEREPRENEURSHIP IN TRANSITION ECONOMIES
631
- Devolution refers to high local autonomy and responsibility. Local authorities are given a clear and legal geographic border inside which they conduct public functions.
Fiscal decentralization stands for transferring to the local authority and private organizations
the following: resources for making decentralized decisions, as well as the power and authority for generating revenues.
Market decentralization includes privatization and deregulation.
Local authority as the most important form of decentralization
Many authors consider a local government as the only real decentralization. Local government is today often defined as an arranged system of local government rights' realization, through which citizens and local units directly and by their freely elected representatives manage public works, which are directly connected to the interests of local population, disposing with own sour-ces of public revenues and acting according to the principles of constitutionality and legality (Vučetić and Janićijević, 2006, p. 31). Decentralization helps citizens conduct works important for their community through institutions. It is also clear that problems connected to the basic subsistence and living conditions can be firstly noticed in such a primary social community. Local government development refers to the level of decentralization and democratization of the central authority, including the degree of its respect and ability of citizens to face surrounding problems. Nevertheless, the term local government should be distinguished from local community which refers to the wider environment in which local government operates.
The main goal of local government is the establishment of its active role as leader and coordinator of local development. To achieve this goal there is a need for personnel and material capacity of local government organs so as to independently overtake new responsibilities. Material capacity is ensured through fiscal decentralization and creating constitutional and legal works for ensuring the existence of local governments' own property. Regarding organs' personnel capacity, the Ministry of state administration and local government should provide all necessary help in analyzing the capacities of local authorities and creating plans for their enlargement.
Development of local economy should be based on sustainable usage of available natural resources. The main task of local governments in local economy development process is the creation of strategies for local economic development and employment, as well as the construction and strengthening of institutions to support creation and implementation of those strategies.
Contemporary local government should have the following characteristics: multi-functionality (tightly connected to the idea of self-sufficiency), discretionary authorisations (connected to the capacity of local governments for innovation), authorization for independent taxation, and representation (the only authority institution, besides the parliament, which is the subject of direct periodical legitimising by electors).
The principle of subsidiarity
When the word is about decentralization, there holds and needs to hold the basic principle of subsidiarity. It refers to authority transfer from higher to the lower organs. Namely, what local units can do more efficiently and effectively there is no need for such a work to be conducted by wider territorial units or state itself (Vučetić and Janićijević, 2006, p. 34). It means that anything that can be better done at a lower authority level should not be the task for a higher level of authority. Citizens must learn that they can now themselves (or via their directly elected

REDETE – ECONOMIC DEVELOPMENT AND ENTEREPRENEURSHIP IN TRANSITION ECONOMIES
632
representatives) conduct the activities which were previously realized by the wider organizational structures. Such activities involve borrowing, privatisatization of certain works, establishment of public private partnerships, and so on. However, there are specific authorities that can not be the subject to decentralization. These include defense, internal security, monetary policy, etc., which are the state affairs by their nature.
Decentralization in Republic of Serbia
Serbia is the most centralized state in Europe. Decentralization, in case of Serbia, represents the main unsatisfied need of its citizens. However, a reform of economic, social, and political system was initiated in 2000. Many laws were introduced to regulate in a new way different areas (modernization, democratization, and decentralization) including the new Constitution in 2006. Reforms have initiated decentralization of power by delegation of authority, responsibility, and resources from republic to local levels in many areas. Successful reform requires a development of complete local authorities network (multilevel, partnerships, and the principle of subsidiarity), strengthening local government regarding jurisdiction, finances, and the overall resources and potentials, as well as development of partnership between central and local authorities.
The key legal and normative framework for regulating the performances of local organs is the Local Government Law adopted by Serbian Assembly in 2002, including local authorities' statutes implemented according to this Law (Đorđević, 2008, p. 106). Local Government Law has ini-tiated decentralization by ensuring a wide original jurisdiction for local authorities. Local autho-rities have a classical set of jurisdictions which also exists in other European countries. Therefore, the jurisdictions of municipalities include: public utilities (supply of electricity, gas, water, drainage, waste cleaning and depositing), local transportation, roads, vehicles and signalisation, planning and construction, residence, children's care, primary schools, basic health care, social services, culture, information, sport, recreation, green areas, ecology, supporting economic development, etc.). Unfinished part of the process is a transfer, through sectoral laws, of those jurisdictions from republic to local authorities. For many areas it is considered that „sudden decentralization“ may be dangerous, so there is a tendency to gradually transfer responsibilities and increase capacities of local authorities.
However, decentralization and reform of local government are not conducted consequently and completely. One of the main reasons lies in the fact that reforms in this area are directly conditioned by the progress of reforms in other areas (reform of central authority and public administration institutions, fighting against the corruption, regionalization of the country, etc.). Nevertheless, the basis for local governments' demand regarding restitution of municipal property has been created, and as a result local governments have gained the right to have their own property. The general problem with this area regulation arises from the lack of adequate sub-legal regulation and institutional instruments for the implementation of legal acts. Undefined institutional framework has contributed to insufficient connection between municipalities and districts when deciding upon development initiatives, information flow, and harmonisation of national, regional, and local development goals and priorities. Another reason for weak results of decentralization process is connected to internal administration weaknesses on the local level and its insufficient capacity for reform implementation.
According to the survey conducted during October and November in 2009 by non-government organization “Diferencija” from Niš, attitudes of citizens in Central Serbia regarding the political relations are quite different from citizens in Blegrade or Vojvodina (Decentraliyator Journal, 2010, p. 22). A central topic of this survey was the attitude of citizens from different regions towards the idea of regionalization. The survey results show that one third of examinees has affirmative attitude towards new autonomous provinces formation and high level of decentralization, while 40 % supports decentralization but is against new autonomous provinces. Around 10 % of citizens are strongly against both decentralization as well as new autonomous

REDETE – ECONOMIC DEVELOPMENT AND ENTEREPRENEURSHIP IN TRANSITION ECONOMIES
633
provinces creation, perceiving this process as breaking the state, while 13,3 % are neutral. This survey has shown that citizens of Vojvodina, more than citizens from other regions in Serbia, show understanding for contemporary, democratic territorial regulation which refers to high level of decentralization and regionalization. On the other hand, citizens from Central Serbia show the least understanding, including a worrying percent of people who consider this measures as separatist. Namely, Vojvodina has the major portion of citizens with affirmative attitude toward new autonomous provinces creation and high level of decentralization (45,5 %), while some smaller portion refers to those supporting decentralization and opposing to new provinces (38,2 %). Only 1,8 % of examinees from Vojvodina are against both, decentralization and creation of new autonomous provinces, while 14,5 % are indifferent. One third of examinees from Belgrade supports decentralization and regionalization of Serbia, but the higher percent consists of those who favour just decetralization without new provinces (44,5 %). Around 7 % of the capital residents are against those processes, and 15,5 % are without the attitude. Decentralization and regionalization ideas have the least support in Central Serbia where only one forth of examinees have a positive attitude. However, around 40 % would support decentralization without new provinces; more than one fifth of examinees had a negative attitude toward those processes, while 10 % are indifferent.
Decentralization and regionalization of Serbia, as a question of European future for this country, should be enabled by using more efficiently political and administrative capacities and transferring authorities to the lower power levels and smaller communities. That should facilitate the work of central authority and contribute to regional development, strengthening the country as a whole. Financial and economic crisis suggest that globalization and centralization are not always able to protect development. State decentralization and regionalization may serve as an incentive for the municipal, regional and cross-border cooperation, which is in the period of global financial crisis enabled by implementation of alternative strategic ways for attracting domestic and foreign investors.
Conclusion
Centralization and decentralization are immanent relations and states of supremacy and sub-ordination, because sustainable can be only that, what is formed as a hierarchically arranged order. Absolutely decentralized state, in which all governmental taks are conducted on the level of self-governing cells, is an ideal which is impossible to achieve. Therefore, while analysing some state arrangement, it should be never asked whether a country is decentralized or not, but to what extent it is decentralized or is not. When deciding if a country is rather centralized or decen-tralized, we need to consider which subjects bear the main part of governing tasks.
Accordingly, what decentralization brings in itself is that a state which is decentralized certainly can not be totalitarian. Surely, a state which is decentralized can not be less responsible for its citizens than a centralized one. A decentralized state can not be as corrupted as a centralized one. And a decentralized state can not be less stable than a centralized one (Čanak, 2010, p. 7). In a decentralized state problems arising in some area should be solved at that place and not raised to the highest level of authority. This is the reason why decentralized state is, according to the definition, better, more stable, less corrupted, with more jobs, and more energy for market game, than a centralized one. Each democratic country strives for decentralization, namely, to dismount power and decision-making on the level which is much closer to the citizens than in a case of a centralized state.
The only acceptable concept of decentralization refers to delegation of higher authority and resources to local governments where they more efficiently can solve citizens' problems than centralized authority, and not by simply transferring the state power to the regional level. In order to accelerate the process of decentralization, it is of the key importance to obtain the public and political elite's support. This can be achieved through organized engagement of local governme-
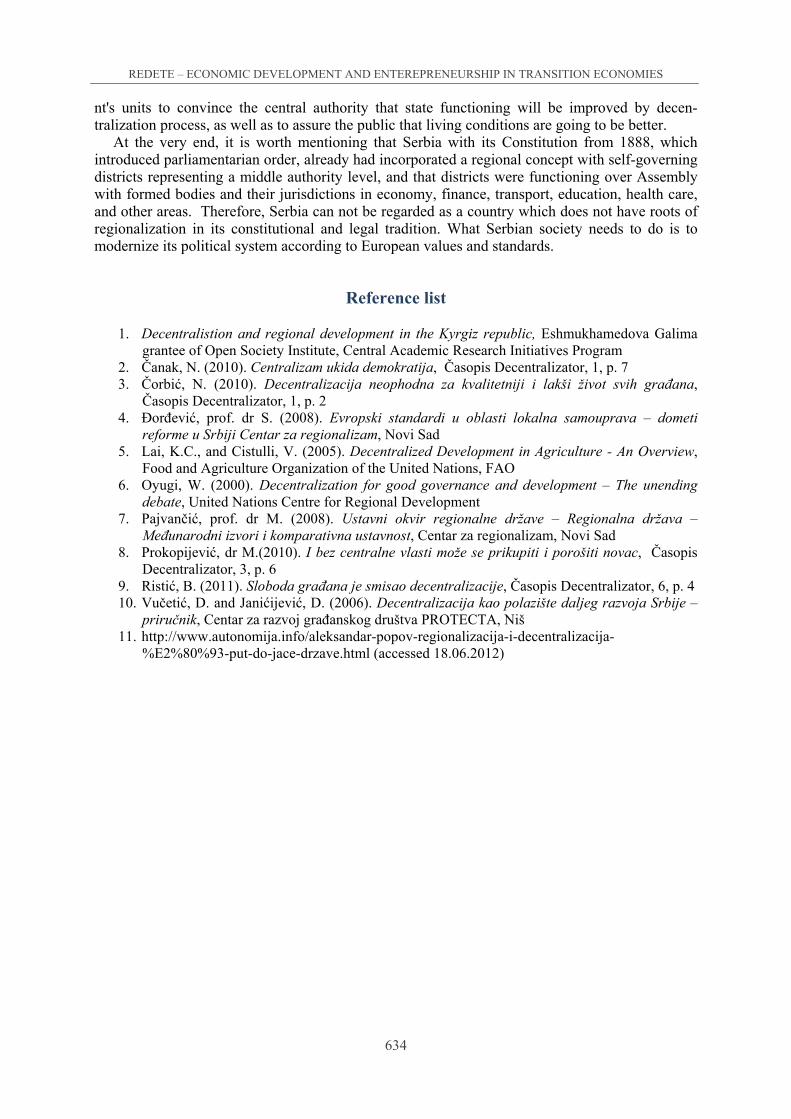
REDETE – ECONOMIC DEVELOPMENT AND ENTEREPRENEURSHIP IN TRANSITION ECONOMIES
634
nt's units to convince the central authority that state functioning will be improved by decen-tralization process, as well as to assure the public that living conditions are going to be better.
At the very end, it is worth mentioning that Serbia with its Constitution from 1888, which introduced parliamentarian order, already had incorporated a regional concept with self-governing districts representing a middle authority level, and that districts were functioning over Assembly with formed bodies and their jurisdictions in economy, finance, transport, education, health care, and other areas. Therefore, Serbia can not be regarded as a country which does not have roots of regionalization in its constitutional and legal tradition. What Serbian society needs to do is to modernize its political system according to European values and standards.
Reference list
1. Decentralistion and regional development in the Kyrgiz republic, Eshmukhamedova Galima grantee of Open Society Institute, Central Academic Research Initiatives Program
2. Čanak, N. (2010). Centralizam ukida demokratija, Časopis Decentralizator, 1, p. 7 3. Čorbić, N. (2010). Decentralizacija neophodna za kvalitetniji i lakši život svih građana,
Časopis Decentralizator, 1, p. 2 4. Đorđević, prof. dr S. (2008). Evropski standardi u oblasti lokalna samouprava – dometi
reforme u Srbiji Centar za regionalizam, Novi Sad 5. Lai, K.C., and Cistulli, V. (2005). Decentralized Development in Agriculture - An Overview,
Food and Agriculture Organization of the United Nations, FAO 6. Oyugi, W. (2000). Decentralization for good governance and development – The unending
debate, United Nations Centre for Regional Development 7. Pajvančić, prof. dr M. (2008). Ustavni okvir regionalne države – Regionalna država –
Međunarodni izvori i komparativna ustavnost, Centar za regionalizam, Novi Sad 8. Prokopijević, dr M.(2010). I bez centralne vlasti može se prikupiti i porošiti novac, Časopis
Decentralizator, 3, p. 6 9. Ristić, B. (2011). Sloboda građana je smisao decentralizacije, Časopis Decentralizator, 6, p. 4 10. Vučetić, D. and Janićijević, D. (2006). Decentralizacija kao polazište daljeg razvoja Srbije –
priručnik, Centar za razvoj građanskog društva PROTECTA, Niš 11. http://www.autonomija.info/aleksandar-popov-regionalizacija-i-decentralizacija-
%E2%80%93-put-do-jace-drzave.html (accessed 18.06.2012)

REDETE – ECONOMIC DEVELOPMENT AND ENTEREPRENEURSHIP IN TRANSITION ECONOMIES
635
THE IMPACT OF BUDGETARY SPENDING ON THE ECONOMIC GROWTH IN THE COUNTRIES FROM EASTERN EUROPE
Gabriela DOBROTĂ292
Maria Felicia CHIRCULESCU293
Abstract
The level of public spending is different from a country at other and from a period at ano-ther, in concordance with the economic situations and governmental choices. Manifestation of economic - financial crisis since 2008 has had a negative impact on budgetary indicators. Thus, on the fond of decreasing of revenues and increasing of expenditures, were recorded increases of budgetary deficits. In this context, the process of redistribution of income developed by Go-vernments with a view to the allocate of resources for public services and the promotion of an active economic and fiscal policies represent fundamental elements in economic development. The growth of public spending should not only be seen as a determinant of the budget deficit but also as a generator element of risk, regarding the reduce trust of financial markets, with direct impact on funding costs for borrowed resources. A particular importance has the trend of public spending and also of their components. In the paper are presented the evolution of the share of public expenditure in GDP at the level of six East - European countries and the changes in their structure. The purpose of this paper is to identify the influence of public expen-diture on economic growth using data for the period 2000-2010, for the six countries, with the regression models. Data series used relates to economic growth dimensioned with real GDP growth rate and government spending components structured according to COFOG classifica-tion. To identify the impact of public spending levels and their structure on economic growth, we considered beneficial to use the following indicators: economic growth sized through real GDP growth rate: dependent variable; the level of public expenditure by category: independent variables. The results obtained demonstrate the correlation between the elements spelled out in the event of a multifactoriale analysis at the level of the sample countries, in different proportio-ns from one country to another, but this converged in the same direction. It should be noted that the use of unifactorial models highlighting the correlation between each category of expenditu-re and economic growth did not allow conclusive hypothesis, which suggests the need for multi-factorial approach. The correlation identified impose prudence in public policy making, becau-se the long-term impact of increased government spending is not dimensioned.
Keywords: public expenditure, economic growth, residual analysis, correlation
292 Constantin Brâncusi University from Târgu Jiu, Faculty of Economics and Bussines Administrations,
[email protected] 293 Constantin Brâncusi University from Târgu Jiu, Faculty of Economics and Bussines Administrations,

REDETE – ECONOMIC DEVELOPMENT AND ENTEREPRENEURSHIP IN TRANSITION ECONOMIES
636
1. Introduction
The fact that the allocations realized by the government at level of capital, education and tra-ining have a direct contribution to growth and reducing unemployment cannot be disputed. Howe-ver, many analyses performed on the correlation between the level and structure of public expen-diture on the one hand and economic growth on the other hand, revealed often contrary results. What would be the explanation? This stems from the following aspects: ensuring the resources needed to finance the investments through increased taxes or the implementation of other taxes generating by distorsions; the emphasising of the budget deficits amid such allocations; the in-crease of the social expenditure due to the increase of unemployment and the ageing of the po-pulation. The purpose of this paper is to identify in empirical mode the influence exercised by the level and structure of public expenditure on economic growth. To do this, we will try to determine the components of public expenditure which have the strongest influence on economic growth. The identification of the link between the growth of budgetary expenditure and final consumption can offer an overview on the allocation process of financial resources. At the same time, the analysis of the correlation between the budgetary revenues and budgetary expenditure allows an explanation of the type of connection, as well as the influence exercised by the tax policy.
The analysis carried out relates to use of a set of data on a number of East European countries, EU members for the period 2000 - 2010. The reason for we chose this sample is the fact that their evolution from an economic point of view was different though there were countries with centralized economies. In this context, expected result is represented by the identification of the public expenditure role in faster or slower development to one or other of the countries in ques-tion. After the introduction and literature review, the paper is structured as follows. Section III presents the theoretical and methodological aspects of the issues analyzed. Section IV is dedicated to the presentation of the results obtained. Finally, section V materialized the conclusions resulting from the analysis performed.
2. Review of literature
Barro proposed an endogenous growth model which suggests a possible relationship between the share of government spending in GDP and the growth rate of real GDP per capita (Barro, 1990). In 1991, Barro studied data for 98 countries for 15 years and found a negative relationship between growth rate and the share of government consumption expenditure. However, as far as public services are included in the production, there is a certain connection between economic growth and the size of government, but statistically insignificant (Barro, 1991). This relationship was approached from an empirical point of view by different economists. Thus, using data recorded in more than 100 countries in the period 1961-1976, Landau found a negative relations-hip between the growth rate of real GDP per capita and the share of government consumption expenditure in GDP (1983). Also, Kormendi and Meguire, analyzing data from 47 countries, ha-ven't identified a significant relationship between real GDP growth rate and the economic growth rate or the share of government consumption expenditure (Kormendi and Meguire, 1985). This analysis continued in 1987 by Grier and Tullok that, using data from 115 countries found a negative relationship between growth rate and the share of government spending in GDP (Grier and Tullok, 1987).
Hsieh and Kon, using Barro growth model has tried to highlight the nature of the relationship between government spending and economic growth, using as indicators the real economic growth per capita, government spending and private investment to GDP ratio for group G 7 coun-tries (Hsieh and Kon, 1994). The conclusion reached by the two economists is that the relation-ship between the two indicators vary significantly over time and in major industrialized countries and that there is not considerable evidence on the influence of public expenditure on GDP per

REDETE – ECONOMIC DEVELOPMENT AND ENTEREPRENEURSHIP IN TRANSITION ECONOMIES
637
capita growth. Moreover, the study found that public spending contributes a small proportion to economic development.
Tanzi and Schuknecht analyzed how public spending influences the welfare of an economy. Based on the data recorded in 32 countries for a long time, researchers found an increase in the expenditure ratio to GDP from 12% in 1913 to 43% in 1990. One of the conclusions of the study was that, above a certain level, additional expenses do not contribute to well-being, whether it is measured by economic and social relevant indicators. However, the two have found that in many industrialized countries public spending was high and inefficient, being indicated a decrease of them (Tanzi and Schuknecht 1991).
Examining the data for 30 countries over a period of 10 years a group of economists has found a positive and significant link between capital expenditures and economic growth, while running costs have an insignificant correlation (Bose et. al, 2003). Another study based on data in 23 OECD economies (Lamartine and Zaghini, 2008) has found a positive correlation between public spending and GDP growth in the long term. In India, using data for the period 1950 - 2007 (Ranjan and Sharma, 2008) there was identified a positive effect of public expenditure on economic growth. Other authors have examined the causal relationship between GDP and public spendings on U.S. data from 1947 to 2002, identified causal relationship revealed that total government spending causes GDP growth but GDP growth does not lead to the expansion of public expenditure (Chih – HL, Hsu, Younis, 2008).
The government spending influence but also the quality of governance on economic growth has been identified in a study of 71 countries in the sample, the results allowing the observation of an bidirectional link between government spending and economic growth (Cooray, 2009).
A World Bank study (2010) concluded that the fiscal adjustments that allow reducing fiscal deficits and public spending cuts generate stronger economic growth compared with an increase of taxes. The study perform an analysis of four main elements that influence the economic growth: effects of budget deficits and fiscal consolidation on economic growth; impact of govern-ment size on economic growth; the relationship with the quality of governance; influence of the structure of expenditure and the impact on economic growth. Using a series of specifications used by Barro and Sala-i-Martin (1992), Barro (1997), and similar others proposed by Bleaney, Ge-mmell and Kneller (2001), Leaner (1985), the authors show that a reinforcement of fiscal deficit based on raising taxes and reducing public investments were not sustainable, while those held by the public spending reforms have generated lasting effects. Another conclusion (Nurudeen and Usman, 2010) of the Nigerian economy survey shows a small impact of increased spending on growth and identifies differentiated influences on expenditure categories (capital expenditures or educational costs have a negative impact while the transport, communications and health expen-ditures positively affects economic growth).
A study by Carsten made in Swiss analyzes the effects of the composition of public expenditure on economic growth, the conclusion that emerges is that the transport, infrastructure, education and administration spending stimulates growth (Carsten 2011). Moreover, the analysis carried out on the data recorded in the Jordan structuring spending by ESA95 classification, it appears that the level of GDP growth is influenced by government expenditure (Dandan, 2011).
From the literature review, we can draw two ways of analysis: cross-sectional and analysis based on time series. The results achieved in the different studies are conflicting and, often, inconclusive. Thus, positive links between economic growth and government spending are identified, or are found a little relationship or no relationship between the two variables. However, the unanimous opinion is that the size of public spending may or may not be an influential factor while their structure can exert a much greater influence in a greater future period. In this context, the issue of budget neutrality requires the application of financial and monetary policies to ensure financial equilibrium and, implicitly, the economic balance (Ungureanu, et al. 2011).

REDETE – ECONOMIC DEVELOPMENT AND ENTEREPRENEURSHIP IN TRANSITION ECONOMIES
638
3. Theoretical and methodological aspects
The objective of ensuring economic growth is specific to any government program, regardless of the period under review. A leading indicator in monitoring the achievement of this objective is the growth rate of GDP. Economic growth is an important goal of economic policy mainly due to the fact that it is reflected in improving satisfaction of human and the whole society needs. Economic growth is not an end in itself but "a mean or way of satisfying the vital necessities of human, of society as a whole and to ensure the pleasure of living " (Roengen, 1979). It cannot be forgotten that, in recent years, there has been an increase in environmental protection objectives or social protection, considering that they should be put before the reported economic growth. We cannot deny their importance, but also not aware that their achievement is dependent on funding sources generated by economic growth. Recording a positive growth rate in real GDP (determined by recalculating GDP from the current period in the base period prices using the GDP deflator) is an important element in ensuring meet the needs of community members at a higher level allows allocation to achieve a greater share of public spending. In general, public expenditures are regarded as payments made to ensure the functioning of public institutions and state-owned enterprises. But, the most important acceptance is by economic nature, imposing an analysis of this in the quality of economic processes which makes a distribution of GDP in the allocation and use of monetary resources to meet the needs of public utilities. The transition from the classical approach in which public spending is nothing more than some final consumption of resources adversely affect national wealth, the modern approach, emphasizes the positive side of allocative process, meaning that a part of them is recoverable or reallocated, with a favorable impact on social reproduction.
In this context, identifying the correlation between actual expenses and growth is important and necessary. In processing of the data we opted for multiple regression method. This is generalized by the theory of the "general linear model", in which are allowed multiple dependent variables simultaneously and, also, factorial variables which are not linearly independent.
The class of linear models can be expressed by:
(1)
where: - represents the dependent variable (endogenous, explained, resulting);
- is the vector of independent variables (explanatory, exogenous) of size 1 ×p;
- is the vector of the coefficients, of 1 ×psize, the model parameters, and they show only the partial influence of each independent variable, when the influence of all the other independent variables is considered constant;
- is a random variable, interpreted as error (disturbance, error of measurement, etc.), which synthesizes influences of all the factorial variables not included in the model and whose influence is considered to be constant.
To study the intense relationship between a dependent characteristic (Y) and two or more independent features using correlation, the multiple correlation ratio is calculated (Multiple R), also called the Pearson correlated coefficient correlated. It can be used both for simple correlation and multiple correlations for determining the formula:
(2)
The correlation coefficient (R) can take values included in the interval [0,1]. The more this coefficient is closer to the highest value, the relationship intensity is greater:
- if R=0 indicates a lack of relationship between the variables, so these are independent;
- if R=1 there is a strong relationship between the variables X and the variable Y;

REDETE – ECONOMIC DEVELOPMENT AND ENTEREPRENEURSHIP IN TRANSITION ECONOMIES
639
- if R 0 the relationship is weak;
- if R 1 the relationship is strong.
Whereas from the analysis of literature we found a sharp orientation towards the uni or
bifactorial analyses, we considered appropriate a multifactorial analysis (relationship 1), allowing highlighting of the relations among the elements taken into account.
The multifactorial model:: explains the change in GDP at the level of analysed countries due to all the factors from the analysis.
The equation that highlights the correlation between the elements specified in our case is:
(3)
Variables are dimensioned: economic growth refers to the growth rate of real GDP. Public expenditure components are represented by weight in the GDP and have the following meanings: SP – social protection; H – health; TCF – traditional collective function; EA – economic affairs; RCE – recreation, culture and education; EP - Environmental protection.
4. Results obtained
The growth of public spending should not only be seen as a determinant of the budget deficit but also as a generator element of risk, regarding the reduce trust of financial markets, with direct impact on funding costs for borrowed resources. A particular importance has the trend of public spending and also their components. At the level of the analyzed countries, the evolution of public spending as a share of GDP between 2000 -2011, with reporting and 1996, is presented in Table 1.
The share of public spending in GDP in the period 2000 – 2011
Table 1 Country 1996 2000 2001 2002 2003 2004 2005 2006 2007 2008 2009 2010 2011
Romania 33,2 38,6 36,2 35 33,5 33,6 33,6 35,5 38,2 39,3 41,1 40,2 37,7 Bulgaria 44 41,3 40,6 39,6 39,1 38,6 37,3 34,4 39,8 38,3 40,7 37,4 35,2 Estonia 39,4 36,1 34,8 35,8 34,8 34 33,6 33,6 34 39,5 45,2 40,6 38,2 Austria 55.9 51,9 51,3 50,7 51,3 53,8 50 49,1 48,6 49,3 52,9 52,6 50,5 Slovenia 44,2 46,5 47,3 46,2 46,2 45,7 45,3 44,6 42,5 44,2 49,3 50,3 50,9 Poland 51 41,1 43,8 44,3 44,7 42,6 43,4 43,9 42,2 43,2 44,5 45,4 43,6 Latvia 36,9 37,6 35 36 34,9 35,9 35,8 38,3 36 39,1 44,4 43,9 39,1
Source: Government Finance Statistics Yearbook 2011
From data submitted can be found the differences existing between the developed and the de-
veloping countries. Manifestation of economic - financial crisis since 2008 has had a negative im-pact on budgetary indicators. Thus, on the fond of decreasing of revenues and increasing of ex-penditures, were recorded increases of budgetary deficits. In this context, the process of redistribution of income developed by Governments with a view to the allocate of resources for public services and the promotion of an active economic and fiscal policies represent fundamental elements in economic development. EU trend has been to increase the share of public spending in GDP. In 2011, the level reached was 49.1%, but there were states where the 50% threshold was exceeded (Denmark, France, Finland, Belgium and Sweden), opposite hovering Switzerland, having 34.2%. Below 40% were located many Eastern European countries, including Romania, Bulgaria, Slovakia, Lithuania, Estonia or Latvia. Regarding the structure public expenditure, in 2010 compared with the year 2002 there have been several changes, reflected in figure 1.

REDETE – ECONOMIC DEVELOPMENT AND ENTEREPRENEURSHIP IN TRANSITION ECONOMIES
640
Figure 1 Dynamic public expenditure by category in the EU in the range 2009-2010 compared with the year 2002
0
10
20
30
40
50
60
70
2010
2009
2002
Source: own analysis based on data recorded: www.eurostat.eu
These changes in the structure of public spending can be interpreted as a result of measures
adopted by various countries to reduce the negative effects of economic and financial crisis that started in 2008. Thus, there is a change in the meaning of growth at the expense of health and social protection, by more than one percentage point (in 2009 compared to 2010, the increase has been just 2 percentage points), expenditure on economic actions by posting an increase of 0.5% in 2009 and 0.7% in 2010. It should be noted that some countries have recorded decreases of economic action costs compared with 2002 (France, Italy, Cyprus, Greece) but the trend was generally to increase (noting that Ireland is by far in this view: 4% in 2002, 6% in 2008, 7.3% in 2009 and 25% in 2010).
If we take into account the structure of public spending under ESA95, we can identify a category majority of benefits and other transfers (within their own social benefits rule), with a share of 27% in the year 2010, followed by operational costs by 18.2%, while investment costs are at the same level as Interest payable, 2.7% respectively.
The analyzed countries, public expenditure COFOG classification reflects differences in government policy on the allocation of resources (Figure 2). Thus, Austria and Slovenia recorded a high level of spending on social protection and health while Lithuania has primacy at the expense of economic affairs, reflecting the government's option to support economic environment due to extremely unfavorable evolution of the economy in 2009, when real GDP rate was -17.7% (in 2011 there is a revival of Lithuanian economy, the real rate of GDP was -0.3%).

REDETE – ECONOMIC DEVELOPMENT AND ENTEREPRENEURSHIP IN TRANSITION ECONOMIES
641
Figure 2 General government expenditure by COFOG function in 2010 at the level of analyzed countries
0%
20%
40%
60%
80%
100%
RO BG EE AT SI PL LV
14.9 13.5 14.6 21.7 18.7 16.9 13.8
4.5 3.93.2
6.8 5.7 5.94.5
3.64.8
5.38.1
6.9 54.3
3.43.8
6.85.7 6.6 5.6
6.2
6.8 0.1 4.45.7 5.1 5.6 9
7 6.9 6.4 4.5 7.1 6.3 6.7
Social protections General publice services Health
Source: www.eurostat.ec, gov_a_exp
Structure public expenditure is determined not only by economic circumstances but also by the
invoice policy of the government which is in power. Thus, social - democratic rely more on redistribution GDP at a higher percentage, which results in a higher level of public spending, while liberal or conservative governments opt for a limited redistribution and lower spendings. Obviously, this is not the only able to determine the configuration of spending in a country, there are other factors determining. In this respect, it can be omitted GDP size which is behind of ensuring the necessary resources in the provision of public services and utilities. Developed countries can allocate major resources to social protection, health, education while less developed countries should support more business and investment in infrastructure.
To identify the impact of public spending levels and their structure on economic growth, we considered beneficial to use the following indicators:
- economic growth sized through real GDP growth rate: dependent variable;
- the level of public expenditure by category: independent variables.
Dates taken into account for the period 2000 - 2010 have allowed model identification which reflect correlations between the indicators indicate. From their processing have resulted the following models (table 2):
Patterns of expression of relations between economic growth and public expenditure as COFOG classification
Table 2 Country The model
Romania (RO)
Bulgaria (BG)
Estonia (EE)
Austria (AT)
Slovenia (SI)
Poland (PL)
Latvia (LV)

REDETE – ECONOMIC DEVELOPMENT AND ENTEREPRENEURSHIP IN TRANSITION ECONOMIES
642
From table 2 it can be observed the fact that the economic growth is influenced by public expenditure, in different proportions from one country to another, but the results converged in the same direction. It should be noted that the use of unifactorial models highlighting the correlation between each category of expenditure and economic growth did not allow conclusive hypothesis, which suggests the need for multifactorial approach. The relationship between the variables taken into account is demonstrated by the results of the application procedure for regression (table 3).
The results of Regression procedure for analyzed countries
Table 3 Country Multiple F R square Adjusted R square Standard error
Romania 0,929656 0,864259 0,444584 3,576522 Bulgaria 0,964069 0,929429 0,591216 2,330665 Estonia 0,92206 0,850194 0,412936 5,04697 Austria 0,884577 0,782476 0,26057 1,89594 Slovenia 0,822744 0,676907 0,023042 4,291042 Poland 0,932707 0,869942 0,457369 2,473183 Latvia 0,859578 0,738875 0,162469 7,548428
5. Conclusion
This paper examines the interdependence between economic growth and government spendings, ranked according to COFOG: social protection, health, traditional collective function; economic affairs; recreation, culture and education; environmental protection Processing data recorded in the period 2000-2010, from a sample of six Eastern European countries and using re-gression procedure shows that public spending determines the evolution of the GDP growth rate being obtained models expressing correlations between variables specified. The distributional assumptions of the linear model, the calculated values of the coefficients come from normal distributions, making possible statistical verification of coefficients. Thus, the models identified reflect the fact that in the countries analyzed, the multiple correlation coefficient is between 0.8227 and 0.9640, resulting in a strong link between economic growth through sized real GDP growth rate and the independent variables. But the results should not be overrated, even though they converge in the same direction with classical theories (Keynesian's theory, Wagner's law) and numerous studies in recent decades. Thus, allocating a greater amount of resources for the related government spending reduces private consumption and investment. Or, they can often cause major increases and more durable than those generated by government spending. Appli-cation of prudential policy in resource allocation corresponding with the period covered and especially their effective spending can be important factors in ensuring a healthy and sustainable economic growth.

REDETE – ECONOMIC DEVELOPMENT AND ENTEREPRENEURSHIP IN TRANSITION ECONOMIES
643
Reference list
1. Barro R.J. (1990). Government spending in a simple model of endogenous growth, Journal of Political Economy, 98, S103-25
2. Barro R.J. (1991). Economic growth in a cross section of countries, Quaterly Journal of Economics, 106, 407-43
3. Bose N., Haque E., Osborn D. (2003). Public Expenditure and Economic Growth: A Disaggregated Analysis for Developing Countries, http://www.socialsciences.manchester.-ac.uk/cgbcr/dpcgbcr/dpcgbcr30.pdf (accessed 15.09.2012)
4. Carsten C. (2011). Does the composition of public expenditure affect economic growth? Evidence from the Swiss case, Applied Economic Letters, vol. 18, issue 16, pp 1583 -1589
5. Cooray A. (2009). Government Expenditure, Governance and Economic Growth. Comparative Economic Studies, 51(3): 401-418
6. Dandan M., (2011), Government expenditures and economic growth in Jordan, International Conference on Economics and Finance research, IPEDR, vol. 4, Singapore, pp 467 – 471
7. Grier K.B., Tullock G. (1987). An empirical analysis of cross-national economic growth, 1950-1980, Working paper, Cahforma Institute of technology
8. Hsieh E. and Kon L. (1994). Government spending and economic growth: the G-7 experience, Applied Economics, 1994, 26, 535-542
9. Kormendi R.C., Meguire P.G. (1985). Macroeconomic determinants of growth cross-country evidence, Journal of Monetary Economics, 16, 141 -63
10. Lamartina, S., Zaghini A. (2008). Increasing Public Expenditures: Wagner’s Law in OECD Countries, https://www.ifk-cfs.de/fileadmin/downloads/publications/ wp/08_13. pdf., (accessed 17.09.2012)
11. Landau D. (1983). Government expenditure and economic growth: a cross – country study, Souther Economic Journal, 49, 783-92
12. Liu Chih-HL., Hsu C., Younis MZ. (2008). The Association between Government Expenditure and Economic Growth: The Granger Causality Test of the US Data, 1974-2002. Journal of Public Budgeting, Accounting and Financial Management, 20(4): 439-52
13. Nurudeen A., Usman, A. (2010). Government expenditure and economic growth in Nigeria, 14. Ranjan KD., Sharma C. (2008). Government Expenditure and Economic Growth: Evidence
from India. The ICFAI University Journal of Public Finance, 6(3): 60-69 15. Roengen G.N. (1979). The law of entropy and economic processes, Policy Publishing,
Bucharest 16. Ungureanu M. A., Popa I., Ungureanu, M.D. et. al. (2011). Budget and Public Treasury,
Academic Publishing, Bucharest

REDETE – ECONOMIC DEVELOPMENT AND ENTEREPRENEURSHIP IN TRANSITION ECONOMIES
644
COORDINATION OF FISCAL AND MONETARY POLICY IN TERMS OF FINANCIAL CRISIS AND THEIR IMPORTANCE FOR THE
TRANSITION ECONOMIES
Vasilka GABER294 Stevan GABER295
Abstract
The world today is facing the most difficult and the most complicated crisis, starting from the time of the Great Depression. The crisis significantly emphasized the role of fiscal policy as im-portant to increase the aggregate demand and to recover the financial sector. We are aware of the biggest coordination of monetary and fiscal policy until today, in which through aggressive monetary and fiscal measures was allowed quicker overcoming of the consequences of the crisis, taking corrective action in the financial architecture, adoption of new rules for the regu-lation of financial markets and financial institutions, and greater care in handling with complicated and modern financial derivates. The aim of this paper is to realize the most impor-tant aspect of the European crisis: the coordination of fiscal and monetary policy and their importance for the transition economies (including Eastern Europe and CIF members). Financial crises have a significant and permanent effect on these countries, lowering long-term output by about 17 percent. The effect is more important in smaller countries, with relative hig-her dependence on external financing, and in which the banking sector noticed more important financial disequilibria. We also found that fiscal policy measures have been the most efficient tools in dealing with the crises, while the role of monetary policy instruments has been rather blinded. Exchange rate resulted to be more a propagator than a crises absorber, while the IMF credit has been found to have positive (but not significant) impact on growth performance. Finally, the effect for the CEECs is much bigger than in the EU advanced economies, for which we found that financial crises lowers long-term output only by 2 percent. The necessity for fiscal adjustment is required step of fiscal authorities to stabilize the economy and to achieve financi-al stability and sustainable economic growth in the long term.
Keywords: financial crisis, fiscal policy, monetary policies, transition economies, output, re-forms.
294 Doctoral student at University “Cyril and Methodius”, Economic faculty – Skopje. 295 Teaching assistant at University “Goce Delcev” – Stip.

REDETE – ECONOMIC DEVELOPMENT AND ENTEREPRENEURSHIP IN TRANSITION ECONOMIES
645
Introduction
We live in a time that will be remembered in our memory as a repetition of the experience of the Great Depression, but with much wiser political responses. If we have the chance to read about the tragic events of 1929’s and the collapse of the economy, now we are able to closely follow every painful economic scream, prudent and coordinated responses of fiscal and monetary authorities, the awareness of urgent regulatory reform and above all caution trading with “finan-cial weapons of mass destruction” (financial derivatives) and the necessity for reform of the entire financial infrastructure. The crisis highlighted the importance of healthy public finances. Govern-ments should be consolidated during good times if they want to have the opportunity to maneuver during bad times. According to monetary policy, the crisis demonstrated the importance of inde-pendent central banks, dedicated fully and credibly to their main objective – price stability. Fiscal and monetary authorities have a crucial role in maintaining economic recovery. Governments must devise and implement credible strategies for recovery of the banking sector and to ensure that discretionary measures implemented during crisis will show positive results. During the crisis, fiscal policies provide support to the economy in the short run, with a significant increase in fiscal deficit. But now, fiscal deficits are high in many countries, which entail the necessity of thinking about fiscal sustainability and public solvency.
The key question for fiscal policy is not “when” and “how” but “how soon” to begin with fis-cal consolidation. In the long run, fiscal consolidation – in other words moving from unsustaina-ble to the sustainable public finances, is more important for economic growth. Does that mean that in the current conditions fiscal coordination should be postponed until recovery is finished? It is clear that early fiscal tightening that moves economy in recession should be avoided, but it would be better how fast the fiscal policy is adjusted.
As long as fiscal policy is on unsustainable path with public debt indicators that are growing, social costs of further delay in adjustment would exceed the cost if governments would react as soon as possible in fiscal consolidation. However, credible and detailed plans for fiscal adjustment should restore the investor confidence, creating favorable and long-term business climate and stable, credible financial institutions. In addition, the financial crisis by the World Bank is defined as financial event that eliminate or distort important part of bank capital in the financial system. Financial crisis have two fundamental dimensions: one of them is financial, the other is the panic that often trigger, initiates the crisis. In the world differentiate several types of financial crises: banking, currency, bubbles and stock market crashes, debt and twin crises.
The consequences of the occurrence of the financial crisis are destructive on financial and real sector. They are always followed by the basic forms of economic imbalances, such as inflation, deflation, recession, expansion and hyperinflation. In addition, the occurrence of the financial crisis is almost always followed by deflation. This occurs as a result of reduced confidence of investitures and creditors, the credit tightening which initiates reduction in consumption and investment, and hence the demand, which ultimately leads to the emergence of “debt deflation” that reflect damaging on debtors due to increase in real debt.
During the current mortgage crisis there is widely accepted consensus among economists that the only way of exit from the current crisis are aggressive expansive monetary and fiscal policies, especially the implementation of significant fiscal stimulus. Successful policy responses to the crisis should be directed in two segments: 1) recovery in the financial sector, and 2) stimulating the aggregate demand. Under present conditions the main director of the IMF stressed the importance of fiscal response on the global level.296
296 Vasilka Gaber (2010), “Fiscal Policy in Terms of Financial Crises”, Faculty of Economics, University St. Cyril and
Methodius – Skopje;

REDETE – ECONOMIC DEVELOPMENT AND ENTEREPRENEURSHIP IN TRANSITION ECONOMIES
646
Optimal fiscal package or fiscal stimulus should be: timely (in terms of the urgent need for fiscal action), large (because demand fall is high) durable (because occurred recession will probably take a long time), diversified (due to high uncertainty which measures will be effective), contingent (to indicate that additional measures will be taken, if necessary), collective (all countries that have fiscal space should use fiscal stimulus according to intensity and nature of the global crisis) and sustainable (to avoid explosion of debt in the long run and negative effects in the short term). The challenge is to ensure proper balance between these sometimes competing objectives, especially between large and lasting fiscal stimulus versus fiscal sustainability.
Close coordination between monetary and fiscal policy is crucial for sustainable economic growth under price stability and stable balance of payment. To be effective, coordination must be based on sustainable and credible monetary and fiscal policies. In addition, although the political decision makers are trying to coordinate their policies, however, their efforts would fail if one or both policies are unsustainable. How much is the credibility of one policy lower, the greater will be the burden of the other policies. We saw the precious value of coordination in the current crisis in which all countries globally coordinate their macroeconomic policies, according to their monetary and fiscal space for undertaking measures. The first defensive line in terms of current crisis was the decline of reference interest rates of six major central banks and the use of unconventional instruments to increase liquidity in the economy. Furthermore, there were huge fiscal stimuli of the largest countries in the world in order to strengthen the financial sector, to restore investor confides and to relax credit flows in economies.
The aim of this paper it’s the coordination of monetary and fiscal policy and their importance for countries in transition and emerging countries. All transition countries have experienced banking crises or severe banking distress during the transition process. Key factors contributing to banking crises in these countries have been the large amounts of bad debt inherited from the previous socialist regimes, and the lack of familiarity of enterprises and banks with the func-tioning of market economies. Therefore, the resolution of banking crises in these countries can also be viewed as a challenge of transition, or as a challenge of banking sector development in the transition context. While some transition countries have progressed more than others in develop-ing and strengthening their banking systems, many have not completed the “transition” process. To this extent, new banking crises remain a risk. A pertinent question for policy makers therefore is how to resolve such crises in a way that would minimize the costs to the economy and the risks of such crises recurring in the future.
This paper reviews the experience of banking crises during 1990-98 in twelve transition countries: five countries from Central and Eastern Europe (CEEs) – Bulgaria, the Czech Republic, Hungary, Macedonia and Poland; the three Baltic States – Estonia, Latvia and Lithuania; and four countries from the Commonwealth of Independent States (CIS) – Georgia, Kazakhstan, the Kyrgyz Republic and Ukraine. These countries have experienced either episodes of obvious crisis such as bank runs, or episodes of severe banking distress involving a large share of non-performing loans in the banking sector. Both types of episodes are referred to in this paper as banking crisis episodes.
Banking crises in Transition Countries
All transition countries have suffered from banking crises. Governments have a range of options of how to respond, from doing nothing and allowing banks to fail, to absorbing the entire cost of the banking crisis which is not only fiscally expensive but run the risk of moral hazard in the case of private banks.
The crisis resolution strategies pursued by the twelve transition countries fall into three broad categories: (a) extensive restructuring and recapitalization of banks, which was generally pursued by the CEEs; (b) large-scale liquidation of banks pursued by most CIS countries; and (c) a

REDETE – ECONOMIC DEVELOPMENT AND ENTEREPRENEURSHIP IN TRANSITION ECONOMIES
647
combination of bank liquidation and restructuring, which was generally pursued by the Baltic state.
The different strategies adopted by the authorities in these countries appear to depend on two main factors: initial macroeconomic conditions and development of the banking sector. On the macroeconomic side, the key factor was inflation.297 Hyper inflation in the countries of the FSU (CIS and the Baltic countries) at the beginning of transition had drastically reduced the real value of the bad debt in the banking system. By contrast, while some CEEs began transition with high inflation, inflation in these countries was far lower than in the FSU, which means that the CEEs were saddled with a much larger stock of bad debt that the authorities needed to tackle.
Banking sector development also had implications for the bank crisis resolution strategy adopted by the different country groups. While both the FSU and CEEs pursued liberal licensing policies initially, entry of new banks was on a much larger scale in the FSU than in the CEEs. Furthermore, while in the CEE's new banks were allowed to enter to foster competition in the banking sector, in the FSU many new banks emerged to finance inefficient state-owned enterpri-ses. As a result, that there was a much greater proliferation of banks of poor quality in the FSU compared to the CEEs. Also, financial intermediation was much deeper in the CEEs (with some banks considered “too big to fail”) than in the FSU countries, which meant that liquidation of banks in the FSU would not have much economic or social impact, whereas it could in the CEEs. Because of these reasons, countries in the CEEs did not undertake bank liquidation on the large-scale that the FSU did.
These initial conditions and bank crisis resolution strategies had a direct impact on the fiscal costs of banking crises. Further, the amount of fiscal costs incurred also depended on the extent to which bank shareholders and depositors bore some of the costs. The CIS and Baltic States, the fiscal costs were generally lower because they relied more on recapitalization by private shareholders than by the government. There was also minimal compensation for depositors in the event of bank liquidation in the CIS and the Baltic’s. Also, the restructuring operations undertaken by the CEEs suffered from several weaknesses, which raised fiscal and quasi-fiscal costs.
Taking together the costs of bank restructuring and depositor compensation incurred by the Government and the Central bank, the total fiscal costs of banking crises were by far the highest in the CEEs, where they ranged from 7 to over 40 percent of GDP, compared with a range of 0.1 to 18 percent of GDP for the CIS and from 2 to 3 percent for the Baltic’s. The bulk of these costs were incurred by the government for bank restructuring, which were typically several times the costs of direct payments to depositors or the costs incurred by the central bank. The higher fiscal costs incurred by the CEEs are reflected in the higher levels of fiscal outlays arising from banking crises compared with the general government deficits in these countries. The resolution of banking crises also raised central government indebtedness more in the CEEs than in the CIS, by around 5 percent in the case of the Kyrgyz Republic to around 11 percent in the case of Bulgaria. All three country groups enjoyed positive results from the resolution of banking crises, although the outcomes were generally better in the CEEs and the Baltic’s than in the CIS, particularly in regard to improving banking sector efficiency and raising the confidence in the banking sector. There needs to be further financial deepening in all three country groups, and especially so in the CIS. Finally, although non-performing loans as a share of total loans has declined, they remain a concern in several countries in all three country groups.298
The incurrence of at least some fiscal costs may have been inevitable for the transition countries because of the need to deal with the inherited bad debt. Because of the moral hazard created by undercapitalization, these banks needed to be recapitalized before sound commercial banking could take place. The CEEs broadly adopted the approach of rehabilitating and injecting
297 Juha-Pekka Niinimaki (2002). “Bank panics in transition economies”, Bank of Finland, Institute for Economies in
Transition, BOFIT 298 Drahokoupil J. and Myant M. (2010). “International integration and resilience to crisis in transition economies”, pp. 9-16

REDETE – ECONOMIC DEVELOPMENT AND ENTEREPRENEURSHIP IN TRANSITION ECONOMIES
648
capital into banks. Although they incurred quite substantial fiscal costs in the process, the result was a sounder and more efficient banking system, in particular because many of the recapitalized banks have since been privatized to strategic foreign investors.
Finally, it is important to note that successful bad debt recovery requires adequate capacity for the task. Given the relatively recent introduction of transition economies to commercial banking, the capacity of collecting bad debt which entails restructuring of enterprises will take some time to build up, more so for the countries from the FSU than the CEEs. Therefore, only modest results from bad debt recovery may be expected from these countries for some time.299
Financial Fragility and Real Effect of Financial Crises in European Transition Economies
The world financial crisis of 2008 that started to spread over the world in 2007 has led to a rapid and sharp deterioration of economic activity. The severity of this impact has brought once again the discussion about the real economic effects of financial crises. 300All transition economies experienced a sharp decline in GDP as a result of the world financial crisis of 2008. This affected those that were vulnerable to directly financial effects and those that were affected by falling demand for exports. The immediate financial effects can be followed by the ‘balance-sheet’ approach, but a full picture of vulnerability only emerges with the help of analysis of different forms of international integration.
The analysis of the different effects of the crisis raises questions of its longer-term implicati-ons. Hopes that the crisis could be no more than a temporary interruption to an otherwise con-tinuing growth trajectory are most likely to be realised in CEECs where close links to western Europe could continue to make them attractive locations for FDI. By way of contrast, finan-cialised growth has probably reached its limits for the foreseeable future. Inflows on the scale achieved in the years up to 2008 will not be restored. At best, the most severely affected countries may be able to attract enough external finance to ward off international insolvency. They are likely to emerge with lower wages and living standards, providing possible routes to future growth through exports of simple products – although that too may already have reached its limits - or remittances, should the demand for labour pick up in other countries. The prospect of exporters of raw materials and semi-manufactures depend in the first instance on the world prices of those products. These will recover to pre-crisis levels only in the event of a very full recovery in the world economy. Russian business also faces directly financial problems and the structure of ‘oligarchic’ business has come under threat, with the possibility of an expansion of state ownership over key parts of the economy. Finally, countries with a high dependence on remittances face bleak prospects as they lack any obvious means to compensate for a failure of this form of financial inflow. 301
The financial crisis has exposed the vulnerabilities of transition economies 20 years after they set out to create market economies. Markets and easier links to the outside world have become dominant, but the analysis demonstrates that all have suffered from the external shock of the world financial crisis and all are likely to find recovery slow and difficult.
The results suggest that financial crises have a significant and permanent effect, lowering long-term output by about 17 percent. The effect is more important in smaller countries, with relative
299 Tang H., Zoli E. and Klytchnikova I., “Banking Crises in Transition Countries: Fiscal Costs and Related Issues”, pp. 2-12. 300 Some traditional views on the real effect of (currency) crises suggest that, under the existence of nominal
rigidities, the real depreciation increases exportations and stimulates employment and output. For example, Demirgüç-Kunt et al. (2006) find a positive impact in the case of 40 percent of the currency crises taken under consideration.
301 Bonin J. and Wachtel P. (2004). ʻʻDealing with Financial Fragility in Transition Economiesʼʼ, Presented to Conference on “Systematic Financial Crises: Resolving Large Bank Insolvencies, Federal Reserve Bank of Chicago, September 30, 2004.

REDETE – ECONOMIC DEVELOPMENT AND ENTEREPRENEURSHIP IN TRANSITION ECONOMIES
649
higher dependence on external financing, and in which the banking sector noticed more important financial disequilibria. We also found that fiscal policy measures have been the most efficient tools in dealing with the crises, while the role of monetary policy instruments has been rather blinded. Exchange rate resulted to be more a propagator than a crises absorber, while the IMF credit has been found to have positive (but not significant) impact on growth performance. Finally, the effect for the CEECs is much bigger than in the EU advanced economies, for which we found that financial crises lowers long-term output only by 2 percent.
The propagation channels of financial crises on the real economy pass from a sharp currency depreciation through wealth effects and aggregate demand, through increasing imported factors prices and production costs. Financial crises affect also private agents’ behavior, increasing uncer-tainty about future gains and decreasing the level of investment and consumption. Other important channels of crises propagation work through the banking system by disturbing the process of credit intermediation, and in the payment system by decreasing collateral values.302
These real effects seem to be more important and persistent in emerging countries. In fact, developing economies are more vulnerable to the factors that lead to crises, such as: banks and private agent’s exposure to currency and maturity mismatch, disruption in international capital markets, banks panic (Chang and Velasco, 1998) and “sudden stops” in capital inflows (Calvo, 2006). In this context, the European transition economies (CEECs hereafter) constitute a very interesting group of countries. Indeed, despite increasing similarities to developed economies they still show important features of emerging markets. In addition, structural reforms, which could enhance the degree of resilience in these economies, are far to be completed making thus more likely that the effect of financial crises would be important and persistent.303
Financial crises have a significant impact on output both in the short and in the long-run. In particular, financial crises are found to lower output by 1 percent after one year, and by 17 percent after 5 years. The impact of currency crises is relatively less important (12 percent). Comparing the effect of financial crises between the CEEC and the EU-15 economies, our results suggest that the effect is more important for the CEECs. Controlling for structural heterogeneity among CEECs, the impact of financial crises is more important for smaller countries, with greater dependence on external financing, where the banking sector shows greater disequilibria (dominance of foreign sources of financing, excessive credit growth), and whose current account deficit is lower and less financed by the FDI inflows. The impact of financial crises on growth performance is mostly influenced by fiscal policy (in terms of increase in government spending), while the effect of monetary policy is rather limited. Exchange rate can amplify the real effect of financial crises on the CEECs’ economies. Moreover, the impact of foreign financial aid, albeit positive, has been found to be not significant. In lights of these findings, the claim that these countries could be better off in joining the EMU in the very short-term may be only partially true. In fact, on the one hand the monetary integration process could favor other reforms that would increase the resilience of these economies to external shocks (Duval, 2008). On the other hand, even if the principal role in crises absorption belongs to fiscal policy, the large worsening of public finances would make domestic monetary and exchange rate policy the only (independent) tool to face the current and future significant output loss.304
302 See for example the “Financial accelerator theory” in Bernanke and Gertler (1989), Kiyotaki and Moore
(1997). 303 For example, Hutchison and Ilan (2005) analyzing the impact of currency and banking crises for a large set of
countries find that while in a sample of 24 emerging economies real output contraction reaches 8 percent and last 2 years, when developed countries are included in the study the reduction in output is about 2 percent during only one year. Similarly, Dell’ Ariccia et al. (2008) find that the real effect of banking crises is about 1.5 percentage point bigger for developing countries. Moreover, the recent Reinhart and Rogoff’s (2009) historical analysis underlines that a decline in real GDP is greater and more persistent for emerging than developed countries.
304 Furceri D. and Zdzienicka A. (2009), “The Real Effect of Financial Crises in the European Transition Economies, GATE Groupe d’ Analyse Et de Théorie économique, pp.7-15.

REDETE – ECONOMIC DEVELOPMENT AND ENTEREPRENEURSHIP IN TRANSITION ECONOMIES
650
The importance of coordination of fiscal and monetary policy in terms of financial crisis
Close coordination between monetary and fiscal policy is essential for sustainable economic growth in a context of price stability and viable external accounts. Effective policy coordination makes it easier for policymakers to achieve their objectives efficiently, in part by ensuring their commitment to mutually agreed objectives. Without efficient policy coordination, financial ins-tability could ensue, leading to high interest rates, pressures on exchange rates, rapid inflation, and an adverse impact on economic growth. To be efficient, coordination must be based on sustainable and credible monetary and fiscal policies. Even if decision makers attempt to coordinate their policies, efforts will ultimately fail if one or both policies are unsustainable. The less credible aspect of one policy will mean larger burden on the other policy. Coordination also needs to account for the different time frames in which monetary and fiscal policies operate. Whereas monetary policy can be adjusted on short notice, it usually takes longer to alter the fiscal stance. The joint determination of objectives and policies by the monetary and fiscal authorities is also required for efficient policy coordination. If policy consistency comes about simply by the passive reaction in one policy area to the commanding position of the other area, the intended policy effects will not be achieved. There is always a need for policy coordination, irrespective of an economy’s stage of development. However, with the increased emphasis in many countries on structural reform and market-based policies, it has become more important to ensure that actions in one policy area do not undermine those in a different area, but rather that they support each other.305
Fiscal policy generally refers to the government’s choice regarding the use of taxation and government spending to regulate the aggregate level of economic activity. In the same vein, the use of fiscal policy entails changes in the level or composition of government spending or taxation, and hence in the government’s financial position. Key variables that policy makers focus on include government deficits and debt, as well as tax and expenditure levels.
Monetary policy refers to the central bank’s control of the availability of credit in the economy to achieve the broad objectives of economic policy. Control can be exerted through the monetary system which operates on such aggregates as the money supply, the level and structure of interest rates, and other conditions affecting credit in the economy. The most important objective of central bankers is price stability, but there can be others such as promoting economic development and growth, exchange rate stability and safeguarding the balance of external payme-nts, and maintaining financial stability. Key variables in this policy are interest rates, money and credit supply, and the exchange rate.
While monetary and fiscal policies are implemented by two different bodies, these policies are far from independent. A change in one policy will influence the effectiveness of the other and the-reby the overall impact. Tensions can arise between what each will do to help smooth economic cycles and achieve macroeconomic stability and growth. That is why it is crucial to pursue a consistent monetary-fiscal policy mix and coordinate these (and other) policies as much as possible to avoid tensions or inconsistencies. This policy mix is a key component of the IMF’s macroeconomic policy advice and of IMF-supported economic adjustment programs, together with external, structural, and financial sector policies. In practice, imbalances in the budgetary position have in many cases proven to be a key element in both macroeconomic problems and their solution. For this reason, the IMF was sometimes jokingly said to stand for “its Mostly Fiscal,” although in reality the macroeconomic problems countries are faced with generally consi-st of a broader mix of imbalances and require a broader set of policy responses.
305 Bernard Laurens and Enrique G. de la Piedra, “Structural Reform and Market-Based Policies Heighten Need for Policy
Coordination, IMF survey, June 8, 1998

REDETE – ECONOMIC DEVELOPMENT AND ENTEREPRENEURSHIP IN TRANSITION ECONOMIES
651
How does fiscal policy affect monetary policy and thus the central banks? There are both direct and indirect channels. There are a number of ways in which fiscal policy may impinge on monetary policy. First and foremost, an expansionary fiscal policy may result in excessive fiscal deficits, which may create a strong temptation for governments to resort to the printing press (i.e., monetary financing by the central bank) to finance the deficits. An expansionary fiscal policy, then, leads to an expansionary monetary policy, fueling inflationary pressures, causing a possible real appreciation of the currency and hence balance of payments difficulties, potentially even resulting in a currency (and/or banking) crisis. But even if governments finance their deficits in a non-monetary way, that is, through the markets, there may be cause for concern, specifically about crowding out: if governments take up (too) much funding in the markets, the result may be too little or too expensive credit for the private sector. This may harm economic development and growth, which would certainly be a concern of central bankers. On the external side, there is the risk that too much dependence on foreign funding of domestic debt results in exchange rate and/or balance-of-payments risks, which again would be worrying to central banks. There is another, more direct channel of fiscal policy affecting central bankers and that is the impact of indirect taxes on the price level and thus on inflation. If governments feel forced to resort to substantial increases in indirect taxes—sales taxes, value added taxes—rather than taxes on various forms of income, this will have a direct impact on prices.
The key concern here is that a one-off increase leads to a wage-price spiral and therefore permanent (higher) inflation and inflationary expectations. In addition to these direct relationships between fiscal and monetary policy, there is the more indirect channel through expectations. Perceptions and expectations of large and on-going budget deficits and resulting large borrowing requirements may trigger a lack of confidence in the economic prospects. This may become a risk to the stability in financial markets. Such a lack of confidence in the sustainability of the financial position of the government may become a potential destabilizing factor on bond and foreign exchange markets, eventually even leading to the collapse of the monetary regime.
Under a fixed exchange rate regime, the higher the degree of capital mobility, the less likely are actions that will affect domestic interest rates. So, fiscal policy will tend to be particularly effective in influencing the level of aggregate demand, because it will not provoke a rise in interest rates that would tend to simultaneously reduce private sector activity. Monetary policy, in turn, will remain relatively ineffective in this regard; thus, an expansionary monetary policy will only tend to change the sources of money supply but will achieve little, if any, modification in the level of monetary aggregates or interest rates.
Under a flexible exchange rate regime, the opposite will tend to be true: the authorities will be able to use monetary policy to a greater extent to change the level of aggregate demand, since the monetary stock is now under their control, and fiscal policy would be less effective than before. In either case, however, there will be limits to the effectiveness of a given policy. Under a fixed exchange rate regime, for example, an excessively expansionary fiscal policy would weaken market confidence in the exchange rate peg. At the same time, under a flexible exchange rate regime, continued monetary expansion could lead to an unsustainable process of exchange rate depreciation and domestic inflation.
Policymakers need to focus daily on the effects of changes in government balances on mone-tary conditions. The central bank must monitor the impact of changes in government deposits on the level of bank reserves, while the treasury focuses on maintaining effective control over cash management and public expenditure. A particularly important element in policy coordination is an appropriate framework for projecting government cash flow. Both the central bank and the public debt manager need this information: the former, so as to decide on the timing and size of its open market operations; the latter, so as to rationalize debt issuance and minimize the debt-service costs. Short term government cash flow forecasts will need to be shared by the central bank and the public debt manager— both when the management of government balances is centralized at the central bank and when the government is allowed to place funds with commercial banks, as is the case in Canada, France, Germany, Malaysia, the United Kingdom, and the United States. The

REDETE – ECONOMIC DEVELOPMENT AND ENTEREPRENEURSHIP IN TRANSITION ECONOMIES
652
treasury and the central bank should also discuss whether forecast errors are the result of tempo-rary shortfalls or surpluses, which will be self correcting, or result from more fundamental and permanent events that could prompt a change in macroeconomic policies. Preparing such project-tions facilitates regular public disclosure of the size of the government’s financing requirements and its plans for meeting them.
Conclusions
The world today is facing the most difficult and the most complicated crisis, starting from the time of the Great Depression. The crisis significantly emphasized the role of fiscal policy as important to increase the aggregate demand and to recover the financial sector. We are aware of the biggest coordination of monetary and fiscal policy until today, in which through aggressive monetary and fiscal measures was allowed quicker overcoming of the consequences of the crisis, taking corrective action in the financial architecture, adoption of new rules for the regulation of financial markets and financial institutions, and greater care in handling with complicated and modern financial derivates.
Financial crises have a significant and permanent effect on these countries, lowering long-term output by about 17 percent. The effect is more important in smaller countries, with relative higher dependence on external financing, and in which the banking sector noticed more important financial disequilibria. We also found that fiscal policy measures have been the most efficient to-ols in dealing with the crises, while the role of monetary policy instruments has been rather blinded.
Coordination of fiscal and monetary policy is very important for transition economies because without efficient policy coordination, financial instability could ensue, leading to high interest rates, pressures on exchange rates, rapid inflation, and an adverse impact on economic growth. To be efficient, coordination must be based on sustainable and credible monetary and fiscal policies. Even if decision makers attempt to coordinate their policies, efforts will ultimately fail if one or both policies are unsustainable. The less credible one policy, the larger will be the burden on the other policy.
While monetary and fiscal policies are implemented by two different bodies, these policies are far from independent. A change in one policy will influence the effectiveness of the other and thereby the overall impact of any change. Tensions can arise between what each will do to help smooth economic cycles and achieve macroeconomic stability and growth. That is why it is crucial to pursue a consistent mix of monetary and fiscal policy and coordinate these (and other) policies as much as possible to avoid tensions or inconsistencies. Policymakers need to focus daily on the effects of changes in government balances on monetary conditions. The central bank must monitor the impact of changes in government deposits on the level of bank reserves, while the treasury focuses on maintaining effective control over cash management and public expenditure. Close coordination between monetary and fiscal policy is essential for sustainable economic growth in a context of price stability and viable external accounts. Effective policy coordination makes it easier for policymakers to achieve their objectives efficiently, in part by ensuring their commitment to mutually agreed objectives.

REDETE – ECONOMIC DEVELOPMENT AND ENTEREPRENEURSHIP IN TRANSITION ECONOMIES
653
Reference list
1. Antonio Spilbergo, Steve Symansky, Olivier Blanchard and Carlo Cottarelli. “Fiscal policy for the crisis”, IMF 2009;
2. Bernard Laurens and Enrique G. de la Piedra, “Structural Reform and Market-Based Policies Heighten Need for Policy Coordination, IMF survey, June 8, 1998;
3. Bonin J. and Wachtel P. (2004). ʻʻDealing with Financial Fragility in Transition Economiesʼʼ, Presented to Conference on “Systematic Financial Crises: Resolving Large Bank Insolvencies, Federal Reserve Bank of Chicago, September 30, 2004;
4. C.A.E. Goodhart (2008). “Regulatory response to the financial crisis”, Working paper No. 2257, Category 6: Monetary Policy and International Finance, March 2008;
5. Charles Enoch, Anne-Marie Gulde and Daniel Hardy, 2002, “Banking Crises and Bank Resolution: Experiences in Some Transition Economies,” IMF Working Paper, 02/56.
6. Dominique Strauss-Kahn (2009). “Crisis management and Policy Coordination: Do we need a new Global Framework," Vienna, May 15, 2009;
7. Douglas D. Evanoll and George Kaufman (2005). “Systemic financial crisis - resolving large bank insolvencies”, World Scientific Publishing Co. Pte. Ltd., Papers presented at the seventh annual international conference, held on Sept. 30-Oct.1, 2004, Library of Congress Cataloging-in-Publication Data, 2005;
8. Drahokoupil J. and Myant M. (2010). “International integration and resilience to crisis in transition economies”, pp. 9-16;
9. Furceri D. and Zdzienicka A. (2009), “The Real Effect of Financial Crises in the European Transition Economies, GATE Groupe d’ Analyse Et de Théorie économique, pp.7-15;
10. John Bonin and Paul Wachtel, 2003, “Financial Sector Development in Transition Economies: Lessons from the first Decade,’ Financial Markets, Institutions and Instruments, Vol. 12, pp. 1-66;
11. Juha-Pekka Niinimaki (2002). “Bank panics in transition economies”, Bank of Finland, Institute for Economies in Transition, BOFIT;
12. Tang H., Zoli E. and Klytchnikova I., “Banking Crises in Transition Countries: Fiscal Costs and Related Issues”, pp. 2-12;
13. Vasilka Gaber (2010), “Fiscal Policy in Terms of Financial Crises”, Faculty of Economics, University Ss. Cyril and Methodius – Skopje;

REDETE – ECONOMIC DEVELOPMENT AND ENTEREPRENEURSHIP IN TRANSITION ECONOMIES
654
IMPACT OF THE COMPETITION POLICY ON THE ECONOMIC DEVELOPMENT
IN TRANSITION ECONOMIES
Siniša MILOŠEVIĆ306
Abstract
At the beginning of the 21st century, transition economies were subjected to new challenges. The main problem was related to maintaining sustainable development during the global eco-nomic crisis, which still has effects in many countries around the world. In such circumstances of slow economic growth of global proportions, transitional countries should concentrate more on internal affairs that may affect economic growth and development. The goal of each eco-nomy is to deliver the highest standard of living for its citizens. It is determined by the econo-my’s level of overall productivity in which people live and work. Overall productivity of a certa-in economy results from productivities of its individual business undertakings. One of the key elements that raise productivity of individual companies is definitely the pressure of compe-tition. The pressure of competition influences those who participate on the market to continually develop their business activities in order to surpass their rivals, improve market positioning and increase profit. In order for competition pressure to exist in a certain economy, a high level of market competition is required including proper implementation of competition policy. The focus of the competition policy is consumer welfare, which also represents the aim of every economy. The question is what and how great the effects are from efficient implementation of competition policy on a certain country’s economic development. In this study, a thorough research of this problem is conducted. We will start from the hypothesis that there is positive influence resulted from efficient implementation of competition policy on economic development in transition economies. Quantitative testing of this hypothesis will be undertaken with the help of correlation and regression analysis. If the hypothesis is correct, it will be a clear signal for transitional countries to direct their attention on efficient implementation of competition policy, because it represents an additional way of raising their economic development. Upon the paper’s introduction, the methodology used in the study is introduced. In the second part of the paper, the goals of competition policy are analyzed including their effects on productivity incre-ase of individual businesses and the economy as a whole. The third part of the paper describes the indicators of economic development and levels of efficient implementation of competition policy for transition economies used in the study. The fourth part is meant to examine the effects that the competition policy has on economic development of transition economies and actual testing of the starting hypothesis will be conducted within these effects. At the end of the study, final remarks are given.
Keywords: Competition policy, Economic development, transition economies.
306 Faculty of Economics, University of Belgrade, [email protected].

REDETE – ECONOMIC DEVELOPMENT AND ENTEREPRENEURSHIP IN TRANSITION ECONOMIES
655
Introduction
The subject of this research is examination of effects which competition policy has on eco-nomic development of countries in transition. Although it had existed for more than one century, in countries in transition this matter does not have long history. Its main aim is the increase of social welfare and encouragement of higher effectiveness and productivity of the whole economy. In the 21st century, the current situation of global economic crisis had forced countries to seek for a sustainable development strategy which will provide better quality of life for their citizens. The-se circumstances had caused change of economic development methods, in a way that countries have focused their attention towards solving internal problems mainly because of their limited global influence caused by stagnation of global economy.
One of the basic internal problems of countries in transition is surely the question of compe-tition policy. Enactment of regulatory frame and establishment of regulatory bodies for this matter are one of the conditions for accession to the European Union. There is numerous literature related to competition policy and within it there are theoretically established facts that imple-mentation of such policy would contribute to economic prosperity and development of society as a whole. Questions are asked: “Is this policy being implemented in real life, and therefore, can it be implemented in countries in transition”? The purpose of this research will be focused on testing the following hypothesis.
Effective governing of competition policy has positive effects on the economic development of
countries in transition.
The goal of this research is to present the positive economic effects caused by proper gover-ning of competition policy in countries in transition. Among that, a better understanding of the importance that this policy has within an economy is also a goal. If this hypothesis is true, each country, especially the ones in transition subjected to processes and changes within their market should pay great attention towards development and implementation of competition policy. Co-mpetition policy directly affects the existence and functioning of individual business entities, thus having indirect influence on consumers on one side and the whole economy on the other.
This research is divided into four parts. The introduction part will enhance the understanding of the posted problem. In the first part, a review and basic methodology explanation are shown. The second part explains the goals of competition policy as the trigger of productivity increase of individual companies and the economy as a whole. The third part defines and analyzes indicators of effective implementation of competition policy and economic development. In the fourth part, a quantitative hypothetical test is conducted related to the positive economic effects of proper competition policy implementation in countries in transition. Results of this testing will be summarized at the very end of this research.
1. Methdology
The subject of this paper is examination of effects which competition policy has on economic development of countries in transition. In this paper, we will use several different methods and techniques of research, primarily the method of relevant literature analysis on which we will de-fine the main goals of competition policy, followed by implementation of hypothesis quantitative testing by correlation and regression analysis.
The correlation analysis method requires interpretation of the correlation coefficient. Defining of correlation strength between observed events depends on the problem inspected, but in cases of

REDETE – ECONOMIC DEVELOPMENT AND ENTEREPRENEURSHIP IN TRANSITION ECONOMIES
656
economic analysis, based on previous researches, we may conclude that the following intervals are acceptable:
- Very strong correlation (correlation coefficient values between 0.70 and 1)
- Strong correlation (between 0.50 and 0.69)
- Moderate correlation (between 0.30 and 0.49)
- Mild correlation (between 0.10 and 0.29)
- Insignificant correlation (between 0.01 and 0.09)
- No linear correlation (0.00)
In this paper, regression analysis will be conducted with a simple linear regression model. Wi-
th the simple linear regression model, a stochastic link of dependent variable Y and independent variable X is expressed. Formally, it can be presented in the following way (Asteriou and Hall, 2007):
in which and are unknown parameters that need to be estimated. The specification of the regression model will be estimated by the least squares method. Upon estimation of the regression model, in order to accept given results with higher reliability, we will conduct additional econometric tests which include residual analysis of estimated regression model. We will test the existence of auto-correlation with the Durbin-Watson test and, after that, normality based on statistics of the Jarque-Bera test and heteroscedasticity based on the White test.
2. Aims of competition policy in the purpose of raising productivity
Competition policy had existed for over a century. It was introduced in North America at the end of the 19th century and today it exists in over 100 countries throughout the world (Hofer, 2004). The idea of competition policy is related to the Sherman Act of 1980 in the USA. The Antitrust Law of the USA had great influence on the development of competition policy in the EU (Gifford and Kudrle, 2003). Traditional competition policy has been narrowly accepted. Its aims are related to prohibition of agreements that limit competition, prohibition of abuse of dominant position and non-competitive mergers. However, those opinions have changed significantly throughout the years and competition protection has become accepted more widely and has a stronger role in conduction of business processes. Today, competition policy is accepted as conduction of business activities (Kovacic and Shapiro, 2000). Globalization of the world market had influenced expansion and development of competition policy. The trend impacted even countries in transition. Implementation of competition policy in countries in transition has a relatively short history (Ma, 2011).
Competition policy has the task of increasing the level of efficient competition and should not be considered as something that protects small businesses from the larger ones and the opposite. On the highly demanding market, individual participants have a small share and they can not affect the price, regardless of their capability to increase or decrease production volume. Because of that, in the legal frames of competition policy there is a possibility to implement the rule de minimus. This means that even if certain competition rules are breached, small entities can not cause any economic effect so these breaches are not subjected to investigation of regulatory bodies for competition protection. Because of the fact that price is a determined value in competitive market conditions, in order to achieve maximum profit, each will produce a quantity

REDETE – ECONOMIC DEVELOPMENT AND ENTEREPRENEURSHIP IN TRANSITION ECONOMIES
657
of goods that will secure the lowest average production costs. In that way, production efficiency is achieved. “Efficient markets are usually thought to be those with a large number of competitors, so that firms compete until prices are equal to the marginal cost of production” (Bannett 2000, p 52). In addition, the perfect competitive market means absence of entrance and exit barriers so that change of price causes new entries and exits of existing participants at the market, by which allocation efficiency is achieved. A high level of competition causes reduction of prices, higher supply of goods and services and constant pressure on reducing production costs. That is why efficient implementation of competition policy can provide certain benefits for consumers.
On the other hand, big firms, depending on their size, can effectively influence the state of competition. Firms that have market power can behave independently of other market partici-pants. In this way, they can increase the final prices for consumers and provide themselves greater profit. In business, generally, there is always a desire for profit maximization. On the other hand, competition policy sees earning of enormous profit as a potential abuse of dominant position (Grout and Zalewska, 2007). If there is only one participant at the market, he will limit his pro-duction under the competitive level in order to raise the price. It will cause higher average costs of production because only the competitive level of production volume can provide minimum costs per unit.
In that way, industrial inefficiency is created. In order to avoid it, an appropriately designed economic policy should include measures of competition protection, with the main goal to influe-nce a higher level of competition on all markets. That is why the legal frame of competition policy is of high importance in order to achieve successful growth of market economy (Hofer, 2004). However, implementation of competition policy does not mean that businesses are not allowed to negotiate and work together, nor does it consider dominant position on the market as illegal. Because of that, one of the key factors of adequate implementation of competition policy should be training and informing of business managers. Knowledge of competition policy rules is the advantage that can provide efficient protection against violation of competition, preventing busi-nesses from financial problems because competition protection can add up to 10% of total annual revenue.
From the perspective of competition policy and analysis of individual cases, it is necessary to view the difference between static and dynamic competition on the market (Sidak and Teece, 2009). Static competition means absence of significant changes on the market. Products are offered for very low prices, with no significant improvements of existing products, nor intro-ductions of new ones. In these circumstances, there is no significant reduction of price with intro-ductions of certain innovations. Without innovations, all businesses on the market possess equal technology and equal business models, they achieve equal and very small profits, while, in the long term, prices become equal with marginal costs. Dynamic competition is lead by innovations. This kind of market characterizes various competitor activities that result in significant differen-cing of products and quick answers to newly created changes, whether they are caused by certain innovations or introductions of new market possibilities.
With regard to the mentioned definitions, we can say that the majority of today’s markets in conditions of global competition have a dynamic character. Traditional static analysis is focused on determining the market power on the relevant market of products. Dynamic analysis considers competition from a wider angle and is less focused on the current state, but more on the processes that are happening on a certain market.
Modern competition policy is based on the synthesis of competition law and competition economy. That is why a serious consideration of competition policy problems cannot be done without understanding the economy and relevant market functioning. Competition policy is based on the belief that a competitive market contributes growth of economic efficiency and social welfare. Because of that, it is not rare when regulatory bodies for competition protection intervene on certain markets in order to achieve a competitive level on markets. The ideal solution would be if the market is capable of existing without interventions and regulations within implementation of

REDETE – ECONOMIC DEVELOPMENT AND ENTEREPRENEURSHIP IN TRANSITION ECONOMIES
658
competition policy. However, it is not possible primarily because not all markets have the equal structure that characterizes a high level of competition.
The law and the policy of competition often overlap with other government policies. In the areas of privatization, international policy, investment policy, regional development policy and similar, sometimes there are disputes and misunderstandings of goals and competition policy implementation instruments. In these circumstances, which policy has the priority is often the question. The answer to this question lies in finding the optimal solution between achievement of competitiveness, progress and efficiency of the national economy as a whole with all of its sectors with parallel protection of consumer interest (Spevec, 2005).
Based on presented facts, we can conclude that welfare and consumer protection, including realization of utility for consumers upon high level of competition between business entities that work on the same relevant market, are the main goals of competition policy. In his speech in July 2001, EU Competition Commissioner Mario Monti declared that “the goal of competition policy in all its aspects is to protect consumer welfare” (Monti, 2001, p. 2). High level of competition brings lower prices to consumers and better quality of life, which is presented by greater supply of high quality products and services. Overall, consumers are always the greatest beneficiaries of competition policy implementation. They are the handlers of their money, so suppliers should offer them the best for their money. However, the actual organization of regulatory body for implementing competition policy requires certain costs. Logically, a cost-benefit analysis is required in order to determine if the benefits are beyond the costs. The key of success and validity of competition policy’s existence in a certain country is the quality of their institutions, primarily the Commission for Protection of Competition and the law system (Veigt, 2006).
Former president of the British Commission for Protection of Competition, in his speech in September 2004, claimed that cost-effectiveness of competition policy is similar to the issue of publishing houses. A very large case is required to cover the costs. He mentions the case of the British Commission for Protection of Competition that had an annual budget of around 25 million pounds which, in the period of 10 years, had 4 cases that were worth over 4 billion pounds. Just on the new car market, there was an annual detriment for consumers in the value of 2 billion pounds. One of the larger cases was related to companies from the mobile communications sector, which charged even up to 40% more for specific services. In this case, the return of market participants to within their allowed behaviour brought between 325 and 700 million pounds of savings to consumers in Great Britain, which is a lot more than 2.5 million pounds spent in this case (Georski, 2004).
Experiences of other countries show that cartel agreements, which are actually prohibited by competition policy, can be made without regard of the sector or country borders. In Spain, for example, sugar had cost between 5% and 10% more than in other European countries. Spain’s Commission for Protection of Competition had concluded that the issue was cartel and fined its members 8.7 million Euros, by which it increased the level of competition on the sugar market with impacts on the market of products that are based on sugar (OECD, 2002).
Microsoft was fined due to abuse of its dominant position with around 500 million Euros, because it connected services which, by its nature, do not have to be connected, forcing con-sumers to buy more products in one package, without the possibility to buy individual products. Anyone who needed an operating system had to buy it together with other Microsoft applications, like Media Player, etc. Microsoft also prevented its consumers from buying additional software, preventing other companies from developing software compatible to its operating system (Graić-Stepanović, 2009).
In order to completely understand competition policy it is necessary to separate terms compe-titiveness and competition. When defining competitiveness, it is very important to determine if it is related to individual business, specific industry, region or entire country’s economy. Here we will analyze the definitions of competitiveness for the extreme cases, an individual business as the lowest and an economic treaty, as the highest level of competitiveness analysis.

REDETE – ECONOMIC DEVELOPMENT AND ENTEREPRENEURSHIP IN TRANSITION ECONOMIES
659
The main difference between competitiveness of individual businesses and an economic treaty lies in the fact that various levels of individual business competitiveness and their changes at a specific market result in zero-sum game, while competitiveness of an economic treaty always has a positive result, or positive-sum game. In order to understand competitiveness properly it is necessary to implement a microeconomic approach and begin from understanding competitive-ness of individual businesses and, after that, analyzing next levels. Competitiveness of individual businesses is most often measured by the share of the market. Bigger market share results in higher competitiveness of the individual company. Zero-sum game as a result of interactive efforts of competitors on the market is described by the fact that it is not possible for one competitor, or certain company, to increase its share on the relevant market, without lowering the share of another or more competitors. On the other hand, competitiveness of economic treaties is most often expressed in conditions of business and the whole business environment. An increase of a country’s competitiveness does not lead to a decrease of other countries’ competitiveness (Snowdon and Stonehouse 2006).
Competition on the market exists when two or more companies mutually compete for higher distribution of their products whether with price or quantity. That type of fight creates competitive pressure which encourages economic efficiency of market participants. Competitive pressure is the main trigger of economic progress and, therefore, strong competition on the market is the condition for a strong economy (Begovic and Pavic, 2010). This competitive pressure always encourages companies to be more productive than others in order to offer their products for lower prices and acquire higher market share by which they become more competitive than others. Therefore, the goals of competition policy and its main purpose of increasing the level of competition and creating and strengthening competitive pressure will result in an increase of productivity of individual companies and the economy as a whole.
3. Analysis of indicators for efficient implementation of competition policy and economic development
For the purpose of testing the hypothesis from which we started in this research, it is necessary to define and analyze the indicators of efficient implementation of competition policy and economic development in transition countries. The European Bank for Reconstruction and Development (EBRD) publishes each year the Transition Report in which, among everything else, facts are shown about efficiency of competition policy, expressed in certain indicators, for 29 countries who have been or still are in the process of transition. These indicators will be used for measuring the level of competition policy efficient implementation. When it comes to economic development, we will use the Gross Domestic Product Per Capita indicator (GDPPC) for the countries analyzed.
Indicators for the level of efficient competition policy implementation vary in the interval 1 – 4.33. The lowest indicator value (1) means that the country does not possess the regulatory frame neither the regulatory body for implementing competition policy, while the highest value (4.33) is given to those countries in which competition policy is being implemented most efficiently. These indicators express the state in a specific country during the one year period. However, due to the fact that building a modern market economy is a long term process, the influence of efficient competition policy implementation must be analyzed for a period of several years. The same state on the market cannot be expected in countries that reached a certain indicator value, for example 3 in the previous year of analysis, and in countries that were graded by the same indicator in the last five years. It is certain that countries with long-term high indicator value have a stronger influence of competition policy on market economy development. This is why a cumulative approach of indicator analysis is necessary.
In the following graph we will present the indicators of efficient competition policy implemen-tation in countries in transition. The most efficient competition policy implementation is achieved

REDETE – ECONOMIC DEVELOPMENT AND ENTEREPRENEURSHIP IN TRANSITION ECONOMIES
660
in Hungary and the Slovak Republic, while the least efficient is in Montenegro and Turkmenistan. Out of 29 countries analyzed, 12 have a value above average.
Figure 1. Indicators of efficient competition policy implementation in countries in transition, 2011 (EBRD, 2012)
When it comes to the indicator of economic development, or the Gross Domestic Product Per
Capita, 12 countries out of 29 analyzed also have above average value. The highest GDPPC in 2011 was achieved in Slovenia and the Slovak Republic, while the lowest economic development was measured in the Kyrgyz Republic and Tajikistan.
Figure 2. Economic development indicators for countries in transition, 2011 (Calculation of author based on EBRD, 2012)
If we carefully look at the two previous graphs that present indicators of efficient competition
policy implementation and economic development we may see that, at the same time, 10 countries with above average values of both indicators. It leads us to the conclusion that there is a certain connection between these two occurrences so additional quantitative tests should be conducted.
4. Testing of hypothesis: existence of efficient competition policy’s positive effects on economic development in countries in transition
In this part of the research, we will conduct quantitative testing of the starting hypothesis, which claims that efficient governing of competition policy has positive effects on economic development in countries in transition. For conducting this test, we will use the previously described and analyzed indicators. At first, we will present them together on a scatter diagram.

REDETE – ECONOMIC DEVELOPMENT AND ENTEREPRENEURSHIP IN TRANSITION ECONOMIES
661
Figure 3. Indicators of efficient competition policy and economic development implementation
In the previous scatter diagram we may notice the connection between observed indicators which means that countries with more efficient competition policy implementation reach a higher level of economic development according to their GDP per capita. The correlation coefficient equals 0,60 and is at the acceptable level of statistic significance α=0,01 with appropriate t value of 3,94, which means there is a strong connection between the two cases observed. By using regression analysis, we have determined the linear model and calculated the following parameter estimates.
Table 1. Estimated model of simple linear regression
Dependent variable (EDI) Coefficient t-value p- value
-3815,53 -1,81 0,08
210,97 4,51 0,00
dummy 12.500,67 4,35 0,00
0,63 F=22,32 0,00
Number of observation 29
Where are: EDI – indicator of economic development CI – indicator of efficient competition policy implementation In figure 2, we can see that Slovenia has a much higher value of the economic development
indicator if compared with other countries. It is an extreme value so in the regression model an dummy variable had to be included for this country in order to exclude the effect of extreme value on the estimation of the entire model.
Based on the conducted regression analysis, at the significance level of α=0,01, we can con-clude that efficient governing of competition policy has positive effects on economic development of countries in transition. In addition, the whole regression is statistically significant and can be accepted with equal level of significance. The measured coefficient of determination is valued at 0,63 which means that the indicators of efficient competition policy implementation explain 63% of variations of economic development indicators for observed countries.
In order to fully accept the results of conducted regression analysis, it is necessary to conduct certain additional econometric tests. We tested the existence of residual auto-correlation. The Durbin-Watson statistic value is 1,98 and, based on it, we cannot claim that there is auto-correlation of primary level. Upon the auto-correlation test we conducted the test of residual

REDETE – ECONOMIC DEVELOPMENT AND ENTEREPRENEURSHIP IN TRANSITION ECONOMIES
662
normality. Given Jarque-Bera value is 0,73 with appurtenant value of p=0,69, so on the signifyca-nce level α=0,01 we cannot claim that the residuals are without normal distribution. Heteros-cedasticity of residuals test was conducted by the White test. The values given were F and statistics 0,46 and 1,50 with appurtenant p values 0,71 and 0,68 respectively, based on which, with level of statistic significance α=0,01, we cannot reject the statement which, at the same time, proposes the absence of heteroscedasticity and regularity of the model’s linear form.
Further investigations of this problem should be concentrated on development of the proposed model, so that the time dimension is included in the analysis, apart from structural data, which will enable the implementation of econometric panel model and significantly increase the number of observations. In addition, it would be of use including additional independent variables, which present economic development in countries in transition.
Anyway, based on thorough quantitative analysis, we can conclude that there is positive effect of efficient competition policy implementation on economic development in countries in transition, by which we confirm the base hypothesis set at the beginning of this research. Because of this, countries in transition have to have a detailed approach in forming the regulatory frame and regulatory body for competition protection, but also to invest additional efforts in order to maintain efficient competition policy implementation.
Conclusion
Competition policy was first established in North America as the Antitrust Law at the end of the 19th century and today it exists in more than 100 countries around the world. The USA An-titrust Law had great impact on competition policy development in the EU. Unlike traditional competition policy that has been narrowly accepted and includes only prohibition of agreements that limit competition, prohibition of dominant position abuse and prohibition of non-competitive mergers, today’s opinions are much wider and competition policy is accepted as a part of business management.
The main goal of competition policy is to increase and preserve social welfare. It promotes efficient competition and contributes creation of greater competitive pressure on the market. Competitive pressure leads to lowering of prices which directly increases consumer utility. On the other hand, competitive pressure influences technologic development and differentiation of goods because it constantly forces competitors to seek for new solutions in order to offer something new for a reasonable price.
During analysis of certain cases and processes within competition policy, it is necessary to know the difference between the definitions of competition and competitiveness. When defining competitiveness it is important to know the level of observation because competitiveness of individual firms is measured with their market share while competitiveness of economic treaties is measure by business conditions and overall business environment.
Competition on the market is defined as existence of two or more firms that mutually compete for larger distribution of their products. Competition can be static or dynamic. Static competition means the absence of innovations, products are offered at lower prices and there are no significant improvements of existing products neither there are introductions of new products. Dynamic competition is lead by innovations through which, in some cases, there is significant reduction of product prices. Dynamic competition has more influence in causing competitive pressure which results in productivity increase of individual companies and the economy as a whole.
When analyzing the indicators of efficient competition policy implementation and economic development, we can conclude that transitional countries with above average indicators of efficient competition policy implementation achieve an above average GDP per capita, so they are more economically developed than the average of observed countries. Quantitative analysis has shown positive effects of efficient competition policy implementation on economic development of countries in transition, which only confirms the base hypothesis set at the beginning of this

REDETE – ECONOMIC DEVELOPMENT AND ENTEREPRENEURSHIP IN TRANSITION ECONOMIES
663
research. In spite of that, it is highly recommended for economic policy bodies in countries in transition to implement competition policy thoroughly and carefully.
Further work related to the research of this problem should be focused on investigating the effects on competition policy on individual economic sectors and their development, in order for the regulatory bodies to create a clear plan about which sectors require supervision and control of the level of competition.
Reference list
1. Asteriou, D., Hall, S. G. (2007). Applied Econometrics: A Modern Approach. New York. Pal-grave Macmillan.
2. Bannett, P. (2000). Anti-Trust? European Competition Law and Mutual Environmental Insu-rance. Economic Geography. 76(1), pp. 50-67
3. Begović, B., Pavić, V. (2010). Šta je to konkurencija i kako se štiti. Beograd. Centar za liberal-no-demokratske studije.
4. EBRD. (2012). Data. http://www.ebrd.com/pages/research/economics/data/macro.shtml#ti (accessed 05.07.2012.)
5. EBRD. (2012). Transition Report 2011. http://www.ebrd.com (accessed 11.07.2012. 6. Geroski P. A. (2004). Is Competition Policy Worth it? http://www.competition-commissi-
on.org.uk/our_peop/members/chair_speeches/pdf/geroski_uea_140904.pdf (accessed 10.08.2012.)
7. Gifford D. J., Kudrle R. T. (2003). European Union competition law and policy: how much latitude for convergence with the United States? The Antitrust Bulleting/Fall 2003. Pp. 727-780
8. Graić-Stepanović, S. (2009). Konkurencija. http://www.fefa.edu.rs/files/pdf/StudijeIstrazivanja/11Konkurencija.pdf (accessed 05.08.2012.)
9. Grout P. A., Zalewska, A. (2007). Measuring the Rate of Return for Competition Law. Journal of Competition Law and Economics. 4(1), pp. 155-176
10. Hofer, P., Williams, M. Wu, L. (2004) Principles of competition policy economics. The Asia Pacific Antitrust Review 2004. pp.4-7
11. Kovacic W. E., Shapiro, C. (2000). Antitrust Policy: A Century of Economic and Legal Thinking. Journal of Economic Perspectives. 14(1), pp. 43-60
12. Ma, T. (2011). The Effect of Competition Law Enforcement on Economic Growth. Journal of Competition Law and Economics. 7(2), pp. 301-334
13. Monti, M. (2001). The Future for Competition Policy in the European Union. http://europa.eu/rapid/pressReleasesAction.do?reference=SPEECH/01/340&form (accessed 15.08.2012)
14. OECD. (2002). Fighting Hard Core Cartels: Harm, Effective, Sanctions and Leniency Programmes. http://www.oecd.org/dataoecd/41/44/1841891.pdf
15. Snowdon, B. Stonehouse, G. (2006). Competitiveness in a globalised world: Michael Porter on the microeconomic foundations of the competitivenss of nations, regions, and firms. Journal of International Business Studies. 37, pp. 163-175
16. Speec, O. (2005). Zaštita tržišnog natjecanja i poticanje razvoja određenih gospodarskih sektora. Gospodarstvo. pp. 156-163
17. Voigt, S. (2006). The Economic Effects of Competition Policy: Cross-Country Evidence Using Four New Indicators. http://dx.doi.org/10.2139/ssrn.925794 (accessed 17.08.2012.)

REDETE – ECONOMIC DEVELOPMENT AND ENTEREPRENEURSHIP IN TRANSITION ECONOMIES
664
HEALTH AND ECONOMIC GROWTH
Velma PIJALOVIĆ307
Abstract
The main aim of this paper is to show the relationship between health and economic growth. Namely, the relationship between health and economic growth has been widely examined by va-rious scientists. The types of studies can be divided into three major groups: (i) Historical stu-dies of growth and income effects: these studies raise the question how, in a historical period, income growth was affected due to health improvements and how much of this income growth effect can be attributed to health; (ii) Micro-studies of health investment: these studies consider the effects of health investment on an individual’s income. These studies investigate the impact of health improvements on labor productivity and wages and (iii) Macro- or cross-country-studies: these studies try to explain why some countries expose higher growth rates than others by examining cross-country-data or different aspects of the “growth motor”. This paper offers an overview over the most important models concerning the interactions between health and economic growth. The first part examines relationship between health and economics. The se-cond part analyses health as a part of human capital and discusses interaction between health and education. The final section analyses correlation between the level of real GDP per capita and health expenditure in selected European countries.
Keywords: health, economic growth, human capital
JEL: I15
307 School of Economics and Business, Trg oslobodjenja 1, 71 000 Sarajevo, B&H,
E-mail address: [email protected]

REDETE – ECONOMIC DEVELOPMENT AND ENTEREPRENEURSHIP IN TRANSITION ECONOMIES
665
1. Health and Economic Growth
Numerous studies conducted over the past twenty years have shown that there is a mutual causality between health and economic growth and development. Several studies conducted in different periods show that there is a measurable, positive and significant relationship between life expectancy and economic growth.
Barro conducted a research in 1996 in order to isolate the most important factors that determi-ne economic growth in a country. Overall health status of the population as measured by the loga-rithm of life expectancy at birth (LEB) showed a significant positive effect on the growth. The coefficient that was obtained, ceteris paribus, implies that an increase in life expectancy of forty percent (from 50 to 70 years) increases the growth rate for 1.4% per year. A similar result is obtained if factors such as child mortality rate, adult mortality rate and expected years of life at the age of five are taken as indicators of population health. It is very important to note that health exerts a significant influence on economic growth, even when the impact of education and GDP are included in the regression. (Barro, 1996).
Research Barghava in 2001 has shown there is a positive effect of health on economic growth in developing countries, while in developed countries this effect is negative. On the other hand, in countries that have achieved high standards in health and education investments in health are no less important because the longer life span increases the incentive to invest in human capital, in other words individuals are changing modern consumption for investments in health and education, because this will ultimately lead to higher return and higher future consumption.
Doppelhofer, Miller and Sala-i-Martin (2004) have included more than twenty factors that can influence economic growth in their regression analysis, which has shown that the health is the most important component of the human capital when we analize the influence on economic growth. As indicators of health they took life expectancy at birth, prevalence of malaria and the participation of tropical regions in the total area of the state.
Weil (2005) explored the impact of health on economic growth by using the data of average age, height and life expectancy of men and found that there is an influence of health on economic growth but that this influence is significantly lower than in other studies. Besides this obvious connection, a World Bank study showed a strong link between aggregate indicators of health of populations and the amount of per capita income. As an example of this relationship we can take the number of children dead before the age of five. Overall, in 2002, in the low-income countries 120 out of 1000 children died, in middle-income countries 37, and in countries with high income there were 7 deaths per 1000 children.
Besides increasing the workers' productivity, the population's health influences the economic development by increasing the number of those able to work and by decreasing direct and indirect costs of treatments. It is possible to measure the economic effects of various diseases. McDonald and Roberts (2006) concluded that in Africa the increase of number of HIV positive people by 1% affects the decrease of per capita income by 1%.
In addition to the direct impact of health on economic growth, it is important to note that many studies have shown the reverse impact of economic development on health. The relationship between classic synthetic indicators of economic growth and the amount of health expenditure per capita has been empirically proven. 35 years ago, Joseph Newhouse showed by using the cross-section analysis of thirteen developed countries that 90 percent of the variations in the amounts of per capita health care spending can be explained by differences in the amount of GDP per capita (Newhouse, 1977).
These mentioned studies, as well as numerous others that we haven’t included in this paper can be divided in three big groups:
1. Studies which are based on historical data about the economic growth and income effect
2. Studies which analyze the micro-economic effects of investing in health
3. Macro or cross-country studies

REDETE – ECONOMIC DEVELOPMENT AND ENTEREPRENEURSHIP IN TRANSITION ECONOMIES
666
Studies that are based on historical data on economic growth and income effect deal with the issues such as how in a certain historical period, health improvements influenced income growth and what percentage of income growth can be attributed to health. So, for example, Fogel shows that 20 to 30% of British GDP growth in the period between 1780 and 1979 can be explained by the improvement of health and nutrition.
The second group of studies focuses on the study of micro-economic effects of investing in health as well as on how this investment affects the individual’s income. This group includes studies on the impact of health on productivity, which we mentioned earlier.
The third group consists of macro or cross-country studies which explain why some countries have a higher rate of growth than other countries. These studies use cross-country data on various "engines" of economic growth, such as data on population growth and technological progress. In 2006, Jamison, Lau and Wang studied the impact of health on technological progress, assuming that health affects investment in education, consequently education affects the increase of the number of innovations and the increased number of innovations affects technological progress. (Fimpel J ,2007), The relationship between health and economic development can be graphically shown as in scheme 1. Human capital can be increased by investing in education and health, thus the relationship between education and health is very important.
3. The relationship between health and education
The concept of “investing in people” was introduced into economic theory in the late 50’s and we find the first contemplations of health being treated as capital in an article published in The Journal of Political Economy in 1962, the year in which S.J. Mushkin treats health as an impor-tant investment. In the mentioned work Mushkin analyzes the similarities and differences between education and health. Education and health both increase the "productivity" of individuals where the individual is seen both as a consumer and a producer. Both education and health are partly consumer goods and partly investments considering that both components are treated as implicit components of the life standard. (Mushkin, 1962).

REDETE – ECONOMIC DEVELOPMENT AND ENTEREPRENEURSHIP IN TRANSITION ECONOMIES
667
Scheme 1: Health and economic growth
On the other hand, there are differences between education and health, as important compo-nents of human capital: (i) while investing in education increases the quality of the work force, investing in health increases the number of people able to work as well as the working capacity of an individual, (ii) while the health program seeks to prevent diseases that arise due to the "hostile" environment, education seeks to detect and encourage natural talents that develop in the mentioned area, (iii) with education, there are two alternatives: to invest or not to invest, while with health there is the question of choice between investing in health or letting Darwin’s law of the survival of the fittest take over, which in modern society is not an acceptable option.
Special feature of the health and education is that they are both on the one hand a result of the manufacturing process and on the other an input in the production process.
Considering that the impact of health and education on efficiency and economic growth is difficult to isolate most of the authors take into account only the impact of human capital as a whole. However, there are a number of interdependencies between education, health and produc-tivity.
First interdependence of health and education is reflected in the impact of education on the demand and supply of health services. Demand of the health care services increases with the higher level of education. On the other hand, the level of education affects the provision of health services. The delivery of health services is more efficient with less experimentation and with a reduced risk of failure. In addition, education plays a very important role in disease prevention
HEALTH
PRODUCTIVITY
EDUCATION
GDP GROWTH
Investments in health and
human capital INVESTMENTS
Demand for health services
Provision of health care services
HEALTH
HUMAN CAPITAL

REDETE – ECONOMIC DEVELOPMENT AND ENTEREPRENEURSHIP IN TRANSITION ECONOMIES
668
because patients with higher levels of education have more knowledge on methods how to prevent some disease.
Sala-i-Martin for example, states that children of better educated mothers in developing cou-ntries have a significantly greater chance of survival than children whose mothers are illite-rate. This is explained by the fact that educated mothers understand the need for hand washing, using soap, clean drinking water and contacting a doctor when necessary (Sala-i-Martin, 2006).
Higher education increases the rate of financial return from health, because a longer life span signifies an increase in revenues during a lifetime, while dying earlier in life would make, for each individual and the society, investing in education less cost-effective.
On the other hand, health has a major impact on education as well. For example, sick children in developing countries suffer from hunger, malnutrition, parasites and infections which ultimately lead to a large number of absences from school and drop in the number of enrolled participants.
At the same time, children in richer countries are often overweight, lack physical exercise and often have psychological problems. Some of them are inattentive, hyperactive, and have trouble concentrating in class. Also, in an unhealthy environment, parents die younger leaving children behind, which is a big problem since "guidance, financial protection, support, and parents’ kno-wledge are key in the process of educating children" (Sala-i-Martin, 2006).
Another influence of health on education is seen in the incentive to invest in education. Healthy people who are less likely to get sick are expected to make more out of education they receive, so the companies are motivated to invest more in the education of employees. The same is true for an individual. In the case of low life expectancy, the present discounted value of the income of an individual's life is reduced, and therefore the usefulness of education and training is relatively low, so individuals are not motivated to invest in education.
Besides these interactions between health and education, it is important to note that both health and education affect productivity and ultimately the overall economic development of a country. Sala-i-Martin states that poor health is a cause and consequence of poverty. He calls this phenol-menon "poverty trap." The unhealthy people have less productive bodies, in terms of power and height, and a hungry man is unable to concentrate properly, therefore has a smaller brain capa-city. (Sala-i-Martin, 2006)
It is possible to find plenty of examples to support the argument that health increases worker productivity.
For example, Schultz's work published in 1999 and 2000, and Bloom's works published three years later also showed that at the macro level there is a positive correlation between health and productivity of workers. (Chawla, 2007)
4. The amount of GDP and health expenditure
Since the governments took over the responsibility for health care, the costs are becoming one of the main and ever-growing components of public finances. However, there are large differre-nces in the amount of health care spending measured as a share of GDP or per capita amounts among different countries.
The first work that attempts to explain these differences and to specify the determinants of health expenditure is considered to be the work of Newhouse where he shows on the example of 13 OECD countries that 90% of the variation in the amount of health care spending per capita can be explained by differences in the amount of GDP per capita (Newhouse, 1977). Hoffmeyer and McCarthy in 1994 and Roberts in 1999 state that twenty years after Newhouse there had been very little progress since that finding that the variations in national income per capita are closely associated with variations in health spending per capita. Surveys conducted during this period were mainly based on studying OECD countries in different time periods. As examples we can

REDETE – ECONOMIC DEVELOPMENT AND ENTEREPRENEURSHIP IN TRANSITION ECONOMIES
669
mention the following works: Leu (1986), Culyer (1995), Getzen and Poullier (1991), and Hitris and Posnett (1992). (Fimpel, 2007)
In order to prove our thesis about the connection between the amount of health care spending and economic growth, we can test the connection between the amount of health care spending and the level of GDP per capita. Trend analysis and convergence of health expenditure has been made for three groups of countries and Bosnia and Herzegovina. The first two groups are EU15 countries - old members and new members of the EU - EU12 countries, while the third group consists of: Croatia, Montenegro, Macedonia, Iceland, Turkey and Serbia, which are identified as the EU candidate countries. Serbia is included in this group because its status in the negotiation process for EU membership is similar to the status of BiH. All analyses were done for the last year for which data is available - 2008.
Table 1: Average values and the rate of deviation in dependent and independent variables
Variables Group N Smallest
value Biggest value
Arithmetic mean
Standard deviation
Health spending as a % of GDP
EU15 15 7,20 11,10 9,3467 0,94783 EU12 12 4,70 7,80 6,7667 0,89477
EU candidates 7 5,00 11,80 8,7429 2,28754 Total 34 4,70 11,80 8,3118 1,73026
Health spending per capita PPP$
EU15 15 2334,00 6047,00 3482,2667 841,72921 EU12 12 665,00 4039,00 1717,2500 1009,33652
EU candidates 7 695,00 4310,00 1460,7143 1293,69338 Total 34 665,00 6047,00 2443,1176 1353,37078
Real GDP per capita PPP$
EU15 15 23124,00 83759,00 38082,3333 13472,21266 EU12 12 12394,00 53527,00 24831,3333 13155,17023
EU candidates 7 8417,00 49423,00 20132,4286 16223,59678 Total 34 8417,00 83759,00 29709,9412 15572,94328
The highest health spending in all countries analyzed is recorded in Iceland (11.8% of GDP). In the EU15 group France has the highest health spending (11.1%) and in the EU12 group Slovenia is the one with highest spending (7.8). Data on the lowest health spending relates to Romania (4.7%), while among the old members the lowest health spending measured as a % of GDP is recorded in Luxembourg (7.2%). Among the candidate countries the smallest percentage of GDP (5%) allocated to health we find in Turkey. If we consider the long dependent variable- health care per capita, as expected, the highest value is recorded in EU15 countries. Luxembourg allocates $ 6,047 per capita for health annually. In the EU12 group Malta has the largest allocation of $4039, while Iceland allocates $ 4,310.
As chart 1 shows, health care spending as a % of GDP is more or less uniform for all three groups of countries, but in last periods there is a notable trend of consumption decrease- stabilizing (remaining more or less at the same level) in the candidate countries and new member states.
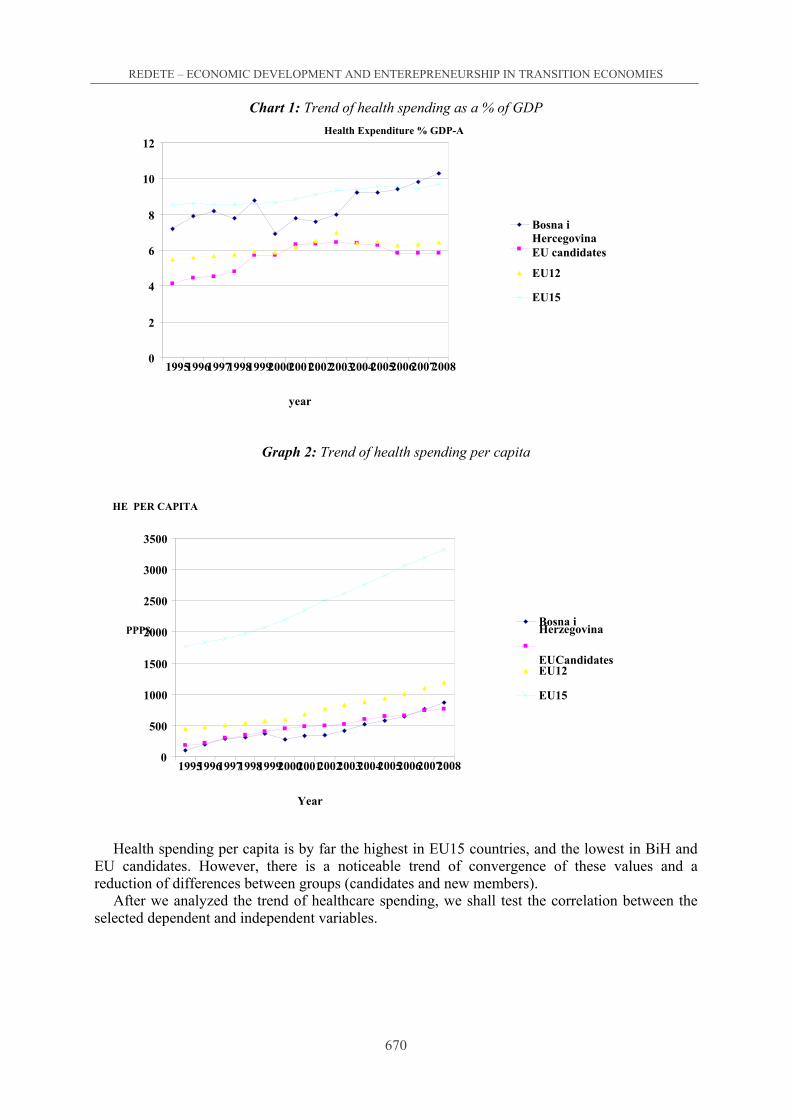
REDETE – ECONOMIC DEVELOPMENT AND ENTEREPRENEURSHIP IN TRANSITION ECONOMIES
670
Chart 1: Trend of health spending as a % of GDP
Graph 2: Trend of health spending per capita
Health spending per capita is by far the highest in EU15 countries, and the lowest in BiH and EU candidates. However, there is a noticeable trend of convergence of these values and a reduction of differences between groups (candidates and new members).
After we analyzed the trend of healthcare spending, we shall test the correlation between the selected dependent and independent variables.
0
2
4
6
8
10
12
1995 1996 1997199819992000 2001 2002200320042005200620072008
year
Health Expenditure % GDP-A
Bosna i Hercegovina EU candidates EU12
EU15
0
500
1000
1500
2000
2500
3000
3500
1995 1996 19971998 1999 2000 2001 2002200320042005200620072008
Year
HE PER CAPITA
PPP$ Bosna iHerzegovina
EUCandidatesEU12
EU15

REDETE – ECONOMIC DEVELOPMENT AND ENTEREPRENEURSHIP IN TRANSITION ECONOMIES
671
Table 2: Values and levels of significance of the Pearson correlation coefficient between dependent and independent variables
Prediction variable Health spending as a % of GDP Health spending per capita ppp$
Pearson correlation coefficient
Level of significance p
Pearson correlation coefficient
Level of significance p
Real GDP PPP$ 0,161 0,363 0,875 0,000** ** correlation is statistically significant at the level smaller than 1%
Chart 3 Correlation of health spending as a % of GDP and real GDP per capita
On the basis of chart 3, we can conclude that there is a positive trend of association, and as examples of bi-variant extreme values we can give BiH and Luxembourg which, in their positions, lie the farthest from the line of regression.
80000,0060000,0040000,0020000,00 0,00 GDP PPP$
12,00
11,00
10,00
9,00
8,00
7,00
6,00
5,00
4,00
HE % GDP-A
TURSKA
ŠVEDSKA
ŠPANIJA
SRBIJA
SLOVENIJA
SLOVA?KA
RUMUNIJA
PORTUGAL
POLJSKA
NJEMA?KA
MALTA
MAKEDONIJA MA?ARSKA
LUKSEMBURG
LITVANIJA
LATVIA
KIPAR
ITALIJA
ISLAND
IRSKA
HRVATSKA
HOLANDIJA
GR?KA
FRANCUSKA
FINSKA
ESTONIJA
DANSKA
?EŠKA REPUBLIKA CRNA GORA
BUGARSKA
BOSNA I HERCEGOVINA BELGIJA
AUSTRIJA

REDETE – ECONOMIC DEVELOPMENT AND ENTEREPRENEURSHIP IN TRANSITION ECONOMIES
672
Chart 4: Correlation of health spending per capita and real GDP per capita
In Figure 4 we can see that the trend is clearly positive in the sense of correlation. Among the
bi-variant outliers the only noticeable position is that of Croatia. Based on the data from the table and graph layout, we can conclude that real GDP PPP $, is significantly correlated with health expenditure per capita, while the value of the Pearson coefficient and the look of the diagram suggest that the correlation between real GDP per capita and other independent variable is not significant.
Based on everything we stated above we can conclude that this analysis has shown that there is a clear correlation between the consumption of health care spending, spending per capita and economic development of countries surveyed - measured in terms of GDP PPP $ per capita.
4. Conclusion
Based on the analysis of numerous studies and scientific works, in this paper we showed that health has a significant influence on economic growth, on different ways. Some studies showed the connection between economic growth and indicators of population health, other studies dealt with the issues of how health improvement influenced income growth, while some other studies proved the connection between health expenditure and economic growth. Considering that the health and education present main components of human capital, in this paper we also analysed their connection too.
In order to prove our thesis about the connection between the amount of health care spending and economic growth, we decided to test the connection between the amount of health care spending and the level of GDP per capita. Trend analysis and convergence of health expenditure has been made for three groups of countries and Bosnia and Herzegovina.
Based on the analysis in this paper, we can conclude that there is a clear correlation between the consumption of health care spending, spending per capita and economic development of countries surveyed - measured in terms of GDP PPP $ per capita.
80000,0060000,0040000,0020000,00 0,00 GDP PPP$
8000,00
7000,00
6000,00
5000,00
4000,00
3000,00
2000,00
1000,00
0,00
HE PER CAPITA PPP$
TURSKA ŠVEDSKA
ŠPANIA
SRBIJA
SLOVENIJA
SLOVA?KA
RUMUNIJA
PORTUGAL POLJSKA
NJEMA?KA
MONTENEGRO
MALTA
MAKEDONIJA
MA?ARSKA
LUKSEMBURG
LITVANIJA
LATVIJA
KIPAR
ITALIJA
ISLAND
IRSKA HRVATSKA HOLANDIJA
GR?KA
FRANCUSKA
FINSKA
ESTONIJA
DANSKA
?EŠKA REPUBLIKA
BUGARSKA BOSNA I HERCEGOVINA
BELGIJA
AUSTRIJA

REDETE – ECONOMIC DEVELOPMENT AND ENTEREPRENEURSHIP IN TRANSITION ECONOMIES
673
Reference list
1. Barro, R.J. (1996): Health and Economic growth, (accessed 15.09.2010 at:http://www.paho.org/English/HDP/HDD/barro.pdf )
2. Barghava, A., D.T. Jamison, L.J. Lau, C.J.L. Murray (2001): Modelling the effects of health on economic growth, Journal of Health Economics, Vol. 20,
3. Chawla M (2007), Health Care Spending in the New EU Member States – Controling Costs and Improving Quality, The World Bank, Washington, D.C
4. Culyer, A. J. (1995): Equality of what in health policy? Conflicts between the contenders, Department of Economics and Related Studies, University of York
5. Doppelhofer, G., R. Miller and X. Sala-i-Martin (2004): Determinants of long-term growth: a bayesian averaging of classical estimates (BACE) approach, American Economic Review, Vol. 94 (4)
6. Fimpel J (2007), Health and Economic Growth: A Stability Approach, Andrássy Universität Budapest, Budapest
7. McDonald, S. and J. Roberts (2006): AIDS and economic growth: a human capital approach, Journal of Development Economics Vol. 80
8. Mushkin, S. J. (1962): Health as an investment, in: The Journal of Political Economy, Vol.70, no. 5, Part 2: Investment in human beings
9. Newhouse, J.P. (1977), Medical-care expenditure: a cross-national survey. Journal of Human Resources 12 (1), 115–125.
10. Sala-i-Martin (2006): The health-poverty-trap, in: López-Casasnovas et. al. (eds.), Health and economic growth: Findings and Policy Implications, MIT press.
11. Weil, D. N. (2005): Accounting for the effect of health on economic growth, NBER working paper

REDETE – ECONOMIC DEVELOPMENT AND ENTEREPRENEURSHIP IN TRANSITION ECONOMIES
674
BENCHMARKING AS A FUNCTION OF CREATING
A NEW IMAGE OF ENTERPRENEURSHIP IN THE REGION OF FORMER YUGOSLAVIA
Duje PETRIČEVIĆ308
Abstract
The overwhelming, negative perception of the entrepreneurship present in the geographical area that once was Yugoslavia remains at the core of a relatively humble influx of FDI, as well as the hesitance of the local populace to invest. The prevailing perception is a consequence of unsuccessful transformation of the model of ownership, paired with a privatisation that had, quite frequently, little or no basis in economy. One of the greatest obstacles to the harmonious entrepreneurial development is the militaristic notion of ethnicity and its significance in the eco-nomic and social ruin of ex-Yugoslavian nations. The isolation is not the answer to economic difficulties, even when the country is the member of the European Union (a poignant example is the country of Slovenia). Therefore, creating a completely novel image of entrepreneurship is not only needed, it is required, and thus represents an absolute imperative. With that regard, a benchmarking analysis is quite feasible and practical, for it is possible to direct attention to-ward successful business cases that can provide general guidelines for the creation of a new image of entrepreneurship in the entire region of ex-Yugoslavia.
At the beginning of the 90’s of the previous century, Yugoslavia, once a nation at the apex of socialist theory and practice, became a stage for political turmoil and armed conflict. The newly formed countries were governed in an authoritative manner. Manipulations of the media, unethical actions preceding elections, intimidations and occasional executions of political opponents marked the every-day life of the populace. The theft and carnage that followed damaged the image of entrepreneurship almost beyond repair. In spite of these facts, the basis for creating a successful, positive image of entrepreneurship still exists.
Yugoslavia had practised a unique concept of social ownership and self-governing economy. Once the country was no more, the individuals in power and frequent opportunists did every-thing to establish their own, extreme view on ethnic identification. They deemed it necessary, in order to transition the society from one where power is based on the position in the hierarchy one holds, to the structure of power based on ownership. Therefore, the ethnical identification became the means to successfully manipulate and control the people.
These problems, unfortunately, are extremely complicated, and interdisciplinary at their very core. The full cooperation of all the nations in the region should provide a valuable starting po-int for change and a period of increased prosperity. With that regard, it is possible to dismantle the frequently promoted “ethnical differences” that still primarily serve as the means of control and manipulation. With that regard, the basic goal of this research is to argue that every single country in the region has to link and network their resources and economic entities, if each na-tion is hopeful in surviving in the market of European Union.
Keywords: entrepreneurship, Yugoslavia, perception, benchmarking, foreign direct invest-ment, capitalism
308 Doctoral student, University of Split, Faculty of Economy; Cvite Fiskovića 5, 21 000 Split, [email protected]

REDETE – ECONOMIC DEVELOPMENT AND ENTEREPRENEURSHIP IN TRANSITION ECONOMIES
675
Introduction
One cannot hope to even begin to understand how an otherwise reputable economic activity – entrepreneurship, could have suffered such a considerable perceptive distortion by the majority of the populace inhabiting ex-Yugoslavia. In order to approach the problem in a sufficiently adequ-ate manner, one has to explore the conditions that lead to the public’s perception of entrepreneur-ship as a, at best, shady, dishonest and dubious dealing.
The 1989 marked a distinctly crucial turning point for the Socialist Federal Republic of Yugo-slavia (SFRY), when the situation went for the worse and a country that was on cutting edge of East European socialist theory and practice was suddenly embroiled first into political chaos and then, a year later, into violent war. Yugoslavia, the most open and liberal society of the region and the socialist country with the highest per capita income, one deemed most likely to join the European Community, suddenly disappeared from the stage of history. Though disguised as “ethnic hatreds”, the wars were the result of political struggles between newly formed elites, which ruthlessly vied for economic and political dominance.
The 1990 shattered the political identity of “Yugoslavism”. In its place now stood not nationa-lities, but nationalist leaders, who tricked the populace in sacrificing their lives at the altar of their blind ambitions. Therefore, it is important to note that Yugoslavia did not disintegrate naturally. Rather, it was purposefully and strategically destroyed by those motivated to achieve dominance inside the country as a whole, as well as those who wanted to shatter the federation into pieces.
These forces created and provoked violent conflict and worsened existing, nonviolent conflicts. This strategy proved to be extremely successful and profitable, for the elites were thus able to control the resources and steer the social and cultural change. Unfortunately, this “change” almost immediately translated into cultural and social disintegration.
The Yugoslav system itself was based on power that depended on positions attained within the hierarchy of the ruling party and/or within the political and economic bureaucracy, rather than actual ownership (which was true in the case of capitalist regimes). However, SFTY was not a typical socialist state, for each country had a large amount of autonomy from the centre, which resulted in a confederal party-state. Quite obviously, the union was most certainly not paradise on Earth, but it also was not the keg of gunpowder we were all led to believe. The war that erupted was not spontaneous, but rather, calculated, prepared, galvanised by the people who wanted the conflict to start.
Thus the elites, craving power, fully exploited their control over military and media in order to construct perception of immediate, immense threat from the “other”. The concept itself was almost hysterically funny, were it not for the imminent threat and subsequent cost expressed in peoples’ lives and property. Thus, an apparent unison between ethnic identity and political posi-tion was formed. Those opposing these policies were effectively silenced and marginalized. It is only natural that true heroes arose during the war, such as, in Croatia, Josip Reihl-Kir. Assuredly, each ex-Yugoslavian country had people who tried to stem the tide.
The sad truth was that there was no objective reason that required the SFRY to disintegrate in violent conflagration of open warfare (Garon).
Rise of the “entrepreneurs”
The mindless violence planted the seed for complete social and economic disintegration of the former Yugoslavia.According to the Yugoslav constitution of 1974, social property was a special form of collective property of the means of production. It belonged to the whole community and was not the possession of one collective, group or individual (Stallaerts).
The Yugoslav system of self-management was therefore a hybrid system of a managed market economy, with somewhat fuzzy property rights. Practically, this meant that the managers and worker’s councils, within the bounds of the law, could only use the firms’ property and assets.

REDETE – ECONOMIC DEVELOPMENT AND ENTEREPRENEURSHIP IN TRANSITION ECONOMIES
676
The act of selling them was not an option, for they belonged to each member of the community. Thus, this unique economy resembled more a true market economy, as opposed to a centrally planned economy. This system empowered employees and provided them with the belief that they “owned” the enterprises they worked for (Vujačić).
Thus, at least in theory, the hybrid system was set to be converted into one of private owner-ship. Finally, the definitive owners were to be known, so they could take on the responsibilities, risk and the profit. In general, the economic transition is frequently perceived as the transition from a less efficient (stable) economic system, toward a more efficient one. However, it is also important to point out it comes at a great social cost, particularly in the case of ex-Yugoslavia.
Essentially, privatisation is a zero-sum game, which means that non-cooperative behaviour is vastly prevalent. The newly formed political and economic elites formed a tacit agreement and took advantage of those with least money and/or influence. With that in mind, it is crucial to point out that all of the transitional countries started to massively defund the social welfare programs.
There were some positive impacts of privatisation. However, they remained nominal at best. The negative effects of both the transition and privatisation were corruption, unemployment and tax evasion. Thus new elite, a class of “entrepreneurs” was created. The mainstream media almost always congratulated them on their success and often used the indispensible epithet “successful”. Unfortunately, the Croatian satirical news magazine, the sharp and profound, Feral Tribune, was quite a lonely sight to behold in these troubled times., at least inside the borders of Croatia.
The after-effects of both transition and privatisation were far-reaching and influential, and can
be grouped thusly (Grgurek): 1. New owners had no concept of development, for everyone just sought to earn capital
gains. Therefore, nobody was truly interested in the business process or the products. There literally was no true marketing to speak of.
2. The prevailing logic glorified trade. The act of trading, not producing, society believed, gave rise to prosperity and well-being.
3. The annihilation of conglomerates left destruction and myriad small, weak enterprises in its wake.
4. Higher unemployment and lower wages decreased worker rights.
5. The highly skilled workers migrated.
Generally speaking, in the post-socialist economies, there is present an “apparent hostility”
toward enterpreneurship and profit making, at lest on the social level (Kalantaridis). This was made exponentionally worse by the peculiar transition of ex-Yugoslavian countries.
The transitional reality itself was marked by a distinctly schizophrenic nature. On one hand, the populace craved the plenty associated with capitalistic societies. On the other, it resisted the inequalities are an indispensable side-effect of the capitalistic system. Thus, all of the explained factors gave rise to the widespread dissatisfaction of the entire populace of ex-Yugoslavia.
At its core were, and still remain, two dominant preconceptions (Štulhofner): 1. Privatisation is unfair and predominantly done in an unlawful manner. Trough shady
dealings the chosen “elites” have now became the owners of a great portion of what once was owned by every member of the society.
2. The entrepreneurs are opportunists who do favours for the politicians and state clerks, taking advantage of those less fortunate. Political connections and unscrupulousness are the basic traits of all entrepreneurs.
This does not come as a surprise, considering the “entrepreneurs” abused social property and
stripped assets for their own benefit, only to provide material and moral support to the regime.

REDETE – ECONOMIC DEVELOPMENT AND ENTEREPRENEURSHIP IN TRANSITION ECONOMIES
677
Money laundering in the privatisation process has not been adequately dealt with. This lead to privatisations in which individuals, widely suspected of criminal activities, used their wealth to purchase firms (Vujačić). On these basis, the overwhelmely negative image of enterpreneurship is quite understandable. Therefore, it is cleasr it also has to be improved.
The research problem
Individuals in post-socialist economies do not necessarily have a lower propensity to engage in enterpreneurial activities than those in matured market economies. However, it is important to note that the concept of enterpreneurship is quite broad in post-socialist economies. One way to classify entrepreneurial activities is in terms of their legalities. There have been an increasing number of businesses within the legal boundary. However, broadly speaking, “extralegality has become the norm” (De Soto).
It is reasonable to expect that, compared to more matured market economies, unproductive and destructive forms of enterpreneurship are likely to be more prevalent in post-socialist economies. Finally, a remarkable example of “parasitical existence” of enterpreneurs upon the economy is, in some post-social economies, the creation of firms that serve as support for the criminal activities. This is the destructive enterpreneurship, in which enterpreneurs engage in detrimental activities, which in turn leads to net social loss (Kshetri).
Therein lays the heart of the problem. What should be perceived as a driving force of economic development is essentially regarded by the populace as brazen criminal activity. Entrepreneurship has to be seen as an economically positive force for the entire region, from which every nation can and should benefit.
The negative image, coupled with the further social deterioration among the nations of ex-Yu-goslavia offered little chance for the development of vibrant societies. The post-socialist bloc ranks consistently lower on indicators commonly used to gauge the progress of civil society: associational membership, volunteerism and protest action. The citizens of Central and East European countries express a fair amount of trust in civil organizations and yet are reluctant to join them.
Evidence from the macro level indicates that trust in civil institutions is higher in countries where corruption is an acute problem and lower in relatively transparent political contexts. At the micro level, citizens who perceive corruption to be one of the most worrisome problems facing their country are on average more likely to trust non-government organisations, charity and voluntary organisations (Marinova). Thus, the image of enterpreneurship has to be one of positive affirmation, which could in turn galvanise beneficial social changes, benefiting both the micro and the macro.
Also, foreign direct investment plays a particularly important role for catch-up development, where investment from technologically advanced regions in less advanced regions may lead to the transfer and dissemination of knowledge into the host economy. For the countries of ex-Yugoslavia, the integration into the European division of labour and technological catching up, remain the most important task. These economies were disconnected from technical progress in the West for an extended period and a significant productivity gap still prevails. It is important to note that intellectual property rights regimes alone will not be sufficient to tap the full potential of international technology transfer (Johannes).
Rather, a mix of other policies is needed, which should include the following: the promotion of wider political stability, encouragement of flexible labour markets, further liberalisation of the markets, and investment in the intellectual property (Maskus). Other instruments to attract foreign direct investment may include the host country’s guarantee of good infrastructure supplies, transparency in policies and regulations, as well as the government stability (Kalemli-Oczan).
However, this is by no means an easy fix, for post-socialist states that received more foreign investment per capita also registered more income inequality. In fact, the similarity between the

REDETE – ECONOMIC DEVELOPMENT AND ENTEREPRENEURSHIP IN TRANSITION ECONOMIES
678
privatisation and foreign capital penetration effects, coupled with the marginal inequality reducing effect of domestic investment, suggest that privatization strategies favouring foreign capital created more inequality that those favouring domestic capital (Bandelj). Evidently, the research problem is extensive and requires an interdisciplinary approach. Also, alternatives for further privatisation have to be found, for it could be argued that they are merely means to raise money used to cover regional budget deficits.
Research results
Several key issues presented quite a problem, one that should be solved in order to further the economic and sociological development of the entire region. Unfortunately, there are no easy solutions or one-sided measures that could miraculously result in significant progress. The benchmarking tool for the presented problem appears to be quite a blunt instrument. However, in the opinion of the author, this presents both the weakness and the biggest strength of the paper.
As was already discussed, the negative perception of entrepreneurship is rooted deep into the psyche of all the inhabitants of former Yugoslavia. A single country bent on changing the way people perceive entrepreneurship is probably doomed to fail, even in the long run. On this complex issue, several different scientific fields, such as sociology, economy and psychology all have to muster the all their courage and knowledge, in order to tackle the colossal problem.
In order to ensure the social and economic progress of the entire region, people from all over the Yugoslavia that tried to prevent conflict and foster mutual respect and understanding should be widely known, held in the highest regard and universally lauded for their brave deeds. Assuredly, such people exist or have existed during the war, in every single country. Some laid their lives for the cause of peace, while others fought trough music or art. It is a social prerequisite that has to be met in order to ultimately result in the economic well-being of the entire region.
Psychology should help the people affected by the horrors of war, for not a single victim of war, no matter what his/her nationality is, should be left behind. It is quite easy for one to be objective when unscarred by war. All the societies must express compassion and understanding to those afflicted, without exception.
Finally, economy is certainly able to contribute as a whole, but this especially holds true for the field of marketing, because of its interdisciplinary nature. Creating stakeholder networks among nations, forming joint brand locations in cross-border locations, promoting tourism of the entire region, fostering the transfer of workers and the creation of joint business enterprises are just a few of the possible measures that could reap enormous benefits in the future.
Nationalists on each side of the borders would probably argue that all of this reminds a lot of a futile attempt to resurrect Yugoslavia. The author of this paper holds that there is more than enough scientific evidence to warrant the creation of a close cooperation between all the nations in the region, without any political implications.
Conclusion
The aim of this paper was twofold. First, it aimed at identifying the causes for the need of creating a new image of entrepreneurship in the region of ex-Yugoslavia. Secondly, it wanted to offer benchmarking insights into solving the difficulty presented. It basically concluded that such a complex task could be achieved through mainly interdisciplinary means, although the science of economy could play a significant role. Establishing strong tourism brands, communication and stakeholder networks could easily attract investors.
However, although FDI in developed countries provides support for economic growth, it also leads to corruption. It is highly recommended that, while a better foreign investment climate will certainly attract foreign investors, countries should also focus on improving the investment

REDETE – ECONOMIC DEVELOPMENT AND ENTEREPRENEURSHIP IN TRANSITION ECONOMIES
679
environment for domestic entrepreneurs. Countries that receive more foreign investment, an important conduit for new technologies, management experience and access to markets – enjoy faster growth (Debab). Ex-Yugoslav countries, if they manage to cooperate, can hope to stand together in the tough market that is the European Union. The nationalist should try to approach the problem logically and ask themselves whether they would like to live in a safer society and what kind of World would they like their children to live in.
The prospering of the economy is likewise supported by the introduction of democratic institutions, such as rule-of-law or effective property rights. The more economically prosperous a nation is, the greater the chances it will sustain democracy. Apparently, the most persuasive argument for accepting new democratic system is a flourishing economy. The only available option of achieving it is trough cooperation, from the highest to the lowest hierarchical levels.
After the demise of “real” socialism, perhaps it can be salvaged as a social preference system oriented toward equality and social justice, to be implemented without systemic constraints in the organisational and institutional sense (Chilosi).
Reference list
1. Bandelj, N., Mahutga, M.C. »How Socio-Economic Change Shapes Income Inequality in Post-Socijalist Europe.« Social Forces (2010): 2133-2162.
2. Chilosi, A. »The economic system as an end or as a means, the socialization of consumption, and the future of socialism and capitalism.« Economic Systems (2002): 401-407.
3. De Soto, H. The mystery of capital: why capitalism triumphs in the West and fails everywhere else. New York: Random House, 2000.
4. Debab, N. »Globalization and Privatization: Two Faces One Coin.« International Research Journal of Finance and Economics (2011): 7-29.
5. Garon, V.P. Jr. »Yugoslavia in 1989 and after.« Nationalities Paper (2010): 23-39. 6. Gregurek, M. »Stupanj i učinci privatizacije u Hrvatskoj.« Ekonomski pregled (2001): 155-
188. 7. Johannes, S. »Foreign direct investment in weak intellectual property rights regimes - the
example of post-socialist economies.« Post-Communist Economies (2011): 35-53. 8. Kalantaridis, C. »Globalization and entrepreneurial response in post-socialist trasnformation: a
case study from Transcarpathia, Ukraine.« Eur Plann Stud (2000): 285-300. 9. Kalemli-Oczan, S., et al. »Why doesn't capital flow from rich to poor countries? An empirical
investigation.« Journal of Economic Literature (2003): 1-67. 10. Kshetri, N. »Entrepreneurship in post-socialist economies: A typology and institutional
contexts for market entrepreneurship.« Journal of International Entrepreneurship (2009): 236-259.
11. Marinova, D.M. »When government fails us: trust in post-socialist civil organisations.« Democratization (2011): 160-183.
12. Maskus, K.E. »Intellectual property rights and foreign direct investment.« Centre for international economic studies (2000).
13. Neundorf, A. »Democracy in Transition: A Micro perspective on System Change in Post-Socialist Societies.« The Journal of Politics (2010): 1096-1108.
14. Seleznev, A. »On the Illusions of "Investment-Oriented Privatization".« Problems of Economic Transition (2011): 66-84.
15. Stallaerts, R. »Towards a Justiflcation of Social Ownership: A Comparison of the Property Rights, Social Choice and Economic Justice Approach.« Review of Social Economy (1994): 72-85.
16. Štulhofer. »Krivudava staza hrvatske privatizacije.« Privatizacija i modernizacija (1998): 1-17. 17. Vujačić, I., Petrović, J. »Privatisation in Serbia - Results and Institutional Failures.« Economic
Annals (2001): 89-105.

PART EIGHT:
Smes: Management, Financing, Challenges and Issues

REDETE – ECONOMIC DEVELOPMENT AND ENTEREPRENEURSHIP IN TRANSITION ECONOMIES
681
THE MOST COMMON SYMPTOMS AND CAUSES OF CRISES IN SMALL AND MIDDLE COMPANIES
Sead OMERČEVIĆ309
Abstract
What is typical for every crisis situation is that the symptoms which led to the crisis were rather strong but nobody noticed. Furthermore, to identify a crisis is pretty easy if there are clearly visible symptoms. However, it is the basic problem, since the most of the symptoms, concerning crises, are related to various effects and factors. When the very course of a crisis in a company is taken into consideration, it can easily be concluded that collapse of a company at first begins very slowly (but very surely as well), and as the time goes by, all kinds of adversities that a company is faced with, only become more obvious and more difficult to handle at the same time.
Within the scope of this work, the most important symptoms, causing crisis situations in sma-ll and middle companies, were selected and elaborated on. The work is also based on a broad research of the author concerning a crisis and crisis situations. The primary objective of this work is to compare the theoretical attitudes and to prove them i.e. to relate them to the real symptoms, those which cause crises in companies. The crucial symptoms or factors, which are of great importance for a company in the process of overcoming a crisis are certainly brought about by internal elements, which altogether may well be considered as a hypothesis of this wo-rk. What will also be checked through these causes of crises are competences/incompetences of management when it comes to running a company successfully, but the significance of manage-ment in the process of avoiding or overcoming crisis situations will also be emphasized. What is of really great importance and what will be the main topic of this work, are phases, i.e. psycho-logical reactions of employees in a company, to a crisis occurrence. Moreover, through both domestic and foreign literature, as well as through a lot of activities concerning the empirical research, this proves to be one of the most important segments which need to be considered when a crisis occurs in a company.
Through this work, the chronological symptoms causing crisis situations will be introduced, and explanations for them will be provided appropriately. Also, the matching of the crucial symptoms was done, and the interdependency existing between them was pointed at, in other words, the “domino effect” between them. The objective of this paper is to seek the answer to the question: in which phase a company still has a chance to react, or to get back on a path to recovery. One part of the work will deal with crisis management and its influence and function in a crisis-affected company.
Keywords: symptoms of a crisis, causes of a crisis, crisis, crisis situations, market share loss, liquidity.
309 Babilon Ltd. CEO, Alekse Šantića 45, 75 000 Tuzla, Bosnia and Herzegovina, E-mail: [email protected]

REDETE – ECONOMIC DEVELOPMENT AND ENTEREPRENEURSHIP IN TRANSITION ECONOMIES
682
1. Introduction
A crisis has two main features: the first one is that signs of a crisis occur very early, and the second one is that nobody sees those signs (Dojčinović, 2008. 27).
In case that a crisis occurs suddenly, at that moment it is pretty easy to identify it. We have the
same situations when it comes to fires, floods, explosions, etc. For all the crisis situations which occur in this way, every company should have a pre-prepared crisis plan for solving these new si-tuations. It is much more difficult for a company to notice (identify) the weak signals which actu-ally serve to warn about a crisis. This is also supported by a fact that, managers at the middle level of management do not react to these early signs of worsening a business, which are actually anno-uncing a crisis. Actually, the symptoms are features based on which an existence of a crisis can be observed.
Symptoms of a crisis can also be discussed from the aspect of having different definitions for a crisis. For instance, if a crisis is observed in relation to the objectives of a company, then we can have the following forms of a crisis: crisis of success, crisis of liquidity, and crisis of strategy (Briker, 2000, 67). All of these three forms were previously explained. To form any reasonable attitude about the current form of a crisis is only possible after we have a temporal comparison, i.e. after analyzing and comparing data from several consecutive years (Bedenik, Osmanagić, 2007, 161).
It is very easy to identify a crisis if there are clearly visible symptoms of a crisis. However, it is the basic problem since the majority of those symptoms can be caused by various factors and effe-cts. When we analyze typical courses of crises in companies, we come to conclusion that a colla-pse of a company first comes very slowly and then, as the time goes by, all the adversities that a company is faced with become only stronger. A crisis has a variable course and intensity of affe-ctting a company.
It is necessary that management continually monitors the course of operating a business in a company, and in order to make that happen, all the five basic functions of management must be performed permanently and consistently (planning, organizing, managing, staffing, and contro-lling). Professional and experienced management registers and recognizes the first symptoms of a business crisis in due time and automatically performs certain activities which will help to combat a crisis. A problem can be noticed through monitoring an entire stream of information from certa-in departments such as: sales, supply, marketing, production, finance, accounting service etc. Ho-wever, this is the point where we are faced with the issue of assessing the information, which ma-nagement reaches, correctly. In a pile of information we need to select those which can be con-sidered as a warning, and those which are not actually threatening to endanger the process of running a business (Muratović, 2006, 58).
Nowadays, the symptoms which most usually signify a crisis are: illiquidity, overindebtedness, poor working climate among the employees, fluctuating prices of products, missed or inefficiently used opportunities at the market, lack of motivation, not having a control over working processes etc.
The symptoms are most frequently shown in a simple form (Softić, 2011, 98), and the following image allows us to observe a great number of symptoms, all at once.

REDETE – ECONOMIC DEVELOPMENT AND ENTEREPRENEURSHIP IN TRANSITION ECONOMIES
683
Figure 1 Crisis symptoms examples (Dubrovski, 2004, 32)
Today when we reached a pretty high level of technological development, a process of
identifying the symptoms of a crisis should not be difficult to perform for management. Simply by getting informed about main parameters of business and through conversations with employees, we should be able to discover the symptoms of a crisis within a company pretty easily. On the previous image it is clearly evident that the first symptoms come through reduction of market share i.e. through losing individual small customers, which is followed by increasing stocks (for the fact that goods are not traded like before) and discounted revenues. As a consequence to this, we face a liquidity distortion and getting a company into such a state where expenses equal revenues of a company. It leads to making losses and then, we are already in a stage where only a significant turnaround can bring stabilization for a company and provide surmounting a crisis. In order to compare these theoretical causes to the real condition which economy is in, we first conducted a research on the attitude of managers from the companies surveyed about which causes of crisis situations in our country had a dominant role.
Table 1. Business crisis cause
INTERNAL
7% EXTERNAL
31%COMBINATION62%
Figure 2. Business crisis cause
Percentage Cumulative percentage
Cause INTERNAL 6.8 6.8 EXTERNAL 31.1 37.8
COMBINATION 62.2 100.0 Total 100.0
From the previous graphic it is clearly obvious that the attitude of most managers polled is that the causes of crises are dominantly in external factors i.e. that the causes are mixtures of external
Decrease in market share
Reduction in sales volume
Reduction in sales revenue
Failure to cover costs
Loss
Loss increase
Reduction in capital
Overindebtedness
Payment delay
Raising of credit
Borrowing constraints
Illiquidity
Increase in stocks
Discounted revenues
Liquidity issues
Llate payment of wages
Personnel issues
Discontinuance of business
Interrupted business process

REDETE – ECONOMIC DEVELOPMENT AND ENTEREPRENEURSHIP IN TRANSITION ECONOMIES
684
and internal factors. Only 6.8 % of the managers polled confirmed the theoretical attitudes and they were self-critical enough to admit that the dominant role in the process of developing crisis situations belonged to various internal processes. In order to refute these managers’ claims (of those managers who operate companies during crises) we carried out a research about the factors which were of greatest importance in overcoming a crisis, in companies which managed to surmount a crisis. The following graphic shows the results obtained.
Figure 3. Factors being of greatest importance while overcoming a crisis in companies which managed to surmount a crisis
The previous graphic clearly shows that companies which overcame crises mostly made their best efforts in improving internal factors. Moreover, the first eight factors that companies were focused on are internal by nature but as we can see, the factor number one is about enhancing sales function. Even 16.3% of the companies consider this factor to be the most important in the process of overcoming a crisis. If we compare it to the theoretical claim stated by Dubrovski, we will conclude that these facts match. The sales factor i.e. a situation when securing a market for goods and services is weakened, usually signifies the first symptom which occurs. At this point, the question rightly arising is why managers (the greatest percentage of them) claim that the causes of crises in our companies are dominantly external by nature. The answer is rather clear: it is because by doing that, they were actually hiding their own incompetences. In this way, we confirmed the hypothesis in which we did claim that management had a dominant role in creating these crisis situations through their negligence, idleness or ignorance. In order to even better understand the reasons which led them to those situations, we also tried to find more about the level of education concerning the managers who operate the companies surveyed.
Figure 4. Educational background of management members

REDETE – ECONOMIC DEVELOPMENT AND ENTEREPRENEURSHIP IN TRANSITION ECONOMIES
685
From the previous graphic we can see that 78% of managers operating small and middle com-panies have secondary school degrees, which means that although they have certain entrepreneu-rial skills, they still do not have adequate professional knowledge from the management sphe-re. So it was once again proved that competences of managers have the crucial role in ensuring business continuity.
2. Constructive and destructive effects
Speaking of crisis effects, it is of greatest importance to focus on constructive and destructive effects which a crisis leaves behind. Since it is well known that crises are time-limited processes, it is very important for management of a company “to know how to handle” a crisis. During a crisis, which is, we may well say a period of emergency, there are certain processes occurring within a company, which directly influence the way a company operates. However, before we move to discussing about these constructive and destructive effects, we must point out the fact that companies often face a crisis precisely for the reason that they have no clear vision about where they want to get or what they yearn to achieve over the time. The following image (Dojčinović, 2007, 11) shows all the interest groups vulnerable to a crisis occurrence.
Figure 5. Interest groups and potential dangers caused by a business crisis
From the previous image, we can clearly see that the consequences of destructive effects of a
crisis are multiple and that they are very usually followed by a situation in which a company becomes illiquid and insolvent, than it decreases the number of employees, undermines its own reputation and image, and reduces the quality of its own products and services. Today, at the time of the modern economy, the prevailing opinion is that companies are the best possible instruments for achieving personal aims of individuals/groups employed by those companies. As long as they consider that they can achieve their aims and goals, they will be interested in how a company operates (in its objectives). Taking that into consideration, it can easily be concluded that des-tructive effects come from a situation in which these individuals (groups) are not able to achieve their personal objectives. In order to check whether or not managers of companies recognize this occurrence, we carried out a research through which we aimed to find out what the greatest attention is paid to when it comes to employees of a company.
Job loss Threatened existence
Loss of customers Cancellation of orders Threatened existence
Delivery conditions loss Loss of service
Dangers caused by
a crisis
Employees
Suppliers
Customers
Owners
Financial institutions
Government
Loss of invested capital Threatened existence
Capital loss Loss of clients
Increase in unemployment Tax revenues loss

REDETE – ECONOMIC DEVELOPMENT AND ENTEREPRENEURSHIP IN TRANSITION ECONOMIES
686
Table 2. Employee-related indicators
Percenta
ge
Cumulative
percentage
Indicator NUMBER OF EMPLOYEES
20.3 20.3
EDUCATIONAL BACKGROUND OF EMPLOYEES
24.3 44.6
EMPLOYEE SATISFACTION
54.1 98.6
EMPLOYEE TURNOVER
1.4 100.0
Total 100.0
Figure 6. Employee-related indicators
From the previous tables, it is clearly evident that managers of the companies polled (when it
comes to employees) pay the greatest attention to employee satisfaction. It tells us that there is a high level of awareness about satisfaction of employees, whose motivation directly influences the objectives of a company.
However, those which cannot be avoided when a crisis occurs are destructive effects which a crisis brings about and leaves behind. As we have previously provided an overview of these destructive effects, now we can state that the main activity holders in a company can be divided in two groups and those are: Employees of a company and Shareholders – owners of capital. Through the research we found that the most significant destructive effects concerning employees are: loss of jobs - employees are constantly exposed to this risk which has disturbing effects on them; impacts of stressful situations – a possibility of losing a job creates stress for employees and seriously undermines their health and motivation at the same time; abolition of rights to benefits earned and reducing weekly working time; elimination of professional training for employees – which is actually a rather frequent activity taken by managers during crisis situations and justified by their concerns for savings; loss of social connections – this means: ending the social connections obtained among the employees, which represents a direct consequence of destructive effects of a crisis.
When we explored which destructive effects the owners of capital were faced with, it turned out that there are the three most dominant of all and those are: loss of capital invested, giving up the return on equity, and decline in the value of acquired participation rights.
As we previously stated, these destructive impacts do not affect only employees and owners of capital, but they are also of wide-ranging nature. The level of its exogenous destructive impact depends on the size of a company coping with a crisis situation so it affects the entire economy, partners of a company, as well as a government together with its local bodies and institutions. Destructive impacts that a crisis has on overall economy are primarily reflected in financial losses related to insolvency. Partners involved in businesses with a company undergoing a crisis are also in danger of suffering serious financial losses, which is at the same time a clear threat that they might be faced with a crisis situation in the following period too. From the macroeconomic point

REDETE – ECONOMIC DEVELOPMENT AND ENTEREPRENEURSHIP IN TRANSITION ECONOMIES
687
of view, as well as from the government’s point of view, in reference to these destructive effects, we can say that meeting the objectives for the government and all of its institutions is put at risk in many ways, which is manifested through tax revenue reduction, increased expenditures, and undermining the process of meeting all the other objectives such as full employment and object-tives of competition.
On the other hand, there are also constructive effects of a crisis. The point is that “crises in companies are capable of releasing innovative strengths, which have so far been unknown and which can overcome the barriers for introducing necessary changes” (Senić, Lukić 2008, 156). As they successfully surmount a crisis, employees in a company usually become aware of their own values and through that, they establish their own new system of goals. Overcoming a crisis for an individual creates a feeling of satisfaction and it is considered a positive experience, thereby it represents an additional power and it improves self-confidence of employees in a company. Trough these constructive impacts a crisis can be observed as a chance for a new beginning since strategies for surmounting a crisis require leaving routines and introducing innovative measures, which altogether demands high readiness to be shown by management. This is why it is very common, in discussions on a company’s development issues, that some claim that exactly the phases of acute crisis offer a chance for implementing new structures (Krystek 1989). Just like destructive impacts do not affect only a company undergoing a crisis, constructive effects also have a wide range of influences. The fact which needs to be stated is that, unlike destructive, these constructive effects have reverse direction of influence, both in endogenous and exogenous sphere of impacts. This is reflected in increased readiness to take risks, i.e. in preference for investments including a heightened risk but also higher yields (Muller 1985).
3. Preparedness of a company to react to crisis situations
Crisis prevention, in a context about which we talk in this work, means not allowing a crisis to develop to such a level (acute state) where it will not be possible to normally perform activities in a company without putting a company at risk of entering into a state of liquidation. To simplify, preventing a potential crisis in a company actually means struggling against eventual or already existing processes, which threaten the survival of a company, using certain measures, and based on early findings. It, of course, does not necessarily include all the activities that management of a company should perform, but it is focused only on that part which is about avoiding latent crises in companies. Potential crises in a company, as (still) practically non-existent, but only possible processes which threaten its survival, are usually not the target of operating-activities which are focused on future. In order for a company or management to apply the system of preventive acting, they need to implement a comprehensive controlling system known as an early warning system. Its role is reflected in discovering weak signals, transmission of important information, making a creative background and preventing a business crisis. Preventive planning may well be understood as a special way of planning objectives and measures which is focused on a latent crisis in a company, and which complements or replaces a regular planning in a company. It can be strategic and/or operative and it can be explained through its essence, especially if we consider how different this kind of planning is compared to alternative (contingent) planning.
The basic difference between operative and strategic system for early warning is in the way they work. On the one hand, there is an operative managing concept focused on short-term indica-tors of success like solvency or economy, which actually serve as the main governing skills of operative management. On the other hand, we have a strategic concept of managing, with a special orientation on potentials for success as informative support to strategic management.
After theoretical explanations concerning early warning systems, we conducted a research through which we aimed to check to what extent our companies are truly prepared for a crisis, i.e. in what way they prepared themselves for crisis situations. We first wanted to determine what the

REDETE – ECONOMIC DEVELOPMENT AND ENTEREPRENEURSHIP IN TRANSITION ECONOMIES
688
prevailing opinion of the managers from the companies polled is, when it comes to their level of preparedness for crisis situations. The following graphic shows the results obtained.
Figure 7. Preparedness of companies for a crisis
From the previous graphic we can clearly see that 85.1% of companies consider that the level
of their preparedness for a crisis is either good or excellent, while only 14.9% of companies con-sider that they are not prepared well enough for crisis situations. Of course, these are only state-ments of companies’ managers and we cannot consider them to be the actual state, but we must check the results gathered like this and prove the opposite. For that reason, we explored whether or not the companies surveyed own certain systems warning about disproportions in business, i.e. whether or not they even pay attention to the early potential threats which might cause crises. The results are shown in the following graphic.
Figure 8. Preventive warning system
The previous graphic clearly shows the percentage of companies owning early warning sys-tems. So it can easily be concluded that the statements given by the managers polled actually just serve as a screen for the current status which companies have, because we cannot talk about a high level of preparedness for crisis situations if companies do not have systems for preventive warning about crisis occurrence. Of course, from this graphic we can also see that the smaller percentage of companies which own systems for preventive warning corresponds to the percentage of those companies which use instruments of strategic crisis management.

REDETE – ECONOMIC DEVELOPMENT AND ENTEREPRENEURSHIP IN TRANSITION ECONOMIES
689
Figure 9. Concerns about the possibility of entering a crisis
YES81%
NO19%
Figure 10. Reactions to crisis situations
WE HAVE A PRE-
PREPARED STRATEGY
27%
WE RESPOND TO A NEW
SITUATION AS IT HAPPENS,
EXTEMPORARY
72%
WE LET A CRISIS
DEVELOP AND THAN REPAIR THE DAMAGE
1%
From the two previous graphics it is clear that the managers’ statements about being well
prepared for a crisis, unfortunately “fall by the wayside” since even 81% of companies (which is the exact percentage of those companies which do not own early warning systems) are concerned about the possibility that they might face crisis situations in the forthcoming period. This is also supported by the fact that 72% of the companies polled solve crisis situations as they happen, meaning that they do not have pre-prepared scenarios nor strategies, which altogether signi-ficantly makes the process of performing all the operations in a company more difficult, once it confronts a crisis. Through this, we again confirmed that managers of companies have a pretty dominant role in creating future for a company, so we may also well state that they are the most responsible persons for all the (good and bad) states that a company might go through.

REDETE – ECONOMIC DEVELOPMENT AND ENTEREPRENEURSHIP IN TRANSITION ECONOMIES
690
4. Conclusion
The aim of this work was to explore the symptoms occurring as a first sign to warn about a potential crisis. To those symptoms, an active management of a company should respond in due time so that a crisis would not develop. In order to compare the theoretical attitudes to the infor-mation we gathered through the research, we took into consideration theoretically explained objectives and tried to compare them to the crucial factors that managers of the companies polled were focused on during the process of struggling with a crisis. As it was concluded that the sales function had, i.e. represented the most significant internal factor which companies worked on, it was rather easy to relate it to the theoretical symptoms, knowing that the first of them is mani-fested through losses in market share. A market share loss also brings about cut in revenue as well as stock increase, and one of immediate side effects for a company is facing lower liquidity. All of these inevitably lead to “domino-effect” which can rapidly become a cause of coping with serious issues for a company, or which can even increase a risk of liquidation (total collapse).
In this work, through explaining as well as exploring the symptoms and causes of crises, we also dealt with the way management of companies operates. Therefore, here we tried to emphasize the importance of a role that management of a company has, and we aimed to determine a range of responsibility which is attributed to it. Through empirical researches we proved that managers of the companies observed, beside having certain entrepreneurial skills, do not posses enough knowledge when it comes to knowing the essence of management, so their incompetences directly cause (through their negligence) a crisis in a company. This is exactly where a great danger lies, threatening to harm the continuation of all the operations in a company, as well as its survival. By not responding on time and by not taking certain measures, a crisis will develop and very quickly, from just a potential danger, it will turn to a latent form of a crisis. In that situation (latent crisis level) greater efforts are needed in order for a company to surmount such an undesirable situation, which usually includes departure from previously set objectives. This is supported by the fact that companies (80% of them) do not own systems for early warning about crisis occurrence, or syste-ms indicating the presence of disproportions in business, which would be the first to draw the ate-ntion of management to eventual deviations in business. This entire situation can surely be behind a very unrewarding and long-term position of a company, because under these circumstances, it might, for a long time in future, be relegated to a marginal status between potential, latent and acute crisis.
At the end, we can conclude that even after the crucial symptoms leading to crises are determi-ned, somebody should notice them and choose adequate mechanisms to prepare a good response to them. Otherwise, if they are observed and there is no response to them, it may well be said that it is the same as if the symptoms were not noticed at all.

REDETE – ECONOMIC DEVELOPMENT AND ENTEREPRENEURSHIP IN TRANSITION ECONOMIES
691
Reference list
1. Briker, K., Peoples, W.: HANHBUCH KRISENBEWUSSTES MANAGAMENT, Krisenvor-beugung und Unternehmenssanierung, Cornelsen, Berlin, 2000.
2. Dojčinović, D. Sustavi ranog upozorenja poslovne krize, znanstveni magistarski rad, Zagreb, 2008.
3. Dubrovski, D., Krizni management in prestrukturiranje podjetja, Fakultet za management, Ko-per, 2004.
4. Krystek, U.: ENTWICKLUNG UND KULTUR DER UNTERNEHMUNG WERDEN DURCH KRISEN VERÄNDERT, Zeitschrift für Organisation, 3/1989 .
5. Müller, R.: CORPORATE CRISIS MANAGEMENT, Long Range Planning, October 1985.
6. Muratović, H.: ORGANIZACIJSKI PREOKRET, Ekonomski fakultet, Sarajevo, 2006. 7. Osmanagić, Bedenik, N.: KRIZA KAO ŠANSA, Školska knjiga, Zagreb, 2007. 8. Senić, R., Lukić, M.S.: KRIZNI MENADŽMENT, Prvi dio, Aperion, Banja Luka, 2008. 9. Softić, S.: SIMPTOMI I UZROCI KRIZE PREDUZEĆA U BOSNI I HERCEGOVINI,
Ekonomski fakultet, Sarajevo, 2011.

REDETE – ECONOMIC DEVELOPMENT AND ENTEREPRENEURSHIP IN TRANSITION ECONOMIES
692
RISK MANAGEMENT STANDARDS AND SMEs
Valerija BUBLIĆ310
Abstract
Problem: While majority of projects addressing risk management are focused on large en-terprises, financial and insurance sector, in nowadays volatile world not enough attention is gi-ven to small and medium sized enterprises that need a framework in place to sustain and to help managing risk.
Purpose: The purpose of this paper is to give a brief insight into the history of risk manage-ment and a few online available current standards, regulations and directives which are focu-sed either on quality management or risk management, and to highlight the correlation with their general or specific areas of applicability regarding the economic activity and the size of an enterprise, and the certification.
Design/Methodology/Approach: A desk study applying content analysis was undertaken on the literature addressing risk management and on a few online available current standards, re-gulations and directives addressing various risk management issues which have been published or revised since 2000 in EU, Australia and the USA with the approach to determining the app-licability of each standard. The questions “Is it a general or specific standard? In which econo-mic activity and size of the enterprise is the standard applicable? Is the certification required?” are explored.
Findings: Risk management as a particular challenge to sustainability and continuity of businesses in global and volatile world has gained an overall concern. The research has exami-ned standards, regulations and directives dealing either with quality management or various risk management issues. Some standards have been designed for the implementation in large enterprises or specific economic activities only, and some for the implementation in any size and any economic activity of the enterprise. Certification is not required for all standards, only for few of them. However, further research is needed to establish the implementation guidelines of those standards for SMEs of which the certification is not required.
Research limitations/implications: The initial process of collecting documents was inadeq-uately designed, but it was improved through the project development. Some standards were dropped out and some were added, as well as regulations and directives. The analysis was na-rrowed down to documents published or revised in 2000 or later.
Originality/value: This research paper offers an insight into the applicability of quality ma-nagement and risk management standards, regulations and directives and is of corporate go-vernance (policy) value.
Keywords: risk, risk management standards, applicability, SMEs,
310 VERN University of Applied Sciences, Trg b. J. Jelačića 3, Zagreb, Croatia, [email protected]

REDETE – ECONOMIC DEVELOPMENT AND ENTEREPRENEURSHIP IN TRANSITION ECONOMIES
693
1. Introduction
Risk is defined as any uncertainty that, if it occurs could affect one or more business objectives [1, p. 11]. Risk can be also defined as the combination of the probability of an event and its consequences [2, p. 1 – 15]. In all types of undertaking, there is the potential for events and consequences that constitute opportunities for benefit or threats to success.
In today’s competitive business environment, risk management – which is defined as “mana-ging the threats and opportunities to our businesses within acceptable risk tolerances” – plays a vital role in the success of all businesses [3]. Risk management increases the probability of su-ccess, and reduces both the probability of failure and the uncertainty of achieving the organization’s overall objectives. The risk management process is set out of several stages: communication and consultation; establishing the context; risk identification; risk analysis; risk evaluation; risk treatment; monitoring and review [4, p. 1 – 6] It should be a continuous and developing process which runs throughout the organization’s strategy and the implementation of that strategy [3]. Risk management process contributes to a better understanding of the way risks can build on each other to create more serious problems than might be expected individually. One European CRO calls these “sequential risks, where if Risk A happens, it is seen as inevitable that some element of Risk B will happen, although it’s not certain” [5, p. 1 – 32]. Key business benefits of the risk management process are: increased risk mitigation, better ability to identify and manage risks, better strategic decision making, improved governance, and increased management accountability [5, p. 1 – 32]. If the risk assessment is a failure, then the best case is that the risk management effort is simple a waste of time and money because decisions are ultimately unimproved [6, p. 6]. While majority of projects addressing risk management are focused on large companies, financial and insurance sector, in nowadays volatile world not enough attention is given to small and medium sized enterprises that need a framework in place to sustain and to help managing risk. It is important for the SME sector to change the way they look at risk management and transform their businesses to have better risk management capabilities [7].
There have been plenty of standards and regulations addressing risks and risk management issues. The purpose of this paper is to give a brief insight into the history of risk management and a few online available current standards which are focused either on quality management or risk management, and to highlight the correlation with their general or specific applicability regarding the economic activity and the size of an enterprise, as well as with the certification.
2. Methodology
The research was based on the desk study, applying content analysis as the research tool. Desk study means gathering and analyzing information, already available in print or published on the internet [8]. Content analysis is a research tool used to determine the presence of certain words or concepts within texts or sets of texts. Researchers quantify and analyze the presence, meanings and relationships of such words and concepts, then make inferences about the messages within the texts [9, p. 113].
Besides analyzing the online literature concerning the business risks, risk management, the history of risk management, the analysis of the online available current standards, regulations and directives addressing various risk management issues which have been published or revised since 2000 in EU, Australia and the USA was undertaken: ISO 9001:2008 – Quality Management, ISO 14001:2004 – Environmental Management, ISO 22000:2005 – Food Safety Management System, ISO 27000:2005 – Information Security Management, ISO 31000:2009 – Risk Management, FERMA Risk Management Standard, IRM Risk Management Standard, AS/NZS 4360:2004 Risk Management Standard, COSO Enterprise Risk Management – Integrated Framework, Basel

REDETE – ECONOMIC DEVELOPMENT AND ENTEREPRENEURSHIP IN TRANSITION ECONOMIES
694
Regulations, and Solvency Directives. The analyze was extended on HACCP – safety program in the food industry, because the Croatian Ministry of Agriculture and Forestry published the compulsory rule and regulation, based on HACCP, related to the control of food of animal origin in 2007 [10]. The approach of the analysis was to determine the applicability of each standard, regulative or directive depending on general or specific issues: economic activity, size of an enterprise, and certification. The research questions “Is it a general or specific standard? In which economic activity and size of an enterprise is the standard applicable? Is the certification required?” are explored.
3. History of Risk Management
Risk and risk management has been a challenge for owners, managers and entrepreneurs for centuries. The earliest risk management record is from Babylon in the Code of Hammurabi, dating from 18th century BC [11]. This concerns “bottomry”, a form of naval insurance whereby the ow-ner of the vessel can borrow money to buy cargo and does not have to pay the debt if the ship is lost at sea. The term “bottomry” refers to pledging the bottom of the owner to the lender [8, p. 1].
Until recently insurance was still the main way the companies managed risk. In the 1960s and 1970s insurance companies sought to reduce their potential losses by encouraging businesses to make their premises safer. This was the first age of risk management. Businesses considered mainly non-entrepreneurial risk in a reactive way to see how much insurance they should pay [12, p.1].
In the 1970s and 1980s companies started to introduce quality assurance, to ensure that pro-ducts conformed to their specifications. This was the second age of risk management. Companies treated risk in a more proactive way. Risk awareness was also fostered by government legislation that wanted companies to think about the risks they posed to workers and customers. New concerns also started to emerge about environmental risks [12, p. 1].
Historically in financial institutions, risk functions such as legal, compliance, audit, credit risk and market risk were managed in separate organizational silos. Operational risk was generally the responsibility of business units as part of their daily activities. Risk management was focused primarily on financial, predictable and quantifiable risks related to loss prevention. Since the 1980s, risk management has evolved to include corporate governance, alignment to strategic objectives, capital adequacy and stakeholder value. Additionally, regular discussions on risk management started appearing on corporate board agendas [3].
The third age of risk management started in 1995 with the publishing of the risk management standards AS/NZS 4360:1995, published in Australia. In the last decade of 20th century the reporting of financial accounts became important. Turnbull Report was published in 1999, focusing on internal financial controls and better risk monitoring, and also EU started with accounting standardization to ensure better comparison and evaluation possibilities for investors. Corporate scandals in the early 2000s, such as Enron, led legislators around the world to define new standards for reporting company accounts, in an effort to ensure honest and transparent reports [12, p. 2 – 3]. The focus on enterprise-wide risk management has entered a more intense phase across a broad range of global companies since the 2008 financial crisis and recession. Risk management has become somewhat or significantly more important over the past three years [5, p. 1 – 32].

REDETE – ECONOMIC DEVELOPMENT AND ENTEREPRENEURSHIP IN TRANSITION ECONOMIES
695
4. Standards
4.1. About International Organization for Standardization (ISO)
The International Organization for Standardization – ISO, founded in 1947, is a worldwide federation of national standards bodies [13]. Some of ISO's standards are management system standards. A management system describes the set of procedures an organization needs to follow in order to meet its objectives. In a small organization there may not be an official system, just “our way of doing things”, which is in the head of the staff. The larger the organization is, the mo-re likely it is that there are written instructions about how things are done. When an organization systemizes how it does things, this is known as a management system. These standards can be applied to any organization, large or small, whatever its product or service and regardless of its se-ctor of activity. Certification to management system standards is not a requirement. However, many organizations do decide to get certified to one or more of ISO’s management system standards [13].
4.1.1. ISO 9001:2008 – Quality Management
The ISO 9000 family addresses various aspects of quality management standards, including ISO 9001:2008 which sets out the requirements of a quality management system, ISO 9000:2005 which covers the basic concepts and language, ISO 9004:2009 – focuses on how to make a quality management system more efficient and effective, and ISO 19011 which sets out guidance on internal and external audits of quality management systems. The standards provide guidance and tools for companies and organizations who want to ensure that their products and services consistently meet customer's requirements, and that quality is consistently improved [14]. ISO 9001:2000 is a generic standard for quality management systems applicable to all organizations including laboratories. ISO 9001:2008 is the only standard in the family that can be certified to, although this is not a requirement. It can be used by any organization, large or small, regardless of its field of activity. The design and implementation of an organization's quality management system is influenced by its organizational environment, changes in that environment, the risks associated with that environment, organization's varying needs; its particular objectives, the products it provides, the processes it employs, and its size and organizational structure [15].
4.1.2. ISO 14001:2004 – Environmental Management
The ISO 14000 family addresses various aspects of environmental management. It provides practical tools for companies and organizations looking to identify and control their environ-mental impact and constantly improve their environmental performance. ISO 14001:2004 and ISO 14004:2004 focus on environmental management systems. The other standards in the family focus on the specific environmental aspects such as life cycle analysis, communication and auditing. This International Standard specifies requirements for an environmental management system to enable an organization to develop and implement a policy and objectives which take into account legal requirements and information about significant environmental aspects. It is intended to apply to all types and sizes of organizations and to accommodate diverse geographical, cultural and social conditions. Small and medium sized enterprises also benefit from ISO 14001:2004 [16].

REDETE – ECONOMIC DEVELOPMENT AND ENTEREPRENEURSHIP IN TRANSITION ECONOMIES
696
4.1.3. ISO 22000:2005 –Food Safety Management System
ISO 22000:2005 specifies requirements for a food safety management system where an organi-zation in the food chain needs to demonstrate its ability to control food safety hazards in order to ensure that food is safe at the time of human consumption. The Standard incorporates the principles of the Codex Alimentarius Commission's "Hazard Analysis and Critical Control Point" (HACCP) system for food hygiene. It is applicable to all organizations, regardless of the size which are involved in any aspect of the food chain. The standard among other specifies requirements to demonstrate compliance with applicable statutory and regulatory food safety requirements and to seek certification or registration of its food safety management system by an external organization, or make a self-assessment or self-declaration of conformity to ISO 22000:2005 The means of meeting any requirements of ISO 22000:2005 can be accomplished through the use of internal and/or external resources [17].
4.1.4. ISO 27001:2005 – Information Security Management
Information security is nowadays an issue of a significant importance to any organization. An information security management system is a systematic approach to managing sensitive informa-tion of an organization so that it remains secure. It encompasses people, processes and IT systems. The ISO/IEC 27000 family is a series of information security standards developed and published by the International Standards Organization (ISO) and the International Electro technical Commi-ssion (IEC), reserved by ISO for information security matters. This aligns with a number of other topics, including ISO 9000 – Quality management and ISO 14000 – Environmental management. ISO 27001 sets out specific requirements, all of which must be followed, and against which an or-ganization's Information Security Management System (ISMS) can be audited and certified. The design and implementation of an organization's ISMS is influenced by their needs and objectives, security requirements, the process employed and the size and structure of the organization. The standard provides guidelines for information security risk management (ISRM) in an organization, specifically supporting the requirements of an information security management system defined by ISO. The standards are applicable to any organization, in any sector, of any size [18].
4.1.5. ISO 31000:2009 – Risk Management
ISO 31000:2009, Risk management – Principles and guidelines, provides principles, frame-work and a process for managing risk. It can be used by any organization regardless of its size, activity or sector. The standard can help organizations increase the likelihood of achieving objectives, improve the identification of opportunities and threats and effectively allocate and use resources for risk treatment. ISO 31000 can be applied to any public, private or community enterprise, association, group or individual. It is not specific to any industry or sector. ISO 31000 cannot be used for certification purposes, but does provide guidance for internal or external audit programs. Some other standards also relate to risk management, such as: ISO Guide 73:2009, Risk management vocabulary complements ISO 31000 by providing a collection of terms and definitions relating to the management of risk; and ISO/IEC 31010:2009, Risk management – Risk Assessment Technique focuses on risk assessment. ISO/IEC is used to analyze risk in terms of consequences and their probabilities, before the organization decides on further treatment, if required [19].

REDETE – ECONOMIC DEVELOPMENT AND ENTEREPRENEURSHIP IN TRANSITION ECONOMIES
697
4.2. IRM Risk Management Standard
The Institute of Risk Management (IRM) was founded in UK in April 1986 and opera-tes internationally [20]. The Risk Management Standard was originally published by the Insti-tute of Risk Management (IRM), The Association of Insurance and Risk Managers (AIRMIC) and Alarm (The Public Risk Management Association) in 2002. It has subsequently been adopted by the Federation of European Risk Management Associates (FERMA). Following the publication of the ISO 31000 Risk Management Principles and Guidelines in 2009 a new document “A Structured Approach to Enterprise Risk Management (ERM) and the Require-ments of ISO 31000” has been produced by IRM, AIRMIC and Alarm. This provides up to date guidance on the implementation of the enterprise risk management in the context of the new ISO 31000 [21]. Risk management is not just something for corporations or public orga-nizations, but for any activity whether short or long term. The standard is not prescriptive what could lead to a box ticking approach or to establish a certifiable process. By meeting the various component parts of this standard, albeit in different ways, organizations will be in a position to report that they are in compliance. The standard has wherever possible used the terminology for risk set out by the International Organization for Standardization in its recent document ISO/IEC Guide 73 Risk Management - Vocabulary - Guidelines for use in standards [22].
4.3. FERMA Risk Management Standard
FERMA was established in 1974 under its previous name of “European Association of Insure-ds of Industries” (AEAI) as an International Association with aim of exchanging ideas and expe-riences with headquarters in Brussels, Belgium. Their members are risk and insurance profe-ssionals responsible for risk management in their organizations, whether in the public or private sector [23]. In 2003 FERMA has adopted the Risk Management Standard which was published by IRM in the UK in 2002. The Risk Management Standard sets out a strategic process, starting with an organization's overall objectives and aspirations, through to the identification, evaluation and mitigation of risk, including the transfer of some of that risk by insurance or contract to insurers and third parties. It intends to serve risk managers and to encourage international consensus on what is best practice [24].
4.4. AS/NZS 4360:2004 – Australian /New Zealand Risk Management Standard
The Standard was prepared in 2004 by the Joint Standards Australia/Standards New Zealand Committee OB-007, Risk Management as a revision of AS/NZS 4360:1999 – Risk management. It provides a generic framework for establishing the context, identification, analysis, evaluation, treatment, monitoring and communicating risk. HB 436 Risk Management Guidelines, a companion to AS/NZS 4360:2004, contains specific guidance on the implementation of the Standard. The two documents are intended to be used together. The Standard may be applied to a very wide range of activities, decisions or operations of any public, private or community enterprise, group or individual. It is not the purpose of the Standard to enforce uniformity of risk management systems. It is generic and independent of any specific industry or economic sector. The Standard should be applied at all stages in the life of an activity, function, project, product or asset. The risk management process applies to the management of both potential gains and potential losses [25].

REDETE – ECONOMIC DEVELOPMENT AND ENTEREPRENEURSHIP IN TRANSITION ECONOMIES
698
4.5. COSO Enterprise Risk Management – Integrated Framework
Committee of Sponsoring Organizations of the Treadway Commission COSO was organized in 1985 to sponsor the National Commission on Fraudulent Financial Reporting, an independent private-sector initiative that studied the causal factors that can lead to fraudulent financial reporting. In 2004 COSO issued Enterprise Risk Management – Integrated Framework to help businesses and other entities assess and enhance their internal control system [26]. Recent years have seen heightened concern and focus on risk management, and it became increasingly clear that a need exists for a robust framework to effectively identify, assess, and manage risk. The period of the framework's development was marked by a series of high-profile business scandals and failures where investors, company personnel, and other stakeholders suffered tremendous loss. In the aftermath were calls for enhanced corporate governance and risk management, with new law, regulation, and listing standards. The need for an enterprise risk management framework, providing key principles and concepts, a common language, and clear direction and guidance, became even more compelling [27]. Enterprise risk management is a process that companies of all sizes and degrees of sophistication should consider. The framework is scalable, enabling companies to be able to match the process to the company’s complexity and sophistication. The framework can be used in all functional areas, including information technology, finance, accounting, and internal audit and risk specialists within any organization [28]. The framework has been designed in the main for large multinational and public enterprises and less for small or medium enterprises (SME). The same enterprise risk management framework which is adequate for large companies might be too complex for SMEs.
4.6. Basel Regulations
The Basel Committee on Banking Supervision is a committee of banking supervisory autho-rities that was established by the central bank governors of the Group of Ten countries in 1975. It consists of senior representatives of bank supervisory authorities and central banks from Belgium, Canada, France, Germany, Italy, Japan, Luxembourg, the Netherlands, Spain, Sweden, Switzerland, the United Kingdom, and the United States [29]. The Committee has published several sets of banking regulations which regulates finance and banking internationally. The recent one is Basel III. Basel III builds upon and enhances the regulatory framework adopted by Basel II and Basel 2.5, which now form integral parts of the Basel III framework. Basel II, which improved the measurement of credit risk and included capture of operational risk, was released in 2004 and was due to be implemented from year-end 2006. Basel 2.5, agreed in July 2009, enhanced the measurements of risks related to securitization and trading book exposures. Basel 2.5 was due to be implemented no later than December 31st 2011. In December 2010, the Committee released Basel III, which set higher levels for capital requirements and introduced a new global liquidity framework. Committee members agreed to implement Basel III from January 1st 2013, subject to transitional and phase-in arrangements. In November 2011, G20 leaders in Cannes called on jurisdictions to meet their commitment to implement fully and consistently Basel II and Basel 2.5 by end 2011, and Basel III, starting in 2013 and completing by January 1st 2019 [30].
4.7. Solvency Directives
Solvency I Directives (2002/12/EC – concerning life insurers and 2002/13/EC – concerning non-life insurers) and the Solvency II Directive 2009/138/EC are the EU Directives that codifies and harmonizes the EU insurance regulation, both in life insurance and non-life insurance. The

REDETE – ECONOMIC DEVELOPMENT AND ENTEREPRENEURSHIP IN TRANSITION ECONOMIES
699
Solvency II Directive is the revision of Solvency I Directives, published in 2009. Primarily this concerns the amount of capital that EU insurance companies must hold to reduce the risk of insolvency. The purpose of Solvency II is to reduce the risk that an insurer would be unable to meet claims, to reduce the losses suffered by policyholders in the event that a firm is unable to meet all claims fully, too provide early warning to supervisors so that they can intervene promptly if capital falls below the required level, and to promote confidence in the financial stability of the insurance sector. It is often called "Basel for insurers," as is somewhat similar to the banking regulations of Basel II. The rules of Solvency I will remain in force until January 1st 2014. Solvency II Directive – a recast of several directives – is likely to be applicable from January 1st 2014 [31].
4.8. Hazard Analysis and Critical Control Point (HACCP) System
The International HACCP Alliance was established on March 25, 1994, to provide a uniform program to assure safer meat and poultry products. It is housed within the Department of Animal Science at Texas A&M University [32]. The document Hazard Analysis and Critical Control Point (HACCP) System and Guidelines (CAC/RCP 1-1969, Rev. 3 (1997), Amended 1999) consists of two sections. First section sets out the principles of the Hazard Analysis and Critical Control Point (HACCP) system adopted by the Codex Alimentarius Commission. The second section provides general guidance for the application of the system while recognizing that the details of application may vary depending on the circumstances of the food operation [21]. The HACCP system, which is science based and systematic, identifies specific hazards and measures for their control to ensure the safety of food. HACCP is a tool to assess hazards and establish control systems that focus on prevention rather than relying mainly on end-product testing. Based on risk-assessment, HACCP plans allow both industry and government to allocate their resources efficiently in establishing and auditing safe food production practices. HACCP can be applied throughout the food chain from primary production to final consumption and its implementation should be guided by scientific evidence of risks to human health. In addition, the application of HACCP systems can aid inspection by regulatory authorities and promote international trade by increasing confidence in food safety. The application of HACCP is compatible with the imple-mentation of quality management systems, such as the ISO 9000 series, and is the system of cho-ice in the management of food safety within such systems [33]. The mandatory implementation of HACCP depends on the national legislation. It is mandatory in EU according to Council Directive 93/43/EEC [34]. In Croatia it is mandatory according to the national legislation [10].
5. Findings
The content analysis of the current online available standards, regulations and directives adder-ssing various risk management issues which have been published or revised since 2000 in EU, Australia and the USA was undertaken. Following standards were analyzed: ISO 9001:2008 – Quality Management, ISO 14001:2004 – Environmental Management, ISO 22000:2005 – Food Safety Management System, ISO 27000:2005 – Information Security Management, ISO 31000:2009 – Risk Management, IRM Risk Management Standard, FERMA Risk Management Standard, AS/NZS 4360:2004 Risk Management Standard, COSO Enterprise Risk Management – Integrated Framework, Basel Regulations, and Solvency Directives. The analysis was extended on the HACCP – safety program in the food industry. As a result, there are the following findings:
Related to the question “Is it a general or specific standard?” There is only one standard which is applicable as a general regulation of an overall organiza-
tional management system, taking into consideration factors from macro- and microenvironment,

REDETE – ECONOMIC DEVELOPMENT AND ENTEREPRENEURSHIP IN TRANSITION ECONOMIES
700
internal factors, changes and changes related risks. It is ISO 9001:2008 – Quality Management. The rest of the standards, regulations or directives are related to specific issues. ISO 14001:2004 is related to the environmental management issues, ISO 22000:2005 and HACCP are related to the food safety management issues, and ISO 27001:2005 is related to the information security ma-nagement issues. There are five regulations related to risk management issues: ISO 31000:2009 Risk Management, IRM Risk Management Standard, FERMA Risk Management Standard, AS/NZS 4360:2004 Risk Management Standard and COSO Enterprise Risk Management – Inte-grated Framework. Basel Regulations are related to finance and banking issues. Solvency Directi-ves are related to insurance issues.
Related to the question “In which economic activity and size of the enterprise is the standard applicable?
Following standards are applicable in any economic activity: ISO 9001:2008 – Quality Mana-gement, ISO 14001:2004 – Environmental Management, ISO 27001:2005 – Information Security Management, ISO 31000:2009 – Risk Management, IRM Risk Management Standard, FERMA Risk Management Standard, AS/NZS 4360:2004 Risk Management Standard, and COSO Enterprise Risk Management – Integrated Framework. ISO 22000:2005 – Food Safety Manage-ment System and HACCP – safety program in the food industry are applicable within the food chain members. Basel Regulations are applicable in the finance and banking industry and Solven-cy Directives in the insurance industry. The implementation of each analyzed standard is appli-cable in every enterprise, no matter on its size, but Basel Regulations and Solvency Directives are applicable in large enterprises. COSO Enterprise Risk Management – Integrated Framework is designed for large enterprises.
Related to the question “Is the certification required?” The certification of the enterprise is required in case the enterprise would publish the
declaration of the conformity to the regulations or in case the client would request the proof of the conformity, i. e. the certificate. In such cases, the certification is required for ISO 9001:2008 – Quality Management, ISO 14001:2004 – Environmental Management, ISO 27001:2005 – Information Security Management, ISO 22000:2005 – Food Safety Management System, and HACCP – safety program in the food industry. In addition to the mentioned standards, enterprises can make a self-assessment or self-declaration of the conformity to ISO 31000:2009 Risk Management, IRM Risk Management Standard, FERMA Risk Management Standard, AS/NZS 4360:2004 Risk Management Standard and COSO Enterprise Risk Management – Integrated Framework. The application of Basel Regulations, Solvency Directives is mandatory.
The application of standards, regulations and directives is shown in Table 1.
Table 1 The application of standards, regulations and directives Published
or Last Self-
Revision General Specific Any Specific Small Medium Large Assessment
1 ISO 9001:2008 2008 x x x x x x x
2 ISO 14001:2004 2004 Environmental Management x x x x x x
3 ISO 22000:2005 2005 Food Safety Management Food Chain x x x x x
4 ISO 27001:2005 2005 Information Security Management x x x x x x
5 ISO 31000:2009 2009 Risk Management x x x x x
6 IRM:2002 2002 Risk Management x x x x x
7 FERMA:2003 2003 Risk Management x x x x x
8 AS/NZS 4360:2004 2004 Risk Mangement x x x x x
9 COSO - ERM 2004 Risk Management x x x
10 Basel Regulations 2010 Finance and Banking Banking x x*
11 Solvency Directives 2009 Life and non-life Insurance Insurance x x*
12 HACCP 1999 Food Safety Management Food Chain x x x x x x*
ImplementationNo. Code
Area of
Industry Size
Enterprise Implementation Model
Certification Mandadory
* Depending on the legislative
REDETE – ECONOMIC DEVELOPMENT AND ENTEREPRENEURSHIP IN TRANSITION ECONOMIES
701
6. Conclusions
Risk management increases the probability of success, and reduces both the probability of failure and the uncertainty of achieving the organization’s overall objectives. While majority of projects addressing risk management are focused on large enterprises, financial and insurance sector, in nowadays volatile world not enough attention is given to small and medium sized enter-prises that need a framework in place to sustain and to help managing risk
The research was based on the desk study, applying content analysis as the research tool. Besides analyzing the online literature concerning the business risks, risk management, the history of risk management, the analysis of several online available current standards, regulations and directives addressing various risk management issues which have been published or revised since 2000 in EU, Australia and the USA was undertaken. The questions “Is it a general or specific standard? In which economic activity and size of the enterprise is the standard applicable? Is the certification required?” were explored.
One standard is applicable as a general regulation of an overall organizational management system, taking into consideration factors from macro- and microenvironment, internal factors, changes and changes related risks. It is ISO 9001:2008 – Quality Management. The rest of the standards, regulations or directives are related to specific issues.
ISO 22000:2005 and HACCP safety program in the food industry are applicable although the food chain, Basel Regulations are designed for the application in finance and banking industry, Solvency Directives are designed for the application in the insurance industry, and the rest of the analyzed standards are designed for the application in any economic sector. Basel Regulations, Solvency Directives and COSO Enterprise Risk Management – Integrated Framework are design-ned for large enterprises. The same enterprise risk management framework which is adequate for large enterprises might be too complex for SMEs. The rest of the analyzed standards are applica-ble in any size of an organization.
The certification of the enterprise is required in case the enterprise would publish the declara-tion of the conformity to the regulations or in case the client would request the proof of the conformity. Application of Basel Regulations, Solvency Directives and HACCP safety program in the food industry is mandatory according to the local legislation. Enterprises can also make a self-assessment or self-declaration of the conformity to all analyzed standards, regulations and directives.
However, further research is needed to establish the implementation guidelines of those stan-dards for SMEs of which the certification is not required.

REDETE – ECONOMIC DEVELOPMENT AND ENTEREPRENEURSHIP IN TRANSITION ECONOMIES
702
Reference list
1. Hillson, D. (2005), Effective Opportunity Management for Projects: Exploiting Positive Risk, Taylor & Francis e-Library
2. ISO Guide 73:2009 (E/F), Risk management –Vocabulary, available at http://www.pqm-online.com/assets/files/standards/iso_iec_guide_73-2009.pdf, accessed May 10th 2011
3. FERMA, Federation of European Risk Managers, available at http://www.ferma.eu/risk-management/, accessed: June 20th 2012
4. Tutorial Notes: The Australian and New Zealand Standards on Risk Management, AS/NZS 4360/2004 (2007), Broadleaf Capital International, Pty Ltd.; available at http://www.ucop.-edu/riskmgt/erm/documents/asnzs4360_2004_tut_notes.pdf, accessed July 20th 2012]
5. Risk Management in a time of Global Uncertainty (2011), A report by Harvard business review analytic services, Harvard Business Review, available at http://hbr.org/hbrg-main/-resources/pdfs/marketing/risk-management-in-a-time-of-global-uncertainty.pdf, accessed July 20th 2012
6. Hubbard, W. D. (2009), The Failure of Risk Management: Why It's Broken and How to Fix It, John Wiley & Sons, Inc., Hoboken, New Jersey
7. http://www.smeadvisor.com/2012/08/lessons-in-risk-management/, accessed August 30th 2012 8. http://www.businessdictionary.com/definition/desk-research.html, accessed June 26th 2012 9. Žugaj, M., Dumičić, K. & Dušak, V. (2006) Temelji znanstvenoistraživačkog rada, Sveučilište
u Zagrebu, Fakultet organizacije i informatike Varaždin, Varaždin 10. Pravilnik o službenim kontrolama hrane životinjskog podrijetla (2007), Narodne novine, No.
99/2007 11. The Code of Hammurabi, available at http://avalon.law.yale.edu/ancient/hamframe.asp,
accessed May 15th 2011 12. Seagrove, K. (2005), The Complete Guide to Business Risk Management, Second Edition,
Grower 13. http://www.iso.org/iso/home/about.htm, accessed: June 20th 2012 14. http://www.iso.org/iso/home/standards/management-standards.htm, accessed June 20th 2012 15. ISO 9001:2008 – Quality Management, available at
http://www.iso.org/iso/home/standards/management-standards/iso_9000.htm, accessed June 20th 2012
16. ISO 14000 – Environmental Management, available at http://www.iso.org/iso/home/standards/management-standards/iso14000.htm, accessed June 20th 2012
17. ISO 22000 – Food Safety Management System, available at http://www.iso.org/iso/catalogue_detail?csnumber=35466, accessed June 20th 2012
18. ISO 27000 – Information Security Management, available at http://www.27000.org/iso-27001.htm, accessed June 20th 2012
19. ISO 31000:2009 – Risk Management, available at http://www.iso.org/iso/catalogue_detail?csnumber=43170, accessed June 20th 2012
20. The Institute of Risk Management (IRM), available at http://www.theirm.org/aboutheirm/ABhistory.htm, accessed June 20th 2012
21. A Risk Management Standard © IRM: 2002, available at http://www.theirm.org/publications/documents/ARMS_2002_IRM.pdf, accessed June 20th 2012
22. A Risk Management Standard © AIRMIC, ALARM, IRM: 2002, available at http://www.theirm.org/publications/documents/Risk_Management_Standard_030820.pdf, accessed June 20th 2012

REDETE – ECONOMIC DEVELOPMENT AND ENTEREPRENEURSHIP IN TRANSITION ECONOMIES
703
23. Federation of European Risk Management Association FERMA, available at http://www.ferma.eu/about/mission-and-objectives/what-is-ferma/, accessed June 20th 2012
24. The Risk Management Standard © AIRMIC, ALARM, IRM: 2002, translation copyright FERMA: 2003, available at http://www.ferma.eu/wp-content/uploads/2011/11/a-risk-management-standard-english-version.pdf, accessed June 20th 2012
25. AS/NZS: 2004 Australian/New Zealand Risk Management Standards, SAI GLOBAL, available at http://www.ucop.edu/riskmgt/erm/documents/as_stdrds4360_2004.pdf, accessed June 20th 2012
26. COSO Committee of Sponsoring Organizations of the Treadway Commission, available at http://www.coso.org/aboutus.htm, accessed June 20th 2012
27. Enterprise Risk Management – Integrated Framework, Executive Summary (2004), COSO Committee of Sponsoring Organizations of the Treadway Commission, available at http://www.coso.org/documents/COSO_ERM_ExecutiveSummary.pdf, accessed June 20th 2012
28. COSO Committee of Sponsoring Organizations of the Treadway Commission, available at http://www.coso.org/documents/ERM-FAQs.pdf, accessed June 20th 2012
29. Bank for International Settlements, available at http://www.bis.org/bcbs/about.htm, accessed June 20th 2012
30. Basel Committee on Banking Supervision, Progress report on Basel III implementation (2012), Bank for International Settlements, available at http://www.bis.org/publ/bcbs215.pdf, accessed June 20th 2012
31. European Commission, available at http://ec.europa.eu/internal_market/insurance/solvency/current/index_en.htm, accessed June 20th 2012
32. International HACCP Alliance, available at http://www.haccpalliance.org/sub/index.html, accessed: August 30th 2012
33. Codex Alimentarius, Food Hygiene Basic Text, Second Edition (1997), Food and Agriculture Organization of the United Nations, World Health Organization, available at ftp://ftp.fao.org/docrep/fao/005/Y1579e/Y1579e.pdf, accessed: August 30th 2012
34. Council Directive 93/43/EEC, available at http://ec.europa.eu/food/food/biosafety/salmonella/mr06_en.pdf, accessed August 30th 2012

REDETE – ECONOMIC DEVELOPMENT AND ENTEREPRENEURSHIP IN TRANSITION ECONOMIES
704
FACTORS ENHANCING ECONOMIC PERFORMANCE IN HOSPITALITY. THE PARADIGM OF GREEK HOTEL
COMPANIES
Soultana Tania KAPIKI311
Abstract
The possibility to identify and suggest variables contributing to the economic success of the hotel enterprises is very attractive to hoteliers, especially nowadays that the hospitality industry and the entire economy are undergoing a financial crisis. Therefore, the hotel managers should focus on identifying, creating or developing competitive advantages that can be utilised in order to improve the company’s economic performance and bottom line. This paper attempts to identify those internal factors having enhanced the financial performance in the Greek hospi-tality sector during 2008-2010. The survey was conducted in Greek high-class hotel companies and reveals that the enhancement of a hotel’s economic performance can be achieved by the following key factors: traditional, warm and exceptional services focused on personalised service, as well as valet and signature services; well-trained and highly motivated associates undergoing frequent training to upgrade their skills and be professional, attentive, efficient, courteous and committed. Special emphasis should be placed on work relations, commu-nication, organisational planning, maximization of human potential and level of performance; contemporary managerial approaches including total quality management, database manage-ment, yield management, management by walking around and interaction with employees and guests; pricing tactics, such as special offers and discounts, several packages, all inclusive and gift vouchers, maximising the revenue per room based on demand projections; investments in new technology systems concerning guest security and business meetings, as well as in systems increasing reservations and hotel sales; organization of several performances, theme nights and entertainment activities keeping the guests (and the revenues) within the premises; application of sustainable practices that benefit the environment, attract guests, reduce the operating costs and increase profitability; use of the social media, word of mouth advertisement, travel web-sites, Global Distribution Systems and hospitality organizations to help the hotels best showcase their quality and to attract new guests; and, formal cooperation with other tourism stakeholders (e.g. airlines, rent a car, mobile telephony companies, sea and land transporters, other hotels and restaurants, golf courts, etc.) so as to maximize occupancy and turnover. The findings of this study are suggested as best practices for the hospitality industry.
Keywords: Economic performance; hospitality; profitability; success factors.
JEL Classification
L25, L83, L84
311 Alexander Technological Educational Institute of Thessaloniki
Department of Tourism Management P.O. Box 141, 57400 Sindos, Thessaloniki, Greece e-mail: [email protected]

REDETE – ECONOMIC DEVELOPMENT AND ENTEREPRENEURSHIP IN TRANSITION ECONOMIES
705
Introduction
Tourism is a key driver of socio-economic progress through the creation of jobs and enterpri-ses, infrastructure development and revenues earned. International tourism rebounded strongly in 2010, with 940 million international tourist arrivals (up by 6,6% over 2009) and tourism receipts to have reached US$ 919 billion worldwide (693 billion euros), up by 4,7% in relation to 2009. Europe remains the region with the highest tourist arrivals (471 million) and tourism receipts ($441 billion) maintaining the largest share of the international tourism market (UNWTO Tourism Highlights, 2011).
Greece is ranked 21st in Europe and 29th overall, in the Travel & Tourism Competitiveness In-dex rankings 2011, down by three positions in Europe and five positions overall since 2009 (Wor-ld Economic Forum, 2009 & 2011).
Table 1 summarizes the basic figures and performance indicators of the Greek tourism for the years 2009 and 2010.
Table 1: Basic Figures of Greek Tourism for the Years 2009 & 2010
Basic Figures & Performance Indicators
YEAR 2009 2010
Contribution to GDP 15,7% 15,4%
Contribution to Employment 17,4% 17,1%
World Rank-Tourist Arrivals 16th 17th
World Rank-Receipts 15th 21st
International Tourism Receipts (billi )
10,4 € 9,6 €
Average per Capita Expenditure 697 € 640 €
Market Share World - Arrivals & 1,7% 1,6% & 1,4%
Source: Association of Greek Tourism Enterprises, 2009-2010
The hospitality industry is part of the travel and tourism industry and, consequently, there is a
strong interrelation between these two industries (Walker, 2010). Whenever tourism goes well, there is an increase in hospitality as well. This is the reason why the hospitality industry is considered cyclical, sometimes experiencing falling occupancy rates and revenues, while at other times increasing these two variables significantly (Hayes et al., 2011).
In 2010 the average occupancy rate for all the Greek hotels was 60,0% and in 2009 this rate was 51,1%. At the same time the average revenue per available room (RevPAR) in 2010 was 13.274,39 euros, decreased by 13,4% in relation to 2009 (ITEP, 2011).
The hotel capacity in Greece in the years 2009 and 2010 was as follows (Table 2):

REDETE – ECONOMIC DEVELOPMENT AND ENTEREPRENEURSHIP IN TRANSITION ECONOMIES
706
Table 2: Hotel capacity in Greece (2009-2010)
Hotel Capacity / Indicator 2009 2010 Hotels 9.559 9.732 Rooms 383.000 397.700 Beds 732.279 763.407
Distribution of beds per class
5* 91.770 4* 187.494 3* 171.202 2* 226.707 1* 55.106
5* 102.428 4* 196.862 3* 177.923 2* 230.358 1* 55.835
International arrivals per bed 20,4 19,7 Average hotel size in rooms 40 41 Average occupancy 51,1% 60,0% Revenue per available room (RevPAR) 15.328 € 13.274 €
Sources: SETE & Greek Chamber of Hotels (2009 & 2010), ITEP (2011)
Due to the high number of lodgings operating in Greece, the competition in the Greek hos-
pitality sector is particularly keen. In 2009 and 2010 the average index of gross profit margin decreased in Greece (especially in 2009) irrespectively of the hotel rating. The 3-star hotels had the highest gross profit margin (33,8%) while the 5-star hotels had the lowest (22,09%). Moreover, the operating profit margin was negative and the net profit EBITDA margin was higher in the 3-star hotels (23,33%) compared with the other hotel categories. As for the net profit margin (before taxes), the rate was negative for the majority of hotels and geographical areas (ICAP, 2011).
Material
The success of a hotel company depends on a number of external and internal factors. External factors include several macro-environments such as demographic, economic, natural, technologi-cal, etc., and, therefore, companies have little or no control over these factors (Gursoy & Swanger, 2007).
Internal factors include various kinds of knowledge, production equipment, buildings, perso-nnel, capital, marketing capabilities, and other company resources that can influence the company level of success. These internal factors can be labelled company competencies (Harmsen et al., 2000).
Although the external environment influences company success, sustained competitive advan-tages derive from the internal resources and capabilities (also referred to as core competencies) that a company controls (Barney et al., 2001). The term “resources” includes competencies, asse-ts, capabilities, resources, information and knowledge (Kim and Oh, 2004). Core competencies are those processes, skills and assets within the firm that it relies on to achieve competitive advan-tages (Olsen et al., 1998).
Therefore, hotel managers should focus on identifying, creating or developing competitive ad-vantages that can be utilised in order to enhance the company’s economic performance and bottom line.
The major competitive methods of the hotel firms include: new product development; strategic alliances; brand repositioning; technological innovation; data base marketing; pricing tactics; diversification; service quality management; employees as important assets; in-room sales and entertainment; conservation/ecology programs; and management information systems (Olsen et al., 1998).

REDETE – ECONOMIC DEVELOPMENT AND ENTEREPRENEURSHIP IN TRANSITION ECONOMIES
707
Some companies are successful because of the identification of the right success factors and implementation of new competitive methods, while others fail because of their inability to identify and implement the proper strategies. Among the internal strategic factors, the human resources, product development, innovation, technology, customer service, and marketing strategies are considered to have a significant impact on a company’s financial success (Gursoy & Swanger, 2007).
Amit Sharma and Arun Upneja (2005) in their article “Factors influencing financial perfor-mance of small hotels in Tanzania” found out the following (internal) factors as affecting profita-bility and performance of small hotels in Tanzania: low volume and low prices of rentable rooms; high cost of goods sold, and high cost to sales percentages of controllable expenses; limited investment in technology and equipment; lack of product and service variety and quality; lack of formal training and education opportunities for employees.
Another study by Alison Morrison and Rivanda Teixeira (2004) shows the internal and exter-nal contextual factors that were found to impact on performance in the small tourism businesses. The internal factors include the owner’s-manager’s management capabilities; ownership and organisational structure; involvement in a range of business activities; and, staff and skills.
Gu (2005) pointed out that size, occupancy, and ownership are not the only factors that may affect the profitability of hotels. Other factors, such as branding, management systems, service quality, franchise status, guest demographics, etc., may also have impacts on their profitability. The study concluded that economies of scale are the key to profitability.
Finally, the research results of a study by Ottenbacher et al. (2006) revealed that out of 23 fac-tors that had been identified as potentially determining success in new services development, seven factors were found to play a distinctive role: market attractiveness, strategic human resource management, market responsiveness, employees training, empowerment, employee commitment and marketing synergy.
Methodology
The purpose of this study is to explore the determinants of success for some of the most well-known and profitable hotel companies in Greece. In order to identify the internal strategic factors that enabled the hotel companies to gain their competitive advantages and have significant economic results in the middle of a financial crisis, we applied a methodological approach that includes the following steps:
- Data collection and calculation of various performance indicators.
- Benchmarking, as well as empirical analysis for the economic assessment of several Greek hotels and for the identification of the most profitable and successful ones.
- Developing and sending a questionnaire to the successful hotels aiming to identify those factors that have contributed in the enhancement of their economic performance.
- Elaboration of the answers and presentation of the results as best practices for the hotel industry.
The steps analytically follow below:
Data Collection and Measurement of Performance Indicators
For the purposes of this study the hotel performance assessment methods concern the followi-ng variables: Labor productivity; Market share; Average occupancy rate; Turnover (Sales); Net profits (before taxes); and EBITDA, for the period 2008-2010.

REDETE – ECONOMIC DEVELOPMENT AND ENTEREPRENEURSHIP IN TRANSITION ECONOMIES
708
An extensive elaboration of data published in several sector studies and financial directories (ICAP, 2008-2011) as well as of balance-sheets published in financial newspapers (Express) took place so as to gather and calculate the above variables.
We measured the labour productivity of each hotel company by dividing the total revenue by the number of employees registered with the local Social Security Organization.
The market shares were calculated as a percentage of the turnover (sales) of the hotel enterprises on the total market value of the 5 and 4-star hotels (which in turn is equal to the total sum of turnovers of all the Greek 5 and 4-star hotels).
EBITDA (Earnings before interest, taxes, depreciation and amortization) was calculated as follows: Operating margin + Financial costs + Accounted depreciation costs.
Benchmarking and Empirical Analysis
In order to compare the performance of the hotel companies and identify the most profitable and successful ones, benchmarking process and empirical analysis for the period 2008-2010 was carried out.
By scrutinising the results we selected 104 hotels, with occupancy rates to vary from 44 to 100 per cent on an average, net profits (before taxes) from 4.500.000 to 100.000 euros and market shares (in terms of value) from 0,1% to 2,6%.
Moreover, the hotels’ labour productivity varies from 12.650 to 91.760 euros, the turnover (sales) from 4.743.994 to 38.190.580 euros and the EBITDA from 1.236.088 to 12.487.846 euros (all the above figures are the averages for the years 2008, 2009 and 2010).
It is noticeable that among these 104 hotels there are four hotel companies with a total of 26 hotels which have negative net profits (losses) but yet, the benchmarking analysis showed that their overall performance is positive and that’s why they are considered successful and were included in the sample.
Developing and Sending Questionnaires
Through the literature review we identified several methods utilized by the hotel industry towards creation of growth and value. We evaluated these methods and we discerned the most important factors for the enhancement of economic performance and profitability.
A structured questionnaire was developed to serve as the main data collection tool in the study. The questionnaire comprised 19 closed-ended and one open-ended questions. The first section of the questionnaire sought from the respondent hotels relevant demographic information such as business structure, size, rating, etc. (independent variables).
In terms of the dependent variables, the questionnaire included 9 internal factors (and their subcategories) considered to increase hotel performance. These factors are: Exceptional service; Technological innovation; Management capability; Strategic alliances; Niche marketing and advertising; Pricing tactics; Environmental program; In-house animation and outdoor events; Highly motivated Staff; Others.
The hotel managers were asked to specify the 10th (and any additional) factor(s) based on their experience and measure each factor using a 5-point Likert scale (5 = extremely important, 1 = not important at all) as to their importance for financial success in their enterprise.
The questionnaires were sent electronically in April 2012 to the hotel managers of 104 hotels that were found to be profitable and are among the most well-known and successful companies in Greece. The contacts of the hotels are included in the Greek Travel Pages (GTP).
The answered questionnaires were collected by June 2012. Four (4) answered questionnaires were not complete and, therefore, they were excluded from the sample and fifty nine (59)

REDETE – ECONOMIC DEVELOPMENT AND ENTEREPRENEURSHIP IN TRANSITION ECONOMIES
709
questionnaires were answered properly. This response rate (56,7%) is considered to be satisfactory and sufficient for reliable conclusions.
The basic characteristics of the sample are (Table 3):
Table 3: Sample characteristics
Number of Hotels Classification Bed Capacity 24 5* 13.919 33 4* 18.410 2 3* 725
Total Number of Employees: 9.323 Location:
City hotels (10) Resort hotels (49)
Total Market Share (in terms of value): 18,2%
Source: author’s own elaboration
Results
The main findings of the survey are summarized in the Table 4.
Table 4: Statistics and ranking of success factors
FACTOR MEAN RANK Exceptional service 4,15 1 Highly motivated staff 3,95 2 Management capability 3,80 3 Pricing tactics 3,75 4 Technological innovation 3,72 5 In-house animation & outdoor events 3,70 6 Environmental program 3,68 7 Niche marketing & advertising 3,66 8 Strategic alliances 3,65 9 Others 3,60 10
Source: author’s own elaboration
As can be seen in Table 4 the “Exceptional service” and the “Highly motivated staff” were
ranked as the most important factors enhancing economic performance and profitability in the total sample.
The factors identified in the open-ended question “Others” include the following findings: spa; conference and meeting facilities; business centre; executive (VIP) lounge; sport & leisure facilities; health club, fitness centre, gym, sauna, massage; loyalty programs for guests and travel agents; special privileges to repeaters.
In terms of the dependent variables, the following aspects were highlighted for each factor and are suggested as best practices for the hotel industry (Table 5):

REDETE – ECONOMIC DEVELOPMENT AND ENTEREPRENEURSHIP IN TRANSITION ECONOMIES
710
Table 5: Best practices for economic performance enhancement in hospitality
Exceptional service: hotels fully committed to the value of warm, traditional hospitality; strong emphasis on personalised service; valet services; signature services.
Highly motivated staff: continuous productivity updating, recruitment and work evaluation; associates undergoing frequent training to upgrade their skills and be professional, attentive, efficient, courteous and committed; special emphasis is placed on work relations, communication, organisational planning, maximization of human potential and level of performance; staff/trainees mobility from other countries for lower cost. Management capability: total quality management; database management; yield management; management by walking around and interact with employees and guests. Pricing tactics: special offers and discounts; several packages (e.g. family, weekend, honeymoon, business, gastronomy, stay & drive, etc.); all inclusive; gift vouchers. Technological innovation: latest guest security, business and entertainment systems; high-speed/WiFi Internet; website with booking engine; property management systems. In-house animation and outdoor events: organization of several performances, theme nights and entertainment activities so as to keep the guests within the premises. Environmental program: the EU Eco-label, Green Key, ISO 14001, International Hotels' Environment Initiative, Travelife Sustainability System, Blue Flag and individual application of green practices are among the schemes followed by the majority of the sampled hotels. Niche marketing & advertising: membership in the Leading or the Small Luxury Hotels of the World; social media; word of mouth advertisement; global distribution systems (GDS); Trip Advisor. Strategic alliances: partnership with airlines; rent a car; mobile telephony companies for free handsets; sea and land transporters; other hotels and restaurants; golf courts. Other: creation or successful operation of conference, meeting and business facilities; executive (VIP) lounges; sport and leisure facilities; spa, health club and fitness centres; loyalty programs for both guests and travel agents; special privileges to repeaters.
Source: author’s own elaboration
Discussion
The goal of the paper presented here was threefold. First, through the literature review we tried to enrich our knowledge on the factors contributing to the financial success of the hotel compa-nies. Furthermore, we attempted to discern which internal factors, among those that had been fou-nd, were most important for the economic performance of the Greek hospitality industry. Nine key factors were identified pertaining to Greek hotel enterprises as: Exceptional service; Techno-logical innovation; Management capability; Strategic alliances; Niche marketing and advertising; Pricing tactics; Environmental program; In-house animation and outdoor events; and Highly motivated Staff.
Second, based on data published on several sector studies, financial directories and balance-sheets we calculated various performance indicators and we carried out benchmarking as well as empirical analysis in order to assess the performance of the high-class Greek hotel companies for the period 2008-2010. Through the assessment we identified 104 successful hotels and we sent them a questionnaire seeking the factors having enhanced their economic performance.
Third, we elaborated the answered questionnaires and presented the success factors as they were ranked by the hotel managers. These factors are suggested as best practices for the enhance-ment of economic performance in hospitality.
A limitation to this study was the fact that it included only high-class hotels operating in Greece. Future research is suggested to include both international and local companies, as well as hotels of all levels of service for more objective conclusions. It should also consider qualitative methods (to supplement and enrich the quantitative methods and findings) so as to understand the

REDETE – ECONOMIC DEVELOPMENT AND ENTEREPRENEURSHIP IN TRANSITION ECONOMIES
711
relative impact of each success factor on the overall performance of the hotel sector. This is likely to provide a perspective on why and to what extent companies should invest in each specific su-ccess factor.
Furthermore, the employees’ opinion and suggestions on the subject should be taken under consideration for having improved and more precise results.
Conclusion
Some hotel companies are successful because they have managed to identify the right success factors and implement new competitive methods, while others fail because of their inability to fi-nd and implement the proper strategies.
The possibility to identify and suggest variables contributing to the economic success of the hotel enterprises is very attractive to hoteliers, especially nowadays that the hospitality industry and the entire economy are undergoing a serious financial crisis.
The findings of this study suggest that if hoteliers wish to be successful and profitable, they need to:
1. Provide traditional, warm, personalized and exceptional services;
2. Place special emphasis on well-trained and highly motivated associates;
3. Apply contemporary managerial approaches and pricing tactics, such as special offers and packages maximising the revenue per room based on demand projections;
4. Invest in new technology systems concerning guest security and business meetings, as well as in systems increasing reservations and hotel sales;
5. Organize events and activities so as to keep the guests (and the revenues) within the premises;
6. Apply sustainable practices that benefit the environment, attract guests, reduce the operating costs and increase profitability;
7. Use the social media, word of mouth advertisement, travel websites, GDS and hospitality organizations to help the hotels best showcase their quality and to attract new guests; and,
8. Cooperate formally with other tourism stakeholders (airlines, land and sea transporters, etc.), so as to maximize occupancy and turnover.
We consider that the above success factors properly adjusted and possibly enriched could be
appropriate for the hoteliers of tourism destinations other than Greece and we suggest the findings of our survey as best practices for the sector’s development and economic enhancement.

REDETE – ECONOMIC DEVELOPMENT AND ENTEREPRENEURSHIP IN TRANSITION ECONOMIES
712
Reference list
1. Association of Greek Tourism Enterprises (SETE). Greek Tourism: Facts & Figures (2009 & 2010), & Basic Figures of Greek Tourism:2009 & 2010
2. Barney, J., Wright, M. & Ketchen Jr., D.J. 2001. The resource-based view of the firm: ten years after 1991. Journal of Management 27, 625–641
3. Express (Financial Newspaper), http://www.express.gr/ (accessed 10/09/2012) 4. Greek Chamber of Hotels. Hotel Capacity 2009 & 2010 5. Greek Travel Pages (http://www.gtp.gr/), (accessed 15/09/2012) 6. Gu, Z. 2005. Economies of Scale Could Be Key to Profitability. International Journal of
Hospitality & Tourism Administration, 6:1, 73-85 7. Gursoy, D. & Swanger, N. 2007. Performance-enhancing internal strategic factors and compe-
tencies: Impacts on financial success. International Journal of Hospitality Management, 26: 213–227
8. Harmsen, H., Grunert, K.G., Bove, K., 2000. Company competencies as a network: the role of product development. Journal of Product Innovation Management, 17: 194–207
9. Hayes, K.D., Ninemeier, D.J., & Miller, A.A. 2011. Foundations of Lodging Management. Pearson Education, UK
10. ICAP, Greece in Figures, Greek Financial Directory: Publications 2008, 2009, 2010 11. ICAP, Sector Studies, Hotels: Publications 2008, 2009, 2011 12. ITEP (Research Institute for Tourism). Developments in the key figures of the Greek hotel
market in the years 2010 – 2011 13. Kim, B.Y. & Oh, H. 2004. How do hotel firms obtain a competitive advantage? International
Journal of Contemporary Hospitality Management, Vol. 16(1), pp. 65 – 71 14. Morrison, A. & Teixeira, R. 2004. Small business performance: a tourism sector focus.
Journal of Small Business and Enterprise Development, Vol. 11(2), pp. 166 – 173 15. Olsen, M., West, J., & Tse, E. 1998. Strategic Management in the Hospitality Industry. Wiley
& Sons, USA 16. Ottenbacher, M., Gnoth, J. & Jones, P. 2006. Identifying determinants of success in
development of new high-contact services: Insights from the hospitality industry. International Journal of Service Industry Management, Vol. 17(4), pp. 344 – 363
17. Research Institute for Tourism (ITEP), 2011. Developments in the key figures of the Greek hotel market in the years 2010 – 2011
18. Sharma, A. & Upneja, A. 2005. Factors influencing financial performance of small hotels in Tanzania. International Journal of Contemporary Hospitality Management, Vol. 17(6), pp. 504 – 515
19. UNWTO Tourism Highligts, 2011. Retrieved from www.unwto.org/facts (accessed 1/9/2012) 20. Walker, J. (2010). Introduction to Hospitality Management. Pearson Education, London 21. World Economic Forum, the Travel & Tourism Competitiveness Report 2009 & 2011.
Retrieved from www.weforum.org/ttcr (accessed 8/9/2012).

REDETE – ECONOMIC DEVELOPMENT AND ENTEREPRENEURSHIP IN TRANSITION ECONOMIES
713
IDENTIFICATION OF CONTROLLING AND EVALUATION OF THE USE OF THE INTERNAL FINANCIAL REPORTS
IN THE ŠIBENIK KNIN COUNTY SME’s
Lovorka BLAŽEVIĆ312 Marijana RAIČ313
Marijana DRAGAŠ314
Abstract
The modern market is characterized by dynamism, competitiveness and adoptable management. All these features encourage entrepreneurs (business entities) to develop new managerial tools that will enable them to adapt very quickly to changed business conditions. The role of managerial tools in any business entity is crucial, not only in terms of performance, but also in terms of maintenance of business operations, especially at the present time of global crisis. This paper focuses on the identification of controlling as a function of management in small and medium business entities in the Sibenik- Knin County. Also, it evaluates the use of the internal financial reports in decision-making process taken by small and medium entrepreneurs. The role of controlling as a function of management in a business entity is an important link between the accounting department and management. Controlling as a system allows the realization of competent abilities on the basis of creating an efficient business. The authors of this paper make an attempt to answer the following questions: Has controlling, as a necessary managerial tool, come into use in the most successful businesses in the area of Sibenik – Knin County? At what level entrepreneurs do accept controlling? Has the current crisis encouraged the entrepreneurs to introduce controlling as an effective way to improve their business operations, survive in the market, establish their positions and the like? Our aim is to point to the problem of the implementation of controlling and its role in a business entity at the time of global crisis. Also, we will try to emphasize the necessity of further education of the existing management with a view to increase the use of controlling and improve its effectiveness. In addition, we will try to provide the necessary guidance in order to improve the implementation of the internal financial reports as a relevant basis for decision making. Internal financial reports as a basis for the implementation of controlling function are not yet developed enough to be a sufficient basis for the controller – management relations. The process of controlling begins with collecting internal information arising from the entire organization, where financial reports of the accounting system are important foundations for further development and use of controlling. The quality of con-trolling in the first place depends on the cooperation of managers and controllers, as well as their successful coordination of the activities connected to this system, which is called controlership. This paper implies that the related business entities are unsuccessful in terms of using the system of controlling in order to ensure their long-term existence in the market, including the long-term profit. However, the major problem, especially in the area of the County mentioned above, is neglecting the position of controlling in terms of prevention of business crisis.
Keywords: control, controlling, controller, controllership
312 Veleučilište „Marko Marulić“, Kralja Petra Krešimira IV 30, 22 300 Knin, Republika Hrvatska [email protected] 313 Veleučilište „Marko Marulić“, Kralja Petra Krešimira IV 30, 22 300 Knin, Republika Hrvatska, [email protected] 314 Veleučilište „Marko Marulić“, Kralja Petra Krešimira IV 30, 22 300 Knin, Republika Hrvatska, [email protected]

REDETE – ECONOMIC DEVELOPMENT AND ENTEREPRENEURSHIP IN TRANSITION ECONOMIES
714
1. Introduction
An active role of management is essential in improving business performance, occupation and maintenance of a certain acquired market position. Croatian economy, and the economies of other European countries have been facing with the global crisis recently. The Šibenik- Knin County is one of the less developed counties in the Republic of Croatia. Small and medium businesses face major business challenges during the recession that has not spared entrepreneurs in this county. The functions of management in small and medium-sized companies in the county are not separa-ted from the ownership functions, and this is one of the reasons for non-implementation of the management functions, and thus the issue of management. This paper focuses on small and medium companies in the Šibenik- Knin County in order to provide a realistic presentation in the domain of using modern management instruments by the entrepreneurs in the area observed. There is another important reason for putting the small and medium entrepreneurs into the focus. In time of crisis SMEs face a number of constraints in their business. One of the limitations is related to personnel management which is usually reflected in the reduction of the administrative staff, that is, the Department of Management and Accounting Department. This practice certainly has its consequences in the quality of delivering services. This paper aims at identification of controlling as a management function and development of the internal financial reports as a relevant basis for decision making.
The underlying hypotheses of the study are: - The entrepreneurs in the Sibenik – Knin County have no organized controlling department
or individual controllers in order to improve the management function.
- The internal financial reports are not in the function of controlling in the small-and me-dium-sized entrepreneurs in the Sibenik – Knin County.
In addition to the basic hypotheses, one of the goals of this paper is to emphasize the necessity of further education of the existing management in order to increase the use of controlling as a management function and improve its efficiency. The paper will also seek to provide the nece-ssary guidance in order to improve the implementation of the internal financial reports as a rele-vant basis for business decision making.
2. Theoretical framework
2.1. Controlling
Controlling can be defined and interpreted in different ways. The simplest definition interprets controlling as the process that is a result of adjusting the joint efforts of the management (indivi-dual or team) and controller in order to achieve a targeted goal of a business entity. A more concise definition is: "Controlling means the control of all the activities of the business entity aimed at realization of the company’s goals" (Lebefromm, 1997, p.1). Historically, controlling was developed in the U.S. in the early 20th c, or more accurately in 1931, with the establishment of the "Controller` s Institute of America" as a consequence of the Great 1929 Depression.
The development of controlling was fueled by the increasing diversification of production of the U.S. companies such as DuPont, General Motors, Sears,... and the launch of their branches in different locations that had realized the need for investment feedback. Modeled on the American theory and practice, controlling begins a dynamic increase in the developed European countries (Germany, Italy, Austria,...), expanding into multinational companies during the 60-ies of the 20th
REDETE – ECONOMIC DEVELOPMENT AND ENTEREPRENEURSHIP IN TRANSITION ECONOMIES
715
century. Due to the development controlling becomes more complicated because of the need for harmonization of managerial functions (planning, organization, personnel issues, management and control), and its task remains the same: to support management in achieving the vision, mission and business goals of the company, giving them support in carrying out their functions.
The primary sources of the controlling are connected to five basic functions (Horvath, 2006, p.21):
- accounting-computed function
- internal audit function
- team-work and collaboration with external audit,
- tax function,
- function of interpreting the results and information.
Given that controlling contributes to transparency, coordination and integration of the organi-zation's operations, it is considered that this contemporary philosophy and business functions actually support management at work (Osmanagic Bedenik, 2003, p.361). Control should involve a comparison between the planned and realized values for information on the outcome of an economic activity (Frese, 1968, p.53). The term "control" in management means mastering, cont-rol and execution of the management process.
The term Management Control is defined as the management process that consists of (Anthony, Dearden and Govindarajan, 1992, p.3):
- Programming,
- Budgeting,
- Execution,
- Evaluation.
According to Horvath, the expression Management Control should not be translated literally, as in the domain of management controlling also covers the company management. Thus, accor-ding to the bibliography on management, American English-speaking areas use the term "controllership" describes the managerial tasks whose primary holder is the "controller" (Horvath, 2006, p.19). It represents every person who uses the term "Management Control" in the American literature, while the Croatian and German communication comm.only translates it as "kontrolor", which is wrong, and what is even worse, "controlling" is translated as the process of "control”. The controller and manager are the conditional operators of the controlling process, that is, there is no controlling without them. The controller’s tasks cannot be described simply by the terms "control", or "controlling". He/she is an active carrier of the controlling tasks and participates as a subject in the "controllership" as the system of controlling relations inside the enterprise, which inevitably include the management or manager (Lukovic, Lebefromm, 2009, p.26).
The controller’s goal is to minimize the risk in making a timely election strategy in order to en-sure competitiveness of the company. A pre-condition for the operation of controlling department is to deliver and suitably process information from the entire company. Controlling is a function within the management system, which increases its efficiency and effectiveness, and thus the abi-lity to adapt to changes within and outside the enterprise (Weber, 1993, p.46). For example, Ma-yer and Weber, setting the goal of the company to the forefront, defined the basic characteristics of controlling (Table 1):

REDETE – ECONOMIC DEVELOPMENT AND ENTEREPRENEURSHIP IN TRANSITION ECONOMIES
716
Table 1. Basic characteristics of controlling
FOCUSING THE COMPANY’S GOAL
EFFECTS OF CONTROLLING
- Formulation of objectives - Leading to the goal - Realization of the goal
- a narrow market orientation, monitoring supply and demand in order to realize operational and strategic success / goal - Target-oriented organization and functioning of all activities of the economic entity, - Orientation and conduct of all activities in order to make a profit, - Orientation and managing all processes toward the future in terms of a successful business in the future.
Source: adapted by the Lukovic, according to: T. Mayer, E. & Weber, J., "The Handbook of Controlling", CE Poeschel Verlag Stuttgart, Stuttgart, 1990., p. 35
The concept of controlling aims at ensuring the long-term existence of the company carried out
in two directions. The first direction is to ensure the long term survival of the company on the market, and the other is to ensure the long-term realization of profits. The concept is based on the long life that has adopted a philosophy of sustainable development, which means meeting broader and clearer goals. The basic controlling classification is in accordance with the management cla-ssification, so, considering the market orientation of management, we differ the Operational and Strategic Controlling. Strategic Controlling aims to increase business effectiveness that provides "real things at the right time" in order to meet market needs. It is also aimed at improving the capabilities of business success, building growth potential and preparing companies to market changes. The Operational Controlling functions as support to the management in daily operations and decision making. Its primary mission is to assist in increasing the efficiency of operations that is aimed at "providing the highest possible output with minimal input." It helps to increase the efficiency, liquidity and keep the substance and the coordinated use of operational management tools. There are two basic forms of the way of controlling organization and its position in the company: centralized and decentralized. Centralized controlling organization connects several functions in the company, while a decentralized controlling organization is organized by departments or by products and works closely with the Sales Controlling. In a market-oriented management decentralized controlling is aimed at the customer needs and performs the selection of product characteristics in order to meet their needs. The concept of controlling develops high sensitivity to changes, external and internal. Internal changes are resolved by the internal stan-dards and adjustments, while external are of key importance to the concept of controlling within a company (Osmanagic Bedenik, 2007, p.84).
The basic model of the concept of controlling supports six basic concepts of company (Lukovic and Lebefromm, 2009, P.20):
- a system of values,
- the planning system,
- control system,
- an information system,
- human resources management system and
- the system of organization.
- Controlling business philosophy consists of three pillars (Lukovic and Lebefromm, 2009, p.21):
- action-oriented planning at all levels,

REDETE – ECONOMIC DEVELOPMENT AND ENTEREPRENEURSHIP IN TRANSITION ECONOMIES
717
- decentralized personalization of accountability at all levels of operation and decision ma-king,
- qualified control dimension of realization of the planned tasks and evaluation of achieve-ments.
The conception of controlling occurs via realization of the three pillars of the philosophy of controlling, via the use of controlling instruments, controlling organization and establishing the process of controlling, that is the concept of controlling is a system of harmonized performance of all functions that are planned, measurable and goal-oriented (Horvath, 2006, p.99). Plans are quantified objectives of the company (Perčević, 2006, p.2). Controlling includes all activities that company managers take with the intent to achieve results as closer to the planned result (Do-nnelly, Gibson and Ivanievich, 1990, p.225). Planning is one of the five basic stages of strategic management and it is divided into the financial and operating plan. The plan also includes the budget plan, drafted by the controller as an anticipation of the future business. The most important segment of the operating plan is the financial plan. The financial plan is normally made by the Accounting Department according to information provided by the management with the support of the controller. In addition to the financial plan, controlling and management use a series of reports due to the needs of control. A good part of the reports is stemmed from the Accounting Department (external and internal financial reports).
2.2. Financial reports as support to the function of controlling
The objective of financial reports is to present a true and fair financial position, financial per-formance and cash flows of the business owners. A fair presentation requires a faithful presenta-tion of the effects of transactions and other events, and in accordance with the criteria for recog-nition of assets, liabilities, capital, income and expenses (HSFI, eng. Croatian Standards for Financial Reporting, 2008). The financial reports combine the essential business information and necessary managerial instruments are based on the information from the financial reports. One of the fundamental characteristics of the financial reports is their fair presentation of the information contained. The basic financial reports (external) contain specific information needed to make appropriate business decisions. However, all the information is not properly contained only within the basic financial statements. There is a number of the reports that are largely customized by form and substance to its customers. These reports are generated not only within the Accounting Department, but also within other business units of the company. Such reports are generally not standardized, and their form is free and is created according to the needs of individual users. Typically, these reports contain targeted information, closely related to the activity of entrepre-neurs, because the basic financial reports are sometimes too generalized and not sufficient groun-ds for making certain business decisions. Creating content and structure of internal financial reports in the free form and according to the user needs provides a lot of options and flexibility to meet the individual and specific requirements of the internal users. However, the lack of standar-dization requires more effort, work and knowledge when creating the internal reports. The very methodological basis for developing such reports is known, scientifically grounded and practically tested (Vašiček, 2011, p.680). Following that the external reports should provide relevant and comparable data, the need arises to provide relevant sources of information for their creation. The elaboration of the instruments of the internal accounts is indirectly imposed as a necessary precondition for successful implementation of the externally presented reports (Persic, 2009). So, preparing the internal reports should be primarily focused on the real needs of users. Therefore, the proper development of the internal financial reports largely depends on a quality information system in which accounting occupies a dominant position. On the basis of the developed information system it is possible to exercise control. Therefore, the information on financial

REDETE – ECONOMIC DEVELOPMENT AND ENTEREPRENEURSHIP IN TRANSITION ECONOMIES
718
reports, in particular the internal financial reports, is useful to the management and controlling of businesses. The primary role of the internal financial reports is consolidation of information for the purposes of "internal" users, therefore, the management and controlling.
Controlling as a function of management incorporates the following strategic tasks (Ocko and Švigir, 2009, p.39):
- permanent look to the future based on the analysis of the market trends and competition,
- making strategic forecast,
- help managers to assess the future development of guidelines,
- adjust operations based on economic trends,
- informing and advising management on the way to achieving the vision,
- raise the overall efficiency of a company (its values)
- help managers to shape their goals and balancing them via the Balance Score Card (qualitatively and quantitatively),
- continuously monitoring the environment (macroeconomic trends, customers, suppliers, political and social environment), the primary focus on the environment in which the company operates or is about to act,
- help the management via the SWOT analysis through detection of all the good and bad in the company, but also the surrounding environment and
- help to manage human resources.
Controlling operational tasks can be summarized in (Očko and Švigir, 2009, p.40): - continuous communication throughout the company;
- continuous efforts to improve the information system, with emphasis on the financial accounting service;
- active cooperation on the development of operational plans;
- determination of relative values and indicators needed to understand the status and trends of business events in the company;
- establish standard size with respect to the activity;
- testing various tools and instruments of controlling, as well as many economic indicators and the selection of those which show the best of the most important parameters for the evaluation of business in the particular case;
- special attention should be paid to correlations between different sizes,
- identifying positive and negative trends and suggestions for improvements,
- making business reports according to specific needs,
- initiating and organizing meetings at various management levels…
In practice, controlling is usually associated with the financial and management accounting,
which usually depends on the size and organization of the company, particularly from the Acco-unting Department, Controlling draws the largest number of information, through internal and external financial reports. Managers are increasingly aware of the importance of this information.
However, before the introduction of the function of controlling every company should study the reasons for that, and therefore bear in mind the limiting factors like need for innovation, company size, complexity, principles and organization, basic strategic position of the company,
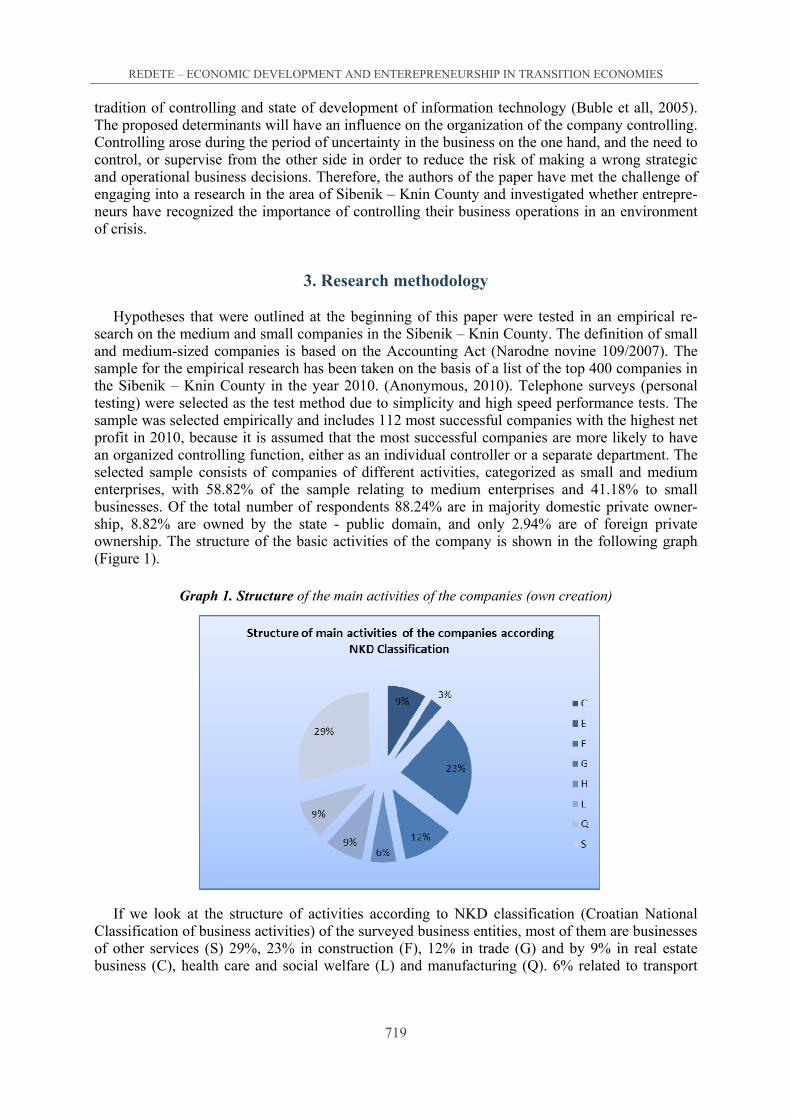
REDETE – ECONOMIC DEVELOPMENT AND ENTEREPRENEURSHIP IN TRANSITION ECONOMIES
719
tradition of controlling and state of development of information technology (Buble et all, 2005). The proposed determinants will have an influence on the organization of the company controlling. Controlling arose during the period of uncertainty in the business on the one hand, and the need to control, or supervise from the other side in order to reduce the risk of making a wrong strategic and operational business decisions. Therefore, the authors of the paper have met the challenge of engaging into a research in the area of Sibenik – Knin County and investigated whether entrepre-neurs have recognized the importance of controlling their business operations in an environment of crisis.
3. Research methodology
Hypotheses that were outlined at the beginning of this paper were tested in an empirical re-search on the medium and small companies in the Sibenik – Knin County. The definition of small and medium-sized companies is based on the Accounting Act (Narodne novine 109/2007). The sample for the empirical research has been taken on the basis of a list of the top 400 companies in the Sibenik – Knin County in the year 2010. (Anonymous, 2010). Telephone surveys (personal testing) were selected as the test method due to simplicity and high speed performance tests. The sample was selected empirically and includes 112 most successful companies with the highest net profit in 2010, because it is assumed that the most successful companies are more likely to have an organized controlling function, either as an individual controller or a separate department. The selected sample consists of companies of different activities, categorized as small and medium enterprises, with 58.82% of the sample relating to medium enterprises and 41.18% to small businesses. Of the total number of respondents 88.24% are in majority domestic private owner-ship, 8.82% are owned by the state - public domain, and only 2.94% are of foreign private ownership. The structure of the basic activities of the company is shown in the following graph (Figure 1).
Graph 1. Structure of the main activities of the companies (own creation)
If we look at the structure of activities according to NKD classification (Croatian National
Classification of business activities) of the surveyed business entities, most of them are businesses of other services (S) 29%, 23% in construction (F), 12% in trade (G) and by 9% in real estate business (C), health care and social welfare (L) and manufacturing (Q). 6% related to transport

REDETE – ECONOMIC DEVELOPMENT AND ENTEREPRENEURSHIP IN TRANSITION ECONOMIES
720
and storage (H), and 3% of the activity of water supply (E). It is significant to single out the information that most of the respondents come from a variety of service industries (29% of the other facilities, 9% real estate, 9% of health care services, transportation and storage of 6% and 3% of supply), then 23% of the construction industry and 9% of businesses surveyed in the manufacturing industry. Due to problems of business crisis, therefore, imperfect conditions in which this empirical research has been conducted, thus defined sample is considered relatively representative, while the rate of return of 30.36% is considered moderately representative. Market research during the last 10 years cited the low rate of return of only 20% (Jelenc, 2005, p.1066) and 24% (Kuliš, 2004, p.348). Therefore, this rate of return is assessed as satisfactory. The questionnaire in this empirical study consisted of closed questions, multiple choice questions, and questions on intensity (semantic differential). A questionnaire was used as an instrument of the telephone survey, and the target respondents were potential controllers, and alternatively managers, owners and managers of accounting in the absence of controlling in a business entity. The study was conducted at two levels: theoretical and empirical, with empirical data collected and systematized via the methods of classification, description, and comparison. Research results related to the arithmetic mean and correlation.
4. Research results
Studies in developed market economies have shown that the size of the company is one of the determinants of the institutional aspects of controlling (Osmanagic Bedenik, 2010). The age structure of the companies in this study suggests they are 20 years old on average, 82.35% of them were founded between the 1990 and 2010. Of that number, 55.88% were established after 2000. We may suggest that the survey covers mainly companies younger than 11 years. Organization age and controlling functions have introduced a weak link for the observed pattern. The correlation is positive and amounts to 0.365668, but not statistically significant.
Figure 2. The age structure of the surveyed companies (own creation)
The research shows that as many as 55.88% of the surveyed companies are not familiar with the function of controlling and its role in a company. The reason for this might be found in the fact that nearly half of the respondents were in the category of small businesses. According to the earlier studies conducted in the Republic of Croatia (Osmanagic Bedenik, 2010), it is more likely that larger companies have introduced the function of controlling. Another reason may be sought

REDETE – ECONOMIC DEVELOPMENT AND ENTEREPRENEURSHIP IN TRANSITION ECONOMIES
721
in the problem of separation of ownership and control functions, which is substantiated by the fact that the majority of respondents were in private ownership and dominated by the authoritarian management style. Furthermore, in response to the question of whether an entity is planning to introduce the function of controlling, 12% of them responded that they planned to introduce the controlling function soon, 40% had plans to introduce controlling but in better market times, and even 52% did not even have intention of introducing a strategy of controlling. Precisely, these data indicate that a large number of businesses surveyed are not based on controlling and modern managerial concept. Taking into account that the management style that dominates was authoritarian in 55.88% of the businesses surveyed, paternalistic in14.71%, and consultative in only 29.41%, we may suggest that the percentage of the owners’ participation in deciding was dominant. In such an environment, the development of the controlling function is not gaining ground. This contention is supported by the finding that only 7.14% of the sample companies have introduced some form of controlling function, that is 26.47% of the companies that responded to the questionnaire.
The causes of these results might be: - undereducated management,
- staff reduction caused by the economic crisis,
- inadequate form of management...
The research also shows that development of controlling in the Sibenik- Knin County started
during the last 10 years, with the stimulus coming from the management of their own (37.5%), domestic consultants (50%) and other sources (12.5 %). Controlling is organized as a separate department in 37.5% of the companies, and in 62.5% of them it is associated with another department. As an indicator of the intensity of the important role of controlling in making business decisions on the scale from 1 to 10, where 10 is the highest intensity score, the impor-tance of controlling in companies in the Šibenik- Knin County is 6.75. We suggest that controlling is still in the stage of introduction and development, and that it still does not have a strategic role, but its role is certainly not trivial. The internal financial reports, as a basis for the successful implementation of the controlling function, should be fully supervised by the controller. They are generated according to the needs of their users. The relationship between the controller and the internal financial reports should be interactive, which means that communication between the Department of Accounting and Controlling is necessary. The empirical research shows that the internal financial reports are in the function of controlling in the sense that they meet their current needs at the level of satisfaction intensity which amounts 7.375 (scale of 1 to 10, with 10 meaning the complete satisfaction). A high intensity score does not mean that the internal financial statements fully comply controlling. Taking into account that the function of controlling is not at a high level in the field of business management, this result could be interpreted in such a way that there is a good interaction between the users of the financial statements and the Accounting Department, which prepares the internal financial reports. This hypothesis is supported by the results of the accounting monitoring system (Table 1.).
Table 2: Rating the level of the accounting monitoring system
Levels of the accounting monitoring system Satisfaction of controlling (1 -10)
level of cost centers 5,875 level of divisional organizational units 6,125 level of budgetary centers 6 level of the organizational units 5,5 level of entrepreneurs 6
Source: own creation

REDETE – ECONOMIC DEVELOPMENT AND ENTEREPRENEURSHIP IN TRANSITION ECONOMIES
722
Despite of the general satisfaction with the internal financial reports, when conducting a com-
parative analysis of the accounting monitoring system at different levels, it is evident that the internal financial reports meet only the most basic needs of controlling. Only at the level of divisional organizational units the satisfaction with the accounting monitoring was evaluated as 6.125 (on a scale of 1 to 10), which would mean an average grade, while the accounting monito-ring of the level of budgetary centers and levels of entrepreneurs was rated the grade 6. The level of cost centers meets controlling with the grade 5.875, and the level of organizational units with the grade 5.5. Therefore, the very accounting monitoring of various levels of the company is not at a high level, which means that the observed companies still have plenty of room for improve-ment and development, not only in the Accounting Department, but also in controlling. These results confirm the appointment of the second hypothesis.
The necessary guidance in order to improve the level of accounting monitoring system, and thus the level of financial reporting, with a special emphasis on the internal financial reports, would be reflected in improvements in:
- defining strategies,
- linking strategic and operational plans,
- defining detailed plans,
- cost control and
- measuring performance plans…
5. Conclusive remarks
Based on the results of the research, we may suggest that the companies in the study area do not use modern managerial tools. Further development of the economic business will certainly depend to a large extent on the flexibility of managers and their acceptance of controlling as an essential instrument of any successful management. Introduction of controlling would also mean better preparation of the companies for crisis conditions, especially for prevention. Controlling which rests on the interaction of all departments of the company is successful controlling. The connection between the Controlling and the Accounting Department, as the primary source of data for controlling, brings an insight into a complete state of the company to the management and controller, in the field of planning, execution and control of operations.
Controlling quality primarily depends on the cooperation of managers and controllers, as well as their successful coordination of activities within the system, which is called controllership. This study was conducted in medium and small companies in order to indicate the business functions of controlling and understand the necessity of controlling in modern business. Although it was assumed that the function of controlling would not be significantly represented in small and medium-sized companies, our aim was to identify the existence of these functions in the poorly developed Sibenik – Knin County.
Reference list
1. Anonymous (2008) Hrvatski standardi financijskog izvještavanja, HSFI 1 Financijski izvještaji, Narodne novine d.d., Zagreb, broj 30/2008
2. Anonymous (2010): Rang ljestvica 400 najvećih hrvatskih tvrtki u 2010. + 400 najvećih tvrtki po županijama, Privredni vjesnik godina LVIII, broj 3687, srpanj, 2010.
3. Anthony, R. N. & Dearden, J. & Govindarajan, V. (1992): „Menagement Control Systems“, 7. izdanje, Mc-Grow Hill, New York, 1992.

REDETE – ECONOMIC DEVELOPMENT AND ENTEREPRENEURSHIP IN TRANSITION ECONOMIES
723
4. Buble, M., Cingula, M., Dujanić, M., Dulčić, Ž., Gonan Božac, M., Galetić, L., Ljubić, Pfeig-er, S., Tipurić, D. (2005) Strateški menadžment. Sinergija nakladništvo d.o.o.. Zagreb
5. Frese, E. (1968): „Kontrolle und Unternehmensführung“, Wiesbaden, 1968. 6. Gulin, D., Janković, S., Dražić Lutilsky, I., Perčević, H., Peršić, M. i Vašiček, V. (2011):
Upravljačko računovodstvo, Hrvatska zajednica računovođa i financijskih djelatnika, Zagreb, 2011.
7. Horvath, P. (2006): „Controlling“, 10. Auflage, Verlag Franz Vahlen München, München, 2006.
8. Jelenc, L. (2005) Istraživanje karakteristika klasične škole strateškog menadžmenta u poduze-ćima Primorsko – goranske županije. Ekonomski pregled, Vol.56, No. 11, studeni 2005, Hrvatsko društvo ekonomista c/o Ekonomski institut Zagreb
9. Kuliš, D. (2004) Troškovi ispunjavanja poreznih obveza – trošarina. Financijska teorija i praksa 28 (3), Institut za javne financije, Zagreb
10. Lebefromm, U. (1997): „Controlling – Einführung mit Beispielen aus SAP© ERP©® R/3“ Managmentwiessen für Studium und Praxis, R. Oldenbourg Verlag München, Wien, Oldenbourg, 1997.
11. Luković, T. & Lebefromm, U. (2009): „Controlling – Koncepcija i slučajevi “, Prva knjiga, Sveučilište u Dubrovniku, 2009.
12. Mijoč, I. & Crnković, L. & Martinović, J. (2010): „Pozicioniranje uloge računovodstva u procesu odlučivanja“, Računovodstvo, Upravljačko računovodstvo, 2010.
13. Očko, Jasminka; Švigir, Andreja: (2009) „Kontroling – upravljanje iz backstagea“, Knjiga pring d.o.o., Zagreb, 2009.
14. Osmanagić Bedenik, N. (2003): „Realnost kontrolinga u Hrvatskoj – preliminarni rezultati empirijskog istraživanja“, Zbornik Ekonomskog fakulteta u Zagrebu, god.1, broj 1, Zagreb, 2003.
15. Osmanagić Bedenik, N. (2007): „Kontroling abeceda poslovnog uspjeha“, Školska knjiga d.d., Zagreb, Zagreb, 2007.
16. Osmanagić Bedenik, N.(2010): „Krizni menadžment: Teorija i praksa“, Zbornik Ekonomskog fakulteta u Zagrebu, Vol.8. No.1, lipanj 2010., Zagreb
17. Perčević, H. (2006), „Financijsko planiranje u financijskim institucijama (operativno planiranje – metodologije, sadržaj, faze)“, „Metodološki algoritam sastavljanja i struktura pos-lovnog plana“, Hrvatski institut za bankarstvo i i osiguranje, (specijalistički seminar), Zagreb, 2006.
18. Peršić, M (2009): „Interni obračun i upravljanje troškovima u javnom sektoru“. Izvor: http://crosbi.znanstvenici.hr/datoteka/389089.Persic_javni_sektor_2009.pdf (accessed 05.05.2012)
19. Vašiček, V. et.al. (2011) Upravljačko računovodstvo javnog sektora: Mogućnosti primjene računovodstva troškova u javnom sektoru. U: Gulin, D. i Peršić, M., ur., Upravljačko računovodstvo. Zagreb: Hrvatska zajednica računovođa i financijskih djelatnika

REDETE – ECONOMIC DEVELOPMENT AND ENTEREPRENEURSHIP IN TRANSITION ECONOMIES
724
IMPROVING ACCESS TO FINANCE OF SME’S WITH SUBSIDIZED CREDIT LINES:
THE CASE OF MACEDONIA
Efimija DIMOVSKA315
Abstract
The paper will examine the efficiency of subsidized credit lines implemented by Macedonian Government with a main goal to promote bank lending to SMEs. It will attempt to assess the cost and the impact on the financing constraints of companies.
The starting point of the research is the wide accepted evidence that the SME sector is one of the most important drivers of the economy in each country. SME’s participate with a high per-centage in the GDP generation, new jobs creation, increase of export, innovation of products and services. The share of SME’s in the total number of enterprises almost in all countries is above 95%. For the sake of comparison, The EUROSTAT and member states National Statistics Offices data shows that SMEs account for 99, 8% of all enterprises in the EU and they employ 67% of the labor force in the private sector. The Central Registry official data confirm the same tendency in the Republic of Macedonia, according to which 99,7% of all active companies are SME’s and their share in employment is 80,2%. This refers to the SEE countries as well.
In addition, many studies and research have concluded that access to finance remains to be a major concern and main obstacle for SMEs growth and development in the SEE. The lack of external financing limits the capacity of firm to expand their operation, to improve technology and productivity and even question its continued existence.
Bank loans are the main source of external financing of SMEs in the region. The survey performed by the World Bank and EBRD shows that bank loans represent 40% to nearly 80% of external funds obtained by SMEs in SEE. This situation is mainly due to the growing banking sector in the past several years and undeveloped capital markets and equity finance.
However, there are many factors as higher administrative costs and risks involved in lending to SMEs that reduce banks’ willingness to lend to them. Also, lack of collateral and borrower information is frequently reason for credit rejection.
Therefore, many governments have acknowledged the importance of implementing various policies and programs aimed to support SMEs and their development, particularly in the time of global financial crises.
Yet, evaluation and impact assessment of implemented government programs in general is lacking and the effectiveness of such credit schemes has not been demonstrated.
Keywords: access to finance, SMEs, subsidized credit lines
315 FON University, Bul. Vojvodina bb, 1000 Skopje, R. Macedonia. [email protected]

REDETE – ECONOMIC DEVELOPMENT AND ENTEREPRENEURSHIP IN TRANSITION ECONOMIES
725
1. Introduction
SME sector is one of the most important drivers of the economy in each country. The SMEs possibility to develop and to create new jobs becomes a crucial prerequisite for econo-mic growth and development. The SMEs in different countries have different financing possi-bilities, depending on countries’ specific characteristics of the financial system and the busi-ness environment. The structure of SMEs’ financing is depending on both demand and supply side factors. The reasons for a market failure relate to insufficient supply of capital and inade-quacies on the demand side. In the presence of market imperfections, any financing limita-tions will reflect on SMEs’ investments. The lack of external financing limits the capacity of firm to expand their operation, to improve technology and productivity and even question its continued existence. Bank loans are the main source of external financing of SMEs in Mace-donia and in many other developing and developed countries. However, there are many fac-tors as higher administrative costs and risks involved in lending to SMEs that reduce banks’ willingness to lend to them. Also, lack of collateral and borrower information is frequently reason for credit rejection. Therefore, many governments have acknowledged the importance of implementing various policies and programs aimed to support SMEs and their deve-lopment, particularly in the time of global financial crises. However, evaluation and impact assessment of implemented government programs in general is lacking.
2. SME definition
The term “SME” involve various definitions, which differs from country to country. In situ-ation when there is no universally accepted definition, the most common classification criteria used by different organizations and countries are the number of employees, sales or assets.
In the case of European Union, in May 2003 European Commission has adopted the Recommendation 2003/361/EC, according to which enterprises are classified as micro, small and medium. The main goal of this definition is to make a clear distinction between independent and affiliated enterprises for the purpose of appropriate allocation of state aid funds for SME’s. (European Commission, 2003)
Taking in consideration the aspiration of the Western Balkan countries for European Union integration, there is an ongoing process of approximation of the national legislative to the EU regulation. Therefore, most of the countries in the region have applied the EU SME definition, but only for the criteria “number of employees”, while each country has its own specific criteria concerning the annual turnover and balance sheet, in compliance with their economic condition. The classification of enterprises in the Republic of Macedonia is regulated with the Company Law, according to the number of employees, annual turnover and total assets. (Official Journal of the RM, 2004)

REDETE – ECONOMIC DEVELOPMENT AND ENTEREPRENEURSHIP IN TRANSITION ECONOMIES
726
Тable 1: Classification of enterprises in different countries
Country Category of enterprises
Number of employees
Annual Turnover
Total Assets
European Union Micro < 10 ≤ 2 million EUR ≤ 2 million EUR Small < 50 ≤ 10 million EUR ≤ 10 million EUR
Medium < 250 ≤ 50 million EUR ≤ 43 million EUR
Macedonia Micro < 10 < 50.000 EUR
Maximum 80% of gross income to be
from one client/buyer Small < 50 < 2 million EUR < 2 million EUR
Medium < 250 < 10 million EUR < 11 million EUR
Bosnia and Herzegovina
Micro < 10 N/A N/A Small < 50 < 2 million EUR < 1 million EUR
Medium < 250 < 10 million EUR < 5 million EUR
Croatia Micro < 10 < 2 million EUR < 1 million EUR Small < 50 < 8 million EUR < 4 million EUR
Medium < 250 < 30 million EUR < 15 million EUR Source: European Commission; Company Law of the RM; Small and Medium-Size Enterprise Development
in BH 2009-2011; SME Report for Croatia 2011
3. Role and importance of the SMEs
Small and medium enterprises play an important role in a country’s economy. They are crucial for economic development, particularly in emerging markets. The evidence shows that over 95% of all registered companies across the world are SMEs. This number is even higher in the Euro-pean Union, where SMEs represent 99, 8% of all businesses, out of which 92, 1% are micro business with less than 10 employees. (Wymenga, Spanikova, Derbyshire, Barker, 2011, p.9)
SME sector makes a critical contribution to GDP and employment in both developed and developing countries. In terms of employment, 67% of all job places in the European private sector are within the SME sector. European Commission has published a study regarding the SME role in creation of new job places. (Kok, Vroonhof, Verhoeven, Timmermans, Kwaak, Snijders, Zoetermeer, 2011)
The results of the analysis shows that in period 2002-2010, 85% of the newly created jobs where in the SME sector, which is a higher figure comparing to the a.m. SMEs share of 67% of all jobs in EU. Regarding the SME contribution to the GDP creation, their importance is not lesser, achieving nearly 60%.
The position of the SME sector in the Republic of Macedonia is similar to EU. Namely, the data from the Central Register of the Republic of Macedonia for the period 2006-2010 show continuous enlargement of the officially registered enterprises.

REDETE – ECONOMIC DEVELOPMENT AND ENTEREPRENEURSHIP IN TRANSITION ECONOMIES
727
Figure 1. Number of registered and active companies in RM for the period 2006-2010
Source: Central Register of the RM
However, there is a significant difference between registered and active companies. The active
companies are contributing to the economic growth with their realized income, employments, taxes paid to the government, etc. The biggest part of the active enterprises in the Republic of Macedonia, or 99, 71%, is the SMEs.
Figure 2. Share of employments by company size in 2010
Source: Central Register of the RM
SME sector in Macedonia participate with 80, 2% of total employments, while 19, 8% of
employments are in the big companies. These data provide evidence of the SMEs importance for the entire economy. Contribution of SMEs to the creation of the GDP in Macedonia in 2010 is around 64% . (State Statistic Office, 2012)

REDETE – ECONOMIC DEVELOPMENT AND ENTEREPRENEURSHIP IN TRANSITION ECONOMIES
728
4. Access to finance: is there a problem?
Despite the importance of SMEs for the economic growth and jobs creation, their formation, survival and development is often troubled by several obstacles.
Various researches around the developing world provide evidence that SMEs face greater financing obstacles than large firms. (Beck, Demirgüç-Kunt & Maksimovic 2005; Beck & Demirgüç-Kunt 2006; and Beck, Demirgüç-Kunt, Laeven, Maksimovic 2006)
World Bank, in cooperation with the European Bank for Restructuring and Development, in 2009 has conducted a detail survey called Business Environment and Enterprise Performance Survey – BEEPS. The survey was made on a representative sample of enterprises through direct interviews. The topics covered in the survey include finance, infrastructure, trade, taxes and busi-ness licensing, regulations, corruption, crime and informality, innovation, labor, and perceptions about obstacles to doing business. (World Bank, 2010)
According to this survey, 26, 9 % of the interviewed Macedonian firms identified access to fi-nance as their major obstacle for doing business, which is the second ranked obstacle, after informal economy.
Figure 3. Percentage of firms that identified access to finance as the biggest obstacle for their operation
Source: Business Environment and Enterprise Performance Surveys-BEEPS, 2010
From the graph above it can be concluded that Macedonian enterprise have bigger financial
problems, comparing to the other analyzed countries. The general results of this survey confirm the weak institutional and legal framework in Macedonia, which enhance the financing obstacles for Macedonian SMEs. It must be noted that this obstacles are intensified with the world eco-nomic and financial crises.
4. Sources of financing
External sources of financing are critical component for the enterprise growth. Different analysis conducted in the Western Balkan countries demonstrates the domination of the banking sector comparing to other external sources.

REDETE – ECONOMIC DEVELOPMENT AND ENTEREPRENEURSHIP IN TRANSITION ECONOMIES
729
The analysis carried out by World Bank and EBRD (World Bank, 2010) shows that the most frequently used source for the planned investments of SMEs in Western Balkan countries are internal funds (71, 8%). As a second source are banking loans (15, 4%), while the percentage of investments financed by equity funds, leasing and other alternative sources of financing is very low, comparing to the developed market economies. This survey shows that bank loans represent 40% to nearly 80% of external funds obtained by SMEs in SEE. This situation is mainly due to the growing banking sector in the past several years and undeveloped capital markets and equity finance.
Figure 4: Structure of financing sources (%)
Source: Business Environment and Enterprise Performance Surveys –BEEPS, 2010
Within a USAID financed project - Business Environment Activity, a research was conducted
by the Center for Economic Analysis–Skopje, in order to assess the available forms of financing of companies in Macedonia. The survey was done on a representative sample of 50 enterprises, and the results showed that 76% of interviewed companies use bank loans to finance their operation, while other alternative sources of financing (capital markets, equity funds, etc.) are not used at all. (CEA, 2007)
Therefore the further analysis concerning the financing issue of SMEs should be focused on banking sector. However, there are many factors that reduce banks’ willingness to lend to them.
The economics literature on enterprise financing has identified few main reasons why banks are often reluctant and avoid lending to an SME: (Zavatta, 2008)
1. The information asymmetry that exists between small businesses and lenders, or outside investors i.e. lack of relevant financial information, credit history etc.
2. The high risks involved in lending to the SME, associated with small scale activities, high failure rates, low capitalization and exposure to market risks, because they operate in a more competitive environment.
3. The high transaction costs in administrating SME loans.
4. The lack of collateral that usually characterizes SMEs, which may have little or no assets that can be used as collateral.
5. The lack of bank’s capacity and skills to conduct a credit determine whether the borrower possesses the technical, managerial and marketing skills to generate adequate cash.

REDETE – ECONOMIC DEVELOPMENT AND ENTEREPRENEURSHIP IN TRANSITION ECONOMIES
730
In developing countries, such as Macedonia, these problems are often worsened by institutio-
nal factors, such weak creditors’ rights and protection, weak judicial system and bankruptcy pro-cedures, lack of information infrastructure, etc.
5. Role of the Government
The question is whether the Government should undertake measures to mitigate the problem that SMEs are facing in obtaining finances for their activities? In the economic literature exist different theories and opinions. (See Stiglitz, 1994; Klapper and Zaidi, 2005) Public intervention may be considered justified where market is failing to provide the required financing necessary for the less-favoured sectors, regions or clients. In addition intervention by the public authorities is needed to mitigate the effects from certain external shocks, i.e. to assists a certain sector affected by this negative impact. As already mentioned, there is market imperfection due to which Macedonian SMEs have problems in access to finance. Furthermore, the world economic and financial crisis from 2008 is certainly that kind of external shock, causing negative effects to the Macedonian SMEs. This gives good reason for the Government to intervene.
The other question is what form such intervention should take: interest-rate subsidies, guaran-tees, loans, equity financing or something different?
6. Macedonian case: EIB credit line
As a response to the economic and financial crises the Government of the Republic of Macedonia in 2009 has decides to apply for a loan from the European Investment Bank to increase the available capital for Macedonian companies, and to mitigate the negative effects of the crisis in the Macedonian banking sector. EIB has provided similar loans for SMEs and priority projects in other SEE countries: Croatia, Serbia, Montenegro, Bosnia and Herzegovina, Turkey and Albania. In the time of crisis banks have become even more conservative in loan approval, which worsen already difficult financial situation of the SME sector.
The Financing Agreement for SME credit line in amount of 100 million EUR was signed between Macedonian Bank for Development Promotion - MBDP and EIB. MBDP is the only development state-owned bank in the RM, established in 1998 under the specific Law on establishment of MBDP (Official Journal 24/98, 6/2000, 109/2005, 130/2008, 105/2009), with main mission to provide financing support to SMEs and to support national economic strategies and objectives.
The credit line was disbursed through intermediary banks, contracted by MBDP, which has onlended the funds to the final beneficiaries. The total amount of the credit line was fully disbursed by April 2011. (MBDP, 2011)
The credit conditions applied for the final beneficiaries have been changed several times since the project start-up, meeting their demands, yet in line with EIB requirements. The final criteria were as follows:
- 100% financing by the EIB funds for SMEs and co-financing up to 50% in partnership with the local commercial banks for priority projects.
- Interest rate of 5, 5% p.a. for the final beneficiaries.
- Purpose: investments, permanent working capital and priority projects
- Target group: SME’s and all registered enterprises under the Law on trade companies for the priority projects only.

REDETE – ECONOMIC DEVELOPMENT AND ENTEREPRENEURSHIP IN TRANSITION ECONOMIES
731
- Maximum amount of 3, 5 million EUR per loan for SMEs and 12, 5 million EUR per loan for priority projects.
- Repayment period up to 5 years for investment loans, up to 3 years for loans for permanent working capital and up to 15 years for priority projects, with grace period from 6 to 12 months.
- Collateral is defined by each participating bank, according to their credit policy.
This credit line was withdrawn earlier than projected due to the big demand of the
SME sector for the EIB loans. The following table presents the structure of the EIB credit line portfolio by three characteristic: target group, purpose and sector.
Table 2: Portfolio structure
Number of financed projects (%)
Disbursed amount (%)
By target group SMEs 97 89 Big enterprises 3 11 By loan purpose Investment loans N/A 24 Permanent working capital N/A 57 Priority projects 3 19 By sectors Production 53 61 Construction 8 7 Trade 23 18 Transport 2 3 Health 6 4 Hotels/Restaurants 6 2 Other 4 6
Source: MBDP, 2011
The structure of the EIB loan portfolio in terms of the loan purpose shows that 57% of the dis-
bursed amount is for working capital, which reflects the situation in the Macedonian economy. As a result of the economic crisis SMEs in Macedonia are facing a big problem with their liquidity. Regarding the structure by sector, the biggest percent of the funds (61%) were invested in production companies.
The total number of financed project with the EIB100 million EUR credit line is 306, out of which 97% are SMEs projects, and only 3% are for big companies. According to the MBDP data, collected from the final beneficiaries, this credit line has supported creation/retention of 2.140 jobs.
The EIB credit line represents a model of indirect interest rate subsidies on commercial loans extended to SMEs. The interest rate subsidy is technically realized by providing funds to comer-cial banks at low rates and these low rates are then passed on to SMEs through lower interest rates on the commercial loans approved by these banks.
For the funds onlended to intermediary banks MBDP is charging 1% p.a. on outstanding balan-ce. As described above, the intention of the Government with this credit line was to provide additional credit funds under favorable conditions for the final beneficiaries. Therefore, in the agreements signed between MBDP and intermediary banks the interest rate for the borrowers is fixed at 5, 5% p.a.
On the other hand, MBDP is obliged to repay this loan to EIB using flexible interest rate based on 3-months Euribor under the Financing Agreement and calculated on the outstanding balance of

REDETE – ECONOMIC DEVELOPMENT AND ENTEREPRENEURSHIP IN TRANSITION ECONOMIES
732
each tranche. The likely mismatch of the earned interest from the banks and due repayment obligation to the EIB is financed with Government budget funds..
The full loan amount was withdrawn in nine tranches starting in December 2009, and the last tranche was withdrawn in April 2011. For each tranche different interest rate is applied. In the graph bellow we can see that in the past three years the Euribor rate has a downward trend, and the rate is equal or minor comparing to the interest rate charged to the banks.
Figure 5: Euribor rates by year (%)
Source: http://www.euribor-rates.eu/
That implies low amount of budget funds used for servicing the EIB loan, or practically no cost
for the Government. It must be noted that despite the favorable credit conditions, EIB loans are commercially app-
roved loans to beneficiaries with good credit history and good cash flow that ensures timely repayment of the installments. Up to date, there is no systematic data collected from participating banks regarding the repayment rate of the EIB loans, yet it is recommendable for the MBDP to follow the quality of the EIB portfolio and if necessary to adjust credit line criteria, in cooperation with EIB. Banks are expected to become even more reluctant to lend to SMEs if repayment of the loans deteriorates.
Subsequent to the fast disbursement of this credit instrument, and deepening the problems of the SMEs as a result of the on-going crisis in the Euro zone, EIB has approved two additional cre-dit lines to Macedonia, one in October 2011 in amount of 50 million EUR and the second in July 2012 in amount of 100 million EUR. (EIB, 2012) The criteria are very similar to the first EIB credit line, and the only significant change is the increase of the repayment period for the investment loans to 8 years with 2 years of grace period, and for the working capital to 3 years with 6 month of grace period. (MBDP, 2012)
7. Research
In order to explore the supply side factors i.e. banks’ experience and policies in lending to SMEs and to evaluate the impact of the EIB 100 million credit line on participating banks, a survey was carried out on six banks that are contracted by MBDP for servicing the EIB credit line. The selected banks account for about 75% of total assets in the banking sector in Macedonia and 86% of the total EIB portfolio. The survey was conducted in the period July – September 2012 using a questionnaire of multiple choice questions that was sent by e-mail to responsible managers for SMEs lending in the respective bank.

REDETE – ECONOMIC DEVELOPMENT AND ENTEREPRENEURSHIP IN TRANSITION ECONOMIES
733
The answers on the first question “What is the most common purpose of the loans approved to SMEs?” shows that majority of the loans at 50% of the interviewed banks are for investments and working capital, 33,3% responded that majority of their loans are only for working capital, while 16,67% chose solving of liquidity issues. The answers are in correspondence with the structure of the EIB loans, where the working capital loans are dominating, mainly as a result of the crisis that negatively affected SMEs operations.
On the second question “What is the most used source of financing for SMEs loans?” there are very interesting results. Namely, 100% of the banks answered that majority of their SMEs loans are financed from their own sources, not from MBDP credit lines or other international financial institutions credit lines. Probably this is not so surprising, if we take in consideration that Macedonian banks remained very liquid and capitalized even in the time of crisis. The average capital adequacy ratio of the banking sector as of 31.03.2012 is 17, 5%, which is almost double then the legally required minimum of 8%. (NBRM, 2012)
Concerning the problems that banks are facing in providing loans to SMEs, banks were asked to rank given problems and the results shows that the key problem for the banks is lack of adequate and acceptable loan requests, followed by macroeconomic factors and specifics of the SME sector (high risk, no collateral, high transaction cost). This complies with the situation of overdebtness that companies are facing and continued increase of the nonfunctional loans on the level of the banking sector.
Regarding the necessity and type of public intervention, the opinion of the respondents is that the most positive impact is expected from establishing a public guarantee funds (83%), second are specifically targeted credit lines (to a certain priority sector), while interest rate subsidy is ranked on a third place.
In order to measure the impact of the cooperation with the MBDP, the banks were asked to evaluate the influence regarding the total SME portfolio. 50% answered that their cooperation with MBDP has a positive effect (increase) on their total SME portfolio, while 50% stated that there is no influence.
On the question “What is the influence of the cooperation with MBDP on the interest of new SME clients to apply for a loan in your bank?”, 66% answered that there is a positive influence, while 34% said that there is no influence.
Regarding the influence on the credit conditions, 50% of the banks stated that participation in the MBDP credit lines has positive influence on improvement of the credit conditions applied to their SME loans. Nevertheless, it must be noted that lower interest rate is defined in the contract between MBDP and the bank, and it shouldn’t be taken in consideration when evaluating the impact on credit conditions.
8. Conclusion
Appropriate, tailor made, commercially driven public measures in place will help to mitigate the market imperfections and weaknesses in SMEs’ access to finance not only in times of crisis but on an on-going basis as a fundamental structural issue. Design of subsidized financial products, targeting strategic sectors, should be considered as one of the solutions to overcome the problems in obtaining necessary finance. Indirect interest subsidies do not violate the WTO Agreement on Subsidies and Countervailing Measures and they are classified as a voluntary compromise by the participating banks in order to expand their outreach.
Another advantage, which is of great importance, is the low cost for the Government for implementation of such onlending activities. Even if the reference rate for calculating the interest (Euribor) increases, still the budget participation is not going to increase significantly. While initially offering incentives to participating financial institutions to expand their SME lending, the long-term objective of these interventions should be that banks would increasingly start to con-

REDETE – ECONOMIC DEVELOPMENT AND ENTEREPRENEURSHIP IN TRANSITION ECONOMIES
734
sider SMEs as part of their mainstream clientele that would in the future be served wholly with the banks’ own recourses.
EIB credit line is the most favorable credit line for SMEs on the financial market in Macedonia. Nevertheless, with the first EIB 100 million credit line MBDP has onlended only 297 loans to SMEs which is 0,4% of active SMEs in Macedonia. This data point to certain situation that needs to be further closely reviewed. Is there a clear strategy in directing this subsidized credit funds?
In order to complete the impact assessment, monitoring on the loan quality should be estab-lished by MBDP/Government and detailed survey on beneficiaries should be conducted to evaluate the effects of the EIB loan on their operations.
Reference list
1. Beck, T. , Demirgüç-Kunt, A. (2006). Small and Medium-Size Enterprises: Access to 2. Finance as Growth Constraint. Journal of Banking and Finance. 30, pp 2931-43 3. Beck, T., Demirgüç-Kunt, A., Maksimovic V. (2005). Financial and Legal Constraints 4. to Firm Growth: Does Firm Size Matter? Journal of Finance. 60 (1), pp 137–77 5. Beck, T., Demirgüç-Kunt. A, Laeven, L., Maksimovic, V. (2006). The Determinants 6. of Financing Obstacles. Journal of International Money and Finance. 25 7. Center for Economic Analysis - CEA. (2007). Financing through borrowing or equity 8. finance, pp 6 9. Central Register of the Republic of Macedonia. (2011). Official data. 10. Company Law. Official Journal of the Republic of Macedonia no. 28/04 11. European Commission.(2003). Commission Recommendation of 6 May 2003 12. concerning the definition of micro, small and medium-sized enterprises (2003/361/EC).
Official Journal of the European Union 13. European Commission (2012). 14. http://ec.europa.eu/enterprise/policies/sme/facts-figures analysis/sme-
definition/index_en.htm (accessed 27.07.2012) 15. European Investment Bank. (2012). 16. www.eib.org/projects/loans/regions/enlargement/mk.htm (accessed 31.08.2012) 17. Klapper, L., Zaidi, R. (2005). A Survey of Government Regulation and Intervention in 18. Financial Markets - Prepared for the World Development Report 2005: Improving the
Investment Climate for Growth and Poverty Reduction, pp 15-20 19. Kok, J., Vroonhof, P., Verhoeven, W., Timmermans, N., Kwaak, T., Snijders, J., 20. Florieke , Zoetermeer, W. (2011) Do SMEs create more and better jobs? 21. http://ec.europa.eu/enterprise/policies/sme/facts-figures-analysis/performance-
review/pdf/do-smes-create-more-and-better-jobs_en.pdf(accessed 16.06.2012) 22. Macedonian Bank for Development Promotion. (2011). Information on EIB 100 23. million credit line. 24. Macedonian Bank for Development Promotion. (2012). 25. http://www.mbdp.com.mk/index.php/mk/kreditiranje/msp (accessed 03.09.2012) 26. National Bank of the Republic of Macedonia (2012). Indicators on the banking 27. system of the Republic of Macedonia as of 31.03.2012.
http://www.nbrm.mk/?ItemID=3094889810EE20458F9308EAEB1ABC83 (accessed 03.06.2012)
28. Small and Medium-Size Enterprise Development in BH 2009-2011. (2009) 29. SMEs and Entrepreneurship Policy Center. (2011). SME Report for Croatia 2011, pp 30. 11- 13. http://www.cepor.hr/projekti/SME_godisnjak_ENG.PDF (accessed 03.07.2012) 31. State Statistic Office. (2012). Gross Domestic Product 2010, 3.4.12.01/710.

REDETE – ECONOMIC DEVELOPMENT AND ENTEREPRENEURSHIP IN TRANSITION ECONOMIES
735
32. Stiglitz, J. (1994). The Role of the State in the Financial Markets, pp 28 33. World Bank. (2010). Business Environment and Enterprise Performance Surveys - BEEPS.
http://www.enterprisesurveys.org/CustomQuery (accessed 34. 15.06.2012) 35. World Bank. (2010). BEEPS at-a-glance 2010 FYR Macedonia. 36. http://siteresources.worldbank.org/INTECAREGTOPANTCOR/Resources/704589126
7561320871/FYR_Macedonia_2010.pdf (accessed 24.04.2012) 37. Wymenga, P., Spanikova, V., Derbyshire, J., Barker, A. (2011). Are EU SMEs 38. recovering? Annual Report on EU SMEs 2010/2011, pp 9
http://ec.europa.eu/enterprise/policies/sme/facts-figures-analysis/performance-review/files/supporting-documents/2010-2011/annual-report en.pdf (accessed 05.06.2012)
39. Zavatta, R. (2008). Financing Technology Entrepreneurs and SMEs in Developing Countries. infoDev / World Bank. http://www.infodev.org/publications
40. (accessed 15.07.2012)

REDETE – ECONOMIC DEVELOPMENT AND ENTEREPRENEURSHIP IN TRANSITION ECONOMIES
736
MICROCREDITING AS A FACTOR IN DEVELOPMENT OF SMALL BUSINESS IN BOSNIA IN HERZEGOVINA
Zoran NAJDANOVIĆ316
Neven ŠIPIĆ317
Abstract
After the collapse of financial markets and real estate markets in USA, the impact of the global economic crisis was soon reflected in the rest of the world. With the problems of some of EU members, long-term aid couldn't be expected even from the most powerful EU countries pressed by the problems of the troubled states. Without stable long-term financial system, deve-lopment of domestic economy couldn't be expected, especially if we know that the financial industry is always looking for higher profits ie return of equity, and has a tendency to downgra-de incoming country economies by financing imports and trade in goods in favour of its domes-tic industry ie country of origin. Thus, the main development factor of domestic industry and small business is stable and liquid financial system which is strategically focused in financing production, not consumption. Consumption needs to be financed ie credited, but only when it comes to cases of purchase goods and services from local manufacturers and service providers. On the example of some transition countries, we will investigate the consequences of leaving a large part of the financial system in the hands of foreign owners that can not be conditional on the terms of who to fund, therefore not able to pursue development projects of particular industries. Fifteen years ago micro crediting sector experienced a great development, that was carried out, depending of the state, under similar conditions as the institution organisational savings and credit cooperatives, credit unions, micro-credit organisations, foundations etc. The primary role in the fight against the world poverty was access to financial markets for those who didn't have it and self-employment. Due to world economic crisis, in the last few years the needs for microfinancing have became more pronounced, even in developed countries of EU, not only in third world countries where microfinance model was born in late seventies. Due to these facts, EU commission in the terms of microcredit defined the amount of microcredit not to exceed 25k € per user. Furthermore the European Commission (EC) and European Investment Bank (EIB) through the European Investment Fund (EIF) supported and financed development of microcredit for all member states and candidates for EU. According to the World Bank in 2008 only 18% of the adult population in BiH had access to the financial sector, while the rest of the population was not able to fund own entrepreneurial projects. The main role of microcre-dit institutions is providing a full range of microcredit services, from poor people, unemployed to small and medium business who have needs for more flexible and individualised service conditions ie economically active population that attempts to activate, but banks didn't show any interest. We will present the results of primary research conducted on the entire territory of BiH, on a representative sample of 1152 respondents without access to banking market ie their preferences and willingness for establishing private business if the financing was allowed.
Keywords: microcredits, entrepreneur, bank, crisis
316 Visoka poslovna škola Zagreb, Ulica grada Vukovara 68, Zagreb, [email protected] 317 Visoka poslovna škola Zagreb, Ulica grada Vukovara 68, Zagreb

REDETE – ECONOMIC DEVELOPMENT AND ENTEREPRENEURSHIP IN TRANSITION ECONOMIES
737
The Definition of Microcredit Organisations
Micro-crediting is commonly used as a term for providing financial services to clients with low incomes and for those below the poverty line. The term is ingrained to small amount credits for users that are unemployed, self-employed or entrepreneurial beginners that do not have steady incomes and who cannot qualify for a classic bank loan.
Microcredit organisations do not only deal with loans, but also offer savings services, insurance, money transfer, etc. Microcredit institutions are not banks, nor direct competitions to banks. Instead, they are institutions whose business is directed towards the population segment that does not meet the terms of loan capability in the banking system. Microcredit institutions, unlike banks, finance the most vulnerable population, which are people with low, irregular inco-mes or no incomes at all. Major role of micro financing is financing beginners’ projects from the start for people who do not have an access to classic banking market.
Micro crediting has been flourished in the last thirty years, from the 1970s when professor Yunus started the project of financing women and their trades in Bangladesh. In the coming years and decades, the project spread throughout the world, and has become one of the instrumental ways of lowering world poverty. Currently, more than 5% of the world’s poor is financed through micro crediting.
The European Commission (EC) set the maximum amount of a microcredit to 25.000 Euros, while member countries of the European Union can individually lower the maximum loan amount depending on the GDP level of the country compared with EU's average.
European Union is also trying to reduce poverty using micro-crediting, because 25% of the Western Europe's population do not have an access to formal banking market.
Microcredit organisations finance their users in phases, that is, after every loan is repaid, the client’s credit level gets better and is able to get a bigger loan with better terms. Between 60 and 70% of microcredit users take new larger loans from microcredit organisations, after repaying the first one. More than 98% of microcredit users are regular in their loan payments, and after few microcredit cycles and getting steady incomes, users become credit capable for larger bank loans.
Microcredit Organisations in the EU and the World
Looking from a historical perspective, micro-financing emerged in the 17th century Ireland. Jonathan Smith devised a project of giving loans to craftsmen to develop their businesses and/or as an aid in financial troubles. Preceding today’s guarantors, the loans were usually guaranteed by neighbours who would ensure banks of the integrity and working ethics of the borrower, in order to ensure creditworthiness.
A century after Smith's first microcredit loans, a social reformer Friedrich Wilheim Raiffeisen emerges in Germany as a pioneer in micro-crediting. He united many village credit unions into a single agricultural bank made of farmers and business owners from surrounding villages. Small loans that were taken were guaranteed to be repaid by the mother credit union as a guarantor. Certain members would guarantee for other members that were borrowing from Raiffaisen bank.
Micro-crediting as a term implies financial services: micro-credits, micro-insurances, bank accounts and savings. The success of micro-crediting in the world as a model for fighting poverty, access to the financial services and self-employment, in applied to the EU in the beginning of 2000. as an initiative from both public and private sector. A quote from EU resolution on micro crediting:
“The success of European initiative on micro-crediting can significantly help in achieving the goals of revised Lisbon strategy on growth, employment, and making innovative, creative and dynamic European economy.”

REDETE – ECONOMIC DEVELOPMENT AND ENTEREPRENEURSHIP IN TRANSITION ECONOMIES
738
The need for micro-crediting is even more needed due to the world financial crisis. There is a trend of downscaling financial services in the world. Most of the countries in the EU have commercial banks, cooperative banks, micro banks, savings & credit union banks and micro fi-nancial institutions.
EC (European Commission) and EIB (European Investment bank) use EIF (European Investment fund) to finance and support the growth of micro-crediting in all member and candidate countries of the European Union.
The most important programmes that are financed by EC and EIB in micro-crediting are:
The European Progress Microfinance Facility (EPMF) EC and the European parliament made this programme in March 2010 for the purpose of
employment and social involvement with focus on the development of micro-financing as an instrument for employment, self-employment, and social cohesion.
EC and EIB ensured 500 mil. € for the start of this programme. It is estimated that 2 billion € will be invested in this programme.
This programme offers 2 types of products: -Guarantees for microcredit organisations as high as 75% of given loans for the population that
does not have an access to the banking sector. -Financing microcredit organisations (crediting with affordable rates or investment in basic
capital) Competitiveness and Innovation Programme (2007-2013) In mid-2011, EC through EIF ensured 470 mil. € MFI guarantees (Micro financial institutions)
for micro-crediting in EU. Joint European Resources for Micro to Medium Enterprises initiative (JEREMIE) The goal of this initiative is to improve access to micro-credits for small businesses through the
European Regional Development Funds (ERDF). Micro-crediting in Bulgaria, Greece, Italy and European Fund for South-Easter Europe (EFSE) was done through this fund. This fund is intended to finance micro and small businesses and self-employing poor families. 80% of 579 mil. € is invested in micro and macro entrepreneurship.
Joint Action to Support Microfinance Institutions in Europe (JASMINE) EC started financing this programme through EIF in 2008. Funds are primarily intended for
technical equipping and professional training of micro-institution staff. This programme will last for few more years. Professional seminars are frequently organised for about thirty MFIs from all-over Europe.

REDETE – ECONOMIC DEVELOPMENT AND ENTEREPRENEURSHIP IN TRANSITION ECONOMIES
739
Graph 1: Access to financial services (World bank data for 2008)
Microcredit Organisations in Bosnia and Herzegovina
The history of micro crediting in Bosnia and Herzegovina encompasses period after the war, that is, from the mid 1990s. In Bosnia and Herzegovina, as well as in other countries of the ex-Yugoslavia, the role and function of micro-crediting was not properly regulated by law.
Beginning of 2000 brings laws regulating the business of micro-crediting organisations, while the last legislative amendment was in 2006. Laws and regulations made a clear classification distinction among micro-organisations, based on the reason the organisation is created. It can be established as a capital society (an actionary company or a company with limited responsibility) or a microcredit foundation, according to the law of alliances and foundations.
Classification is important because both microcredit companies and microcredit institutions can give loans to the public with no demographical limitations.
Currently, more than 10.4% of population uses microcredit organisations’ services. It represents a large market share in absolute numbers, but from the aspect of population’s access to banking market of just 19%, there is more than enough space and opportunity for more microcredit organisations. One should not exclude the arrival of foreign banks, which will come as soon as the conditions (legal security, especially with property ownership; dawdle of courts, etc.) are met.
The law that oversees microcredit organisations from 2006 allowed microcredit foundations a maximum loan amount for an individual client (with associated parties) of 10.000 (ten thousand) KM, while microcredit companies are allowed 50.000 (fifty thousand). There is also a difference in the constituting capital: microcredit foundations must have a minimum of 50.000 KM, while microcredit companies must have a minimum of 500.000 KM to open up a business.
The amount of initial founding capital of microcredit institutions represents one of the highest constituting capital costs in the EU. The flaw of the law is that microcredit company is not depository, that is, it cannot collect savings from citizens and firms.
High capital demand and a system of high security in banking business together with quality surveillance and overseeing from regulatory agencies will inevitably creating a healthy financial system.
Legislative is set extremely good, even though there were some foreclosures and collapses of few microcredit organisations. If there were any errors, they can be attributed to supervisory bodies that did not react to eventual errors in time and ultimately left big exposure to risk.

REDETE – ECONOMIC DEVELOPMENT AND ENTEREPRENEURSHIP IN TRANSITION ECONOMIES
740
It would be more efficient if microcredit organisations are intermediaries between units with monetary surplus and units with money deficit, units being physical or legal. Collecting savings is tricky because it can make a domino effect in the entire system when only one savings-deposit institution collapses. Of course, with changes in risk management and adequate control, that is the only way to resist competition of present foreign financial institutions.
The last statement questions why foreign banks, which are registered in Bosnia and Herzego-vina, can collect savings from the people, and if they go bankrupt, state agencies must cover their losses from country’s budget, while microcredit institutions cannot be depositary institutions. Even bigger paradox is when those same microcredit institutions get loans in local banks with foreign ownership where local population saves their money with low interest, and then those banks loan money to microcredit institution at higher interest rates, making that money end up as a neighbour’s loan from those bank depositors. With little intervention in legislative regulations and more surveillance, if microcredit organisations were to become depository institutions, the price of money for the end users would be notably lower, which would be a significant relief for their business.
Graph 2: The development of microcredit organisations between 2003 and 2010 based on number of borrowers and gross credit portfolio:
Research on Representation and Supply of Microcredit Institutions in the Republic of Bosnia and Herzegovina
Graph 3: The Size of Portfolio in KM

Tab
le 1
: T
he L
ist o
f MK
O o
n T
erri
tory
of B
osni
a an
d H
erze
govi
na (
Fed
erat
ion
or R
S)
N
aziv
O
blik
P
odručj
e po
slov
anja
Sj
ediš
te
Br.
P
oslo
vnic
a Z
apos
leni
h B
r.
Kre
d.
pr.
Izno
s kr
edit
a K
M
Rok
ot
plat
e u
m
j.
Žir
anti
ili
Gar
anci
ja
Nak
nada
za
kre
dit
EK
S.
Nom
. K
S
Br.
A
ktiv
nih
ko
risn
ika
Vel
ičin
a kr
edit
nih
po
rtfe
lja u
$
Rb
Min
M
ax
Min
M
ax
1 M
ikro
fin
MK
D
FE
D i
RS
B
anja
L
uka
60
- 13
30
0 50
.000
6-
60
> 5
000
*
17,9
4%
22,0
8%
17%
-20%
>
100
.000
12
3.47
5.72
1
2 S
iner
gija
pl
us
MK
D
RS
B
anja
L
uka
17
- 7
3.00
0 30
.000
36
-60
1-2
žira
nta
1,50
%
- -
14,
5%-
22,5
%
10.0
00
32.6
32.2
17
3 Z
drav
o M
KD
R
S
Ban
ja
Luk
a 5
- 8
- -
- -
- -
- -
- -
4 M
ikro
kred
it
Srb
ac
MK
F
FED
S
rbac
-
- -
- -
- -
- -
- -
- -
5 M
icro
cre
dit
offi
ce
- -
- -
- -
- -
- S
tand
ardn
a ga
ranc
ija
- -
- -
- -
6 A
lfa-
plus
-
- -
- -
- -
- -
- -
- -
- -
-
7 N
ova
- -
- -
- -
- -
- -
- -
- -
- -
8 A
dria
mik
ro
d.o.
o.
MK
D
FED
M
osta
r 2
- 2
5.00
0 50
.000
3-
36
Gar
anci
ja
**
- -
- -
509
857.
534
9 B
osan
sko
selo
M
KF
-
- -
- -
- -
- -
- -
- -
- -
10
EK
I M
KF
F
ED
i R
S
- 66
28
0 6
300
10.0
00
1-66
G
aran
cija
**
2%
-2,5
%
23,0
3%
30,5
2%
20%
-25%
41
.605
75.2
58.4
21
11
Lid
er
MK
F
FE
D
Sar
ajev
o 10
-
- -
- -
- -
- -
- 3.
765
4.
604.
582
12
LO
K
MK
F
FE
D i
RS
S
araj
evo
60
- 5+
4 30
0 1.
000
<60
-
- -
- -
29.8
00
41
.187
.671
13
Mel
aha
MK
F FE
D
Sara
jevo
1
- 6
500
1.00
0 <
60
Žir
anti
3%
/
26
,4%
-32
,4%
-
19.0
00.0
00
14
MIB
A
MK
F
FED
T
uzla
1
- -
- -
- -
- -
- -
- -
15
MI-
Bos
po
MK
F
FE
D
Tuz
la
1 -
- -
- -
- -
- -
- 16
.195
19.7
00.0
00
16
Mik
ro A
ldi
MK
F
FED
G
oraž
de
1 -
- -
- -
- -
- -
- 1.
895
2.
447.
976
17
Par
tner
M
KF
F
ED
i R
S
Tuz
la
56
- 8
500
10.0
00
1-64
-
1,5%
-2%
15
,77%
30
,07%
6,
99%
-24
,99%
39
.620
64.8
29.7
12
18
Pri
zma
MK
F
FE
D i
RS
S
araj
evo
42
250
8 -
< 1
0.00
0 <
5 g
-
- -
- -
250.
000
37
0.00
0.00
0
19
San
i M
KF
F
ED
Z
enic
a -
- -
- -
- -
- -
- -
- -
20
Sunr
ise
MK
F
FED
S
araj
evo
40
- 6
500
10.0
00
1-24
S
tand
ardn
a O
visi
-
- -
19.1
03
28
.359
.510
21
Vor
it-I
nves
t M
KF
F
ED
S
araj
evo
- -
- -
- -
- -
- -
- -
-
22
Žen
e za
Ž
ene
MK
F
FE
D i
RS
S
araj
evo
- -
- -
- -
- -
- -
- 4.
840
4.
174.
508
23
Prv
a Is
lam
ska
MK
F
MK
F
FE
D i
RS
S
araj
evo
6 -
4 50
0 5.
000
< 1
2 -
- -
- -
- -
24
Mik
ra
MK
F
FE
D i
RS
S
araj
evo
39
99
4 /
- <
12
- -
- -
- 7.
989
*ove
r 5.
000
need
1 g
uara
ntor
, mor
tgag
e de
posi
t.
** b
ond,
dep
osit
, mor
tgag
e, a
dmin
istr
ativ
e ba
n.

REDETE – ECONOMIC DEVELOPMENT AND ENTEREPRENEURSHIP IN TRANSITION ECONOMIES
742
The Role of Microcredit Organisations for a Small Economy
To understand the importance and role of micro crediting on a small economy, we must first consider the table by the World Bank that shows population ability to gain a bank loan.
Table 2: Access to Financial Sector in % in Countries CEE/SEE-The World Bank 2008
CEE/SEE Percent with access Slovenia 97 Estonia 86
Czech Republic 85 Lithuania 70 Hungary 66 Poland 66 Latvia 64
Bulgaria 56 Croatia 42 Albania 34 Romania 23
Macedonia 20 Bosnia and Herzegovina 17
It is obvious at the first glimpse that the part of population that does not have conditions for
formal banking market is over 80%. There is a need to ensure alternative credit sources for that part of the population, irrespective whether it is about loan to start a project or to bridge some extraordinary financial situation for physical people.
Important information about the meaning of crediting people through credit lines in the microcredit organisations, that do not have an access to banking market, are available from the research on 1152 examinees from Bosnia and Herzegovina, labelled „Population readiness on taking loans to start up a business“.
Graph 4:
0% 20% 40% 60% 80%
1.6
30.0
61.5
6.9
If you had means to sart a new business, would you do it?
Almost every third examinee in Bosnia and Herzegovina (30%) is ready to take a loan to start its own business, if he/she had a chance.
No answer
Yes
No
I do not know

REDETE – ECONOMIC DEVELOPMENT AND ENTEREPRENEURSHIP IN TRANSITION ECONOMIES
743
Graph 5:
0% 20% 40% 60
5
26.0
8.4
7.5
Besides yourself, would you employ any other member of your household?
The largest number of respondents (26%) plans on starting a private business and employ a family member. Only 8.4% of examinees would not employ some of their family members if he/she was starting a business.
Graph 6:
0% 20% 40% 60% 80%
77.2
6.8
10.0
4.5
1.9
How many people live in your household?
As we can see from graph 6, when opening a private business, the respondents plan to employ from one to three people.
Regardless if it is a microcredit of average amount (7.000 Euros) in the European Union or a
loan of 27$ from the project in late 1976 by professor Yunus and Grameen bank, the principle is the same. The basic mission is to fund population that does not have an access to the financial market, that is, to encourage their entrepreneurial undertakings, which will cause the self-employment effect, and reduce poverty and raise living standard.
I would not get the loan
Yes
No
I do not know
Was not asked
1
2
3
4 or more

REDETE – ECONOMIC DEVELOPMENT AND ENTEREPRENEURSHIP IN TRANSITION ECONOMIES
744
Over 90% of firms in the European Union are micro-companies that are defined by the European Commission as companies with lesser then ten employees. Based on the unemployment data in Bosnia and Herzegovina, it can be concluded that initiatives and preparing self-employ-ment projects are essential to future economical growth. It is hard to expect that former socialist self-management giants will revive and employ thousands of unemployed. The expectations focus solely on the private initiative. From the research „Population readiness on taking loans to start up a business“, it is evident that the main problem is a lack of financial funds to start a business or to advance the existing. Large percentage (30%) of examinees stated readiness to get a loan to start a business, or to advance business processes. When we add that percentage to the fact that roughly 80% of the population does not have an access to the banking market, we get a number of few hundred thousand people that are ready and willing to work only if initial financing is available to them. From the available data, there is an evident need for entrepreneurial micro-financing in Bosnia and Herzegovina.
Conclusion:
Markets of undeveloped countries and developing countries, such as the market of Bosnia and Herzegovina, are often perceived as overbooked with banks as well as the access to formal finan-cial services to all. It is said to be true, if we think of medium and high income citizens. However, for others like small business owners, unemployed, low income population and rural population, it is simply not the true. World Bank data from 2008. suggest that only 18% of Population in BiH (2011. data is even worse) have an access to financial market, putting the country on the bottom of the list of countries in Europe. There needs an urgent action in micro crediting to ensure lower unemployment and further economic growth.
With all the efforts from the EU and EC are doing in this field of supporting the growth of mic-ro crediting and microcredit institutions, Bosnia and Herzegovina has seen only small progress in micro crediting foundations and companies, while a project of Savings-credit cooperatives did not start yet. At the same time the EC financially helps the creation of Savings-credit cooperatives in EU countries, and UN proclaims 2012. As the year of Savings-credit cooperatives).
From all the data and discussion on the issue, one can conclude that growth and positioning of microcredit institutions and savings-credit cooperatives on BIH's financial market is "conditio sine qua non", as a tool to battle poverty, to spur self-employment and to develop small busi-nesses.

REDETE – ECONOMIC DEVELOPMENT AND ENTEREPRENEURSHIP IN TRANSITION ECONOMIES
745
Bibliography:
1. Bašić M, «Ekonomija BiH», Ekonomski fakultet u Sarajevu, Sarajevo, 2005. 2. Blejer M. , Škreb M. , «Financial Sector Transformation», Cambridge University Press. 1999. 3. Leko V., «Rječnik bankarstva», Masmedia, Zagreb, 1998. 4. Marušić M, Vranešević T., «Istraživanje tržišta», ADECO, Zagreb, 2001. 5. Najdanović Z., «Marketing unapređenja štednje - čimbenik razvoja hrvatskog gospodarstva»,
Pula, 2001. 6. Najdanović Z., «The role of the state-owned banks in transition countries economic
development», Sarajevo, 2002. 7. Najdanović Z., Tomašević M. , «Retail bank selection criteria in Republic of Croatia», Zagreb,
2002. 8. Perišin I. , Šokman A. , Lovrinović I. , «Monetarna politika», Sveučilište u Rijeci 2001. 9. Sachs J. , «Developing Country Debt and World Economy», Chicago University Press 1989. 10. Tihi B., «Istraživanje marketinga», Sarajevo, 2007. 11. Tomašević Lišanin M., «Bankarski marketing», Informator, Zagreb, 1997. 12. Vlada RH , «Program poticanja zapošljavanja», Zagreb 2002. 13. Vlada RH , «Strategija razvitka Republike Hrvatske – Hrvatska u 21. stoljeću», Zagreb 2003. 14. Vlada RH , «Nacionalni program za pridruživanje EU u 2004. godini», Zagreb 2004. 15. World Bank , «Global Economic Prospects for Developing Countries 1998/99: Beyond
Financial Crisis», The World Bank Washington DC 1999. 16. Zelenović V., «Marketing u bankarstvu», Kopi komerc, Novi Sad, 2008.

PART NINE:
Entrepreneurialism, Responsible Business, Csr

REDETE – ECONOMIC DEVELOPMENT AND ENTEREPRENEURSHIP IN TRANSITION ECONOMIES
747
ENTERPRISE ETHICS AS A NECESSARY PARADIGM FOR ENTERPRISE’S DEVELOPMENT
Tjaša ŠTRUKELJ318A,B, Matjaž MULEJA,B,
Simona STERNADA
Abstract
The current problems and economic/financial/value crisis crucially depend of perception of decisive persons what should be included in the considered cost, effort, benefit, time horizon, tackled circles of persons etc. If this perception is narrow-minded rather than requisitely ho-listic, one-sidedness of decisions results and failures of processes outcomes are hardly avoidab-le. Enterprise is a part of social environment and enterprise ethics is changing from instrument for profit making into condition for it. Thus we have to divide the entrepreneurial rationality, which could become/remain unethical, in technical, economic, and social-economic (res-ponsible) rationality. Hence it follows that enterprise’s long-term survival depends on efficie-ncy, effectiveness and ethical behaviour. These three partial rationalities are mutually interde-pendent and conditioned, but are frequently also opposing each other. This is why their adjus-tment is becoming a central point in developmental strategic decisions. The present research will show the importance of achieving such entrepreneurial rationality for (enterprise) long te-rm survival, which enables enterprise excellent performance as well. We will define technical rationality (efficiency), economic rationality (effectiveness) and social-economic (responsible) rationality (ethics), as well as discuss their mutual interdependency and conditional interdepen-dence, but frequently also contrariety. This is why the adjustment of all three partial rationa-lities is becoming a central point of entrepreneurial decisions. The partial rationalities (i.e., tec-hnical, economic, social-economic) discussed in the paper cannot be dealt with in isolation as they are interdependent. If the enterprise rationality and the individual humans’ rationality are leaving the nature aside, because they forget that human are a part of nature and enterprise are a part of human tools for well-being, the nature tends to take its revenge. As a reaction, rather than as pro-action, the enterprise ethics and resulting enterprise policy needs to be changed, actually to be innovated in order to provide more benefit. If the technical rationality and the short-term and narrow-minded economic rationality are the only ones to be considered, with no ethics of interdependence (rather than any kind of ethics, e.g. the feudalist’s one), then the fa-ilure in economic action is hardly avoidable. And so is the revenge of nature against those who do not practice the requisite holism (RH), including the synergy of the technological, economic, and ethical aspects of SR.
Keywords: enterprise policy, enterprise ethics, efficiency, effectiveness, social responsibility
318 aUniversity of Maribor, Faculty of Economics and Business, Razlagova ul. 14, 2000 Maribor, Slovenia bIRDO Institute for Development of Social responsibility, Preradovičeva ulica 26, 2000 Maribor, Slovenia e-mail: [email protected], [email protected], [email protected]

REDETE – ECONOMIC DEVELOPMENT AND ENTEREPRENEURSHIP IN TRANSITION ECONOMIES
748
1. Introduction
After several years, officially and publicly visibly, the socio-economic crises started surfacing in 2008. Though, warnings about it are much older, e.g. in the form of United Nations’ and European Union’s documents about social responsibility (SR) (Mulej and Hrast, editors, 2010). Years-long practice has shown that such documents matter, once countries and enterprises include them into their strategies as crucial and well-supported non-technological invention-innovation-diffusion processes (IIDP) leading to innovations concerning the way of governing and managing. Creative and innovative capacities of co-workers tend to be dormant or even detrimentally used, if the governance and management styles and processes are not innovated toward SR. European Union declared this in its action plan for promotion of SR as a way out from the current socio-economic crisis (EUCSR, 2011). Member countries and big enterprises are urged to no longer be passive, but role-models, about SR and to use ISO 26000 standard on SR, whose essence is expre-ssed not only by 7 principles, 7 areas of application, and 7 steps of implementation, but first of all by the two concepts from systems theory linking all of them: (1) interdependence (instead of the abuse-based independence and dependence in natural, economic and political relations), and (2) holistic approach (instead of one-sidedness leading to oversights and thus causing crises, includi-ng the current one and wars) (ISO, 2010). These concepts make organizations innovative.
The experience, reported in public press, proves that innovative enterprises succeed even in crises, because they have appropriate requisitely holistic enterprise policy and strategies, inclu-ding enterprise ethics and social responsibility (SR), exposing interdependence and holism, as important sources of productivity, efficiency, and profitability. IIDP are natural consequences and components of such business practices that deserve imitation and require a transition from a traditional, self-enclosed and non-cooperative behaviour of key enterprise stakeholders by the (dialectical) systems approach. This approach can be – theoretically speaking – informal, e.g. supported by the ISO 26000 Standard on SR (ISO, 2010). Responsible organizations (as institutions of interest-linked people and property) define their basic, general and long-term cha-racteristics in their enterprise policy as an important management instrument influencing their development and operation. The differences in enterprises’ policies result from differences in (stakeholders’) interests, reflecting their values, culture, ethics, and norms (VCEN; Potočan and Mulej, 2007). The future enterprise policy, therefore governance and management, is also influenced by the existing enterprise policy. To reach enterprise excellence, enterprise policy should be innovated toward SR (EUCSR, 2011) through responsible and sustainable enterprise policy (Štrukelj et al., 2012a) resulting from enterprises’ VCEN, thus (also) from enterprise ethics, for better stakeholder quality of life.
Here we show how the enterprise ethics help enterprise stakeholder toward better way of life and is therefore a necessary paradigm for enterprise’s development. We introduce the entrepre-neurial rationality and ethical problem levels (1) enterprise efficiency as its technical rationality, (2) enterprise effectiveness as its economic rationality, and (3) enterprise ethical behaviour as its social-economic (responsible) rationality. All of them in interdependence should provide better stakeholder quality of life. We present the results of the OECD “Better Life Index” of well-being measurement comparing Slovenia to OECD countries average (YBLICN, 2011) that results from more or less ethical behaviour (and consequently more or less responsible enterprise policy) of Slovenian enterprises. We conclude with some thoughts and some pieces of advices for making business decisions.

REDETE – ECONOMIC DEVELOPMENT AND ENTEREPRENEURSHIP IN TRANSITION ECONOMIES
749
2. The entrepreneurial rationality and ethical problem levels
The financial, economic, and social crisis which emerged in 2008 in the most innovative coun-tries of the world shows that economy creates only a part of preconditions for well-being and ha-ppiness of people (Beyond GDP, 2011; Blanchflower and Oswald, 2011; Judge and Kamma-yer-Mueller, 2011; Wu and Wu, 2010; YBLICN, 2011). The innovation of planning and management criteria must therefore be oriented toward greater SR and RH (Dyck, 2011; EUCSR, 2011; Hrast et al., ed., 2012; ISO, 2010; Motohashi et al., 2012; Mulej and Hrast, ed., 2010; Wang and Juslin, 2012). The process must lead toward enterprise ethics and socially responsible enterprise, as well (see also Epstein, 2010; Madu and Kuei, 2012; Wagner, 2010); therefore future social and economic development will require even more creativity and innovation. New benefit for the current and coming generations should be provided also through the enterprise policy (corporate governance) innovation (Amman et al., 2011; Duh and Štrukelj, 2011; Štrukelj and Mulej, 2008, 2009; Šarotar-Žižek et al., 2011; Štrukelj et al., 2012a).
The differences in enterprises’ policies result from differences in (stockholders’) VCEN and resulting interests. According to Belak, Ja. (2002, p. 76) the enterprise policy defines basis, general, and long-term enterprise characteristics. It contains mission, purpose and basic goals of an enterprise with global determination of resources, processes and outcomes. We believe that enterprise policy must be oriented towards enterprise’s responsible behaviour. Responsible enterprise policy (see Bleicher, 2004, also Belak, Ja., 2002, p. 113) is many-sided, objective-oriented into implementation of all stakeholders’ interests, with high level of social responsibility consideration and with long-term developmental attitude, which requires entrepreneurial innovative search of new opportunities. One considers the requirements of an enterprise policy fulfilled (see: Belak, Ja. 2002, p. 132), when they are realised at the level of strategic management as well. Strategies and related structures are crucial instruments for business policy implementation. In this way the modes of enterprise policy realisation are determined. This is why the enterprise policy implementation is the central task of top management and that’s why it directly belongs into the process of strategic and indirectly into the process of operational management.
Enterprise policy is influenced by enterprise VCEN and resulting interests, strengths/weak-nesses, opportunities/threats, and existing enterprise policy (compare Belak, Ja. and Duh, 2012). In continuation of the paper (1) enterprise efficiency as its technical rationality, (2) enterprise effectiveness as its economic rationality, and (3) enterprise ethical behaviour as its social-economic (responsible) rationality as part of VCEN determinants influencing enterprise policy are examined.
(1) Enterprise efficiency can also be termed technical rationality.
Under technical rationality Thommen (1996, p. 796) understands the efficiency of business operation. Efficiency (Coulter, 2005, p. 243) is the ability of the organization to minimize the use of resources in achieving organizational goals [thus to use its limited resources strategically]. It is important to create maximum output with minimum input of work and/or material. To be efficient means to do the things right (see Drucker, 1967). Efficiency (Kajzer and Potočan, 2004, p. 25) is thus enterprise’s internal characteristic. From the systemic point of view we are dealing with conception of closed system – for system function (know-how). This is why the efficiency in generally is estimated on the basis of the following criteria (ibid):
- Profit maximum as moral obligation (Osterloh and Thiemann, 1995, in ibid),
- Quantity of manufactured products and/or services,
- Exploitation of available resources,

REDETE – ECONOMIC DEVELOPMENT AND ENTEREPRENEURSHIP IN TRANSITION ECONOMIES
750
- Decantation speed,
- Operation reliability,
- Productivity,
- Economic efficiency etc.
Typical for all of these and also other criteria (Kajzer and Potočan, 2004, p. 25) is, that they are
not oriented toward aims (know why) and goals (know what) of an enterprise. Those are deemed self-evident. All attention is oriented toward aspiration for criteria achievement, with minimum of input.
However, for enterprises’ long term success it is not enough to be efficient only. If an enter-prise must put (efficiently) produced goods into the warehouse because nobody wants to buy them, the enterprise will sooner or later sail into troubles (Thommen, 1996, p. 796). For long-term survival and development enterprise effectiveness as its economic rationality is of great importance; we discuss it in the continuation.
(2) Enterprise effectiveness can also be termed economic rationality.
It is important to produce only those goods (Thommen, 1996, p. 796) that satisfy real consu-mer needs, that are able to be competitive, and which price cover costs and assures profit. This is why effectiveness of business operation, measured with profit as a goal of market economy, comes in foreground. Effectiveness (Coulter, 2005, p. 243) is the organization’s ability to complete or reach goals (in achieving high level of corporate performance; N. B. authors). To be effective means to do the right things (Drucker, 1967). Effectiveness (Kajzer and Potočan, 2004, p. 25) is thus enterprise’s external characteristics. We are dealing with conception of open system – for system behaviour in its environment (know what). With effectiveness we are generally estimating the consequences, caused by the system in his environment. Between typical criteria of effectiveness we are placing above all (ibid):
- Ethical behaviour and enterprise credibility (Thommen, 1991 in ibid),
- Quality of products and/or services,
- Delivery-time and service-time readiness,
- Relation to nature [ecological environment] and social environment,
- Humanization of work and relationships,
- Profitability and capacity to accumulate investment funds; etc.
By judging the effectiveness we put in foreground social purposes and goals derived from
them. Their background is thus in life quality enlargement (Kajzer and Potočan, 2004, p. 25). This is why we are researching enterprise ethical behaviour as its social-economic (responsible) rationality in the continuation.
(3) Enterprise ethical behaviour can also be termed social-economic (responsible) rationality.
Economic activity and profit achievement (Thommen, 1996, p. 796) is not realised in an empty place. An enterprise is a part of comprehensive political, economic, social and cultural system. For long-term survival and development of an enterprise as a part of this complex system enter-prise must be aware not only of its obligations towards co-workers and consumers, but also of its

REDETE – ECONOMIC DEVELOPMENT AND ENTEREPRENEURSHIP IN TRANSITION ECONOMIES
751
obligations towards society. Enterprise has to determine, what the good moral of an enterprise is, which is basis for good enterprise management and for appropriate behaviour of its workers. This is also the reason (ibid, pp. 796–797) why some enterprises create their codes of ethical respecti-vely behaviour, in which they define their moral principles. We believe that social responsibility of enterprises, other organizations, and countries, depends on humans and their ethics, which can be viewed as information – impact of influential persons over others and their internalization of received information about the “correct” ethics. We also believe that social-economic (respon-sible) rationality can be achieved through received information about the “correct” ethics and that social responsibility can be attained by planning of ethics only (about attainment of social responsibility by enterprise ethics planning see Belak, Je. et al., 2010; also Griseri and Seppala, 2010).
Because enterprise’s functioning concerns other organisations, people within these organizatio-ns and in its environment (see Thommen, 1996, p. 787), every enterprise faces many ethical prob-lems and dilemmas. This is why, as a consequence of differentiating observation, we can distin-guish micro-level, mezzo-level and macro-level of enterprise ethical problems. At the micro-level (ibid) individual values and behaviour are in the centre. The aim of the research at this level is to examine the individual’s behaviour within her specific life space in the circumstances that limit individual’s behaviour within that life space. At the mezzo-level (ibid) we investigate the beha-viour of organizations. An organization, like an enterprise, consists of individuals, who shape and directed it; but an enterprise as a whole is also economic unit and that’s why we are talking about enterprise as an individual behaviour subject. As an outcome (ibid, pp. 787–788), an enterprise is responsible for its behaviour and has to accept consequences of its functioning. Therefore an enterprise becomes not only legal, but also moral entity – it must accept also moral rights and obligations of its functioning. At the macro-level (ibid) we investigate general economic conditions. We want to know what kind of economic system is the most suitable or the best for certain enterprise’s functioning. About social responsibility as a way of systemic behaviour and innovation leading out of the current socio-economic crisis read Motohashi et al. (2012); Mulej et al. (2009d), Šarotar Žižek et al. (2011), and Štrukelj et al. (2012a).
Without legal framework that both favours and demands social responsibility and innova-tiveness beyond the limits of technical-technological innovations, total quality, and systemic thinking, enterprises are not willing to take into consideration the social-economic (responsible) rationality sufficiently: in the short term, arrangements of this kind mean more costs than profit. For suchlike changes only legal frame is neither enough. The great and excellent enterprises showed and proved that enterprises need innovations of their products, processes as well as social innovations within their governance and management, basic-realisation and information pro-cesses. Many researches show (e.g., Kajzer and Potočan, 2004, p. 25) that the most successful en-terprises have radically innovated their management processes and style (Amman et al., 2011; Collins, 2001; Collins, Porras, 1994; Drucker, 1985; Goerner, 2004; Goerner et al., 2008; Gorenak, 2008; Gregory, Midgley, 2003; Hrast et al., 2012; Kanter 1983; Peters, Reimann, 1988; Peters, Watermann, 1982; Peters, 1987; Šarotar Žižek et al., 2011; Štrukelj et al., 2012a; Štrukelj, Mulej, 2008, 2009 etc.); only then they could effectively and efficiently use the top-level informational technology (Sternad et al., 2011; Zahn, 1989; Zahn, 1990), and only then enterprise excellent performance could be taken into consideration.
3. Mini case: enterprise ethics results in ‘Your Better Life Index’ – Slovenia example
In 2011 OECD unveiled a new, interactive index that lets everyday people measure and compare their lives in a way reaching beyond traditional GDP numbers (Fietz, 2011). Issues discussed included: new sources of economic growth and jobs; gender equity; rising food and energy prices; and global development. Called “Your Better Life Index”, the index measures

REDETE – ECONOMIC DEVELOPMENT AND ENTEREPRENEURSHIP IN TRANSITION ECONOMIES
752
welfare (well-being) and allows citizens to compare their lives across 34 countries, based on 11 dimensions [basic determinants of well-being]: housing, income, jobs, community, education, environment, governance, health, life satisfaction, safety, work-life balance (www.oecd.org/be-tterlifeindex). Slovenia performs favorably in several measures of well-being (YBLICN, 2011, p. 29), and ranks close to the average or higher in several topics in the Better Life Index (Table 1). This reflects enterprise ethics’ consequences, resulting in enterprise policy and citizens everyday life.
Table 1: ‘Your Better Life Index’: Slovenia compared to the OECD Average
11 Your Better Life Index components Slovenia OECD average 1 The average household earning a year (important means to achieving higher living standards)
19 891 USD 22 284 USD
2 Employment: people aged 15 to 64 that have a paid job nearly 66% 65% 3 Working hours a year 1687 hours 1739 hours 4 Mothers employed after their children begin school (women ability to successfully balance family and career)
74% 66%
5 Adults aged 25 to 64 that have earned the equivalent of a high-school diploma (good education is an important requisite to finding a job)
82% 73%
6 Reading ability according to the latest PISA student-assessment program (the average student score)
483 out of 600
493 out of 600
7 Health, life expectancy at birth 78.8 years 79.5 years 8 The level of atmospheric PM10 (tiny air pollutant particles small enough to enter and cause damage to the lungs)
29 micrograms per m3
22 micrograms per
m3
9 The public sphere: sense of community and moderate levels of civic participation (people that believe that they know someone they could rely on in a time of need)
91% 91%
10 Voter turnout (a measure of public trust in government and of citizens' participation in the political process)
63% 72%
11 Satisfaction of people with their own life 39% 59% Note: These findings are based on data from 2008 or later.
Source: YBLICN, 2011, p. 29, p. 28, p. 3.
Using enterprise ethics, all inhabitants of planet Earth can enjoy SR and a better quality of life.
The competitive ability of enterprises and countries, and better quality of life of citizens, is in-fluenced also by innovative, creative, lateral, and entrepreneurial thinking that is a part of the personality traits of each person, but they can also be stimulated and developed (see, e.g., De Bono, 2005; Boynton et al., 2011); this can be especially effective when governors, managers and coworkers support and apply such thinking, innovating it toward more ethics.
4. Concluding remarks
Policy makers struggle with ways to address new economic challenges in preparing their economies to succeed in the future economy, characterized by growing uncertainty. In a difficult global economic environment it is important that the country has laid a solid founda-tion to support socio-economic growth and development, including competitiveness and quali-ty of life of all residents. All the widely successful appeals to the enterprise ethics, sustainable development, and corporate social responsibility confirm this truth (Slovenian recent examp-les: Hrast et al., 2012; Mulej and Hrast, ed., 2010; etc.; International examples: the standard ISO, 2010; EUCSR, 2011; etc.; about sustainable development, see Epstein, 2010; Madu and Kuei, 2012; Wagner, 2010).

REDETE – ECONOMIC DEVELOPMENT AND ENTEREPRENEURSHIP IN TRANSITION ECONOMIES
753
We may discuss the business effectiveness only from the viewpoint of customer-need satisfac-tion; but, the profit-oriented business must take into consideration social consequences. Contrary to this, the enterprise ethics is always related to people and their economic behaviour. Therefore it is understandable that all three rationalities are interdependent and mutually conditioned. When making business decisions all three partial rationalities should therefore be seen requisitely holisti-cally and taken into consideration as such. Long-term enterprise survival and development namely depends on its efficiency, profit orientation, and ethical behaviour. If an enterprise achieves its lo-ng-term goals in such a manner and considers economic and ethical viewpoints, it will be credib-le, effective and efficient in the long term. Enterprise rationality should be a special, requisitely holistic enterprise policy, because the enterprise’s long-term survival depends on synergy of the efficient, effective and ethical behaviour. These three partial rationalities are mutually interdepen-dent and conditioned, but are frequently also opposing each other. Thus, engagement with ethics must be a part of socially and else-how responsible enterprise policy, strategies and activities; the same is valid also for governmental organisations or non-governmental organizations, including social responsibility, supporting RH of enterprise behaviour, innovation of habits/VCEN, not only technology, and RH of responsibility of owners (shareholders) and managers to all stakeholders, including co-workers and environment, and vice versa.

REDETE – ECONOMIC DEVELOPMENT AND ENTEREPRENEURSHIP IN TRANSITION ECONOMIES
754
SOCIAL ENTREPRENEURSHIP NETWORKING MODELS IN TRANSITION ECONOMIES AS INNOVATIVE TOOLS FOR
SUSTAINABLE DEVELOPMENT
Liliya TERZIEVA319
Abstract
Social entrepreneurship is a 21st century phenomenon, by means of which innovative soluti-ons to society’s most pressing social problems are being provided. It is more than ambitious and persistent, tackling major social issues and offering new ideas for wide-scale change not only for the pure economic growth but mainly for the long-term benefit of the society. Rather th-an leaving societal needs to the government or business sectors, social entrepreneurship finds what is not working and solves the problem by changing the system, spreading the solution, and persuading entire societies to take new leaps. Social entrepreneurs often seem to be possessed by their ideas, committing their lives to changing the direction of their field. They are both visi-onaries and ultimate realists, concerned with the practical implementation of their vision above all else. In other words, every leading social entrepreneur is a mass recruiter of local change-makers—a role model proving that citizens who channel their passion into action can do almost anything.
However in the transition economies networking and especially social entrepreneurship net-working is still a solution formula and vision, which need more than argumentation for people to believe in and devote their business efforts to in order to co-explore and further co-create su-stainability. The challenge of the social entrepreneurship networking model based on the HUB global network is the potential of covering all industries and professions, from fair-trade eco-fashion to micro-finance for the poor, from inclusive education to zero-waste supply chains, from corporate intrapreneurship to peer-to-peer crowdsourcing models, and much, much more. Thus there is provided direct support to scalable business models so that ventures developed by means of the model become financially sustainable and create real impact. Therefore the HUB good practices are being introduced since they are about the power of innovation through co-llaboration since they have been founded to address this need. They set out to create spaces that combine the best of a trusted community, innovation lab, business incubator and the comforts of home. Spaces with all the tools and trimmings needed to grow and develop innovative ventures for the world. But above all, spaces for meaningful encounters, exchange and inspiration, full of diverse people doing amazing things. By gathering and sharing best practices and practical examples of innovative sustainable ideas from around the globe, the HUB believes that the po-wer of inspiration can move development forward in a more sustainable way for our planet and people.
In this respect the paper presents certain challenges of social entrepreneurship networking models versus sustainable development in transition economies and based on this reveals spe-cific characteristics and discusses innovative networking problems at the example of Bulgaria and Romania. The paper is based on the case studies and results gathered within the framework of the Academy for Leisure at the NHTV University of Applied Sciences, Breda, the Netherlands
319 NHTV University of Applied Sciences, Breda, The Netherlands; 17, Archimedestraat; Breda; NL; [email protected]

REDETE – ECONOMIC DEVELOPMENT AND ENTEREPRENEURSHIP IN TRANSITION ECONOMIES
755
and the Global HUB Network social entrepreneurship impact measurement programme for economic and sustainable growth.
Keywords: social entrepreneurship, HUB, networking, organizational structures
Introduction
As a widely arguable definition, social entrepreneurship refers to unique and innovative allia-nces between public, private, and non-profit organizations as well as individuals and other groups who come together cooperatively in order to address pressing economic and social challenges at a local and/or global level. Since many of these challenges carry over from the last century (or even before), especially in the transition economies, the society today is witnessing a transformation of responses to these challenges to enable them to keep up with the increasingly digitalized, infor-mation-based, and networked world, a world considerably “smaller,” i.e., much more connected than before.
This paper has the objective to portray social entrepreneurship as involving a decentralized and non-dogmatic approach to problem resolution that takes advantage of the varied institutional mechanisms afforded by society (markets, governments, community enterprise), as a networking process that can happen anywhere in the economy and society: inside governments, corporations, communities, through new ventures.
1. Essence of Social Entrepreneurship
Social innovation practices and challenges have a strong mobilizing effect, which would allow gathering of competences and resources, beyond sectors and disciplines boundaries. As the Euro-pean Commision’s policy on Social Innovations states: “Social challenges are also opportunities: Many of these developments can — and should — be viewed as also offering economic and social opportunities. Developments in information and communications technologies have created exci-ting possibilities for improving our ability to meet social needs.”
It has been argued by Phills et al. (2008) that social innovations can be encountered in different points in history. What changes over time and according to the circumstances are the mechanisms of the phenomenon. Currently, social entrepreneurship is viewed as an enabler of social transfor-mation and economic growth since it blurs the boundaries between private and public sector and blends entrepreneurial approaches with social purposes (Dees, 2001). Social entrepreneurship represents the new expression of civil society against a background of economic crisis, the wea-kening of social bonds and difficulties of the welfare state; hence it has strong points compared to the other sectors in regards to the broad mobilization of resources across society. According to Bronstein and Davis (2010), this is a result of the increase in urgent and complex problems in society, the spread of technology and the emergence of social challenges that call for a quick res-ponse.
The complexity of the term, the considerable range of activities included in social entrepre-neurship and its widespread use, rendered its explanation a rather challenging task resulting more than 37 definitions (Mair and Marti, 2004). Therefore, Nicholls (2006) uses the term as an umbre-lla for any innovative and dynamic initiative in the social sphere.
Based on a similar argument, Defoyrny and Nyssens (2010) distinguish three major approaches to social entrepreneurship in Europe. These are based on the background of the researchers and the various perceptions around Europe. In brief, these schools of thought are the Earned Income approach focusing more on the use of business like activities by non-profits in order to support their mission, the Social Innovation approach which emphasizes the notion of entrepreneur as a change maker who aims on impact not on income and the EMES Approach which is based on

REDETE – ECONOMIC DEVELOPMENT AND ENTEREPRENEURSHIP IN TRANSITION ECONOMIES
756
interdisciplinary dialogue and is more concerned with identifying the indicators of social entrepre-neurship rather with defining the concept.
Social entrepreneurship is an entrepreneurial activity, which results in providing socially im-portant services, employment of persons with physical disabilities or mental disorder, goods and services for the most vulnerable parts of the society. The advantages of social entrepreneurship in comparison to non-profit organizations are the use of effective business methods, the innovation component and profit, which ensure financial stability.
However there are still many disputable issues concerning this phenomenon. The first point of critique regards the vagueness and diversity in definition of social entrepreneurship. The common way to define it is to point out two crucial aspects, namely market principles of doing business, including income-generating (Andersson, 2012) and social mission. At this particular point it is questionable if both these aspects can exist together. Historically, non-profit sector is developed as an alternative to state and market distribution of social goods. Even assuming that the combination of social and entrepreneurial creates a new phenomenon, which is neither state nor non-profit, nor a private sector, one would argue, what exactly «social» and «entrepreneurial» in this context mean.
Moreover the main characteristics of social entrepreneurship, outlined in diverse theoretical resources, can be summarized as follows:
- Explicitly formulated mission to create and sustain social value and to benefit the communities;
- High degree of economic risk and autonomy in activities related to producing goods and/or selling services;
- Pursuit of new opportunities and exploration of hidden resources to serve that mission;
- Quest for sustainable models, based on well elaborated feasibility study;
- Ongoing engagement in innovation, adaptation and learning;
- Decision-making power not based on capital ownership;
- Participatory and collaborative nature involving various stakeholders;
- Limited distribution of profit and minimum amount of paid work;
- Change opportunities lying in the hands of every individual.
2. The HUB as a social entrepreneurship networking model
What is key to the success of any social activity is the total resource of the community network within which it must interact. Any small businessperson would confirm that without the support of a community social network that can help supply business acumen, sales leads, and contacts, profit is going to come and go at the whim of chance. Chambers of Commerce, Business Improvement Districts, Rotarians, Lions are all long established interactive network efforts among business people to connect and create new avenues for profitable emergence. Creating these networks for social businesses is also critical, because they often need more from the business community than simply meeting a business neighbor or sharing issues within the local Business Improvement District. Providing more is reasonable because social businesses actually create a better economic base for the community in which they operate, since:
- They address social problems in the community;
- They help lower the cost of local government run social programs that are supported by the tax dollars of the community’s other businesses;
- They make a profit and are self-sustaining, and therefore contribute to the tax-base;

REDETE – ECONOMIC DEVELOPMENT AND ENTEREPRENEURSHIP IN TRANSITION ECONOMIES
757
This is also why it is crucial that it is reached out to these small social business operators and
make sure they become successful within the community. It is also working to reduce the costs of living in our communities for everyone.
The Global HUB Network, founded in 2005 in London, UK, has been developed with the general objective of transforming power of innovation through collaboration. Today there are already more than 25 functioning HUBs and above 50 in the process of development with more than 4000 members on 5 continents, comprising one global network.
The main reason behind the HUB concept lies within the theory that “there is no shortage of good ideas to solve the issues of the 21st century but there is an acute lack of collaboration and support structures to help make them happen”. The HUB was founded to address this need.
The Global HUB network sets out to create spaces that combine the best of a trusted community, innovation lab, business incubator and the comforts of home. Spaces with all the tools and trimmings needed to grow and develop innovative ventures for the world. But above all, “spaces for meaningful encounters, exchange and inspiration, full of diverse people doing amazing things”.
At the HUB, people from every profession, background and culture are being united by one thing: the imagination and drive to pursue enterprising ideas for the world. These are the people who see and do things differently and have entrepreneurial passion to create sustainable impact. The HUB is becoming the place they call home. HUBs are uniquely designed spaces that provide a creative environment as well as a professional infrastructure to work, meet, learn and connect.
In a time where everything becomes virtual it has been identified that it is ever more important for people to continue connecting physically in meaningful settings. The HUB spaces are designed to provide an inspirational home to the members and are a focal point for change within the local communities where they operate.
The networking community idea lies within the search for diversity in perspectives but similarity in values and intention. The communities span across a wide range of professional backgrounds, cultures, nationalities, approaches and contexts. The Global HUB network’s aim is to be the place where unlikely allies meet, connect and engage in collaborative ventures for a sustainable world.
HUBs host a variety of events, workshops and innovation labs to foster collaborative learning and thought leadership around topics that help people take their initiative to the next level. From everyday interactions to thought-provoking events, the HUBs curate peer-driven learning opportunities that broaden the understanding of the world, help create the impact people strive for and find out about the most effective, innovative and entrepreneurial ways to get there.
The HUBs are global communities of entrepreneurial people with a common vision for the world (see Fig. 1).

REDETE – ECONOMIC DEVELOPMENT AND ENTEREPRENEURSHIP IN TRANSITION ECONOMIES
758
1. Vision
People taking collaborative action for a better world.
We see a world where people collaborate across nations, organizations and cultures to create a more sustainable future. We believe we can make this shift by working together, locally and globally, to create the best world we can collectively imagine.
2. Purpose
We create spaces that inspire, connect and enable people to realize enterprising ideas for sustainable impact.
We are curators of physical, virtual and social spaces for change. Our spaces offer access to a unique ecosystem of inspiration, people and resources to realize good ideas for the world.
3. Values
Trust
Trust forms the basis of working together. We value authentic connections and see the development of trusted communities at the core of our work.
Courage
It takes courage to pioneer new solutions for the world. We challenge ourselves to go beyond established ways of thinking and hold each other accountable to deliver on our ambitions.
Collaboration
Collaboration is at the heart of solving the issues of our time. We welcome diversity and partner with like-minded organizations to make a meaningful difference.
Fig. 1 HUB network as a global community model (source: http://www.the-hub.net/)
The HUB is a distributed global network of independent local spaces that share the same brand
and core identity. HUBs co-own the assets of the network and make global decisions on the principle of “1 vote per HUB”. In return for getting access to the benefits of being a global network, each HUB contributes financially to maintain global operations and invest in the further development of the network. To ensure shared quality standards across the network, each new HUB is approved and voted into the HUB Association following a peer review process.
The idea is to encourage the creation of “clusters” of people who are willing to work across the network on common projects. Currently there are two operating clusters and many more in the making: HUB Practice Academy: a distributed learning structure aimed at disseminating knowledge and talent across our network and EU Cluster: this group coordinates multi-HUB initiatives within Europe, seeking to participate in the shaping of the EU social innovation agenda.

REDETE – ECONOMIC DEVELOPMENT AND ENTEREPRENEURSHIP IN TRANSITION ECONOMIES
759
Fig. 2 The HUB’s sustainable impact (source: http://www.the-hub.net/)
The harmonization policies of the European Union together with the strive towards deve-lopment and sustainability of the transition economy countries in solving problems such as changing the system, spreading the solution, and persuading entire societies to take new leaps, set forward the necessity and willingness of formation of new strategic alliances and socially-driven networks with the objective of designing for evolution.
3. “Hubbing” as a sustainable development concept
Focusing on social network analysis turns attention to relationships between entrepreneurs and others that provide the resources that are important in establishing a business (Johannisson, 1988; Larson, 1991). Entrepreneurs have ideas to test, and some knowledge and competence to run the business, but they also need complementary resources to produce and deliver their goods or services (Teece, 1987). They get support, knowledge, and access to distribution channels through their social networks. Entrepreneurs are also linked to people and organizations that interact among themselves, and these contacts can widen the availability of resources that sustain a new firm (Hansen, 1995).
Social networks are not fixed; they are the social context of businesses and can be activated according to different needs (Granovetter, 1985; Burt, 1992). To fit their enterprise needs, entrepreneurs bring both those that are closer and distant to them into their business decisions. Family members can play a critical part. As they entertain, plan for, and actually set up a firm, entrepreneurs call on their family and others in their networks for different kinds of help and support (Rosenblatt, de Mik, Anderson, & Johnson, 1985).
Networks have several useful properties for entrepreneurs. The first is size. Entrepreneurs can enlarge their networks to get crucial information and other resources from knowledgeable others.
The next is positioning. Entrepreneurs position themselves within a social network to shorten the path to knowledgeable others to get what they need (Blau, 1977; Burt, 1992; Granovetter, 1973). Finally is relationship structure. Social contacts may be related to the entrepreneur or to each other through several types of relations or interactions. In single stranded relations, each person performs only one activity with the entrepreneur and is related to that person through only one type of relation. Multiplex ties , in contrast, have several layers of different content or types of relationships (Scott, 1991). They may play numerous roles in the entrepreneur’s support group. Researchers pay special attention to the contribution of multiplex ties to entrepreneurship. They especially note that social network members can contact and organize themselves, expanding the opportunities they make available to the entrepreneur (Burt, 1992; Hansen, 2001).
REDETE – ECONOMIC DEVELOPMENT AND ENTEREPRENEURSHIP IN TRANSITION ECONOMIES
760
Within the concept of the “hubbing” good practice initiatives are embedded onto the one-liner: “More you for a better world!” The basic model of the social entrepreneur working in sustainable development is fairly simple: to assess a problem, understand the environmental, social, and eco-nomic dimensions; figure out the leverage points, then execute with an impact-feedback provision. This having been said, there are some at first contradictory characteristics that crosscut leading social entrepreneurial efforts in sustainable development that appear to be distinctive traits, one of the main of which is the ability to balance and harness a set of these potentially opposed notions to drive better and better results.
Leading social entrepreneurs have the ability to evaluate the system dispassionately, but then have the vision to make a passionate bet on a leverage point and a strategy to tip that leverage point.
Community needs and preferences must fundamentally drive social entrepreneurial efforts. But these efforts must also be pragmatic and opportunistic about external realities.
A key to long-term sustainability is community control over natural resources. However, a reality faced by many communities is that traditional control and decision making systems may need to be revived or may be strained when encountering previously non-existent threats. There-fore intervention is sometimes necessary. But the intervention, to be lasting, must be aimed at capacitating local control as opposed to simply solving the problem at hand.
Social entrepreneurship networks put not only data in the hands of communities, but also the knowledge and ability to continue monitoring, to assess the resulting data, and to identify the most promising strategies to address future problems.
The Social entrepreneurship network is more than a community for professionals in specific areas, these are creative pioneers, initiatives, companies, and organizations loners who see that the world needs talent who want to give more of themselves for a better world. Like business entre-preneurship, social entrepreneurship recognizes and acts upon what others miss: opportunities to improve systems, create solutions, and invent new approaches. Venkataraman (1997), studying traditional entrepreneurship, sees the creation of social wealth as a by-product of economic value created by entrepreneurs. In social entrepreneurship by contrast, social value creation appears to be the primary objective, while economic value creation is often a by-product that allows the organization to achieve sustainability and self-sufficiency. In fact, for social entrepreneurship, economic value creation, in the sense of being able to capture part of the created value in financial terms, is often limited, mainly because the “customers” social entrepreneurship serves may be willing but are often unable to pay for even a small part of the products and services provided.
While social entrepreneurship traditionally has been studied in the US, many initiatives operate in transition economy countries that have no structures or resources to enable or support traditio-nal entrepreneurship. Accordingly, social entrepreneurship creates novel business models, or-ganizational structures, and strategies for brokering between very limited and disparate resources to create social value. It therefore relies on individuals who are exceptionally skilled at mustering and mobilizing resources: human, financial, and political.
This ambiguity can be overcome by studying social entrepreneurship through the lens of a widely recognized and global goal that integrates social needs to which many institutions and businesses have committed themselves: the goal of achieving sustainable development (Seelos & Mair, 2004). In this perspective, extending the earlier definition, social entrepreneurship can be defined as entrepreneurship that creates new models for the provision of products and services that cater directly to the social needs underlying sustainable development goals such as the MDGs.
To make a significant contribution to sustainable development, social entrepreneurship must reach a critical mass of initiatives around the globe. The scale and scope of social entrepreneu-rship ultimately depends on the number of individuals who choose to become entrepreneurs with a primarily social mission. It has been suggested that social entrepreneurship depends on very specific and scarce individual characteristics.

REDETE – ECONOMIC DEVELOPMENT AND ENTEREPRENEURSHIP IN TRANSITION ECONOMIES
761
4. Bulgaria and Romania towards HUB culture development
In recent decades, the boundaries between the public (government), private (profit) and social (non-profit) sector has become increasingly blurred, due to the fact that many organizations are trying to make a mix between social and business goals and approaches. The pioneers of this development, from all three sectors making moves in the direction of a new emerging industry. A sector that brings social / societal goals and business methods together. This 4th sector is different from a variety of perspectives since perspectives mingle withr contradictions. The result is the di-versity of approaches and names for a new way of doing business: "Socially (responsible) entrepreneurship, sustainability, community involvement, social entrepreneurship, social responsi-bility, co-creation, as business development, professionalization of voluntary initiatives, cross cul-tural understanding, etc." These visions lie as a basic concept for the development of innovative ideas and changes in society. They detect social injustices and inaccuracies in society and find ways to solve this problem in a sustainable nature through the application of business methods and entrepreneurial qualities.
Bulgaria and Romania as transition economies are currently facing a turning point due to the economic recession and budget cuts and there is a need for fundamental reforms in an economic, political and social level. As a way towards these reforms, and the efforts to privatize public goods and services, the ideas of social economy and social entrepreneurship entered the political agenda and a discussion around them was initiated.
Traditionally, both the Bulgarian and the Romanian social economies are considered to be rat-her weak, with very few strong formal institutions (trade unions of public servants and associa-tions of liberal professionals). However, there is a very strong informal sector that fulfils the functionality of formal institutions in other countries of the West.
Due to the emergence of the social entrepreneurship concept in Bulgaria and Romania there is a need to set the right foundation for its development and long term growth as the danger of its uncritical promotion lurks. With the new commitments to the forthcoming Operational program-mme period (2014-2020), the state policies indicate their intention to promote social entrepreneurship through various forms of networks and organizational forms. However, they also need to take action to ensure the independence of the field otherwise even this legitimate domain could do more harm than good, in the sense that in a permanently changing society, the system needs to be provoked by new ideas and input (Korn, 2009, p.51).
Therefore, what is crucial to understand is that social economy is not an impersonal concept, but it consists of groups of people with different beliefs, cultures, backgrounds, needs, etc. Hence, it is important to identify which factors are shaping the concept and uncover any problems before they arise. In order to do so, study should be deeply rooted into local perceptions, values and attitudes. Research so far shows that, the peculiarities of the Bulgarian and the Romanian historical background and social traditions have played an important role in the development of social economy sector that could potentially explain the fragmentation of the field.
Generally, the state of civil society in Bulgaria and Romania after the transition period is considered to be weak, in common with the rest South European countries. According to statistical surveys measuring the participation of citizens in organized forms of voluntary activities, Romania and Bulgaria can be found in one of the last positions of Europe, as can be seen in Figure 3 below, with less than 12% of the citizens being involved in social economy (Eurofound, 2011).

REDETE – ECONOMIC DEVELOPMENT AND ENTEREPRENEURSHIP IN TRANSITION ECONOMIES
762
Fig. 3: Frequency of participation in voluntary and charitable activities by EU Member State (%), Abbreviations for Bulgaria and Romania are RO and BG (Source: Eurofound, 2011, p.13)
Interestingly, social entrepreneurship in Bulgaria and Romania is seen differently from gover-nment (state) and individual (private) perspectives. The governments demonstrate tolerance to this phenomenon; simultaneously they show their superiority in solving social problems. That is why, though some steps in preparing legal framework can be seen, there is no coordinated policy in fostering social entrepreneurship. The state defines special type of NGOs, which mostly are very dependent on state financial support that means a very limited entrepreneurial freedom. Moreover, even if private social projects appear, government officials tend to support those of them, which can be lined to the main social governmental programs. That again means constraints for further development.
On the contrary, business society, universities and individual activists express interest to this phenomenon and initiate its development even if there is still no official legal framework. Thus, social entrepreneurship exists in the society as an attractive idea, at the same time it is not really formalized, which definitely impedes an objectivity and complexity of the analysis.
According to diffused opinion, social entrepreneurship takes the position between classical entrepreneurship and charity (Ribov, 2011). As apposed to charity, social entrepreneurship has other principles of functioning. Unlike classical entrepreneurship, it deals with social goals. Besides that, social entrepreneurship has the following five attributes (Ribov, 2010):
1. activity aimed on easing social problems;
2. innovation;
3. profitability and financial stability;
4. replicability;
5. entrepreneurial approach to overcome market failures and obtaining resources.
These features correspond almost entirely with those, we formulated before for the “hubbing”
and social networking cultures. Apart from defining the five main features, the experts differentiate three type of social entrepreneurship organizational formations:
- charity NGOs, which turned into for-profit organizations;
- organizations, specialized on employment of persons with physical disabilities or mental disorder;
- small-scale enterprise.

REDETE – ECONOMIC DEVELOPMENT AND ENTEREPRENEURSHIP IN TRANSITION ECONOMIES
763
No wonder that in the early 2009 after a booming period, the crisis was suddenly putting the buzz and the carelessness in the market in the shadow, business as usual, fast, with big numbers, boasting confidence and loud was becoming slower, stingy and low-voiced. In the middle of doomsday projections and with more free in May of 2010, 100 people converged, openly sharing our question. And for all those that were deciding to pursue it, in July, the HUB Bucharest started its initial phase of organization, while in Bulgaria the first steps had been made as well. In 2011, with a community formed, a bigger picture was to be born: the value found in connecting, supporting and enabling each other to bring more value was to be linked-in with a larger world, a wider network of game changers and more, to be collected in a single space, accessible and useful to all: The HUB Bucharest. A year later Bulgaria is on its way of obtaining the registration of its HUB.
At both The HUB Bucharest and The HUB Sofia, people from every profession, background and culture are being united by one thing: the imagination and drive to pursue enterprising ideas for the world. These are the people who see and do things differently and have entrepreneurial passion to create sustainable impact.
As the society is facing multiple crises in the global economic, social and ecological spheres, innovative solutions are needed to tackle the many challenges at hand. The HUBs in these two transition economy countries are facing the challenge to prove successful in having been designed to efficiently and effectively facilitate these solutions by creating a global network of collaborative spaces where entrepreneurs and social innovators come together to realize their ideas for a sustainable society.
5. Conclusion
Innovation in the 21st century differs from the model embraced in the last century which was characterized as a profit-oriented and nationally-targeted one. Currently the logic is being driven towards “the social” sense of the change within the reality of complexity and continuous necessity of design and re-design concepts. The underlying motive of innovation has been always perceived as generating economic value, which, however, looking ahead to the society in the future, is now being transformed into generating social challenges in a multi-layered complexity scenario. Thus there has been identified a need of finding effective ways to foster innovation, generating social and public value based on the interdependence and the emergence of the interrelated and constantly networking society.
Governments have to enable the promotion and functioning of social entrepreneurship networking as it unleashes decentralized knowledge and resource allocation mechanisms that increase economy’s dynamic efficiency, social entrepreneurs can identify hidden societal problems and reduce their negative consequences. Social entrepreneurs excel in incubating solutions at low cost that can then be adopted by others or institutionalized by government if proven effective, they can channel and focus in a positive way the energies and passions of the next generation, who increasingly look for meaning (instead of or in addition to profit).

REDETE – ECONOMIC DEVELOPMENT AND ENTEREPRENEURSHIP IN TRANSITION ECONOMIES
764
Reference list
1. Bar-Yam, Y., (2004), Making things work, US: Knowledge Press 2. Dacin, P. A., Dacin, M. T., & Matear, M. (2010). Social Entrepreneurship: Why We Don't
Need a New Theory and How We Move Forward From Here. Academy of Management Perspectives, 24(3), 37-57.
3. Daft, R. L., & Weick, K. E. (1984). Toward a Model of Organizations as Interpretation Systems. Academy of Management Review, 9(2), 284-295.
4. Drucker, P. F. (1987). Social innovation - Management´s New Dimension. In P. F. Drucker (Ed.), The Frontiers of Management: Where Tomorrow´s Decisions Are Being Shaped Today. Great Britain: Pergamon Journals Ltd.
5. Elkjaer, B. (2004). Organizational Learning: The "Third Way". Management Learning, 35(4), 419-434.
6. Greve, A., (2003), Social networks and entrepreneurship, Entrepreneurship, Theory & Practice, 28(1): 1-22.
7. Light, P. C., (2006), Reshaping Social Entrepreneurship, Stanford Social Innovation Review, Leland Stanford University, US.
8. March, J. G. (1991). Exploration and Exploitation in Organizational Learning. Organization Science, 2(1), 71-87.
9. Nijs, D.E.L.W., (2003). Imagineering: engineering for imagination in the emotion economy : presentation of the NHTV Associate Professorhip Imagineering. In Creating a fascinating world : associate professorships : sustainable transport and tourism, visitor management, imagineering. Breda: NHTV University of Applied Sciences.
10. Ribov, M., (2010), Integrative trends in the tourism science development. Alternatives for the contemporary tourism development. A miscellany of reports of a scientific conference, Varna, publishing house “Science and Economy”, Economic University, p. 33.
11. Seelos, C., Mair, J., (2005), Social entrepreneurship: Creating new business models to serve the poor, Business Horizons, Barcelona, Spain, p.241-248.
12. Voskolovic, N., Volkova-Duhovic, A.,(2012), Social Entrepreneurship: myth or reality? New Challenge for Russia, TSRC, UK
13. Weick, K. E., & Quinn, R. E. (1999). Organizational change and development. Annual Review of Psycology 50, 361-386.
14. Bureau of European Policy Advisers, (2011), Empowering people, driving change: Social innovation in the European Union, Luxembourg: Publications Office of the European Union.

REDETE – ECONOMIC DEVELOPMENT AND ENTEREPRENEURSHIP IN TRANSITION ECONOMIES
765
LEVEL OF UNDERSTANDING OF THE CONCEPT OF CORPORATE SOCIAL RESPONSIBILITY
IN UNA-SANA CANTON
Elvira ĆATIĆ-KAJTAZOVIĆ320
Abstract
One of the few generally accepted goals in Bosnia and Herzegovina is the membership in the European Union. Also, the institutions of the European Union are the biggest lobbyist and pro-moters of corporate social responsibility. To determine the level of understanding of the concept of corporate social responsibility, a research was conducted using a questionnaire with 3 sets of questions on a sample group of companies that operate in Una-Sana Canton. The results sho-wed the necessity of education and lack of information about corporate social responsibility. Specifically, companies that operate in the area USC still do not have a clear idea of true meaning of socially responsible business. Also, the research has shown the need for incurpo-rating CSR activities in the long term goals and strategies of the company, as that would secure availability of what costs the most, is wanted the most, and what the companies see as their greatest value, i.e. the combination of the following: a satisfied employee, a loyal customers and considerate society.
Keywords: Corporate social responsibility, Enterprise, Una-Sana Canton
320 University of Bihac, Faculty of Economics, Pape Ivana Pavla II, No2, 77 000 Bihac, BiH,

REDETE – ECONOMIC DEVELOPMENT AND ENTEREPRENEURSHIP IN TRANSITION ECONOMIES
766
1. Definition of terminology of Corporate Social Responsibility
Apart from the term Corporate Social Responsibility – CSR, translations in BiH also provide terms corporative, corporate or social responsibility. In analyzing of the subject of CSR one comes across a number of authors suggesting different definitions of CSR. Corporate social responsibility (CSR; Bowen, 1953; Drašček, 2006; Kotler and Lee, 2004; Littrell and Dickson, 1999; Margolis and Walsh, 2001; Willmott, 2001) is regarded as voluntary corporate commitment to exceed the explicit and implicit obligations imposed on a company by society's expectations of conventional corporate behavior (Falck and Heblich, 2007, p.247-254). Carroll (1979, p. 500) presented corporate social responsibility as a construct that ‘‘...encompasses the economic, legal, ethical, and discretionary expectations that society has of organizations at a given point in time.’’ Berens, van Reil and van Rekom noted “Doing good has become increasingly important in the last decades. Developments in this area have led to an ever-increasing attention to what became to be coined as CSR, i.e., corporate social responsibility” (2007, p. 233). Gustafson (2002, p. 291) described CSR as: “generally refers to an ongoing commitment by business to behave ethically and to contribute to economic development when demonstrating respect for people, communities, society at large, and the environment. In short, CSR marries the concepts of global citizenship with environmental stewardship and sustainable development”. For our purposes, despite the overwhelming sources of various definitions, we will adhere to the definition suggested by the European Union. The reason is simple: the concept of CSR is of crucial relevance for the countries that wish to join the EU. Namely, the CSR is one of the policies being strongly developed in the EU, as a part of the sustainable development. That support is demonstrated in the fact that 2005 was declared to be the year of the CSR.
The first official declaration of CSR in the EU occurred in March 2000, when a “special appe-al” was addressed to all the companies urging them to apply the concept of social responsibility. Since that time, various activities of the European Commission commenced and were aimed at development of the concept of CSR in the EU (SMEs Observatory, 2002, p.15):
1. The Social Policy Agenda (June 2000) underlined the importance of CSR from the
perspective of employees and social responsibility, but also consequences resulting from integrations of economies and markets.
2. Green Paper on Promoting a European Framework for Corporate Social Responsibility (July 2001) – the intention was to encourage a debate on all aspects of the CSR involving all the relevant partners. The Green Paper is a joint publication of the European Commission, DG Employment and DG Enterprise.
3. The first conference on CSP took place in November 2001.
In the Green Paper, the European Commission defined CSR as “a set of company’s actions
aimed at fulfillment of legal obligations defined by laws and contracts, but also those actions by which the company fulfills obligations that do not derive from formal-legal framework, such as investing in development of human resources, protection of environment, and improving relation-ships with all the relevant stakeholders “(GREEN PAPER,2001, p. 4.).
However, their preoccupation with CSR is not just a “new trend” and that was substantiated with publication of “Communication of CSR” in late 2011.The Commission puts forward a new definition of CSR as “the responsibility of enterprises for their impacts on society”. Respect for applicable legislation, and for collective agreements between social partners, is a prerequisite for meeting that responsibility. To fully meet their corporate social responsibility, enterprises should have in place a process to integrate social, environmental, ethical, human rights and consumer concerns into their business operations and core strategy in close collaboration with their

REDETE – ECONOMIC DEVELOPMENT AND ENTEREPRENEURSHIP IN TRANSITION ECONOMIES
767
stakeholders (Communication CSR,2011, p. 6). This document represents the EU strategy of CSR for the period 2011-2014.
Given the fact that the strategic objective of Bosnia and Herzegovina is to achieve full membership in the EU, with all its multifold relevance, one of the particularities of this objective is that it is one of the few that has a general consensus. Therefore, from that point of view, CSR is an inevitable necessity for our companies.
2. Research of the level of understanding of the concept of CSR in Una-sana canton
Determining the level of understanding of the concept of CSR among the business entities in Una-Sana Canton (USC) was the goal of the conducted research and the analyzed results are presented in the next section. In order to achieve the goal of the research, sets of questions were defined that referred to the following:
1. Defining the concept of CSR
2. Assessment of the current situation and the level of applicability of CSR in one’s own company
3. Assessment of the current situation and the level of applicability of CSR in Bosnia and Herzegovina.
It is important to underline the fact that researches conducted in Bosnia and Herzegovina are
made difficult to implement due to two fundamental reasons:
a. Lack of adequate statistical support
b. Large presence of grey economy
Such problems occurred in attempts to determine the number of business entities in Una-Sana
Canton, due to the significant discrepancies in numbers provided by different sources of statistics. The author of this paper adheres to the information on the total number of business entities in Una-Sana Canton published by the Federal Institute for Development Programming in their last analysis of macro-economic indicators by cantons. According to their report, the number of business entities in Una-Sana Canton is 11.277 (Federal Institute for Development Programming, 2010, p. 13). According to Slovin’s formula, the size of the sample should be 386321. The total of 90 questioners were filled out and returned, which represents a sample feedback rate of 23,31%. Of those, 73,33% are very small companies; 12,22% are small; 8,89% are medium sized; and 5,22% are large companies.
In determining how the company operates in direct interaction with its environment, the respondents brought up the following factors in answering the question “What factors in your environment positively affect your financial situation?“:
- Inflow of money from abroad,
- Improved economic situation,
- Quality of products and services,
- More acceptable prices,
- Export,
321 n=11277/1+(11277*0,0025); n=386

REDETE – ECONOMIC DEVELOPMENT AND ENTEREPRENEURSHIP IN TRANSITION ECONOMIES
768
- Acceptable prices from suppliers,
- Customer loyalty,
- Advantages over competition.
On the other hand, the respondents listed the following factors as the ones that negatively affect the company’s financial situation:
- General situation of the country,
- Unfair competition,
- Difficulties in collection of receivables,
- Low quality of goods,
- Non-existence of some legal regulations,
- Crisis,
- Low consumer buying power,
- Bad interaction of the local administration,
- Unemployment.
From the total number of companies included in the survey, 90% of them are privately owned (81), 8 companies are state-owned (8,89%), and 1 company has some other form of ownership (1,11%).
Samples subjected to surveys must also be represented geographically, and this dimension of the research was taken into account.
3. Results of the research of the level of understanding of the concept of CSR in Una-Sana canton
In order to achieve the most relevant determination of the level of understanding of CSR in Una-Sana Canton, the respondents were asked about their knowledge of the CSR. In their answers, 73,33% respondents replied that they were familiarized with CSR, 14,44% replied that they heard of the CSR but did not know what if referred to, 6,67% did not know about CSR, and 5,56% did not respond to this question. The following image is a graphical illustration of the results:
Graph 1: Awareness of the corporate social responsibility
6.67%Not aware
14.44%Yes, I heard
about it but I do not know to what does
it refer73.33%Yes, I am
aware
5.56%No response
Analysis of the research also provided some interesting results. Namely, although 73,33% of
the respondents replied that they were aware of the CSR, problems occurred in their attempt to provide definitions of CSR and respective activities. By CSR, the companies mainly refer to giving of donations and sponsorships, which represent only one portion of the CSR activities.

REDETE – ECONOMIC DEVELOPMENT AND ENTEREPRENEURSHIP IN TRANSITION ECONOMIES
769
Also, even those activities are sporadically present among companies. One can conclude that the lack of information about this concept of conducting business is one of the key problems in development of such concept in the companies in Una-Sana Canton.
When asked to rank the most important stakeholders in their company’s business operations, the respondents provided answers that are summarized in the following table.
Table 1: Ranking of the most relevant stakeholders in company’s operations
Rang Rank
Owners, shareholders
Employees Government Society as a
whole Customers Suppliers
1. place 31,11 % 12,22 % 2,22 % 5,56 % 46,67 % 0 % 2. place 17,78 % 35,56 % 2,22 % 4,44 % 20 % 17,78 % 3. place 11,11 % 28,89 % 3,33 % 10,00 % 16,67 % 22,22 % 4. place 10,00 % 5,56 % 10,00 % 25,56 % 7,78 % 22,22 % 5. place 5,56 % 2,22 % 22,22 % 26,67 % 1,11 % 6,67 % Total: 75,56 % 84,44 % 39,99 % 72,23 % 92,23 % 68, 89 %
31,11% of the respondents in this research are of opinion that the owners take up the first place
as the most important stakeholders; 17,78% think that the owners come in the second place; 11,11% put the owners in the third place; whereas 10% of the respondents see the owners in the fourth position. Only 5,56% of the respondents see the owners in the fifth place. Finally, 75,76% respondents think that owners should be placed in any of the five offered positions, whereas the remainder of the respondents (24,44%) do not see the owners as important stakeholders.
12,22% of the respondents think that the employees come first; 35,5% see them as second; 28,89% put employees in the third place; 5,56% rank employees as the fourth; and 2,22% see employees as the fifth most relevant stakeholders. Finally, 84,44% think that employees have an important role in one of the five offered positions, whereas 15,56% do not see employees as stakeholders in their company.
How important the customers are for the company show the figures by which 83 out of 90 respondents place the customers in of the ranking positions. Of those, 46,67% see their customers in the first place; 20% place them second; 16,67% place them third; 7,78% rank them fourth; and only 1,11% rank them in the last position. Sum of these percentages gives us a total of 92,22% respondents, due to only 7,78% of those who do not see customers as one of the relevant stakeholders for their company’s business.
Only 36 out of 90, or 39,99% of the respondents see the government as relevant. Of those, 2,22% see the government in the first place; 2,22% rank the government as second; 3,33% position it in the third place; 10% rank it fourth; and 22,22% see it in the fifth place. Also, 60% of the respondents do not see the government in any of the five offered ranking positions.
Suppliers are seen as relevant stakeholders by 68,89% of the respondents, whereas the remainder (31,11%) do not see them as relevant stakeholders. Of those who see the suppliers as relevant, 17,78% rnk the suppliers second; 22,22% rank them third; the same percentage of respondents rank the suppliers as fourth; and 6,67% rank them in the first place. None of the respondents see the suppliers in the first place.
Finally, one can conclude that the most relevant stakeholders for the surveyed companies are ranked in the following order: customers come first, followed by employees and then owners/shareholders.
In order to obtain the most reliable assessment of the level of understanding of the concept of CSR in Una-Sana Canton, the respondents were requested to mark three most relevant issues in business with CSR. As the most relevant, our respondents raised the quality of products and services at fair prices (62,10%). For successful achievement of entrepreneurial ideas, and not only by fair prices and quality, it is necessary to conduct business in accordance with legal regulations. This opinion is shared by 54,9% respondents. As the next relevant issues, the following were listed: communication with customers, general ethics and fair treatment towards employees.

REDETE – ECONOMIC DEVELOPMENT AND ENTEREPRENEURSHIP IN TRANSITION ECONOMIES
770
Lesser amount of relevance is attributed to investments in general community well-being. Only 4,44% respondents in this research think that investments should be made in general community well-being.
Scheme 1: Most relevant issues in CSR
Failure to recognize the need for investment in general community well-being, the need for fostering general ethics in business, and the need for development of fair treatment towards employees, illustrates the necessity for education on activities and advantages in implementation of the CSR.
Ranking of the most relevant company’s goals illustrates whether companies develop their social and/or ecological side of business along with their economic development. When asked to list three most relevant goals of their company, the respondents named the goals presented in Scheme 2.
Scheme 2: Three most relevant goals in companies in Una-Sana Canton
In 90% of the respondents the profit is the first and the most important company’s goal. Even
though a large percentage of the respondents list the profit as the most important goal, there are some companies that replaced that primary goal with the goal of achieving development, responsibility and employment. What every company would surely require in order to operate a successful business, apart from considering its productivity, is to also give consideration to
1. Profit 2. Busines with profit 3. Satisfied customers 4. Company's image
1. Development 2. Reponsibililty 3. Employment 4. Profit 5. Stability
1. Expanding capacities 2. Correct treatment 3. Capital 4. Market position 5. Endurance
Goal 1
Goal 2
Goal 3
5. Quality of products and services 6. Increasing production 7. Endurance 8. Further development
6. Satisfied customers7. Liquidity 8. Fair business 9. Competetiveness
6. Prices7. Liquidity 8. Profits 9. Employment 10. Satisified customers
Quality of products and services with fair prices
Conducting business legally
Investment in community well-being
Communication with customers, ethics and fair treatment to employees
4th place
3rd place
62,10%
2nd place
1st place
Others
54,90%
26,67%
4,44%

REDETE – ECONOMIC DEVELOPMENT AND ENTEREPRENEURSHIP IN TRANSITION ECONOMIES
771
satisfaction of its employees. In analysis of their responses, it was determined that it is those two issues that were listed last by our respondents. When asked “Does your statement of company’s vision or company’s mission, include any elements that concern activities of corporate social responsibility?“, the respondents provided answers illustrated in the following scheme:
Scheme 3: Presence of CSR elements in company‘s vision/mission statement
This question was listed at the end of the questionnaire by purpose so that through their writing of their responses and opinions of CSR, the respondents would gain more information about this type of a concept of running business. Based on these answers, one can conclude that more than half of the respondents have incorporated some forms of CSR into their vision or mission statements. Also, the 26,67% respondents who did not do so, plan to do that in the forthcoming period. Only 11,11% find that unnecessary. Furthermore, the said results are somewhat surprising if we take into consideration the previously presented results that clearly illustrated failure to recognize the relevance and activities of CSR. However, the results still make sense when observed in the context of analysis of responses to the following questions:
9. How would you rate the current situation and the level of applicability of CSR in one’s
own company,
10. How would you rate the current situation and the level of applicability of CSR in Bosnia and Herzegovina.
Assessment of CSR in one’s own company provided relatively good results, and somewhat
unexpected in light of the analysis of earlier responses. Namely, when asked how they would assess the current situation and the level of applicability of CSR in one’s own company, the respondents provided the following responses:
- Excellent 23,33 %
- Very good 36,67 %
- Good 28,89 %
- Bad 6,67 %
- No response 4,44 %
After they were asked to assess the situation with CSR in their own company, representatives
of the companies were asked to answer the following question: “How would you rate the current situation and the level of applicability of CSR in Bosnia and Herzegovina?”
To this question, the respondents replied as follows: - Excellent 4,44 %
- Very good 10,00 %
YES
NO, but we plan to do that
NO, no need for that
No response
52,27%
26,67%
11,11%
10,00%

REDETE – ECONOMIC DEVELOPMENT AND ENTEREPRENEURSHIP IN TRANSITION ECONOMIES
772
- Good 20,00 %
- Bad 63,33 %
- No response 2,22 %
If we compare this analysis with analysis of answers to the previous question, we observe an anomaly. Namely, only 6,67% respondents replied that the situation with CSR in their company is bad, and incidentally 63,33% replied that the CSR situation in BiH is bad. This discrepancy in understanding of the situation with CSR in one’s own company and the state of BiH, is more easily identifiable when illustrated graphically.
Graph 2: Assessment of the situation of CSR in one’s own company and in BiH
Based on the results illustrated in the graph, one can draw several conclusions: 1. There is awareness that the situation with CSR in BiH is bad.
2. Respondents’ subjectivity is evident when responding to questions concerning their own company
3. There is an evident urge to present one’s own company as being socially responsible
4. There is a risk of the identified subjectivity becoming an impediment in implementation of CSR-oriented running of business.
According to opinions expressed by respondents during our research, the fundamental obstac-
les for adoption of CSR practices, are the following: no legal regulations, corruption, lack of kno-wledge about CSR, bad state politics, fragmented market inside BiH, personal interests, financial crisis, disinterested executive authorities, lack of information sharing, indiligence of authorities, step-motherly treatment by authorities, grey economy, and political party favoritism towards some companies.
Excellent Very good Good Bad No response
One's own company

REDETE – ECONOMIC DEVELOPMENT AND ENTEREPRENEURSHIP IN TRANSITION ECONOMIES
773
4. Conclusion
The global idea of corporate responsibility and sustainable development became the world wide movement, and are increasingly encountering the headlines such as „World Movement of corporate social responsibility“. Currently, the corporate social responsibility is one of the most dynamic concepts of modern business. Corporate social responsibility evolves from company’s voluntary development of partnerships with the society in which the company operates. This con-cept of business practice, somewhat imposed on companies as an obligation of taking responsi-bility and care for society, resulted also as an answer of sustainable development to the increasing influence of businesses in every aspect of life. On the other hand, there is an unbreakable link between companies and the society where they operate. That bond of cause and effect also impo-ses company’s obligation to make investments and create good business environment. Institutions of the European Union are powerful promoters of the CSR concept. In late 2011, a strategy on development of CSR 2011-2014 was published, which proved that the concept of CSR is an inevitable necessity of the modern age.
Regardless of that, there is still a lack of support for development of this concept of business practice in Una-Sana Canton. Also, the companies that operate in Una-Sana Canton do not give priority to the CSR in their business practice, justifying their stance with a question: “As long as I can barely take care of myself, how can I take care of the society”? However, the threat hides in the following: Only in “healthy” society, can a company grow, develop and run a business with stability. The degree of understanding and applicability of the concept of CSR in USC has been presented in the form of analysis of the results of the study. The questionnaire represents the attitude of companies towards social responsibility. The questionnaire filled out the managers of enterprises who appreciate the answers to your own signature and seal of the company. Analysis of the research provided some interesting results. Namely, it can be concluded that the lack of information about the concept of corporate social responsibility is one of the key problems for companies in USC. Still potential for improving CSR exist: 1. Based on these responses can be concluded that more than half of those surveyed some forms of CSR incorporated in its statements on its vision and mission, 2. There is awareness that the situation with CSR in BiH is bad, and that it must improve.
References
1. Berens, G., van Reil, C. & van Rekom, J. (2007). The CSR-quality trade-off: When can corpo-rate social responsibility and corporate ability compensate each other? Journal of Business Ethics, 74, pp. 233-252
2. Carroll, A. B. (1979). A three-dimensional conceptual model of corporate performance. Academy of Management Review, 4(4), pp.497-505
3. Communication from The Commission to The European Parliament, The Council, The European Economic and Social Committee and The Committee of The Regions, A renewed EU strategy 2011-14 for Corporate Social Responsibility, Commission Of the European Communities, Brussels, 25.10.2011, COM(2011) 681 final. http://eur-lex.europa.eu/LexUriServ/LexUriServ.do?uri=COM:2011:0681:FIN:EN:PDF (accessed 04.05.2012.)
4. Falck, O., Heblich, S. (2007). Corporate Social Responsibility: Doing well by Doing Good. Business Horizons, 50 (3), pp. 247-254
5. GREEN PAPER, (2001) Promoting a European framework for Corporate Social Responsibility, Commission Of the European Communities, Brussels, 18.7.2001, COM(2001) 366 final. http://eur-lex.europa.eu/LexUriServ/site/en/com/2001/com2001_0366en01.pdf (accessed 10.05.2012.)

REDETE – ECONOMIC DEVELOPMENT AND ENTEREPRENEURSHIP IN TRANSITION ECONOMIES
774
6. Gustafson, J. (2002). Corporate Social Responsibility: Are You Giving Back or Just Giving Away?. Business the ultimate Resource Winchester, U.K.: Bloomsbury Publishing Plc
7. Macro-economic indicators by cantons in 2010, Federal Institute for Development Programming (2010) http://www.fzzpr.gov.ba/upload/file/dokumenti/makroekonomski_i_socioekonomski_pokazatelji/makroekonomski_pokazatelji_po_kantonima_2010.pdf (accessed 02.02.2012.)
8. Observatory of European SMEs, European SMEs and Social and Environmental Responsibility, (2002) http://ec.europa.eu/enterprise/policies/sme/files/analysis/doc/smes_observatory_2002_report4_en.pdf (accessed 20.12.2011.)

REDETE – ECONOMIC DEVELOPMENT AND ENTEREPRENEURSHIP IN TRANSITION ECONOMIES
775
BUSINESS ETHICS AND COMPANY PERFORMANCE
Zoran LUKIĆ322 Dragana DOŠENOVIĆ323
Abstract
Business entities were in different forms and under influence of various factors within di-fferent phases of their historical development. One of the main preconditions for successful bu-siness and unhindered development was institutionalized form of organization. One of business organizational forms which has solid basis for successfully operating business is Corporation and A joint-stock company within it. At the same time, within modern market economy, special attention is paid to large business forms, such as Holding and Corporation. Corporation, as a unique business form, represents basis for development of any economy. Functioning of corpo-rations is regulated by many normative acts, and we are specially processing segment of corpo-rate management. Corporate management represents complex managerial mechanism for ma-naging any business successfully. Corporate management is affected by significant number of factors. We want to emphasize the importance of business ethics on business performance. Non-material elements of management were neglected in earlier periods, such as influence with all sub-functions and organizational behaviour. With development of technology and productive-ness to their limits, some additional sources in work were discovered just in those new elements of business, where business ethics and social responsibility have prominent position.
Key expressions: joint-stock companies, big business systems, corporations, corporate go-vernance, non-material elements of management, business ethics, ethical principles, code of conduct.
322 University of Banja Luka, Faculty of Economics, Email: [email protected] 323 Postgraduate student at University of Banja Luka, Faculty of Economics, Email: [email protected]

REDETE – ECONOMIC DEVELOPMENT AND ENTEREPRENEURSHIP IN TRANSITION ECONOMIES
776
Introduction
A business entity operating is under the impact of large number of internal and external facto-rs. Some new fields rise from development of many disciplines, or the importance of some tradi-tional ones become evident for companies’ performance. In these times, ethics has even larger im-portance for business entities operating in contemporary conditions and especially in the period of global crisis that is connected to certain moral norms. Ethics implies adopting various ethical principles, i.e. moral norms in business world.
Therefore, codexes of business ethics are more applied, somewhere formally and somewhere essentially, which can be beneficial to the companies in the following: improvement in society reputation, improvement in risk and crisis management, improvement in communication with interests holders, development of corporative culture, putting accent on corporative values along with planned avoiding of conflicts within company as well as misunderstandings with business partners.
This work is aimed at examining and proving certain assertions related to codex of business ethics, therefore we marked main problem of research and it refers to examining impact of business ethics on business success in large business systems, i.e. corporations.
Considering defined problem of research which is economic as well as legal, the subject of research can be defined as field of economy, especially related to corporate governance, field of law related to legislations on economic bodies and their performance on capital markets as well as field of sociology, psychology and other sciences that research problems of ethics and moral.
Aims of research are complex as well and refer to presentation of basic notions on corporatio-ns, corporate governance, business ethics as well as defining and revealing presence of causes and effects between business ethics and business success along with elaborating impact of business ethics upon business success. At the same time, we will examine and point out the current situation in Republic of Srpska related to corporate governance as well as to business ethics.
Starting point of our research refers to setting in which adopting and applying different principles of business ethics can influence positively business success of large business systems, ie. in this case corporations.
1. Emergence of modern corporation and corporate governance.
1.1 Emergence and concept of corporation.
Examining contemporary terms of business, it is easily noticeable that large business systems have enormous importance for economy of every country. Although the importance of today’s small and medium enterprises can not be denied,
it must be acknowledged that their success as well as survival is largely due to large companies without whom the business world would be inconceivable.
Reviewing large business systems around the world, we can come to the conclusion that the most frequent form of them is corporation. That is how it represents dominant organizational form in developed countries within market economy, in which there are those business systems which act as unique entities within business as well as proprietary sense.
Initial forms of corporate companies were established in 16th century in England and Spain, but we can say that modern corporations were established in mid-19th century, when some legal solutions were introduced within this domain in Great Britain. In 20th century, this form of organization becomes dominant in world economy and emerges in all spheres of business. That is how corporations, bringing themselves a large number of innovations (that reflects in ownership release from liability in relation to obligations of corporations, establishment and development of

REDETE – ECONOMIC DEVELOPMENT AND ENTEREPRENEURSHIP IN TRANSITION ECONOMIES
777
capital market along with detaching management from ownership), become subject of larger in-terest and intensive research.
This form of organization differs from others in its specific characteristics. That is how corpo-ration represents joint-stock company based upon its institutionalized structure and determination, which means that corporation researches and finds capital, necessary for its performance, through emitting and selling off stocks. In this way, principal (share) capital is acquired as well as some additional one, if there is a need for that. Second characteristic of corporation is that it represents unique entity in business and proprietary sense, i.e. makes complete business and organizational system that has a status of legal person. Legal person has its property, capital, trade and manage-ment bodies. One of the characteristics is that regardless of corporation size, it represents billing control unit against the society, therefore establishing business results and monitoring tax and other obligations is performed on corporate level only.
When internal organization is in question, we can say that large business systems, organized as corporations are more or less decentralized. Basic concept of internal organization is based upon profit decentralization. Corporations are composed of large number of business units of different type and level of autonomy in operating, being formed in different segments of performance that are mostly made of separate, complete, business and market units, such as business activities, lines of manufacturing, groups of products, manufacturing stages etc.
Business units formed on that base are profit centers, strategic business units, cost centers, investment and other centers.
Considering the fact that corporation is a unique system in business and proprietary sense, all the capital is in the possession of corporation and divided on shares owned by individual owners, which are named at company. Managing decisions related to capital and performance is made by managing bodies, formed on corporate level, and they are: shareholders’ meeting, administrative board and very often auditing committee.
Main players of corporate governance system are shareholders, i.e. owners of a corporation, managers along with professional head of corporation activities and corporation itself has to provide maximizing of three long-term economic benefits for shareholders, and those are: profit maximizing, dividend maximizing and maximizing of shares market value.
On the basis of above mentioned, we can conclude that distribution of corporations is caused by its various advantages, compared to other forms of organizing. Great advantage certainly is li-mited liability of its owners, who are accountable for only the range of shares value that they own. Within those shares value, owners bear the risk and are not personally responsible for corpo-ration’s debt. Easy transfer of property is one of the advantages in this form of organizing and implies possibilities for the shares owner to sell them completely or partially when he wants to. Another advantage is possibility of collecting huge amount of financial means from various individuals, which enables undertaking important business ventures. By means of emission and selling of shares, powerful financial corporations are formed and they often have massive number of shareholders, given in millions.
1.2 Corporate governance
It can be said that there is no unique definition of corporate governance. International financial corporation defines it as ‘structure for leading and
control of economic bodies’ 324 Although there are numerous definitions, depending on the in-stitution, country or legal tradition, each one of them claims that corporate governance is essen-tially a system of relations, defined in structures and processes. These relations can encompass
324IFC – International Financial Corporation, Corporate governance, Guide book for companies in Bosnia and Herzegovina,
IFC Sarajevo, 2009.

REDETE – ECONOMIC DEVELOPMENT AND ENTEREPRENEURSHIP IN TRANSITION ECONOMIES
778
parties with different and sometimes opposite interests, which have to be carefully observed and kept in balance. To achieve that, it is necessary for all parties to participate in managing and con-trolling of society, in some way, which will lead towards proper distribution of rights and liabili-ties with the final outcome in enlarging long-term value for shareholders, i.e. corporation owners.
In the last few years, numerous regulations were brought, containing the best practices and pri-nciples of corporate governance; one of those very important principles are OECD principles which are focused upon the whole framework of business. They are developed to provide advices on proper management and are accepted worldwide. Principles were issued in 1999 and reviewed in 2004. Framework of corporate governance by OECD principles is based on four basic values: impartiality, obligation, transparency and liability. First value refers to protection of rights and equal treatment for all the shareholders, majority and minority shareholders as well as foreign ones. Obligation relates to acknowledgement of rights to all interest holders and encouraging of active cooperation between them and corporation itself. The third value implies timely and correct revealing of information on all for company important issues, whereas liability incorporates strategic directing of the company, efficient monitoring of administration by the board as well as responsibility of board towards the company and shareholders.
In order to provide control of corporation management and its effects along with managers’ work success, various mechanisms of corporate governance are created; they can be divided in two groups: internal and external mechanisms. Internal mechanisms refer to separation of mana-gement from ownership, which represents assumption for establishing this system of manage-ment, strategic planning, effective and timely reporting, professionalizing of manager’s position and bodies, defining standards (norms) of performance effects, measuring and valuing managers’ work success, creating reward system for managers, concentration of ownership, establishing administrative boards of shareholders, establishing and maintaining relations with internally influ-ential groups, as well as issuing information and financial transparency. External mechanisms of corporate governance are: market for corporate management which disciplines managers and makes them use corporate resources effectively for the interest of their shareholders, legal infra-structure (well structured framework), protection of minority shareholders and competitiveness.
Corporate governance has its own two models: open model of corporate management and closed model of corporate management.325 Basic differences between those two models are in systems of allocation of socio-economic power, ways of marking the efficiency of managers’ performance and positions, i.e. relationship between managers and corporation owners. Open model of corporate management is also recognized as Anglo American, market or outsider’s. Capital market has got main monitoring role within it, and it conducts observing over corporation performance as well as control of effectiveness and successfulness in managers’ performance. Means for evaluating are growth or decrease of share prices, whereas shift of unsuccessful managers is not done by shareholders, as it is the case with closed model of corporate mana-gement. It is being done by opponents and other transferees through replacement of unsuccessful one with the new effective management, increasing profitability in that manner. Fear from take-over leads to managers using all available resources effectively and therefore increase the value of shares and corporation itself. In this model, managers are key players in corporation management; they have important role and therefore, decide upon important issues; they focus on their own benefits and welfare. Closed model of corporate management is also named internal (insiders), continental or continentally Japanese. Main characteristic of this model is high ownership concen-tration and along with that also dominant position of corporation shareholders. Shareholders are main conductors of monitoring and control of performance and successfulness in managers’ work. Successful managers are rewarded, and the ones, who are not successful, are punished and
325 Babić,M., Lukić, 3.; Management,Theories,Functions, Institutional Aspects and Corporate governance, Faculty of
Economy, Banja Luka, 2008.

REDETE – ECONOMIC DEVELOPMENT AND ENTEREPRENEURSHIP IN TRANSITION ECONOMIES
779
replaced; monitoring of their success is based upon internal and not external indicators, like with open model. Institutional investors are less important with this model, and business banks have important role, which are creditors and share owners at the same time.
Important characteristic of this model is detachment of auditing role, conducted by auditing board, and operative-administrative, done by top management.
2. Concept and importance of business ethics
2.1 Business ethics
To define meaning of business ethics, we have to first define term of ethics itself. This term originates from Greek word ethos, which means custom, habit, character, philosophy of moral. Ethics represents science on moral and its creator is Greek philosopher Socrates; ethics in its basis was philosophic discipline for him, which defines notions of human virtues such as: righteousness, bravery, humaneness, goodness and above all separates good from bad and true from lie. Ethics can be defined as philosophy of moral that researches meaning and aims of moral norms, main criteria for moral valuation as well as the science itself along with moral sources. Ethics belong to philosophy and deals with researching man’s natural behaviour, that helps him to express his customs, habits and moral in given time and space. That is how man depicts an image of himself, his character and moral to his interlocutor.
If work was defined as acting with goal or as a mission, and ethics, as a science that regulates and determines rules of human behaviour, therefore business ethics could be defined as applying and acknowledging of ethical principles in all business activities. Foundation of business ethics is behaviour in accordance with laws, which incorporates providing transparent information, fair approach towards competition, employees, shareholders, partners as well as focusing upon social responsibility and sustainable development. From the above mentioned, we can learn that business ethics is not present only in relations between a company and environment; relationships within the company itself are also very important. That is how relations between employer and management, as well as relation towards employees, should be perceived through the prism of business ethics and moral behaviour. There are multiple benefits that organization gets from business ethics implementation along with ethical behaviour. They are beneficial in the long run, because such business manner affects not only reduction of costs, which appeared as the consequence of non ethical behaviour of employees and other members of economic body, but in that manner ethical climate within organization is developed and teamwork is improved which overall affects positive image of organization in public.
Main question raised, in relation to business ethics, is identifying the border which determines whether some matter in business is moral or not. Defining the border is challenge for every individual. ‘It is the matter of personal decision, personal perception of situation, needs, interests and motifs, the question of personal moral integrity but also the question of cultural inheritance, expectations and pressures that come from the company and environment’.326
In today’s global world, business ethics became irreplaceable part of business practice and main condition for reaching business success in short as well as long period. Business ethics acquires strategic role, because it helps organization to create management system, based upon ethical principles, which enables quality response to claims of all interest groups, which are directly and indirectly related to the organization. It is believed that successful organizations are
326 Šijaković, I; Business Ethics, (internet), available at http://www.sijakovic.com/02/poslovnaetika/, (site visited on 25th
August 2012), 2008

REDETE – ECONOMIC DEVELOPMENT AND ENTEREPRENEURSHIP IN TRANSITION ECONOMIES
780
only the ones who: ‘do not separate ethics from profitability, but harmonize it successfully in its performance’ (Aleksić, 2007)
In order to regulate business ethics, it is necessary to define its principles. This is enabled through codexes of business ethics, also named as codexes of business behaviour or ethical codexes. These codexes refer to collection of formal and informal rules, schemes, regulations and good practises in business conduct and serve as frame to follow, in order to formally aid operating in much more complicated conditions on the market.
We can say that business ethics represents ’soul’ of socially responsible conduct in a company, but not only in form of approved regulations and ethical codexes; they have to be real reflection of synergy and communication with internal and external environment.
2.2 Codex of business ethics
In order to explain importance and role of business ethics codex, it is best to describe all fields regulated by the codex. Majority of these codexes has the same or similar content in countries that adopted it and legally regulated. Therefore, in the following text, some parts of the codex, approved in Republic of Srpska, will be presented along with the ones from neighboring countries.
Codex of business ethics serves to establishing higher moral level of business entities within the organization itself. Through this codex, values are defined and expected eligible conducts based upon those values, as well as the ones that are not going to be tolerated. Codex of business ethics along with codex of corporate management should represent basis for business policy of business entities in some country.
Majority of business ethics codexes is composed of few separate units that regulate certain segments of company business, so it can be divided into more parts that are going to be separately elaborated in this paper.
First part of the codex mainly refers to basic provisions, and they incorporate questions such as: domain of codex implementation, principles and rules of business ethics, purpose of the codex and individuals that codex refers to.
Apart from domains stated above, basic terms used in codex are defined in basic provisions of the codex, such as: 327
1. Moral – represents a group of norms (rules) that regulate people’s behaviour, through directing towards realization of some interest, which is spontaneously created and autonomously accepted within social community.
2. Business ethics – refers to those moral norms (rules) that are relevant in business relations; incorporates principles and standards, spontaneously created or established, based upon moral virtues and professional well-being; they regulate conduct of individuals that codex refers to.
3. Activity of business entity – implies conducting activities approved by the law.
4. Competition – are natural or legal persons conducting the same or similar activities on the market aiming at profit generation.
5. Consumer – is person who buys the product or uses the service of other business entity as final user.
Second part of the codex defines basic principles, such as: principle of personal responsibility,
legal business, fairness and conscientiousness, prohibition of legal misusage, principle of respect
327 Board of trade of Republic of Srpska; Ethical codex, (internet), available at
http://www.komorars.ba/pkrs/static/92/regulativa_PKRS, (site visited on 17th August 2012), 2012.

REDETE – ECONOMIC DEVELOPMENT AND ENTEREPRENEURSHIP IN TRANSITION ECONOMIES
781
for business partners, negotiating, creating of contract provisions, prohibition of concluding false contracts, principle of duty to fulfill and execute obligations, principle of realizing rights and principle of peaceful settlement of disputes.
Third part of the codex is dedicated to internal affairs within business entity and incorporates several segments. It is used to define rights and liabilities of employees as well as the position of members of business entity bodies, i.e. employees and persons employed on the basis of contract, i.e. different persons participating in society activities in any way. These persons imply: directors, members of administrative, auditing and executive board along with revision board, internal controller and other members of economic body. This part also defines protection of business entity’s ownership as well as keeping business and minute-books.
Apart from internal relations, codex also regulates external relations. In this part, we can find information and rules for regulating different relations such as: relationship with consumers, customers, supplies, financiers, owners as well as public relations and relations with state bodies.
Fifth part of the codex, related to protection of free competition, defines several fields: pro-hibition of actions that violates free competition, collecting information about competitors, pro-hibiting of violation of business reputation of other business entities, prohibiting of support to pro-ducts and services of competition companies, prohibiting boycott, prohibiting misusage of domi-nant position, prohibiting misusage of monopoly agreements, prohibiting misusage of monopoly position, prohibition of dumpers, prohibition of speculations and limiting of market.
Codex of business ethics defines protection of environment, and therefore defines responsi-bility of business entities, obliged to raise the awareness on importance of environment protection, which is provided through improving of work process through system of scientific research and technological development and popularization of environment protection.
After all the above mentioned, every codex also contains part that refers to rules of its implementation, where implementation is defined along with monitoring of the same.
2. Corporate governance and regulation of business ethics in Republic of Srpska
Although it is considered that today’s corporate governance is one of the key elements for improvement of economic efficiency, for growth and development of companies and also for im-provement of trust and attracting investors, it is relatively new occurrence in Republic of Srpska. However, to insure persuasive and understandable corporate governance, and therefore to gain numerous benefits, it caries with itself, it is necessary to bring adequate laws and other legal acts to regulate this matter.
When legal regulation of corporate governance and business ethics is in question, in Republic of Srpska, it is necessary to mention valid law that regulates performance of all business entities. That is the Company Law 328 used to arrange establishing economic bodies, managing bodies, rights and liabilities of founders, partners, members and shareholders, networking, reorganizing and liquidation of economic bodies. Economic bodies imply legal persons who establish legal and/or natural persons for conducting activities in order to gain profit.
As a legal form of economic bodies, joint-stock company is defined according to this law, article 179, as: ‘economic body that is established by one or more legal and/or natural persons, as shareholders for conducting certain activities, under the same business name, whose principal capital is determined and distributed into shares’.329 This law regulated various issues related to corporations and corporate governance.
328This Law is published in Official Gazette of Republic of Srpska; 31/12/2008. It came into effect eight days after issuing
and its implementation started from 01/07/2009. 329Official Gazette of Republic of Srpska (127); Company Law, Banja Luka, 2008.

REDETE – ECONOMIC DEVELOPMENT AND ENTEREPRENEURSHIP IN TRANSITION ECONOMIES
782
When business ethics is in question, article 309 of this law, refers to codex of conduct and relates to its implementation. The first paragraph of article mentioned, states that administrative board of open joint-stock company, whose shares are included in official stock market, is obliged to bring its codex of conduct in writing or accept standards of corporate governance that committee for securities administration of Republic of Srpska brings.
In second paragraph of this article, it is stated that joint-stock company issues codex of conduct on their internet page, whereas third paragraph defines regulation of administrative board that obliges them, on every annual general meeting and in annual report on performance, to give state-ment upon compatibility of organization and acting in compliance with codex of conduct and elaborates every mismatch of company with codex if it occurred.
Apart from the Company Law, the question of ethics for companies in Republic of Srpska is regulated through codex of business ethics of Board of trade in Republic of Srpska 330 which obliges business entities, members of Board of trade in Republic of Srpska, employyees, members of bodies and persons employed on the basis of contract within business entity. This codex obliges business entities, its subsidiaries and regional offices in Republic of Srpska and abroad, and it was issued on 15th March 2006.
Question of business ethics is also regulated with Ordinance on reporting and issuing information by issuer of securities that are the subject of public offering. This ordinance is issued on 10th October 2007, and complemented on 31st December 2011.
However, when the situation of corporate sector in Republic of Srpska is realistically reviewed, it is noticeable that there are numerous problems. One of it is surely centralized ownership, i.e. controlling of the company by smaller group of shareholders, which creates larger possibility for misusage by minority shareholders. In addition to that, this sector also has the problem of very small detachedness of ownership from control, and it is not rare occurrence that persons, who own controlling interest, are usually general managers or members of board in the company. It is not only that their objectiveness is questionable here, but expertise as well. In this manner, inexperi-enced and inadequate corporate bodies are created, which results in inefficient management, and therefore lower possibility for achieving business success. On the basis of analysis, we can say that the level of applying corporate governance in companies in Republic of Srpska is very low, and companies do not show any will to run the company transparently and promote good corpo-rate management. It is thought that in these companies, activities of corporate governance come from legal regulations that were imposed by authorized institutions which do not have enough expertise upon corporate governance. Small number of companies really understands depth and complexity of this topic, therefore reforms of corporate governance are often introduced super-ficially and are rather used as promotional activity than a mean for introduction of structure and process that enables company to acquire trust of its shareholders, to manage risks and improve possibilities for access to capital.
In addition to problems named, through analysis of observed sector, we can conclude that one of the causes of insufficient business successfulness in corporations certainly is business ethics. Reason for that is in the fact that majority of companies from this sector in Republic of Srpska do not even have codex of business ethics. On the other hand, large percentage of those companies which are in the opposite group, created their codex only for the legal obligation.
330Board of trade in Republic of Srpska – nongovernmental, independent, professional, business organization, independent
and non-profitable public and legal association of business entities and economic associations in the area of Republic of Srpska, based upon Law of Board of trade in Republic of Srpska (Official Gazette of Republic of Srpska, number 65/08).

REDETE – ECONOMIC DEVELOPMENT AND ENTEREPRENEURSHIP IN TRANSITION ECONOMIES
783
4. Importance of business ethics for business success.
Frequently asked question is how business ethics can influence company’s business successful-ness. Certain researches conducted around the world as well as in our country state various ways.
Since the purpose of business ethics is to contribute completion of various business activities in compliance with business moral, good business customs and principles of conscientiousness and fairness; business ethics focuses on liability of business entities related to all the employees along with all other business partners towards whom company has to show respect and acknow-ledgement. Respect for human dignity and appreciation of human rights makes basics of all re-lationships among employees. All the employees have the right on clean and sound working envi-ronment, protection at work as well as encouraging conditions for creative work and vocational training. In accordance with qualifications, experience, working conditions and working hours, every employee has the right on salary and limited working hours. Their political rights and free choice out of working hours and out of working environment must be respected, and within the work position, they have the right to organize themselves and act within union. Employees have the right on privacy related to all the information about them. All this affects employees’ motivation. On the other hand, all employees as well as members of bodies in business entity have duty to act in the best possible interest for the company. All the above mentioned persons have duty to make conscientious business evaluations and have duty to avoid conflict of interests. It is of crucial importance for business quality to protect ownership of business entity, therefore there is liability of above mentioned persons for protection, accumulation and rational usage of property owned by business entity.
When external relations of a company are in question, its relations with consumers are very important; company has to treat them with respect and put effort into meeting their needs, where deceit of consumers is strictly forbidden. Business entity is also obliged to develop quality cooperation with suppliers, fulfilling arranged obligations regularly. In case those third parties are financiers, results and business plan have to be presented objectively and all obligations must be fulfilled. Relation towards owners is especially important, therefore compliance with business ethics implies running business in responsible way towards owners, and all that to protect their rights and investments. All the shareholders have the right on timely presented, quality and truthful information and to influence business strategy development through general meeting and company bodies. All the shareholders, minority ones along with foreign ones, have the above mentioned rights because of obligation of the company to respect equal treatment of owners. Business entity is also obliged to contribute social development through its activities, through encouraging employees and members of bodies to actively participate in social life. When public is in question, very important obligation is the one related to timely, regular and reliable infor-ming upon business performance.
Business ethics also regulates protection of free competition through different restrictions, such as: forbidding actions that infringe free competition, forbidding violation of business reputation of other business entities, prohibition of support to products and services from competition companies, prohibition of boycott, prohibition of misusage of dominant position, prohibition of monopoly agreements and misusage of monopoly position, prohibition of dumpers, prohibition of speculations and limitations to the market.
Adoption and acknowledgement of business ethics principles provide image improvement, i.e. society image improvement, and they make non material part of assets. It is also useful for directing attention of all employees in a company towards potential problems, which can prevent total crisis. That is the way which enables development of corporate culture and focusing on corporate values. This codex is used for improvement of communication with interest holders and for avoiding court litigations that are result of different frauds, conflict of interests, corruptions, bribing etc.
All the above mentioned advantages that are brought by adoption and acknowledgement of certain business ethics principles, directly or indirectly affect increase of profits or decrease of

REDETE – ECONOMIC DEVELOPMENT AND ENTEREPRENEURSHIP IN TRANSITION ECONOMIES
784
costs, and it is finally going to lead to increase of business successfulness in those companies which not only define but apply those principles.
Conclusion
Performance of any company, and especially corporations, must be established with all nece-ssary normative acts, regardless if it is necessary or as a result of realistic needs. Performance of modern companies and especially successful performance can be related to appliance of certain moral and ethical standards. Aiming at that, business ethics represents important, and in public companies obligatory, segment of normatively regulated business performance. Business ethics can be defined easily as adoption and appliance of ethical principles in all business activities.
If global conditions of business performance are perceived, we can conclude that business ethics has growing influence for all business entities, and especially for the ones who emit their securities at capital markets. Numerous reasons brought to the situation where ethics became irreplaceable part of business practice and main precondition for realization of business success in short period of time as well as in the long run. It gains strategic importance, because it helps or-ganization to create management system that is based on ethical principles, and it enables quality response to all claims from interest groups, being directly or indirectly connected to organization.
Adopting and issuing of codex of business ethics, that defines rules, principles, and good customs in business conduct, is one of the most efficient means for achieving organizational goals. Codex influences better reputation, improvement of risk and crisis management, improve-ment of communication with interest holders, development of corporate culture and focusing on corporate values; codex influences avoiding court litigations of business entity, reduction of costs directly or indirectly as well as increase of profits and consequently realized profits. Starting point of this work was problem of impact of business ethics upon business success in large business systems, especially in corporations; on the basis of represented theoretical and practical know-ledge, we can conclude that presence and appliance of principles and rules of business ethics, positively affects company’s business success from the observed sector; it can be confirmed by starting basis of research in this work.
Reference list
1. Babić, M., Lukić, Y.Č Management, Theories, Functions, Institutionalised Aspects and Corporate governance, Faculty of Economy, Banja Luka, 2008.
2. IFC - International Financial Corporation, Corporate governance, Guide Book for Companies in Bosnia and Herzegovina, IFC Sarajevo, 2009.
3. Board of Trade Republic of Srpska; Ethical Codex,(internet), available at : http://www.komorars.ba/pkrs/static/92/regulativa_PKRS, (site visited on 17th august 2012), 2012.
4. Official Gazette Republic of Srpska (127); Company Law, Banja Luka, 2008. 5. Official Gazette Republic of Serbia (1/006),; Codex of Business Ethics, Belgrade, 2006. 6. Šijaković, I.; Business Ethics, (internet), available at: http://www.sijakovic.com/02/poslovna-
etika/ , (site visited on 25th August 2012), 2008.

PART TEN:
Tourism, Regional Developed, Cross-Border Collaboration, Sustainability

STRATEGIC APPROACH OF SUSTAINABLE MANAGEMENT OF THE DEVELOPMENT OF RURAL TOURISM
- A CASE STUDY IN MACEDONIA
Blagoj GORGIEVSKI331
Abstract
Tourism generally and rural tourism especially is one of the largest and fastest growing in-dustries in the world. It is an increasingly important source of income, employment and wealth in many countries and regions. However, its rapid expansion has also had detrimental envi-ronmental (and socio-cultural) impact in many regions.
Define the sustainable tourism strategic goals seek to exploit national and community re-sources and sweep away constraints. There are several keys to success for effectiveness of sustainable tourism strategiess such as the person or team formulating the strategy is skilled not only in tourism development but also in economic, ecological and social analysis, wide consul-tations amongst all interest groups are essential, tourism relies more than any other industry on local goodwill — the ability to make holidaymakers feel welcome, the strategy-making process should not be a once-only affair. It has to be an evolving long-term enterprise, able to cope with change, and able to admit to its own mistakes and shortcomings
This paper reviews how the principles of sustainable tourism have special relevance to the development of rural tourism, and examines how those principles can be translated into practice by the writing and implementing of sustainable rural tourism strategies.Therefore, a case study is given of the development of a rural tourism strategy in Macedonia.
Key points: strategy, development, sustainable rural tourism
331 [email protected] University “ St. Kliment Ohridski” – Bitola, Faculty of Law, R. Macedonia,

REDETE – ECONOMIC DEVELOPMENT AND ENTEREPRENEURSHIP IN TRANSITION ECONOMIES
787
Introduction
Over the last 20 years the concept of sustainable tourism has been developed to counter the threats which unmanaged tourism can bring. Sustainable tourism sees tourism within destination areas as a triangular relationship between host areas and their habitats and peoples, holidayma-kers, and the tourism industry. In the past, the tourism industry dominated the triangle. Sustain-able tourism aims to reconcile the tensions between the three partners in the triangle, and keep the equilibrium in the long term. Sustainable tourism aims to minimise environmental and cultural damage, optimise visitor satisfaction, and maximise long- term economic growth for the region. It is way of obtaining a balance between the growth potential of tourism and the conservation needs of the environment (see Krippendorf et al., 1988; English Tourist Board, 1991; Hawkes & Williams, 1993; Bramwell & Lane, 1993).
Over a similar time-span, tourism in rural areas has grown, partly because of market forces, seeking different kinds of holiday, and partly as a result of government initiatives (Lane, 1991a; Weiler & Hall, 1992). This growth has been most noticeable in the countries of the developed world, where sophisticated economic diversification agencies have been hard at work promoting new uses for the countryside, influencing both potential providers of tourism facilities, and the markets for rural tourism through press and media contacts. Tourism is seen as an agent for rural economic re-generation and as a way of valorising conservation (Bramwell, 1990; Jamieson, 1990; Brown & Leblanc, 1992). The rural environment is, however, a very fragile one. It is easily either changed or damaged (or both) by rapid changes of any sort: tourism is a powerful agent for change. This is an important issue because of the role rural areas play in many nations as repositories of both natural and historical heritage. It is also important commercially. Surveys show that ‘rurality’ is a unique selling point for holidays in the countryside. Customers look for high quality and ‘unspoiled’ scenery, for peace, quiet, and, to some extent, solitude, and for the personal attention which small-scale tourism enterprises can offer to their guests (Krippendorf, 1987; P.A. Cambridge Economic Consultants, 1987). Tourism growth can be an urbanising influence, which by destroying rurality (or the illusion of rurality), can induce the onset of the destructive Resort Cycle much discussed in tourism circles (Butler, 1980).
The case for sustainable tourism in rural areas is, therefore, a very strong one. The concept of sustainability in rural tourism must be a multi-purpose one if it is to succeed. It cannot be successfully based on a narrow pro-nature conservation ethic. It should aim to:
- Sustain the culture and character of host communities.
- Sustain landscape and habitats.
- Sustain the rural economy.
- Sustain a tourism industry which will be viable in the long term — and this in turn means the promotion of successful and satisfying holiday experiences.
- Develop sufficient understanding, leadership and vision amongst the decision-makers in an area that they realise the dangers of too much reliance on tourism, and continue to work towards a balanced and diversified rural economy.
There are, however, many difficulties in implementing the principles of sustainability discu-
ssed above in a free market economy. The very concept of sustainability is fraught with ambi-guity. Implementation is equally problematic:
it involves numerous interested parties, with diverse aims and beliefs. One practical way forward lies in the creation of sustainable management and development strategies. This paper discusses the defining of sustainable tourism strategic goals compare with the conventional touri-sm plans and their effectiveness with the special stress on Macedonian case.

REDETE – ECONOMIC DEVELOPMENT AND ENTEREPRENEURSHIP IN TRANSITION ECONOMIES
788
Define the sustainable tourism strategic goals
Almost all successful businesses, and many successful regions, develop according to carefully worked out business plans and strategies. The plans seek to reconcile competing demands, to avoid wasteful investments and duplication of effort, and to research and seek out niche markets where special success can be achieved. Sustainable tourism strategies should have all these attributes, but in addition, ten special features should be noted.
- The development of the strategy should be used to encourage an ongoing dialogue between government, tourism businesses, communities and other interests about the future of an area and tourism’s role in that future.
- The strategy can be used to guide and encourage infrastructural investment in transport, public services, marketing, information and interpretation.
- Tourism businesses should gain in security and can invest for the long term because they can develop in a more stable environment.
- Nature conservation, the arts and cultural activities can be drawn into the strategymaking process. They will gain in stature from being recognised and valorised by being part of that process. The process should see conservation as a positive rather than a negative viewpoint. The human and political energies behind the arts and nature lobbies should be used to guide tourism, not simply to protect their position against tourism of any kind.
- The strategy can protect the special scenic, historic and cultural heritage of an area, thus preserving tourism’s future seed corn. It should help to establish the financial and political interdependence between conservation and tourism.
- The strategy-making process can encourage new entrants into tourism. These can include farm diversification schemes, craft workshops, cycle hire, speciality food production, re-organised public transport marketed to visitors, new restaurants, etc. Often these can help retain, diversify or even increase employment opportunities. Notably, many new tourism enterprises are led by women: female activity rates have traditionally been low in rural areas (see Bouquet & Winter, 1987).
- Strategy-making can be used as a vehicle for new ideas and for the beginning of an ongoing educational process bringing new skills, and new flexibility into the business and political life of a region.
- Public dialogue and discussion can allow time for a consideration of the costs and benefits of alternative types of tourism, and alternative types of investments.
- Most rural tourism businesses are small and are unable to afford effective marketing or training. The strategy-making process can be used to encourage future co-operation in marketing and training between businesses and between communities, and to seek niche markets for an area where it can have an advantage over competing areas.
- The production of a well researched and carefully written plan, backed by the whole community, canbe used as an effective lever to obtain public sector funding to begin the process of both development and the reconciliation of tourism and environmental issues through good management. The existence of a public sector investment programme should in turn encourage private sector investment.

REDETE – ECONOMIC DEVELOPMENT AND ENTEREPRENEURSHIP IN TRANSITION ECONOMIES
789
Sustainable strategy or conventional tourism plan ?
Most conventional tourism plans are dominated by the growth requirements of the tourism in-dustry. They are either marketing plans or capital investment plans. They are usually designed to increase traffic, visitor numbers, turnover, and job creation. The plans seek to exploit national and community resources and sweep away constraints. Other types of plan are often written purely in land use and physical planning terms; they may have little regard for community, culture or enter-prise.
Sustainable tourism plans are based on a wider, more holistic, regional analysis. They follow the concepts first enunciated by Krippendorf, Jungk and others in the 1980s, and which since then have been refined and tested in practice in many places (see Krippendorf, 1988). Their hallmarks are:
- An analysis of an area’s social, economic, ecological and cultural needs.
- An analysis of an area’s tourism assets and the constraints on future tourism development.
- A discussion of how best tourism could be used as a tool for social, economic, ecological and cultural regeneration.
- A strong measure of local participation in both the plan-making process and in any ongoing decision-making
- A careful consideration of the visitor carrying capacities, and the type and scale of developments suitable for each part of the region. This may include decisions to allocate some areas for intensive use, to make some areas less accessible on conservation grounds and to set overall limits to growth. Fragile ecosysytems should receive special attention; this could mean that mechanised facilities, such as ski-lifts, are excluded from key zones.
- A market survey to establish opportunities and a marketing strategy. This strategy should both explain and use the Sustainable Tourism Strategy as part of its campaign.
- A training and career enhancement programme for both businesses and employees. Part of this programme should aim to encourage new local businesses in the tourism sector; without this special encouragement and help, there will be a danger that entrepreneurs from outside the area will dominate the tourism industry before local people can adapt to the new opportunities which are available.
- A quality assurance programme designed to develop visitor knowledge of the area, increase insight and satisfaction, improve customer care and help ensure repeat visits.
- The setting up of local groups to monitor, advise, and assist future management.
- Stress on the need to support farming (because farmers are the guardians of the rural landscape), and on the need to encourage discussion on ways to broaden the regional economy to avoid total reliance on the visitor industry.
- Strategies should be long term in their approach (five to ten years appears to be appropriate), but, to be effective, must list priorities and suggest an annualised work programme for at least three years. There must be quantifiable targets, an evaluation process and regular up-dating of objectives.
Effectiveness of sustainable tourism strategies
There are four keys to success. Firstly, it is important that the person or team formulating the strategy is skilled not only in tourism development but also in economic, ecological and social analysis. While local knowledge is useful, impartiality is much more vital if trust is to be

REDETE – ECONOMIC DEVELOPMENT AND ENTEREPRENEURSHIP IN TRANSITION ECONOMIES
790
maintained amongst the many parties taking part in the strategy-making process. Secondly, wide consultations amongst all interest groups are essential. These consultations will include trade and business, transport, farmers, administrators, and the custodians of the natural and historic assets of the area.
Thirdly, openness, has a very special role to play. Tourism relies more than any other industry on local goodwill — the ability to make holidaymakers feel welcome. The local population must be happy with their visitors, and secure in the knowledge that the visitor influx will not overwhelm their lives, increase their housing costs, and impose new and unwelcome value sys-tems on them. Openness can be achieved by public discussions, by careful use of the press, radio and television, and by the development of a two-way dialogue with the community.
Fourthly, the strategy-making process should not be a once-only affair. It has to be an evolving long-term enterprise, able to cope with change, and able to admit to its own mistakes and shortcomings. It is the beginning of a partnership between business, government and cultural and conservation interests.
It can be claimed that these keys to success are counsels of perfection. Certainly, it is probably impossible to be totally impartial, or that openness can ever be complete. But these are the ideals for which the strategy maker should strive, and ideals which should be encouraged.
Macedonian sustainable rural tourism strategy – a case study
Rural tourism in all its forms (agri-tourism, eco-tourism, cultural/monastery , wilderness sports, eno-gastronomic, hunting, spa, etc.) and, more in general the tourism industry in Macedonia is small and well below the potential. Tourism is regulated by the Law on Tourism (OG 62/2004) and its bylaws. The Law on Tourism defines ethno-village tourism services as visit of tourists in village households for the purpose of vacation and recreation (c.12 of art. 2). Tourism services in ethno-village tourism are renting horses for horseback riding, photo-safari, producing and selling of local handicrafts, souvenirs, instruments and other products and services in the village household. The Law on tourism (OG 62/2004) defines services in eco-tourism (art.51) as visiting regions with special natural characteristics, as well as in protected areas for the purpose of vacation, recreation and site seeing of the natural beauties on a manner determined by law. Tourism services in eco tourism are renting of vehicles for site seeing of natural beauties, selling of natural fruits, describing the natural beauties, photo safari and other services that do not harm the nature on a manner determined by law (art.52).
The National Agricultural and Rural Development Strategy 2007-2013 (NARDS) states that it is a priority to promote the integrated development of a sustainable rural tourism in Macedonia, which should be carried out in cooperation by all relevant Ministries and stakeholders (private sector, associations, etc). NARDS considers rural tourism an important factor for off-farm employment in rural areas that suffer from weak number and strength of enterprises (in particular SMEs), a lack of alternative off-farm opportunities and mainly agricultural rural population, often subsistence oriented, with low incomes and value added. Therefore NARDS supports rural tourism as a sub measure of the measure Development and diversification of rural economic activities.
In Macedonia there is a lack of data and of reliable indicators on rural tourism although some studies have been occasionally carried out in the last 10 years. According to the study on the possibilities for development of rural tourism in the Republic of Macedonia332, the support to rural tourism would help reduce the tendency for depopulation that the villages and border regions in
332 PhD Nikola Panov - Possibilities for development of rural tourism in the Republic of Macedonia, 2000

REDETE – ECONOMIC DEVELOPMENT AND ENTEREPRENEURSHIP IN TRANSITION ECONOMIES
791
Macedonia are facing. As in other European countries, rural tourism can significantly contribute to the rural development process in rural areas in Macedonia through:
- Generating income and jobs;
- Exchange between rural and urban areas;
- The multiplier effect in the case of relatively small-scale direct investments;
- Strengthening the local/regional structures by creating networks and public/private partnerships;
- Stimulating developments in the area of physical infrastructure (which in turn may provide opportunities for other economic developments);
- Increasing the diversity of economic activities;
- Raising awareness of the value of an area, such as its landscape, nature and culture, and the economic potential of these.
Agri-tourism in particular is seen as important for protecting the ‘rural way of life’, the rural
culture. Tourism offers to farmers an extra economic activity, which increases agriculture's chance of survival. Tourists also constitute a market for the farm produce, for example via the sale of 'regional products' on the farm. Preserving farming promotes the preservation of the agricultural landscape, a key aspect of the rural product for recreation and tourism.
The basic feature, that may represent a suitable basis for a proper start-up of rural tourism sector, is that tourism (including rural tourism) in overall terms is growing all over the country, and especially in the most known destinations (e.g. Ohrid and Prespa lake), and that Macedonia is starting to present its tourist resources in a more integrated and effective manner, introducing itself to key tour operators.
1. Strategic documents in Environmental protection and spatial planning
The National Strategy for conservation of the biodiversity (adopted by the Government of RM in 2004) is an integral framework with defined vision and strategic objectives, and also includes efficient measures and activities for the protection of the basic components of the biodiversity: ecosystems, species, communities, dwellings and genetic resources. The main objective is the protection of the biodiversity and enabling conditions for sustainable utilization of the bio-resources for the human wellbeing, having consideration for the unique natural values. The main objectives are connected with the need to take appropriate measures for protection / conservation of the basic components of biodiversity an they correspond with the international standards which should be achieved in the coming period. The Action Plan is an efficient mechanism for the implementation of the envisioned strategic objectives via implementation of projects and programmes on national and local level. The Strategy and Action Plan are designed for the period 2004-2008. The implementation of the Action plan is not implemented in accordance with the plan, mainly due to the insufficient funding.
The Second National Environmental Action Plan (NEAP 2) (2006). The second national environmental action plan, enacted in the Government of RM in March 2006, gives general directions in this field for the coming 5 years (until 2011). The process of the EU accession is the key reason for the decision to leave the classical concept for the preparation of NEAP as an “action plan”. Instead, it has been decided to connect NEAP, as much as possible, to the process of the EU accession and the principles of sustainable development, paying at the same time maximal attention to the process of decentralization and the new role of the units of the local self-government (UoLSG). Preparation of NEAP-2 was conducted via cooperation of all the relevant

REDETE – ECONOMIC DEVELOPMENT AND ENTEREPRENEURSHIP IN TRANSITION ECONOMIES
792
sectors, ministries and other organs of the state administration who have jointly proposed the measures of environmental protection per individual media and thematic fields.
- Environmental Monitoring Strategy (2006); - Public Environmental Awareness Strategy (2005); - Environmental Communication Strategy (2005); - Environmental Data Management Strategy (2005); - Strategy and Action Plan for the Aarhus Convention Implementation (2005); - National Capacity Needs Self Assessment for Global Environmental Management (2005); - Vision 2008 (2004); - Physical Plan of the Republic of Macedonia, (2004), (OG39/04); - National Environmental Health Action Plan (NEHAP) (1999);
2 Priorities
Environment
- Amendments of the Law on Environment,
- Adoption of bylaws
Air
- Amending the Law on Ambient Air Quality Management
- Adoption of bylaws
Waste
- Amending the Law on Waste Management
- Adoption of Strategy for Waste Management
- Adoption of bylaws
Water
- Adoption of the new Law on Waters fully harmonised with the EU law. In the Draft Law on waters, nine main objectives shave been incorporated to the Nitrate Directive on reduction of the water pollution caused by agriculture sources and prevention of further pollution. The complete transposition of the requirements of the Nitrate Directive will be enabled with the enactment of the legislation envisioned in the Draft Law on waters, for the following issues: for identification of waters sensitive to nitrates, identification of sensitive zones/areas, establishment of a Code of Good Agricultural Practice, establish-ment and implementation of operational programmes, defining and establishment of a monitoring programme and defining of the method of reporting of the Committee for the degree of implementation of the Nitrate Directive.
- With regard to the matter of wastewater treatment, it is planned to prepare and adopt a Strategic Coherent Framework and Operational Programme for transport and environment
REDETE – ECONOMIC DEVELOPMENT AND ENTEREPRENEURSHIP IN TRANSITION ECONOMIES
793
Nature
- Amending the Law on Nature Protection
- Adoption of bylaws
Industrial pollution
- Adoption of bylaws
Genetically modified organisms
- Adoption of the Law on GMO
Chemicals
- Adoption of the Law on Chemicals
- Adoption of bylaws
Noise
- Adoption of the Law on Environmental Noise
- Adoption of bylaws
Cultural Heritage
- Adoption of the Law on Cultural Heritage Protection
- Adoption of bylaws
Conclusion
As stressed at the beginning of this paper, rural tourism is expected to resume its rapid growth in the near future. This growth can be harnessed not only for the enjoyment of tourists themselves but, more importantly, for maximizing economic benefits and thus increasing the living standards of host communities and countries. At the same time, unless corrective measures are taken, it is bound to have negative environmental and socio-cultural impact on those communities and coun-tries. Rural tourism as a sustainable tourism strategies have gone a long way towards minimizing this negative impact and ensuring that the economic benefits of rural tourism can contribute to environmental protection and the sustainable use of natural resources.
But while environmental sustainability must remain a key component of management sustaina-ble rural tourism strategies, another challenge for the underdeveloped regions and countries is to devise ways and means to incentive economic growth. This will require, amongst other things, genuine participation, greater technical and financial assistance, human resources development, and institutional capacity building in many developing countries.
In Macedonia the first ruts of rural tourism development is already made. Rural tourism can modesty contribute to the rural development process in rural areas in Macedonia through increa-sing the diversity of economic activities, raising awareness of the value of an area, such as its landscape, nature and culture heritage, and the economic potential of these and generating income and jobs. It must be accompanied by appropriately environmental protection and spatial planning
REDETE – ECONOMIC DEVELOPMENT AND ENTEREPRENEURSHIP IN TRANSITION ECONOMIES
794
of given priorities such as: environment, air, water, nature, industrial pollution, genetically modi-fied organisms, chemicals, noise, cultural heritage etc.
Reference list
1. Alberta Tourism (1988) Community Tourism Action 2. Plan Manual. Edmonton: Alberta Tourism. 3. Alberta Tourism (1991) Market Planning Skills 4. Program: Community Participants’ Guide. Edmonton: Alberta Tourism. 5. Blank, U. (1985) The Community Tourism Industry Imperative: The Necessity, the
Opportunities, its Potential. Pennsylvania: Venture Publishing. 6. Bouquet, M. and Winter, M.(1987) Who From Their Labours Rest? Conflict and Practice in
Rural Tourism. London: Gower. 7. Bramwell, B. (ed.) (1990) Shades of Green: Working Towards Green Tourism in the
Countryside. London: English Tourist Board. 8. Bramwell, B. and Lane, B.(1993) Sustainable tourism: An evolving global approach. Journal
of Sustainable Tourism 1 (1), 1—5. 9. Brown, V. and Leblanc, F.(1992) The Ontario Heritage Regions Projects. Ottawa: Heritage
Canada. 10. Butler, R.W. (1980) The concept of a tourist area cycle of evolution: Implications for the
management of resources. Canadian Geographer 24, 5—12. 11. P.A. Cambridge Economic Consultants (1987) A Study of Rural Tourism. London: Rural
Development Commission! English Tourist Board. 12. English Tourist Board (1991) Tourism and the Environment: Maintaining the Balance (plus
four associated volumes: the reports of the Countryside Working Group, the Heritage Sites Working Group, the Historic Towns Working Group, and Visitor Management Case Studies). London: English Tourist Board.
13. Hawkes, S. and Williams, P. (1993) The Greening of Tourism: From Principles to Practice. Burnaby, British Columbia: Simon Fraser University Press.
14. Jamieson, W. (ed) (1990) Maintaining and Enhancing the Sense of Place for Small Communities and Regions. University of Calgary.
15. Keane, M.J. and Quinn, J. (1990) Rural Development and Rural Tourism. University College Galway.
16. Krippendorf, J. (1987) The Holiday Makers: Understanding the Impact of Leisure and Travel. Oxford: Heinemann.
17. Krippendorf, J., Zirnmer,P., and Glauber, H.(1988) Fuer einen andern Tourismus. Frankfurt: Fischer Taschenbuch Verlag.
18. Lane, B. (1991a) Will rural tourism succeed? In S. 19. Hardy, T. Hart and T. Shaw (eds) The Role of Tourism in the Urban and Regional Economy
(pp. 34—39). London: Regional Studies Association. 20. Lane, B. (1991b) Berwick-upon-Tweed: A Strategy for Sustainable Rural Tourism. University
of Bristol. 21. Lane, B. (1993) Rural Tourism: A Bibliography. Paris OECD. 22. Murphy, P.E. (1985) Tourism: A Community Approach. London: Methuen. 23. Reynolds, Sir Joshua (1797) Discourses. London. (Modem edition ed. R.R. Wark (1975), New
Haven, 24. (Yale University Press). Saskatchewan Economic Development and Tourism (1988) Commu-
nity Tourism Planning Guide. Regina: Saskatchewan Tourism. 25. Sem, J. (ed.) (1989) Using Tourism and Travel as a Community and Rural Revitalisation
Strategy (Proceedings of the National Extension Workshop). Minneapolis: University of Minnesota.

REDETE – ECONOMIC DEVELOPMENT AND ENTEREPRENEURSHIP IN TRANSITION ECONOMIES
795
26. Weiler, B. and Hall, C.M. (1992) Special Interest Tourism. London: Belhaven,’Halsted Press 27. PhD Nikola Panov - Possibilities for development of rural tourism in the Republic of
Macedonia, 2000 28. Ministry of Economy – Master Plan for tourism of Republic in Macedonia, Louis Berger S.A,
April 2003. The study is being currently updated and reviewed 29. VRM - Nacioanlna strategija za razvoj na turizmot 2009-2013

REDETE – ECONOMIC DEVELOPMENT AND ENTEREPRENEURSHIP IN TRANSITION ECONOMIES
796
THE BENEFITS OF CROSS-BORDER COOPERATION: THE BIHOR-HAJDU BIHAR EUROREGION
Laura Mariana CISMAȘ333 Cosmin Leontin SABĂU334
Abstract
In the current context of the harmonization of European territorial development, regional policy allocates an increasingly important role to cross-border cooperation, establishing its objective, for the current period of financial programming ending in 2013, to stimulate this kind of cooperation.
The European countries have understood that one method to reduce the imbalances (gaps) between regions’ development is to run a large number of cross-border projects. This way, the border territories between states will develop well-balanced. All these elements led to the Euro-regions as forms of cross-border cooperation, the actors implied being from both private and public area. Also, the cooperation links are established between local, regional and national organisms.
This collaboration between areas located on both sides of borders enables the border areas to develop in a more intense rhythm. In plus, it will be assisted to the territorial cohesion, an important support for achieving this desideratum coming from the EU and the Council of Europe.
This paper aims to highlight the effects of cross-border cooperation, as a form of regional cooperation, has on the countries involved. For this purpose, the paper covers the following specific objectives: the conceptual approach of cross-border cooperation, a brief review of cross-border cooperation worldwide and in Europe, the socio-economic analysis of Bihor-Hajdu Bihar Euro-region and Tyrol-South Tyrol-Trentino Euro-region.
To better highlight the results that cross-border cooperation has among European countries, it has been extensively studied a few economic and social aspects of two regions: Tyrol-Trentino (located on the border between Italy and Austria) and Bihor Hajdu-Bihar (located on the border between Romania and Hungary). The results point out that those areas were able to grow as level of development and the perspectives are favorable provided the amplification of the cooperation between the entities involved.
The investigation methodology used combines analysis and synthesis, the regulatory appro-ach with the explorative one, the quantitative analysis with the qualitative evaluations.
Keywords:cross-border cooperation, euroregion, economic analysis, economic structure,
333 West University of Timisoara- Faculty of Economics and Business Administration, J.H Pestalozzi Street, no.16 ,
Timișoara, e-mail: [email protected] 334 West University of Timisoara- Faculty of Economics and Business Administration, J.H Pestalozzi Street, no.16 ,
Timișoara, e-mail: [email protected]

REDETE – ECONOMIC DEVELOPMENT AND ENTEREPRENEURSHIP IN TRANSITION ECONOMIES
797
Introduction. The appearance of cross-border cooperation concept. Conceptual frameworks
The Old Continent, in addition to its vast culture and common history of nations, includes also a lot of borders (state borders). Most states which arose many years ago still exist today; they passed through a comprehensive process of transformation in the nineteenth and twentieth centuries, so that in the present day each to receive a certain level of development. However, only a few of them have long-life borders, such as the Portugal-Spanish border (the oldest territorial border in Europe). (Guide 2000 Regional Politics, p.5)
Currently, the cooperation between natural border territories, directly adjacent to one another, has a long tradition in the European continent. Even so, in countries such as Spain, Portugal, Greece, CBC began only in the 80s, due to political changes, the transition of these countries to democratic systems and the obtaining of the European Union membership. For countries of Cen-tral and Eastern Europe, this process began after 1989.( Guide 2000 Regional Politics, p.5)
Ever since the 50s, shortly after the Second World War, specialists from a significant number of European border regions have debated the removal of borders and the possibilities of cross-border cooperation.
The basis of this meeting was the need to increase the living standards, the existing of a lasting peace on the Continent, and the elimination of border barriers, restrictions and other factors that determined the separation of people and authorities from neighboring border regions.( Guide 2000 Regional Politics, p.5)
At the end of the Second World War, people from different border areas realized that, in order to have a living standard equal to that of the central part of the country, it is necessary to reduce or even to eliminate the negative effects that border has. They realized, however, that this was not possible, especially due to the lack of a legislative framework. Therefore, they founded communal and regional associations on both sides of the border seeking to streamline cross-border cooperation.( Guide 2000 Regional Politics, p.6)
Since the '70s, border regions have established the European Association of Border Regions - The Association of European Border Regions (AEBR), in 1971. This body has maintained a close collaboration relationship with the European Council, the European Parliament and European Commission. Thus, border areas and border network in Europe has become a decisive force for efficient cross-border cooperation in all this areas of the Continent, contributing to the deepening of European integration, the implementation and development of the European assistance programs of border areas across Europe.(Guide 2000 Regional Politics, p.6)
The creation of the Single European Market and the transition to democracy of Central and Eastern Europe countries have allowed an increased of permeability of national borders. Thus, several border and cross-border regions arose and increased the cooperation the opportunities between member states. Therefore, the objective of European integration required the establish-ment of a polity which supported political border regions in order to eliminate the obstacles hindering integration.( Guide 2000 Regional Politics, p.6)
For this part of Central and Eastern Europe, this form of territorial cooperation (cross-border cooperation) started to show only after 1990, with a lot of apprehension from the involved countries, because in the past these borders were sealed. In this context, the collaboration was carefully prepared, and people had to be aware of the fact that they still belong to a common history and that they need to look to a common future inside the continental space.( Guide 2000 Regional Politics, p.7)
Because of the fact that previously it was mentioned the historical emergence of cross-border cooperation, it is necessary to know also the reasons that gave rise to territorial cooperation. These reasons are presented below, as they appear in the document prepared by AEBR and the European Commission on cross-border cooperation: (Guide 2000 Regional Politics, p.8)

REDETE – ECONOMIC DEVELOPMENT AND ENTEREPRENEURSHIP IN TRANSITION ECONOMIES
798
- the transformation of borders, from separating lines into communication areas between neighbor states;
- the swift adoption of the ideal of European integration;
- overcoming mutual prejudices and differences between people in the border regions, a result of historical heritage;
- crossing national peripheral location and isolation;
- support for the economic and development growth and raising living standards;
- foundation of democracy and the development of administrative structures, able to operate at regional and local level.
All these motifs were resolved through the following principles: the principle of partnership, the principle of subsidiarity, the existence of a joint program of border development and joint stru-ctures at the regional/local level. It should be mentioned that the legal instruments that underpin cross-border cooperation are: multilateral, bilateral and trilateral agreements at regional and local levels.
The links between two or more adjacent local and regional entities located in different but neighboring countries, represents the territorial cooperation. This types of collaborations can be short term (for example one project) or permanent term – indeterminate term – (in order to solve complex problems).(Engl, 2009, p.5) Euroregion is met as a permanent cross-border cooperation form; it is an institution involving public and private actors; it establishes cross-border ties bet-ween national, local, and regional organisms.(Engl, 2009, p.5) Other forms of cross-border cooperation are Eurodistricts and working communities.
Territorial cooperation between areas on both sides of the border enable border regions to develop much faster and to achieve territorial cohesion with the support of the European Union and the Council of Europe.(Engl, 2007)
Thus, the concept of territorial cooperation has become an extremely important subject within the European Community once the intensification of European integration process.
As author Alice Engl says, the developing of a growing number of cross-border projects and the emergence of border territories, were based on three of the European Union’s products: the Euro, the single internal market and the Schengen Agreement.(Engl, 2009, p.3)
As a result, border areas have turned into cooperation areas between economic, social and poli-tical systems, belonging to different countries, where human, natural and financial resources, can be shared by the inhabitants of those settlements.(Engl, 2009, p.3)
One thing worth remembering is that in recent years, there have been noticed a growing in-terest from national, regional, local and international actors for the issue of territorial cooperation.
This idea is reinforced by the fact that, as from the economical point of view, European Union must face the global economic challenges, the continent cannot remain isolated, according to what happens outside its borders.(Gambert and Jann, 2010)
A very important remark is made by Jirka Zapletal, who noted that integration brings into question another aspect: territorial cohesion among European areas, becoming one of the objectives of the Union under the Lisbon Treaty signed in 2000.(Zapletal, p.15)
Thus, territorial cooperation supports the achievement of national cohesion, infrastructure and communications, cultural exchanges and also tourism cooperation between territories situated on both sides of the borders, regions and nations.(Engl, 2009, p.4)

REDETE – ECONOMIC DEVELOPMENT AND ENTEREPRENEURSHIP IN TRANSITION ECONOMIES
799
Cross-border cooperation in Europe – historical evolution and case study (Tyrol-South Tyrol-Trentino Euroregion and Bihor-Hajdu Bihar Euroregion)
Over recent years, there was noticed an increased interest in disciplinary and inter-disciplinary research of issues related to state borders and border regions. This increased interest has been largely determined by the rapid growth of cross-border cooperation (CBC) in Europe, development that was based on continued expansion of the European Union.(O’Dowd, 2002, p.21)
Researchers, O'Dowd believes, ended up perceiving cross-border cooperation as a response to two interrelated aspects of border changes: (O’Dowd, 2002, p.21)
- The borders fragmentation process, especially in Europe after 1989. Quoting the author Foucher, O'Dowd points out that approximately 8,000 miles of new state border were added to Europe after that year, especially because the spread of regionalism has created or strengthened border states.
- The integration process involves the impact of accelerated globalization, in its economic, political, cultural and technological forms regarding the importance and significance of state borders.
It should be noted that regional cross-border cooperation doesn’t have its origins in the old European continent, in 1990. It was in 1950 that, as also O'Dowd states, in the Rhine basin was set up this type of cooperation, its promoters even benefiting by the financial support of the Council of Europe. However, it was only after the Cold War, the process of the foundation of EU policy regarding borders, have started.
Ever since 1989, the European Commission has established among its main objectives the cross-border cooperation. This caused CBC to be more subject to social scientific research, at least in terms of an overall policy.(O’Dowd, 2002, p.21)
From an analytical point of view, within cross-border cooperation, there is a problem related to the wide variety of border regions in Europe, which have different training border histories and hold a large variety of socio-economic, location and cultural conditions.
Even if there is a great responsiveness in terms of research and the analysis of CBC process, it is needed to point out the fact that borders can change, but still they won’t disappear. (O’Dowd, 2002, p.22)
Also, Liam O'Dowd, makes the following statement: "While CBC is usually compared with the transcendence of borders and border crossing, it cannot be fully analyzed or understood without recognizing its appearance to the co-existence and the appearance of the border. Borders separate and unite, and separation is not possible without union and vice versa.”
Therefore is withheld, from the idea expressed in the above paragraph, that in order to speak about CBC, we should also take into account the national borders. These borders are everywhere, are a reality that surround us, and the aim of cross-border cooperation, at least in Europe, is to facilitate the cooperation between authorities, people, institutions, etc. on both sides of the boundary separating the countries.
Citing Duchacek, the same O'Dowd notes: ''borders, therefore, are an integral part of human behavior - they are a product of the need to command, control and protect human life and human society, reflecting human desires competing for similarity and difference, [...]''. O’Dowd also says that: "Borders are ubiquitous human constructions, an inevitable result of the power of coercion, social organization, division of labor and promotion of collective identity within an assigned territory."
Therefore, a key objective of the cooperation between the regions on either side of the border is to strengthen the relations between the involved actors in its performance. Even if this kind of cooperation includes also an important economic part, one of its features is the relatively small role that private agencies have compared to the large role played by public authorities and nonprofit organizations.(O’Dowd, 2002, p.23)

REDETE – ECONOMIC DEVELOPMENT AND ENTEREPRENEURSHIP IN TRANSITION ECONOMIES
800
As a conclusion, it can be said that at the European level, cross-border cooperation has some-times the role to revive the old borders and the contacts between communities and ethnic groups on both sides of the border. Cross-border cooperation also supports the geo-political and geo-economical changing role of border regions.
Cross-border cooperation between Italy and Austria. The Tyrol – South Tyrol - Trentino Euroregion
The Tyrol – South Tyrol - Trentino Euroregion has an interesting history that begins many years ago. In the past there were more historical factors that have not always made possible the cooperation between the three component areas, but with the ample process of globalization and the continuous development of modern society, a constructive cross-border cooperation was established.
The geographical position, the tumultuous history of the territory, the impressive landscape and the favorable location between North and South are elements that may cause an endogenous development of the region and its international recognition. (Magagnotti, 2010)
It should be noted that the Euroregion has a close connection with the Southern Europe and with the Northern Europe, a considerable advantage who offers a number of opportunities in various fields.
Tourist attraction is important and has to be mentioned, especially since the Euroregion has many cultural sites, and multilingualism is an essential foundation for the economic development of the territory. (Magagnotti, 2010, p.12)
The region is characterized by the strong attachment that people have for their ancestors and by a great desire for self-government. Thus, the area’s turbulent history represents one of the main pillars underpinning the very close cooperation relations between provincial authorities from Ty-rol, South Tyrol and Trentino.( http://www.europaregion.info/en/19.asp)
The collaboration between the three provinces (territories) is channeled in several activity fields, such as: economics, transports, education, culture, environment protection, tourism, social protection. Among these, transport has a special place, as the authorities in the three territories have achieved a common transport policy through which they managed to jointly finance the construction of the Brenner Tunnel, thus managing to facilitate the access in the quite difficult Central Alps area. (http://www.europaregion.info/en/19.asp)
A very important goal for the Euroregion is to achieve sustainable development, which can be obtained by correlating economic needs with the realities of the area. All the objectives pursued by the Euroregion’s authorities have been published in a statement aimed at the development and protection of alpine regions entitled “Alpendeklaration”. The document was presented in January 2001 by the governors of the provinces Tyrol, South Tyrol and Trentino in the city of San Michele all'Adige. The Declaration itself was likened to a sort of Magna Carta which aimed at the sustainable development of the three provinces of the Euroregion. Its purpose, in addition to the one previously mentioned, was to stimulate other Alpine regions to establish cross-border coo-peration.( http://www.europaregion.info/en/19.asp)
Some of the extremely stable and fruitful examples of cooperation between the three provinces forming the Euroregion would be: making a joint liaison office whose foundations were laid by the three provincial governments of the Euroregion (the office was meant to represent the Euroregion to the European Union, so it’s office was established in Brussels), the participation in the event entitled "Expo 2000" from Hanover where, as a difference from all the other national participants, the three provinces (Tyrol, Soth Tyrol and Trentino) had the same stand. In other words, they promoted together their tourist potential.( http://www.europaregion.info/en/19.asp)
Therefore Tyrol, South Tyrol and Trentino form a solid entity, based on close and friendly relations in various areas: social area, economic area, cultural area, environmental area. To this, it

REDETE – ECONOMIC DEVELOPMENT AND ENTEREPRENEURSHIP IN TRANSITION ECONOMIES
801
is added the common history of many centuries and the likeness of the geographical space.( http://www.europaregion.info/en/19.asp)
The Euroregion’s economic structure
Table no.1 The Euroregion’s Surface (km2)
Trentino 6.206 Total Euroregion
26.246 Tyrol 12.640 South Tyrol 7.400
Source:http://appsso.eurostat.ec.europa.eu/nui/show.do?dataset=demo_r_d3area&lang=en, accessed in 04.02.2012
As shown in the table above, the Euroregion has a total area of 26,246 km2. Tyrol province holds the greatest size, approximately 49%, followed by the South Tyrol province with 29% and then Trentino province with 22%.
Table no.2
The Euroregion’s inhabitants (thousand persons) Year 2010 Total
Euroregion 1.719.372
Trentino 524.826 Tyrol 706.873 South Tyrol 487.673
Source:Eurostat, http://appsso.eurostat.ec.europa.eu/nui/show.do?dataset=demo_r_d2jan&lang=en, accessed in 04.02.2012
The population of Tyrol-South Tyrol-Trentino Euroregion in 2010 was of 1,719,372 people.
Having the largest area, Tyrol region is the most populated of the three areas forming the Euroregion studied in this chapter. The Italian region Trentino follows, owing 30% of the Euroregion, and then South Tyrol region with 29% of the population.
Table no.3
Unemployment Rate (%) Year 2005 Total
Euroregion 2,7
Trentino 3,1 Tyrol 2
South Tyrol 2,3 Source: The Cross-border cooperation development along history of Trentino –Tyrol - South Tyrol and the role
of autonomy in promoting the economic development, Research Report number two, West University of Timisoara, Faculty of Economics and Business Administration
One of the most important macroeconomic indicators, the unemployment rate, is is described
in Table no.3. With a value of 2.7% in 2005, the Euroregion unemployment rate was below the European average. This was also due to the fact that each of the three component regions had a high level of employment. The number of unemployed persons was reduced, which determined a rapid economical growth of the area.
Table no.4
Euroregion Level Total GDP (in million Euro) Year 2000 2001 2002 2003 2004 2005 2006 2007 2008 Trentino 12.079 12.629 13.046 13.450 13.933 14.197 14.810 15.639 16.007 Tyrol 17.625 18.215 18.815 19.299 20.058 21.375 22.635 23.776 24.720 South Tyrol 13.000 13.500 14.000 14.500 15.000 15.500 16.000 16.500 17.000 GDP average 14.234 14.781 15.287 15.749 16.330 17.024 17.815 18.638 19.242
Source: http://epp.eurostat.ec.europa.eu, accessed in 04.02.2012

REDETE – ECONOMIC DEVELOPMENT AND ENTEREPRENEURSHIP IN TRANSITION ECONOMIES
802
The above table presents the GDP indicator evolution at the Euroregion level between 2000-
2008. The data allowed us to calculate the average value indicator for each of the nine years taken into analysis. Therefore, it is shown the upward trend of the total GDP, while the last analyzed year was not yet influenced to some extent by the global economic crisis.
Chart no.1 The evolution of total GDP at the Euroregion level (in millions euro)
Source: Eurostat http://epp.eurostat.ec.europa.eu, accessed in 04.02.2012
Table no.5 GDP/inhabitant (in PPS)
Year 2002 2003 2004 2005 2006 2007 2008 2009 2010 Italy 24.500 24.300 24.500 24.500 24.900 25.100 24.700 23.300 23.500 Austria 28.600 28.800 29.300 29.800 30.800 31.800 32.100 30.700 31.400
Source: Eurostat, available on: http://epp.eurostat.ec.europa.eu, accessed in 23.01.2012
At the national level, in this case Italy and Austria, the GDP/capita indicator expressed in current prices had a fluctuating evolution between 2002-2010. More specifically, on absolute values, it highlights the superiority of Austria, the difference from Italy being of more than 8000 euro more, as it happened in 2010. Moreover, the gap between the two countries has steadily increased in Austria’s favor in the period between 2002-2010 due to a more emphasized dynamic of this indicator (approximately 3,000 euro). Meanwhile, Italy has experienced a fluctuating evolution of GDP per capita, in the last two years 2009 and 2010 the economic crisis putting seriously its mark on decreasing the indicator with almost 1000 euro since 2002.
Table no.6
The evolution of GDP/inhabitant (thousands euro) Year 2000 2001 2002 2003 2004 2005 2006 2007 2008 Trentino 25.600 26.500 27.200 27.600 28.200 28.400 29.300 30.700 31.000 Tyrol 26.300 27.000 27.700 28.300 29.000 30.900 32.500 34.000 35.200 South Tyrol 27.799 28.557 29.103 29.952 31.466 31.712 32.969 33.965 34.365 Source: http://appsso.eurostat.ec.europa.eu/nui/show.do?dataset=nama_r_e2gdp&lang=en, accessed in 04.02.2012 The GDP/inhabitant in the three regions components of the Euroregion Tyrol-South Tyrol-
Trentino had a generally positive evolution. Thus, it can be observed that the most spectacular increase was the one from Tyrol area, followed by South Tyrol and Trentino. This order is directly related to what happened to the national indicator, where Austria enjoys a significant advantage in relation to Italy.

REDETE – ECONOMIC DEVELOPMENT AND ENTEREPRENEURSHIP IN TRANSITION ECONOMIES
803
Table no.7 Number of tourists staying overnight (in million persons)
An 2000 2001 2002 2003 2004 2005 2006 2007 2008 2009 Trentino 2,7 2,8 2,7 2,8 2,8 2,8 2,9 2,9 2,9 3 Tyrol 4 4,1 4,2 4,3 4,3 4,4 4,2 4,2 4,4 4,3 Sud Tyrol 2,4 2,5 2,5 2,6 2,6 2,6 2,6 2,7 2,8 2,8 Nr. mediu 3,04 3,14 3,14 3,24 3,24 3,27 3,24 3,27 3,37 3,37
Source: The Cross-border cooperation development along history of Trentino –Tyrol - South Tyrol and the role of autonomy in promoting the economic development, Research Report number two, West University of Timisoara, Faculty of
Economics and Business Administration
The number of persons that visited the Euroregion in the period between 2000-2009 increased, fact suggested and shown in the previous table. The most interesting positive evolution was registered in the South Tyrol region, followed by Tyrol and then Trentino. This evolution can be placed on the account of massive investments made over the years in national roads and rail roads, which caused a more easily and quickly accessible way to this area for potential tourists. In addition, further promotion of tourism potential at various international fairs and specialized events in both Europe and other continents, have contributed to the success among tourists of the area delimited by the three regions. This situation determined a weight increase of the tourism sector from the total GDP.
Cross-border cooperation between Romania and Hungary. The Bihor Hajdu-Bihar Euroregion
Bihor county is situated the northwestern border of Romania, has an area of 7544 km2, and Hajdu Bihar is at the northeastern border of Hungary, with an area of 6211 km2. The two counties doesn’t have a homogenous structure, nor in terms of relief, neither in terms of other natural resources (lands, on categories of use and fertility, deposits of raw materials, etc.). However, they seem somewhat driven to establish new ways of cooperation, because of the challenges people live on both sides of the Romanian-Hungarian border. In addition, differences in resources make somehow possible, and even required, some sort of economic cooperation between Bihor and Hajdu-Bihar.
The first association between the two neighboring border counties was held in 1997 inside another, much larger, cross-border cooperation structure: the Carpathian Euroregion, including administrative-territorial units from five countries.
In order to perform better the cooperation between counties and because the Carpathian Euroregion had a population over the number of inhabitants of associated countries (Hungary, Slovakia) after it’s setting, smaller Euroregions were formed; one of them is Bihor-Hajdu Bihar Euroregion.(Suli Zakar, 2007, p.99)
The existing premises from 2002, starting with the establishment of the Euroregion, of the symbolic extinction of the Romanian-Hungarian border, since the adherence of Romania and Hungary to the EU, which happened in 2007 and respectively in 2004, was an important factor, the basis for achieving this Euroregion. Therefore, the point from which it was started when it was decided the combination of two counties, Bihor and Hajdu-Bihar, in a cross-border organization, was the importance that local authorities have granted to the economic ties that began to manifest between entities on either side of the border. In addition to this reason, it was intended that the two county seats, Oradea and Debrecen, to collaborate in a joint program aimed to the developing of the border area.(Suli Zakar, 2007, p.99)
The figure below shows the geographical location of Bihor-Hajdu Bihar Euroregion, as it is inserted in the geographical areas of the two countries: Romania and Hungary.

REDETE – ECONOMIC DEVELOPMENT AND ENTEREPRENEURSHIP IN TRANSITION ECONOMIES
804
Figure no. 1 The geographical location of Bihor-Hajdu Bihar Euroregion
Source: Ilieş Alexandru, România. Euoregiuni, Editura Universității din Oradea, 2004
The Euroregion in question comprises both large and small administrative-territorial institutio-
ns. Thus, the cross-border cooperation basis will be much broader. Compared to the Carpathian Euroregion (which includes five states), Bihor-Hajdu Bihar has a greater functionality because it is a form of bilateral cooperation (only between Romania and Hungary).(Ilies, 2004, p.154)
Oradea and Debrecen, the two county seats cities, are characterized by common and also distinct elements.
Oradea is recognized as one of the most important cities in Romania, but nevertheless, cities such as Cluj-Napoca or Targu Mures are prior to Oradea in terms of development. On the other hand, Debrecen, with a population of 210,000 inhabitants after the last census (in 2001) is the most important city in the province, having also the quality of regional center. (Suli Zakar, 2007, p.145)
Another issue that arose in the two cities after 1990 was suburbanization. For Oradea, the transition to market economy has been quite difficult, especially since the construction of new neighborhoods was stopped and the process of industrialization began. Therefore appeared the suburbanization process, which meant that people moved from cities to rural areas. As a consequence of reducing the labor market, young people decided to leave the urban areas, which determined the reduction to about 20,000 of the number of inhabitants in the period 1992-2002.( Suli Zakar, 2007, p. 145)
Debrecen is in about the same situation, which, after 1990, has also witnessed a decrease in population, but not in proportion to that seen in Oradea. The declining of the birth rates can be explained by decreasing the number of jobs, because some of the unemployed persons chose to migrate to other areas. However, the unemployment problem was much better managed in Debrecen than in Oradea, because only 1,200 people left the city during 1991-2002, from nearly 20,000 people who left Oradea in the same period of time. Another factor of the subur-banization was the desire of people to retire in peripheral areas of both cities, for lower hous-ing prices of apartments in these areas, for the quietness of these areas and not least for the lower cost of living.(Suli Zakar, 2007, p.146)
Also, regarding the legal basis of the Euroregion, it should be noted that the key feature is the Treaty of understanding, cooperation and good neighborly relations between Romania and Hungary, initialed by the two countries on September 16, 1996 in Timisoara, to which there were added other national or European documents.(Suli Zakar, 2007, p.146)

REDETE – ECONOMIC DEVELOPMENT AND ENTEREPRENEURSHIP IN TRANSITION ECONOMIES
805
According to the statute drafted at the moment of the Euroregion’s constitution, the Bihor-Hajdu-Bihar Euroregion is an association with CBC openness that does not have a legal personality.(Suli Zakar, 2007, p.146) However, in addition to Romanian and Hungarian, which are the official languages, English language is also used. For documents involving partnerships with the EU it can be used any official language of EU.(Suli Zakar, 2007, p.146)
The founding members of the Euroregion, based on the Collaboration Agreement are:
a) From the Hungarian side: - The self-governance of Hajdu-Bihar county, Debrecen City Hall, Association of border
municipalities from Hajdu-Bihar county, the City Hall Association from Hajdu-Bihar, the Association for regional development and local border municipalities Delnyirszeg.
b) From the Romanian side: - Bihor County Council, Oradea’s City Hall, Association of border localities in Bihor, the
Érmellék Association.
The Euroregion’s economic structure Table no. 8
Constant population (thousand persons)
Year 2001 2002 2003 2004 2005 2006 Hajdu Bihar 553264 552478 551837 550265 549372 547357 Bihor 619529 603743 602206 598381 596670 595448
Source: TEMPO ONLINE data base, The Romanian National Statistical Institute http://portal.ksh.hu/pls/ksh/docs/eng/xstadat/xstadat_annual/i_qlf022.html, accessed in 15.05.2011
Analyzing the data presented in the table above, it can be seen that Bihor county is placed
somewhat positive regarding the constant population resource, but is facing, although with less intensity than Hajdu Bihar county, the phenomenon of depopulation, a result of the demographic crisis that manifests in all the European area.
The worst value of this variable was recorded in Hajdu-Bihar county in 2006, and the most favorable value was recorded in Bihor county in 2001, with unfavorable trends in both counties.
For the characterization of the business environment’s state and dynamics, it could be used only the registered companies indicator, mentioning the fact that business environment is a reality and a concept way too complex to be expressed just by one index. However, the analysis needs to be simplified analysis and the achievable data in structured and comparable forms are very few.
The obtained data, relating to the business environment, are structured and presented in Table no.9.
Table no. 9 Registered companies (numbers)
Year 2005 2006 2007 2008 2009 2010 Hajdu Bihar 18301 18775 19340 20422 21290 22130 Bihor 15168 16118 17750 18850 18850 18850
Source: baza de date TEMPO ONLINE, The Romanian National Statistical Institute http://portal.ksh.hu/pls/ksh/docs/eng/xstadat/xstadat_annual/i_qlf022.htm, accessed in 15.05.2011
To better characterize the evolution of state and the economic dynamics of the two counties, in Table no.10, is presented the gross domestic product from Bihor and Hajdu-Bihar, properly expressed in millions HUF forint and millions ROM lei.
The two tables were used to calculate data in Table no.12, with annual GDP of the two coun-ties expressed in US dollars. This last table is used in tracking GDP dynamics in the two counties.

REDETE – ECONOMIC DEVELOPMENT AND ENTEREPRENEURSHIP IN TRANSITION ECONOMIES
806
Table no.10 GDP (in millions HUF forint and in millions ROM lei)
Year 2004 2005 2006 2007 2008 Hajdu Bihar 854791 881740 924335 973446 1024981 Bihor 7352.5 8007.4 9475.4 11488.9 13751.5
Source: TEMPO ONLINE data base, The Romanian National Statistical Institute http://portal.ksh.hu/pls/ksh/docs/eng/xstadat/xstadat_annual/i_qlf022.htm, accessed in 15.05.2011
For 2004-2008 period, in two component counties of the Euroregion, it is outlined the increa-
sing trend of the GDP. It should be noted that in Bihor county, the increase was more pronounced unlike to the Hungarian county.
To achieve a better comparison, it was drawn Table no. 11, which shows the average annual exchange rate of the Romanian and the Hungarian forint in respect to the US dollar.
Table no. 11
The average annual exchange rate of the Romanian and the Hungarian forint in respect to the US dollar
Year 2004 2005 2006 2007 2008 Media
Hajdu Bihar 202.63 199.66 210.51 183.83 171.8 161.4 Bihor 3.26 2.91 2.81 2.44 2.52 2.3
Source: TEMPO ONLINE data base, The Romanian National Statistical Institute http://portal.ksh.hu/pls/ksh/docs/eng/xstadat/xstadat_annual/i_qlf022.htm, accessed in 15.05.2011
Once calculated the average annual exchange of the two currencies against the US dollar, it was made Table no.12, in which, by using the statistical method called the boniterung method, it was obtained the GDP value in US dollars between 2004-2008.
It was also calculated the minimum value of the indicator for the analyzed period.
Table no.12 The Boniterung method - GDP (millions US dollars)
Year 2004 2005 2006 2007 2008 Minimum
value Hajdu Bihar 187,04 195,81 194,69 234,79 264,53 2255,4 Bihor 100,00 122,00 149,51 208,77 241,95
* author’s calculations
Table 12 highlights a very interesting situation. Specifically, in US dollars, the Hungarian co-unty is better located in terms of macroeconomic indicator, entitled GDP, in respect to Bihor county (if we consider the absolute values). The indicator’s growth rhythm was more pronounced on the Romanian side of the Euroregion. It mustn’t be forgotten that the exchange rate had a particular influence on this situation.
Table no.13
GDP per inhabitant (thousand euro in PPS) Year 2002 2003 2004 2005 2006 2007 2008 2009 2010
Romania 3.100 3.200 3.500 3.700 4.000 4.200 4.600 4.300 4.200 Ungaria 7.700 8.000 8.400 8.800 9.200 9.200 8.700 8.700 8.800
Source: Eurostat, available on: http://epp.eurostat.ec.europa.eu, accessed in 23.01.2012
The generalization of data about GDP/capita in the two counties, Hajdu Bihar and Bihor from the table above, leads to the conclusion that this indicator, for Romania and Hungary, in the period 2002-2010, was a positive one. Even if the economic crisis has had an impact on it,

REDETE – ECONOMIC DEVELOPMENT AND ENTEREPRENEURSHIP IN TRANSITION ECONOMIES
807
in the analyzed period of time, the GDP/capita had largely reflected a growth economical period in the early years, recorded in the two countries, though later the recession put its mark on this indicator.
Table no.14 Number of unemployees (thousand persons)
Year 2000 2001 2002 2003 2004 2005 2006 2007 2008 2009 2010 Hajdu Bihar 14.5 13.1 13.4 12.5 11.9 17.6 20.0 16.3 18.4 22.7 27.9 Bihor 16.5 10.1 14.9 10.5 9.3 12.3 12.8 11.5 13.9 23.3 23.3
Source: TEMPO ONLINE data base, The Romanian National Statistical Institute http://portal.ksh.hu/pls/ksh/docs/eng/xstadat/xstadat_annual/i_qlf022.htm, accessed in 15.05.2011
Analyzing the data presented in the table above, it can be observed a certain increase in the number of unemployed persons, after a relative decline, the increasing trend occurring since 2007 in Hajdu-Bihar, and in 2008 in Bihor county. The worst value of this variable is recorded in 2010, in Hajdu-Bihar county, and the most favorable value is recorded in Bihor county in 2001.
Table no.15
Total number of overnight stays tourists in accommodation facilities Year 2005 2006 2007 2008 2009 Hajdu Bihar 1.073.564 1.304.289 1.333.334 1.260.285 1.128.619 Bihor 1.131.164 1.145.183 1.139.245 1.128.159 998.638
Source: TEMPO ONLINE data base, The Romanian National Statistical Institute http://portal.ksh.hu/pls/ksh/docs/eng/xstadat/xstadat_annual/i_qlf022.htm,accesed accessed in 15.05.2011
Interpreting the data values from Table no. 14, it is seen that the worst situation is from 2009 in
Bihor county, and the most favorable situation is in 2008 in Hajdu-Bihar county. The differences are again net favorable to the Hungarian county, the higher number of nights spent by tourists somewhat offsetting the differences in the number of arrivals.
Development differences between two Euroregions. Comparative analysis
Next, after the analysis of the economic structure of the two regions, it will made a comparison between the two of them. This is required in order to see however, the differences between them and the development differences between the two territories that are part of the European Union.
Chart no.2 The Surface of the Tyrol-South Tyrol-Trentino Euroregion (km2)
12.640
7.400
6.206
26.246Tyrol
South Tyrol
Trentino
Total
Source : Eurostat,http://appsso.eurostat.ec.europa.eu/nui/show.do?dataset=demo_r_d3area&lang=en,

REDETE – ECONOMIC DEVELOPMENT AND ENTEREPRENEURSHIP IN TRANSITION ECONOMIES
808
Chart no.3 The Surface of Bihor-Hajdu Bihar Euroregion (km2)
7.544
6.51114.055
Bihor
Hajdu-Bihar
Total
Source: TEMPO ONLINE data base, The Romanian National Statistical Institute
http://portal.ksh.hu/pls/ksh/docs/eng/xstadat/xstadat_annual/i_qlf022.html, accessed in 15.05.2011
First of all, as seen in charts no. 2 and no. 3, as a surface, the Tyrol-South Tyrol-Trentino Euroregion is much bigger than as the Romanian-Hungarian one. This is also due to the fact that in its composition there are three provinces, opposed to the two counties forming Bihor-Hajdu Bihar Euroregion.
Chart no.4 Constant population(thousand persons)
Source: TEMPO ONLINE data base, The Romanian National Statistical Institute http://portal.ksh.hu/pls/ksh/docs/eng/xstadat/xstadat_annual/i_qlf022.html, accessed in 15.05.2011
Chart no.5 The population of Tyrol-South Tyrol-Trentino Euroregion(2010)
700.427487673
507.300
1.719.372
Tyrol
South Tyrol
Trentino
Total
Source : Eurostat, http://appsso.eurostat.ec.europa.eu/nui/show.do?dataset=demo_r_d2jan&lang=en
The different area of the two territories that form the Euroregion determines also the number of
stable population which, in 2006, was higher in the Italian-Austrian Euroregion.

REDETE – ECONOMIC DEVELOPMENT AND ENTEREPRENEURSHIP IN TRANSITION ECONOMIES
809
Chart no.6 The evolution of GDP per inhabitant - thousands euro
010.00020.00030.00040.000
2000 2001 2002 2003 2004 2005 2006 2007 2008
Trentino
Tyrol
South Tyrol
Source: http://appsso.eurostat.ec.europa.eu/nui/show.do?dataset=nama_r_e2gdp&lang=en
Chart no.7 GDP per inhab.(in PPS)-thousands euro
Source: Eurostat, available on: http://epp.eurostat.ec.europa.eu, accessed in 23.01.2012
Regarding GDP/capita, the largest gap is observed between the two Euroregions. This situation is also determined by the national values of the indicator, Italy and Austria being way over Romania and Hungary. Even if the values are not expressed in the same currency, we can make an idea of the absolute differences between Bihor-Hajdu Bihar and Tyrol-South Tyrol-Trentino.
Chart no.8 The evolution of GDP per inhab.(thousands dollars)
Source : TEMPO ONLIN data base, The Romanian National Statistical Institute
http ://portal.ksh.hu/pls/ksh/docs/eng/xstadat/xstadat_annual/i_qlf022.htm, accessed in 15.05.2011
An extremely important area, which at least for Tyrol-South Tyrol-Trentino Euroregion has a
significant contribution to the GDP, is tourism. That is why in the following charts it is comparatively analyzed the evolution of tourists until 2009 in the two Euroregions.
0
10
20
30
40
2002 2003 2004 2005 2006 2007 2008 2009 2010
Italy
Austria

REDETE – ECONOMIC DEVELOPMENT AND ENTEREPRENEURSHIP IN TRANSITION ECONOMIES
810
Chart no.9 The evolution of the number of tourists who needed overnight accomodation
Source : TEMPO ONLINE data base, The Romanian National Statistical Institute
http ://portal.ksh.hu/pls/ksh/docs/eng/xstadat/xstadat_annual/i_qlf022.htm, accessed in 15.05.2011
Chart no.10 The evolution of the number of overnight sleeping tourists – in million persons
0
1
2
3
4
5
2000 2001 2002 2003 2004 2005 2006 2007 2008 2009
Trentino
Tyrol
South Tyrol
Avr.
Source: Paolo Magagnotti - Dezvoltarea Cooperării Transfrontaliere de-alungul istoriei a Euregiunii Trentino
– South Tyrol – Tirol şi Rolul autonomiei în promovarea dezvoltării economice
Thus, as shown in charts no.9 and no.10 of the present research, by 2009, the number of tourists who had visited the analyzed Euroregions had a good evolution overall. However, by comparison, there were more tourists who had chosen Italy and Austria and by default the Tyrol-South and Tyrol-Trentino Euroregion in preference to Bihor-Hajdu Bihar Euroregion. As recalled in a previous chapter, the border area between Italy and Austria won many visitors also because it’s marketing was made together with the three component provinces. Unfortunately, the other Euroregion doesn’t have any common tourist program yet and no functional tourist authority to deal with the marketing of the tourist potential.
Finally, chart no.11 captures the evolution of the number of companies registered in Bihor-Hajdu Bihar Euroregion from 2005 to 2010.
Chart No.11 Registered companies
Source : TEMPO ONLINE data base, The Romanian National Statistical Institute

REDETE – ECONOMIC DEVELOPMENT AND ENTEREPRENEURSHIP IN TRANSITION ECONOMIES
811
http://portal.ksh.hu/pls/ksh/docs/eng/xstadat/xstadat_annual/i_qlf022.htm, accessed in 15.05.2011
The situation highlights the fact that Hajdu-Bihar county had encountered a higher dynamic in respect to Bihor county regarding business environment. An important support for the economic development of the area was represented by the number of companies located in the region and which, through direct foreign investments, have contributed to the rising living standards.
Conclusions
The research conducted on the subject of cross-border cooperation and of Euroregions allows the drawing of the following conclusions:
Many experts see this form of territorial cooperation as a means for gathering closer European countries, the interconnection of different cultures and customs and not least a way to increase links between citizens.
Also in the vast process of economic integration of countries, border regions have an important role, especially as the economic and social integration of these territories is conducted at advanced levels.
Besides these mentioned aspects, we have to point out the fact that inside border territories labor market is directly correlated with the research system and the information exchange.
Regarding the studied Euroregions and taken as an example to point out how cross-border coo-peration influence the development level of territories, it has been observed that the differences are quite obvious. The factors are of the most diverse, starting from the year of establishment, the intensity of links between local authorities involved in the cooperation process, the modality to promote Europe-wide entities, the ability to effectively use available financial resources through the European institutions and last but not least, the ability to prioritize investments in various activity fields.
Reference list:
1. Cismaş L. & Sabău C.(2011). The Evolution of the Socio-Economical Profile and Cross-Border Cooperation in Bihor-Hajdu Bihar Euroregion, Recent Researches in Tourism and Economic Development, pp. 160-165
2. Cismaș L. & Sabău C.(2012). Cross-Border Cooperation in Europe: The Case of Bihor-Hajdu Bihar Euroregion, International Business Research, Published by Canadian Center of Science and Education, Vol.5, No.3, 2012, pp. 91-99
3. Engl A. (2009).Territorial Cooperation in Europe: Coordinated Strategy or Lost in Confusion? Institute of Governance Studies, University of Twente Enschede
4. Engl A.(2007).Future Perspectives on Territorial Cooperation in Europe: The EC Regulation on a European Grouping of Territorial Cooperation and the Planned Council of Europe Third Protocol to the Madrid Outline Convention Concern Euroregional Co-operation Groupings, European Diversity and Autonomy Papers, EDAP 03/2007.www.eurac.edu/edap(accessed 01.03.2011
5. Gambert N. & Jann R.(2011). European Cohesion Policy and Territorial Cooperation. Neighbouring Countries: Towards Deeper Coordination?. European Journal of Spatial Development
6. Ilieş A. (2004). România. Euoregiuni, Editura Universității din Oradea 7. O’Dowd L.(2002) The Research Perspective: The Cross-Border Issue In Europe, Centre for
International Borders Research, Queen’s University Belfast in Cross-Border and Transnational Cooperation, The New Europe is Inventing Itself and Its Margins, Report by Jean-Louis Arnaud

REDETE – ECONOMIC DEVELOPMENT AND ENTEREPRENEURSHIP IN TRANSITION ECONOMIES
812
8. Magagnotti P.(2010). - Dezvoltarea Cooperării Transfrontaliere de-alungul istoriei a Euregiunii Trentino – South Tyrol – Tirol şi Rolul autonomiei în promovarea dezvoltării economice, Universitatea de Vest Timișoara
9. Suli Zakar I.(2007).A hatarok es a Hataron Antyulo(CBC) Kapesolatok, Debrecen 10. Zapletal J.(2010), The European Grouping of Territorial Coperation – EGTC: A New Tool
Facilitating Cross-Border Cooperation and Governance Quaestiones Geographicae 29(4), manuscript
11. AEBR’s Ghid 2000 Politici Regionale, elaborated by AEBR(Section C2), pp.5-6 12. Data base TEMPO ONLINE, Romanian Național Institute of Statistics 13. http://portal.ksh.hu/pls/ksh/docs/eng/xstadat/xstadat_annual/i_qlf022.htm 14. Eurostat, disponibil pe: http://epp.eurostat.ec.europa.eu 15. http://www. europaregion.info/en/19.asp

REDETE – ECONOMIC DEVELOPMENT AND ENTEREPRENEURSHIP IN TRANSITION ECONOMIES
813
ENTERPRENEURSHIP AS A FACTOR FOR ECONOMIC DEVELOPMENT IN THE CROSS BORDER REGION
KICHEVO - KORCA
Dragan DAMJANOVSKI335, Karolina ILIESKA336,
Abstract
The private enterprises are an important driver of the national economy in each country. They give a great contribution to GDP, job creation, exports increase, increased promotion of domestic products to foreign markets, in the creation of innovative products and services, etc. In almost all countries the number of SMEs is between 95% and 99% of the total number of private enterprises.
The number of registered enterprises in FYR Macedonia and in the Republic of Albania is constantly increasing, thereby is increasing the contribution that they make in the economy. Most companies fall into the category of small and medium enterprises. They represent 99% of the total number of active enterprises in FYR Macedonia and 99% of the total number of active enterprises in the Republic of Albania which is an important indicator for the participation of this category of enterprises in the economy of both countries.
Estimating the advantages that the small and medium enterprises have and the need to promote and develop the SME sector in the cross border region, the joint efforts undertaken by this paper, do the first step towards recording and addressing the underlying problems such as:
The difficulties of placing the domestic production to foreign markets;
Insufficient information flow on the markets; Insufficient organization and technical structure; Differences in legislative and banking systems; Services; The rules and procedures; Bureaucracy.
The research and detailed analysis will provides the opportunity to extract a number of conclusions about past work and future development of SMEs. The focus of the analyses will be: profile of the SME sector in the cross border region Kichevo – Korca, swot analysis of the cross border region, the number of joint ventures or foreign investment companies, process of educa-tion for the needs of enterprises; the introduction of standards for facilitated conquest of EU markets; cross-border cooperation between FYR Macedonia and the Republic of Albania, im-plementation of the new technological processes, cooperation with large companies, education of staff and financial support.
Keywords: entrepreneurship, economic development, cross border region, small and medi-um enterprises
335 Technological-Technical Faculty –Veles, R. Macedonia; [email protected] 336 Faculty of Economics-Prilep, R. Macedonia; [email protected]

REDETE – ECONOMIC DEVELOPMENT AND ENTEREPRENEURSHIP IN TRANSITION ECONOMIES
814
1. Sme In The Cross Border Region Kichevo - Korcha
The number of registered enterprises in FYR Macedonia is constantly increasing, thereby in-creasеs the contribution that they give to the economy. Most companies fall into the category of small enterprises. They represent 98.84% of the total number of active enterprises337 which is an important indicator for the participation of this category of enterprises in the country's economy.
Table 1. Number of registered business entites in FYR Macedonia
Year Number of entites 2009 70 710 2010 75 497
Source: State Statistics Office (www.stat.gov.mk)
Table 2. Active business entites by their size (status on 31th December)
2009 2010
Total micro small medium large Total micro small medium large
FYR Macedonia
70 710 38 107 31 873 533 197 75 497 39 999 34 702 584 212
Kichevo region
1404 908 469 0 0 1504 969 530 5 0
Source: State Statistics Office (www.stat.gov.mk)
In Republic of Albania, in turn, the number of registered companies for the previous two years
is as follows:
Table 3. Number of registered business entites in Republic of Albania
Year Number of entites
2009 106 477 2010 103 038
Source: www.instat.gov.al
Unlike Kicevo region, in the region of Korca in the structure of active enterprises, dominate
SMEs, which is evident from the following table:
Table 4. Structure of active enterprises by their size
1 employee 3559 2 – 10 employees 658 11 – 50 employees 88
51 – 100 employees 9 101 – 200 employees 13 Over 200 employees 3
Source: RDA Korca
337 Registered under the Law on Trade Companies

REDETE – ECONOMIC DEVELOPMENT AND ENTEREPRENEURSHIP IN TRANSITION ECONOMIES
815
2. SWOT ANALYSIS OF THE CROSS BORDER REGION KICHEVO - KORCHA
STRENGHTS Excellent geographic position - being at the border of the EU can be an excellent attraction for Greek and EU investors; Excellent position for creation of a free trade zone; Very good infrastructure to support investments such as roads, water supply, telephone network and energy system; Facilitated procedures for starting a business - 10% flat income tax has created a favourable environment for doing business and to attract foreign businesses; A few emigrants are returning and starting businesses based on their European experiences; Natural resources (water, forests, pastures, minerals, unpolluted environment, very fertile land); Suitable conditions for further tourism development (historical and cultural sites, beautiful landscapes and lakes); Educated and professional human resources; Tradition in handicraft; Relatively good base of business entities; Existing NGOs/CSOs;
WEAKNESSES Products are not very well developed and promoted in the neighbouring countries; Inadequate usage of natural resources and historical and cultural fаcilities (not using at all or destroying the resources); Work force is not well qualified based on market economy needs; High number of unemployed people especially young generation who are looking to be trained and enter in the work force of the market economy; Low influence of the media on the development and cross border cooperation; Weak use of IT by entrepreneurs; Lack of urbanistic plans, not defined land ownership and management; Lack of investments; Lack of administrative infrastructure (inadequate set up and functioning of local government); Negative population growth rate; Underdeveloped and unorganized private sector (lack of management skills and knowledge, lack of association of business, undeveloped public-private partnership); Low promotion of tourism opportunities; Lack of strategy for economic development.

REDETE – ECONOMIC DEVELOPMENT AND ENTEREPRENEURSHIP IN TRANSITION ECONOMIES
816
OPPORTUNITIES There are very good opportunities to attract fore-ign investments based on the good infrastructure of the region; Attracting foreign investment by promoting the fiscal reforms which the governments are imple-menting; Media can play a great role on the promotion of Cross Border Cooperation and economic deve-lopment; Use of natural resources as a base for sustainable development - excellent opportunity for develop-ment of water bottling industries; Improve the management of the existing Industri-es and create new ones by training entrepreneurs; Great opportunities for the development of touri-sm; Train entrepreneurs on how to use IT and intro-duce this technology to the businesses; Train unqualified work force based on the needs of the market economy; Further development of agriculture and stock-bre-eding (organic food, wild fruits, poultry); Diaspora investments; Enforcement of private companies through their associating; Decentralization: transfer of competences in LED; Strengthening of the SMEs (business services and training); Re-start of industrial capacities and construction of new energy capacities; Improvement of local-central government coope-ration; Existence of young, qualified and cheap labor
THREATS Long recession period that has affected foreign investments; Remittances from emigrants are going down. The economy will collapse if production is not strengthen on a competitive way; If not well developed the products will not be exported in other countries; Brain drain; Migration of population - well educated young people are leaving the region and living in the metropolitan areas; If natural resources continue to be exploited in this way, very soon we will not be able to use them at all; Bribery and corruption still high; Weak and slow implementation of decentraliza-tion; Bureaucracy; Grey economy; Monopoly of big companies; Lack of professional human resources; Unfavorable policies of central government for LED (mortgages rates on credits, uncompleted privatization, macroeconomic policy, business climate); Lack of national development strategies; Impossibility to follow the pace of technology; Political instability of Balkan region; Poor communication with central government; Unfavorable demographic development (ageing of population).

REDETE – ECONOMIC DEVELOPMENT AND ENTEREPRENEURSHIP IN TRANSITION ECONOMIES
817
force.
3.THE RESEARCH OF THE PAST WORK AND FUTURE DEVELOPMENT OF SMES IN THE CROSS BORDER REGION KICHEVO – KORCHA
The main purpose of this research is overview of the current status and possibilities for future development of the SME sector in the cross – border region. In order to accomplish this objective, it has used a questionnaire on a sample of 200 existing companies in the cross – border region (100 companies from the Region of Kichevo and other 100 companies from the Region of Korca).
The answers obtained have been statistically processed and the results are presented in the tables and graphs which are given below:
1. Last year's realized turnover (in MKD / EUR)
Region of Kichevo (in MKD)
Region of Korca (in EUR)
Total:
Companies % Companies % Companies % Less than 300.000 denars / 5000 euro
46 48% 0 0% 46 24%
300.000 - 1 million denars/ 5000 – 15.000 euro
24 25% 1 1% 25 13%
1 – 3 million denars / 15.000 – 50.000 euro
11 12% 13 13% 24 12%
3 – 5 million denars / 50.000 – 90.000 euro
2 2% 8 8% 10 5%
5 – 10 million denars / 90.000 – 180.000 euro
3 3% 20 20% 23 13%
More than 10 million denars / 180.000 euro
9 10% 57 58% 66 34%
Total: 95 100% 99 100% 194 100%

REDETE – ECONOMIC DEVELOPMENT AND ENTEREPRENEURSHIP IN TRANSITION ECONOMIES
818
The results have shown that the turnover of the companies in the region of Kichevo is relati-vely low, which is understandable if we had in mind that the majority of the companies intervie-wed deal with retail. On the other hand, majority of the companies in the region of Korca have quite high turnover.
2. Introducing new products or technological solutions
Region of Kichevo Region of Korca Total: Companies % Companies % Companies %
Yes 13 14% 88 88% 101 52% No 82 86% 12 12% 94 48%
Total: 95 100% 100 100% 195 100%
The analysis shows that the companies from the region of Kichevo do not invest in
development of new products or technologies, most probably because they do not have enough finance and/ or knowledge in difference to the situation in the region of Korca.
F-Test Two-Sample for Variances
Variable 1 Variable 2
Mean 47.5 50 Variance 2380.5 2888 Observations 2 2 df 1 1 F 0.824273 P(F<=f) one-tail 0.46929 F Critical one-tail 0.006194
Hypothesis is: “There is no statistically significant difference among regions for introducing
new products and technologies.” From the table we can see that 0.82>0.006, so this hypothesis is rejected.

REDETE – ECONOMIC DEVELOPMENT AND ENTEREPRENEURSHIP IN TRANSITION ECONOMIES
819
3. Do you have a prepared business plan for development of your company?
Region of Kichevo Region of Korca Total: Companies % Companies % Companies %
Yes 44 46% 52 52% 96 49% No 52 54% 48 48% 100 51%
Total: 96 100% 100 100% 196 100%
F-Test Two-Sample for Variances
Variable 1 Variable 2
Mean 48 50
Variance 32 8
Observations 2 2
df 1 1
F 4
P(F<=f) one-tail 0.295167
F Critical one-tail 161.4476
H0: There is no statistically significant difference in the preparation of a business plan between
regions. This hypothesis is accepted.
4.Does your company cooperate with companies from R. Albania / FYR Macedonia? – The answers from this question we have on the table below:
Region of Kichevo Region of Korca Total: Companies % Companies % Companies %
Yes 5 5% 23 23% 28 14% No 93 95% 77 77% 170 86%
Total: 98 100% 100 100% 198 100%

REDETE – ECONOMIC DEVELOPMENT AND ENTEREPRENEURSHIP IN TRANSITION ECONOMIES
820
The results shows that only 14% of the company from Republic Albania and FYR Macedonia corporate mutual.
5. Does your company have potential interest in cooperation?
* This question is intended for companies which answered NO on the previous question
Region of Kichevo Region of Korca Total: Companies % Companies % Companies %
Yes 69 72% 78 97% 147 16% No 27 28% 2 2% 29 84%
Total: 96 100% 80 100% 176 100%
Despite the fact that the cross – border cooperation at the moment is on a very low level, the
relatively big interest for cooperation is logical because of the neighboring relations, as well as the possibility to gain new markets through joint cooperation.
6. What are the prerequisites for your company to appear on new markets?
Region of Kichevo Region of Korca Total: Cooperation with companies from neighboring countries 60 87 147 Authorized institution expert assistance 9 33 42 Additional training on marketing 9 23 32 Credits / Loans usage 21 49 70 Other 5 1 6
Ho: There is no statistically significant difference between regions of Kicevo and Korca in identifying factors (modalities) for entering into new markets.
From the analysis we can see that 1.021<5,318 . This hypothesis is accepted.

REDETE – ECONOMIC DEVELOPMENT AND ENTEREPRENEURSHIP IN TRANSITION ECONOMIES
821
Anova: Single Factor
SUMMARY
Groups Count Sum Average Variance
Column 1 5 104 20.8 516.2
Column 2 5 193 38.6 1034.8
ANOVA
Source of Variation
SS df MS F P-value F crit
Between Groups 792.1 1 792.1 1.021406 0.341773 5.317655
Within Groups 6204 8 775.5
Total 6996.1 9
7. Participation in trainings
Region of Kichevo Region of Korca Total: Companies % Companies % Companies %
Yes 43 45% 98 98% 141 72% No 53 55% 2 2% 55 28%
Total: 96 100% 100 100% 196 100%
Next analysis shows the interdependence between introduction of new products, services and
technology solutions and cooperation with companies from the Republic Albania. As we can see H0: there are no statistically significant difference between factors. This means that introduction of new products, services or technology solutions does not depend of cooperation with companies from Republic Albania.
Hypothesis is rejected.

REDETE – ECONOMIC DEVELOPMENT AND ENTEREPRENEURSHIP IN TRANSITION ECONOMIES
822
F-Test Two-Sample for Variances
Variable 1 Variable 2
Mean 1.102041 1.05102
Variance 0.154429 0.048916
Observations 98 98
df 97 97
F 3.156989
P(F<=f) one-tail 1.88E-08
F Critical one-tail 1.398866
The last analysis represent the interdependence between introduction of new products, services
and technology solutions and cooperation with companies from the R. Macedonia. (If positive responses indicate the activity)
H0: There is no statistically significant difference between the factors . This means that introduction of new products, services or technology solutions does not depend of cooperation with companies from Republic Macedonia.
Hypothesis is accepted.
F-Test Two-Sample for Variances
Variable 1 Variable 2
Mean 1.88 1.23
Variance 0.106667 0.178889
Observations 100 100
df 99 99
F 0.596273
P(F<=f) one-tail 0.005359
F Critical one-tail 0.717329
Conclusion
The detailed analysis provides the opportunity to extract a number of conclusions about past work and future development of SMEs:
- Grows the number of newly established enterprises;
- In the next period attention should be paid to the process of education for the needs of enterprises;
- It is necessary to strengthen cross-border cooperation between FYR Macedonia and the Republic of Albania, which is currently low;
- In a large number of enterprises in the Republic of Albania new technological processes are introduced and new products appear on the market, which is not the case with the FYR of Macedonia;
- Bigger and stronger cooperation with large companies, education of staff and normally, stronger financial support with favorable credit terms is needed.

REDETE – ECONOMIC DEVELOPMENT AND ENTEREPRENEURSHIP IN TRANSITION ECONOMIES
823
Reference list:
16. Ilieska,K., Risteska,A., Miladinoski,S.(2002). Marketing Information System, Bitola, 17. Druker P. (2006). Innovation and Entrepreneurship, USA, 18. Fiti T., Markovska V., Bejtmen M.(2007). Entrepreneurship, Skopje 19. Hisrich R., Peters M., Shepherd D. (2009). Entrepreneurship, USA 20. Kuratko D. (2009). Entrepreneurship: Theory, Process and Practice, USA 21. Mariotti S., Glackin C.(2011). Entrepreneurship and small business, USA

REDETE – ECONOMIC DEVELOPMENT AND ENTEREPRENEURSHIP IN TRANSITION ECONOMIES
824
EVALUATION OF SUSTAINABILITY REPORTING OF CZECH COMPANIES
Marie DOCEKALOVA338 Alena KOCMANOVA339
Abstract
The aim of the paper is to compare Corporate Sustainability Reporting according to GRI-Guidelines in the Czech Republic with reports published worldwide. Main objective of Global Reporting Initiative is to create generally applicable recommendations for reporting on sustai-nable development of organization. Growing interest in sustainability instruments and the-ir communication towards company stakeholders has given rise to the Corporate Sustainability Reporting. Corporate Sustainability Reporting is a part of a trend incorporating sustainability into organizations’ management. In the Czech Republic, there is a growing interest in Corpo-rate Sustainability Reporting both on side of companies and their stakeholders. The paper aims to analyse companies´ practical experience with implementation of GRI reporting and to evalu-ate a level of these reports with reports of foreign organizations. The informative value of this comparison is limited by the fact that only one Czech company does reporting according to GRI. To compare the quality of the sustainability report published by the Czech Coal, a compa-ny operating in the mining industry, a study involving comparable reports from the same indu-stry published by companies in other parts of the world was performed. In the study, both quan-titative methods and basic qualitative evaluation methods were used. The performed study shows that the quality of Corporate Sustainability Report of the Czech company is very good and it was rated above average number of points in comparison with Corporate Sustainability Reports issued by foreign companies. Based on the research results a recommendation to Czech organizations can be made. Czech organizations should take an advantage of positive aspects of the GRI sustainability reporting framework, and thus get closer to the worldwide trend. Corpo-rate Sustainability Reporting might help Czech companies and other organizations to improve their position in negotiation with state authorities, local governments and other institutions and it might increase attractiveness for potential investors and international cooperation.
Keywords: Reporting; Corporate Sustainability Reporting; Global Reporting Initiative; Cze-ch Republic.
338 Brno University of Technology, Faculty of Business and Management, Kolejni 4, 612 00 Brno, Czech Republic,
[email protected] 339 Brno University of Technology, Faculty of Business and Management, Kolejni 4, 612 00 Brno, Czech Republic,

REDETE – ECONOMIC DEVELOPMENT AND ENTEREPRENEURSHIP IN TRANSITION ECONOMIES
825
Introduction
Global Reporting Initiative (GRI) was founded in 1997 by a coalition of CERES (Coalition for Environmentally Responsible Economy) and UNEP (United Nations Environment Programme). First GRI guideline (Guidelines 2000) was published in 2000. In 2002 there was next guideline (Sustainable Reporting Guidelines 2002). Currently the third generation of guidelines (G3 Guidelines) is used, issued in 2006. GRI organization is already working on the fourth generation of guidelines (G4-Sustainability Reporting Guidelines). G4 issue is planned for 2013. (GRI, 2012).
GRI is a global initiative that is independent of other institutions. Its main objective is to create generally applicable recommendations for reporting on sustainable development of organization. Directive from GRI for reporting is probably the most comprehensive framework for reporting on sustainable business development, i.e. on economic development, it respects friendly approach to the environment and takes into account the social aspects of business.
The basic framework of the methodology of the GRI Guidelines is a generally accepted frame-work, designed for reporting on environmental, economic and social profile (performance) of an organization. It can be applied in organizations of different sizes, sectors and industries or in di-fferent locations. It takes into account the practical aspects that are common to a wide range of organizations – from small and medium-sized enterprises (SMEs) up to large corporations with. This framework provides general and sector-specific content, which was agreed by a wide range of stakeholders from around the world to be generally applicable for voluntary reports – reporting on performance (profile) of the organization in the field of sustainable development (GRI, 2012, Hrebicek and Kokrment, 2005; Hrebicek and Soukopova, 2008)
In 2009, Amsterdam Declaration „On Transparency and Reporting“ was issued, within the fra-mework of which the GRI Board of Directors challenged governments to introduce national strategies of sustainable development, which require organizations to publish in their voluntary reports ESG indicators. The Declaration states that the causes of the current economic crisis could be identified by global transparency and responsibilities of a reporting system of the organizations, based on a carefully and publicly reported ESG performance. The declaration calls on the governments to assume leadership for economic reconstruction and for the recovery into a flexible economic system, through which:
- Implementation of company policies (strategy) requires, that ESG indicators are reported, or it is publicly explained why the company does not do so.
- By requiring ESG reporting from public institutions – in particular for: public companies, government and public pension funds, investment agencies.
- Integrating reports within the newly emerging global financial regulatory framework, suggested by G20 officials.
Previous intergovernmental meetings have recognized the need for publishing voluntary
business reports with sustainability indicators at the 2007 G8 summit in the German Heiligenda-mm, where GRI reporting was officially supported. It should serve as a means to obtaining good governance of public matters, and their transparency, and so achieve reduction of poverty, conflict prevention, promotion of sustainable investment decision-making and support of development in developing economies. (Hřebíček et al., 2009; Hřebíček et al., 2009; Ritschelová et al., 2008; Hřebíček, 2009)
Sustainable business development is understood as a complex set of strategies that allow using economic means to satisfy human needs, material, cultural and also spiritual needs, while fully respecting environmental limits. Economic development, environmental and social aspects are
REDETE – ECONOMIC DEVELOPMENT AND ENTEREPRENEURSHIP IN TRANSITION ECONOMIES
826
impossible to be perceived separately and the concept of sustainable development stresses the harmonious and balanced development of these three pillars (Moldan, Hak and Kolarova, 2002).
Measuring of sustainable development is given by indicators that are strategic tools for the sustainable development of the company. In any business the best indicators are those that match the key risks relating to the sustainable development of the company, provide information that can help clarify issues and measure the responses (Kocmanova, Hornungova and Klimkova, 2010).
Corporate Sustainability Reporting in accordance with GRI in the Czech Republic and abroad
In the Czech Republic (CR) the interest in Corporate Sustainability Reporting is on the rise with the companies that issue the reports, and also on the part of the public wishing to learn more about the activities of enterprises.
Despite increasing interest in Corporate Sustainability Reporting these reports are issued in the CR only by 14% of companies, what is in percentage terms less than in Romania and Hungary (KPMG, 2008). In addition, we are only talking only about large companies. Implementation of Corporate Sustainability Reporting in SMEs is certainly without any great exaggeration near to 0%.
Possible reasons that prevent further expansion of the Corporate Sustainability Reporting are: level of resources, capabilities and skills that may be missing in SMEs; financial investment without return in the short/medium term; lack of guidelines specifically tailored for SMEs; SMEs do not perceive the possible benefits from Corporate Sustainability Reporting; limited financial resources (Borga, Citterio, Noci and Pizzurno, 2009).
In the CR is a widespread view that the reporting according to GRI is suitable only for large enterprises. GRI statistics shows that this view is mistaken and that SMEs elsewhere in the world are capable of reporting according to GRI. GRI statistics shows that SMEs are a significant minority, but the reporting of SMEs are growing annually at an increasing rate. Most SMEs which issued the GRI report in the last three years are from Europe.
In 2011, 1845 organizations worldwide released a report on sustainable development according to the GRI-G3 Guidelines. While according to GRI statistics in the CR only 2 organizations, i.e. 0.11 % of the total. Companies that issued these reports, are the Czech Coal and Provident Financial. The company Czech Coal operates in the coal mining sector and Provident Financial in the financial services sector. In 2011, to the reports from these two companies came another report from the company CEE Bankwatch Network, acting as an international NGO. Company Czech Coal issued its first sustainability report in 2005 and since then it publishes it regularly every year. The company Provident Financial issued the first report according to GRI also in 2005, than in 2006 and the last report for 2009 was published in 2010. The organisation CEE Bankwatch Network issued the report only once, in 2010.
Provident Finacial and CEE Bankwatch Network are not Czech companies and in the statistics of GRI they are assigned to the CR because they have a branch in the CR. Their reports are not specific about their activities in the CR but to the whole international society. Only the company Czech Coal has experience with reporting according to GRI in the Czech environment. So in comparison we will take as purely Czech reports only the reports from Czech Coal.
The main reason why the company Czech Coal decided to issue reports according to GRI is the equal reporting of both financial and non-financial data and both internal and external effects. The chosen methodology in their view allows preparing a more rational and balanced interpretation of the impact of the company on the environment and stakeholders, in comparison with purely protective perspectives which are focused only on negative impacts of man and technology on nature. Sustainability report from Czech Coal is based upon consolidated data from annual reports of the company, and some other details are taken from annual reports of individual branches and

REDETE – ECONOMIC DEVELOPMENT AND ENTEREPRENEURSHIP IN TRANSITION ECONOMIES
827
subsidiaries, only a small portion of data is prepared specially for this report. Some information, especially social data, quality management, social impacts of mining, etc., are prepared separately with respect to requirements of the GRI methodology, only for the needs of stakeholders (Kuzel, 2009).
Case study: assessing the level of Czech reports in the world context
If we want to compare the level of the GRI-reporting in the Czech Republic and abroad there should be compared the reports from comparable companies. As discussed above in the CR, there is only one company issuing GRI report, i.e. we shall compare it with similar companies in the world, and the information will be drawn from the GRI statistics. Comparisons will be made with reports issued in 2011.
As the basic characteristics were chosen: - Industry - mining
- Enterprise size - large
Companies with these characteristics are 80. Distribution by countries is shown in a Fig. 1.
Figure 1: Distribution of GRI reports according to countries in mining industry (Source: own processing based on GRI statistics)
Reports will be evaluated by the following set of qualitative indicators, of which the first four are used by GRI: Integrated Report; application level, status, sector supplement, the availability of reports; clarity of reports. List of indicators with the values, which may be acquired and their score is given in Table 1.

REDETE – ECONOMIC DEVELOPMENT AND ENTEREPRENEURSHIP IN TRANSITION ECONOMIES
828
Table 1. Indicators for reports evaluation
Indicator Values Scoring Integrated Report Yes 1
No 0 Application Level A, A+ 3
B, B+ 2 C, C+ 1
undeclared 0
Status GRI-checked 2 Third-party-checked 2
Self-Declared 1 None 0
Sector Supplement Used 1
Not used 0
Availability Available at www 1
Available on request 0
Clarity intelligible 2 neither intelligible nor unintelligible 1
unintelligible 0
Source: own processing
Integrated Report – contains information about financial performance of organisation and
about its environmental, social and corporate governance (ESG) performance. In order to make the integrated reporting to be functional and useful activity for the company, it must be based on standard financial reporting (IFRS and U.S. GAAP) and ESG reporting (GRI Guidelines). Advantages of integrated reporting are that it provides a comprehensive and consistent reports, the firm communicates the same information to owners (shareholders), employees and all other stakeholders.
Application level – application levels shows the extent to which G3/G3.1 Guidelines were used. Application level reflects the degree of transparency in reporting, but do not give opinion on sustainable performance and quality of the reports.
Application Level C – in the report must be published at least 10 performance indicators, either core or additional with at least one from each group of economic, social and environmental indicators. There is no need to publish data on management approach (Disclosures on Management Approach - DMAs).
Application Level B – disclosures on Management Approach must be published for all categories of indicators. The report should include at least 20 performance indicators, with at least one from the field of the economic, environment, labour practices and decent work, human rights, society and product responsibility.
Application Level A – intended for organizations experienced in reporting. There must be published Disclosures on Management Approach for all categories of indicators. All performance indicators must be reported, including indicators from a sector supplement.
Status – application level of the report should be confirmed. The author of the report declares the application level himself by comparing the own content of the report and criteria of the GRI Application levels. They may also let to confirm the level by GRI (GRI offers this service) and also/or ask a third party to evaluate the accuracy of the declared Application level. Confirmation of Application level increases the credibility of the report.

REDETE – ECONOMIC DEVELOPMENT AND ENTEREPRENEURSHIP IN TRANSITION ECONOMIES
829
Sector Supplement – GRI Sector Supplements are tailored to the specific requirements of certain sectors. By application of the Sector Supplement the reports are becoming more relevant, because some issues are unique to a particular sector (e.g. relocation of residents for the mining industry) (GRI, 2O12).
Availability of reports – it can just be recommended that the reports should be available for all who are interested in them. We see no reason why the organization simply could not provide reports for download on the Internet. Also this fact makes the reports more credible and proves the openness of an organization in providing information.
Clarity of reports – it is recommended for greater clarity to use appropriate graphical means, such as charts and photos. Publishing the reports in English is a necessity for large companies, while only the national language (if different from English) seems to be insufficient. It is appropriate to issue the report also in the national language or in the language of the largest group of stakeholders (employees, affected community), because the report is becoming for them more accessible and understandable. Clarity of reports was considered independently by two persons without professional training in the field of reporting.
The maximum number of points that the report can in the case study get is 10 points – such report is integrated, application level A is checked by GRI or by third party, sector supplement is used, the report is easily available on the website of the organization and is intelligible. The minimum score is 0 and this is a „basic“ report, i.e. not integrated, application level is not declared and hence not checked and sector supplement is not used, the report is not available at www.
Table 2. Evaluation of 80 analysed reports from large companies from the mining sector
Indicator Values Number of reports % share Integrated Report Yes 9 11.25
No 71 88.75 Application Level A, A+ 37 46.25
B, B+ 22 27.50 C, C+ 10 12.50
undeclared 11 13.75 Status GRI-checked 18 22.50
Third-party-checked 28 35.00
Self-Declared 23 28.75
None 11 13.75 Sector Supplement Used 57 71.25
Not used/Not Applicable 23 28.75 Availability Available at www 71 88.75
Available on request 9 11.25 Clarity intelligible 43 52.50
neither intelligible nor unintelligible 28 36.25
unintelligible 9 11.25
Source: own processing
From the set of analysed reports we can draw characteristics. For the set of evaluated reports is
typical: - reports are not integrated (88.75 %); - Application level A (46.25 %); - Application level is confirmed by GRI or a third party (57.50 %);

REDETE – ECONOMIC DEVELOPMENT AND ENTEREPRENEURSHIP IN TRANSITION ECONOMIES
830
- Sector Supplement is applied (71.25 %); - available on the website of the organization (88.75 %); - good clarity of reports (52.50 %). Table 3 shows the score distribution of evaluated reports. The maximum number of points
achieved only one organization from Chile. One report was rated with the minimum score, it was a Chinese company. The average number of points is 6.6375.
Table 3. Distribution of points for evaluated reports
Scoring Number of reports 10 1 9 15 8 18 7 12 6 12 5 9 4 7 3 3 2 2 1 0 0 1
Total 80 Source: own processing
Report on the sustainable development of Czech company Czech Coal was rated with 9 points,
application level A + is confirmed by a third party, sector supplement is used, the report is available from the website of the company in Czech and English and it is well intelligible. But it is not an integrated report and for this reason one point was deducted.
Discussion and conclusions
Corporate Sustainability Reporting is a part of a trend integrating sustainable development into companies’ management. Despite increasing interest in Corporate Sustainability Reporting on side of stakeholders, Czech organizations do not publish these reports in a larger extent.
Possible reasons that prevent more widespread voluntary sustainability tools emerge from the literature search (Del Brío and Junquera, 2003; Pilisi and Venturelli, 2003; Venturelli and Pilisi, 2003; Friedman and Miles, 2002; Tilley, 2000; Bianchi and Noci, 1998; Borga et al., 2009):
- levels of resources and skills that may may be missing,
- financial investments without short/medium returns,
- low sensitivity to the potential advantages,
- limited financial resources.
These findings may be related to Corporate Sustainability Reporting, because it is one of
voluntary sustainability tools. Tailored reporting framework and reporting guidelines that would meet the needs of Czech
companies may help to introduce Corporate Sustainability Reporting and change little interest of Czech companies in this matter. Such reporting framework should be built on existing mandatory reports and information that companies routinely monitor, and it should be on basic level. After overcoming the concerns of companies and verification of positive effects, companies would

REDETE – ECONOMIC DEVELOPMENT AND ENTEREPRENEURSHIP IN TRANSITION ECONOMIES
831
naturally move to the internationally recognized methodology (e.g. GRI). Czech companies should use and take the advantage of the GRI Reporting Framework and services that GRI offers.
Another solution is that Corporate Sustainability Reporting would cease to be voluntary and become mandatory by law. Countries that adopted a mandatory sustainability reporting law are for example: Norway, Sweden, Australia, Great Britain, Italy, etc. In companies that were forced by law to adapt mandatory sustainability reporting, bribery and corruption has been reduced, an employee training has become a higher priority and companies implement more ethical practices (Ioannou and Serafeim, 2011).
To evaluate reports the following set of qualitative indicators was used: integrated report; application level, status, sector supplement, the availability of reports; clarity of reports. From the comparison of Czech report with other reports is obvious that this report is very good and it was rated high above the average number of points.
Czech companies should more use the GRI Reporting Framework and services offered by GRI. Czech companies should inform their stakeholders more about their environmental, social and economic impact. Czech companies should use the advantage of the Corporate Sustainability Reporting because it might help them to improve their position in negotiation with state authorities, local governments and other leaders, to increase employees' positive attitude to the company and thus achieve significant economic effects, increase attractiveness for potential investors and international cooperation. All these effects should in long term lead to economic benefits and sustainability of business.
Acknowledgements. This paper was supported by grant FP-S-12-1 ‘Efficient Management of
Enterprises with Regard to Development in Global Marketsfrom the Internal Grant Agency at Brno University of Technology’.
References
1. Bianchi, R., Noci, G. (1998) Greening SMEs’ competitiveness. Small Business Economics, 11,
pp. 269–281. 2. Borga, F., Citterio, A., Noci, G., Pizzurno, E. (2009) Sustainability report in small enterprises:
case studies in Italian furniture companies. Business Strategy & the Environment (John Wiley & Sons, Inc), 18(3), pp. 162-176
3. Friedman, A. L., Miles, S. (2002) SMEs and the environment: evaluating dissemination routes and handholding levels. Business Strategy and the Environment, 11, pp 24–341.
4. GRI Guidelines (2012) https://www.globalreporting.org/reporting/latest-guidelines/g3-guidelines/Pages/default.aspx (accessed 20.06.2012.)
5. Del Brío, J. A., Junquera, B. (2003) A review of the literature on environmental innovation management in SMEs: implications for public policies. Technovation, 23(12), pp. 939–948
6. Hřebíček, J. (2009) Voluntary Reporting in the Czech Republic and Indicators of Sustainable Development. In Sustainability Accounting and Reporting at macroeconomic and microeconomic level. Praha: Linde nakladatelství Praha, pp. 257-264
7. Hřebíček, J., Hájek, M., Chvátalová, Z., Ritschelová, I. (2009) Current Trends in Sustainability Reporting in the Czech Republic. In EnviroInfo 2009. Environmental Informatics and Industrial Environmental Protection: Concepts, Methods and Tools. 23. International Conference on Informatics for Environmental Protection. Aachen: Shaker Verlag, pp. 233-240
8. Hřebíček, J., Hájek, M., Ritschelová, I., Sidorov, E. (2009) Corporate Sustainability Reporting in the Czech Republic. In Environmental Accounting - Sustainable Development Indicators. Ústí nad Labem: Universita J. E. Purkyně Ústí nad Labem, 12 p

REDETE – ECONOMIC DEVELOPMENT AND ENTEREPRENEURSHIP IN TRANSITION ECONOMIES
832
9. Hrebicek, J.,Kokrment, L. (2005) Standardization of Environmental Reporting in the Czech Republic. In Environmental Accounting and Sustainable Development Indicators. Praha: Jan Evangelista Purkyně University in Ústí nad Labem, Charles University in Prague, pp. 309-317
10. Hrebicek, J., Soukopova, J. (2008) Dobrovolné zprávy o hodnocení vazeb mezi životním prostředím, ekonomikou a společností. Praha: Ministerstvo životního prostředí
11. Ioannou, I., Serafeim, G. (2011) The Consequences of Mandatory Corporate Sustainability Reporting (Working paper 11-100). Harvard Business School. http://www.hbs.edu/research/pdf/11-100.pdf
12. Kocmanova, A., Hornungova, J., Klímkova, M. (2010) Impact of economic, social and environmental performance on sustainable development in the Czech Republic. In: The 15th Intenational Business Information Management Conference (IBIMA). Cairo Egypt. The American University in Cairo School of Business: IBIMA USA, pp. 722-730
13. KPMG (2008) International Survey of Corporate Responsibility Reporting 2008. http://www.kpmg.com/Global/en/IssuesAndInsights/ArticlesPublications/Documents/International-corporate-responsibility-survey-2008.pdf (accessed 20.05.2012.)
14. Kuzel, S. (2009) Sustainability Reporting in the Czech Coal Group. In: Environmental Accounting-Sustainable Development Indicators. Ústí nad Labem: Universita J. E. Purkyně, pp. 1-6
15. Moldan, B., Hak, T., Kolarova, H. (2002) K udržitelnému rozvoji České republiky: vytváření podmínek. Svazek 1, Zdroje a prostředí. Praha: Univerzita Karlova v Praze, Centrum pro otázky životního prostředí
16. Pilisi, A., Venturelli, A. (2003) Introducing environmental management accounting into small and medium-sized enterprises. In Environmental Management Accounting: Purpose and Progress, Bennett M, Rikhardsson PM, Schaltegger S (eds). Kluwer: Dordrecht, pp. 1–27
17. Ritschelová, I., Sidorov, E., Hájek, M., Hřebíček, J. (2008) Corporate Environmental Reporting in the Czech Republic and its Relation to Environmental Accounting at Macro Level. In 11th Annual EMAN Conference on Sustainability and Corporate Responsibility Accounting. Measuring and Managing Business Benefits. Budapest: AULA, pp. 55-60
18. Tilley, F. (2000) Small firm environmental ethics: how deep do they go? Business Ethics: a European Review, 9(1), pp 31–41
19. Venturelli, A., Pilisi, A. (2003) EMA in SMEs: ten Italian case studies. In Environmental Management Accounting: Purpose and Progress, Bennett M, Rikhardsson PM, Schaltegger S (eds). Kluwer: Dordrecht, pp. 29–52.

REDETE – ECONOMIC DEVELOPMENT AND ENTEREPRENEURSHIP IN TRANSITION ECONOMIES
833
PLACE OF SUSTAINABLE TOURISM IN REGIONAL DEVELOPMENT OF SERBIA
Svetislav MILENKOVIĆ340
Nikola BOŠKOVIĆ341
Abstract
Permanent, linear or exponentially growing, dynamic or gentle, untouchable in continuous wavering of global economic forces, tourism movement is still reflected in tourist activities. The world is getting more tempting, and tourism is increasingly unable to satisfy all emerging hu-man needs equally and evenly dislocated in every place and time. Therefore there arises the qu-estion of new „colonialism“ or tourist „imperalism“ in the regionalization of tourist market and overall tourist traffic.
Expansive and uncontrolled tourism development over the past few decades, followed by ma-ny negative ecological, social and cultural consequences imposes the need of placing this acti-vity under the concept of sustainable development. In the last twenty years, tourism has deve-loped into an important factor in the context of sustainable development in both positive and negative terms. Sustainable tourism in its purest sense represents an economic activity of min-imal negative environmental and local cultural impact while stimulating income generation, new employment and protection of local eco-systems along with meeting all tourists’ needs. The main objective of this type of tourism is to enable people to enjoy and gain knowledge on natural, historical and cultural features of the unique environment while preserving the integrity of a tourist site and fostering the economic growth and welfare of a local community.
On the other hand, sustainable tourism in the regional development presumes different eva-luation measures for it is needed to determine its value over the whole region of Serbia, find appropriate destinations fitting into the tourist product of the region, recognize tourist destinati-ons with rounded, i.e. complex tourist offer and incorporate them all into macro global regional scale. As a consequence, sustainable development opportunities are determined by the regional development which is seen as a resource base of the formed concept of tourist services, modern infrastructure and reasonable economic policy of the country.
In Serbia, the relation between sustainable tourism and regional development indicates the necessary and indispensable milestone in modern trends of the global economy. In our country, it has primary natural and anthropogenic base in the tangible part of tourist product, and secondary role in its intangible part. This further means that resource base of sustainable tourism makes the Serbian regions rich, whereas their hospitality services are still at very low level. If this is accompanied by insufficient participation of the local community in the regional tourist development, the need arises to transform the undeveloped conflicting unsustainable tourism into developed co-existential one in the economic activities of all regions of Serbia.
The goal of the work is to define position of sustainable tourism of lasting duration and responsible behaviour in the regional development of Serbia. Out of the afore-mentioned goal the following hypothesis is derived: sustainable tourism is a reflexive change of the attarctive-
340 University of Kragujevac, Faculty of Economics, Serbia, E-mail: [email protected] 341 University of Kragujevac, Faculty of Economics, Serbia, E-mail: [email protected]

REDETE – ECONOMIC DEVELOPMENT AND ENTEREPRENEURSHIP IN TRANSITION ECONOMIES
834
ness of needs and services which are to grow into a regular movement of tourists, capital and tourist stakeholders in space and time. While proving the set hypothesis by means of latest met-hods for evaluation of sustainable tourism and regional development, the work will result in a practical confirmation of the basic indicator of sustainable tourism development based on opti-mal regionalization of Serbian tourist resources.
Keywords: sustainable tourism, movement, regional development, Serbia
1. Introduction
Following the Second World War, tourism became a global phenomenon that characterises aspects of post industrial society and presents insights into major trends for the future (Eadington and Redman, 1991, p.41.). Such observed interdependence between tourism and economic development continued to exist in the following period.
The term “sustainable tourism” first entered the language in the 1970s' though we meet the basic elements of sustainability in the works of the classic economists (Rikardo, Maltus and Mill) which can be fully applicable in the period of development of modern tourism. The first occurence of the term “sustainable tourism” originates from the 1970s' in the Millers’s researches in which he studied the possibilities of development of tourism in national parks (Miller, 1978). According to his findings, tourism development is more likely to be achieved when preservation of the natural characteristics of protected areas is parallelly ensured.
The period of the '80s and '90s of the last century is marked by the fact that an increasing number of authors start debating about the need to change the basic principles of mass tourism, which was already proven to be unsustainable in the long run. Emphasis is placed more on the destination, for it is seen as a vehicle of tourism development, and the analysis of its performance. The potential of tourism development in the future depends on the resource potential of the destination.
Some autors (Bramwell and Lane, 1993, p.3) define sustainable tourism as a positive approach intended to reduce the tensions and frictions created by complex interactions between the tourism industry, visitors, the environment and the communities which are host to holiday makers…an approach which involves working for the longer viability and quality of both natural and human resources. Others (Hunter and Green, 1995) suggest that sustainability includes quality of life for local communities, visitor satisfaction and conservation of natural and human resources. Our opinion is that Hunter's and Green's views are more correct for it should not be the objective of sustainable tourism the preservation of tourist resources only, but also the satisfaction of all participants in tourist business.
Harris and Leiper agrue that sustainable tourism dependent upon a given stock of natural, constructed and socio-cultural attributes...if sustainable development of these resources is to occur they must be managed in a way that allows the economic needs of industry and the experiential needs of tourists to be met while at the same time maintaining cultural integrity, preserving or enhancing biological diversity, and maintaining life support systems (Harris and Leiper, 1995). Swarbrooke define sustainable tourism as a tourism which is economically viable has but does not destroy the resources on which the future of tourism will depend, notably the physical environment and the social fabric of the host community (Swarbrooke, 1999, p.13). On the other hand, Burns highlights the ethical aspect of sustainable tourism, which must find its place in designing the sustainable tourism development of a particular region (Burns, 1999).
Bakić defines sustainable tourism as meeting the needs of the present without arrogantly neglecting the ability of future generations to meet their own needs (Bakić, 2004, p. 115.).
Not all the concepts of sustainable tourism in Serbia and elsewhere are focused on the regional characteristics of the resource potential that should assure such sustainability. Therefore, pessimistic, optimistic and conservative economic and ecological orientations stimulate the

REDETE – ECONOMIC DEVELOPMENT AND ENTEREPRENEURSHIP IN TRANSITION ECONOMIES
835
development of sustainable tourism in the direction that it build links with, on the one hand, technocratic achievements of scientific and technical progress and, on the other hand, all the movements of natural sciences calling for sustainable tourism to be an economic activity, but also the greatest stabilizer and an optimal balancer between all the elements of the environment.
In this paper, we present the most important features of the regional distribution of sustainable tourism in Serbia with the aim of putting this regionalization of sustainability in existential and symbiotic relation to regions of sustainable tourism in the former Yugoslavia, as well as the current broader areal units (eg. southeast Europe). The goal of such a regionalization of sus-tainable tourism in Serbia is to properly satisfy all environmental and economic quality standards laid down by the international community, both for the tourism product and environmental and economic growth and development of all regions. This will ultimately result in the integration of sustainable tourism of the prominent regions of Serbia into international clusters, especially in the so-called LAND cluster, the center for evaluation of sustainable tourism in Bratislava (Slovakia).
2. Regional aspects of sustainable tourism and their integration into sustainable
development of Serbia
The concept of sustainable tourism is an integral part of sustainable development, which has emerged as a logical necessity of stopping the expansive economic growth based on the uncontrolled exploitation of the existing, primarily natural resources. Economic policy makers at the global, regional, national and recently local level are trying to find an answer to the question how it is possible to ensure both economic development and preservation of natural resources and the environment. It is the tourism that offers one of the positive and possible answers to that question. The development of tourism ensures reaching both goals in the long run, because it is one of the few, if not the only economic sector and industry which is concerned for the long-term survival of natural and anthropogenic resources. Only the existence of these resource categories enables the development of tourism.
The first theoretical studies related to the various modalities and the need to introduce sustainable tourism gave rise to the necessity for the establishment of regional guidelines for further development of sustainable tourism. In order for these guidelines to come to the fore in regional predispositions for the development of sustainable tourism in Serbia, it is found indispensable that each region includes the following:
1. compactness of necessary tourist sites attractive enough for the development of sustainable tourism;
2. to achieve unity of preserved landscape or environmental units of that region;
3. to transform the said landscape or environmental units into into familiar or recognizable brands of sustainable tourism;
4. to educationally prepare population in tourist destinations for ecological and economic sustainability of tourism penetration;
5. each region should bear regional endurance capacity for all tourism activities, and
6. to achieve in each region such competition that does not affect the neighboring regions but helps create the comparative safety of exchange so that the free movement of tourists, labor and capital always result in a sustained economic growth and development.
Each development, including that of sustainable tourism in Serbia, has to respect international
consensus in determining concepts or recommendations for the development of sustainable

REDETE – ECONOMIC DEVELOPMENT AND ENTEREPRENEURSHIP IN TRANSITION ECONOMIES
836
tourism. Therefore, we think that the most acceptable for Serbia is to take the following two concepts, namely:
- that of the World Commission on Environment and Development from 1987, the so-called Brundtland Report, which defines sustainable development as development that meets the needs of the present without compromising the ability of future generations to meet their own needs, and
- Agenda 21, ie. International Covenant on Sustainable Development from 1992, which ma-kes an attempt to concretize the concept previously established. Its key contributions are it gives concrete strategies that should lead to sustainable development and strikes a balance between economic, environmental, social and political dimensions of sustainable develop-ment.
Without going too deeply in an attempt to find the most appropriate definition of the concept
of sustainable tourism, which, after all, goes beyond the objective of this work, we shall state the basic elements of sustainable tourism here:
- conservation of natural resources and the environment, which has not been done enough in Serbia;
- affirmation of social integrity, which in all regions in Serbia has yet to take hold in the course of sustainable development of tourism;
- fostering cultural specificities of the local population, which is at a very high level in Ser-bia and can be considered as a driving power of sustainable tourism;
- optimally satisfy the tourist needs, which has not been achieved yet in sustainable tourism in the region of Serbia, and
- achieving economic profit, which is the desired item and good management mission of sus-tainable tourism in the regions of Serbia.
According to a recent survey of many international organizations (EU, UNWTO, OECD, UN-
EP), sustainable tourism should: 1. provide conditions for the optimal use of environmental resources that constitute a key
element in the development of modern economy and tourism as the most dynamic and most promising industries, through which Serbia, for having them sufficiently, can work on the development of selective sustainable tourism industries in all regions;
2. enable the maintenance of essential ecological processes and contribute to the conser-vation of the natural heritage and biodiversity in all of Serbia's development strategies, which is the base for the development of sustainable tourism;
3. ensure respect of socio-cultural authenticity of the local communities jeopardized by globalization process and the imposition of purported solutions to problems of modern economies. Here it needs to be done especially in eastern Serbia, creating a sustainable tourism destinations of Šopska and Vlaška communities, as well as in Vojvodina where we are witnessing the rising prominence of ethnic minorities’ cultures;
4. preserve the cultural heritage and traditional values of authentic areas, which are to beco-me the basis for the development of modern tourist forms. For Serbia, the authentic pro-perties of the gravitational zones of Stari Ras and Stari Vlah are very important basis for the development of sustainable tourism;
5. contribute to intercultural understanding and tolerance, as one of the proclaimed goals of the global economy development on the whole. This has a particular impact on the inter-regional tourism cooperation between the countries of the former Yugoslavia. For Serbia,

REDETE – ECONOMIC DEVELOPMENT AND ENTEREPRENEURSHIP IN TRANSITION ECONOMIES
837
this refers to the Republic of Srpska with its sustainable tourist parts centered around the town of Trebinje, the National Park Kozara, the Banja Luka region and Semberija with Posavina. Also, other regions of the Serbian neighbouring countries can grow into major international tourist clusters, and
6. create conditions for sustainable, long-term economic performance, providing socio-eco-nomic benefits to all stakeholders that are, in most cases, fairly distributed, including steady employment and income for local communities and a contribution to poverty reduction. It is a key goal of sustainable tourism management in the regions of Serbia
3. Role of sustainable toursim in achieving balanced regional development
Early modern understanding of the relationship between tourism and regional development is considered to be of a French research tourismologist Defert. He laid the foundation for regional tourism development planning, basing it on two principles (Defert, 1966, p. 10-11):
- tourist development of a region must be preceeded by an examination of the economic structure of the population residing in the region observed which may be a vehicle of the tourist development both through primary and complemetary employment, and
- it is essentially needed to develop and improve regional planning of tourist traffic and con-struction, even more than in other sectors and industries.
From the afore-mentioned, it is easily to conclude that the expansion of sustainable tourism can
only be achieved by well organized local communities in the region. Also, the success of sustain-able tourism in the region depends on the impact of economic policies that affect business envi-ronment in the region. This means that long-term planning of sustainable tourism development should be observded from the viewpoint of development of the regions and in coordination with the global objectives of national economic policy. If sustainable tourism is recognized as a key factor of a balanced regional development within a country, and if the measures of the national economic policies are taken in this direction, then it is possible to achieve long-term sustainable development of tourism. The initiator of balanced development of tourism in some regions of Serbia is the optimal ratio of the formation of tourism demand and offer, in compliance with changes to the existing and newly created tourism markets.
Tourism, as a kind of phenomenon of temporary migrations, in all its manifestations has al-ways been associated with an area and conditioned by certain natural characteristics of the area. Putting aside the contentious and still unresolved issues on the specific policy of regional deve-lopment, tourism planning, in any case, requires a special approach to the concept and function of a natural and economic region. Tourism is always and permanently connected to the natural characteristics of the area, which are non-transferable and non-consumable if managed rationally, and this is what gives tourist regions the attributes of natural ones. Taking advantage of these na-tural features, tourism drives certain economic processes and make tourist regions obtain specific economic features.
Developing tourism in rural or relatively poor regions of a country may mitigate between de-veloped and underdeveloped areas. When the tourism sector expands, new revenues flow into the economy of the destination region. As a result, jobs are created and income grows. (Tosun.C. et all., 2003, p.142). This clearly indicates that sustainable tourism development on a region encou-rages overall economic, environmental, social and political development so that sustainable tourism can emerge as one of the key growth and development strategiesin the under-developed areas.

REDETE – ECONOMIC DEVELOPMENT AND ENTEREPRENEURSHIP IN TRANSITION ECONOMIES
838
When discussing the establishment of the dependency between sustainable tourism deve-lopment and reduction of regional disparities, we must point out a Milenković’s survey. He states that certain regions that had the core values of tourist attraction started developing rapidly under the influence of increasingly growing tourism spending (Milenković, 2009, pp. 81-82). To what extent the modern and post-modern tourism influenced changing of economic situation of certain regions, we can conclude from it becoming not only an economic, but also social, geo-strategic, political etc. category. Today tourism is a unique function of all elements of the socio-economic system, which means it activates all parts of the secondary products of other branches and industries to create the highest quality product of the region. For these reasons, the regional touri-sm development of Serbia is an inseparable part of international tourist regions such as the Medi-terranean, Alpine, Danube, etc. From this it follows that it is necessary to acknowledge tourism’s development role; as to be able to further ensure the harmonious development of the region, meeting the tourist needs and increase the effectiveness and efficiency of the tourism industry, it is inevitable to take certain actions.
Tourism’s contribution to sustainable development is also expressed in terms of regional im-pact by its role in regional planning and development, which can help to correct economic im-balances between regions. In many regions, tourism generates numerous opportunities for diversi-fication of the local economy, by attracting economic resources to areas where there are few po-ssibilities for alternative development. (Petković and Pindžo, 2012, p. 121).
The process of planning sustainable tourism development in one region must follow the mode-rn concept of regional planning management. The basis of tourism regional development planni-ng has been formed by Gunn.
From the presented model (Figure 1), we see that the process of sustainable tourism develop-ment planning in a selected region commences with the identification of the objectives to be achi-eved through the tourism development. The objectives are often not only related to tourism development, but concerns the possibilities of the overall economic development of the region. If tourism is identified as one of the alternatives in the research phase on the basis of the available natural and anthropogenic resources, the next phases give recommendations on which forms of sustainable tourism to develop and to what extent.

REDETE – ECONOMIC DEVELOPMENT AND ENTEREPRENEURSHIP IN TRANSITION ECONOMIES
839
Figure 1. Process of regional tourism planning
Source: Gunn, C. (1993). Tourism planning. Washington: Taylor-Francis. p.142
Should we accept all current and successful business initiatives and proposals from the Serbia
related statements given above, sustainable tourism development would have the following characteristics:
1. in the region of Vojvodina sustainable tourism must be practiced because the flat land itself seems to accelerate degradation of the environment and at the same time the psychological behavior of tourist stakeholders. Therefore, sustainable tourism can be either: at the initial stage of development in all cities and industrial destinations of Vojvodina or the medium level of development in the gravitational areas of Palic and Ludaš, all salaš estate complexes, Vršac hill, Fruška Gora mountain, Upper Danube, Deliblato Sands and Koviljsko- Petrovaradin Marsh;
2. Belgrade region, unfortunately, does not have good conditions for the development of sus-tainable tourism except for water tourism and activities in its remotest parts;
Setting objectives
Research Synthesis - conclusions
Concepts Recommendations
PLANNING OBJECTIVES:
1. Planning actions
2. Planning documents for both sectors (public and private)
PHYSICAL FACTORS
RESEARCH: - Natural
resourses - Cultural
PROGRAM FACTORS
RESEARCH: - Market; - Promotion; - Information; - Social factors; - Environmental
factors; - Country; - Finances; - Management;
PHYSICAL DATA
SYNTHESIS
RESEARCH CONCLUSIONS
PROGRAM DATA
SYNTHESIS
PHYSICAL DEVELOPMENT CONCEPTS
PROGRAM DEVELOPMENT
CONCEPTS
PHYSICAL DEVELOPM
ENT
PROGRAM DEVELOPME
NT
POLICY AND ORGANIZATION

REDETE – ECONOMIC DEVELOPMENT AND ENTEREPRENEURSHIP IN TRANSITION ECONOMIES
840
3. all destinations in eastern Serbia allow for regional sustainable tourism to develop fully, ranging from the Đerdap National Park, the entire complex of Homolje Mountain, Natural Park of Resava to some parts of South Kučaj and Rtanj Mountain. This region is particula-rly attractive for the development of specific forms of tourism as well as the complex inter-regional cross-border cooperation with Bulgaria and Romania;
4. Western Serbia, as a regional tourist part, stands out in its significance because of the di-versity of natural attractions and well preserved environemental brands of Maljen, Su-vobor, Zlatibor, Tara and Zlatar. Here, we would like to point out the possibility for com-plementary cooperation with the tourist destinations of the bordering areas of the Republic of Srpska (ex. Stanišići tourist complex in the Republic of Srpska can be a complement to the destinations of Koviljača Spa and Gučevo in Serbia, whereas the Tara-Drina area on the Serbian side of the border appears to be inseparable from the Podrinje tourist complex in the Republic of Srpska with the preserved medieval centre of Višegrad), and
5. The Kosovo and Metohija region, together with the most attractive zone of Western Serbia, Kopaonik Mountain, constitutes a solid ground for the development of sustainable tourism; Kopaonik should take the lead for it has already reached the medium level of development, while Kosovo and Metohija, by using their natural and environmental values, can achieve a good economic and ecological consensus of the brands.
4. Integration of sustainable tourism into established regionalization of Serbia
The former economic analysis of tourism regions of Serbia did not raise the question of the intensity of the impact of tourism on the regional space, the organization of spatial units, the frequency of the formation of new structural contents of sustainable tourism products, the impact on tourism market segmentation by economic, demographic, religious and personal characteristics of tourists (21, p. 43).
The process of regionalization in Serbia at the beginning of the new millennium entered a completely new phase, which implied the harmonization with EU legislation. Respecting the natural and anthropogenic characteristics of certain areas which should lead to the formation of a homogeneous and coherent sustainable tourism product in Serbia, there were identified 5 tourist regions:
1. Belgrade region;
2. Vojvodina region;
3. Western Serbia region;
4. Eastern Serbia region, and
5. Kosovo and Metohija region.
The table below show the economic characteristics of the Serbian regions ranked by the total
value of GDP, as the most relevant indicator of the economic progress of a region.

REDETE – ECONOMIC DEVELOPMENT AND ENTEREPRENEURSHIP IN TRANSITION ECONOMIES
841
Table 1. Economic characteristics of the regions of Serbia
Region GDP Total in
thousands of dinars
% contribution Per capita Index RS=100
Belgrade 1.193.866.771 40,0 728.000 177,8 Vojvodina 775.878.690 26,0 396.000 96,8
Western Serbia 583.366.177 19,5 286.000 69,9 Eastern Serbia 433.502.261 14,5 262.000 63,9
Kosovo and Metohija - - - - Total / Serbia 2.986.613.900 100,0 410.000 100
Source: National accounts, http://webrzs.stat.gov.rs/WebSite/repository/documents/00/00/47/67/06 _Nacionalni_racuni.pdf, accessed 25.08.2012.
The above indicators of GDP clearly shows us that Serbia has not achieved balanced regional
development, ie. there are sharp differences in the development of certain regions. Belgrade is the most developed region, which achieved GDP 77.8% higher than the average. Other regions are below the GDP average. Among them should be noted that the region of Vojvodina achieved an average 96.8% of Serbia's GDP, while the regions of Western and Eastern Serbia Serbia did significantly lower (69.9% and 63.9% respectively).
Such unevenly balanced regional development shown above leads to further manifestations of regional inequalities, measured primarily by the level of purchasing power, education etc.; consequently, if the current development trend is not stopped, this will result in further deepening of the observed differences between the regions.
In addition to the clear differences in terms of economic development levels of the regions, we can say that the same goes for the availability of natural and anthropogenic attractions related to sustainable tourism development. Economically most developed region of Belgrade is the poorest in resources, especially taking natural ones into consideration, because of the very high degree of urbanization which have significantly degraded them. Other regions, which are territorially wider, offer rich potential for the development of many forms of sustainable tourism.
All this indicates that the resource potential for the development of sustainable tourism is concentrated in undeveloped and very underdeveloped regions. We must note that the region of Belgrade is the main emitting area of domestic tourists.
The following tabular view cite basic tourist traffic indicators by regions.
Table 2. Arrivals and overnight stays of tourists by regions of Serbia in 2011
Region Tourist arrivals Tourist overnight stays Total Domestic Foreign Total Domestic Foreign
Beograd 635.984 178.957 457.027 1.393.250 484.098 909.152 Vojvodina 288.440 168.912 119.528 736.639 451.725 284.914
Western Serbia 790.254 656.250 134.004 3.081.011 2.689.920 391.091 Eastern Serbia 359.966 280.378 79.588 1.353.094 1.207.269 145.825
Kosovo and Metohija - - - - - - Total / Serbia 2.074.644 1.284.497 790.147 6.563.994 4.833.012 1.730.982
Source: Arrivals and overnight stays of tourists by regions, Republic Bureau for Statistics, http://webrzs.stat.gov.rs/WebSite/Public/ReportResultView.aspx, accessed 28.08.2012.
If we take a look at the achieved level of development of tourism in the regions of Serbia, we note that the largest number of tourists visit the region of Western Serbia. However, if we considered only the movement of foreign tourists, the presented data clearly show the dominance of the region of Belgrade, which attracts the largest number of business tourists, i.e. tourists

REDETE – ECONOMIC DEVELOPMENT AND ENTEREPRENEURSHIP IN TRANSITION ECONOMIES
842
visiting Belgrade when participating in business conferences, meetings, etc. It is these categories of foreign tourists that should become the main vehicles of the development of sustainable tourism in the other regions, due to the capital's favorable position and its vicinity.
The core objectives and policies of the regional development of tourism are outlined in the Tourism Development Strategy of the Republic of Serbia. According to the Strategy for Regional Development of Serbia, those can be classified as follows:
1. the development of international tourism has to boost economic growth, employment and higher living standard;
2. creation of positive international image through tourism market;
3. to ensure long-term protection of natural and cultural resources through sustainable tourism development, and
4. new tourist products of the Republic of Serbia must satisfy international quality standards and, most of all, the protection of tourist consumers in compliance with the current European practice.
In order for the concept of sustainable tourism to be implemented in practice in some regions
of Serbia, it is proven necessary that its main subjects - people, both on the supply and demand side, are sufficiently educated and trained so as to be able to always fully comprehend the meaning sustainable tourism development bears. In other words, sustainable tourism in regions of Serbia calls for an adequate level of awareness, education and training of all participants of the tourist industry so that, while acting, they could provide a tangible contribution to the realization of multiple objectives and functions of the tourist phenomenon, which should be adjusted to the extent that is reasonable and likely to sustain.
5. Conclusion
Sustainable tourism development in certain regions of Serbia should not only be based on the existence of natural and anthropogenic attractions. To ensure tourist valorization of these in a pro-per manner, it is essential to meet a number of conditions. First of all, it is necessary that there is adequate infrastructure already in place in the observed region. This includes not only transport infrastructure but also other forms of infrastructure: supply of all forms of energy (heat and elec-tricity, gas, etc..), water supply, utilities and the like. If the foregoing conditions are not met, the development of sustainable tourism in some regions would be quite difficult and probably not competitive. Also, it is necessary to ensure the existence of adequate human resources which should professionally present the regional sustainable tourism product to potential tourists. As sustainable tourism product is closely connected to the area it covers, it implies that the locals are motivated to develop this form of tourism. They may be motivated by economic and non-econo-mic reasons. Considering that economic motives prevail, local population can be actively involved in offering sustainable tourism products, either through employment, putting underutilized agri-cultural land to use through the construction of tourism infrastructure and superstructure or, po-ssibly, by selling authentic agricultural products and food to tourists or renting excess housing units as a form of sustainable tourism accommodation.
Practically, regardless of the methods and techniques applied, in the education of tourists focus should be placed on the following activities:
- selection of tourist operators whose operations take into account environmental and ethical criteria;
- choice of means of transport and travel itineraries with a minimum negative impact on the environment;

REDETE – ECONOMIC DEVELOPMENT AND ENTEREPRENEURSHIP IN TRANSITION ECONOMIES
843
- introduction to the natural and anthropological values of the receptive areas, including geographic and historical characteristics and practices of these;
- refrain from inappropriate behaviour during a tourist trip, which can have adverse effects on cultural and natural values of certain regions, and
- participation in the activities aimed at protecting natural tourist and cultural characteristics and values.
If the foregoing actions and measures are enforced in a suitable fashion simultaneously with
the application of information methods and techniques, it is highly likely to avoid environmental degradation of tourist regions and prevent undesirable conflicts between tourists and locals.
Reference list
1. Agenda for a sustainable and competitive European tourism. http://eurlex.europa.eu/-LexUriServ/LexUriServ.do?uri=COM:2007:0621:FIN:EN:PDF (accessed 15.06.2012.)
2. Arrivals and overnight stays of tourists by regions. Republic Bureau for Statistics. http://webrzs.stat.gov.rs/WebSite/Public/ReportResultView.aspx. (accessed 28.08.2012.)
3. Bakić, O. (2004). Koncepcija održivog turizma i marketing menadžment: Održivi turizam u zaštićenim oblastima. Beograd: Koda
4. Bramwell, B. and Lane, B. (1993). Sustainable tourism: an evolving global approach. Journal of Sustainable Tourism. 1(1). pp. 1-5
5. Burns, P. (1999). Paradoxes in Planning: Tourism Elitism or Brutalism? Annals of Tourism Research 26(2). pp. 329–348
6. Charter for Sustainable Tourism in Protected Areas. http://www.ccght.org/sustainable-tourism/eu-charter-for-sustainable-tourism-in-protected-areas/ (accessed 18.06.2012.)
7. Decoupling Natural Resource Use and Environmental Impacts from Economic Growth. http://www.unep.org/resourcepanel/decoupling/files/pdf/Decoupling_Report_English.pdf (accessed 17.06.2012.)
8. Defert, P. (1966). La localization touristique: problemes theoritique et pratiques. Berne : Gurten
9. Dolasci i noćenja turista po regionima. http://webrzs.stat.gov.rs/WebSite/Public/ReportResultView.aspx. (accessed 28.08.2012.)
10. Eadington, W.R. and Redman, M. (1991). Economics and tourism. Annals of Tourism Research. 18(1). pp. 41-56
11. Green Agenda. http://green-agenda.com/agenda21.html (accessed 26.06.2012.) 12. Green Economy Report – Tourism Chapter.
http://www.unep.org/greeneconomy/Portals/88/documents/ger/GER_11_Tourism.pdf (accessed 16.06.2012.)
13. Gunn, C. (1993). Tourism planning. Washington: Taylor-Francis 14. Harris, R. and Leiper, N. (1995). Sustainable Tourism: An Australian Perspective. Chatswood:
Butterworth-Heinemann 15. Hunter, C. and Green, H. (1995). Tourism and environment. London: Routledge 16. Milenković, S. (2009). Turizam i ekonomija. Kragujevac: Ekonomski fakultet 17. Milenković, S. i Utvić, S. (2012). Regionalne predispozicije konkurentskih prednosti
turističkih odredišta Srbije. In Aranđelović (eds.) Regionalni razvoj i demografski tokovi zemalja Jugoistočne Evrope. Niš: Ekonomski fakultet. pp. 39-61
18. Miller, K. (1978). Planning national park for ecodevelopment: Methods and Cases from Latin America. University of Michigan. Michigan: Centre for Strategic Wildland Management Studies
19. National accounts, http://webrzs.stat.gov.rs/WebSite/repository/documents/00/00/47/67/06_-Nacionalni_racuni.pdf. (accessed 25.08.2012.)

REDETE – ECONOMIC DEVELOPMENT AND ENTEREPRENEURSHIP IN TRANSITION ECONOMIES
844
20. Petković, G. and Pindžo, R., (2012). Tourism and new economic challenges. Ekonomika preduzeća. 60(1-2): pp. 117-126.
21. Report of the World Commission on Environment and Development: Our Common Future. http://www.un-documents.net/wced-ocf.htm (accessed 25.06.2012.)
22. Strategija regionalnog razvoja Republike Srbije od 2007. do 2012.godine. Službeni Glasnik RS. br. 91/2006
23. Swarbrooke, J. (1999). Sustainable Tourism Management. Oxon: CAB International 24. Towards Green Growth: Monitoring Progress Indicators. http://www.oecd.org/dataoecd/-
37/33/48224574.pdf. (accessed 25.06.2012.) 25. Tosun.C. et all. (2003). Tourism growth, national development and regional inequality in
Turkey. Journal of Sustainable Tourism. 11(2). pp.133-161

REDETE – ECONOMIC DEVELOPMENT AND ENTEREPRENEURSHIP IN TRANSITION ECONOMIES
845
THE PROPOSITION OF THE MODEL FOR MANAGING TURISTM RESOURCES OF THE BORDER AREAS – THE BASIS FOR
CREATING A TOURIST BRAND
Neven ŠERIĆ342 Silvija VITNER MARKOVIĆ343
Duje PETRIČEVIĆ344
Abstract
Cross-border cooperation is becoming an imperative when managing a sustainable tourist development of the border areas. A synergic development of specialised tourism products of two or more bordering nations contributes to a more pronounced competitiveness and a greater re-cognisability of the said areas. Interest association contributes to the strengthening of the ove-rall cooperation of the border areas. The broadening of cooperation stimulates the development of novel business ides and gives rise to a stimulating entrepreneurial environment. As a conseq-uence of new ideas, the strengthening and growth of the economy, entities, products and services contribute to creating a new image of the border areas. New business contents improve the identity, expanding the potential for creating a recognisable brand of a particular border area The strengthening of European interregional cooperation is a confirmation of an affirmati-ve stance toward economic integrations, which give rise to these projects, that are a prerequisi-te for finding investors who are willing to finance infrastructure projects.
Tourism is an economic commitment of the Republic of Croatia. With that fundamental rega-rd in mind, Republic of Croatia should be the promoter of initiatives that aim to establish cross-border cooperation, with the ultimate goal of strengthening tourism identity of the border areas. Establishing cross-border cooperation contributes to increased propulsion of transit tourist corridors of the border areas. In that regard, the marketing potential is also represented in the possibility of forming a co-branding effort that establishes a national tourism supply for the na-tions which possess a sufficiently developed tourism sector in the border areas.
The diversity of tourism resources, as well as the climate particularities of the border areas located in the region of ex-Yugoslavia is actually the precondition for creating a recognisable and competitive tourism brand. Earlier research, conducted by the authors from south-east Slovenia and the Karlovac County form the basis for the creation of the model presented in this paper. Similar researches done by the scientists from the nations of ex-Yugoslavia are quite rare, because there is inefficient support from the local governments. Adequate cross-border cooperation, as well as the adequate synergy of tourism development represents the basis for creating the model for managing the resources of border areas. The realisation of such a synergy of tourism development is the platform for the creation of a recognisable tourism brand of a particular cross-border area. In regard to the increasing synergy, the contribution of labo-ur is evaluated. Further incentives represent potential positive repercussions on the political and economic stages, ones that could easily influence at present modestly valorised cross-bo-rder areas of the ex-Yugoslavian countries.
Keywords: croos-border destination, border area, tourism.
342 Assistant Professor, University of Split, Faculty of Economy; Cvite Fiskovića 5, 21 000 Split,[email protected] 343Senior Lecturer, Karlovac University of Applied Sciences, Trg J. J. Strossmayera 9, 47 000 Karlovac, silvi-
[email protected] 344 doctoral candidate, University of Split, Faculty of Economics, Cvite Fiskovića 5, 21 000 Split,

REDETE – ECONOMIC DEVELOPMENT AND ENTEREPRENEURSHIP IN TRANSITION ECONOMIES
846
Introductory remarks
The period of global recession points to the overall complexity and increased difficulty when anticipating the demand reactions (Avraham, Ketter, 2008.). Quite similar manifestation can be observed when overlooking the manner in which the demand of the global tourism market be-haves (Šerić, Vitner, 2011.). Nowadays, a tourist demands increasingly more for the money in-vested. Therefore, it is necessary to further enhance individual products of tourism, both quail-tatively and quantitatively. Cross-border cooperation in the border areas thus arises as a usable platform when creating a competitive tourism supply. The unity of differences, based on social, political and historical repercussions forms a platform that could be used for creating a recog-nisable tourism brand of the cross-border areas (Šerić, 2008.). A heterogeneous tourism demand represents an incentive for creating a heterogeneous tourism supply, one that can meet the criteria of differentiation, uniqueness, recognisability and distinctiveness of the tourism supply.
Creating a recognisable tourism brand by fostering cross-border cooperation in the border areas is conditioned by actions that are planned and systematic in nature (The program of cross-border cooperation, 2010.). With regard to the various social and political entities that exist along the border areas, activities should be planned in accordance with state regulations of each respective state. This guarantees that managing and valorisation of the tourism resources will not become an improvisational activity.
Forming of a joint tourism cross-border brand will make the tourism supply recognisable and unique (Blažević, Radnić, 2006.). Cross-border areas are rarely included in the national plans of tourism development. With regard to the marginalisation, the absence of necessary tourism infras-tructure is frequently quite evident. This fact presents opportunities for the financial investors. Branding of a cross-border tourism destination contributes to the increased interest of the potential investors, thus ensuring the necessary funds for building the required tourism infrastructure (Avraham, Ketter, 2008.).
The research problem is tied to the selection of the concept for managing the cross-border brand of tourist destination, founded on the basis of available and potential tourism resources. The chosen managing concept should be enhancing market competitiveness, as well as ensuring the optimal managing practices for taking care of the tourism resources in border areas of all the nations involved. The separate incentive is the integration of individual tourism products of border areas, with the ultimate goal of achieving greater competitiveness and the creation of a recogni-sable tourism brand of cross-border destination. With this regard, based on the former research of the authors (Šerić, 2008.; Šerić, Vitner 2011.), the guidelines for a sustainable concept of mana-ging tourism resources of the border areas will be presented, with the ultimate goal of creating the tourism brand of a cross-border destination.
Explication of the research problem
The full managing potential of tourism resources located in the cross-border areas, so it could eventually give rise to a recognisable tourism brand, is insufficiently researched (Vodeb, 2006.). It is a consequence of a delayed implementation of marketing tools to the field of tourism research (Kuhn, Alpert 2009.). An additional problem arises from a conventional practice of rarely including the border areas in the plans for tourism development (Vodeb, 2006.). The unification of the unique tourism characteristics of two or more adjacent cross-border areas, contributes in reinforcing the competitiveness of the tourism brand of the entire area (Šerić, Luković, 2010.). An efficient branding of tourism cross-border areas remains a prerequisite for an image based on the
REDETE – ECONOMIC DEVELOPMENT AND ENTEREPRENEURSHIP IN TRANSITION ECONOMIES
847
fundamental tourism resources (Šerić, 2008.). The condition for creating the competitive destina-tion image is an effective managing of the marketing scenario of the tourism offer. In order to effectively manage the image of a tourism area, one has to consider the totality of the identity the cross-border area has. Thus perceived, trough the perspective of branding, the destination image has to be regarded as a consequence and not the cause. The scenario of marketing management, which deals with the managing of the destination identity, should be evaluated on the basis of the destination’s resources. This approach represents an adequate starting point in shaping the re-cognisable and competitive brand of the border area.
The process of branding the cross-border areas is time-intensive and complex (Vodeb, 2006.). When managing the tourism brand of the cross-border areas, the marketing strategy should be de-veloped as neither a promotional, nor a political campaign (Aaker, 2001.). The uniqueness of the usable tourism resources present in the cross-border areas are quite frequently the consequence of social and historical peculiarities of that particular cross-border area (Kuhn, Alpert, 2009.). Cross-border collaboration contributes to the uniqueness of the tourism product (Črnjar, 2009.). The competitiveness of the tourism supply is enhanced trough the modifications done to models that manage cross-border destinations (Blažević, Radnić, 2006.). No matter what the level of quality of individual tourism products of cross-border destination is, it is necessary to standardise tourist supply at large. Because of this, when managing the brand of cross-border destination, it is necessary to apply the strategy that is in accordance to the resources on which the brand is based. Cross-border cooperation has significant effect on implementation of the set strategy, thus becoming the precipitator for creating the recognisable brand of cross-border tourism destination. Efficient marketing strategy, one attuned to the resources represents one of preconditions to the creation of a recognisable and competitive brand (Aaker, 2001.). Image modifications of cross-border tourism destination can be achieved practically via re-branding activities, with accordance to the interests of cross-border areas (Šerić, Vitner, 2011.). Stimulating the tourism interest is achieved by identifying the crucial resources present in the management of brand destination scenario, as well as the desired remaking of the destination vision (Šerić, Vitner, 2011.).
The strategy of managing the scenario of branding the cross-border tourism destination should be modified to match the expectations of targeted tourist segments, in accordance with the historical and social development of the cross-border areas. Specificity and diversity of cross-border areas of two or more neighbouring countries determine the specificity of models managing the brand of a particular cross-border tourism destination. Depending on the individual case, it is useful to define a common branding strategy for adjacent, cross-border areas, even under the condition of unequal tourism development. The implementation of the economic model that enables the creation of a joint recognisability of cross-border areas is useful in such an instance.
Cross-border areas are frequently facing specific problems, such as unequal economic de-velopment and uneven population distribution, which is usually a consequence of depopulation. Frequent are the problems of relative or absolute inaccessibility, insufficient infrastructure, nomadic behavioural patterns of the local populace, small size of the market that excludes the possibility of a sufficient economic development, or the weak political influences, due to the area being on the fringes of political importance. In the areas characterised by peculiar and valuable landscape resources, as well as the significant cultural and historic heritage conditions, a speciali-sed tourism offer can indeed be developed. Thus formed, the tourism offer is manageable, ac-hieving branding and positioning in a particular niche.
Based on everything thus presented, the cooperation between representatives and tourism entities in the cross-border areas represent an imperative for the development of tourism. Therefore, applying benchmarking to the formation of an adjusted model of branding the cross-border tourism destination is indeed practical. Coordinating the tourism supply in the border areas enables the rationality when investing in the much needed facilities of the tourism infrastructure.
Resources that serve as an appropriate basis for the creation of the tourism brand in the cross-border destinations are distinguished into two basic groups. Internal resources represent the

REDETE – ECONOMIC DEVELOPMENT AND ENTEREPRENEURSHIP IN TRANSITION ECONOMIES
848
tourist attributes of the region (landscape, flora and fauna, the uniqueness of the environment, etc.). Also, this category encompasses the attitude of the cross-border populace toward develop-ment, as well as their habitat fragmentation. External resources are the willingness of the govern-ment administration to develop cross-border tourism, as well as the available investment capital. These resources also encompass the interest of funding tourism from foreign investors. Other external resources that are pragmatically feasible to analyze are the global increase in demand for the specific tourism forms (ecotourism, thanatotourism, adventure tourism, etc.). On the basis of these components, it is possible to create a proposition of a model for managing the tourism re-sources of the cross-border areas, as the fundamental future tourism brand of cross-border destination.
It is possible to establish an efficient system of conservation and sustainable management of valuable resources, in regard to the joint tourism policies and cooperation of the cross-border areas. Creating the tourism brand based on the exact model stimulates interaction and an effective integration of various tourism entities of the whole area, covering the whole cross-border tourism destination. An approach based on such a model enables a collateral comparison of disposable tourism resources, the coordination and planning of investment in the tourism infrastructure, as well as forming the joint strategy of the tourism development of the cross-border areas. Cross-border cooperation sets up preconditions for a greater economic competiveness of the business entities in the entire said areas. The uniformity of development of the wider region is thus enco-uraged, as well as the enabling of the different forms of horizontal, vertical and diagonal business associations. Inside the European Union, an apparent effort to foster linking and networking of smaller bordering tourism destinations into integrated tourism areas is evident, ones showcasing diverse, specialised tourism products. These projects attract investors and contribute to the economic development of the border areas. The fact is that border areas are still marred with unbalanced economic development and the fluctuation in populace numbers, so the integration of tourism activities by interconnecting the border areas has apparent advantages, as far as social marketing is concerned. In that regard, the basic hypothesis of the research is as follows: Branding of a certain cross-border tourism destination, based on the model of managing tourism resources, ultimately contributes to the creation of a competitive tourism brand, as well as the affiliation and integration of the populace in immediate contact.
Research problem explication
The benchmarking research explores several examples of European, cross-border cooperation. These research results, as well as the understandings that arose from former research, concerning the cross-border cooperation by border areas on the Slovenia – Croatia border, presented a platform for creating the proposition of a model for managing tourism resources of border areas that, in turn, served as a basis for the creation of the tourism brand.
Lor-Lux-Saar is an agreement that establisher the cross-border cooperation between France, Luxembourg and Germany. It covered the issues of linking and joint operations of business entities in the Luxembourg area, French Lorraine region, as well as the German region of Saarland. The said agreement is concerned with eight sectors in total, of which one of the most important is tourism. An important common resource, included into cross-border cooperation is the nature park, located on the border between Germany and Luxembourg (Vodeb, 2007.) .
The research also analyzes the model of cross-border cooperation, Kvarken-Mittskandia is located in the border area between Sweden, Finland and Norway. Kvarken-Mittskandia encompa-sses the Norwegian region of Helgeland, Swedish regions of Västerbotten and Örnsköldsvik, as well as the Finnish region of Österbotten. This model also bases its cooperation on the valori-sation of tourism resources of cross-border areas. The fundamental goal of the cooperation is the reinforcement of recognisability of the tourism offer for the entire area, trough a strong cohesion

REDETE – ECONOMIC DEVELOPMENT AND ENTEREPRENEURSHIP IN TRANSITION ECONOMIES
849
of entities engaged in the tourism sector. The corresponding actions resulted in the increased attendance by tourists, as well as channelling the weekend tourist spending, that used to be focused at the countries on the other side of the Baltic. This example is interesting because of the traditional antipathy between Norwegian and Swedish people, which can prove to be extremely useful when considering the cross-border cooperation between countries of ex-Yugoslavia.
Useful experience can be derived from the project of cross-border tourism cooperation bet-ween Slovenia and Austria. This project is financed through the program PHARE CBC. The pro-ject connects Slovenian border zones, municipalities Tržič, Jesenice and Jezersko with the Austrian border zone.
A specific example of cooperation involving Republic of Croatia is the cooperation between the Olimia spa, located in Podčetrtk, Slovenia, with the Croatian region, Hrvatsko Zagorje. This cooperation is based on the trans-national settlement concerning the unrestrained crossing of the borders for the visitors of the spa during their stay. The goal of this cooperation is strengthening the competitiveness of the Olimia spa with regard to the other providers of the health tourism services in Slovenia (Vodeb, 2007.). Along with the tourism supply of the Hrvatsko Zagorje region, the Olimia tourism entity has enriched its fundamental offer. On the other side, the constant affluence of business visitors increases the number of tourist visits during the entire year.
The knowledge and experiences of the abovementioned projects have been used in order to shape the model of managing the tourism resources in the cross-border areas, with the ultimate goal of creating an efficient platform for the possible tourism brand. All the analyzed projects of cross-border cooperation aimed at increasing the competitiveness of the tourism supply in the whole, wider region. The same has been achieved by a synergistic tourism development, based on the upsurge of novel tourism products, the formation of a joint promotional policy, as well as the selective planning of the infrastructure projects, in such a way as to ensure the mutual supplement of substance, resources and the tourism infrastructure.
Research results
Based on the initial determinants and the knowledge that arose from the conducted research, a proposition of the model for managing the tourism resources of the cross-border areas has been formed. The research results pointed to the fact that the potential to create a recognisable tourism brand using the cross-border tourism cooperation indeed exists, but it remains to be mostly untapped. Branding of the cross-border tourism destinations, in accordance with the principles of sustainable development, should be, from the ecological aspect, acceptable in the long run, as well as ethically and socially just for the local communities. This model of tourism resource management for the cross-border areas could provide a guarantee for a long-term political and economic stability.
The brand of cross-border tourism destination should at its core have the orientation toward the specificities of the border areas. This implementation encompasses the rich cultural, geographic and historic diversities. The model should serve mutual interests of all the economic entities located inside the border areas. This means securing the optimum level of competitiveness of the said areas, the positive image of individual components, the increased standard of living, as well as the stable employment rate. The ecological sustainability principle can be applied to the same concept in a way as to ensure the optimal valorisation of the available tourism resources when managing the environment of the economic entities located in the cross-border area. Useful marketing tools are the certifications of eco brands, increasing the awareness of the local populace for the need to preserve their environment, etc. The sociocultural principle of sustainability implicates the sociocultural authenticity of the host, the preservation of the built sociocultural heritage, as well as the traditional values of both of the hosts residing inside the border areas.

REDETE – ECONOMIC DEVELOPMENT AND ENTEREPRENEURSHIP IN TRANSITION ECONOMIES
850
With regard to this, it is a necessity to adjust the model in accordance with the branding concept that will protect the interests of all the stakeholders, all the while unifying them trough resources and supply. Each cross-border area that will ultimately make up the cross-border tourism destination has its peculiarities, as well as the existing tourism products that are either already branded, or do have the branding potential. It is advisable to base the development of a specialised joint tourism product that contributes to the recognisability of the cross-border destination, on the global tourism market. Thus, basing the development of the cross-border destination on such a model, it is possible to achieve and preserve the sustainable criteria for tourism development. These criteria, in turn, lay the basis for competitiveness and the unity of a wide array of diverse, specialised products of cross-border tourism destinations.
The proposition of the elements for the model of managing the tourism resources of the cross-country areas
Source: author, according to the conducted research, 2010.-2012.
Conclusion
The suggested model consolidates all the relevant components of efficient managing of the tourism resources of the cross-border destination. The model points to the adequate guidelines for fostering the cross-border cooperation, in order to achieve the tourism development of the wider region. Along with the tradition, historical and cultural heritage, the attitude toward tourism and the fragmentation of the populace inhabiting the wider cross-border area is indeed important. Therefore, it is necessary to promote the sociocultural national identity and to systematically inform the local populace of the importance tourism holds for the economic development for the entire area. National and local political decisions should aim to solve the problems that prevent these aspirations. Simultaneously, it is necessary to convert the potential tourism resources of the cross-border areas into specialised tourism products that could be branded and used for streng-thening the tourism image of the cross-border destination. Finally, a prerequisite also presents itself in the form of the government’s affirmative attitude, backed up trough redistribution of the national income, toward the fledgling tourism sector. Therefore, the provision of the relevant
The model for managing tourism resources oft he cross-border destination
Tradition, history, culture, attitude and
fragmentation oft he populace inhabiting both
border areas
The existing, branded, specialised tourism
products of the first cross-border area
Attitude of the government, development
of tourism, investor interests, global tourism
trends
The existing, branded, specialised tourism
products of the second cross-border area
Usable tourism resources –the branding potential of the first cross-border area
Usable tourism resources –the branding potential of the second cross-border
area

REDETE – ECONOMIC DEVELOPMENT AND ENTEREPRENEURSHIP IN TRANSITION ECONOMIES
851
documentation for the marketing project is crucial, for it is needed in order to achieve adequate standards that serve as a prerequisite for the development of tourism in the cross-border areas.
The potential for creating a recognisable tourism brand of the cross-border destination contri-butes to the increased investor interest, concerning the necessary infrastructure projects. However, explicit state care, regarding the tourism development the of cross-border areas also remains a necessity. Finally, the relevant, global trends in tourism are the source behind the creation of adequate guidelines that are needed for the effective creation of specialised tourism products in the cross-border areas, ones in accordance with the resources available.
With regard to the apparent interest of the European Union to encourage the linking and networking among neighbouring tourism destinations into larger tourism zones, with the ulti-mate goal of creating the recognisable tourism products, these researches also have broader social benefits for all the stockholders and nations. It serves to attract foreign investments and also to obtain funds from the structural funds of the European Union. Therefore, the suggested concept of the proposed model for managing the tourism resources of the cross-border des-tinations should be general in nature, not only because of the apparent need for it to be able to suit numerous different situations, but also because of the need to create a much simpler selling point in order to entice the prospective investors, so they invest in the tourism infrastructure.
Reference list
1. Aaker, D. (2001), Strategic Market Management, 6th ed., John Wiley & Sons, Inc. New York 2. Avraham, E., Ketter, E. (2008), Media Strategies for Marketing Places in Crisis, 1st
ed. Elsevier Inc., Oxford 3. Blažević, B, Alkier Radnić, R., (2006), EU tourism trends and the outlook for Croatia,
Tourism and Hospitality Management, godište 12, br. 2, Fakultet za turistički i hotelski menadžment Opatija, Opatija, str. 83-92
4. Črnjar, M., Črnjar, K., (2009), Menadžment održivog razvoja, Fakultet za menadžment u turizmu i ugostiteljstvu Sveučilišta u Rijeci, Rijeka, 2009. god.
5. Kuhn, K., Alpert, F. (2009), Applying Kellers Brand equity model and B2B context-limitations and empirical test, Griffith University
6. Program prekogranične suradnje Slovenija-Hrvatska 2007.-2013., (2010), Priručnik o provedbi projekta, Europska komisija
7. Skoko, B. (2009), Država kao brend, Matica Hrvatska, Zagreb 8. Šerić, N. (2008), Business intelligence – platform for judging evaluation of risk associated
with acceptance of international projects, 9.th Paneuropean shipping conference, Split 9. Šerić, N. (2008), Modeling of the marketing strategy on tourism destination with a special
ambience value, International Tourism Research Conference Sustainable Tourism Develop-ment 2008, Conference proceedings, Stockholm
10. Šerić, N., Luković, T. (2010), Marketing and environment management for tourism: Croatian experiences, Academica turistica, year 3, no 1-2, p. 73-80
11. Šerić, N, Vitner M., S. (2011), Brand management in the practice of cross-border tourist des-tinations, Academica turistica, year 4., no 2, p. 89-99
12. Vodeb, K. (2006), Cross-border tourism cooperation of Slovenia and Croatia, Tourism and Hospitality Management, godište 12, br. 2, Faculty of tourism and hotel management Opatija, Opatija, p. 199-211
13. Vodeb, K., (2007), Čezmejna turistična destinacija, Turistica – Visoka škola za turizem Por-torož

REDETE – ECONOMIC DEVELOPMENT AND ENTEREPRENEURSHIP IN TRANSITION ECONOMIES
852
RURAL TOURISM SUSTAINABLE DEVELOPMENT AND RURAL DEVELOPMENT OF BOSNIA AND HERZEGOVINA
Aleksandar LUGONJA345
Abstract
Bosnia and Herzegovina has great natural potentials for development of rural tourism but it is necessary to research about others potentials. Existing network of resources are very low and it is necessary to make a survey in order to give possibilities to domestic and foreigner tourists, to learn more about Bosnia and Herzegovina, to make quality plans of their journey and to get quality information’s about tourist attractions. Tourism in rural areas of Bosnia and Herzego-vina (BH) helps to respond the challenges of open trade, by diversifying the rural economy. On this basis is possible, with use of definition of agro tourism, and basic laws of its development, to develop agro tourism in the country. Bosnia and Herzegovina have majority of rural popula-tion and many rural destinations. Rural areas and less built-up area with higher preservation-degree of the environment, where acceptable farm development exist, represent the main valo-rization-base for making agro tourism product.
Rural economy in Bosnia and Herzegovina (BH) is increasingly diversified but agriculture is still an important component of the rural livelihood portfolio. The paper aims at providing an overview of rural tourism and rural development (ARD) in BH. The paper focuses on ARD go-vernance especially policies, strategies and plans; stakeholders; approaches and paradigms; and projects. It identifies the main State- and Entity-level institutions dealing with ARD policies in BH (law, strategic plan and agro tourism and rural development) and analyzes relationships and linkages between them. A comparison has been made between ARD programmed in BH with European Union’s RD policy. A SWOT analysis of the Strategic Plan for Rural Develop-ment 2009-2015 in the Republic of Srpska has been performed. All in all, effective, efficient and sustainable ARD policies in BH should be place-based, multi-sectorial, synergistic and desig-ned and implemented through a good coordination between multilevel governance public and civil institutions (international, national, and sub-national: entities, cantons, regions, municipa-lities). Creation of new potential cores for evaluation in agro tourism encourages the tourism revenue and economic benefit at the healthy and almost completely natural way in the essence of concept of sustainable development.
Keywords: rural development, policies, rural tourism, sustainable development
345 E-mail: [email protected]

REDETE – ECONOMIC DEVELOPMENT AND ENTEREPRENEURSHIP IN TRANSITION ECONOMIES
853
Introduction
Bosnia and Herzegovina is a mountainous-valley country of SE Europe (42oN-45oN; 15oE-19oE). Boundering with Croatia (932 km), Montenegro (249 km), Serbia (357 km). The area is 51.209 km2 (land: 51.197 km2; water: 12.2 km2).
Contemporary political-administrative structure of Bosnia and Herzegovina (BH) includes two entities: the Federation of Bosnia and Herzegovina and Republic of Srpska and third region Brčko District (BD). Territory of Bosnia and Herzegovina is a transitional area between southern parts of the northern temperate belt and northern parts of the northern subtropical belt, which results in intertwining and mixing of air masses of different physical characteristics. Bosnia and Herzego-vina morfostructurly belongs to the Mediterranean area of mountains- Dinarides. Central Dinaric mountain massif gradually descends to the north in the area of Bosnian Posavina and the Panno-nian plain, and steeper to the south in the area of Herzegovina and the Adriatic depression.
In reflection of this was formed a complexable multicultural, multiethnic and multi religious State Board of Bosnia. Position of Bosnia and Herzegovina between European regions (Mediterranean and Pannonian), with the traffic and geographic links along the main river valley (Bosna, Vrbas, Drina, Sava, Neretva, etc.), resulted in its convenient regional and geographical situation.
The State population is around 3.9 million and the total area of the country is 51.209 km2. The gross domestic product for BiH for 2010 had a nominal value of 24.486 million KM. The nominal increase of GDP in relation with 2009 was 2,01% while real increase was 0,70%. GDP per capita amounted 6.371 KM or 4.314 USD or 3.258 EUR.
Rural economy in BH is increasingly diversified but agriculture is still an important. Agricul-ture share in GDP was 8.60% in 2010 (EC, 2011). According to the Labour Force Survey for 2010, the agricultural sector employs 166.000 persons or 19.7% of the total labour force (ASBH, 2010). Agricultural land covers 50% of the total area of BH. The average size of farms is 2.6 ha (MoFTER, 2009). Rural areas in BH (81%) lag behind in terms of socio-economic development and still face many problems. Around 61% of the total population can be classified as rural. In particular, Republic of Srpska is mainly rural (about 95% of the territory is rural according to OECD criteria), where live 83% of the population.
Agro tourism and rural development cannot be achieved without improving governance in Bosnian rural areas. Rural governance comprises mechanisms, institutions and processes of decisions making and implementation through which persons and groups articulate their interests, exercise their legal rights, meet their obligations and mediate their differences in rural areas (Cheema, 2005).
Civil society organizations in BH have about 2.000 regional NGOs. Rural development programming is largely dominated by an elite core of foreign-supported NGOs. Rural areas and small towns, CBOs (Community-Based Organizations) are characterized by a small size, and, often, by a low capacity and the lack of a long-term vision and a specific mission. There is a gro-wing body of evidence from many European countries suggesting that there is a strong relation-ship between governance and rural development policy impact on rural population’s livelihoods. In fact, there are strong correlations between institutions efficacy and effectiveness and rural development policies outcomes.
The paper focuses on policies, strategies and plans, stakeholders, approaches and paradigms, and projects. It identifies the main actors dealing with ARD in BH and analyzes relationships between them. It provides as well an overview of the main ARD projects during last year.
The evolution of ARD philosophy and practice in the post-war period has been analyzed as well as the main constraints impeding a good coordination between actors dealing with ARD policy. A comparison has been made between ARD programmed in BH with EU RD policy 2007-13 especially in terms of objectives and priorities. Strengths, weaknesses, opportunities and threats analysis of rural areas, as reported in the Strategic Plan for Rural Development 2009-2015 in the RS, has been included.

REDETE – ECONOMIC DEVELOPMENT AND ENTEREPRENEURSHIP IN TRANSITION ECONOMIES
854
1. Developer notes in rural tourism
Development of rural tourism and affirmation of rural areas in countries of Europe and the United States was registered in the mid sixties of last century. In Europe further accelerated by economic trends and European Union enlargement. Rural tourism is valuable contributor to rural economy and allows diversification and favors protection and enhancement of social fabric and heritage European Rural Space. Europe has largest share of tourism arrivals and maintains posi-tive growth. Rural tourism involves the recruitment of tourists in the farmer jobs. Agro tourism include the chance to help with farming tasks during the visit. Agro tourism is often practiced in wine growing regions, as in Italy and France. Agro tourism is based on the landscape, tradition and family from which emerges a complete competitive tourism product. Elementary variables and factors of attractiveness of any destination and the main elements of the tourist product and its further development as an agro tourist destination are: elements of accommodation; attractiveness of tourist destination; environmental elements; socio-cultural; elements of the offer; infrastructure facilities; political stability; the local involvement in tourism; elements of promotion; marketing; information system, from these is a definition of agro tourist destination, which represents a kind of amalgam and combination of interrelated elements of attraction, accommodation facilities, domestic population courtesy and condition of infrastructure, as well as tourist information system as a kind of tourist information traverses. Specificity of agro tourist marketing is in the conception of sustainable development through the protection of flora and fauna, the understanding of the social dimension of the area, minimizing the impact on the physical and cultural environment, a profit based on the service with a positive environmental output and tourist experience of environment.
Agro tourism is identified with the farmer tourism, and is part of rural tourism and eco-tourism. However, many theorists and practitioners tend to define the concept and forms of agro tourism.
- Farm-based Tourism can be described as the act of visiting a working farm or any agricultural, horticultural or agribusiness operation to enjoy, be educated or involved in activities.
- Community Tourism is one or a combination of tourist products offered at a community- level to domestic or international visitors.
- Agro-Heritage Tourism can be described as many measure that promotes the heritage, history and interpretation of early and contemporary agriculture (agro-museums; plantation tours; craft making; indigenous art showcases or workshop; agricultural festivals).
- Agro-Trade Tourism consists of any act eg negotiation that faciliates the exchange of goods and services among local community stakeholders, tourism enterprises, and visitors of foreign interests (produce markets; agro-processing; marketing to hotels, restaurants and other agencies).
- Health and Wellness Tourism can be described as the process of combining the goal to look and feel better with travel, leisure and fun activities (spa treatment; specialty surgeries; alternative medicines; herbal remedies; therapeutic holidays), etc.
2. Basic characteristics of rural and agrarian in Bosnia and Herzegovina
Bosnia and Herzegovina is a developing country where 54.7% of the total population lives in villages. A trend of decreasing rural population (1990-2006; rate of changes -1.4%) has occurred in late decades. It is followed by a series of problems: abandonment and deterioration of the

REDETE – ECONOMIC DEVELOPMENT AND ENTEREPRENEURSHIP IN TRANSITION ECONOMIES
855
village, lack of income and unemployment, overcrowding in urban areas and rising unemployme-nt rates, and different issues (environmental, social, psychological).
Diversity of terrain with valleys as well as other physical favorable conditions (climatic, hy-drological, pedological), traditional villages, etc., are good predisposition for the successful de-velopment of agriculture and agro tourism.
Particular researches show that some of the environment elements in certain areas of Bosnia are six times less contaminated compared to developed countries. For the production of fruits and vegetables in the Federation there are about 55.000 ha of land, and in the Republic of Srpska 45.000 ha. The agricultural sector in total GDP of Bosnia and Herzegovina participates with 10% (the World Bank, 2008). It is produced and sold approximately 280.000 metric tons of fresh fruit-plums, apples, raspberries, every year , etc. The total market value is about 210 million euro, and it’s almost enough to meet domestic needs, especially during the summer.
Nowdays, the emphasis is on organic agriculture and production. Organic agriculture involves food production as a result of specific production in which the system of ensuring quality is the base of all activities, and leads to the harmonization of the whole environment. In Bosnia and Herzegovina under organic production is 497 ha of land, including 440.000 ha of agricultural and forest land for collecting wild plants, wild berries and mushrooms.
3. Sustainable development in Bosnia and Herzegovina and directions of agro tourism
Sustainable development is a process having economic, social, cultural and environmental- ecological dimensions. This process is perceived as a development in all respects for both urban and rural societies. In Bosnia and Herzegovina, as in most developing countries, rural population is followed with numerous problems and concern of existence villages. Main characteristics are increasing impoverishment of rural society, as well as the problems of deforestation, erosion and soil productivity loss by misuse of funds, which further emerge problems of migration, poverty and hunger. Development of appropriate agricultural and environmental policies should be ensured to protect and develop agricultural lands, to increase agricultural productivity and marketing agricultural products, to create job opportunities in agricultural and non-agricultural sector, to increase the contribution of agricultural productivity to national income and rural people. Rural areas are multifunctional dynamic systems. They include different land use and activities such as settlement, transportation, industry, forestry, tourism and recreation. Agro tourism is one of the best ways of affirmation, improvisation and existence of the village, and sustainable development in the country. Rural tourism provides an incentive for infrastructure development, which then contributes to the growth of other economic activities in rural areas. Advantages of agricultural tourism are:
- help rural people set the priorities for development in their own communities, through effective and democratic bodies, by providing access to discretionary funds and building the local capacity to plan and implement local economic development,
- helps to protect the agricultural areas, cultivation lands and rural landscape development,
- creates diversity in agricultural pattern and job opportunities in rural areas,
- increases welfare level of local people,
- provides a bridge between rural and urban areas,
- rises the respectability of agricultural activity from the urban peoples’ point of views,
- introducing agricultural activities to urban people is a way to educate urban people in the sense of contribution of agriculture to quality of life and economy.

REDETE – ECONOMIC DEVELOPMENT AND ENTEREPRENEURSHIP IN TRANSITION ECONOMIES
856
- provide physical infrastructure and social services (water, sanitation, transport, health services and schools) and
- ensure wider access to productive resources in the rural areas.
Essential characteristics of sustainable development in villages are promotion (flyers and
bulletins), honest business, competitive prices, pay farmers on time, minimize debts, healthy plants, good service, prime locations, word of mouth, family business, etc.
In many developing Countries, the third point may require greater efforts and investments as regards the creation of basic conditions for such a development:
- land tenure reform (but also land redistribution and restitution),
- extension of water supplies (and water laws to protect the rights of down-stream users),
- rural financial services for investment in rural livelihoods,
- framework for rural activities for investment in trade, service delivery, transport and information.
Success factors in agro tourism:
- long term planning,
- right recipe for tours,
- community spirit,
- repeat business,
- clean environment,
- good stuff,
- brilliant tour guides,
- hard work,
- exciting rural tour,
- good food (Waithe, 2006).
Rural tourism of Bosnia and Herzegovina is in its very beginning. Program support through
transfers have been continued in 2009 year with qualitative new projects that provided 2.75 million euro for rural tourism. From the viewpoint of rural and Agro tourism, Bosnia represents a huge untapped potential; potential centers of rural tourism are numerous villages, especially in wider environment of major cities. However, in Bosnia and Herzegovina there is still no specific tourist product of rural tourism. Economy in rural tourism, to be imposed as an alternative bid, must be much more creative than the hotel chains which is a major challenge for those engaged in marketing and promotion of rural tourism. So far in Bosnia there is only minor involvement of some rural settlements mainly in the school and congress tourism, or as an additional motive of tourist bid of town attracted to the village (rural ambient of Bjelašnica, Kupres, etc.).
Priority step is defining resources and providing access to them. In cooperation with the European Commission delegation in Bosnia and Herzegovina in December of 2006 the Project is designed in this purpose, to support the establishment of the State Ministry of Agriculture and Rural Development- SESMARD. In the basis of its methodology is defining rural areas on European level (OECD, EU), as indicators for development of rural area typology (demographic, geographic, economic, employment, human capital, agricultural structures, tourism, infrastruc-ture).

REDETE – ECONOMIC DEVELOPMENT AND ENTEREPRENEURSHIP IN TRANSITION ECONOMIES
857
The program “Ucodep Program 2003-2012 ” is also a support to rural, agro tourism and susta-inable development in Bosnia and Herzegovina. Protection and valorization of natural, cultural, agricultural and livestock resources, primarily in tourism, as well as improvement of small and medium enterprises, are the main sectors of intervention through which Ucodep intends to promote sustainable local development in the country. In rural areas of the municipality of Trnovo and the of municipality Konjic, in the park Hutovo Blato activities were directed towards the de-velopment of ambient tourism. In Herzegovina region (focus on the municipality of Livno, Stolac, Nevesinje and Trebinje). In western Republic of Srpska, valorization processes of traditional agro-food and craft products. In Trebinje was supported establishment of beekeeping cooperative - Zalfija (more than 200 members; main goal is to increase production of honey, typical and quality product of this area). Increase capacity of local institutions (municipalities, local development agency and the tourist board) and private subjects (NGO’s, manufacturer associations) in the field of valorization, protection and promotion of local products and territories, through exchange experiences with entities from Tuscany, with technical and financial support to attend local and international events and creating promotional materials (web site, gastronomy guide, brochures).
4. The role of Agriculture and Rural Development, policies, strategies and plans
It is estimated that over 70% of informal employment in BH is linked to the agro-food sector. Increasing prosperity and the quality of life in rural areas is, therefore, essential to the country’s overall process of economic, political and social stabilization.
The European Commission plays a key role in the enlargement process. It is closely associated in the accession process including negotiations. Commission experts in the field of agriculture and rural development provide assistance and guidance to candidate and potential candidate countries in their task of preparing for future accession to the EU and more specifically in preparing for the Common Agricultural Policy and Rural Development. Agricultural production in the eligible area is based on small-scale family households due to existing natural conditions and property issues.
In the framework of the EU project “Support for Establishment of the State Ministry for Agriculture and Rural Development”, on July 2006 the “Draft BH Law on Agriculture, Food and Rural Development” was completed. The EU technical assistance facilitated the recent completion through the work of a government-appointed working group supervised by Council of Ministries of BH - Directorate of Economic Planning. This project helped BH to improve its administrative capacity at State level. It defines the framework of institutional structures and competencies at all levels of government, including the approved new State Ministry of Agriculture, Food and Rural Development.
The law was approved by the BH Parliamentary Assembly of Ministers in June 2008 and defines the framework for institutional structures and competencies at all levels of government, and the proposed new State Ministry of Agriculture and Rural Development will be responsible for concrete services and measures to be taken to benefit farmers and rural communities. The law also introduces modern concepts linked explicitly to the European integration process and adop-tion of the Acquis Communautaire.
The law provides for the establishment of a wide range of new institutional structures and mechanisms which can ensure effective co-ordination and communication between all stakeholders. Many of them are essential foundations to attract future EU pre-accession and structural funds, and include:
- BH Agriculture Market Information Service, - BH Administration for Harmonization of Payment Systems, - BH Farm Registry and Land Parcel Identification System, - BH Agricultural Report,

REDETE – ECONOMIC DEVELOPMENT AND ENTEREPRENEURSHIP IN TRANSITION ECONOMIES
858
- a range of mechanisms co-ordinated by the new State Ministry of Agriculture and Rural Development.
In BH and RS, rural governance models are slowly experiencing a paradigm shift towards the concept of “the new rural paradigm”. The new models of local rural governance reflect a shift of rural development policies target from agriculture to a multi sectoral approach, which also targets enhanced synergy and complementarities between rural sectors and to create public-civil society-private partnerships (OECD, 2006). While there have been many attempts to design appropriate policies to improve the competitiveness of rural areas based on their specificities, in many cases rural development philosophy and practice are still top down and subsidy-based. Government support to the rural sector evolved from command and-control policies under socialism to support for transition where donors have an increasingly important role. The design and implementation of ARD policies involve different international, national and sub-national actors (regional; intermediate or sub-regional; and local) (OECD, 2006). In BH, intermediate levels, Entities of RS and FBiH, have a crucial role in ARD design and delivery.
Rural development becomes then essential to increase the volume of agricultural production, employment opportunities, income and living standards of rural population, to improve envi-ronmental protection and, consequently, to stop the depopulation and de-agrarisation of rural and mountainous areas.
Most of the rural areas in BH can be classified as disadvantaged or less favored, according to criteria used in European countries, since they lay in hilly or mountainous zones. Due to very limited and difficult development conditions, i.e. in infrastructure and transport facilities, there is a decrease of their inhabitants: mountainous municipalities tend to loose their popula-tion.
In many BH cantons or municipalities, both in Federation BH and Republic of Srpska, there are strategic plans that can be considered connected to rural development, and in all of them rural development is considered as one of the main development goal. Despite of it, in almost all of these territories there is a lack of a study completely focused on rural deve-lopment.
International organizations and development agencies have implemented different rural development projects and programmes during the post-war period. In BH, all levels of gover-nance, ranging from the State to municipal authorities, are involved in the agricultural sector ma-nagement and rural areas development. At the state level, the most important institution that deals with ARD is the MoFTER. Taking in consideration the complexity of the organization of BH as a State, the role of MoFTER is mainly coordination and it is also responsible for cooperation with the European Union (EU) and other international organizations relevant to the agriculture, food and rural development (AFRD) sector (MoFTER, 2011).
Systematic and structural harmonization of agricultural policies at the State level began with entry into force of the Law on Agriculture, Food and Rural Development of BH, adopted in May 2008. The Law regulates definitions of terms to be used in the AFRD sector legislation, objectti-ves, principles and mechanisms for development of strategies and policies, structures and compe-tencies at all governance levels, institutional support structures and services and their functions and linkages, monitoring and evaluation mechanisms, and administrative and inspection super-vision. The Law defines as well the goals and commitments to be realized in the coming period (Office for Harmonization and Coordination of Payment Systems, Agricultural Market Informa-tion Service, Animal Identification Register, etc.). The measures of the Law are basically classified into policy measures to support agricultural markets and measures for rural development. Measures to support agricultural market deal with improving products quality, direct support to agricultural farms and foreign trade. Measures related to rural development aims at increasing competitiveness, protecting rural environment, diversifying activities in rural areas and improving life quality in rural areas (PABH, 2008) that are in line with EU RD policy objectives.

REDETE – ECONOMIC DEVELOPMENT AND ENTEREPRENEURSHIP IN TRANSITION ECONOMIES
859
As a matter of fact, the EU Rural Development Policy 2007-2013 include 3 core objectives, 4 axes and 41 measures. In comparison to policy of the 2000-2006 programming period, two major changes occurred in RD simplification and strategic approach (programming and reporting). The objectives of RD policy - according to Council Regulation (EC) no 1698/2005 adopted by European Council on September 2005 on support for rural development by the European Agricultural Fund for Rural Development (EAFRD) - are: (i) improving the competitiveness of agriculture and forestry by supporting restructuring, development and innovation; (ii) improving the environment and the countryside by supporting land management; and (iii) improving the quality of life in rural areas and encouraging diversification of economic activity.
In 2004 European Commission in Sarajevo commissioned a survey on Agriculture Sector in BH, the situation about rural development they found out is the following:
A Council for Agriculture, Food Processing Industry, Forestry and Rural Development of BH was established as an advisory body to the BH Council. It is recommended to set up a State Ministry of Agriculture and Rural Development to perform key functions needed on State level.
Within RS Ministry for Agriculture, Forestry and Water Management there is an Agricultural & Rural Development Sector that is divided into 2 Departments (Plant Production and Rural Development) and one Animal Production Group. According to the Rule Book, Rural Develop-ment Department is generally responsible for production and marketing of products from rural areas, whereas the two Commodity units are specialized on animal and plant production. But competencies are overlapping. The Rural Development Department should deal with cross-sector rural development issues whereas the Commodity Departments should deal with all issues related to production, development and marketing of crops and animal products. Generally, a more clear understanding of rural development policies common in the EU should be acquired.
Within FBH Ministry of Agriculture there isn’t any specific department that take care about rural development. Moreover, Sector of Agriculture, in charge for rural issues, is understaffed so many preparatory works to develop plans and measures for rural development cannot be carried out properly. Additionally, there is generally a lack of reliable formal coordinating structures vis à vis between Cantons and Municipalities.
Brcko District has a Department of Agriculture, Forestry and Water Management. The Department has an Office for Analysis & Support, focusing on project development, rural development and analytical work. Although this Office is doing some important development work its institutional status is low.
To make full use the economic potential of the rural areas of the District and to prepare for EU support programmes more staff would be needed to develop and implement rural development programmes.
Municipalities are neither much involved in the development of agricultural and rural development strategies and policies nor get sufficient information and support from higher administrative levels. However, such support is particularly needed for the numerous rural and remote Municipalities in BH which, in most cases, have suffered the most during the war.
Support and development functions are usually performed by specialized extension services. However, although extension services are much needed there are no structures on State level, poor ones in the Federation and fairly professional ones in the RS.
Strategic Plan and Operational Program are implemented at Entity level. At the level of Entities, institutions in charge of agricultural sector management are the Ministry of Agriculture, Forestry and Water Management (AFWM) in the RS and the Federal Ministry of AFWM in the FBH while Brcko District local administration has its own Department of AFWM. In FBH the system of responsibilities is further divided, so all 10 cantons have established departments for the issues of agriculture, veterinary medicine, forestry and water.
Entity ministries are in charge of policy and laws implementation, monitoring the implementation of the regulations and decisions, management of natural resource, food industry and related activities in the field of plant production, rural development, fisheries and hunting,

REDETE – ECONOMIC DEVELOPMENT AND ENTEREPRENEURSHIP IN TRANSITION ECONOMIES
860
protection and use of agricultural land, food, fodder, water, veterinary protection, protection of public health and forestry (MoFTER, 2011).
The Strategic Plan for Rural Development 2009-2015 was adopted in the RS (November 2009), work is in progress in the FBH, while the Development Strategy of AFRD in the Brcko District of BH was prepared in 2008 for the period 2008-2013. The main strengths, weaknesses, opportunities and threats of rural areas in Republic of Srpska stated in the Strategic Plan for Rural Development 2009-2015 are presented in the following table (tab. 1).
Table 1. Summarized SWOT analysis of rural areas in Republika Srpska.
Strengths Weaknesses High % of rural population
Relatively cheap labour force Educational institutions available and well educated
rural population Favourable natural conditions
Rich natural and cultural - historic heritage Tradition in production and processing
Existing public advisory services Specialized agricultural cooperatives Significant and rich forest potential
Significant wood processing capacities Institutionally regulated sectors of forestry, wood
processing and tourism Positive trend in number of SMEs
Low population density in some rural regions Migration of the young (rural - urban, rural -abroad)
High unemployment rate Lack of entrepreneurial spirit
Fragmentation of land holdings Poor cooperation between producers and scientific and
research institutions Lack of investments and low incentives
Unfavourable credits’ conditions Poor coordination and collaboration between
institutions dealing with RD Poor access to services and bad infrastructure
Opportunities Threats Incentives for rising birth rate
Job creation and opportunities for SMEs Training for rural population Increased demand for food
Certification and standardization Farms modernization
Better agricultural Advisory Service Clustering and associations
Better institutional support to RD Protection of autochthonous products
Integration processes with EU Strengthened cooperation between relevant
institutions, municipalities and regions Diversification of activities (e.g. tourism) Access to additional funds (IPARD, etc.)
Population aging and low birth rate Uneven regional population distribution
Further depopulation of rural areas Lack of State support
Budget constraints to increase incentives for RD Political instability in the country and region
Uncontrolled food imports Low investment in Science and Technology
Excessive lumbering of forests Mined area under forest and agricultural land
Negative image of the country Investment in rural infrastructure conditioned by
political views Weak representation of the rural population Low motivation for life in the countryside
Source: Adapted from MAFWM-RS, 2009.
In 2010 the Medium Term Entities’ Strategies for providing advisory services are prepared.
That strategy will be adopted in FBH after entrance into force of the Law of the agricultural advisory services while in RS at the end of 2010 the National Assembly adopted the draft Medi-um-Term Strategy (2010-2015) of agricultural advisory service (MoFTER, 2011). Preparations for the agricultural census are simultaneous with population and household census in BH (MoFTER, 2011). Nevertheless, limited progress was made towards improving agricultural statis-tics. However, a decision on establishing a State-level monitoring and evaluation system for AFRD was adopted (EC, 2010).
The agricultural and rural development sector is also characterized by the presence of a number of international donors, such as the USA/USAID, Sweden/SIDA, Italy/IC, UK/DFID, Japan/JICA, Spain/AECID, Switzerland/SDC/SECO, Czech Republic/CzDA, the European Commission (EC), the World Bank, European Bank for Reconstruction and Development/EBRD,

REDETE – ECONOMIC DEVELOPMENT AND ENTEREPRENEURSHIP IN TRANSITION ECONOMIES
861
UNDP, FAO, etc. However from 2009, due to world economic crisis, the investments of donors in BH have decreased. Funds come from nonreturnable international assistance (grants), loans (World Bank, IFAD) and national funds. The key projects are: Agriculture and Rural Developme-nt Project funded by World Bank and projects financed by the EU Instrument for Pre-accession Assistance (IPA).
BH receives financial assistance under the IPA as a potential candidate country. With a total allocation of 98.3 million euro, the IPA 2010 programme focuses on political criteria as well as water infrastructure, agriculture, rural development, etc. Furthermore, BH participates in the IPA multi-beneficiary programmes, including an IPA package developed in 2008 in response to the financial crisis. The purpose of the IPARD is to strengthen rural development programming capacities in BH by promoting the participatory bottom-up approach in management of the rural development measures. Through the first IPA component for 2007, three projects are programmed in the field of agriculture, food security and rural development and its implementation began in 2009 and continued during the 2010.
Financial support to individuals or companies involved in ARD is provided also by microcredit organizations and banks. As a matter of fact, while a particular attention was paid to registration of farms and rural infrastructure development in the RS; the highest share of the budget for ARD has been dedicated to increase of size of farms, less favorable areas, investments in farms, rural infrastructure development and land arrangement in the FBH. Detailed information on the budget for agriculture in the RS, FBH and BD during last years are provided in the following table (tab. 2). Total allocations for agriculture in 2010 was more than 165.6 million which represents an increase of about 7 million 4.5%, compared to 2009 budget. In 2011, agricultural budget in RS significantly decreased for more than 20 millions BAM, in BD remained almost the same like in 2010, while in FBH 2011 budget is not comparable due to missing of data for Cantons. The Entities did not increase their overall support for ARD, but a larger proportion of this support was allocated to rural development measures (EC, 2010).
Table 2. Agricultural budgets in BiH during the period 2008-2011 (in million BAM).
2008 2009 2010 2011 Brcko District (BD) 4.646.316 6.055.822,80 5.066.820,9 5.009.500,00
Federation of BiH and Cantons
80.068.922 71.126.748,3 79.393.79 54.000.000
Republic of Srpska 80.000.000,0 81.547.605,36 81.186.160,17 60.000.000 Bosnia and Herzegovina 164.715.238 158.730.176,4 165.646.260 119.009.500,00
*Source: Authors' elaboration based on data from the official websites.
The institutions more widely identified as the most important in providing a coordination of
rural development issues are the Entity’s Ministries for agriculture while no public institution or civil society organization considered the MoFTER as the leader institution regarding these issues. In fact, it is quite common in the decentralized or ‘concerted’ and multi-actors driven rural policy design and delivery systems (Mantino, 2009) that the different levels of government find it difficult to clarify their respective roles and responsibilities (OECD, 2006).
The analysis of relationships and linkages between the institutions that are involved in the design and implementation of ARD policies in BH showed a lack and/or weakness of coordi-nation between them. Therefore, this problem should be addressed as possible in order to increase the effectiveness of these policies and their impacts on rural people’s livelihoods. A basic action to strengthen coordination would be to encourage dialogue between these institutions and harmonizing Entities’ policies, strategies, action plans and strategic plans with the State level ones in particular the Law on Agriculture, Food and Rural Development of BH. Moreover, many of the solutions in order to address key coordination challenges and to achieve an effective governance are suitable also in the case of BH. Coordination of rural development policy is weak. The EC
REDETE – ECONOMIC DEVELOPMENT AND ENTEREPRENEURSHIP IN TRANSITION ECONOMIES
862
(2010) pointed out also in its progress report that there has been no progress towards establishing a State-level Ministry of Agriculture, Food and Rural Development that can help improving coordination of ARD policy.
Conclusions
Geographical location of Bosnia and Herzegovina and heterogeneity of natural factors (relief, climate, water, soil, vegetation) implied abundance of natural resources. On this basis is possible, with use of definition of agro tourism, and basic laws of its development, to develop agro tourism in the country. The reinvestment of those benefits can bring about the positive change but also secure sustainability o tourism on long run.
Rural development becomes then essential to increase the volume of agricultural production, employment opportunities, income and living standards of rural population, to improve environmental protection and, consequently, to stop the depopulation and de-agrarization of rural and mountainous areas.
Implementation of ARD policy is at an early stage and stronger coordination between the State and the Entities in aligning with the EU in the field of ARD is required. State level capacity for policy formulation should be improved. The lack of coordination between State and Entity levels hampers the harmonized implementation of ARD legislation. Lack of a good coordination between actors dealing with ARD policies decreases their effectiveness. Vertical co-ordination between State level institutions with Entity, regional and local ones, especially civil society organizations, is still particularly challenging in BH. State and Entity governments should encourage local actor’s participation in the design and implementation of place-based policies for rural development. Coordination with other State and Entity ministries and development agencies is also relevant.
Problems faced by rural areas of BH are the following: - depopulation process of rural areas, especially hilly or mountainous municipalities, and
resettlement towards bigger cities or in their surroundings;
- very slow return process as the consequence of the war;
- lack of plans to develop rural resources;
- absence of socio-economic analysis of rural areas;
- superficial strategies for the development of rural areas as a whole.
Cooperation between State, Entities, cantons, regions, municipalities and non-state actors is
essential for promoting sustainable agro tourism and rural development. ARD governance is to be put into the context of a wider process of institutional reforms and alignment with the EU and legislation.
Reference list
1. Cheema G.S. (2005). Building democratic institutions: governance reform in developing countries. Kumarian Press Inc, New York.
2. EC (2010). Bosnia and Herzegovina 2010 progress report. European Commission (EC), Brussels. 65 p. 3. EC (2011). Bosnia and Herzegovina 2011 progress report. European Commission (EC), Brussels. 43-45 p. 4. MAFWM-RS (2009). Сратешки план руралног развоја Републике Српске за период 2009-
2015 године (The Strategic Plan for Rural Development in Republic of Srpska 2009-2015). Ministry of Agriculture, Forestry and Water Management of Republic of Srpska, Banja Luka.

REDETE – ECONOMIC DEVELOPMENT AND ENTEREPRENEURSHIP IN TRANSITION ECONOMIES
863
http://www.vladars.net/sr-SPCyrl/Vlada/Ministarstva/mps/министарство/; accessed on September 10, 2011.
5. Mantino F. (2009). Typologies of governance models. FP 7 Project no. 213034, Assessing the impact of rural development models (including LEADER).
6. MoFT (2010). Donor mapping report 2009-2010. Ministry of Finance and Treasury (MoFT) of BiH, Sarajevo. 79 p. http://www.donormapping.ba/pdf/DMR-Report-Eng-2010.pdf, accessed on September 22, 2011.
7. MoFTER (2009). Policy analysis in the field of agriculture, food and rural development in BiH. The Ministry of Foreign Trade and External Relations of BiH, Sarajevo.
8. MoFTER (2011). Izvještaj iz oblasti poljoprivrede za Bosnu i Hercegovinu za 2010. godinu (Bosnia and Herzegovina, Agricultural Report 2010). The Ministry of Foreign Trade and External Relations of BiH, Sarajevo.
9. OECD (2006). The New Rural Paradigm - Policies and Governance. OECD Rural Policy Reviews. Organization for Economic Co-operation and Development (OECD). 168 p.
10. PABH (2008). Zakon o Poljoprivredi, Prehrani i Ruralnom Razvoju Bosne i Hercegovine . 11. Waithe, R. (2006). Caribbean Agro tourism Development Initiatives and Opportunities. Inter-
American Institute for Cooperation on Agriculture (IICA). Barbados. 12. The World Bank (2008). World Development Indicators. Washington, USA

REDETE – ECONOMIC DEVELOPMENT AND ENTEREPRENEURSHIP IN TRANSITION ECONOMIES
864
ENTREPRENEUSHIP AND INNOVATION AS A CONDITION FOR POSITIONING ON THE INTERNATIONAL TOURISM MARKET
Vesna MILOVANOVIĆ346
Snežana MILIĆEVIĆ347
Abstract
One of the biggest economic changes by the end of the past century in Europe was a privati-zation of state owned properties. This was a big challenge, since there have been numerous unsuccessful examples which have destroyed economic activities and left many people without a job. On the other hand, successful privatizations have contributed to further increase of econo-mic and social welfare. The new owners of the property operate with their own capital in an un-certain business environment that changes rapidly, so they need to constantly follow and ma-nage changes, make adjustments and undertake risks. Thus, the new private owners of the pro-perty become entrepreneurs who tend to maximise their profit through creativity and innovative solutions, competitive advantage, customer orientation, change management, etc. In a contem-porary business environment enrepreneurship has become one of the main market forces, since it represents a source of ideas, actions, inovations, as well as a constant tendency towards change.
Large number of entrepreneurs worldwide have entered into cooperation with partners from all over the world, so the economy has become highly internationalised nowadays. New techno-logies and low cost of communication enable us to buy products and services at the place where they have a better quality at a given price. This tendency is not strange to the tourism market. In order to increase the number of tourists many tourism destinations are oriented towards international tourists attraction. To succeed it is necessary to follow the needs of sophisticated tourists, invest in new technologies, equipment, infrastructure, staff, and gain the support from authorities. Entering the international tourism market can be very complicated task.
The aim of this work is to highlight the importance of entrepreneurship activity in attracting the foreign tourists. The study will examine the impact of successful and unsuccessful privateza-tions on entrepreneurship activity and positioning on the international tourism market. The ex-ample of Serbian spas indicates low number of foreign tourists due to bad privatizations and la-ck of innovations as opposed to countries from the region, who have almost equal number of domestic and foreign tourists because after privatization entrepreneurs were improving conditi-ons in spas according to the newest trends. Methodology employed consists of comparative ana-lysis and benchmarking taking the best examples from the region. The value of the work is reflected in raising the awareness about the importance of entrepreneurship activity for positio-ning on the international market and giving the recommendations to local authorities for nece-ssary improvements based on some successful examples.
Key words: entrepreneurship, innovation, privatization, spa tourism, contemporary tourism trends
346 Teaching Assistant at the Faculty for Hotel Management and Tourism Vrnjačka Banja University of Kragujevac,
Vojvodjanska bb; e-mail: [email protected] 347 Teaching Assistant at Faculty for Hotel Management and Tourism Vrnjačka Banja University of Kragujevac,
Vojvodjanska bb; e-mail: [email protected]

REDETE – ECONOMIC DEVELOPMENT AND ENTEREPRENEURSHIP IN TRANSITION ECONOMIES
865
Introduction
Modern economy is characterised by knowledge and innovation being the key forces in competitive advantage creation. It means that although many companies are trying to reduce costs by outsourcing to cheap material and labour countries, their sustainable development is deter-mined by their capabilities to learn and innovate. Privately owned and managed capital can best serve to effectiveness, innovation, and competitiveness through monitoring customer satisfaction, knowledge generation and upgrade, technology advancement, and establishing tight relationships with stakeholders. Entrepreneurship is especially important in tourism sector where most com-panies are small and medium sized (SMEs) and where uncertainty is high due to constant market changes. Tourists became highly sophisticated due to rich information supply, the Internet, lower transport costs, advanced technology, increased standard of living, etc. Globalisation has inc-reased competition among tourism destinations worldwide. Costs of visiting an old European city or an exotic African destination are comparable. In that sense, each destination more than ever works hard to protect its market and attract new tourists from all over the world. Present study will analyse the state of entrepreneurship in Serbian spa tourism and its position relative to some countries from the region with similar historical background. Differences in competitive position of Serbian spas comparing to other countries are mainly due to unsuccessful privatization in Serbian tourism sector. The lack of entrepreneurship and therefore capital injection, innovation, but also government assistance and strategy, caused Serbian spas to be unattractive on the inter-national tourism market, although they are abundant in mineral resources and skilled medical sta-ff. The study will provide insights for Serbian government and local authorities on how to enhan-ce entrepreneurship and innovation in spa tourism. Strengthening the entrepreneurial activity in tourism sector will lead to development of connected industries, lower unemployment, foreign currency inflow, new investors and therefore to overall economic welfare. Such events can be very helpful for country survival in the period of transition and economic crisis. Recommen-dations can apply to other states in similar position, where the lack of private capital and management still prevents the economic progress.
The concept of entrepreneurship
Mises (1949, p.249) defines entrepreneurship as a driving market force. Usually entrepreneurs are small and medium sized companies (SME) and individuals who search for new, innovative so-lutions in order to ensure survival at a highly competitive and uncertain market. Small companies are by their nature more flexible and adapt promptly to market changes. Entrepreneurship is based on recognising the opportunities that arise from changes. One of the most influential is Kirzner's (1973) approach of entrepreneurship as a recognition of profit opportunities. Intuition, creativity and information play a vital role in opportunities detection and development of a new product, service, process or a method. Market economy represents a necessary condition for entrepreneu-rship existence and is characterised by competitiveness and uncertainty. Mises (1949, p.705) argues that in socialist economy individuals may be workers, managers, or technicians, but not en-trepreneurs since there are no personal financial gains or losses. Cantillon (1755) divides market participants on entrepreneurs and wage-earners: ”Entrepreneurs work for uncertain compensation, to say so, and all the others for certain compensation as long as they have it”. Gain or loss is seen as a return on entrepreneurship.
Nowadays, special attention has been drawn to sustainable entrepreneurship. Scientists argue that entrepreneurship may sustain the ecosystem, prevent climate changes, reduce natural degra-dation, improve agricultural processes and sustain biodiversity (Cohen and Winn, 2007; Dean and McMullen, 2007). In developing countries entrepreneurship may contribute to education, produ-ctivity, socioeconomic status, physical health, as well as to self confidence of individuals and

REDETE – ECONOMIC DEVELOPMENT AND ENTEREPRENEURSHIP IN TRANSITION ECONOMIES
866
society (Wheeler et al., 2005). While the economic profit is a central topic of entrepreneurship, sustainable entrepreneurship includes also non-economic goals (wellbeing for people and society as a whole). Non-economic gains include child survival, life expectations, education, and equality. Studies from social entrepreneurship and corporate social responsibility suggest that entrepreneurs may significantly contribute to development of non-economic benefits for individuals.
Entrepreneurship is crucial concept in tourism sector which is comprised mainly of SMEs and where uncertainty is high due to often changes in demand patterns, competitors' offer, seasonal fluctuations, exchange rate, atmospheric conditions, legislation, etc. Entrepreneurs in tourism sec-tor carefully monitor changes in internal and external environment in order to promptly detect new opportunities for innovative solutions. It is worth mentioning some of the world's biggest entrepreneurs in tourism, such as Thomas Cook known as the ‘‘father of mass tourism’’ who exploited the opportunity offered by the invention of the steam engine to move large numbers of working class people to tourism destinations, or Walt Disney, labeled as the ‘‘father of theme parks’’.
Seasonal character of tourism activities represents a sort of obstacle to innovation, since during the season there is too much work so the “care for tomorrow” is being postponed. However, the season is the actual moment for gathering the information which is going to be processed afterwards as a material for innovative processes (Blichfeldt B., 2009). Weiermair (2003, p.5) reminds us that “customer plays a fundamental role in service innovation”, so the interaction with clients while providing the service is of crucial importance for valuable information collection. Since innovation is a different concept from imitation, it has incorporated something what custo-mers can hardly find elsewhere. Innovation does not necessarily refer to radical invention, but also to slight changes on product, service, or process. Some examples of innovations in tourism are: new manifestations, corporate social responsibility approaches to protect environment and support sustainable tourism development, appearance of wellness, loyalty programs, electronic reservation systems, modern technology enabling quality, demand, capacity management, and so on.
Development of spa tourism entrepreneurship in post-socialist European countries
Spa tourism has a long history and is based on rehabilitation practices using the curative agents from thermal and mineral water, such as iron salts, sulfur, brine, iodine and water with bitumen elements (Cooper et al., 1995). There are over 750 spas throughout the Europe with the major concentrations in Germany and Italy, and the most sophisticated ones are places Austria, Switzerland, Italy and Germany. Between 1945 and the late 1980s the countries of Central and Eastern Europe could be said to form a political and economic region, sharply differentiated from Western Europe by political ideology and economic structures. State-owned companies have invested in construction of centers in various tourism destinations to ensure relatively cheap accommodation and facilities for their employees. There was a culture of social holidays organised by state-owned companies and state travel agencies usually on a group basis (Johnson, 1997). Employees who needed rehabilitation in spa centers were sent by their companies and treatment was fully covered from social funds. The post 1989 transition in Central Eastern Europe (CEE) has had a major impact on tourism in the region. The central issue was, and remains, how tourism is influenced by the transition from a system of central planning to a market economy (Williams and Balaž, 2002). Successfulness of state-owned property privatization in tourism sector varies across countries. In the case of some countries this transition was proceeding relatively smoothly (Hungary), while elsewhere in the region the change has been more complex (e.g. Romania). The progress towards a market economy is often hindered by the fact that the privatization is as much a political process as an economic one (Cooper et al., 1995). Cases of Slovenia, Czech Republic, Hungary, and Romania are emphasized below.
REDETE – ECONOMIC DEVELOPMENT AND ENTEREPRENEURSHIP IN TRANSITION ECONOMIES
867
Slovenia is known for its rich tourism history and quickly developing hospitality industry, especially after privatization when the new owners, mainly domestic companies started to invest in restructuring and development of new products such as conference and wellness or thermal facilities. Slovenia has 87 thermal springs majority of which are dedicated to health tourism, providing modern therapies and well-being products. Investments from 1990s in spa tourism referred to old equipment replacement, building pool complex, introducing wellness, accommo-dation capacity enlargement and modernization. While prior to privatization Slovenian tourism sector lacked the resources to improve quality standards, the new private owners initiated in-vestment cycle, brought new management training, developed new products and intensified advertisement campaigns. Entering to the European Union in 2004 Slovenia gained the access to EU funds for financing infrastructural projects in the tourism industry. With EU and domestic investments hotel quality improved significantly over time, currently with more than 90 percent of all hotels operating at the three, four or five-star level (Assaf and Knežević, 2011). Among the main reasons for successfulness of Slovenian tourism industry are intensive investment policy aiming at modernization, development of new programs according to newest trends, good pre-paration for obtaining the EU funds, etc. As a result, the number of foreign tourists is large as twice as the number of domestic tourists.
Czech Republic is abundant with mineral springs, curative agents, as well as skilled medical personnel. It has been popular as spa destination from XV century. Development of health-tourism services has been high in the last 20 years due to privatization process and foreign investments. Prior to privatization this country has experienced problems in service quality, outdated infrastructure, as well as changes in tourists structure (mainly from socialist republics). Today, number of domestic and foreign tourists is almost equal, foreigners coming mostly from Germany and Russia (Királová, 2011, p.131). This means substantial inflow of foreign capital trough tourism activities. Czech Republic is also a part of the EU, having access to its funds for tourism development and modernization.
Hungary is well known spa tourism destination – it has 1.300 thermal springs. In 1972 a new state enterprise, Danubius Hotels, was set up to develop hotels related to Hungarian thermal waters and hot springs. The hotel sector in the period 1960-1990 was dominated by state and state-related enterprises. Hungary did not have such dramatic experience as its socialist neigh-bours during socio-political changes in 1989, because it had followed rather more liberal policies. In some sectors of the economy entrepreneurship was permitted under 'market socialism'. Since spa tourists and the higher spending visitors required hotels of international standing, the authorities allowed foreign capital inflow during the privatization phase in the late 1980s, because limited capital resources were available from indigenous corporations and individual investors. In 2007 Hungarian government has financially supported development of thermal spas. The country also benefited from the EU funds for accommodation and attraction improvement during the period 2004-2008. As a result, foreign tourist currently overweight the domestic ones.
In Romania, spas represent an important sector of the tourism industry. From total 160 spas, 24 are internationally known for the natural treatment of a wide variety of illnesses and ailments. However, the condition of many of the treatment facilities is poor due to lack of investment since early 1970s. Tourism was one of the first economic activities to be affected by privatization. At the beginning of the process, new owners became management and employees through the complete or partial buy-out method. The idea was to create immediate core investors with potentially a strong interest in the business and its future. Nevertheless, the buyout privatization method has made little contribution to an improvement in standards and facilities, so the government elected in 1996 preferred auctions and negotiations with potential buyers. In Romanian tourism sector privatization has been affected by corruption and the influence of former communist elite (nomenklatura), whose members secured for themselves the most attractive assets at well below their market value, being concerned primarily with immediate profits than longer-term investments. Foreign investors, on the other hand, were interested only in larger and more

REDETE – ECONOMIC DEVELOPMENT AND ENTEREPRENEURSHIP IN TRANSITION ECONOMIES
868
prestigious hotels, in the major resorts and cities. More recently, the government has been encouraging privatization in the tourism industry, training programs and has commissioned a tourism master plan. As a member of the EU, Romania was supported with funds aiming at development and modernization in tourism industry. However, the general economic conditions and the poor quality of the infrastructure are still a large obstacle to attract foreign investment in the tourism industry.
Recently there has emerged a tendency to move away from the traditional medical cure towards prevention of illness, health strengthening, fitness and beauty. Lifestyle has changed dramatically and many young people are under pressure to follow high objectives imposed by modern society. Stress has become a component of everyday life, leading to health degradation over time. Many spa centers that were historically serving to rehabilitation of older population ha-ve recently being adapting to serve younger generations who seek for relax and entertainment. This demands the development of a high quality tourism product with emphasis on luxury treat-ment and accommodation. Traditional spas' market is aging and there is a need to diversify products offering with both health and fitness regimes and preventative medicine to attract a re-placement market. The key role in connecting natural richness of spas with modern entertainment and relax supply belongs to entrepreneurship. Especially important are networks and clusters in tourism sector which speed up innovation by fostering cooperation as well as information and knowledge exchange. Networks ensure greater bargaining power with authorities than would individual entrepreneurs have, increasing possibilities of government assistance in improving the infrastructure for tourism development. Besides entrepreneurship playing the crucial role in economic progress, networking and government support are seen as very influential factors in expanding to international market.
Privatization and entrepreneurship in Serbian spa tourism sector
Although having over 1000 thermal springs, there are just around 40 spas in Serbia. Majority do not have any touristic significance because basic infrastructure is weak and they serve only as medical institutions. Unsolved property relations between Serbian government and Republic fund for pension insurance is the major obstacle to spa privatization in Serbia. Such problems occur in 90% of total 32 spas (Agencija BETA, 2011). There have been positive examples of spas privatization, such as Gornja Trepča, Lukovske Banje and Prolom Banja, where the new owners have changed marketing approach and now face to increasing number of visitors. The most successful is Gornja Trepča (known also as Atomic spa), which has signed contracts with funds from Slovenia, Bosnia and Herzegovina, and rehabilitation association form Moscow. New owners have invested more than one million of EUR and employed new staff. As a result, there is 24% increase in the number of visitors and 44% in revenues. In some instances privatization did not improve conditions, as in Vrnjačka Banja or Soko Banja, and in some it completely destroyed spa functioning, such as in Zvonačka Banja (Stanisavljević, 2012). Vrnjačka Banja records drastic fall of tourists due to condition of hotel-touristic firm Fontana which contains leading hotels in this spa. It has been a problem for years to find the owner who would invest and properly manage this company. Thus, privatization is a necessary but not sufficient condition for spa tourism development. It is of crucial importance to develop entrepreneurial activities which bring innovative practices and improve competitiveness. Hungarian or Slovenian spas are the best examples from the region who have invested in aqua parks, luxurious hotels, wellness centers and infrastructure. Today, they are internationally well-known and attract many local and foreign tourists, contributing significantly to GDP and foreign currency inflow. International hotel chains are present in almost all neighboring countries where hotels were privatized a long time ago.

REDETE – ECONOMIC DEVELOPMENT AND ENTEREPRENEURSHIP IN TRANSITION ECONOMIES
869
Therefore, it should not be surprising that those countries have up to 5 times greater revenues from tourism activity.
Serbia has many tourism potentials but there is a need to build awareness and encourage entrepreneurship. It may benefit from natural environment, thermal springs, hospital people, geographic position, as well as cultural and historical wealth. Serbia is not known as tourism destination on international market due to incomplete value chain in tourism offer and weak infrastructure. The level of medical services is very high but the problem lies in low quality of tourism services. The state was covering costs of rehabilitation in spas while special hospitals could not use credits for facilities modernization. Spa visitors should be offered satisfactory level of accommodation and entertainment for which they are ready to pay. There is huge problem of transport infrastructure, especially for international visitors, who need at least few hours to reach any spa destination from the Belgrade airport using pretty bad roads.
Recently the Serbian Spa Association has been established and it consists of nearly 80 membe-rs including spas, universities, and local authorities, aiming at creation of strategy for spa develop-ment. If tourism offer improves, it is expected that the number of foreign tourist will increase, since the price for good medical service and natural beauty is relatively low. Besides older people who look for rehabilitation, Serbian spas should put greater emphasis on tourism offer for young generations. This is only achievable by encouraging entrepreneurship because only then sources will be used to achieve competitive advantage, differentiate on tourism market and innovation will be enhanced.
Recommendations for spa tourism entrepreneurship encouragement
As a consequence of long technological lag regarding old equipment replacement, implemen-tation of new knowledge and skills, evident is product quality degradation, loss of foreign market and low level of innovation in tourism sector. Local institutions should more actively participate in crating the positive climate for business and an attractive location for investors. Strategic goal of spa centers should be positioning on international tourism market, and it can be achieved through increasing SMEs' competitiveness by encouraging entrepreneurship and innovation. Authorities should support entrepreneurial activity by enhancing healthy competition, providing professional help, educating entrepreneurs and employees, enabling technology and knowledge transfer, providing marketing assistance, liberating bureaucracy, offering financial assistance, etc. These recommendations are presented below in more details:
- Supporting SME through specialised education programs for entrepreneurs and employees in area of management and marketing;
- Establishment of technological and incubator center for transfer of technology, experience and business communication;
- Providing financial and technical support to newly created SMEs;
- Supporting the export oriented SMEs;
- Establishment of information center (providing the information regarding donation and credit programs, information about the market, experts and consultants for development of SME sector, etc.);
- Marketing support for existing SMEs and individual entrepreneurs (regular information about economic manifestations, supporting local entrepreneurs in domestic and interna-tional manifestations, printing offer prospects for SMEs, etc.);
- Reducing bureaucracy in local administration by educating its staff and creating “one stop shop” center;

REDETE – ECONOMIC DEVELOPMENT AND ENTEREPRENEURSHIP IN TRANSITION ECONOMIES
870
- Offering advisory and technical help for entrepreneurial growth (e.g. helping to create business plans for small hotels, hostels, restaurants, small factories for processing agri-cultural products, etc.);
- Establishing Fund for entrepreneurship development to encourage cooperation of entre-preneurs and financial institutions.
Although entrepreneurs are seen as the main agents of change and progress, it is not excluded
that their practices may have unfavourable impact on the local environment, including the natural environment and the community. While enhancing entrepreneurial activity authorities should mo-nitor their practices and intervene when necessary to prevent bad practices. However, stakeholders are increasingly demanding regarding companies' social responsibility, and companies are becoming aware of this market pressure. Accordingly, self-control is going to play a vital role in this respect. It is important to preserve the natural spa environment and control building, traffic, and other activities that may reduce the main advantage of spas. Marseu (2011, 6) provided some basic principles regarding spa contents:
- Spa centers should be “the places of health and psychophysical well-being”;
- Sustainable in all aspects: natural environment, services and public spaces hygiene, architecture and decoration, minimal air, acoustic, and traffic pollution;
- Silence, peace, hospitality of local community;
- Parks, gardens, walking and bicycle paths, sport centers;
- Availability of beauty farm and places for entertainment;
- Spaces for meetings and congresses, which should be equipped with clean and renewable energy sources;
Entrepreneurs are thus expected to help resolve consequences of past malpractices and create a
better world for living. Again, it is of crucial importance to create a favourable climate for entre-preneurship development, what many countries still fail to achieve. It is evident that entre-preneurship can create the wealth for a nation and increase its competitiveness on international market, but it needs to be supported by the local government.
Conclusion
Socioeconomic and technological progress have influenced both market trends and the metho-ds of satisfying consumer demand. Tourism destinations experience an adaptation process, as new markets and opportunities emerge, and competitive relationships modify. Entrepreneurs became the main agents of change, attracted by new, chaotic, and not sufficiently regulated tourism area. Modern spas offer numerous medical services inspired by Eastern and Western health tradition, as well as hospitality services, entertaining activities, cultural contents, etc. They tend to satisfy va-rious needs and expectations of sophisticated tourists. Spa tourism in Serbia is dominated by local tourists, while the portion of foreigners is very low (around 7%). Such a small number of international visitors reflects the fact that Serbian spas offer is weaker compared to spas in the region and is not competitive on international tourism market. The main reason lies in bad privatizations and thus in the lack of entrepreneurship. In order to improve tourism offer and attract international tourists there is a need to invest in modern accommodation first of all, then in the transport infrastructure and entertaining activities. Creation of clusters and networks increases the potential of innovation through tight cooperation of entrepreneurs, exchange of knowledge, information and technology. It also improves the bargaining power of cluster members with
REDETE – ECONOMIC DEVELOPMENT AND ENTEREPRENEURSHIP IN TRANSITION ECONOMIES
871
authorities, as well as the competitiveness on international market. As tourism sector may well contribute to the GDP and foreign currency inflow it is recommended, especially for developing countries with tourism potential, to encourage entrepreneurial activity and innovation in order to improve its position on international market and ensure sustainable economic development.
Reference list
1. Agencija BETA (2011). Vlasnički odnosi koče privatizaciju banja. http://www.naslovi.net-/2011-09-12/glas-javnosti/vlasnicki-odnosi-koce-privatizaciju-banja/2802143 (accessed 25.08.2012)
2. Assaf, A., Knežević, Lj. (2011). privatization, market competition, international attractiveness, management tenure and hotel performance: Evidence from Slovenia. International Journal of Hospitality Management. 30, pp. 391–397
3. Blichfeldt, B. (2009). Innovation and Entrepreneurship in Tourism: The Case of a Danish Caravan Site. PASOS. Revista de Turismo y Patrimonio Cultural. 7, pp.415–431
4. Cantillon, R. (1755). Essai sur la nature de commerce en géneral (1931 edn), Higgs, H. (ed). Macmillan: London, U.K. Chicago Press: Chicago
5. Cohen, B., Winn, M.I. (2007). Market imperfection, opportunity and sustainable entrepreneur-ship. Journal of Business Venturing. 22, pp. 29–49
6. Cooper, C.P. , Fletcher, J., Noble, A., Westlake, J.N. (1995). Changing Tourism Demand in Central Europe: The Case of Romanian Tourist Spas. The Journal of Tourism Studies. 6(2), pp. 30-44
7. Dean, T.J., McMullen, J.S. (2007). Toward a theory of sustainable entrepreneurship: Reducing environmental degradation through entrepreneurial action. Journal of Business Venturing, 22, pp. 50–76
8. Johnson, M. (1997). Hungary's hotel industry in transition, 1960-1996. Tourism Management. 18(7), pp. 441-452
9. Királová, A. (2010) “Health Spa and Wellness – Competition or Supplement? The Czech Re-public Case”, Proceedings of the Travel and Tourism Research Association Europe 2010 Annual Conference. p. 131, http://pc.parnu.ee/~htooman/Proceedingnyomdanak.pdf (accessed on 26.08.2012)
10. Kirzner, IM. (1973). Competition and Entrepreneurship. University of Chicago Press: Chi-cago.
11. Marseu, G. (2011). Stručni profili u sektoru banjskog turizma. Presentation during the seminar organised by Italian Chamber of Foreign Commerce, European Forum and Megatrend University of Belgrade
12. Mises, L. (1949). Human Action: A Treatise on Economics. Yale University Press: New Ha-ven, CT.
13. Stanisavljević, D. (2012). Banje u Srbiji - Neiskorišćen turistički potencijal. http://www.kristali.rs/putovanja/banje-u-srbiji-neiskori%C5%A1%C4%87en-turisti%C4%8Dki-potencijal.html (accessed 25.08.2012)
14. Weiermair, K. (2001). Theoretical foundations or considerations regarding the growth of tou-rism enterprises. Tourism Review. 56, pp. 17-25.
15. Wheeler, D., McKague, K., Thomson, J., Davies, R., Medalye, J., Prada, M. (2005). Creating sustainable local enterprise networks. Sloan Management Review, 47, pp. 33–40
16. Williams, A., Balaž, V. (2002). The Czech and Slovak Republics: conceptual issues in the economic analysis of tourism in transition. Tourism Management. 23, pp. 37–45

REDETE – ECONOMIC DEVELOPMENT AND ENTEREPRENEURSHIP IN TRANSITION ECONOMIES
872
YOUTH CHAMBER OF COMMERCE
Vesna NOVAKOVIĆ348
Abstract
If traditional conceptions in a society can be changed toward facilitating acceptance of inno-vation, encourage individual creativity, reducing resistance to change thus enhancing of the en-trepreneurial spirit, entrepreneurship can be learned. The best way to shape and create an entrepreneur is through the education system, from elementary school, to shape perceptions, and behavior of young people toward to the entrepreneurial model. Most authors agrees that a model experiential learning, or "learning through work", is more efficient to develop entrepre-neurial skills and attitudes than the traditional methods such as lectures.
Entrepreneurship education should be an integral part of the national curriculum at all leve-ls of education.
On the other hand, if we provide a unique and coordinated approach by all institutions inte-rested in youth entrepreneurship it would enable consolidation of a large number of individual, independent, uncoordinated efforts and projects to solve the problem of youth employment. Actually, creating the Youth Chamber of Commerce would allow the integration of young enter-prise to solve institutional problems of unemployment, and involvement of young entrepreneurs into the business network. Young would have available mentoring services, they would be infor-med about sources for funding future business ventures. On the other hand, young people thro-ughout the Republic of Srpska could have an equal opportunity without any special allocation of the Western or Eastern part of the Republic.
Keywords: Youth Chamber of Commerce, youth entrepreneurship, Unemployment, Entrepre-neurship.
348 Vesna Novaković, MSc in Economics, Ministry of Education and Culture, Government of the Republic of Srpska

REDETE – ECONOMIC DEVELOPMENT AND ENTEREPRENEURSHIP IN TRANSITION ECONOMIES
873
Introduction
In Bosnia and Herzegovina one of the fundamental problems of young people is unemplo-yment. Namely, in the last few years the rate of unemployment have been constantly rising. One of the main reasons for this situation in the labor market are authorities. Since they carried out the privatisation of public companies, instead of restructuring and modernisation, a large number of working places were lost. On the other hand, the duration of education is extended and more and more of young people are continuing their education in higher education institutions.
In today's world who is overwhelmed by the same products, services, companies that have similar ideas thus creates society of surplus (Riderstale / Nordstorm, 2004) there is a need to respond, to be different, special, or to be adventurous. An entrepreneur, according to adopted definition, is the creator of business ideas and business opportunities (Vukmirović, 2006). He creates ideas and also realize them, finding many obstacles in his path. An entrepreneur must possess many skills, to be the first to recognize that chance, an opportunity, but, at the same time, to be ready to take risks.
If we want to youth entrepreneurship be accepted as an option in the choice career, we need to “wake up” young people, so that they take matter in their hands, not to expect that the job will be waiting for them after they graduate education, but to fight for the same. Possibilities for youth entrepreneurship development should be considered in the context of economic realities in the countries in order to avoid unrealistic expectations. Exchange of national experiences may give some clues, but in the end, policies and programs should be customized to the local conditions and circumstances in the country (Kapitsa, L., 2007). When taking in consideration the rate of unemployment of young people, their feeling of discouragement at finding jobs, it should consider activity of all institutions and in this way find a best solution for youth issues.
During research for this paper it has been used the general scientific method of detection and observation of general strengths of legality, cause - effect ties and their comparison with the specifics that are characterised by the area of research. Analysis described and critically showed youth involvement in the labor market in Bosnia and Herzegovina. While a wider and cause - effect dependence determined the solution which could be applied and used in the Republic of Srpska.
1. The basic problems of youth entrepreneurship development in the Republika Srpska
In the last few years the unemployment rate in Bosnia and Herzegovina is constantly growing. The rate of unemployment is the highest among young persons aged between 15 and 24 and it was 57.9 %. A review of the rate of unemployment for last 4 years in Bosnia and Herzegovina was shown in Table 1.
Table 1. The unemployment rate in Bosnia and Hercegovina
2008 2009 2010 2011 The rate of unemployment for young 15-24 47.5 48,7 57,5 57,9
The rate of unemployment BiH 23.4 24,1 27,2 27,6 Source: Survey on working force in Bosnia and Herzegovina 2009., 2011.
http://www.bhas.ba/new/Questionaries.asp?Test=32r5&Arh=1&Pripadnost=5&mode=dark04.08.2012.
This fact speaks enough that the unemployment is the problem number one when it comes to
young people. One of the main reasons for this situation in the labor market is that the authorities

REDETE – ECONOMIC DEVELOPMENT AND ENTEREPRENEURSHIP IN TRANSITION ECONOMIES
874
after the war conflict, streamline the process of privatisation public enterprises instead of restructuring and modernisation.
This kind of policy caused a loss of large number of jobs. On the other hand, the process of founding the new businesses and entrepreneurship development is not strong enough to facilitate creating a sufficient number of new jobs and to compensate the loss of jobs through privatisation of public enterprises (Daria Duilović, Nedim Sinanović, Dino Đipa, Nebojša Kuruzović, Martina Rotim, Darko Paranos, 2008, pp.12 –13).
Unlike their parents, young people in the Central and South-eastern Europe (Bosnia and Herzegovina, Croatia, Serbia, Montenegro, Macedonia and Albania) faces new challenges and opportunities. Young people enter the labor market that is characterised by the principles of the market economy, which implies greater opportunities in the sense of freedom of choice. At the same time they encounter professional changes in sense of grater uncertainty in the area of social and job security (Global Employment Trends for Youth, 2009, pp. 42).
The main reason for reduction in participation of young people in the overall work force in this region (same has dropped from 45.0 per cent in 1997 to 39.3 % in 2007) is that the duration of education has been extended, and more and more of young people continues their education in higher education institutions (Global Employment Trends for Youth, 2009, pp. 45). Of course there is “hiding” in the educational system, in order to avoid job searching, which would probably be difficult and frustrating. According to data, only one-third of all young unemployed in the region has found employment in 2007. Given that the youth is facing with almost impossible prospects of finding job many young people in the region decided to migrate abroad in Western Europe. Data suggest that in the period from 1996 - 2002 about 100,000 young people have left Bosnia and Herzegovina. According to further research 73% of young would leave Bosnia and Herzegovina for schooling, temporary work, or permanent settlement in some foreign country. Improvement of self employment of the young people could contribute in reducing immigration, as well as the release of new work places (Duilović D., Sinanović N., Đipa D., Kuruzović N., Rotim M., Paranos D., 2008, pp.12 – 15).
On the other hand one part of young people becomes discouraged, and giving up on seeking for job, and for the economy that means spending human resources and production resources. Nearly half of youth after a long period of time soliciting work remains inactive or find work in the informal sector. Proper employment, employment equivalent to degree of education, for young people can’t be achieved through isolated and partial interventions. It requires long-term and persistent work to create an integrated strategy for growth and the creation of jobs, including targeted intervention to help young people to overcome certain obstacles that they are facing in entering the labor market (Global Employment Trends for Youth, 2009, pp. 41). Therefore, it is necessary to find the best way to encourage youth entrepreneurship among young people.
Institutional advocacy of interest for the young people in the Republic of Srpska is organized through respective ministry (Ministry for the family, youth and sports in the Government RS), Board for the youth in the National Assembly of Republic of Srpska, Youth Council of the Republic of Srpska, and numerous non-governmental organizations, municipal commission for youth and initiative project character.
On 10th of November 2009 The National Assembly of the Republic of Srpska adopted the document "Youth Policy of Republic of Srpska 2010 – 2015”. Youth Policy is a strategy that provides systematic promotion of a larger number of areas (education, employment, housing, free time, health etc), all of which are sphere of interest for the young people (Youth Policy of Republic of Srpska 2010 – 2015).
According to the data from United Nation Development Program (UNDP), only 8% of young successfully tried to launch their own businesses, 28% didn’t tried due to complicated procedures, around 10% tried and gave up, and 54% was not interested in starting their own business. The same sources confirmed that 58% of young has no income. These data are in full

REDETE – ECONOMIC DEVELOPMENT AND ENTEREPRENEURSHIP IN TRANSITION ECONOMIES
875
correlation with the findings in the research on labor market and prospects for young people conducted by Institute of Economy Banja Luka. This research states that:
- 20% of young people wants to develop their own business, - 50% of young thinks that there is only talking about, and that nothing is been done on the
issue, - 15% of young is familiar with features and demands of modern entrepreneurship, - 61% of young consider to have no impact on society (Aleksandar Draganić, 2008, pp. 44).
According to research conducted in mid-2006, on the sample of 203 graduate students with
two-year post-secondary degrees and the high school in the Republic of Srpska, only 17.24 % thinks that in 10 years will lead their own business. Interesting is the fact that these are the views of persons who graduated in field of medicine and health care (1/3 of all respondents), and of those who are employed in the service industry (almost 35%) (Global Employment Trends for Youth, 2009, pp. 45) The issue of youth employment in the Republic of Srpska is shown in Tables 2 and 3.
Namely, 27.59 % of young under the age of 30 are unemployed, according to official records in the Republic of Srpska, and the largest number of registered unemployed has lower secondary and professional qualification. This information deserves a special attention considering that existing programs for employment are mainly focused on persons with a higher level of education.
Table 2. Number of registered unemployed people in the Office of the employment of Republic of Srpska according to age (March 2011.)
Category Age
15 - 20 Age
20- 24 Age
24 -27 Age
27- 30 Age
30 - 35 Age
35 - 45 Age
45 - 55 age 55
and over A total
Number of the unemployed
1,871 14,128 12,513 12,845 19,416 38,208 37,202 14,893 151,076
Source:http://www.zzrs.org/statistika/statistika_rezultati_mjesecno_starosna.asp?NAV=3&Vrsta_izvjestaja=&Godine_opcija=specificna_godina&Od_godine=2011&Do_godine=2011&Period_opcija=svi_periodi&Period=3 05.07.2012
Table 3. Number of registered unemployed people in the Office of the employment of Republic of Srpska according to qualifications (March 2011)
Category Unqualified Semi qualified
qualified Secondary school
skilled UD Master Phd A total
Number of the
unemployed
40,687 3,962 56,487 39,080 1,728 9,021 108 3 151,076
Source:http://www.zzrs.org/statistika/statistika_rezultati_mjesecno_starosna.asp?NAV=3&Vrsta_izvjestaja=&Godine_opcija=specificna_godina&Od_godine=2011&Do_godine=2011&Period_opcija=svi_periodi&Period=1
05.07.2012
Some of individual solutions that could be proposed and which are related to reducing the
youth unemployment rates are following: - It is necesery that all economic entities and competent institutions are interested and
involved in the development of youth entrepreneurship, - Youth must not be uninterested and uninformed, but it must be animated and affirmative
looking toward youth entrepreneurship - Inclusion of the youth in all the necessary training in order to recognized clear steps that
need to be taken in order to obtain certain financial resources, - To support young new founded enterprises one period after its establishment.

REDETE – ECONOMIC DEVELOPMENT AND ENTEREPRENEURSHIP IN TRANSITION ECONOMIES
876
Institutional solution to realize the above mentioned solutions could unify under the establish-ment of the Chamber of Commerce for young at the Chamber of Commerce on the entity level. In the continuation of this paper will be presented more elaborate way for establishing the Chamber and its benefits.
2. Promotion measures for youth entrepreneurship
For development of entrepreneurship and creating small and medium-sized enterprises lack institutional support and infrastructural environment, there is a weak support of business asso-ciations, chambers of commerce and similar institutions. There are three fields of action which could be improved. They are:
- education in entrepreneurship and enabling young people to overcome certain skills for opening up their own work,
- that policy makers seriously discuss how to facilitate access to finance for young entre-preneurs, as well as to provide logistical support for obtaining certain licenses, equipment, materials,
- and there is a third to support businesses after their establishment.
In August 1998 the Lisbon Declaration of policy and programs for young people which defines
the framework state policy toward the young people in youth development, education, employ-ment, health and other issues which are important for young people, was adopted. Declaration in particular emphasizes partnership of public authorities, private sector and educational institutions and civil society initiatives in order to promote employment of young people. Government should invest in youth entrepreneurial capacity ensuring skills and resources for starting their own business (Duilović D., Sinanović N., Đipa D., Kuruzović N., Rotim M., Paranos D, 2008: 16).
Today young people have more creative ways to make money. Many young people feel that starting their own business or just learning skills to launch a business can give an advantage in the business life. Some research shows that the seminars and training young people for leading their own work will give an opportunity for youth to learn about options in career and build leadership characteristics. As well as to reach a self confidence, and then increases the interest in youth for continued education, and belief in their ability to reach goals.
One of the conclusions analysis after research USAID is that there is no magical stick to solve youth unemployment problem, namely that you can’t e.g. copy Mongolian model in Bosnia and Herzegovina, but we can talk about common principles on which it is based and upon which de-pends success of policies and programs.
Namely, the state must have a clearly defined policy with the State Action Plan for this area. Authorities need to integrate an action plan for youth employment in its development strategy, and to provide necessary resources for the development action plan.
3. Ways to improve entrepreneurial climate in the Republic of Srpska
Entrepreneur framework conditions reflect the main characteristics of socio-economic environ-ment of a state which is expected to have a significant impact on entrepreneurial sector. Factors that show most pronounced differences of stages of economic development include national policy, government programs, transfer of research and development, commercial and professional infrastructure, internal market openness and physical infrastructure. Certainly the national culture of a country should be taken into consideration since it can affect the development of entrepre-

REDETE – ECONOMIC DEVELOPMENT AND ENTEREPRENEURSHIP IN TRANSITION ECONOMIES
877
neurship in the sense of affirmative relations toward entrepreneurship in the country. Along with the development of the economy, the government should increase attention to encourage entrepreneurship (N. S. Bosma, J. Levie, 2010).
If a national policy of one country comprises development and encourage entrepreneurship there would be reduction of unemployment. Urgency for solving youth unemployment is reco-gnized as fact in the European Union as well. Some of the goals that institutions in the European Union are trying to achieve through support of the young people in the area of employment are that funds within European co-operation should be directed toward finding solutions for problems of unemployment. Member States of the European Union and the European Commission will take measures for:
- Investing in those skills for which there is a demand in the labor market,
- Include youth issues in employment strategy,
- Career guidance and development consulting services,
- Improvement of the quality of an internship which would boost young people's chances in the labor market,
- Support for youth entrepreneurship e.g. through targeted training, access to funds, mentoring and support network in favor of youth entrepreneurship.
Republic of Srpska should include these steps in its development policy. Namely, in order to increase the number of young people who are interested in entrepreneurship it is necessary to have projects that will promote it, in which the young people will have the opportunity to get acquainted with the basic concept and the possibilities for entrepreneurship, with an important note – that the whole process is interesting, dynamic, and entertaining for them. There is a series of patterns to promote entrepreneurship. Around the world most often are competition projects for the best business ideas, business plans and other business elements often with organization of certain conferences with educational meetings for young people, as well as special fairs of youth entrepreneurship. More often these competitions allow persons who have a business idea and who have shaped the idea into the business plan (which is a strategic document containing specified steps for realization of business ideas) to come to financial resources for the realization of their ideas, if their idea is among the best.
One example of incentive measures that are applied in municipality Zvornik in Republic of Srpska is the implementation of "Approval for work on the same day". Namely, through this project, if parties submit complete documentation, their request is being processed within one day, and at the same day they receive approval to start working, and they don’t have to pay fees for establishment of new enterprises.
It is necessary to provide some financial and institutional support for young people in order to reduce risks involved with starting the business activities and the use of funds. This support would be reflected through providing appropriate expert and advisory support to young people interested in starting their own business. Namely, young people are not ready to independently implement a certain idea even after receiving financial resources, so it is necessary to organize a practical training through which young people can simulate and check the effects of the implementation of their business ideas, which will result with appropriate business plan and advisory support. This kind of approach would allow easier access to financial means for young people, and also because the authorities are taking a certain part of risk. In addition, the expert and advisory support to young people will contribute lowering the risks related to starting their own businesses. In this way their capability for entrepreneurship activities would be raised on the moderate degree.
Research which The Republic Agency for Small and Medium Enterprises conducted in vocational high schools in the Republic of Srpska has shown that, thanks to more extensive

REDETE – ECONOMIC DEVELOPMENT AND ENTEREPRENEURSHIP IN TRANSITION ECONOMIES
878
studying of “Basic entrepreneurship”, close to 70% of polled students would start their own business.349 Significant indicators are derived from this research can be seen in chart 1.
Chart 1. Job choices for high school students after they graduate.
Source: Public opinion survey - a survey among students on the studying “Entrepreneurship basis”
If traditional conceptions in a society can be changed toward facilitating acceptance of inno-
vation we can conclude that the entrepreneurship can be learned through education system. On the other hand it should encourage creativity of individuals, reducing resistance to changes and precipitate entrepreneurial spirit.
4. Youth chamber of commerce
One of the solutions applied in developed countries (Schoof, 2006) and which can be applied in the Republic of Srpska is to form the The Chamber of Commerce of youth within Chamber of Commerce on entity level in order to import the young people in the entrepreneur’s network. Namely, institutional representation of interest of young people in the Republic of Srpska is organized through respective ministry, Committee for the youth in the National Assembly of the Republic of Srpska, Youth Council of the Republic of Srpska, and numerous non-governmental organizations, municipal commission for youth and initiative project character. On the other hand, the issues of the employment are in jurisdiction of the Ministry of Labor and veterans in the Government of the Republic of Srpska, which, through institutions in its jurisdiction, implement certain policies related to unemployment problem. However, a unified and coordinated approach of all of the institutions in the area of youth entrepreneurship would allow unification of a large number of individual, independent, uncoordinated attempts and problem-solving projects of youth employment. Therefore the Youth Chamber of Commerce would enable business connectivity of young entrepreneurs with each other, as well as merger of experienced entrepreneurs and business leaders through providing mentoring programs with young entrepreneurs. Namely, one of short-comings that young people see as the inability of successful business is entrepreneurship isolation, or lack of business networking. Business contacts are of crucial importance especially for the young and inexperienced entrepreneurs.
For the younger entrepreneurs the most important criteria are business idea, financial support and business contacts. The youngest age group (15 – 24 years) tend to be particularly sensitive to this factor. About 83 per cent of youngest respondents give most importance to the contact with the relevant business partners (Schoof, 2006) Through this solution it would be achieved that in
349 http://www.rars-msp.org/sr-Cyrl-CS/Rars/Media?galleryTitle=%D0%9F%D1%83%D0%B1%D0%BB%D0%B8%D0%-
BA%D0%B0%D1%86%D0%B8%D1%98%D0%B5 04.05.2011.

REDETE – ECONOMIC DEVELOPMENT AND ENTEREPRENEURSHIP IN TRANSITION ECONOMIES
879
one place could be found all available information for young entrepreneurs on available services provided by different public (and private) companies for business support, and detailed analysis in order to solve the lack of awareness among young people that such services are there. Research conducted in the UK has shown that 27 per cent of the respondents haven’t used business services financed by the government or they aren’t even aware that the those services are provided (Schoof, 2006). The youth Chamber of Commerce would provided information on availability and sources for financial resources for the launch of new venture business. Then, training for those who want to be entrepreneurs or already are, access to professional services support, access to physical infrastructure, certainly in co-operation with other institutions that represent the interests of young people, as well as The Republic Agency for Small and Medium Enterprises.
Given the organization of the Chamber of Commerce, creating the Youth Chamber of Commerce would enable territorial representation and allowed for all young people, with overall territory of the Republic of Srpska, to get involved and to participate actively in the development of youth entrepreneurship in Republic of Srpska.
In the scheme below is shown the way on which could be organized Youth Chamber of Commerce including Secretary of youth issues.
Conclusion
For youth to be independent we need to think in the entrepreneurial way. It is necessary to have adequate education in entrepreneurship that brings a wide range of skills, flexibility and creativity. When entrepreneurship knowledge is mastered, young people could be adjusted to a great and fast changes, both in economy and in the social relations. Research that The Republic Agency for Small and Medium Enterprises conducted in vocational high schools in the Republic of Srpska has shown that, thanks to more extensive studying of "Basic entrepreneurship," close to 70% of polled students would start their own business. If traditional conceptions in a society can be changed toward facilitating acceptance of innovation we can conclude that the entrepre-neurship can be learned through education system. On the other hand it should encourage crea-

REDETE – ECONOMIC DEVELOPMENT AND ENTEREPRENEURSHIP IN TRANSITION ECONOMIES
880
tivity of individuals, reducing resistance to changes and precipitate entrepreneurial spirit. The best way to create an entrepreneur is through the education system, from elementary school, to shape perceptions, and behavior of young people according to the entrepreneurs model. Most authors agrees that a model experiential learning, or "learning through work", is more efficient to develop entrepreneurial skills and attitudes than the traditional methods such as lectures. Namely, through education can be influenced on individuals views and educational system helps young people to think creatively, to recognize opportunities and allows them to build leadership skills and trust. School curriculum and programs should focus on fostering autonomy and independence, innova-tion and creativity, as well as taking risks.
Enterprise education should be an integral part of national plan and program at all levels of education in primary, secondary and higher education. On the other hand, if it could be possible to provide a unique and a coordinated approach of all interested institutions in the area of youth entrepreneurship, that would enable the unification of a large number of individual, independent, uncoordinated attempts and problem-solving projects for employment of young people.
Looking at the obstacles and problems that young people are facing with, it can be concluded that forming Youth Chamber of Commerce it would allow the unification of institutional solving of unemployment problems, as well as the involvement of young people in business network of entrepreneurs.
Young people would have available mentor services, would be informed about sources for funding future business enterprises. On the other hand, young people throughout the Republic of Srpska would had equal opportunities without a special allocations for western or eastern part of the Republic.

REDETE – ECONOMIC DEVELOPMENT AND ENTEREPRENEURSHIP IN TRANSITION ECONOMIES
881
References
1. Dallago, B., Blokker, P., 2008, Youth Entrepreneurship and Local Development in Central and Eastern Europe.
2. Draganić, A. 2008, Samozapošljavanje mladih, između deklarativne i stvarne podrške, EDA 3. Duilović D., Sinanović N., Đipa D., Kuruzović N., Rotim M., Paranos D.,2008, Ana-
liza položaja mladih i omladinkog sektora BiH, Komisija za koordinaciju pitanja mla-dih u BiH
4. Kapitsa, L., 2007, Youth entrepreneurship Policies and programmes in the UNECE States, United nations – Economic commission for Europe
5. http://www.unece.org/operact/meetings/documents/cuoa.2002.y2.pdf (Accessed 12.12.2011) 6. Miovčić Z., Pavlica, M., 2008, Samozapošljavanje mladih – U potrazi za pravom jav-
nom politikom, EDA 7. Riderstale, J., Nordstorm, K., 2004, Funky business, Plato, Beograd 8. Schoof, U., 2006, Stimulating Youth Entrepreneurship: Barriers and incentives to entre-
preneurship start-ups by young people., International Labour Organization, Geneva 9. Vukmirović, N., 2006, Banja Luka, Savremeno preduzetništvo – Nauka i vještina poslovnog
uspjeha, Ekonomski fakultet, Univerzitet u Banja Luci. 10. Agencija za statistiku BiH, Anketa o radnoj snazi 2009 http://www.bhas.ba/new/-
Questionaries.asp?Test=32r5&Arh=1&Pripadnost=5&mode=dark (Accessed 04. 08. 2012.)
11. Agencija za statistiku BiH, Anketa o radnoj snazi 2011 http://www.bhas.ba/new/-Questionaries.asp?Test=32r5&Arh=1&Pripadnost=5&mode=dark (Accessed 04.08.2012.)
12. Global Employment Trends for Youth, October 2008 International Labor Office, Geneva 2009
13. Global Employment Trends for Youth, International Labor Office, Geneva 2006 14. Global Entrepreneurship Monitor, 2009 Executive Report N. S. Bosma, J. Levie, and
Global Entrpreneurship Research Consortium (GERA), 2010, 15. www.gemconsortium.org (Accessed 04.05.2012.) 16. „Omladinska politika Republike Srpske od 2010-2015 gоdine“, Odluka Narodne
skupštine Repoublike Srpske broj: 01-1601/09, od 10.11.2009. gоdine 17. Priručnik: Značaj, potrebe i mogućnosti zapošljavanja mladih i preduzetništva/poduzetništva u
BiH, USAID i Omladinska informativna agencija Bosne i Hercegovine, Sarajevo, 2006. 18. http://www.150000radnihmjesta.ba/docs/uploads/17___OIA%20Prirucnik%20o%20zaposljav
anju- preduzetnistvu-2006.pdf (Accessed 15.10.2010) 19. Euro blic, dnevne novine, 04.02.2010. godine 20. http://www.rars-msp.org/sr-Cyrl-
CS/Rars/Media?galleryTitle=%D0%9F%D1%83%D0%B1%D0%BB%D0%B8%D0%BA%D0%B0%D1%86%D0%B8%D1%98%D0%B5 (Accessed 04.05.2011.)
21. http://www.zzrs.org/statistika/statistika_rezultati_mjesecno_starosna.asp?NAV=3&Vrsta_izvjestaja=&Godine_opcija=specificna_godina&Od_godine=2011&Do_godine=2011&Period_opcija=svi_periodi&Period=3 (Accessed 05.07.2012)
22. http://ec.europa.eu/youth/youth-policies/doc1691_en.htm (Accessed 05.03.2011)

REDETE – ECONOMIC DEVELOPMENT AND ENTEREPRENEURSHIP IN TRANSITION ECONOMIES
882
FEMALE ENTREPRENEURSHIP AS A PRECONDITION FOR CREATING ENTREPRENEURIAL CLIMATE IN THE SOCIETY
Andrea KOVAČEVIĆ350
Gabrijela VIDIĆ351 Božena KRCE MIOČIĆ352
Abstract
Although women represent a majority in population of Croatia, their economic position is much worse compared to the economic situation of men. Generally, unemployment rates of women are higher, there is a small proportion of women on leading positions in firms, their salaries are smaller, and in entrepreneurship, which is especially important for this work, wo-men are also involved in a smaller number than man. Despite the fact that the position of wo-men has improved during the last fifty years, women are still often seen primarily as mothers, wives and housekeepers.
In societies, particularly traditional ones like the Croatian and Bosnian society is, entrepre-neurship is primary considered as a male activity. According to usual stereotypes, men are mo-re aggressive than women, and according to the same stereotypes an entrepreneur should be someone who is aggressive and dominant.
Entrepreneurship should be considered as an opportunity of making a career and securing means of sustenance for every member of the society, besides gender, age, religious, national or other affiliations.
Encouraging women in engaging in entrepreneurship is a national interest, because it is a way of reducing unemployment, improving economic conditions, and at the same time streng-thening the economic position of women by reducing their economic dependence from others.
One of the preconditions for involving women in entrepreneurship is the development of en-trepreneurial climate. Croatia and Bosnia and Herzegovina are countries where the entrepre-neurial climate is insufficient developed. In order to improve entrepreneurial climate in a cer-tain country it is necessary to develop an entrepreneurial spirit at young age, to invest in en-trepreneurial infrastructure, to start programs for the development of entrepreneurship and to invest in social institutions which provide support for entrepreneurs.
For the aim of this work there was conducted a research on a student population in Croatia and Bosnia and Herzegovina. The study will seek to determine student attitudes concerning their entrepreneurial climate, male and female entrepreneurs in the society where they live and entrepreneurship in general.
Key words: female entrepreneurship, entrepreneurial climate, Croatia, Bosnia and Herzego-vina.
350 [email protected] 351 [email protected] 352 University of Zadar, Department of Tourism and Communication Studies, Franje Tudjmana 24 i, 23000 Zadar, Croatia,

REDETE – ECONOMIC DEVELOPMENT AND ENTEREPRENEURSHIP IN TRANSITION ECONOMIES
883
1. Introduction
Entrepreneurship is an important factor in economy of every country. It contributes to general prosperity of society. Every newly founded business entity has its share in creating new workpla-ces, technologies, products and services. In order to include larger population into entrepreneurial activities, it is necessary to develop entrepreneurial climate (in society). One of prerequisites for creating such climate is encouraging women to choose entrepreneurship as their own careers.
Despite men domination in the field of entrepreneurship in most societies, one should keep in mind that this is not exclusively male activity, and that entrepreneurship can be examined consi-dering individual characteristics of the founders. Therefore, it is possible to differentiate entrepre-neurship according to gender, nationality, entrepreneurial experience, engagement of family mem-bers or the number of members included in the entrepreneurial activity. If entrepreneurship is ob-served considering the gender of founders, there is female entrepreneurship or male entrepre-neurship.
There are a number of definitions of the term entrepreneurship in the existing literature. Howe-ver, not many definitions exist that refer to female entrepreneurship. 'The term entrepreneurship implies totality of entrepreneur’s organizational, supervisional, guiding and managerial functions.' (Sunajko, 2001, p. 673) The definition of female entrepreneurship used in this work is that one according to which a female entrepreneur is a woman who recognizes a business opportunity and start business while accepting the risk which it implies. According to the same definition, women as female entrepreneurs manage and lead the enterprise toward a planned goal.353 An American definition states that the women enterprise is an economic entity with at least 51% of its share in hands of woman, who controls business and manages activities of the entity. Therefore, a woman makes all of the important decisions and is also active in day to day business activities. (Buble and Kružić, 2006, p. 143)
It is a matter of fact that Croatian and Bosnian-Herzegovinian society is traditionally patriarc-hal and governed by stereotypes regarding roles of men and women. These stereotypes imply that entrepreneurship is not an appropriate choice for a woman, because it is believed that she is primarily a mother and housewife. If these societies are to develop entrepreneurial climate, they will have to present entrepreneurship as an activity equally accessible to both genders. This possi-bility is needs to be presented to young people from their earliest years.
2. Current position of women in entrepreneurship in Croatia and Bosnia and Herzegovina
In both Croatia and Bosnia and Herzegovina women are majority of the population. According to data from 2010, 51,73% of Croatian population was female.354 Also, majority of work capable population are women, but also majority of unemployed population. In general, economic situ-ation of women is worse when compared to men. For instance, when working same jobs, women's salaries are lower than men's, better paid workplaces are not accessible to women and there are not enough women on managerial positions. In both countries, ratio of women in entrepreneurship is smaller than men's. In Croatia, for every female entrepreneur, there are 2,41 men.355 This is a
353 http://definitions.uslegal.com/w/women-entrepreneur.s/, 04.04.2012. 354 Statistički ljetopis Republike Hrvatske 2011., 2011., Zagreb: Državni zavod za statistiku Republike Hrvatske,
http://www.dzs.hr/Hrv_Eng/ljetopis/2011/SLJH2011.pdf 355 Strategiji razvoja ženskog poduzetništva u Republici Hrvatskoj, 2009., Zagreb: Ministarstvo gospodarstva, rada i
poduzetništva, http://www.ured-ravnopravnost.hr/site/preuzimanje/dokumenti/nac_strat/strategija-poduzet-2010-2013.pdf, 24.01.2012.

REDETE – ECONOMIC DEVELOPMENT AND ENTEREPRENEURSHIP IN TRANSITION ECONOMIES
884
consequence of social environment that, in spite of promoting gender equality, recognizes entre-preneurship primarily as male activity.
Women who consider entrepreneurship careers, or have already started their businesses, usua-lly run into an array of obstacles which can be categorized as follows: individual, obstacles related to education and skills, social environment and financial obstacles.
Individual obstacles refer to lack of self-confidence, courage, lack of vision and unwillingness to risk.
Despite a rise in education of women, they still have a lack of knowledge needed to successfu-lly practice entrepreneurial activity. Primarily, knowledge in fields such as finance, management and marketing are those needed to be improved, although men also fall beck in these.
When talking about social environment as an obstacle, women face with lack of entrepreneu-rial climate in society, insufficiently built infrastructure and complexity of administrative works.
When talking about financial obstacles, women are the ones with fewer finances at their disposal (compared to men). This is consequence of lower salaries, and tradition of inheritance in traditional societies, where men are the ones who inherit assets after death of relatives. As a result of lack of finances, women are less likely to receive credits to finance their entrepreneurship.
It is important to note that these obstacles are faced by both men and women, but women usually deal with them less successfully. First of many problems they need to deal with is stereotype in traditional societies that see entrepreneurship as an inappropriate choice for women.
As previously emphasized, entrepreneurial activity is insufficiently promoted in Croatia and Bosnia and Herzegovina. It is not a seldom case that success of entrepreneurs, both men and women, is seen as a result of bribe and corruption, putting entrepreneurship in negative light. (Leburić and Krneta, 2004, p.88) However, a research among young people in Croatia showed participants dividing themselves symmetrically into those who see and not see connections as primary factor of success in entrepreneurship. (Pavić, 2001, pp. 85-93)
Also, entrepreneurial infrastructure on local and national level in both countries is insufficiently developed and it doesn't fulfill needs of those who are entrepreneurs or plan to be. (Čučković and Bartlett, 2007, pp. 37-56) The procedure of founding new enterprise demands an array of administrative acts which spend time and finance, discouraging some of those with bu-siness ideas.
3. Research methodology
A research on student’s attitudes towards entrepreneurship and practicing entrepreneurship was conducted in the period from 20th of December to 20th of January 2012 among student popula-tion in Bosnia and Herzegovina and Croatia. Students included in this research had subjects rela-ted to economy as a part of their studying program, and because of that they were expected to ha-ve had their entrepreneurial spirit encouraged and developed.
A structured questionnaire consisting of 24 closed type questions was used in this survey. First part of the questionnaire referred to general characteristics of participants, such as age, gender, education level etc. Second part analyzed attitudes of participants toward entrepreneurship, moti-ves and obstacles in practicing entrepreneurship and activities that participants would like to engage in as their bussineses. Third part included questions on student’s attitudes toward social environment and elements that affect creation of entrepreneurial climate in society where the participant came from. Forth part of the questionnaire analyzed attitudes of participants about an ideal woman and man.
After collecting it, the data was analyzed in EXCEL, by methods of descriptive statistics. Results are presented in tables and interpreted in order to accept or reject preliminary hypothesis.

REDETE – ECONOMIC DEVELOPMENT AND ENTEREPRENEURSHIP IN TRANSITION ECONOMIES
885
4. Research results
Globally, entrepreneurship is recognized as an important factor of economic development. In the last couple of years, the government of Croatia introduced programs for development of entrepreneurship. However, Croatian entrepreneurs did not rate these programs positively, pointing out that these do not fulfill their needs. (Čučković and Bartlett, 2007, pp. 37-56) Entrepreneurial activity in Croatia is insufficiently promoted as a possibility for creating careers. National policies related to encouraging development of entrepreneurship should also include the educational system that, at this point, do not develop entrepreneurial mind with young people. Besides, successful entrepreneurs (men and women) are not sufficiently presented in the media. Creating of entrepreneurial climate in society requires emphasizing of successful ventures in media, educational institutions and society in general. As rise in number of entrepreneurs in society improves economic situation of the country and reduces unemployment, it is necessary to ensure programs for promotion of entrepreneurial activity. Primarily, these should be focused on groups that are less represented in entrepreneurship, such as women and young people.356
Table 1: The rating of the social environment (%)
In my country: I
agree (BiH)
I agree (CRO)
I do not agree (BiH)
I do not agree
(CRO)
I can not determine
(BiH)
I can not determine
(CRO) there are different
entrepreneurship development programs,
18,52 51,92 46,30 21,15 35,19 26,92
there are different female ntrepreneurship development
programs,
16,67 38,46 53,70 15,38 29,63 46,15
there are different institutions for developing entrepreneurship,
25,93 55,77 29,63 5,77 44,44 38,46
there are financing research and development,
12,96 42,31 46,30 23,08 40,74 32,69
there are social services for female entrepreneurs,
5,56 11,54 57,41 26,92 37,04 61,54
dominates an entrepreneurial climate,
11,11 15,38 61,11 69,23 27,78 13,46
all important entrepreneurial issues are legally regulated
24,07 21,15 37,04 34,62 38,89 42,31
men in contrast to women have better access to knowledge and
skills,
38,89 44,23 29,63 26,92 31,48 28,85
men in contrast to women have easier access to financial
resources.
57,41 73,08 24,07 7,69 18,52 19,23
Source: own research
Majority of Croatian participants (51,92%) believes that their country encourages development
of entrepreneurship by introducing different assisting programs. Meanwhile, the majority of Bos-nian participants believe that there are no programs that encourage entrepreneurship in their country. Such attitude of Bosnian participants does not surprise. In 2011 only three projects inten-ded to encourage entrepreneurship. Paradoxically, in 2008 Bosnia and Herzegovina came up with
356 Women's Economic Empowermwnt , 2011, OECD, http://www.oecd.org/dataoecd/50/60/47561694.pdf, 01.04.2012.

REDETE – ECONOMIC DEVELOPMENT AND ENTEREPRENEURSHIP IN TRANSITION ECONOMIES
886
the plan 'Development of small and mid-sized entrepreneurship in Bosnia and Herzegovina' which defined main goals related to rise in number of small and mid-sized enterprises, encouragement of development of existing enterprises and creating of entrepreneurial climate.357
A different situation exists in Croatia, where former Government of Croatia encouraged development of entrepreneurship. In 2011 Ministry of Economy, Work and Entrepreneurship started 16 programs for encouraging development of entrepreneurship.
However, most Croatia participants (46,15%) could not express opinion whetted programs for encouraging women to practice entrepreneurship exist is their country, while Bosnian participants think that such programs do not exist in Bosnia and Herzegovina. The earlier mentioned program 'Development of small and mid-sized entrepreneurship in Bosnia and Herzegovina'358 does not specifically stress the problem of smaller ratio of women in entrepreneurship.
Croatia does encourage development of women entrepreneurship, although still insufficiently. A number of projects intended to encourage women business ventures is still small and most of encouragements are basically motivational seminars and workshops. Encouragement measures should be more specific, considering the fact that it should be dealing with the problem deeply rooted in society.
Most Croatian participants (55,77%) believes that there exists a number of institutions which support entrepreneurship. Also, most of them (42,31%) believes that Croatia invests in research and development. In Bosnia and Herzegovina most of the participants (44,44%) could not express their opinion on existence of institutions which would provide support to entrepreneurship. Regarding investment of their country in research and development, most of Bosnian participants (46,30%) disagrees with the statement that their country invests in these fields.
Most Bosnian participants (57,41%) expressed disbelief in existence of social services for providing help to entrepreneurship aspiring women, while 64,5% Croatian participants were not able to rate this segment. It is a matter of fact that there is a lack of support infrastructure in both countries. Inclusion of women into entrepreneurship is the matter of national interest, and therefore it is government's duty to ensure social services to enable women attune their family and business lives. (Puljiz, 2003, pp. 3-20)
Participants from both countries (61,11% in Bosnia and Herzegovina and 69,23% in Croatia) believe that entrepreneurial climate in their countries is not significant. Also, they were not able to rate whatever all important issues regarding founding and running enterprise business were legaly regulated.
Also, the largest ratio of participants of both countries (Bosnia and Herzegovina with 38,89% and Croatia with 44,23%) agreed with the fact that men have better access to knowledge and skills in comparison to women. Besides, most participants in both countries (57,1% in Bosnia and 73,08% in Croatia) believes that men have easier access to finances. In spite of the fact that education level of women is rising, certain societies such as Turkey still invest more in education of their sons. (Çaliyurt, 2011, pp. 327-354) Access to finances is harder for women as well, as financial institutions often believe that enterprises owned by women are more risky to invest in.
Attitude of society toward entrepreneurial activity and entrepreneurs is also a significant factor in enlargement of inclusion of individuals into entrepreneurship.
The following table shows the ratio of those participants who agreed with statements related to perceptions of entrepreneurship and entrepreneurs in societies they come from.
357http://www.fmrpo.gov.ba/ba/stranica/view/poticaji-2011, 23.04.2012. 358Projekt „Razvoj malog i srednjeg poduzetništva Federacije Bosne i Hercegovine“, 2008., Federalno Ministarstvo razvoja,
poduzetništva i obrta, http://www.fmrpo.gov.ba/ba/projekti, 04.04.2012.

Tab
le 1
: A
ttitu
des
abou
t the
soc
ial e
nvir
onm
ent (
%)
Bos
nia
an
d H
erze
govi
na
Cro
atia
Fem
ale
Mal
e F
emal
e M
ale
ST
AT
EM
EN
TS
I agree
I do not agree
I can not determine
Total
I agree
I do not agree
I can not determine
Total
I agree
I do not agree
I can not determine
Total
I agree
I do not agree
I can not determine
Total
Ent
repr
eneu
rshi
p is
pri
mar
ly c
onsi
dere
d as
a m
ascu
line
ac
tivi
ty in
my
soci
ety.
48
,84
16,2
8 34
,88
100,
0018
,18
36,3
6 45
,45
100,
0068
,29
9,76
21
,95
100,
0066
,67
0,00
33
,33
100,
00
Fem
ale
entr
epre
neur
s ar
e pe
rcei
ved
as le
ss f
emin
ine
in
my
soci
ety.
25
,58
34,8
8 39
,53
100,
000,
00
63,6
4 36
,36
100,
0021
,95
46,3
4 31
,71
100,
0041
,67
33,3
3 25
,00
100,
00
In m
y co
untr
y fe
mal
ent
repr
eure
al a
ctiv
itie
s ar
e ex
lusi
vely
a r
esul
t of
nece
ssit
y.
14,2
9 59
,52
26,1
9 10
0,00
27,2
7 45
,45
27,2
7 10
0,00
9,76
41
,46
48,7
8 10
0,00
0,00
33
,33
66,6
7 10
0,00
In th
e so
ciet
y in
whi
ch I
live
mal
e en
trep
rene
urs
are
perc
eive
d as
pos
itiv
e ex
ampl
es o
f pe
rson
who
pro
vide
s re
sour
ces
for
life
wit
h th
eir
own
wor
k an
d ef
fort
s.
76,7
4 9,
30
13,9
5 10
0,00
72,7
3 9,
09
18,1
8 10
0,00
80,4
9 0,
00
19,5
1 10
0,00
91,6
7 0,
00
8,33
10
0,00
In th
e so
ciet
y in
whi
ch I
live
fem
ale
entr
epre
neur
s ar
e pe
rcei
ved
as p
osit
ive
exam
ples
of
pers
on w
ho p
rovi
de
reso
urce
s fo
r li
fe w
ith
thei
r ow
n w
ork
and
effo
rts.
55
,81
9,30
34
,88
100,
0072
,73
0,00
27
,27
100,
0060
,98
9,76
29
,27
100,
0025
,00
8,33
66
,67
100,
00
A m
an w
ho g
oes
on m
ater
nity
leav
e is
per
ceiv
ed a
s le
ss
mas
culi
ne in
the
soci
ety
in w
hich
I li
ve.
55,8
1 9,
30
34,8
8 10
0,00
9,09
27
,27
63,6
4 10
0,00
68,2
9 9,
76
21,9
5 10
0,00
33,3
3 25
,00
41,6
7 10
0,00
Wom
en w
ho e
ngag
e in
ent
repr
eneu
rshi
p ar
e co
nfro
nted
w
ith
lack
of
supp
ort o
f so
ciet
y an
d fa
mil
y in
the
soci
ety
in w
hich
I li
ve.
41,8
6 16
,28
41,8
6 10
0,00
18,1
8 18
,18
63,6
4 10
0,00
41,4
6 19
,51
39,0
2 10
0,00
33,3
3 25
,00
41,6
7 10
0,00
Sour
ce:
own
rese
arch

REDETE – ECONOMIC DEVELOPMENT AND ENTEREPRENEURSHIP IN TRANSITION ECONOMIES
888
Existing researches show that entrepreneurship is primarily considered as a male activity. Data from this research also favor this fact, as most participants from Croatia (66,67% male and 68,29% female) believe that their society perceives entrepreneurship exclusively as male activity. The biggest part of Bosnian and Herzegovinian female participants (48,83%) also agrees that entrepreneurship is considered as a male activity in their society, while biggest part of male participants (45,45%) could not rate the statement.
By calculating chi square test ( 2x =2,305, v=2, p>0,05), the author did not find a significant difference between participants gender and their attitudes that their societies perceives entrepreneurship primarily as a male activity. Therefore, based on this calculation the null hypothesis was accepted that there are no significant differences between participant’s gender and their attitudes that their societies perceive entrepreneurship primarily as a male activity.
However, based on calculation chi square test ( 2x =7,607, v=2, p=0,022), there were found significant differences between participants’ countries of origin and their attitude that society they live in perceives entrepreneurship primarily as a male activity.
Women on managerial positions with managing style and behavior different from that stereotypically attributed to women are considered less feminine. (Eagly and Carly, 2003, pp. 807-834) Most participants from Bosnia and Herzegovina (63,6%) did not agree with the statement that female entrepreneurs were considered less feminine in their society. Largest part of female participants (39,53%) from Bosnia and Herzegovina was not able to provide opinion on whether their society sees a female entrepreneur as less feminine or not. However, while none of Bosnian male students agreed with the above mentioned statement, 25,58% female students did agree with it. The biggest part of the female participants (46,3%) as well as the biggest part of male participants (41,67%) in Croatia did not agree with the statement that women entrepreneurs in their society were perceived as less feminine.
As previously stated, researches show that women in medium and low developed countries start their entrepreneurial activities because of necessity, both because of long-term unemploy-ment or a lack of finances.359 However, only a small part of participants in this research agreed with the statement that women in their country practice entrepreneurship exclusively because of necessity. The largest part of male participants (45,45%) and female participants (59,52% in Bos-nia and Herzegovina did not agree with the statement that women in their country were engaged in entrepreneurship exclusively because of necessity. In Croatia the largest part of female (48,78%) and male participants (66,67%) were not able to rate if women in their country were engaged in entrepreneurship exclusively because of necessity.
Entrepreneurs are in many cases considered successful exclusively because of bribe and corruption. (Leburić and Krneta, 2004, p.78) Despite this, participants see an entrepreneur as a positive example of someone who survives by its own hard work. Most participants from Bosnia and Herzegovina (55,81% women and 72,73 men) think of female entrepreneurs as an example of person who survive in their society by its own hard work. In Croatia, however, the situation is different. While 60,98 female participants agreed with this statement, only 25% of male participants had the same opinion. It is important to point out that a bigger part of participants (91,66%) from Croatia agreed with the statement that a man is a positive example than those who agreed that woman is a positive example.
Chi square testing ( 2x =7,545 v= 2 p<0,05) made possible the conclusion that there were significant differences between the gender of participants and their attitudes on perception of wo-man entrepreneurs in their societies. Based on this calculation, the author accepted the alternative hypothesis according to which there were significant differences between participant’s gender and their perception of female entrepreneurs.
359 Report on Women and Entrepreneurship Although 2007, Global Entrepreneurship Monitor,
http://www.gemconsortium.org/, 14.05.2012.

REDETE – ECONOMIC DEVELOPMENT AND ENTEREPRENEURSHIP IN TRANSITION ECONOMIES
889
Despite the fact that the Government in Croatia legally encourages paternal leave for man, a small number of them really use this opportunity is small, mainly because baby care is seen as primarily female work. The biggest part of women from Bosnia and Herzegovina (55,81%) and most women from Croatia (63,64%) agreed that society they lived in perceived a man having paternal leave as less masculine. However, the biggest parts of men (Bosnia and Herzegovina 63,6% and Croatia 41,67%) were not able to rate how their societies saw such man.
Women who start entrepreneurial activities lack family and society support.360 Because of risks it implies, family members are skeptical towards it, especially if the entrepreneur is a woman. The biggest part of women from Bosnia and Herzegovina (41,86%) and Croatia (41,66%) agreed with the statement that women starting an enterprise lack family and society support. However, most men from both countries (Bosnia and Herzegovina with 63,6% and Croatia with 41,67% ) were not able to define the state of family and society support that women entrepreneurs get.
5. Conclusion
In order to strengthen the national economy, countries should promote entrepreneurial activity among its population. For a larger involvement of individuals in an entrepreneurial activity it is important to develop an entrepreneurial climate in the society. The majority of respondents in both countries (in Bosnia and Herzegovina 61,11% and Croatia 69,23%) think that in their countries do not dominate an entrepreneurial climate. They cannot assess whether there are legally regulated all important issues relating to the establishment and operation of enterprises. The reputation of entrepreneurs in society is also very for entrepreneurship development. Frequently entrepreneurs are seen as people who have succeeded with the help of bribery and corruption. But, results of this study have shown that the majority of respondents see an entrepreneur as a positive example of a person who is able to secure their existence with their own efforts and work.
In terms of programs for entrepreneurship development, most of Croatian respondents reported that in their country there are programs for entrepreneurship development, while the majority of respondents from Bosnia and Herzegovina consider that there is a lack of such programs in their country. A larger participation of women in entrepreneurship requires from the government to develop programs designed primarily to female entrepreneurs. Majority of respondents in this study regardless of gender and country from which they come from, declared that they could not assess whether their country is developing programs for the development of female entrepreneu-rship.
As it has been mentioned before, quite often, particularly in traditional and patriarchal socie-ties, entrepreneurship is primarily seen as an exclusively male activity. Based on the calculation of a chi square test there were no significant differences between the gender of the respondents and their attitude that entrepreneurship is primarily perceived as a male activity in the society in which they live in. Based on the above mentioned test, the hypothesis that there is no significant differ-rence between the gender of the respondents and their attitude that entrepreneurship is primarily seen as male activity in the society in which they live was accepted. But based on a calculation of a chi square test there was a significant difference between the country from which the responden-ts come from and their attitude that in the society in which they live entrepreneurship is primarily seen as a masculine activity. The majority of male respondents (66.67%) and the majority of fe-male respondents (68.29%) from Croatia considered that in their society entrepreneurship is perceived solely as a masculine activity. In Bosnia and Herzegovina, the largest proportion of female respondents (48.83%) disagreed with the statement that entrepreneurship is considered as a
360 Report on Women and Entrepreneurship Although 2007., Global Entrepreneurship Monitor,
http://www.gemconsortium.org/, 22.04.2012.

REDETE – ECONOMIC DEVELOPMENT AND ENTEREPRENEURSHIP IN TRANSITION ECONOMIES
890
male activity in their society, while the largest proportion of male respondents (45.45%) were not able to evaluate this statement.
Testing the differences with a chi square test there was concluded that there was a significant difference between the gender of the respondents and their attitude toward female entrepreneurs in the society in which they live. Based on this test the hypothesis that there are significant differen-ces between gender of the respondents and perceptions of the female entrepreneurs was accepted. The majority of the respondents from Bosnia and Herzegovina, regardless of gender (55.81% women and 72.73% men) considered that in their society female entrepreneurs are positive exam-ples of people who ensure existence with the help of their own hard work. The situation in Croatia differs a little. While 60.98% of female respondents agreed with the statement, only 25% of the male respondents agreed with the same statement.
It is necessary to make efforts on national and local levels, in order to create an entrepreneurial climate in the Croatian and Bosnian society as female entrepreneurs are still the minority in these societies. Within these efforts it will be necessary to encourage and develop an entrepreneurial spirit starting from an early age. Besides it is necessary to facilitate the establishment and opera-tions of the enterprises themselves. For entrepreneurship development it is necessary to provide the required entrepreneurial infrastructure, institutions for providing support to entrepreneurs, and it is also necessary to ensure financial and non-financial programs to encourage entrepreneurship. For female entrepreneurs it is especially important to develop different levels of social support (kindergartens, schools with extended day programs, retirement homes) that will facilitate harmonizing of their private and professional life. Starting a business is an eqaul right for all members of the population, regardless of gender, racial, ethnic, religion or any other category, and this is the way that entrepreneurship should be promoted in society.
Reference list
1. Buble, M., Kružić, D. (2006) Poduzetništvo realnost, sadašnjost i izazov budućnosti. 2. Zagreb: RriF- plus d.o.o. za nakladništvo i poslovne usluge 3. Čučković, N., Bartlett, W. (2007). Entrepreneurhip and Competitivness: The 4. Europeanisation of Small and Medium- sized Enterprise Policy in Croatia. Southeast 5. European and Black Sea Studies. Vol. 7(1), pp. 37–56 6. Çaliyurt, K. T. (2011.) Importance of Financial Management Knowledge in Small and 7. Medium Enterprises 8. (SMEs) Managing by Women. Trakya Üniversitesi Sosyal Bilimler Dergisi. Vol. 2 (13), pp.
327-354 9. Eagly, A. H., Carli, L.L. (2003.) The female leadership advantage: An evaluation of the 10. evidence. The Leadership Quarterly. Vol. 14, pp. 807–834 11. Glas žena poduzetnica u Bosni i Hercegovini, 2008., MI- BOSPO, http://www.mi 12. bospo.org/Dokumenti/article/154/Glas%20zena%20poduzetnica%20BiH.PDF, 13. (Accessed 22.04.2012.) 14. Leburić, A., Krneta, M. (2004). Profil poduzetnika u Hrvatskoj. Socio- ekonomsko 15. istraživanje 2003. Split: Naklada Bošković 16. Pavić, Željko (2001). Poduzetništvo mladih i nova ekonomija. Ekonomski vjesnik. Vol. 17. No. 1-2, pp. 85- 93 18. Projekt „Razvoj malog i srednjeg poduzetništva Federacije Bosne i Hercegovine“, 2008., 19. Federalno Ministarstvo razvoja, poduzetništva i obrta, 20. http://www.fmrpo.gov.ba/ba/projekti, (Accessed 04.04.2012.) 21. Puljiz, V. (2003.) Socijalna prava i socijalni razvoj Republike Hrvatske. Revija za socijalnu
politiku. 22. Vol.11(1), pp. 3-20 23. Report on Women and Entrepreneurship Although 2007, Global Entrepreneurship

REDETE – ECONOMIC DEVELOPMENT AND ENTEREPRENEURSHIP IN TRANSITION ECONOMIES
891
24. Monitor, http://www.gemconsortium.org/, 14.05.2012. 25. Statistički ljetopis Republike Hrvatske 2011., 2011., Zagreb: Državni zavod za statistiku 26. Republike Hrvatske, http://www.dzs.hr/Hrv_Eng/ljetopis/2011/SLJH2011.pdf 27. (Accessed 04.04.2012.) 28. Strategiji razvoja ženskog poduzetništva u Republici Hrvatskoj, 2009., Zagreb: 29. Ministarstvo gospodarstva, rada i poduzetništva, http://www.ured 30. ravnopravnost.hr/site/preuzimanje/dokumenti/nac_strat/strategija-poduzet-2010 31. 2013.pdf, (Accessed 24.01.2012.) 32. Sunajko, G. ur. (2011). Ekonomski leksikon. Zagreb: Leksikografski zavod Miroslav 33. Krleža i Masmedia 34. Women's Economic Empowermwnt , 2011, OECD, 35. http://www.oecd.org/dataoecd/50/60/47561694.pdf, (Accessed 01.04.2012.) 36. http://definitions.uslegal.com/w/women-entrepreneur.s/, (Accessed 04.04.2012.) 37. http://www.fmrpo.gov.ba/ba/stranica/view/poticaji-2011, (Accessed 23.04.2012.)

REDETE – ECONOMIC DEVELOPMENT AND ENTEREPRENEURSHIP IN TRANSITION ECONOMIES
892
PROMOTION IN FUNCTION OF STRENGTHENING COMPETITIVE ADVANTAGES AND SUSTAINABLE
DEVELOPMENT OF RURAL ISTRIA
Danijel DRPIĆ361 Vedran MILOJICA362
Abstract
Promotion of a tourist product of rural areas represents the direct contact of a rural tourism agent with a tourist market. Creating active and well designed promotion, and using modern marketing tools in forming marketing mix of rural tourism of a certain area will enable su-ccessful (re)positioning of a tourist offer and revitalisation of rural areas on the tourist market as ecologicaly preserved areas which enable potential users direct contact with nature and tradition. The Republic of Croatia has great potential in rural tourism development, which is unsufficiently used and tourist valorised, which is going to be changed through application of active and directed promotion and compliant marketing mix on the level of a whole tourist offer of a country. Since Istrian county was the first on the area of the Republic of Croatia to develop offer of rural tourism, further promotion guidelines of rural tourism of Istria as a leading rural tourist region will be given in the paper, which will help economic and socio-demographic renewal of rural areas of Croatia and Istria. Promotion has to be created in the way to present to the potential guests all the advantages of a rural tourist destination of Croatia and Istria compared to the global competition. Promotional activities have to be organised in the manner which ensures economic cost-effectiveness of a rural tourist destination's product. All interested parties in a rural tourist destination local community, managers, politicians, experts) need to be included in the creation and promotion of a tourist product. A possible project of marketing repositioning of rural Istria will be presented in the paper, as the most successful region of rural tourism of Croatia and the Mediterranean. The same will be based on SWOT analysis of all factors which have direct influence on the development of a successful tourist product. Mentioned proposition of the project Istria-Green Heart of Croatia will have for a goal to promote Istria as a tourist destination of sustainable tourism, excellence, originality and ecological awareness of all participants in tourist destinations of rural Istria. The purpose of creating previously mentioned project is to enable strengthening and directing all promotion activities of management in the destination towards activities which will ensure strengthening of total comparative advantages of rural Istria in relation to the global tourist competition and ensure permanent sustainable development of rural areas, which positive influences will be presented in the Porter´s Diamond of competitive advantages, and through display of possible implementation activities.
Keywords: promotion, rural area, rural tourism of the Republic of Croatia, Istrian County, sustainble development
361 Privredna Banka Zagreb, Rijeka, Croatia, e-mail: [email protected] 362 Rijeka, Primorsko-goranska County, Croatia, e-mail: [email protected]

REDETE – ECONOMIC DEVELOPMENT AND ENTEREPRENEURSHIP IN TRANSITION ECONOMIES
893
Introduction
Modern tourists are searching for a getaway from everyday life, and from the accelerated and stressful life in urban areas. Croatian rural areas offer them quite the opposite. These areas have been ecologically preserved, have a rich natural resource basis, and significant potentials for sus-tainable tourism development. In order to enable sustainable rural tourism development in Croatia, it is necessary to create promotional activities which will contribute to improved and mo-re successful repositioning of the Croatian and Istrian rural offer on the European and internatio-nal tourist market. Rural Croatia and Istria has to provide new guidelines for sustainble Croatian and Istrian tourism development. While Croatian coastal areas were devastated by excessive urbanisation, and the tourist product is in a late or terminal stage, rural tourism development in rural areas (but also in the inland of Croatian islands and the Istrian peninsula as an example of successful coexistence of mass and selective tourism) offer the possibility of creating a new tourist brand which positions the Republic of Croatia on the tourist market in ecologically aware destinations which value the principles of sustainable development, tradition and originality. The objective of the paper is to point out the necessity to create a promotional mix of rural tourist destinations, while the purpose of the paper is to raise the awareness of Croatian tourism agents on the necessity for creating a new marketing strategy which will be based on sustainble development, on the blue colour of the sea, the green of the forests and the unique tradition of rural Croatia.
Rural Tourism as an Agent of Revitalisation of Croatian Rural Areas
Rural tourism in Croatia has great development posibilities. According to the OECD criteria, the Republic of Croatia disposes with 51.872 km², or 91,6% of rural areas (including predominan-tly and significantly rural areas), and in this area there are 6.001 settlements (88,7% of the total number), and 2.110.988 inhabitants (47,66%) (Ministry of agriculture, fishery and rural develop-ment of he Republic of Croatia (2007). Strategy of rural development of Croatia, (2012.09.10.), p.8 Retrieved from http://www.azrri.hr/fileadmin/dokumenti-download/STRATEGIJA_RR_-2008-2013.pdf) in rural areas. In the past (especially after the world economic crisis in the 1930s, and between and after the two world wars), rural area was subject to significant depopulation, stagnation and degradation.
Kušen states that lagging behind of the Croatian rural tourism is caused by political legacy and propietary agricultural legacy, as well as earlier indifference of the agricultural sector for develop-ment of rural areas and this type of tourism. Furthermore, the author points out that, in the scope of the preparation Croatia made in order to enter the EU, rural areas became the centre of atten-tion, as well as the process of enlargement of family country farms, which is a basic pre-condition for rural tourism development. (Kušen, 2006, p.188) Sustainable tourism development, which manages rural resources, provides the opportunity for the revival of these areas, which become an oasis of a different, original and innovative tourist product. The goal is to enable the development of rural areas through ensuring economic prosperity, quality of life and satisfaction of local community. This very depopulation which occured during the past century enabled preservation of unique comparative advantages in the rural areas in comparison with other tourist destinations. Spatial resources were preserved, the area remained traditional, preserved its rural-traditional architecture and originality, while competitive mass tourism destinations have lost all the precon-ditions for originality and became, in many ways, unified and impersonal; consequently, these destinations have become less interesting for modern tourists. In the redesigning of the tourist of-fer in Croatian rural areas, it is necessary to devote special attention to quality promotional activities. Thus, it is necessary to create a promotional mix which will enable "meeting" of the

REDETE – ECONOMIC DEVELOPMENT AND ENTEREPRENEURSHIP IN TRANSITION ECONOMIES
894
offer on one side (country family farms (TCFF), agrotourism, rural eco-hotels and restaurants), with the demand on the other side - tourists. Modern tourists want to spend their vacation in a different environment; they need the change which will provide them an (active) vacation, and distance from stressful everyday life. This is exactly what rural tourism is offering.
Rural destinations are mostly visited by middle-aged guests, usually with higher income, who are in many ways separated from nature and the environment because of their business activities. The following picture presents the SWOT analysis of Croatian rural tourism.
Table 1: SWOT Analysis of Croatian Rural Tourism (Source: Authors' analysis)
STRENGHTS WEAKNESSES
Connectivity, traffic availability Defficiency of educated human resources
Convenient geographical position – vicinity of emitivemarkets
Lack of co-operation between private and educational sector
Adequate climate Quality of the offer
Quite preserved traditional architecture Quality vs. profit
Traditional way of life (fishery, grape-growing, olive-growing, cattle-breeding)
Non-existence of quality promotional strategies
Preserved natural resources There are no quality projects for development of the additional offer
Rich traditional heritage (intangible and tangible – musicinstruments, dance, melodies)
Insufficient number of Tourist Country Farms
OPPORTUNITIES THREATS
Redesign of additional tourist infrastructure in the ruralareas (walkways, cycle tracks, walking trails…)
Tourism is threatened by global crises (wars, financial crisis)
Organisation of the points of interest throughout the year Non-stimulative legislature, bureaucracy and corruption
Branding of the offer Uncontrolled appartment building
Possibility of stimulation for using traditional architectureelements on houses
Insufficient interest of the government
Theme bars and gastronomy Easy access to competitive destinations
Authentic offer Strong and developed competition
Stimulations for new products, investments…. Pollution of water, air, rivers
Strengthening - upgrading the programme of the Ministry ofTourism "Zelena Brazda"
Pre-accesion and cohesion funds of the EU
Improvement of marketing and promotion
Introduction of legislation of higher quality forrural tourismaccomodation offer – qualitative improvement
From the SWOT analysis above it is visible that the Republic of Croatia has quite preserved
natural resources, and its natural, cultural and traditional richness attracts the tourists. The Repu-blic of Croatia has a very favourable geographical position, and is easily accessible from the emi-tive tourist markets. A disadvantage and a threat to further development and improvement of the Croatian tourist offer is the fact that specific quality of the selective tourist offer and rural tourism has not been recognised. It is necessary to synchronise the needs of the labour market with the educational structure which the education system sends to the market. Furthermore, it is necessary to ensure additional quality standards through the "value for money" principle which will perma-nently distinguish Croatia in relation to its strong competition in this part of the tourist offer. Quality development, marketing and promotional strategy of Croatian rural tourism will certainly contribute to this goal.
Croatian rural tourism development has to be encouraged through the already existing prog-rammmes of the Croatian Ministry of Tourism, "Zelena Brazda" - a country tourism financing programme called "The Development of Country Tourism" (Ministry of tourism of the Republic of Croatia (2009). Programme of financing country tourism, (2012.09.10.) Retrived from

REDETE – ECONOMIC DEVELOPMENT AND ENTEREPRENEURSHIP IN TRANSITION ECONOMIES
895
http://www.mint.hr/default.aspx?id=6548). It enriched the tourist offer on country farms. From 2008 to 2010, 46 loans were granted, and funds from 10.000,00 to 300.000,00 € are available during the period of 15 years, including with the first grace year, with an interest rate of 8%, while the state finances a part of the interest rate of 6%, so that the final user pays only 2% of the interest rate. It is necessary to continuously complement the programme in the way that permane-nt support is ensured to the users throughout the duration period of the project, and relatively low interest of the citizens is the indicator that it is necessary to create more agressive marketing app-roach, even in this field.
According to the Contract about accession of the Republic of Croatia to the European Union (EC and Goverment of the Republic of Croatia (2009). Contract about accession of the Republic of Croatia to the European Union working text of translation, (2011.09.23.) Retrieved from http://www.vlada.hr/hr/naslovnica/novosti_i_najave/2011/rujan/ugovor_o_pristupanju_rh_eu) the Republic of Croatia will, from the day of its accession to the European Union, have at its disposal significant funds for rural development. For example, for the year 2013, the amount of 27.700.000.00 € will be at its disposal, so it is necessary to ensure significant support for the fund users, and for the interested entrepreneurs so that available assets would be used to the greatest possible extent. It is necessary to include more actively banks, HABOR, etc., in the projects of stimulation of sustainble rural tourism development.
Promotional Activities in Croatian Rural Areas with special review on Istrian County
The purpose of promotion of a sustainble rural tourism destination as a tourist offer agent in a rural area is to connect them with the target market-tourists. Thus, promotion as a component of rural tourist destination marketing presents a rural destination product on the market and stimulates the potential guests to buy it. The goal of an effective promotion is to expand the market of the rural tourist destination's agents (adapted according to Berc Radišić, 2005, p.69). Promotion of a rural tourist destination is conducted through: marketing, personal sales, public relations of the rural destination, and through measures for sales improvement. In order to conduct these activities, it is necessary to ensure a quality rural tourist destination product and marketing.
In order to successfully promote a rural tourist destination product, it is necessary to create a total tourist destination development and marketing strategy during the designing of such a product. In this process, it is necessary to determine what we want to achieve by the rural tourism offer, how do we want to achieve the set goals, and in which period of time.
In this process, it is necessary to take into account the possibility of commercialisation of a rural tourist destination product, but also to carefully select the participants in this offer. In order for a rural tourist product to be complete, it is necessary to ensure destination management support on all levels, and raise the awareness of the entire local community of the importance of ensuring sustainable development of a rural tourist destination, through re-designing of a product which offers specific characteristics, innovativeness and originality, and is, in that way, different from the others on the tourist market. A rural tourist destination product implies the totallity of activities of the offer agents in a tourist destination (ideas, services, merchandise). This may include cultural events (grape picking, picking of seasonal fruit, etc.), accommodation facilities (rural eco-hotel, tourist country farms, etc), natural attractions of the rural landscape, and others.
Rural tourist offer marketing has to ensure connection of the rural tourist destination offer with the market. Connection will be achieved through creation of a marketing mix by a combination of various methods used by the destination in order to position itself on the market. Marketing mix of a rural tourist destination can be determined through the 4P form (product, price, place, promotion). Thus, a rural tourist destination product has to have different assortments and a carefully designed set of policies for its constant improvement, and permanent market orientation.

REDETE – ECONOMIC DEVELOPMENT AND ENTEREPRENEURSHIP IN TRANSITION ECONOMIES
896
If we want to ensure strong positioning of the Croatian and Istrian rural offer, we have to take into account strong competition on the market. Croatia and Istrian region, unfortunately, lags be-hind in the development of all rural tourism settings in comparison with the neighbouring coun-tries. This is indicated by the fact that, even though the number of tourist family farms has signi-ficantly increased in Croatia in the past few years. In 1998, there were 32 tourist country family farms in Croatia, and in 2008 there were 360. As a comparison we can mention neighbouring Slovenia where in year 2009, 630 tourist family farms were noted (Združenje turističnih kmetij Slovenije (n.d.) Predstavitev združenja (2012.09.15) Retrived from http://www.turisticnek-metije.si/predstavitev-zdruzenja), which indicates to the fact that this segment of tourist offer in Croatia is still unsufficiently valorised.
Thus, in the process of forming the price of a product, the fact has to be taken into account that it has to be created in the way to primarily ensure competitiveness of the Croatian offer on the market. The price of a product has to match the "value for money" system; it can be a strong stimulation for tourists to visit a rural tourist destination, but it can also be demotivating. So, the price of a product has to be competitive and acceptable to the tourists, and it has to provide economic profit for the destination. Creating successful marketing strategy is closely related with promotion activities which have to inform potential users about the rural tourist destination produ-ct, but it also has to persuade them to buy this product. Since Istrian County is the most successful croatian region in previous development of rural tourism with the product which in the near future can reach the maturity stage, and decrease of the share on the tourist market, in the paper follows the proposition of marketing strategy on the example Istria-Green Heart of Croatia, with the goal of strengthening and directing total promotion of rural Istria, pointing out its particularities in relation to the global competition, and keeping product of rural Istria in the phase of growth and increasing share on the tourist market.
An Example of Product Promotion: Istria - Green Heart of Croatia
Istrian County is the most developed region of Croatian rural tourism; thus, the example of promotion of the rural product called «Istria-Green Heart of Croatia» is described in the paper. According to the OECD criteria, Istra classifies into predominatly rural areas (206.344 km2 or 13,34% of the Croatian territory) (Ministry of agriculture, fishery and rural development of the Republic of Croatia (2007). Strategy of rural development of Croatia, (2012.09.10.), p.8 Retrieved from http://www.azrri.hr/fileadmin/dokumenti-download/STRATEGIJA_RR_2008-2013.pdf). According to data from Ruralis (Ruralis Consortium, 2012) 81,6% of territory of the Istrian County consists of rural areas, in which 81,9% of the settlements is located, inhabited by 36,3% of the population of the Istrian County. According to data for 2010, rural tourism makes 1,6% of total tourism in Istria. The average stay of guests in Istrian rural tourism is 6,2 days, while the average occupancy of capacities is 91 days. As for the national structure, 65% of tourists come from Germany, 10% from Great Britain, 10% from Austria, 7% from the Netherlands, 5% from Slovenia, 4% from France, and only 1% from Italy and other countries. As sales channels of the Istrian rural tourist offer, agencies and touroperators participate with the share of 80%, followed by the Internet with 10%, brochures and catalogues with 3%, and other forms of promotion (cover stories, advertising in specialised tour guides with 7%.) - Table 2

REDETE – ECONOMIC DEVELOPMENT AND ENTEREPRENEURSHIP IN TRANSITION ECONOMIES
897
Table 2: The Number of Tourists, Realised Overnights and Realised Income from Rural Tourism in the Istra County from 2008 to 2011.
(Source: Ruralis, E-mail received on: 11/01/12 and 22/02/2012.)
In the year 2008, the number of tourists in the rural tourism of Istria amounted 15.627, who realised the total of 111.350 overnights, and a total of 5,1 million euros was recorded. In 2009, the number of tourists and overnights increased by 12%; namely, 17.502 tourists and 124.712 of overnights, while the income was twice as higher than the increased number of tourists, i.e. the realised number of overnights amounts 6,2 million euros, which is an increase of 21,57%. In the year 2010, rural tourism in Istria accommodated 18.727 tourists who realised 133.441 overnights and 6,7 million euros. The increase in the number of tourists and overnigths in the year 2010 in relation to 2009 amounted 6,99%, and 8.06% in relation to income. In 2011, there were 20.037 visitors who realised the total of 142.781 overnights, (growth of 6,99 %) while the average stay of tourists in rural Istria amounted 7.13 days. Decrease of income is a bit higher, and amounts 7.3 billion of euros or 8.96% more in relation to the year 2010, which indicates on changes in offer quality, but also on adapting of pricing policy (value for money) as an important segment of designing promotion and marketing activities.The above-mentioned data indicate attractiveness of the Istrian rural area's product, which can be developed even more through by means of the right promotion and marketing strategy. According to Ruralis' data - consortium of agrotourism and Istrian rural tourism for 2008, 81% of registered tourist family farms offer food services, and 59% offers wine tasting. Of the total number of overnights on the country farms, 85% of the total number of tourist overnights and arrivals to Croatian rural tourism facilities are situated in the Istrian County, while 89% of the total number of rural tourism guests are foreign guests, and only 11% domestic guests. In modern European rural tourist destinations, the situation is reversed. In other countries, over 90% of the total number of visitors/overnights are domestic guests, while the total income of rural tourism in Croatia amounts over 4 million euros.
Table 3: Types of Accommodation and the Number of Beds in Rural Tourism of the County of Istria, in accordance with the RURALIS' marketing typology in 2011.
Types of accommodation (in accordance with the Ruralis' marketing typology)
Number of households
Number of beds
Number of beds /household
Agrotourism 58 254 4,38 Rural vacation house 322 2.359 7,33
Rural family hotel/boarding house 10 238 23,80 Rural b&b 23 211 9,17
Holiday on wine roads 5 22 4,40 "Stancija"363 2 16 8,00
Total 420 3.100 7,38 Source: Ruralis, data obtained via E-mail, received on: 11/01/12 and 22/02/2012.
363 Stancija - renewed and reconstructed old huge country rural farm with a goal of providing tourist services. See more to:
http://www.ruralis.hr/hr/standardi_klasifikacija_stancija.html
INDEKS
Indicators per year
2008 2009 2010 2011 2009/´08 2010/´09 2011/´10
Overnights 111.350 124.712 133.441 142.781 112,00 106,99 106,99
Tourists 15.627 17.502 18.727 20.037 111,99 106,99 106,99
Revenues (in mill. €)
5,1 6,2 6,7 7,3 121,57 108,06 108,96

REDETE – ECONOMIC DEVELOPMENT AND ENTEREPRENEURSHIP IN TRANSITION ECONOMIES
898
The table 3 shows the data about accomodation capacities in the area of rural Istria in year 2011. It is visible that the most represented accommodation facilities were rural vacation houses. On the rural area of Istria there are 322 vacation houses, or 76.66% of the total accommodation facilities, while the number of beds amounts 2.359, or 76.09% of total accommodation facilities. There are 58 tourist peasant farms (agrotourism) with 254 beds, 10 rural hotels/boarding houses with 238 beds, 23 rural B&B's with 211 beds. Very popular Holiday on wine roads is offered in five facilities, which have at their disposal 22 beds, while in the entire County of Istria there are only 2" stancije" with the total of 16 beds. Mentioned types of accomodation are designed consistently with marketing typology of the agency for the development of rural tourism of Istria-Ruralis.
Promotion of every product, and this is also true for tourism, is a demanding and long process in which methods which will transmit the desired message to the tourist destination guests have to be carefully selected. This will be achieved by a full-scale marketing strategy, in which promotion will have a central role. For example, Istria, as the most developed area of Croatian rural tourism, wants to promote its untouched rural areas and sustainble development in the inland of the peninsula. The subject of promotion is originality, patina of the past which can be felt, respectful relationship to nature, wisdom and persistance of Istrian workers. In order to achieve this goal, all methods of promotional activities (a promotion mix) will be used, such as promotion through the public media (local TV station, local daily newspapers, jumbo posters), promotion through the Tourist Board of the Istrian County and the Croatian Tourist Board, and through specialised touroperators, as well as through personal promotion which will be conducted on country farms - the hosts in the country farms located in the inland of Istria make Istria the most favourite green destination of this part of Europe through establishing close and sincere relation with the client, the guest of the destination. The guest is the target of promotional activities, the centre of interest. The advantages of public relations through engagement of PR agencies will be fully used, with the goal to achieve even more dynamic promotion of the product, and the direct contact with the tourist market will be achieved through interactive Internet service on which the visitors will receive all the information about the product Green Heart of Istria (the accommodation offer, gastro-enologic offer, posibilities of active involvement in the life of the rural destination, etc). Website design will be supported by the Tourist Board of the Istrian County, which actively promotes its «Blue and Green» development strategy. All the offerers in the mentioned product will use their common recognisable brand, and the concept of Rural Istria-Green Heart of Croatia will be the motto pointed out on all the related websites. All the promotional activities have to be unified within the marketing strategy; in this example, Istria's inland, and this marketing strategy has to lean on the marketing strategy of Istria and the Republic of Croatia. While designing promotion activities it is necessary to give special attention to the promotion of sustainable development, sustainable business, use of renewable energy sources and green technologies in the destination of rural tourism of Istria.
In order to make the right selection of the marketing strategy all important influences have to be taken into consideration – both external (economic, social, competitive...), and internal (cost structure, adequacy of managerial skills, financial resources...) factors, and SWOT analysis of the rural offer or Istria's inland should be conducted. (Table 4).

REDETE – ECONOMIC DEVELOPMENT AND ENTEREPRENEURSHIP IN TRANSITION ECONOMIES
899
Table 4. SWOT Analysis of the Rural Offer of Istria's Inland (Source: Authors´ Analysis)
STRENGTHS WEAKNESSES
Position in the heart of Istria Lack of educated human resources
Proximity of emitive tourist markets Lack of co-operation between the private and educational sector
Preserved traditional architecture of acropolic settlements ofIstria's inland
Quality of the offer
Traditional way of life Quality vs. profit
Preserved natural resources Non.exsistence of quality promotion strategies
Rich intangible traditional heritage - traditional musicalinstruments, costumes, dances
There are no quality projects for development of additional offer
Agency for Development of Rural Tourism of Istria – RuralisInsufficient grants for stimulation of rural tourism development inIstria
Existence of rural tourism standards (asparugus)
OPPORTUNITIES THREATS
Creation of additional tourist offer
Hunting tourism
Coordination of rural offer and health tourism
Creation of the brand «Istria - Green Heart of Croatia» Non-stimulating legislation, bureaucracy and corruption
Stimulations for new products, investments….Insufficient cooperation with the Agency for Rural Tourism of Istriaand Istria Tourist Board.
Pre-accession and cohesion funds of the EU Easy access to competitive destinations
Cross-border cooperation projects Strong and developed competition
Improvement of marketing and promotion Pollution of water, air
Non-existence of projects which could compete for the EU funds
Insufficient recognisability of the inland offer of Istria in relation tothe coastal destinations
Rural Istria is the area of preserved picturesque specific characteristics, and acropolic
settlements of Istria provide the possibility of panoramic vistas of the wider area. Rich gastronomic and enological offer provides great development possibilities for this type of tourism. The rural product of Istria's inland has to be closely connected to the health tourism offer in the valley of the Mirna River, as well with the truffles phenomenon. This part of Istria provides opportunities for development of hunting tourism, especially if the fact is taken into consideration that an autochtonous Croatian dog breed, istarski gonič lives in this area. The vicinity of emitive tourist markets, raised awareness and existence of the agency for development of rural tourism of Istria, Ruralis, provide the main advantages for development. Marketing strategy will be conducted on the principle of the 4P marketing mix, which also includes promotion - as the last component, but not the least. In the process of desiging a product, it is necessary to take into consideration its quality, interest for the product, legislation, etc., which do exist in the case of Istria's inland - people from neighbouring emitive countries have already been visiting picturesque towns in the inland of Istria, and this product will only complement this.
Everything mentioned above has to be offered at a price potential tourists will be willing to pay - the price will greatly determine the segment of desired guests in the rural areas of Istria (middle-aged, of higher purchasing power, nature lovers, etc). It is important to determine the promotion channels which will be used, as well as the promotion itself, as stated earlier.
All of this will lead to the creation of added value of the tourist product of Istria and
Croatia.

REDETE – ECONOMIC DEVELOPMENT AND ENTEREPRENEURSHIP IN TRANSITION ECONOMIES
900
Figure 1.: Promotion and Marketing Strategy of Product Development "Istria-Green Heart of Croatia" (Source : Authors' analysis)
Picture 1 presents the marketing strategy of the product "Istria-Green Heart of Croatia", as
well as the promotion mix whose objective is to place the product "Istria-Green Heart of Croatia", and the rural tourist destination Rural Istria, on the tourist market. As a product destination, the inland of Istria was chosen because this promotion mix can be applied on any area - town, municipality, group of settlements in Istria, but also in Croatia. Mentioned project can be upgraded in the way that it includes all interested experts from other areas, i.e. tourism, economics, geography, demography, sociology, etc., with which it would become an interdisciplinary project based on postulates of unique marketing mix. Introducing mentioned marketing strategy will have a positive effect on whole offer of rural Istria, on its competitive position on the tourist market and further sustainable tourism development, which will enable further growth of tourist product of rural Istria, by which the phase of decrease and obsoleteness of a tourist product will be delayed. Based on the previously mentioned, interdisciplinarity of mentioned approach is noticed.

REDETE – ECONOMIC DEVELOPMENT AND ENTEREPRENEURSHIP IN TRANSITION ECONOMIES
901
Figure 2: Porter's Diamond of Competitive Advantages of Joint Marketing and Development Strategy of Rural Tourism of the rural Istria
(Source: adapted according to: Alkier Radnić R., Milojica V., Drpić, D. (2012.) Management of Sustainable
Rural Tourism Development in the County of Istria, (2012.09.12) Retrived from: http://www.scientific-publications.net/download/economy-and-business-2012-3.pdf)
Design of the competitiveness diamond of rural Istria and strengthening of the rural tourism
offer has a goal to indicate on possible positive influences of application of programme Istria-Green Heart of Croatia on positioning of rural Istria as a destination of sustainable tourism, preserved nature and place of nice living. Besides on positioning on the tourist market, the mentioned project will enable certain economic and socio-demographic benefits for those, as a rule, weakly inhabited and economicly undeveloped areas. Thereby it needs to enable sustainable tourist development of the area, and disable possible negative impacts of tourist development on landscape and environment.This will be enabled through application of green technologies in business of all offer carriers, application of renewable energy sources, traditional way of production and food preparation, traditional architecture, and construction with natural materials, etc. Joint marketing and developmental strategy will enable stronger synergy between all offer carriers, who will on a unique way present the region of rural tourism, by which special attention must be given to the needs and interests of a modern tourist, and that is returning to nature, shift away from the stress of everyday life, feeling of affiliation and closesness with the host, while the price of the offer must match the offered product (achievement of value for money). The diamond of competitive advantages leads to promotion of all the Istrian strengths. This offer will, except for its own innovative solutions, be based on international experiences and world practice.
Following, a possible implementation plan of activities for the project Istria-green heart of
Croatia is presented.
Influence ofapplica tion ofproject Ist ria –Gr ee n hea rt of
Croat ia on com pet it ive
adva nta ge s ofr ur al Istr ia
Gov ernme nt ,Lo cal g ove rnment,
M a na ge ment of rura lto ur ist dest inat i on
A ge ncy for dev elo pme ntof rura l to ur ism of Istr ia
R ural is
Po ssib le o utputs –ac hi ev ei ng c om pet it iv e
a dva ntag es o f r ur alIstri a, enabl ing new
li fe c yc le o f a pro duct
of rur al Istri a
BUS INESS STR ATEG Y STR UCTUR E AN D R IVALERYJoint develo pmental and marketing stra tegy of a touristdes tination of rural touris m of Is tr ian county and co mpetit ionMutual cooperation of all offer carriers in rur al touristdes tination, use of their best links in busines s and m utual co ordination of activit iesBarriers for the entry and exit on the tourist m arket of rura ldes tination of IstriaMutual com petition betw een o ffer carriers
FACTO RS (IN PU TS)Natural resources (c lean air, water, fores ts , thesea), a ttractions (cultural-his torica l heritage, traditional architecture , na tural attractions ) Human, financia l and technological resources –use of so “green" technologijes and renewableenergy s ourcesInfrastructure in the des tination of rura l touris mof IstriaApplicatio n of high quality equippm ent inbus iness processes made of natura l m ateria ls
EXI STENC E O F RELATED A ND SUPPORTI NG IN DUS TRIESTour ist o ffer carriers of rural Is tria – res taurants, rura l hotels, tourist agenc ies of rural tour ism , Associatio n Rura lis, offerregarding cultivation and proces sing eco products on familyfarms, workshops of traditional c rafts, e tc. )Tour ists and vis itors of des tinations of rural tourism of IstriaJo int prom otion activities in prom otion of rural tourism of Istriathrough project Is tria –green heart of CroatiaPr omotio n of rural tourim of Is tria as a seppar ate segment of a total tourist product of Croatia,
CO ND ITIO NS O F D EMA ND IN RU RAL TOU RIS T DES TINATIO N O F ISTRI AStruc tureof touris t dem andGrow th of free tim e, ecolo gical awareness andfinancia l fundsIncr ease for specia l interests (se lective form s of offer –rural to urism ).Awar eness about the brand of a des tination of ruraltouris m of Istria and the necess ity of a m ore activeprom otionControl and standardization of quality of offer o f ruraltouris m of IstriaInterests and motivatio n o f touris ts

REDETE – ECONOMIC DEVELOPMENT AND ENTEREPRENEURSHIP IN TRANSITION ECONOMIES
902
Table 5: Possible implementation plan of activities for the project Istria-green heart of Croatia
ACTIVITIES/MEASURESENFORCER OF THE
ACTIVITIESTARGET GROUP DEADLINE
POSSIBLE FINANCIAL RESOURCES
TARGET PRIORITY
POTENTIONAL BUDGET IN EURO
Help in designing marketing strategy of an individual offer carrier
Tourist Board, Local government and self-
government, Ministry of tourism, interested scientific
institutions and institutes
Offer carriers ContinuouslyTourist Board, Ministry of tourism, community
Maximum 100.000,00
500.000,00
Project Green rural Eco Hotels of Istria/Croatia-branding, support to construction, establishing interest
Associations
Private Investors, Financial institutions
Visitors of a destination and
owners of new objects3 years
Croatian Bank for Reconstruction and Development, EU cohesion funds,
entrepreneurs, Ministry of Tourism, public-private partnership
Maximum
100.000,00
50.000,00
20.000,00
150.000,00
270.000,00
250.000,00
Tourist Board, Ministry of tourism, community
Making promotion flyers, brochures, internet websites, promotive shows
and spots
Ministry of tourism, Ruralis, specialised marketing agencies, interested scientific institutions
and institutes
Offer carriers, Local community
Ministry of tourism, Tourist Board,
community, PPP
Seminars/educations and workshops with the topic of promotion of rural
tourism of Istria - goals of promotion of rural tourism of Istria, particularities
of rural tourism, possibilities of developing a brand..
Ministry of tourism, experts in the area of rural tourism,
sustainable development and marketing
Offer carriers, Local community
Ministry of tourism, Tourist Board,
community, PPP
Continuously
Tourist Board, Ministry of tourism, community,
public-private partnership
Project rural villages of Istria
Tourist Board, Local government and self-
government, Ministry of tourism, interested scientific
institutions and institutes
Offer carriers, local community
HABOR, Cohesion funds of EU, entrepreneurs, Ministry of tourism,
public-private partnership
Brochures with informations about possibility of financing project of rural tourism and sustainable development
Business banks, HBOR, Local government, Ministry of
tourismOffer carriers
Ministry of tourism, HABOR, European Comission Office in
Croatia, business banks, tourist board
Free marketing for rural offer carriers
6 months – continuously
1 year
Continuously
1 year - continously
2 years
Designing and developing a Brand "Istria- green heart of Croatia"
Tourist Board, Local government and self-
government, Ministry of tourism, interested scientific
institutions and institutes
Offer carriers
Tourist Bord Offer carriers
Maximum
Maximum
Maximum
Maximum
Maximum
Maximum
(Source: Authors´ analysis )
The goal of previously presented implementation activities of this interdisciplinary project is
that in the realization of the project all interested participants are involved in the local rural community (population, entrepreneurs, experts, scientists) and widely interested public. All presented data is a subject to changes, dependingly on the duration of an individual activity, the way of conducting, and participants in the project.
Conclusion
Rural area of the Republic of Croatia and Istrian County are an endless source for sustainable development of Croatian tourism. Multiple positive effects will be achieved by its participation on the tourist market. First of all, economic-demographic-sociological rehabilitation will be enabled, and Croatian tourist offer will also be enriched. Croatia and Istrian county will be recognisable for its ecologically preserved resources, which provide the opportunity to be recognised as an eco-tourist destination on the European and world market. The promotion mix is of great importance

REDETE – ECONOMIC DEVELOPMENT AND ENTEREPRENEURSHIP IN TRANSITION ECONOMIES
903
for successful positioning of the rural tourist destination product on a tourist market. Well-selec-ted combination of promotional activities will achieve recognisibility of a rural tourism destina-tion on the tourist market, and the expected business success will be achieved. Promotional activi-ties will be successful if the product satisfies the demand of modern guests in terms service qua-lity, value for money, etc. It is also important to include all the interested parties in the rural tou-rist destination into promotion activities, and to encourage the use of modern promotion resources over the Internet. Successful implementation of promotional activities will enable achievement of competitive advantages on the European and world tourist market, as well as inclusion in Euro-pean tourist flows. Implementation of promotion activities in Istria through the product «Istria-Green Heart of Croatia» will achieve even greater recognisibility and specific characteristics of this greatest Croatian rural tourist destination, and the same promotion mix model and creation of the marketing strategy can be implemented in all other Croatian rural areas.
Bibliography:
1. Alkier Radnić R., Milojica V., Drpić, D. (2012.) Management of Sustainable Rural Tourism
Development in the County of Istria. http://www.scientific-publications.net/download/economy-and-business-2012-3.pdf (accessed 12.09.2012.)
2. Berc-Radišić, B. (2005). Promocija u hotelijerstvu, Opatija.Faculty of Tourism and Hospitality Management
3. Kušen, E. (2006). Hrvatski turizam: plavo, bijelo, zeleno: Ruralni turizam, Zagreb.Institute for Tourism
4. Ministry of agriculture, fishery and rural development of he Republic of Croatia (2007). Strategija ruralnog razvoja Hrvatske 2008-2013. http://www.azrri.hr/fileadmin/dokumenti-download/STRATEGIJA_RR_2008-2013.pdf (accessed 10.09.2012.).
5. Ministry of Tourism of the Republic of Croatia (2009). Programme of financing country tourism, http://www.mint.hr/default.aspx?id=6548 (accessed 10.09.2012.)
6. Senečić, J.(1998). Promocija u turizmu, Zagreb. Mikrorad 7. Združenje turističnih kmetij Slovenije. (n.d.). http://www.turisticnekmetije.si/predstavitev-
zdruzenja (accessed: 15.09.2012.)