Error Propagation in Cartographic Modelling Using Boolean Logic and Continuous Classification
Upload
khangminh22Category
view
0download
0
www.icc2013.org
th26 INTERNATIONAL CARTOGRAPHIC CONFERENCEAugust 25 – 30, 2013 • Dresden | Germany
INTERNATIONAL CARTOGRAPHIC EXHIBITION

th26 INTERNATIONAL CARTOGRAPHIC CONFERENCEAugust 25 – 30, 2013 • Dresden | Germany
INTERNATIONAL CARTOGRAPHIC EXHIBITION CATALOG


PREFACE
The International Cartographic Exhibition in Dresden is organised as part of the th26 International Cartographic Conference (ICC). All exhibits are displayed at the International
Congress Center from 25-30 August 2013. Within the exhibition various kinds of cartographic products are presented such as traditional paper maps, digital products, globes, atlases supplemented with physical reliefs, smell and tactile maps. Furthermore, a collection of nautical charts is exhibited in conjunction with the International Hydrographic Organization (IHO).
Descriptions of all exhibits were submitted to the local organising committee of the ICC by the National Committees and ICA-affiliated members for the production of this Exhibition Catalogue. For the first time this catalogue contains thumbnails added to the descriptions of the cartographic products. The exhibits are subdivided into five categories:
I. PAPER MAPSII. ATLASESIII. DIGITAL PRODUCTSIV. EDUCATIONAL CARTOGRAPHIC PRODUCTSV. OTHER CARTOGRAPHIC PRODUCTS (including globes and tactile maps)
Within each category the best products will be honoured by an international ICA jury presided by Dr. Corné van Elzakker.
The Local Organising Committee would like to thank all participating countries for contributing to this event displaying the international state-of-the-art in the world of cartography.
Dirk Burghardt, Nikolas Prechtel & Manfred BuchroithnerOrganisers of the International Cartographic Exhibition 2013
Preface
3

INDEX
ICC 2013 International Cartographic Exhibition
Algeria ...................................................................................................... 7Australia ...................................................................................................... 8Austria ..................................................................................................... 11Belgium ..................................................................................................... 13Bulgaria ..................................................................................................... 18Canada ..................................................................................................... 23Chile ..................................................................................................... 32China ..................................................................................................... 35Croatia ..................................................................................................... 39Czech Republic ..................................................................................................... 42Finland Cartographic Society of Finland .................................................... 52France ..................................................................................................... 57France IGN-France................................................................................... 63Germany ..................................................................................................... 67Greece ..................................................................................................... 75Hong Kong ..................................................................................................... 78Hungary ..................................................................................................... 81Islamic Republic of Iran ..................................................................................................... 86Ireland ..................................................................................................... 90Japan ..................................................................................................... 93Republic of Korea ..................................................................................................... 98Netherland ..................................................................................................... 99Netherland Faculty ITC, University of Twente ................................................. 104New Zealand ................................................................................................... 106Norway ................................................................................................... 108Poland ................................................................................................... 113Slovakia ................................................................................................... 117Slovenia ................................................................................................... 119Spain Spanish Society of Cartography (SECFT) ..................................... 125Spain National Geographic Institute of Spain........................................ 129Sweden ................................................................................................... 132Switzerland ................................................................................................... 137Turkey General Command of Mapping .................................................. 140Ukraine ................................................................................................... 142United Kingdom ................................................................................................... 147United Kingdom Ordnance Survey ........................................................................ 157USA ................................................................................................... 159USA U.S. Geological Survey................................................................ 167
IHO Chile........................................................................................... 168IHO Finland ....................................................................................... 169IHO France ........................................................................................ 170IHO Germany .................................................................................... 172IHO Mexico ....................................................................................... 175IHO Romania ..................................................................................... 176IHO Spain .......................................................................................... 177IHO Ukraine....................................................................................... 179IHO United Kingdom ......................................................................... 182
Index
5

OTHER CARTOGRAPHIC PRODUCTS
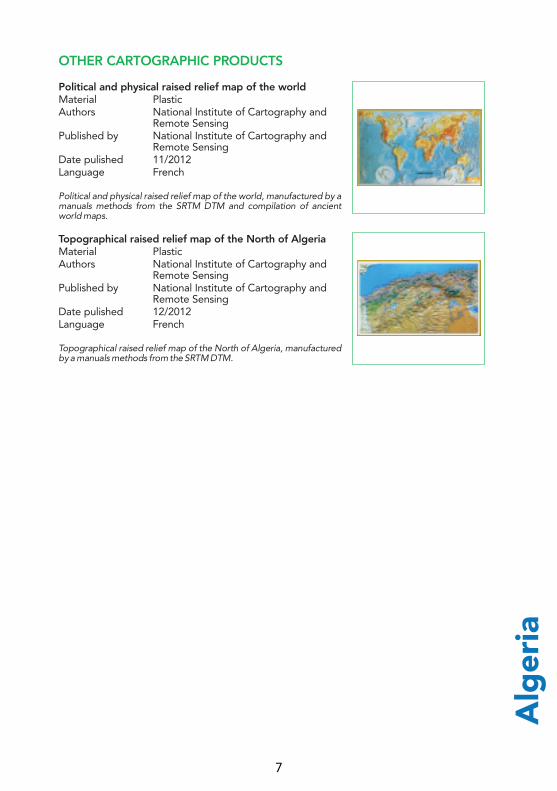
Political and physical raised relief map of the world Material PAuthors National Institute of Cartography and
Remote SensingPublished by National Institute of Cartography and
Remote SensingDate pulished 11/2012Language French
Political and physical raised relief map of the world, manufactured by a manuals methods from the SRTM DTM and compilation of ancient world maps.
Topographical raised relief map of the North of AlgeriaMaterial PlasticAuthors National Institute of Cartography and
Remote SensingPublished by National Institute of Cartography and
Remote SensingDate pulished 12/2012Language French
Topographical raised relief map of the North of Algeria, manufactured by a manuals methods from the SRTM DTM.
lastic
Alg
eria
7

MAPS
Kangaroo Island – Souvenir tourist map and guide (5th edition)Material PaperScale 1:200 000Dimensions 830 x 590 mmAuthors John FrithPublished by Flat Earth MappingDate pulished 01/2012Language English
The map is aimed primarily at tourists and visitors to Kangaroo Island who require an accurate, detailed map in order to navigate their way around the island to locate attractions and accommodation. The map also appeals to those wanting an attractive poster-style souvenir map for display, as evidenced by the large number of flat and laminated copies sold so far. Besides the clean yet detailed main map with numerous short paragraphs of information placed over it, the stand out feature of this map would be the hand-painted acrylic illustrations depicting the island’s wildlife, flora, natural features and landscapes.
Wilsons Promontory Outdoor Recreation GuideMaterial PaperScale 1:50 000Dimensions 1000 x 810 mmAuthors Glenn van der KnijffPublished by Spatial VisionDate pulished 12/2012Language English
The Wilsons Promontory ORG has been designed specifically for bushwalkers visiting this iconic National Park. The map is rich in detail, showing recreational facilities, walking tracks, walk distances, historical information and marine information. The reverse of the map contains a comprehensive about the park, covering the history and development, flora and fauna, accommodation options, plus detailed walk information, for those wishing to do a short beach stroll, a simple day walk or a more strenuous overnight walk. The Wilsons Promontory ORG is the first map to be presented in both a hardcopy printed map and a mobile application for iPhone.
Geotourism Map – Geological Sites of NSWMaterial PaperScale 1:1 515 151Dimensions 700 x 1010 mmAuthors Cartoscope Pty Ltd, compiled by Carrol
CummingsPublished by Cartoscope Pty LtdDate pulished 03/2013Language English
The Cartoscope Geotourism map of NSW focuses on geological sites across the state to capture interest and educate the public. Regional areas will benefit from tourism dollars spent locally by this new affluent niche market of Geotourists. Sites with heritage value as well as those with outright natural wonder have been selected. The sites are located by flags on the map to make them easy to find in the field and a short story is written about each on the reverse side of the sheet. There is an accompanying website www.geomaps.com.au which gives detailed information on each site.
Aus
tral
ia
8

Metallogenic Map of New South Wales 1:1 500 000Material PaperScale 1:500 000Dimensions 1152 x 840 mmAuthors Downes P.M., Blevin P.L., Reid W.J.,
Barnes R.G. & Forster D.B.Published by NSW Department of Trade and
Investment, Regional Infra-structure and Services
Date published 08/2011Language English
The Metallogenic Map of New South Walesshows the distribution of major NSW mineral deposits as key mineral systems identified in the new mineral systems classification scheme, and gives a useful overview of commodities and prospective areas of NSW. It is available in flat or folded formats.
Koonenberry Belt 1:250 000 solid geology maps (north map)Material Synthetic PaperScale 1:250 000Dimensions 896 x 840 mmAuthors Gilmore P.J., Greenfield J.E., Mills K.J.,
Musgrave R.M., Hegarty R.A., Brown R.E., Vickery N.M
Published by NSW Department of Trade and Investment, Regional Infrastructure and Services
Date pulished 12/ 2011Language English
The Koonenberry Belt 1:250 000 solid geology maps (north and south) provide an overview of the pre-Mesozoic geology, underlain by the first vertical derivative of Total Magnetic Intensity. The maps were compiled from 1:100 000 scale geological mapping and geophysical interpretation. The two maps are designed to complement each other. The northern map includes thumbnail images of mineral occurrences and potential mineral systems, depth to pre-Mesozoic basement, total magnetic intensity and isostatic residual gravity. The southern map includes unit descriptions, a simplified time-space plot for the Koonenberry Belt, and geophysically-modelled cross sections of pre-Quaternary geology.
Koonenberry Belt 1:250 000 solid geology maps (south map)Material Synthetic PaperScale 1:250 000Dimensions 896 x 1120 mmAuthors Gilmore P.J., Greenfield J.E., Mills K.J.,
Musgrave R.M., Hegarty R.A., Brown R.E., Vickery N.M.
Published by NSW Department of Trade and Investment, Regional Infrastructure and Services
Date pulished 12/2011Language English
The Koonenberry Belt 1:250 000 solid geology maps (north and south) provide an overview of the pre-Mesozoic geology, underlain by the first vertical derivative of Total Magnetic Intensity. The maps were compiled from 1:100 000 scale geological mapping and geophysical interpretation. The two maps are designed to complement each other. The northern map includes thumbnail images of mineral occurrences and potential mineral systems, depth to pre-Mesozoic basement, total magnetic intensity and isostatic residual gravity. The southern map includes unit descriptions, a simplified time-space plot for the Koonenberry Belt, and geophysically-modelled cross sections of pre-Quaternary geology.
Aus
tral
ia
9
ATLASES
EDUCATIONAL CARTOGRAPHIC PRODUCTS
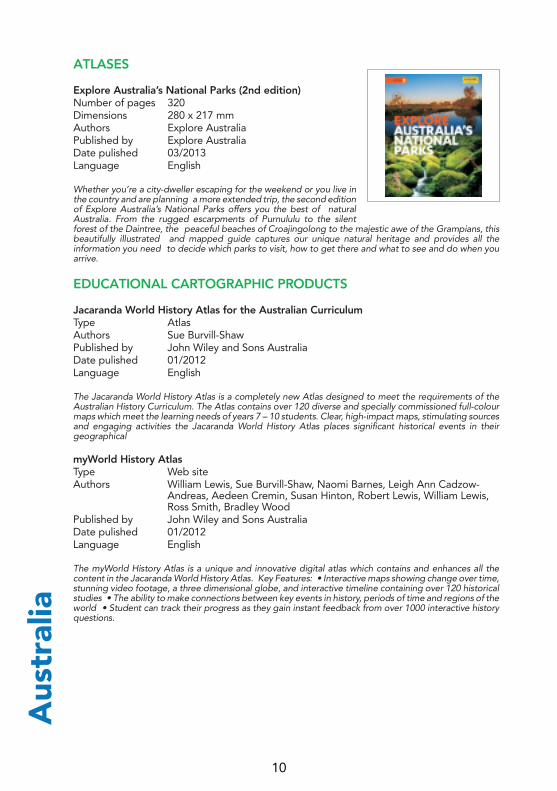
Explore Australia’s National Parks (2nd edition)Number of pages 320Dimensions 280 x 217 mmAuthors Explore AustraliaPublished by Explore AustraliaDate pulished 03/2013Language English
Whether you’re a city-dweller escaping for the weekend or you live in the country and are planning a more extended trip, the second edition of Explore Australia’s National Parks offers you the best of natural Australia. From the rugged escarpments of Purnululu to the silent forest of the Daintree, the peaceful beaches of Croajingolong to the majestic awe of the Grampians, this beautifully illustrated and mapped guide captures our unique natural heritage and provides all the information you need to decide which parks to visit, how to get there and what to see and do when you arrive.
Jacaranda World History Atlas for the Australian CurriculumType AtlasAuthors Sue Burvill-ShawPublished by John Wiley and Sons AustraliaDate pulished 01/2012Language English
The Jacaranda World History Atlas is a completely new Atlas designed to meet the requirements of the Australian History Curriculum. The Atlas contains over 120 diverse and specially commissioned full-colour maps which meet the learning needs of years 7 – 10 students. Clear, high-impact maps, stimulating sources and engaging activities the Jacaranda World History Atlas places significant historical events in their geographical
myWorld History AtlasType Web siteAuthors William Lewis, Sue Burvill-Shaw, Naomi Barnes, Leigh Ann Cadzow-
Andreas, Aedeen Cremin, Susan Hinton, Robert Lewis, William Lewis, Ross Smith, Bradley Wood
Published by John Wiley and Sons AustraliaDate pulished 01/2012Language English
The myWorld History Atlas is a unique and innovative digital atlas which contains and enhances all the content in the Jacaranda World History Atlas. Key Features: • Interactive maps showing change over time, stunning video footage, a three dimensional globe, and interactive timeline containing over 120 historical studies • The ability to make connections between key events in history, periods of time and regions of the world • Student can track their progress as they gain instant feedback from over 1000 interactive history questions.
Aus
tral
ia
10
Aus
tria
MAPS
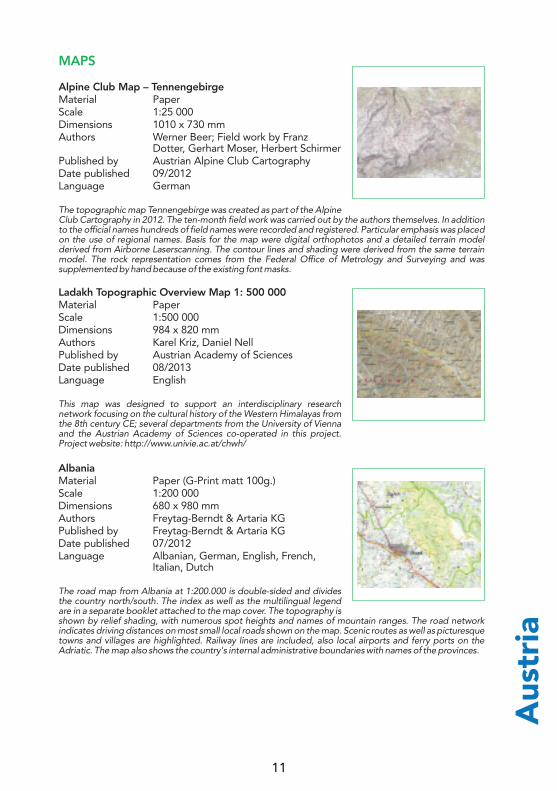
Alpine Club Map – TennengebirgeMaterial PaperScale 1:25 000Dimensions 1010 x 730 mmAuthors Werner Beer; Field work by Franz
Dotter, Gerhart Moser, Herbert SchirmerPublished by Austrian Alpine Club CartographyDate published 09/2012Language German
The topographic map Tennengebirge was created as part of the Alpine Club Cartography in 2012. The ten-month field work was carried out by the authors themselves. In addition to the official names hundreds of field names were recorded and registered. Particular emphasis was placed on the use of regional names. Basis for the map were digital orthophotos and a detailed terrain model derived from Airborne Laserscanning. The contour lines and shading were derived from the same terrain model. The rock representation comes from the Federal Office of Metrology and Surveying and was supplemented by hand because of the existing font masks.
Ladakh Topographic Overview Map 1: 500 000Material PaperScale 1:500 000Dimensions 984 x 820 mmAuthors Karel Kriz, Daniel NellPublished by Austrian Academy of SciencesDate published 08/2013Language English
This map was designed to support an interdisciplinary research network focusing on the cultural history of the Western Himalayas from the 8th century CE; several departments from the University of Vienna and the Austrian Academy of Sciences co-operated in this project. Project website: http://www.univie.ac.at/chwh/
AlbaniaMaterial Paper (G-Print matt 100g.)Scale 1:200 000Dimensions 680 x 980 mmAuthors Freytag-Berndt & Artaria KGPublished by Freytag-Berndt & Artaria KGDate published 07/2012Language Albanian, German, English, French,
Italian, Dutch
The road map from Albania at 1:200.000 is double-sided and divides the country north/south. The index as well as the multilingual legend are in a separate booklet attached to the map cover. The topography is shown by relief shading, with numerous spot heights and names of mountain ranges. The road network indicates driving distances on most small local roads shown on the map. Scenic routes as well as picturesque towns and villages are highlighted. Railway lines are included, also local airports and ferry ports on the Adriatic. The map also shows the country's internal administrative boundaries with names of the provinces.
11
Aus
tria
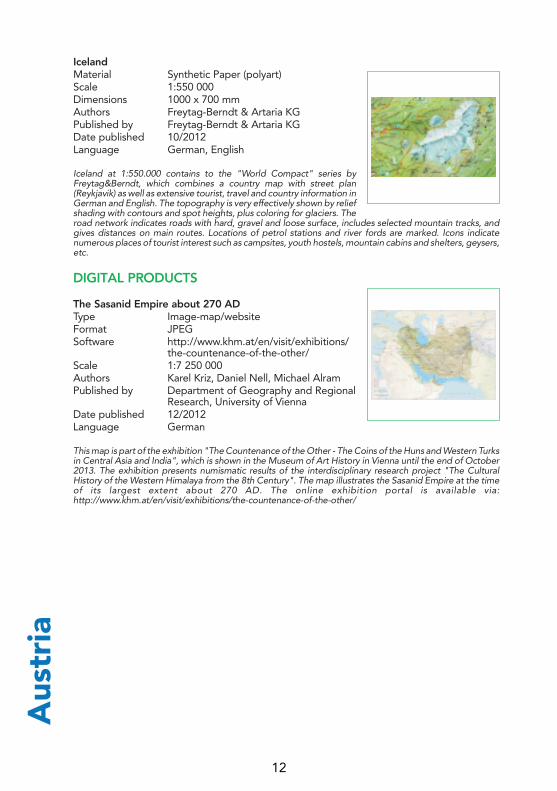
IcelandMaterial Synthetic Paper (polyart)Scale 1:550 000Dimensions 1000 x 700 mmAuthors Freytag-Berndt & Artaria KGPublished by Freytag-Berndt & Artaria KGDate published 10/2012Language German, English
Iceland at 1:550.000 contains to the "World Compact" series by Freytag&Berndt, which combines a country map with street plan (Reykjavik) as well as extensive tourist, travel and country information in German and English. The topography is very effectively shown by relief shading with contours and spot heights, plus coloring for glaciers. The road network indicates roads with hard, gravel and loose surface, includes selected mountain tracks, and gives distances on main routes. Locations of petrol stations and river fords are marked. Icons indicate numerous places of tourist interest such as campsites, youth hostels, mountain cabins and shelters, geysers, etc.
The Sasanid Empire about 270 ADType Image-map/websiteFormat JPEGSoftware http://www.khm.at/en/visit/exhibitions/
the-countenance-of-the-other/Scale 1:7 250 000Authors Karel Kriz, Daniel Nell, Michael AlramPublished by Department of Geography and Regional
Research, University of ViennaDate published 12/2012Language German
This map is part of the exhibition "The Countenance of the Other - The Coins of the Huns and Western Turks in Central Asia and India", which is shown in the Museum of Art History in Vienna until the end of October 2013. The exhibition presents numismatic results of the interdisciplinary research project "The Cultural History of the Western Himalaya from the 8th Century". The map illustrates the Sasanid Empire at the time of its largest extent about 270 AD. The online exhibition portal is available via: http://www.khm.at/en/visit/exhibitions/the-countenance-of-the-other/
DIGITAL PRODUCTS
12

Aus
tria
OTHER CARTOGRAPHIC PRODUCTS
The Habsburg Monarchy 1848-1918. Vol. 9: Social StructuresMaterial PaperAuthors Helmut RUMPLER, Martin SEGERPublished by Austrian Academy of SciencesDate published 01/2012Language German
This volume clarifies, supplements and offers additional argumentative support to the soon to be published volume on social structures of the Habsburg monarchy. The statistics derived from the population census of 1910, presenting 96 maps on different topics, give a good insight and are an incentive to carry out further studies. Austrian political districts and similar administrative units in Hungary are shown in the statistics. The following topics are taken into consideration: administrative organisation, ethnic groups, religious beliefs, demographic factors, employment, occupational type, agricultural diversity, land use, housing developments, household budgets, housing, system of education, deployment of the military, and the rail network. The centres and boundaries of social and economic development, as well as disparities, are demonstrated in the demographic and socio-economic features. All in all, these maps can be considered representative of the countries of the Habsburg monarchy a hundred years ago and are still influencing the present.
13
Bel
giu
mMAPS
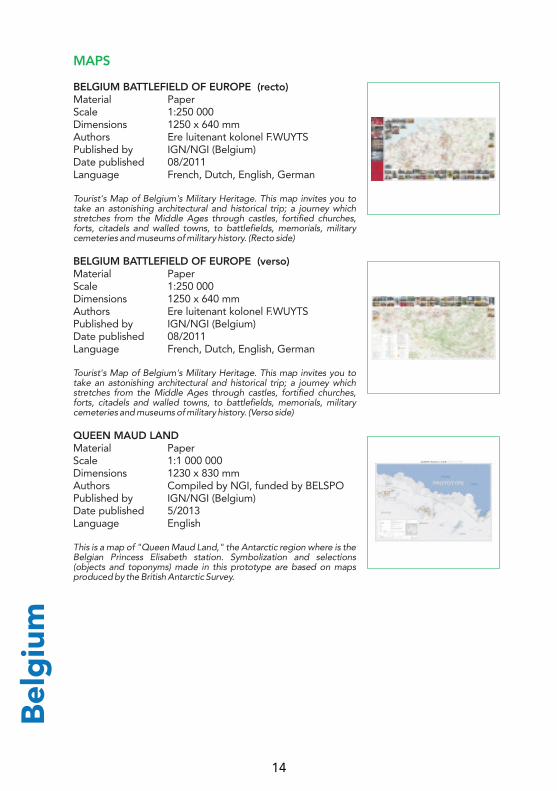
BELGIUM BATTLEFIELD OF EUROPE (recto)Material PaperScale 1:250 000Dimensions 1250 x 640 mmAuthors Ere luitenant kolonel F.WUYTSPublished by IGN/NGI (Belgium)Date published 08/2011Language French, Dutch, English, German
Tourist's Map of Belgium's Military Heritage. This map invites you to take an astonishing architectural and historical trip; a journey which stretches from the Middle Ages through castles, fortified churches, forts, citadels and walled towns, to battlefields, memorials, military cemeteries and museums of military history. (Recto side)
BELGIUM BATTLEFIELD OF EUROPE (verso)Material PaperScale 1:250 000Dimensions 1250 x 640 mmAuthors Ere luitenant kolonel F.WUYTSPublished by IGN/NGI (Belgium)Date published 08/2011Language French, Dutch, English, German
Tourist's Map of Belgium's Military Heritage. This map invites you to take an astonishing architectural and historical trip; a journey which stretches from the Middle Ages through castles, fortified churches, forts, citadels and walled towns, to battlefields, memorials, military cemeteries and museums of military history. (Verso side)
QUEEN MAUD LANDMaterial PaperScale 1:1 000 000Dimensions 1230 x 830 mmAuthors Compiled by NGI, funded by BELSPOPublished by IGN/NGI (Belgium)Date published 5/2013Language English
This is a map of "Queen Maud Land," the Antarctic region where is the Belgian Princess Elisabeth station. Symbolization and selections (objects and toponyms) made in this prototype are based on maps produced by the British Antarctic Survey.
14
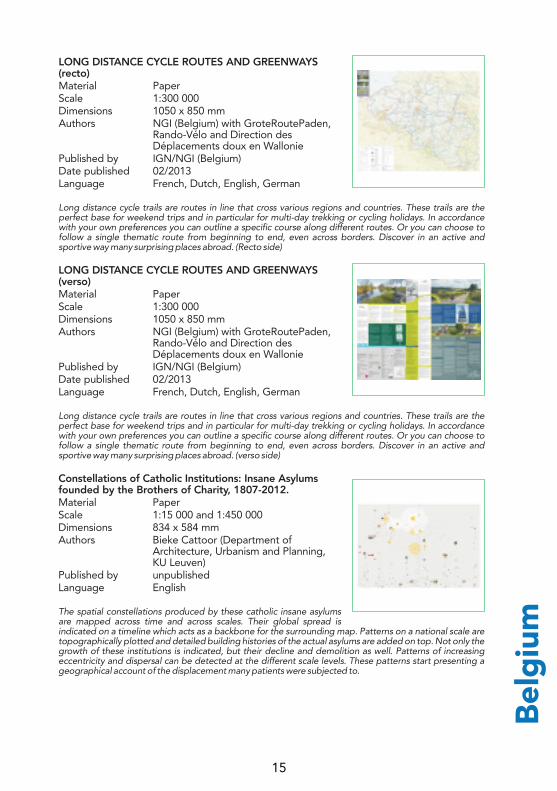
LONG DISTANCE CYCLE ROUTES AND GREENWAYS (recto)Material PaperScale 1:300 000Dimensions 1050 x 850 mmAuthors NGI (Belgium) with GroteRoutePaden,
Rando-Vélo and Direction des Déplacements doux en Wallonie
Published by IGN/NGI (Belgium)Date published 02/2013Language French, Dutch, English, German
Long distance cycle trails are routes in line that cross various regions and countries. These trails are the perfect base for weekend trips and in particular for multi-day trekking or cycling holidays. In accordance with your own preferences you can outline a specific course along different routes. Or you can choose to follow a single thematic route from beginning to end, even across borders. Discover in an active and sportive way many surprising places abroad. (Recto side)
LONG DISTANCE CYCLE ROUTES AND GREENWAYS (verso)Material PaperScale 1:300 000Dimensions 1050 x 850 mmAuthors NGI (Belgium) with GroteRoutePaden,
Rando-Vélo and Direction des Déplacements doux en Wallonie
Published by IGN/NGI (Belgium)Date published 02/2013Language French, Dutch, English, German
Long distance cycle trails are routes in line that cross various regions and countries. These trails are the perfect base for weekend trips and in particular for multi-day trekking or cycling holidays. In accordance with your own preferences you can outline a specific course along different routes. Or you can choose to follow a single thematic route from beginning to end, even across borders. Discover in an active and sportive way many surprising places abroad. (verso side)
Constellations of Catholic Institutions: Insane Asylums founded by the Brothers of Charity, 1807-2012.Material PaperScale 1:15 000 and 1:450 000Dimensions 834 x 584 mmAuthors Bieke Cattoor (Department of
Architecture, Urbanism and Planning, KU Leuven)
Published by unpublishedLanguage English
The spatial constellations produced by these catholic insane asylums are mapped across time and across scales. Their global spread is indicated on a timeline which acts as a backbone for the surrounding map. Patterns on a national scale are topographically plotted and detailed building histories of the actual asylums are added on top. Not only the growth of these institutions is indicated, but their decline and demolition as well. Patterns of increasing eccentricity and dispersal can be detected at the different scale levels. These patterns start presenting a geographical account of the displacement many patients were subjected to.
Bel
giu
m
15
ATLASES
DIGITAL PRODUCTS
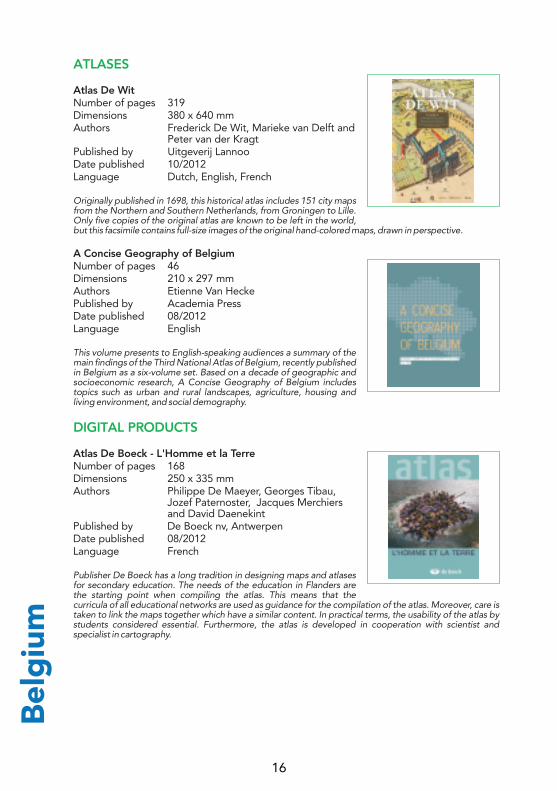
Atlas De WitNumber of pages 319Dimensions 380 x 640 mmAuthors Frederick De Wit, Marieke van Delft and
Peter van der KragtPublished by Uitgeverij LannooDate published 10/2012Language Dutch, English, French
Originally published in 1698, this historical atlas includes 151 city maps from the Northern and Southern Netherlands, from Groningen to Lille. Only five copies of the original atlas are known to be left in the world, but this facsimile contains full-size images of the original hand-colored maps, drawn in perspective.
A Concise Geography of BelgiumNumber of pages 46Dimensions 210 x 297 mmAuthors Etienne Van HeckePublished by Academia PressDate published 08/2012Language English
This volume presents to English-speaking audiences a summary of the main findings of the Third National Atlas of Belgium, recently published in Belgium as a six-volume set. Based on a decade of geographic and socioeconomic research, A Concise Geography of Belgium includes topics such as urban and rural landscapes, agriculture, housing and living environment, and social demography.
Atlas De Boeck - L'Homme et la TerreNumber of pages 168Dimensions 250 x 335 mmAuthors Philippe De Maeyer, Georges Tibau,
Jozef Paternoster, Jacques Merchiers and David Daenekint
Published by De Boeck nv, AntwerpenDate published 08/2012Language French
Publisher De Boeck has a long tradition in designing maps and atlases for secondary education. The needs of the education in Flanders are the starting point when compiling the atlas. This means that the curricula of all educational networks are used as guidance for the compilation of the atlas. Moreover, care is taken to link the maps together which have a similar content. In practical terms, the usability of the atlas by students considered essential. Furthermore, the atlas is developed in cooperation with scientist and specialist in cartography.
Bel
giu
m
16
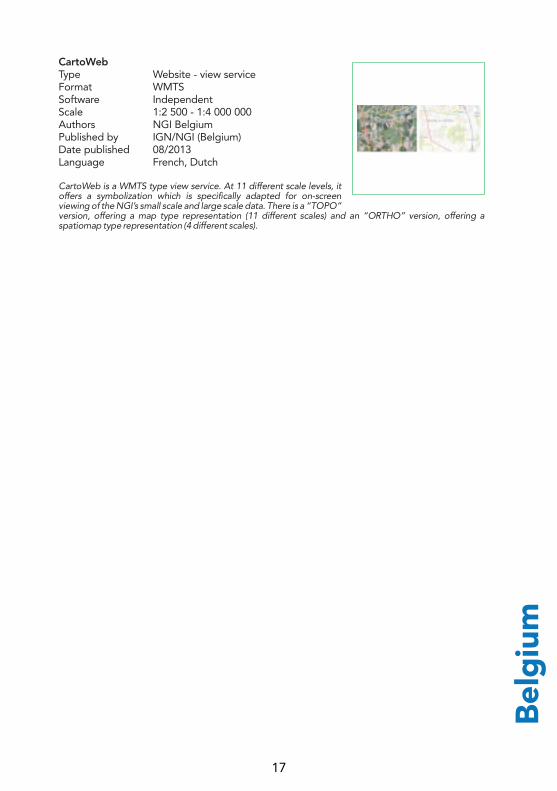
CartoWebType Website - view serviceFormat WMTSSoftware IndependentScale 1:2 500 - 1:4 000 000Authors NGI BelgiumPublished by IGN/NGI (Belgium)Date published 08/2013Language French, Dutch
CartoWeb is a WMTS type view service. At 11 different scale levels, it offers a symbolization which is specifically adapted for on-screen viewing of the NGI’s small scale and large scale data. There is a “TOPO” version, offering a map type representation (11 different scales) and an “ORTHO” version, offering a spatiomap type representation (4 different scales).
Bel
giu
m
17

MAPS
Nature Map of EuropeMaterial PaperScale 1:6 200 000Dimensions 1000 x 700 mmAuthors DataMap-Europe Ltd.Published by DataMap-Europe Ltd.Date published 03/2013Language Bulgarian
Nature map of Europe is compiled by GIS and designed software. The shade relief is modelled on the base of 3D model of the relief and tested several time for the best presentation of mountains and plans in Europe. The presented information is generalized on way that big shapes could be visible from longer distance and smaller shapes by near view. The legend describes all represented elements on clear way. The map is tested by different kind of users for understandability and reading of the contents.
Belasitsa and Ograzhden - Tourist MapMaterial PaperScale 1:70 000Dimensions 1000 x 700 mmAuthors KartGeo Ltd.Published by KartGeo Ltd.Date published 03/2013Language Bulgarian, English, Macedonian, Greek
A detailed tourist map covering the mountains of Belasitsa and Ograzhden. The map presents a cross-border area of 3 000 sq. km, covering territories of three countries - Bulgaria, FYR Macedonia and Greece. It includes railway lines and stations, detailed road network with classification, foot paths, protected areas, tourist chalets and shelters, hotels, archaeological sites, waterfalls, mountaineering sites, other natural landmarks and places of interest. The map shows all marked trekking routes with approximate hiking times. A list of tourist sites and important points with GPS data is also included. The map can be used for route planning and navigation.
100 National Tourist SitesMaterial PaperScale 1:800 000Dimensions 700 x 500 mmAuthors KartGeo Ltd. and Bulgarian Tourist
UnionPublished by KartGeo Ltd. and Bulgarian Tourist
UnionDate published 12/2012Language Bulgarian
A compact, pocket sized tourist map covering the whole of Bulgaria. It shows the most significant cultural, historic and natural landmarks of Bulgaria. The map aims to promote “100 National Tourist Sites”. It contains attractive individual paintings of all the sites. An index listing visitor information and contact details is included on the reverse.
Bul
gar
ia
18
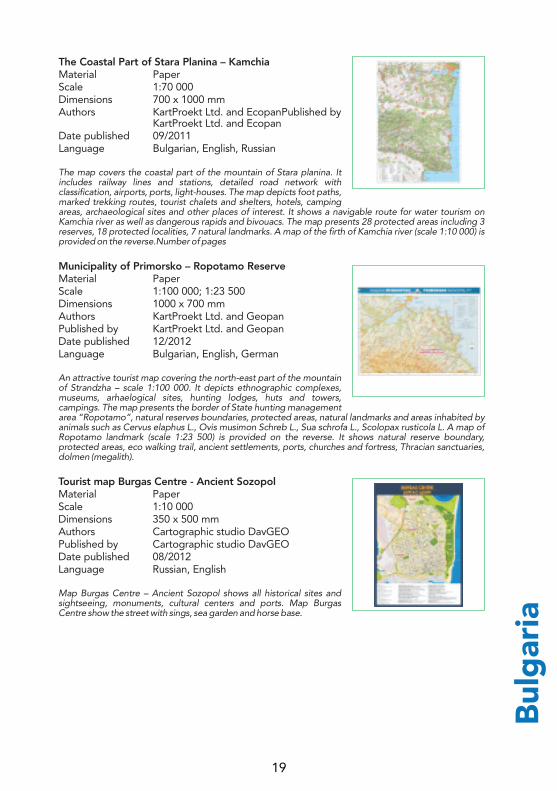
The Coastal Part of Stara Planina – KamchiaMaterial PaperScale 1:70 000Dimensions 700 x 1000 mmAuthors KartProekt Ltd. and EcopanPublished by
KartProekt Ltd. and EcopanDate published 09/2011Language Bulgarian, English, Russian
The map covers the coastal part of the mountain of Stara planina. It includes railway lines and stations, detailed road network with classification, airports, ports, light-houses. The map depicts foot paths, marked trekking routes, tourist chalets and shelters, hotels, camping areas, archaeological sites and other places of interest. It shows a navigable route for water tourism on Kamchia river as well as dangerous rapids and bivouacs. The map presents 28 protected areas including 3 reserves, 18 protected localities, 7 natural landmarks. A map of the firth of Kamchia river (scale 1:10 000) is provided on the reverse.Number of pages
Municipality of Primorsko – Ropotamo ReserveMaterial PaperScale 1:100 000; 1:23 500Dimensions 1000 x 700 mmAuthors KartProekt Ltd. and GeopanPublished by KartProekt Ltd. and GeopanDate published 12/2012Language Bulgarian, English, German
An attractive tourist map covering the north-east part of the mountain of Strandzha – scale 1:100 000. It depicts ethnographic complexes, museums, arhaelogical sites, hunting lodges, huts and towers, campings. The map presents the border of State hunting management area “Ropotamo”, natural reserves boundaries, protected areas, natural landmarks and areas inhabited by animals such as Cervus elaphus L., Ovis musimon Schreb L., Sua schrofa L., Scolopax rusticola L. A map of Ropotamo landmark (scale 1:23 500) is provided on the reverse. It shows natural reserve boundary, protected areas, eco walking trail, ancient settlements, ports, churches and fortress, Thracian sanctuaries, dolmen (megalith).
Tourist map Burgas Centre - Ancient SozopolMaterial PaperScale 1:10 000Dimensions 350 x 500 mmAuthors Cartographic studio DavGEOPublished by Cartographic studio DavGEODate published 08/2012Language Russian, English
Map Burgas Centre – Ancient Sozopol shows all historical sites and sightseeing, monuments, cultural centers and ports. Map Burgas Centre show the street with sings, sea garden and horse base.
Bul
gar
ia
19

Tourist map Central Balkan national parkMaterial PaperScale 1:50 000Dimensions 1000 x 700 mmAuthors Cartographic studio DavGEOPublished by Cartographic studio DavGEODate published 11/2011Language English, Bulgarian
Map Central Balkan national park show protect site and nature reserve, tourist tracks and eco path, cultural and historical monuments and place for break. There are marked tourist tracks. Band markings in the mountains, which are plotted on tourist maps in colors show the summer routes and paths. The winter routes are marked with iron poles painted in yellow and black.
Albena - 3D Panoramic mapMaterial PaperScale perspective projectionDimensions 700 x 500 mmAuthors Cartographic studio DavGEOPublished by Cartographic studio DavGEODate published 03/2013Language English, Bulgarian
Panoramic tourist map, based on a real three-dimensional digital model of terrain, buildings and facilities. Covers Bay of Albena resort. Buildings, facilities and land cover are depicted with their actual proportions and visual characteristics.
Historical Atlas on South-East EuropeNumber of pages 80Dimensions 155 x 240 mmAuthors history: Matanov Hr., Baramova M.,
Stanev V.; cartography: Bandrova T.Published by DataMap-Europe Ltd.Date published 06/2012Language Bulgarian
The Atlas is compiled for historical community, students and all those interested in the history of South-East Europe from IV century to the present day. The content is divided into the following sections: Middle Ages, IV-XV, Modern Times, XVI - XIX, the Balkans after 1878. The maps were compiled based on the latest historical research and data using Geographic Information Systems. They are rich in events and information presented in a way that does not make difficulties in maps reading. Geographical basis is presented accurately and reliably. The Atlas is made with modern design and high quality printing.
ATLASES
Bul
gar
ia
20
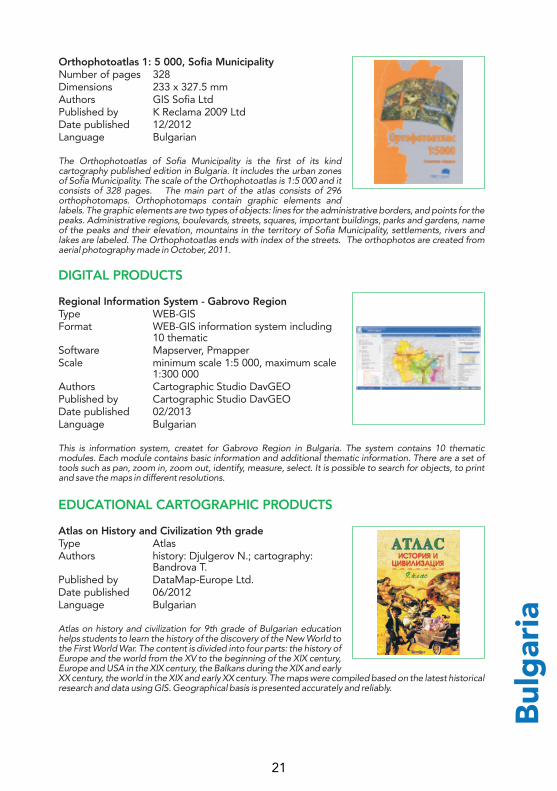
Orthophotoatlas 1: 5 000, Sofia MunicipalityNumber of pages 328Dimensions 233 x 327.5 mmAuthors GIS Sofia LtdPublished by K Reclama 2009 LtdDate published 12/2012Language Bulgarian
The Orthophotoatlas of Sofia Municipality is the first of its kind cartography published edition in Bulgaria. It includes the urban zones of Sofia Municipality. The scale of the Orthophotoatlas is 1:5 000 and it consists of 328 pages. The main part of the atlas consists of 296 orthophotomaps. Orthophotomaps contain graphic elements and labels. The graphic elements are two types of objects: lines for the administrative borders, and points for the peaks. Administrative regions, boulevards, streets, squares, important buildings, parks and gardens, name of the peaks and their elevation, mountains in the territory of Sofia Municipality, settlements, rivers and lakes are labeled. The Orthophotoatlas ends with index of the streets. The orthophotos are created from aerial photography made in October, 2011.
Regional Information System - Gabrovo RegionType WEB-GISFormat WEB-GIS information system including
10 thematicSoftware Mapserver, PmapperScale minimum scale 1:5 000, maximum scale
1:300 000Authors Cartographic Studio DavGEOPublished by Cartographic Studio DavGEODate published 02/2013Language Bulgarian
This is information system, createt for Gabrovo Region in Bulgaria. The system contains 10 thematic modules. Each module contains basic information and additional thematic information. There are a set of tools such as pan, zoom in, zoom out, identify, measure, select. It is possible to search for objects, to print and save the maps in different resolutions.
Atlas on History and Civilization 9th gradeType AtlasAuthors history: Djulgerov N.; cartography:
Bandrova T.Published by DataMap-Europe Ltd.Date published 06/2012Language Bulgarian
Atlas on history and civilization for 9th grade of Bulgarian education helps students to learn the history of the discovery of the New World to the First World War. The content is divided into four parts: the history of Europe and the world from the XV to the beginning of the XIX century, Europe and USA in the XIX century, the Balkans during the XIX and early XX century, the world in the XIX and early XX century. The maps were compiled based on the latest historical research and data using GIS. Geographical basis is presented accurately and reliably.
DIGITAL PRODUCTS
EDUCATIONAL CARTOGRAPHIC PRODUCTS
Bul
gar
ia
21
Atlas on History and Civilization 8th gradeType AtlasAuthors history: Djulgerov N.; cartography:
Bandrova T.Published by DataMap-Europe Ltd.Date published 09/2011Language Bulgarian
The Atlas on history and civilization for 8th grade (35 maps, 6 schemas, 48 pages, format 24 x 15.5 cm) helps students to learn the history of the Middle Ages (IV-XV century). The content is divided into the following sections: Ages, IV-X; • Ages genuine, X-XIII century; • Late Middle Ages, XIV-XV centuries. The maps were compiled based on the latest historical research and data using Geographic Information Systems. Geographical basis is presented accurately and reliably. The Atlas is made with modern design and high quality printing.
Bul
gar
ia
22
MAPS
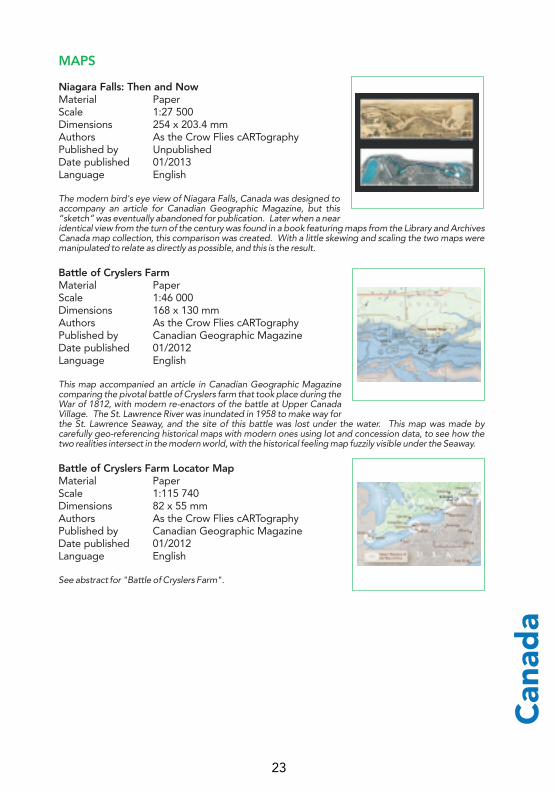
Niagara Falls: Then and NowMaterial PaperScale 1:27 500Dimensions 254 x 203.4 mmAuthors As the Crow Flies cARTographyPublished by UnpublishedDate published 01/2013Language English
The modern bird's eye view of Niagara Falls, Canada was designed to accompany an article for Canadian Geographic Magazine, but this “sketch” was eventually abandoned for publication. Later when a near identical view from the turn of the century was found in a book featuring maps from the Library and Archives Canada map collection, this comparison was created. With a little skewing and scaling the two maps were manipulated to relate as directly as possible, and this is the result.
Battle of Cryslers FarmMaterial PaperScale 1:46 000Dimensions 168 x 130 mmAuthors As the Crow Flies cARTographyPublished by Canadian Geographic MagazineDate published 01/2012Language English
This map accompanied an article in Canadian Geographic Magazine comparing the pivotal battle of Cryslers farm that took place during the War of 1812, with modern re-enactors of the battle at Upper Canada Village. The St. Lawrence River was inundated in 1958 to make way for the St. Lawrence Seaway, and the site of this battle was lost under the water. This map was made by carefully geo-referencing historical maps with modern ones using lot and concession data, to see how the two realities intersect in the modern world, with the historical feeling map fuzzily visible under the Seaway.
Battle of Cryslers Farm Locator MapMaterial PaperScale 1:115 740Dimensions 82 x 55 mmAuthors As the Crow Flies cARTographyPublished by Canadian Geographic MagazineDate published 01/2012Language English
See abstract for "Battle of Cryslers Farm".
Can
ada
23

Ice Cream IslandMaterial PaperScale 1:33 000Dimensions 457 x 356 mmAuthors As the Crow Flies cARTographyPublished by Splatosphere, LLCDate published 01/2012Language English
This map accompanied the launch of a novel, set on the fictitious “Ice Cream Island”. The book was bound to look from all sides like an ice cream sandwich: “chocolate wafer” front and back covers, and white “ice cream” pages in between. The book came wrapped, like a real ice cream sandwich, in a Paper wrapper, and printed on the inside of the wrapper was this map. The places shown on the map are all featured in the adventure that takes place in the novel.
Northern Canada, MCR0036Material PaperScale 1:4 000 000Dimensions 1220 x 1120 mmAuthors Government of Canada, Natural
Resources Canada, Earth Sciences Sector, Mapping Information Branch
Published by Government of Canada, Natural Resources Canada, Earth Sciences Sector, Mapping Information Branch
Date published 01/2012Language English, French
This bilingual map is the latest in the Atlas of Canada's series of reference maps. It shows the populated places in the three territories, the northern areas of the provinces, and adjacent areas of Russia, Alaska, and Greenland. The map shows the following features: roads, railways, ports, national parks, natural resources, relief, bathymetry, glaciers, ice fields, and over 2900 named hydrographic and physical features. The surveyed locations of the Magnetic North Pole are mapped from 1831 to 2011. An inset of the Labrador coast shows the cultural connection of Nunatsiavut to the Inuit of Nunavut.
Mount Head (Alberta-British Columbia)Material Digital, Print-on-demandScale 1:50 000Dimensions 1270 x 686 mmAuthors Stockmal, G.S.Published by Government of Canada, Natural
Resources Canada, Earth Sciences Sector, Mapping Information Branch
Date published 12/2012Language English
This map is the result of compilation and reinterpretation of pre-existing maps combined with new geological mapping conducted during the 2008 field season. The bedrock geology is characterized by Late Devonian to Late Cretaceous sedimentary strata that were deformed by a series of probable Late Cretaceous to Early Tertiary thin-skinned thrust faults and associated folds. The three major thrusts, the McConnell-Sentinel Peak, Lewis, and Bourgeau dominate the structural geology. Mapped structures include folded thrusts, duplexes, thrust-overridden folds, and prominent plunge magnitudes related to probable subsurface lateral thrust ramps. Coupled with regional map relationships, these features indicate out-of-sequence thrust development and substantial kinematic interaction between thrust sheets carried on long-lived thrusts.
Can
ada
24
340B10, Borup Fiord (Nunavut)Material Digital, Print-on-demandScale 1:50 000Dimensions 966 x 686 mmAuthors Government of Canada, Natural
Resources Canada, Earth Sciences Sector, Mapping Information Branch,
Published by Government of Canada, Natural Resources Canada, Earth Sciences Sector, Mapping Information Branch,
Date published 03/2012Language English, French
CanTopo is the next generation of topographic maps being produced by Natural Resources Canada. This product originates from the best available data sources covering Canadian territory and offers a quality cartographic product in vector and raster format that complies with international geomatics standards. CanTopo is a multi-source product generated from the Cartographic Data Base (CDB) described in the Cartographic Data Base (CDB) Product Specification. Data within the CDB comes mainly from the GeoBase initiative (www.geobase.ca), Natural Resources Canada digital topographic data and data from national initiatives. Data from authoritative sources are identified, stored, and used.
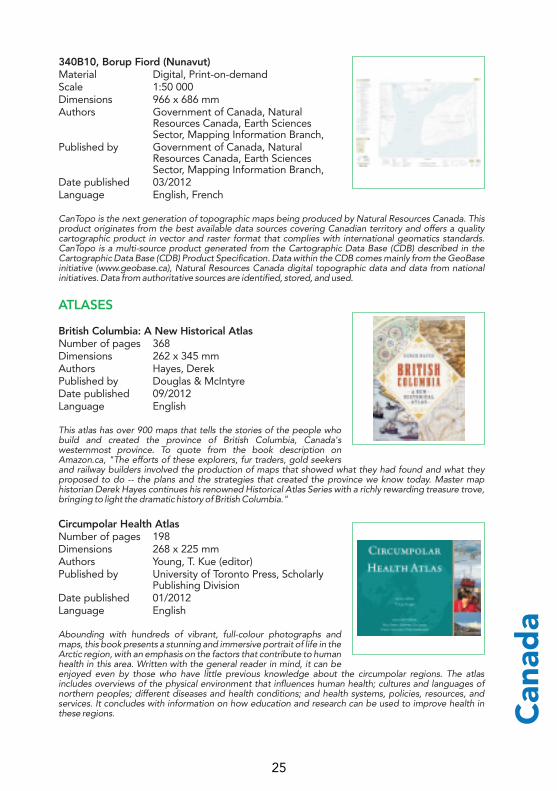
British Columbia: A New Historical AtlasNumber of pages 368Dimensions 262 x 345 mmAuthors Hayes, DerekPublished by Douglas & McIntyreDate published 09/2012Language English
This atlas has over 900 maps that tells the stories of the people who build and created the province of British Columbia, Canada's westernmost province. To quote from the book description on Amazon.ca, "The efforts of these explorers, fur traders, gold seekers and railway builders involved the production of maps that showed what they had found and what they proposed to do -- the plans and the strategies that created the province we know today. Master map historian Derek Hayes continues his renowned Historical Atlas Series with a richly rewarding treasure trove, bringing to light the dramatic history of British Columbia."
Circumpolar Health AtlasNumber of pages 198Dimensions 268 x 225 mmAuthors Young, T. Kue (editor)Published by University of Toronto Press, Scholarly
Publishing DivisionDate published 01/2012Language English
Abounding with hundreds of vibrant, full-colour photographs and maps, this book presents a stunning and immersive portrait of life in the Arctic region, with an emphasis on the factors that contribute to human health in this area. Written with the general reader in mind, it can be enjoyed even by those who have little previous knowledge about the circumpolar regions. The atlas includes overviews of the physical environment that influences human health; cultures and languages of northern peoples; different diseases and health conditions; and health systems, policies, resources, and services. It concludes with information on how education and research can be used to improve health in these regions.
ATLASES
Can
ada
25
DIGITAL PRODUCTS
EDUCATIONAL CARTOGRAPHIC PRODUCTS
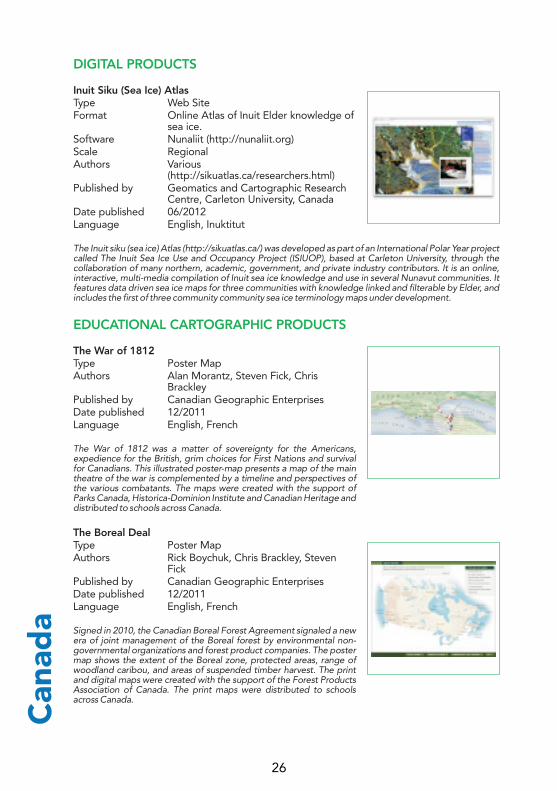
Inuit Siku (Sea Ice) AtlasType Web SiteFormat Online Atlas of Inuit Elder knowledge of
sea ice.Software Nunaliit (http://nunaliit.org)Scale RegionalAuthors Various
(http://sikuatlas.ca/researchers.html)Published by Geomatics and Cartographic Research
Centre, Carleton University, CanadaDate published 06/2012Language English, Inuktitut
The Inuit siku (sea ice) Atlas (http://sikuatlas.ca/) was developed as part of an International Polar Year project called The Inuit Sea Ice Use and Occupancy Project (ISIUOP), based at Carleton University, through the collaboration of many northern, academic, government, and private industry contributors. It is an online, interactive, multi-media compilation of Inuit sea ice knowledge and use in several Nunavut communities. It features data driven sea ice maps for three communities with knowledge linked and filterable by Elder, and includes the first of three community community sea ice terminology maps under development.
The War of 1812Type Poster MapAuthors Alan Morantz, Steven Fick, Chris
BrackleyPublished by Canadian Geographic EnterprisesDate published 12/2011Language English, French
The War of 1812 was a matter of sovereignty for the Americans, expedience for the British, grim choices for First Nations and survival for Canadians. This illustrated poster-map presents a map of the main theatre of the war is complemented by a timeline and perspectives of the various combatants. The maps were created with the support of Parks Canada, Historica-Dominion Institute and Canadian Heritage and distributed to schools across Canada.
The Boreal DealType Poster MapAuthors Rick Boychuk, Chris Brackley, Steven
FickPublished by Canadian Geographic EnterprisesDate published 12/2011Language English, French
Signed in 2010, the Canadian Boreal Forest Agreement signaled a new era of joint management of the Boreal forest by environmental non-governmental organizations and forest product companies. The poster map shows the extent of the Boreal zone, protected areas, range of woodland caribou, and areas of suspended timber harvest. The print and digital maps were created with the support of the Forest Products Association of Canada. The print maps were distributed to schools across Canada.
Can
ada
26
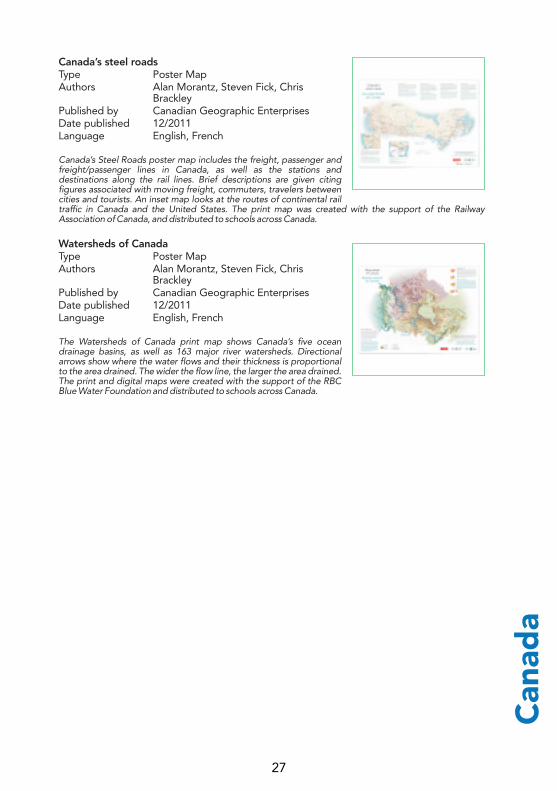
Canada’s steel roadsType Poster MapAuthors Alan Morantz, Steven Fick, Chris
BrackleyPublished by Canadian Geographic EnterprisesDate published 12/2011Language English, French
Canada’s Steel Roads poster map includes the freight, passenger and freight/passenger lines in Canada, as well as the stations and destinations along the rail lines. Brief descriptions are given citing figures associated with moving freight, commuters, travelers between cities and tourists. An inset map looks at the routes of continental rail traffic in Canada and the United States. The print map was created with the support of the Railway Association of Canada, and distributed to schools across Canada.
Watersheds of CanadaType Poster MapAuthors Alan Morantz, Steven Fick, Chris
BrackleyPublished by Canadian Geographic EnterprisesDate published 12/2011Language English, French
The Watersheds of Canada print map shows Canada’s five ocean drainage basins, as well as 163 major river watersheds. Directional arrows show where the water flows and their thickness is proportional to the area drained. The wider the flow line, the larger the area drained. The print and digital maps were created with the support of the RBC Blue Water Foundation and distributed to schools across Canada.
Can
ada
27
MAPS
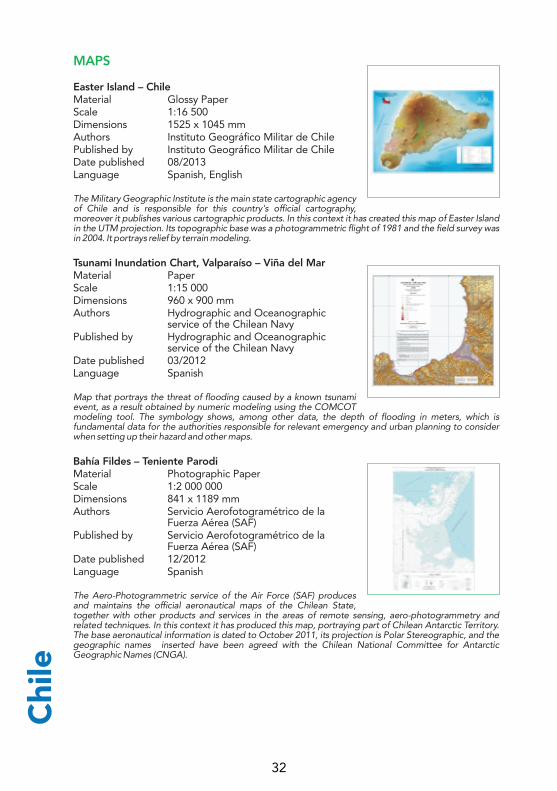
Easter Island – ChileMaterial Glossy PaperScale 1:16 500Dimensions 1525 x 1045 mmAuthors Instituto Geográfico Militar de ChilePublished by Instituto Geográfico Militar de ChileDate published 08/2013Language Spanish, English
The Military Geographic Institute is the main state cartographic agency of Chile and is responsible for this country's official cartography, moreover it publishes various cartographic products. In this context it has created this map of Easter Island in the UTM projection. Its topographic base was a photogrammetric flight of 1981 and the field survey was in 2004. It portrays relief by terrain modeling.
Tsunami Inundation Chart, Valparaíso – Viña del MarMaterial PaperScale 1:15 000Dimensions 960 x 900 mmAuthors Hydrographic and Oceanographic
service of the Chilean NavyPublished by Hydrographic and Oceanographic
service of the Chilean NavyDate published 03/2012Language Spanish
Map that portrays the threat of flooding caused by a known tsunami event, as a result obtained by numeric modeling using the COMCOT modeling tool. The symbology shows, among other data, the depth of flooding in meters, which is fundamental data for the authorities responsible for relevant emergency and urban planning to consider when setting up their hazard and other maps.
Bahía Fildes – Teniente ParodiMaterial Photographic PaperScale 1:2 000 000Dimensions 841 x 1189 mmAuthors Servicio Aerofotogramétrico de la
Fuerza Aérea (SAF)Published by Servicio Aerofotogramétrico de la
Fuerza Aérea (SAF)Date published 12/2012Language Spanish
The Aero-Photogrammetric service of the Air Force (SAF) produces and maintains the official aeronautical maps of the Chilean State, together with other products and services in the areas of remote sensing, aero-photogrammetry and related techniques. In this context it has produced this map, portraying part of Chilean Antarctic Territory. The base aeronautical information is dated to October 2011, its projection is Polar Stereographic, and the geographic names inserted have been agreed with the Chilean National Committee for Antarctic Geographic Names (CNGA).
Chi
le
32

Catalina in Antofagasta RegionMaterial PaperScale 1:100 000Dimensions 1130 x 900 mmAuthors Felipe Espinoza, Stephen Matthews,
Paula Cornejo, Carlos VenegasPublished by Servicio Nacional de Geología y Minería
– SERNAGEOMINDate published 12/2011Language Spanish
The geological 1:100,000 scale map of Catalina, in the Antofagasta region, covers much of the central valley of Chile. The geology is presented as two longitudinal morpho-structural domains: one to the west, of metasedimentary Paleozoic rocks with mesozoic volcanic and plutonic rock; the other in the center and east, with strong Cenozoic volcanic successions. Early-Middle Miocene gravel (Atacama Gravels) are distributed in the central-eastern domain, and form pediplanes cut into by Miocene-Pliocene alluvial deposits, alternating with ignimbrite horizons from explosive eruptions in the higher Andes mountains. These deposits are cut into by sporadic flows of water-courses that drag Pleistocene-Holocene sediments with them.
Piloto Pardo IslandsMaterial PaperScale 1:100 000Dimensions 900 x 700 mmAuthors Instituto Geográfico Militar de ChilePublished by Instituto Geográfico Militar de ChileDate published 07/2013Language Spanish, English
The Military Geographic Institute is the main state cartographic agency of Chile and is responsible for this country's official cartography, moreover it publishes various cartographic products. In this context it has created this map of the Piloto Pardo Islands with UTM projection (zone 21) and SIRGAS (WGS 84) Datum. It was created through the combination of information obtained from a set of different but reliable cartographic sources, among them a global DEM; the result is a topographically correct map suitable for various uses.
Land uses of Coastal Non-Irrigated Areas of Central-Southern ChileMaterial PaperScale 1:150 000Dimensions 802 x 797 mmAuthors Marion Espinosa, Agricultural Engineer;
Daniela Alegria, Geographer; Matias Perez, Cartographer
Published by Centro de Informacion de Recursos Naturales – CIREN
Date published 01/2013Language English
The map presents current land uses of coastal non-irrigated areas in central-southern Chile, at a scale of 1:150,000. It was obtained from the visual analysis of Landsat 5 TM satellite images and processing them through digital classification algorithms, supervised and unsupervised, and multicriteria analysis of vegetational indexes, topography, climate and soil, allowing land use to be characterized at 1:50,000. scale and the boundaries of vegetated coverages to be defined. Tree cover areas were differentiated from other land cover such as annual grasslands, crops, orchards and vineyards. The legend was set up based on the CORINE LAND COVER classification system.
Chi
le
33

Maps of Chile CollectionMaterial PaperScale 1:5 100 000Dimensions 315 x 1015 mmAuthors Instituto Geográfico Militar de ChilePublished by Instituto Geográfico Militar de ChileDate published 04/2009Language Spanish
The Military Geographic Institute is the main state cartographic agency of Chile and is responsible for this country's official cartography, moreover it publishes various cartographic products. In this context it has created the “Maps of Chile Collection”, intended mainly for educational uses. Each map shows the territory of Chile in the modified Polyconic projection of Lallemand. Upon this base, identical in all the maps of this series, each one has a specific theme; the three maps chosen for this exhibition are N°1 “Political-Administrative Divisions”, N°2 Relief” and N°4 “Climates”.
Basic Soil Map of Easter Island, ChileMaterial PaperScale 1:20 000Dimensions 802 x 795 mmAuthors Gerardo Reyes Calvo & Patricio Torres
Fuentes, Agricultural Engineers; Balfredo Toledo Hernández, Cartographer
Published by Centro de Informacion de Recursos Naturales – CIREN
Date published 03/2013Language English
For the purposes of agricultural development, information about soil types is needed on easily usable cartography. The intention of this work was to update the cartographic information of soils corresponding to the agricultural study “Detailed Survey of the Soils of Easter Island”, Technical Publication Nº 3 of CORFO (state corporation), 1975 edition, using digital QuickBird satellite orthoimages of the year 2003 at 1:20,000 scale for the output. The descriptive information of the agricultural study complements the analytical data created by setting up a GIS database and zoning soils classed by themes such as phosphorous present, acidity and conservation.
Map of Antarctic ContinentMaterial PaperScale 1:10 000 000Dimensions 900 x 719 mmAuthors Instituto Geográfico Militar de ChilePublished by Instituto Geográfico Militar de ChileDate published 08/2009Language Spanish, English
The Military Geographic Institute is the main state cartographic agency of Chile and is responsible for this country's official cartography, moreover it publishes various cartographic products. In this context it has created this map of the Antarctic Continent, intended for that sector of the general public interested in Antarctic topics. It has been compiled from cartographic sources from both Chile and other countries, with a polar stereographic projection; the Datum is WGS 84. The version displayed in this exhibition is reduced; the original map is 1800 mm by 1600 at 1:5,000,000. scale.
Chi
le
34
Chi
na
MAPS
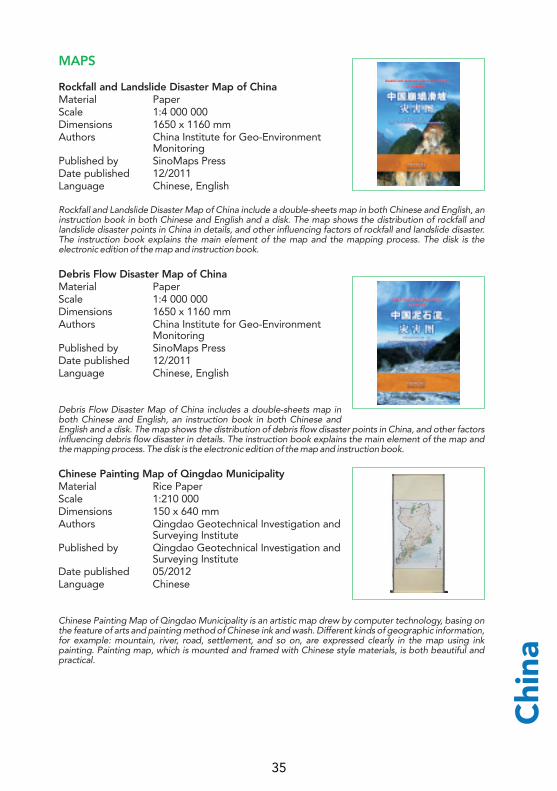
Rockfall and Landslide Disaster Map of ChinaMaterial PaperScale 1:4 000 000Dimensions 1650 x 1160 mmAuthors China Institute for Geo-Environment
MonitoringPublished by SinoMaps PressDate published 12/2011Language Chinese, English
Rockfall and Landslide Disaster Map of China include a double-sheets map in both Chinese and English, an instruction book in both Chinese and English and a disk. The map shows the distribution of rockfall and landslide disaster points in China in details, and other influencing factors of rockfall and landslide disaster. The instruction book explains the main element of the map and the mapping process. The disk is the electronic edition of the map and instruction book.
Debris Flow Disaster Map of ChinaMaterial PaperScale 1:4 000 000Dimensions 1650 x 1160 mmAuthors China Institute for Geo-Environment
MonitoringPublished by SinoMaps PressDate published 12/2011Language Chinese, English
Debris Flow Disaster Map of China includes a double-sheets map in both Chinese and English, an instruction book in both Chinese and English and a disk. The map shows the distribution of debris flow disaster points in China, and other factors influencing debris flow disaster in details. The instruction book explains the main element of the map and the mapping process. The disk is the electronic edition of the map and instruction book.
Chinese Painting Map of Qingdao MunicipalityMaterial Rice PaperScale 1:210 000Dimensions 150 x 640 mmAuthors Qingdao Geotechnical Investigation and
Surveying InstitutePublished by Qingdao Geotechnical Investigation and
Surveying InstituteDate published 05/2012Language Chinese
Chinese Painting Map of Qingdao Municipality is an artistic map drew by computer technology, basing on the feature of arts and painting method of Chinese ink and wash. Different kinds of geographic information, for example: mountain, river, road, settlement, and so on, are expressed clearly in the map using ink painting. Painting map, which is mounted and framed with Chinese style materials, is both beautiful and practical.
35

General Geomorphic Map of Land and Sea of Asia and SurroundingsMaterial PaperScale 1:8 000 000Dimensions 1528 x 1718 mmAuthors Chen ZhimingPublished by Surveying and Mapping PressDate published 06/2011Language Chinese, English
The important research results of Asian geosciences-General Geomorphic Map of Land and Sea of Asia and Surroundings and Plate Morphotectonic Map of Asia and Surroundings, as well as its matching monograph An Outline of Asia’s Geomorphic Sphere and Its Plate Morphotectonics, which have taken 18 years been developed successfully. General Geomorphic Map of Land and Sea of Asia and Surroundings is the first international intercontinental geomorphic map under the guidance of tectonic activity theory, and Plate Morphotectonic Map of Asia and Surroundings is extended and deepened from it. Experts think, the two maps of Asia, as a project of geosciences study, have significant meaning to the formation of land and sea landform and modern deformation research.
Plate Morphotectonic Map of Asia and SurroundingsMaterial PaperScale 1:14 000 000Dimensions 872 x 1157 mmAuthors Chen ZhimingPublished by Surveying and Mapping PressDate published 06/2011Language Chinese, English
The important research results of Asian geosciences-General Geomorphic Map of Land and Sea of Asia and Surroundings and Plate Morphotectonic Map of Asia and Surroundings, as well as its matching monograph An Outline of Asia’s Geomorphic Sphere and Its Plate Morphotectonics, which have taken 18 years been developed successfully. General Geomorphic Map of Land and Sea of Asia and Surroundings is the first international intercontinental geomorphic map under the guidance of tectonic activity theory, and Plate Morphotectonic Map of Asia and Surroundings is extended and deepened from it. Experts think, the two maps of Asia, as a project of geosciences study, have significant meaning to the formation of land and sea landform and modern deformation research.
The Chang'E-1 Topographic Atlas of the MoonNumber of pages 234Dimensions 370 x 340 mmAuthors Li Chunlai, Liu Jianjun, Mu Lingli, Ren
Xin, Zuo WeiPublished by National Astronomical Observatories,
Chinese Academy of SciencesDate published 01/2013Language Chinese, English
Based on the lunar global DEM derived from the Chang’E-1 CCD stereo image data with digital photogrammetry by National Astronomical Observatories, Chinese Academy of Sciences, the Chang’E-1 Topographic Atlas of the Moon uses color shaded relief map with contour lines to portrait the global topographic characters and illustrate a new view for the Moon. As an important research result of China's Lunar Exploration Program, this atlas will provide foundational information for the study on lunar topography, morphology, and geologic structures, as well as lunar evolution research.
ATLASES
Chi
na
36
The World atlas of mountains higher than 8,000 metreNumber of pages 22Dimensions 820 x 550 mmAuthors Desheng MiPublished by SinoMaps PressDate published 07/2013Language Chinese, English
The World Atlas of Snow-capped Mountains Higher Than 8,000 Meters reflects the world’s 17 snow-capped mountains of more than 8,000 meters above the sea level comprehensively and accurately., especially the newly discovered three mountains: the 15th snow-capped mountains–East Annapurna peak (8013 m a.s.l.) , the 16th - the central peak ( 8011 m a.s.l.) , the 17th mountain –Northwest Xixabangma peak ( 8008 m a.s.l.). These new discovery will update the information from secondary school geography textbooks, and it is great contribution to world culture of cartography.
Atlas of Historical Vicissitude of Dongting LakeNumber of pages 328Dimensions 889 x 1194 mmAuthors Hunan Mapping Institute and Hunan
Map Publishing HousePublished by Hunan Map Publishing HouseDate published 09/2011Language Chinese
This atlas consists of map groups of eight kinds and appendix, presenting respectively the introduction on maps, the history of evolution of geological structure, the evolution of lakes, the evolution of dykes, the disasters of flood and drought, the construction of water conservation works, agriculture and resources environment of Dongting Lake area. There are 368 maps about 93 subjects, with more than 600,000 words and a number of figures and pictures.The atlas focuses on the description of the vicissitude of Dongting Lake and the evolution of dykes from the early cretaceous to Holocene in the prehistory of geology, and from Western Zhou dynasty to the present time in the Chinese history.
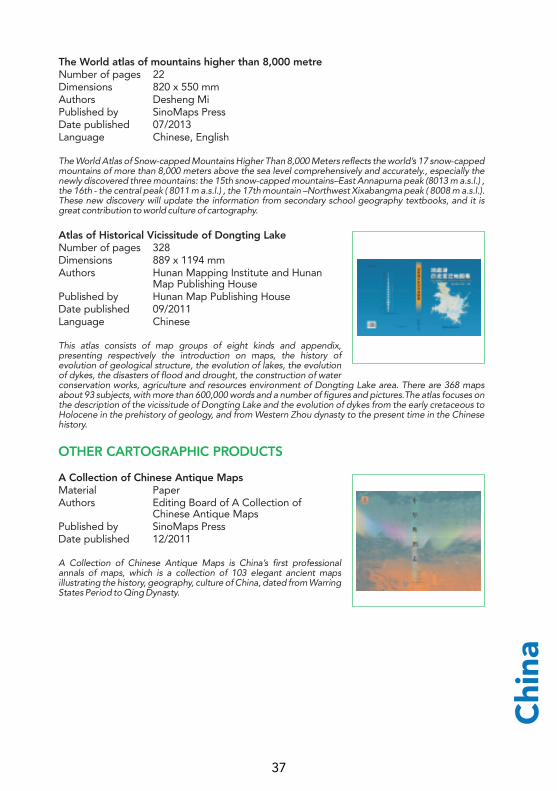
A Collection of Chinese Antique MapsMaterial PaperAuthors Editing Board of A Collection of
Chinese Antique MapsPublished by SinoMaps PressDate published 12/2011
A Collection of Chinese Antique Maps is China’s first professional annals of maps, which is a collection of 103 elegant ancient maps illustrating the history, geography, culture of China, dated from Warring States Period to Qing Dynasty.
OTHER CARTOGRAPHIC PRODUCTS
Chi
na
37

Map of the Huanghe RiverMaterial PaperAuthors Editing Board of Map of the Huanghe
RiverPublished by SinoMaps PressDate published 01/2012
Map of the Huanghe River was drawn during the Reign Kangxi (1662-1722), Qing Dynasty, using traditional landscape painting technique of China. The map was about the Huanghe River ran into the sea from Xingxiuhai to Yuntiguan, Andong. This scroll is a copy of the original painting, which is 12 meters long, Accordion fold.Number of pages
Map of Huang Ming Da Yi Tong on Wooden SlipsMaterial WoodAuthors Editing Board of Map of Huang Ming
Da Yi Tong on Wooden SlipsPublished by SinoMaps PressDate published 04/2012
Adopting traditional Block Print method, the map of Huang Ming Da Yi Tong was firstly printed in the 9th year of Emperor Chongzhen's Reign (1636). The original map used the traditional map-drawing technique. It reflected the vast territory of China in mid-late Ming dynasty, and also introduced some neighboring countries. The copy of this old map engraved in wooden slips is 0.94 meters long and 0.25 meters high.
Paper Cut MapMaterial Red PaperAuthors Qingdao Geotechnical Investigation and
Surveying InstitutePublished by Qingdao Geotechnical Investigation and
Surveying InstituteDate published 08/2012
Paper cut map is a type of map combined with the Paper-cutting art. Different kinds of geographic information, for example: road, mountain, and so on, are expressed clearly in the map using by hollowing out. Chinese traditional handicraft is expressed fully and delightfully in the Paper cut map.
Chi
na
38

Cro
atia
MAPS
Basic Geological Map of the Republic of Croatia scale 1:50000 – sheet Cres 2Material PaperScale 1:50 000Dimensions 900 x 705 mmAuthors Fucek, Ladislav; Maticec, Dubravko;
Vlahovic, Igor; Oštric, Nenad; Prtoljan, Božo; Korbar, Tvrtko; Husinec, Antun
Published by Croatian Geological Survey / Hrvatski geološki institut (Zavod za geologiju)
Date published 12/2012Language Croatian
This sheet shows geological structures, i.e. spatial distribution, stratigraphical and tectonic relations as well as basic palaeontology and petrology of 18 lithostratigraphical units of various geological age (Cretaceous, Palaeogene, Quaternary) cropping out within middle part of Cres island. This sheet is compiled according to written geological standard (Guidelines for compilation of Basic Geological Map of the Republic of Croatia, scale 1:50000), within the project of strategic national interest.
Snow Area in CroatiaMaterial PaperScale 1:1 000 000Dimensions 611 x 616 mmAuthors Croatian Standards Institute, Miljenko
Lapaine, Marina Rajakovic, Dražen Tutic from Faculty of Geodesy, University of Zagreb, State Geodetic Administration
Published by Croatian Standards InstituteDate published 06/2012Language Croatian, English
By accepting European norms for construction desing, Croatia also accepted the principle of embedding national specificities, primarily referring to natural phenomena (wind, earthquake, snow, temperature) into each standard, i.e. to create special annexes for a certain norm with defined national parameters. In accordance with these standards, the Croatian Standards Institute (Hrvatski zavod za norme - HZN) ordered from the Faculty of Geodesy University of Zagreb a cartographic map processing of snow areas for the territory of the Republic of Croatia.
Basic Wind Speed Map in CroatiaMaterial PaperScale 1:1 000 000Dimensions 611 x 616 mmAuthors Alica Bajic, Stjepan Ivatek-Šahdan,
Kristian Horvath, Melita Percec Tadic, from Meteorological and Hydrological Service, Croatian Standards Institute, Miljenko Lapaine, Marina Rajakovic, Dražen Tutic from Faculty of Geodesy, University of Zagreb, SGA
Published by Croatian Standards InstituteDate published 06/2012Language Croatian, English
39
By accepting European norms for construction desing, Croatia also accepted the principle of embedding national specificities, primarily referring to natural phenomena (wind, earthquake, snow, temperature) into each standard, i.e. to create special annexes for a certain norm with defined national parameters. In accordance with these standards, the Croatian Standards Institute (Hrvatski zavod za norme - HZN) ordered from the Faculty of Geodesy University of Zagreb a cartographic map processing of the basic wind speed for the territory of the Republic of Croatia.
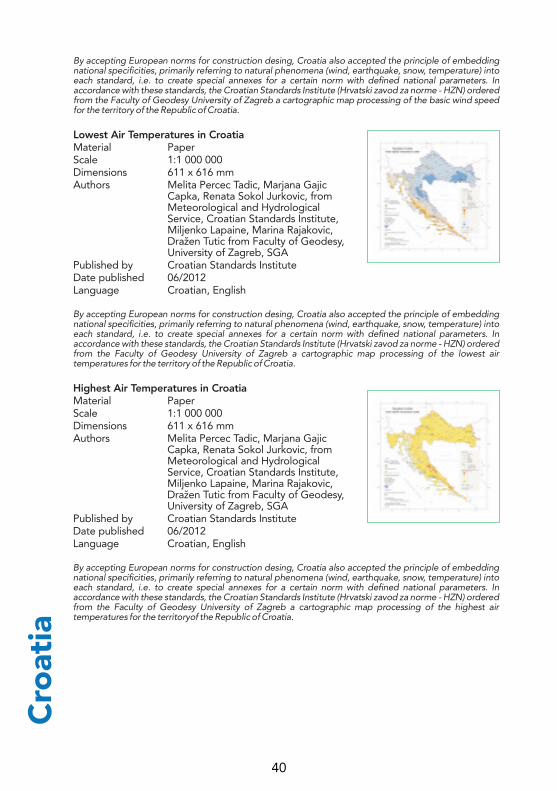
Lowest Air Temperatures in CroatiaMaterial PaperScale 1:1 000 000Dimensions 611 x 616 mmAuthors Melita Percec Tadic, Marjana Gajic
Capka, Renata Sokol Jurkovic, from Meteorological and Hydrological Service, Croatian Standards Institute, Miljenko Lapaine, Marina Rajakovic, Dražen Tutic from Faculty of Geodesy, University of Zagreb, SGA
Published by Croatian Standards InstituteDate published 06/2012Language Croatian, English
By accepting European norms for construction desing, Croatia also accepted the principle of embedding national specificities, primarily referring to natural phenomena (wind, earthquake, snow, temperature) into each standard, i.e. to create special annexes for a certain norm with defined national parameters. In accordance with these standards, the Croatian Standards Institute (Hrvatski zavod za norme - HZN) ordered from the Faculty of Geodesy University of Zagreb a cartographic map processing of the lowest air temperatures for the territory of the Republic of Croatia.
Highest Air Temperatures in CroatiaMaterial PaperScale 1:1 000 000Dimensions 611 x 616 mmAuthors Melita Percec Tadic, Marjana Gajic
Capka, Renata Sokol Jurkovic, from Meteorological and Hydrological Service, Croatian Standards Institute, Miljenko Lapaine, Marina Rajakovic, Dražen Tutic from Faculty of Geodesy, University of Zagreb, SGA
Published by Croatian Standards InstituteDate published 06/2012Language Croatian, English
By accepting European norms for construction desing, Croatia also accepted the principle of embedding national specificities, primarily referring to natural phenomena (wind, earthquake, snow, temperature) into each standard, i.e. to create special annexes for a certain norm with defined national parameters. In accordance with these standards, the Croatian Standards Institute (Hrvatski zavod za norme - HZN) ordered from the Faculty of Geodesy University of Zagreb a cartographic map processing of the highest air temperatures for the territoryof the Republic of Croatia.
Cro
atia
40
OTHER CARTOGRAPHIC PRODUCTS
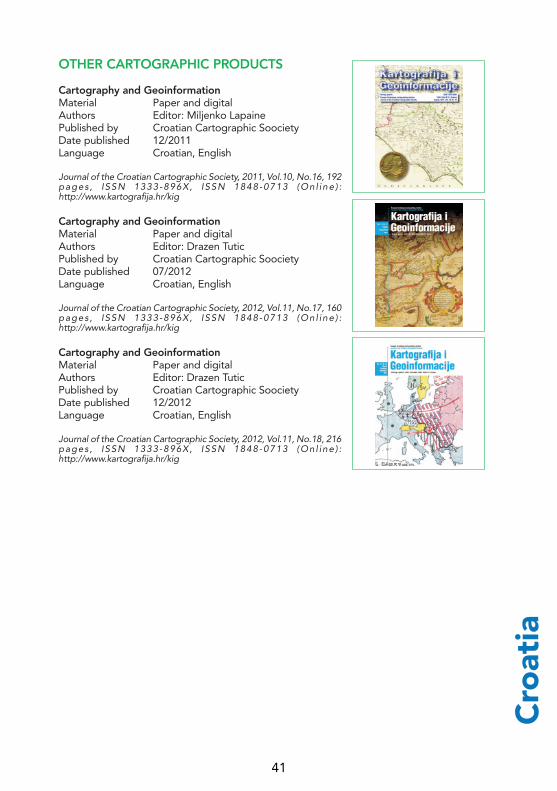
Cartography and GeoinformationMaterial Paper and digitalAuthors Editor: Miljenko LapainePublished by Croatian Cartographic SoocietyDate published 12/2011Language Croatian, English
Journal of the Croatian Cartographic Society, 2011, Vol.10, No.16, 192 pages , ISSN 1333-896X, ISSN 1848-0713 (On l ine ) : http://www.kartografija.hr/kig
Cartography and GeoinformationMaterial Paper and digitalAuthors Editor: Drazen TuticPublished by Croatian Cartographic SoocietyDate published 07/2012Language Croatian, English
Journal of the Croatian Cartographic Society, 2012, Vol.11, No.17, 160 pages , ISSN 1333-896X, ISSN 1848-0713 (On l ine ) : http://www.kartografija.hr/kig
Cartography and GeoinformationMaterial Paper and digitalAuthors Editor: Drazen TuticPublished by Croatian Cartographic SoocietyDate published 12/2012Language Croatian, English
Journal of the Croatian Cartographic Society, 2012, Vol.11, No.18, 216 pages , ISSN 1333-896X, ISSN 1848-0713 (On l ine ) : http://www.kartografija.hr/kig
Cro
atia
41
MAPS
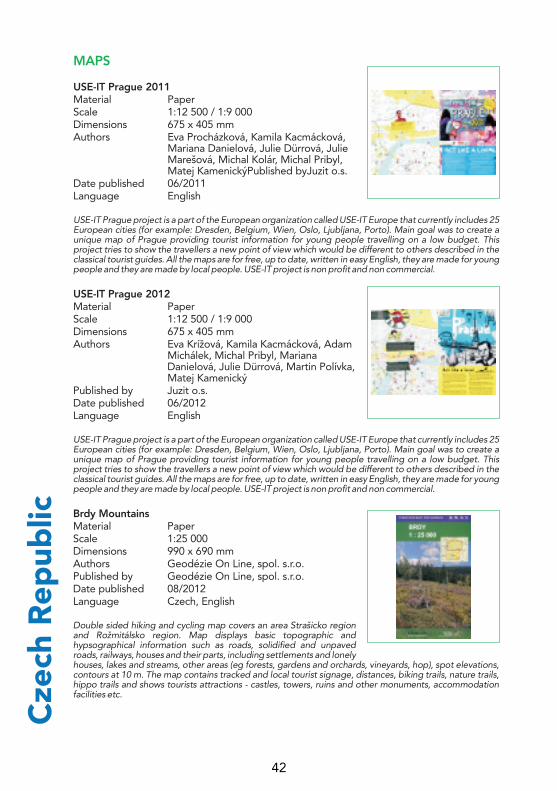
USE-IT Prague 2011Material PaperScale 1:12 500 / 1:9 000Dimensions 675 x 405 mmAuthors Eva Procházková, Kamila Kacmácková,
Mariana Danielová, Julie Dürrová, Julie Marešová, Michal Kolár, Michal Pribyl, Matej KamenickýPublished byJuzit o.s.
Date published 06/2011Language English
USE-IT Prague project is a part of the European organization called USE-IT Europe that currently includes 25 European cities (for example: Dresden, Belgium, Wien, Oslo, Ljubljana, Porto). Main goal was to create a unique map of Prague providing tourist information for young people travelling on a low budget. This project tries to show the travellers a new point of view which would be different to others described in the classical tourist guides. All the maps are for free, up to date, written in easy English, they are made for young people and they are made by local people. USE-IT project is non profit and non commercial.
USE-IT Prague 2012Material PaperScale 1:12 500 / 1:9 000Dimensions 675 x 405 mmAuthors Eva Krížová, Kamila Kacmácková, Adam
Michálek, Michal Pribyl, Mariana Danielová, Julie Dürrová, Martin Polívka, Matej Kamenický
Published by Juzit o.s.Date published 06/2012Language English
USE-IT Prague project is a part of the European organization called USE-IT Europe that currently includes 25 European cities (for example: Dresden, Belgium, Wien, Oslo, Ljubljana, Porto). Main goal was to create a unique map of Prague providing tourist information for young people travelling on a low budget. This project tries to show the travellers a new point of view which would be different to others described in the classical tourist guides. All the maps are for free, up to date, written in easy English, they are made for young people and they are made by local people. USE-IT project is non profit and non commercial.
Brdy MountainsMaterial PaperScale 1:25 000Dimensions 990 x 690 mmAuthors Geodézie On Line, spol. s.r.o.Published by Geodézie On Line, spol. s.r.o.Date published 08/2012Language Czech, English
Double sided hiking and cycling map covers an area Strašicko region and Rožmitálsko region. Map displays basic topographic and hypsographical information such as roads, solidified and unpaved roads, railways, houses and their parts, including settlements and lonely houses, lakes and streams, other areas (eg forests, gardens and orchards, vineyards, hop), spot elevations, contours at 10 m. The map contains tracked and local tourist signage, distances, biking trails, nature trails, hippo trails and shows tourists attractions - castles, towers, ruins and other monuments, accommodation facilities etc.
Cze
ch R
epub
lic
42

Ceská Kanada regionMaterial PaperScale 1:25 000Dimensions 990 x 690 mmAuthors Geodézie On Line, spol. s.r.o.Published by Geodézie On Line, spol. s.r.o.Date published 08/2011Language Czech, German
Double sided hiking and cycling map covers an area of Ceská Kanada region. Map displays basic topographic and hypsographical information such as roads, solidified and unpaved roads, railways, houses and their parts, including settlements and lonely houses, lakes and streams, other areas (eg forests, gardens and orchards, vineyards, hop), spot elevations, contours at 10 m. The map contains tracked and local tourist signage, distances, biking trails, nature trails, hippo trails and shows tourists attractions - castles, towers, ruins and other monuments, accommodation facilities etc.
Dolní Posázaví regionMaterial PaperScale 1:25 000Dimensions 990 x 690 mmAuthors Geodézie On Line, spol. s.r.o.Published by Geodézie On Line, spol. s.r.o.Date published 05/2012Language Czech, English
Double sided hiking and cycling map covers an area of Dolní Posázaví region. Map displays basic topographic and hypsographical information such as roads, solidified and unpaved roads, railways, houses and their parts, including settlements and lonely houses, lakes and streams, other areas (eg forests, gardens and orchards, vineyards, hop), spot elevations, contours at 10 m. The map contains tracked and local tourist signage, distances, biking trails, nature trails, hippo trails and shows tourists attractions - castles, towers, ruins and other monuments, accommodation facilities etc.
Ceský ráj PLAMaterial PaperScale 1:25 000Dimensions 990 x 690 mmAuthors Geodézie On Line, spol. s.r.o.Published by Geodézie On Line, spol. s.r.o.Date published 08/2011Language Czech, German, English
Double sided hiking and cycling map covers an area of PLA "Ceský ráj". Map displays basic topographic and hypsographical information such as roads, solidified and unpaved roads, railways, houses and their parts, including settlements and lonely houses, lakes and streams, other areas (eg forests, gardens and orchards, vineyards, hop), spot elevations, contours at 10 m. The map contains tracked and local tourist signage, distances, biking trails, nature trails, hippo trails and shows tourists attractions - castles, towers, ruins and other monuments, accommodation facilities etc.
Cze
ch R
epub
lic
43
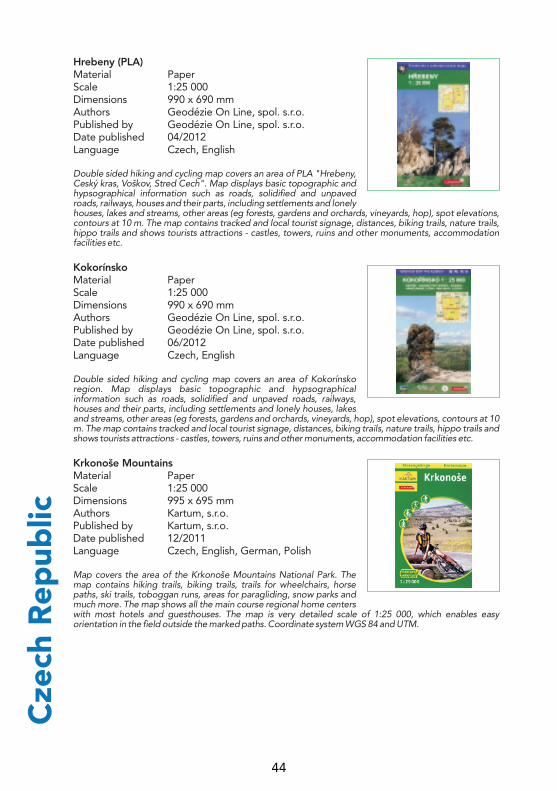
Hrebeny (PLA)Material PaperScale 1:25 000Dimensions 990 x 690 mmAuthors Geodézie On Line, spol. s.r.o.Published by Geodézie On Line, spol. s.r.o.Date published 04/2012Language Czech, English
Double sided hiking and cycling map covers an area of PLA "Hrebeny, Ceský kras, Voškov, Stred Cech". Map displays basic topographic and hypsographical information such as roads, solidified and unpaved roads, railways, houses and their parts, including settlements and lonely houses, lakes and streams, other areas (eg forests, gardens and orchards, vineyards, hop), spot elevations, contours at 10 m. The map contains tracked and local tourist signage, distances, biking trails, nature trails, hippo trails and shows tourists attractions - castles, towers, ruins and other monuments, accommodation facilities etc.
KokorínskoMaterial PaperScale 1:25 000Dimensions 990 x 690 mmAuthors Geodézie On Line, spol. s.r.o.Published by Geodézie On Line, spol. s.r.o.Date published 06/2012Language Czech, English
Double sided hiking and cycling map covers an area of Kokorínsko region. Map displays basic topographic and hypsographical information such as roads, solidified and unpaved roads, railways, houses and their parts, including settlements and lonely houses, lakes and streams, other areas (eg forests, gardens and orchards, vineyards, hop), spot elevations, contours at 10 m. The map contains tracked and local tourist signage, distances, biking trails, nature trails, hippo trails and shows tourists attractions - castles, towers, ruins and other monuments, accommodation facilities etc.
Krkonoše MountainsMaterial PaperScale 1:25 000Dimensions 995 x 695 mmAuthors Kartum, s.r.o.Published by Kartum, s.r.o.Date published 12/2011Language Czech, English, German, Polish
Map covers the area of the Krkonoše Mountains National Park. The map contains hiking trails, biking trails, trails for wheelchairs, horse paths, ski trails, toboggan runs, areas for paragliding, snow parks and much more. The map shows all the main course regional home centers with most hotels and guesthouses. The map is very detailed scale of 1:25 000, which enables easy orientation in the field outside the marked paths. Coordinate system WGS 84 and UTM.
Cze
ch R
epub
lic
44
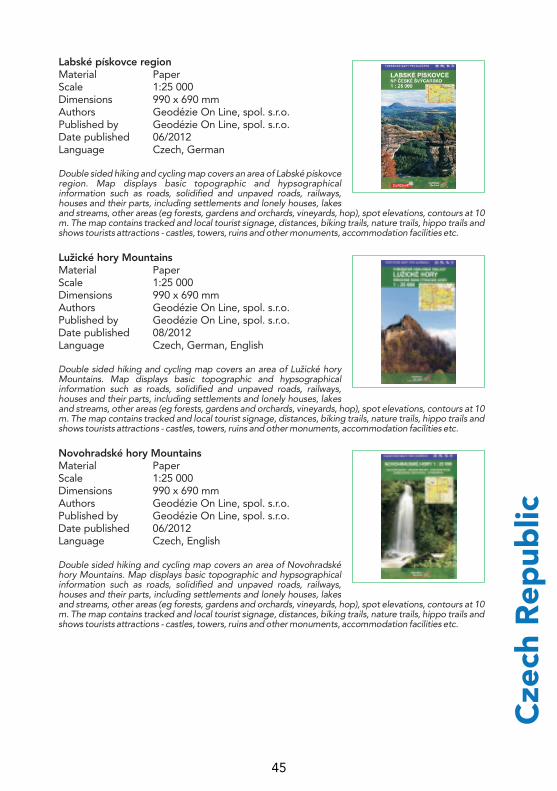
Labské pískovce regionMaterial PaperScale 1:25 000Dimensions 990 x 690 mmAuthors Geodézie On Line, spol. s.r.o.Published by Geodézie On Line, spol. s.r.o.Date published 06/2012Language Czech, German
Double sided hiking and cycling map covers an area of Labské pískovce region. Map displays basic topographic and hypsographical information such as roads, solidified and unpaved roads, railways, houses and their parts, including settlements and lonely houses, lakes and streams, other areas (eg forests, gardens and orchards, vineyards, hop), spot elevations, contours at 10 m. The map contains tracked and local tourist signage, distances, biking trails, nature trails, hippo trails and shows tourists attractions - castles, towers, ruins and other monuments, accommodation facilities etc.
Lužické hory MountainsMaterial PaperScale 1:25 000Dimensions 990 x 690 mmAuthors Geodézie On Line, spol. s.r.o.Published by Geodézie On Line, spol. s.r.o.Date published 08/2012Language Czech, German, English
Double sided hiking and cycling map covers an area of Lužické hory Mountains. Map displays basic topographic and hypsographical information such as roads, solidified and unpaved roads, railways, houses and their parts, including settlements and lonely houses, lakes and streams, other areas (eg forests, gardens and orchards, vineyards, hop), spot elevations, contours at 10 m. The map contains tracked and local tourist signage, distances, biking trails, nature trails, hippo trails and shows tourists attractions - castles, towers, ruins and other monuments, accommodation facilities etc.
Novohradské hory MountainsMaterial PaperScale 1:25 000Dimensions 990 x 690 mmAuthors Geodézie On Line, spol. s.r.o.Published by Geodézie On Line, spol. s.r.o.Date published 06/2012Language Czech, English
Double sided hiking and cycling map covers an area of Novohradské hory Mountains. Map displays basic topographic and hypsographical information such as roads, solidified and unpaved roads, railways, houses and their parts, including settlements and lonely houses, lakes and streams, other areas (eg forests, gardens and orchards, vineyards, hop), spot elevations, contours at 10 m. The map contains tracked and local tourist signage, distances, biking trails, nature trails, hippo trails and shows tourists attractions - castles, towers, ruins and other monuments, accommodation facilities etc.
Cze
ch R
epub
lic
45

Šumava – LipnoMaterial PaperScale 1:25 000Dimensions 990 x 690 mmAuthors Geodézie On Line, spol. s.r.o.Published by Geodézie On Line, spol. s.r.o.Date published 09/2012Language Czech, German, English
Double sided hiking and cycling map covers an area of Šumava Mountains and Lipno region. Map displays basic topographic and hypsographical information such as roads, solidified and unpaved roads, railways, houses and their parts, including settlements and lonely houses, lakes and streams, other areas (eg forests, gardens and orchards, vineyards, hop), spot elevations, contours at 10 m. The map contains tracked and local tourist signage, distances, biking trails, nature trails, hippo trails and shows tourists attractions - castles, towers, ruins and other monuments, accommodation facilities etc.
Šumava – PláneMaterial PaperScale 1:25 000Dimensions 990 x 690 mmAuthors Geodézie On Line, spol. s.r.o.Published by Geodézie On Line, spol. s.r.o.Date published 12/2011Language Czech, German, English, Polish
Double sided hiking and cycling map covers an area of Šumava Mountains and Pláne region. Map displays basic topographic and hypsographical information such as roads, solidified and unpaved roads, railways, houses and their parts, including settlements and lonely houses, lakes and streams, other areas (eg forests, gardens and orchards, vineyards, hop), spot elevations, contours at 10 m. The map contains tracked and local tourist signage, distances, biking trails, nature trails, hippo trails and shows tourists attractions - castles, towers, ruins and other monuments, accommodation facilities etc.Double sided hiking and cycling map covers an area of Šumava Mountains and Lipno region. Map displays basic topographic and hypsographical information such as roads, solidified and unpaved roads, railways, houses and their parts, including settlements and lonely houses, lakes and streams, other areas (eg forests, gardens and orchards, vineyards, hop), spot elevations, contours at 10 m. The map contains tracked and local tourist signage, distances, biking trails, nature trails, hippo trails and shows tourists attractions - castles, towers, ruins and other monuments, accommodation facilities etc.
TrebonskoMaterial PaperScale 1:25 000Dimensions 990 x 690 mmAuthors Geodézie On Line, spol. s.r.o.Published by Geodézie On Line, spol. s.r.o.Date published 08/2011Language Czech, German
Cze
ch R
epub
lic
46

Double sided hiking and cycling map covers an area of Trebonsko region. Map displays basic topographic and hypsographical information such as roads, solidified and unpaved roads, railways, houses and their parts, including settlements and lonely houses, lakes and streams, other areas (eg forests, gardens and orchards, vineyards, hop), spot elevations, contours at 10 m. The map contains tracked and local tourist signage, distances, biking trails, nature trails, hippo trails and shows tourists attractions - castles, towers, ruins and other monuments, accommodation facilities etc.Double sided hiking and cycling map covers an area of Šumava Mountains and Lipno region. Map displays basic topographic and hypsographical information such as roads, solidified and unpaved roads, railways, houses and their parts, including settlements and lonely houses, lakes and streams, other areas (eg forests, gardens and orchards, vineyards, hop), spot elevations, contours at 10 m. The map contains tracked and local tourist signage, distances, biking trails, nature trails, hippo trails and shows tourists attractions - castles, towers, ruins and other monuments, accommodation facilities etc.
Šumava mountains 1 (Železná Ruda - Sušice)Material BandannaScale 1:50 000Dimensions 720 x 720 mmAuthors Kartografie PRAHA, a. s.Published by Vlasta SmékalováDate published 04/2013Language Czech, English, German
Map as a bandanna (hiking, cycling, canoeing, city plans) are printed using transfer sublimation printing on polyester silk. Bandanna has a dimension of 72 x 72 cm, of which own map of 70 x 70 cm. In the rest are the map name, scale, legend in English, German and Czech, washing symbols, and other information. Map so produced can compose and decompose without damage, can be even crumple into a pocket. It does not mind the weather, always have a map that you do not pull the protective case at hand. After contamination, map can be easily washed without any problems with deformation etc. It is designed especially for those who are moving in the outdoors - hikers, cyclists, canoeists, but will also be a nice reminder of the visited site.
Šumava mountains 2 (Prachatice - Volary)Material BandannaScale 1:50 000Dimensions 720 x 720 mmAuthors Kartografie PRAHA, a. s.Published by Vlasta SmékalováDate published 04/2013Language Czech, English, German
Map as a bandanna (hiking, cycling, canoeing, city plans) are printed using transfer sublimation printing on polyester silk. Bandanna has a dimension of 72 x 72 cm, of which own map of 70 x 70 cm. In the rest are the map name, scale, legend in English, German and Czech, washing symbols, and other information. Map so produced can compose and decompose without damage, can be even crumple into a pocket. It does not mind the weather, always have a map that you do not pull the protective case at hand. After contamination, map can be easily washed without any problems with deformation etc. It is designed especially for those who are moving in the outdoors - hikers, cyclists, canoeists, but will also be a nice reminder of the visited site.
Cze
ch R
epub
lic
47

Šumava mountains 3 (Lipno Dam and entourage)Material BandannaScale 1:50 000Dimensions 720 x 720 mmAuthors Kartografie PRAHA, a. s.Published by Vlasta SmékalováDate published 04/2013Language Czech, English, German
Map as a bandanna (hiking, cycling, canoeing, city plans) are printed using transfer sublimation printing on polyester silk. Bandanna has a dimension of 72 x 72 cm, of which own map of 70 x 70 cm. In the rest are the map name, scale, legend in English, German and Czech, washing symbols, and other information. Map so produced can compose and decompose without damage, can be even crumple into a pocket. It does not mind the weather, always have a map that you do not pull the protective case at hand. After contamination, map can be easily washed without any problems with deformation etc. It is designed especially for those who are moving in the outdoors - hikers, cyclists, canoeists, but will also be a nice reminder of the visited site.
Climatic regions of Czechia: Quitt´s classification during years 1961–2000Material PaperScale 1:500 000Dimensions 1000 x 700 mmAuthors Vít Kveton, Vít VoženílekPublished by Palacký University OlomoucDate published 12/2011Language Czech, English
The map presents the Quitt classification of the climate of Czechia, as well as the same classification completed in 1975. The study accompanying the map deals in detail with an assessment of the degree of compliance of the raster layer in Quitt classification with the real values of meteorological elements in individual pixels. It also contains an analysis of the degree of indeterminancy when classifying areas within the original classification. The study also presents a comparison of two different executions of the Quitt classification.
Municipalities of the Czech Republic - delimitation of the rural and urban area at 31st December 2010Material PaperScale 1:500 000Dimensions 1000 x 700 mmAuthors Vít Pászto, Alžbeta BrychtováPublished by Palacký University OlomoucDate published 12/2012Language Czech
In this study, statistical data from Czech Statistical Office and fuzzy sets theory for realistic rural and urban area delimitation was used. This could set the degree of rural and urban area membership in range from 0 to 1 for each municipality in Czech Republic. Very unique map combining Geographic Information science and modern geocomputation methods to show desired transitional (fuzzy) character of municipalities was made.
Cze
ch R
epub
lic
48
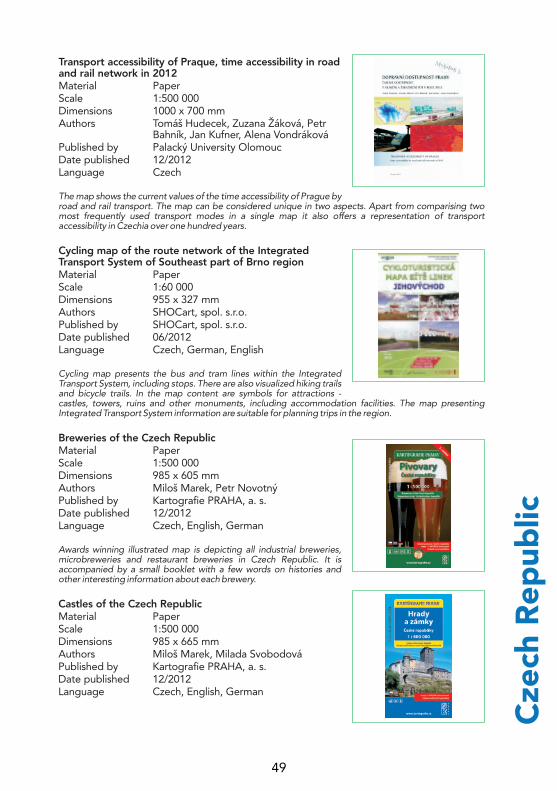
Transport accessibility of Praque, time accessibility in road and rail network in 2012Material PaperScale 1:500 000Dimensions 1000 x 700 mmAuthors Tomáš Hudecek, Zuzana Žáková, Petr
Bahník, Jan Kufner, Alena VondrákováPublished by Palacký University OlomoucDate published 12/2012Language Czech
The map shows the current values of the time accessibility of Prague by road and rail transport. The map can be considered unique in two aspects. Apart from comparising two most frequently used transport modes in a single map it also offers a representation of transport accessibility in Czechia over one hundred years.
Cycling map of the route network of the Integrated Transport System of Southeast part of Brno regionMaterial PaperScale 1:60 000Dimensions 955 x 327 mmAuthors SHOCart, spol. s.r.o.Published by SHOCart, spol. s.r.o.Date published 06/2012Language Czech, German, English
Cycling map presents the bus and tram lines within the Integrated Transport System, including stops. There are also visualized hiking trails and bicycle trails. In the map content are symbols for attractions - castles, towers, ruins and other monuments, including accommodation facilities. The map presenting Integrated Transport System information are suitable for planning trips in the region.
Breweries of the Czech RepublicMaterial PaperScale 1:500 000Dimensions 985 x 605 mmAuthors Miloš Marek, Petr NovotnýPublished by Kartografie PRAHA, a. s.Date published 12/2012Language Czech, English, German
Awards winning illustrated map is depicting all industrial breweries, microbreweries and restaurant breweries in Czech Republic. It is accompanied by a small booklet with a few words on histories and other interesting information about each brewery.
Castles of the Czech RepublicMaterial PaperScale 1:500 000Dimensions 985 x 665 mmAuthors Miloš Marek, Milada SvobodováPublished by Kartografie PRAHA, a. s.Date published 12/2012Language Czech, English, German
Cze
ch R
epub
lic
49
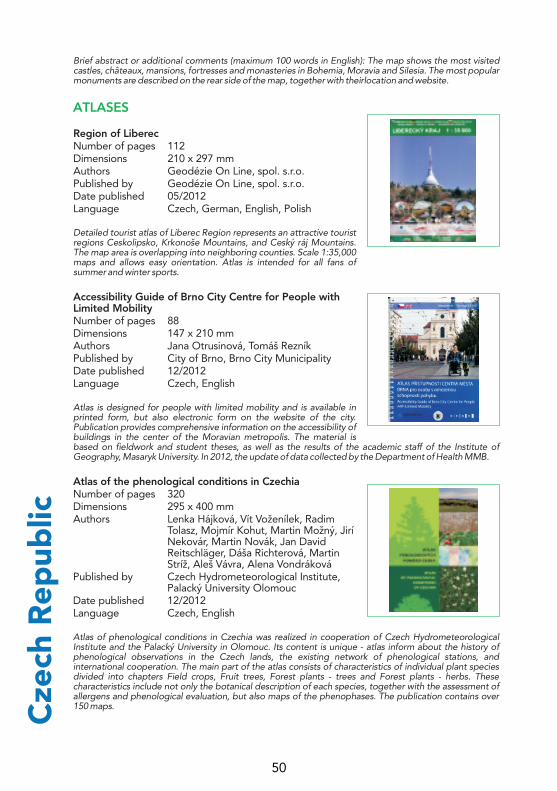
Brief abstract or additional comments (maximum 100 words in English): The map shows the most visited castles, châteaux, mansions, fortresses and monasteries in Bohemia, Moravia and Silesia. The most popular monuments are described on the rear side of the map, together with theirlocation and website.
Region of LiberecNumber of pages 112Dimensions 210 x 297 mmAuthors Geodézie On Line, spol. s.r.o.Published by Geodézie On Line, spol. s.r.o.Date published 05/2012Language Czech, German, English, Polish
Detailed tourist atlas of Liberec Region represents an attractive tourist regions Ceskolipsko, Krkonoše Mountains, and Ceský ráj Mountains. The map area is overlapping into neighboring counties. Scale 1:35,000 maps and allows easy orientation. Atlas is intended for all fans of summer and winter sports.
Accessibility Guide of Brno City Centre for People with Limited MobilityNumber of pages 88Dimensions 147 x 210 mmAuthors Jana Otrusinová, Tomáš RezníkPublished by City of Brno, Brno City MunicipalityDate published 12/2012Language Czech, English
Atlas is designed for people with limited mobility and is available in printed form, but also electronic form on the website of the city. Publication provides comprehensive information on the accessibility of buildings in the center of the Moravian metropolis. The material is based on fieldwork and student theses, as well as the results of the academic staff of the Institute of Geography, Masaryk University. In 2012, the update of data collected by the Department of Health MMB.
Atlas of the phenological conditions in CzechiaNumber of pages 320Dimensions 295 x 400 mmAuthors Lenka Hájková, Vít Voženílek, Radim
Tolasz, Mojmír Kohut, Martin Možný, Jirí Nekovár, Martin Novák, Jan David Reitschläger, Dáša Richterová, Martin Stríž, Aleš Vávra, Alena Vondráková
Published by Czech Hydrometeorological Institute, Palacký University Olomouc
Date published 12/2012Language Czech, English
Atlas of phenological conditions in Czechia was realized in cooperation of Czech Hydrometeorological Institute and the Palacký University in Olomouc. Its content is unique - atlas inform about the history of phenological observations in the Czech lands, the existing network of phenological stations, and international cooperation. The main part of the atlas consists of characteristics of individual plant species divided into chapters Field crops, Fruit trees, Forest plants - trees and Forest plants - herbs. These characteristics include not only the botanical description of each species, together with the assessment of allergens and phenological evaluation, but also maps of the phenophases. The publication contains over 150 maps.
ATLASES
Cze
ch R
epub
lic
50
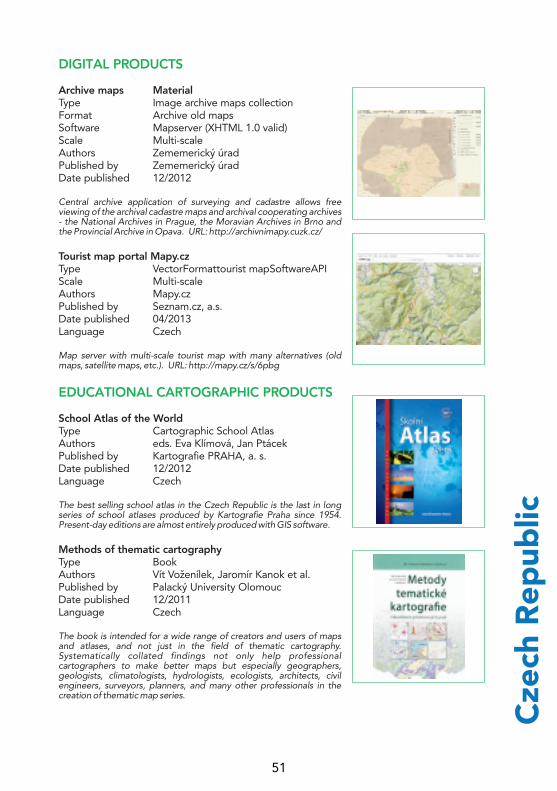
DIGITAL PRODUCTS
EDUCATIONAL CARTOGRAPHIC PRODUCTS
Archive maps MaterialType Image archive maps collectionFormat Archive old mapsSoftware Mapserver (XHTML 1.0 valid)Scale Multi-scaleAuthors Zememerický úradPublished by Zememerický úradDate published 12/2012
Central archive application of surveying and cadastre allows free viewing of the archival cadastre maps and archival cooperating archives - the National Archives in Prague, the Moravian Archives in Brno and the Provincial Archive in Opava. URL: http://archivnimapy.cuzk.cz/
Tourist map portal Mapy.czType VectorFormattourist mapSoftwareAPIScale Multi-scaleAuthors Mapy.czPublished by Seznam.cz, a.s.Date published 04/2013Language Czech
Map server with multi-scale tourist map with many alternatives (old maps, satellite maps, etc.). URL: http://mapy.cz/s/6pbg
School Atlas of the WorldType Cartographic School AtlasAuthors eds. Eva Klímová, Jan PtácekPublished by Kartografie PRAHA, a. s.Date published 12/2012Language Czech
The best selling school atlas in the Czech Republic is the last in long series of school atlases produced by Kartografie Praha since 1954. Present-day editions are almost entirely produced with GIS software.
Methods of thematic cartographyType BookAuthors Vít Voženílek, Jaromír Kanok et al.Published by Palacký University OlomoucDate published 12/2011Language Czech
The book is intended for a wide range of creators and users of maps and atlases, and not just in the field of thematic cartography. Systematically collated findings not only help professional cartographers to make better maps but especially geographers, geologists, climatologists, hydrologists, ecologists, architects, civil engineers, surveyors, planners, and many other professionals in the creation of thematic map series.
Cze
ch R
epub
lic
51
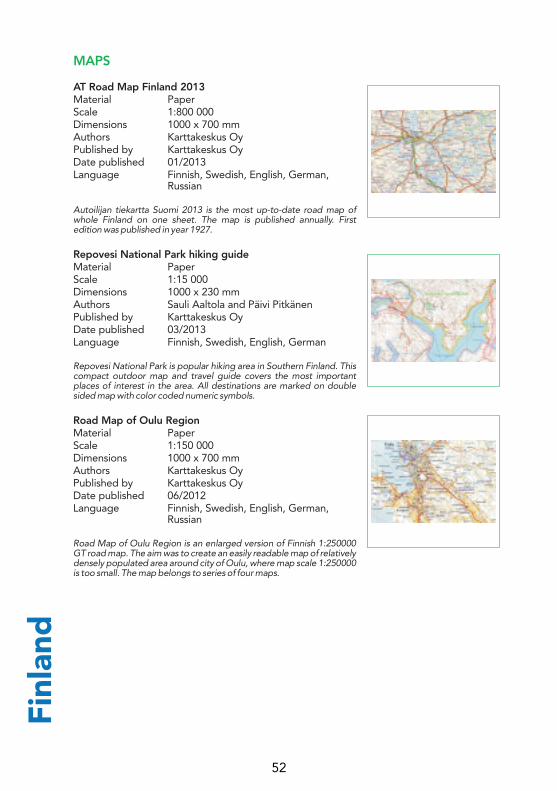
Finl
and
MAPS
AT Road Map Finland 2013Material PaperScale 1:800 000Dimensions 1000 x 700 mmAuthors Karttakeskus OyPublished by Karttakeskus OyDate published 01/2013Language Finnish, Swedish, English, German,
Russian
Autoilijan tiekartta Suomi 2013 is the most up-to-date road map of whole Finland on one sheet. The map is published annually. First edition was published in year 1927.
Repovesi National Park hiking guideMaterial PaperScale 1:15 000Dimensions 1000 x 230 mmAuthors Sauli Aaltola and Päivi PitkänenPublished by Karttakeskus OyDate published 03/2013Language Finnish, Swedish, English, German
Repovesi National Park is popular hiking area in Southern Finland. This compact outdoor map and travel guide covers the most important places of interest in the area. All destinations are marked on double sided map with color coded numeric symbols.
Road Map of Oulu RegionMaterial PaperScale 1:150 000Dimensions 1000 x 700 mmAuthors Karttakeskus OyPublished by Karttakeskus OyDate published 06/2012Language Finnish, Swedish, English, German,
Russian
Road Map of Oulu Region is an enlarged version of Finnish 1:250000 GT road map. The aim was to create an easily readable map of relatively densely populated area around city of Oulu, where map scale 1:250000 is too small. The map belongs to series of four maps.
52

Outdoor Map Evo Päijänne IlvesvaellusMaterial PaperScale 1:25 000Dimensions 800 x 700 mmAuthors Karttakeskus OyPublished by Karttakeskus OyDate published 03/2012Language Finnish, Swedish, English, German
Map covers State hiking area of Evo and is the first ever outdoor map published of Päijänne National Park in southern Finland.
Address map of Espoo archipelagoMaterial PaperScale 1:20 000Dimensions 594 x 420 mmAuthors Municipality of EspooPublished by Municipality of EspooDate published 04/2012Language Finnish, Swedish
New address numbers for properties on islands, for property owners, rescue groups and fire department , Euref GK25
Q5232 SOTKAMO, Basic mapMaterial PaperScale 1:25 000Dimensions 999 x 692 mmAuthors National Land Survey of FinlandPublished by National Land Survey of FinlandDate published 11/2012Language Finnish, Swedish, English
The basic map is an appropriate guide for everyone on the road or in the wild. It also provides a basis for other maps, for instance, specific outdoor maps that allow the users to go hiking or orienting in the terrain. For those skilled in the art the basic map is a suitable aid for making plans.
Q523 SOTKAMO, Topographic mapMaterial PaperScale 1:50 000Dimensions 999 x 692 mmAuthors National Land Survey of FinlandPublished by National Land Survey of FinlandDate published 10/2012Language Finnish, Swedish, English
The topographic map 1:50 000 gives a more general picture of the ground features than the basic map. The topographic map is an ideal complement to nautical charts as it provides detailed information about the terrain, since all Finnish sea areas are covered by 1:50 000 topographic map sheets.
Finl
and
53

Rokua Geopark - Heritage of the Ice AgeMaterial PaperScale 1:15 000Dimensions 700 x 1000 mmAuthors Geological Survey of Finland (GTK)Published by Geological Survey of Finland (GTK)Date published 03/2013Language Finnish
A poster prepared for promoting the Rokua Geopark geological outdoor atlas. It consists of a regional map of the whole Geopark area and a detailed map of the central part of the area. There is also, as an example, a drawing depicting the genesis and development of dunes.
Coastal Chart 29 Houtskari – LypyrttiMaterial PaperScale 1:50 000Dimensions 1120 x 820 mmAuthors Finnish Transport Agency, Hydrographic
OfficePublished by Finnish Transport Agency, Hydrographic
OfficeDate published 09/2012Language Finnish, Swedish, English
Coastal Chart, scale 1:50 000, intended for archipelago and coastal navigation.
Sipoonkorpi Nature ReserveMaterial PaperScale 1:15 000Dimensions 1250 x 1000 mmAuthors Susanne Suvanto and Juha OksanenPublished by Finnish Geodetic InstituteDate published 02/2013Language English
The map presents the Sipoonkorpi Nature Reserve, an important recreational area within the Helsinki Metropolitan area. The aim is to provide an intuitive view of the landscape by utilizing tree symbols for forests and continuous background coloring of the terrain. This is accomplished by integrating open data from the National Land Survey of Finland (Topographic Database and DEM) and the Finnish Environment Institute (Corine Land Cover). The map has been prepared as a part of MenoksiMetsään! (Go to Woods!) initiative which was accepted to be a project in the World Design Capital Helsinki 2012 programme.
Finl
and
54

ATLASES
Rokua Geopark - Heritage of the Ice Age. Geological Outdoor GuideNumber of pages 64Dimensions 170 x 230 mmAuthors Geological Survey of Finland (GTK)Published by Geological Survey of Finland (GTK)Date published 05/2012Language Finnish
The guide is intended for hikers and all people interested in nature. It contains geological, topographic and thematic maps (50 pages) and images and explains the development of the area from formation of crystalline bedrock 2.7 billion years ago through the most recent ice age to the present day. Maps provide both overviews of the whole area and detailed guides to the most interesting parts. Digital elevation model derived from airborne laser scanning data has been widely used both in interpreting geological formations and as background visualization on the maps. More than one hundred sites are highlighted as examples of different types of formations and different stages of development.
Kuninkaan kartasto Etelä-Suomesta (The King's Atlas from the Southern Finland)Number of pages 477Dimensions 215 x 300 mmAuthors Erkki-Sakari HarjuPublished by The Society of Finnish LiteratureDate published 10/2012Language Finnish
This historical atlas includes the 1:40 000 scale topographical maps from the Southern Finland surveyed by the Swedish military at the end of 18th century. This so called reconnaissance mapping lasted 29 years and covered an area of 100 000 square kilometres. The mapping was made according to a sheet division system in the scales of 1:20 000, 1:40 000 and 1:160 000. In addition to topographical,maps the work included also coastal mapping of the Gulf of Finland in 1:40 000 scale. The original maps are in a good condition and kept in the Swedish Military Archives in Stockholm.
Chart series A, Viipuri – HelsinkiNumber of pages 66Dimensions 460 x 340 mmAuthors Finnish Transport Agency, Hydrographic
OfficePublished by Finnish Transport Agency, Hydrographic
OfficeDate published 02/2013Language Finnish, English, Swedish
New edition of Chart Series for leisure craft from the Gulf of Finland, eastern part.
Finl
and
55
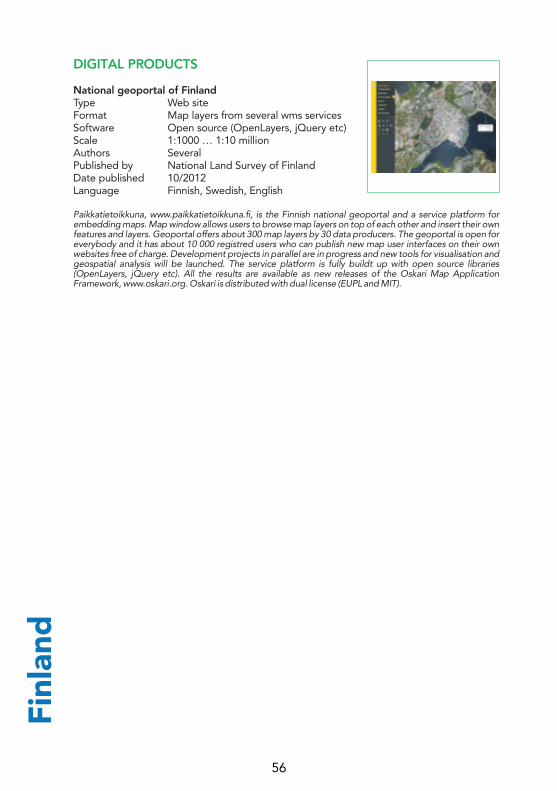
DIGITAL PRODUCTS
National geoportal of FinlandType Web siteFormat Map layers from several wms servicesSoftware Open source (OpenLayers, jQuery etc)Scale 1:1000 … 1:10 millionAuthors SeveralPublished by National Land Survey of FinlandDate published 10/2012Language Finnish, Swedish, English
Paikkatietoikkuna, www.paikkatietoikkuna.fi, is the Finnish national geoportal and a service platform for embedding maps. Map window allows users to browse map layers on top of each other and insert their own features and layers. Geoportal offers about 300 map layers by 30 data producers. The geoportal is open for everybody and it has about 10 000 registred users who can publish new map user interfaces on their own websites free of charge. Development projects in parallel are in progress and new tools for visualisation and geospatial analysis will be launched. The service platform is fully buildt up with open source libraries (OpenLayers, jQuery etc). All the results are available as new releases of the Oskari Map Application Framework, www.oskari.org. Oskari is distributed with dual license (EUPL and MIT).
Finl
and
56
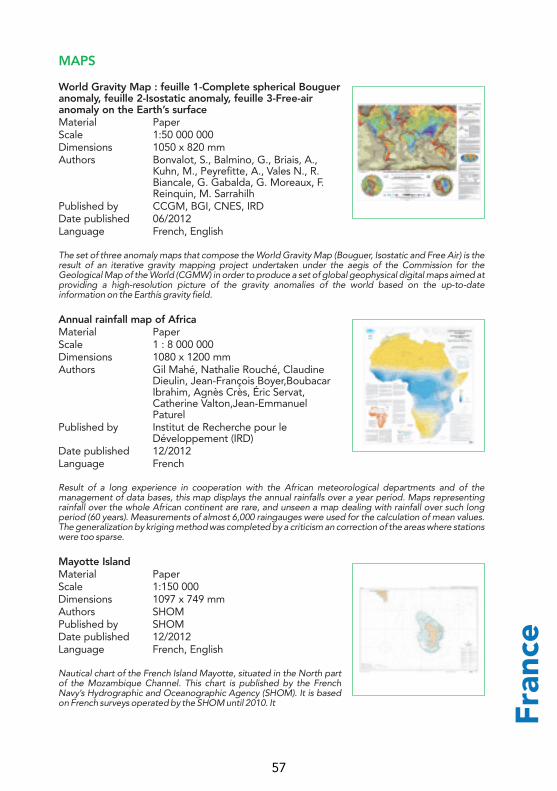
Fran
ce
MAPS
World Gravity Map : feuille 1-Complete spherical Bouguer anomaly, feuille 2-Isostatic anomaly, feuille 3-Free-air anomaly on the Earth’s surfaceMaterial PaperScale 1:50 000 000Dimensions 1050 x 820 mmAuthors Bonvalot, S., Balmino, G., Briais, A.,
Kuhn, M., Peyrefitte, A., Vales N., R. Biancale, G. Gabalda, G. Moreaux, F. Reinquin, M. Sarrahilh
Published by CCGM, BGI, CNES, IRDDate published 06/2012Language French, English
The set of three anomaly maps that compose the World Gravity Map (Bouguer, Isostatic and Free Air) is the result of an iterative gravity mapping project undertaken under the aegis of the Commission for the Geological Map of the World (CGMW) in order to produce a set of global geophysical digital maps aimed at providing a high-resolution picture of the gravity anomalies of the world based on the up-to-date information on the Earthís gravity field.
Annual rainfall map of AfricaMaterial PaperScale 1 : 8 000 000Dimensions 1080 x 1200 mmAuthors Gil Mahé, Nathalie Rouché, Claudine
Dieulin, Jean-François Boyer,Boubacar Ibrahim, Agnès Crès, Éric Servat, Catherine Valton,Jean-Emmanuel Paturel
Published by Institut de Recherche pour le Développement (IRD)
Date published 12/2012Language French
Result of a long experience in cooperation with the African meteorological departments and of the management of data bases, this map displays the annual rainfalls over a year period. Maps representing rainfall over the whole African continent are rare, and unseen a map dealing with rainfall over such long period (60 years). Measurements of almost 6,000 raingauges were used for the calculation of mean values. The generalization by kriging method was completed by a criticism an correction of the areas where stations were too sparse.
Mayotte IslandMaterial PaperScale 1:150 000Dimensions 1097 x 749 mmAuthors SHOMPublished by SHOMDate published 12/2012Language French, English
Nautical chart of the French Island Mayotte, situated in the North part of the Mozambique Channel. This chart is published by the French Navy’s Hydrographic and Oceanographic Agency (SHOM). It is based on French surveys operated by the SHOM until 2010. It
57
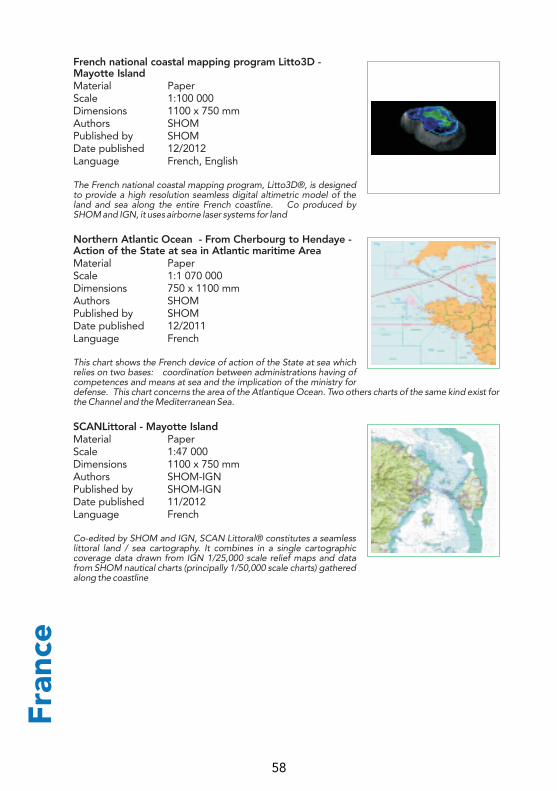
French national coastal mapping program Litto3D - Mayotte IslandMaterial PaperScale 1:100 000Dimensions 1100 x 750 mmAuthors SHOMPublished by SHOMDate published 12/2012Language French, English
The French national coastal mapping program, Litto3D®, is designed to provide a high resolution seamless digital altimetric model of the land and sea along the entire French coastline. Co produced by SHOM and IGN, it uses airborne laser systems for land
Northern Atlantic Ocean - From Cherbourg to Hendaye - Action of the State at sea in Atlantic maritime AreaMaterial PaperScale 1:1 070 000Dimensions 750 x 1100 mmAuthors SHOMPublished by SHOMDate published 12/2011Language French
This chart shows the French device of action of the State at sea which relies on two bases: coordination between administrations having of competences and means at sea and the implication of the ministry for defense. This chart concerns the area of the Atlantique Ocean. Two others charts of the same kind exist for the Channel and the Mediterranean Sea.
SCANLittoral - Mayotte IslandMaterial PaperScale 1:47 000Dimensions 1100 x 750 mmAuthors SHOM-IGNPublished by SHOM-IGNDate published 11/2012Language French
Co-edited by SHOM and IGN, SCAN Littoral® constitutes a seamless littoral land / sea cartography. It combines in a single cartographic coverage data drawn from IGN 1/25,000 scale relief maps and data from SHOM nautical charts (principally 1/50,000 scale charts) gathered along the coastline
Fran
ce
58

Fran
ce
Les principales échéances électorales en Europe (2012-2017)Material PaperDimensions 290 x 200 mmAuthors Ministère des Affaires étrangèresPublished by Ministère des Affaires étrangèresDate published 07/2012Language French
ZambieMaterial PaperScale 1:6000000Dimensions 290 x 200 mmAuthors Ministère des Affaires étrangèresPublished by Ministère des Affaires étrangèresDate published 09/2012Language French
Territory and Population
Colombie-Nicaragua : Espaces maritimesMaterial PaperScale 1:5000000Dimensions 290 x 200 mmAuthors Ministère des Affaires étrangèresPublished by Ministère des Affaires étrangèresDate published 11/2012Language French
Les membres du "Partenariat de Deauville"Material PaperDimensions 290 x 200 mmAuthors Ministère des Affaires étrangèresPublished by Ministère des Affaires étrangèresDate published 08/2012Language French
La France dans le PacifiqueMaterial PapScale 1:55000000Dimensions 290 x 200 mmAuthors Ministère des Affaires étrangèresPublished by Ministère des Affaires étrangèresDate published 01/2013Language French
59
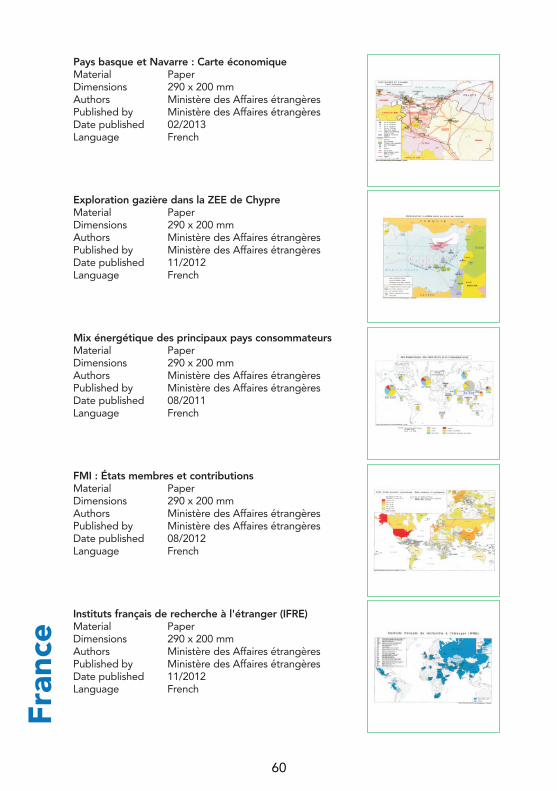
Pays basque et Navarre : Carte économiqueMaterial PaperDimensions 290 x 200 mmAuthors Ministère des Affaires étrangèresPublished by Ministère des Affaires étrangèresDate published 02/2013Language French
Exploration gazière dans la ZEE de ChypreMaterial PaperDimensions 290 x 200 mmAuthors Ministère des Affaires étrangèresPublished by Ministère des Affaires étrangèresDate published 11/2012Language French
Mix énergétique des principaux pays consommateursMaterial PaperDimensions 290 x 200 mmAuthors Ministère des Affaires étrangèresPublished by Ministère des Affaires étrangèresDate published 08/2011Language French
FMI : États membres et contributionsMaterial PaperDimensions 290 x 200 mmAuthors Ministère des Affaires étrangèresPublished by Ministère des Affaires étrangèresDate published 08/2012Language French
Instituts français de recherche à l'étranger (IFRE)Material PaperDimensions 290 x 200 mmAuthors Ministère des Affaires étrangèresPublished by Ministère des Affaires étrangèresDate published 11/2012Language French
Fran
ce
60
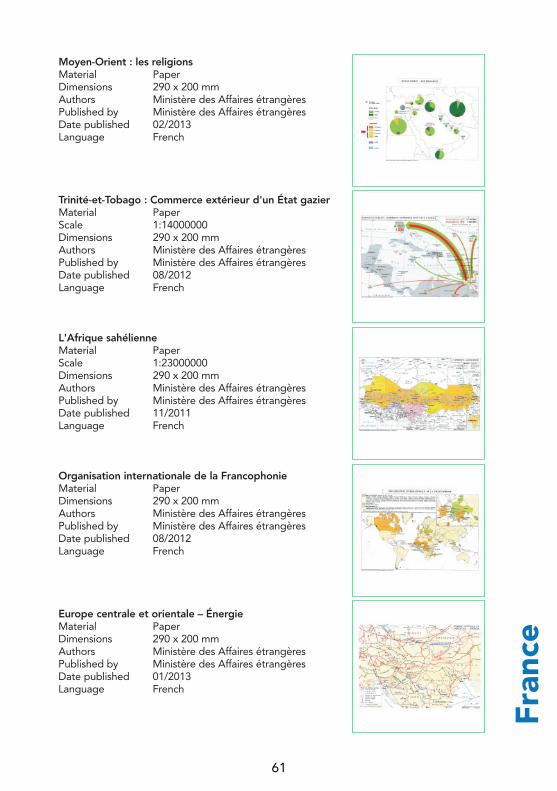
Fran
ce
Moyen-Orient : les religionsMaterial PaperDimensions 290 x 200 mmAuthors Ministère des Affaires étrangèresPublished by Ministère des Affaires étrangèresDate published 02/2013Language French
Trinité-et-Tobago : Commerce extérieur d'un État gazierMaterial PaperScale 1:14000000Dimensions 290 x 200 mmAuthors Ministère des Affaires étrangèresPublished by Ministère des Affaires étrangèresDate published 08/2012Language French
L'Afrique sahélienneMaterial PaperScale 1:23000000Dimensions 290 x 200 mmAuthors Ministère des Affaires étrangèresPublished by Ministère des Affaires étrangèresDate published 11/2011Language French
Organisation internationale de la FrancophonieMaterial PaperDimensions 290 x 200 mmAuthors Ministère des Affaires étrangèresPublished by Ministère des Affaires étrangèresDate published 08/2012Language French
Europe centrale et orientale – ÉnergieMaterial PaperDimensions 290 x 200 mmAuthors Ministère des Affaires étrangèresPublished by Ministère des Affaires étrangèresDate published 01/2013Language French
61
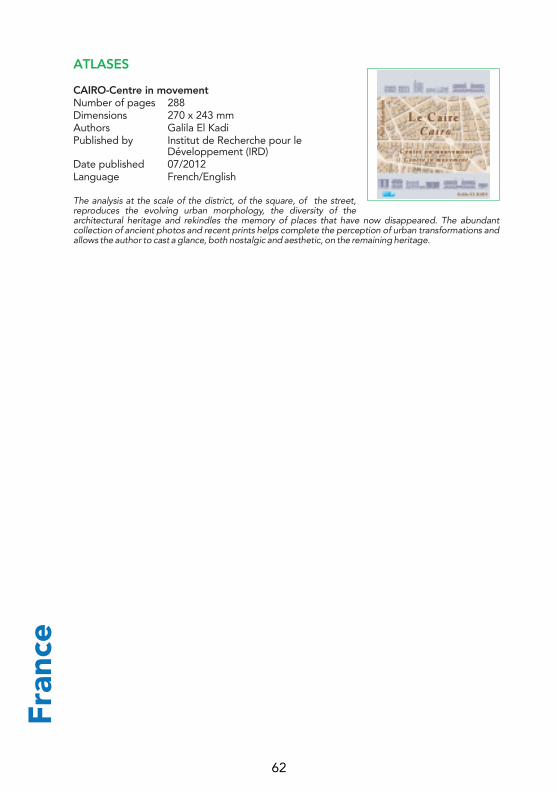
ATLASES
CAIRO-Centre in movementNumber of pages 288Dimensions 270 x 243 mmAuthors Galila El KadiPublished by Institut de Recherche pour le
Développement (IRD)Date published 07/2012Language French/English
The analysis at the scale of the district, of the square, of the street, reproduces the evolving urban morphology, the diversity of the architectural heritage and rekindles the memory of places that have now disappeared. The abundant collection of ancient photos and recent prints helps complete the perception of urban transformations and allows the author to cast a glance, both nostalgic and aesthetic, on the remaining heritage.
Fran
ce
62

MAPS
Road map at the 1:350 000 scale SouthWest FranceMaterial PaperScale 1:350 000Dimensions 1320 x 1000 mmAuthors IGN FrancePublished by IGN FranceDate published 11/2012Language French, German, English
The new division of France into 4 road maps at the 1:350 000 scale derived from IGN regional maps at the 1:250 000 scale. All the roads and localities have been selected semi-automatically. This scale range had been abandoned by IGN for over 150 years.
French Guiana map at the 1:50 000 scale E793 SaülMaterial PaperScale 1:50 000Dimensions 1320 x 780 mmAuthors IGN FrancePublished by IGN FranceDate published 10/2011Language French, English
Central French Guiana: First complete coverage of the largest French department at the 1:50 000 scale (82 000 km²). It was derived from a vector database and an SRTM altimetric model. All the mapping was produced in 1 year by means of a fully automated production process.
French Guiana map at the1:50 000 scale E793 South KourouMaterial PaperScale 1:50 000Dimensions 1320 x 780 mmAuthors IGN FrancePublished by IGN FranceDate published 12/2011Language French, English
French Guiana Coastal Areas: First complete coverage of the largest French department at the 1:50 000 scale (1/6th the size of Continental France). It was derived from a vector database and an SRTM altimetric model. All the mapping was produced in 1 year by means of a fully automated production process.
Fran
ce
IGN
Fra
nce
63
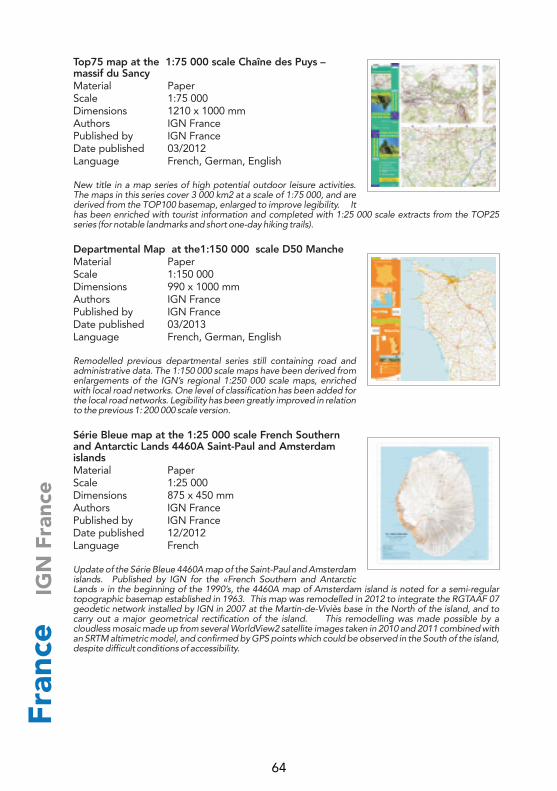
Top75 map at the 1:75 000 scale Chaîne des Puys – massif du SancyMaterial PaperScale 1:75 000Dimensions 1210 x 1000 mmAuthors IGN FrancePublished by IGN FranceDate published 03/2012Language French, German, English
New title in a map series of high potential outdoor leisure activities. The maps in this series cover 3 000 km2 at a scale of 1:75 000, and are derived from the TOP100 basemap, enlarged to improve legibility. It has been enriched with tourist information and completed with 1:25 000 scale extracts from the TOP25 series (for notable landmarks and short one-day hiking trails).
Departmental Map at the1:150 000 scale D50 MancheMaterial PaperScale 1:150 000Dimensions 990 x 1000 mmAuthors IGN FrancePublished by IGN FranceDate published 03/2013Language French, German, English
Remodelled previous departmental series still containing road and administrative data. The 1:150 000 scale maps have been derived from enlargements of the IGN’s regional 1:250 000 scale maps, enriched with local road networks. One level of classification has been added for the local road networks. Legibility has been greatly improved in relation to the previous 1: 200 000 scale version.
Série Bleue map at the 1:25 000 scale French Southern and Antarctic Lands 4460A Saint-Paul and Amsterdam islandsMaterial PaperScale 1:25 000Dimensions 875 x 450 mmAuthors IGN FrancePublished by IGN FranceDate published 12/2012Language French
Update of the Série Bleue 4460A map of the Saint-Paul and Amsterdam islands. Published by IGN for the «French Southern and Antarctic Lands » in the beginning of the 1990’s, the 4460A map of Amsterdam island is noted for a semi-regular topographic basemap established in 1963. This map was remodelled in 2012 to integrate the RGTAAF 07 geodetic network installed by IGN in 2007 at the Martin-de-Viviès base in the North of the island, and to carry out a major geometrical rectification of the island. This remodelling was made possible by a cloudless mosaic made up from several WorldView2 satellite images taken in 2010 and 2011 combined with an SRTM altimetric model, and confirmed by GPS points which could be observed in the South of the island, despite difficult conditions of accessibility.
Fran
ce
IGN
Fra
nce
64
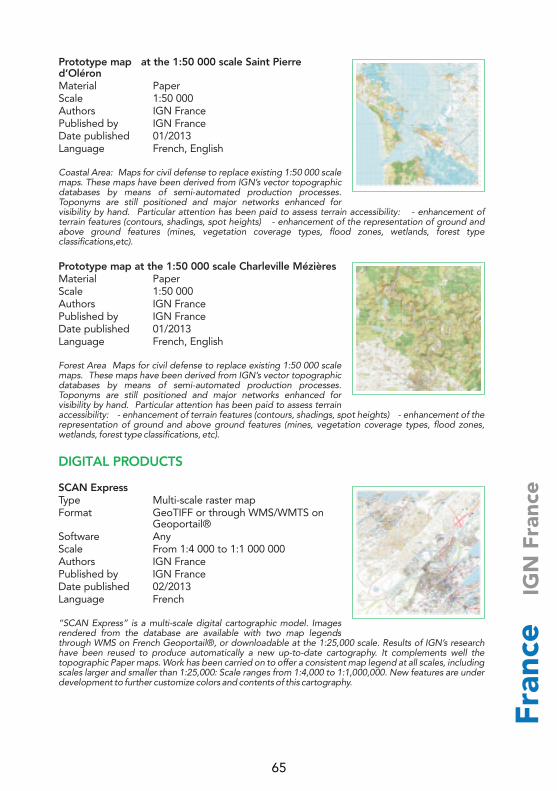
Fran
ce
IGN
Fra
nce
Prototype map at the 1:50 000 scale Saint Pierre d’OléronMaterial PaperScale 1:50 000Authors IGN FrancePublished by IGN FranceDate published 01/2013Language French, English
Coastal Area: Maps for civil defense to replace existing 1:50 000 scale maps. These maps have been derived from IGN’s vector topographic databases by means of semi-automated production processes. Toponyms are still positioned and major networks enhanced for visibility by hand. Particular attention has been paid to assess terrain accessibility: - enhancement of terrain features (contours, shadings, spot heights) - enhancement of the representation of ground and above ground features (mines, vegetation coverage types, flood zones, wetlands, forest type classifications,etc).
Prototype map at the 1:50 000 scale Charleville MézièresMaterial PaperScale 1:50 000Authors IGN FrancePublished by IGN FranceDate published 01/2013Language French, English
Forest Area Maps for civil defense to replace existing 1:50 000 scale maps. These maps have been derived from IGN’s vector topographic databases by means of semi-automated production processes. Toponyms are still positioned and major networks enhanced for visibility by hand. Particular attention has been paid to assess terrain accessibility: - enhancement of terrain features (contours, shadings, spot heights) - enhancement of the representation of ground and above ground features (mines, vegetation coverage types, flood zones, wetlands, forest type classifications, etc).
SCAN ExpressType Multi-scale raster mapFormat GeoTIFF or through WMS/WMTS on
Geoportail®Software AnyScale From 1:4 000 to 1:1 000 000Authors IGN FrancePublished by IGN FranceDate published 02/2013Language French
“SCAN Express” is a multi-scale digital cartographic model. Images rendered from the database are available with two map legends through WMS on French Geoportail®, or downloadable at the 1:25,000 scale. Results of IGN’s research have been reused to produce automatically a new up-to-date cartography. It complements well the topographic Paper maps. Work has been carried on to offer a consistent map legend at all scales, including scales larger and smaller than 1:25,000: Scale ranges from 1:4,000 to 1:1,000,000. New features are under development to further customize colors and contents of this cartography.
DIGITAL PRODUCTS
65
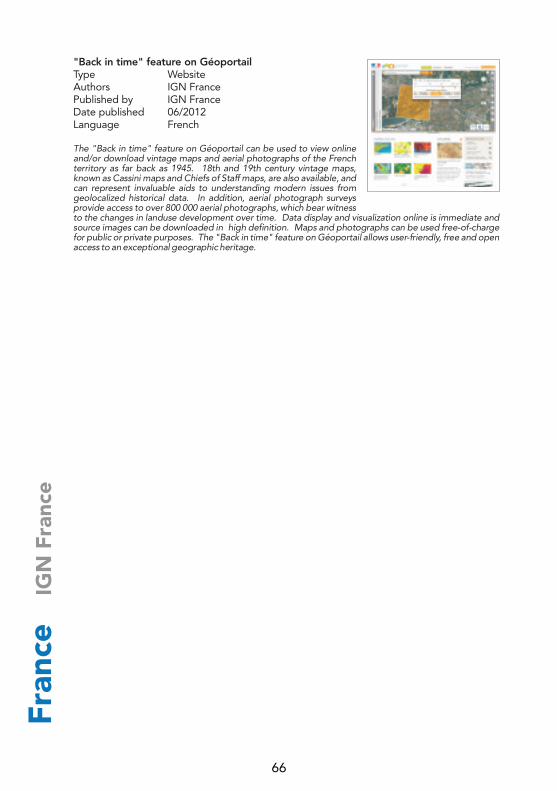
"Back in time" feature on GéoportailType WebsiteAuthors IGN FrancePublished by IGN FranceDate published 06/2012Language French
The "Back in time" feature on Géoportail can be used to view online and/or download vintage maps and aerial photographs of the French territory as far back as 1945. 18th and 19th century vintage maps, known as Cassini maps and Chiefs of Staff maps, are also available, and can represent invaluable aids to understanding modern issues from geolocalized historical data. In addition, aerial photograph surveys provide access to over 800 000 aerial photographs, which bear witness to the changes in landuse development over time. Data display and visualization online is immediate and source images can be downloaded in high definition. Maps and photographs can be used free-of-charge for public or private purposes. The "Back in time" feature on Géoportail allows user-friendly, free and open access to an exceptional geographic heritage.
Fran
ce
IGN
Fra
nce
66
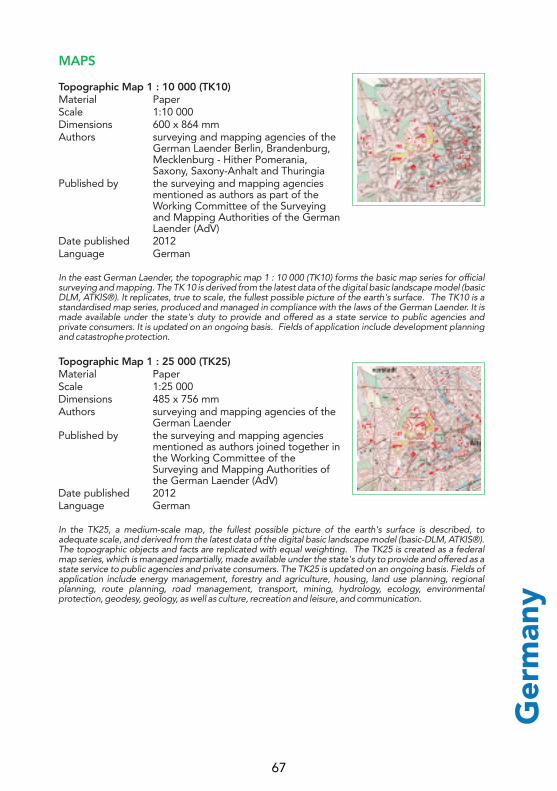
Ger
man
y
MAPS
Topographic Map 1 : 10 000 (TK10)Material PaperScale 1:10 000Dimensions 600 x 864 mmAuthors surveying and mapping agencies of the
German Laender Berlin, Brandenburg, Mecklenburg - Hither Pomerania, Saxony, Saxony-Anhalt and Thuringia
Published by the surveying and mapping agencies mentioned as authors as part of the Working Committee of the Surveying and Mapping Authorities of the German Laender (AdV)
Date published 2012Language German
In the east German Laender, the topographic map 1 : 10 000 (TK10) forms the basic map series for official surveying and mapping. The TK 10 is derived from the latest data of the digital basic landscape model (basic DLM, ATKIS®). It replicates, true to scale, the fullest possible picture of the earth's surface. The TK10 is a standardised map series, produced and managed in compliance with the laws of the German Laender. It is made available under the state's duty to provide and offered as a state service to public agencies and private consumers. It is updated on an ongoing basis. Fields of application include development planning and catastrophe protection.
Topographic Map 1 : 25 000 (TK25)Material PaperScale 1:25 000Dimensions 485 x 756 mmAuthors surveying and mapping agencies of the
German LaenderPublished by the surveying and mapping agencies
mentioned as authors joined together in the Working Committee of the Surveying and Mapping Authorities of the German Laender (AdV)
Date published 2012Language German
In the TK25, a medium-scale map, the fullest possible picture of the earth's surface is described, to adequate scale, and derived from the latest data of the digital basic landscape model (basic-DLM, ATKIS®). The topographic objects and facts are replicated with equal weighting. The TK25 is created as a federal map series, which is managed impartially, made available under the state's duty to provide and offered as a state service to public agencies and private consumers. The TK25 is updated on an ongoing basis. Fields of application include energy management, forestry and agriculture, housing, land use planning, regional planning, route planning, road management, transport, mining, hydrology, ecology, environmental protection, geodesy, geology, as well as culture, recreation and leisure, and communication.
67
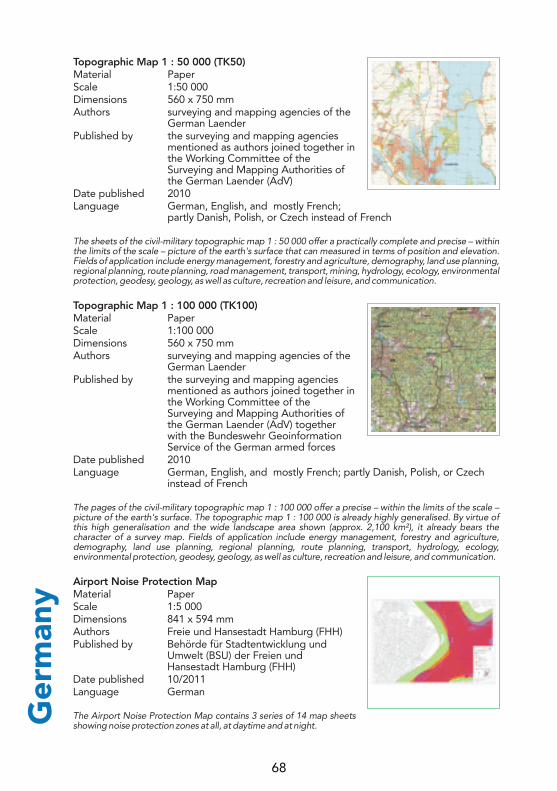
Topographic Map 1 : 50 000 (TK50)Material PaperScale 1:50 000Dimensions 560 x 750 mmAuthors surveying and mapping agencies of the
German LaenderPublished by the surveying and mapping agencies
mentioned as authors joined together in the Working Committee of the Surveying and Mapping Authorities of the German Laender (AdV)
Date published 2010Language German, English, and mostly French;
partly Danish, Polish, or Czech instead of French
The sheets of the civil-military topographic map 1 : 50 000 offer a practically complete and precise – within the limits of the scale – picture of the earth's surface that can measured in terms of position and elevation. Fields of application include energy management, forestry and agriculture, demography, land use planning, regional planning, route planning, road management, transport, mining, hydrology, ecology, environmental protection, geodesy, geology, as well as culture, recreation and leisure, and communication.
Topographic Map 1 : 100 000 (TK100)Material PaperScale 1:100 000Dimensions 560 x 750 mmAuthors surveying and mapping agencies of the
German LaenderPublished by the surveying and mapping agencies
mentioned as authors joined together in the Working Committee of the Surveying and Mapping Authorities of the German Laender (AdV) together with the Bundeswehr Geoinformation Service of the German armed forces
Date published 2010Language German, English, and mostly French; partly Danish, Polish, or Czech
instead of French
The pages of the civil-military topographic map 1 : 100 000 offer a precise – within the limits of the scale – picture of the earth's surface. The topographic map 1 : 100 000 is already highly generalised. By virtue of this high generalisation and the wide landscape area shown (approx. 2,100 km²), it already bears the character of a survey map. Fields of application include energy management, forestry and agriculture, demography, land use planning, regional planning, route planning, transport, hydrology, ecology, environmental protection, geodesy, geology, as well as culture, recreation and leisure, and communication.
Airport Noise Protection MapMaterial PaperScale 1:5 000Dimensions 841 x 594 mmAuthors Freie und Hansestadt Hamburg (FHH)Published by Behörde für Stadtentwicklung und
Umwelt (BSU) der Freien und Hansestadt Hamburg (FHH)
Date published 10/2011Language German
The Airport Noise Protection Map contains 3 series of 14 map sheets showing noise protection zones at all, at daytime and at night.Ger
man
y
68
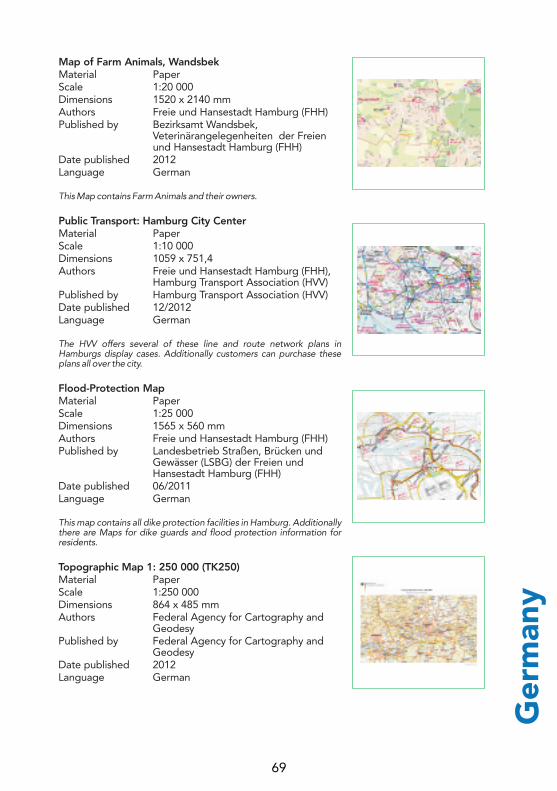
Ger
man
y
Map of Farm Animals, WandsbekMaterial PaperScale 1:20 000Dimensions 1520 x 2140 mmAuthors Freie und Hansestadt Hamburg (FHH)Published by Bezirksamt Wandsbek,
Veterinärangelegenheiten der Freien und Hansestadt Hamburg (FHH)
Date published 2012Language German
This Map contains Farm Animals and their owners.
Public Transport: Hamburg City CenterMaterial PaperScale 1:10 000Dimensions 1059 x 751,4Authors Freie und Hansestadt Hamburg (FHH),
Hamburg Transport Association (HVV)Published by Hamburg Transport Association (HVV)Date published 12/2012Language German
The HVV offers several of these line and route network plans in Hamburgs display cases. Additionally customers can purchase these plans all over the city.
Flood-Protection MapMaterial PaperScale 1:25 000Dimensions 1565 x 560 mmAuthors Freie und Hansestadt Hamburg (FHH)Published by Landesbetrieb Straßen, Brücken und
Gewässer (LSBG) der Freien und Hansestadt Hamburg (FHH)
Date published 06/2011Language German
This map contains all dike protection facilities in Hamburg. Additionally there are Maps for dike guards and flood protection information for residents.
Topographic Map 1: 250 000 (TK250)Material PaperScale 1:250 000Dimensions 864 x 485 mmAuthors Federal Agency for Cartography and
GeodesyPublished by Federal Agency for Cartography and
GeodesyDate published 2012Language German
69
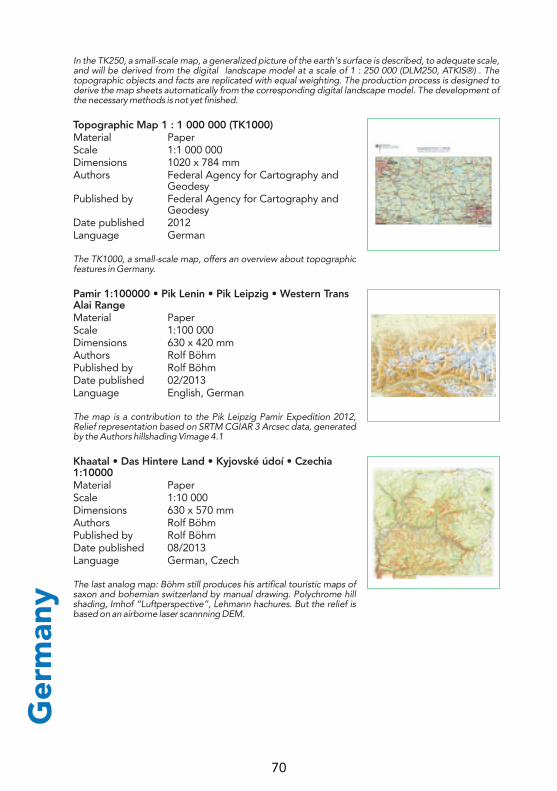
In the TK250, a small-scale map, a generalized picture of the earth's surface is described, to adequate scale, and will be derived from the digital landscape model at a scale of 1 : 250 000 (DLM250, ATKIS®) . The topographic objects and facts are replicated with equal weighting. The production process is designed to derive the map sheets automatically from the corresponding digital landscape model. The development of the necessary methods is not yet finished.
Topographic Map 1 : 1 000 000 (TK1000)Material PaperScale 1:1 000 000Dimensions 1020 x 784 mmAuthors Federal Agency for Cartography and
GeodesyPublished by Federal Agency for Cartography and
GeodesyDate published 2012Language German
The TK1000, a small-scale map, offers an overview about topographic features in Germany.
Pamir 1:100000 • Pik Lenin • Pik Leipzig • Western Trans Alai RangeMaterial PaperScale 1:100 000Dimensions 630 x 420 mmAuthors Rolf BöhmPublished by Rolf BöhmDate published 02/2013Language English, German
The map is a contribution to the Pik Leipzig Pamir Expedition 2012, Relief representation based on SRTM CGIAR 3 Arcsec data, generated by the Authors hillshading Vimage 4.1
Khaatal • Das Hintere Land • Kyjovské údoí • Czechia 1:10000Material PaperScale 1:10 000Dimensions 630 x 570 mmAuthors Rolf BöhmPublished by Rolf BöhmDate published 08/2013Language German, Czech
The last analog map: Böhm still produces his artifical touristic maps of saxon and bohemian switzerland by manual drawing. Polychrome hill shading, Imhof “Luftperspective”, Lehmann hachures. But the relief is based on an airborne laser scannning DEM.
Ger
man
y
70

Ger
man
y
Khumbu Himal, Shorong / HinkuMaterial PaperScale 1:50 000Dimensions 1180 x 840 mmAuthors TU DresdenPublished by Scientific Association for Comparative
High-Mountain Research MunichDate published 03/2013Language English, German
Taking over the tradition of the world famous Nepal maps from the Scientific Association for Comparative High-Mountain Research, the Institute of Cartography of the TUD has completely redesigned these two mountain maps from the years 1965 and 1974. Settlements and road network as well as the glacier extents are updated on the basis of extensive field work and the analysis of current satellite images. Additionally touristic information is presented the first time within the maps. The analogous maps were digitised and transferred into a digital GIS-based map production process. The main focus of the maps is set on the Everest trail, which starts at Himalaya airport Lukla, going around Namche Bazar to the north ending at the Everest Base Camp.
Wissenschaftsatlas of Heidelberg University - Spatio-temporal relations of academic knowledge productionNumber of pages 392Dimensions 300 x 350 mmPublished by Department of Geography of
Heidelberg University and Leibniz Institute for Regional Geography Leipzig; published by Peter Meusburger and Thomas Schuch on behalf of Rector Bernhard Eitel
Date published 06/2012Language English
The Wissenschaftsatlas of Heidelberg University is the expanded and revised English edition from Meusburger, P. & Schuch, T. (Ed.) (2011): Wissenschaftsatlas der Universität Heidelberg. Knittlingen, BIBLIOTHEKA PALATINA. The atlas in its German edition was produced to celebrate the 625th anniversary of Heidelberg University in 2011. The atlas presents a large number of maps about history and present of Heidelberg University and its surrounding. With its consistently spatial perspective this festschrift is unconventional.
Diercke International AtlasNumber of pages 227Authors www.diercke.comPublished by Westermann VerlagDate published 2009Language English
For the first time, an English atlas includes physical and economic maps with worldwide coverage. The broad range of examples covers different learning levels. The interdisciplinary approach allows the use of the atlas both in English lessons as well as in bilingual classes.
ATLASES
71

DIGITAL PRODUCTS
Web Atlas Germany (WebAtlasDE)Type Web applicationFormat Tiles in a web map tile serviceSoftware VariousScale 10 different layers in scales from
1 : 2 000 to 1 : 5 000 000Authors Surveying and mapping agencies of the
german Laender together with the Federal Agency for Cartography and Geodesy (BKG)
Published by The surveying and mapping agencies mentioned as authors joined together in the Working Committee of the Surveying and Mapping Authorities of the German Laender (AdV)
Date published 2012Language German
With WebAtlasDE, the federal government and its Laender provide an official Internet-based map service across the whole of Germany. Standardised map characteristics, zoom levels spanning from single building view to a map of Germany and an effective display speed set this service apart. The cartographic representation is based on the geometries of the continued digital landscape model (DLM) of the surveying and mapping authorities of the Laender and of the Federal Agency for Cartography and Geodesy, and on the data in the real estate cadastre. WebAtlasDE is offered as a Web Map Tile Service in both colour and grey-scale versions for internal commercial and private use.
hamburg.deType Web mapFormat Web mapping service (wms)Software Web browser (platform independent)Scale 1:1 000-1:250 000Authors Freie und Hansestadt Hamburg (FHH)Published by LGV Hamburg & hamburg.deDate published 01/2013Language German
Hamburgs web mapping service has been created automatically from the Authoritative Topographic-Cartographic Information System (ATKIS®) and the Authoritative Real Estate Cadastre Information System (ALKIS®). It is the base map for thematic wms in Hamburg, i.e. bike routes.
Sibirien Baikalsee • Siberia Lake BaikalType Raster MapFormat DIN A 2Software Vimage 4.1Scale ca. 1:500 000Authors Rolf BöhmPublished by Unpublished
A famous relief representation, composited by/containing a monochrome Lambert hill shading, a polychrome Cynthia Brewer hill shading and a Imhof “Luftperspektive” simulation by means of a adaptive filter algorithm.
Ger
man
y
72
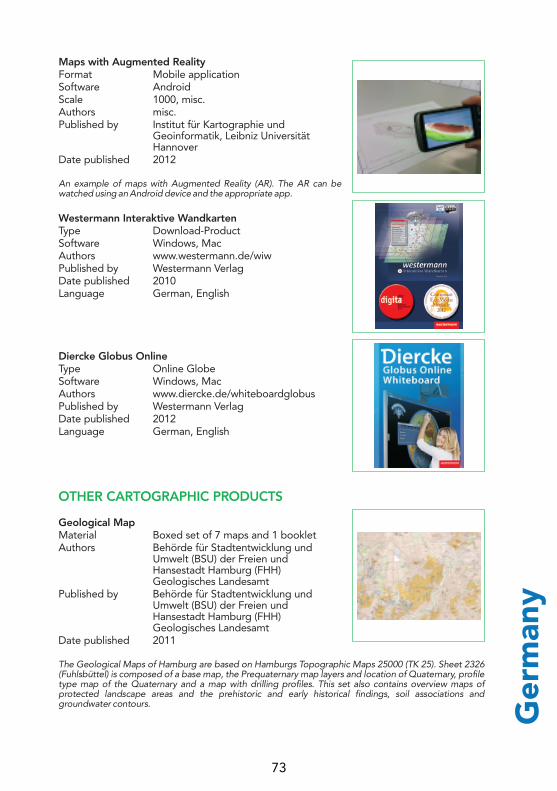
Ger
man
y
Maps with Augmented RealityFormat Mobile applicationSoftware AndroidScale 1000, misc.Authors misc.Published by Institut für Kartographie und
Geoinformatik, Leibniz Universität Hannover
Date published 2012
An example of maps with Augmented Reality (AR). The AR can be watched using an Android device and the appropriate app.
Westermann Interaktive WandkartenType Download-ProductSoftware Windows, MacAuthors www.westermann.de/wiwPublished by Westermann VerlagDate published 2010Language German, English
Diercke Globus OnlineType Online GlobeSoftware Windows, MacAuthors www.diercke.de/whiteboardglobusPublished by Westermann VerlagDate published 2012Language German, English
Geological MapMaterial Boxed set of 7 maps and 1 bookletAuthors Behörde für Stadtentwicklung und
Umwelt (BSU) der Freien und Hansestadt Hamburg (FHH) Geologisches Landesamt
Published by Behörde für Stadtentwicklung und Umwelt (BSU) der Freien und Hansestadt Hamburg (FHH) Geologisches Landesamt
Date published 2011
The Geological Maps of Hamburg are based on Hamburgs Topographic Maps 25000 (TK 25). Sheet 2326 (Fuhlsbüttel) is composed of a base map, the Prequaternary map layers and location of Quaternary, profile type map of the Quaternary and a map with drilling profiles. This set also contains overview maps of protected landscape areas and the prehistoric and early historical findings, soil associations and groundwater contours.
OTHER CARTOGRAPHIC PRODUCTS
73
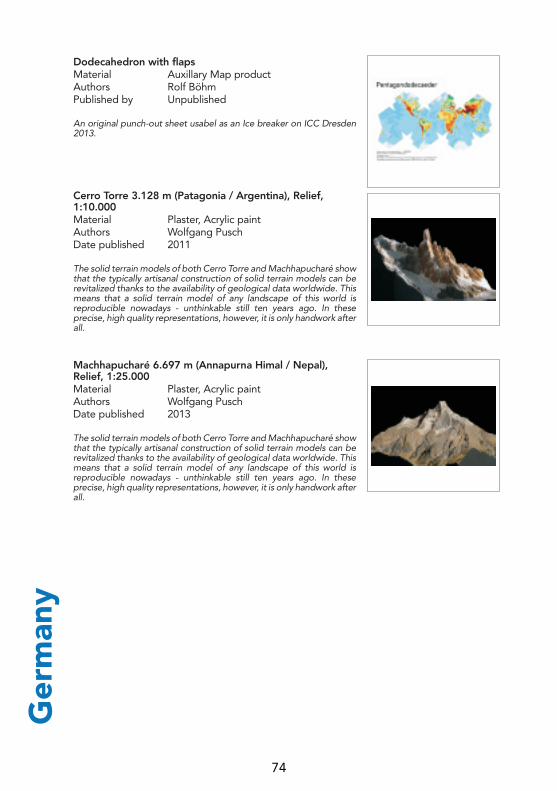
Dodecahedron with flapsMaterial Auxillary Map productAuthors Rolf BöhmPublished by Unpublished
An original punch-out sheet usabel as an Ice breaker on ICC Dresden 2013.
Cerro Torre 3.128 m (Patagonia / Argentina), Relief, 1:10.000Material Plaster, Acrylic paintAuthors Wolfgang PuschDate published 2011
The solid terrain models of both Cerro Torre and Machhapucharé show that the typically artisanal construction of solid terrain models can be revitalized thanks to the availability of geological data worldwide. This means that a solid terrain model of any landscape of this world is reproducible nowadays - unthinkable still ten years ago. In these precise, high quality representations, however, it is only handwork after all.
Machhapucharé 6.697 m (Annapurna Himal / Nepal), Relief, 1:25.000Material Plaster, Acrylic paintAuthors Wolfgang PuschDate published 2013
The solid terrain models of both Cerro Torre and Machhapucharé show that the typically artisanal construction of solid terrain models can be revitalized thanks to the availability of geological data worldwide. This means that a solid terrain model of any landscape of this world is reproducible nowadays - unthinkable still ten years ago. In these precise, high quality representations, however, it is only handwork after all.
Ger
man
y
74

Gre
ece
MAPS
Map of Magnisia Prefecture, GreeceMaterial PaperScale 1:100 000Dimensions 950 x 713 mmAuthors Chrysoula Boutoura, Angeliki Tsorlini,
Vasiliki Zografopoulou, E.LivieratosPublished by Department of Cadastre,
Photogrammetry, Cartography - School of Rural and Surveying Engineering - Faculty of Engineering - 1Aristotle University of Thessaloniki
Date published 03/2013Language Greek
The map of Magnisia prefecture is constructed on two overlapping sheets at scale 1:100000, following the methodology developed for the production of maps in the Department of Cadastre, Photogrammetry and Cartography of School of Rural and Surveying Engineering, Aristotle University of Thessaloniki. The map combines appropriately the content of the existing topographic map-sheets by Hellenic Military Geographical Service, satellite images as well as the recently available geodata provided through the National Geospatial Infrastructure, following a specific procedure in order all these data to be homogenized. The result is a map geometrically accurate, as its scale requires and graphically attractive, depicting the physical characteristics of the prefecture, highlighting areas of special environmental interest.
Map of Magnisia Prefecture, GreeceMaterial PaperScale 1:100 000Dimensions 950 x 713 mmAuthors Chrysoula Boutoura, Angeliki Tsorlini,
Vasiliki Zografopoulou, E.LivieratosPublished by Department of Cadastre,
Photogrammetry, Cartography - School of Rural and Surveying Engineering - Faculty of Engineering - 1Aristotle University of Thessaloniki
Date published 03/2013Language Greek
The map of Magnisia prefecture is constructed on two overlapping sheets in scale 1:100000, following the methodology developed for the production of maps in the Department of Cadastre, Photogrammetry and Cartography of School of Rural and Surveying Engineering, Aristotle University of Thessaloniki. The map combines appropriately the content of the existing topographic map-sheets by Hellenic Military Geographical Service, satellite images as well as the recently available geodata provided through the National Geospatial Infrastructure, following a specific procedure in order all these data to be homogenized. The result is a map geometrically accurate, as its scale requires and graphically atractive, depicting the physical characteristics of the prefecture, highlighting areas of special environmental interest.
75

XEE 415/3 KIMOLOS STRAITSMaterial PaperScale 1:15 000Dimensions 830 x 580 mmPublished by Hellenic Navy Hydrographic ServiceDate published 04/2012Language Greek, English
This chart has been designed and published by the Hellenic Navy Hydrographic Service (HNHS), using data from the Electronic Navigational Charts (ENCs) database. Thus it is harmonized with the relevant ENC in the area. HNHS used semi automated techniques to produce the chart (dKart Publisher v.3.2) achieving to reduce considerably the production time . HNHS, in the design of XEE 415/3, has implemented the latest version of IHO’s specification S4 Ed. 3.0. It is pointed out that one of the major changes is the portrayal of the “Zone of Confidence (ZOC) diagram”, instead of the traditional Source diagram. Moreover, this chart is the first with colors that better support the mariner’s needs.
Acropolis of AthensMaterial PaperScale 1/800Dimensions 881 x 740 mmAuthors Chrysaeidis L., Georgosouli A.Published by KTIMATOLOGIO S.A.Date published 03/2013Language English
Very Large Scale Orthophotos (VLSO): R,G,B true orthophoto product (GSD: 20cm) that covers ~ 4,000 SqKm of the major urban areas of Greece. The geometric accuracy of the specific product is the following: RMSE of known ground points measured on the image RMSEx = RMSEy <= 0.20 m (1 pixel), RMSExy <= 0.28m, Absolute Accuracy <= 0.48m (95% confidence level accuracy). Leica ADS40 aerial sensor has been used for the raw imagery data collection. Period of aerial photography 2007-2008. Geodetical Datum: ETRS89.
The Old City of KavalaMaterial HP Universal High-gloss Photo PaperScale 1/1000Dimensions 867 x 1194 mmAuthors Chrysaeidis L., Georgosouli A.Published by KTIMATOLOGIO S.A.Date published 03/2013Language English
Very Large Scale Orthophotos (VLSO): R,G,B true orthophoto product (GSD: 20cm) that covers ~ 4,000 SqKm of the major urban areas of Greece. The geometric accuracy of the specific product is the following: RMSE of known ground points measured on the image RMSEx = RMSEy <= 0.20 m (1 pixel), RMSExy <= 0.28m, Absolute Accuracy <= 0.48m (95% confidence level accuracy). Leica ADS40 aerial sensor has been used for the raw imagery data collection. Period of aerial photography 2007-2008. Geodetical Datum: ETRS89
Gre
ece
76
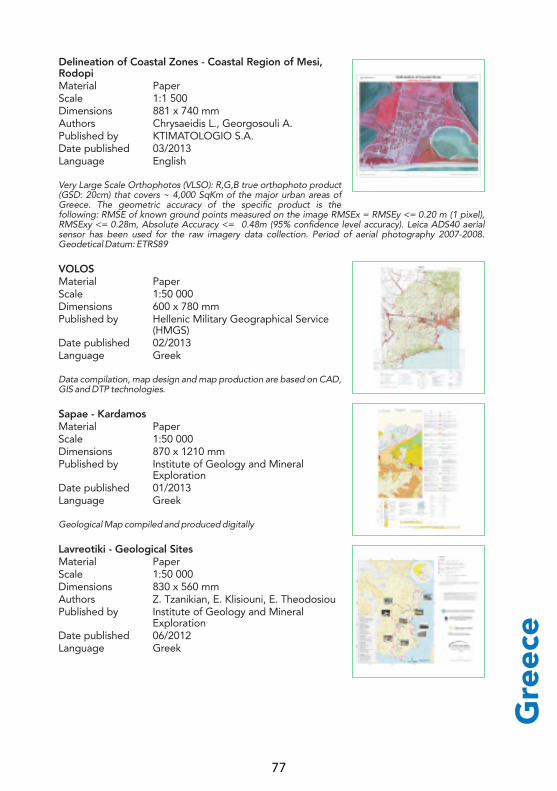
Gre
ece
Delineation of Coastal Zones - Coastal Region of Mesi, RodopiMaterial PaperScale 1:1 500Dimensions 881 x 740 mmAuthors Chrysaeidis L., Georgosouli A.Published by KTIMATOLOGIO S.A.Date published 03/2013Language English
Very Large Scale Orthophotos (VLSO): R,G,B true orthophoto product (GSD: 20cm) that covers ~ 4,000 SqKm of the major urban areas of Greece. The geometric accuracy of the specific product is the following: RMSE of known ground points measured on the image RMSEx = RMSEy <= 0.20 m (1 pixel), RMSExy <= 0.28m, Absolute Accuracy <= 0.48m (95% confidence level accuracy). Leica ADS40 aerial sensor has been used for the raw imagery data collection. Period of aerial photography 2007-2008. Geodetical Datum: ETRS89
VOLOSMaterial PaperScale 1:50 000Dimensions 600 x 780 mmPublished by Hellenic Military Geographical Service
(HMGS)Date published 02/2013Language Greek
Data compilation, map design and map production are based on CAD, GIS and DTP technologies.
Sapae - KardamosMaterial PaperScale 1:50 000Dimensions 870 x 1210 mmPublished by Institute of Geology and Mineral
ExplorationDate published 01/2013Language Greek
Geological Map compiled and produced digitally
Lavreotiki - Geological SitesMaterial PaperScale 1:50 000Dimensions 830 x 560 mmAuthors Z. Tzanikian, E. Klisiouni, E. TheodosiouPublished by Institute of Geology and Mineral
ExplorationDate published 06/2012Language Greek
77

MAPS
1:20 000 Topographic Map (Series HM20C) [Sheet 7]Material PaperScale 1:20 000Dimensions 980 x 685 mmAuthors Survey and Mapping Office, Lands
Department, Government of Hong Kong Special Administrative Region
Published by Survey and Mapping Office, Lands Department, Government of Hong Kong Special Administrative Region
Date published 2013Language Chinese, English
HM20C Series is a medium scale map with 16 sheets covering the whole Hong Kong territory. It depicts topography with contours at 20m interval. This general purpose map series serves many uses such as planning, teaching and orienteering.
1:5 000 Topographic Map (Series HP5C) [Cheung Chau]Material PaperScale 1:5 000Dimensions 850 x 750 mmAuthors Survey and Mapping Office, Lands
Department, Government of Hong Kong Special Administrative Region
Published by Survey and Mapping Office, Lands Department, Government of Hong Kong Special Administrative Region
Date published 2013Language Chinese, English
The black and white version of 1:5000 map series namely HP5C consists of 167 sheets which are compiled from 1: 1000 basic map series with the map details generalized. Contours are shown at 10m interval. It is a general purpose medium scale derived map for use by the architects, engineers, planners, developers, etc.
1:5 000 Topographic Map (Series HP5CL) [Sheet 11-SE-D]Material PaperScale 1:5 000Dimensions 850 x 750 mmAuthors Survey and Mapping Office, Lands
Department, Government of Hong Kong Special Administrative Region
Published by Survey and Mapping Office, Lands Department, Government of Hong Kong Special Administrative Region
Date published 2013Language Chinese, English
The colour version of 1:5000 map series namely HP5CL consists of 167 sheets which are compiled from 1: 1000 basic map series with the map details generalized. The colours and patterns used illustrate feature hierarchy and magnitude. Contours are shown at 10m interval. It is a general purpose medium scale derived map for use by the architects, engineers, planners, developers, etc.
Ho
ng K
ong
78
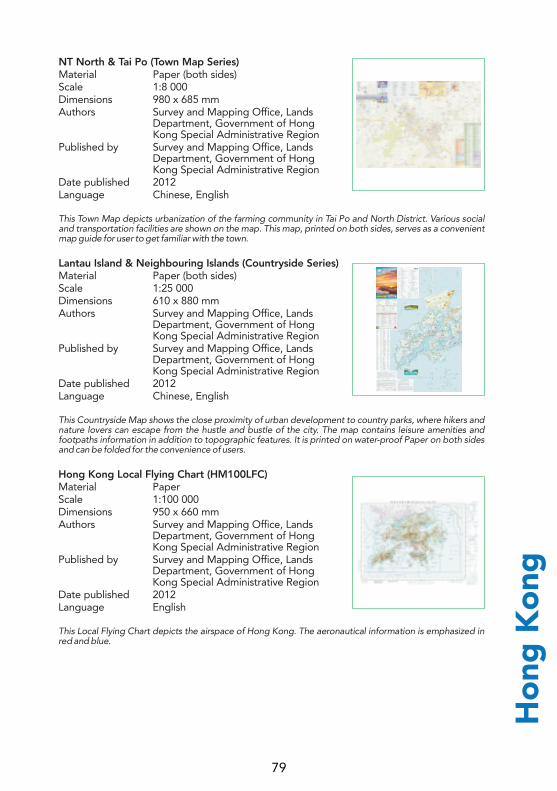
Ho
ng K
ong
NT North & Tai Po (Town Map Series)Material Paper (both sides)Scale 1:8 000Dimensions 980 x 685 mmAuthors Survey and Mapping Office, Lands
Department, Government of Hong Kong Special Administrative Region
Published by Survey and Mapping Office, Lands Department, Government of Hong Kong Special Administrative Region
Date published 2012Language Chinese, English
This Town Map depicts urbanization of the farming community in Tai Po and North District. Various social and transportation facilities are shown on the map. This map, printed on both sides, serves as a convenient map guide for user to get familiar with the town.
Lantau Island & Neighbouring Islands (Countryside Series)Material Paper (both sides)Scale 1:25 000Dimensions 610 x 880 mmAuthors Survey and Mapping Office, Lands
Department, Government of Hong Kong Special Administrative Region
Published by Survey and Mapping Office, Lands Department, Government of Hong Kong Special Administrative Region
Date published 2012Language Chinese, English
This Countryside Map shows the close proximity of urban development to country parks, where hikers and nature lovers can escape from the hustle and bustle of the city. The map contains leisure amenities and footpaths information in addition to topographic features. It is printed on water-proof Paper on both sides and can be folded for the convenience of users.
Hong Kong Local Flying Chart (HM100LFC)Material PaperScale 1:100 000Dimensions 950 x 660 mmAuthors Survey and Mapping Office, Lands
Department, Government of Hong Kong Special Administrative Region
Published by Survey and Mapping Office, Lands Department, Government of Hong Kong Special Administrative Region
Date published 2012Language English
This Local Flying Chart depicts the airspace of Hong Kong. The aeronautical information is emphasized in red and blue.
79
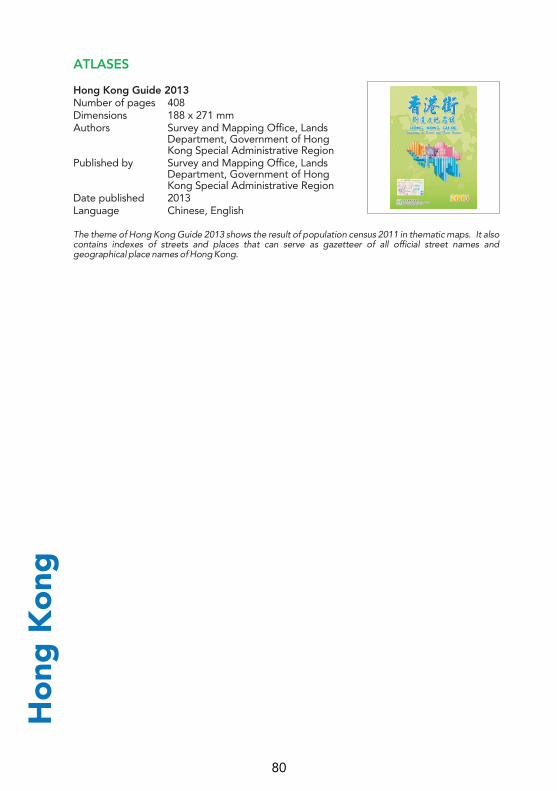
ATLASES
Hong Kong Guide 2013Number of pages 408Dimensions 188 x 271 mmAuthors Survey and Mapping Office, Lands
Department, Government of Hong Kong Special Administrative Region
Published by Survey and Mapping Office, Lands Department, Government of Hong Kong Special Administrative Region
Date published 2013Language Chinese, English
The theme of Hong Kong Guide 2013 shows the result of population census 2011 in thematic maps. It also contains indexes of streets and places that can serve as gazetteer of all official street names and geographical place names of Hong Kong.
Ho
ng K
ong
80

Hun
gar
y
MAPS
Changing ethnic patterns of the Carpatho-Pannonian areaMaterial Paper (1 main map, 9 side maps)Scale main map: 1:500 000,
side maps: 1:2 200 000Dimensions 1750 (main map) 420 (side maps), 1250
(main map) 300 (side maps)Authors Kocsis Károly, Tátrai Patrik, Bognár
András, Bottlik Zsolt, Kovács Anikó, Varga E. Árpád
Published by Geographical Research Institute of the Hungarian Academy of Sciences
Date published 2012Language Hungarian, English
A collection of maps that visually introduces the changing ethnic patterns of the ethnically, religiously, culturally unique and diverse Carpathian Basin and its neighbourhood, the Carpatho–Pannonian area. The Hungarian and English volume consists of three structural units. On the main map, pie charts depict the ethnic structure of the settlements in proportion to the population based on census data at the millennium. In the supplementary maps, changes of the ethnic structure can be seen at nine dates (in 1495, 1784, 1880, 1910, 1930, 1941, 1960, 1990 and 2001). The third unit of the work is the accompanying text, which outlines the ethnic trends of the past five hundred years in the studied area. The antecedent of this publication is the "series of ethnic maps" published by the Geographical Research Institute of the Hungarian Academy from the middle of the 1990's, which displayed each of the regions of the Carpathian Basin (in order of publication: Transylvania, Slovakia, Transcarpathia, Pannonian Croatia, Vojvodina, Transmura Region, Burgenland, Hungary). This work represents, on the one hand, the updated and revised version of these areas, and, on the other hand, regions beyond the Carpathian Basin not included on previous maps. Thus, the reader can browse ethnic data of some thirty thousand settlements in different maps.
VATICAN CITY City MapMaterial PaperScale 1:2 250Dimensions 980 x 680 mmAuthors Gizella BassaPublished by GiziMapDate published 2013Language English, Italian, German, French,
Spanish, Polish,
City map for tourists, pilgrims and businessmen presenting in detail the central city of the Catholic churches of the worldra politically sensitive area with administrative divisions, Inset maps show details of Saint Peter’s Basilica, the Sistine Chapel, the papal tombs (grottoes) and historical places of Rome.
SUDAN and SOUTH SUDAN Geographical MapMaterial PaperScale 1:2 500 000Dimensions 880 x 940 mmAuthors Gizella BassaPublished by GiziMapDate published 2011Language English, German, French, Spanish,
Russian, Arabic
81

Hand map for businessmen and tourists presenting in detail a politically sensitive area with administrative divisions, communication (roads, airfields), elevation (contour colouring), index of localities on the backside. The map includes the boundary of the disputed Abyei region as well as the administrative boundaries and names of the provinces. Transport (roads, airfields), nature conservation areas are shown in best detail. North Sudan towns and provinces are given in Arabic.
SOMALIA Geographical MapMaterial PaperScale 1:1 750 000Dimensions 860 x 940 mmAuthors Gizella BassaPublished by GiziMapDate published 2012Language English, German, French, Italian, Arabic
Hand map for businessmen and travellers showing its de facto division into Somaliland and Somalia, as well as the self-proclaimed autonomous states within Somalia: Puntland, Galmudug and Jubaland, plus the disputed region claimed by Somaliland but under Puntland administration. Road network includes country tracks and gives distances on main routes. Local airports and seaports are marked and a range of symbols indicate various places of interest, including locations with hotel accommodation, historical sites, etc. All place names are given in the Latin alphabet with, where appropriate, alternative names or transliterations.
Hungary administrative mapMaterial PaperScale 1:450 000Dimensions 1220 x 860 mmAuthors Hibernia Maps Ltd.Published by Szarvas András Cartographic Agency,
BudapestDate published 2013Language Hungarian, English, German
A pastel-coloured choropleth map displaying the latest administrative division of Hungary. As of 1 January 2013 the country was divided into 175 districts plus 23 Budapest capital districts. Two inset maps show the 7 statistical regions of Hungary and the Budapest districts respectively.
Hungary road mapMaterial PaperScale 1:450 000Dimensions 1220 x 860 mmAuthors Hibernia Maps Ltd.Published by Szarvas András Cartographic Agency,
BudapestDate published 2013Language Hungarian, English, German, Slovak,
Polish
A GPS-compatible road map with the full public road network of Hungary: The index of 3700 settlements ont he back side also gives their postal code numbers. Inset map gives a quick overview of transit routes of Hungary.
Hun
gar
y
82

Hun
gar
y
Buda Hills hiking mapMaterial PaperScale 1:25 000Dimensions 1220 x 860 mmAuthors Map FaragóPublished by Szarvas András Cartographic Agency,
BudapestDate published 2012Language Hungarian, English, German
Detailed hiking map of the Buda Hills that extend from the west bank of the Danube at Budapest. Complete with graticules at minute intervals. Plenty of information for hikers, cyclers, pilgrims and all kinds of tourists. Contour intervals at 10 m. Textual information of dozens of touristic spots with photographs.
Csepel Island – Danube tourist mapMaterial PaperScale 1:30 000Dimensions 430 x 1220 mmAuthors A&Z Map WorkshopPublished by Szarvas András Cartographic Agency,
BudapestDate published 2013Language Hungarian, English, German
Hiking map for walking, cycling, watersports, fishing and all other tourists on the area south of Budapest along the River Danube. Complete with a photo guide-book of touristic information about places of interest.
Geographical World AtlasNumber of pages 464Dimensions 235 x 330 mmAuthors Cartographia Ltd.Published by Cartographia Ltd.Date published 2012Language Hungarian
A new Geographical World Atlas presenting the world on 146 pages of detailed maps. Maps are produced in relief colours, displaying the major settlements, roads, railways and nature conservation areas, undersea relief for sea areas. A section on textual country information contains much valuable data on all independent countries, with national symbols and high quality photos. Complete with comparative data on physical and economic geography, 60 thematic maps, index of more than 100 000 geographical names.
ATLASES
83

Sátoraljaújhely – Hungarian Atlas of Historic Towns No.2Number of pages 94Dimensions 303 x 420 mmAuthors István TringliPublished by Institute of History of the Hungarian
Academy of SciencesDate published 201Language Hungarian, English
The urban historical atlas of Sátoraljaújhely is the second volume of the Hungarian Atlas of Historic Towns. Its aim is the reconstruct and present the topographical development of the town prior to the great transformation in the 19th century. It also contains independently planned and reproduced old maps and pictures. It was published in both printed and CD form.
Hungary – Budapest Road AtlasNumber of pages 100Dimensions 151 x 240 mmAuthors Ministry of Defence Mapping Non-profit
Limited CompanyPublished by Ministry of Defence Mapping Non-profit
Limited CompanyDate published 2013Language Hungarian with legend in English and
German
The map of Hungary is based on the Hungarian defence DTA200 database. The five-colour (CMYK + relief shading) 1:200.000 scale map has elevation contours, relief shading, bright coloured transportation theme, representation of power lines as a unique feature for this map. The Budapest map cut-out at scale 1:27.500 is delineated by the border of the city. Useful for both motorists, cyclists and pedestrians it also includes the whole public transportation network, and is completed by a 1:10 000 scale map of Central Budapest, nicely decorated with ink-drawn images of landmark buildings.
Building Monitoring System illustration seriesMaterial Paper (map series of 6 maps) for display
on panelAuthors Institute of Geodesy, Cartography and
Remote Sensing (FÖMI)Published by Institute of Geodesy, Cartography and
Remote Sensing (FÖMI)Date published 2012Language English
Building Monitoring System illustration series – published by the Institute of Geodesy, Cartography and Remote Sensing (FÖMI), Hungary in 2012 The Building Monitoring System project was accepted in the Electronic Public Administration Operational Programme financed from the European Regional Development Fund and from the national central budget. The goal of the project is to support the authorities’ tasks by remote sensing data – e.g. to control illegal buildings or out of the building permits. FÖMI produces the digital surface model (DSM) for the whole country and also produces a special orthophoto cover, uses existing digital terrain model (DTM), classic orthophotos, aerial photos and produces the national building coverage. All differences from the cadastral data will be detected and building authority will be able to take suitable measures. The six illustrations demonstrate the results of object-based image analysis (OBIA), executed on quasi true orthophotos implicating differences of DSM and DTM.
OTHER CARTOGRAPHIC PRODUCTS
Hun
gar
y
84

Hun
gar
y
Börzsöny Mountains relief mapMaterial Plastic Authors Ministry of Defence Mapping Non-profit
Limited CompanyPublished by Ministry of Defence Mapping Non-profit
Limited CompanyDate published 2012Language Hungarian
The map is based on the Hungarian defence mapping’s 1:200 000 scale roadmap. A 560x400 mm size fragment has been made from this map with the Börzsöny mountains in the middle. This mountains is one of the most spectacular geomorphological area, just like Danube Bend to the south. An extinct volcanic group belying its heights it has a high mountain characteristic and with the gorge of the Danube Bend together producea perfect area for designing relief maps. To enhance representation the Hungarian defence mapping’s digital elevation model (DDM-50) has also been used with the proper elevation distortion. The high-quality plastic sheet is durable and non-fading.
85

MAPS
Khuzestan ProvinceMaterial PaperScale 1:500 000Dimensions 1000 x 700 mmAuthors NCCPublished by NCCDate published 05/2011Language English-Persian
Map of Khuzestan Province-Iran
En_Route ChartMaterial PaperScale 1:2 200 000Dimensions 1000 x 1000 mmAuthors NCCPublished by NCCDate published 04/2012Language English
This map is provided to guide commercial aircraft
Tourist Map of Esfahan ProvinceMaterial PaperScale 1:1 000 000Dimensions 700 x 500 mmAuthors NCCPublished by NCCDate published 03/2013Language English, Persian
This map was produced on both sides from the province and Center of Esfahan
Tourist Map of Yazd ProvinceMaterial PaperScale 1:1 200 000Dimensions 700 x 500 mmAuthors NCCPublished by NCCDate published 03/2013Language English, Persian
This map was produced on both sides from the province and Center of Yazd
Isla
mic
Rep
ublic
of
Iran
86

Isla
mic
Rep
ublic
of
Iran
Tourist Map of East AzarbayjanMaterial PaperScale 1:650 000Dimensions 700 x 500 mmAuthors NCCPublished by NCCDate published 03/2013Language English, Persian
This map was produced on both sides from the province and Center of East Azarbayjan
Tourist Map of MazandaranMaterial PaperScale 1:500 000Dimensions 700 x 500 mmAuthors NCCPublished by NCCDate published 03/2013Language English, Persian
This map was produced on both sides from the province and Center of Mazandaran
Tourist Map of Shiraz CityMaterial PaperScale 1:40 000Dimensions 700 x 1000 mmAuthors NCCPublished by NCCDate published 05/2011Language Persian
The double sided map shows Shiraz city
Tourist Map of Kermanshah CityMaterial PaperScale 1:12 000Dimensions 1000 x 700 mmAuthors NCCPublished by NCCDate published 06/2011Language Persian
The double sided map shows Kermanshah city
87
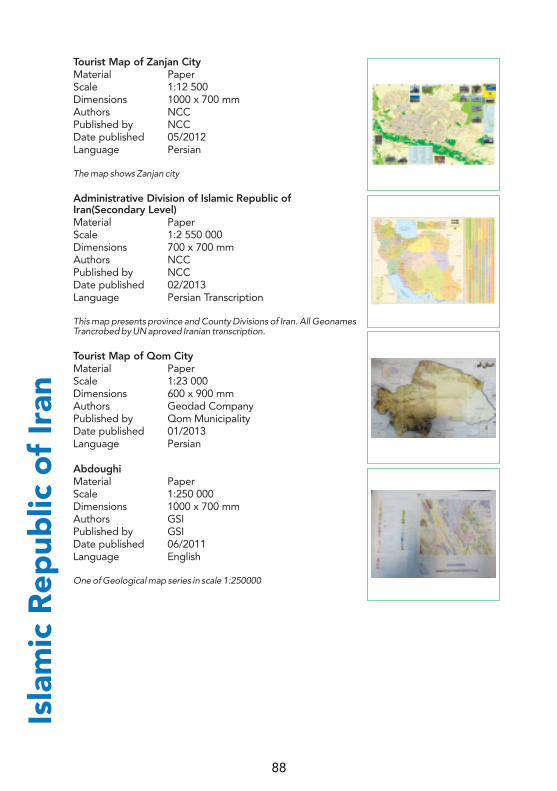
Tourist Map of Zanjan CityMaterial PaperScale 1:12 500Dimensions 1000 x 700 mmAuthors NCCPublished by NCCDate published 05/2012Language Persian
The map shows Zanjan city
Administrative Division of Islamic Republic of Iran(Secondary Level)Material PaperScale 1:2 550 000Dimensions 700 x 700 mmAuthors NCCPublished by NCCDate published 02/2013Language Persian Transcription
This map presents province and County Divisions of Iran. All Geonames Trancrobed by UN aproved Iranian transcription.
Tourist Map of Qom CityMaterial PaperScale 1:23 000Dimensions 600 x 900 mmAuthors Geodad CompanyPublished by Qom MunicipalityDate published 01/2013Language Persian
AbdoughiMaterial PaperScale 1:250 000Dimensions 1000 x 700 mmAuthors GSIPublished by GSIDate published 06/2011Language English
One of Geological map series in scale 1:250000
Isla
mic
Rep
ublic
of
Iran
88

Isla
mic
Rep
ublic
of
Iran
Metallogenic Map of MiddeleastMaterial PaperScale 1:5 000 000Dimensions 1100 x 1000 mmAuthors GSIPublished by GSIDate published 09/2011Language English
Atlas of Education-2nd EditionNumber of pages 80Dimensions 230 x 300 mmAuthors NCCPublished by NCCDate published 06/2011Language Persian
The atlas is one of the national atlas of Iran series
Atlas of CommerceNumber of pages 80Dimensions 230 x 300 mmAuthors NCCPublished by NCCDate published 05/2012Language Persian
Atlas of Tehran MetropolisNumber of pages 329Dimensions 240 x 320 mmAuthors Tehran MunicipalityPublished by Tehran MunicipalityDate published 06/2010Language English
ATLASES
89

MAPS
Eire mapMaterial PaperScale 1:600 000Dimensions 640 x 890 mmAuthors Ordnance Survey IrelandPublished by Ordnance Survey IrelandDate published 01/2013Language Irish
A detailed map of Ireland in the Irish language highlighting the counties, roads and cities of Ireland.
Ireland Touring MapMaterial PaperScale 1:450 000Dimensions 960 x 1050 mmAuthors Ordnance Survey IrelandPublished by Ordnance Survey IrelandDate published 06/2012Language English
A detailed map of Ireland highlighting all the motorways and regional roads of Ireland as well as other points of interest such as Nature Reserves, Tourist information, race courses and beaches.
Discovery SeriesMaterial PaperScale 1:50 000Dimensions 960 x 800 mmAuthors Ordnance Survey IrelandPublished by Ordnance Survey IrelandDate published 01/2012Language English
The Discovery Series comprises a series of 75 maps maps covering all of Ireland and is ideally suited for hill walkers and outdoor enthusiasts.
Dublin City Centre MapMaterial PaperDimensions 594 x 420 mmAuthors Ordnance Survey Ireland in conjunction
with Failte IrelandPublished by Ordnance Survey Ireland in conjunction
with Failte IrelandDate published 05/3013Language English
A detailed map of the centre of Dublin with transport details , pedestrian streets, police stations, theatres, public parks highlighted. Also features Dublin areas such as the Viking and Medieval Quarter and temple Bar.
Irel
and
90
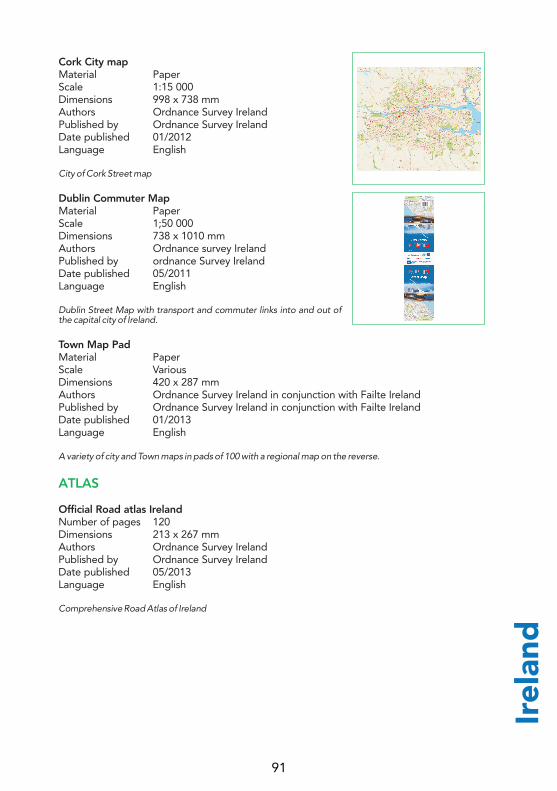
Irel
and
Cork City mapMaterial PaperScale 1:15 000Dimensions 998 x 738 mmAuthors Ordnance Survey IrelandPublished by Ordnance Survey IrelandDate published 01/2012Language English
City of Cork Street map
Dublin Commuter MapMaterial PaperScale 1;50 000Dimensions 738 x 1010 mmAuthors Ordnance survey IrelandPublished by ordnance Survey IrelandDate published 05/2011Language English
Dublin Street Map with transport and commuter links into and out of the capital city of Ireland.
Town Map PadMaterial PaperScale VariousDimensions 420 x 287 mmAuthors Ordnance Survey Ireland in conjunction with Failte IrelandPublished by Ordnance Survey Ireland in conjunction with Failte IrelandDate published 01/2013Language English
A variety of city and Town maps in pads of 100 with a regional map on the reverse.
Official Road atlas IrelandNumber of pages 120Dimensions 213 x 267 mmAuthors Ordnance Survey IrelandPublished by Ordnance Survey IrelandDate published 05/2013Language English
Comprehensive Road Atlas of Ireland
ATLAS
91
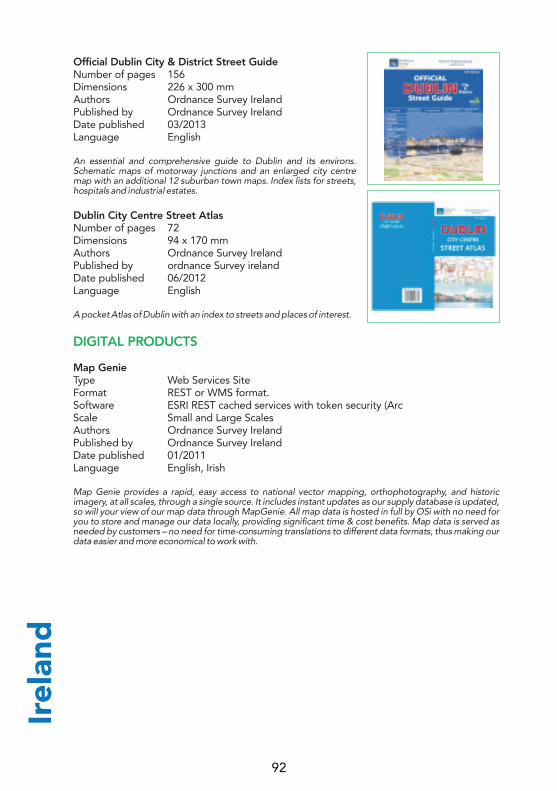
Official Dublin City & District Street GuideNumber of pages 156Dimensions 226 x 300 mmAuthors Ordnance Survey IrelandPublished by Ordnance Survey IrelandDate published 03/2013Language English
An essential and comprehensive guide to Dublin and its environs. Schematic maps of motorway junctions and an enlarged city centre map with an additional 12 suburban town maps. Index lists for streets, hospitals and industrial estates.
Dublin City Centre Street AtlasNumber of pages 72Dimensions 94 x 170 mmAuthors Ordnance Survey IrelandPublished by ordnance Survey irelandDate published 06/2012Language English
A pocket Atlas of Dublin with an index to streets and places of interest.
Map GenieType Web Services SiteFormat REST or WMS format.Software ESRI REST cached services with token security (ArcScale Small and Large ScalesAuthors Ordnance Survey IrelandPublished by Ordnance Survey IrelandDate published 01/2011Language English, Irish
Map Genie provides a rapid, easy access to national vector mapping, orthophotography, and historic imagery, at all scales, through a single source. It includes instant updates as our supply database is updated, so will your view of our map data through MapGenie. All map data is hosted in full by OSi with no need for you to store and manage our data locally, providing significant time & cost benefits. Map data is served as needed by customers – no need for time-consuming translations to different data formats, thus making our data easier and more economical to work with.
DIGITAL PRODUCTS
Irel
and
92
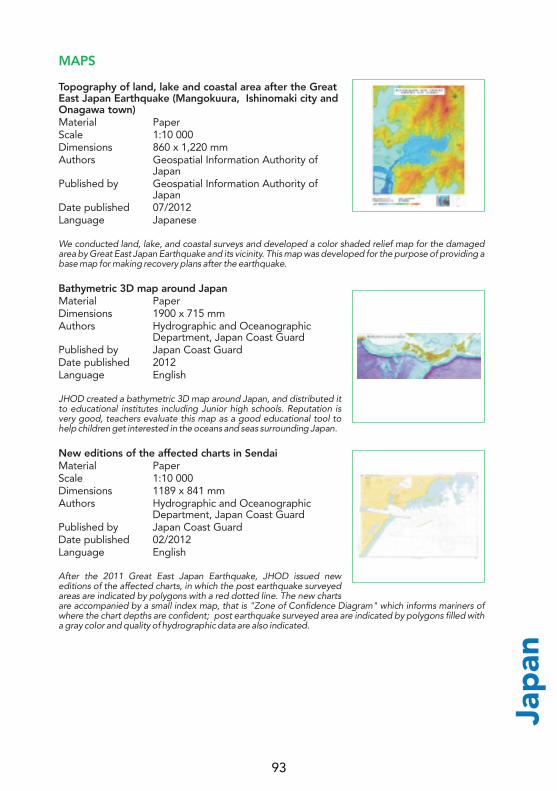
Jap
an
MAPS
Topography of land, lake and coastal area after the Great East Japan Earthquake (Mangokuura, Ishinomaki city and Onagawa town)Material PaperScale 1:10 000Dimensions 860 x 1,220 mmAuthors Geospatial Information Authority of
JapanPublished by Geospatial Information Authority of
JapanDate published 07/2012Language Japanese
We conducted land, lake, and coastal surveys and developed a color shaded relief map for the damaged area by Great East Japan Earthquake and its vicinity. This map was developed for the purpose of providing a base map for making recovery plans after the earthquake.
Bathymetric 3D map around JapanMaterial PaperDimensions 1900 x 715 mmAuthors Hydrographic and Oceanographic
Department, Japan Coast GuardPublished by Japan Coast GuardDate published 2012Language English
JHOD created a bathymetric 3D map around Japan, and distributed it to educational institutes including Junior high schools. Reputation is very good, teachers evaluate this map as a good educational tool to help children get interested in the oceans and seas surrounding Japan.
New editions of the affected charts in SendaiMaterial PaperScale 1:10 000Dimensions 1189 x 841 mmAuthors Hydrographic and Oceanographic
Department, Japan Coast GuardPublished by Japan Coast GuardDate published 02/2012Language English
After the 2011 Great East Japan Earthquake, JHOD issued new editions of the affected charts, in which the post earthquake surveyed areas are indicated by polygons with a red dotted line. The new charts are accompanied by a small index map, that is "Zone of Confidence Diagram" which informs mariners of where the chart depths are confident; post earthquake surveyed area are indicated by polygons filled with a gray color and quality of hydrographic data are also indicated.
93

A shaded-gradient map of Japanese Archipelago and its Exclusive Economic ZoneMaterial PaperScale 1:3 500 000Dimensions 1220 x 1030 mmAuthors KOKUDOCHIZU Co., Ltd.Published by KOKUDOCHIZU Co., Ltd.Date published 05/2012Language Japanese
A pseudo three-dimensional information map which shows actual condition (configuration, location) on the land in Japan and its Exclusive Economic Zone (EEZ).
Miura City Tsunami Hazard Map (Miura Area)Material PaperScale 1:6 500Dimensions 594 x 841 mmAuthors Chuo Geomatics Co., Ltd.Published by Miura City OfficeDate published 11/2012Language Japanese
This tsunami hazard map shows areas with the potential for flooding from tsunami, elevation, evacuation routes to higher area and evacuation sites for the citizens and their anti-disaster consciousness. One side shows the map of the whole city and other side shows map of the high risk area with the article of disaster prevention information. This map's characteristic are as below. (1) Visualized flooding and elevation information (2) Elevation value and direction to evacuate are printed with contour lines and evacuation sites. (3) Users of the map can write down where they should evacuate.
Birds-eye night view "ASAKUSA"Material PaperDimensions 1030 x 728Authors GEO Co., Ltd.Published by GEO Co., Ltd.Date published 2012Language Japanese
It is a birds-eye night view westward from Asakusa, Tokyo. A Birds-eye style map makes it possible that you dramatically image the broad area, from Skytree to Mt. Fuji in 3D. Tokyo has many faces because Shinjuku and Ikebukuro have many skyscrapers but Ueno and Asakusa nostalgical old japanese taste too. Please enjoy these many faces of Tokyo with this map.
Higasikawa Town Panorama Geo-Art Day & EveningMaterial PaperDimensions 1900 x 800 mmAuthors Hokkaido-Chizu Co., Ltd.Published by Hokkaido-Chizu Co., Ltd.Date published 10/2011Language Japanese
Jap
an
94
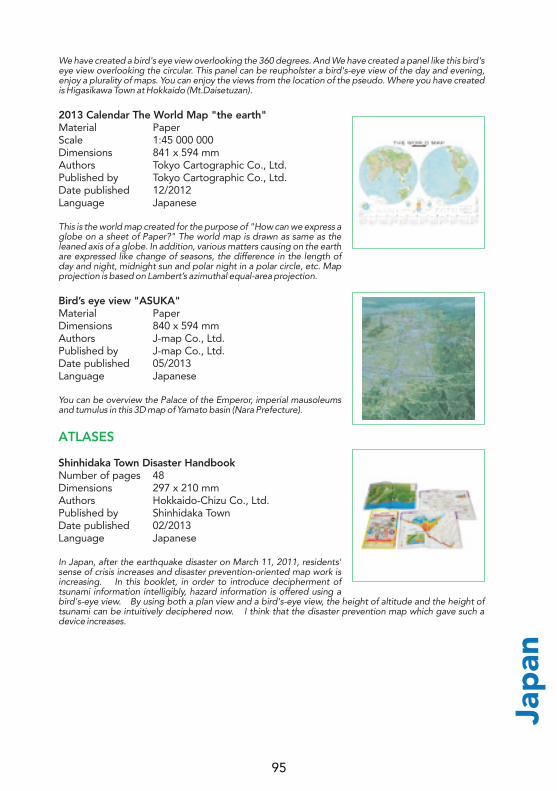
Jap
an
We have created a bird's eye view overlooking the 360 degrees. And We have created a panel like this bird's eye view overlooking the circular. This panel can be reupholster a bird's-eye view of the day and evening, enjoy a plurality of maps. You can enjoy the views from the location of the pseudo. Where you have created is Higasikawa Town at Hokkaido (Mt.Daisetuzan).
2013 Calendar The World Map "the earth"Material PaperScale 1:45 000 000Dimensions 841 x 594 mmAuthors Tokyo Cartographic Co., Ltd.Published by Tokyo Cartographic Co., Ltd.Date published 12/2012Language Japanese
This is the world map created for the purpose of "How can we express a globe on a sheet of Paper?" The world map is drawn as same as the leaned axis of a globe. In addition, various matters causing on the earth are expressed like change of seasons, the difference in the length of day and night, midnight sun and polar night in a polar circle, etc. Map projection is based on Lambert’s azimuthal equal-area projection.
Bird’s eye view "ASUKA"Material PaperDimensions 840 x 594 mmAuthors J-map Co., Ltd.Published by J-map Co., Ltd.Date published 05/2013Language Japanese
You can be overview the Palace of the Emperor, imperial mausoleums and tumulus in this 3D map of Yamato basin (Nara Prefecture).
Shinhidaka Town Disaster HandbookNumber of pages 48Dimensions 297 x 210 mmAuthors Hokkaido-Chizu Co., Ltd.Published by Shinhidaka TownDate published 02/2013Language Japanese
In Japan, after the earthquake disaster on March 11, 2011, residents' sense of crisis increases and disaster prevention-oriented map work is increasing. In this booklet, in order to introduce decipherment of tsunami information intelligibly, hazard information is offered using a bird's-eye view. By using both a plan view and a bird's-eye view, the height of altitude and the height of tsunami can be intuitively deciphered now. I think that the disaster prevention map which gave such a device increases.
ATLASES
95
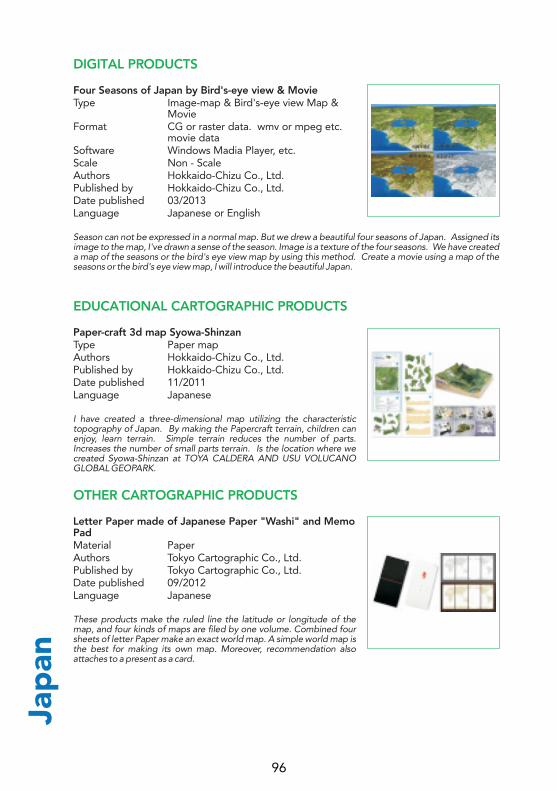
DIGITAL PRODUCTS
EDUCATIONAL CARTOGRAPHIC PRODUCTS
OTHER CARTOGRAPHIC PRODUCTS
Four Seasons of Japan by Bird's-eye view & MovieType Image-map & Bird's-eye view Map &
MovieFormat CG or raster data. wmv or mpeg etc.
movie dataSoftware Windows Madia Player, etc.Scale Non - ScaleAuthors Hokkaido-Chizu Co., Ltd.Published by Hokkaido-Chizu Co., Ltd.Date published 03/2013Language Japanese or English
Season can not be expressed in a normal map. But we drew a beautiful four seasons of Japan. Assigned its image to the map, I've drawn a sense of the season. Image is a texture of the four seasons. We have created a map of the seasons or the bird's eye view map by using this method. Create a movie using a map of the seasons or the bird's eye view map, I will introduce the beautiful Japan.
Paper-craft 3d map Syowa-ShinzanType Paper mapAuthors Hokkaido-Chizu Co., Ltd.Published by Hokkaido-Chizu Co., Ltd.Date published 11/2011Language Japanese
I have created a three-dimensional map utilizing the characteristic topography of Japan. By making the Papercraft terrain, children can enjoy, learn terrain. Simple terrain reduces the number of parts. Increases the number of small parts terrain. Is the location where we created Syowa-Shinzan at TOYA CALDERA AND USU VOLUCANO GLOBAL GEOPARK.
Letter Paper made of Japanese Paper "Washi" and Memo PadMaterial PaperAuthors Tokyo Cartographic Co., Ltd.Published by Tokyo Cartographic Co., Ltd.Date published 09/2012Language Japanese
These products make the ruled line the latitude or longitude of the map, and four kinds of maps are filed by one volume. Combined four sheets of letter Paper make an exact world map. A simple world map is the best for making its own map. Moreover, recommendation also attaches to a present as a card.
Jap
an
96
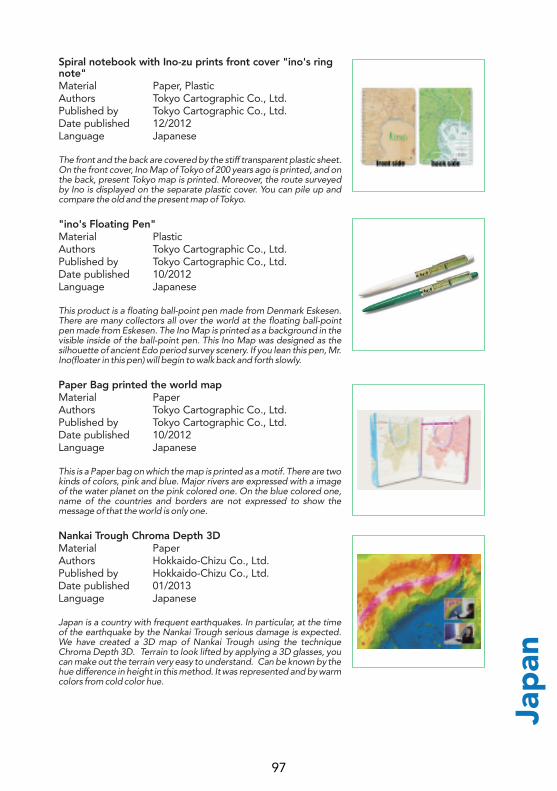
Jap
an
Spiral notebook with Ino-zu prints front cover "ino's ring note"Material Paper, PlasticAuthors Tokyo Cartographic Co., Ltd.Published by Tokyo Cartographic Co., Ltd.Date published 12/2012Language Japanese
The front and the back are covered by the stiff transparent plastic sheet. On the front cover, Ino Map of Tokyo of 200 years ago is printed, and on the back, present Tokyo map is printed. Moreover, the route surveyed by Ino is displayed on the separate plastic cover. You can pile up and compare the old and the present map of Tokyo.
"ino's Floating Pen"Material PlasticAuthors Tokyo Cartographic Co., Ltd.Published by Tokyo Cartographic Co., Ltd.Date published 10/2012Language Japanese
This product is a floating ball-point pen made from Denmark Eskesen. There are many collectors all over the world at the floating ball-point pen made from Eskesen. The Ino Map is printed as a background in the visible inside of the ball-point pen. This Ino Map was designed as the silhouette of ancient Edo period survey scenery. If you lean this pen, Mr. Ino(floater in this pen) will begin to walk back and forth slowly.
Paper Bag printed the world mapMaterial PaperAuthors Tokyo Cartographic Co., Ltd.Published by Tokyo Cartographic Co., Ltd.Date published 10/2012Language Japanese
This is a Paper bag on which the map is printed as a motif. There are two kinds of colors, pink and blue. Major rivers are expressed with a image of the water planet on the pink colored one. On the blue colored one, name of the countries and borders are not expressed to show the message of that the world is only one.
Nankai Trough Chroma Depth 3DMaterial PaperAuthors Hokkaido-Chizu Co., Ltd.Published by Hokkaido-Chizu Co., Ltd.Date published 01/2013Language Japanese
Japan is a country with frequent earthquakes. In particular, at the time of the earthquake by the Nankai Trough serious damage is expected. We have created a 3D map of Nankai Trough using the technique Chroma Depth 3D. Terrain to look lifted by applying a 3D glasses, you can make out the terrain very easy to understand. Can be known by the hue difference in height in this method. It was represented and by warm colors from cold color hue.
97

MAPS
ATLASES
Map of Korea and Surrounding CountriesMaterial PaperScale 1:13 000 000Authors National Geographic Information InstitutePublished by Ministry of Land, Transportation and Maritime AffairsDate published 12/2012Language English
World MapMaterial PaperAuthors National Geographic Information InstitutePublished by Ministry of Land, Transportation and Maritime AffairsDate published 12/2012Language English
World MapMaterial PaperAuthors National Geographic Information InstitutePublished by Ministry of Land, Transportation and Maritime AffairsDate published 12/2012Language French
World MapMaterial PaperAuthors National Geographic Information InstitutePublished by Ministry of Land, Transportation and Maritime AffairsDate published 12/2012Language Spanish
The National Gazetteer of KoreaNumber of pages 124Dimensions 215 x 280 mmAuthors National Geographic Information InstitutePublished by Ministry of Land, Transportation and Maritime AffairsDate published 05/2009Language English
The National Atlas of KoreaNumber of pages 192Dimensions 270 x 360 mmAuthors National Geographic Information InstitutePublished by Ministry of Land, Transportation and Maritime AffairsDate published 05/2009Language English
Rep
ublic
of
Ko
rea
98
Net
herl
and
MAPS
Disappeared towns in the NetherlandsMaterial PaperScale 1:300 000Dimensions 840 x 1180 mmAuthors Eddie PoppePublished by CartoMagie, UtrechtDate published 01/2013Language Dutch
Based on the disappeared towns described by Bert Stulp in a series of five books, CartoMagie created this map. The map represents all disappeared cities, villages and hamlets, including the cause of disappearance of the towns - flood, sand cover, war, construction of industry and infrastructure, depopulation, competition and displacement
Scouting in the NetherlandsMaterial PaperScale 1:300 000Dimensions 840 x 1180 mmAuthors Eddie PoppePublished by CartoMagie, UtrechtDate published 12/2012Language Dutch
The map represents everything related to Scouting in The Netherlands, like local scouting groups, camp sites, Scout Shops and the sites of the World Jamborees in 1937 and 1995. Water, forests and dunes are highlighted in the topography as they are the best exploring sites for Dutch Scouts, and even long distance walking routes and sailing routes are indicated
Topographic Map of the Netherlands, Sheet Delft 37ENMaterial PaperScale 1:10 000Dimensions 840 x 1180 mmAuthors Cadastre, Land Registry and Mapping AgencyPublished by Cadastre, Land Registry and Mapping AgencyDate published 2013Language Dutch, English
Topographic base map of the Netherlands in stereographic projection. Compiled by Aerial photo interpretation and terrain reconnaissance.
Topographic Map of the Netherlands, Sheet 37EMaterial PaperScale 1:25 000Dimensions 570 x 720 mmAuthors Cadastre, Land Registry and Mapping AgencyPublished by Cadastre, Land Registry and Mapping AgencyDate published 2013Language Dutch, English
Topographic map of the Netherlands in stereographic projection. Compiled by Aerial photo interpretation and terrain reconnaissance.
99
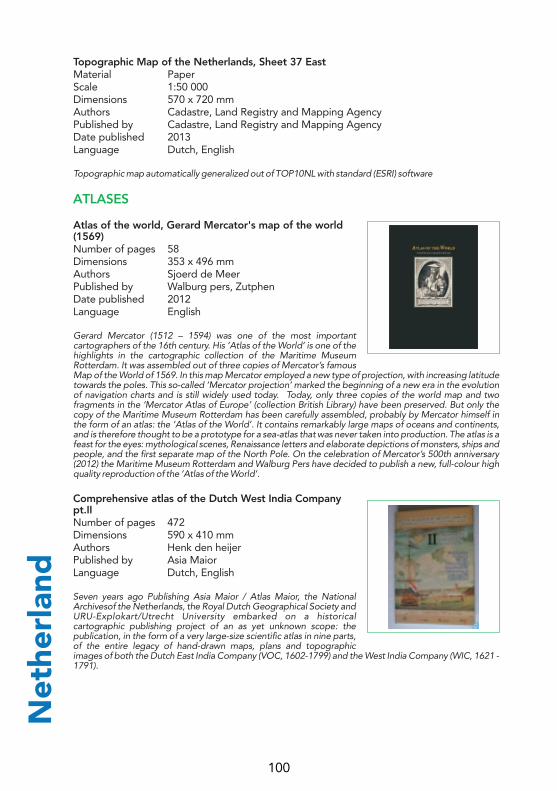
Topographic Map of the Netherlands, Sheet 37 EastMaterial PaperScale 1:50 000Dimensions 570 x 720 mmAuthors Cadastre, Land Registry and Mapping AgencyPublished by Cadastre, Land Registry and Mapping AgencyDate published 2013Language Dutch, English
Topographic map automatically generalized out of TOP10NL with standard (ESRI) software
Atlas of the world, Gerard Mercator's map of the world (1569)Number of pages 58Dimensions 353 x 496 mmAuthors Sjoerd de MeerPublished by Walburg pers, ZutphenDate published 2012Language English
Gerard Mercator (1512 – 1594) was one of the most important cartographers of the 16th century. His ‘Atlas of the World’ is one of the highlights in the cartographic collection of the Maritime Museum Rotterdam. It was assembled out of three copies of Mercator’s famous Map of the World of 1569. In this map Mercator employed a new type of projection, with increasing latitude towards the poles. This so-called ‘Mercator projection’ marked the beginning of a new era in the evolution of navigation charts and is still widely used today. Today, only three copies of the world map and two fragments in the ‘Mercator Atlas of Europe’ (collection British Library) have been preserved. But only the copy of the Maritime Museum Rotterdam has been carefully assembled, probably by Mercator himself in the form of an atlas: the ‘Atlas of the World’. It contains remarkably large maps of oceans and continents, and is therefore thought to be a prototype for a sea-atlas that was never taken into production. The atlas is a feast for the eyes: mythological scenes, Renaissance letters and elaborate depictions of monsters, ships and people, and the first separate map of the North Pole. On the celebration of Mercator’s 500th anniversary (2012) the Maritime Museum Rotterdam and Walburg Pers have decided to publish a new, full-colour high quality reproduction of the ‘Atlas of the World’.
Comprehensive atlas of the Dutch West India Company pt.IINumber of pages 472Dimensions 590 x 410 mmAuthors Henk den heijerPublished by Asia MaiorLanguage Dutch, English
Seven years ago Publishing Asia Maior / Atlas Maior, the National Archivesof the Netherlands, the Royal Dutch Geographical Society and URU-Explokart/Utrecht University embarked on a historical cartographic publishing project of an as yet unknown scope: the publication, in the form of a very large-size scientific atlas in nine parts, of the entire legacy of hand-drawn maps, plans and topographic images of both the Dutch East India Company (VOC, 1602-1799) and the West India Company (WIC, 1621 - 1791).
ATLASES
Net
herl
and
100
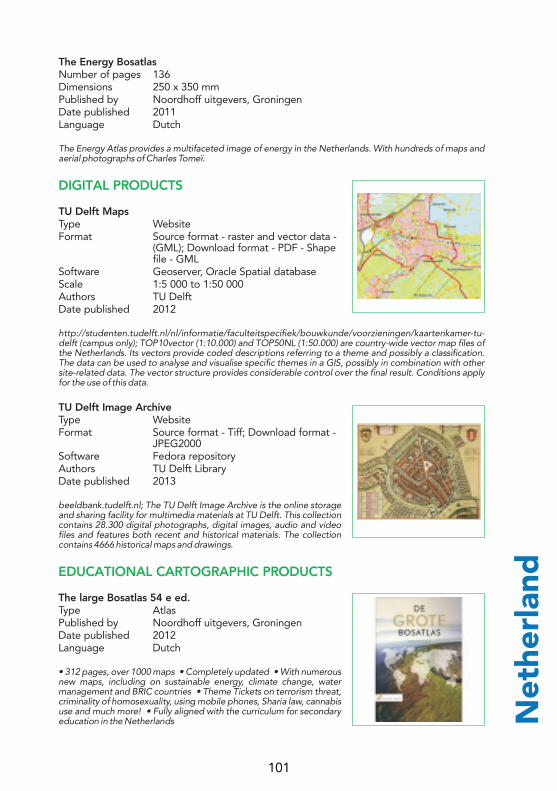
Net
herl
and
The Energy BosatlasNumber of pages 136Dimensions 250 x 350 mmPublished by Noordhoff uitgevers, GroningenDate published 2011Language Dutch
The Energy Atlas provides a multifaceted image of energy in the Netherlands. With hundreds of maps and aerial photographs of Charles Tomeï.
TU Delft MapsType WebsiteFormat Source format - raster and vector data -
(GML); Download format - PDF - Shape file - GML
Software Geoserver, Oracle Spatial databaseScale 1:5 000 to 1:50 000Authors TU DelftDate published 2012
http://studenten.tudelft.nl/nl/informatie/faculteitspecifiek/bouwkunde/voorzieningen/kaartenkamer-tu-delft (campus only); TOP10vector (1:10.000) and TOP50NL (1:50.000) are country-wide vector map files of the Netherlands. Its vectors provide coded descriptions referring to a theme and possibly a classification. The data can be used to analyse and visualise specific themes in a GIS, possibly in combination with other site-related data. The vector structure provides considerable control over the final result. Conditions apply for the use of this data.
TU Delft Image ArchiveType WebsiteFormat Source format - Tiff; Download format -
JPEG2000Software Fedora repositoryAuthors TU Delft LibraryDate published 2013
beeldbank.tudelft.nl; The TU Delft Image Archive is the online storage and sharing facility for multimedia materials at TU Delft. This collection contains 28.300 digital photographs, digital images, audio and video files and features both recent and historical materials. The collection contains 4666 historical maps and drawings.
The large Bosatlas 54 e ed.Type AtlasPublished by Noordhoff uitgevers, GroningenDate published 2012Language Dutch
• 312 pages, over 1000 maps • Completely updated • With numerous new maps, including on sustainable energy, climate change, water management and BRIC countries • Theme Tickets on terrorism threat, criminality of homosexuality, using mobile phones, Sharia law, cannabis use and much more! • Fully aligned with the curriculum for secondary education in the Netherlands
DIGITAL PRODUCTS
EDUCATIONAL CARTOGRAPHIC PRODUCTS
101
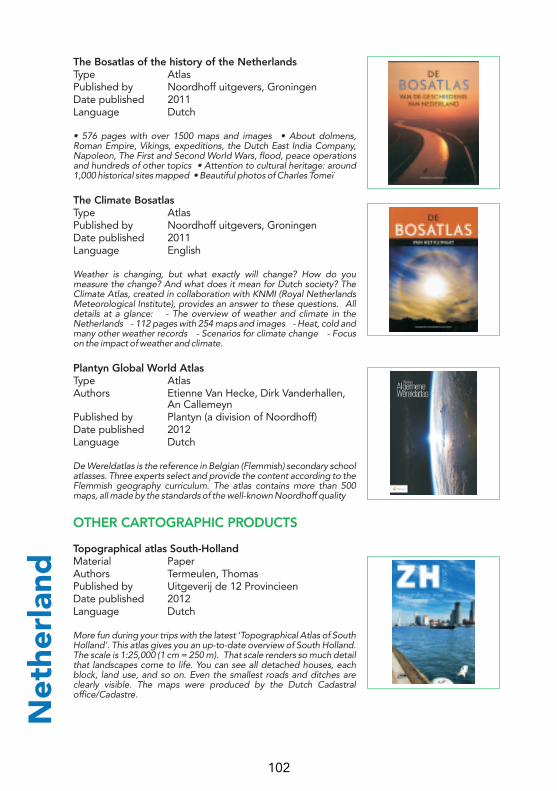
The Bosatlas of the history of the NetherlandsType AtlasPublished by Noordhoff uitgevers, GroningenDate published 2011Language Dutch
• 576 pages with over 1500 maps and images • About dolmens, Roman Empire, Vikings, expeditions, the Dutch East India Company, Napoleon, The First and Second World Wars, flood, peace operations and hundreds of other topics • Attention to cultural heritage: around 1,000 historical sites mapped • Beautiful photos of Charles Tomeï
The Climate BosatlasType AtlasPublished by Noordhoff uitgevers, GroningenDate published 2011Language English
Weather is changing, but what exactly will change? How do you measure the change? And what does it mean for Dutch society? The Climate Atlas, created in collaboration with KNMI (Royal Netherlands Meteorological Institute), provides an answer to these questions. All details at a glance: - The overview of weather and climate in the Netherlands - 112 pages with 254 maps and images - Heat, cold and many other weather records - Scenarios for climate change - Focus on the impact of weather and climate.
Plantyn Global World AtlasType AtlasAuthors Etienne Van Hecke, Dirk Vanderhallen,
An CallemeynPublished by Plantyn (a division of Noordhoff)Date published 2012Language Dutch
De Wereldatlas is the reference in Belgian (Flemmish) secondary school atlasses. Three experts select and provide the content according to the Flemmish geography curriculum. The atlas contains more than 500 maps, all made by the standards of the well-known Noordhoff quality
Topographical atlas South-HollandMaterial PaperAuthors Termeulen, ThomasPublished by Uitgeverij de 12 ProvincieenDate published 2012Language Dutch
More fun during your trips with the latest 'Topographical Atlas of South Holland'. This atlas gives you an up-to-date overview of South Holland. The scale is 1:25,000 (1 cm = 250 m). That scale renders so much detail that landscapes come to life. You can see all detached houses, each block, land use, and so on. Even the smallest roads and ditches are clearly visible. The maps were produced by the Dutch Cadastral office/Cadastre.
OTHER CARTOGRAPHIC PRODUCTS
Net
herl
and
102

Net
herl
and
OverHollandMaterial PaperAuthors Engel, H. e. a.Published by SunDate published 2011Language Dutch, English
Twelve centuries of spatial transformation in the western Netherlands is the result of a joint study carried out from 2008 to 2011 by the University of Amsterdam and TU Delft.
103
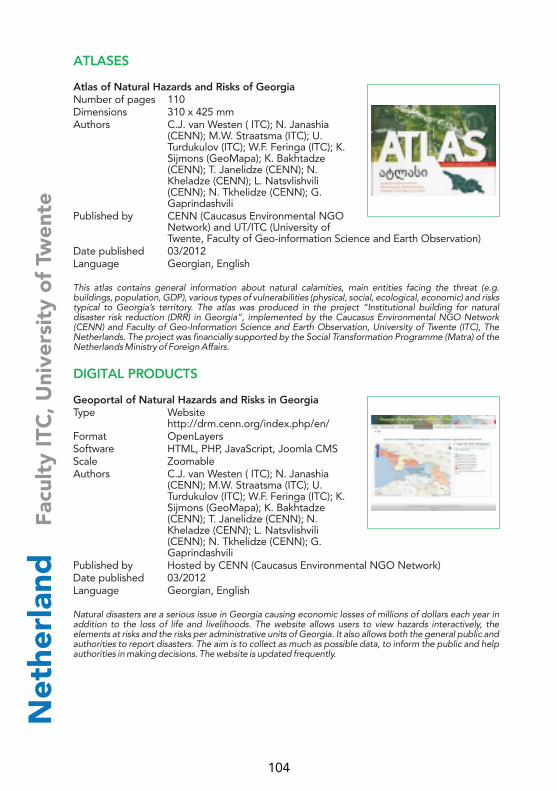
ATLASES
DIGITAL PRODUCTS
Atlas of Natural Hazards and Risks of GeorgiaNumber of pages 110Dimensions 310 x 425 mmAuthors C.J. van Westen ( ITC); N. Janashia
(CENN); M.W. Straatsma (ITC); U. Turdukulov (ITC); W.F. Feringa (ITC); K. Sijmons (GeoMapa); K. Bakhtadze (CENN); T. Janelidze (CENN); N. Kheladze (CENN); L. Natsvlishvili (CENN); N. Tkhelidze (CENN); G. Gaprindashvili
Published by CENN (Caucasus Environmental NGO Network) and UT/ITC (University of Twente, Faculty of Geo-information Science and Earth Observation)
Date published 03/2012Language Georgian, English
This atlas contains general information about natural calamities, main entities facing the threat (e.g. buildings, population, GDP), various types of vulnerabilities (physical, social, ecological, economic) and risks typical to Georgia’s territory. The atlas was produced in the project “Institutional building for natural disaster risk reduction (DRR) in Georgia”, implemented by the Caucasus Environmental NGO Network (CENN) and Faculty of Geo-Information Science and Earth Observation, University of Twente (ITC), The Netherlands. The project was financially supported by the Social Transformation Programme (Matra) of the Netherlands Ministry of Foreign Affairs.
Geoportal of Natural Hazards and Risks in GeorgiaType Website
http://drm.cenn.org/index.php/en/Format OpenLayersSoftware HTML, PHP, JavaScript, Joomla CMSScale ZoomableAuthors C.J. van Westen ( ITC); N. Janashia
(CENN); M.W. Straatsma (ITC); U. Turdukulov (ITC); W.F. Feringa (ITC); K. Sijmons (GeoMapa); K. Bakhtadze (CENN); T. Janelidze (CENN); N. Kheladze (CENN); L. Natsvlishvili (CENN); N. Tkhelidze (CENN); G. Gaprindashvili
Published by Hosted by CENN (Caucasus Environmental NGO Network)Date published 03/2012Language Georgian, English
Natural disasters are a serious issue in Georgia causing economic losses of millions of dollars each year in addition to the loss of life and livelihoods. The website allows users to view hazards interactively, the elements at risks and the risks per administrative units of Georgia. It also allows both the general public and authorities to report disasters. The aim is to collect as much as possible data, to inform the public and help authorities in making decisions. The website is updated frequently.
Net
herl
and
Fa
cult
y IT
C, U
nive
rsit
y o
f Tw
ente
104

Net
herl
and
Fa
cult
y IT
C, U
nive
rsit
y o
f Tw
ente
Experimental National Atlas of the Netherlands as part of the National Spatial Data InfrastructureType Website http://www.nationaleatlas.nl/Format SDI nodes and web mapping client:
Maps HTML5Software Various services, HTML5, D3 javascript
libraryScale Approximately 1: 1 million (on 1280 x
960 screen)Authors Barend Köbben (ITC-University of
Twente)Published by Foundation National Scientific Atlas of
the NetherlandsDate published 03/2013Language Dutch, English
This website is a prototype for a 3rd edition of the National Atlas of the Netherlands. A National Atlas nowadays should unite the world of atlas cartography with that of National Spatial Infrastructures. Here we introduce the test bed we are using to try out our theoretical framework in a real-life use case, using an Atlas Map Viewer component created with Open Web Platform technology (HTML5 and Javascript). The D3 library is used to interactively map the data from various SDI nodes, using HTML5 and SVG.
Zambia The Real AfricaType MapAuthors Shelly MakuwaPublished by Faculty ITC, University of TwenteDate published 10/2011Language English
Within the field of their specialization, the Individual Final Assignment (IFA) allows the course participants of the ITC Geo-information Diploma Course to work individually on a short production oriented project of a topic of their own choice. This project shows a map of Zambia with touristic information on the major attractions.
Zimbabwe Tourist MapType MapAuthors B. ZinyamaPublished by Faculty ITC, University of TwenteDate published 10/2011Language English
Within the field of their specialization, the Individual Final Assignment (IFA) allows the course participant of the ITC Geo-information Diploma Course to work individually on a short production oriented project of a topic of their own choice. This project shows a map of Zimbabwe with touristic information on the major attractions.
EDUCATIONAL CARTOGRAPHIC PRODUCTS
105
MAPS
Arthur’s PassMaterial PaperScale 1:55 000Dimensions 840 x 635 mmAuthors Geoff AitkenPublished by NewTopo NZ LtdDate published 08/2012Language English
This is a recreational map showing information useful to trampers on a topographic base. The map covers most of the Arthur’s Pass National Park at 1:55 000 scale. The National Park covers rugged mountain areas which are a nursery for young mountaineers and trampers, and a recreational refuge for Christchurch enthusiasts. The map usefully covers the main areas of activity which would otherwise require four of national topographic (Topo50) maps.
Mount Ruapehu: Tongariro National ParkMaterial PlasticScale 1:40 000Dimensions 630 x 840 mmAuthors Geoff AitkenPublished by NewTopo NZ LtdDate published 08/2012Language English
This is a recreational map showing information useful to trampers, skiers and climbers on a topographic base. The map covers most of the Tongariro National Park at 1:40 000 scale. The National Park covers the volcanic cones of Ruapehu, Ngauruhoe, and Tongariro in the Central Plateau of the North Island of New Zealand. These mountain areas are a nursery and playground for young mountaineers, skiers and trampers from Auckland and Wellington. The map usefully covers the main areas of activity which would otherwise require four of national topographic (Topo50) maps.
Milford Sound & the Central Otago Lake DistrictMaterial PaperScale not statedDimensions 1800 x 900 mmAuthors Geographx LtdPublished by Geographx LtdDate published 08/2012Language English
A boldly coloured pseudo photo-realistic panoramic wall map of the Southern lakes region around Queenstown. The texture mapping was all created from vector Topo50 and LCDB source data. The projection is an oblique orthographic, a derivative of the Plan Oblique projection where perspective has effectively been removed. The map is intended for use as a familiarisation and reference tool by visitors to the region. It is designed to come across as a striking artwork when viewed from across the room, yet on close inspection it contains around 1,500 text objects.
Tongariro National ParkMaterial PaperScale not statedDimensions 1170 x 420 mmAuthors Geographx LtdPublished by Geographx LtdDate published 06/2012Language English
A panoramic representation of the Tongariro volcanoes. Designed as a wall map and capable of being scaled to twice the linear dimensions of the presented print. The texture mapping was created from vector source data (not orthophotography nor satellite imagery). The projection is oblique orthographic. Perspective has effectively been removed. The map was designed to appeal to visitors to the region looking for something a bit different that they can take home as a souvenir or reminder. Produced to mark the 8th ICA Mountain Cartography Workshop held in Taurewa, next to Tongariro National Park in September 2012.
New
Zea
land
106

New
Zea
land
Albert-Eden Walking Map (Sheet 1)Material PaperScale 1:8 000Dimensions 594 x 841 mmAuthors Igor DreckiPublished by Auckland CouncilDate published 07/2013Language English
A large scale urban map depicting city landscape with its parks, walking tracks, streets, recreation facilities and transport information. Particular attention is placed on features concerning pedestrian traffic, whether for work or recreation. Facilities such as bus stops and carparks are shown to provide access reference. Play grounds for children, lookout points, toilets and a detailed network of walking routes with steps marked, are included to promote family recreation and leisure.
Albert-Eden Walking Map (Sheet 2)Material PaperScale 1:8 000Dimensions 841 x 594 mmAuthors Igor DreckiPublished by Auckland CouncilDate published 07/2013Language English
A large scale urban map depicting city landscape with its parks, walking tracks, streets, recreation facilities and transport information. Particular attention is placed on features concerning pedestrian traffic, whether for work or recreation. Facilities such as bus stops and carparks are shown to provide access reference. Play grounds for children, lookout points, toilets and a detailed network of walking routes with steps marked, are included to promote family recreation and leisure.
Glacial Geomorphology of the central South Island, New ZealandMaterial MonographAuthors D. J. A. Barrell, B. G. Andersen and G. H. DentonPublished by GNS ScienceDate published 2011Language English
The set of five maps that accompany the 80-page monograph depict glacial landforms at the scale of 1:100,000. The maps show distribution of glaciers, glacial moraines, outwash plains and a range of other landforms, organised by age and overlaid on a 10m cell size DEM to provide topographic context. These maps provide a foundation for detailed research on New Zealand Quaternary climate record. Understanding this record provides context to the current widespread retreat of Southern Alps glaciers, while emphasizing climate fluctuation over the past 45,000 years, and offering a framework for consideration of future climate change.
OTHER CARTOGRAPHIC PRODUCTS
107

MAPS
AntarcticaMaterial PaperScale 1:8 700 000Dimensions 1000 x 1150 mmAuthors Anders Skoglund, Norwegian Polar
Institute, Fram Centre, NO-9296 Tromsø, Norway
Published by Norwegian Polar Institute, NO-9296 Tromsø, Norway
Date published 02/2013Language English
Antarctica is a circumpolar wall map to be released by the Norwegian Polar Institute in spring 2013, at scale 1:10 000 000 and with some minor adjustments compared to the Special Edition at this ICA exhibition. The map will be published in English to target the international audience. Creating this as a wall map, there has been focus on vivid but pleasant and natural colors, distinct shaded relief, and an appropriate amount of place names. An overview map and a satellite imagery backdrop have been included for general reference and value addition.
Mountaineering Map LeirvassbuMaterial Water resistant PaperScale 1:50 000Dimensions 625 x 500 mmAuthors Tore Tonning/ Mesterkart, Veelsmyra 43,
N-1634 Gamle Fredrikstad, NorwayPublished by Fri Flyt/ MesterkartDate published 11/2012Language Norwegian, English
The map shows the skiing, hiking and mountaineering opportunities around the mountain hut Leirvassbu in Jotunheimen, Norway.
Tourist Map Oslomarka SummerMaterial Pretex 120 gScale 1:50 000Dimensions 700 x 1000 mmAuthors Cappelen Damm kart/Therese
Torstensson, Akersgata 47/49, N-0055 Oslo, Norway
Published by Cappelen Damm AS, Akersgata 47/49, N-0055 Oslo, Norway
Date published 09/2011Language Norwegian, English
This is the first edition of the Oslo hiking maps in scale 1:50.000. The summer map has information on both marked and unmarked trails, bicycle routes, dining, lodging and other useful information. Selected marked trails also have walking time in hours. The map also has a mountain shadow that makes it easier to visualize the terrain, and it is printed on weather-resistant Paper with high durability and rain tolerance.
No
rway
108
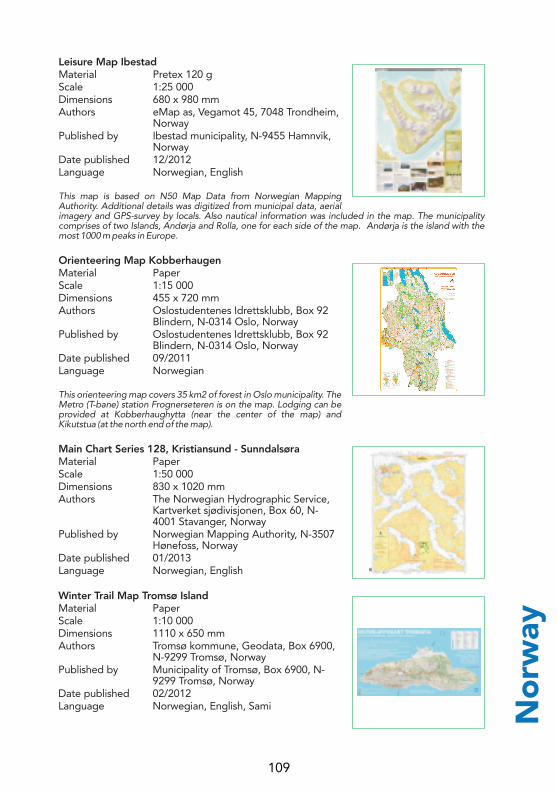
No
rway
Leisure Map IbestadMaterial Pretex 120 gScale 1:25 000Dimensions 680 x 980 mmAuthors eMap as, Vegamot 45, 7048 Trondheim,
NorwayPublished by Ibestad municipality, N-9455 Hamnvik,
NorwayDate published 12/2012Language Norwegian, English
This map is based on N50 Map Data from Norwegian Mapping Authority. Additional details was digitized from municipal data, aerial imagery and GPS-survey by locals. Also nautical information was included in the map. The municipality comprises of two Islands, Andørja and Rolla, one for each side of the map. Andørja is the island with the most 1000 m peaks in Europe.
Orienteering Map KobberhaugenMaterial PaperScale 1:15 000Dimensions 455 x 720 mmAuthors Oslostudentenes Idrettsklubb, Box 92
Blindern, N-0314 Oslo, NorwayPublished by Oslostudentenes Idrettsklubb, Box 92
Blindern, N-0314 Oslo, NorwayDate published 09/2011Language Norwegian
This orienteering map covers 35 km2 of forest in Oslo municipality. The Metro (T-bane) station Frognerseteren is on the map. Lodging can be provided at Kobberhaughytta (near the center of the map) and Kikutstua (at the north end of the map).
Main Chart Series 128, Kristiansund - SunndalsøraMaterial PaperScale 1:50 000Dimensions 830 x 1020 mmAuthors The Norwegian Hydrographic Service,
Kartverket sjødivisjonen, Box 60, N-4001 Stavanger, Norway
Published by Norwegian Mapping Authority, N-3507 Hønefoss, Norway
Date published 01/2013Language Norwegian, English
Winter Trail Map Tromsø IslandMaterial PaperScale 1:10 000Dimensions 1110 x 650 mmAuthors Tromsø kommune, Geodata, Box 6900,
N-9299 Tromsø, NorwayPublished by Municipality of Tromsø, Box 6900, N-
9299 Tromsø, NorwayDate published 02/2012Language Norwegian, English, Sami
109

The winter trail map shows city parks and trails nearby the city of Tromsø. The map is situated several places along the trails. Paper-versions are available and digital versions can be downloaded from QR-code or from website, free of charge. The map shows several alternatives for both inhabitants and tourists, whether they are looking for a winter hiking trail or a ski trail. Parking places, sledding hills and arenas for winter sport are also shown. Hopefully, the winter trail map inspires everybody to use the city parks and trails – right outside the doorstep and always waiting to be used!
Tourist Map HallingskarvetMaterial PaperScale 1:50 000Dimensions 1100 x 800 mmAuthors Tore Tonning, Veelsmyra 43, N-1634
Gamle Fredrikstad, NorwayPublished by Mesterkart, Veelsmyra 43, N-1634
Gamle Fredrikstad, NorwayDate published 05/2012Language Norwegian
This is a custom made wall map, made for the owner of a mountain cabin in the area.
Harbour Chart Series 468, Tønsberg HarbourMaterial PaperScale 1:10 000Dimensions 925 x 700 mmAuthors The Norwegian Hydrographic Service,
Kartverket sjødivisjonen, Box 60, N-4001 Stavanger, Norway
Published by Norwegian Mapping Authority, N-3507 Hønefoss, Norway
Date published 09/2012Language Norwegian, English
Trondheim City, Board mapMaterial Plotted on PaperScale 1:4 000Dimensions 1200 x 1765 mmAuthors eMap as, Vegamot 45, N-7048
Trondheim, NorwayPublished by Trondheim municipality, Box 2300
Sluppen, 7004 TRONDHEIMDate published 07/2012Language Norwegian, English
The map is displayed in various glass mounts and bus stop shelters around in the city for tourists, visitors and locals.
No
rway
110
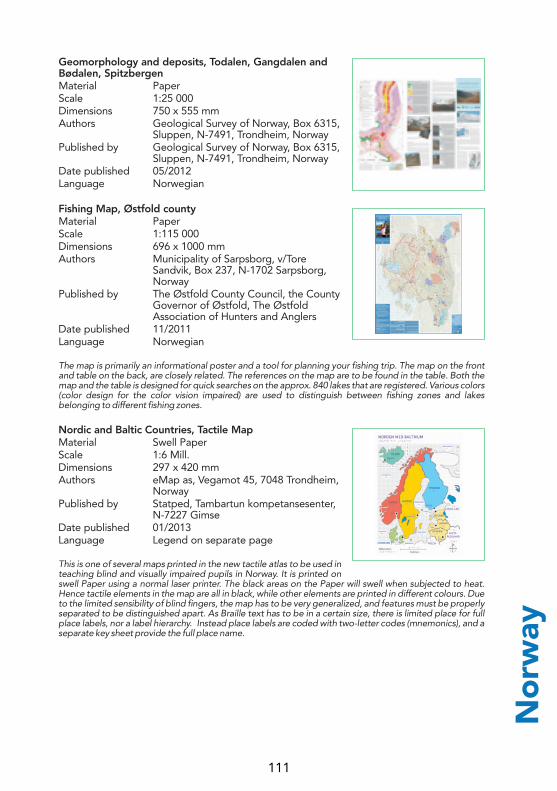
No
rway
Geomorphology and deposits, Todalen, Gangdalen and Bødalen, SpitzbergenMaterial PaperScale 1:25 000Dimensions 750 x 555 mmAuthors Geological Survey of Norway, Box 6315,
Sluppen, N-7491, Trondheim, NorwayPublished by Geological Survey of Norway, Box 6315,
Sluppen, N-7491, Trondheim, NorwayDate published 05/2012Language Norwegian
Fishing Map, Østfold countyMaterial PaperScale 1:115 000Dimensions 696 x 1000 mmAuthors Municipality of Sarpsborg, v/Tore
Sandvik, Box 237, N-1702 Sarpsborg, Norway
Published by The Østfold County Council, the County Governor of Østfold, The Østfold Association of Hunters and Anglers
Date published 11/2011Language Norwegian
The map is primarily an informational poster and a tool for planning your fishing trip. The map on the front and table on the back, are closely related. The references on the map are to be found in the table. Both the map and the table is designed for quick searches on the approx. 840 lakes that are registered. Various colors (color design for the color vision impaired) are used to distinguish between fishing zones and lakes belonging to different fishing zones.
Nordic and Baltic Countries, Tactile MapMaterial Swell PaperScale 1:6 Mill.Dimensions 297 x 420 mmAuthors eMap as, Vegamot 45, 7048 Trondheim,
NorwayPublished by Statped, Tambartun kompetansesenter,
N-7227 GimseDate published 01/2013Language Legend on separate page
This is one of several maps printed in the new tactile atlas to be used in teaching blind and visually impaired pupils in Norway. It is printed on swell Paper using a normal laser printer. The black areas on the Paper will swell when subjected to heat. Hence tactile elements in the map are all in black, while other elements are printed in different colours. Due to the limited sensibility of blind fingers, the map has to be very generalized, and features must be properly separated to be distinguished apart. As Braille text has to be in a certain size, there is limited place for full place labels, nor a label hierarchy. Instead place labels are coded with two-letter codes (mnemonics), and a separate key sheet provide the full place name.
111
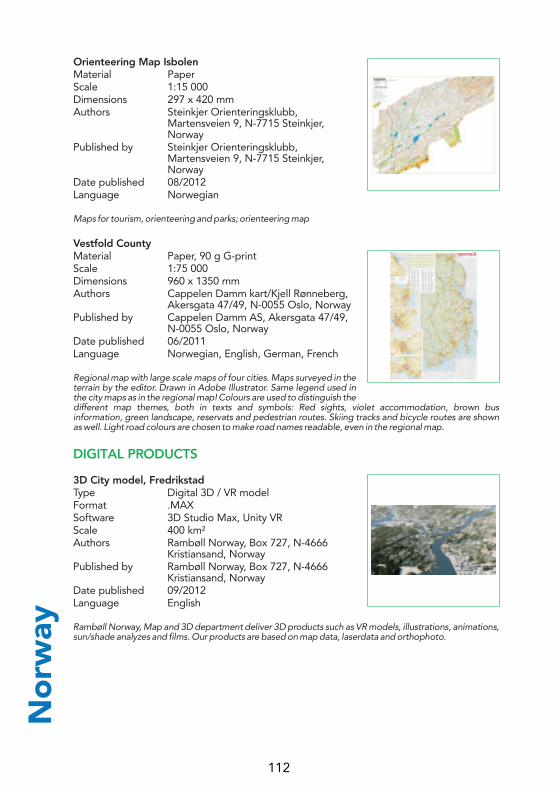
Orienteering Map IsbolenMaterial PaperScale 1:15 000Dimensions 297 x 420 mmAuthors Steinkjer Orienteringsklubb,
Martensveien 9, N-7715 Steinkjer, Norway
Published by Steinkjer Orienteringsklubb, Martensveien 9, N-7715 Steinkjer, Norway
Date published 08/2012Language Norwegian
Maps for tourism, orienteering and parks; orienteering map
Vestfold CountyMaterial Paper, 90 g G-printScale 1:75 000Dimensions 960 x 1350 mmAuthors Cappelen Damm kart/Kjell Rønneberg,
Akersgata 47/49, N-0055 Oslo, NorwayPublished by Cappelen Damm AS, Akersgata 47/49,
N-0055 Oslo, NorwayDate published 06/2011Language Norwegian, English, German, French
Regional map with large scale maps of four cities. Maps surveyed in the terrain by the editor. Drawn in Adobe Illustrator. Same legend used in the city maps as in the regional map! Colours are used to distinguish the different map themes, both in texts and symbols: Red sights, violet accommodation, brown bus information, green landscape, reservats and pedestrian routes. Skiing tracks and bicycle routes are shown as well. Light road colours are chosen to make road names readable, even in the regional map.
3D City model, FredrikstadType Digital 3D / VR modelFormat .MAXSoftware 3D Studio Max, Unity VRScale 400 km²Authors Rambøll Norway, Box 727, N-4666
Kristiansand, NorwayPublished by Rambøll Norway, Box 727, N-4666
Kristiansand, NorwayDate published 09/2012Language English
Rambøll Norway, Map and 3D department deliver 3D products such as VR models, illustrations, animations, sun/shade analyzes and films. Our products are based on map data, laserdata and orthophoto.
DIGITAL PRODUCTS
No
rway
112

Po
land
MAPS
Poland. Landscape MapMaterial PaperScale 1:500 000Dimensions 1450 x 1400 mmPublished by Head Office of Geodesy and
Cartography, Surveyor General of Poland
Date published 2011Language Polish, English
The map contains thematic content, which includes 12 landscape types as well as a detailed reference content. There have been distinguished 2 types of anthropogenic landscape, 3 rural and 3 woodland. The main source material for making the map was the General Geographic Database and the Digital Terrain Model used for hill shading.
Geoenvironmental Map of Poland, sheet 640 Radzyn Podlaski (M-34-10-C), part AMaterial PaperScale 1:50 000Dimensions 610 x 550 mmAuthors Katarzyna Siwy-Bedkowska, Zbigniew
BedkowskiPublished by Panstwowy Instytut Geologiczny,
Panstwowy Instytut Badawczy and Ministerstwo Srodowiska
Date published 2011Language Polish
The main contents of the A part of the ‘Geoenvironmental Map of Poland’ is the presentation of: 1) beds of minerals, prospect and prognostic areas of future mineral deposit exploitation, 2) present and potential hazards connected with the appearance of mineral deposits, their exploitation and mineral processing, 3) surface and underground water protection, 4) landscape and cultural monuments protection. The map is foreseen for the territorial planning purposes and might be used by the local and regional administration.
Geoenvironmental Map of Poland, sheet 640 Radzyn Podlaski (M-34-10-C), part BMaterial PaperScale 1:50 000Dimensions 610 x 550 mmAuthors Jerzy Król, Malgorzata MarczakPublished by Panstwowy Instytut Geologiczny,
Panstwowy Instytut Badawczy and Ministerstwo Srodowiska
Date published 2011Language Polish
The B part of the ‘Geoenvironmental Map of Poland’ consists of 3 thematic layers: 1) geochemical conditions of the environment (soil degradation as well as heavy metal and organic matter water deposits), 2) waste disposal (areas, on which disposal sites can be placed), 3) degree of hazard to the usable aquifer. The map legend is open and its content will be enriched with new items pertaining to the legal acts concerning the environment protection.
113
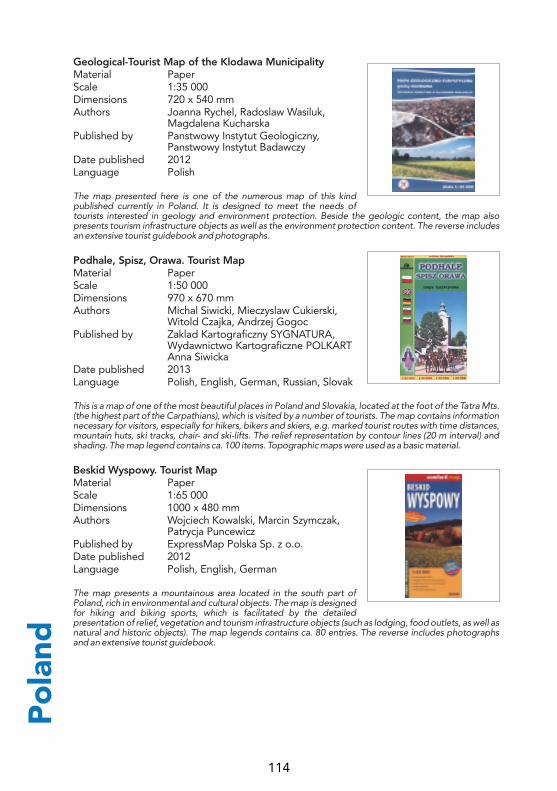
Geological-Tourist Map of the Klodawa MunicipalityMaterial PaperScale 1:35 000Dimensions 720 x 540 mmAuthors Joanna Rychel, Radoslaw Wasiluk,
Magdalena KucharskaPublished by Panstwowy Instytut Geologiczny,
Panstwowy Instytut BadawczyDate published 2012Language Polish
The map presented here is one of the numerous map of this kind published currently in Poland. It is designed to meet the needs of tourists interested in geology and environment protection. Beside the geologic content, the map also presents tourism infrastructure objects as well as the environment protection content. The reverse includes an extensive tourist guidebook and photographs.
Podhale, Spisz, Orawa. Tourist MapMaterial PaperScale 1:50 000Dimensions 970 x 670 mmAuthors Michal Siwicki, Mieczyslaw Cukierski,
Witold Czajka, Andrzej GogocPublished by Zaklad Kartograficzny SYGNATURA,
Wydawnictwo Kartograficzne POLKART Anna Siwicka
Date published 2013Language Polish, English, German, Russian, Slovak
This is a map of one of the most beautiful places in Poland and Slovakia, located at the foot of the Tatra Mts. (the highest part of the Carpathians), which is visited by a number of tourists. The map contains information necessary for visitors, especially for hikers, bikers and skiers, e.g. marked tourist routes with time distances, mountain huts, ski tracks, chair- and ski-lifts. The relief representation by contour lines (20 m interval) and shading. The map legend contains ca. 100 items. Topographic maps were used as a basic material.
Beskid Wyspowy. Tourist MapMaterial PaperScale 1:65 000Dimensions 1000 x 480 mmAuthors Wojciech Kowalski, Marcin Szymczak,
Patrycja PuncewiczPublished by ExpressMap Polska Sp. z o.o.Date published 2012Language Polish, English, German
The map presents a mountainous area located in the south part of Poland, rich in environmental and cultural objects. The map is designed for hiking and biking sports, which is facilitated by the detailed presentation of relief, vegetation and tourism infrastructure objects (such as lodging, food outlets, as well as natural and historic objects). The map legends contains ca. 80 entries. The reverse includes photographs and an extensive tourist guidebook.
Po
land
114
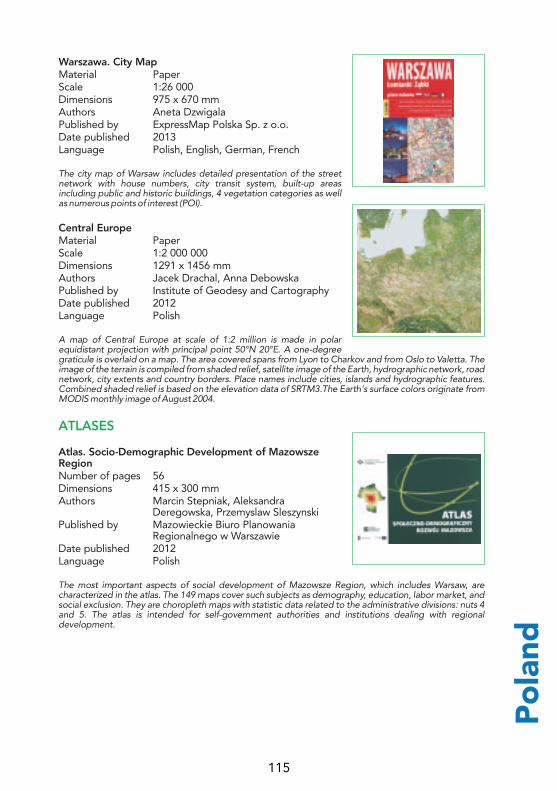
Po
land
Warszawa. City MapMaterial PaperScale 1:26 000Dimensions 975 x 670 mmAuthors Aneta DzwigalaPublished by ExpressMap Polska Sp. z o.o.Date published 2013Language Polish, English, German, French
The city map of Warsaw includes detailed presentation of the street network with house numbers, city transit system, built-up areas including public and historic buildings, 4 vegetation categories as well as numerous points of interest (POI).
Central EuropeMaterial PaperScale 1:2 000 000Dimensions 1291 x 1456 mmAuthors Jacek Drachal, Anna DebowskaPublished by Institute of Geodesy and CartographyDate published 2012Language Polish
A map of Central Europe at scale of 1:2 million is made in polar equidistant projection with principal point 50°N 20°E. A one-degree graticule is overlaid on a map. The area covered spans from Lyon to Charkov and from Oslo to Valetta. The image of the terrain is compiled from shaded relief, satellite image of the Earth, hydrographic network, road network, city extents and country borders. Place names include cities, islands and hydrographic features. Combined shaded relief is based on the elevation data of SRTM3.The Earth's surface colors originate from MODIS monthly image of August 2004.
Atlas. Socio-Demographic Development of Mazowsze RegionNumber of pages 56Dimensions 415 x 300 mmAuthors Marcin Stepniak, Aleksandra
Deregowska, Przemyslaw SleszynskiPublished by Mazowieckie Biuro Planowania
Regionalnego w WarszawieDate published 2012Language Polish
The most important aspects of social development of Mazowsze Region, which includes Warsaw, are characterized in the atlas. The 149 maps cover such subjects as demography, education, labor market, and social exclusion. They are choropleth maps with statistic data related to the administrative divisions: nuts 4 and 5. The atlas is intended for self-government authorities and institutions dealing with regional development.
ATLASES
115
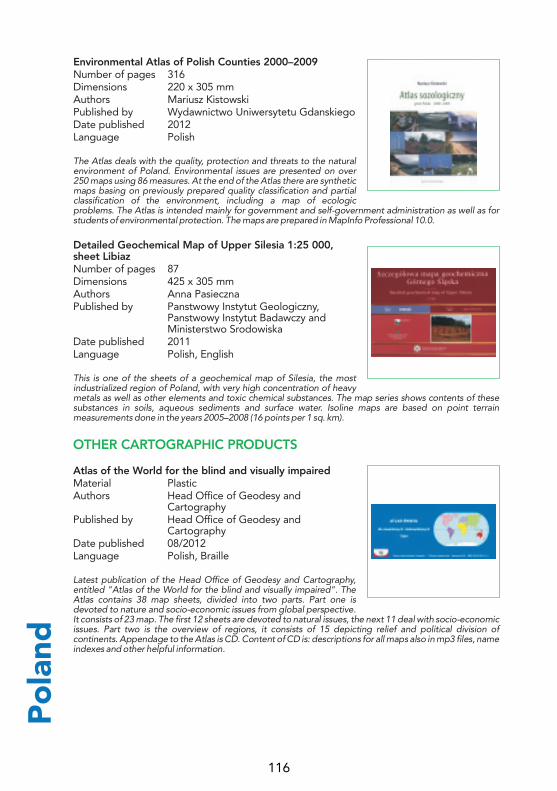
Environmental Atlas of Polish Counties 2000–2009Number of pages 316Dimensions 220 x 305 mmAuthors Mariusz KistowskiPublished by Wydawnictwo Uniwersytetu GdanskiegoDate published 2012Language Polish
The Atlas deals with the quality, protection and threats to the natural environment of Poland. Environmental issues are presented on over 250 maps using 86 measures. At the end of the Atlas there are synthetic maps basing on previously prepared quality classification and partial classification of the environment, including a map of ecologic problems. The Atlas is intended mainly for government and self-government administration as well as for students of environmental protection. The maps are prepared in MapInfo Professional 10.0.
Detailed Geochemical Map of Upper Silesia 1:25 000, sheet LibiazNumber of pages 87Dimensions 425 x 305 mmAuthors Anna PasiecznaPublished by Panstwowy Instytut Geologiczny,
Panstwowy Instytut Badawczy and Ministerstwo Srodowiska
Date published 2011Language Polish, English
This is one of the sheets of a geochemical map of Silesia, the most industrialized region of Poland, with very high concentration of heavy metals as well as other elements and toxic chemical substances. The map series shows contents of these substances in soils, aqueous sediments and surface water. Isoline maps are based on point terrain measurements done in the years 2005–2008 (16 points per 1 sq. km).
Atlas of the World for the blind and visually impairedMaterial PlasticAuthors Head Office of Geodesy and
CartographyPublished by Head Office of Geodesy and
CartographyDate published 08/2012Language Polish, Braille
Latest publication of the Head Office of Geodesy and Cartography, entitled "Atlas of the World for the blind and visually impaired". The Atlas contains 38 map sheets, divided into two parts. Part one is devoted to nature and socio-economic issues from global perspective. It consists of 23 map. The first 12 sheets are devoted to natural issues, the next 11 deal with socio-economic issues. Part two is the overview of regions, it consists of 15 depicting relief and political division of continents. Appendage to the Atlas is CD. Content of CD is: descriptions for all maps also in mp3 files, name indexes and other helpful information.
OTHER CARTOGRAPHIC PRODUCTS
Po
land
116
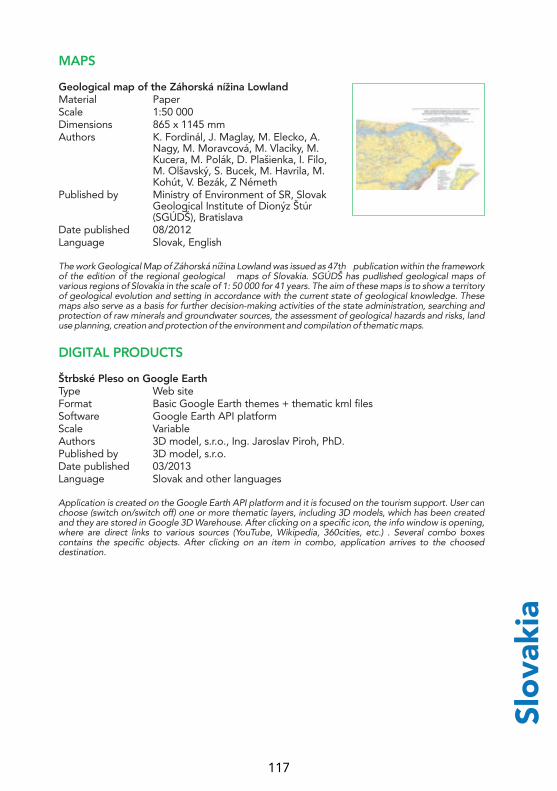
Slo
vaki
a
MAPS
DIGITAL PRODUCTS
Geological map of the Záhorská nížina LowlandMaterial PaperScale 1:50 000Dimensions 865 x 1145 mmAuthors K. Fordinál, J. Maglay, M. Elecko, A.
Nagy, M. Moravcová, M. Vlaciky, M. Kucera, M. Polák, D. Plašienka, I. Filo, M. Olšavský, S. Bucek, M. Havrila, M. Kohút, V. Bezák, Z Németh
Published by Ministry of Environment of SR, Slovak Geological Institute of Dionýz Štúr (SGÚDŠ), Bratislava
Date published 08/2012Language Slovak, English
The work Geological Map of Záhorská nížina Lowland was issued as 47th publication within the framework of the edition of the regional geological maps of Slovakia. SGÚDŠ has pudlished geological maps of various regions of Slovakia in the scale of 1: 50 000 for 41 years. The aim of these maps is to show a territory of geological evolution and setting in accordance with the current state of geological knowledge. These maps also serve as a basis for further decision-making activities of the state administration, searching and protection of raw minerals and groundwater sources, the assessment of geological hazards and risks, land use planning, creation and protection of the environment and compilation of thematic maps.
Štrbské Pleso on Google EarthType Web siteFormat Basic Google Earth themes + thematic kml filesSoftware Google Earth API platformScale VariableAuthors 3D model, s.r.o., Ing. Jaroslav Piroh, PhD.Published by 3D model, s.r.o.Date published 03/2013Language Slovak and other languages
Application is created on the Google Earth API platform and it is focused on the tourism support. User can choose (switch on/switch off) one or more thematic layers, including 3D models, which has been created and they are stored in Google 3D Warehouse. After clicking on a specific icon, the info window is opening, where are direct links to various sources (YouTube, Wikipedia, 360cities, etc.) . Several combo boxes contains the specific objects. After clicking on an item in combo, application arrives to the choosed destination.
117

Web-GIS MichalovceType Internet GIS applicationFormat ASP.NET applicationSoftware PostGIS, GeoServer, OpenLayersScale 8 zoomlevels (1:45 354 - 1:354)Authors Stengl, a.s.Published by Stengl, a.s.Date published 10/2012Language Slovak
Web-GIS of the Michalovce city is an interactive GIS application. It is based on an open-source platform, which uses PostGIS as its database, GeoServer as a map server and the OpenLayers library for displaying the maps. This application allows the user to display many thematic layers, such as urban green, cadastral map, public transport, etc. These are laid over a base map or an orthophotomap. This application also provides some basic tools for panning, zooming and measuring of the map. With a full-text search tool, the user can look up any addresses and cadastral parcels. Thanks to this GIS application, authorized users (municipal officers) are able to register parking places or roadworks on the streets directly into the map.
Slo
vaki
a
118
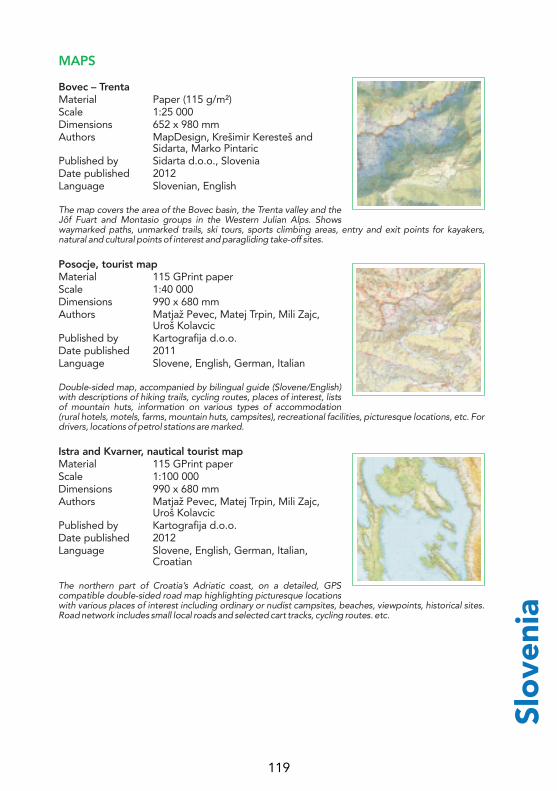
Slo
veni
a
MAPS
Bovec – TrentaMaterial Paper (115 g/m²)Scale 1:25 000Dimensions 652 x 980 mmAuthors MapDesign, Krešimir Keresteš and
Sidarta, Marko PintaricPublished by Sidarta d.o.o., SloveniaDate published 2012Language Slovenian, English
The map covers the area of the Bovec basin, the Trenta valley and the Jôf Fuart and Montasio groups in the Western Julian Alps. Shows waymarked paths, unmarked trails, ski tours, sports climbing areas, entry and exit points for kayakers, natural and cultural points of interest and paragliding take-off sites.
Posocje, tourist mapMaterial 115 GPrint paperScale 1:40 000Dimensions 990 x 680 mmAuthors Matjaž Pevec, Matej Trpin, Mili Zajc,
Uroš KolavcicPublished by Kartografija d.o.o.Date published 2011Language Slovene, English, German, Italian
Double-sided map, accompanied by bilingual guide (Slovene/English) with descriptions of hiking trails, cycling routes, places of interest, lists of mountain huts, information on various types of accommodation (rural hotels, motels, farms, mountain huts, campsites), recreational facilities, picturesque locations, etc. For drivers, locations of petrol stations are marked.
Istra and Kvarner, nautical tourist mapMaterial 115 GPrint paperScale 1:100 000Dimensions 990 x 680 mmAuthors Matjaž Pevec, Matej Trpin, Mili Zajc,
Uroš KolavcicPublished by Kartografija d.o.o.Date published 2012Language Slovene, English, German, Italian,
Croatian
The northern part of Croatia’s Adriatic coast, on a detailed, GPS compatible double-sided road map highlighting picturesque locations with various places of interest including ordinary or nudist campsites, beaches, viewpoints, historical sites. Road network includes small local roads and selected cart tracks, cycling routes. etc.
119
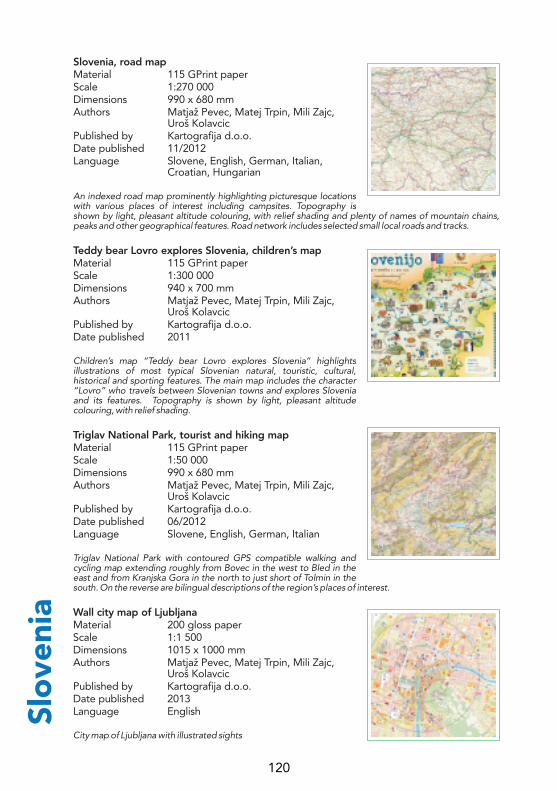
Slovenia, road mapMaterial 115 GPrint paperScale 1:270 000Dimensions 990 x 680 mmAuthors Matjaž Pevec, Matej Trpin, Mili Zajc,
Uroš KolavcicPublished by Kartografija d.o.o.Date published 11/2012Language Slovene, English, German, Italian,
Croatian, Hungarian
An indexed road map prominently highlighting picturesque locations with various places of interest including campsites. Topography is shown by light, pleasant altitude colouring, with relief shading and plenty of names of mountain chains, peaks and other geographical features. Road network includes selected small local roads and tracks.
Teddy bear Lovro explores Slovenia, children’s mapMaterial 115 GPrint paperScale 1:300 000Dimensions 940 x 700 mmAuthors Matjaž Pevec, Matej Trpin, Mili Zajc,
Uroš KolavcicPublished by Kartografija d.o.o.Date published 2011
Children’s map “Teddy bear Lovro explores Slovenia” highlights illustrations of most typical Slovenian natural, touristic, cultural, historical and sporting features. The main map includes the character “Lovro” who travels between Slovenian towns and explores Slovenia and its features. Topography is shown by light, pleasant altitude colouring, with relief shading.
Triglav National Park, tourist and hiking mapMaterial 115 GPrint paperScale 1:50 000Dimensions 990 x 680 mmAuthors Matjaž Pevec, Matej Trpin, Mili Zajc,
Uroš KolavcicPublished by Kartografija d.o.o.Date published 06/2012Language Slovene, English, German, Italian
Triglav National Park with contoured GPS compatible walking and cycling map extending roughly from Bovec in the west to Bled in the east and from Kranjska Gora in the north to just short of Tolmin in the south. On the reverse are bilingual descriptions of the region’s places of interest.
Wall city map of LjubljanaMaterial 200 gloss paperScale 1:1 500Dimensions 1015 x 1000 mmAuthors Matjaž Pevec, Matej Trpin, Mili Zajc,
Uroš KolavcicPublished by Kartografija d.o.o.Date published 2013Language English
City map of Ljubljana with illustrated sights
Slo
veni
a
120

Slo
veni
a
DARS Slovenian roadmapMaterial PaperScale 1:260 000Dimensions 960 x 680 mmAuthors Geodetic Institute of SloveniaPublished by DARS – Motorway company in the
Republic of SloveniaDate published 12/2011Language Slovene, English
Official map of DARS, who managed and maintained all existing motorways and expressways in Slovenia, as well as relevant infrastructure – junctions, tunnels, rest areas with services and plant. Includes other traffic data (main and regional public roads, road numbering, distances between places, border crossings, airports, railway network, etc)
Maribor - map of accessible places for disabled personsMaterial PaperScale 1:6 000Dimensions 680 x 460 mmAuthors Geodetic Institute of SloveniaPublished by Municipality of MariborDate published 12/2012Language Slovene, English
The map shows the transition paths for the disabled (paths without major architectural barriers, pedestrian crossings and ramps), the location of tactile floor system for the blind and visually impaired people in the city of Maribor and other places of interest.
Bay of Piran 02Material PaperScale 1:15 000Dimensions 824 x 555 mmAuthors Geodetic Institute of SloveniaPublished by Ministry of Transport of the Republic of
SloveniaDate published 11/2012Language Slovene, English
Nautical chart, 2nd Edition
General Tactile Map of Town Maribor, SloveniaMaterial PlasticScale 1:50 000Dimensions 250 x 350 mmAuthors Geodetic Institute of Slovenia Roman
Rener, M.Sc., Urška Babic, B.Sc., Jani Demsar
Published by Municipality of Maribor, Slovenia, Financed by: European Regional Development Fund and Municipality of Maribor
Date published 12/2012Language Slovenian
121
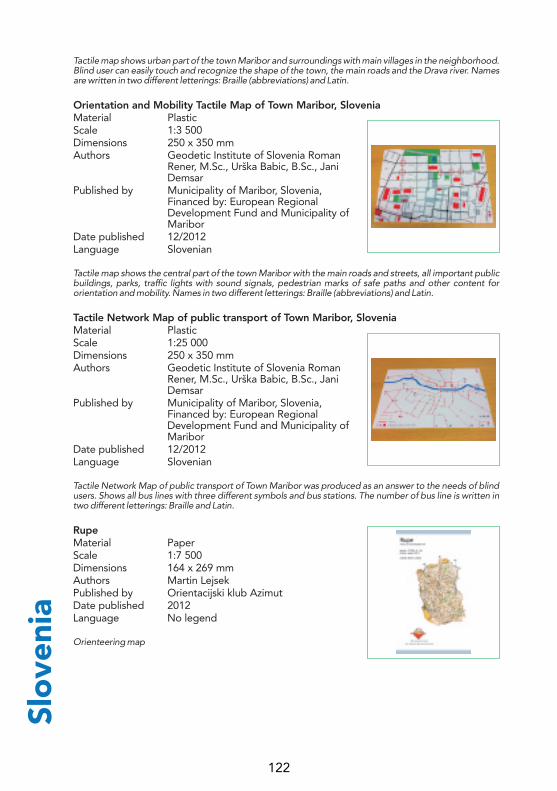
Tactile map shows urban part of the town Maribor and surroundings with main villages in the neighborhood. Blind user can easily touch and recognize the shape of the town, the main roads and the Drava river. Names are written in two different letterings: Braille (abbreviations) and Latin.
Orientation and Mobility Tactile Map of Town Maribor, SloveniaMaterial PlasticScale 1:3 500Dimensions 250 x 350 mmAuthors Geodetic Institute of Slovenia Roman
Rener, M.Sc., Urška Babic, B.Sc., Jani Demsar
Published by Municipality of Maribor, Slovenia, Financed by: European Regional Development Fund and Municipality of Maribor
Date published 12/2012Language Slovenian
Tactile map shows the central part of the town Maribor with the main roads and streets, all important public buildings, parks, traffic lights with sound signals, pedestrian marks of safe paths and other content for orientation and mobility. Names in two different letterings: Braille (abbreviations) and Latin.
Tactile Network Map of public transport of Town Maribor, SloveniaMaterial PlasticScale 1:25 000Dimensions 250 x 350 mmAuthors Geodetic Institute of Slovenia Roman
Rener, M.Sc., Urška Babic, B.Sc., Jani Demsar
Published by Municipality of Maribor, Slovenia, Financed by: European Regional Development Fund and Municipality of Maribor
Date published 12/2012Language Slovenian
Tactile Network Map of public transport of Town Maribor was produced as an answer to the needs of blind users. Shows all bus lines with three different symbols and bus stations. The number of bus line is written in two different letterings: Braille and Latin.
RupeMaterial PaperScale 1:7 500Dimensions 164 x 269 mmAuthors Martin LejsekPublished by Orientacijski klub AzimutDate published 2012Language No legend
Orienteering map
Slo
veni
a
122

Slo
veni
a
Bohinjsko jezeroMaterial PaperScale 1:7 500Dimensions 189 x 122 mmAuthors Mile StevanovicPublished by Orientacijska zveza Slovenije, Zveza
tabornikov SlovenijeDate published 08/2012Language No legend
Orienteering map
Kazlje - GradnjeMaterial PaperScale 1:10 000Dimensions 297 x 210 mmAuthors Mile Stevanovic, Daniel Lebar, Zdenek
Sokolár, Róbert MicekPublished by Lesovik, Ivan Nagy s.p.Date published 2012Language No legend
Orienteering map
Prevojske gmajneMaterial PaperScale 1:10 000Dimensions 350 x 200 mmAuthors Dušan PetrovicPublished by Orientacijski klub PolarisDate published 03/2013Language No legend
Orienteering map, made from lidar data with automated procedure (1), with additional visual interpretation (2); no field survey
Julian Alps – Central PartMaterial Lenticular foilScale 1:83 000Dimensions 210 x 297 mmAuthors Aleksandra DrakslerPublished by University of Ljubljana, Faculty of Civil
and Geodetic EngineeringDate published 2013Language Slovenian
Lenticular foil mountain map of the central part of the most prominent alpine area in Slovenia including Slovenian highest peak Triglav, the first lenticular foil map of territory of Slovenia.
123
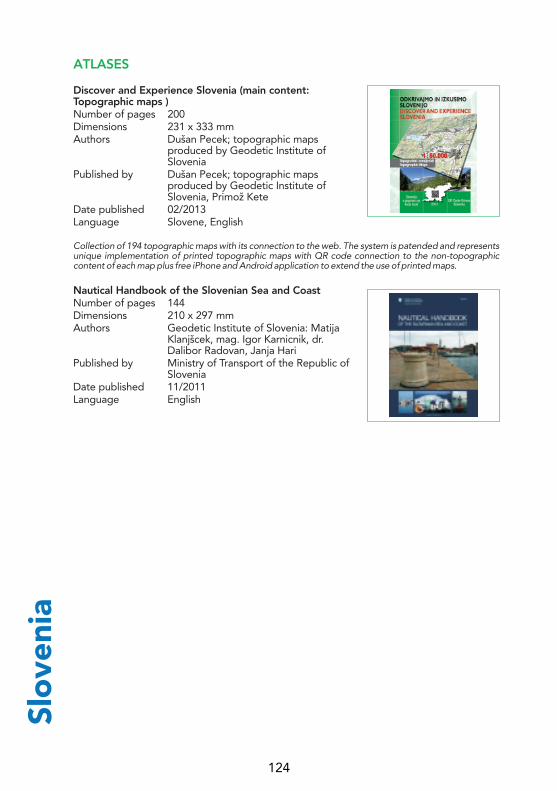
ATLASES
Discover and Experience Slovenia (main content: Topographic maps )Number of pages 200Dimensions 231 x 333 mmAuthors Dušan Pecek; topographic maps
produced by Geodetic Institute of Slovenia
Published by Dušan Pecek; topographic maps produced by Geodetic Institute of Slovenia, Primož Kete
Date published 02/2013Language Slovene, English
Collection of 194 topographic maps with its connection to the web. The system is patended and represents unique implementation of printed topographic maps with QR code connection to the non-topographic content of each map plus free iPhone and Android application to extend the use of printed maps.
Nautical Handbook of the Slovenian Sea and CoastNumber of pages 144Dimensions 210 x 297 mmAuthors Geodetic Institute of Slovenia: Matija
Klanjšcek, mag. Igor Karnicnik, dr. Dalibor Radovan, Janja Hari
Published by Ministry of Transport of the Republic of Slovenia
Date published 11/2011Language English
Slo
veni
a
124

MAPS
Continental Maps for visually impaired people. Physical Relief Map of Europe.Material PlasticScale 1:12 000 000Dimensions 600 x 450 mmAuthors Comisión Braille Española. Grupo de
Materiales en relieve. Fernando García Sória ([email protected]) ONCE
Published by Organización Nacional de Ciegos de España. ONCE
Date published 01/2013Language Braille, Spanish
Continental Maps for visually impaired people. Political Relief Map of EuropeMaterial PlasticScale 1:12 000 000Dimensions 600 x 450 mmAuthors Comisión Braille Española. Grupo de
Materiales en relieve. Fernando García Sória ([email protected]) ONCE
Published by Organización Nacional de Ciegos de España. ONCE
Date published 01/2013Language Braille, Spanish
Geological Map of Marambio Island (Seymour). AntarcticaMaterial PaperScale 1:20 000Dimensions 1300 x 900 mmAuthors Manuel Montes ([email protected]),
Francisco Nozal ([email protected]), Sergio Santillana ([email protected]), Sergio Marenssi ([email protected]), Eduardo Olivero ([email protected])
Published by Geological Survey of Spain (IGME)Date published 03/2013Language Spanish
Oviedo Roads MapMaterial PaperScale 1:5 000Dimensions 840 x 594 mmAuthors Jose Antonio Suárez
García([email protected]), Pelayo Gonzalez-Pumariega Solís ([email protected]) Ramón J. Argüelles Fraga ([email protected]), Juan Gabriel Rodriguez Aldesoro, Luis Manuel Lafuente Medina, Lorena Pérez Álvarez, Antonio Vinuesa Angulo
Published by Ayuntamiento de OviedoDate published 12/2011Language Spanish
Spai
n S
pan
ish
Soci
ety
of
Car
tog
rap
hy (
SEC
FT)
125
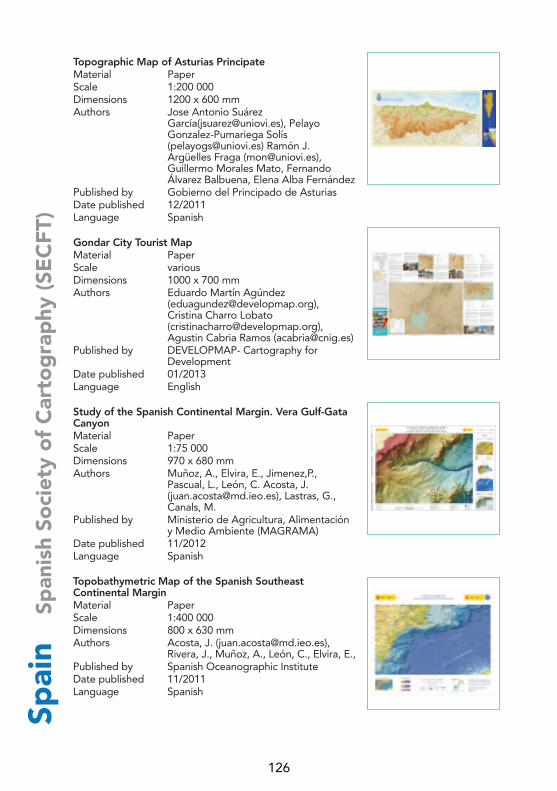
Topographic Map of Asturias PrincipateMaterial PaperScale 1:200 000Dimensions 1200 x 600 mmAuthors Jose Antonio Suárez
García([email protected]), Pelayo Gonzalez-Pumariega Solís ([email protected]) Ramón J. Argüelles Fraga ([email protected]), Guillermo Morales Mato, Fernando Álvarez Balbuena, Elena Alba Fernández
Published by Gobierno del Principado de AsturiasDate published 12/2011Language Spanish
Gondar City Tourist MapMaterial PaperScale variousDimensions 1000 x 700 mmAuthors Eduardo Martín Agúndez
([email protected]), Cristina Charro Lobato ([email protected]), Agustin Cabria Ramos ([email protected])
Published by DEVELOPMAP- Cartography for Development
Date published 01/2013Language English
Study of the Spanish Continental Margin. Vera Gulf-Gata CanyonMaterial PaperScale 1:75 000Dimensions 970 x 680 mmAuthors Muñoz, A., Elvira, E., Jimenez,P.,
Pascual, L., León, C. Acosta, J. ([email protected]), Lastras, G., Canals, M.
Published by Ministerio de Agricultura, Alimentación y Medio Ambiente (MAGRAMA)
Date published 11/2012Language Spanish
Topobathymetric Map of the Spanish Southeast Continental MarginMaterial PaperScale 1:400 000Dimensions 800 x 630 mmAuthors Acosta, J. ([email protected]),
Rivera, J., Muñoz, A., León, C., Elvira, E.,Published by Spanish Oceanographic InstituteDate published 11/2011Language Spanish
Spai
n S
pan
ish
Soci
ety
of
Car
tog
rap
hy (
SEC
FT)
126

Spai
n S
pan
ish
Soci
ety
of
Car
tog
rap
hy (
SEC
FT)
Map of the province of SevilleMaterial PaperScale 1:200 000Dimensions 1020 x 820 mmAuthors Instituto de Estadística y Cartografía de
Andalucía. Diputación Provincial de Sevilla
Published by Instituto de Estadística y Cartografía de Andalucía
Date published 07/2012Language Spanish
Informative map of the province of Seville which includes the elements that define its territorial structure: land uses, infrastructure, urban system, equipment and services supramunicipal character and natural resources, culture and tourism. The reverse features an SPOT image scale 1:75.000 of the Metropolitan Area of Seville
Doñana National ParkMaterial PaperScale 1:75 000Dimensions 670 x 960 mmAuthors Instituto de Estadística y Cartografía de
Andalucía. Diputación Provincial de Sevilla
Published by Instituto de Estadística y Cartografía de Andalucía
Date published 02/2012Language Spanish
Title of the series map-guides Andalusian natural parks, which provide information on the services provided by the tour trails, lookouts and other public facilities. Includes a general introduction to the environmental values ​​ of the protected area.
Map of NavarraMaterial PaperScale 1:100 000Dimensions 1750 x 1500 mmAuthors Government of Navarra. Public Works
DeparmentPublished by Public Works DeparmentDate published 06/2012Language Spanish
Atlas of Navarra (Roads, Turism an Environment)Number of pages 67Authors Government of Navarra. Public Works
DeparmentPublished by Public Works DeparmentDate published 12/2011Language Spanish
ATLASES
127

Geochemical Atlas of SpainNumber of pages 592Dimensions 297 x 420 mmAuthors Juan locutura ([email protected]),
Alejandro Bel-lan ([email protected]), Angel García Cortés ([email protected]), Sandra Martínez ([email protected])
Published by Geological Survey of Spain (IGME)Date published 10/2012Language Spanish
Andalusia. The cartographic image until the late nineteenth centuryNumber of pages 568Dimensions 280 x 320 mmAuthors Instituto de Estadística y Cartografía de
Andalucía.Published by Instituto de Estadística y Cartografía de
Andalucía.Date published 11/2011Language Spanish
Spatial data of reference of Andalusia or intermediate scalesType Multimedia DVD-Format ThemesScale Geographical informationAuthors Instituto de Estadística y Cartografía de
Andalucía.Published by Instituto de Estadística y Cartografía de
Andalucía.Date published 03/2013Language Spanish
DVD-Rom accompanied by a booklet, 20 pages containing the Repertoire of existing more complete and updated geographical information about the territory the autonomous community of Andalusia, being the reference plan of the statistical and cartographic system of Andalusia. 263 layers of information are presented in various formats in order to facilitate their incorporation into the most common cartographic treatment tools. This repository of geographical information has scale defined, since the accuracy of the information is measured by the positional quality of your original data, captured between 1:10.000 and 1:100.000, and has been designed to allow for complex analitic functions.
DIGITAL PRODUCTS
Spai
n S
pan
ish
Soci
ety
of
Car
tog
rap
hy (
SEC
FT)
128

Spai
n N
atio
nal G
eog
rap
hic
Inst
itut
e o
f Sp
ain
MAPS
Political Map of WorldMaterial PaperScale 1:82 350 000Dimensions 520 x 380 mmAuthors National Geographic Institute of SpainPublished by National Center of Geographic
Information of SpainDate published 05/2012Language Spanish
Physical Map of WorldMaterial PaperScale 1:82 350 000Dimensions 520 x 380 mmAuthors National Geographic Institute of SpainPublished by National Center of Geographic
Information of SpainDate published 05/2012Language Spanish
Political Map of SpainMaterial PaperScale 1:3 000 000Dimensions 520 x 380 mmAuthors National Geographic Institute of SpainPublished by National Center of Geographic
Information of SpainDate published 05/2012Language Spanish
Political Map of SpainMaterial PaperScale 1:1 125 000Dimensions 1400 x 1000 mmAuthors National Geographic Institute of SpainPublished by National Center of Geographic
Information of SpainDate published 06/2012Language Spanish
Physical Map of SpainMaterial PaperScale 1:3 000 000Dimensions 520 x 380 mmAuthors National Geographic Institute of SpainPublished by National Center of Geographic
Information of SpainDate published 06/2012Language Spanish
129

National Topographic Map of CastelldefelsMaterial PaperScale 1:25 000Dimensions 780 x 520 mmAuthors National Geographic Institute of SpainPublished by National Center of Geographic
Information of SpainDate published 06/2012Language Spanish
National Topographic Map of Madrid Area (Special Edition)Material PaperScale 1:50 000Dimensions 1270 x 1000 mmAuthors National Geographic Institute of SpainPublished by National Center of Geographic
Information of SpainDate published 06/2012Language Spanish
National Topographic Map of SalardúMaterial PaperScale 1:50 000Dimensions 770 x 520 mmAuthors National Geographic Institute of SpainPublished by National Center of Geographic
Information of SpainDate published 06/2012Language Spanish
Relief Map of La RiojaMaterial PlasticScale 1:200 000Dimensions 800 x 800 mmAuthors National Geographic Institute of SpainPublished by National Center of Geographic
Information of SpainDate published 02/2013Language Spanish
Relief Map of El Estrecho de GibraltarMaterial PlasticScale 1:100 000Dimensions 850 x 1000 mmAuthors National Geographic Institute of SpainPublished by National Center of Geographic
Information of SpainDate published 12/2011Language SpanishSp
ain
Nat
iona
l Geo
gra
phi
c In
stit
ute
of
Spai
n
130

Spai
n N
atio
nal G
eog
rap
hic
Inst
itut
e o
f Sp
ain
Region Map of BadajozMaterial PaperScale 1:200 000Dimensions 1400 x 1000 mmAuthors National Geographic Institute of SpainPublished by National Center of Geographic
Information of SpainDate published 06/2012Language Spanish
National Park of TeideType Multimedia DVDFormat VideoSoftware Windows (XP o higher)Scale Flora and FaunaAuthors National Center of Geographic
Information of SpainPublished by National Center of Geographic
Information of SpainDate published 06/2012Language Spanish
National Park of Picos de EuropaType Multimedia DVDFormat VideoSoftware Windows (XP o higher)Scale Flora and FaunaAuthors National Center of Geographic
Information of SpainPublished by National Center of Geographic
Information of SpainDate published 06/2012Language Spanish
DIGITAL PRODUCTS
131

MAPS
Topographic Map of Catalonia. Ebro Delta Natural ParkMaterial PaperScale 1:25 000Dimensions 1159 x 1484 mmAuthors Institut Cartogràfic de CatalunyaPublished by Institut Cartogràfic de CatalunyaDate published 12/2012Language Catalan, Spanish, English, French
Topographic map enhanced with thematic information, mainly for tourists and hikers: paths, places of interest and accommodation.
Topographic Map of Catalonia. Costa Brava centre - les GavarresMaterial PaperScale 1:25 000Dimensions 1480 x 940 mmAuthors Institut Cartogràfic de CatalunyaPublished by Institut Cartogràfic de CatalunyaDate published 07/2012Language Catalan, Spanish, English, French
Topographic map enhanced with thematic information, mainly for tourists and hikers: paths, places of interest and accommodation.
Topographic Map of Catalonia. Eastern Pyrenees - Girona - Costa BravaMaterial PaperScale 1:100 000Dimensions 1487 x 1121 mmAuthors Institut Cartogràfic de CatalunyaPublished by Institut Cartogràfic de CatalunyaDate published 12/2012Language Catalan, Spanish, English, French,
German, Ital
Topographic map enhanced with thematic information, mainly places of interest and accommodation.
Spai
n - C
atal
unya
28

Geological Map of Catalonia. El Pont de Suert (Front Side)
Material PaperScale 1:25 000Dimensions 1402 x 575 mmAuthors Institut Geològic de CatalunyaPublished by Institut Cartogràfic de CatalunyaDate published 10/2012Language Catalan
Series which presents information about the geological substratum on a topographic base. UTM projection. Each sheet includes various drawings relating to the map: geological diagrams and diagrams of stratigraphic records, units that do not outcrop in the area of the sheet, geological sections and synthetic and detailed columns. Printed on both sides.
Geological Map of Catalonia. El Pont de Suert (Back Side)Material PaperScale 1:25 000Dimensions 1402 x 575 mmAuthors Institut Geològic de CatalunyaPublished by Institut Cartogràfic de CatalunyaDate published 10/2012Language Catalan
Series which presents information about the geological substratum on a topographic base. UTM projection. Each sheet includes various drawings relating to the map: geological diagrams and diagrams of stratigraphic records, units that do not outcrop in the area of the sheet, geological sections and synthetic and detailed columns. Printed on both sides.
Geoanthropic Map of Catalonia. El Pont de Suert (Front Side)Material PaperScale 1:25 000Dimensions 1132 x 730 mmAuthors Institut Geològic de CatalunyaPublished by Institut Cartogràfic de CatalunyaDate published 10/2012Language Catalan
The map reflects those elements and geological processes that affect or might affect directly in human activities, along with those activities or human actions that modify the morphological characteristics of the surface topography or may affect, directly, in the physical properties and the behaviour of the natural terrain. Printed on both sides.
Spai
n - C
atal
unya
29
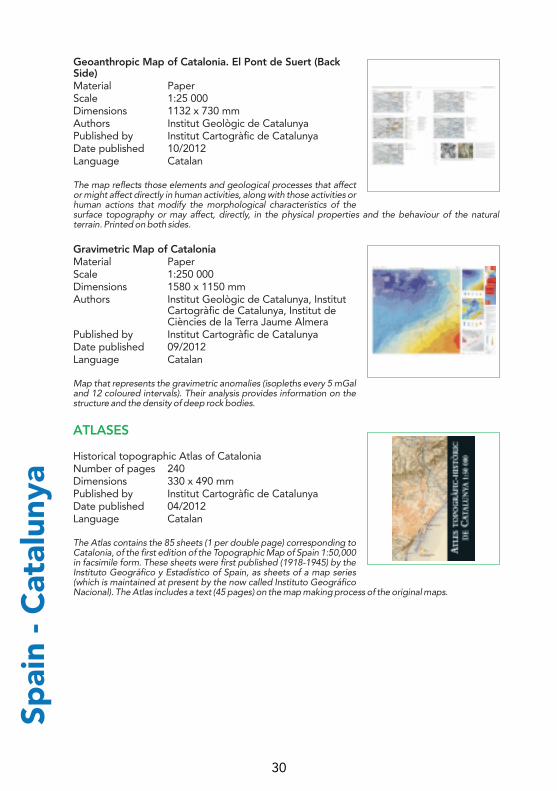
Geoanthropic Map of Catalonia. El Pont de Suert (Back Side)Material PaperScale 1:25 000Dimensions 1132 x 730 mmAuthors Institut Geològic de CatalunyaPublished by Institut Cartogràfic de CatalunyaDate published 10/2012Language Catalan
The map reflects those elements and geological processes that affect or might affect directly in human activities, along with those activities or human actions that modify the morphological characteristics of the surface topography or may affect, directly, in the physical properties and the behaviour of the natural terrain. Printed on both sides.
Gravimetric Map of CataloniaMaterial PaperScale 1:250 000Dimensions 1580 x 1150 mmAuthors Institut Geològic de Catalunya, Institut
Cartogràfic de Catalunya, Institut de Ciències de la Terra Jaume Almera
Published by Institut Cartogràfic de CatalunyaDate published 09/2012Language Catalan
Map that represents the gravimetric anomalies (isopleths every 5 mGal and 12 coloured intervals). Their analysis provides information on the structure and the density of deep rock bodies.
Historical topographic Atlas of CataloniaNumber of pages 240Dimensions 330 x 490 mmPublished by Institut Cartogràfic de CatalunyaDate published 04/2012Language Catalan
The Atlas contains the 85 sheets (1 per double page) corresponding to Catalonia, of the first edition of the Topographic Map of Spain 1:50,000 in facsimile form. These sheets were first published (1918-1945) by the Instituto Geográfico y Estadístico of Spain, as sheets of a map series (which is maintained at present by the now called Instituto Geográfico Nacional). The Atlas includes a text (45 pages) on the map making process of the original maps.
ATLASES
Spai
n - C
atal
unya
30

Catalonia. Grand Road AtlasNumber of pages 312Authors Institut Cartogràfic de CatalunyaPublished by SGIT Geostel, SADate published 2012Language Catalan
202 pages of detailed road maps 1:50,000. The content is drawn from the ICC’s topographic database 1:50,000. Continuity of cartographic representation throughout the atlas with each double page reading as one and uniform overlapping between sheets. And all the information about roads. Place-name index with 55,000 entries, of which 5,300 correspond to centres of population.
Spai
n - C
atal
unya
31
MAPS
Biking in HaningeMaterial Paper, two sidesScale 1:60 000 and 1:25 000Dimensions 543 x 500 mmAuthors Haninge municipalityPublished by Haninge municipalityDate published 08/2011Language Swedish
Published in Haninge 2011. Developed in collaboration between Haninge kommun and Infab. Haninge kommun, which is an administrative unit of local government, have inventoried geometries with appropriate bicycle paths and developed the background map. Infab, which is a cartographic agency, have applied the colours and graphic adjustments to the map.
Urban Streetmap LjungbyMaterial Paper, two sidesScale 1:10 000Dimensions 865 x 643 mmAuthors Danfilip Lundberg and Birgitta Westlin,
Infab ABPublished by Ljungby municipalityDate published 2012Language Swedish, English, German
This map product was printed in 10,000 copies and covers the urban areas of the municipality. The map is free of charge and distributed to public places such as libraries, information centers, hotels, gas stations etc. The map is also available on the municipality´s website in pdf format. Our intention is to be able to supply the residents of The Ljungby Municipality and its visitors with a quality map product without commercial interests. The product is also frequently used by employees and politicians in the municipal-organisation for planning and decision making.
Mountain MapMaterial Pretex, 100 g, two sidesScale 1:50 000Dimensions 910 x 585 mmAuthors National Land SurveyPublished by Lantmäteriet, the Swedish mapping,
cadastral and land registration authorityDate published 2011Language Swedish, English, German
The Mountain Map provides recent and reliable mountain information such as trails, bridges, cabins and emergency telephones. The map series are revised every 4 years. At revision information is gathered from authorities and organizations (central, regional and local) who have knowledge of, or operates, in the mountain region. Data is also gathered from other maps and with the support of aerial images. To ensure the quality of the contents inspections in the field are conducted.
Swed
en
132
Swed
en
Map and chart Tjärö-JärnavikMaterial Polyart 110 gScale 1:10 000Dimensions 1000 x 700 mmAuthors Jakob BengtssonPublished by Stigmännen Karlshamns
orienteringsklubbDate published 2012Language Swedish, English
Marin geologic map, Kosterhavet Geoturistic map, Documentation of the Swedish national parks Nr 26Material PaperScale 1:50 000Dimensions 630 x 897 mmAuthors Jeanette Bergman WeihedPublished by The Swedish Environmental Protection
Agency and Geological Survey of Sweden
Date published 2011Language Swedish
Bedrock map of SwedenMaterial PaperScale 1:1 MillionDimensions 940 x 1630 mmAuthors Jeanette Bergman WeihedPublished by Geological Survey of SwedenDate published 2012Language Swedish, English
Arctic Ocean BasemapMaterial PaperScale 1:14 000 000 (approximately)Dimensions 594 x 841 mmAuthors Hugo Ahlenius, Nordpil
http://nordpil.comPublished by UNEP/GRID-ArendalDate published 2011Language English
Background map for interactive web map service with geological data for oceanography. Prepared using Global Mapper, ESRI Arcgis, Adobe Illustrator and Adobe Photoshop.
133
Protected areas for conservation in the ArcticMaterial PaperScale VaryingDimensions 594 x 841 mmAuthors Hugo Ahlenius, Nordpil
http://nordpil.comPublished by Conservation of Arctic Flora and FaunaDate published 2011Language English
Prepared using ESRI Arcgis, Adobe Illustrator and Adobe Photoshop. Maps prepared for a report on status and inventory of protected areas in the Arctic, for overview and evaluation of conservation.
National Chart Series Sweden Inland Waters VÄTTERNMaterial PaperScale 1:100 000Dimensions 780 x 1130 mmPublished by Swedish Maritime Administration,
NorrköpingDate published 2012Language Swedish, English
Archipelago Chart Scale 1:100 000 (58° 30´N) Projection: Mercator Geodetical datum: WGS84 Chart datum: Mean sea level of the lake Vättern is 88.41m. Mean sea level is 3.07m above the lock-sill in Motala Symbols and abbreviations: see INT1
Agriculture and Forestry in Sweden since 1900Number of pages 232Dimensions 250 x 335 mmAuthors Ulf Jansson (sci.editor)Published by Norstedts Förlagsgrupp ABDate published 2011Language English
Agriculture and forestry provide us with foodstuffs, energy, building materials and paper – products essential to our daily living. This volume of the National Atlas of Sweden puts present-day land use and its changes in agriculture and forestry into a historical perspective.With its 342 maps, 133 charts and 171 photographs, plus 59 other illustrations, its describes the dramatic century that has passed. Farming and forestry have been transformed by mechanisation, motorisation, plant improvement, chemical pesticides, new knowledge on many different levels, economic and political change etc.
Atlas of Kristianstad MunicipalityNumber of pages 144Dimensions 215 x 205 mmAuthors Department of geographic information,
City Planning Office, Kristianstad Municipality
Published by Department of geographic information, City Planning Office, Kristianstad Municipality
Date published 2012Language Swedish
ATLASES
Swed
en
134
Swed
en
A new atlas of Kristianstad Municipality has been prepared by City Planning Office. The atlas contains maps of the municipality's population centers with addresses. With the Atlas follows two major folded maps, one of which is a two-sided map of the municipality and the other is an urban map with Kristianstad on one side and Åhus on the other. The urban map is a combination of aerial photography and traditional map, making it easy to find interesting destinations close to the populated areas.
Swedish Mining and MetalworkingNumber of pages 216Dimensions 250 x 335 mmAuthors Jan af Geijerstam, Marie Nisser (sci. eds)Published by Norstedts Förlagsgrupp ABDate published 2011
This atlas shows the contribution made by mining and metalworking to Sweden’s welfare over the centuries. Competition from abroad has been met with quality, inventiveness and enterprise. Even today, ore and special steels are among Sweden’s most important export products – more steel is being produced in Sweden than ever before. The history of metalworking in Sweden goes back at least 4,500 years. Traces of this activity are preserved in slag deposits and the remains of furnaces. The very landscape also testifies to the long history of mining and metalworking in place names, abandoned pits, and buildings and whole communities established around mines and metalworking.
Staffanstorp then and nowType Interactive map serviceFormat ESRI aerial photos to compareSoftware ArcGIS Server, base on a StoryMap TemplateScale 1:500 > 1: 1,024,000Authors Martin Ekstrand, Peter Gustafsson, Oscar MonellPublished by Geoinfo Staffanstorp Kävlinge municipalitiesDate published 2013Language Swedish, English
Staffanstorp and Kävlinge, Sweden. With our amazing "time machine", a swipetool-enabled web mapping application, everyone with an interest of the past can enjoy easy exploration of the development of their community. Built upon samples from the ArcGIS Online Story map team and further developed by the municipalities, http://kartweb.staffanstorp.se/historiskastaffanstorp is an example of a virtual gold mine, yours to explore!
GeomapType Geological maps in mobile app for AndroidFormat Geological maps in mobile app for AndroidSoftware mobile app for AndroidScale dynamic, max resolution 1:50,000Authors Geological Survey of SwedenPublished by Geological Survey of SwedenDate published 2012
Geomap is an application that quickly supplies you with information on bedrock, soil and groundwater in Sweden. The information is retrieved from SGU’s databases and is continuously updated with information from mapping of new areas. For example the app helps you finding the nearest spring or to see what kind of bedrock is under your feet.
DIGITAL PRODUCTS
135

Linköping MapType Interactiv webb mapFormat htmlSoftware webb readerScale Ca 1:1 000 000 – 1:300Authors The municipality of LinköpingPublished by The municipality of LinköpingDate published 04/2013
The Linköping Map is the main public mapping presence on the web for the municipality of Linköping. It provides a wide range of local information by the municipality, aimed at both citizens and visitors. The user interface is kept simple and easy to use, yet providing a mapping experience in both two and three dimensions.
Swed
en
136

Swit
zerl
and
MAPS
ATLASES
Trafimage mapsMaterial PaperScale 1:600 000Dimensions 880 x 420 mmAuthors Duplex Design, Basel. 7r, Schaffhausen. camtocamp, Lausanne.Published by SBB Infrastruktur, SwitzerlandDate published 08/2013Language English
Trafimage maps are used to illustrate a whole range of topics relating to public transport. The most important maps provide information to customers in Switzerland and abroad regarding public transport networks and areas of validity and inform them about offers such as bike rental, scenic routes or ideas for day trips. There are also Trafimage network maps as well as a wide range of maps for different internal uses.
Cuba / Pico TurquinoMaterial PaperScale 1:50 000Dimensions 690 x 490 mmAuthors Sandra Greulich, Sacha WettsteinPublished by climbing-map.com GmbHDate published 06/2012Language English, Spanish, German
Trekking and tourist map on a scale of 1:50,000 with useful information includes city maps of Havana, Santiago de Cuba and Bayamo. General map 1:1 million. Description of the history of the Cuban Revolution with chronological table and extra map. Trekking profile: Alto de Naranjo-Pico Turquino-Las Cuevas.
Atlas of the Swiss National Park – The first 100 yearsNumber of pages 243Dimensions 334 x 260 mmAuthors Haller, Heinrich; Eisenhut, Antonia; Haller, Rudolf (more than 90
different authors!)Published by Haupt Verlag, Bern, SwitzerlandDate published 2013Language German, French
For 100 years the Swiss National Park has scientifically observed how nature develops when left alone. Research into the park's geology, its fauna and flora, and the impact of human influence, as well as possible future scenarios, are all documented in text and maps with spatial and temporal comparisons. In their totality, they result in a broad and concise overview of the oldest and best protected national park of the Alps. This atlas is a milestone in literature describing nature reserves; the variety of topics,the detailed maps and the changes along a timeline are beyond comparison.
Navigator EuropeNumber of pages 512Dimensions 190 x 290 mmAuthors Hallwag Kümmerly+Frey AGPublished by www.swisstravelcenter.ch; Hallwag InternationalDate published 02/2013Language English, German +10 other languages
512 pages, travel informations, Web-Navigator 2.2 Europe: more than 1'500 important european web-sites supporting your planning and booking of journeys (hotel bookings, car-assistance organisations, official train organisations, ferry bookings, official airway organisations, tourism organisations). With mobile connectivity! table of distances, map keys in 12 languages, route planning map 1:4.5 Mio., Road map 1:800 000, planning map 1:5 Mio. with MotorRail & Ferries, 59 city maps, 30 transit plans, index of about 100 000 place names. GPS compatible.
137

DIGITAL PRODUCTS
Journey through timeType WebsiteAuthors Federal Office of Topography swisstopoPublished by Federal Office of Topography swisstopo:
http://www.swisstopo.admin.ch/internet/swisstopo/en/home/175/timetravel.html
Date published 01/2013Language English, German, French, Italian
What did Bern look like in 1950, or the banks of Lake Zurich in 1940? How far did the Aletsch glacier reach 20 years ago? To answer these questions and highlight national heritage in country maps, swisstopo has developed a viewer for topographical maps allowing a journey through time between 1938 and today.
Population: Cantons and the 10 largest cities of SwitzerlandType WebsiteFormat D3.js; SVG; HTML5Authors Ralph Straumann, 8050 Zürich, SwitzerlandPublished by http://ralphstraumann.ch/cartogram_cantons_frDate published 03/2013Language French, German
Le graphique en barres montre le nombre d'habitants des zones concernées. La Suisse déformée est une cartographie en anamorphose. Elle a été générée en tenant compte du nombre d'habitants qui peuplent les cantons et les villes de telle sorte que les "nouvelles" surfaces de ces territoires sont toujours représentatives de leur population.
Visualisation: Statistics of road traffic accidentsType WebsiteAuthors Federal Roads Office (FEDRO), SwitzerlandPublished by Federal Roads Office (FEDRO), SwitzerlandDate published 09/2012Language French, German, Italian
Statistics of road traffic accidents in Switzerland, three different types of visualisation: http://www.astra.admin.ch/unfalldaten/04345/04716/index.html?lang=fr
BabbuType Mobile mapAuthors Caroline Breitenmoser ([email protected]), Christophe Emery
([email protected])Published by Editions à la Carte, ZürichDate published 07/2012Language German
Children's book combined with a mobile map. The book is based on a true story: http://www.babbu.ch/geschichte-1; Web Map (Mobile): http://bit.ly/YDV4k8; Web Mapping Application (Desktop): http://goo.gl/EgRMP; Embeded im Website: http://www.esri.ch/de/news/articles/n120712.html
Swit
zerl
and
138

Swit
zerl
and
Political Atlas of Switzerland 1866-2012Type Website, DVD, USB Card, AppAuthors Sabine Kuster-Ahrens, Madeleine Schneider, David Vogel (Gaja Maps),
Thomas SchulzPublished by Bundesamt für Statistik BFS, SwitzerlandDate published 07/2012Language German, French
The new atlas on Swiss politics contains a comprehensive database and almost 3000 interactive maps that answer almost every question about current or historical Swiss elections and votes. The free online version contains all results since 1991 and all 24 elections of the National Council since 1919. The full edition (USB-Card, DVD) contains all results of 554 votes and voter turnouts since 1848.
139
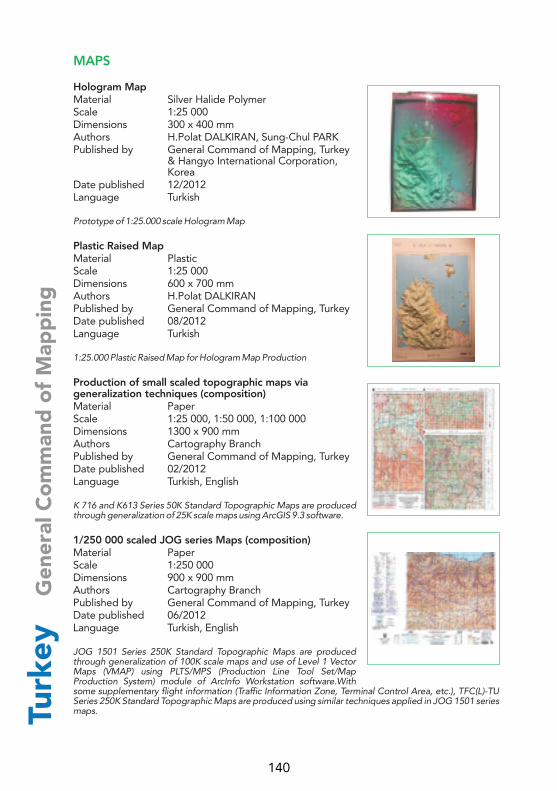
MAPS
Hologram MapMaterial Silver Halide PolymerScale 1:25 000Dimensions 300 x 400 mmAuthors H.Polat DALKIRAN, Sung-Chul PARKPublished by General Command of Mapping, Turkey
& Hangyo International Corporation, Korea
Date published 12/2012Language Turkish
Prototype of 1:25.000 scale Hologram Map
Plastic Raised MapMaterial PlasticScale 1:25 000Dimensions 600 x 700 mmAuthors H.Polat DALKIRANPublished by General Command of Mapping, TurkeyDate published 08/2012Language Turkish
1:25.000 Plastic Raised Map for Hologram Map Production
Production of small scaled topographic maps via generalization techniques (composition)Material PaperScale 1:25 000, 1:50 000, 1:100 000Dimensions 1300 x 900 mmAuthors Cartography BranchPublished by General Command of Mapping, TurkeyDate published 02/2012Language Turkish, English
K 716 and K613 Series 50K Standard Topographic Maps are produced through generalization of 25K scale maps using ArcGIS 9.3 software.
1/250 000 scaled JOG series Maps (composition)Material PaperScale 1:250 000Dimensions 900 x 900 mmAuthors Cartography BranchPublished by General Command of Mapping, TurkeyDate published 06/2012Language Turkish, English
JOG 1501 Series 250K Standard Topographic Maps are produced through generalization of 100K scale maps and use of Level 1 Vector Maps (VMAP) using PLTS/MPS (Production Line Tool Set/Map Production System) module of ArcInfo Workstation software.With some supplementary flight information (Traffic Information Zone, Terminal Control Area, etc.), TFC(L)-TU Series 250K Standard Topographic Maps are produced using similar techniques applied in JOG 1501 series maps.Tu
rkey
G
ener
al C
om
man
d o
f M
app
ing
140
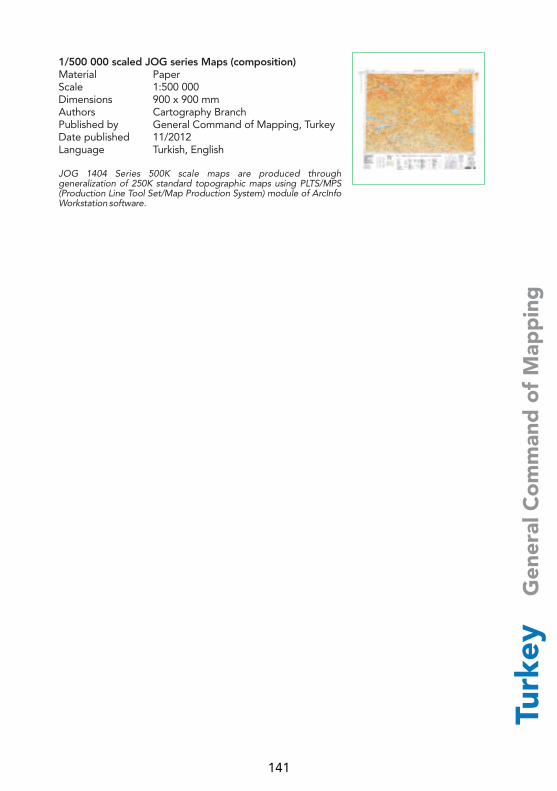
Turk
ey
Gen
eral
Co
mm
and
of
Map
pin
g
1/500 000 scaled JOG series Maps (composition)Material PaperScale 1:500 000Dimensions 900 x 900 mmAuthors Cartography BranchPublished by General Command of Mapping, TurkeyDate published 11/2012Language Turkish, English
JOG 1404 Series 500K scale maps are produced through generalization of 250K standard topographic maps using PLTS/MPS (Production Line Tool Set/Map Production System) module of ArcInfo Workstation software.
141
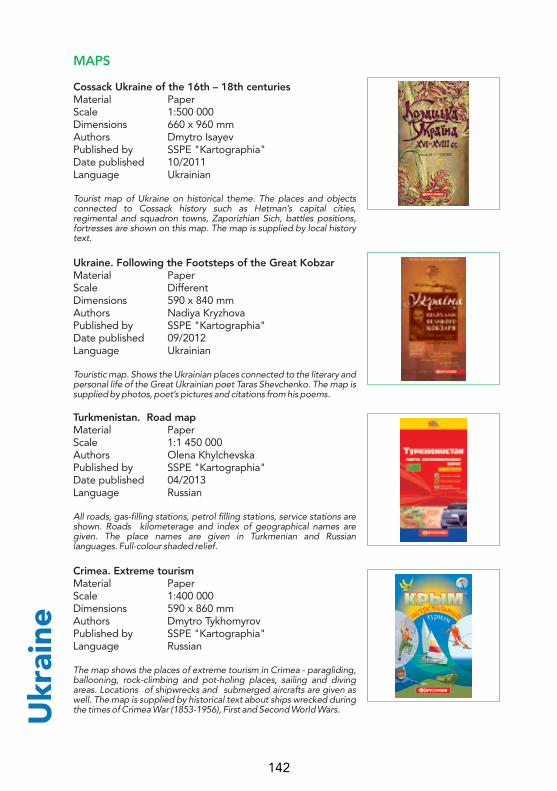
MAPS
Cossack Ukraine of the 16th – 18th centuriesMaterial PaperScale 1:500 000Dimensions 660 x 960 mmAuthors Dmytro IsayevPublished by SSPE "Kartographia"Date published 10/2011Language Ukrainian
Tourist map of Ukraine on historical theme. The places and objects connected to Cossack history such as Hetman’s capital cities, regimental and squadron towns, Zaporizhian Sich, battles positions, fortresses are shown on this map. The map is supplied by local history text.
Ukraine. Following the Footsteps of the Great KobzarMaterial PaperScale DifferentDimensions 590 x 840 mmAuthors Nadiya KryzhovaPublished by SSPE "Kartographia"Date published 09/2012Language Ukrainian
Touristic map. Shows the Ukrainian places connected to the literary and personal life of the Great Ukrainian poet Taras Shevchenko. The map is supplied by photos, poet’s pictures and citations from his poems.
Turkmenistan. Road mapMaterial PaperScale 1:1 450 000Authors Olena KhylchevskaPublished by SSPE "Kartographia"Date published 04/2013Language Russian
All roads, gas-filling stations, petrol filling stations, service stations are shown. Roads kilometerage and index of geographical names are given. The place names are given in Turkmenian and Russian languages. Full-colour shaded relief.
Crimea. Extreme tourismMaterial PaperScale 1:400 000Dimensions 590 x 860 mmAuthors Dmytro TykhomyrovPublished by SSPE "Kartographia"Language Russian
The map shows the places of extreme tourism in Crimea - paragliding, ballooning, rock-climbing and pot-holing places, sailing and diving areas. Locations of shipwrecks and submerged aircrafts are given as well. The map is supplied by historical text about ships wrecked during the times of Crimea War (1853-1956), First and Second World Wars.Ukr
aine
142

Ukr
aine
Tourist map of UkraineMaterial PaperScale 1:250 000Dimensions 750 x 1100 mmAuthors Valentyna VdovenkoPublished by SSPE "Kartographia"Date published 02/2012Language English, German, Spanish, French
Includes items of special tourist interest that were recommended to EURO-2012 football fans. The map is supplied by plans of Kyiv, Kharkov, Lviv, Donetsk – football matches venues and by explanatory texts on tourist attractions of these cities, reference materials.
World. Physical MapMaterial LaminatedScale 1:35 000 000Dimensions 980 x 680 mmAuthors Veronika RadchenkoPublished by SSPE "Kartographia"Date published 11/2012Language Ukrainian
Shows relief with colour shading, rivers, lakes, swamps, salt marshes, cays, volcanoes. The map is shaped by fine arts frame.
Political map of the WorldMaterial CardboardScale 1:15 000 000Dimensions 2160 x 1580 mmAuthors Veronika RadchenkoPublished by SSPE "Kartographia"Language Ukrainian
Contains information regarding all countries and territories of the World. Settlements are shown by population size. The map is supplied by reference materials for each country: national flag, area size, country code, email id.
The Autonomous Republic of the Crimea. Relief MapMaterial PlasticScale 1:200 000Dimensions 1700 x 1230 mmAuthors Olena KhylchevskaPublished by SSPE "Kartographia"Date published 12/2011Language Russian
143

The Autonomous Republic of the Crimea .Road Map.Material PaperScale 1:250 000Dimensions 700 x 940 mmAuthors Olena KhylchevskaPublished by SSPE "Kartographia"Date published 04/2012Language Ukrainian, Russian, English
Displays up-to-date road network and automotive service. Supplied by plans of 10 cities. Localities names are given in Russian and Ukrainian.
Ukraine. The West.Material PaperScale 1:500 000Dimensions 620 x 1000 mmAuthors Olena KhylchevskaDate published 03/2013Language Ukrainian, English
Double-sided map. Displays roads, highway markers, distance in kilometers by roads, gas-filling stations, petrol filling stations, service stations, campings, tourist attractions.
Atlas of Reproductions. Hand-made Maps of the 16th – 19th cc. From the Funds of the State Historical Achieves of Ukraine (Lviv)Number of pages 216Dimensions 240 x 325 mmAuthors Uliana KryshtalovychPublished by SSPE "Kartographia'Date published 09/2011Language Ukrainian, English, Latin
For the first time in Ukrainian cartography the Atlas displays the maps of the 16th – 19th cc. from the Funds of the State Historical Achieves of Ukraine (Lviv). The manorial maps that were attached to juridical documents and supplied the acts of partition, delimitation, purchasing and sell of estate are described. The maps of forests, rivers, demarcation maps of Western Ukraine and South-Eastern Poland are displays as well.
Lviv. Complex AtlasNumber of pages 192Dimensions 235 x 320 mmAuthors Oleg Shabliy, Semen Matkovskyi,
Oleksandra VistakPublished by SSPE "Kartographia'Date published 01/2013Language Ukrainian
The first complex atlas of the big city published in Ukraine. Contains information about geographical location, natural resources, history, population, economy, market and production infrastructure of the Lviv city.
ATLASES
Ukr
aine
144

Ukr
aine
Atlas “History of Ukraine”Number of pages 152Dimensions 240 x 325 mmAuthors Dmytro IsayevPublished by SSPE "Kartographia'Date published 01/2013Language Ukrainian
The atlas represents the landmarks of the history of Ukraine from ancient times to the present day. The edition contains a lot of archaeological maps, maps in histrorical economics, maps in the history of culture, population maps, etc. Each page of thematic units consists of three parts: one or several maps; the commentary, which explains the locality of historical events, shown on the map; illustrations. The Atlas is meant for teachers, History students and for everyone engaged in self-education.
General Geography 6th gradeType Educational multimedia CD-ROMFormat ExecutableSoftware JavaScale DifferentAuthors Inna Yevropyna, Vitaliy Ostroukch, Yuryi
KonstantynovDate published 09/2011Language Ukrainian
For individual learning about geography. Consists from 8 sections: 1) Knowledge the Earth by the means of geography; 2) The Earth in space; 3) The Earth on plans and maps; 4) Lithosphere; 5) Hydrosphere; 6) Atmosphere; 7) Biosphere. Sections are divided into themes. There are texts for self-examinations and a lot of maps and plans with animation.
Physical Geography of Ukraine. The 8th gradeType Educational multimedia CD-ROMFormat ExecutableSoftware JavaScale 1:2 500 000Authors Svytlana Kapustenko, Vitaliy OstroukchPublished by SSPE "Kartographia"Date published 09/2012Language Ukrainian
For individual learning about geography. Consists from 4 sections: 1) Geographical location; 2) Natural environment; 3) Lanscapes and geographical zoning; 4) Nature reserve fund and ecology. Contains a lot of charts and maps with animation.
DIGITAL PRODUCTS
145

EDUCATIONAL CARTOGRAPHIC PRODUCTS
Mykolaiv Oblast. General educational map.Type MapAuthors Olena KorolPublished by SSPE "Kartographia"Date published 11/162Language Ukrainian
Displays all settlements of the region, limitations of administrative areas, borders of reserves, national natural and regional landscape parks, roads and railways. Relief is given by hypsometric tinting – 0-40-100-160-200-240 with bench-marks and depth. Shows swamps, salt marches and natural resources.
Ukr
aine
146

Uni
ted
Kin
gd
om
MAPS
Easter Bush Campus Travel MapMaterial Paper & CardScale VariousDimensions 400 x 234 mmAuthors Clare Seldon, Steer Davies GleavePublished by University of EdinburghDate published 08/2012Language English
Supports relocation of staff and students to the new Easter Bush Campus, located eight miles outside Edinburgh city centre, a leaflet was produced by Steer Davies Gleave to explain travel options. As parking is limited at the new site, public transport is the recommended means of getting there and bus routes were reviewed to create better links between campuses and halls of residence as well as major transport hubs and Edinburgh city centre. The maps build upon existing travel planning work undertaken at the site and recognise the business opportunities associated with neighbouring organisations in the Easter Bush area. Available on-line at: http://www.docs.csg.ed.ac.uk/EstatesBuildings/Transport/EasterBushCampusTravelMap.pdf
Swindon Cycle MapMaterial Paper & CardScale 1:14 000Dimensions 841 x 594 mmAuthors Clare Seldon, Steer Davies GleavePublished by Swindon Borough CouncilDate published 06/2012Language English
Swindon Travel Choices is funded through the Government’s Local Sustainable Transport Fund and aims to make it easier for those living or working in Swindon to get around without a car. This map has been produced with the help of Swindon Bicycle User Group and Sustrans and is published using OpenStreetMap. Workshops are also being held by SBC to encourage OSM use and contributors and in March 2013 the area passed the 100% mark for road completion. Available on-line at: http://www.swindontravelchoices.co.uk/assets/CycleLeaflet_SwindonTown.pdf
Climate Change Vulnerability Index 2013Material PaperScale 1:83 400 000Dimensions 594 x 420 mmAuthors Arianna Granziera (GIS); Patrick Ward
(Design); Joe Baker (Design)Published by MaplecroftDate published 11/2012Language English
The Climate Change Vulnerability Index, which forms a central pillar of Maplecroft's Climate Change and Environmental Risk Atlas 2013, has been developed by Maplecroft to identify risks to populations and business from the changing temperatures and weather systems that are forecast to take hold in the coming years. It evaluates 197 countries, down to a level of 25km², on their exposure to climate related natural hazards; the sensitivity of populations; development; natural resources; agricultural dependency; research and development; government effectiveness and education levels. For more information see www.maplecroft.com.
147
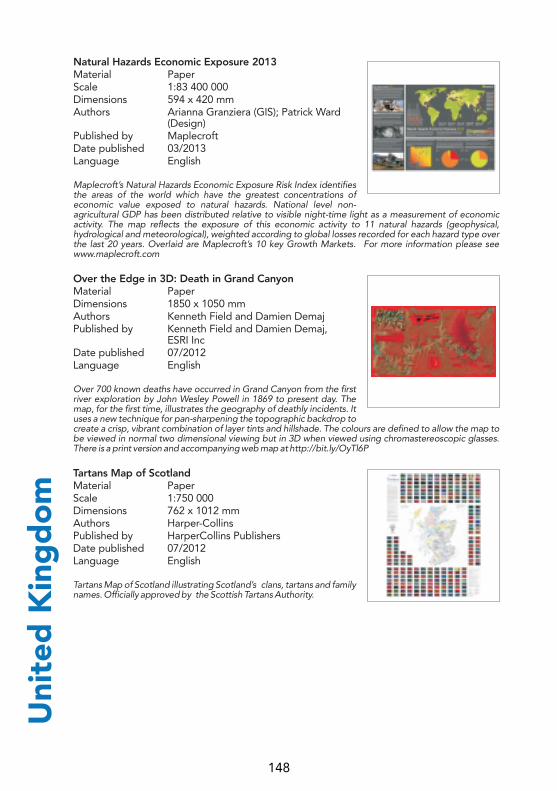
Natural Hazards Economic Exposure 2013Material PaperScale 1:83 400 000Dimensions 594 x 420 mmAuthors Arianna Granziera (GIS); Patrick Ward
(Design)Published by MaplecroftDate published 03/2013Language English
Maplecroft’s Natural Hazards Economic Exposure Risk Index identifies the areas of the world which have the greatest concentrations of economic value exposed to natural hazards. National level non-agricultural GDP has been distributed relative to visible night-time light as a measurement of economic activity. The map reflects the exposure of this economic activity to 11 natural hazards (geophysical, hydrological and meteorological), weighted according to global losses recorded for each hazard type over the last 20 years. Overlaid are Maplecroft’s 10 key Growth Markets. For more information please see www.maplecroft.com
Over the Edge in 3D: Death in Grand CanyonMaterial PaperDimensions 1850 x 1050 mmAuthors Kenneth Field and Damien DemajPublished by Kenneth Field and Damien Demaj,
ESRI IncDate published 07/2012Language English
Over 700 known deaths have occurred in Grand Canyon from the first river exploration by John Wesley Powell in 1869 to present day. The map, for the first time, illustrates the geography of deathly incidents. It uses a new technique for pan-sharpening the topographic backdrop to create a crisp, vibrant combination of layer tints and hillshade. The colours are defined to allow the map to be viewed in normal two dimensional viewing but in 3D when viewed using chromastereoscopic glasses. There is a print version and accompanying web map at http://bit.ly/OyTl6P
Tartans Map of ScotlandMaterial PaperScale 1:750 000Dimensions 762 x 1012 mmAuthors Harper-CollinsPublished by HarperCollins PublishersDate published 07/2012Language English
Tartans Map of Scotland illustrating Scotland’s clans, tartans and family names. Officially approved by the Scottish Tartans Authority.
Uni
ted
Kin
gd
om
148
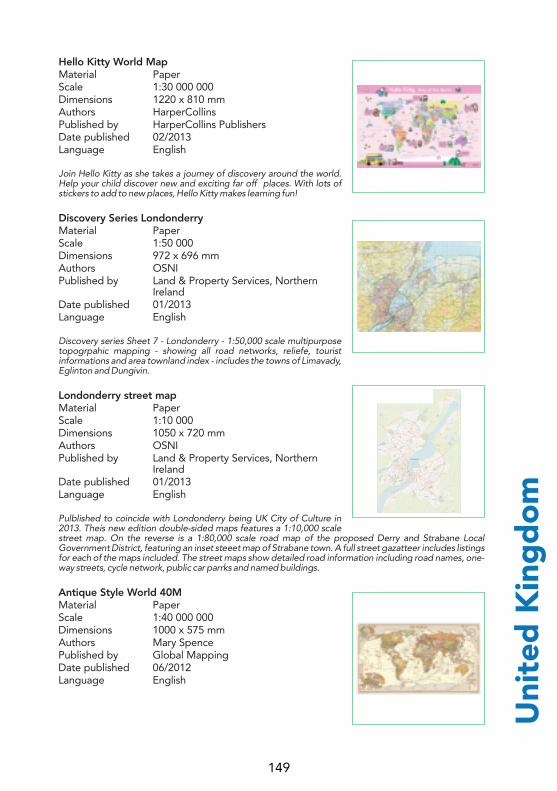
Uni
ted
Kin
gd
om
Hello Kitty World MapMaterial PaperScale 1:30 000 000Dimensions 1220 x 810 mmAuthors HarperCollinsPublished by HarperCollins PublishersDate published 02/2013Language English
Join Hello Kitty as she takes a journey of discovery around the world. Help your child discover new and exciting far off places. With lots of stickers to add to new places, Hello Kitty makes learning fun!
Discovery Series LondonderryMaterial PaperScale 1:50 000Dimensions 972 x 696 mmAuthors OSNIPublished by Land & Property Services, Northern
IrelandDate published 01/2013Language English
Discovery series Sheet 7 - Londonderry - 1:50,000 scale multipurpose topogrpahic mapping - showing all road networks, reliefe, tourist informations and area townland index - includes the towns of Limavady, Eglinton and Dungivin.
Londonderry street mapMaterial PaperScale 1:10 000Dimensions 1050 x 720 mmAuthors OSNIPublished by Land & Property Services, Northern
IrelandDate published 01/2013Language English
Pulblished to coincide with Londonderry being UK City of Culture in 2013. Theis new edition double-sided maps features a 1:10,000 scale street map. On the reverse is a 1:80,000 scale road map of the proposed Derry and Strabane Local Government District, featuring an inset steeet map of Strabane town. A full street gazatteer includes listings for each of the maps included. The street maps show detailed road information including road names, one-way streets, cycle network, public car parrks and named buildings.
Antique Style World 40MMaterial PaperScale 1:40 000 000Dimensions 1000 x 575 mmAuthors Mary SpencePublished by Global MappingDate published 06/2012Language English
149
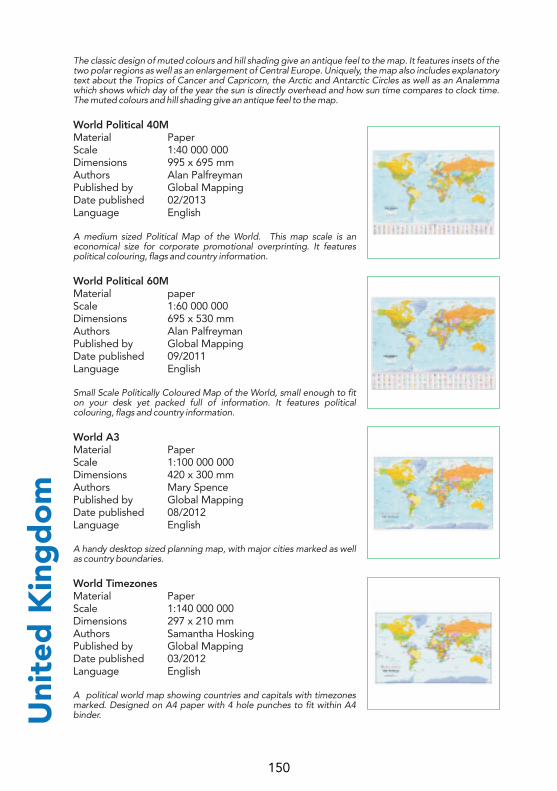
The classic design of muted colours and hill shading give an antique feel to the map. It features insets of the two polar regions as well as an enlargement of Central Europe. Uniquely, the map also includes explanatory text about the Tropics of Cancer and Capricorn, the Arctic and Antarctic Circles as well as an Analemma which shows which day of the year the sun is directly overhead and how sun time compares to clock time. The muted colours and hill shading give an antique feel to the map.
World Political 40MMaterial PaperScale 1:40 000 000Dimensions 995 x 695 mmAuthors Alan PalfreymanPublished by Global MappingDate published 02/2013Language English
A medium sized Political Map of the World. This map scale is an economical size for corporate promotional overprinting. It features political colouring, flags and country information.
World Political 60MMaterial paperScale 1:60 000 000Dimensions 695 x 530 mmAuthors Alan PalfreymanPublished by Global MappingDate published 09/2011Language English
Small Scale Politically Coloured Map of the World, small enough to fit on your desk yet packed full of information. It features political colouring, flags and country information.
World A3Material PaperScale 1:100 000 000Dimensions 420 x 300 mmAuthors Mary SpencePublished by Global MappingDate published 08/2012Language English
A handy desktop sized planning map, with major cities marked as well as country boundaries.
World TimezonesMaterial PaperScale 1:140 000 000Dimensions 297 x 210 mmAuthors Samantha HoskingPublished by Global MappingDate published 03/2012Language English
A political world map showing countries and capitals with timezones marked. Designed on A4 paper with 4 hole punches to fit within A4 binder.Uni
ted
Kin
gd
om
150
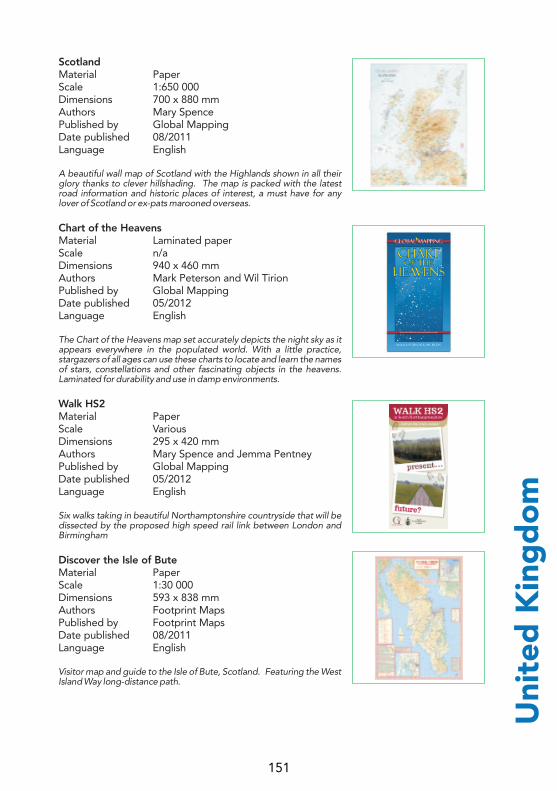
Uni
ted
Kin
gd
om
ScotlandMaterial PaperScale 1:650 000Dimensions 700 x 880 mmAuthors Mary SpencePublished by Global MappingDate published 08/2011Language English
A beautiful wall map of Scotland with the Highlands shown in all their glory thanks to clever hillshading. The map is packed with the latest road information and historic places of interest, a must have for any lover of Scotland or ex-pats marooned overseas.
Chart of the HeavensMaterial Laminated paperScale n/aDimensions 940 x 460 mmAuthors Mark Peterson and Wil TirionPublished by Global MappingDate published 05/2012Language English
The Chart of the Heavens map set accurately depicts the night sky as it appears everywhere in the populated world. With a little practice, stargazers of all ages can use these charts to locate and learn the names of stars, constellations and other fascinating objects in the heavens. Laminated for durability and use in damp environments.
Walk HS2Material PaperScale VariousDimensions 295 x 420 mmAuthors Mary Spence and Jemma PentneyPublished by Global MappingDate published 05/2012Language English
Six walks taking in beautiful Northamptonshire countryside that will be dissected by the proposed high speed rail link between London and Birmingham
Discover the Isle of ButeMaterial PaperScale 1:30 000Dimensions 593 x 838 mmAuthors Footprint MapsPublished by Footprint MapsDate published 08/2011Language English
Visitor map and guide to the Isle of Bute, Scotland. Featuring the West Island Way long-distance path.
151

Anglesey (Ynys Môn): a landscape carved by iceMaterial PaperScale VariousDimensions 1190 x 940 mmAuthors E R Phillips, C Ritchie, L M Oliver, J D
EverestPublished by British Geological SurveyDate published 10/2011Language English
‘Anglesey - a landscape carved by ice’ a series of three wall maps that explore the Quaternary glacial history of the island of Anglesey, North Wales (UK). They examines the distinctive ‘footprint’ left on Anglesey by the fast moving corridor of ice of the Irish Sea Ice Stream as it melted after the last ice age in the form of mapping, up to 1:50 000 scale, and a gallery of annotated photographs detailing these glacial landforms features left on the present day landscape. Available in either English or Welsh language versions. Digital version at: http://www.bgs.ac.uk/discoveringGeology/geologyOfBritain/anglesey/home.html
Nitty Gritty Guide BristolMaterial PaperScale Not to scaleDimensions 700 x 500 mmAuthors Nitty Gritty Guide BristolPublished by Nitty Gritty PublishingDate published 08/2011Language English
A quirky , thought provoking, impartial, bespoke fun guide bursting with information. Creative Cartography - a portrayal of a the City.
The Times Comprehensive Atlas of the WorldNumber of pages 544Dimensions 450 x 310 mmAuthors Collins BartholomewPublished by HarperCollins PublishersDate published 09/2011Language English
The world’s most prestigious and authoritative reference atlas representing the highest quality cartography and satellite images. Trusted by governments around the world.
The Times Atlas of LondonNumber of pages 304Dimensions 227 x 186 mmAuthors Collins BartholomewPublished by HarperCollins PublishersDate published 06/2012Language English
An authoritative and prestigious atlas of the whole of Greater London. Fully up-to-date reference maps, statistics, images and historical mapping give an exceptionally detailed view of London.
ATLASES
Uni
ted
Kin
gd
om
152

Uni
ted
Kin
gd
om
Walk and Cycle BrackleyNumber of pages 24Dimensions 150 x 211 mmAuthors Tracy Smith and Mary SpencePublished by Global MappingDate published 02/2012Language English
This walking guide was developed due to local people asking us about walking in the areas around Brackley, Northamptonshire. The guide has 12 walks of 30 minutes to 4 hours and routes to suit all abilities and a map of recommended cycle routes. There is a 'spot the nature' game all the way through it and certificates for this can be downloaded from our website.
Atlas by CollinsType OtherFormat AppSoftware iOSScale VariousAuthors Collins BartholomewPublished by HarperCollins PublishersDate published 10/2012Language English
https://itunes.apple.com/gb/app/atlas-by-collins/id560461884?mt=8 A world atlas mobile app designed for the newest iPhone and iPad that displays data about the world around us in stunning fashion. Containing a series of interactive themed globes broken down by subject areas, the app helps users put their world in context by providing insight and comparison on a global scale. Globe topics, such as environment, energy, population, communications and politics, are visualized by overlaying colour-coded layers of rich information on top of continents and countries.
Swindon Travel Choices - multi-modal journey planner > "BETA" versionType WebsiteFormat http://visuals.sdgworld.net/
temp/swindonjp/v4/Software All browsersScale VariousAuthors Clare Seldon, Steer Davies GleavePublished by Swindon Borough CouncilDate published 03/2013Language English
Swindon Travel Choices is funded through the Government’s Local Sustainable Transport Fund and aims to make it easier for those living or working in Swindon to get around without a car. These tiled maps have been published using OpenStreetMap and incorporate the CycleStreets API among others to feed into the multi-modal journey planner. The maps use OSM and are styled in a bespoke manner to match the printed maps to enforce the brand and ensure legibility to the users. beta version: http://visuals.sdgworld.net/temp/swindonjp/v4/
DIGITAL PRODUCTS
153

London TubeType ImageFormat TiffSoftware all browsersScale VariousAuthors Visual IT LimitedPublished by Visual IT LimitedDate published 03/2013Language English
This map shows the London Tube transportation system (including the Croydon trams and Thames river boat services) and is predominantly designed in a schematic format but also contains elements of a geographic depiction. The motivation for this projection is to provide a clear and simple view of the transportation systems along with a good connection and context to the real world. This work has taken inspiration from the existing iconic Harry Becks map but with a new innovative design which works well on a mobile digital device. We would also like to say thank you to Mark Ovenden for his transportation publications and advice with this map.
Assynt Culmination Geological 3D Mapping http://www.bgs.ac.uk/research/ukgeology/assyntCulmination.html?src=epType Web siteSoftware All browsersScale VariousAuthors G Leslie, C Ritchie, M Krabbendam, T
KearseyPublished by British Geological SurveyDate published 02/2013Language English
http://www.bgs.ac.uk/research/ukgeology/assyntCulmination.html?src=ep - The geology of Assynt, in North West Scotland, has often formed the 'yard-stick' against which aspiring geologists have tested their ability to see geological relationships in three dimensions. Over the last decade, the BGS has revised its geological mapping and constructed a series of cross-sections that show the geological structure below the surface. This product allows the user to visualise such structures in three dimensions providing a unique visualisation of the architecture of the classic Assynt Culmination of the Moine Thrust.
Anglesey (Ynys Môn): a landscape carved by ice http://www.bgs.ac.uk/discoveringGeology/geologyOfBritain/anglesey/home.htmlType Web siteSoftware All browsersScale VariousAuthors E R Phillips, C Ritchie, J D EverestPublished by British Geological SurveyDate published 10/2011Language English
http://www.bgs.ac.uk/discoveringGeology/geologyOfBritain/anglesey/home.html - ‘Anglesey - a landscape carved by ice’ is web-based interactive educational product describing the Quaternary glacial history of the island of Anglesey, North Wales (UK). Available on the BGS website it examines the distinctive ‘footprint’ left on Anglesey by the fast moving corridor of ice of the Irish Sea Ice Stream as it melted after the last ice age. This bilingual interactive map is built on Adobe Flash, based on GIS data, that allows the user to navigate, reconfigure and expand the content revealing additional information on the glacial landforms and distinct assemblage zones.
Uni
ted
Kin
gd
om
154
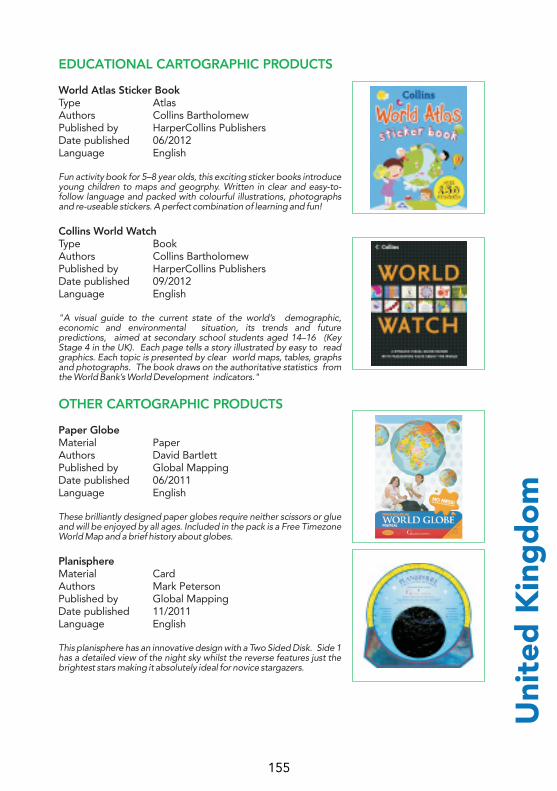
Uni
ted
Kin
gd
om
EDUCATIONAL CARTOGRAPHIC PRODUCTS
OTHER CARTOGRAPHIC PRODUCTS
World Atlas Sticker BookType AtlasAuthors Collins BartholomewPublished by HarperCollins PublishersDate published 06/2012Language English
Fun activity book for 5–8 year olds, this exciting sticker books introduce young children to maps and geogrphy. Written in clear and easy-to-follow language and packed with colourful illustrations, photographs and re-useable stickers. A perfect combination of learning and fun!
Collins World WatchType BookAuthors Collins BartholomewPublished by HarperCollins PublishersDate published 09/2012Language English
"A visual guide to the current state of the world’s demographic, economic and environmental situation, its trends and future predictions, aimed at secondary school students aged 14–16 (Key Stage 4 in the UK). Each page tells a story illustrated by easy to read graphics. Each topic is presented by clear world maps, tables, graphs and photographs. The book draws on the authoritative statistics from the World Bank’s World Development indicators."
Paper GlobeMaterial PaperAuthors David BartlettPublished by Global MappingDate published 06/2011Language English
These brilliantly designed paper globes require neither scissors or glue and will be enjoyed by all ages. Included in the pack is a Free Timezone World Map and a brief history about globes.
PlanisphereMaterial CardAuthors Mark PetersonPublished by Global MappingDate published 11/2011Language English
This planisphere has an innovative design with a Two Sided Disk. Side 1 has a detailed view of the night sky whilst the reverse features just the brightest stars making it absolutely ideal for novice stargazers.
155
Smellmap: GlasgowMaterial Paper and ScentsAuthors Kate McLeanPublished by Kate McLean DesignDate published 08/2011Language English
This is a participatory exhibition map of the smells of Glasgow.Glasgow's smells are of movement, of reinvention, of rebuilding, of regeneration. A city of renewal. Researched with contrbutions from author Michael Meighan (author of "Glasgow Smells" and "Glasgow Smells Better") as well as commuters, residents, workers, tourists, the Glasgow City council. Displayed and sniffed at the Glasgow Science Centre from September 2012. Map and artist featured on STV - broadcast on Aug 28, 2012 http://www.sensorymaps.com/maps_cities/glasgow_smell.html
Uni
ted
Kin
gd
om
156

Uni
ted
Kin
gd
om
O
rdna
nce
Surv
ey
MAPS
OS Travel Map - Tour: ScotlandMaterial PaperScale 1:500 000Dimensions 952 x 1270 mmAuthors Ordnance SurveyPublished by Ordnance SurveyDate published 2012Language English (with French & German)
Packed with information aimed at people going on holiday, these easy-to-read maps include roads, rail links and cycle routes along with essential tourist information and town plans. As well as helping to plan where to visit and how to get there, it can also guide users along coastal paths, national trails and long distance routes. Key information: • Simple and easy to follow • Covers whole tourist areas • Includes: place names index, enlarged town centre maps, enhanced tourist information, selected places of interest highlighted, scenic areas and hillshading and restricted junction information
OS VectorMap®Material Printed here on paper (available
electronically)Scale Local and DistrictDimensions 952 x 486 mmAuthors Ordnance SurveyPublished by Ordnance SurveyDate published 2013Language English
'Mapping – your way' OS VectorMap® is a family of products that helps its users visualise information on our maps. Its flexiblity enables you to customise the look and feel of your map, incorporating your own information, in your own way. Giving a geographic context to your data will help you make quicker decisions. Currently OS VectorMap is available at local and district scales. Smaller scales are expected to follow.
RIBA Awards for London 2012Material PaperScale 1:40 000Dimensions 1000 x 890 mmAuthors Ordnance SurveyPublished by Ordnance SurveyDate published 2012Language English
This customised map is specially designed to support the 2012 Royal Institute of British Architects Awards in London. Location data from Ordnance Survey is used to help architects and other built environment professionals to make better decisions with feasibility investigations, scenario modelling and presenting design plans. The RIBA Awards champion the best of British Architecture and are the most rigorously judged awards programme in the world. This map locates the winners of the RIBA Awards (both London and National) from within London and is the definitive guide to the Capital’s best new buildings in 2012.
157

Queen Elizabeth Olympic Park 2030Material PaperScale 1:4 000Dimensions 1000 x 890 mmAuthors Ordnance SurveyPublished by Ordnance SurveyDate published 2012Language English
This customised Ordnance Survey map of the future Queen Elizabeth Olympic Park, celebrates the work of the Olympic Delivery Authority and ongoing work of the London Legacy Development Corporation – recognising the outstanding achievements of civil engineers in creating a lasting legacy for the regeneration of east London. It is also a resource for students, and their teachers and parents, demonstrating how exciting and rewarding a career in civil engineering can be and providing information on routes into the profession. Find out more at: www.ice.org.uk/london www.londonlegacy.co.uk/about-us
OS Wall Map: EuropeMaterial PaperScale 1:5 789 574Dimensions 1230 x 910 mmAuthors Ordnance SurveyPublished by Ordnance SurveyDate published 2012Language English
OS Wall Maps cover Great Britain, the UK, Europe and the world. Each map is laminated, making it ideal for educational use. The current range includes United Kingdom Administration, British Isles Communication, British Isles Physical, Europe and two maps showing the world in different projections. Suggested uses: • Educational • Decorative • Holiday/break planning
OS Explorer Map - Custom Made: The Olympic Park and East LondonMaterial PaperScale 1:25 000Dimensions 1000 x 890 mmAuthors Ordnance SurveyPublished by Ordnance SurveyDate published 2013Language English
With Custom Made you can create a bespoke OS Explorer Map or OS Landranger Map in just a few minutes. Centre your map on the start of your favourite walk, your neighbourhood or perhaps even a treasured holiday destination: • customise the folded-map cover with your own image, alternatively you can choose from over 50 of our stock images. • centre your map anywhere in Great Britain. • choose between 1:25 000 or 1:50 000 scale. • create a flat or folded map. • write your own title and sub-title. • professionally printed on tough and durable map paper.
Uni
ted
Kin
gd
om
O
rdna
nce
Surv
ey
158
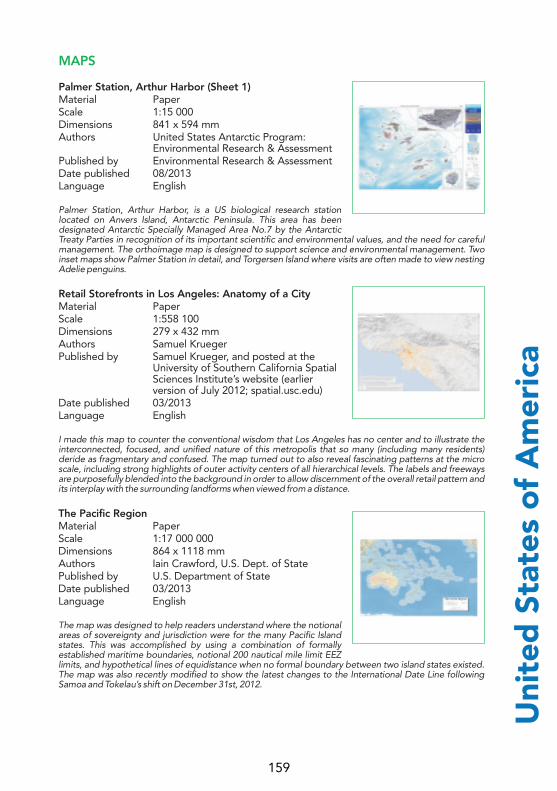
Uni
ted
Sta
tes
of
Am
eric
a
MAPS
Palmer Station, Arthur Harbor (Sheet 1)Material PaperScale 1:15 000Dimensions 841 x 594 mmAuthors United States Antarctic Program:
Environmental Research & AssessmentPublished by Environmental Research & AssessmentDate published 08/2013Language English
Palmer Station, Arthur Harbor, is a US biological research station located on Anvers Island, Antarctic Peninsula. This area has been designated Antarctic Specially Managed Area No.7 by the Antarctic Treaty Parties in recognition of its important scientific and environmental values, and the need for careful management. The orthoimage map is designed to support science and environmental management. Two inset maps show Palmer Station in detail, and Torgersen Island where visits are often made to view nesting Adelie penguins.
Retail Storefronts in Los Angeles: Anatomy of a CityMaterial PaperScale 1:558 100Dimensions 279 x 432 mmAuthors Samuel KruegerPublished by Samuel Krueger, and posted at the
University of Southern California Spatial Sciences Institute’s website (earlier version of July 2012; spatial.usc.edu)
Date published 03/2013Language English
I made this map to counter the conventional wisdom that Los Angeles has no center and to illustrate the interconnected, focused, and unified nature of this metropolis that so many (including many residents) deride as fragmentary and confused. The map turned out to also reveal fascinating patterns at the micro scale, including strong highlights of outer activity centers of all hierarchical levels. The labels and freeways are purposefully blended into the background in order to allow discernment of the overall retail pattern and its interplay with the surrounding landforms when viewed from a distance.
The Pacific RegionMaterial PaperScale 1:17 000 000Dimensions 864 x 1118 mmAuthors Iain Crawford, U.S. Dept. of StatePublished by U.S. Department of StateDate published 03/2013Language English
The map was designed to help readers understand where the notional areas of sovereignty and jurisdiction were for the many Pacific Island states. This was accomplished by using a combination of formally established maritime boundaries, notional 200 nautical mile limit EEZ limits, and hypothetical lines of equidistance when no formal boundary between two island states existed. The map was also recently modified to show the latest changes to the International Date Line following Samoa and Tokelau’s shift on December 31st, 2012.
159

Thematic Maps of PlacesMaterial PaperScale MultipleDimensions 1220 x 660 mmAuthors U.S. Census BureauPublished by U.S. Census BureauDate published 06/2012Language English
This dot map showing the distribution of incorporated places and census designated places represents a an active, ongoing, and collaborative program of legal and statistical place delineations for the decennial Census and other survey tabulations. Incorporated places are legally delineated under state law as a city, town, borough, or village. CDPs are the statistical counterpart of incorporated places and are delineated by state and local officials and the Census Bureau. With a majority of the American population living in places, data for places have a critical role in the operational programs of federal, state, county, and local governments for infrastructure and services (i.e. schools, hospitals, transportation, emergency)
Congressional Districts of the 113th Congress of the United StatesMaterial PaperScale 1:5 000 000Dimensions 1140 x 840 mmAuthors U.S. Census BureauPublished by U.S. Census BureauDate published 03/2013Language English
This national map of the Congressional Districts of the 113th Congress shows the boundaries of congressional districts based on results from the 2010 Census, as collected by the U.S. Census Bureau in Phase 4 of the Redistricting Data Program (RDP). These congressional district boundaries were processed and inserted into the MAF/TIGER database and the Census Bureau generated verification materials for each state to review and certify as accurate. Close collaboration with the RDP state liaison to ensure the accuracy and efficiency of this process has become increasingly more streamlined with the production of geographic equivalency files based on census blocks.
113th Congress of the United States: Ohio -- District 8: Speaker John A.BoehnerMaterial PaperScale 1:112 000Dimensions 760 x 1020 mmAuthors U.S. Census BureauPublished by U.S. Census BureauDate published 03/2013Language English
Ohio-Congressional District 8 (Speaker John A. Boehner). The large-scale Congressional District maps of the 113th Congress show boundaries of the 113th Congressional Districts as collected by the U.S. Census Bureau in Phase 4 of the Redistricting Data Program (RDP). TIGER/Line Shapefile products with these boundaries are available to the public by state and nation, the State Legislative Districts (2010 election cycle), and the supporting 2010 Census Geography on the website (www.census.gov/rdo) or via the FTP server. Census decennial statistics published in the 113th Congressional District Summary Files (2013), the Easy Stats data tool with American Community Survey (ACS) estimates, and Congressional District Relationship files for census tabulation geography are also available for additional analysis and mapping.Uni
ted
Sta
tes
of
Am
eric
a
160
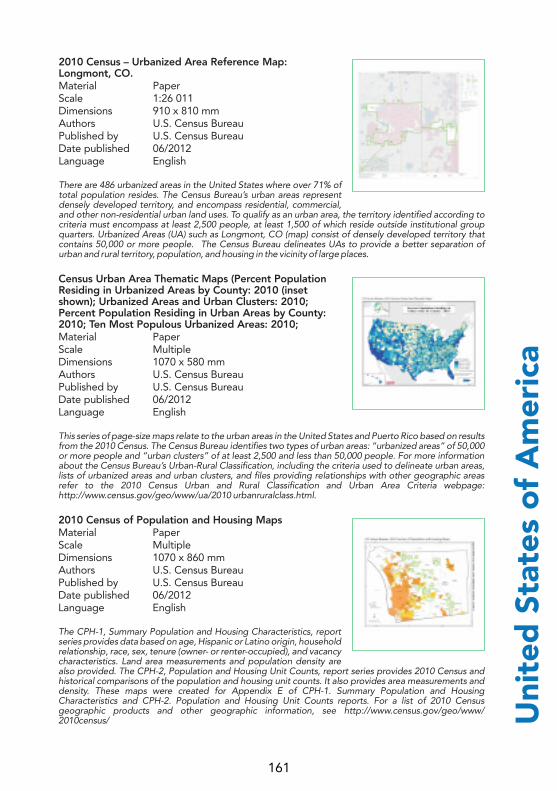
Uni
ted
Sta
tes
of
Am
eric
a
2010 Census – Urbanized Area Reference Map: Longmont, CO.Material PaperScale 1:26 011Dimensions 910 x 810 mmAuthors U.S. Census BureauPublished by U.S. Census BureauDate published 06/2012Language English
There are 486 urbanized areas in the United States where over 71% of total population resides. The Census Bureau’s urban areas represent densely developed territory, and encompass residential, commercial, and other non-residential urban land uses. To qualify as an urban area, the territory identified according to criteria must encompass at least 2,500 people, at least 1,500 of which reside outside institutional group quarters. Urbanized Areas (UA) such as Longmont, CO (map) consist of densely developed territory that contains 50,000 or more people. The Census Bureau delineates UAs to provide a better separation of urban and rural territory, population, and housing in the vicinity of large places.
Census Urban Area Thematic Maps (Percent Population Residing in Urbanized Areas by County: 2010 (inset shown); Urbanized Areas and Urban Clusters: 2010; Percent Population Residing in Urban Areas by County: 2010; Ten Most Populous Urbanized Areas: 2010;Material PaperScale MultipleDimensions 1070 x 580 mmAuthors U.S. Census BureauPublished by U.S. Census BureauDate published 06/2012Language English
This series of page-size maps relate to the urban areas in the United States and Puerto Rico based on results from the 2010 Census. The Census Bureau identifies two types of urban areas: “urbanized areas” of 50,000 or more people and “urban clusters” of at least 2,500 and less than 50,000 people. For more information about the Census Bureau’s Urban-Rural Classification, including the criteria used to delineate urban areas, lists of urbanized areas and urban clusters, and files providing relationships with other geographic areas refer to the 2010 Census Urban and Rural Classification and Urban Area Criteria webpage: http://www.census.gov/geo/www/ua/2010 urbanruralclass.html.
2010 Census of Population and Housing MapsMaterial PaperScale MultipleDimensions 1070 x 860 mmAuthors U.S. Census BureauPublished by U.S. Census BureauDate published 06/2012Language English
The CPH-1, Summary Population and Housing Characteristics, report series provides data based on age, Hispanic or Latino origin, household relationship, race, sex, tenure (owner- or renter-occupied), and vacancy characteristics. Land area measurements and population density are also provided. The CPH-2, Population and Housing Unit Counts, report series provides 2010 Census and historical comparisons of the population and housing unit counts. It also provides area measurements and density. These maps were created for Appendix E of CPH-1. Summary Population and Housing Characteristics and CPH-2. Population and Housing Unit Counts reports. For a list of 2010 Census geographic products and other geographic information, see http://www.census.gov/geo/www/ 2010census/
161

Household Characteristics MapsMaterial PaperScale MultipleDimensions 1140 x 890 mmAuthors U.S. Census BureauPublished by U.S. Census BureauDate published 12/2012Language English
Of the total population in 2010 (308.7 million people), 300.8 million (97%) lived in 116.7 million households for an average of 2.58 people per household. This was down from an average of 2.59 in 2000 when 273.6 million people lived in 105.5 million households. The remaining 8.0 million people in 2010 lived in group-quarters arrangements such as school dormitories, nursing homes, o r m i l i t a r y b a r r a c k s . T h e H o u s e h o l d s a n d F a m i l i e s : 2 0 1 0 r e p o r t a t http://www.census.gov/prod/3/98pubs/p20-509.pdf presents data on the on the number and types of living arrangements of American households in 2010 derived from the relationship question on the 2010 Census.
County Business Patterns: 2010Material PaperScale MultipleDimensions 1120 x 660 mmAuthors U.S. Census BureauPublished by U.S. Census BureauDate published 12/2012Language English
These maps from County Business Patterns: 2010 show data from Census Bureau and other federal agencies by county. These reports provide the only detailed annual information on the number of establishments, employees, and payroll for most of the 1,100 industries at the national, state, and county levels. Annual Statistics for United States (including Island Areas) Employer Businesses show declines in establishments and employees in 2010. This year’s report shows the overall decline in employment is slowing compared to 2009, the height of the recession. The constructions sector showed the largest percentage decline in establishments from 2009 to 2010. Source: http://www.census.gov/newsroom/releases/archives/county_business_patterns/cb12-115.html.
Capitol State ForestMaterial PaperScale 1:63 360Dimensions 712 x 610 mmAuthors Elizabeth Eberle, Mark Macleod, Don
HillerPublished by Washington State Department of
Natural ResourcesDate published 02/2013Language English
The Capitol State Forest map was produced by the Washington State Department of Natural Resources (DNR) as part of the agency’s State Forest Map series. These maps are used by the DNR as general planning tools and by the public, as recreation guides. Capitol State Forest is a 90,000+ acre working forest in southwest Washington. The Forest generates revenue for local county services, public school construction and universities, through timber harvests and commercial leases. The Forest also provides a variety of motorized and no-motorized recreational opportunities. This is the first map created and published by DNR using only ESRI’s ArcMap.
Uni
ted
Sta
tes
of
Am
eric
a
162
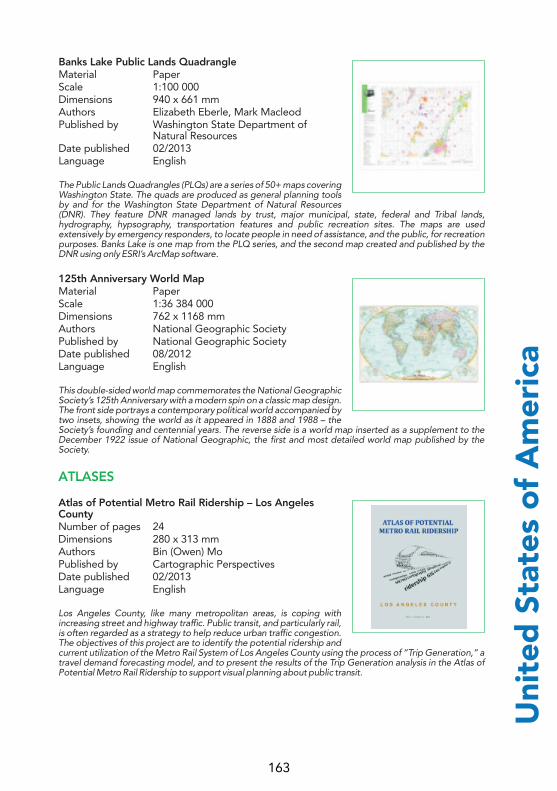
Uni
ted
Sta
tes
of
Am
eric
a
Banks Lake Public Lands QuadrangleMaterial PaperScale 1:100 000Dimensions 940 x 661 mmAuthors Elizabeth Eberle, Mark MacleodPublished by Washington State Department of
Natural ResourcesDate published 02/2013Language English
The Public Lands Quadrangles (PLQs) are a series of 50+ maps covering Washington State. The quads are produced as general planning tools by and for the Washington State Department of Natural Resources (DNR). They feature DNR managed lands by trust, major municipal, state, federal and Tribal lands, hydrography, hypsography, transportation features and public recreation sites. The maps are used extensively by emergency responders, to locate people in need of assistance, and the public, for recreation purposes. Banks Lake is one map from the PLQ series, and the second map created and published by the DNR using only ESRI’s ArcMap software.
125th Anniversary World MapMaterial PaperScale 1:36 384 000Dimensions 762 x 1168 mmAuthors National Geographic SocietyPublished by National Geographic SocietyDate published 08/2012Language English
This double-sided world map commemorates the National Geographic Society’s 125th Anniversary with a modern spin on a classic map design. The front side portrays a contemporary political world accompanied by two insets, showing the world as it appeared in 1888 and 1988 – the Society’s founding and centennial years. The reverse side is a world map inserted as a supplement to the December 1922 issue of National Geographic, the first and most detailed world map published by the Society.
Atlas of Potential Metro Rail Ridership – Los Angeles CountyNumber of pages 24Dimensions 280 x 313 mmAuthors Bin (Owen) MoPublished by Cartographic PerspectivesDate published 02/2013Language English
Los Angeles County, like many metropolitan areas, is coping with increasing street and highway traffic. Public transit, and particularly rail, is often regarded as a strategy to help reduce urban traffic congestion. The objectives of this project are to identify the potential ridership and current utilization of the Metro Rail System of Los Angeles County using the process of “Trip Generation,” a travel demand forecasting model, and to present the results of the Trip Generation analysis in the Atlas of Potential Metro Rail Ridership to support visual planning about public transit.
ATLASES
163

Atlas of YellowstoneNumber of pages 296Dimensions 343 x 249 mmAuthors W. Andrew Marcus, James E. Meacham,
Ann W. Rodman, and Alethea Y. Steingisser
Published by University of California PressDate published 04/2012Language English
The primary objective of the Atlas of Yellowstone was to create a compelling presentation portraying Yellowstone’s complex geography and wealth of research in a form that is accessible to a wide audience. The atlas contains over 800 maps/data graphics to create the first comprehensive atlas of a national park and its region for the first national park in the world. The Atlas is built around four central themes: variations in space and time; connections at local to global scales; the significance of human–nature interactions; and the importance of Yellowstone for research and education, and in inspiring conservation and preservation.
Compact Atlas of the WorldNumber of pages 256Dimensions 105 x 153 mmAuthors National Geographic SocietyPublished by National Geographic SocietyDate published 07/2012Language English
This first-of-its-kind mini atlas puts the entire world in the palm of your hand. Sized at 4 by 6 inches with a pliable soft cover, the National Geographic Compact Atlas of the World is designed to be thumbed through, easily referenced, and conveniently stored in a pocket, backpack, or desk. All maps are newly researched and updated and reflect the latest changes in the world—from geologic to geographic, political to population. Other enhancements include new internal navigation elements and extensive world and continental thematic coverage of climate, land cover, water availability, and natural hazards.
Seafloor Map of Hawai‘iType Image mapFormat JPEG, quality setting 10, 250 DPISoftware Adobe PhotoshopScale 1:897 000 when printed 853 mm wideAuthors Tom PattersonPublished by www.shadedrelief.com/hawaii/Date published 01/2012Language English with metric spot depths
The volcanic Hawaiian Islands are among Earth’s most prominent mountains when measured from their bases on the ocean floor. The summit of Mauna Kea on the island of Hawai‘i rises 10,000 meters, 1,100 meters taller than Mount Everest is above sea level. Yet with 60 percent of their total height hidden beneath the Pacific, most people do not realize the significance of Hawai‘i’s mountains. The Seafloor Map of Hawai‘i – designed as a “soft science” reference map for general audiences – attempts to correct this misperception.
DIGITAL PRODUCTS
Uni
ted
Sta
tes
of
Am
eric
a
164
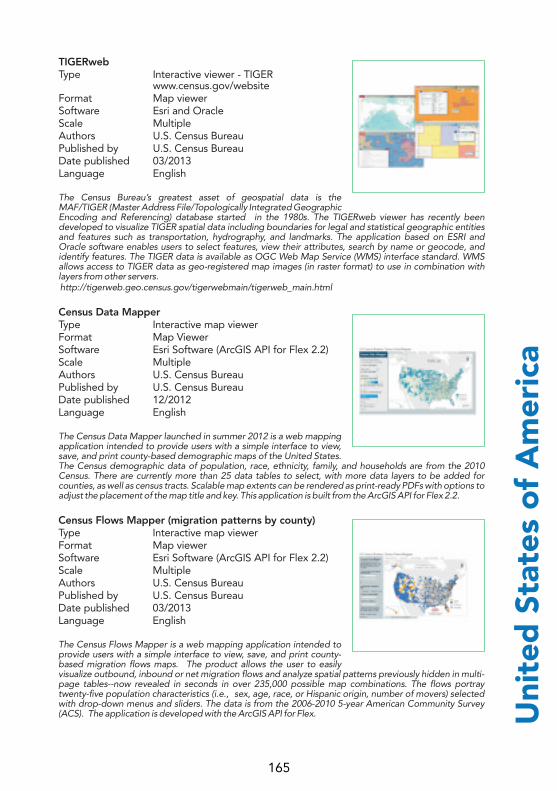
Uni
ted
Sta
tes
of
Am
eric
a
TIGERwebType Interactive viewer - TIGER
www.census.gov/websiteFormat Map viewerSoftware Esri and OracleScale MultipleAuthors U.S. Census BureauPublished by U.S. Census BureauDate published 03/2013Language English
The Census Bureau’s greatest asset of geospatial data is the MAF/TIGER (Master Address File/Topologically Integrated Geographic Encoding and Referencing) database started in the 1980s. The TIGERweb viewer has recently been developed to visualize TIGER spatial data including boundaries for legal and statistical geographic entities and features such as transportation, hydrography, and landmarks. The application based on ESRI and Oracle software enables users to select features, view their attributes, search by name or geocode, and identify features. The TIGER data is available as OGC Web Map Service (WMS) interface standard. WMS allows access to TIGER data as geo-registered map images (in raster format) to use in combination with layers from other servers. http://tigerweb.geo.census.gov/tigerwebmain/tigerweb_main.html
Census Data MapperType Interactive map viewerFormat Map ViewerSoftware Esri Software (ArcGIS API for Flex 2.2)Scale MultipleAuthors U.S. Census BureauPublished by U.S. Census BureauDate published 12/2012Language English
The Census Data Mapper launched in summer 2012 is a web mapping application intended to provide users with a simple interface to view, save, and print county-based demographic maps of the United States. The Census demographic data of population, race, ethnicity, family, and households are from the 2010 Census. There are currently more than 25 data tables to select, with more data layers to be added for counties, as well as census tracts. Scalable map extents can be rendered as print-ready PDFs with options to adjust the placement of the map title and key. This application is built from the ArcGIS API for Flex 2.2.
Census Flows Mapper (migration patterns by county)Type Interactive map viewerFormat Map viewerSoftware Esri Software (ArcGIS API for Flex 2.2)Scale MultipleAuthors U.S. Census BureauPublished by U.S. Census BureauDate published 03/2013Language English
The Census Flows Mapper is a web mapping application intended to provide users with a simple interface to view, save, and print county-based migration flows maps. The product allows the user to easily visualize outbound, inbound or net migration flows and analyze spatial patterns previously hidden in multi-page tables--now revealed in seconds in over 235,000 possible map combinations. The flows portray twenty-five population characteristics (i.e., sex, age, race, or Hispanic origin, number of movers) selected with drop-down menus and sliders. The data is from the 2006-2010 5-year American Community Survey (ACS). The application is developed with the ArcGIS API for Flex.
165
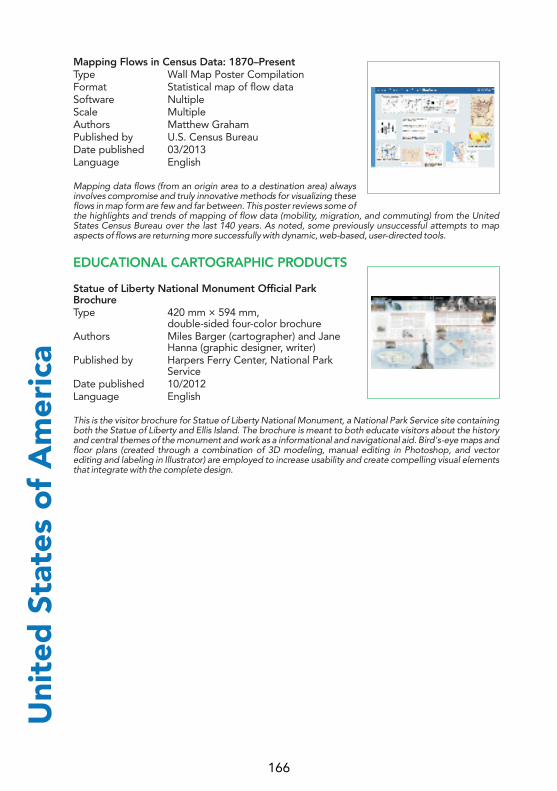
Mapping Flows in Census Data: 1870–PresentType Wall Map Poster CompilationFormat Statistical map of flow dataSoftware NultipleScale MultipleAuthors Matthew GrahamPublished by U.S. Census BureauDate published 03/2013Language English
Mapping data flows (from an origin area to a destination area) always involves compromise and truly innovative methods for visualizing these flows in map form are few and far between. This poster reviews some of the highlights and trends of mapping of flow data (mobility, migration, and commuting) from the United States Census Bureau over the last 140 years. As noted, some previously unsuccessful attempts to map aspects of flows are returning more successfully with dynamic, web-based, user-directed tools.
Statue of Liberty National Monument Official Park BrochureType 420 mm × 594 mm,
double-sided four-color brochureAuthors Miles Barger (cartographer) and Jane
Hanna (graphic designer, writer)Published by Harpers Ferry Center, National Park
ServiceDate published 10/2012Language English
This is the visitor brochure for Statue of Liberty National Monument, a National Park Service site containing both the Statue of Liberty and Ellis Island. The brochure is meant to both educate visitors about the history and central themes of the monument and work as a informational and navigational aid. Bird's-eye maps and floor plans (created through a combination of 3D modeling, manual editing in Photoshop, and vector editing and labeling in Illustrator) are employed to increase usability and create compelling visual elements that integrate with the complete design.
EDUCATIONAL CARTOGRAPHIC PRODUCTS
Uni
ted
Sta
tes
of
Am
eric
a
166
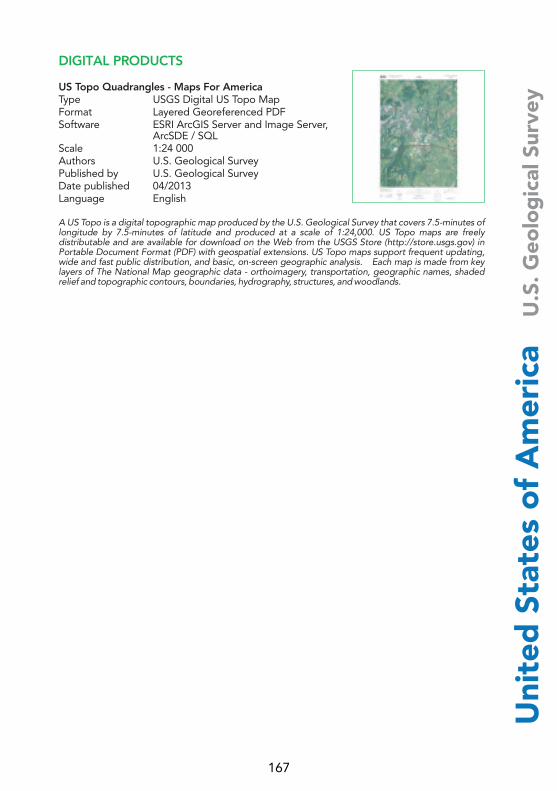
DIGITAL PRODUCTS
US Topo Quadrangles - Maps For AmericaType USGS Digital US Topo MapFormat Layered Georeferenced PDFSoftware ESRI ArcGIS Server and Image Server,
ArcSDE / SQLScale 1:24 000Authors U.S. Geological SurveyPublished by U.S. Geological SurveyDate published 04/2013Language English
A US Topo is a digital topographic map produced by the U.S. Geological Survey that covers 7.5-minutes of longitude by 7.5-minutes of latitude and produced at a scale of 1:24,000. US Topo maps are freely distributable and are available for download on the Web from the USGS Store (http://store.usgs.gov) in Portable Document Format (PDF) with geospatial extensions. US Topo maps support frequent updating, wide and fast public distribution, and basic, on-screen geographic analysis. Each map is made from key layers of The National Map geographic data - orthoimagery, transportation, geographic names, shaded relief and topographic contours, boundaries, hydrography, structures, and woodlands.
Uni
ted
Sta
tes
of
Am
eric
a U
.S. G
eolo
gic
al S
urve
y
167

MAPS
San Vicente BayMaterial PaperScale 1:10 000Dimensions 800 x 840 mmAuthors Hydrographic and Oceanographic
Service of the Chilean NavyPublished by Hydrographic and Oceanographic
Service of the Chilean NavyDate published 07/2012Language Spanish
SHOA chart No 6112 is the first produced using the information contained in the new hydrographic / oceanographic / cartographic database of the Service, with data collected after the earthquake and tsunami occurred in 2010. San Vicente Bay is located in the Biobío region, 500 kilometers to the south of Santiago.
IHO
C
hile
168

IHO
Fi
naln
d
MAPS
Examples of a paper chart and ENC on same area.Material PaperDimensions 700 x 1000 mmAuthors Finnish Transport Agency/Hydrographic
OfficePublished by Finnish Transport Agency/Hydrographic
OfficeLanguage English
Examples of two different products where chart features are presented with different symbology on the same area.
INT 1193 KumlingeMaterial PaperScale 1:50 000Dimensions 1000 x 700 mmAuthors Finnish Transport Agency/Hydrographic
OfficePublished by Finnish Transport Agency/Hydrographic
OfficeDate published 09/2012Language Finnish/Swedish/English
International Nautical Chart No INT 1193 (National Chart 30), Baltic Sea - Archipelago Sea - Kumlinge (1:50.000) and part of the national Harbour Chart No 109 Baltic Sea - Archipelago Sea - Kumlinge, Lappo, Jurmo, Vuosnainen & Lypyrtti (1:20.000)
169
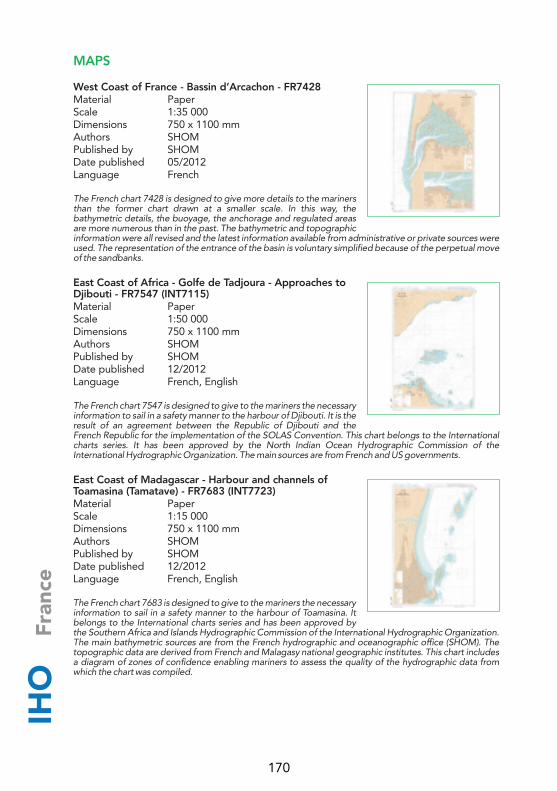
IHO
Fr
ance
MAPS
West Coast of France - Bassin d’Arcachon - FR7428Material PaperScale 1:35 000Dimensions 750 x 1100 mmAuthors SHOMPublished by SHOMDate published 05/2012Language French
The French chart 7428 is designed to give more details to the mariners than the former chart drawn at a smaller scale. In this way, the bathymetric details, the buoyage, the anchorage and regulated areas are more numerous than in the past. The bathymetric and topographic information were all revised and the latest information available from administrative or private sources were used. The representation of the entrance of the basin is voluntary simplified because of the perpetual move of the sandbanks.
East Coast of Africa - Golfe de Tadjoura - Approaches to Djibouti - FR7547 (INT7115)Material PaperScale 1:50 000Dimensions 750 x 1100 mmAuthors SHOMPublished by SHOMDate published 12/2012Language French, English
The French chart 7547 is designed to give to the mariners the necessary information to sail in a safety manner to the harbour of Djibouti. It is the result of an agreement between the Republic of Djibouti and the French Republic for the implementation of the SOLAS Convention. This chart belongs to the International charts series. It has been approved by the North Indian Ocean Hydrographic Commission of the International Hydrographic Organization. The main sources are from French and US governments.
East Coast of Madagascar - Harbour and channels of Toamasina (Tamatave) - FR7683 (INT7723)Material PaperScale 1:15 000Dimensions 750 x 1100 mmAuthors SHOMPublished by SHOMDate published 12/2012Language French, English
The French chart 7683 is designed to give to the mariners the necessary information to sail in a safety manner to the harbour of Toamasina. It belongs to the International charts series and has been approved by the Southern Africa and Islands Hydrographic Commission of the International Hydrographic Organization. The main bathymetric sources are from the French hydrographic and oceanographic office (SHOM). The topographic data are derived from French and Malagasy national geographic institutes. This chart includes a diagram of zones of confidence enabling mariners to assess the quality of the hydrographic data from which the chart was compiled.
170

IHO
Fr
ance
DIGITAL PRODUCTS
West Coast of New Caledonia - Passe de Poya to Passe de MuéoType Vector mapFormat S-57Software ECDIS, ECSScale 1:25 000Authors SHOMPublished by SHOMDate published 12/2011Language French, English
This Electronic Navigational Chart (ENC) covers the access to Port de Muéo. It was published by the French hydrographic and oceanographic office (SHOM) to answer the new carriage requirements set by International Maritime Organization. Since the 1st July of 2012, the carriage of an Electronic Chart Display and Information System on board is compulsory for new tankers exceeding 3000 gross tonnage. The use of ENCs, particularly in narrow passages, as the access to Muéo, enhances navigation safety. Moreover, the bathymetry of navigable waters is well-known, in particular in the channel where modern and recent surveys have been achieved.
171
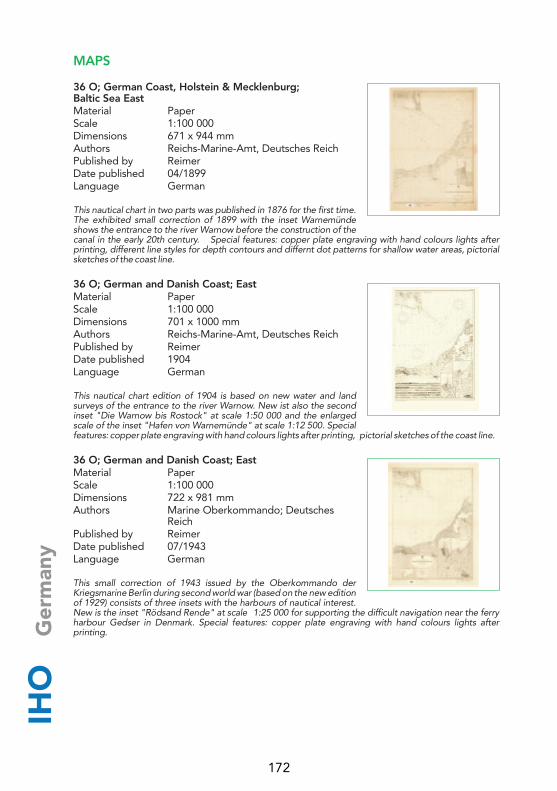
IHO
G
erm
any
MAPS
36 O; German Coast, Holstein & Mecklenburg; Baltic Sea EastMaterial PaperScale 1:100 000Dimensions 671 x 944 mmAuthors Reichs-Marine-Amt, Deutsches ReichPublished by ReimerDate published 04/1899Language German
This nautical chart in two parts was published in 1876 for the first time. The exhibited small correction of 1899 with the inset Warnemünde shows the entrance to the river Warnow before the construction of the canal in the early 20th century. Special features: copper plate engraving with hand colours lights after printing, different line styles for depth contours and differnt dot patterns for shallow water areas, pictorial sketches of the coast line.
36 O; German and Danish Coast; EastMaterial PaperScale 1:100 000Dimensions 701 x 1000 mmAuthors Reichs-Marine-Amt, Deutsches ReichPublished by ReimerDate published 1904Language German
This nautical chart edition of 1904 is based on new water and land surveys of the entrance to the river Warnow. New ist also the second inset "Die Warnow bis Rostock" at scale 1:50 000 and the enlarged scale of the inset "Hafen von Warnemünde" at scale 1:12 500. Special features: copper plate engraving with hand colours lights after printing, pictorial sketches of the coast line.
36 O; German and Danish Coast; EastMaterial PaperScale 1:100 000Dimensions 722 x 981 mmAuthors Marine Oberkommando; Deutsches
ReichPublished by ReimerDate published 07/1943Language German
This small correction of 1943 issued by the Oberkommando der Kriegsmarine Berlin during second world war (based on the new edition of 1929) consists of three insets with the harbours of nautical interest. New is the inset "Rödsand Rende" at scale 1:25 000 for supporting the difficult navigation near the ferry harbour Gedser in Denmark. Special features: copper plate engraving with hand colours lights after printing.
172

IHO
G
erm
any
3016; Fairway Warnemünde-Rostock; Baltic SeaMaterial PaperScale 1:15 000Dimensions 835 x 1085 mmAuthors Seehydrographischer Dienst der DDRPublished by Seehydrographischer Dienst der DDRDate published 05/1960Language German
The nautical chart 3016 is one of the first issued by Seehydrographischer Dienst der DDR (first edition 1955). The second development of the sea canal to the oversea port Rostock is included in this large scale chart. Special features: multicoloured chart (black, land and sea areas, lights), drawn by hand and printed
1631; Port of Rostock; Baltic SeaMaterial PaperScale 1:20 000Dimensions 781 x 1033 mmAuthors Seehydrographischer Dienst der DDRPublished by Seehydrographischer Dienst der DDRDate published 11/1987Language German
First issued 1966 as chart number 1630 with the new title "Hafen Rostock" and scale 1:20 000, in 1979 the inset "Warnemünde und Überseehafen" in 1:10 000 was included to show the expanded oversea port. The new edition of 1979 was published to introduce the new IALA bouyage system. Special features: multicoloured chart (black, land and sea areas, contour lines, red, green and yellow lights), offset printing
1672 (INT 1355); Port of Rostock; Baltic SeaMaterial PaperScale 1:12 500Dimensions 824 x 1173 mmAuthors Bundesamt für Seeschifffahrt und
HydrographiePublished by Bundesamt für Seeschifffahrt und
HydrographieDate published 04/2013Language German, English
The first edition was produced in 1990 by Seehydrographischer Dienst der DDR in WGS 72, with the unification in October 1990 the chart was adopted and issued by Bundesamt für Seeschifffahrt und Hydrographie. In 1998 the chart was transformed to the position reference system WGS 84. The development of the fairway Rostock sea canal to 120 m width and 14,5 m depth was shown in the edition 1999 firstly. In the newest edition 2013 the inset "Warnemünde" 1:5 000 was extended to show the passenger quay and the turning basin for cruise vessels.
173

IHO
G
erm
any
2911 (INT 1200); Mariners´ Routeing Guide Baltic SeaMaterial PaperScale 1:1 750 000Dimensions 1179 x 859 mmAuthors Bundesamt für Seeschifffahrt und
HydrographiePublished by Bundesamt für Seeschifffahrt und
HydrographieDate published 10/2012Language English, German
The chart 2911 was issued by Bundesamt für Seeschifffahrt und Hydrographie in 2006 firstly. The guide has been developed by the Baltic States in the HELCOM Expert Working Group on Routeing and provides details on routeing systems as well as information on route planning, Maritime Safety Information Services, ships´ reporting systems, Vessel Traffic Services, environmental protection, natural conditions and pilotage.
Jade and Weser Approach (DE421030)Type Vector mapFormat S-57Software ECDISScale 1:22 000Authors BSHPublished by BSHDate published 05/2013Language German, English
This Electronic Navigational Chart (ENC) shows the approaches to the rivers Jade and Weser. The ENC is produced from a hydrographic data base (HPD) with newly captured and evaluated data in order to give the user the best digital information of this area.
Cuxhaven (DE521420)Type Vector mapFormat S-57Software ECDISScale 1:8 000Authors BSHPublished by BSHDate published 02/2013Language German, English
This Electronic Navigational Chart (ENC) shows the harbour of Cuxhaven. The ENC is produced from a hydrographic data base (HPD) with newly captured and evaluated data in order to give the user the best digital information of this area.
Waters east of Ruegen (DE316004)Type Vector mapFormat S-57Software ECDISScale 1:90 000Authors BSHPublished by BSHDate published 06/2012Language German, English
This Electronic Navigational Chart (ENC) covers the waters east of Ruegen.
DIGITAL PRODUCTS
174

IHO
M
exic
o
MAPS
SM-840 Bahía de CampecheMaterial PaperScale 1:250 000Date published 03/2007
175

IHO
R
om
ania
MAPS
DIGITAL PRODUCTS
International Chart INT3820 From Cape Kaliakra to Delta DanubeMaterial PaperScale 1:300 000Dimensions 480 x 950 mmAuthors Maritime Hydrographic DirectoratePublished by Maritime Hydrographic Directorate will publish the chart until to the
end of 2013Date published 2013Language English
The International chart INT3820 is new edition and the first time when it is issue on WGS84 datum.
International Chart INT3905 The Constantza Harbour and approachesMaterial PaperScale 1:30 000Dimensions 480 x 950 mmAuthors Maritime Hydrographic DirectoratePublished by Maritime Hydrographic Directorate will publish the chart until to the
end of 2013Date published 2013Language English
The international chart INT3905 is new chart and the first Romanian chart issue at scale 1:30 000.
RO405002 Black Sea. Coast of Romania. From Tuzla Cape to Midia CapeType Vector mapFormat S-57 format (.000)Software Caris S - 57 Composer, version 2.3Scale 1:50 000/1:45 000Authors Maritime Hydrographic DirectoratePublished by Maritime Hydrographic DirectorateDate published 12/2012Language English
The electronic navigational chart RO405002 is the first Romanian ENC had sent to The International Centre for ENCs (IC-ENC) Taunton for validation.
RO403002 The Constantza Harbour and approachesType Vector mapFormat S-57 format (.000)Software Caris S - 57 Composer, version 2.3Scale 1:30 000/1:22 000Authors Maritime Hydrographic DirectoratePublished by Maritime Hydrographic DirectorateDate published 12/2012Language English
RO403002 is new cell equivalent to International Chart INT3905 The Constantza Harbour and approaches paper chart in extent.
176

IHO
Sp
ain
MAPS
ATLASES
Livingston Island. Byers Peninsula (Byers Camp)Material PaperScale 1:10 000Dimensions 1096 x 930 mmAuthors Instituto Hidrográfico de la MarinaPublished by Instituto Hidrográfico de la MarinaDate published 03/2013Language Spanish
Nautical chart showing approaches to the Spanish Scientific Camp Byers, located in Livingston Island, South Shetland Islands, Antarctica.Leisure chart in booklet format made up of water resistant paper, containing information of an area off the coast of Galicia, Spain, plus a set of harbour charts and an extract of Sailing Directions for that area.
Chart of the Meridian Measured in the Kingdom of Quito by Order of the King Our Lord for the Determination of the terrestrial Degrees and Shape of the Earth.Material Paper (engraved on paper)Scale Graphics of 10 LeaguesDimensions 990 x 230 mmAuthors Jorge Juan and Antonio de UlloaDate published 1748Language Spanish
This piece belongs to the work "Historical Description of the voyage to Meridional America", part one, volume two. This mal represents the geodetic triangulations performed by Jorge Juan and Antonio de Ulloa, who triangulated a meridian arc of more than three degrees, with an extension of 382 kilometers covered by a chain of thirty triangles. The ground marks of the geodetic survey are also shown.
From O Grove Peninsula to Silleiro CapeNumber of pages 15Dimensions 427 x 317 mmAuthors Instituto Hidrográfico de la MarinaPublished by Instituto Hidrográfico de la MarinaDate published 12/2013Language Spanish
Other cartographic products
Mr. Jorge Juan...Material Paper (engraved on paper)Authors J. Maea (Draughtsman) and Vazquez
(Engraver)Date published mid 19th centuryLanguage Spanish
... illustrious sailor, profound mathematician whose works granted him the renown of "Spanish Wise Man" and will be eternal monuments of his memory.
177
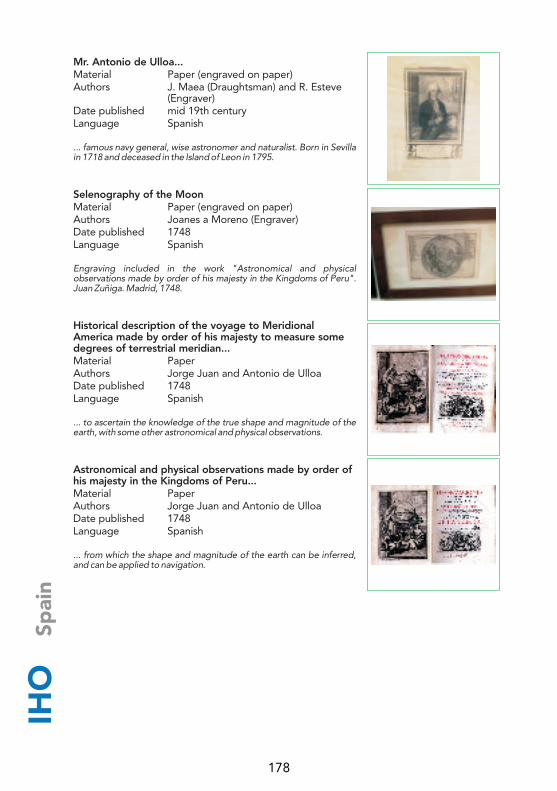
IHO
Sp
ain
Mr. Antonio de Ulloa...Material Paper (engraved on paper)Authors J. Maea (Draughtsman) and R. Esteve
(Engraver)Date published mid 19th centuryLanguage Spanish
... famous navy general, wise astronomer and naturalist. Born in Sevilla in 1718 and deceased in the Island of Leon in 1795.
Selenography of the MoonMaterial Paper (engraved on paper)Authors Joanes a Moreno (Engraver)Date published 1748Language Spanish
Engraving included in the work "Astronomical and physical observations made by order of his majesty in the Kingdoms of Peru". Juan Zuñiga. Madrid, 1748.
Historical description of the voyage to Meridional America made by order of his majesty to measure some degrees of terrestrial meridian...Material PaperAuthors Jorge Juan and Antonio de UlloaDate published 1748Language Spanish
... to ascertain the knowledge of the true shape and magnitude of the earth, with some other astronomical and physical observations.
Astronomical and physical observations made by order of his majesty in the Kingdoms of Peru...Material PaperAuthors Jorge Juan and Antonio de UlloaDate published 1748Language Spanish
... from which the shape and magnitude of the earth can be inferred, and can be applied to navigation.
178
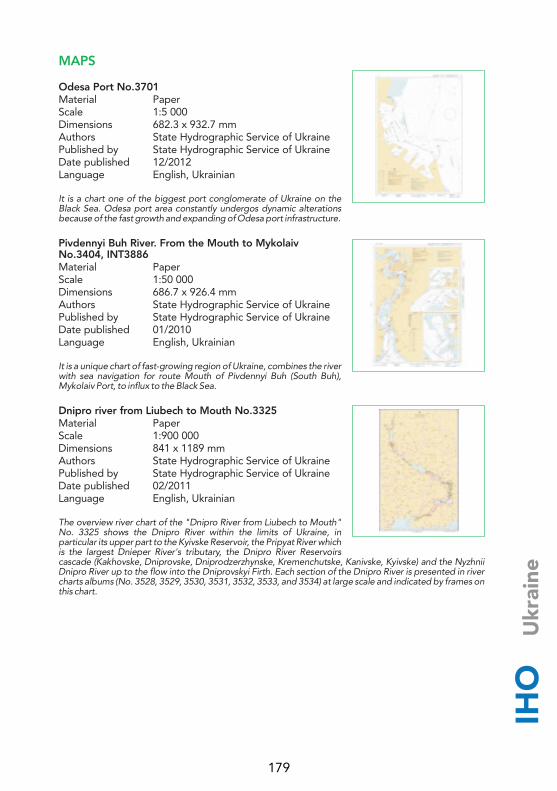
IHO
U
krai
ne
MAPS
Odesa Port No.3701Material PaperScale 1:5 000Dimensions 682.3 x 932.7 mmAuthors State Hydrographic Service of UkrainePublished by State Hydrographic Service of UkraineDate published 12/2012Language English, Ukrainian
It is a chart one of the biggest port conglomerate of Ukraine on the Black Sea. Odesa port area constantly undergos dynamic alterations because of the fast growth and expanding of Odesa port infrastructure.
Pivdennyi Buh River. From the Mouth to Mykolaiv No.3404, INT3886Material PaperScale 1:50 000Dimensions 686.7 x 926.4 mmAuthors State Hydrographic Service of UkrainePublished by State Hydrographic Service of UkraineDate published 01/2010Language English, Ukrainian
It is a unique chart of fast-growing region of Ukraine, combines the river with sea navigation for route Mouth of Pivdennyi Buh (South Buh), Mykolaiv Port, to influx to the Black Sea.
Dnipro river from Liubech to Mouth No.3325Material PaperScale 1:900 000Dimensions 841 x 1189 mmAuthors State Hydrographic Service of UkrainePublished by State Hydrographic Service of UkraineDate published 02/2011Language English, Ukrainian
The overview river chart of the "Dnipro River from Liubech to Mouth" No. 3325 shows the Dnipro River within the limits of Ukraine, in particular its upper part to the Kyivske Reservoir, the Pripyat River which is the largest Dnieper River's tributary, the Dnipro River Reservoirs cascade (Kakhovske, Dniprovske, Dniprodzerzhynske, Kremenchutske, Kanivske, Kyivske) and the Nyzhnii Dnipro River up to the flow into the Dniprovskyi Firth. Each section of the Dnipro River is presented in river charts albums (No. 3528, 3529, 3530, 3531, 3532, 3533, and 3534) at large scale and indicated by frames on this chart.
179

IHO
U
krai
neATLASES
Oceanographic Atlas of the Black Sea and the Sea of Azov No.601Number of pages 356Dimensions 460 x 350 mmAuthors State Hydrographic Service of UkrainePublished by State Hydrographic Service of UkraineDate published 2009Language English, Ukrainian
The "Oceanographic Atlas" contains complex scientific information on the state of the environment and the main peculiarities of the Black and Azov Seas. Its charts portray in the smallest details the oceanologic, climatic, hydrographic and other characteristics of these seas. This Atlas is the first Ukrainian comprehensive charting edition and the important milestone of the decades-long creative cooperation of Ukrainian oceanologists, hydrographers and cartographers.
Navigation on the Nyzhnii Dnipro RiverNumber of pages 21Dimensions 210 x 297 mmAuthors State Hydrographic Service of UkrainePublished by State Hydrographic Service of UkraineDate published 04/2013Language English, Ukrainian
This publication is the first edition which includes cartographic and textual information about Kanivske Reservoir. It gives general overview on navigation conditions within this section of the Dnipro River and cannot be used as official guidance for navigation. Overview includes the pilot providing physical and geographical, climatic and hydrological characteristics of the Kanivske Reservoir, describing navigational and hydrographic sailing conditions. It also contains 13 chart sheets at a scale of 1:50 000 in WGS-84 including inserts of larger scales, scheme of yacht-clubs and fuel stations location, chart symbols and signal beacons regulating navigation on inner waterways, navigation rules on Kanivske Reservoir, pictures of aids to navigation and river sceneries.
Navigational River Chart of the Danube River from Reni Port to the Mouth No.3504Dimensions 450 x 380 mmAuthors State Hydrographic Service of UkrainePublished by State Hydrographic Service of UkraineDate published 03/2011Language English, Ukrainian
Scale: 1:25 000; The Album consists of easy-to-use charts of the Ukrainian part of the Danube River beginning from the Prut River Mouth to the flowing into the Black Sea compiled on the basis of traditional nautical navigational charts in order to be used on small-sized vessels and yachts. Appropriate number and quality of nautical charts required to ensure marine practice and safety of navigation. For usage and keeping on small-sized vessels, yachts, launches (size, compactness, level, etc.). Updated correction maintenance (available through web-site and information channels).
180
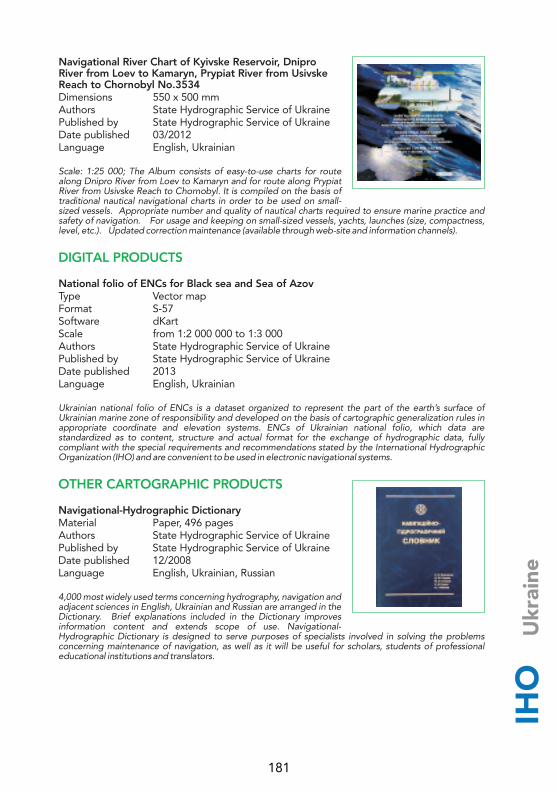
IHO
U
krai
ne
Navigational River Chart of Kyivske Reservoir, Dnipro River from Loev to Kamaryn, Prypiat River from Usivske Reach to Chornobyl No.3534Dimensions 550 x 500 mmAuthors State Hydrographic Service of UkrainePublished by State Hydrographic Service of UkraineDate published 03/2012Language English, Ukrainian
Scale: 1:25 000; The Album consists of easy-to-use charts for route along Dnipro River from Loev to Kamaryn and for route along Prypiat River from Usivske Reach to Chornobyl. It is compiled on the basis of traditional nautical navigational charts in order to be used on small-sized vessels. Appropriate number and quality of nautical charts required to ensure marine practice and safety of navigation. For usage and keeping on small-sized vessels, yachts, launches (size, compactness, level, etc.). Updated correction maintenance (available through web-site and information channels).
National folio of ENCs for Black sea and Sea of AzovType Vector mapFormat S-57Software dKartScale from 1:2 000 000 to 1:3 000Authors State Hydrographic Service of UkrainePublished by State Hydrographic Service of UkraineDate published 2013Language English, Ukrainian
Ukrainian national folio of ENCs is a dataset organized to represent the part of the earth’s surface of Ukrainian marine zone of responsibility and developed on the basis of cartographic generalization rules in appropriate coordinate and elevation systems. ENCs of Ukrainian national folio, which data are standardized as to content, structure and actual format for the exchange of hydrographic data, fully compliant with the special requirements and recommendations stated by the International Hydrographic Organization (IHO) and are convenient to be used in electronic navigational systems.
Navigational-Hydrographic DictionaryMaterial Paper, 496 pagesAuthors State Hydrographic Service of UkrainePublished by State Hydrographic Service of UkraineDate published 12/2008Language English, Ukrainian, Russian
4,000 most widely used terms concerning hydrography, navigation and adjacent sciences in English, Ukrainian and Russian are arranged in the Dictionary. Brief explanations included in the Dictionary improves information content and extends scope of use. Navigational-Hydrographic Dictionary is designed to serve purposes of specialists involved in solving the problems concerning maintenance of navigation, as well as it will be useful for scholars, students of professional educational institutions and translators.
DIGITAL PRODUCTS
OTHER CARTOGRAPHIC PRODUCTS
181
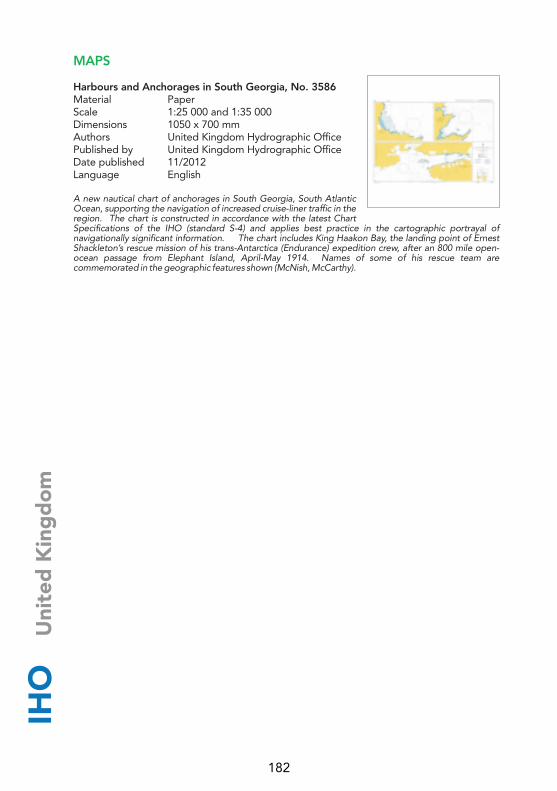
IHO
U
nite
d K
ing
do
mMAPS
Harbours and Anchorages in South Georgia, No. 3586Material PaperScale 1:25 000 and 1:35 000Dimensions 1050 x 700 mmAuthors United Kingdom Hydrographic OfficePublished by United Kingdom Hydrographic OfficeDate published 11/2012Language English
A new nautical chart of anchorages in South Georgia, South Atlantic Ocean, supporting the navigation of increased cruise-liner traffic in the region. The chart is constructed in accordance with the latest Chart Specifications of the IHO (standard S-4) and applies best practice in the cartographic portrayal of navigationally significant information. The chart includes King Haakon Bay, the landing point of Ernest Shackleton’s rescue mission of his trans-Antarctica (Endurance) expedition crew, after an 800 mile open-ocean passage from Elephant Island, April-May 1914. Names of some of his rescue team are commemorated in the geographic features shown (McNish, McCarthy).
182

Copyright © 2022 FDOKUMEN