15й International Cosmic Ray Conference
555
15 й International Cosmic Ray Conference CONFERENCE PAPERS VOLUME 8 EA SESSION PLOVDIV, BULGARIA AUGUST13-2B.1977
-
Upload
khangminh22 -
Category
Documents
-
view
1 -
download
0
Transcript of 15й International Cosmic Ray Conference

15й International Cosmic Ray Conference
CONFERENCE PAPERS VOLUME 8
EA SESSION
PLOVDIV, BULGARIA AUGUST13-2B.1977

15th International Cosmic Ray inference
C O N F E R E N C E P A P E R S
V O L U M E В
EA SESSION
BULGARIAN A C A D E M Y OF SCIENCES
PLOVDIV, BULGARIA A U G U S T 13 - 2 6 , 1 Э 7 7

V
T A B L E O F C O N T E N T S
VOLUME - 8
EXTENSIVE AIR SHOWERS - EA
EA-1 Air Shower Core Location Procedures F.Ashton, J . F a t e m i , H.Nejebat, A .Nasr i , E.Shaat, A.C.Smith , T .R.Stewar t , M..G.Thompson, M.W.Treasure and I. A. Ward (Abstract)
EA-2 The l a t e r a l Distribution of Electrons In EAS at Sea Level F.Ashton, J .Fa t emi , H.Nejebat, A .Nas r i , E.Shaat, A.C.Smith , T.H.Stewart , M.G.Thompson, M.W.Treasure and I .A.Ward (Abstract)
EA-3 Electron Density Sampling Fluctuations in Extensive Air Shower s F.Ashton, J . F a t e m i , H.Najebat, A .Nas r i , E.Shaat, A.C.Smith , T .R.S tewar t , M.G.Thompson, M.W. Treasure and LA.Ward (Abstract)
5 EA-4 The Absolute Vertical Intensity of EAS of Electron Size 10
Par t ic les at Sea Level F.Ashton, J . F a t e m i , H.Nejebat, A .Nas r i , E.Shaat, A.C.Smith , T .R.Stewar t , M.G.Thompson, M.W. Treasu re and LA.Ward (Abstract)
EA-5 Study of Charged and Neutral Hadrons in Extensive Air Showers at Sea Level F.Ashton, D.A.Cooper, A .Nas r i , A. Parvarer;h and A.J .Sa leh (Abstract)
EA-6 The Transverse Momentum of Leading Par t ic les in EAS with Respect to the Shower Axis F.Ashton, A.Nasr i and I .A.Ward
4 6 EA-7 Observationson Air Showers In the Range 10 .. 10 Part icles 12
F.Shaat , A.C.Smith , T.Stewart , M.W.Treasure ;,nd M. G. Thompson (Abstract)
EA-8 A New Measurement of the Shower Size Spectrum tor 13 7.105«N«. 10 6 a t Sea Level W.S.Rada, A.C.Smith and M.G.Thompson
EA-9 Electron and Muon Components in Air Shower 18 H. Sakuyama and N. Suzuki

VI
EA-10 The Electron Photon Component In Extensive Air Showers 22 T.Matano, M. Machlda and K.Ohta (Abstract)
EA-11 High Energy Hadronlc and Electronic Components in 23 Extensive Air Showers near Sea Level T.Kameda, T.Maeda and K.Mizushtma (Abstract)
EA-12 Energy Flows of Extensive Air Showers near Sea Level 24 N.Jogo, T.Kameda, T.Maeda, K.Mtzushima and T.Okamoto (Abstract)
EA-13 The Production Height of Muons in EAS 25 E. BShm, J. Burger and M. Suling
EA-14 A Comparison of EAS Observations at Sea Level and at 29 Mountain Altitude E.Bohm
EA-15 A New Air Shower Experiment at Kiel 34 E.R. Bagge, M. Samorski and W. Stamm (Abstract)
EA-16 Lateral Distribution of Charged Particles in Air Showers 35 Associated with Muons of Energy Э220 GeV B.S.Acharya, S.Naranan, V.S.Naras,'imham; M.V.S.Rao, K. Stvaprasad, B. V. Sreekantan and Srlkantha Rao (Abstract)
EA-17 Transverse Momentum Distribution and Primary Charge 36 Composition from a Study of Muons of Energy 3 220 GeV in Air Showers B.S.Acharya, S.Na^anan, V.S.Narasimham, M.V.S.Rao, K. Sivaprasad, B. V. Sreekantan and Srikantha Rao
EA-18 Properties of Air Showers Associated with Multiple Muons 44 of Energy > 220 GeV B.S.Acharya, S.Naranan, V.S.Narasimham, M.V.S.Rao, K. Sivaprasad, B. V. Sreekantan and Srikantha Rao (Abstract)
EA-20 Properties of Extensive Air Showers with Sizee 4E 105 ^ 5 x 10⁶ at Sea Level J. Gawin, B. Grochalska, T.Dzlkowski, R. FIrtawskt, J.Kempa, S. Pachala and J. Wdowczyk (Abstract)
EA-21 Estimation of the Mass of the Primary Cosmic Ray 46 Particles with Energies 10 l s - 1016 eV on the Basis of the Fluctuations In the Muon to Electron Ratio T.Dzikowskl, J.Gawin, B. Grochalska, S. Pachate and J. Wdowczyk

VII
EA-22 Lateral Distribution of Electrons In EAS with N e > 2.10 52 E.N.Alexeyev, A.E.Chudakov, A.E.Danshin, M.D.Galperin, P .Ya.Glemba, A.S.Lidvansky, Yu.R.Sul la-Petrovsky, B. B.Tatian, V.A. Ttzengausen, G. B. Khrlstiansen, G. V. Kulikov and V. P . Sulakov
5 EA-23 Structure of the Central Pa r t of EAS with Ne== 2.10 56
E.N.AJexeyev, A . E . Ghudakov, M. D. Galperin, P .Ya .Glemba , D.D.Japuyev, A.S.Lidvansky, Yu.H.Sul la-Petrovsky, B.B.Tat ian , V.A.Tizengausen, G. B. (Christiansen, G. V. Kulikov, V. P . Sulakov and G. Navarra
EA-24 Low-Energy Nuclear-Active Par t i c les in Extended Air 62 Showers (EAS) S.Zh.Apshev, L .Z .Tzagova , S. I. NUeolskij, Y.N.Stamencv, A. I. Kbstin and A. Ch. Binogerov
о EA-25 The 54 m Spark-Chamber Array at Mt. Norikura for the 68
Fundamental Study of the Air Shower S.Kino , T.Kitaj ima, N.Nii , S.Dake, H.Oda, T.Nakattfuka, T.Sugihara, M.Kusunose, H.Sasaki, K.J i t suno, Y. NakanisM, K. Nishikawa, N. Ohmori, M. Sakata, Y.Yamamoto, T . Yura, T. Yanagita and Y. Hatano
EA-26 The Fluctuation of Electron Density at H 2 20m from SAS Core 74 Y.Hatano, T.Kitaj ima, N.Nii , T.Yanagita , T .Yura , S.Dake, T.Nakatsuka, H,Oda, T.Suglhara, M.Kusunose, H.Sasaki, ICJi tsuno, Y.Nakanishi, N.Ohmori , M.Sakata, Y. Yamamoto and S. Kino
EA-27 Multi-Cored Air Showers Observed by Large Spark 79 Chamber Array S.Kino, T.Kitaj ima, N.Nii , S.Dake, T.Nakatsuka, H.Oda, T.Sugihara, M.Kusunose, H.Sasaki, K.Ji tsuno, Y.Nakanishi, K.Nlshikawa, N.Ohmori , M.Sakata, Y.Yamamoto, T .Yura , T.YanagiU; and Y.Hatano
EA-28 The A!r Shower Structures Under Iron Absorber 85 T.Kitaj ima, N.Nii , S.Dake, T.Nakatsuka, H.Oda, T.Sugihara, M.Kusunose, H.Sasaki, K.Ji tsuno, Y.Nakanishi, K.Nishikawa, N.Ohmori , M.Sakata, Y.Yamamoto, T .Yura , S.Kino, T.Yanagita and Y. Hatano
EA-29 The Density Spectrum, the Lateral Distribution and the 91 Size Spectrum T.Yanagita, Y.Hatano and M.Sakata

VIII
EA-30 Lateral Distribution of High Energy Events in EAS 96 S. Miyake, N. Ito, S. Kawakami, Y. Hayashi and N.Awaji (Abstract)
EA-31 Structure of Muon Component in Extensive Air Showers 97 S. Miyake, N. Ito, S. Kawakami, Y. Hayashi and N.Awaji (Abstract)
ЕЛ-32 The Lateral Distribution of Electron and Muon Fluxes in 98 Extensive Air Showers at Mountain Altitude V.S.Aseikin, A. G.Dulovij, N. V, Kabanova, N. M. Nesterova, N. M. Nikolska>a, S. I. Nikolsky, V. A.Romakhin, E. I .Tukish, L. M. Katsarsky,
-I .N.Kirov, J .N.Stamenov and V.D. Janminchev
EA-33 Phenomenological Character is t ics of the Muon Component 102 on EAS at Mountain Altitude J . N. Stamenov, N. H. Georgiev, L. M,Katsarsky I .N.Kirov, V.D. Janminchev, S. I. Nikolsky, N. M. Nikolskaya and N. V. Kabanova
EA-34 About Some Problems of the Structure on EAS with Energies 106 Below 1 0 1 7 e V L. M. Kat^arsky, LN.Ki rov , J . N . Stamenov, S.Z.Ushev, V.D. Janminchev, L. G.Dedenko, N. V.Kabanova, N. M. Nikolskaya and S. I. Nikolsky (Abstract)
EA-35 The Lateral and Energetic Character is t ics of the EAS 107 Hadronic Component at Mountain Altitude. I V. A.Bomakhin, N. M. Nesterova and A. G. Dubovy
EA-36 The Lateral and the Energetic Character is t ics <rf the 113 EAS Hadronie Component at Mountain Altitude. I I N. M. Nesterova and V. A. P.omakhin
EA-37 Energy Character is t ics of EAS Electron-Photon 118 Component at 3330 in above Sea Level V. S. Aseikin, S. L Nikolsky and E. I. Tukish
EA-38 Fluctuations of Muon Density of EAS at Different 123 Distances from the Axis , B.Betev, i L.Katzarsky, LKirov, J .Stamenov, T.Stanev, S.Ushev, Ch.Vankov, N.V.Kabanova, N.M.Nesterova, S. I.Nikolsky, V. A.Romachin and V. D.Yanminehev
EA-39. The Energ. Spectrum of the Pr imary Cosmic Rays in the 129 R a n g e 1 0 1 3 - JO1 6
e V T. V. Dantlova, N. V. Kabanova, N. M. Nesterova, N.M. Nikolskaya, S. I. Nikolsky, L. M. Katsarsky, LN.Kirov, J.N. Stamenov and V.D. Janminehev

IX
EA-40 About the High Dependence of Extensive Air Showers with 133 Energies below 1 0 " eV J . N. Stamenov and S. Z. Ushev
EA-41 New Experimental Data on the EAS Altitude Dependence 137 in the Upper Atmosphere R. A. Antonov, V. A. Astafiev, I. P . Ivanenko and Т. М, Kopylova
EA14Z The Analysis of Experimental Data on the Part icle Lateral 142 Distrjbution at Large Distances from the Axis in EAS with the Total Par t ic le Numbers 107 - ID8
V . B . A t r a s h k e v i c h f\ »". Vedeneev, G.V.Kulikov, V. 1. Solovjeva and G. B. Khristiansen
EA-43 Study of EAS Muon Component 148 G. B.Khristiansen, G.V.Kulikov, A . P . Lebedev, A.A.Silaev V. L Solovjeva, N. Sirodzev and В. М. Makhmudov
EA-44 Some Fea tures of Superhigh Energy EAS at Sea Level 154 O. S. Diminstein, T. A. Egorov, N. N. Ef imov, A.V. Glushkov, L.l .Kaganov, A.I .Kuzmin. S. V.Maximov and M. I. Pravdin
17 20 EA-45 Cosmic Ray Spectrum in 10 - 10 eV Region 159
D.D.Krasi lnikov, M.N.Dyakonov, T. A.Egorov, j . M.KerschenhoIz V. A. Kolosov, д . i. Kuzmin, V. A. Orlov and I. Ye. Sleptsov
EA-46 Spatial Distribution Function of Hadrons in EAS with 165 Energy More than 10 eV A. I. Kuzmin, G. V. Skripin and A. A. Upolnikov (Abstract)
EA-47 Measurement of the Lateral Distribution in Individual EAS 166 of Energy 10 1 7 - 1 0 1 8 eV J .Lapikens , H.M.Norwood, R . J . O . R e i d , S.Ridgwayand A.A.Watson
EA-48 Fluctuation Studies in EAS by Means of Rise t ime 172 Measurementsat Energies Above 10 eV M. L. Barre t t , R. Walker, A. A. Watson and P . Wild
EAS Structu; J . Lapikens
18 ЕЛ-49 EAS Structure at Energy у 5.10 eV 178

X
EA-50 Observations of Extensive Air Shower Cores in the 183 Observations ot Extensive Ail Energy Range 1 0 1 4 - 10 eV J . M . F o s t e r , B .R .Green , A. L.Hodson, W.E.Hazen , A.Hendel and R. M. Bui 1 (Abstract)
4 6 EA-51 Hadrons ^ 500 GeV in Air Showers of Size 5x10 -10 . 184
J . E . F . Baruch, G. brooke, L.W.Kel lermann and N.D.Wals te r
EA-52 The Muon Content of EAS 189 P . R . B l a k e
EA-53 The Study of Fluctuations in the Muon Component of 194 Large EAS R.Armi tage , P .R .B lake , P . J .Connor , W.F .Nash and C. G. Saltmarsch
EA-54 Arrival Time Spread Measurements of Muons in EAS 200 P . R . B l a k e , W.F .Nash and l . C . P r e s c o t t
EA-55 Average Structure of Large Air Showers as Function 206 of Size and Zenith Angle J . Linsley (Abstract)
EA-56 Intrinsic Variance of Air Shower Structure Measured 207 at Volcano R a n c h J . Linsley (Abstract)
EA-57 Electrons in Large Air Showers Observed at 5,200 m a. s . l . 208 C.Aguirre^ A.Trepp , H.Yoshii, P.K.MacKeown, T.Kaneko, F.Kakimoto, Y.Mizumoto, K.Suga, M. Nagano, K.Kamata, K. Murakami, K. Nishi and Y. Toyoda
ЕA-58 Muons in Large Air Showers Observed at 5,200 m a. s . 1 . 2 1 3 C A g u i r r e , A.Trepp , H.Yoshii, Y.Mizumo:o, F.Kakimoto, K.Suga, P.K.MacKeown, T.Kaneko, K.Murakami, K.Nishi , M. Nagano, K. Kamata and Y. Toyoda
EA-59 Energy Spectrum of P r imary Cosmic Rays from 10 eV to 218 10*9 eV Determined from Air Showers Observed at 5,200 m a. s. 1 C.Agutrre, G.R.Mejia, H.Yoshii, T.Kaneko, P.K.MacKeown, F.Kakimoto, Y.Mizumoto, K.Suga, M.Nagano, K.Kamata, K. Murakami, K. Nishi and Y. Toyoda
EA-60 Shower Fronts of Large Air Showers Observed at 5,200 m a. s . l 223 Y.Mizumoto, F.Kakimoto, K.Suga, P.K.MacKeown, T.Kaneko, C.Aguirre, A .Trepp , H.Yoshii, Y.Toyoda, K.Murakami and K.Nishi

XI
EA-61 Air Shower Cores of 10 -10 eV Observed by 226 Chacaltaya Emulsion Chambers Brazil-Japan Emulsion Chamber Collaboration (Abstract)
EA-62 The Time Structure of the Muon Component of EAS in 227 the Energy Range 1016 to 5x10 eV E. J.de Villiers and D. J. van der Walt (Abstract)
EA-63 Temporal Characteristics of Air Shower Energy 228 Deposition in Plastic Scintillators D. M. McDonald, K. W. CI яу ~хм J. R. Pre scott.
V
EA-64 The Cerenkov Light Pulse Spectrum from Low Energy 233 Air Showers: Measurements and Simulations D.H;Hartman,C.Y.Fan, P.G.Googh, K.E.Turver and T.C.Weekes
EA-65 Cerenkov Light from EAS at Sea-Level 239 J.D.Kuhlmann, R.W.Clay, P.C.Crouch, P.R.Gerhardy, A. G. Gregory, J.R.Patterson, J.R. Prescott and G.J.Thornton
EA-66 F u r t h e r studies of the Shape of the EAS Cerenkov 244 Radiation Pulse with the Yakutsk Array N.N.Kalmykov, G.B.Khristlansen, Yu.A.Nechin, V. V. Prosin, V. M. Grigoriev and N. N. Ef imov
EA-67 Cerenkov Radiation of the EAS Superhigh Energy 251 O. S. Diminstein, M. N. Dyakonov, N. N.Efimov, T.A.Egorov, A.V.Glushkov, V.M.Grigoryev, S.P.Knurenko, V.A.Kolosov, D. D. Krasllnlkpv, F. F. Llshchenyuk, I.E.Sleptsov, V.F.Sokurov, N.N.Kalmykov, G. B.Khristiansen, Yu. A.Nechin, V. V.Prosin, S.N.Vernov and S.LNikolsky(Abstract)
EA-129 Observations of Extensive Air Showers by Air Fluorescence 252 Description of Experimental Techniques G.W.Mason, H.E.Bergeson, G.L.Casslday, T.-W.Chlu, D.A.Cooper, J.W.Elbert, E.C. Loh, S.Steck, W.J. West, J. Boone and J. Linsley
EA-130 Observations of Extensive Air Showers by Air Fluorescence 258 Sensitivity Tesfcand Results G.L.Cassiday, H.E.Bergeson, T.-W.Chiu, D.A.Cooper, J.W.Elbert, E.C.Loh, D.Steck, W.J.West, G.W.Mason, J. Boone and J. Linsley

XII
ЕА-1М Observations of Extensive Air Showers by Air 264 Fluorescence - Results of the Measurements J .W.E lbe r t , H.E.Bergeson, G. L.Cassiday, T.-W. Chiu, D.A.Cooper, E .C .Loh , D. Steek, W.J . West, G.W.Mason, J.Boone and J .Lins ley
EA-69 Rate Es t imates for Proposed Experiments Using the F ly ' s 270 Eye Air Fluorescence Detector G. L.Cassiday, H.E.Bergeson, T.-W.CMu, D.A.Cooper, J .W.E lbe r t , E .C .Loh , V. Stock, W . J . West, G.W, Mason, J . Boone and J . Linsley
EA-70 Cerenkov Radiation from Large Cosmic Ray Showers 275 I-Computer Simulation Data R .J .Pro t l i c roe and K . E . T u r v e r
EA-71 Cerenkov Radiation in Large Cosmic Ray Showers 281 II-Measurements at Sea Level R.T.Hammond, K.J .Orford , J . A. L. Shearer, K . E . T u r v e r , W.D. Waddoup and D. W. Wellby
EA-74 Direct Measurement of the Cascade Development in 287 Large Cosmic Ray Showers R.T.Hammond, R . J . Protheroe, K. J .Orford, J . A. L. Shearer , K. E . Turver, W. D. Waddoup and D. W. Wellby
EA-75 Calculations of the Angular and Lateral Distributions 292 of Cerenkov Light for the Narrow-Angle Detectors I. P . Ivanenko, V. V. Makarov and L. A. Hein
EA-76 Lateral Distribution of the Cerenkov Radiation for the Wide-angle 297 Detectors I. P . Ivanenko, V. V. Makarov and L. A. Hein
EA-77 Determination of the Longitudinal EAS Development on the 30Э Basis of the Data on the Time Scaning of Cerenkov Radiation Pulse I. P . Ivanenko and V. V. Makarov
EA-78 Optical Cerenkov Radiation from Extensive Air Showers 308 Т . Нага, K.Kamata and G.Tanahashi
EA-79 Do EAS Observations Rule out Feynman Scaling? 314 Т . К . Gaisser , R . J . Protheroe and K . E . Turver
EA-80 Violation of the Hadron Interaction Character is t ics 320 Obtained with Accelerators in the Superhigh-Energy Range from EAS Data S.N.Vernov, G.B. Khristiansen, A .T . Abrosimov, N.N.Kalmykov, G. V. Kulikov, V.L Solovieva, Yu. A.Fomin and B. A. Khrenov

XIII
EA-81 Scaling and Its Breakdown at Very High Energies 326 P . K . F . G r i e d e r
EA-82 Inadequacy of Scaling Models with EAS Proper t ies at 10 GeV 332 M-F.Bourdeau, J -N. Capdevielle and J . Procurcur
EA-83 Evaluation of the Pr imary Spectrum Index Near of 338 10 GeV by Theoretical Analysis of Central Density Fluctuations M. F.Bourdeau, J, N. Capdevielle and J . Procureur i (Abstract) I
EA-84 Extensive Air Shower Detection at Pic Du Midi Level 339 1 0 1 3 - 1 4 e V )
A,Cachon, J . N. Capdevielle and J . Wdowczyk (Abstract)
EA-85 Pr imary Mass Composition and Small EAS at Very High 340 Altitude M. F . Bourdeau, J . N. Capdevielle and J . Procureur (Abstract)
Г EA-86 Non Validity of Age Paramete r Uniclty in the Description 341
of the Lateral Electron Distribution J . N. Capdevielle, J . Gawin and J . P rocureur
EA-87 Simulation of Lateral Electron Distribution at Tien-Shan 347 Altitude J . N. Capdevielle, J . Gawln and J . Procureur
EA-88 Reliability of the Method of Constant Intensity Cuts for 353 Reconstructing the Average Development of Vertical Showers T . K. Gaisser and A. M. Hfflas
EA-89 Longitudinal Behaviour of Cosmic Ray Par t ic les in the 358 Atmosphere T . Shibata
EA-90 Transverse Behaviour of Cosmic Ray Par t ic les in the 364 Atmosphere T.Shibata
EA-91 On the Separation of the Effects Caused by Different P r imary 370 Masses , Rising Cross Sections and a Changing Multiplicity Law on Air Shower Spectra by a Suitable Choice of Observables p . K. F . Grieder

XIV
EA-92 The Effects of Large Transverse Momenta on Air Shower 376 Spectra and Implications for Part icle Production Mode1 s P . K. F . Grieder
EA-93 Global Comparison of Experimental and Theoretical Air 381 Shower Spectra and Distributionsand the Most Likely Model of High Energy Multiparticle Production.Part I: Energy Spectra P . K . F . G r i e d e r
EA-94 Global Comparison of Experimental and Theoretical Air 387 Shower Spectra and Distributions, and the Most Likely Model of High Energy Multiparticle Production Pa r t П, Lateral Distributions and Overall Conclusions P . K . F . Grieder
EA-95 Sensitivity of Various EAS Proper t ies to Pr imary Mass ЗЭЗ Composition and High Energy Collision Models J .Olejniczak, J.Wdowczyk and E. Zujewska
EA-96 A Detailed Auoroach to the Structure o f t h e E x t e n s i v e 398 A i r S h o w e r s - I ( F l u c t u a t i o n s ) L. Popova
EA-97 A Detailed Approach to the Structure o f t h e E x t e n s i v e 403 A i r S h o w e r s - I I ( C o r r e l a t i o n s ) L. Popova
EA-98 Proper t ies of High Energy Interactions and Shower 409 Character i s t ics at the Depth of 690 g /cm L. Popova and J . Wdowczyk
EA-99 Character is t ics of Extensive Showers from Nucleus- 413 Nucleus Interactions at Energies Above 1 0 1 4 eV L. Popova and O. Popov
EA-100 Genesis of the Shower Par tc i les and the Measurement of 419 the Cross Section at EAS Energies T . Stanev
EA-101 Could the New Theoretical Ideas of the Multlparttcle 424 Production be Useful in the EAS Studies B.Markovsky, T.Stanev and Ch. Vankov ( A b s t r a c t )
EA-102 Multlcored EAS and the High P Cross'-Section in the 10 - 1 0 6 425 GeV Energy Region T. Stanev

XV
EA-103 Monte-Carlo Simulations of the Lateral Distribution of 430 Particles in Extensive Air Shower Cores B. R, Green (Abstract)
EA-104 . Interpretation of Air Shoner Data Relevant to Cosmic. 431 Ray Composition J. Linsley (Abstract)
EA-105 Analytical Solution for the Basic Equations of the 432 Cascade Theory Using the Energy-Inhomogeneous Cross-Sections I. P. Ivanenko and A. A. Kirillov
EA-106 The Functions of the Angular and Lateral Distributions of 438 Particles in Electron-Photon Cascade A. A. Belyaev, I. P. Ivanenko and V. V. Makhrov
EA-107 Lateral Distribution of Electrons with Energies above 444 Zero in the Cascades Produced by Photon with Energies 1 0 - 1 0 eV in Iflothermfc Atmosphere R.A.Antonov, V.A.Astaflev, I.P.Ivanenko, A.A.Kirlllov, T. S. Lim and Yu. L Paskhalov
EA-1.08 Effect of the Generation Depth on the Electromagnetic 448 Cascade Shower Development In Isothermic Atmosphere V. A. Astafiev, I. P. Ivanenko, T. S. Lim and V. V. Makarov
EA-109 The Analytical Expression for the Function of Lateral 454 Distribution of Electrons in Electron-Photon Cascade A. K. Bakhtadze
EA-110 Electron-Photon Cascades in the Atmosphere and in 460 Detectors A. M. Hillas and J. Lapikens
EA-111 The Angular Structure Functions of Electrons and Photons 4 66 L. G. Dedenko
EA-112 The Second Moments and tne NKG Formula 470 L. G. Dedenko
EA-113 The Lateral Structure Functions of Electrons and Muo.is 474 in EAS in the Energy Range of 10 - 10 GeV L. G. Dedenko and G. B. Khristiansen
EA-114 A Monte Carlo Model of Electromagnetic Cascade 480 Development T.Stanev, Ch. Vankov and T.Vodenicharova (Abstract)

XVI
ЕЛ-115 Monte-Carlo Simulation of the Electromagnetic Cascade 481 Development in the Atmosphere E . K r y s , A. Wasilewski and J. Wdowczyk ( A b s t r a c t )
EA-116 The Root Mean Square of Lateral Spread of Electrons 482 in the Extensive Air Showers T.Nakatsuka and H.Oda ( A b s t r a c t )
EA-117 The Lateral Structure Function of Energy Density of 483 Electrons in an Electromagnetic Cascade Shower H.Oda ( A b s t r a c t )
EA-118 Extensive Air Showers in Radio Frequency Elect romag- 484 netic Fie lds K. Sivaprasad
ЕА-П9 The Spatial Distribution of Radio Emission by Extensive Air 490 Showers A. T. Kaminsky and E. S. Shmatko
EA-132 Measurement of the Electron-positron Ratio in Extensive 495 Air Showers S. W. Fong and L. K. Ng (Abstract)
EA-120 Calculation of the Density Spectrum of the Electron and 496 Muon Е AS Components a t Sea Level B. M. Makhmudov and R. L. Sharibdzhanov
EA-121 The Plan of EAS Observation at Akeno 501 Akeno group (Abstract)
EA-122 Tho Akeno Air Shower Project 502 Akeno Group (Abstract)
EA-123 The Plan of Optical Observation at Akeno £03 Akeno Group (Abstract)
EA-124 Complex Installation for Investigations of EAS 504 G. B. Khristiansen, B. M. Mahmudov, N. Aliev, N. Slrodzhev, A. A. Silaev and V. A. Chukanov
EA-125 Evidence for Steepening of Cosmic Ray Pr imary Spactrum 508 1 5
n e a r 10 eV f rom a C e r e n k o v L i g h t D e t e c t i o n
S y s t e m a t G u l m a r g
C. L. Bhat, H. Razdan, P . R. Sarma and M. L. Sapru
EA-126 The Spectrum of Muons to 1000 GeV Accompanied 514 by Local Electron Showers R . C . Hawkes, M. G.Thompson and B. Khrenov

AIR SHOV.'f.H COKE LOCATION l'ROCEl/JRES
У, Ashtony J. Fatcnii, H. NejebaL, A. Nasri, li. Snaat, A.C. SrfliLh; T.R. Stewart, M.G. Thompson, M.W. Treasure and Т..Л. Ward . Department of Phys'-ins, Durham University!, Durban» England.
Theoretical • Experimental f^j Nolh p j
The absolute laininwm "numbfer of electron denr-xty detectors rnqui.rcd tc locate the position of the core of an extensive air shower is 3'. In this case the core position can be easily found by graphical mothers-and it is usual to use the informatior. from a fourth detector to give confidence in the result. The Durham EAS. array contains many detectors and the position of the core is determined by a least squares technique using the information from all the detectors. Quantitative information on the difference-in core position obtained by the above methods will be presented.
Coordinates: EA 3,7 (Extensive Air Showers - Others)
Mailing address: Dr. F. Anhtor., Department of Physics, university of Durham. Science Laboratories, South Koad, Durham. DR1 3LE, England.

2
'hi::-LATERAL DISTRIBUTION OF ELECTRONS IN LAS ЛТ SEA LEVEL. F. Ashi-nn, J. b'atemi, H. Nejobot, Л. Hasri, E. Shaat, Л.С. Smith, Т.К. iiu-wavt, M.G. Thompson, M.W. Treasure and I.A. Hard.
Deparl.-runt of Physics, Durham University, Durham,' England
icrctica П
The average of b'AS with a
•a
electrontlateral struct
Experiments
ure at sea level have been measured suimv.ary of previous work.
function
И
and The results
its wi
Doth4~~l
fluctuations 11 be compared
Coordinates; EA 3.2 (Extensive Air Showers - Structure)
K'iiiiiiii; j!dJiT.'.s: Dr. F. Ash ton , Department of Physics, University of Durban, Science Laboratories, Durham. Dili 3LE, England.

3
ELECTRON DENSITY SAMPLING FLUCTUATIONS IN EXTENSIVE AIR SHOWERS
F. Ashton, J. Fatemi,.H. Nejebat, A. N.isri, E. Shaat, A.C. Smith, T.R. Stewart, M.G. Thompson, M.W. Treasure and I.-A. Ward.
Theoretical Q Experimental Q ] B°th Q
Electron density sampling fluctuations in EAS hare been studied and found to be broader than expected assuming they obey the i'oisson distribution. Ouantiative work concerning this problem will be presented.
Coordinates: ЕЛ 3.7 (Extensive Air Showers - Others)
Mailing addicss: Пг- F- Ash ton, Department of Physics, University of Durham, Science Laboratories, South Road, Durham. 1Ш1 31.E, England.

THE AiiSOUITr. VERTICAL INTENSITY OF К AS OF El ••CTKON SIZE 10 VA&TltJMS AT SEA LEVEL
Г. Ash'ton, J . Katemi, H» Nejebr.t, A. H a s r j , K. Shnat , A.C. Smith, T*R> Stewart., M.G. Thompson, M.U. f'reas:urc and l .A. Ward.
Department of Physics;, Durham. Un ive r s i t y , Durham, England.
Theoretical • ЕмрытпипЫ QQ B c h [""]
The abso lu t e v e r t i c a l i n t e n s i t y and the shape of the EAS e l e c t r o n питч^ег spectrum a t sea leve^ has been determined in the region of 1.0 p a r t i c l e s . The r e s u l t i s compared with я summary of previous rot psureinenr.s.
Coordinates: EA 3.7 (Extensive Air Shov:crs - Others)
Railing address: Dr. F. Ashton, Department of Ph/sic?: , Um'verftity of Durham, Science L a b o r a t o r i e s , South Hoad, Durh,v.R. DH1 3LE, England.

5
STUDY OF CHARGED A1!D NEUTRAL ilADRONS IS EXTENSIVE AIR SliOV'ERS AT SKA LEVEL
F. Ashton, D.'A. Cooper. A. Nasl'i, A. Parva,:csh лг,в A.J. Saleh Departn.°;it oi* Physics, Durham University, Dvrh.nn,. England
Theoretical Q Experiment.!! [x] Hot I; Q J
Measurements of Lhe Ч П С Г Ё У spectrum and tlie ratio of charged (o neutral hadrens in LAS at sea level as a function of the shower size will be rcpoited.
Coordinates: ЕЛ 3.2 (Extensive Air Showers - Structure)
>.?пШ»в adilri-ss: Dr. F. Ash ton , Department of Physics, University of Durham, Science Laboratories, South Road, Durham. DH1 3LE, Er:g] nud .

вф78й7Ш THE TRANSVERSE MOMENTUM OF LEADING PARTICLES IN
EAS WITH RESPECT TO THE SHOWER AXIS
F. Ash ton, A. Nasri and I.A. Ward
Department of Physics, Durham University, Durham, England.
Using the detection of a high energy hadron as a master trigger both the shower size and core distance of any accompanying air shower falling within a distance of 10 m from the detector has been determined. The results show that the leading particles (the ones with the highest energy) have an anomalously large transverse momentum with respect to the shower axis.
Introduction. It is well known that in transforming the motion of a particle from one coordinate system to another (e.g. the laboratory system to the centre of mass system) using the Lorentz transformation the transverse momentum remains invariant. Early workers studying hadron interactions in the GeV and multi GeV energy range found the transverse momentum of produced pions could be represented by
• А Л N(pJdPjb= Ар е podPi
where the average transverse momentum <p^ « 2p = 0.30 GeV/c. This analytical formula, although a convenient quantative representation of the data, is thought not to be exact for pA-»- 0 since it gives a discontinuity in the derivative of the flux with respect to angle 9 at 8 = 0 (Fowler and Perkins, 1964). For 10 GeV 7r~-p collisions the <g^ for produced particles has been found to increase with mass of the produced particle (e.g. <p^ = (0.30+0.01) GeV/c for v*, (0.44+0.05) GeV/c for p, (0.56+0.08) GeV/c for g"- see Hayakawa, 1969, pg. 235). The fact that the average transverse momentum of produced particles is small suggests strong final state interactions between produced particles which reach an approximate thermodynamic equilibrium in an interaction space of size
lb before they leave this space and become free particles. The situation for the leading nucleon is not as clear as for produced
pions but the evidence is <n^ = (0.58+_-?§)GeV/c for •>, 250 GeV nucleons incident on nucleons at rest (Hayakawa, 1969, pg. 239). Using direct observation techniques where the primary particle and all the secondary particles produced in a hadron-nucleon interaction are observed, measurements of <p^ have been made using accelerators for incident energies up to •* 1012eV and cosmic rays up to •>. W^'eV. To get measure-measurements at even higher energies,measurements have been made of the structure of air shower cores and the lateral distribution of hadrons with respect to the shower axis. Many of these measurements have shown

7
&
61 ^ • • .
• Ч «. *
*• • И •• ••*+ *
• : f ч +
fcJe. -|лп-IX и
evidence for hadrons with anomalously large transverse momentum and this work has recently been summarised by McCusker (1975). The present work was carried out in the hope of establishing the exact variation of<pA> with energy for primary particle energies >10l4eV. Experimental Arrangement The experimental arrangement used a hadron detector in conjunction with four electron density sampling detectors for core position and shower size determination. In figure 1 the hadron detector is situated directly underneath the central electron density sampling detector M. The hadron detector comprised a layer of 15 cm of lead, a plastic scintillator С of area 1 m^, 8 layers of neon flash tubes, a layer of 15 cm of iron, a plastic scintillator A of area 1 m2 and further layers of flash tubes. A scale diagram of the front view of the detector is given in Ashton et al (1977) - this conference Paper HE 111. To study hadrons in EAS either an air shower trigger can be used (e.g. a 3 fold coincidence btween the detectors C, 61 and 12 as shown in figure 1 where each is set at a given electron density threshold) or a hadron trigger can be used and the size and core position of any accompanying air shower determined by measuring the electron densities in C, 61, 12 and M. The latter method has been employed in the present work as it selects the highest energy hadrons in showers of a given size more efficiently than the former method as well as giving information on the sea level hadron spectrum at the same time. As a hadron master trigger a burst size of > .400 equivalent muons (average pion energy > 300 GeV or nucleon energy > 390 GeV) in either scintillator С or A was used gnd..for each trigger the electron density in the 4 electron density samplingAwa's*displayed on a special oscilloscope unit having 4 separate cathode ray tubes but each operated with the same time base. The vast majority of the triggers showed no significant air shrwer accompaniment but in 96 cases the core position and shower size of the accompanying air shower could be measured. The basic data is shown in table 1.
Figure 1. The distribution inxcore position for hadrons registered in the energy ranges indicated:» 300<Eh<650GeV> + 650<E.<3O00GeV. The hadron detector has area lm and is situated directly under the central electron density sampling detector M (area 1.24m2). The 3 outlying scintillators are C(0.75m2), 61(1.6m2) and 12 (1.6ш2). Total number of showers with N > 5.10'* and a core distance from M < 10m = 96.

8
Figure 2. The dots represent individual measurements and the circles are average values of Exr over the range of shower size indicated by the arrows. The average behaviour can be represented by Exr=AN« where A = 5.6, a = 0.51 and Exr is in GeVm. Total number of showers = 96 with N > 5.10* and core distance < 10m from the hadron detector.
5.104 105 106 2.106 Shower size N.
Running time Total no. of triggers with a burst size > 400 pts.in scintillator С or A
No. of triggers with a measureable shower size and core position produced by an initial hadron interaction in the lead or iron determined from the flash tube information.
lead
iron
Total
Percentage of triggers that produce a measurable shower size and core position (N>5.10 , r<l0m)
2,624.5 hours
1,458
58
38
96
(6.6+0.7)2
Table 1. Basic experimental data. - A shower having a measureable core position and size was taken as one'JJwhich the electron density in C, 61, 12 and M was each >3 m~2. The maximum electron density that could be measured in any detector was 400 m~^. Interpretation of the measurement?
A hadron of energy Е observer at sea level will on the average have made its last interaction at a height h km (corresponding to the interaction length in air X g cm ) above sea level. Assuming it received transverse momentum p^ in this interaction then for the average case it will arrive at sea level at a distance r from the shower axis'дг/п= Р<С^Е i.e. Exr = hxpTc^ Experimentally Z and r can be measured ana studying the average value of the distribution of the product will give information on the average value of pT c.h. Figure 2 shows a scatter plot of Exr as a function of shower size N determined from the present work where energies have been determined from the theoretical variation of burst size with energy for hadrons (assumed to be pions but the energy is only slightly
2 \ >« >< ^ ^ v s - ^ — p . " _ I _ L J L J « • i • • ••••!

9
3.10
5
4 •
| -| T-J 1 I'll J1
. . • » • • m
Л " * •> '•'.С - Ч /
•" ••/ • A/ 1 • W *'
л l_ • AW** * / f» •
•J——1 1—1,1 LnL
r * i
• ' /
• • • *
ft-
^T—
• _ --" "
_ \ -m
> J \ 1 103
Energy (GeV)
Figure 3. The dots represent individual measurements and Che circles are average values over the ю " |— range of core distance indicated by the arrows. The average behaviour can be represented by N=AEa where A=27 and a-1.4 with ^ Е in GeV. Total number of S showers = 96 with N>5.10^ and N core distance <10 m from the '« hadron detector. и
at ,
different if nucleons are assumed) ел incident on 15 cm thick lead and iron absorbers. In figure 2 average, values of Exr over the shower size ranges indicated by ю ^ the arrows have also been calculated and it is clear that there is a steady increase of <Exr> with increasing N. The increase in <Exr> is more related to the rapid increase of average shower size accompanying hadrons of a given energy (see figure 3) than with an increasing r with increasing shower size. To determine the error in core position a Monte Carlo calculation has been performed using showers of similar size and core position as determined in the present measurements. Assuming the sampling fluctuations on N particles is Gaussian and of standard deviation 1.2ЛТ the error in core position is found to be Gaussian and of standard deviation 0.8m (H. Nejebat - private communication). Figure 4 compares the present work with previous measurements and it is seen that there is good agreement on the shape of the variation of <Exr> with shower size. If the average height of the last hadron interaction is assumed to be independent of H, as seems reasonable, then the result implies an increase of <pr> with N, Converting N to an estimate of primary energy using the calculations of Kempa (1976) and Exr to pYc assuming h=l km (corresponding to A=120 g cm-2 which is the interaction length of pions in air) the final result is shown in figure 5 where an attempt has been made to summarise the available information on the variation of <pT> with incident hadron energy. In figure 5 the points labelled 1, 2, 3, 4, 5, 6 are average values taken from the survey of Nasri (1977). The value of <p > found by Adcock et al (1970, 1971-point 5) is calculated from measurements of the Utah group on the decoherence curve of muons of energy >1,000 GeV measured in two large area detectors situated deep underground. These muons originate from the decay of pions produced predominantly by primary nucleons making their first interaction near the top of the atmosphere. The value of <p^ > determined in this work is thus not sensitive to the <pT > of the surviving nucleon which is certainly the case in the present studies. Other surveys of the variation of <pT > with Е are given by Fowler and Perkins (1964), Kazuno (1967), Murzin and Saricheva (1968,pg.210) and Adcock et al (1970). Discussion. The variation of <pT > with Е . ermined from the present work and shown in figure 5 is seen to be roughly consistent with the behaviour found by McCusker et al (1969). It should be noted that the MrCusker et al measurements were made on the electron density subcores observed in an array of 64 close pack scintillators (each of area 0.18 m ).

10
Figure ft. Summary of measurements on the variation of <Exr> with shower size. The fact that <Exr> is approximately the same at sea level and mountain altitude for a given shower size is not understood. i Aseikin et al (1975a) -T EjflTeV, N>105-3,340 m
a.s.l. (Tien-Shan) 1 McCursker et al (1969) -
sea level h Vatcha et al (1973) -
quoted by Aseikin et al 1975a) - 2,200 m a.s.l. (Ootacamond) Present work — >ce. level
10° Siii.'rtr sine N
5.10
4 Subcores were assumed to be produced by y-rays from тт decay and assuming a production height above sea level (e.g. 350 g спГ* Е 3.7 km corresponding to 9.3 radiation lengths for 1012eV y-rays) so that the resulting electron-photon cascade has s=l (maximum development) at sea level energies were estimated and hence <pT>1 values. In this work the lateral distribution of the electron density in the region of the subcore peak density was found to be consistent with an r-1*^ behaviour which is indicative of cascades near the maximum of their development (Bakich et al, 1969). The present measurements were made on the charged hadron component so they are different in this resepect. An extrapolation of the present measurements to lower energies indicates the commencement of a strong divergence from the expected variation determined by other work at an energy of ^ 5.10* GeV. It should be noted that the present measurements give information on the <p T > of the leading nucleon propagating an EAS rather than the <ру> of pions produced in a particular interaction. The hadrons (presumably mainly pions) detected in the present work are produced predominantly in the last interaction above sea level of the primary EAS surviving baryon whereas the EA" core position is determined by a superposition of electron-photon cascades generated in previous interactions. It is thought that heavy nuclei in the primary cosmic rays could not cause the effect as a) the <py> of heavy nuclei undergoing fragmentation is small - 80 Mev/c (Hayakawa, 1969, pg.239) , b) the effect is observed at shower sizes N<7.105
at which the sea level number spectrum is observed to change slope (Ashton et al, 1973) and may signify that air showers of size >7.105 at sea level are produced predominantly by heavy nuclei. The scaling prediction shown-in figure 5 is taken from Michejda (1971) who calculated the expected variation of <pT> from the postulates of Feynmann (1969) and available experimental data. It is seen that tho present work is inconsistent with this result for energies Jf 5.10^ GeV. Aseikin et al (1975b) reported a sudden change in the attenuation length of hadrons of energy >100 TeV that fall within 5 m of the axis of EAS with size >5.10^ at an altitude of 3,340 m above sea level (Tien Shan). This effect gzves^sifpport to the present observations. Further support can be found in the work of Wdowczyk et al (1973) who presented evidence that the law connecting average multiplicity with incident hadron energy violated scaling predictions for Е %3 TeV.

11
т»ч—гттпго!—г-гттщп—rrrinm—гп"пп—птпиа—пч<'»(
_ir v-*---==4-r--->r.r:t:.._€*A : I i i mil/ i i i t f j f i i *in.|—i 11 UIMI—i I iimil i 11 inal
10
л -i
1 0 102 103 104 105 Primary energy (GeV)
Figure 5. Survey of measurements of the variation of <pT> with primary energy. The origin of the points 1, 2, 3, 4, 5, 6 are described in the text. References Adcock, C , Coats, R.B., Wolfendale, A.W., and Wdowczyk, J., 1970, Л. Phys. A., 3, 697-707; 1971, J. Phys. A., 4, 276-290. Aseikin, V.S., Nesterova, N.M., Nikolskaja, N.M., Nikolsky, S.I. Pavluchenko, V.A., Remakhin, V.A., Tukish, E.I., Chubenko, A.P., Jakovlev, V.I. , 1975a, Proc. Int. Conf. Cosmic Rays (Munich) ,Ъ_, 2960-2S65. Aseikin, V.S. , Goryacheva, G.Ya., Nikolsky, S.I., Yakovlev, V.I., 1975b, Proc. Int. Conf. Cosmic Rays (Munich), ]_, 2462-2465. Ashton, Г., and Parvaresh, A., 1975, Proc. Int. Conf. Cosmic Ravs (Munich) 8_, 2719-2724. Bakich, A.M., McCusker, C.B.A., Nelson, D., Peak, L.S., Rathgeber, M.H., and Winn, M.M., 1970, Acta Physica Acad. Sci. Hungaricae, 29_, Suppl.3, 501-508. Feynmann, R.P., 1969, Phys. Rev. Lett., 23, 1415-1417. Fowler, P.H., and Perkins, D.H., 1964, Proc. Roy. Soc. A., 278_, 401-415. Hayakawa, S., "Cosmic Ray Physics", Published by Wiley 1969. Kazuno, M., 1967, Ph.D. Thesis, Dublin Institute for Advanced Studies. Kempa, J., 1976, Nuovo Cim., 3M, 568-580. McCusker, C.B.A., Peak, L.S., and Rathgeber, M.H., 1969, Phys.Rev.,177, 1902-1920. McCusker, C.B.A., 1975, Physics Reports, 20C, 229-285. Michejda, L., 1971, Nuc. Phys., B35, 287-316. Murzin, V.S., and Saricheva, L.E., "Cosmic Rays and their Interactions", Published by Atomezdat (Moscow) 1969. In Russian. Nasri, A., 1977, Ph.D. Thesis, University of Durham. Wdowczyk, J., and Wolfendale, A.W., 1973, J. Phys. A., 6_, 1594-1611.

12
Observations on air siiowers in die range 10 - 10 panicles.
J'. Shaat, Л.С. Smith, T. Stewart, M.W. Treasure and ».:. Thompson
Department of Physics, University of Durham, Durham, England.
Theoretical j~| Experimental [Д B o t h Q
The Durham 50 m EAS array has been operating since October 1976. The array incorporates 14 pl.-stic scintillation counters of various sizes around the Durham spectrograph. Results will be presented on data .analysed concerning the lateral electron structure of the showers and on the i:iuon. component of the showers.
Coordinates:
EA 3.2 (Structure)
Mailing address: »r. M.S. Thompson, Department of Physics, Science Laboratories, South Road, Durham DH1 3LE England.

13
A New Measurement of the Shower Size Spectrum for 7.105 < N < 3106 at Sea Level
W. S. Bada, A. C. Smith and M. G. Thompson Physics Department', Science Laboratories, South Road, Durham, England.
Abstract
Preliminary data from the recently constructed small air shower array at Durham, England have been analysed. From the data acquired during a r, nning time of nearly 800 hours the shower size spectrum in the range 7105<N<3106 is found to be:
TON) -- <Z-b2± 0-5S) Ю * [~b) КЧ-ЧИ
1. Introduction This paper.represents some of the first results obtained from the small
air shower array at Durham. Only since October» 1976 has the array been functioning in its present manner: prior to this date the array was being run intermittently and with a variety of trigger requirements. However, the data presented here represents an early spectrum experiment from the data collected between October, 1975 and February, 1976 during a total of 778.46 hours of operation. The present experimental situation has been described in detail by Rada et al.*-) and the current analysis technique by Smith and Thompson^).
The experimental layout that was functioning during the acquisition of these data is shown in figure 1. This differs from that quoted in reference 1) by the following features:
1. there are no liquid scintillator detectors operational 2. detectors 11, 31 and 51 were not operational
and 3. detectors 51 and 52 were reversed. In all other respects the experiment is unchanged.
Briefly, this experiment consisted-of 11 thin ( 2.5 cm) plastic scintillator detectore covered by about 2g.cm of protective covering. From these detectors we could measure 11 particle densities and 4 fast-timing measurements as an air shower front swept over the array. These data were electronically digitised and stored in a ferrite core store within 2ms of an event occurring. Because the data were digitised all subsequent data manipulation has been via computational techniques. This results in easier data handling and enabling a greater degree of systems and data checking than would otherwise have been possible.

14
Description
0 7 5 m 2 [Density and 2.<Jm2 J last limng
K'i'.n Spectrograph Hadfon Chamber
Stale 9
Figure 1. ТЫ Durham Extensive Air Shower Array 11975-1976)
The data acquisition
Acquisition of these data was enabled by an air shower satisfying the then current triggering requirement and this was a coincidence between detectors C, 13, 33 and 53 with at least one particle per square metre in each detector.
The data analysis of these air shower data has been described in reference 2). Due to a fault in the data handling electronics in the laboratory, during the acquisition period, any data stored which saturated our electronics resulted in a zero being registered in the buffer memory. This meant that in the subsequent data analysis we could not tell if a zero represented a zero particle density in a detector or a detector saturation. In this case the offending density measurement was eliminated from the event's analysis and the analysis then proceeded in the usual way. Due also to the then low particle density trigger, about 30% of the data thus acquired had insufficient fast-timing information for a shower arrival direction to be calculated (this is also because we have independent density and fast-timing electronics). These showers are, nevertheless, analysed but with a zenith angle of 0°. It is a simple task to correct the intensity of these showers to that which would exist if our standard zenith angle cut of 30° could have been applied to the data had this fault not been present.
3. Data Selection
Once the data have been analysed - each event takes about two seconds of IBM 370 computing time - the data are stored on magnetic disc for later interpretation. As a major selection feature we impose cuts on the data of accepting only those events whose zenith angle is less than, or equal to, 30° and whose core position is within a circle of radius 50m. from the central detector. For the purposes of establishing the shower size spectrum we include an additional requirement that the probability of detection of the shower be greater than 0.95.

15
All data whose calculated shower size is greater than 7.10 is used. If one imposes a cut on an event's goodness-of-fit (in our case measured by a weighted least squares function) that same cut should apply to the simulated Monte-Carlo events that are produced to estimate the experiment's response to showers so that meaningful comparisons can be made. In this present case no cut has been introduced.
4. The theoretical response of the air shower installation
Since the Monte-Carlo calculations of this experiment's response to air shower parameters will be published elsewhere only a brief description of the calculations will be given here.
In order to ascertain any inherent systematic biases in the detection or analysis of air shower events recorded by this array we have performed some elaborate calculations in simulating the experiment and the air shower and then analysing these simulated data with the usual analysis programmes. By selecting random shower sizes from an input shower size spectrum, firing them at random points over an area five times that of the array, selecting random azimuthal and zenithal angles (modulated by appropriate distributions) and then including the statistical and detector sampling fluctuations a situation close to the real case is achieved. These events, once simulated, are then analysed and interpreted using the same methods and criteria that are employed with genuine data. Pre- and post-analysis shower parameters can then be examined for a variety of relationahips between them.
3) These showers are simulated using the Greisen structure function and
analysed using the Catz et al*' structure function. Why this is so is largely historical but a saving in analysis-time is achieved over analysing with the Greisen function. A comparison of data analysed using several structure functions will also be published elsewhere but it is found that only the shower size is systematically altered and this shift can be established if careful comparisons of the structure functions are mads.
From the simulation of 1872 showers above N=2.8 10 . (with y.=l.5 for N<7.105 and Yi=2.0 for N>7.105), 379 of which had N>7,105, and which were analysed withour usual analysis programme, we have found that there is a systematic bias introduced into the analysed data. We think that this may be due to the minimising package MINUIT2>5) used in our analysis programme and because we analyse our simulated and genuine data with a different structure function to that used when simulating the showers. The correction to be applied to the simulated output spectrum to get back to the original input spectrum is, from these calculations,
This is then applied to the observed spectrum measured in this experiment.
Ai. attempt to relate the measured scintillator size ( threshold'1'10 M e V) to a G.M. size has been made using, as a guide, the results of references 6) to 8). We estimate that the systematic scintillator size is about 10% larger than the G.M. size. Our own experiment to verify this quantity is planned for later this year.

Fig. 2.
Ю6
Shower size, N
Fig. 2. The shower size spectrum measured in this experiment.
Fig. 3. A comparison between thi& experiment's data and those of other groups (taken from Hillas?))
Ю5
ч£ rf
Т&Г-
Fig.3.
Doo 9 o ^
о Kiel OMSU •MIT • Yak к This
i 10
• •1Ч 0
1 t 1
xperiment t
Ю6
Shower
rf>o
size
о 0
1 10» IN)
rf*.4»t- t
Ю» 109

17
5. Calculation of the observed spectrum
A weighted least squares fit of a power law spectrum has been attempted on both Che simulated and observed spectra. After the corrections, which hav. been outlined above, have, been applied we conclude that the shower size sped rum as measured in this preliminary experiment for 7. K)5<N'-'3.10^ is best ^ivo-by
-> 4*XAJAf -\
This curve is shown in figure 2 along with the corrected shower data. 469 shower events have gone into producing this spectrum. The data shown in figure 3 are taken from Hillas") and relates to other sea-level air shower installations. The Durham data are also included and it is seen that our largest shower size point lies about half an order of magnitude below the survey. This is most probably due to a combination of poor statisrics(this point is for seven showers) and the detector saturation г r obi em indicated ir section 2, although we have tried to take this info account in our calculations. Nevertheless! we feel that the data presented here represent a Fair appraisal of the experiment and give us confidence in our inrerpretarion or
air shower data.
6. Future Work
Since about October, 1976 we have been runnin;: a variety -• . y.per ii'.-nt s simultaneously that use the air shower array, and in particr.'.- •• ha- b.vv running another shower size spectrum experiment. Data roll.••'• .•; -'is date do not have the detector saturation problem nor an '.-• .vent • analysed without an estimate of the shower arrival direct' >: . '" •^•ou^rt'y these data represent a significant advance in our e:<piri it >! erhrii'iue.
7. Acknowledgement
The Science Research Council is thanked for its support i:. inneiiM', this work.
8. References
1. W. S. Rada, E. A. M. Shaat, A. C. Smith, T. R. Stewart, M. С Thompson and M. W. Treasure, Sucl. Inst. Meth. (Accepted for publication)
2. A. C. Smith and M.. G. Thompson, Nucl. Inst. Meth. (Accepted for publication)
3. K. Greisen, Ann. Rev. Nucl. Science, 1£, (1960), 63 4. Ph. Catz, J. Gawin, B. Grochalska, J. Hibner, J. P. Hochart, G. Milleret,
J. Stanizyk and J. Wdowczyk, Proc.Int.Conf. Cosmic Rays, 12, (1975), 4329 —
5. F. James and M. Roos, Сотр. Phys. Comm. 10, (1975), 343 6. S. Shibita, M. Nagans, T. Matano, K. Suga, H. Hasegawa, Proc. Int. Conf.
Cosmic Rays, 2_, (1965), 672 7. A-. D. Bray, D. F. Crawford et al., Proc. Int. Conf. Cosmic Rays 2, (1965)
' 685 8. S. Dake, K. Asayama, K. Jituno, N. Nishifcawa, M. Sakata, Y. Yamamoto,
Y. Hatano, Proc. Int. Conf. Cosmic Rays, _3> (1971), 948 9. A. M. Hillas, Physics Reports (Phys. Lett. C), 20C, (1975), f>l.

18
ELECTRON AND MUON COMPONENTS IN AIR SHOWER
H. Sakuyama and N. Suzuki
Department of Science and Technology, Meisei University, Hino, Tokyo, Japan
24 O^Sm^scintillation counters that were arranged in a lattice configuration with 7.5m separation, were set in the center of the AS array at the Institute for Nuclear Study, University of Tokyo. As a result, the general tendency between average age parameter S and the size of EAS shows that the former decreases gradually with the latter above J0S and that shows a kind of scaling in comparison with a cascade curve by electron or photon primary, but in the range of 5AI0^ to 105
it changes. Also there is a correlation between S and the form of lateral distribution of muons near the core axis.
1. Introduction. The study of EAS of 10 ev has been done so far. The change of size spectrum at the size of 10 *-1Cr is confirmed in phenomenological aspect, but physical meaning about it, is not always consistent among physisists. So we made an experiment on analysis of the structure function about electromagnetic and muon components in EAS, in order to investigate that how a mutual relation to them this change of size spectrum has. Before, we observed the lateral distribution of electron at mountain altitude(Mt. Norikura) by arranging in a lattice configuration of scintillation counters. As a result from 2x10s to lO** average age parameter "§ decreases with increasing size monotonically and it is reasonable for considering^ simple cascade curve for EAS. Now we have investigated that how the above relation between S and EAS size is in the range of about 10 and smaller size than 10s. Also we obtained the results of the correlation between S and average lateral distribution of muons <25Gev).
2. Apparatus and method. 24 0.25m*1 plastic scintillation counters were arranged in a lattice configuration with a unit of 7.5m. These are set in the center of the air shower array at the I.N.S., and (4Х0.25)т* plastic scintillation counters are set to get information of the zenith and azimuthal angle of EAS in accuracy of 5 degrees. These are shown in Figure 1. Core position is decided from (24*0.25)т1 counters and several 1тг counters placed near the center at the I.N.S. The EAS array was triggered by five fold coincidence of five detectors placed at the central part of the lattice array and the frequaney of triggering was 10 per hour. Observed EAS were of the size 104" to 106, and EASs whose cores were inside the central 3X4 "counter arrays were selected for the analysis by which the core position and the age parameter S obtained from the lateral distribution of electrons were determined precisely for individual EAS. Two muon detectors are

19
composed of 8mz plastic scintillation counters. One is located at 3m from the lattice arrays, 15m underground, and can observe muon of energy more than 5Gev, the other about 40m from the center and that of energy more than 1 Gev. The experiment was done in the summer of 1975 at sea level. Another one was carried out to examine the lateral structure of electrons below the size of 10' in detail, arranged in a lattice configuration with 3m separation using (28X0.25)m* scintillation counters.
3. Results and discussions. (a) Electron component The determination of age parameter of EAS has been made mainly based on the best fit of the lateral distribution of electron at distant region from the core(from a.few meter to 60m). The curves foe the lateral distribution of electron have been compared with a single cascade distribution curves that are Nishimura-Kamata-Greisen function with various age parameter. And the best fit function among the age parameter 0.4, 0.6, 0.6, 0.8, 1.0, 1.2, 1.4, 1,6, has been taken as the approximated distribution function. The relation between 3 and shower size is shown in Figure 2. The general tendency of the distribution above the size 10$ shows that ~S decreases gradually with the size of EAS. The result is consistent with Mt. Norikura and Mt. Chacaltaya ones1?'**1 The tendency shows a kind of scaling in comparison with a cascade curve by electron or photon primary. In the range of 5X10* to 10 it changes; 3 shows a smaller value. It seems that there is no detection bias for the range of the size. Because the size spectrum of the range of the size is consistent with the results obtained so far^?' In conclusion the increasing frequancy of the showers with small age parameter, brings about the small average age parameter and the change of size spectrum.
(b) Muon component The average lateral density distribution of muons has been studied for muons with energy of more than 5Gev near the core axis;5m to 20m. They were classified into the groups based on the age parameter of EAS determined from the lateral structure of the electron component. Each group has been classified further into the such groups according to their size. Figure 3 shows the lateral density distribution of muons for various age parameter groups, various size ones, and two zenith angle ones(6<30, B>30). The lateral density distribution of muons in the observed range can be expressed approximately as a power function of the distance r from the core axis, in the range of more than about 5m from the core axis. Above results shows that the slope of young shower is steep while the slope of old shower is almost flat and both the slopes of the electrons and muons 'change together by the age parameter significantly, and have a same tendency as the results of Mt. Norikura for muons with the energy of more than 0.45Gev at the range of 20m to 70m from the core axis J4"*

:о :. of S"cli a d i f f e r e n c e or; t h e munn d i s t r i b u t i o n b e t w e e n ,d a i d ! AS may be и ч е Ч , ; u n d c s t a n d t h e rcer.'iaru sm .*f r be lent - ЕЛЯ.
; y a k e i y a K O
e t a l e t a l
^;:ле1< ^ el a '
• • t ? i . el a l
. ; C a n a d . J . P h y s . 4 6 , S 1 7 , 1<>68.
. ; P r o c . i n t s r n . C e n t , ("osiriic Ray, H o b a r t , EAS- 2 6 , 1 9 7 1 .
. ; P r o c . I n t e r n . Conf. Cosmic Ray, Mtinchen, Vo i.. ft , 2 7 4 7 , 1 9 7 f..
; P r o g . T h e n r . P h y s . S n p r l . ^ 6 , 1, 1160. . ; Ca i a r i . J . P h y s . 4 6 . Ы П 7 . 1968 . T in ' s . c o c . J a p a n , 3 2 . r 'R7, 1972 .
С (О 20 30 40m D m . i u : [.-__-j .: i
Fie. 1- The arrangement of л I r shower array.
• : \u? scintillation con:! *:o.25 nf scint i 11 a*-i IT-
counter Ht Sn'1 mion detector
-J--:The present result -|—:S.Miyake et al.
(Hobart Conf.Г
..,.-•1- Ч-- -f_
— I-
1P ij>. ''. CorrelaMnn between average age palameter S and shower size N<-
Л „7 N..

j . i
M
t lT f i
( a ) " •hr
, + - * ;; i ' '-0
O.-rt
t "•и
, f ' * "ft
( b j TO 2Um
i I
J 1
( d )
*
~\b 2o n
o . * - — •
• T - T - - - A
(e.) 10 'ZOi , .
d i n ! -i • ! ( i и ! ( a ) B V , . (b) ы..:о ( c ; Hi .!) . . (d) в п и ; .• .-• ( e ) ёгЗО . ..>-..•
л : 2. 2 л] о" .л. / О : 4 . 7 л 1 [ Г ч \ , - . lij п . ' • : 1.0x10'- . ЧЧ .1 .J ., д : 2.2.41 С5-....•>.•.. 7 •: a : 4 - 7 x l U S 4 ,V,-i 10 . i./ ш- l .Oxiu'1.;.^ .2..'лш'' ( j : 2 - 2 W 0 * - . \ f •. H'.UO"1
т : 1 . O X I O K N O : . : , . ; * O O S

22
The Electron Photon Component in Extensive Air Showers
T.Matano, M.Machida and K.Ohta Department of Physics, Saitama University, Urawa,. Japan I.Tsushima, N.Kewasumi, K.Honda and K.Hashimoto Department of Physics, Yamanashi University, kofu, Japan
Theoretical Q Experimental fx) Both Q
We have observed high energy electrons and photons. (£,1 Tev PTlr showers with the emulsion chamber installed in the air shower array of the INS, Tokyo. The energy spectrum and lateral distribution of this component
have been studied. The handles of high energy photons were found,too. From the transverse deflections of these bundles with respect to the air shower axis, high transverse momentum are studied.
The energy flow of the air showers.whlch have been studied with the scintillation detectors placed just below the emulsion chamber, are compared with the core structure.
Coordinates:
EA 3.4. ( high energy interactions )
Mailing address:
T.Matano. Department of Physics Saitama University, Urawa'338 Japan

23
HIGH ENERGY HADRONIC AND ELECTRONIC COMPONENTS IN EXTENSIVE AIR
SHOWERS NEAR SEA LEVEL
T. Kameda. T. Maeda and K. Mlzushima
Department of Phys ics , Kobe U n i v e r s i t y , Japan.
Theoretical Q Experimental (* ] Both Q
High energy hadronic and electronic components in
showers with sizes 10 — 10 were measured by two cloud
air
1)
2).
3)
4)
5)
shower arrays.
The results are presented for the followingss
Lateral distribution of the hadronic components,
the extensive air
chambers
Energy spectra of the hadronic and electronic components.
Charge ratio of hadrons,
Relation between hadronic components and electronic
Core structure.
The physical explanation and meaning of items 1 ) ,
presented.
Coordinates:
E.A 3.2 (Structure)
Mailing address:
Professor T. Kameda
Department of Physics, Kobe University
Rokkodai, Nadaku, Kobe,
Japan
ones,
3), 5) are
in the INS
also

24
ENERGY FLOWS OF EXTENSIVE AIR SHOWERS NEAR SEA LEVEL
N. Jogo, T. Kameda. T» Maeda, Kt Mizushima and T# Okamoto
Department of Physics» Kobe University, Japan
Theoretical [_J Experimental (x] B o th Q
Energy flows of EAS with sizes 5>10 — 5x16 were measured by
.arious arrangements of 6~10 leadglass Cerenkov detectors in INS air
shower arrays and in the air shower arrays in Kobe University.
The fluctuations of the meadured energy flows were classified by
various parameters ( sizes, distances from the core, zenithal angles, and
lateral distributions of charged particles near the core), and the results
were compared with Monte Carlo calculations.
Coordinates: E.A 3.2 (structure)
Mailing address: Professor T. Kameda
Department of Physics, Kobe University
Rokkodai, Nadaku, Kobe,
Japan

25 THE PRODUCTION HEIGHT OF MUONS IN Е AS
E. BOEHM.J. BUERGER*, M SOLING
INSTITUT FUER REINE UND RNGEWANDTE KERNPHYSIK WNIVERSITAET KIEL, KIEL, GERMANY
THE PRODUCTION HEIGHT OF MUONS IN ERS MRS BEEN DERIVED BY Я SIMPLE GEOHTRICRL MODEL FROM THE SIMULTANEOUS MEASUREMENT OF ENERGY, ARRIVAL TIME AND CORE DISTANCE OF INDIVIDUAL MUDNS. A COMPARISON HITH SHOWER SIMULATIONS SHOWS, THAT THE OBSERVED PRODUCTION HEIGHTS ARE STRONGLY BIASED AND A CALIBRATION ON SIMULATED SHOWERS IS NECESSARY. THE AVERAGE PRODUCTION HEIGHT OF MUONS ]S LOWER IN THE ATMOSPHERE THAN GIVEN BY THE SIMULATION USED FOR COMPARISON. THIS CRN BE EXPLAINED ONLY BY A PRIMARY PROTON BEAM AND ITS FLUCTUATIONS IN SHOWER DEVELOPMENT.
BECAUSE OF THEIR SHALL ABSORPTION MUONS ARE ABLE TO TRANSFER INFORMATION ON THEIR PARENTS, MAINLY PIONS, OVER LONG DISTANCES THROUGH THE ATMOSPHERE. THE MEASUREMENT OF THE PRODUCTION HEIGHT OF HUONS (I.E. THEIR PARENTS) IS ONE METHOD TO GET INFORMATION ON THE LONGITUDINAL SHOWER DEVELOPMENT, WHICH THEN CRN PROVIDE INFORMATION ON THE PRIMARIES AND ON HIGH ENERGY INTERACTIONS MEASUREMENTS ON THE PRODUCTION HEIGHT OF MUONS HAVE BEEN PERFORMED IN GIANT SHOWERS <N > 38*) AT LARGE CORE DISTANCES <R .' 288 M> (EARNSHAW ET RL, 1Э73). THE METHODS USED THERE TO DERIVE THE PRODUCTION HEIGHT, MEASURING THE ANGULAR DEFLECTION OF THE PARTICLES WITH RESPECT TO THE SHOWER DIRECTION, ARE NOT APPLICABLE IN SMALLER SHOWERS, I.E. AT SMALL CORE DISTANCES
APPARATUS AND METHOD THE MUON PRODUCTION HEIGHT IS DETERMINED FROM THE SIMULTANEOUS MEASUREMENT OF THE MOMENTUM, THE ARRIVAL TIME AND THE CORE DISTANCE OF INDIVIDUAL MUONS. THE HEIGHT IS GIVEN IN A SIMPLE GEOMETRICAL MODEL (BUERGER ET RL, 1975) BY
к. о r (J % jT^?') «) WITH С = VELOCITY OF LIGHT
T = DELAY OF THE MUON WITH RESPECT TO THE LIGHT CONE f = E,,/(M,.*C*- ) THE У-FACTOR OF THE MUON R,k= CORE DISTANCE
THE TWO SOLUTIONS OF (1) CORRESPOND TO PARTICLES DELAYED MAINLY BY PATH LENGTH- (R-BRRNCH:-) AND BY VELOCITY- <V-BRANCH.+) DIFFERENCES. FIG.1 SHOWS THE DEPENDENCE OF THE TIME DELRY ON THE PRODUCTION HEIGHT FOR 5 GEV MUONS ACCORDING TO (1). INCLUDED RRE
+ HOW GESRMTHOCHSCHULE S2EGEN, SIEGEN, GERMANY

26
LINES OF CONSTANT % ( = E/,*R*/H): 1 \
FROM (1) ONE DERIVES
DETAILS OF THE APPRRRTUS HAVE BEEN GIVEN ELSEWHERE (BUERGER ET RL, 1975): THE HUON MOMENTUM IS MEASURED BY A MAGNETIC SPECTROMETER ( E ) 3GEV, MDH 158 GEV), THE ARRIVAL TIME BY SCINTILLATION COUNTERS (TIME RESOLUTION T = 1.5 MSEC). THE CORE DISTANCE IS OBTAINED FROM THE PARTICLE DENSITIES RECORDED IN 16 SCINTILLATION COUNTERS OF 1 M* EACH, INFORMATION ON THE ARRIVAL DIRECTION FROM 4 SCINTILLATION COUNTERS BY FAST TIMING METHODS. EXPERIMENTALLY THE ARRIVAL TIME OF THE MOON WITH RESPECT TO ELECTRONS FIG. 1 DEPENDENCE OF TIME IS MEASURED RATHER THAN TO THE LIGHT DELAY OH PRODUCTION HEIGHT FRONT. THE CURVATURE OF THE IN THf SIMPLE GEOMETRICAL ELECTRON DISK DEPENDS ON THE CORE MODEL DISTANCE (WOIDNECK ET RL, 1973) AND ON THE TRIGGERING TINE WITHIN THE SHOWER DISK. IN THIS EXPERIMENT THE ARRIVAL TIME OF THE FIRST PARTICLE IN THE DISK, OUT OF THREE BW THE AVERAGE, HAS BEEN MEASURED AND A RADIUS OF 2 KM HAS BEEN DERIVED FROM EVENTS WITH LARGE ELECTRON DENSITY (>18 PARTICLES/DETECTOR) AND HUONS OF HIGH EHERGY <E/.> 3B GEV), INDEPENDENT OF CORE DISTANCE (R(188 M) WITHIN STATISTICAL ERRORS.
atSJLLU. WITHIN B888 SHOWERS 888 EVENTS HAVE BEEN FOUHD WITH EXACTLY ONE MUON PASSING THE MRGHETIC SPECTROMETER, PRODUCING SPARKS IN AT LEAST 5 OUT OF THE g GAPS OF THE THREE SPARK CHAMBERS. THE SHOWER SIZE IS IH THE RANGE FROM 18* TO IB* PARTICLES (AVERAGE SIZE 18 * 1 ) . THESE EVENTS HAVE BEEN USED FURTHER RHRLYSIS. FIG 2 SHOWS THE PRODUCTION (R-BRRNCH) IN' DEPENDEHCE OH THE CORE DISTANCE. THE DATA FIT WELL TO THE RESULTS AT LARGER CORE DISTANCES AND QUITE DIFFERENT SHOWER SIZES (N >18* )(ERRNSHRW ET RL,
IN THE
AVERAGE HEIGHT
H" '4
too
FIG.2 PRODUCTION HEIGHT OF MUONS IN DEPENDENCE ON CORE DTSTRNCE

27
1973), BUT ARE IN DISCREPANCY WITH AVERAGE HEIGHTS FROM SHOWER SIMULATIONS (GRIEDER. 1976). HOWEVER, SUBJECTING THE SIMULATED SHOWERS TO THE 5ЙНЕ ANALYSIS AS THE EXPERIMENTAL DATA, GIVES PRODUCTION HEIGHTS AS LOW, UHDERESTIMATIHG THE TRUE PRODUCTION HEIGHT: THE AVERAGE HEIGHT OF ORIGIN OF HUONS IN THESE SIMULATIONS, AN INTERMEDIATE FIREBALL MODEL (SMFB-N^E*^"") WITH 20 % PROBABILITY OF NUCLEON PAIR PRODUCTION AND PROTON PRIMARIES OF lH*.EV, IS 5-6 KM AND GIVES, APPLYING <i), HEIGHTS ONLY SLIGHTLY LARGER THAN THE MEASURED ONES, ALTHOUGH THE EXPERIMENTAL RESULTS ARE STILL SYSTEMATICALLY LONER THAN THE MODEL DATA. THIS SHOWS, THAT THE GEOMETRICAL MODEL LEADING TO FORMULA <1) IS RATHER ROUGH: THE MOONS ARE NOT PRODUCED IN A LINE SOURCE AND THEIR EXIST MANY MUONS WITH DELAYS SMALLER THAN GIVEN IN .THIS SIMPLE MODEL,CAUSING THE UNDERESTIMATION OF THE PRODUCTION HPIGHT BY (1). THE LARGER HEIGHT OF PRODUCTION COMPARED 10 THE RESULTS OF ERRNSHRN ET AL (E/L.)3BB MEV) SEEMS REASONABLE DUE TO THE FACTOR 1B% DIFFEREHCE IN SHOWER SIZE AND THUS PRIMARY ENERGY AND THE DIFFERENCE IN THE NUON THRESHOLD ENERGY .
FIG.3 SHOWS THE DEPENDENCE OF THE PRODUCTION HEIGHT ON U(=E^*R^). R LARGE DIFFERENCE IN THE HEIGHTS FROM THE R- AND V-BRRNCH IS APPARENT, LEADING TO BUITE DIFFERENT CONCLUSIONS IN THE OBSERVED TRANSVERSE MOMENTA. A COMPARISON WITH THE _RNALYSIS OF SIMULATED EVENTS <&=8. 2 GEV/C) AGAIN SHOWS SYSTEHATIC DEVIATIONS, AND THE TRUE PRODUCTION HEIGHTS ARE QUITE DIFFERENT, SHOWING THAT THE AVERAGE HEIGHT OF ORIGIN DOES NOT CORRESPOND TO THE AVERAGE 7\. AT SMALL U THE TRUE HEIGHTS ARE CLOSE TO THE V-BRRNCH, AT LARGE U THEY MOVE TOWARDS TO THE R-BRANCH. FROM U AN ADDITIONAL APPROACH. TO INFORMATION ON THE PRODUCTION HEIGHT IS POSSIBLE BY A COMPARISON OF THE U( = PjL.*H)-DISTRIBUTIONS FROM MEASUREMENT AND SIMULATION. FIG. 4 SHOWS THE AVERAGE U IN DEPENDENCE ON CORE DISTANCE. THE EXPERIMENTAL DATA SHOW, CLOSE TO THE CORE, SMALLER VALUES THAN THE SHOWER SIMULATIONS. THUS FROM FIG.2 AND 4 IT HAS TO BE PRODUCTION <E/.)3 GEV) ATMOSPHERE SIMULATIONS.
FIG.3 PRODUCTION HEIGHT OF MUONS IN DEPENDENCE
CONCLUDED, THAT THE HEIGHT OF THE MUONS IS LOWER IN THE THAN GIVEN BY THE

28 THELOWAtE CONNECTED SHOWER, EXP OF SHOWER BOEHM, 1976 IN THE SA TO MRXIMU ATMOSPHERIC HAPPENS DUE STRONGLY DECREASING ABSORPTION EXPLANATION PROTON S FLUCTUATION THE PRESENT DATA AMD SATISFYING QUOTED AB SIMULATIONS RESULTS PRE fROH THE CO SHOWER MODE
BEFORE DEFINITE CONCLUSIONS CRN BE RESULTS ON THE MODEL ASSUMPTIONS HA
FIG 4 E**R DEPFNDENCE ON CORE DISTANCE
IN
RAGE PRODUCTl TO A LOW STAR LAINABLE IN T
DEVELOPMEN THE OBSER
HE STAGE OF D M), IRRESPE
DEPTH OF TO THE COM INCREASING
PRIMARY ENER6 IN THE A
ESSENTIALLY HOMERS WIT S IN DEVELOP!!
COMPARISON SHOWER SIMUL
WITH CONCER OVE EVEN
WOULD BE SENTED HERE H MPARISON WITH L. DRAWN, THE SE VE TO BE INVE
ON HEIGHT TING POINT HE MYRKE T (MYAKE,
MAY BE OF THE
PICTURE 1958,
VED SHOWERS ARE EVELOPMENT CTIVE Of
(CLOSE THE
OBSERVATION, THIS PETITION BETWEEN
INTENSITY FOR Y AND THE TMOSPHERE HOLDS FOR H THEIR ENT.
SHOWER THIS
PRIMARY LARGE
OF EXPERIMENTAL ATIONS IS N TO THE STRONGLY NECESSARY
NOT YET EFFECT BIASED
THE AVE BEEN OBTAINED
ONE PARTICULAR
NSITIVITY ST 1 GATED
OF THE
ACKNOWLEDGEMENT THE ANTHERS WISH TO THANK DR.P GR1EDER (BERN), WHO MADE AVAILABLE DETAILED RESULTS OF HIS MONTE CARLO CALCULATIONS ON ESS. THIS WORK HAS BEEN SUPPORTED BY THE DEUTSCHE FORSCNWNGSGEMEINSCHAFT UNDER GRANT ВО 46Э/2
REFERENCES BOEHM, E., BUERGER,J. ERRNSHAH, GRIEDER,P.
INTERNAL REPORT, KIEL, 76/4, 1976 ET RL, 13TH ICRC, MUENCHEN,27B4, 1975
J. С ET RL, J.PHYS. R,6,i244, 1973 , PRIVATE COMMUNICATION, 1976
HVm*E,S. , PROG TH PHVS. ,6, 844. 1958 WOIDWECK,C. P. ET AL, J PHYS. A, B, 997, 1973

Вб^(^<?9с 29
R COMPARISON OF EAS OBSERVATIONS AT SEA LEVEL AND RT MOUNTAIN ALTITUDE
E. BOEHM
INSTITUT FUER REINF. UNO ANGEWANDTE KERNPHYS1K UNIVERSITRET KIEL, KIEL, GERMANY
AIR SHOWER EXPERIMENTS HAVE BEEN PERFORMED AT SEA LEVEL (KIEL) AND RT MOUNTAIN ALTITUDE (PIC DU MIDI). THE OBSERVATIONS ON THE ELECTRON AND ON THE HIGH ENERGY HRDRON COMPONENT ARE COMPARED RT FIXED PRIMARY ENERGY, DEDUCED FROM CONSTANT INTENSITY CUTS IN THE SHOWER SIZE 5PECTRR. A CONSISTENT PICTURE OF SHONE* DEVELOPMENT IS OBTAINED WITH THE ASSUMPTION, THAT STRONGLY BIASED SAMPLES OF SHOWERS ARE OBSERVED, WITH THE BIAS DEPENDING ON THE HADRON ENERGY SEEN, CAUSED BY LARGE FLUCTUATIONS, LIKE IN A PRIMARY PROTON BEAM.
INTRODUCTION IN EAS RESEARCH A LOT OF EFFORT HAS BEEN DEVOTED TO GET EXPERIMENTAL DATA ON THE LONGITUDINAL SHOWER DEVELOPMENT: A THE OBSERVATION OF THE ARRIVAL TIME DISTRIBUTION OF
ATMOSPHERIC CERENKOVLIGHT HAS NOT YET BEEN SUCCESSFULL IN THIS RESPECT (BOEHM ET AL, 1977R), BUT IN THE LARGEST SHOWERS (BRFORD ET RL, 1976).
В THE MEASUREMENT OF THE PRODUCTION HEIGHT OF MUONS STILL SHOWS PROBLEMS IN THE INTERPRETATION (BOEHM ET AL, 1977B).
Г THE INDIRECT METHOD TO DERIVE THE SHOWER DEVELOPMENT FROM CONSTANT INTENSITY CUTS IN THE. SHOWER SIZE SPECTRA AT DIFFERENT ATMOSPHERIC DEPTHS <LR POINTE ET RL, 1968) SUFFERS FROM THE USUALLY LARGE DEPTHS OF OBSERVATION, NOT ALLOWING TO OBSERVE THE EARLY STAGE OF DEVELOPMENT, CLOSE TO OR BEFORE MAXIMUM.
NEVERTHELESS THE LAST METHOD IS THE ONE EXTENSIVELY EXPLOITED, WHEN COMPARING THE RESULTS OF DIFFERENT EXPERIMENTS: THE DATA OBTAINED FROM OBSERVATIONS AT VARIOUS ATMOSPHERIC DEPTHS ARE TAKEN TO ЙЕ MEASUREMENTS OF THE SRHE SHOWER IN DIFFERENT STAGES OF DEVELOPMENT. SYSTEMATIC ERRORS DUE TO THE SPECIAL EXPERIMENTAL SETUPS AND METHOD!" OF ANALYSIS USED BY THE DIFFERENT GROUPS HERE MAY CAUSE PROBLEMS IN A COMPARISON OF THE RESULTS AND THUS IN INTERPRETATION. THE KIEL EMS GROUP MRS PERFORMED AIR SHOWER EXPERIMENTS AT TWO ATMOSPHERIC DEPTHS (5. BOEHM ET AL, 1975): 1 KIEL (S.L., 1038 G/CM* ), 2 PIC DO MIDI <28(B H, 730 G/CM* ), THE RESULTS OF WHICH ARE COMPARED IN THE PRESENT PAPER, WITH SPECIAL CARE TAKEN TO AVOID SYSTEMATIC ERRORS.
&РРД&ЯЛЖ_Ж1_М Е T H OD A DESCRIPTION OF THE APPARATUS RT KIEL AND PIC DU MIDI CONSISTING OF SCINTILLATION COUNTERS AND A HIGH ENERGY HRDRON DETECTOR EACH HAS BEEN GIVEN ELSEWHERE (BOEHM ET RL, 1975). THE HABRONS ARE

ЯП
DETECTED BY THE CRSC THICKNESS: 8B8 О/СМ* О BEYOND MAXIMUM OF BE CONCRETE RT THE PIC DU MAXIMUM OF DEVELOPMENT) THE HRDRON ENERGY IS OB SIZE), DETECTED UND SIMULATIONS FOR CDNCRET FLUCTURTIONS IN BURST ENERGY SPECTRUM OF HRDR FACTOR THREE) IN THE RPPERRS (ASCHENBRCH, 19 HRDRON ENERGY 5PECRUM R PUBLISHED EARLIER (FRIT
RDES PRODUCED 1 F CONCRETE RT VELOPMENT), 480 MIDI (CHOSEN TO 0
TR1NED FROM THE ERNERTH THE T Е (JONES, 1969).
SIZE RT FIXED T ONS. R CONSIDER
RVERRGE ENERGY Z4), CAUSING THE T KIEL LEVEL IN T 2E ET RL, 1970).
N TARGETS OF DIFFERENT KIEL (CASCRDES RRE FRR G/CM*" OF LERD» SRND RND
BSERVE THE CRSCRDE5 RT
PRRTICLE NUMBER (BURST RRGET, RPPLYING CASCADE TAKING INTO RCCOUNT THE RRGET DEPTH RND THE STEEP ABLE DECREASE (RBOUT A TO BURST SIZE CONVERSION DIFFERENCE BETWEEN THE
HIS PAPER RND THE RESULTS
RESULTS. THE HRDRON ENERGY SPECTRR RT FIXED SIZE ARE GIVEN IN FIG. 1 (VAN STAR ET AL, 1974, RSCHENBRCN, 1974). FIB. 2 SHOWS THE ENERGY SPECTRR OF THE MOST ENERGETIC PRRTICLE PER SHOWER. FIG.1 RND 2 RRE INTERESTING FROM A PHENOMENOLOGICBL POINT OF VIEN. BUT Я COMPARISON OF THE RESULTS RT FIXED PRIMRRY ENERGY RRTHER THRN RT FIXED SIZE IS DESIRABLE. FIXED PRIMARY ENERGY CORRESPONDS TO SHOWERS OF CONSTRNT INTENSITY RT THE THO OBSERVATION LEVELS. FIG.3 SHOWS THE SHOWER SIZE SPECTRR. INCLUDED IS R SPECTRUM DERIVED FROM THE PIC DU MIDI DRTR FOR KIEL LEVEL (EVENTS WITH DEPTHS LARGER 1838 G/CM* ), WHICH GIVES AN IDEA OF SYSTEMATIC DIFFERENCES IN THE SIZE DETERMINATION RT THE TWO LEVELS. TAKING CONSTRNT INTENSITY CUTS FROM FIG. 3, THE SPECTRR OF FIG.1 RND 2 RT FIXED SIZE CRN BE CONVERTED TO SPECTRR RT FIXED PRIMRRY ENERGY.
& 1 1 M 1 '
119%) V \ \ \
l\
to" if *f«v
FIG. 3 COMPARISON OF HRDRON ENERGY SPECTRA RT FIXED SIZE '
10
FIB.2 COMPARISON ОТ HOST INIRGCT1C PRRTICIE SPEC IBM ГП FIXED SI/Г
THESE SPECTRR RLLOW TO DETERMINE THE RESORPTION BEHAVIOUR OF SHOWER PARTICLES (FIG.4). THE ABSORPTION OF ELECTRONS COMES OUT TO BE LARGER THAN THAT OF HADRONS. THE ELECTRON COMPONENT IS NOT IN EQUILIBRIUM WITH THE HRDRON COMPONENT: THE HIGHER THE ENERGY OF THE PARTICLES THE CLOSER TO SHOMER MAXIMUM THEY SEEM TO BE AND THE SMALLER SEEMS THE ENERGY LOSS. FROM THE SPECTRR OF THE MOST ENERGETIC PRRTICLE RT FIXED PRIMRRY ENERGY RN ENERGY LOSS OF A FACTOR K = l ? IS OBTRINED RT THE 18% LEVEL FOR THE PRRTICLE WITH THE HIGHEST ENERGY. TAKING К TO BE THE ENERGY КАПО K = Ep/E*=l/T^ , WHERE -? IS THE EFFECTIVE ELASTICITY AND N THE

31
EFFECTIVE NUMBER OF INTERACTIONS BETWEEN THE TWO LEVELS,
f ,c I730g/cm')
b,000 2 sco
I™ 6200
10" »" Ю"
5
FIG.4 ABSORPTION LENGTH OF SHOWER PARTICLES ЙТ FIXtt' PRIMARY ENERGY IN TERMS Of N,;,. ( = 10* )
FIG. 3 COMPARISON OF SHOWIR SI7F SPFCTRR
DISTRIBUTION OF 6. THE LATERAL STEEPER RT KIEL
100 Гс1:Е„)М
THE POSSIBLE AND N VALUES ARE GIVEN IN FIB. 5. AGAIN HIGH ELRSTICTY HAS TO BE ASSUMED OR AN EXTREMELY SMALL EFFECTIVE NUMBER OF INTERACTIONS
THE STEEPNESS PARAMETER RoOE*) OF THE LATERAL HRDRDNS <EXP(-R/R*)) IS COMPARED IN FIG. DISTRIBUTION FOR MADRONS OF FIXED ENERGY IS LEVEL.
THE STEEPNESS OF THE LATERAL DISTRIBUTION CAN BE RELATED TO THE PRODUCTION HEIGHT-RND THE TRANSVERSE MOMENTUM-DISTRIBUTION TAKING THE Pi-DISTRIBUTION TO BE THE SAME AT BOTH LEVELS, THE PRODUCTION HEIGHT IS LARGER AT THE PIC DU MIDI LEVEL, B^T TAKING H = E*Rc,/Fi WITH 2*P.=%, INFERRED FROM Pi-DISTRIBUTION Pi.*EXP(-Pi/P«) ASSUMING PRODUCTION
BE THE SAME AGREEMENT IS PRODUCED RT
k = !7
05 1 2 5
FIG. 5 COMBINATIONS OF"; , N POSSIBLE, AS DERI VCD FROM THE MOST ENERGETIC PARTICLE SPECTRA AT FIXCD
ENERGY IN H,;c ( = 10* )
К i
PRIMARV TERMS OF THE
AND THE
HEIGHT LEVELS
TO (IN G/CIC ) REASONABLE
THE PARTICLES ARE HEIGHT (IN G,'CM*> FROM THE OBSERVER RATHER THAN FROM THE TOP OF THE ATMOSPHERE, FOR
RT BOTH OBTAINED: THE SAME
10" 10" eV if
FIG. 6 STEEPNESS OF LATERAL DISTRIBUTION OF MADRONS IN DEPENDENCE ON MADRON. ENERGY
P, =8.5 GEV/C. 390 G/CM* RT E„ = 1B I* EV.

32
THIS SHOWER BEHAVIOUR GETS ADDITIONAL SUPPORT FROM THE E*R-DISTRIBUriON FOR HIGH ENERGY HADRONS (FIG.7) CONVERTING FROM FIXED SIZE TO FIXED PRIMARY ENERGY, THE AVERAGE E*R ARE THE SAME AT BOTH LEVELS, INCREASING TOGETHER WITH PRIMARY ENERGY. --IT HAS ТВ BE NOTED HERE, THAT THIS RESULT IS OBTAINED FROM A SUBSAMPLE OF SHOWERS: FROM SHOWERS WITH MADRONS DETECTED. --NEVERTHELESS IT SEEMS THAT THE HIGHER THE ENERGY THE LARGER THE PRODUCTION HEIGHT. FIG. В SHOWS THE DISTANCE OF THE PRODUCTION OF THE PARTICLES FROM THE OBSERVER, IN_ DEPENDENCE ON THE PRIMARY ENERGY, AGAIN ASSUMING H=(E*R)/P^ (P^ =8 5 GEV/C), AS DERIVED FROM FIG. 3 AND Г.
. « * ^ — * 3 ^ ^ f ' v^^^
E,»30OG«V
moo
SCO % ^ ^ h
IgN FIG У COKPHRI50N ОТ I*R DEIEIinENCI OK 5IIOWIR SIZE
IN Fiu в mvi ki;n FkocucuoN Н И CUT AS DERIVED FROM Till E*k DATA, IN DII'KNDIHCE ON PRIMARY ENERGY IN TERMS OF Nfic
AT LOW LEVELS, LEVEL. THIS BE THE ATM HAPPENS PROTON THE SHO THE INT THE PI ABSORPT PRIMARY ENERGY A COH5I RSSUMIN EITHER COMPONE ENERGY PRIMARY OBSERVE IN SHO FULLY D OF SHO PRODUCT FDR А О WHICH
PRIMARY ENERGY THE PRODUCTION HEIGHT IS THE SAME A.T BOTH THE HEIGHT INCREASES WITH ENERGY, STRONGER FOR KIEL
HRVIOUR CRN BE EXPLAINED, IF THE STARTI OSPHERE IN SMALL SHOWERS AND HIGHER IN
IF THE FLUCTUATIONS ARE LARGE, ESSENT BEAM: THE DECREASE OF PROBABILITY FOR HER LOW IN THE ATMOSPHERE IS CANCELLED ENSITY AT LOWER PRIMARY ENERGY. CTORE GIVEN IS NOT YET CONSISTENT ION OF THE ELECTRON COMPONENT, WHICH W BEAM OR A HIGH MULTIPLICITY, AND ALSO DEPENDENCE OF THE ABSORPTION OF PART1C
STENT PICTURE, AT LEAST QUALITATIVELY, G THAT DIFFERENTLY BIASED SAMPLES OF SH THE ELECTRON COMPONENT ALONE OR EL NT, AGAIN DUE TO THE FLUCTUATIONS TOGE SPECTRUM. THE BIAS DEPENDS ON THE
AND ' HRDRON ENERGY. IN SHOWERS WITH О THE PRIMARIES DC NOT SUFFER THAT MANY WERS WITH NO PARTICLE OF HIGH ENERGY, T EVELOPPED, THE LATER BEING EXHAUSTED. WER BEHAVIOUR IS CONSISTENT WITH THE ON HEIGHT OF MUONS IN ERS (BOEHM ET AL
UANTITRT1VE ANALYSIS DETAILED CRLCULRT1 PROVIDE AVERAGE PHYSICAL PRRRMET
NO POINT IS LOW IN LARGER SHOWERS, AND IRLLY FOR A PRIMARY A STARTING POINT OF BY THE INCREASE OF
WITH OULD DE DOES NO LES <S MAY В
ONERS Я ECTRON THER WI DIFFERE HIGH EN
INTER HE FORM THIS IN OBSERVR L, 19?? ONS ARE ERS F
THE STRONG HAND R HEAVY T FIT TO THE FIG. 4). BUT Е OBTAINED, RE RECORDED, AND HADRON
TH THE STEEP NCE BETWEEN ERGY HRDRONS ACTIONS, AS ER NOT BEING TERPRETRTION TIONS ON THE B).
NECESSARY, OR OBSERVED

33
QUANTITIES, AS FOR EXAMPLE SIZE, FIXED RATHER THAN AVERAGE OBSERVED BUANTIilES FOR FIXED PHYSICAL PARAMETERS, AS THE PRIMARY ENERGY, ALLOWING FOR THE DISTRIBUTIONS IN THE PARAMETERS BIASED BY THE SPECTRIN' OF THE INCIDENT PARTICLE BEAM
RJEJLEJLEJWCES. ASCHENBACH, B. , DISSERTATION TUEBINGEN, 1974 BOEHM,E. ET RL, J. PHYS. G. , IN PRESS, 1977Й BOEHM,E. ET RL 'THIS CONF., ER-13, 19778 BOEHM.E. ET AL, 13TH ICRC,MUENCHEN, 2974, 1975 FRITZE.R. ET Rl, ACTA PHYS. HUNG. , 29,SUPPL 3, 419, 197* JONES, N. V., PHYS. REV. , 187, 1868, 1969 LA POINTE.H. ET AL,CRN. J. PHYS., 46, 568, 1968 DRFORB,K.,J. ET RL, NATURE, 264, 727, 1976 VAN STRA.R. ET AL, J. PHYS. A, 7, 135, 1974

34
A NEW AIR SHOWER EXPERIMENT AT KIEL
E.R. Bagge, M. Samorski, W. Stamm
Institut fUr Reine und Angewandte Kernphyslk
der Universitat Kiel, Germany
Theoretical £ ] Experimental |5T| B°th Q
The air shower experiment at Kiel has been considerably extended and modified in order to obtain more detailed and more accurate information on the core region of each individual air shower detected. The new array involves the following detectors; 1. 27 unshielded scintillation counters (shower size, core
position), 2. 11 scintillation counters connected with 22 fast timing
channels arrival direction of showers), 3. a 31 itfi neon hodoscope with 176,400 flash tubes under about
2.5 g/cm^ of wood (electron core structure), 4. 13 scintillation counters shielded by 2 cm of lead (energy
flow of the electromagnetic shower component), 5. a 65 n2 neon hodoscope with 367,500 flash tubes under a
layer of 880g/cm2 of concrete (shower hadrons and muons). This array has come into operation at the beginning of 1976 after a construction time of 2 years. The facilities for test and control of the running apparatus have been improved. The neon hodoscope photographs are now scanned automatically by a new flying spot device controlled by a P0P11/40 processor. Further details of this new experiment will be presented, including remarks on test equipment, detector calibration and response and evaluation of shower parameters. If already available some preliminary results will be given for discussion.
Coordinates: EA 3.2 (Structure)
Mailing address: Dr. M. Samorski Institut fiir Reine und Angewandte Kernphysik der Universitat Kiel Olshausenstr. 40-60, Gebaude N20a
2300 Kiel, Germany

35
LATERAL DISTRIBUTION OF CHARGED PARTICLES IN AIR SHOWERS ASSOCIATED WITH MUONS OF ENERGY » 220 GEV
B.S. Acharya, S. Naranan, V.S. Naraslmham M.V.S. Rao. K. iivaprasad, B.V. Sreekantan and SrikanfhaRao
Tata Institute of Fundamental Research, Roml Bhabha Road, Bombay 400 006
X
About 1600 air showers associated with at least one moon of energy
> 220 GeV passing through the neon flash tube telescope of area 2 m and
height 2.25 m, located at 270 m underground and several thousand showers
without such an association have been recorded with the sir shower array
operating at Kolar Gold Fields. The dnt? is being analysed to obtain
information regarding the ctange, if any, in the lateral distribution function
of charged particles in the two classes of eko-vers. Results obtained till
the time of conference will be presented.
EA 3.2 (Structure)
Dr M.V.S. Rao HECK Group Tata Institute of Fundamental Research Horn! Bhabha Road Bombay 400 005 India

36
TRANSVERSE MOMENTUM D;j5TRIBUTION AND PRIMARY CHARGE COMPOSITION FROM A STUDY OF MUONS OF ENERGY ^ 220 GeV
IN AIR SHOWERS
B.S . Acharya, S. Naranan, V. S, Narasimham, M. V.S, Rao, K. Sivaprasad, B. V. Sreekantan and Srikantha Rao
Tata Institute of Fundamental Research, Homi Bhabha Road, Bombay 400005
We present results on the lateral distribution and the total number of muons of e n e r g y ^ 220 GeV from an analysis of 3340 showers associated with at least one muon recorded with the modified air shower a r ray at Kolar Gold Fields. These results along with the data on 1 GeV muons, when compared with Monte-Carlo simulations based on scaling model, strongly indicate that (i) scaling is valid up to 10*4 e y (ц) ^ e pr imary charge composition at 10 1 4 eV is essentially similar to that at lower energies and (iii) ^ p A is independent of energy up to 10 '* eV.
1. Introduction
As pointed Out in our earl ier publications, experimental investigation of high energy muons in extensive air showers is very important for studying high energy interactions and pr imary composition of cosmic rays of energy ^ 10 4 eV. High energy xnuons directly carry information regarding the characterist ics of interactions from which they originate and hence form an important tool in studying these interactions. In previous confer-e n c e s C i ' » " , we have presented resul ts on the energy spectrum and the dependence of the number of muons on shower size and indicated the trends in the characterist ics of high energy interactions. In this paper we present results on the lateral distributions of muons of energy ^. 220 GeV in showers of size ^ . 10* particles obtained with the modified air shower a r ray at Kolar Gold Fields (920 gms/cm ). The new a r r ay has been designed to locate the cores of showers of size 10* particles to an accuracy of 1 m. A neon flash tube telescope, situated underground at a depth of 270 m, locates the position of the muons, in the array-plane, also to a s imilar accuracy.
2, Experimental Arrangement
The air shower a r r a y at Kolar Gold Fields is shown in Fig. 1. The disposition of the detectors is shown on the left side of the figure. There a re 37 plastic scintillation detectors, each of area 2, 25 m , within a circle of radius 15 m, arranged in a triangular pattern with a detector-separation of 5 m. These detectors enable us to locate the cores of smaE showers (^ 104 particles) landing within 15 m from the centre to an accuracy of " l m . The 20-m ring contains 6 detectors each of area 2.25 m^. The 40 m, 60 m and 100 m rings contain 12, 12 and 6 detectors respectively, each of area 1 m . The a r r ay also contains 5 fast timing liquid scintillation detectors, each of a rea 1. 1 m , to measure the ar r iva l direction of

37
К G F AIR SHOWER ARRAY • Z S 5 m * PLASTIC SCINTILLftTOn » I OOro* PL«STIC SCNULLATOP • M S m 1 LIC-JIO SCINTILLATOR
t гп>Чтм21.НТ TELESCOPE
<270m BELOW SURFOCE I
Fig. 1: Air Shower Array at K. G . F .
air showers. In addition, there a re four plastic scintillation detectors, each of area 2. 25 m 2 , under 10 ft. of granite to measure muons of energy *%, 1 GeV,
A neon flash tube telescope (NFT) of area Z m x 1 m and height 2. 25 m is located a t a depth of 270 m underground. The minimum energy required for a muon to penetrate to this depth is 220 GeV. The position of the telescope, when projected on to the plane of the air shower a r ray , is shown in Fig. 1 (the rectangle). On the right,in the same figure#a schematic of the a r r a y and the telescope in a 3-dimensional view is shown. Fig. 2 shows the details of the East-West and North-South views of the telescope. The telescope contains 2 plastic scintillators each of area 1 m and viewed by 2,photomultipliers of 5" diameter in coincidence. There a re two sets of crossed flash tube t rays kept horizontally and separated by a vertical d is t ance of 2.25 m, In addition, there is a 2 m x 1 m t ray in the middle of the telescope in the N-S direction. Each tray contains 4 staggered layers of flash tubes. The length and diameter of the tubes in the East-West direction a re 1 m and 1 cm respectively whereas in the North-South direction they are 2 m and 2 cm. The telescope enables us to determine the space angle of the 'muon to an accuracy of *» 0. 2°. The corresponding uncertainty in the point of impact of the muon on the surface is л» 1 m. An absorber comprising 3" of Pb and 2" of Fe is interposed between the top and bottom NFT t rays . There a r e two more l m r scintillators situated a t i " 3 m and ~ 8 m from the
I

38
Fig. 2: Neon flash tube telescope at 270 m underground
te! scope. Signals from all th^ 4 detectors (Yes/No) a r e time-coded and transmitted through a coaxial cable to the laboratory on the surface to be processed further.
Air showers a re se lected when any three of the innermost 19 detectors r eco r ded ">, 3 particles each s imultaneously. An on-line TDC-12 computer records the inf or -mation from all the surface and underground detectors whenever there is a coincidence between an air shower on the surface and at least one of the 4 detectors located in the underground laboratory SU showers). If one of the detectors inside the telescope happens to be in coincidence with an air shower, high voltage is applied to the flash tube trays and the tubes photographed by an open shutter camera. When the computer is not recording an event, it monitors and calibrates the detectors on the surface in a sequential way. The details of the computerised recording and monitoring system were described elsewhere '* ' .
Data presented in this paper a r e collected with 55 detectors on the surface (up to and including the 40 m ring) and the NFT telescope under -gr ound. 3. Method of Analysis 3. 1 Shower size and core position:
Shower size (Ne) and core position (x, y) for individual showers were obtained by fitting the observed particle densities to the NKG lateral d i s t r i bution function with a value for the 'age parameter 1 s = 1. 25 using the method of least squares. F rom an analysis of artificially generated showe r s , we found that the e r ro r in the estimation of the core position is 1 m for showers of size ">/ 1С* particles landing within 15 m from the centre; the er ror in N e for this size is iw 10%. There is however a systematic overestimate of N by 20% at Ne = 104; this e r ro r becomes negligible for N e > 4 x 10⁴ . 3. 2 Density of Muons:
The density of muons &/*(*) for a given distance interval (with ave r age distance, r) in showers falling in a given size and zenith angle, & , interval is given by
•y(Ne,r) h* N t ( r ) " s "coe* ( I )

39
where n«»(r) is the total number of muons recorded in that distance interval in a certain period of time and Nt(r) is the total number of showers incident at that distance from the telescope during the same period of time. The distance 'r' is measured in the shower plane. S Cos в is the effective area offered by the telescope at an angle в . i iu(r) is readily obtained from the SU showers. Nt (r) can in principle be obtained from showers recorded without demanding a muon through the telescope (S showers). However, since the distance, r, between the core and the telescope is a sensitive function of ® and ф (azimuth angle) of the shower axis which cannot be deter -mined to an accuracy better than ~ 3° with the fast timing detectorB, r cannot be obtained with the desired accuracy of 1 m. Hence the following Monte Carlo procedure has been adopted for obtaining NAT) S COS в .
Shower axes were allowed to fall within an acceptance area (a circle of radius 15 m in the present case) with zenith angles up to 30° with an angular distribution of the form Cos в . Errors in X, Y, 0 and <f> were taken into account in generating the showers. For each case, the effective area of the telescope S Cos в (the area overlapped by the top and bottom NFT trays when one is projected on to the other) is calculated. This area is divided into several segments, each not exceeding 0, 5 m x 0. 5 m. The distance of each of the segments, in the shower plane from the shower core is calculated. The area S Cos © is then accumulated in the respective distance bins. A total of 5 x 10 cases are generated for each value of n and £ S Cos & is obtained for each distance interval. The calculations are repeated for n = 5, 6, 7, 8 and 9, Equation 1 can now be written, in terms of the quantities calculated by this method as
A.(D 5 x l 0 5 > ( N e . r ) л (2)
Г Т A F (N^<30°) S e (r)
where T is the time during which SU-showers are collected over a surface area A and F(N e , < 30°) is the flux of showers of size Ne per unit area per unit time arriving at zenith angles < 30°. F(N , С 30°) is obtained experimentally from S-showers. S_ (r) is the sum of S Cos © values at the distance, V .
The error introduced in ДЛг) due to an uncertainty of +1 in the value of n is л» 10%. Г
4, Results
A total of 3340 showers associated with at least one muon passing through the telescope, have been recorded in an effective operation time of /v 1700 hours. Showers were accepted for further analysis if they satisfied the following criteria:
(i) any three adjacent detectors of the inner 19 on the surface should have recorded ^. 3 particles.

40
(ii) shower cores should have landed within 15 m from the centre of the a r r ay , where the detection efficiency is > 95%, and
(iii) the muon should have passed through both the top and the bottom NFT trays in N-S as well as Е -W views.
Showers were then classified into size and distance groups for obtaining the lateral distribution of muons. The resul ts presented here a r e for the two size groups (1 -4) x 104 and (0. 4 - 3. 2) x 10 with average sizes of 2 x 10⁴ and 1. 1 x 10⁵ respectively. The number of showers available in the two sizes groups are 71 and 32 respectively. The distance groups chosen are 0-4, 4-8, 8-12, 12-16, 16-20, 20-30, 30-40, 40-50 and 50-60 m. F(N , < 30°) the flux of showers of size, N e , integrated up to a zenith angle of 30° (see eqn. 2) is obtained from 350 selected S-showers recorded in a separate run. The density of muons at different distances in the two siae groups is then calculated using eqn. (2).
Fig. 3(a) shows the experimental values of the density of muons (Eiu.>/ 220 GeV.) plotted against the core distance for the size group (1-4) x 104 . The e r ro r s indicated a re purely statistical. The curves 1, 2, 3 and 4 a r e predictions due to Monte-Carlo calculations based on the scaling model5 . The inelastic cross -section for p-a i r collisions is assumed to have an energy dependence given by Yodh et al . W Curve 1 is for protons with energy 10 ' GeV. The average size at KGF level in this case is 1. 7 x 10⁴. Curve 2 is for an iron nucleus of total energy 3 x 10⁵ GeV with
_ j — i — i i i—i i—i—_J ., го so во so 60 ,0* CORE DISTANCE (m) TO 3° 4°
CORE DISTANCE (m)
Fig. 3: Lateral distribution of muons of energy'? ' 220 GeV for two different size groups

41 a corresponding size of 2 x 10⁴. Showers due to heavy primaries are generated assuming superposition model. Curve 3 is for the 'normal ' composition (as obtained at lower energies). In constructing this curve, the effects due to fluctuations are neglected and one to one correspondence between pr imary energy and shower size is assumed. Curve 4 is obtained for protons with an average shower size of 2 x 10 assuming that < p t > , the average value of p t , for each type of produced particles increases logarithmically, with energy, reaching a.value at 105 GeV equal to twice that at 10 3 GeV(e. 'g . «£pt> increases from 0. 3 GeV/c at 10 J GeV to 0. 6 GeV/с at 105 GeV for pionsj.' И can be seen that curves 1 and 2 do not fit the data. Though curve 1 agrees at smaller distances, the discrepancy is large at large distances (>30m). Curve 2 is much flatter and requires higher densities than observed over all distances. However, curves 3 and 4 a re .in reasonably good agreement with the experimental data. Even though the observed densities at smaller distances a r e lower than curve 3, the ag ree ment is expected to be better if the effects of fluctuations in proton showers a r e taken into account.
In Fig. 3(b), the muon densities a re plotted as a function of core distance for the size group 4 x 10⁴ - 3. 2 x 10⁵ . The statistical e r r o r s on the muon densities a r e much larger for this group. The smooth curve in this figure is the prediction of calculations for a proton giving r i se to an average shower size of 1.1 x 10⁵ at KGF level. The experimental pointa at larger distances веет to be higher than Monte-Carlo predictions, though the e r ro r s are large in this case.
The total number of muons, N ^ , of energy >/ 220 GeV contained within 60 m from the core is obtained by summin g up the products of density and area over all the distance groups. The number of muons thus obtained is plotted against shower s ize , N g , in Fig. 4. Calculations using scaling model show that more than 97% of the total number of muons is contained within 60 m for protons and mixed composition. Hence the experimental value of N|u can be treated as the total number of muons in the shower. The open circles in the figure a r e from the present experiment. The squares a r e from a r e -analysis of the data from an earl ier experiment' *K In the reana lysis , the accuracy in the calculation of the proba -bility of recording a muon in the underground detectors is improved and a correction has been made for the sys tematic difference in the shower
О PAE8ENT ЕКРГ
Q SIVAPPASAO
Fig. 4: Variation of N.. (E >, 220 GeV) with Ne I Г

42
size estimates in the two experiments. There is good agreement between the two experiments. The smooth carve represents the predictions of the calculations for proton showers using scaling model. Again there is good agreement between experiment and scaling model predictions.
5. Discussion
As mentioned in the previous section, the experimental lateral d i s t r i bution agrees fairly well with the predictions of the scaling model both for a proton pr imary with i p t > increasing in the energy region 103 - 1(P GeV and for a normal mixed composition with constant value for < p.> . The mixed composition curve (curve 3) is expected to be in better agreement with the data at smaller distances when fluctuations in protons showers' 'are taken into account. This is because protons with smaller pr imary energies interacting lower down in the atmosphere can give r i se to the same size and these showers will contain less number of muons. The densities at large distances are not expected to be reduced much because a large f rac tion of the contribution to these densities comes £тот heavy p r imar i e s .
In order to see which of the two alternative interpretations is correct , we analysed the data on muons of energy >/1 GeV for these showers. We divided the showers in the size group 10 -4 x 10⁴ into two sub-groups one containing showers in which the 220 GeV muon is at a distance, R j ~ " < 30m and the other with R «5 "* 30m. In each of these groups we further selected showers whose cores fell in the distance interval 20-30 m from the 1 GeV muon detector (of a rea 9 m2) and obtained the average density of these muons. There a r e 19 showers in the first group and 6 in the second. The densities a re found to be 0. 079 + 0. 022 and 0. 22 t 0.06 for these two groups respectively. The ratio of these densities, Л , is then
L,J&h>, 1 GeV, 25 m, R 2 2 l > 30m) Ы =1 ---'-"- - = 2 . 7 5 + 1 . 1
Д , (E. >, 1 GeV, 25 m, R 2 2 0 < 30m) Г г Л
Clearly the showers, in which the 220 GeV muon is at a distance > 30 m from the core, have a density of 1 GeV muons at 25 m which is 2. 75 times that for showers in which the 220 GeV muon is at С 30 m. The value of J. for proton showers is expected to be ^ 1.0, whereas the ra t io of the density in an iron shower to that in a proton shower is 2. 35. Thus the experimental results can be understood only if showers, in which the 220 GeV muon is at a large distance from the core, a r e preferentially due to heavy p r imar ies . In such a case, it is not necessary to invoke an increase in the value of ^ p t ^ with energy.
The N . - Ne dependence agrees well with the scaling model predictions. It should be noted however that the theoretical curve is for protons, neglecting fluctuations. In fact not only fluctuations but also the contribution from heavy pr imary initiated showers will have to be taken into account.

43
6. С onclus ions
We have demonstrated that the effects due to high energy inter -actions and primary charge composition can be disentangled by simultaneously studying two properly chosen air showers parameters : the high energy and the low energy muon components in the present case.
The present results are consistent with:
(i) scaling model for nuclear interactions,
(ii) 'normal1 charge composition as at low energies,
and (iii) energy independent 4. pt"> ,
14 up to energies of the order of 10 eV,
More experimental data is being collected to improve the stat ist ical significance of the experimental resul ts . Theoretical calculations a r e also being refined to take into account the various aspects discussed above.
7. Acknowledgements
It is a pleasure to thank Shri P . D. Gupta, Chairman and Managing Director and the officials of the Bharat Gold Mines Ltd. , KGF for providing all the facilities and their excellent co-operation. Messrs . S.G. Khairatkar, M.A. Patil, S. D. Samuel, A.M. Gurumurthy and R. J . Patel have provided the technical help in setting up and running the experiment. Sri A. V. John developed the software for the on-line TDC-12 computer. Mrs . S. H. K. Shinde and Mrs . C. V. Raisinghar.i helped in preparing the data and the various programs for processing on the CDC 3600 computer. We acknowledge their contributions.
References
1. B.K. Chatter jee, S. Lai, T. Matano, G. T. Murthy, S. Naranan, K. Sivaprasad, B.V. Sreekantan, M, V. Srinivasa Rao and P .R . Viswanath, P roc . Int. Conf. Cosmic Rays, London, 2, 627 (1965).
2. B.V. Sreekantan, Proc . Int. Conf. Cosmic Rays, Hobart, 7, 2706 (1971). ->
3. S. Naranan, K. Sivaprasad, B. V. Sreekantan and M. V, Srinivasa Rao, Proc . Int. Conf. Cosmic Rays, Denver, 3, 1872 (1973).
4. S. Naranan, M. V. S. Rao, K. Sivaprasad and P . B. Subramanian, Proc. Int. Conf. Cosmic Rays, Munich, 9, 3343 (1975).
5. To be published. 6. G.B. Yodh, Y. Pal and J , S . Trafil, Phys. Rev. Let t . , 28, 1005(1972). 7. K. Sivaprasad, Ph.D. Thesis , Bombay University, 1971 (unpublished).

44
PROPERTIES OF AUt SHOWERS ASSOCIATED WITH MULTIPLE MUONS OF ENERGY >, 220 GEV
B.S. Acharya, 3. Naranan, V.S. Narasimhaui, M. V.S. Rao. K. Sivaprasad, B. V. Sreekantan and SrlkanthaRao
Tata Institute of Fundamental Research, Boml Bhabha Road, Bombay 400 001
X
About 1600 air showers associated with at least one muon of
energy \2ЯЪ GeV passing through a neon flash tube teieacope located at
270 m underground, operating in conjunction with the extensive air shower
array at Kolar Gold Fields, have been recorded so far. Approximately
40 of them ore associated with multiple miKma. The- data is being analysed
to -ooli for any possible differences in the properties of the two classes
of shower». Results obtained till the time of the conference wll.' be
presented.
EA 3.2 (Structure)
Dr M.V.S. Rao mica Group Tata Institute of Fundamental Research Horn! iir.ibha Road Bombay 400 005 India

45 PROPERTIES OF EXTENSIVE AIR SHOWERS WITH SIZES 105 - 5 к 10& AT SEA LEVEL
J. Gawin, B. Grochalska, T. Dzikowski, R. Firkowski, J. Kempa, S. Pachala and J. Wdowczyk
Institute of Nuclear Research and University of Lodz.
Theoretic»» • Experiment»! (x] Both £ ]
An analysis has been made of various properties of extensive air showers
at sea level registered by the Lodz device.
The information concerning the detailed structure of the.muon and electron
lateral distributions has been used in order to evaluate the intensities
of showers with different muon and electron numbers.
The results are compared with other experimental data.
Coordinilc»: EAS 3.2 (Structure)
MjilinR tddrrn: J . Wdowczyk, Institute of Nuclear Research, 90-137 Lodz, ul. Uniwersytecka 5, Poland.

46
ESTIMATION OF THE MASS OF THE PRIMARY COSMIC RAY PARTICLES WITH ENERGIES ю' 5 - ю ' 6 eV ON THE
BASIS OF THE FLUCTUATIONS IN THE MUON TO ELECTRON RATIO
T.0zikow3ki,J.Gewin,B.Grochalska,S.PachaIa and J.Wdowczyk, Institute of Nuclear Research and University of Lodz,Poland.
The fluctuations of the muon to electron ratio have been investigated uaing the data from Lodz EAS device. Good agreement with theoretical predictions has been found. The individual distributions of the ratio for various groups of showers have been analysed. The possibility of a composition with dominance of heavy particles seems to be excluded.
1. Introduction. Fluctuations of extensive air shower(EAS) development have been investigated for several years. The object of the investigations is two fold. First of all, fluctuations of various EAS parameters give some measure of the mass composition of the primary particles /for summary see Wdowczyk, 1975/. The information on fluctuations can also be related to the properties of high energy collisions.
In investigations of fluctuations, particular attention has been given to the fluctuations of the total number of muona in showers of a fixed electron size. Those fluctuations have been investigated both experimentally /e.g.FirkOwski et al.,1965, Vernov et al.,1965/ and theoretically. It was pointed out by de Beer et al./1968/ that the fluctuations' of muon densities which are practically always measured instead of the' total number of muons, have different widths at different distances from the shower core. The distribution of the muon densities should be narrower at small distances and gradually bec'ome wider when the distance increases. The efffect is due to the existence of a negative correlation between the shower size end the width of the muon lateral distribution for showers of a fixed primary energy.
Recently the present authors /Dzikowski et al.,1977, denoted by I/ have demonstrated experimentally that the effect predicted by de Beer et al. exists and that its magnitude is in good agreement with the theoretical predictions given in the quoted paper.
In the present work further analysis of much larger sample of data /about three fold increased/ ia given, together with data from low energy muon detector /0.5 GeV threshold/. As it has been pointed out in I the measurement of the fluctuations of N » to Ne ratio is not a simple task. Due to the fact that the muon densities are rather low and their detectors rather coBtly, the muon size is usually evaluated from a relatively small number of detected muons. This causes a rather dangerous situation where the accuracy of the determination of the muon shower size varies significantly

47 from сазе to case due to the* significant Foissonian fluctuations of the number of detected muons.
The variation of the accuracy of the muon size determination make it practically impossible to evaluate and subtract the fluctuations due to the shower reception /and Poissonian fluctuations/ from the interesting development fluctuations in the case when the muon size is estimated in each individual shower and total fluctuations obtained by grouping together the showers of a given size.
It seems that in order to be able to estimate the development fluctuations correctly it is necessary to use a different procedure such as has been developed in Lodz /see for instance Gawin et al., 1965/. The procedure involves grouping the showers in which the same accuracy of muon density determination exist».
2. The experimental arrangement. The experimental data on muon fluctuations were obtained using the Lodz extensive air shower detector. The general layout of the device is given in figure t. The main feature is the existence of two 'very similar
О S o . 0 U5m
О о till
4x0.5m 135m 0.6
e-y
(310 GM.
104 CM, в=14пГ
', 72 OM i s=lmz
PI "5.1. Thf layout of Win nxp.Tlmcntal device.
arrangements of electron detectors which were ueed for selecting shower cores at two different distances from the underground' muon detector. The detector is situated at a depth of 24 m.w.e. corresponding to 5.6 GeV muon threshold energy. The arrangement also comprises a ground level muon detector with threshold energy 0.6 GeV. Each triggering arrangement has its own timing system for determination of the shower arrival direction.
3. The evaluation of the width of the development fluctuations. In the present work the showers of a fixed size and falling at a fixed distances from the rauon detector were grouped and histograms of the number of muons actually hitting the detector were constructed for each group of showers. In such a case the Poissonian fluctuations could be easily subtracted using the method described in detail in I.
The results are summarised in tables 1 and 2. In figure 2 U«? relative widths of the total fluctuation for various shower intervals are /»iven for the case of muons with energies above 'i.h Oi>v. The results were obtained averaging the data given in ' hi> 1 ч Ы е 1 .

48
Tlt<! relative width of the muon «lrnslty fluctuations at ?0 - 130 ш fi-om the shower core as a function r.f shower size.
The relative width of the rauon number as a function of shower size, for rauon energy threshold
I' >!*/*• a. n >~в , 3. scaling after Elbert
(relaxed).
The relative width of the muon number as a function of shower size, for muon energy'threshold 0.6 OeV. 1. n_ 2.
•E 1/2
3. sealing after Elbert (related),
The widths of the development fluctuations are given in figure J together with theoretical predictions for proton initiated showers and for three different models of high energy colliaions. The experimental data correspond to fluctuations of H^ /Ke ratio and were obtained from those given in figure 2 by subtracting ihe reception fluctuations /<5>/y ~ 0.3/ and multiplying by 0.8. The lest feotor is the obtained in I coeficient for converting from the width of the muoh density fluctuations at 110 n to the rauon shower size fluctuations.

49
ГпМя I . Tim mii i .ni ,,r ili.mfttB re^ l f t^ r r tL l i n unoli fUze mid i l lP t i n i r« l ( i t " [ v , i l t o g e t h e r w i t h r e l a t i v e « I d t h e Of tli« mnon f l u i - l n it IniiB - «rinrcy- tttrefiltoltt Е > 5 , 6 GeV,
5.62
5.76
5.^0
6 03
6 19
6.33
6 46
657
667
70
— 3k
'201O29 3»
157=048 2»
1 34 = 0 41 13
-
CO
093Ю13 " 9
87 I 0 9 = 0 «
134 = 033 ! 1
1.02 = 029 14
117 = 044
90
1)4 и ч = 0 1 ч
2 H O f t ! DO?
198 1.0*1 0 10
I IS 100*0 4
74 127=D22
25 0 9 4 : 0 3 2
12 076=024
100
-055=0.11
4 2 ! 072*004
29 < 09Г100Т
177 090=00»
101 = 011 BO
0.9510.21 11
- 1 . И М . »
110
42 083 = 013,
249 100=0.09
112 0 9 0 ! 0 0 !
498
321 013 = 001
177 O9»=0O9
71 094=014
2 7 0 8 » t 0 2 0
120
75 0 7 7 ! 0 09
311 1 1 5 7 0 0 9
6»0 093 = 0 0 5
« 2 1 24 t 0 0 t
ово=ооз J11
ОЯ9100» 104
0 a i * o o 9 is
079=018 11
0 ( 4 : 0 . 2 0
130
— 10 3
0 6 7 = 0 0 9 212
1 0 ) 7 0 0 9 255
О9Ч1001
O l f t o c e 90
093 = 013 57
1.047 0 . " 21
0 0 9 Ю 2 2
— T2i.1iе r i . Ti.e number of ehowere registered In eaoh nlze and
dLRtnnoa Interval together with r e l a t i v e irldtftn it the miton fItictimtlone - energy threshold Б > 0.6 GeV.
I09S - ^ ^
5 6?
5 76
590
6M
619
6.33
6 16
6 57
667
80
— — — --14
10710H1 1S
0?S = 015 13
0 97 = 035
90
— — — — 4*
0 9 1 = 0 2 . = 1
0 .9=011 31
102 = 025 13
0 9 3 = 0 3 4
100
— — — 120
014*0 11 1)1
09TJ011 10
0 89*-013 SI
1 3 1 * 0 2 9 34
113*033 15
0 9910 32
110
— — vrt
0 ^ 0 0 7 змг
141 0 *0 = 007
7в 101=017
JS 0 9 0 = 0 \ J
13 0 8 1 = 0 3 0
120 .
n 0 7 ? г о г *
H i 070 1009
373 11i = 0 0»
219 0*8*-OQ5
170 0T9 I00B
«г 090=01 )
34 1 0 t x 0 * 0
i3 < 0 3 t 0 j 7
130 TO
0 9 0 : 0 1 1 14»
0 1 0 : 0 0 1
oe(.iooj (02
065 -* ООЧ
073*005
0 66*- 001 I t
fleit0.11
ото.»
—
140
44 018=0.12
119 401*010
ИЗ Оиюоч
S47 1S4*O09
093= 007 1$г
0.97s 0.10
0.TH009 31
—
150
_ i i
OTJ10J7 531
0 711 0 И 7Г
O9#=0»7
*) 0 91Ю.17 J» 0 f l «s02Z
13
11 0 SO* 019
— In figure 4, aimilary obtained, fluctuations of U/i /Ne
for 0.6 GeV threshold are plottei together with the theoretical predictions. The correction factor was taken equal to unity /for 140 m from shower core/ in accordance with recent estimation baaed of calculations of Olejniczak /1975 PhD thesis, University of Lodz/. 4. The shape of the distribution of the muon densities. Recently it hsa been pointed out by Elbert et al./1976/ that a relatively wide fluctuations can be also obtained for heavy primaries when small admixture of protone is added. In that case, due to the fact that proton initiated showers at sea level are clearly larger for the same primary energy, approximately equal contribution from both groups of showers ia obtained and large fluctuations aroae as result o*" the difference in the mean densities of muons in the both groups. In this сазе however different shape of the distribution of muon densities should be expected. ,
Some of the obtained in the present work distributions are given in figure 5. Both the histograms and the evaluated muon denaity distributions are given in the figure. Detailed consideration shows that the smooth distributions postulated in the present analysis relatively well describe the obtained histograms. That

so
R=120m
N = 5.7*10-
го m
20 in
го m Tho h i^ tn i ' i an;<= of t h e r e . ' i s t c r c d mucin d e n s i t y f o r e n e r g y t l u e : l iolo IS •= 5.G GeV a t f i x e d d i s t a n c e and c o i i s t i n t s i z " . FulTt H I K I F «-how a c t u a l d e n s i t y s p e c t r u m , ivlrioli li.-ivf li i ' tn assumed In i 'or of snnirin d i s t r i b u t i o n .

51
fact indicate that fluctuations are either due to relatively pure proton composition or result from supperposition of particles with various masses. The composition based on predominantly very heavy particles with small admixture of protons would generate a distribution which would have less regular behaviour. Quantitative analysis of this problem will be publish elswhere. 5. Conclusions. The muon fluctuations measured at relatively large distance from shower core appears to be rather wide. The obtained results which rule out pure heavy primaries give support to the hipotheeie.that the primary cosmic ray at energies around 10'' - 10lD eV have the mass composition of similar character as that observed at lower energies. The pure proton flux also is not excluded here, although the fluctuations appear to be large even for the case of high multiplicity model. It is however possible that the correction of the effect due to the mentioned earlier negative correlation is still underestimated.
The histogram showing the distribution of showers with various muon densities although wide /due to large development fluctuations/ are rather compact. They do not show significant tails towards the high densities which could be expected in the case of large spread of the primary mass.
References. de Beer J.F., Holyoak. В., Oda H., Wdowczyk J. and
Wolfendale A.W., 1968, J.Phys.A.Gen.Phye.1, 72-81. Dzikowski et al., 1977» J.Phys., /in the press/. Elbert J.W., Mason G.W., Morrison J. and Narasimha'm, 1976.
J .Phys. G. ,Nucl.Phys.2,291-98t. Firkowski B. et al., 1965, 9th Int.Con?.on Cosmic Rays,
London, 676-7. •awin J., 1965, 9th Int.Conf.on Cosmic Rays, London, 639-641. Vernov S.N. et al., 1965, 9th Int.Conf.on Cosmic Rays,
London, 769-71.

М 18ооо9& 52
LATERAL DISTRIBUTION OF ELECTRONS IN EAS WITH Ne^.2.105
E.N.Alexeyev.A.E.ChudaJtov.A.E.Danshin.M.D.Galperin. P.Ya.Glemba,A.S.Lidv8nsky,Yu.R.Sulla-Petrovsky,B.B.Tatian, V.A,Tizengausen
Institute for nuclear Research,Academy of Sciences, Moscow,USSR
C-.B.Khristiansen,G.V.Euliiov,V.P.Sulakov Moscow University,USSR
The results of measurement of particles fluxes in EAS for two ranges of distances from the axis (1+15 m and 20+ 45 m) are presented.Scintillators and Geiger-Muller counters were used.The main feature of experimental array is rather high precision of core location using central detector of 200 m area. The altitude of observation is 1700 m.a.s.1.(840 g/cm ).The average of parameter s is found to be 1.1 .
1. Introduction» One of the main characteristics of EAS is the lateral distribution function.it was measured in many experiments at different altitudes and using different methods* Nevertheless,the data of different groups often contradict each other (Stamenov, 1975) and the mean value of age parameter s is not measured with sufficient precision.In this ex-perement at least the core location was made with high precision due to very big amount of detectors (400) in the central array.Also large area scintillators at distances 50 and 40 m provided relatively good accuracy in density measurement. 2. Experimental. 400 liquid scintillators are arranged in horizontal square 14x14 m .This main part of array,conventionally called the "Carpet",is surrounded by б outward detectors. Four of them are placed at 30 m from the center of Carpet in the direction of its diagonals and the remaining two are near the axis of array at 40 m from the center.All this outward detectors contain the same set of G-M counters of three different areas and also 18 standard scintillators (total area in each detector 9 m ).The signals of scintillators of each detector are summarized.The detailes of experimental arrangement were described already (Alexeyev et al,1975)«Two additional G-M trays were installed for this particular experiment.They are placed on the roof of the building near the center of the array,10 m higher the Carpet level.These trays contain 48 counters of area 21 cm each and 48 counters of area 100 cm each. 3. The data processing and showers selection. The standard procedure was beginning with determination of the angles of

53 shower arrival direction using delays of outward detectors signals relative to central fast plastic scintillator.The showers with zenith angle 0<5O° were included in further analysis.For the core location at first only data from 400 central detectors were used.Experimental data were fitted by the Nishimura-Kamata-Greisen function using the least squares method.Also the shower size N.. and the age parameter s. was determined (the parameter 8.. is essentially shifted from real one by transition effects). The computer program of core location was checked by visual scanning of individual pictures. For s,, < 1.5 the computer core and visual core usually coincides. For s,. > 1.5 a considerable part of events had a wrong computer core location and were rejected by visual scanning. Only those showers which had core inside the central array were finally included into analysis. The data of scintillators of outward detectors were used to determine the shower size He. Then all scintillators and G-M counters densities were normalized to this He and were used for averaged lateral distribution function. Except the age of central part s.. another individual shower age s 2 was determined. As outward scintillators data are not sufficient in our case for individual ages measurement,one value (at 6 m) was used from the central Carpet data for this s_ calculation. After all a showers with sizes Ne>2.10? were selected.
4. Results. Flg.1 presents two examples of individual lateral distribution functions,very young shower and rather old one in their central part. Fig.2 gives distributions of s* and s» and fig.2 - the correlation between these two ages. One can think that fluctuations value in this last figure corresponds to real physical fluctuations in EAS, i.e. individual distribution functions are not the ones of single electron-photon cascade, but now we are rather careful about this conclusion , for additional analysis of both ages dispersions is needed. Fig.4 shows average late-raj, distribution functions
•) The number of events,for which s' visual core location was of some doubt,did not exceed Beveral per cent.
tf
Ъ: C=XL (_1_1
C O L-LJ
1
z L U e r f
; ? i
*
:
! _
. Ue-Ш S,- 0.56 : г. Ne=tflOs S,-;.I2 •
° SCINTILLATOR * G-M COONTEK '
0 • о :
о ~ 0
X * п m' 0 - 0
\ % •
s •
- ID"
2 5 10 20 50 DISTANCE FGOM M CORE ( M )

54
во 60
40
20
i i i i i
i
• гП L Л Г ' j
i i 1 1
1 Т 1 ! I I
— s, ; 1 02
1—1
_ • ~ ,
i
, t—£=fc=a—
Q5 0? 03 Mg.2
. OB
1.1 L3 1.5 S OA
т—i—i—i—i—i—i—i—i—r
л»
i l_
Fig.3 10 12 £4 S.
" SCINTILLATORS
лв-мштк - NK6 FUNCTION
as measured by scintillators and G-M counters. One can see from fig.4 that scintillators data do not allow to approximate lateral distribution for the whole range of distances by the function of single age. The best value for outward detectors is 1.0 while the data of the Carpet gives e= 0.82. Obviously, such a difference is connected with the presence of transition effect depending on the distance in the scintillators and the roof of the building where central part of array is placed (average roof thickness - 21 g/cm* of concrete). This is proved by the fact, that the same function for the data of G-M counters is approximated by the function with one age, s = 1.1 for all distances. Direct measurement of transition effect was also made end fig.? presents scintillator to Geiger ratio as a function of distance from the core. From two last figures we can conclude that transition effects are very important in our case. In small distances range the mean shift of shower age due to roof and scintillators
DISTANCE
Fig.4

55
s
i ого £ u>
& EM
i
' •
f
I i
1 . 1 1 1 1 1
•
.
$44$
i • i i
2 - 5 » Я 30 DISTANCE F80M THE Ш Е (M)
H.g.5 References
isus = 0.3 . For another range of distances 20 • 45 m, transition effect in scintillators gives As = 0.1 . Taking into account this correction we shall have scintillators and G-M counters ages coincident and average value е = 1.10 . This conclusion is in agreement with data,obtained at Horikura.but in disagreement with the results of Tian-Shan station (see Stamenov. 1975).
1. J.N.Stamenov.Izvestia Academii Sauk , serija phis. 1975,52.4201
2. E.H.Alexeyev,P.Ya.Glemba,A.S.Iiidvansky et al. Int.Conf. on Cosmic Bays. liunchen, 1975* Conf. Papers,v.8,p.2996.

56
STRUCTURE OP THE CENTRAL PART OP EAS WITH He > 2 .105
E.N.Alexeyev, A.E.Chudakov, M.D.Galperin, P.Ya.Glemba, D.D.Jappuyev, A.S .Lidvansky, Yu .R.Sul la -Petrovsky , B .B .Tat ian , V.A.Tizengausen
I n s t i t u t e for Huclear Research, Academy of S c i e n c e s , Moscow, USSR G.B.Khris t iansen , G.VVKulikov, V.P.Sulakov
Moscow U n i v e r s i t y , USSR G.Havarra
Laboratory of Совгао-Geophysics, Turin, Italy 2
Using 400-channel scintillator detector of 200 m area the search was carried out of showers with multiple cores. Several examples of multicore events are presented with the estimation of minimum transverse momenta. The data concerning lateral distribution function at small distances f"om the core are also presented. The radius of flattening of this function is of order 0.8 m.
1. Introduction. The study of lateral structure of EAS near the core can give information about both components of shower: nuclear and electron-photon cascades. Two problems especially will attract our attention in this paper: 1) investigation of flattening of lateral distribution at distances about 1 m from the core, when behaviour of this function is well known at larger distances, and 2) anomalous structures in the distances range of 1 4- 10 m, multicore events and transverse momenta of high energy hadrons initiating sub-cores which can be distinguished. 2. Experimental. Detailed description of experimental arrangement was given earlier (Alexeyev et al, 1974). Standard procedure of shower parameters determination and selection of the showers is described in another paper of this volume (Alexeyev et al, 1977). Por the analysis of present paper only the data of central part of EAS array were used. This part, the so-called "Carpet", consists of 400 2 liquid scintillators, arranged in horizontal square 14x14 m . Each scintillator has the threshold of registration 10 re-la tivietic particles.Density of particles is measured in logarithmic scale with constant step of 25%, so for given digital output the particle density о (per detector) is:
10 x (1.25)3~1 <J> ^ 1 0 x(1.25) Por the conclusions concerning lateral structure of EAS question about the accuracy of such density measurement is very important. There are several origins of errors in this measurements. After checking some of them experimentally the total dispersion of density measurement for individual average detector is assumed in a form:

57
(у/л= (соы5)\ (.4.„-3)л+ &"*;% 1 /A -St r I"2 I 3 (~z-*R3Sj + - ;
(1) x i r: u. D L/ / -г
f The first two terms represent the dispersions in calibration curves for individual detectors, including both errors in initial adjustment and drift of parameters during the experiment. The first one corresponds to deviations of thresholds, the second to deviations of elopes of logarithmic amplitude-time convertors. Numerical values in these terms were obtained experimentally. The next terms correspond respectively to the dispersions caused by the finite size of logarithmic step, the finite size of individual detector (0.7 m) *f and Poisso-nian fluctuations. In wide range of densities (50-^^^5000) and for distances from the axis r > 3 ш the sum (1) is approximately constant and &г/р~\1&>. There is an increase of this dispersion for lowest densities due to Foissonian term and for highest densities due to term 2 (dispersion of slopes). Practically, for showers with size 105<Ne < 10° for r > 3 m one can use a distribution of errors for a single detector as a Gaussian with the standard deviation *Jyp = 14%. For the core itself it is better to use not differential but integral measure, i.e. the number of particles inside a circle of radius r, or a summarized signal from several detectors, included in the core. -\. Data analysis and results. It is well known that lateral distribution near the core must become flatter than Hishimura-Kamata function because of the finite energy of initial photons and nuclear scattering. In order to determine the radius of this flattening following method was used. We calculated for each shower the normalized central density A e x n ^ four scintillators with maximum aplitudes Ле^*^2 fi . Corresponding value .Д theor w a s cal~ culated as function of S., for the circle of equivalent radius 7Г Hf= 4.(0.7)2 using NKG-function. It was demonstrated that
difference between Д -theot for circle and in real geometry, depending on core position, fluctuates only into tho limits of + 10%. Pig.1 presents relation A exp/ A theor ox 2 6° showers. Solid lines correspond to calculation of ^ as A t b e o v with different radii of flattening. It is clear that 0.8 m gives better correlation with experimental data *) The error' in core position is assumed +0.35 m. S.-parame-ter of lateral structure of individual shower obtained from the Carpet data. N1 is shower size, corresponding to this S^.

58 than 0.4 m and 1.2 m. It Is interesting that there are several showers with sharp poles near the axis. Relation
/ Д theor i s Лео Antffli
06
02
4 Z I H » . i™.«-jf (i.ntntjn very near for these events to that of Niehinura-Kamata function for infinite energy. By dividing the data of ?ig.l into groups with different shower sizes no dependence of flattening on shower size wee found. It вееше that thie.reeul* Sontraaict to xne ata of Sydney group (Bakich et al, 1970) about the increase with He- of percentage of showers satisfying to the criterium
f/fz ^ 1«5 "bat can mean increase of flattening with shower size. In Table 1 the results of the analysis of our data according to the criterium of Sydney group are presented . Table 1
W.g.1
tie
number of EAS
^ 1 . 5 » )
2.105
260
67+6
4.105
98
65+10
6.105
42
79+15
106
10
70+30
There is no dependence on He in the limits of statistical errors. It means that lateral distribution near the core' is not changed in our range of Ne. Another type of analysis, which was made, was a search for well resolved aubcores. For this purpose a special formal procedure was used: we have called a core (or subcorej an isolated group of scintillators which are touched each other at least by the corners. The amplitudes of them ehould satisfy following conditions: 1) The minimum one from them is strictly bigger than any amplitude of surrounding scintillators not belonging to the group. 2) The number of scintillators into the group should not be less than three, i.e. only correlated outstanding amplitudes are considered. 3) Being bigger than three, the number of scintillators inside the core should be the minimum one from all possible. It means that beginning from the naximum amplitude either in the whole Carpet or into a certain local area one must add to this particular scintillator several surrounding

59
acintillatore, but atop immediately when conditions 1,2 are eatiefied. Only eubooree with J>Sltg %, 100 ( J B , W » 1 0 ) were included in analysis. From figures 3-6 one can see how subcores found by this procedure are looking in real showers. For each subcore the_value of relative average density
Tsui - f3Urr iiag determlned. Heee y c o r e 'core is the шеей particle density of the_main shower core and J> eurr is an
average density ln the •layer of scintillators, surrounding subcore, which is accepted as rough estimate of background. Fig.2 shows the percentage of multicore events, determined by procedure described above, as the function of He for different values of E. Presented curves are integral for He. Observed decreasing of the fraction of multicore events can be
/c
40
30
/0
0
- I a CM
- ^
1. И > 0.05 2. W. *- 0. i
4.k*0.i
^^X^-^ i i T r — i — i — i —
1.0 15 2A i.8 5.9 ~b/ "V Fig. 2 "superposition nodel" is valid, i.e. a big shower can be constructed by superposition of smaller ones. In this case the increaee of number of subcores with a given absolute energy at a given distance from the core
6 7 с p. :(
7 7 В 9 7 10 ; r '4 : : •s л
I 14 1С ч icf
7 9 9 1С П 12 8 8 9 9 1С II
6 7 8 1С 1С 13 14 12 I .
6 9 i r II i i i :
15 Г6 14 13 r2 ГЗ
. i .4 П 14
' II 12 H' . :: :з v.: I '5 U I:.
> If 14 14 2TJI? 14
JI7 IS 14 ' 1С H 15
15 « 13. 13 12 13 13 12 !3 и :: :t ::• i i и !3 If 1С Ii Ii 9 ',' 9 IS
7 7 3 2 3 5 4 3 5 1 г
Г 13 12 :.'. гя и Г II I I к u i. 14 ГЗ 71 13 13 12 и it r: ::io i г гз и i: i: 7 о 3 гз и 13 1С 13 12 12 XI 12 12 1С I" II II S 6 tO
9 I (
I I 9 : i : 9 • 12 in '
9
!I I I 9 12 9 I I 9 9
3 4 3 3 ) .3 I
56354
1 (. r
4 2 7 9 . 1 4 7 G 5 G 5 5 3 3 3 3 3 3 0 2 2 4 2 4 G 6 6 7 & 7 6 G 5 4 4 4 4 9 3 0
7 5 f. G 5 6 7 4 5 3 9 В Й 4 7 9 7 5 4 2
5 5 5 6 9
3 7 G 7 6
> 6 in, 12 1 i r '22 13 i 9 IS,Id
4 1 4 4 4 5 7 5 5 7 7 7 5 6 < l "
4 3 5 7 G G 5 G 5
3 3 I О П
3 4 ?. О П ' J C 5 7 7 5 G 5 - C
5 4 6 4 5 4 6 9 0 9 4 0 4 5 3 3 2 2
6 7 7 а С ', 9 t '
9 0 8 5 0 6 3 5 8 9 8 I 2 2 Г • е 7 7 о с о р г
4 G 3 5 4 О Л О
3 Г р /1 П Г
7 5 5 7 6 7 7 5 7 3 7 7
4 0 0 3 Г 3
Fig.3 Fig. 4

60
Р Г 3 1 4 ?
С 4 5 С С I 4 3 3 7 f,
6 6 8 9 !2 4 7 9 12 ТЗ Б 7 3 :? J2 6 8 К [Ч|Т^ R '.' ? :: if. 7 I? 9 I.: 14 7 а э :г i ;
ti i с б 8 В
:г !''
п '3 ' •> is :
р: 1 Т4 I
з г « е, ? 7 9 9 тг J; 0 5 7 6 5 В Л 7 0 ^
7 i ; s 7 7 7 е 4 $ П 1 5 2 2 2 4 0 5 С 71ГГ С «
1 G 5 б 5 О 5 6(:n : r j 7
л ^ О S С 4 6 4
9 9 Э 7 7 6 3 4 П З 7 7 5 7 F i I F S 4 7 6 5 4 2 4 0 6 ? £ ? 7 I' 1 Г ТГ 9 О Г, 5 4 3 9 6 6 n ? r ' f, 4 ' ;r ;p 6 3 5 3 3 6 7 5 G 1С ? .1 4 f-I 1Г II -Г- С 4 4 3 3 7 0 7 7 С 9 : Г 1Г ТГ- В 7 fi 4 4 Г, 2 С Б 7 f 7 6 9 ; : тг 8 fi б 6 а в 4 б 4 ? 7 е 7
Р, 9 7 6 7 7 S 3 7 G 9 3 7
7 1 4 Г ; г 1С
ш--
р I--. !- : :
.:'£:?• :: :: в »
Г. 1' Г J С 3 2 Г Г- С С
•' С С С С G
Pig .5 Pig . 6
overcompensated by decrease of the amplitude of those subcores relative to the regular density at this distance. Therefore the structure of showers has a tendency to become more regular in relative scale when the size increases (if only there is no drastic increase of transverse momenta in high energy collisions).
Pig.3-6 represents four examples of multicore events. For some of them (Pig.3»4) to determine, which from the cores is the main one, is practically impossible. Events, having well distinguished subcore of much less size than main core, are more typical, however (Pig.5). There are also a few showers of extremely complicated lateral structure (Pig.6). Using cascade curve in core approximation for the circle of radius 0,8 m an estimate was made of minimum transverse momentum values for showers of Fig.3»4,5. These values are 8 fiev/c, 19 Gev/c, 21 Gev/c respectively. 4. Conclusions. 1. The flattening of the lateral distribu-tion near the core has effective radius 0.8 to and at first approximation does not depend on the age parameter and shower size. 2. There is no evidence of increasing of fraction of multicore events with shower size in the range 1Q5 .< jfe < 10 . 3. The multicore events exist and in several per cent of total number of showers give a strong evidence of existence of transverse mooenta <~ 20 Gev/c. However, one can not prove that such a big Pi correspond to a single particle. Probably big subcores are initiated by a narrow groups of particles with big total transverse momenta, the so-called jets.

61
References
1. E.N.Alexeyev, V.V.Alexeyenko, A.V.Voevodeky et al. Izvestia Academli Nauk, serija phiz. 38, 1097 (1974).
2. E.N.Alexeyev, A.E.Chudakov, A.B.Danahin et al. Present Conference paper, 1977.
3. Bakicb A.M., McOuaker C.B.A. and Winn M.M. J. Phya. A., 2J. 662 (1970).

62 LOW-ENERGY NUCLEAR-ACTIVE PARTICLES IN EXTENDED
AIR SHO'.VERS (EAS) Apshev S.Zh., Tzagova L.Z., NikolskiJ S.I., Stamenov Y.N., Kostin A,I., Binogerov A.Ch.
We have carried out an experimental research of low-energy nuclear-active component of extended air showers with a number of particles N = 5.103 f 5«105.
The experiment has been made at the altitude of 1850 meters above the sea level in Elbrus Laboratory of Cosmic Rays. The experimental plant consists of V/ilson cloud chamber /1-2/ placed in magnetic field and hodoscopic unit, connected to each other by means of common control system. Wilson cloud chamber contains two independent operating volumes, each of them having dimensions 230 x 150 z 110 mm and
о effective area S = 0.02 m . For plant description see /"4 A 40 g.cm of copper, which corresponds to 0.3 of nuclear interaction path, are inserted between these volumes. Wilson cloud chamber is mounted in the center of the plant and intended for observation of EAS adrons and copper atomic nucleus interaction. The plant makes it possible to determine particle motion direction as well as the energy and character of EAS adron component. Magnetic-field intensity is 4300 with heterogeneity not more than 5%. Maximum measurable pulse is 6 д •.
The shower section of the plant consists of 4 hodoscopic points for recording the density of charged particle flux: 3 peripheral points located at the angles of equilateral triangle at a distance of 15 meters from the center of the plant, and one central point mounted right above Wilson cloud chamber. The sets of gas-discharge counters type СИ-51 serve as detectors. Each set consists of 20 counters included into 20 hodoscopic channels. The total area of one set is й •= 0.66 m . The central flux density recording point consists of 20 detectors.

The central detector, besides large counters (S = 330 cm ) ,also :ontains 20 counters, eacr of them having the effective area 40 cm .
The hodoscope and Wilson cloud chamber are controlled under condi-;ions of simulatneous operation of 5 counter sets. Pour counter sets ire spaced at a distance of 2 meters from each other and located near ;he center of the plant. The effective area of each one of 4 sets .s 0.4 m2.
The fifth set is located in the magnet clearance under Wilson cloud :hamber end consists of 6 counters type СИ-7Г , each of them having
о ;he effective area 15 cur. The output signal is generated in this jet under conditions of simultaneous operation of not less than 2 :harmels. A compounded filter consisting of lead (4 cm.) and alumi-lium (14 cm.) is placed above Y/ilson cloud chamber to screen the latter 'rom shower electrons.
The data of 4534 hours of plant operation effective time is shown л the present article. For this period the interactions of more :han 300 adrons in EAS have been registered under conditions of energy >elow 10
In order to study the charge and energy relation of nuclear-active articles we have selected 147 interactions in the clearance between he chamber volumes fromm all registered ones. In 140 cases of inter-ctions in copper plate in the above said clearance it could be possibl< о determine reliably the type of adron (neutral or charged), which aused the interaction. No conclusion could be made about the character of 7 nuclear-active
articles. Adron pulses have been mensured by the curvature of rajectory of secondary particles. It has been supposed that all econdary particles consist of Я"-mesons, taking into account the part f energy transmitted to ^"-mesons. In particular cases of interaction the energy of primary nuclear-
ctive particles has been measured directly by the curvature of their rajectories in magnetic field. For each particular case of inter-

64
action it could be possible to determine the axis position and the
full number of corresponding shower particles. The axis positional
accuracy is 5 m, and the particles full number accuracy is 40$.
All registered extended air showers have been divided into three
groups in accordance with a number of electrons:
1. 104 <£. H <i З.Ю 4
2. 3.104^ N < 10^ 3. 1 0 5 ^ H ^ З.Ю 5
For each group of showers the integral energetic spectra both for neutral nuclear-active particles and full number of adrons are shown in Pig. 1. The relative densities of nuclear-active particles are pi on X-axis, and the energies of nuclear-active particles - on Y-axis. It can be seen that spectra take the form of A- .
Pig. 2 shows the experimental data in accordance with relative number of nuclear-active particles defined by, averaged density in the circle of 15 m in radius. The results show that the number of nuclear-active particles is proportional to H for showers with powe.
more than 10 . Absolute fluxes of^nuclear-active particles are not shown here,
because the effectiveness of shower registration and axis locatiion were not taken into account.
Analysis of data obtained allows to determine the charge relation of nuclear-active particles of different energies. Relation values of neutral adrons to the full number of particles under conditions of energy Е > 1 Gev are shown in Table 1.
This data speaks well for the fact that the main flux of electron is composed of neutrons.

65
Table 1
К
n° n°+n ±
104 *• З . Ю 4
0.70 ± 0,021
3.104 * 105
0.72 1 0.019
105 t З .Ю 5
0.70 + °.07
BIBLIOGRAPHY:
1. Mandzhavidze Z.Zh., Chikovani G.E. "Instruments and methods of experiment".
2. Apshev S.Zh. Dissertation. KBGU. 3. Stamenov Y.N. "Preprint", no. 105, FIAH, M (1971). 4. Apshev S.Zh., Bridenko I.I., Stamenov Y.N., Tzagova L.Z.
Publications of Academy of Sciences, USSR, Physical series, v. 38, No. 5 (1974).

66
1.0 2.0 E(&eV) Fig„ 1. Integral energetic spectra of low-energy adrons in EAS:
1 - 10ч ^ И -С 3.10 2 3 - 105<? N ^ З.Ю 5
White circles -• neutral adrons Black circles - all adrons
3.104-£ 10'

10* -Ю'- -"е Fig . 2. Relative«number of nuclear-act ive p a r t i c l e s in EAS at
the a l t i t u d e of 1850 m above the eea l e v e l .

68
THE 54 m' SPARK- CHAMBER ARRAY AT MT. MORIKURA FOR THE FUNDAMENTAL STUDY OF THE AIR SHOWER
S. Kino Department of physics, Osaka City University, Osaka.
T. Kitajima and N. Nil Department of physics, Ashikaga Institute of technology, Ashikaga.
S. Dake, H. Oda and T. Nakatsuka Department of physics, Kobe University, Kobe.
T. Sugihara College of Liberal Arts, Kobe University, Kobe.
M. Kusunose and H. Sasaki Department of phyics, Kochi University, Kochi.
K. Jitsuno, Y. Nakanishi, K. Nishikawa» N. Ohmori, M. Sakata, Y. Yamamoto and T. Yura
Department of physics Konan University, Kobe. T. Yanagita
Department of Applied Mathematics, Faculty of Engineering, Osaka University, Osaka.
Y. Hatano Cosmic Ray Laboratory, Tokyo University, Tanashi, Tokyo.
A new air shower observation system was constructed at Mt. Norikura (739 gem"2) and was entered into the operation of the observation since July, 1976. The first results are reported in this Conference. In this paper, we want to report mainly the following two points; (1) A brief outline of the 54 m 2 spark-chamber array which gives a special feature to the new air shower observation system. (2) A weak point of the glass-glass type spark-chamber, so called "bald phenomenon", is settled easily by that the humidity of the spark-chamber circumference keeps more than ^ 60 %.
I. Mt. Korikura air shower observation system "Mark-I" The new observation system is composed of the following four parts. *" For the observation of the charged shower particles(mainly low energy
electrons); (1) Fundamental equipment-I
Free arrangement.of 100 channels scintillation counters (each 50 cm x 50 cm x 3 cm plastic-made unit). Be intended to Increase 1 m counters in future.
(2) Fundamental equipment-II Fixed arrangement of 160 spark-chambers covering 9 m x 6 m area ( be explained in detail afterwards).
* Гог the preliminary observation of the muons fn each shower; (3) Equipment for the preliminary observation of the muon component.
3 stations of the free arrangement? which are composed of ^ 300 channels proportional counters (each 2,5 m x 10 cm x 5 cm, Al-made, RR-gas-flowing type unit) and absorbers of 10 ton Pb and 100 ton concrete blocks.
* In addition to the above three equipments, as a recording system of (1) and (2); (4) MCS (Micro Computer System) which is also provided with the monitoring of
the detectors. Though our CAOS-group (a common name) calls the whole observation system
mentioned above "Norikura Mark-I" we want to introduce an outline of the (2) which gives a special feature to the "Mark-I" in the following.

69
2_. The- 54 m 2 spark-chamber array and its driving system A unit sp.-ch. (spark-chamber) of the array is the same type which is invented by Fukui and Miyamoto (*) and developed by Tokyo INS-group (2) . It is a Ne-gas-enclosed glass-glass type with 50 cm x 50 cm x 1.7 cm (W.xD.xH.) dimensions. The structure of this sp.-ch. is shown in Fig.l. Up to 'v- 10 3 spark spots/0.25 m 2
can be discriminated by this sp.-ch.
•JIIT г^ТкЙ
Fig. 2. Schematic drawing of the 54 m spark-chamber array.
glw ~^-f| FT •2~M-
•- -A p 7 ? -Г ^fl5-Fig. 1. The structure of a unit
spark-chamber.
The array is composed of 160 sp.-chs. which cover the floor space of 6 m x 9 m in a electromagnetic shielded dark room. The photographs of such 54 m 2
sp.-ch. array are taken by remorte controled eight cameras. Such appearance is schematically shown in Fig.2.
In addition to the sp.-ch. array, the dark room is also provided with the equipments (two stations which are composed of some narrow gap and wide gap glass-glass type sp.-chs.) which are used to observe the arrival direction of the air shower and, further, is also provided with the driving circuits and • some accessories. But, they are omitted in Fig.2 because of simplicity. Please refer to Fig.3 and the following in respect to them.
Next, a block diagram of the driving system of this array is shown in Fig.3. The driving system is composed of the following four parts. They are, [I] Common system, [2] Sp.-ch.-driving system, [3] Camera-control system and [4] Illuminating-display-driving system. Each contents are the following (the number in ( ) correspond to those in Fig.3). [1] Common system
(1) Trigger pulse from the fundamental equipment-I which passes through the trigger condition.
(2) Receiving cct.(circuit) of the trigger pulse, Gate cct. which can institute the voluntary dead time of the whole sp.-ch. system, Counting cct. of the total operated time and Distributing cct. of the various pulses.
(3) Receiving box (Fe-made) for the concentration of the various pulses going to the sp.-ch. room.

70
Щ ж Пр 110 \Ц^цнк г - Ц 1—1 |—1
-Н« р Ч-1 i—i л 1 7 -4- « -1 1 , 1 1~Г~
1 » 1 f-i
п 6 Н г ( 1 1 1 I 1 J 1 Г ' i i—i г - —i i
" Ч 8 R I | l_-_l Ifi | 5 | ,-J-, ! ± . " Ы 1 -1 1 JJ
А Г L Т 1 . м ' _ _ . _ -
* Г 1 Т 1 . л Г",1аИ»
1Я:Я:,-,
«А ч s T ^ L
^ Ч1
27 ; ! £л Ч
—т—Г «i н J ; 1^2spi^2uf i
1и| Зш 33 34 35 36 37 38 34 40
Fig. 3. Driving system of the 54 m spark-chamber array.
[2] Sp.-ch.-driving system (4) Trigger cct. of the large-sized H-thyratron-2G22P (or small-sized
H-thyratron-lG45P cct.). One 1G45P drives the four 2G22P. (5) Power supply for the (4). (6) Trigger cct.-No.1 of the spark-gap cct.(or large-sized H-thyratron-
2G22P cct.). Two 2G22P drives the eight spark-gaps. (7) Power supply for the (6). (8) Trigger cct.-No 2 of the spark-gaps. Its contents are the same'in the
(6). (9) Power supply for the (8). (10) Power supply for the (11) ъ (19), (28) and (29). This supplies them
with 23 KV. (11) >v> (26) Spark-gap cct. One spark-gap drive the eight or twelve unit
sp.-chs. with 23 KV-A-150 ns decay constant-pulse. (27) 160 ap.-chs. array. (28),(29) Marx-generator cct. for the wide gap glass-glass sp.-chs. of the
(30) and (31). (30),(31) Small systems of the some narrow gap and wide gap glass-glass
sp.-chs. which are used to observe the arrival direction of the air shower.
[3] Camera-control system (32) Camera-control cct.-No.1 for the (33) •<. (44). (33) "\< (44) Eight X-ray cameras (Cannon-made) which take tne photographs of
the (27). (41) Camera-control cct.-No.2 for the (42) and (43).

Plate 1. An example of spark photograph of the air shower core which wa,; observed hy the 54 m2 sp.-ch. array.

72
(42),(43) Two X-ray cameras (Cannon-made) which take the photograph of the (30) and (31).
[4] Illuminating-display-driving system (44) Trigger-code pulse from the trigger-loslc cct. (45) Centering cct. of the various data (standard time of the whole system,
event-number and trigger-code) except those of the air shower, Monitor-ing-display cct. of their data and Distributing cct. of their data to the various systems.
(46) Transmitting cr.t. of the data of (45) to the (48) ъ (51). (47) Illuminating-displays-control cct. and their power supply. (48) % (51) Illuminating-display-equipment of the data of (45). (52) Various controlled illuminations in the sp.-ch. room. (53) Position-display-illuminations for the array. The overall delay time of the above system [1] + [2] from the trigger
pulse to the sp.-ch. firing is VL50 nsec. And various system are completly protected from the noises of the sp.-ch. system.
Lastly, an example of the photograph of the air shower core (be closed double core) which was obtained by the 54 m2 sp.-ch. array is shown in Plate 1.
3. On the "bald phenomenon" of the spark-chamber. Тле glass-glass type sp.-ch. has a weak point for detection of the multiple charged shower particles. It is phenomenon that no spark spot region appears in the central part of each sp.-ch. when the time interval of the shower events is short. A photograph showing this phenomenon Is given, as an example, in Plate2. This phenomenon is called the "bald phenomenon" because its appearance resembles a bald head. This phenomenon Is considered to be due to an effect that the intensity of electric field Is decreased by residual ions of the last event. Accordingly, the dead time of 10 *ъ 30 minutes has been required for the observation of the multiple charged shower particles.
Well, we found out a very easy method to remove this defect, i.e. it is enough to keep the humidity of the sp.-ch. room more than ^60 %. The humidity dependence of the rate of "bald" sp.-chs. is shown in Fig.4. The abscissa indicates the relative humidity of the sp.-ch..room and the ordinate the ratio of the number of sp.-chs. showing the "bold phenomena" to the twenty sp.-chs. used in this experiment. The parameter "t" indicates the time Interval between shower events. The "bald phenomenon" is
1
3 b t i 5 • \
i*- »-- ." zL
Plate 2. An example of the "bald phenomenon" of the spark-chamber.
P.Ut.v. Uum^.tr of ttw
Fig. 4. The humidity dependence of rate of the "bald phenomenon".

73
practically negligible, independent of the time internal "t", for the room humidity greater than MiO %. This result leads to an inference that the increase of surface conductivity of external side of the glass due to humidity rise plays the same role as well as the direct clr -nlng electric field.
In order to examine the above inference, we tried to remove the "bald phenomenon" by another method, i.e. we coated the conductive paint to the external surface of the glass. A positive effect was ob-ained. The sp.-ch. through such process, which is located at right under corner in the Plate 2, does not show the ''bald phenomenon".
We are under examination to find out the better method between the above two methods. . The method will be practically chosen from a viewpoint of easy maintenance of the array.
4. References. V1) S. Fukui and S. Miyamoto, Nuovo Cimento, 11, 113 (1959). C2) M. Nagano and S. Shibata, J. Phys. Soc. Japan, 20, 685 (1965).

74 THE FLUCTUATION OF tLECTRON DENSITY AT R>20m FROM EAS CORE
1 2 2 3 <4 5 Hatano Y., Kitajima Т., Nii N., Yanagita Т., Yura Т., Dake S., 5 5 6 7 7
Nakatsuka Т., Oda H., Sugihara Т., Kusunose M., Sasaki H., Jitsuno K., Nakanishi Y., Ohmori N., Sakata M., Yamamoto Y.,
9 and Kino S. 'Cosmic Ray Laboratory, University of Tokyo, Tokyo department of Physics, Ashikaga Institute of Technology, Ashikaga 'Faculty of Engneering Science, Osaka University, Osaka '•Hanayamahigashi, Kita-ku, Kobe department of Physics, Kobe University, Kobe ••College of Liberal Arts, Kobe University, Kobe 'Department of Physics, Kochi University, Kochi department of Physics, Konan University, Kobe department of Physics, Osaka City University,.Osaka
The fluctuation of EAS electron density at a distance gr jter than 20m from the core was investigated at Mt.Morikura (738 gem-2) in summer 1976, using 100 scintillation counters (each 0.25m2 unit) and 54m2 spark chambers array. About 200 showers were analyzed and the fluctuation in response of scintillation counter was compared with that of spark chamber for each events.
1.INTRODUCTION This experiment was performed in order to know the fluctuation of electron density at distance greater than 20m from the EAS core, and also to calibrate the scintillation counters, in summer 1976 pre-ceeding to series of experiments firstly concern to lateral structure which are intended to reconstruct the phenomelogy of extensive air shower.1' 2.EXPERIMENTAL At about 30m from the center of shower array, spark chambers with total area of 54 Decomposed of 160 units (each 50x50cm) were set, and closely packed 40 scintillation counters (each 50x50x3.5cm unit) were arranged just under spark as is shown in figure 1. Figure 2 shows a cross section of spark chamber area. The other 60 scintillation counters were arra-

75 nged within a circle of radius, 60m. Whole EAS array and spark chamber have
1) 2) been described in detail elsewhere." ' The response of scintillation counter was calibrated by L.E.D.light pulser of 10ns width,$' and each counter was monitored by PHA and a rate meter regularly. The array was triggered by 4-fold coincidence of scintillation counters when each counter is hit by more than 30 particles. This experiment was perfomed for a week. 3. ANALYSIS PROCEDURE Firstly, the response of scintillation counters was corrected for the gain all over, (not for the linearity of logarithmic conversion if there was any change). In order to avoid the fluctuation caused by active components of core region and the inclination of density distribution because of not point but some extended counters, we restricted to the data whose core is located at a dis-Spark Ch. qtaSS 089Cm tance 9 r e a t e r than 20m- Neverthe-
•г
* At 0.5A CJ'CITI less, the slope of density d i s t r i -
I r e l .U Cj-CIT) bution was so steep that the
FIGURE 1
• scint. л/
FIGURE г trig.scint. * spark ch. 4 .. • • • . v о
• о • • • a:
10m

76 remarkable inclination of density was observed at the spark chamber aera. In order to cancel-! out this effect of inclination, the data was fitted to a plane in the three dimensional space (x,y; position of counter, z; density) by linear regression method for each shower, and the statistical calculation was performed refering to that plane. (Hereafter, the term of 'linear regression' indicates this procedure.) 213 data of scintillation counters out of 320 recorded data were analyzed, and mean density and its standard deviation were calculated for the packed 40 scintillation counters. Core location and an electron size by fitting to N.K.G. function) were determined for each shower. The photographs of spark chamber were scanned and counted for almost of all photographs with the density of greater than 50 particles per unit chamber and random samples less than 50 particles. Consequently, 64 events were analyzed. For the data of spark chamber case, two method were employed to eliminate the effect of inclination. One of them is a linear regression and the other is a sectioning the spark chamber area to 8 blocks. 4.RESULTS AND DISCUSSION 5x10⁵ to 5x10⁶. Figure 3 shows ^distribution ^ 0 ^ / - $ . 4 * ' for scintillation
01 counters plotted Л
against the mean density. In the ' '°/ figure, a solid 1 0 line indicates Poisson distribution and dotted
The size of.analyzed showers ranges from FIGURE 3
T T T T T г
ж** poisson dist.
J . 10 100
д ( particles/ 0.25 m2)

77 line shows following formula,
whereCT'oHs the fluctuation of ionization loss (+30% for vertically traversed single/4-on), C^g» is the Poisson fluctuation and Qa r. is a combined effect of intrinsic fluctuation and instrumental error which is 25% according to our experiment. It can be seen in the figure that the experimental data seem to
distribute above the expected curve for less than 10 particles and converge to the expected 0 " as the mean dtns. у increases. The same distribution for spark chambers (linear regressioned) is shown in figure 4. The solid line shows
a Poisson distribution. In the case of spark chdmber, the fluctuation of response seems to be explained by Poisson distribution.. A si'' tie deviation from the Poisson may be caused by some overcounting. Figure 5 shows also % distribution for spark chamber нп-Ч-л were sectioned to 8 blocks. This data show the same tendency as above ."ntioned linear regressioned data. Both for scintillation counter and for spark chamber, the reason for the scatter of distribution might be caused by the effect of wall of the experimental building for inclined showers, (about 30cm thick and 4m heights) Our result indicates that the ratio of density observed by "scintillation counter to spark chamber which is less than unity at a distance 20m from the
10 100 Л (particles/0.25m2)

78 EAS core.*) A more detailed study of this ratio will be carried out at Ht. Norikura. In conclusion, 1) the fluctuatioq of response of scintillation counter does not decrease and saturates to about 30% beyond SO particles per 0.25m2, 2) the fluctuation for spark chamber is almost Poissonian.
* * *
The calculation In this work was performed with the computer of Institute for Nuclear Study, University of Tokyo.
REFERENCE 1) KinaS. Proc. 14th I.C.R.C. Vol. 8 pp.2837 , 1975 2) Yura et al. presented this Conference EA-25 3) Hatano et al. 14th I.C.R.C. Vol.9 pp. 3455 1975 4P.R. Blake et al. 14th I.C.R.C. Vol.8 pp.2778
FIGURE 5
' • •
10 100 Д ( Farticlev0.25m2)

79
MULTI-COKED AIR SHOWERS OBSERVED BY LARGE SPARK CHAMBER ARRAY
S. Kino Department of Physics, Osaka City University, Osaka
T. Kitajima and N. Nil Department of Physics, Ashikaga Institute of Technology, Ashikaga
S. Dake, T. Nakatsuka and R. Oda Department of Physics, Kobe University, Kobe
T. Sugihara College of Liberal Arts, Kobe University, Kobe
M. Kusunose and H. Sasaki Department of Physics, Kochi University, Kochi K. Jiteuno, Y. Nakanishi, K. Nishikawa, N. Ohmori,
M. Sakata, Y. Yamamoto and T. Yura -Department of Physics, Konan University, Kobe
T. Yanagita Department of Applied Mathematics, Faculty of Engineering,
Osaka University, Osaka and
Y. Hatano Cosmic Ray Laboratory, University of Tokyo, Tanashi, Tokyo.
The multi-cored air showers with sizes 0.5~5xl05 were studied at Mt. Norikura (740 gem-2) using the newly constructed large spark chamber and scintillation counter arrays. No multi-cored shower, core separation larger than 10 m, has been found out of one thousand showers. Three multi-cored showers were finely analyzed and one of them was found having large p -28 GeV/c, estimated by the method of the Tokyo INS group.
1. Introduction. It is important to study the large transverse momentum p at the energy region of air showers (>101,,eV). But it is difficult to perform further studies by air shower core detectors of usual scaled"6) for the following reasons. The spacial resolution of the ordinary scintillation counters used for air shower detections are not suited for observing the fine structure of subcores. Because of the limited area of spark chambers ('>5'6) or of neon hodoscope, it is usually difficult to subtract the background contributed from the main shower and to get the proper structure of subcores.
The newly constructed spark chamber array of area 54 m2 largely improved above difficulties. Furthermore, we can easily observe fairly separated (2~4m) rjulti-cores. We report the results of the first observation with this array.
2. Air shower array and shower sizes. 2200 air showers were observed in 380 hours. The air shower array of this experiment consists of 55 scintillation counters arranged in a latticed pattern, 54 m2 dense spark chambers (50x50x1.7 cm3 unit) over them in the central region and 45 scintillation counters distributed within 50 mdsitance from the central part of the array as shown in Fig. 1 For further details refer to EA-25 in this conference papers.
Triggering condition was a fivefold coincidence of scintillation counters in the central part of the array as shown by nark T in Fig. 1, where the central scintillation counter is expected to detect more than 30 particles/0.25 m2
and the others more than 10 particles/0.25 m2.

80
о о 0
о о о
8 Ф
о о 0 0 ° О О
( а )
О а а
а С|Гп
l a O D I O Q • a D„n a a d
_ b 2 f l o i n 1Га*^ 1 D O D O
о m • q
a 6 ЦП
p a • D Ь ш о о
• D • D SBWK CHAMBER AREA
( Ь ) Fig.l. (a) Scintillation counter array. Circles are scintillation counters of 50 x 50 x 3 cm3 unit. Square shows area of spark chamber array, (b) Spark chamber array. Small squares are scintillation counters with the same unit as the outer ones.
136 events out of 1,100 air showers were selected on the condition that the shower axis hitted in the central area (14.4 D Z ) . For each air shower the lateral distribution of the particle density at the range between 4 u and 30 m from the shower axis are fitted with the theoretical curves of cascade showers calculated by Kamata and Nishimura (7), and shower sizes are obtained. In Fig.2 the size spectrum Is shown and the value of the power, -1.85 ± 0.19 ( N * 10s),which is consistent with the results obtained by Kameda et. al.(a) and Yoshii (') at Mt. Norikura within a statistical error.
3. Hulticored events. We searched for the largely separated ( > 10 m) multlcored events from
1,000 air shower. But no such event was found.
Moreover we selected double-cored events out of total 2,200 showers,examining the density distribution the central part of scintillation counter data. He picked up clear double-cored events from them and analyzed finely.
The counting of spark spots was performed magnifying the photographs of the spark chamber. The magnifying power was given corresponding to the density of shower particles. The highest magnification was a half of the real size, which wae used for high density area.
One of(these multi-cored events (AS 60830-2236) is shown in Fig. 3 and the detailed structure in the central part of the subcore is also shown in Fig. 4.
Fig.2. Size spectrum

81

82
The density distribution mop of the abovo event is shown in Fig. 5. In this map we can find three cor^s named Л, В, С The core; Л is the main core and В, С are sub-cores. Accounting from the incident direction of thic event, the subcore С pase*-through the wall of the spark chamber roc The lateral density distribution for the main core and the subcore В гге shown in Fig. C>a and 6b respectively. The subcor* С was omitted front the yna.lysis.
For these events, we estimated the transverse momentum P of th-э interaction which produce;-..' thp sui~>core. The energy and the production height of the subcore were determined from the lateral density-distribution at 0.3-2.0 m from the centra of the subcore, using the calculation of
ig.4. Enlarged photograph Nishimura-Kidd (ln) and assuming the sub-of the subcore В of Fig. 3. core to be originated from a single y-ray.
This estimation method is the .чате one by Tokyo INS groupf1).
In Fig. 7, the energy and the pro--n height for these three subcores are plotted in closed circles. Futtnr-results of INS group (short lines) (!> and Kobe group (open circles) ( 1 lotted in the same figure. The energy and production height for the
i. ' Ф » ' I ' S '"""I ' 1*5 a ' П&^Т
Fig.5. Counted map of Fig. 3.

83
present three subcores are relatively larger examples. Detailed parameters are tabulated in Table 1.
Fig.6. Lateral curves of the main and sub-shower 60830-2236. Open circles are data from spark chamber and closed ones from scintillation counters.
Ti-.;*.
!H
Shower name
60816-0503 60830-2236 60902-1252
N
8.0*10" 1.8X10⁵ 1.5x10s
Table 1
s(N.K.) R(m) sun sub
0.8 0.6 1.0
1.1+0.1 49+2 2.2+0.1 34.5+1. 3.8+0.1 33+2
6.0+0.8 5.0+0.8 4.5+0.6
1 2 4 6 8 Production Height (Km)
Fig.7. Esub> hsub diagram of sub-core. Short lines: the Tokyo group, open cirles: the Kobe group and closed circles: this experiment.
subshowers finely analyzed mated as
Jo, sub
where core separation R, production height hSujj and energy ESuj-, of sub-showers are given in Tabic 1. T';is method of P- estimation is the- panic as used by the Tokyo INS group. The obtained values of ?t was 8.'% ?.b and 13 GeV/c which are describee! in the last column of Table 1, The гл.с prominent multi-cored air showers having large Pt, 20-40 GeV/e, have &цеп rcporte by the Tokyo INS group (1). The reali^ of multicored air showers of th?s type is supported by our one event with Pt - 28 ± 4 GeV/e.
The fact that no largely separated (>10 m) multi-cored air shower is /our.J in the 1,000 showers is consistent with the result, 0.1-0.2 X, cb|->!VH by thr-Osaka group(*),

84 References
(') И. Oda and Y. Tanaka: J. Phys. Soc. Japan 17 Suppl. АЛЕ (1962) 189; S. Shlbata, M. Nagano, T. Matano, K. Suga, and H. Hasegawa: Proc. Intern. Conf. Cosmic Rays, London, 2(1966) 672: T. Matano, M. Nagano, S. Shlbata, K. Suga, G. Tanahashl and H. Hasegawa: Can. J. Phys. 46 (1966) 856.
(2) S. Mlyake, K. Hlnotanl, N. Ito, S. Kino, H. Sasaki, H. Yoshll, H. Sakuyama and E.'Kato: Can J. Phys. 46 (1968) 825: S. Mlyake, K. Hinotanl, S. Kino, H. Sakuyama, S. Kawakami and N. Hayashlda: Acta Phys. Hungarlca, 29, Suppl. 3 (1970) 471.
(3) A.M. Bakich, С. В. A. McCusker, D. Nelson, I. S. Peak, M. Н. Rathgeber and M. M. Winn: Acta Phys. Hungarica, 29, Suppl. 3 (1970) 59; С. В. A. MuCusker, L.nS. Peak and M. H. Rathgeber: Phys. Rev. 117, 5 (1969) 1902.
('*) Е Bohm, W.. Biischer, R. Fritze, U. J. Roose, M. Samorski, R. Staubert and Jfl Trumper: Can. J. Fhys. 46 (1968) s41; M. Samorski, R. Staubert, J. Trumper, E. Bohm, W. Biischer and R. Fritze: Acta Phys. Hungarica, 29, Suppl. 3 (1970) 417.
(s) T. Matano, M. Machida, T. Ishizuka, K.-Ohta, M. Machida, I. Tushima, N. Kawasumi, K. Hashimoto and G. Tanahashl: Proc. Intern. Conf. Cosmic Rays, Denver, 4 (1973) 2683.
(6) N. Ohmoro, K. Jitsuno, M. Sakata, Y. Yamamoto, S. Dake and Y. Hatano: J. Phys. Soc. Japan 42 (1977) 1530.
(') K. Kamata, J. Nishimura: Prog. Theor. Phys. Suppl. 6 (1958) 93. ( ) K. Kameda, Y. Toyoda and T. Maeda: J. Phys. Soc. Japan 15 (1960) 1565. (9) H. Yoshli: J. Phys. Soc. Japan 32 (1972) 295. О 3. Nishimura: Handbuch der Physik Bd. XLVI/2 Springer-Verlag (1967) 1.

85
THE AIR SHOWER STRUCTURES UNDER IRON ABSORBER
T. Kitajima and N. Nil Department of Physics, Ashikaga Institute of Technology, Ashikaga
S. Dake, T. Nakatsuka and R. Oda Department of Physics, Kobe University, Kobe
T. Sugihara College of Liberal Arts, Kobe University, Kobe
M. Kusunose and H. Sasaki Department of Physics, Kochi University, Kochi K. Jitsirao, Y. Hakanishi, K. Hishikawa, N. Ohraori
M. Sakata, Y. Yamamoto and T. Yura Department of Physics, Konan University, Kobe
S. Kino Department of Physics, Osaka City University, Osaka
T. Yanagita Department of Applied Mathematics, Faculty of Engineering,
Osaka University, Osaka and
Y. Hatano Cosmic Say Laboratory, University of Tokyo, Tanashi, Tokyo
Air showers of sizes around 10s were observed at Mt. Norikura (738 gem"2) by a complex array of non-covered scintillation counters and those covered with iron absorber of two kinds of thickness (1.8 cm and 3.6 cm) on top of them. The air showers with larger age parameters rejuvenate in their lateral structures through penetrating iron boards more than those with smaller age parameters and decrease their shower sizes against the latter.
1. Introduction. Many experiments to detect the electromagnetic component of air showers before and after passing through an absorber have been carried out,e.g.by using water (Miyake et al. 1968) and lead (Baklch et al. 1970, Dake S. et al. 1977). The detection area was necessarily restricted in a small region within about 5 m at most from the shower axis because of setting the density detectors both on top of and beneath the absorber in these experiments.
In order to extend the detection area we put several iron boards on top of some scintillation counters of air shower array. We call this type observation as an iron "open-sandwich" experiment. Although a direct multiplication or absorption rate of shower particles at each place cannot be obtained in this method, two average lateral density curves given by the non-covered detectors and by the covered ones with iron boards can give the rates at any distances from the shower axis by smoothing out of responces of the detectors.
2. Experimental procedure. The arrangement of 100 scintillation counters, i.e. 46 non-covered counters (OFe array), 28 covered with two iron boards

86
j i o n • ••,;'• ai'tay) . i s showi i.: ; . The thickness of i:d.. : . I'I";;, board is 9 h-s:. A remaining counter was
. In the working period :": -; - ••. to 35 i:t from the Jn,. •.•;: cer for calibration of Lit u;!er counters. Each s:. ntil U". tor and iron board has unit areas, 50x50 cm2 and 60x60 cm , respectively. An area 6*9 m" in the central part of the array is covered by ripark chambers (EA 25) which w^re worked together with the scintillation counters. The air shower events were taken by a fivefold coincidence in which the central detector respoces over JO particles/0.25 rn2 and each of other four detectors over 10 particles/0.25 m2, About 2900 air showers with sizes around )Q- were obtained in the real time about 340 hours. Out of them about 500 events whose shower axes hit the central 7.2 m*2.4 in area and arrived with zenith angle less than 35° were analyzed mainly by an electronic computer and some of the results are presented. The spark chamber data are not yet analyzed.
3- Analyses of Experimental data. The air shower detectors are divided into the three groups, OFe array» 2Fe array and 4Fe array according to the number of iron boards attached. The shower axis is determined as the center of equi-density curves in the density distribution шар for the OEe array. By using the arrival direction of each shower observed by two sets of spark chambers (Dake et al. 1977), the three kinds of lateral density distributions are obtained for each event from the above mentioned three arrays. By the help of an electronic computer, we fitted the NKG lateral structure function to each of the three experimental distributions. Thus, for each event the three sets of shower size and age parameter, i.e. (NQ, &o), (#2, sz) and (ДЧ, 8 K ) , are obtained from the best fit theoretical curves which are given by the least squares.
4. -Y-g correlation. Diagrams of N-3 correlation are shown in Figs. 2(a), (h) and (<?) . The average values of N and е of all air showers analyzed are •is follows:
(<iV0>, <eQ>) = (1.80x10s, 0.66) for OFe array, i<N2>> <я2>) = (2.43*105, 0.65) for 2Fe array, (<Л\.>, <su>) = (2.38X10⁵, 0.61) for 4Fe array.
a a • D D • Е визови
aвашашава aaaSaeaSS •виводаи
а а а а а 10 m
Fig. 1. The шар of air shower array: OFe array with non-covered counters(D), 2Fe array with 1.8 cm iron (0) and 4Fe array with 3.6 cm iron (H) . The trigger counters are shown by the mark El.

s?
ч*
10**
10 ' 10° :иок mi Л/0
10= 10° SilOHER SIZE Л / г
10 10 SII114ER SUE Л / 4
Fig. 2a. HB agram.
W
> i , : ] i i l i t [ ; H i .
t : I M W . I."i i . ' i , ' i 11 .' i
!..• и.**» *'.»•->m *-ui? л и i h .1 i • i i ; i M ( 4 i i , v ; i . v i ,» i и > . . • :
. г 1 « . ' ; . i j t i i , ' 1Л ?n i -i i L ял>.^М ?;f >> .- i; i i i . L
ti , . ' I . 4 ? * J ).V J •>,' J i i i . I Wi l l l l I II 1
i ii i ; i?i i^ ?? 11." ' - ' i I I II i I I
U . I i l l i i I . i , l i
. I 2 1 . 1 , I . •
Fig. 2b. li2
10'
-. • ,
•
•
-•
•
' " ' ,',',""
1 1 ,"• 1 1 1 1 I 4
I / 1 17 Ш i 1 1 7 , 4 1
1 1 1 1 .
i
' И 1 i .• 1
•'it f ? •> 1 1 t
7 1 7 1 7 1 I ? 1 < I > . ? 5 i » 7 1 7 . > J 11 ? 1 1 1
М И T ) l • 1 7 1 ' 1 j l ^ t ^ l i i * II? 1 * > ! ? ! L7 г 1 7 1 7 1 1
) i i i ? i ; .• i I I 11
11 1 H 1 1 1 1 ! 1 1 2 I I f I
'. 1 I V .i
1
. 1
i l l
, . ' '
' -- Fig . 2c. ff„
agram.
10

88
The air showers become slightly younger on an average through penerating iron boards. The average shower size increases under two iron board* and has a tendency toward decrease under four iron board!. These features are shown in more detail in Fig. 3 and Fig. 4. According to Fig. 3, the air showers with smaller age parameters show more increase of their sizes under iron boards. On the contrary, the showers with comparatively large age parameters keep or even decrease their sizes. We also recognize from Fig. 4 a fact that the air showers with larger age parameters become steeper in their lateral structure independently of their sizes, although no noticeable change of age parameter is seen in the size region greater than 2x10s.
5. Multiplication or absorption rate. The ratio of the particle densities before and after passing through the absorber at a lateral distance г is obtained from the three best fit theoretical curves. The ratios pz(.p)/ Po(r), 2Fe array to OFe array, and PtbO/pobOi 4Fe array to OFe array, are shown in Fig. 5 at five lateral distances from 1.5 m to 24 m.
Under the two iron boards the ratio pjGO/Pof?) slightly decrease within 10 m from the shower axis for air showers with small age parameters, i.e. a) and b) in Fig. 5. This is a cause of a little increase of age parameters as shown by a) in Fig. 4. Moreover, both the ratios РгвО/робО and р»(1»)/ро(2")
gradually Increase э Г - 4 — r " - — ' — ' — ' — '
a) o)
<
a) b)
with the lateral distance for these small age showers. This is a cause of the increase of shower size in the small age regions shown in Fig. 3.
On the other hand, for the showers with large age parameters, o) and d) in Fig. 5, these ratios have a fairly strong dependence on the lateral distance, i.e. they increase when approach to the shower axis within 10 m and decrease out of the rsgion. This tendency, which advances under
Fig. 3. NilNt - во .and Яц/Na - a0 correlations. a) ЛГ0-О.5-1хЮ!, b) ff0- 1 - 2x10* .
0.8 1.0 0.< 0.6 AGE PARAMETER S0
0.» 1.0

89
ОА
02
1 0
-0.2
-ОА
ОА
се
1 0
-0.2
-ОА
! '. -1 0) ' -;" "-':' '
- _ _- — - - ; - S;J== = - - -
. - ^ - — I K H " : ~ " : - " :
" • „ ^ w ; - " " ^ - " '
•
_ о ) •
r :sis=s:ii-"i:.5 I = . • •. =>-:.-Il]ds«:" «-"•'
-„ М-:£.=-- :- -.. :=-=; rS -
~z • . - • " I
: i
i
: ! • » ' :
: ! '
^ M ^ - ^ J ^ ^ _ « -
- f>=si~I~-r -
- - r --•
1 b) ' -= J . : - ^ - -_
"•"-=«-«-:= = V = " -- =-;==;«=-;:;--
: ^ : - 5 = : V = - - - • - ; _ _ » : - ^ -
; I 2 ~ " _ -
1
10" 10s 106(4> SHOWER SIZE /V0
10" 10
Fig. 4 a) 8
(82-80) - So and <в*-во) - *o correlations. -0.45-0.65; b) 8o-0.65 - 0.85.
the four Iron boards, leads to the clear rejuvenation of age parameter as already shown by b) In Fig. 4. 6. Coelusion and discussion. The result of our data analysis insists that the showers with comparatively large age parameters, 0.65-0.85, become young again under the 1.8 cm-3.6 cm thick iron against those of smaller age parameters. This assertion seems to be incompatible, at least within 10 m from the shower axis, with the conventional understanding that the shower particles of showers with small age parameters are energetic and those with large age parameters are not so. This inconsistency implies that the age parameter In the lateral structure of air showers does not always give a correct measure of the longitudinal development of showers, because the old age showers have higher ability of rejuvenation than the young age showers in our data. The high rejuvenation ability of these old age showers might have its causes like as: . 1) The central part (r<10 m) of these showers is immature in the matteri-
zation.

1.5 ; в 12 2« 1.5 3 6 12 24 : ATE-W; DISTANCE (m)
Fig 5. Dependence o£ P2/Pr, -.»d . a) OVo, s0) = (0.5-ixlO
5, O.Ai-i,.
(?) (0.5-lx:.Os, 0.65~0.8:>), i) (1-
The symboles are defined i.i orde:
123456789A BCDEFGHIJK LMNOPQRSTl!
'.b 2 В 12 24 1.5 3 6 12 24 1 A'.tRAL DISTANCE (r,v
•'•n Ll.y lajera.1 distance. •, :>) (i - IxlO5, 0.45-0.6b); 10-, 0.05-0.85) .im I to lib as
I
Xi «XVZ-r-O* JV\
2) The energetic hadrons and/or photon:; are abundant in this region. 3) The large transverse momentum expando the core region and makes a t i n
e.'.sity distribution as multi-cored air showers. Besides the above physical causes, there is a technical problem that
.ie events with large ambiguity in the least squa.-e fitting raay distort a fdt
7. References. Bakich et al. : Bakich, A. M., McCufker, С. В. A. and Winn. M. И., J. Phys.,
(1970), A3, 662. lllyake et al.: Kiyake, S., Hinotani, K... H o , N., Kino, S., Sasaki, H.,
Yoshii, H., Sakuyama, H. and Kato, E. , Can. J. Phys., 46, S21 (1968).
bake ec ai. : Dake, S., Hasama, M. , Jit.suno, K. , Nakanisbi, Y., Nishikawji, Sakata, M., Yamamoto, Y. and Hatano, Y., Nuovo Ciment (1977) in printing.

9!
THE DENSITY Sf'FCTRW, THE I AT^RAi. DtS "RTBLT[GJ:
AND THE SJZE SPECTRUM
Yanagi.a.T. Hatano.Y. Sakata,M.
;:acrity cf Engineering Science, Osaka University, Toyonaka.
Cosmic Ray Laboratory, Tokyo University, Tanashi, Tokyo. (v/
Department of Physics, Konan University, Kobe. (**)
A calculation of the density spectrum is performed assumiig
a form of the lateral structure function. The result shows •
that there are many possibilities in the variation of the
lateral structure with size. Now, we cannot confirm the
consistency*of observations of the size spectrum, the densi
ty spectrum and the lateral structure. The experiment to
narrow the ambiguity is proposed.
i. Introduction It is, in general, known that the size distritj;io:i
the density distribution and the lateral distribution of electrons are in :!•.-.-
close connection mutually, and the relation is used to check the consis.eic<
between these observations or to speculate some variation of features '.r nne
of these observations. There exist many calculations of the density spectrum
on the assumption of the size spectrum and the lateral structure which are
suggested by experiments. It is suggested that the size spectrum and/or the
lateral structure changes at the size N=104l0 6 and/or N=107^108. There are
many possible selections of the size spectrum and the lateral structure when
we perform a calculation.
The authors have the opinion that the experimental results above mentior
ed have not been confirmed yet. In such a view point, we investigated the
relation between the electron density spectrum and the lateral structure when
the size spectrum is represented by power law. The contribution of the showe'.-
which have the size greater than Nc to the density spectrum is calculated.
It is discussed how the variation of the lateral structure reflects on the

92
density spectrum. A proposal of the experiment is also made to eliminate the ambiguity.
2. Formulation. When the size spectrum is represented by power law as
I(N)dN >= IoN'^'dN,
the integral density spectrum is given by R(>A) = fa?(>N>u/fm)2nrdr
= I„2naY J [ f ( r> ] Y rd r ,
where f<r) represents the lateral structure of electrons. In general, the lateral structure varies with the size. To"simplify the problem, we consider the case where the lateral structure is represented by ft at N<NC and by f2
at N>NC. In such a case, the density spectrum becomes
RU) = l&Mtu\f1tnlrr*r * ГХггмТгЛг (1) 0 it
where rc is defined by the relation Nc = A/fcrc). In the case where the exponent of the size spectrum changes from у to у , the density spectrum can be writen by the similar equation as
(2n)YR(>u) = I V V V r ]Yfdr + l V 2 / r f r f rd r . (2) 1 о 1
Here, we define С(>д), which represents the contribution of showers having the size greater than Ne, as
C<*A> "ТГПГ • 7 ls>
and parametrize the structure function as
f r * B0(r+a)"nexp(-r/r„)
where J^nrdrfcr) * t and a, n and TQ are parameters which caracterize the

93
distribution at near the core, the midle range of distance and the large distance respectively. The integration in the equation-(l), -(2) and -(3) can be performed easily, and the results will be expressed by the incomplete gamma functions. 3. Results and Discussion. Experimental data of the density spectrum contain an ambiguity in the absolute intensity. Me concern the intensity with arbitrariness. We can reconstruct the density spectrum assuming the sudden change of the lateral structure which has been suggested by experimental data ( similar calculation have been performed by Hillas'), but cannot reconstruct it concerning only the change of the exponent of the size spectrum, as shown in Fig. 1( where we used the equation-1 and -2 ).
Not only the sudden change of the lateral structure but also the gradual change of it are suggested in some works5. Therefore, we cannot, now, confirm the mutual consistency of the observations of the size spectrum, the density spectrum and the lateral structure. For future studies, we investigate the relation between these observations in detail. For this purpose, С(>д) is calculated for various values of a, n and rg, when the value of у is 1.5 and 2.0. Fig. 2 shows the results. It can be seen in the figure that there is no prominent parameter to change С(>д). Thus, there are possibilities to reconstruct the density spectrum by changes of the lateral structure which have not been observed( ie. there is no available data of the lateral structure of near the core for large size and of the large distance for small size ). The relation between the three observations contains such an ambiguity. Such experiments are required that takes away the ambiguity from the relation. Direct observation of the lateral structure in the wide range of the size and the distance from the core is of course the best way but other arange of experiment can be proposed. It is the observation of the density distributions together with the absolute intensity constructed by the showers which fall 1n the restricted ranges of. the core distance. For example, the core distance can be

Fig .2 Calulated С(>Д) for va r ious values of parameters . The va lues of a and n are presented in the f igu re . Solid curves correspond to r n *75 , and broken ones to ro=l20m2.
F i g . l Reconstruction of the d e n s i t y spectrum, assuming a change of f ( r ) ( s o l i d l i n e j aud a change of (broken l i n e ) , i s shown together with experimental data(*=Ashton? O-McCaughan3). Data a r e normalized a t A=100Q/m*.
1 1 P i l l J
•ro-75*T20 at TO7 | * i
-Y=l.5-2.0 at 5105 ' :-V • \
'%.
\
V
100
Log & i
1000 /m2

Mfd 1ч;п fhe ,fiqiOfiS ?s
r- ">:ii l l ' i - j f disi..---.rc).
?On («/•=•• flip f•=• • ). ?0 '--EO,. , V d ' e cistanc
;.•/•!! - I , c-.:ng|. .-. • =,|ц r,ri t ' i rro/ j ' !'P : ' " 'g i ' i ' .y .
HIP calculat ion in th is wo "к was -,"•.< i'o> •••>.' v." t l1 h'ip cor pi. t? ("" " ' 1 4 . ' '
'01 ilucleat St 'dy, '.h'vev Чу ос iofcyo
1) A.M.Hi l lss ' эгог l i f t Int.. C.R С Vol ?. (1 9f ?)53°.
2) F.Ashton et a l . P>oc >3th Int.C.R.C ' - .Д,'973)2^89.
3) J.B.T.McCauohati »t ?1. Pr-cc. 'Mi I n l . t . 4 С VM 2.1P6S:^?J
4) for exaimls. S <V Vein"/ ?t •. . - ' '0 ' . 1 V I n t . C M Vo . ' , ' i o r o ! " ~ 9 .
u s . ; ; iw ' ' " » : ? i . p- с •: •' м . г . ' ! i ' .a •' 19 r4Kh"?.

96
LATERAL DISTRIBUTION OF HIGH ENERGY EVENTS- IN EAS S. Miy aketM. I to. S. Itawalcaml • Y • Н Я У Я Я Ы and N.Awaji Facultjy of Science .Osaka City University,Osaka, *• Cosmic Ray Laboratory.University of Tokyo,Tokyo
Japan
Theoretic»! • Experimental |x] "o"1 Q
Lateral density distribution of high energy events in EAS has been observed at Mt.Norikura (2770<m a.s.l.),using large proportional counter (5m x 5m)which have.been set underneath the water tank.
The lateral -distribution of high energy events (100 GeV - 1 TeV) can be expressed as a form of к ехр (-r/r.). The variation of r. with shower size is discussed relevant to the N - в relation which has been reported in the past Conference.
I C d o n , i n « « ; EA 3.2 Structure
MaUiniiddtem: Prof.S.Miyake Cosmic Ray Laboratory University- of Tokyo Tanashl-shl ,Mld.ori-cho 188 Tokyo Japan

97
Structure df Muon Component in Extensive Air Showers S.Miyake*,H.Ito.,S.Kawakami,Y.Hayashi and N.Awajl Faculty of Science,Osaka City University,Osaka,Japan *Coamic Ray Laboratory,University of Tokyo,.Tokyo,Japan
Theoretical Q Experimental [xj Both Q
In the series of EAS experiments at Mt.Norikura (2770 m.a.s.l.), muon component'have been observed by neon hodoscope array under lead layers. The average lateral density distribution of muons has been analysed based on the assumed function of К r"n exp.(-r/300) in a- range of distance from 30 m to 200 и from the core. As a result, it was found that the exponent 'n in .above equation decreases alowly wich increasing size of EAS.' Comparison with lateral density distribution of electron has been made relevant to the interaction character of earlier stage of EAS.
• «»
Соо«"п««: ЕА 3.2 Structure
Mailing address: _ . . _ , Prof.S.Miyake Cosmic Ray Laboratory University of Tokyo Tanashi-shi ,Hidori-cho 188 Tokyo, Japan

Ъапооовг The Lateral Distribution of electron and Kuon ?luxes in Extensive Air Showers at Mountain Altitude V.L;. Aseiki.n, A.Z. Dulovij, K.7. Habanova, K.il. Kesterova N...i. Mikolskaya, S.I. Kikolnky, /.A. koraachin, a. U Iuki3h i'.ii, Lebedev 1'hysical Institute, Moscow, иЗоЯ 1.... Katsarsky, I.K. Kirov, J.S. Staxenov, V.J. JanrainchRv Ins'titute of iiuclsar research and Kuclear iinergy Sofia, Bulgaria
There are obtained the lateral distributions of » electron and muon flux with energy Eat>53eV in distance interval 10 * 200ra from the axes in showers with sizes Ю 3 •» 5.10°. There is shown, that the lateral distribution of electrons can be diacribsd fey лХЗ-i'unction with age parameter 3*0,05*0,90. The value of the a.je parameter is function of the altitude in the atmosphere X .
о
At Tien Shen complex array were precised the investigations of the muon (£м>5'3е7) and electron lateral distribution in the ran.je of distances 10*200n from the axis with вг 30 in 5 6 s.iowers with sues N =10 +5.10 . The geometry of the arrangement е and the detector characteristics were described in our papers /1,2/. ThQ showers were selected mainly by the central master systera, but an analsocial paripherical system was also used. /2/. In each individual shower were obtained a full complect of the shower parameters by the method, which was described in our previously work /2/.
As a result of the data treatment for an effective run'ing tirr.e of the Tien Shan complex array about 4000 h was obtained tha lateral distribution of electrons (fig.1) at distances in tha range 10^г4200и in showers with sizes •5 G 10 +5.10 . The experimental information was obtained with
о help ofG',: hodoscop detectors ivith the effective- area л*38 m . In interval of distances r= 1-?15m the densities of electron-photon flux were measured only with help of scintillation detiictoi-s, -raduated by OM counters.

99
Fig. 1. The lateral distribution of electron flux in showers with 9<30° and fixed sizes at XQ=700 gem-2
1. Ne= (4,21*0,02).106
2. H = (2,20±0,06).106
3. Ne= (1,44*0,03).106
4. ife- (8,9*0,11).1Q5
5. H « (5,15*0,05).103
6. NQ= (3,04*0,02).105
7. N - (1,79*0,01.105
In each narrow (тт- =1,78) interval of shower size the lateral distribution of the electron flux can be described by the Qreisen approximation of Nishimura Kamata functions with an age parameter in interval 0,79<J S*f0,87 at the range of distances 10^r^200m. In this work was carried out an absorption experiment for distances r =150 • 200m. These experimental data were corrected by a factor k=1,15.
There are obtained the lateral distribution of the electron flux in showers with в =40° -t 60°,for them the depth of the observation level is XQ2f 940 gem c. If these data are compared with analog data for showers with 8<2.Q° ffig.2), it is evident a considerable difference between the obtained lateral distributions fo(r), в «const, N «conat. The approximation of the lateral distributions for zenith angles
в =40°-60° shows a small increase (sMI) of the age parameter с g
showers with size 10^-5.10 , expected as well from model calculations.

100
7 i
^rA'± чИ»-^1 tf-T
- 3 -
-f .-«fcer^il.1
i _ ^ _ - ^ _ _ _ . . i 10 10 » SO 100
fig.2. Comparison of the lateral distribution of electron fluxes in saowers with04f2G° and£=40o
+60°
ar.d fixed sizes
A - fie =(bOAtO,OS).iOb
3 - \ = (5, fff * « « / . » *
mm
Rjm
Pig. 3 . Ihe l a t e r a l d i s t r i bu t i on of muon flux with energy
ii»f> 5GeV in showers with 0<3O ,' a id fixed s i zes H = 105 • 5.101
at XQ=700 gem-1
Г. 2. 3 . 4.
Ml = (4.2It0.02). /0s
Ne • (2,20*0,06). W6
f ((44*403/-Ю' fa-. (6,9 tO,H).Ws
%- (5J5tO.O5).t0s
Ые-- (5,04 10,02). tOs
Ne--(l79*0.Ot).tO*
The lateral distribution of the muon flux with energy ^ff>5Sef at distances 10-2O0m in showers with sizes H =10т 5,10J and 8<30° can be described by a function
fjtU)^ *Гш*р(-%)

iCl
?or the average values of '-~'r i'ur. I.J.„I _- j. .r-v.if.tors Ho were obtained : n-~0,75 i 0,06; Ho .- /C i ' ••- j'ror. t fact follows that t?" a\ -3r?.j,e tu.cort 4in'*y oi' muon number calculated by t.ie a'' ve mentioned function, is about Ъ-J, which depends i'rcm the тггогз in t;ia estimation of t.h-з function parameters n and Ho.
The obtained lateral distribution of the suon flux Eyn>5GeV at XQ=700 gem-2 is in good agreement /3/ v;it!i z CKP model calculations /4/.
&£PZRil!CES
1. V.S. Aseikih, V.P. Bobova, A.3. Dubovij et al.
Р10СЙ, V. 8, 2726, 1975 2. V.S. Aseikin, V.P. Bobova, A.3. Duoovij et al.
PICCfi, v.8, 2807, 1975 3. L.G. Dedenko, N.V. Kabanova, 3.1. I'iikolsky et al.
Kratkie soob. jpIAK, Ho 4, 1975, p. 14 4. L.G. Dedenko, I.A. Diraova
Symposium on ilAS, Jakutsk (1972)

102 PUenomenological enaracteristics of the i.Iuon Component of extensive Air Showers at Mountain
Altitude •Т.Н. Stamenov.IM.H. Geor^iev" L.I.I. Katsarsky, I.N. Kirov, V.D. Janminohev Institute for Huclear iiesearoh and Nuclear jSnergy, Bulgarian Academy of Sciences S.X. Kikolaky, N.M. Nikolskaya, W.V. Kabanova P.N. lebedev, Physical Institute, Moscow, USSR
At lien Shan complex array were obtained new data about characteristics of the muon component with energy Ец> 5GeV in SAS „ with sizes He = 10? - 5.10° and XQ * WOgcm'*
At Tien Shan complex array were precized the dependence of the. lateral distribution function of the muon flux with energy ^j> 5 QeV from the shower size /17. The experimental data were approximated in distances interval from the. axis . 10^г <J 200 m by functions $» (tpfaf'bxpC-grjln narrow = 1,78 intervalls of shower sizes. For parameters n and were obtained the follow values: Тл m f.
Ne.iO'5
n Rotml
3,04*0.02 0,7910.03 76,5*4,5
5J5t0.047 0,7510.06
76tr
/4.40 tO. 30 0.6610.06
7416 Also from lien Shan data follows that there is no cons
iderable dependence of the shape of lateral distribution of the muon flux with enersy E«t> 5 OeV from the shower size in internal 10^ 4. Ил •£. 5.10 е But there is an evident tendances the muon lateral distribution becomes narrower with the primary energy.

J 03
This assumption is in good agreement with the form of the functions Pjun'A/gci
f tu = conat. (fig 1). in this case were obtained a considerable independence of the functions ot =
ci (Пц) from the-radial distances тл in "showers with sizes to'* г 10s !f , . , ,
i''ig.1.lhe dependence of the average density of muon flux at fixed distances irom the sho8 wer size.
1- г„=7,4*Юи. 2. ЙГ=13 *1Sm. 3. r£=18+ 24m. 4. r.= 24*32m. 5. r£= 32+42m. 6. ru= 42*56m. 7. r«» 65*75m. 8. r„= 50+100m.
£>J4«f
•e» * '. ' '• At*,
J?i3. 2 shows the results about the lateral distribution
of auon flux with energy ЕмУ 5GeV at distances 10И7/г^б0/п in showers with fixed aiaes H =const. and age parameters 5 = const. By the approximation of the experimental data with a power function p„ n/ £•" were obtained following values
- the parai > ^ '
5 4.0.»
5 >0,в
neter n: 3,04*002 иг 10.03 099*005
8.90*O.U m to.06 1.0Ы0.07
f4,4t0.3 wtat Q79tO,V
гшо.б U4t0.i 0,B7t0.23
raBLeP. >t.eo
ином 0,9Ш.05
Prora this table we can see the existence of a considerable correlation between the muon &м> 53eV) and electron lateral

104 d i s t r i bu t i ons In the ran^e of d is tances 10-60 m by shower s izes
~6 ю5< ., <5.106 at mountain altitude /2/. At big distances 180m j.„ ~ ни, ..— • obtained no oonaiderable dependence of the
density of the muon flux from the ase parameter S (fig.?).
ffwK) iJij£. 2 . l a t e r a l d i s t r i b u t i o n of г
ir.uon flux with energy 2^>5 (lev at d is tances Гц = 10*60и. in showers with fixed s izes H=const l and age parameter s=const.
f e i n t s - s<0,8 c i r c l e s - s>0,8
1 . T,a= (3,04+0,02 ) .10 5
2 . Hg= (5,15±0,05).10; j 3 . Ne= <:,44±0,03).Юб
L %-i&a<n
У °ls
>Cs С «Г
с s s ,
• 1 ol
At
Fig.3.Ihe dependence е of the average density of muon f u x at distances *^=180т. from the size И of showers with fixed age parameter s.
1. - в <0,8
2. - s>0,8

105 In this сазе the distorsion of the number of rauons Hj»t , if H» were obtained only by the average functionЛ» (r) is above (7-10)#.
At Tien Shan area the study of the dependence of the muon number K M from the shower size II e in interval 10 K g^
<Л.Ю was continued. The shower sizes were estimated with help of the Greisen approximation of Iftshimura Kamata function, the auon number Кя»- with the help of the average function Ум fl* ZJ0,7exp(-e/8a). The experimental data for a effective runingtime about 4000 h were approximated in interval ' 10 S^ N 7.106 by a power function N«A/ II and for parameter d= o.eot
In this size sf the shower interval 104 - 7.10 was obtained an independence of the parameter oL from К /3/ (fig.4).
Kin»"
о 1
t ' Чг
.*-.-.- , • • t i-\—i
IF Нш,
Fig.4.The dependence of the number of muons with energy Ej>5 GeV from the shower size; 1 /3 /, 2 -new 2ien Shan data
aBPSRJSNOES 1.V.S.Aseikin,V.P.Bobova,A.G.Dubovij et al. PICCR,ffiunchen,v.8,p.2807,1975.
2,H.V.Kabanova,J.K.Stamenov,V.D.Jajminchev et al. PICCfi,Denver,v.4,p.2334,1973.
3.V.S.A8eikin,I.V.Danilova,N.V.Kabanova et al. PICCK,Denver,v.4,p.2599,1973.

106
ABOUT SOUS Н Ю В Ш Б OF THE SKTOCOTHE ON EAS WITH BNERGISS BELOW 1017eV.
L.H.Kataareky, I.a.Kiror, I»R.Stamenoy, S.Z.Ueher, V.D.Jaamin~ chev Institute of Hucleat ВезеагсЬ and Suclaar Energy, Sofia b.G.Dedenko ilosoow state university lf.Y.Kabanova, IC.IJ.irikolekada, S.I.Nikolshy P.H.bebeder Physical Institute , Moscow j ^ ^ 3-Hew data about the correlation of the lateral distributions
of electron» and auona fluxes with <aner®r fy> 5<3e? *» integral of diatanoes 10 < r <60a «as obtained» There was analysed muoa fluctuations at conatant distances £eom the axis in interval 0 - 200a. on tbe base of standard models of elementary act.
She lateral distribution of electrons was compared with tha ээзя results of aodel calculations.
Coordinates/ E* .2. ( Structure )
Mailing addreass D-r l.G.Dedenko Moscow State University Moscow
U6SB

107
THE LATERAL AND ENERGETIC CHARACTERISTICS OF THE EAS HADRONIC COMPONENT AT MOUNTAIN ALTITUDE
Fart I The lateral distribution and energy spectrum of EAS hadrone.
V.A.Romakhin, N.M.Nesterova, A.G.Dubovy P.N.Lebedev Physical Institute of USSR Academy of Science.
Moscow, USSR The properties of hadrone of energy Е • 0.3-30 Tev in
air showers of size Ne^. 105 have been investigated by means of Tian-Shan EAS installation. We have received the results of lateral distribution of hadrons for various hadron energies and EAS sizes. The presented results are in agreement with thoae of other experiments. The energy spectrum of hadrons received by means of Tian-Shan calorimetsris presented. Possible sources of this result discrepancy from data of other authors are discussed.
The lateral and energetic characteristics of 0.3-30 Tev energy hadrona in EAS of size He - 1,3.10'' have been investigated by mesne of Tian-Shan installation /1,2/ at the altitude of 3340 ю a.s.l. The energy and coordinates of hadrons were measured by 36 m area ionization calorimeter consisting of 15 rows of ionization chambers with lead layers between them (full depth is 4.4 m.t.p. for hadrons). Every one of 744 chambers permit us to measure the. relativistic particle num-» ber at the area (25хЗОО)сш in the range from 65 t o ^ 5.Ю 5
with< +5* accuracy. Our evaluation show that the mean error of measurements of the hadron energy Kh is 18* (for J^p 1 Tev). Scintillation and G.M* counters array was used for the shower parameters determination. The accuracy of shower size Ne evaluation is 13* and the mean error of core location is ±0.7 m.
1300 showers which axes struck the calorimeter were included in present analysis. It was revealed in the course of analyaia that lonisation in the calorimeter was distributed in the mannar of clear-cut jets. The mean width of the energy flow in jets is 32.5+6,4 cm, while the mean distance between jets is over one metre.

108 The cascade curve and the lateral distribution of the
energy flow for jets of energy Е 1 Tev are shown in fig,1 and 2 respectively. Were the dependence of ionieation I on the depth X in calorimeter ie expressed by I(X) = IQS~x'xo; the parametr x • 110+14 gem" for 2 ^ 2 0 0 gem and X • 625+70 gem"2 for X>200 gem"2 „ The firat part of
this curve can be understood as due to electron-photon component and the second one is due to neurons. The lateral
I/arb.un/
*•> V
1.У
1.0
a \
*--*.
=L 37.5 иго 370 5"0 630 760 880
I/g cm" / fig.1. The ionisation 1 (arbitrary unite)
against the £epth X of the calorime-
energy flow distribution for jets in shower is compared with that generated by alone hadrons in fig.2. These figures (1,2) reflect the picture o£ last hadron interaction at some height (~km) in air. At the observation level the lateral separation of secondary particles is smeller than the resolving size of our apparatus, во these secondaries form jets. It is necessary to take into account the difference between alone hadrons and jets when different experimental and simulation data are compared. The correspondence between mean energy of jet and hadron which generated this jet,was obtained from our simulations. So, we can investigate KAS hadron characteristics by .using the data of jets.

109
F/arb,un/ 100
10
" О 0.25 L.S Q.75 R/m/
fig.2. The mean energy flow (arbitrary units) of jets (closed circles, end wide line; and alone hadrone (thin line) against the distance В
from their mass centre. At first the coordinates of shower axes were determined
by the response of scintillation counters. When the shower axis was in bounds of calorimeter, coordinates of more ener
getic hadron in this ehower were propoeed as that of shower axis. The analysis of our experimental data and some simulations has demonstrated that the mean error of ehower axis position is lessv^han 25 cm in this case.
The mean lateral distributions of hadron^/Э(R) for iiadrons of energies Sb more than 0,3; 1,0; 3,0 and 10,0 Tev at tiiJBoances B<^5 m were obtained in shower of He ^ 1.3.105 (fig.3).
Usually, iheae ' ' 'cibutlens were approximated by the lowt^fH^jj.,,!)- ce~E/,fl° , <mij:eOh ia the number of hadrone of energy > E h at т if distance of shower axis H ; H0(JBh, Ne) is the lateral <x.Latribu-;ion parameter. The values of B 0 were determined for hadrona with various J5h by this appoximation of experimental lateral distribution at distencee В - (1,5-5,0) m from the shower axis. The dependence between B Q and the hadron energy Ifa is given in fig.4 for our data and that of other experiments and

по
0 1 2 3 * 5 fig.3 The number of hadrone of energiea EL 1.0,3;2.1,0; 3.3,0;4.10; Tev par •"* par ahowar ( He -> 1,3»105againat the distance R from the ahower axia. The
broken line la the appo-ximation.
B/m/ 0 1 2 3 ^ 5 6 fig.5. The number of neurone of S n ^ 1 Tev per m"z per ahower against the distance R 1. He « (1-3).105; 2. He «(3-10).105; 3. He>10 .
B/m/
simulation* /3.4,5,6,9,10,13/, Uo wid, lineB ^ fig#4 w M e obtained by varioua almulationa for ahowera generated by primary particlaa with atomic weight of A - I(P) and A- ? 50(Pe) Ho correctiona have been made for different conditlona of ex-perimenta.
The experimental-data do not eontradiot one another.The calculated data are in agreement too. Were characteriatioa of nuclear lnteractiona, especially the value of tranavera momentum Fx "normal", the experimental data for hadron of energiea *h^-1 T,v ase ^ •в**'""»* with thoae of aimula-tiona for heavy primary oompoaition ( A S 50). But data /в /

Ill
Гог less energies аги in contradiction with eueh value cf A. The lateral distributions of hadrons of energies Bh^-
1 Tev for various Ne intervale are presented in fig.5. Dependences between the lateral distribution parameter B 0 and ahower size Ne areshown in fig.6 for our sxpernent and that of other authors ^*J> /Various data ware obtained for hadrons
Vm /
p/Tev/ 10" io 10'
fig.4. The hadron lateral distribution parameter н0 against the hadron energy Е П
experiments ф our present data , B.K.Chatterjee T et al 1968 Д R.van Staa at
al 1974 * H.Haeegawa at _ al 1965 § S.lliyake at al 1970 Calculations for Pand Pe
nuclei О our present data A J.A.Pomin 1972 в H.V.Bradt; S.B. Rappoport 1968
• J.Kempa
fig.6. The hadron lateral distribution parameter S^ against the ahower size Ne
Experiments: our present data B.K.Chatterjee at al.1968 H.Haeegawa at al 1965 S.Miyake at al 1970 The hatching range is the calculation results.
I

112
of different energies, so it was possible to compare elopee of RQ(K ) only. There ia an agreement between various experiments.
The data of calculations is ahown in fig.6 also. The value of RQ increases with increasing lie according to experimental data, but it has to decreaae according to that of simulations.
The hadron energy spectrum may be obtained by integration of the lateral distributions for various energy hadrons in the fixed range of He( Д He) .Usually the approximation functions above mentioned were integrated for this purpose. But while as the used approximations comform to real functions at the measurable interval of distances В only,the slope and aboslute value of the energy spectrum considerably depends on the approximation form. The difference between hadron energy spectra of various experiments may be explained by this cause. The exponent QZ of our energy spectrum calculated in this way is '
Oh = 1 >7+0.2 for Bh^.1 GTev. But it is not correct because the approximation is valid at в "(l,5-5)m only. So,if the hadron lateral distribution received in simulations/ 9/ is approximated by o»exp(-R/R0) low at the same distance interval and energy spectrum is constracted, Qb will have the meaning of 1,5 instead of 1,0 from initial data / 9/ .
The large aiaee of our calorimeter permit us to constract the hadron energy spectrum without using an approximation. It was made by integration of experimental lateral distribution functions in bounds of the calorimeter. If. this spectrum is expressed by power low, the exponent Q is equal: 0 • 1,35+0,05 toe B n • (3-30) lev and $ " n - 0,95+0,1 for B h - (0,3-3) Tev.
The major part of hadrons of energies E ^ . 3 Tev passed close to the shower axis and went through the calorimeter; but an apprecable part of hadrons of S ^ O . 5 Tev passed outside the calorimeter .If this and threshold effects were taken into account the integral hadron spectrum could be repreeented by the united exponent'^ » 1,4+0,08 of the energy range Е ь«0.5-30 Tev in BAS of He £ 105 at Tian-Shan altitude (690 gem"2).

113
THE LATERAL AND THE ENERGETIC CHARACTERISTICS OF THE EAS HABROMIC COMPONENT AT MOUNTAIN ALTITUDE
Fart II. Diseution. The question about large transverse momenta.
Neaterova N.M., Romakhin V.A. P.N.Lebedev Physical Institute, Moscow, 117333. USSR The lateral and the energetic characteristics of
hadrona of the energytE> 0.3 Tev in air showers of size с
N ^ 10^ recorded by means of Tian-Shan EAS installation have been analiaed. These characteristics have been compared with data of other experimenta and simulations based on standart models. It is shown that the data of most experiments are in agreement. But it is impossible to agree the results of experiments with those of simulations in rather large interval of hadron energy and Ne. This discrepancy can be accounted tor hypothesis that features of inelastic nuclear interactions change at energy around 10'* ev. With this change the mean transverse momentum of secondary particlea increases up to <Pt> ^ 2-3 Gev/c when the energy of interacting particlea increases up to 10 1 6 ev. The lateral distributions and the energy spectrum of had
rona of energies 0,3-30 Tev in EAS of sizes N e > 105 obtained by means of Tain-Shah instillation were adduce in the first part of this paper /EA-35/.
It is difficult to compare various experimental data, because they dependant on the hadron energy B h , the shower size Me, the observation altitude and aoon .
The influence of these factors ia reduced, if the value of the product BhR ia analised ( Efa -is the hadron energy; R is the distance between the shower axis and hadron positions). The calculations show that E.B depends strongly from trans-vere momentum p^ and not ao atrong from other characteristics of inelastic nuclear interactions.There is a some dependence ot J.R from primary particlea atomic weight A.
The data of mean values <EhR> and<Eg><rR> against hadron

114
energy Ej, are represented in fig.1 and fig.2 on the bases of our and other ^*»6'7»e'experitnental results. <'BhB> ^ <E£> <P>
where n - is the number of hadrons in the energy interval д1!п .
<£><!>/'xev.iL/
Eh/Tev/
fig.1. The mean value of <EhE> against the hadron
energy Efc Experiments:
f our present data. i R.H.Vatcha, B.V.Sree-* kantan, 1973 f E.BShm.G.Holtrup, 1974. § our present calcula
tions, the broken line is the extrapolation
fig.2. The product of mean values <Ej><B> against the hadron energy Eft .
Experiments: f our present data Д R. Van Staa et.al. 1974 x S.Miyake et.al. 1970
Calculations: for primary nuclei of A • 1; 10 (thin lines) and A - 50 (wide line) о our present data
_ _ «i H.V.Bradt, S.Rappoport 1968 Our Monte-Carlo simulation on the base CKP model and results of other calculation /9/ for showers, generated by the primary nuclei with atomic weight A • 1, 10 and 50 are shown in fig.1,2 also. One can see from these figures, the experimental data are in good agreement. Various calculation results are in agreement between themselves as well. But experiments are in contradiction

115
with calculations. The experimental data at low hadron enegies (E h .5 0.3 Tev) ie possible to agree with calculations for the showers generated by primary nuclei of A » 1-10, as well as data /8/, while at higher energies ( »h Sf 1-10 Tev) for A-50 only. It is impossible to agree the experimental data for hadron energies B h£ 10 Tev with those of simulations if significant variation of elementary act characteristics is not supposed.
The data of mean values <BnH> and <Sy> <B> against the shower size He for hadrons of K h ^ 1 Tev are shown in fig.3 and fig.4 on the bases of various experiments (the present, 4,6, 7,8,11) and simmulations (one present and 9).
<:E • B>/Tev.m/
<E><K>/Tev.m/
10
3
1
"^""i^iil
h?1-у C^ ^ - - Ф » » _ _
*m • • ^
0 Tev
>0.5
> l . o >o.5 > 0 . 1
I04 I0J 10° 10' й„ fig.3. The mean value of <ShR> against the ~ shower size ffe Experiments s f our present data . R.H.Vatcha.B.V.Sree-5 Icantan, 1973 4 A.M.Bakich.C.B.A He Cusker et el. 1970 Calculations: fo? K n > 3 and 0,1 Tev § .our present data for
and experiment «ми шут.д.ищин terpo Л E.BBhm, Holtrup 1974 Bj^O.I Tev
fig.4. The product of mean values <B_> <B> against the shower size He _ м Experiments:
i our present data Eb»iTev | S.Mlyake et al. 1970
( » n>0.5 Tev) д R.Van Staa et al 1974 ( Kj^O.1 Tev)
The lines are results of our calculation for £. > 3; 1,0.5s 0.1 Tev.The brokenPlinea are interpolations.

116 While the experimental data in fig.3>4 increase with the increasing of Me, the calculated data decrease. To all apparance this contradiction between experiments and caloulations begins above Ne ^ 5.10 at the mountain altitude (He * 5.10 corresponds to the energy of the primary particle к s Ю ev).
In Xlg.5 le represented one variant of calculations where had assumed that A ~ B . for в -^10 ev* I n e experimental
fig.5. The produot of mean values <l n><R> against He 1'-
' ф our experimental data § our calculations for
A " 1 and A ~ , .
<B><M>/0ev.m/
dependence In fig.5 rises quickly than calculated one for A~K • о So this experimental dependence is not possible to explain from the point of view that there is a change of the prlmares composition only. These results permit to assume the changing of hadron interaction characteristics at energy ~ 1 С ev, and the transvers momentum may well rise.
The minimum of the mean value of real <Рд> may be obtained by assuming that detected hadrons had generated at the top of atmosphere and passed without interactions to the observation level. Then <PX> - E^B/h , where h is the altitude ( h * 20 1cm for A «= 1 and h « 30 km for A •• 50) .In this case the value of <Pj> . 2,0±0,3 Sev/c (A*1) and <P> • 30*0.5 Gev/o (A - 50 in showers generated by primaries with the energy s * 1,/ ev.

117
SO) the characterist ics of hadronio component of EAS of He > 10? at mountain alt i tude nay be explained only by supposing that there i e a change of elementary act at tbe energy about 10 ev. The mean value of the transvers momentum <P,> increase with increasing interacting part ic les energy to <Pj>^ 2 Gev/c at Е 0 ? Ю ev.
EBPEEEBCES 1 . A.D.Erlykia e t a l . Proc. 9 t h ICCH London_2,731 С 9 6 5 ) . 2. V.S. Aseikin at a l . Proc. 1 4 t h ICCH Munchen fii. 2607(1975). 3 . B.K.Chatterjee e t a l . Canad. J . Phye. J 6 . 1 0 . 136 (1968). 4 . E. van Staa, B.Aschenbach, B.J.Bohm. Phys. A. Math. Gen.
Huol.JL.1. 135 (197*). 5 . H.Hasegawa, Нота M.* Suga K. et a l . Proc. 9 ICCH London
2jt 668 (1965). 6. S.Hiyabe, K.Hinotani, N. Ito e t . a l . Acta Phys. Hong. 29.
Snppl. 3 . 451 (1970) . 7. R.H.Vatcha, B.V.Sreekantan. J.Phye. a. Math.Nud. , Sen. 6,
1050 (1973) . 8. E.Bohm, G.Holtrup."Core Struoture of the Hadron Component
in B.A.S.* Preprint .Lodz (1974). 9. H.V. Bradt, S.A. Eappoport Phye. Hev. 16ju 1567 (1968). 10.J»Kempa*Hadrons in extensive a ir shower etpreprint. Durham
(1975) . H.A.H.Baklch, C.B.A.MoCusker e t . a l . Acta Phys. Hung._22j. Suppl.
3.501(1970).

118
ENEKSY CHAHACSERISSICS OF EAS ELECTSOK-PHOl'ON COMPONENT AH 3 3 3 0 ш ABOVE SHE SEA LEVEL
V.S.Aseikin, S.I.Nicolsky, E.I.Suklsh P.N. Lebedev Physical Institute, Lenin pr.53» Moscow, 117383
USSB Lateral distribution of energy flux in EAS with tbe average number of particles 2,6.105-2.10° and of various age parameters was obtained en Xien-shan array designed for EAS study* Within the error limits this function being independent of the number of par tides in the investigated range depends on the age parameter. Xbe younger the shower the steeper the function of lateral distribution is. She obtained energy of the electron-photon component of the whole shower (460 Mev/electron) reasonably agrees with the results of conventional model calculations.
Sinoe the interpretation of the obtained by now EAS electron-photon component energy £ e.p./N » 200 iilev/electron /4,5, 8,9,10/ in the lower third of the atmosphere involves appreciable difficulties the study of energy characteristics of EAS electron-photon component is the immediate .point of Interest. She agreement between small experimental values and the calculated shower electron-photon component energy has not been achieved, at least at the mountain level. Therefore, electron-photon component energy characteristics were measured on Sien-2 Shan oomplex array /1/ (at the atmospherio depth of 680g/cm ) . In order to identify the axis and the number of particles in the showerj 100 scintillation detectors and four groups of Gai-ger counters placed in distance range 0-180 m from the array centre were used. A36 sq.m ionization calorimeter in the centre of the array was used to determine the energy of EAS electron-photon component.
She showers were studied with the number of particles H exceeding 2.Ю5 zenith angle less than 30° and the axis incident within 16 m side square. She array recorded such showers with the efficiency of 95*. She subsiquent treatment considers the data on 2992 showers.
She energy of electron-photon component was determined according tc cascade curves of electrons and; photons at different distances from the shower axis. With this purpose the average lateral distributions of particle fluxes jnr-,t,t/J/n reoorded by ionization chambers at the depth of lead t=25-820 g/om2 were found. These experimental distributions are distorted both due to big dimensions of a ionization chamber (300x22 cm2) and errors made in determination of the shower axis. In order to estimate the effeot of the above phenomenon, Uonte-Carlo calculations were carried out. Lateral distribution was taken as f(>") = const for r <. 0,2 m and f(i"j^t'n for /V» > 0,2m . She distribution of errors in the axis coordinates within the Interval of +1 - 1 m was taken rojulr. For the simulated axis location and the given lateral distribution of the particle fluxes the number of partioles having

119 passed through the ionisation chamber was found with the accouat for particle flux density variation within the chamber. Then the deviation of the axis from the true position was simulated. For the new axis position accounting for experimental errors and, consequently for the new distances of the chamber from the shower axis r lateral distribution of particle fluxes was determined according to earlier calculated ones which passed through the chamber. The difference between the given and the obtained lateral distributions is the unknown correction. These oorrections were taken into aooojmt_for finding cascade curve? at distances from the shower axis J>(i^J//y . These curves represent a sum of cascade curves from hadron and electron-photon shower components* An experimental oascade ourve j>a (t) for single hadrons with E>=8 TeV,obtained on our calorimeter /14/? *as used for their separation, substracting a hadron curve normalized to the total at the depth of 55-t units from the total cascade curve we finally, get an electron-photon cascade curve.
The density of the electron-photon component was found using the formula, •» — , , . „ ./
Е*p(W)A =Кь.р]вР*Р(*.г,ФA Nevm*electro* where p • 7,4 UeV is critical energy in lead /2$, t=*6,4 g/cm2 is casoade unit in lead /2/, K,« 2 is oopper-lead transient effect /3/. Ct
Lateral distribution of the density of the electron-photon component energy flux is independent of if for M«2,6.105 -2.106 (fig*1), within the limits ,of. the measurement error and can be approximated like: fap'S-r'^W**. Htftf* fer r-ea-3«i W
Fig. 1. Lateral distribution of electron-photon component energy in EAS with different slues.
While comparing different experiments the usage of electron-photon component energy per one electron £ is preferable since it rejeots the error appearing at determination of the number of particles in the shower. Tig*2 indicates lateral distribution of this value obtained in this work, at pamir /4/,
Uorikura /10/, Chacaltaya /12/ and li-shimura-Kamata calculation /6/ for the shower in the maximum of its development.
t * 156*15 MeV/electron at the distance of 60-80 m from the shower axis was obtained in the showers with the number of partioles И у 2.1О' . As it is seen from the .Tig*2 our results 1,5-7,5 times exoeed those obtained in works /4,5/.
Lateral distribution of eleotron-photon component energy in the showers

120 with the average number of partioles H«2,6.1o5 and different age parameters is given in Fig.3. Age parameter S io determined with the aid of Hishimura-Kamata funotlon /6/ according to the ratio of electron flux densities at 6 and 73 meters* distanoe from the shower axis with the aooount for transiet effect in scintillation detectore.Fig.3 indicates that the younger the showeri the steeper the electron-photon oomponent lateral distribution is and the bigger the absolute energy flux density is* This conclusion is qualitatively consistent with the
• ПСИ IHAN N" 2.1 И
• CMULTfcYA ( t t j
Fig.2. Lateral distribution of electron-photon component energy per one electron. All results have been re-normalised to our altitude
(68o g/om2)
Fig.3. lateral dist-reeults of /11 / carried out at the S U S S - ^ - l S S * " sea level, as well as with the S2S?«£SV?SPSb» conclusions of the electromagnetic S ^ - S ^ S R * cascade theory / 6 / . 5 r « e J r •
Knowing the lateral distribu- SSiSS"* * e e **" tion of the electron-photon oompo- rameisere. nent energy one can derive the energy in the circles of various radii:
£ef/tJ ( Г< SjtoJ я 1 3 6 ^ 0 M e v / e a e o t r o l I f ш £'p//i/ lr?-.W») - 283*20 Mev/electron.
In order to obtain electron-photon component energy along a l l the shower one must know the value of this energy at a l l the distances from the shower axis. We have got the eleotron-pho-ton oomponent energy measured for the distanoes of 0-13 m and 60-80 m. Assuming that the lateral distribution of the electron-photon oomponent energy within the range of 13-70

121
aetera' dlataaee froa the axle la expaeaaed by the power law and trylac ta аоЫата the ooaalataaoy of eleotroarphoton enor-flaa at theae diataaoea with tha experlaentally aeaeured valu-aa we «at «bat: feef>.(r)" rm''*s for r - 13-70 a. be* ue eetlaate the eleotroa-pbeton ooapenont along a l l the ahowar In aaauaption of the eaergy par она olootroc £ , 70 a «war froa the abower axla bela* oonataati f e e / * - 460 ± 80 Ker/oleetro Ska error ooaprieea alao tha naoertainty in tha abeolute oal l -bratlea of iaalaatioa ohaabera»
tha eleetroa-photon eoapoaeat energies of a l l tha ahowar •anal ta 200, 190, 330*65 ает/eleotroa ware obtained la / 4 , 5 , 12/ oowoapoBdlagly, earrlad omt at tha aountala altltadaa.
tha uaorepaaoy of oar raanlta and thoaa of / 4 , 5 / 11a taa aaabar of eleetrona la tha ahowar beiai,apaereatly, or eatlaated la the lattar work* aa i t was deteralned by tha electron flax deaaity at avail dlataaoaa froa tha ahowar axla (ay ta 10 • ) aad the m§» paraaeter 3 waa taken equal to 1,2| whereaa wa have S • 0,1-0,9 far r » „-2(Hiao a free the axla» Ska aeooad raaaoa la oopper-lead tranaieat affaot whloh waa 25* laaa la tfaoaa werka than la our'a»
She value 1 fT]t — 460*80 aeT/el oaa ha oonalataat with a wide elaee af oleaontarr aat aodala at ultrahigh energleB. froa aoaliag aodala ( ^ 550 aeT/electron /13/ ) to the aodala with high aaoaadary partlele aultlpliolty and atroag eaargy dlaalpatloa ( -v збТИваТ/eleotroa /13 / ) .
She ааемг of the eleotron-photon ooapoaeat waa ooapated la / 1 3 / far electron» and paotoaa with the energy greater than 3 ват» She above f l o r a e are obtained for the eleotrone aad yhetaaa with tha ввагсг klghar than 0 by lategratiaa ever tha eouillhrlua aaergy apeotraa»
Vnfertaaately, weak oeaaltlvlty of eleotroa-photoa ooapo-aaat energy to eleaentary aot paraaatera and big awaaureaeat errora dlaabled aa to aake a oonoleelon about the role of thia or that prooeaa la l i s feneration. On the other hand, tha obtained l i s eleetroa-photon ooaponeat energy oaaoela the earl ier difflonltlea l a Interpretation of thia value.
l a ooaolaaloa the authora extend their grateful tbanfca to the whole atnff of l i s (roup la the laboratory of coaalo Baya aa «e l l aa to the lien-Shan croup for aaaiatanoe.
вжшя» 1» S«F« lalaeva,
22. O.Z. Devjeako 3 . I.V.*etlaov, " 4» Yu»a*»Yavilev, . . 5. X.i.lyaaik, МГ (1967) Xheaya б» X»Eaaata and J.Viahlaura, J .Frog, theor. rhya.Snpl.1 6,
93 (195») 7. I.I*talaykov, YU»A»FeaiB, O.B.Khristlanaen Free. ICCB,
lebart, v .6 , 2074 (Й1971) a, S.l.Teraev, В.Ж.Оогуипот, Froo.XOOB Иоаооаьт.2, 117 (1960) 9. 8.fakai, ItBaaeeawa at al», suppl. of the Frog, of Sheer.
Fhya. Ж 16, p»1t(1960) lO.S.Xaaeoo, J aura* Fhya. 8oo. Japan, v»19» V 6, 785 (1969) 1la.T.BBaaritaoayaf Xheaya, И.О.&. (1971)

122
12. Escobar I . , Dooingo V. e t a l Proo. ICCH, Jaipur, v . 4 , 168 (1963)
13. Ъ.й. Dedenlco,. Iheeye *IAH (1968) 14* V.S.Aeeikln, A.P.Chubenko e t a l . , Proo. ICCE, Denver, r . 4 ,
2659 (1973)

123
FLUCTUATIONS OF MUON DENSITY OP EAS AT DftTEHEKT DISTANCES FROM THE AXIS
B.Betev, L.Katzarsky, I.Kirov, J.Stamenov, T.Stanev, S.Ushev and Ch.Vankov
Institute for Nuclear Research and Nuclear Energy, 111 Sofia, Bulgaria
K.V. Kabanova, N.M. Hesterova, S .I . Nikolsky and V.A. Romalchin P.H.Lebedev Physical Inst i tute , Koscow, tJSSB
V.D.ranminohev University of Shoumen, Shoumen, Bulgaria
We present results on muon density fluctuations (muon threshold energy E,a 5GeV) of EAS with fixed size in the central part (Г 4 10 n) and at distances <v 38 m and ~80 m from the axis. The data collected by the Tlan-Shan EAS arrangement show that, the relative 'development' fluctuations at fixed distance are independent from the shower size Hi for EAS with M4 from \Qr to 5.2x10 . The estimated 'development' fluctuations ®/§ are 0.46 + 0.o£( 0.46 + 0.03 and 0.37 + O.03 for the central part and for distances of 30 m and 80 m respectively.
1. Introduction. It has been demonstrated by model calculations, that*
the study of the fluctuations of the muon component of EAS, can provide
important additional information about the asymptotic behaviour of the
inelastic interactions and on the chemical composition of the primary
flux at energies above 10 eV. This stimulates experimental investigat
ions on fluctuations of the muon component, but the results published
up to the present (obtained mainly by observations at sea level) are Ц* still insufficient to make more* precise conclusions either about the act of interaction or about the chemical composition. Moreover, probably due to the different methods of observation and estimation, the data on the relative fluctuations, for instance, indicate a considerable discrepancy. The experimental dat-v and theoretical estimations for mountain altitudes are still scarce.

124 The present paper gives an analysis of new data from an underground
muon detector (muon threshold energy Е.» 5 GeV) of the Tian-Shan EAS arrangement. In analysing the data we proceeded from the fact, pointed out in I1] ( that the existing arrangements, the Tian-Shan included, measure only the local density in one or several points at a known distance from the axis. Therefore we have limited ourselves only to muon density fluctuations. These fluctuations have been investigated in the central part ( ' 10 ra) and at mean distances of 58 m and 80 m from the shower core.
Special attention has been devoted to the estimation of the so-called reception fluctuations. The total fluctuations were estimated applying a more precise statistical method, described in details in t J.
In LI we published preliminary data on muon density fluctuations at distances of 38 m from the shower core. As a result of some inaccuracies in the numerical calculations, the relative fluctuations obtained there were underestimated.
2. Experiment and selection of data. Data of the Tian-Shan complex arrangement (depth in the atmosphere of 690 g cm ) have been used. Detailed description of the arrangement has been given in Figure 1 shows a draft ,of an underground muon detector, consisting of 720 ohan-o nels of GM counters, each one with a sensitive area of 0.066 m . The total area of the detector, therefore, is 54-5 m .С marks the central group of 64 scintillator counters, which were used for selection of shower cores and for determining (together with other electron detectors, not indicated in the figure) the shower size in every individual case. A system of four fast scintillators measured the shower arrival direction.
The number of muon counters, at a distance of less than 10 я from the core as well as the number of those of them whioh had been actually hit was recorded for every selected shower. The number of counters hit was also measured in another group of 320 counters marked « . Events with cores located in the central square with side 7 m and 10' ± A/t & 5.6xl05 or in the central circle with a radius of 10 ш and ft)5.6x!0^
ft were used in the further analysis. The centre of the muon group is at a distance of 38 • from the oore.

125
Fig. 1. Layout of the experimental arrangement, l/ - central 'master' system, P - peripheral 'master' system,A - muon detectors in the central part (Г i 10 m),в - 320 muon counters at mean distance of 38 m, D - the whole muon detector (720 channels) at mean distance from P of SO m.
A system of 10 scintillator counters called peripheral and denoted by P on Figure 1 built a second array for selecting of showers. This system was located in such a way that the distance between its centre and the muon counters was almost equal. Events with cores located in a circle with a radius of 10 m and size Aj* 3.2 x 10' were included in the further analysis. The mean distance between the muon detector и and the shower cores selected by the peripheral system was' 80 m. 3. Data processing, total, reoeption and development fluctuations. The events were grouped in narrow intervals according to We (see Table l). The distributions of the counters hit in the groups ,4, fl and P has been constructed. If it is assumed that the gradient of muon density in the vicinity of these groups is negligible, these distributions can be described by the known formula M ,
AVW- (У/О-е''')''*'*"-""'*^ where M is the number of the muon counters and S - their sensitive area. In our case W i s 320, 720 and 40 n (n - 1,2 ...8) for group в, 0

126 and Л respectively. According to the selection and grouping of the events the function r(p) is a composition of the developaent and reception distribution of the muon density. Assuming that F(P) is a gamma-distribution, i.e. F(p) r of p*"* exp> (- лр) I Г(р) parameters 6. and f ware estimated with the help of the method described in [*] . The Jt> «test for all Mm) distributions was positive and so it does not contradict the supposed form of r(p), The calculated values of th* relative fluctuations of F(p) denoted by <5//g#* »*e shown in Table 1.
Tha term in Hp) resulting from the selecting conditions and grouping of the events was estimated by a Monte-Carlo' simulation. The choice of the size, arrival, direction and coordinates of the core* satisfied their observed distributions. The expected auon density was calculated according to the observed lateral distribution at this level [5J. The errors in determining the basic shower parameters were taken into account in the simulation. This produced the reception muon spectra, whose firat momenta were equal to the observed mean density. The cal
culated spectra were represented by the expression
$(r)= i>1 fP-АГ .е °1РГ'Уг %)
Fig.- 2. An example of th* translated gamma-distribution of th* simulated muon density distributions.
(Fig. 2). The three parameters b, <, and />e were estimated with the help of maximum-likelihood method. Th* %• -test in these cases showed a consistency with the supposed form of jffr). The oaloulated relative re-oeption fluctuations, denoted by (Г/р„с are given in Table 1.
Th* relative width of the density fluctuations characterising the longitudinal and transverse development of the muon component have been determined by subtracting the total and reoeption fluctuations. The result* have been presented in Table 2. The relative developaent fluctuation* in a funotion of tb* distances to the axis are given in Figure 5. The results obtained averaged the data given in Table 2.

127
Г*
• «-Н
1
«* ! « i*??-! г -1 "* | £
• О ш N
*
_£ 1Г™
1—1
1Сл
J. •* s;-** > с WJ
. L» ! *
в со кч н с
IS.
• о
< i .
v??-
•** ч)
-** JO» l >
• *
\4n
• «•»
*"£ > c
Ш 5 l o 4
***
te4
r—«
'Б
ron • *
Jf-8 Ш
1/4
s'° • * ' 3
. 1 1
1 1
1 1
1 1
• H ОЧ КЧ CM
• • о о о кч • •
4 0 см э
| Л о
а о
о о . э
0.08
н со ОЧ см оч см а Э
4 0 1-1
< •
см о
~йч" о
+1 • *
э
гЧ о . % ч
_2_ см ОЧ кч н
-sr кч о
* =.
о о о о А1 А1 $ ч$' 1Л 1Л о о
КЧ 1-1 СИ о о . . 3*
GO OJ О гН
• • о о t— кч CV О
•н
1ГЧ CVJ кч кч • •
о о Оч ОЧ о о • •
о . о «tftf 1ГЧ U4
о о
о о
о. °. К Ч 1ГЧ
* . о о КЧ Н t~ см F - К Ч
со см . . и кч 1 1
о со
1Г*
о
* о
?| оч i 4
о О ч о кч
1
1
1
1
чо . |ГЧ
см кч
\с\ •
OJ о •
н N4
• о кч 1Г\ ИГ»
•
•
1
1
о м J, •
со чо СУ СУ
« • о о
ЧО 1ХЧ о о • • эа • •
о э
сч кч о о • • ?|?|
р кч СМ КЧ •\ • о о * ич ОЧ 11*4 ич <м
-"!• кч . 1
о 4 0 о
3- • со ич о
•* о •
см 1ГЧ
о Оч СО 1 к ч
1 1
1 1
• 1
1 1
СО СЧ1 гН К Ч
1 1
О СО Я н
1-е-* со
. ~ > • -
*'« iF
СЧ
!
1 в к II S .
ы
Ь.
а* •S
Л> 1>
и
#
в о з: ь-
t o 1>
—•• н
i i
о см • И - Н
о о +1 +1
IT. f -
• • о о / Л f -о о о о +1 +1
*fr СО
• • о о
со си • •
н кч о со • •
ич и\ чо и\ э о о о о о о о +1 +1 +1 +1
со со оч чо кч кч кч кч Л * 9 • э о о о
VO чЦ- . «
• • • о о о +1 +1 +1 1
СО ЧО f -*t 4S- • *
о о о
1
4 0
см чо ' '

128 4. Conclusion. The following: main conclusions can be drawn from the present work:
(i) All observed histograms of the hit muon counters in the central part and at distances of 38 m and 80 • are compact. They do not show significant irregularity around low and at high densities. The assumed gamma-distributions of the total muon density spectra describe well these histograms.
(ii) The relative width of the development fluctuations 6/f at fixed size "t are relatively large at mountain altitudes. A comparison with sea level results shows that they are not significantly different.
(iii) The results show that there is a tendency of a decrease of the relative width at a larger distance from the axis.
(iv) The fluctuations are independent of the total number of electrons.
Bo detailed calculations are yet available suitable for comparison with the conditions of the present experiment. Some estimations in PI show that a better agreement with the observed relative fluctuations could be obtained for a mixed primary flux and high multiplicity.
Acknowledgements. The authors are grateful to Professor Ch.Chrie-tov for his allround assistance and useful advice. We wish to thank also all who took part in the KAS experiment at the high mountain station on Tian-Shan.
References. 1. B. ?irkowski, J. Gavin et al.' Proc 9th ICCH, London, 2,696,1965 2. В. Betev, т. Staner and Ch. Vankov, This Conference, Paper EA-UJ. 3. fl.V. Kabanova, I.л. xirov et al. Conference Papers 14th ICRC,
Munches, 7. IS» p. 4352 , 1975 4. T.P. Amineva, V. S, Aseikin et al., Trudi Ш П , 46, 1970 5. V.S. Aseikin, V,F. Bobova et al., Conference paper» 14 ICRC,
Mnsehan, V. в , p. 2807 , 1975 6. Vernov S.N. et al., free 9 th ICCR, 2, 769, London, 1965 7. b. Popov* , This Conference, Paper EA- 96, V.8, p.598,1977

129
The 3ner.;y Spectrum of the Primary Cosmic Kays in the Hange 1013 • 1016 eV.
T.V. Danilova, 11.V. Kabanova, K.M. Westerova, II.M. Nikols-kaya, S.I. Nikolsky ?.!'. Lebedev Physical Institute, Moscow, USSR L.K. Katsarky, I.N. Kirov, J.N. Stamenov, V.D. Janminchev Institute of Nuclear Research and Nuclear Energy, Sofia, Bulgaria
New data about the electron and muon number spectra were obtained at the Tien Shan complex array. These-spectra were analyzed and the primary energy spectrum in the en er^ region ИЯЗ-Ю 1" eV was constructed. The form of the cascade curve in the atmosphere was analyzed.
The study of 2AS muon number and size spectra are a way for the experimental investigation of the energy spectrum of the primary cosmic rays in the range of very high energies.
The characteristics of electron component were obtained from the information of scintillator detectors with an 2 effective area Л/38 m , situated in the central part and at distances 15, 20 and 73 m from the center, and of GH detectors
о (л/38 m ), placed at distances 20, 38,73 and 180 m. The characteristics of the muon flux with energy S > 5GeV were obtained with help of an under ground GK detector with an effective area A/53 m . In each shower a full complect of its parameters was obtained. The estimation of the absolute error values was carreid out by a total shower simulation /1/.
By the data treatment for л/4000 h effective running time of the Tien Shan complex array were obtained the integral muon and electron size spectra (fig.1).
Unlike our previous works /2,3/ now, $ae shower size was estimated with help of the Greisen approximation of

130
Nishimura Karaata functions. Аэ a result of this operation, a correction of the shower aizes by a factor 1.36 was obtained.
Ino shower aize spactru.. can be approximated by the power function F( >IL)«*N "**
6 6 *e •
1,70.10»< Nl < Ю* to6 </ife<7.W
1,52*0,02 2,071 0,04
The muon number spectrum can be approximated as well as by the power function J?(> Ём) л. КЛ */•
Fi,««fHirt'*')
JPiS 1. The shower size and muon number spectra 1. F(> И ) s 2. recalculated i?(>:;e); 3. H*i]fi)
11,9 010,02 7,4.10% Njȣt, 3.*
*S 12,5010.04 1,3. ifafyt 7. /0*
By an average systematic uncertainty in the muon number the "absolute intensity of the muon flux can be estimated with an accuracy not better than 14$. By the comparison of the both
spectra P(> Na) and Р>Ю with 0 8 help of the dependence &„«»K •
a good agreement is shown (figl). .From the size spectra measured
for narrow zenit angle intervals A 8 = 10° were obtained the average cascade curves N(X) in the atmosphere (fig.2) for the interval of intensities 10" 9<Р(>И В)<10" 1 2 cm"2sec"1st"1
W She Tien Shan cascade curves
are in good agreement with CKP model calculations /4/ for a mixed primary composition enriched with protons.

131
Ч
• -f
^mt . *
J?ig. 2. The cascade curve i'e(X0) in the atmosphere
1. H S U 2.#K.en Shan F( > M) ж 10~n
2.«Tien Shan F(>H)=3.1Cfn
3. /5/ H. Curve - /6/ plotted 7 dash J c^ves-/4/,
E 0 = const (p, Pe)
X.hu*'!
the ehacaltaya Ke(XQ) data /5/ are in agreement with this calculation only by the assumption that the primary composition consists of pure Pe.
By the assumption ot CKP model and primary composition rich of protons, the shape of the primary energy spectrum f(>£_) in interval of ens.gies 10 13 101b was obtained.(Fi3.3)

132
Viz. 3 . 'i'he primary enerjy spectrum in in t e rva l 101^-101^eV. Л - / 7 / , 3 - / 8 / , 0 - / 5 / „ D - / 9 / , 1 - / 1 0 / 2 - / 1 1 / , 3,4 - .?(> H0) r eca lcu la ted from ?( Ж ) and ? ( > ; ^ , i i e n Siian
1. J.!';. iJtamenov, E.;.i. Hikolskaya, -Cratkie soob. FIAIJ, v. 1, p. 25 (1976)
2. 7.3. Aseikin, J. Зепко et al. JPICCK, Kobart, v.6,p.2152,1971 3. V.S. Aseiicin, V.p. Bobova, A.G. Dubovij et al.
eiOO'd, iliinohea, v. 3, p. 2726, 1975 4. L.G. Dedenko, Dis., MAN, 1966 5. Bradt Ht, Clark G., La i'ointe et al. MCCR, London, 2,715,
1966 6. Hillas A., Hollows J., Hunter H. et al.
PICCa, Hobart, 3, 1007, 1971 7. L.iSf. Grigorov, I.A. Savenko, G.A. Skurdin et al.
Cosm. isaled., 5, v. 3, 396, 1967 8. G.B. Khristianaen. Trudi 6 zimnej skoli po cosmophizike,
part II, p. 2, 1969 9. 1'. Kaneko, 0. Aguire, Y. loyoda et al.
JrlCCU, EUnohen, v. 12, 4343, 1975 10. !•. Hlavac, ii.il. Keaterova, S.I. Nikolsky et al.
ЯССН, Budapest, "OG100, 1969 11. V.S. Aseikin, T.V. Janilova, Iv.V. Kabalova et al.
PICCA, Denver, v.4, 2599, 1973

133
ABOUT THE HIGH DEPENDENCE OF EXPENSIVE
AIR SHO'.VERS WITH ENERGIES BELOW 1017 eV
J.N.Stamenov, S.Z.Ushev
Institut of Nuclear Research.and Nuclear Snergy
Sofia, Bulgaria
On the basis of the size spectra,obtained experimenti-
cally at different observation levels,was analised the J2AS alti
tude variation.The sistematical distorsion of the used data due
to the characteristic of the corresponding experimental arrange
ments were taken into consideration.The obtained results were
compared with the model calculations.
The information about the longitudinal development of 17
extensive air showers with energies below 10 eV can be obtained
by the measurement of the size spectra F(>Ne) at distinct obser
vations levels Zo with help of complex arrays.The result functi
on P(>lJe,Xo)fNe»eonst (fig.1) reflects the high dependence of
Fig.1.The high dependence cur
ve P(>He,Xo),Kemconst of EAS :
1 - /9/; 2- /12/; 3 - /4/;
4 - corrected points from /4/

134
extensive air showers in the atmosphere.In big highes exist on
ly the information from airplane experiments from Antonov et
al./1/.By the comparison of this data ensemble with results of
Model calculations /2/ were obtained a very good ardument for
high multiplicity model of elementary interaction.This conclu
sion depend from the methodical confidence of experimental data
in interval 200<Xo<500 g.cm-2.
In this paper were carried out analyse of the airplane ex
periments of Antonov et al./3,4/ with the help of the total me
thod EAS simulation /5/.We simulated very carefully the airpla
ne shower array and the statistic data treatment were the same
as by Antonov et al./4/.In this case we obtained estimations of
the values of the systematical distorsions of the showers para
meters.On the basis of the calculations we assume:a constant
density of shower axis in a circle with H«70 mjzenith angle di
stribution W(9idA~CoS(qf4»i WW):const;the age parameter distribution as a Gaus law with <3"s »0,15 ; the size spectrum as F(>:i)~lf
and electron lateral distribution was described with ISia formula.
The same procedure was used with the Kiel arrangement and
we obtained control information about the valueo of the systema
tical diatorsion of tue anov.er parawetere.Our results are in
good agreement with the calculations of ICiel group /6/.
Information input in the calculations about the detector
characteristics in both cases was approximately good.
We estimated the follow values of the systematical distor
sions and of the average errors of the shower parameters in the
airplane experiments of Antonov et al.: observation level
Xo - 530 g.era-2 - « = 1 * 3 m; Eh * 0,45 - 0,05;(AWA)=-0,29 •
0,36 ; observation level Xo - 210 g.cm"2 - A r = 1 » 3 u; fa «
0,46 i 0,05 ; (AK/iO=- 0,85.
For this observation levels were calculated the systemati
cal distorsions of the shower aiae spectra /fi3.2/.'i!he systema
tical distorsions of the size spectrum for shower He,> 10 are
relativly small ^fs90 at level Xo»530 g.cm"2,and for Zo»210 gem
yrs4,0 + 5,0 also we have systematical overestiraation of the
absolute spectrum intensity l'(>Ke, Xo) about 4 * 5 tines.

135
Fig.2.The systematical
distorsions of size
spectra,mesured in air
plane experiments of An-
tonov et al./4/
With the help of the obtained coefficients Vf we corrected
Antonov's results in fig.1 but it is seen,that the methodical sa
tisfactory of the airplane data confirm the hypothesis about in
crease of the multiplicity in very high energy region.
In model calculations of EAS we can obtain the values of age
paraneters S„ and Sj /7,3/ which give a good characteristics of the
longitudinal and transversal development of electron-photon compo-
nente.In work /8/ is shown,that the relation is true /fig.3/s
S„- S x +AS , where AS>0,15
Fig.3.The high dependen
ce of the age parameter S
in extensive air shower ;
1 -/9/;2 ,/6/j3 -/10/;
4 -/11/;5 -/12/;6-/13/$
7 -/4/;8 - corrected points
from /4/j9 -/14/
tfj«'"7

136
The most modern data /416,9,10,11,12,13114/ are in good agreement with this relation,only the Pamir and airplane results give discrepances.In /5,15/ is shown,that Pamir data will be corrected by Ss m 0,3 • 0,4.
Xhe results of the total simulation of the airplane experiments shown,that there exist a systematical oversstimation of age parameter S by AS » 0,43 • 0,48.If we input the corrections of age parameter S in the Pamir and airplane results /fig.3/ we can confirm that the relation S ^ S^between the longitudinal and transversal age in good agreement with all experimental results
_ о for observation levels in the range 200 <Xo< 1020 g.cm .
Heferences /1/ Antonon R.A. ,lvanenko I.P. .Samosudov B.ii. et al,
PICCH.Hobart.S,1971,2194 /2/ Kalmykov N.N.,Khristiansen G.B.,Pomin Yu.A.,
PICCA,Hobart,6,1971,2074 /3/ Antonov H.A.,et al.Iav.AN USSa,v.30,10,1966,1640 /4/ Antonov a.A.,et al,Journal of Nuclear Physics,v.18,3,1973,554 /5/ Nikolskaja Н.И..Stamenov J.N..Kratkie soobstenija PIAN,1,1976 /6/ Stauber a.,Ihesisia,Kiel,1969 /7/ Dedenko L.G.et al.,£ratkie soobstenija FIAN,1,1976,25 /8/ Dedenko L.0.,et al.,PICCH,MUnchen,v.8,1975,2731
/9/ Christiansen G.B.,et al.,Izv.AN USSR,ser.fiz,30,1966,1690
/10/ Alexeev 3.H.,et al.,Izv.AN USSR,v.40,1976,994
/11/ Kijake S.,et al..Canadian Journ. Phye.v.46,1968,16
/12/ KatsarsicjF L.K.,et al.,Izv.AB USSfi,ser.fiz,v.40,5,1976,1004
/13/ Kaneko Т., et al.,PICCH,i!Unchen,v.8,1975,2747 /14/ Vavilov ZU.X., et al..Trudy l?IAN,v.26,1964,17 /15/ Aseikin V.S., et al.,PICCK,v.^f,1975,2307

137
WBl EXPERIMENTAL DATA ON THE EAS ALTITUDE DEPENDENCE IN THE UPPER ATMOSPHERE
R.A.Antonov, V.A.Astafiev, I.P.Ivanenfco.T.M.Kopylova Inst i tute of Nuclear Physics, Moscow State University, Moscow,
USSR Abstract» The experimental data on the BAS altitude
dependence up to altitudes of ~ 12 1cm for ~ 5.1CP - 5.Ю 6 EAS else obtained with a new array are presented. The array consists of several hundreds of hodoseopes arranged on a light structure of 30xJ0 • size which was taken up to the upper atmosphere onboard a balloon. Some, of the hodoscopes were arranged on an supplementary platform flown below the burns structure. The EAS incidence angles were determined by measuring the delays of the pulses from several spaced scintillation counters.
1. Equipment The array is schematically shown in ?ig.1. The array was triggered by the pulses exceeding V„ in each of counters IV, V, VI, and the pulses exceeding 1.5 V, in each of counters I, II, III* The value v. corresponds to the maximum of the distribution of the pulses from the total flux of cosmic ray particles through a scintillator. The pulses from counters I,II, III,IV were supplied to the threshold forming cells. The standard pulses rrom there cells were supplied to the deflecting plates of the 5-traca cathode-ray tube. Besides that, the pulse from counter V waa supplied, to the deflecting plates directly from the photomultipllea^ djwde through an emitter repeater. The hodoscope system consisted of Geiger counters of the MC-9 (•" 30 cm) and MC-13 < fif 20 cm) types operating in the controlled pulsed supply node. The counters at each of the hodosco-Slc points (except for the descended one) were arranged at a istanee equaling the diameter of counter, and the axes of a half of the counters were oriented mutually perpendicularly to the directions of the axes of the second half of the counters. This eliminated the possibility of responding of several counters to the same particle and decreased the dependence of the counter areas on zenith angle & . In the descending unit, each of the 688 cm2 area counters consisted of 8 parallel counters ИС-9 arranged closely to eaoh other. Table 1 characterizes the amount of the obtained experimental data. 2. The width of EAS particle disc. The duration or the pulse front in scintillation counter ( Г ) it • level of 0.1-0.9 of the amplitude value was taken as the measure of the width of EAS particle disc. Real values are a little less* Fig.2 present» the С distributions of the detected EAS. The resultant weak altitude dependence reflects the fact that the diffusion of the disc with increasing altitude due to an increase of the geometric length of the Molvere unit is compensated by increase of the. mean energy of EAS particles. Plg.3 presents the distributions of the detected EAS over At (the delay of the time of formation oj the pulse from counter IV relative to formation of the pulse faBm oounter V)* The distribution characterises the smearing of 4he arrival times of the initial particles

138
Table 1 Alti-tutdo, кш
total detec- EAS Number flux of all tine, ted with of EAS EAS, hour _1 min EAS, 0 0 0 ° with unto tal measurable anglea
EAS flux n for 0°, hour" .ster
sea le- 590 25 19 2 2.6+0,5 (I) 4.22+0.6 (I) vel 1-5 22" II 6 I 31.4+9,5 (12) 22.4±9 (5.4) 5-7 .10 23 7 2 153+70 (59) 61±23 (H.5) 7-9 9 27 8 I 203+.40 (79) 7474±26(17.7) 9-H.2 9 16 2 - 113+28 (44) 11,2 40 75 6 12 122+.14 (47) 13.8+5.6(3,3) of the sk*w*b front. A small systematic shift of pulsea Vf relative to pulsea V ia associated with the corresponding delay of the pulae in the forming cell. The pulse front structure waa observed in 5 of all the detected EAS. The second structure ie time-shifted by 30-45 nsec; the energy release in the scintillator correaponds to the passage of 1-13 relativiatic particlea. The nature of the structures may be aasociated with heavy penetrating particles and with the clusters of delayed particles.
Thesenlth and azimutnal angles of EAS Incidence ( £-endy ) were measured on the betts of the time shift of the pulses in counters II and I and II and III. The accuracy of the measurements of the time intervale (inoluding the stability of scanning) was ±5 msec,. She accuracy of determining the anglea © ia +4° for „6^^30°. As fr increases, the error also increases up to +7 at £ ~ 6 0 ° . Fig.4 presents the angular distributions of the detected EAS for the various observation levela.
Table 1 present the altitude dependence of all the detected SAS near vertical (the flux waa found ua-0 change over from the flux of vertical ^array to the flux of EAS with size > V is necessary to take account.of the ef-
w «.!.•• a c m uj. • i m u C O l l C C t i O n t . . . I*.*V«m-»*1««.-' */4*«г-'«-»«Л*-'- *?(&.?.,,/, W , « )
here K. is the length of the Holvere unit at a level above the observation level by г - а ч 9 - rad. unit; ft and ?, are the threshold densities of particles for the triggering system; тсТ,£? ia the function of-lateral distribution of EAS partio-lea. The calculated values <P for the various M and s are listed In Table 2.
Since the triggering counters are widely spaced apart,the dependence of Ф on the form of / and the value of «I is weak, ф is directly related to the form of the lateral distribution of the axes of the deteoted EAS. Pigs 5 present the calculated and experimental EAS distributions over X. .

139
Table 2
H.kml_2 *.gem «—
J'-*»' И 1.25 1.0 «.8 0.6
x Ю - * I(H>106y ,* , u ,J свГ^вес"
ater"1
I(H|-106) cm sec"1
eter»1
О 1030
5-7 485
7-9 366
11.2 223
* )
'%
395.
240
1'5 „ 1.5*2.С
1.5 K8
1.5*2.0
1.5 1.B
1.5+2.0
1.5 1.8
1.5*2.0
>iS 2.7 3 .0 4.2 5.0 2.4 2.7
2.7 4 .2 2.5
2 .3 .10 " 1
2.5 4.3 2.4
1.9 2.1 2.6 3.2 1.9 2.2
7 .0 .10 •11
8 . 4 . Ю ' 1 1
( 4 .6+1 .0 ) . 0-12^
(1 .4+0 .5 ) . .1TJ-10
(1 .7+0 .6 ) . .10Г-10
1 .8 .10" 1 1 (3.6+1.4). .10-11
к) Ы «1.5-» V «2 .0 near the value Jfty) ~ 5 .Ю-' 'cm^sec-, JT тл a t e r - 1 ,
for 6-»o* ( i t ia assumed sfe."*»*^ ) , normalised to tbe data £3] and aea l e v e l . (The accuracy of the absolute valuea Ф i s the factor 2 -2 .5 ) .
вв)
The complete aet of the obtained experimental data on the individual BAS, and the EAS with 0->3O° will be published presently. The иве of the widely spaced triggering counters combined with the hodoBcopic system has made it possible to obtain the direct experimental data on the degree of the fluctuations of the form of the particle lateral distribution at distances ~ 10 • within the BIBB of thg_arrax*_ In the presence of such fluctuations, tbf particle deMrfnsj detected at points 8,10,12
at points 7,9,11. Table 3
The points of registration-. 11.2 km, all EAS ь» 8+10+12 7+9+11 The responding counters | 5lS ]\ 793
The вата related to the product of the number of all counters by the IAS number
9TF Q.245+,0.008 0.211+0.008
11.2 Icm, 30° 8+10+12 7+9+11 53 54 0.177± 0.180+. 0.024 0.025
It follows from Table 3 that the fluctuations of the function of particle lateral distribution are not observed within a ~15J6 accuracy.

140
Fig.6 and the table 2 presents the altitude dependence of EAS with N >-106 .
I view of the importance or the conclusion ensuring from the experimentally observed high intensity of SAS in the upper atmosphere t U £27 , one of the main aims of the present experiment was to obtain similar data in an independent experiment with a new array essentially different'from the earlier array.
The comparison of the presented results with the results obtained earlier makes it possible to safely confirm the conclusion of the high EAS intensity in the upper atmosphere,which was shown earlier to require the assumptionjlof a significant increase in the multiplicity Of the particles generated in the interactions at л> 10'5 eV.
The authors are indebted to V.G.byutov for hie participation in preparation of the equipment and carrying-out the experiment. £s£ej / 1 / - R.A.Antonov, Yu.A.Smorodin, Z.I.Tulinova,
I f f i T f e i 1865. 1963. / 2 / - R»A.Antonov, I.P.Ivanenko, Z.I.Tulinova, Sov. Nuclear Physics, 18, 554, 1973. / 3 / - H.Bradt e t a l , Proc. ICCR, London,2,715,1965. / 4 / - A.E. CkudaJcev et a l , Proc.ICCR, Moscow, 2,47,
1960. / 5 / - T.P.Arainjeva et a l , Izv.Akad. Nauk SSSR, s e r . f i z . , 33, 1508, 1969. / 6 / - S.H.Vernov et a l , Canad.J. Phys. 46, 197, 1968. / 7 / - H.H.Kalmylcov et a l , Proc. ICCR, Bovart, 6,. 2219, 1971. / 8 / - J.-N.Capdevielle et a l . , Proc. ICCR, HUhchen. 8, 2920, 1975.
at
or
„,
5*.
«I
«° o9
-a*
H
sc&t «<*««. (вл?м*> : Г I L a-A-a
!A hvti • П
W ^ I I I I I I l f iy |W|ffm>n|n n ••*" km ' JTl—
ма ttvtt
n **T l
Sr±S km.
i*lt,Z.km
ii.Z L "I ,
,^ЦМДЦЧцт|и
ttec -40
bf, ' l • 1 1 • 1 1 1 1 1
iWpiP, 1111 | • I
to л%я *" flfc.3

141
« 1
0
1*9 k* distance t* Ьл eatii (Ых,т.)
Si4kmf-\0 *
чДЬ
* /Г 30 «Г 40 KM че to v? *
Fq.H
tOO Ptftml

142
THE ANALYSIS op> EXPERII 'ENTAL DATA ON THE PARTICLE LATERAL DISTRIBUTION AT LARGE DISTANCES FROM THE AXIS IN EAS WITH THE TOTAL PARTICLE NUMBERS i O 7 - 1 0 8 .
V.B. Atrashkevich, O.V. Vedeneev, G.V. Kulikov, V.I. Solovjeva, G.B. Khristiansen
Institute of Nuclear Physies,Moscow State University;Moscow, USSR. ABSTRACT
The comparison is presented between the experimental data on the particle lateral distribution at distances "P to 3.5 Moliere lengths
in the showers with particle numbers 10 7 -10 obtained with the array of the Moscow State University and other data . The data from Moscow, Yakutsk, Sydney and Volcano Ranch (for the zenith angle of 36°)are in a good agreement for the average lateral distribution function. A marked disagreement is observed between the data from Tokyo and Chacaltaya (for the zenith angle of 60 ) on the one hand and all others data on the other hand. The analytical form of the average particle lateral distribution in the showers with N above 10 and the information about the fluctuations of the structural function.are also presented.
The lateral distribution of charged particles in EA S of s ize N above Ю 7 was studied by various groups of scientists using quite a number of experimental arrays at s e a level /1-5/ and at mountains /6,7/.
Used in most arrays /2-4,6,?/ as the charged particle detectors are the scintillation counters which are known to give a distorted value of the charged particle density at the location of the detector due to the transient effect . A more correct value of the density may be obtained using Geiger counters / l£ neon flash tubes /4/, and spark chambers /5/. The last two works (/4,5/) are featured by that the charged particle density was measured by a single detector at a given distance from EAS axis. Bes ides that, the values other than the charged particle number (the total muon number /5 / and the value of the Cerenkov signal in a water detector at a 500 m distance from EAS axis /4/) were used in those experiments a s the measure of the shower size. This necessitates the use of additional experimental and theoretical information to get a possibility of comparing of the results obtained in /4,5/ with the rest experimental data .
Pig. 1 shows the mean density of charged particles a s a function of distance obtained in / l / for Е A S with zenith angle of arrival Q ^- 30° and N - 10 7 - 2 x 10 7 ( N » 1.5 x 1 0 7 ) . « h e axes of
the displayed EAS were within a circle of a 9 5 # probability of detection; the charged particle detectors were located within the same distance intervals from the EAS axis .
The distance from the EAS axis is measured in Pig. 4- in Moliere units. Plotted as the ordinate i s log(fRj/A/) , where i i s the mean density of the charged particle flux, R. i s the Moliere unit (in meters), N i s the total particle number . The figure also presents the data of other experiments «called to the s e a level . With this pur^ pose, in particular, the inclined showers ( В - 36 /6/ and V - 6 0 /?/) were examined in the sea-level experiments and the,value of the Moliere unit was chosen to correspond to the attitude of the observation

143 level above sea level . The total particle number N was estimated
by the authors themselves. In the experiment /5/ , in particular , the position of the axis and the s ize were determined using the tnuon detectors , while the total particle number N was estimated an the basis of the total muon number using the information on the charged particle number-to-muon number ratio /5/ .
It will be noted that the muon content did not exceed ~* 10% in the selected interval of distances ( up to 280 m from the shower axis) /5/.. Therefore, Insertion of the coefficient I?2 for the value plotted a s the ordinate is quite justified. At greater distances the coefficient R 2 i s of formal character.
The presented experimental data correspond to N close to 1.5 x 1 0 .
The figure also shows the results of our measurements in the range 3xlO?<N<6 x 10 7 which coincide, within the measurement errors, with the results for the 107<N < 2 x Ю 7 interval.
It will be noted that a slight steepening of the lateral distribution with increasing the shower s ize observed in /2,6/ (to a greater degree in /6/ a s compared with /2/) . According to the data of /4/, however, the shape of the lateral distribution is independent of the shower s ize .The strict determination of this dependence is the task of the future but it is already clear that the dependence obtained in /6/ i s too strong and cannot be confirmed by the data of /2,4/.
The experimental data on the lateral distribution of charged particles at small (below 0,6 R ) distances from EAS axis also shown in Pig. 1 have been obtained by us in Е AS with smaller s i z e s ( Л/ r" 10 ) .
о The lateral distribution of charged particles for N ~ 10 shown in
E-'ig. 2 could be determined in only three showers. Pig. 2 also .presents for the comparison the mean lateral distribution for N - 1.5x10' .
It can be seen from Pig. 1 that the experimental data of /2,5,6/ (curves 1,3,4) agree with each other and with the results of our ex periment. They contradict, however, the data of /3,7/.
Pig. 3 gives the comparison between the mean functions of lateral distribution of charged particles normalized at point R - 3R . Therefore, the figure also presents the data of /4/. The arrows show ще boundaries of the intervals of the examined distances R from EAS axis. The following intervals were used: 16-280 m /l / , ~ 40-470 m /2/, 10-550 m/3/, 100-400 m /4,5/, - 100- * 1000 m /6/, 16-460 m /7/. The intervals of distances R for /2,5/ have been taken to be somewhat smaller than those given by the authors since we disregarded the experimental points determined within greater errors than in / l / . Unfortunately, such procedure cannot be applied to the data of /3,6,7/ for the authors do not give the errors of their measurements.
It can be seen from Pig. 3 «that in the interval R, < R < 3 R the data of /1,2,5,6/ on the slope of the lateral distribution function0
are in a good agreement with each other. A good agreement between the data of /2,4,5,6/ can be also observed at great distances ( 3 R <
< R < 5 R ) from EAS axis . The data of /3,7/ and ( for die-tances emails? than «/ 2 R ) /4 / are drastically at variance with the above presented consistent data . The flatter shape of the lateral distribution function for the data of /4 / can be probably explained by inaccuracy in determining the position of EAS axis с
The deviation of the data of / 3 / i s orobably due to the disregard of the zero detected values of particle density at great distances, and the deviation of the data of /7/ may be associated with a large transient effect for 0 - 60° .

144
sient effect for 0 - 60°. Thus, it may be probably asserted that there exist sufficiently
determined information at present about the mean lateral distribution of charged particles at s ea level in EAS with N ~ 10 in a 10-fold interval of distances from the shower axis ( from <-» 0.5 to ~ 5 IWoliere units), i.e. in the interval used in practice when detecting large EA£ and is also interesting to the detection of EAS of even greater s i z e s . In this connection, the measurement* of / l / may be used a s the reference data in view of the use of Geiger couriers and small «pacings between the detectors in / l / . .
At distances exceeding one Moliere unit from EAS axis, the lateral distribution of particles in EAS with N - 1.5 x 10? corresponds to the Nishimura-Kamata-Greisen function with the parameter Е -1 .33 . At smaller distances, our experimental data ( relating, true to smaller N) satisfy the dependence of the same form as the Nishimura-Kamata-Greisen function for S - 1.18. After normalyzing this dependence at the point R - 4? m to the mean density of charged particles observed in / l / , we took it as the approximation formula for distances smaller than 80 m. The data of / l / are shown in Pig. 1 taking account of the des cribed approximation.
We have obtained the data not only an the mean behaviour of the lateral distribution of charged particles but also on the fluctuations' of this distribution. The lateral distribution was approximated by the Nishi-mura-Kamata-Greizen function with parameter S . The S distribution of 133 individual showers with N - 10 • - 3 x 10? was obtained . If the Nishimura-Kamata-Greizen function is approximated by a power function with exponent ft- in the interval of distances of 0.6-3.6 Moliere units from EAS axis, the n-distribution will give the RMS deviation from the mean value VXHh-ff) " 0.2 ( s e e Ff&.4). The error in measuring n is 0.08 and was estimated by Monte-Carlo drawing of artificial showers and finding the standard deviation of £ in such showers.
The fluctuations of the lateral distribution function were estimated in /2/ (true, l e s s safely) for 13 individual showers and proved to be v'D (n _ >T ) "~" 0.1.
Thus, the data on the mean lateral distribution oi charged particles in large EAS have been obtHned with various EAS arrays, and an agreement may be stated between the measurement results obtained at Moscow State University / l / , Yakutsk /2/, Sydney University /5/,and Volcano Ranch /6/ within an accuracy of ~ 10% .
The Haverah-Park data /4 / on the slope of the lateral distribution function at R > 2 * Ro correspond to the data of /1,2,5,6/. The flatter shape at smaller distances i s proabaly explained by a greater inaccuracy in locating the EAS axis.
The pronounced disagreement between the lateral distribution functions obtained with the Tokyo /3/ and Chacaltaya /7/ arrays and other data has not been explained as yet. The disagreement may be associated with the great importance of the transient effect in the scintillation counters of there arrays. In any case , the steepening of the lateral distribution function obtained at Chacaltaya / ? / at в т 60° as compared to the function obtained in Tokyo /3 / seems to be associated with the rise of the importance of the transient effect for Q - 6 0 ° (due to the increase of the traversed thickness of scintillator).
We propose the following approximation formula for the mean density of charged particles observed in large vertical EAS at s e a level:

145
-ОМ .-Д32.
09цлФг1-&) (i4) шо~
REFERENCES: 1. S.N. Vernov, G.B. Khrietiansen, A.T. Abrosimov, V.B. Atrashkevich,
LP. Belyaeva, G.V. Kulikov, V.I. Solovieva, S.A. Sumarev, Yu.A. Pomln. Izv.Akad.Nauk SSSR, ser.fiz. 22, 458 ,1968.
G.V. Khristiansen, O.V. Vedeneev, G.V. Kulikov, V.I. Nazarov, V.L Solovieva. Izv.Akad.Nauk SSSR, ser.fiz.35,217 ,1971.
2. O.S. Diminshtein, T.A. Egorov, N.N. Efimov, N.N. Efremov, A.V. Glushkov, L.I. Kaganov, M.L Pravdin, G.B. Khristiansen. Proc. Int. Conf. Cosmic Rays (PICCR), MUnchen, 12, 4334 ,1975.
3. S. Kaviaguchi, K. Suga, H. Sakuyama, PICCR , MUnchen.8,2826,1975. 4. P.R. Blake, W.P. Nash, R.B. Strutt. PICCR, MUnchen, 8,2773, 1975.
P.R. Blake, W.P. Naah, R.B. Strutt. PICCR, MUnchen, B, 2778, 1975. 5. A.D. Bray, b, Goorevich, b. Morton, C.B.A, IWcCusker, L.S. Peak,
R. Rapp, J. Ulrichs, M.M. Winn . PICCR, Munchen, B, 2762, 1975. 6. J. Llnsley .PICCR, Jaipur, 4, 7? ,1963. 7. T. Kaneko, C. Aguirre, Y. Toyoda, H. Nakatani, S. Jadot, P.K.Macke-
own, K. Suga, P. Kakimoto, Y. Mizumoto, K. Murakami, K. Nishi , M. Nagano, K. Kamata. PICCR, MUnchen, 8, 2847 ,1975 .

146
Fi3' f Fi3' Z
FIG.l. The mean lateral distribution of .charged particles in EAS with total particle number N - 1,5 x 1 0 . ' T V
о - the present experiment ( 10?'•£ N <- 2 x 10 ); _, x - the present experiment ( Э х Ю 7 ^ , N с 6 x 10 ); о - the present exphifnent ) ( N ~ 10 );;
1- Yakutsk array / 2/j !i - Sydney array /5/; 2 - Tokyo array /3/; 4 - Volcano Ranch array /б/)
S - Chacaltaya array /7/. The arrows indicate the boundaries of the rangee of the measured distances from the shower axis. •
PIG.2. Lateral distribution of charged particles in individual БАЗ with N %> 1 0 8 .

147
tyR*y), m\t unit»
I4G.3. The mean function of lateral distribution of charged particles normalized al point R •= 3Ro (Ro is IVIoliere unit at the observation level altitude .
1 - the present experiment; 3 - Tokyo array /3/; 2 - Yakutsk array /2/j 4 - measurement data from
Haverah Park /4/; 5 - Sydney array /5/j 6 - Volcano Ranch array /б/; 7 - Chacaltaya array /7/.
W(n) 0,4
0.3
0,2
0.1 - Ч - М /
\
2,5 3 n
L^IG.4. Distribution of the exponents n of the lateral distribution function^ of charged particles in EAS with N ranging from 107 to 3 x 10 . The dashed line is the Gausslon distribution with the dispersion corresponding to an error of 0,06 in measuring П .

ЬЬПооодЧ 148
STUDY 01" EAS MUOH COMPONENT G.B. Khristiansen, G.V. Kulikov, A. P. Lebedev, Л.Л. Silaev,
V.I. Solovieva Institute of Nuclear Physics, Moscow State University.Moscow,
USSR N. Sirodzev, B.M. Makhmudov
Samarkand State University,Samarkand, USSR. ABSTRACT: The data on the correlation between the lateral muon distribution and parameter S are presented together with the average functions of muon lateral distribution for EAS of various sizes. The found functions of muon lateral distribution are used to plot the dependence of muon number on electron number and to calculate the dispersion of the muon number distribution at a fixed electron number. The experimental data on the angular distribution of EAS axes are also presented.
The experiment described here has been carried out with the EAS array of the Moscow State University /1/. Thhe accuracy in determining the main EAS parameters with this array is indicated in /2/.
The angular distribution of EAS axes was found for the showers of sizes Jfi. " 105-10" in the range of zenith angles
9 . 0 ° - 40°. The probability of detection of such EAS exceeds 0.95 and was determined as a function of the EAS size, the parameter S, the zenith and azimuthal angles. The experimental data on the angular distribution may be described by the relation X ( 6 / ~ C o - s n e ( see Fig. 1). The power exponent П • 9 ± 1 and was found in accordance with the results published elsewhere.
Main attention was paid whens studying the EAS muon component to the correlation between the shapes of the function of muon lateral distribution and the function of electron lateral distribution characterized by the parameter 5 .
The number of the detected EAS muone was determined on.the basis of the data from an underground detector with a 37 m2 sensitive area. The muon detector consisted of 1122 Geiger counters of 330 cm2 are located at a 40 m.w.e depth. The minimum energy of the detected muons was 10 GeV.
The mean muon deneity Pfi was found by the maximum likelihood method /3,4/ which made it possible to take account of the cases with small numbers of detected particles (including the cases with zero of muon detector response ) and to calculate the mean muon density of a set of showers with different sizes on the assumption of a known relationship between the mean nuon density and EAS size J'bich, according to the earlier data, is of the form J>(*'~jr£'' . In determining the mean muon density at small distances ( l * 10 u) from EAS axes the muon detector was divided into parts and then the distances between EAS axes and the centers of groups of 12 or *

149
18 counters were found. Further, the found distances were to'cen into account to divide the Groups of counters ассол-ditij;, to the intervale of distances and to calculate the total area of the groups of counters and the number of responding counters in each interval of distances. In determining the mean muon density at the distances exceeding 10 n from EAS axes, the number of the responding counters over the entire area of the muon detector was related to the diottuice from the EAS axis to the center of the detector.
The functions of the muon lateral distribution were constructed for the showers whose axes were at less than 30° to the vertical.
The muon lateral distribution in ЕЛЗ with sizes M « 2 X 10->- 10" was studied at distances of up to 50 m from ESS axis, which was in corifoi-mlty to the requirement thr.t the showers with different values оГ 3 should be detected within n probability exceeding 95$. To study in detail the correlation of the form of the muon lateral distribution with the parameter ,5* t *toe showers were broken into five groups each of which was characterized by a narrow range of the values of в ( A d ~ 0 . 1 ) listed in Table 1 together with the mean value $ in each group .
Table 1
A S 3
h
A l 0.92
O.75±0.05
hO-1,1 1.05
0.54+0.04
U1-U2-t .15
0.55±0.04
1.2-1.3 1.25
0.53+0.04
0.54+ 0.02
> 1 . 3 1.35
0.4C+0.04
The obtained experimental lateral distribution of muons was approximated for each 5 group by the functions of the type
f>p~ Z~nexp (- Ъ/я)гт~&ъ1ЪЪ R ж 80 m . The form of the approximation was chosen on the basis of numerous data on the mean functions of the muon lateral distribution. The values of the power exponent n. determined for eech S group of showers by the method of least squares are listed in Table 1.
It can be seen from Table 1 that the greatest difference in the exponents П is observed for the "youngest" showers with iS * 1 . According to the data on the distribution of EAS, the share of the showers with & * 1 fails to exceed 10%. For the intermediate S • 1 -1.3f the form of the lateral distribution function ie practically the same. The "old" showers with 4»? 1.3 seem to exhibit a flatter rauon lateral distribution. The-experimental data on the muon lateral distribution in EAS of various ages are displayed in Fig. 2a.
It is interest to elucidate the problem of the correlation of the function of muon lateral distribution with the form of the function of electron lateral distribution in EAS of

150
large size recorded at great distances. With this purpose, we used EAS with J*k m 10' - 5 J 10' in the interval of dis-tancee t m 10 - 165 m from EAS axis. To construct the functions of muon lateral distribution for the various values of the parameter 5 , the showers were broken into three S groups. The relevant S intervals and mean values are listed in Table 2 Table 2
A S
5 Y\
* 1 . 2
1.14
0.84 + 0.03
1.2 - 1.4 1.3
0.72 £ 0.02
* 1 . 4 1.48
0.72 i 0.03
The showers were so groupped to ensure a sufficiently good statistical accuracy the each group of showers. Selection of S the said intervals is associated with the fact that the mean value of 5 for these showere is p •> 1.33 ± 0.01 * ) .
The lateral muon distribution in EA3 with ^ ё * 1 0 ' for the various values of S are shown in Pig. 2b. The experimental data approximated by the formulas of the same form as those for the showers with smaller -/V£ . The values of the exponent Ю. are listed in Table 2. It can be seen ffom Table 2 that the form of the lateral distribution is a weaker function of S as compared with the showers with -/t£O0° . As to the absolute value of the muon fluxes, it follows
from Figs 2a,b that the muon content increases with 5 . The total number of EAS rauons, -Л^й , was determined taking
account of the dependence of the lateral muon distribution on 5 . ' The increase in $ observed in EAS with . Л ^ Я О 7 as compared with the mean & • 1.10 ± 0.01 characterizing the mean lateral distribution of.electrons in the central part of EAS with vV£ « 2 x 10? - 10b may be explained bv the contri
bution from the partial cascades generated by =r - mesons produced in the nuclear interactions during EAS development in the atmosphere. Aa the distance from EAS axis increases, the contribution from the old partial oascades coming from high altitudes also increases, which results in a flatter shape of the function of electron lateral distribution at great distances from the axis in the real EAS as compared with the electron-photon cascades.

151
The found numbers_£f EAS muona woe used to determine the mean muon number Mm and to plot the muon number distribution at a fixed eleo^tron number.
Fig. 3 presents the dependence of the mean muon number on the electron number. Presented for corapariaon in the aame figure ere the"data obtained using the averaged function of moon lateral distribution /2/. It can be seen from Fig. 3 that the inclusion of the dependence of the muon lateral distribution on •» confirms the relation between the mean muon number and the electron number established earlier to be of the form
Jff, = ( 3.24 ± 0.22) x Ю ^ И ^ / Ю 5 ) 0 ' 7 8 * 0 ' 0 1
in the studied interval of ^ « 105 - 5 x 10'. Fig. 4 presents the values of y&/JSL characterising the relative width of the distribution 'at fixed Л 5 ( D -is the dispersion of the distribution) found with due arfcount of the dependence J®ftiCl>&) » which are in agreement with the results obtained using the averaged lateral distribution of muons /5/. __
/— The experimental data on the dependence of Jf/и and Vz>/Jfa on «Ve are compared with the scaling model calculations in /6,7/ . The comparison shows that (stt Figs 3 and 4) that the scaling model oaloulations mads on the assumption that the primary cosmic raya are purely protons are drastically at variance with the experimental data ( the value's of VO/A/L from /7/ relate to the «- 0.3 GoV muons; the valuea will be smaller for the muons with energies exceeding 10 OeV). The assumption that the primary cosmio rays consist of heavy nuclei ( for examplei iron nuclei) will result in an increase of the muon content but give an even larger disagreement with the fluctuation data. It was established that the lateralxmuon distribution in EAS with V V J ? 1 0 ' is,steeper than the lateral distribution in EAS with vVJ*10 ; the values of the power exponent are respectively П m 0.72 ± 0.02 and Г\ - 0.52*0.02 if the experimental data are approximated by the functions of the form ~ Z~"«xp (-T /80) .
Comparison of the experimental lateral distributions of muons with the calculated distribution is difficult beoause of the disagreement between the calculation results obtained by various authors. REFEREHCESs 1. S.N. Vernov, et al. Izv.Ahad.Nauk SSSR, ser.fis.32.456.t968. 2. G.B. Khristianeen et al. 2zv.Akad.Rauk SSSR.aer.fis.35.2107
1971. ^ 3. G.B. Khristiansen et al. 14th Int.Conf. Cosmio Rays,
Munchen, 8, 2801,1975. 4. G.B. Khristiansen et al. iBv.Akad.Nauk SSSR, ear.fit.40. 991 ,1976. 5. S.N. Vernov et al. Acta Phye. Hung. Aoad.Sol. 29 Suppl. 3 429 . 1970. 6.H.H.Kalmykov, G.B.Khristiansen, JETP Lett.21,666,1975. 7. J. Elbert et al. Preprint University, of Utah , 1976.

152
Fig. 1 . The SAfc aneular diatributiori
\%^
•9,4 •
N.'W
•>< <•< t j lH . 1
Ijfft»'!
N.= 2-10
4 г a I
Fifl. 2. Tha a lataral cUatribution functiona with various Value» of S a) EAS with N - 2.105 - 1 0 е
b) EAS with tha Na - 10 7 - 5 . I0 7 . Tha curvaa praaant tha functiona of tha form
Ьчы

153
• - 4 » - г
\bU\W\ j Ч
Pig.3. The dependence
1 - the present nkork, 2-/2/. The dashed curves is the approximation of the experimental data.
5 6 7 Fig.4. The relative standard
dependence of deviation of the muons number on the electron number. 1-the present work 2- /5/. The curve ©hows the calculations /7/.
Pig. 5. The averaged muon lateral distributione in EAS of different s izes . The curves show the functions of the form
| | , « « < - $ > • «
ytw

154 SOME FKATUKES Of SUPERHIGH iHKBGY BAS AT SEA LEVEL
Dlmineteia 0.8., Egorov I.A., Efimov Я.И., Glushkov A.V., Kaganov L.I., Kuzain A.I., Maximov S.V., Pravdln M.I.
Institute of Cosmophysical Beeearch and Aeronomy, Yakutsk Branch, Siberian Department of the TJSSR Academy of Sciences, Yakutsk,USSR.
On the basis of the experimental data from the Yakutsk EAS array the structure function and size spectra at various depths are analyzed. The size spectrum in the size interval 5 • 10^-10^ is not consistent with single power law.
1. Method. A distinction is to he made between size determinations fo» each shower and the estimation of the average size for a fixed value of some classification parameter. For Yakutsk ar-rey it is the particle density at large axial distance (300 -600 m) (the corresponding mean "scintillator" size ie Ng). It is known that this quantity ( PQQQ ) fluctuates weakly in the models where it reaches the maximum near the sea level.
She fact that the density at large axial distance has its maximum deeper than the total number of particles can be established in the electromagnetic cascade theory and the maximum position for Pgnn can be estimated from empirical data [1]. Therefore we take in the first approximation that our classification of showers corresponds to the fixed primary energy.
The existing uncertainty in a structure function at small Oistances gives an uncertainty of our size determinations ~ 25 per cent at И * 1 0 8 and — 40 per cent at N ~ 5 > 108.
Besides the shower size the empirical Intensities are to be correctly calculated. This is connected with some difficulties in the case if the shower parameters are determined- from measurements made by a small number of detectors which take part in shower selection. In the last results obtained at the Yakutsk array there existed some difference in spectra measured by the central part of the array and by the main part of the array with 1000 a spacing [2, 3]. In the central part within 500-m circle there are placed 16 stations, 9 from them take no part in shower selection. The rest detectors at distance > 500 m from the center are used for selection. The simulation of the shower selection

ISS
Fig.1. Ihe dependence of lateral distribution function "Ь" parameter on the atmospheric depth.
1000 1100 1200 1300 t, gem'
and analysis in the presence of instrumental errors and structure fluctuations demonstrates that in fact an increase by «-'0,2 in spectral slope and — to per cent in intensity at B 0 S* 2-1018ev is to be expected.
Another approach consists in using the method which would lead directly to correct intensities. By essence, some integral equation for the spectrum is to be solved. In f 4J we had proposed an approach based on the refusal from the deterministic parameter estimations ("random likelyhood method", HIM). According to this approach it is assigned to each shower a series of para-esters which are produced by a random way according to likely-hood function and the spectrum in successive approximation.
2. Beaults. The dependence of the structure function on the shower ill* was given in [2, 5 L la this paper we give more Mount» data ra the dependence of the structure rfuactlon on the atmospheric depth. The results for showers with E0~*.1017ev are shewn la Iig.1. «he lateral distribution is in satisfactory agrtsawat with «he following formula!
Sao result of the analysis of so far registered showers oaa be expressed by the following dependence of the parameter НЪИ oa the shewer else and the senita angle*
* • 1.65 • г oos6 • 0.1 lg (I/108)

156
20 ДИ,«Г' Ш " Ю 0 . «•* 30
Pig.2. EAS spectrum obtained within cos * 0,8. Black circles indicate data of the central part of the array; light circles - data from the main.array geometry; squares are Agassis's data [6].
for axial distances 90-4-50 m, 6**5*. In Fig.2 there is shown the size spectrum at the depth
1020 gem calculated from the same showers that in [2] with this difference that points at 4 • 108<:H -<109 are calculated by SIM. Power law spectrum with slope Ж в 2 is used as the first approximation and only instrumental errors are taken into account. As well as "in the case of simulation a good agreement of the intensities at H ~4>10 8 can be obtained. It means that fluctuations of the structure function contribute insignificantly in the distortion of the spectrum provided the "hard'* selection, criteria f2 J are used. The last lead to the exclusion of the most of the events from the spectrum. A reason of principle of such a limitation is the necessity to take into account the fluctuations of the structure function. The requirement that all the showers with given B 0 were selected with probability — 1 results in the exclusion of the most of the showers.
In Fig.2 the results from Agassis experiment taken from [6] in "scintillator" units are shown.

157 Fig.5 shows the constant in
tensity cuts according to present result and [6] . The values of corresponding absorbtion length agree with the formula that we use for conversion to "vertical" •iset A e= (250 + 25 lg(H/108) )
in the depth Interval 1000 -1300 gcm~*.
3. Discussion. The obtained spectrum is hardly consistent with single power law. At H>2-10 8
se s 1,50 + 0,25 eeems to be most convenient being derived by the help of structure function which depends weakly on the size that differs from [7, 8].
Intensity to the empirical ( PZQQ ) spectrum as well as in [2, ifis 3 times lower than in [8] that is in the first series
Ю
Ю'
Я * А
Ю*А
6
a>
7 — — , —
t о
0
700 900 «00 O00 atmosphwic depth.gem'1
Fig-3. Lines of equal intens i t i es according to data of Yakutsk (circles) , Volcano Bunch (triangles) and Agassi!: (squares).
of Yakutsk measurements.
4. Conclusions. At present we are finishing the data treatment of the Yakutsk array for 1974-1977 using the* single method. If the obtained shower spectrum Is confirmed, then i t will indicate the change of the primary energy spectrum or the characteristics of interaction at >0~101 8ev.
B E F E E E H C E S
1. A.V.Glushkov et al. Ixv. AS SSSB, ser. fis., 40, 1023, 1976. 2. A.V.Glushkov, O.S.Diminetein, N.K.Bfimov, L.I.Kaganov, II.I.,
Pravdin. "Kharakteristlkl shlrokikb atmosfernykh livnei kos-mleheskikh lucbel sverkhvysokikh energii". led. Ya? 80 AN SSSB, str. 45, 1976, Yakutsk.

158
3. O.S.Diminetein et al. Measurements of the Primer; Energy Spectrum of Superhigh Energy Particles. Beport of Leeds Symposium, 1976.
4. O.S.Diminetein. Byulleten' NTI, Isd.Yat SO AH SSbB, 197£i Yakutsk.
5. O.S.Dlmlnatein et al. Proc. ICCB, Uunchen, Л£, 4334, 1975. 6. J.Linsley. Proc, ICCB, Denver, jjt 3207, 1973. 7. J.liaeley. Proc. ICCB, Jaipur, 4, 77, 1963. B.T.A.Egorov et al. Proc. ICCB, Hobart, 6, 2059, 1971*

159 COSMIC RAX ВгаСТНШ IN THE RANGE 1017- 1020 eV
Э.Р -jaailnikov. M.N.Byakonov, T.A.Egorov, I.M.Kerschenholz, V.A.Kolosov, A.I.Kuzmin, V.A.Orlov, I.Xe.Sleptsov
Institute of Cosmophysical Research & Aeronomy.Yakutsk Branch, Siberian Department of the DSSE Academy of Sciences, Yakutsk,
USSR
On observation data at the Yakutsk SAB array xi.« cosmic 20 ray energy spectrum at energies to 10 eV is obtained which has the ankle near 10 °eV. The differential spectrum being described by a power law has exponent» -3>0* 0,05 below the ankle and -2,12*0,36 above it and the integral spectrum -1,96 * 0,06 and -1,48 * 0,26 respeoti-'vely.
1. It is advisable to base an estimation of the MS primary particle energy S. on such shower parameter which depends weakly upon different assumptions about the shower development. According to calculation results (Bgorov et al. 1971, Byakonov at al 1973, etc.) Яцоп- atmospheric Oerenkov light flux density at shower core distance 400 a as such parameter was used in analysis of Yakutsk SAS data.
Our recent results of calculations of the shower development fluctuation effect on Ощх) for shower models HP (Dyakonov et al.1974) and СЮР (DiScon and Turver,1974) in Table 1 are presented. According to our preliminary estimations approximately the same results are obtained for showers arriving at zenith angles Q * 20° and 40? Relation between BQ and Q ^ Q taking into account m.s.r» fluctuations at 0°< 0 < 40° we find in the following form: лл tQw. 9т 1,03 '
B0 « (1 * О . З ^ Ю ^ х р 0 0 / ™ 7 ] eV (1). 2. Recent preliminary indications of the energy spectrum slope flattening above 10 'eV from the giant IAS arrays observation data analysis were obtained (Xrasilnlkov,1973, Krasilni-Krasilnikov et al.1975, Watson,l975, Dyakonov et al.1976). Here the results of the energy spectrum determination in

160 -,20. 10 eV range according to the Yakutsk EAS array observation da
ta are presented. In analysis the showers observed at б< 60° during total time of 13*655 hours are included.
TABLE 1. BAS atmospheric Cerenkov light at depth 1020 gem for B 0= l0 1 7eV. » - total flux; I (200-550) - flux in core distances interval 200 to 500 m; QgOO' %QQ and QecQ - flux densities at core distances 200,400 and 550 »t H - particle number, И - mean value, D - a.s.r. deviation.
Jft
! i S, ph 4 ,18*10^ . P( 200-500) ,ph 1 .43И0 1 2
420Q, ph/m2 5.7В«ю£ 4 ^ 0 , ph/m2 1.4-3*10° 0=501 ph/m2 6.73Ж105
W% 50 a*7l 7 H.(1020), part3»32*10'
! ffi/B 0.04 0,04 0,05 0.06 0,10 0,15 0,48
| 0ЮР
I « 4,69*10пг
1,49ж1012
б,51*10б
1,44*10б
6.34Ж105
10.9 2,82*107
I VS/Я 0,11 0,18 0,13 0,21 0.26 0.26 0,44
The total number of shower particles IT in arrays with widely spaced detectors (in our case at 1 km one from another) is difficult to determine because of the absence of Information rbout particle density near shower core. At the same time 0 600-- particle density at core distance 600 m is such EAS parameter the determination of which at the Yakutsk array depends weakly upon not yet enough studied EAS particles lateral distribution function (see also Dimiaetein et al.1975). In present w o r k Q 6 0 0 as initial parameter in analysis was taken.
Belatlonship between 0 g00 and (^Q was determined by us in the same EAS events (Dyakonov et al.1975) where both 0 &QQ and O^oo w#r# >l>ultan«ouBly measured and it is as follows t
Ъ»«П = (3-2* f.0XWltff8 5 ± u 0 5 m2 (2) where в -0°corre«poAds to observation depth in Takutek Xo=f020flCm2

161
From (1) and (2) we find that BQ depends upon ^ 600 °°^ as:
E0=(W±0.3>?019[^!1]1 eV (3) In W.g.1. the SAS integral sp"ectra"bn Ogp^Q) observed
at three zenith angle intervals 0°-30°, ЭО°-Ч-5 and 45°-60° are shown.
M.g.1. Observed integral spectra 9600 at aeni*n
angles 0°-30°(1), ч.\ 30°-45° (2),
10 J. +5°-60° (3) and E. reducted to depth ? XQ« 1020 gcm~2(4).
tgpr-™-
Using to every shower event a dependence of the form:
where ^ftoo» *00 gem*2 for <45° and 650 gem'"2 for 45°< 8 < 60° (as it follows from presented data) the shower integral spectrum at X0 is obtained. The last is also shown in Fig.2 (at right upstairu) and approximated by power law:
F[>$WXo)]»(2.25*a«>» It* PeooCV 20 '
•1.«1±0.20 n s'sr"1 (5)

162
Using dependences (4) and (3) and taking shower collecting area limited by the array perimeter (17 lain plane of detector placing) on 40 MB events with E^10 °eV observed at the Yakutsk array during the considered period the differential and integral energy spectra are obtained. Results in Fig.2 are given.
Ю •28
Ж
irfM
a)
-В--Ы-.if и
M-3 1020eV r e -
* o - I x - 2 + - 3
3 . • - k
0 — Q - - 0 -x x K
M x" "« 12 i
b)
5- 3j.+.Jtt* 1 1 _ _ 1
The energy spectra at Е < 10 ,19,
fig.2. Cosmic ray differential (a) and integral (b) spectra in 3x10¹⁷. gion according the Yakutsk EAS array data. 1-Krasilnikov et al. 1975; 2 and 3 -respectively according to p 2 0 0 and PgQQ selection criteria from Diminstein et al. 1975 with our corrections; 4-pre-sent work.
eV according to the Yakutsk array data published in (Krasilnikov et al.1975, Diminstein et al.1975) are also shown in :Fig.2 The spectra obtained by two methods O^QQ and -.Calorimetric" methods, correspondingly had less than 2-time difference in the intensity in interval 10 to 10 °eV. The difference becomes significantly small if to take into account the possible 1,37 times in average energy underestimations in (Diminstein et al. 1975) *hat follows from our ';(Calorimetricn reestimations (see Table 2).

163
во" V Bel + Еуи + В* Ж
+ \+ B n d where E±, TABLE 2
Е' and 'nd energy dissipated in air by e, f* - components and nuclear disintegrations» B e l and Bu - energy possessed at observation level by e+ph, nuclear active and f* - components» E^ - neutrino energy (in Ю 1 7еУ units).
Authors Diminstein et al.1975 Dyakonov et al.1976
в 19° 37° 19° 37°
Е, 3.27 4.9* 3.86 6.40
Eet Ер 0.43 0.51
0.28 0.32 0.24 0.54
Ф | Bnd 0.06 0.05
0.28 0.15 0.46 0.26
*>0 3.76 5.5 4.89 7.90
The calorimetric method was at first used succesfully in work (Hikoleky,1962) for EAS of BQ~1015eV. But the method use in the Yakutsk array where detectors are arranged far apart one from another,etc meets certain difficulties.
In Fig.2 the results of work (Diminstein et al,1975) accor-1s ding to mentioned above reestimations are shown. Near 10 eV there is a tendency of spectrum irregularity (see also Diminstein et al, 1972; Diminstein et al.1977). Ebis problem requires further researches in more detail.
In approximation by a single power law in whole interval 3x10¹⁷ to 1019 we have the spectra:
E0 i-XO*Q05 J(E0)dE0=(6.0±o.5>io30*[ffe]""'*MMdE0 ,m2s'sf'eV-'
1(>Е0)=СДО±0.3>Ю,2*[-^] Lven in Fig.2 resul ts show thai
E 0 -1-1.96*0.06 m 'sr"1 (6). Given in Fig.2 results show"that cosmic ray spectrum near 10 °eV suffers the break towards flattening above this energy. In . 1.5*10 '-10 eT the spectra are described as follows;
1(>Ео) = (^*аб>ю' |А4^Г9] -t.48*0.26 in s &r r-l (?)

164 References. •Biminstein O.S., V.A.Kolosov, D.D.Krasilnikov, A.I.Kuzmin, V.F. Kulakovskaya, V.A.Orlov, I.Xe.Sleptsov, N.N.yefimov, T.A.Yego-rov, S.N.Vernov, G.B.Khristiansen, S.I.Nikolsky. 3-d European Symposium on Coamic Bays, Paris, 1972. Diminstein O.S., T.A.Bgorov, H.N.Efimov, A.V.Glushkov, V.M. Grigoryev, L.I.Kaganov, I.J.Makaxov, M.I.Pravdin. 14-th ICCE, Munchen, Conf. Papers 12, 4318, 1975. Diainstein 0.8., T.A.Egorov, N.H.Efimov.et al. Paper BA- 44 this conference, 1977. Dixon H.B.and K.E.Turver. Computer Simulation of Air Showers. Private Communication, 1974. Dyakonov M.N., V.At.Eolosov, D.D.Krasilnikov, V.P.Kulakovskaya, P.P.Liehchenyuk, V.A.Orlov, I.Te.Sleptsov. 13-th ICCH, Denver, Conf. Papers, 4, 2384, 1973. Dyakonov M.N., I.M.Kerschenhols, S.P.Knurenko, V.I.Kozlov, V.A. Kolosov, D.D.Krasilnikov, A.I.Kuzmin, V.P.Kulakovskaya, F.F.Li-shchenyuk, S.I.Nikolsky, V.A.Orlov, I.Xe.Sleptsov. Xzv.AK SSSR, ser. fiz., 38, 999, 1974. Dyakonov M.N., A.A.Ivanov, S.P.Knurenko, V.A.Kolosov, D.D.Krasilnikov, V.P.Kulakovskaya, P.P.lishchenyuk, I.Ye.Sleptsov, S.I. Nikolsky. 14-th ICCR, llunchen, Conf.Papers, 12, 4339, 1975. Dyakonov M.N., V.A.Kolosov, D.D.Krasilnikov, I.Te.Sleptsov. V sbornike "Kharakteristiki SnAL kosmicheskikh luchei sverhvy-sokikh energil", Yakutsk, -37, 1976. Bgorov T.A., V.A.Kolosov, D.D.Krasilnikov, V.P.Kulakovskaya,V.A. Orlov, I.Te.Sleptsov. 12-th ICCR, HoDart.Conf,Рарегз,б,21б4,1971. Krasilnikov D.D. 13-th ICCR, Denver,Conf.Papers,4, 2393, 1973. Krasilnikov D.D., V.P.Kulakovskaya, V.A.Orlov, V.N.Pavlov, Z.Xe.Petrov, P.K.Shamsutdinova. 14-th ICCR, Munchen, Conf. Papers, 12, 4347, 1975. Nikolaky S.I, Proc. 5-th Intern. Seminar on Cosmic Rays, La Paz, 2, XXII, 1962. Watson A.A. 14-th ICCR, Munohen, Conf.Papers, 12, 4019, 1975.

165
аишш мзяюсдамоя гшюхюя or нлгаюма иг здв m s швшх ЖШВ «ДО Ю**? «Г
JeJUSUMbte О.Т«аи4р1а* A,A,upoUlkav iff***"**.,?? c«e^hy»K>ai ВммигсЬ «aft Aa*oan*j,Xakaft* Щ и к . ataaxla* Mpaitaaa* «r xtm ива доадов/ of 8«1ааом,хавд2пюв1
ж
OetMtev of a w t n u in MS oeapeaitto» «a tat aaaU •f Ш-6* aaatroa aoatto* oaateoUaa ay ш lapalaaa «f tba Xakutak tars» u s «яяаг *• daawAbaa. iMUatauqr saaolta obtained after tmtt—at of авм «мв ЬтпЛкшй i l imri oa tba y t i * 1 aJjaciKbloD. funrtlua of aawfeceaa u * aaiaaaUa. tar а и м м «# • Ю7 a* «ot «lataaaa Ю0 • 800 a treat «ha oora tha faaefclm ***• «*U tot
at 3.7 (Ottawa)
£Mf«aaor Л.Х.КшвЛп Institute ox СаааарвуаЮа! Baaauea аад Aaroaoagr, lata** 677007» овя*

166
MEASUREMENT OF THE LATERAL DISTRIBUTION IN INDIVIDUAL EAS OP ENERGY 1017-10ieeV
J Lapikens, H" M Norwood, R J О Reid, S Ridgway and A A Watson Department of Physics', University of Leeds, Leeds 2, U.K.
The presence of fluctuations in the lateral distribution of EAS of mean energy £- "ь 3.1017eV is confirmed and provides an estimate of the corresponding fluctuation of the source heights which contribute to the response at an axial distance of 100 a. The derived value of 110 i UO g cm-2, together with the mean value of the lateral distribution, suggests proton primaries and high multiplicity at this energy.
More accurate measurements, using additional detectors within the central area of the array, which are now becoming available are discussed.
1. Introduction , Measurement of mean values of-observable parameters in EAS permit,
at best, only a weak indication of the mass of the primary particle as such mean values are also sensitive to the assumed characteristics of high energy interactions. However, for a wide range of models of nuclear interactions, Hillae et al. (1971), find that particles of the same energy produce showers which differ significantly in their development only if a long interaction mean free path is assumed for the primary particle. If large intrinsic fluctuations in the development of showers of the same primary energy are shown to exist then the evidence favours either a composition containing a major proportion of protons or a mixed composition containing particles with substantially different interaction mean free paths.
Model calculations, (Hillas et al. 19T1; Dixon et al. 1971*; Lapikens 19Jh), have identified a number of development sensitive parameters which can be measured by a detector array of reasonable dimensions. This paper describes the measurement of one such parameter-the deep water Cerenkov detector lateral, distribution function. Lapikens (1971*) has shown that the parameter B(50) = p(50)/p(500) is strongly correlated with the mean depth at which the primary particle releases its energy into the air shower cascade, B(50) changing by * 75)t for a developmental change of 100 g cm-2 in atmospheric depth. Thus the variation of B50) at fixed primary energy provides a simple methoM of estimating the variation in the interaction points of the primary particle.
B(50) is also expected to vary slowly with primary energy, E„, because the cascade development maximum moves deeper into the atmosphere' as the energy of the primary particle initiating the cascade increases (tee e.g. Hillas et al. 1971). A parameter of the type
" ^ / j A w u *8 ma"'^y dependent on the multiplicity, ns, ' ' of secondary particles produced in high energy
interactions. Thus, both the mean value of В and the measurement of ^g/ limit the range of tenable models used to evaluate
'\Jl**€.p °ir shower data. Well determined model'constraints

167
would considerably simplify the task of estimating the primary cosmic ray composition from the observed fluctuations.
The method of determining the lateral distribution parameter p(r)/p(R) is illustrated in Figure 1. The shower core X is surrounded by three small detectors Q. A simple geometrical analysis shows that the density at a distance ъ r can be measured independently of any assumed lateral distribution function. The ratio of this density to the density observed in the large area detectors О is the parameter, p(r)/p(R). It should be noted that our choice of r « 50 m, R = бОО m is not critical - B(50) can be uniquely related to other similar parameters e.g. p(70)/p(5oo) or P(l00)/p(600)
using only the reasonable assumptien that f(r) is continuous and single valued. The choice of r should however be large enough to ensure that the majority of showers have at least one observation at a distance < r.
The first part of this paper reviews earlier measurements of B(100), Edge (1976). A further year's B(100) measurements are added to the earlier data and the limitations, of the measurements are discussed.
In the second part of the paper we make a preliminary assessment of the resolution of B(50) now possible through the recent introduction of 20 additional detectors - the 'infilled' 500 m array.
2. B(IOQ-) measurements The measurements of B(100) are based on measurements of the four
detectors of the 500 m array and the three central 150 m detectors. Edge (1976) has concluded that the variation in B(100) is substantially greater than the measurement uncertainties of this ratio. Apart from the small collecting area (0.03 km2) over which measurements are possible there are other important limitation'! in these measurements. In the first place B(100) is expected to have less sensitivity to changes in shower development than has B(50). (The calculations of Lapikens (1971*) . suggest only about half the expected change in B(50).) Secondly,the dynamic range of the three 150 m detectors had an upper limit of 120 m~2
D Figure 1
Determination of B(r) P(R)

168 (c.f. the. present dynamic range vhich is lj mar up to > 101* m - z ) ; this factor means that in the larger, showers (Epi 6.1017) there is a high probability that at least one of these detectors will be saturated giving a deterioration in core location and hence in measurement of B(100).
Using the same criteria as Edge (1976) the data, grouped in four zenith angle bands up to Uo°9 are shown in Figure 2, together with the results of simulations representing the measurement uncertainties in vertical showers (в < 33°). We support the earlier conclusion that intrinsic fluctuations of about 24% in B(100) are present in these showers. Edge also shoved that fluctuations in B(100) are veil correlated with fluctuations in the risetime parameter tj of Watson and Wilson (197Ц). We have used a rather different approach to show that both sets of fluctuations are consistent with a common origin in the longitudinal development. The critical question of measurement uncertainties in B(lOO) is also re-examined.
For Ep i 2.1017eV Ы600) S 0.3 $Гг) the dominant uncertainty is in the density measurement p(600) Ь 30JS) and the smallest showers in this group are too close to the triggering threshold of the array to be able to
30
ao
10
20
is ю
1. a. SO о
tt
r to
to
4 & m«\o.V\Ons
в <!XO'
J V
" - 1 i n , —• " —
30*$в<35*
J Hk„ ?5»4в<ло*
аоо
Figure 2
300 -BOoc?) B(l00).Distributions • '
exclude the possibility of а biased sample. We have therefore retained only 121 event» for vhich p(600) > 0.3 m-2 and в < 1(0°. For these showers the uncertainty_in B(100) depends mainly on the disposition of the detectors relative to the core and must therefore be assessed for each event. This has been done by performing 10 simulations of each shower taking full account of sampling measurement errors and saturated detectors (31.out of 121 events had one saturated density). For each zenith angle band the meanuncertainty in B(100) is < 15* and the vidth of the measured distribution is not set by showers for which the measurement uncertainty is abnormally large. The weighted mean intrinsic fluctuation in B(100), o(B) is 32.3 + 3.9 for events having p(600) > 0.3 (121 events) and o(B) • 29.1 +, 3.5 for р(ё00) > ОЛ m-2 (76 events). The very restricted

169
range of size precludes the possibility of establishing any change in the mean value of B(100) with p(600) ^R/ \ j s • in consequence it is possible that the intrinsic /e*~fcp » fluctuations quoted, which are based on a constant mean Value for each zenith angle, overestimate the true fluctuations. The variation in the mean value of B(100) as a function of zenith angle is well represented by B100) • U37 - (300 £ 80) sec 8. We can therefore express a change - ДВ(100) in terms of the increased atmospheric depth which would give rise to this change. Thus the fluctuations o(B) can be used to infer a corresponding fluctuation in the atmospheric depth o(X) of that region of the longitudinal development which is responsible for the response at an axial distance of 100 m. The derived values are o(X) • H O + hO g cm-2
(p(600) > 0.3), ff(X) • 100 + l»0 g cm-2 (p(600) > 0.1(). Bearing in mind that it has been assumed that there is no variation of B(100) with p(60O) these values are upper limits which are consistent with o(X) • 70ilDg cm-2 deduced from the measurements of tj (Barrett et al., this Conference EA 48). In so far as the mean B(100) is substantially' smaller than that predicted by model calculations - see Edge (1976) -our data are in agreement with the conclusion of Barrett et al. that a high multiplicity and proton primaries are indicated at this energy.
Future Work The 'infilled' array (Edge et al., this Conference_T 36) which
has detectors on a grid spacing of •<• 150 m over an effective area of л, 0.3 km2, has provided measurements for the majority of showers which fell within the boundary of the 500 m array since November 1976. In this array more than 75? of the showers will have the closest detector within the range 35-75 m of the core. In effect the core position is determined by the remaining detectors while the closest detector is used to obtain p(50); uncertainties in the measurements of a single detector could therefore give rise to apparent fluctuations in B(50). To search for rare, extreme fluctuations produced by primary particles of long interaction mean free path, it is essential that the measurement technique does not suffer from occasional extreme measurement.errors and therefore that the detector response is accurately known and consistently reliable. Analysis of recorded data to date has therefore been concerned with evaluation of detector performance and this has proved entirely satisfactory.
An example of a moderately large shower (Ep ч> 2.1018eV), which also produced measurable responses at two of the 2 km detectors, is given in Figure 3 where the densities are shown in the shower plane. This shower can be analysed in a variety of ways. Firstly by identifying 3 detectors which surround the core and for which densities differ by a factor of < 5 it is possible to determine the core position accurately without any prior knowledge of the lateral distribution. In this example U20, 158 and 1U0 m~2 are the chosen densities and if one assumes, over a very restricted distance range, a lateral distribution f(r) a r~n the data require 1.6 < n < 3.2. For this wide range of n the detector having a density of 580 «Г2 ie always at the same distance 73 + 1 m from the core. In fact the uncertainty in the core position (X, Г in-the shower plane) is greater than this, but even if а 10Ж error is assumed in one of the detectors 'ringing' the core the uncertainty is about * t m moving the core relative to the closest density by < 2 m. The lateral distribution for the complete shower is thus determined for a distance range 73 +, 2m to I68O ra.

170
Alternatively the shower can be analysed using a -lateral distribution of the form f(r) о r_ln i7o5o>over a wide range of r and varying n to find the best fit. This has been done (a) excluding the four largest densities from the analysis programme which finds the core position (as these detectors are known to lie within 150 m of the core), (b) using all densities. For this event the 3 lateral distributions are indistinguishable (the radial distance of the closest detector being T^m for both (a) and (b) ) and the data are best fitted by a lateral distribution n of 2.05 which is th_e mean value used routinely in shower analysis for this zenith angle range. For this shower the parameter B(50) is known to within * 10%. For smaller showers the precision will not be so high because of the increased statistical uncertainty in measurements of p(600) but should certainly never be appreciably more than 20!( for
Conclusion
Eve.,*. W S * 5 2 2 0 6 »Mr* 0*2СЯГ
Com». fOVtttoft
& , а Л АЛЛ «V £.2. ***• WO
/
• И А ,5а Н
%г ч-* га
яда 5 0 0
Scale
showers having Е > 2.1017eV.
Further analysis of the shower parameter B(100) confirms the conclusion of Edge (1976) that substantial fluctuations occur 4n showers of mean energy 3.10 eV and it is shown that these give an estimate of the fluctuations in longitudinal development which is in reasonable agreement with those deduced from the pulse rise time measurements (tj) (Barrett et al., this Conference EA l»8). However the resolution and range of data do not permit measurement of any change of B(100) with primary energy.
Ihe performance of the recently commissioned 'infilled' array is shown to be capable of measuring fluctuations in the lateral distribution of showers having primary energy к 2.1017eVwith good precision.

171
Acknowledgements
We gratefully acknowledge the financial support of the Science Research Council.
References
Hillas et.al. 2972 Proc. 13th Int. Cont. on Cosmic Bays, (Hobart),
3_, looi.
Dixon, H.E. and Turver, K.E. 197U Proe. R.Soc. bond. A. 339. 171.
Lapikens, J. 197ft Ph.D. Thesis, University of Leeds.
Watson, A.A. and Wilson, J.G. 197U J.Phys.A. J, 1199.
Edge, D.M. 1976 J.Fhys.G. 2,, U33.

172
FLUCTUATION STUDIES IN EAS BY MEANS OF RISETIME MEASUREMENTS AT ENERGIES ABOVE 10i7eV
M L Barrett, R Walker, A A Watson and P Wild Department of Physics, University of Leeds, Leeds 2.
Measurements of the risetime from k x 3k a? deep water Cerenkov detectors have continued using techniques described previously. The intrinsic fluctuations are used to deduce fluctuations in the source height of i 70 g cm-2 and this is shown to he inconsistent with a pure Fe beam and scaling. Using an E* model which fits our data we conclude that nearly all of the primary particles near 8.1017eV may be protons.
1. Introduction
The study of cosmic radiation of energies > 1017eV is undertaken primarily because of the astrophysieal importance of information about the particles' energy spectrum and arrival direction distribution. Placement of езе measurements in an appropriate astrophysical context has been hampered by lack of reliable information on primary mass composition, measurement of which is made difficult because of the uncertainties which exist in high energy interaction chart, cw.-isties at these energies. The currently available methods (Lapikens et al. 1973; Fomin et al. 1971; Edge 1976; Orford and Turver 1976) are based on the supposition that showers produced by primary protons should exhibit larger intrinsic fluctuations than showers created by primary iron nuclei. Using the technique of measuring the rise-time of the signals recrrded from the deep water Cerenkov experiments of the Haverah Park experiment Watson and Wilson (197b) established that large fluctuations exist between showers of the same primary energy and they have concluded that the magnitude of the fluctuations imply that some of the particles (mean energy o.l617eV) are protons. Га a more extensive analysis, base' on the results of Monte Carlo calculations, with specific nuclear models, Barrett (1976) has shown that it is likely that ac least k0% of the primaries at this energy are protons. Large intrinsic fluctuations have also been observed in the lateral diBtribu-.ion of ЕЛЗ (Edge 1976) and these are correlated with rise-time fluctuations observed in the same showers.
If the nuclear interaction characteristics wer^ well understood then the fluctuations which are observed in t^eni •'RJ-iral experiments could be directly related to the primary mass ?or>- jsition. However this is not the case and measurements on the deep water :>renkov tanks (Barrett et al. 1975; Barrett 1976) appear to collude the validity of a number of popular nuclear interaction models and to favour models in which the multiplicity of secondary pion production is larger than normal, perhaps varying with energy as E5, and certainly larger than the In Е dependence expected from scaling. Other evidence against the scaling hypothesis has been presented (Kalmykov and Khristiansen 1979; Wdowczyk et al. 1976) deduced from surveys of a wide range of experimental data. It therefore appears likely that it will be sometime before knowledge of nuclear interaction characteristics will be

173 sufficiently detailed to enable the studies described above to be fully interpreted.
Of the experiments which are underway to measure the primary mass composition the rise-time approach has the advantages of high on-time and sensitivity over a vide range of primary energies. A disadvantage however is that very detailed calculations, are required to interpret the observations directly. In this paper we deduce a parameter from our rise-time measurements which provides an estimate of the fluctuation of . the depth of development and which may be more readily calculable than is the signal rise-time. Although no final conclusion as to the mass composition can yet be reached our reBulte suggest a dominantly proton beam between 2.1017 and 5.1018eV.
An accompanying paper (Lapikens et al., EA hi) describes related measurements on the lateral distribution.
2. Experimental Method and Measurements
The experimental technique has been described previously (Watson and Wilson 1971*). In all recorded showers ( 8500 per year), the rise-time of the signals from the 31* a2 water Cereakov detectors are routinely measured if A > 1.0 m~2 and r > 250 m. About 1*300 showers are so analysed each year and of these about 900 have at least two signals satisfying these criteria.
An adequate representation of the average risetime, tj(10 to 50i() IB given by the expression:-
tVfcS fl-t + (o«l <*>G + o.oto UQ (§->J-O-««)*' *i At 500 m in 20° shower of 5.1017eV the risetime is 132 ns and can
be measured to an accuracy of *_ 3 ns. However the dominant source of error arises from the finite size of our 31» m2 detectors and the overall accuracy is about lU ns. After due allovance has been made for 'measurement uncertainties a residual fluctuation remains which increases with distance as:-
rf-^(<)s г н - »г°»х»o*V + VM.xi<r*4-v »>. No variation of af(r) with zenith angle has so far been observed; the variation with energy is dealt with below and elsewhere (Lapikens 1977, this Conference, EA 1)9).
3. Interpretation of the measurements
The zenith angle variation and the fluctuation in rise-time can be combined to infer the fluctuation which occurs in the depth of development of EAS of this energy. Suppose showers are observed at some atmospheric depth, XQ sec 9, (Figure 1). The depth of shower development, D, is nearly independent of 0 for reasonably small 9 and

174
thus the.reduction of tj with increasing в arises because of the increase in X, where X + D « Xg sec в. Now
and if we identify crf (tj) with 3tj and o(X) with ax^fluctuatione in X can be estimated. At 500 m
v у • » •
• 1 1 1 1 I • *
Ж *
/ * / / ж * \ft
/ / '///// У /
Eight independent values of Oftj) have been derived from the data for showers with zenith angles less than Ul* and a range of core distances. Details will be .given elsewhere (Barrett, 1977). Prom the corresponding values of o(X) a weighted mean value of 88 ± 7 g cm-2 is deduced for the fluctuation in the height of development. However because late developing low energy showers will be over-represented in our eample the mean value of o(X) will be an overestimate. Correction for this effect, which involves knowledge of the shower attenuation length as a function of core distance (Edge, 1972»), reduces the developmental fluctuation to 70 £ 1 0 g cm-2.
So far we have not identified the height of development for which a fluctuation of ± 70 g ea"2 has been determined. There are a number of possible choices. Lapikens (197>+) has shown that the quantity P, the energy-weighted sum over the depths of interaction of all the nucleons in the primary particle, is well-correlated with tj. In addition Dixon et al. (1971*) have found that the median delay of muons (which constitute a major fraction of the tl-signal) is well correlated with the depth of electron maximum. Although P has some advantages as a measure of the depth of development, for the purposes of illustrative discussion we will adopt the depth of electron naximua., h, as the depth of development and therefore we infer from our measurements that h fluctuates by ± 70(± 10) g cm"f for showers of mean energy 8 x 10l7eV. ~
Fluctuations in h for a sample of Bhowers arise from a combination of (a) fluctuations in the point of first interaction of the primary, (b) subsequent development of the air shower and (e) a mixture of primary particles. Suppose the primary beam consists of p) protons and (l-p)if Fe-nuclei which have respective mean depths of electron maxima of h. and htand fluctuations in these depths (due to (a) and (b) ) of a, and o, respectively. Then it can be shown that 2
1w a U, + 0-^4

175
and <ГЧ^ с J, ( , - ^ ( к | _ ч у + V-iV+ (•- Л «ЧГ
^
0-Г 1+
ScAMM^ в 4
kv» ft© jw* *г» П - '«^ft» j*-»'* «-„• if
In Figure 2 we compare the measured value ofв(h) with those predicted Ъу two models as a function of the percentage of protons'in a proton/iron primary beam. Data for the scaling model are from preliminary results of a programme of calculations being carried through by Hillas and Ouldridge (private communication). Data for the high multiplicity, E'-model are based on the calculations of Dixon et al, (I97IO and Barrett (1977).
If scaling was valid at air shower energies our conclusion would be that about 80Jt of the primary» two component, beam was Fe. For the high multiplicity model our conclusion would be that at least 50? of the b?nm was protons. We believe that other evidence from our own work supports a. model of shower development in which much of the energy is radiated high, in the atmosphere. The absolute value of ti is much faster than predicted from EG models (Barrett et al. 1975); in addition

176 our measured lateral distribution at t 100 m from the shower core is much flatter than predicted (Edge, 1976, Lapikens et al., this Conference, EA U7). Similar discrepancies will be found 'a fortiori'with a scaling model.
U. Variation of Rise-time with energy
It is of interest to compare the variation of the height of development with primary energy. Many model calculations find
а л ^ h<b6V a i ^ where the constant is a function of the model. From our data we find
L_'*- - fo ± 1 ns at 500 m and hence .5Ь : % i lO g cm"2/aeeade
A similar result has Ъееп deduced by Lapikens (1977, EA U7) from an extended range of measurements. As yet the uncertainty in the rate of fall of depth of maximum with energy is large but the value is consistent with that expected from scaling (80 g cm~z/decade, Hillas and Ouldridge , private communication) if protons dominate in the primary beam through the range of measurement (2.1017 to 5.10leeV). However 90 + 10 g cm-2/decade is a rather more rapid variation than the 50 g cuF2/decade expected from the favoured high multiplicity model. Such a variation could be understood if the percentage of protons increased with primary energy but the data are as yet too weak to sustain such an idea.
3. Conclusions
We find that the most convincing explanation of our data is that protons dominate the primary beam near 8.101 eV and that showers develop much, faster in the atmosphere than expected if scaling was valid to high energies.
Elbert et al. (1976) have concluded on the basis of muon fluctuation measurements and scaling that compositions of 90S heavy nuclei or nearly pure protons are consistent with data between 10ls- 1017eV. However there are serious doubts as to whether scaling can explain the observed Ku - Ne dependence (Kalmykov t Khristiansen 1975) and so we consider Elbert et al.'s conclusions lees finely based than our own which are consistent with a wide range of experimeatal parameters.
Acknowledgements
We are grateful to the Science Research Council for financial support and to our colleagues A H Hillas, J Lapikens, H Ouldridge and A M I Pollock for useful discussions.

177
Reference!
Barrett et al. 1975 Proc. lUth Int. C.R. Conf. (Munchen) £, 2753.
Barrett,M.L. 1976 J.Phya.G. 2, L73. Barrett, H.L.49TT Ph.D. Theiis, University of Leeds, (in preparation).
Dixon «t al. 197b Froc. R.Soc. London Л 339. 133. Edge, D.M. I97U Ph.D. Theiis, University of Leeds. Edge, D.M. 1976 J.Fhye.G. 2, 1(33. Elbert et al. 1976 J.Phys.G. 2, 971. Fonin, Ги A. and Knristiansen, ff.B. 1971 Soriet J.Huclear Pays. 1>», ЗёО. Kalmykov, II.N. and Khristiansen, O.B. 1975 Proc. llrth Int. C.R. Conf. (Munchen), 8, 2861. Lapiktns at al. 1973 Proc. 13th Int. C.S. Conf. (Denver)', J», 2582. Lapikens, J. 1974 Ph.D, Thesis, University of Leeds. Orford, K.J. and Turver, K.E. 1976 Nature 261*., 727. Watson, A.A. and Wilson, J.G. 197* J.Phye.A. J, 1199. Wdovczyk *И al. 1976, preprint.

178 EAS STHUCTUEE AT ENERGY > 5.1018eV
J Lapikens Department of Physics, -University of Leeds, Leeds 2, U.K.
This paper describes measurements of the rise-time of deep water Cerenkov detector pulses generated by air showers of energy •v 1019eV. The measurements are compared with similar data from lower energy showers. It is concluded that: (i) The average EAS depth of maximum increases by 90 ± kO g cm-z per energy decade (ii) EAS of energy •ъ 1019eV exhibit smaller fluctuations in longitudinal development than EAS of energy i< 5.1017eV (iii) Two showers of energy > 10zoeV do not show any extreme behaviour of rise-time.
1. Introduction It has been established that the time structure of EAS particles at
large distances (> 300 m) from the axis is sensitive to the manner in which the EAS develop. Particle detector rise-time measurements can be used to obtain information on fluctuations in EAS longitudinal development. This technique has been described previously, Watson and Wilson (197b). Barrett (1976). Barrett concludes that cosmic rays of energy t> 3.10'7eV consist of at least h0% protons. This paper deals with shower front structure measurements at energy, E„ "v 10l9eV. The flux of cosmic rays at this energy is, of course, much lower than at Ep "v 3.1017eV, for which rise-time measurements have already been reported. However,*the Haverah Park EAS array has been operating continuously for more than 8 years with the capability of measuring shower front time structure and of accurately ranking the showers in energy over the range 1017eV to > 102°eV, Edge et al. (1973). An examination of these data reveals approximately 100 EAS recorded with Ep > 5-1018eV, в < k0° for which shower front time structure measurements are available.
2. Analysis of data
veo*
K*
Ю*
F l i \
L '/£-!
1/ 'I UfrJ
с
ioc woo
^im« i t .
u'oo
Figure 1. 1 - Typical pulse at EL -v. 10I9eV, в "15°, r » 880 m, pulse height - 250 equivalent' muons. г - Recording system
' reponse function.
•;
300-
100-
. ' • '
r 500
•
• •• • • • • * • •
•* '
1 (000
1 — > — 1500
Figure P. A sample of tVa measurements at E_ •»• lO'^eV, 20#< 6 < 30°.

179
A single parameter, tj was measured from the photographic records of the vater Cerenkov detector pulses. Figure 1 shows an example of a pulse observed in a' large air shower. Figure 2 shows a sample of tj aeasureaents for EAS incident at zenith angle, в in the range £0° < в < 30°. She measurements occur at a distance, r of about 1 ka froa the shower axis. For the smaller showers (Ep* 3.1017eV) ti Beatureaents have been aade at г * 500 m. This energy dependence of the distance at which tj measurements are available arises because the collecting area of the array increases with energy. This effect requires careful treatment in the comparison of tj for showers of different energy.
3. Variation of t with Ep
300-
150-
Ю0-
4 +J
E»« Ю ay.
— Г " LOO 600 too I0OO Figure 3. Shows the Б. dependence of tj, 20 < в < 30. Each line represents a fit to data in a limited interval of Ep «ad r. Similar effects arc seen for 0 < в < 20, 30 < в < 1*0.
20° < в Figure 3 snows the data for the seeith angle range < 30 divided into intervals of En and r. One can see that ti is increasing with Ep. However, because the distance, r at which t! is best determined varies with Ep, it is not possible to obtain an accurate estiaate of how ti varies with E-. At r - 600 a it is estimated that tj increases by 13 £ б ns per 100 g cm"2 of additional ataosphere traversed by an EAS. Яш* it is deduced that, on average, a shower with Ep « 10"eV develops 90 + l»0 g ca~z deeper in the ataosphere than a shower vith Е - 10lTeV. A similar effect has been observed in the energy range 2.1017eV to 10'*eV (Barrett et al. this Conference, En кв). tj aeasureaents have been aade for tvjo showers

180
with Е- > 102°eV. Their individual tj measurements are shown in n * _**1. 4« £ . . — ..44.1, 4.1».. . . . в . л о ^ ..~-|..A л4» + 1 «4- V — irtl* Figure к for comparison with the average value of tj at Ep = 10laeV
For shower A tj (r = 1000 m] is + 20 i 7 ns larger than average. The uncertainty in tj is a function of the amplitude of the detector pulses. For this shower the tj estimate is derived from a total pulse height of 2500 equivalent, muons.
Similarly for shower В tj is estimated to be -6 + 13 ns 300-larger than average.
U. EAS development fluctuations at Ep * 10'"eY
200-
100
<л
T m. 500 IOOO 1600
Figure k. tj measurements for 2 EAS with Ep > 10zoeV. © shower А, в • 29°.
I», tj -> lS* X shower В,в « Ep « 1019eV, в
30°. -» 29°.
• Average ti for
Host of the large shower records provide two or more tj measurements for each Bhower. It is possible, therefore to make an estimate of the correlated fluctuation of tj at r * 1000 m. An analysis of variance gives the result: стр « 23 i •* ns; probability that oF m о is 6.10-1*.
A correlated fluctuation in tj can arise from effects other than fluctuations in the interaction points of the primary particle. An analysis of this problem for the smaller EAS has been presented by Barrett et al. (1975). A similar analysis of spurious contributions to crF has also been performed for the showers vith E» > 5-1019eV. The correlated uncertainty in r contributes 5 ns to op and the uncertainty in в contributes 7 ns. These results are accurate to ± 30)f, the uncertainty arising from our limited knowledge of air shower structure (muon/Cerenkor ratio, lateral distribution, etc). However because these spurious contributions are. small, by comparison with the observed fluctuation, their uncertainties do not significantly affect the corrected estimate of Op » 21 U ns.
5. Interpretation of the results Figure 5 shows all available information -qn the fluctuation of
tj, together vith the predictions of various shower models and a pure proton conposition. The lower energy data points are taken from Barrett (1976); .the model calculations have been extended to cover the distance range appropriate to showers with Ep > 5.1018eV.

181
the arrows i n d l c -for each point
var ious a o d e l s .
The models do not reproduce the observed r dependence of 0y. following tabulation of the ratio К • ffp(lOOO)/ор( 500) shows th i s : -
The
observation aodel В model A model Е
oF(500) 11.1» 11.2
7.2 5-7
Op(lOOO) 21 50 35 29
1.8 a 5.1
It appears that the value of К is not strongly dependent on the type of aodel used to describe the ultra high energy interactions-. ' Th, calculated rapid increase of <JF with r can be understood qualitatively when we consider the following effects: i) Muons recorded at r « 1000 m are produced higher up in the atmosphere than nuons recorded at r • 500 в.- the production depth spectrum (measured in g ем"г) of auont at r » 1000 m is narrower than at r « 500 m. However fluctuations in the width of the production depth spectrum are dependent only on fluctuations in the interaction points of the primary proton.

182 'il is an approximate measure of the width of the auon depth spectrum. Thus the fractional fluctuation Oy/tj increases with r. iij Aa r increases the proportion of the deep water Cerenkov detector signal due to the electron-photon (e-y) component decrease!. The time profile of the e-y component fluctuate» leaa than the time profile of the anion component. Thus this effect will also cause Op/tj to increase with r.
In other words it can he shown that.К is determined mainly by the propagation characteristics of the lower energy particles of the cascade (muons of energy S 10 GeV and the e-Y cascade). The slight sensitivity of К to .the high energy interaction model is explained in terms of the increase in the average depth of production of the low energy particles. It ia estimated that К varies Ъу•* 10% per 100 g car2 of atmospheric depth.
Thus there are only two ways of explaining the discrepancy between the observed and the calculated value of X. i) The mean free path of the cosmic ray primary particles decreases by a factor of two from Ep » 5.1017eV to Ep • 1019eV. ii) The calculations give completely incorrect results at г * 1 km. An error of this magnitude could arise only in that part of the calculation which deals with the lateral and temporal spread of the low energy cascade particles.
> Farther work needs to he done to teat the validity of models. Future calculations should, ideally, include a clear statement of the accuracy of their resulta. It must he stressed that alternative interpretations of the observed fluctuation which do not require a change in mean free path have not yet been fully investigated.
Finally let us consider the significance of the variation of tj with Е»: the measurements^ show that over the primary energy range 10"eT to 10"eV the depth of shower development increases by 90 * 40 g cm-2. The two showers with Ep > 10zoeV for which t has been measured show a depth of development which is within 60 g cm-2 of that observed at Ep » 10l9eV. These results therefore do not give an accurate estimate of tie energy variation 9(depth)/3 log Ep. They do however show that the EAS observed by the Haverah Park array from the higher energy region of the primary spectrum (Ep > 1019eV) have an average longitudinal development characteristic which is not drastically different. * « • *"** observed at Ep. • 10IeeV. This is a valuable additional check of the consistent performance of the detectors and the analysis techniques, at the upper end of the observed energy spectrum. References Barrett «b al. 1975 Proc. lUth Int. Conf. on Cosmic Rays (Munchen),
8, 2753. Barrett, M.L. 1976 J.Phys.3. 2, LY3. Barrett, M.L. 1977, this Conference EA *8. Edge et al. 1973 J.Fhys.A. 6, 1612. Watson, A.A. and Wilson, J.G. 197* J.Phys.A. J, 1199.

183
OBSERVATION OF EXTENSIVE AIR SHOWER CORES IH THE ENERGY RANGE lO1** - 10le eV.
J,M. Fostert B.R. Green, A.L, Hodson Department of Physics, University of Leeds, England;
W.E. Hazen, A. Hendel Randall Laboratory, University of Michigan, Ann Arbor, U.S.A.';
R.M. Bull Department of Physics, University of Nottingham, England.
Theoretical Q Experiment»! |7J Both Q
An analysis is given of photographs of shower cores obtained with a 35 и • array of current-limited spark chambers. Particular interest centres on showers with sub-cores involving unusually-high transverse momenta. The range of variation in lateral distribution function for showers of a gives size is explored.
Coordinates: EA ЗА (High Energy Interactions)
Mailing xddress: Dr. A.L. Hodson, Department of Physics, University of Leeds,-Leeds LS2 9JT, England.

184
! Hadrbhs > 500 OeV in Air Showers of size 5 x 10** - IP6
J.E.F. Baruch, G. Brooke, E.W. Kellermann and N.D. Walster Departnent of Physics
The University of Leeds Leeds LS2 9JT
UK
ABSTRACT
These sea-level measurements based on an electronic'data output system
and an analysis improved on those used previously show that the integral
spectrum of hadrons in air showers has a slope of -(1.5 ± 0.2) and that the
['size dependence of hadrons. is compatible with the calculations of Kempa, (1976).
! The measurements in the size range 5 x 10 - 10 do not require the
assumption of large average transverse momenta.
1 . IHTBODUCTIOB
The review paper by Wdowczyk (1975) and simulations by Crieder (.1975)>
Billas (1977) and Khristianseh (1976) have shown the importance of acquiring
more accurate data on hadrons and their relations to air showers and of the
contribution accurate measurements of these data could make to the under
standing of high energy interactions. Vatcha and Sreekantan (1973) have
recently published results which, if confirmed, might demand a reassessment
of the prevailing ideas on interaction models and ffikolsky's (1975) group
has stated that their"measurements suggest an increase of transverse momenta
in interactions with increasing energy. The present paper replaces the
paper of the Leeds group which was withdrawn from the Munich conference to
allow a redetermination of our data with a more reliable electronic output
system and a new reassessment of the hadronic energies as explained in paper
HE-99 of this .conference.
2 . METHOD
The apparatus c o n s i s t s o f the Leeds ca lor imeter , described i n paper HE-99
of this conference, operated in conjunction with h air shower arrays, namely
k x 0.-25 a scinti l lators on top of the calorimeter, 3 x 1 m scintil lators
at an average distance of k m from the centre of the calorimeter, U
similar detector» at a distance of about 12 m and k Haverah Park Cerenkov
detectors, one next to the calorimeter,with the others at 50 m from the
calorimeter. In l.fc x 10 seconds we have recorded 70 hadron events of

185 energy'> 0.5 TeV in shovers of 'size'
It ranging from 5 x 10 to 10 particles.
3. RESULTS The core position
and hence the shower size were determined
2 . by means of a x -fit procedure. In this ve used, because of the similarity of our detectors to those of the Kiel group, the lateral distribution function of showers as given Ъу Kiel (van Staa, 1973). We think that the core location is accurate to within about 1 m. The apparatus is triggered by hadrons
and since it does not measure the size spectrum, the size spectrum of the Kiel group (Buscher, 19T1) has been used to obtain the* hadron density p(> E, H, r) at distance r from the core of showers of size N. p (> E, N, r) » к A(> E, H, r)/B(N, r), where A is the number of showers of size H falling on the annulus of width dr at distance r from the corei-B(R, r) is the number of shovers of size H falling on the same annulus in the same time, and к depends on the geometry of the detector. For a limited size range one finds
p(> E, r) - K(>E) exp - (r/r0), r0 » r0(E) and the number of hadrons,
Figure 1
N„(>E) - /p'(>E, r) 2*rdr - 2trK(>E)r0 0
The lateral distribution function found in the present work

186
(r_ « 0.8 ± 0.1) is compared with that obtained at the Pic du Midi (2,900 m) by the Kiel group in Figure 2. Figure 3 shows the hadron integral spectrum (Blope -(1.5 ± 0.2)), compared with that of Matano (1969).
е-
«-г-
LATERAL OlStWBUTfON OF KAORONS E > 5 0 0 0 *
• PRESENT WORK
OMIY8E0969) ЭПодИк*
M
5 « 1 DISTANCE Я
10
10
r INTEGRAL HAORON SPECTRUM
• PRESENT W0RK|.-1.S>02 - в MATANOltd 11969) ~
\
К Ю EtfSSTtV
Figure 2 Figure 3
In Figures ba and kb the variation of the total hadron number vith shower size is given, and Figure 5 shows the integral distribution of I = E.r vhich can be calculated from and compared vith the distribution o f p , the transverse momentum in the primary interactions. The values of Vatcha and Sreekantan have been redetermined from their raw data, and a more detailed account of this vill be given elsewhere.
U. DISCUSSION AMD CONCLUSION Figure 3 shows that there is good agreement betveen Matano's
measurements and the present spectrum. The number of hadrons as a function of

187 Figure Ua
I к Ш О.
to
1 •
VARIATION OF NQ H«JRONSIE*4O06eV| WITH Ne
ail—L. 10*
A Tonworital (1971) В Vatcha slat (1973) С Kmedoctal(1969 D Myakt(196St о Prtstnt work >500GeY
I05 106 Nt
shaver size also agrees with the sea level data of Matano, hut not with the values of Vatcha ' and Sreekantan (1973). They also agree vith the reeults of Rempa (1976) who, contrary to the conclusions of Vatcha and Sreekantan did not have to assume a new type of interaction.
There is no need to assume large values of p to explain the Y distrihution of Figure 5 (overleaf).
tOOr .VARIATI0N0FN0.HA0R0NSIE>1ltVl WITH Nt
This work is supported Ъу the Science Research Council.
Figure to

188
tOOr
|м|-
1 •
04
Figure 5
YasTwauiim FORE»W
""li:i PRESENT WOKK vATCHAatiinem
10 108 vtmvw
REFEREHCES
Baruch, J.E.F., et al, 1977, This Conference, HE-99 BUscher, W.D., 1971, Thesis, Kiel Grieder, P.K.P., 1975 llrth Int. Cos». R. Conf., Munich, p. 2889 Hillas, A.M., 1977, private сова. Kaueda, T. et al, 1965, 9th Int. Coin. R. Conf., London, 2, p68l Kempa, J. 1976, Muov, Cin, Vol. 31, A., p.568 Khristiansen, G.B. 1976, European Cotm. R. Conf., unpublished Matano, T. et al, 1969, 11th Cora. R. Conf., Budapest, .£, p5Ul Miyake, S. et al, 1969, 11th Int. Cosm. R. Conf., Budapest, .3. p!»63
Hikolsky et al, 1975, lHh Int. Co». R. Conf., Munich, p.2960
Van Staa, R. et al, 1973, 13tfe Int. Cora. R. Conf., DenveV, p.2676
Vatcha R.H. and Sreekantan, J. 1973, J. Pays. A. 6, 1050
Wdowcv*» J. 1975, Ibth Int. Cosa. R. Conf., Munich, p. 002

THE HUON CONTENT OF EAS 189 P Я Blake Department of Physics, University of Nottingham, Nottingham, England
ABSTRACT The nuon lateral density distribution of EAS has been well measured by a number of groups using different EAS detector arrays. This-paper discusses Che variation of the auon density distribution as a function of zenith angle. A number of problems such as the changing threshold energy and conversion to vertical' size are considered. A further attempt to check the consistency of the measurements by the various research groups is presented.
1. INTRODUCTION The auon content of an EAS can be easily and straightforwardly measured by use of a large area shielded detector in conjunction with an EAS detector array. However the limited area of such a detector and uncertainties in the experimentally derived properties of the EAS give rise to a substantial probable random error in the measurement for an individual shower. Averaging over many EAS yields a mean muon density lateral distribution function. Such a function has been well determined experimentally. In addition cascade calculations bf;ed on reasonable nuclear models agree closely with the measured distribution. Overall the auon density measurements appear to serve as a good technique for lining up the various EAS arrays.
2. THE HUON LATERAL DENSITY DISTRIBUTION AS A FUNCTION OF ZENITH ANGLE The Nottingham EAS group have used both shielded neon flash-tubes and shielded scintillators to independently meeeure the muon content for EAS detected at Haverah Park initiated by primaries in the energy range lol' -10 " «V. Data for four different zenith angle ranges are shown in figures 1 to 4, as a function of core distance. The data have been normalised to a shower size parameter Pgoo " 0>178 veuaT2 (=E, i l . 2 x 10" eV). On the whole the agreement between the two fores of detector are seen to be good. The arrays of neon flash-tubes (2 m x 1.7 cm diameter tubes) however clearly show signs of saturating at densities ъ 10 m~z, despite the application of an empirically derived spatial resolution correction. A auon lateral distribution function of the form
has been fitted to the data in the four zenith angle ranges 9 < 25°; 25° < 9 < 35°; 35° < 0 < 45°; and 45° < 0 < 55°. R is the core distance expressed in aetres.
'or Pfcoo * 0.178 a , the values of A and T) derived are shown in table 1.
The changing threshold energy as a function of 0 is indicated assuming 300 mtV to be the vertical threshold. Also shown are the derived auon densities at 200 a, 300 a and 500 a core distance. The lateral density distribution clearly flattens with increasing zenith.
In order to accurately compere the experimentally aeasured muon density at a

190
I 0-1
T 1 — П
— Scintillator • Flaih-tubes
J I L _ l _ Ю0 500
Cort dittanet (mttras)
*i
о i 4
T 1 — П
— Scintillator • Flash tubes
гВ^в-аЗЬ*
Ю0 500 Cora distant» (metres)
Figure l! ,0 (•) for в < 25° Figure 2s p (R) for 25° < в < 35°
0 1
— SdntUlotor • Roth tub»
35*<»*45*
ПО 500 Cort dManct (metric)
I..,
•П
• \
-
-
±L
—I 1—r—I
— Scintillator • Flash tubes -
&<»*&
\» \ e
\ e
i _ I _ I _ J ЮО 500
Core dietanco (metree)
Figure 3s pp(«) for 35° < 9 < «5° Figure 4: pu(R) for 45° < в < 55°

191
Mean e
17° 30° 40° 50°
Threshold Energy 314 meV 346 MV 392 «KV 467 meV
A
2.88x10? Z.81xl0| 2.88x10* 2.34X103
n
2.80(±.08) 2.50(±.08) 2.40(±.W) 1.85(±.15)
pp(200m)
1.05 И-2 1.14 Я-2 1.20 и*' 1.18 m*z
Pu(30O«i)
0.48 m-2 0.54 я"? 0.58 Я-2 0.61 и"2
Р„(500»)
0.153ni"| 0.184Я-2 0.198И-2 0.243*1-2
Table 1: Huon lateral diatribution at function of 0 for p,-. - 0.178 a
particular core distance aa a function of zenith angle the densities should be converted to (i) а со—mi threshold energy, and (ii) a cominn aean primary energy (or common vertical equivalent PUJO value). The conversion to a ciiaann 300 atV threshold energy can be atde by extrapolating the data on auon energy spectra froa the cascade calculations of Dixon et al (1974). The resulting multiplying correction factors are shown in table 2.
Mean Zenith
17» 30° 40° 50°
Threshold Correction
Factor 1.00 1.02 1.04 1.07
Vertical Equivalent
Factor 0.94 0.82 0.62 0.50
Pp(2p/)a)
0.99 0.95 0.85 0.63
Pu<3jj0*i)
0.45 0.45 0.41' 0.33
Pvi(5g0l«)
0.144 0.154 0.140 0.129
Table 2: Muon densities for P6-0(vertical) • 0.178 * at 300 aeV threshold
The vertical equivalent Pun can be calculated assuming a measured attenuation length for Pgoo •» * function of zenith angle of 760 g cm-2 (Clarice et al, 1975). Multiplying correction factora for conversion to an equivalent vertical род - 0.32 m-2 are shown in table 2.
The resulting anon densities at 200 a, 300 a, and 500 a froa the EAS core as a function of zenith angle are also listed in the table. The probable errors on these derived asan values are not easy to calculate but are estiaated to be * -v 5X. At 200 a and 300 a the muon densities above a fixed threshold ariaing from the same primary energy cosmic ray clearly fall with increasing xenith angle. The auon component at thai* cor* distances is being attenuated by the increased atmospheric thickness. It is not a simple attenuation however since the EAS develop through a different atmospheric density disbribution at different senith angles.
Dixon et al (1974) have calculated the muon density leteral distribution aa a function of zenith angle based on their 'standard' cascade model* Their published result* for moons > 1 GeV threshold show close agreement with the experimental results presented here. In particular at 500 a froa the core^the calculations indicate that the auon density is almost independent of senith angle. The experiaental data in table 2 are clearly consistent with this result.
If one expresses the 'attenuation' of the auon component with zenith angle in the form of a function!
Ри(в) - ри(0)(аесв)6 (1)

192 the value» of В derived from tha experimental data of table 2 are liated in table 3 as a function of core distance.
Core Distance В
200M
-1.14
300m
-1.04
500m
-0.33
Table 3: Variation of p as a function of zenith angle Actually the relationship (1) doas not yield a vary constant value oi 0 over the full zenith angle range. This was also found by the Sydney EAS group (Goorevich and Peak, 1973). The Sydney group obtain a value of В - -0.9O (± 0.32) at 10 1 7 eV for the 'attenuation' of the total muon number H„ (Bell, 1976). The median core diet«nee for muons in EAS is * 200 m, although most msasuremtnta on tha muon content of large EAS are made at greater distances. Hillas has obtained values for В for several of his air shower models giving values ranging from -1.01 to -1.19 at 1019 eV primary energy, with little dependence on this parameter (Bell, 1976). 3. INTERCAUBRATION OF EAS ARRAYS USING HUOH COHTEHT The main large EAS detector arrays at Haverah Park, Sydney (Narrabri), Volcano Ranch and Yakutsk all include muon detectors. On the basic assumption that, the arraya all detect the same type of EAS the muon measurements should show consistency. Watson (1975) haa compared the muon signals detected by the four arrays for EAS whose sise corresponds to a threshold energy for an integral flu? at the arrays of 10~11 m~z s"1 sr"1. He found that tha overall agreement in muon number and muon density was reasonably good. Since 1975 a revised analysis of the Sydney data has been published (Bell, 1976). Using this corrected data tha praaant paper trices the muon density measurements as the standard and compares the flux values measured at tha four arraya above a threshold energy for showers having a particular measured muon density.
For comparison I have chosen a muon density of 2.00 m~2 at 300 metres core distance at с smith angle of 17° and a threshold energy of 300 m»v. At Haverah Park using our derived muon lateral density distribution (section 2) this corresponds to a pepo -0.832 at 0° senith. The flux of EAS above.this energy is 8.1 x 10~lz mz2 s"1 sr"1 (Clarke et al, 1975). For the Sydney data a muon density of 2.00 m"z at 300 meV is taken aa equivalent to 1.67 m~z at 750 mtV threshold. This corresponds, .using their standard structure function from tall at al (1973) to a total muon number, Кц, of 3.6 x 10 , From Ball (1976) this corresponds to an integral flux of 4.2 x 10~ 1 г m"z s"1 sr"x. For Volcano Bench tha muon threshold is 220 msV. Adjusted to sea-level and using the,Sydney structure function yields a comparable integral intensity of 6.6 x 10"1Z m"2 s"1 sr l. Yakutsk (Diminstein et al) quote a muon number spectrum of the forms

193 Г(> Ну> - O.S(± 0.1) х l O - ^ / l O 6 ) " 1 - 8 5 4 0 ' 1 5 --1 s'1 sr"1
Uiinf the Sydney structure function and a 700 meV threshold the required auon density yields an integral flux of 4.7 x 10~12 a-1 s-1 sr"1.
Table 4 lists the comparison fluxes for the saat шиоп density at 300 a.
Detector Array
Haverah Park Volcano Ranch Yakutsk Sydney
Integral Intensity ' (•- ' s-1 sr-T)
8.1 x 1СГ12
6.6 x 10"12
4.7 x 1СГ12
4.2 x 10"12
Table 4: Comparison of fluxes for fixed auon density
This spread is encouragingly soaewhat narrower than the spread deaonstrated by Watson (1975) for the primary energy spectra then quoted by the four arrays. However a spread factor of 2 in intensity (= a factor i> 1.4 in auon density) is far too high to be attributable in any aajor way to the measurement errors in the auon densities. It is not appropriate for ae to comment on possible systeaatic errors in flux determination. The other possible source of the discrepancy is the different triggering requirements of the different arrays. This aay lead to different types of EAS being sampled by the arrays, and hence GAS having on average different auon content. ACKHOWLEDGEHEHT
The author wishes to thank his colleagues at the University of Leeds for the continued efficient operation of the Haverah Park Array.
REFERENCES
Bell С J, Bray A D, David S A, Deneky В V, Goorevich L, Horton. L, Loy J G, McCusker C I A , Nielsen P, Outhred A K, Peak L S, Ulrichs J, Wilson L S, Winn M H, Proc 13th Int Conf on Cosmic Kays, Denver, 4, 2569 (1973).
Bell С J, H Phys G 2, 11, p 867-880, (1976). Clarke A R, Ida* D И7 Pollock A M T, Raid R J 0, Watson A A, and Wilson J G,
Proc 14th Int Conf on Cosmic lays, 8, p 2699 (1975). Diainstein О S, Ifiaov К M, Glushkov A v7 Kagenov L I, Pravdin N I, 5th
European Symposium on Cosmic lays, Leeds. (1976). Diana H I, Earnshaw J C, Hook J E, Hough J H, Smith G J, Stephenson W and
Turver К Е, Proc Hoy Soc Load A 339. pp 133-155 (1974). Goorevich L and Peak L S, J Phys A 2> 14, P 1777 (1974). Watson A A, Proc 14th Int Conf on Cosmic Rays, Munich, Rapporteur Paper
(1975).

194 THE STUDY OF FLUCTUATIONS IN THE HUON COMPONENT OF LARGE EAS
R. ARHITAOE, P. R. BLAKE, P. J. CONNOR, W. F. NASH and С G. SALTHARSH
Department of Physics University of Nottingham, University Park, Nottingham NG7 2R0, England
ABSTRACT: The Nottingham auon experiment at'the Kaverab Park EAS array has been expanded to consist of three «ell separated 10 a2 shielded scintillators. The object of tha expansion is to study in detail the fluctuations in the avion content and arriTal time spread in large EAS (;> 1017 «V) detected by the infilled array at Haverah Park. The aim» of the experiment and the techniques being used are described and early results are presented.
1. INTRODUCTION
The university of Nottingham EAS group has recently expanded their muon measuring facilities at- the Haverah Park detector array. This expansion came as part of the general enlargement programme of the whole Haverah Park group; the aim being to study in more deteil EAS in the primary energy range 1017 to 1018 eV.
2 • The Nottingham group now operates three 10 m muon detectors spaced as indicated in figure 1. The responses of these detectors are recordad in coincidence with the main EAS detector array. The recorded data are subsequently correlated with those from the Cetenkov water tanks and other detectors
. _ on sit* thanks to the collaboration Ш of our research colleagues from the
Universities of Leeds and Durham.
The muon detectors are used to study the muon density content of each EAS. In addition fast timing electronics enables the time spread of arrival of muons at each detector to be determined. The detailed aims of tha experiment ara discussed in Section 2; the detectors themselves in Section 3; and the recording techniques in Sections 4 end 5. Finally in Section 6 some early results will be presented.
2. THE AIMS OF THE EXPERIMENT
The overall aim of these experiments is to study fluctuations in tha observed properties of EAS so as to assess the composition spectrum of primaries initiating the EAS.
Such studies inevitably rely on development of EAS in the atmosphere, emerged from considerations largely
id by the University of Durham group
Central site
/ \ i50m 500m 250m
• 34m2 water Cerenkov detectors ЕЭ 10m2 muon Scintiltatordetectors FIGURE 1: ' Iht Havtrah Park wuon
dtttotore. model cascade calculations simulating the The current expanded Haverah Park program based on the csscada calculations performs* (Dixon et el. 1974).

195 The «ion content is a basic aeasurable parameter of each EAS. The aver
age response of auon densities to EAS recorded at Haverah Park and elsewhere has been «ell established. Although the cascade calculation* indicate that the form of the auon lateral density distribution is not very sensitive to the primary mass, the auon content, relative to the electromagnetic component, is a fluctuating parameter.
The siting of the three 10 a muon detectors was chosen so that three auon density aeasureasnts are obtainable for EAS whoae шхв» fall within a defined area of the Haverah Park detector array. These EAS are those also veil recorded by the infilled Cerenkov water tank array. Moreover, for the majority of these EAS at least one muon detector unit lies within 200 a from the EAS core, and thus yields a statistically wall defined response (> 30 auons). Thus the muon content of these EAS can be determined.
The arrival time spread of auons at a detector within the EAS is a paraaeter very sensitive to the longitudinal development of the EAS, and hence the mass of the primary. The average time spread has been well established. In order to study individual showers, the major problem is to sample a sufficiently large number of auons to make the aeasureaent statistically meaningful. Again the competition between measuring a useful rate of events and requiring a aufficiently large aaaple of auons in a particular event was recognized by splitting tbe 30 «2 of auon detector into three 10 m2 well-separated stations aa indicated above. A minimum detector response of 20 muon» is regarded as essential before any useful tiae spread data are analysed.
The detailed correlation of auon content and muon tiae apread measurements with the water'Cerenkov tank response, auon angular spreads and air Cerenkov response (as measured by other researchers at Haverah Park) is expected to lead to definite conclusions regarding the composition spectrum of the primary cosmic rays in the energy range 10Д™ to 1018 *v.
3. THE HUON DETECTORS
Each 10 a muon detector consists of 10 cm depth liquid scintillator, shielded by 3j 300 MeV threshold of absorber. Each detector consists of four units of 2.5 m2, each viewed by two 5" phototubes and separately by two 3" fast phototubes. The response uniformity of the detectors is better than 10Z.
The detector A scintillator (Figure 2) is closely covered by 80 cm of Barytas bricks. Detector В scintillator (Figure 3), also covered by 80 ca of Barytes, is suspended above an array of neon flash-tubes operated by the University of Durham group. The array of flash-tubes enables the angular apread of the auons to be determined. The auon detector С (Figure 4) ia shielded by 15 ca of lead and 7.5 cm of ateel and in addition contains flash-tubes in order to accurately determine the spatial distribution of the auons. The flash-tube part of the detector consists of four arrays of four layers thick and are-triggered from spark gaps producing fields of 3 kV ca~l.
k. THE RECORDING OF HUON DENSITIES
Each detector is individually recorded at its separate station. The auon density recording system of each atation is essentially tbe same and is illustrated a» a simplified block diagram in Figure 5. The response from each 2.5 a2 unit can be individually determined, thus allowing bursts created by auons interacting in the absorber to be isolated and accounted for. Automatic gain

196
FIGURE 2: Hum detector A.
FIGURE 4: Muon detector C. systems allow the dynamic range of the ClO'i to be extended so that the recording system is linear over the range 0 to 500 nuons 10 m~2. The dynamic range is extended up to 10000 muone 10 a-2 by means of a low gain aystea. The flash-tube array at detector С allows a more detailed assessaent of instruaental fluctuations and auon bursts to be aede. This flash-tube array has good spatial resolution for muon tracks in on* plan* but has a low saturation limit as a density measuring device (Blake *t al., Paper WO, this conference). Scintillator detectors are thus preferred to flash-tubes for the basic auon density asasursaants.
In addition a scintillator detector monitoring system is being developed which will enable the background count rate for each detector to be stored for periods up to a week so that stability and gain checks can be maintained on all cictactor units.
5. THE RECORDING OF MOON TIME SPREADS
Two different techniques of measurement are being used at the three muon stations - one based on a fast storage oscilloscope record and the other using

197
MIXER
12/JS
8/iS
GATE
, i
4/us
\ GATE I —
1 ^ GATE
GATE
•i DISC
4 DISC
6/us
COUNTER
. EXT. TRIG OSCILLOSCOPEU-FROM EAS
Y INPUT
. ,
ATTENUATORS
H ARRAY
LAMP DRIVER
FIGURE 5: Muon density recording system.
I 1A-» B-»
2A-» B-»
«Я ЗА-» S B -= 4A — P B *
MIXER
I HAUTOMATIC I , Г
GAIN )-—t Y AMP. INPUT
1A-» 2A-» 3A-» 4A-»
COINCID
H STORAGE . CRT
CAMERA
TIME BASE •TRIGGER
EAS TRIGGER
FIGURE 6: Simplified block diagram of storage oscilloscope recording system.
a digitized transient recorder.
A simplified block diagram of the storage oscilloscope method is shown in Figure 6.

198 The total response from the phototubes is fed through an automatic gain
system onto the Y input of the 150 MHz storage oscilloscope. The time-base is triggered by a fast coincidence system demanding the simultaneous arrival of one muon in each of the four detector units. This results in a trigger rate of 0 feu a minute allowing time for the storage CRT to clear itself without the overlap of possibly useful events. Assuming randomly incident EAS muons over the four detector units the probability of the total detector receiving > 20 muons in a shower and the coincidence requirement not being satisfied is minimal. If the stored waveform appears in coincidence with an EAS trigger then the shutter of the recording camera is operated and the pulse profile of the event is recorded. The pulse profile is then read by means of a digitalizing film reader in a form suitable for computer handling.
The storage oscilloscope technique is being operated at two of the three muon stations. At the third station the pulse profile is digitalized automatically and stored by use of a transient digital recorder. This recorder samples the signal voltage level every 10 ns. Data from a cuain of 2000 successive intervals are stored in sequence. By the use of shift registers such information is retained continuously for 20 Ms leading up to a trigger pulse. The trigger pulse halts the flow of input data and initiates the outputting of the stored data onto punched paper tape.
The digitalization has a range of 256 voltage levels. The gain of the system is set so that one voltage level corresponds to the average response from one vertical muon. A minimum of 20 muons is considered essential to provide statistical weight to the sample; so the dynamic range of the system is approximately 20 to 250 muons per 10 m2. A block diagram of the transient digital recorder system is shown in Figure 7.
ш ts -» m 2A-» ? B -p ЗА-» £ B-» £ 4A-» °- в-»
MIXER HTRANSIENTI ,
RECORDER Г*^ INTERFACE PUNCH
EAS TRIGGER
FIGURE 7: Simplified block diagram of digital transient recorder system.
The system is triggered by all EAS detected by the Haverah Park array. The pulse profile is subsequently analyzed by computer and correlated with other shower parameters provided by the University of Leeds group.
6. ' INITIAL RESULTS
Data on some 20000 EAS triggers have now been recorded by at least one of the muon detectors. Analysis of fluctuation effects has still to be carried out, but mean muon lateral density distributions have been obtained and are consistent with previous work.
Results of muon arrival time spread measurements are presented in a separate paper at this conference. They indicate the potential of the new

199
techniques and again the mean distributions show good consistency with previous measurements.
REFERENCES
Dixon, H.E., Earnshaw, J.C., Hook, J.R., Hough, J.H., Smith, G.J., Stephenson, W. and Turver, K.E., Proc. R. Soc. Lond. A 339, p.133-155 (1974).

201 a* a profile that i* fatter than the recording system's impulse reaponce.
A compromise ha* to be reached between the ainiauai denaity and ainiaua core diatance at which event* will be accepted for riseeiat paraaeter analys-ia auch that the amount of aelected data ia not too aeverely limited. The effect of sampling fluctuation* appears to be to normally distribute the riae-tiae paraaeter and the possibility of a downward excursion froa the expected average behaviour ia "и 2Х at 2a. This criterion was adopted to decide upon the ainiaua denaity and ainiaua core diatance at which data would he accepted for the risetiat paraaeter analysis.
For aiailar arguaanta the zenith angle we* limited to в £ 40°. Table 2 lists the final criteria adopted and the number of EAS recorded in each category.
Huon Water Cerenkov Total Charged
DENSITY
> 1.5 ""2 7 2.0 a-2 •> 5.0 И-2
CORE RANGE 250 < R < 600 m 250 7 R 7 600 a 200 < R < 600 m
ZENITH ANGLE Э < 40° в < 40° в"< 40°
NO. OF EAS 64 84 143
FABLE 2: Criteria for EAS time spread analyst».
4. THE ANALYSIS OF RlSETIHE DATA
Up to five profile risetiae measurements were taken for each EAS, namely: (a) tj of the Cerenkov tank profile; (b) tj of the total-charged particle' profile; (c) tj of the auon profile (transient recorder); (d) tj of the au-on profile (storage oscilloscope); (a) t2o-70 of the auon profile (atorage oscilloscope).
The mean risetiae parameters and mean core distances derived for the five risetime paraaeter* are shown in Table 3.
MEAN CORE DISTANCE 244 a 274 a 335 a 430 m 530 a
Water Cerenkov tj Total-Charged ti Huon (TR) Ц Huon (SS) Ц Huon (SS) t20-70
115.4 ± 1.6 91.1 * 1.5 68.0 x 2.2 68.7 x 2.0 88.0 x 2.6
104.6 ± 1.9 135.4 ± 2.7 80.8 ± 3.4 76.7 x 3.8 92.2 ± 5.1
120.3 ± 3.5 152.2 ± 5.7 87.6 ± 7.7 78.6 ±5.7 104.1 ± 6.5
149.3 ± 9.6 165.0 ± 8.3 100.5 *• 8.1 101.0 ± 12.7 139.3 ± 19.2
TABLE 3: Heaeured mean rieetim parameter» in nanoeeoond» for BAS _< 4(fi; quoted error» are o/JH. ~
The average behaviour of the water Cerenkov profile risetiae parameter tj haa been previously derived froa Barrett at al. (1975) for a aaaple of 850 «how-era uaing conventional oscilloscope recording and a multiple regression analysis of the form:
t, » (A + В cos 6)1 + С cos 6 + D
where A - -0.235, В - 0.450, С - -98.4 and D - 131.9 and ia valid for 250 < R < 1200, 0 < 40°. The predictions of this equation have, been compared with the reaulta given in Table 3. This comparison is presented in Table 4.

202
е < 25°
25 <. в £ 40°
в£4о°
R
Present Barrett Present Barrett Present Barrett
275*
91.3 ± 0.2 91.7 90.9 t 1.9 88.8 91.1 ± 1.5 90.6
340m
105.7 ± 1.9 104.3 103.3 ± 3.1 96-9
104.6 ± 1.9 102'.2
430 m
121.0 ± 6.3 123.5 119.9 * 4.1 111.4 120.3 13.5 H9.6
.530 m
149.3 ± 9.6 141.7
. 149.3 * э;б 136.1
TABLE 4: Companion of present voter Cerenkov tig (па) with Barrett et al. 197S.
Tha agreement between the two sets of results ia generally good. The auon ti results from tbe transient recorder and storage oscilloscope
techniques alao show good agreement. An atteapt waa made to accommodate the zenith angle dependence of the au-
on data below a senith angle of 41° in a multiple linear regression analysis of the form
t, » A + IK + С cos 6 . The regression coefficients А, В, С obtained from this analysis for the
five risetime paraaetar/detector combinations are given in Table 5.
DETECTOR
Weter Cerenkov Total-Charged Huon (TR) Huon (SS) Huon (SS)
t
t i i Ц *20-70
A
24.8 4.8
-7.2 -23.9 -12.3
В
0.201 0.196 0.130 0.100 0.166
С
13-4 69.2 46.3 73.8
116.3
N
85 143 64 49 49
TABLE S: Multiple linear regreeeion analyei» of data.
5. COMPARISON WITH MODEL CALCULATIONS Figure 1 coapares the transient recorder anon ti aaaauraaents at В < 25°
with the predictions derived froa Lapikena (1974) (Jt). These calculations use Hillas Model A to describe the high energy nuclear interactions. A detailed treatment of the auon component propagation waa included in the calculations which refer to е shower initiated by a vertical proton primary of energy I.IS.10I8 eV. Using tbe impulse response of the transient recorder's electronic recording system these distributions were transformed into tbe profiles that would be recorded; the riaetiae parameters tj and t20-70 were extracted from these profilea.
The agreeaent between theory and experiment ia good at core distances < 400 a, but the measurements are significantly faster than the prediction* at larger core distances. Figure 1 also shows the average behaviour of tj derived by the above technique from the auon arrival time distribution calculated by Dixon and Turver (1974) (DT) using the normal model for a 10l7 eV vertical proton primary and a simple muon propagation treatment with е auon detector threshold of 1 GeV. Turver has shown that the differencea between the aiaple and detailed propagation treatments are very email, so the differences

203 between the modal calculation raaults of Lapikens and Turver ariaa aainly froa tha different detection thresholds, primary enargiaa, and aodal* of high energy interaction*. Here recent calculation* by Turver (1975) have included a detailed treetaent of the auon propagation for a detection threshold of 0.3 GeV. The expected tj derived from Turver'a calculation» at core distances of 300 • and 500 a for an average id* eV ahover initiated by е primary proton are alao ahown in Figure 1.
The anon t2o_70 data, В <_ 25°, • re-carded by the storage oacilloacope ere coaparad with aodal calculation pradictiona in Figure 2. The reaulta derived froa Turver apply to id8 CV shower* developing with their depths of aaxia-
_._.._ . * лз. — ua developaant at 750 g ca~2, the aver-FiaUKEl: c<»^?°f^J**? age valuator a proton priaar, of thi*
profit, tlf Bit* mod* Д «.d 9 » g ca-2 and 640 g ca-2 oaleulaUon predustvon». ^.^ cott„poai t0 «bowers developing
late and early in the atmosphere with probabilities of t> 51. Tha two experimental point* at core distance* below «00 a agree well with
the predictions of Upikens and Turver. At larger core distances the experimental data are atill in fair agreement with Turver*• predictions for a shower of average development.
The predictions of the up-dated model (Turver 1975) which incorporates Feynaan scaling and a proton-proton cross-section that increase* with increasing energy have alao been compared with the tj and t2o-70 aata (Figures 1 and 2). Hoting that these calculation* refer to a anon detection threshold of 1 GeV, the predictions of tat up-dated model for proton priaariea are inconsistent with the obaervationa; reconciliation can only be achieved by iron primaries.
6. AM0HM.0US EVENTS H u m detector output pulses have
been observed which show a clearly resolved lata deposition of energy in the shielded scintillator «nits. On the criteria adopted for tat inclusion of a euon pulse profile in tat analysis, two highly structured events have bam КОЖ »: СащаНаоп of the тип pro-identified, giving a frequency of occur- fit» tJ(y?0 viih model oalo-rence of * 3 (z2)Z. These profiles ulation prediction*. cannot be reproduced by amy sampling of
m
m
)
\
\V
• ate «*•
.«Miliar*
/ /' у
/ J
/^ -
ТапегЩМ)
- H
ф tsoerCm)
m И »
/m
i-**l
700
COM MTMKM»)

204
tha thraabold muon time delay distribution! and are not dua to alactronic malfunction in the anion recording system. Thaae events were not included in the analyses presented in Section 5.
A number of possibilities have been considered regarding the origin of this structure. It may arise from a definite IAS phenomenon. If thia waa tha case then a late arrival should also ba discernible in the output pulses from the total-charged particle scintillators and the water Cerenkov detectors. Tha profiles recorded from the three types of detector are shown in Figure 3, where they have been normalized to a common time origin at the 10Z level- of the profile.
FIGURE 3: Events thawing anomalously late muon arrivals.
For each of the events the densities registered by the various detectors are given in vertical equivalent muonf (v.e.p.) and the late entry is identified by a vertical unshaded arrow. Thaae sections of the auon profile have been translated into the density contribution that would he expected from these moons to the response bf the total-charged particle and water Cerenkov detectors as indicated by the solid lines. The assumption vmade in tha determination of the expected contribution to these two detector profiles for each individual event was that the response would be entirely due Co muone, i.e. no soft component contribution wea considered. There is no conclusive support from the'total-charged particle and water Cerenkov profilea for tha premise that the structure seen in the muon profile is a genuine IAS phenomenon.
A closer examination of the muon profile atructure revealed that the time structure of the late entry was very similar to tha instrumental response of the recording channel indicating a fast raleeae of energy within the scintillator.
Further support for the late arrivals not being a property of EAS comas

205
fro* a comparison of the observed.and expected muon densities. The expected densities were derived fro* the mean auon lateral diatribution and are presented in'Table 6.
Mp expected N„ observed IT observed early
136^5616 6.9
16(3.90) 9.5(1.3o)
13825682 8.8
21 («•.la) it(0.7a)
13810086 M.3
27(4.7a) 17(1.7o)
TABLE в: Muon dentititt of anomalou* «wenfce. All three events show improbably large excesses of v.e.u. as seen from the
number of standard deviations, baaed on Poissonian statistics. If the late arrival proportion is removed the densities are in much better agreement.
The fast energy release of 10 v.e.u. can most probably be explained by the presence of muon bursts. Theoretical and further experimental work is currently being undertaken to assess the importance of such phenomena on both density end profile muon measurements. As a precaution against these events the muon recorditig sites at Haverah Park are now equipped with electronic systems that will record not only the total muon density over 10 w? but also the contribution from individual 2.5 m2 units. As a further precaution a neon flash-tube detector is installed directly above one of the muon scintillators.
REFERENCES
Barrett, M. L., Watson, A. A., Wild, P. and Wilson, J. G., 14th Int. Conf. on Cosmic Kays, Munich, 1975, p.2753.
Dixon, H. E. and Turver, *. E., Proc. Soy. Soc. A, 339. 1974, p.171.
Lapikens, J., Ph.D. Thesis, University of Leeds, 1974.
Turver, К. Е., J. Phys. G: Mucl. Phys., V, 1975, p. 134.
ACKNOWLEDGEMENTS
The authors would particularly like to thank their colleagues at the University of Leeds for supplying the Cerenkov tank response signal and for their continued efficient operation of the Haverah Park Array and regular posting of the shower data to Nottingham.

206 AVERAGE STRUCTURE OP LARGE AIR SHOWERS AS A FUNCTION OP SIZE AND ZENITH ANGLE
John Linsley Department of Physics and Astronomy, University of Hew Mexico, USA
(Experimental)
Results will be presented of a measurement carried out at Volcano Ranch using an array of 79 scintillation counters uniformly distributed over an area of 1.2 km2, with a recording system that registered particle densities up to 5»10' и . Data from about 500 air showers ranging in size from 2'10 to 5-109 particles have been used to determine regression coefficients for<4> ard<0C>, the average values of parameters in the semi-empirical structure formula
*-fe««.w|u-*(i*JU--<>)-*)
wherein A is density of particle flux at radial distance R, RQ is the Moliere unit of displacement, given in meters by
R0 >= 272.5 T (P-73.94 cos0 ). P and T are atmospheric pressure and temperature in millibars and degrees Kelvin, respectively, and в is zenith angle. The normalization constant С is given in terms of gamma functions by
С » ПГ>?-оО/21гГГ2-ос)РС?7-2).
Coordinates: EA 3.2 Structure
Nailing address: Professor John Linsley Department of Physics and Astronomy University of New Mexico Albuquerque, New Mexico (USA) 87131
This work was supported by the National Science Foundation.

207 INTRINSIC VARIANCE OF AIR SHOWER STRUCTURE
MEASURES AT VOLCANO RANCH John bii iley
Department of Physics and Astronomy, University of New Mexico, USA
(Experimental)
Evidence will Ъе presented that the lateral structure of large air showers is not a unique function of primary energy and zenith angle. Values of the structure parameter V) , and of (Ги , the standard error thereof, were determined for approximately 500 showers with 2>10'< N< 5*109 particles. The residual variance of и , after allowance for the two systematic effects referred to above, is considerably greater than expected by chance. The effect increases with increasing zenith angle, suggesting that it is due to fluctuation in the location and character of important interactions with air nuclei, as expected for a proton-rich primary composition. 1) J. Linsley, Proe. 8th ICCR (Jaipur) £, 77-99 (1963)
Coordinates: EA 3.2 Structure
Mailing address: Professor John Linsley Department of Physics and Astronomy University of New Mexico Albuquerque, New Mexico (USA) 87131
This work was supported by the National Science Foundation.

208 ELECTRON'S IM LARGE AIR SHOWERS OBSERVED AT 5200a a.a.l»
Bolivian Air Shower Joint Experiment C. Aguirre, A. Trepp and H. Toehil, .Institute da
Invaatlsaclonea Plsicss, Ohlversidad Mayor da San Andrea, LaPax, Bolivia
F.K. HacKaown, Department of Physics, Univeralty of Kong Kong, Hong Kong
I. Kaneko, Dapartaant of Phyalca, Okayama University, Okayama, Japan
P. Kaklaoto, T. Mixuaoto and K. Suga, Departaent of Phyalca, Tokyo Inatltute of Technology, Heguro, Tokyo, Japan
H. Nagano and K. Kaaata, Coaalc Ray Laboratory, Unlveralty of Tokyo, Tanaahl, Tokyo, Japan
K. Murakaal and K. Mlshl, The Inatltute of Phyalcal and Chealcal Research, Itabaahi, Tokyo, Japan
T. Toyoda, Department of Phyalca, Kobe University, Xada, Kobe, Japan
Raaulta are presented on the lateral dletrlbu-tion and the longitudinal development of electrons In air showers with sixes 3x10* to 5*10' observed at Mt. Chacaltaya. The lateral distribution -is coaparad with those determined at mountain altitude and at aaa level by other groups. The longitudinal develops)snt is alao compared with thoae by other groups and with the theoretical predlctlona under various models of nuclear interactions.
1. Introduction. The longitudinal development of electrons In air ahowara near the maxiaiai development la essentially important to study nuclear lnteractlona aa well aa to determine the energy apactrun of primary cosmic raya at very high energies. Therefore, the lateral dlatributloa of electrons, which la the basis to determine the electron-alxe (««), has been obtained, calibrating the response of detector including scintillator, photoaultiplier and amplifier to higher densities and taking into account the transition effect of shower particles In scintillators. Sixe apectra at different xenith angles have beea determined, correcting for uncertainties in determined alxaa and xenith aaglee end checking consistency of tha apectra derived with thrae distinct methods. And the final result on the longitudinal development of electrona Is praaented from air showers ' observed at Nt. Chacaltaya (5200a a.a.l., SSOgca"1) froa 1972 to 1975.
2. Experimental. The Chacaltaya air shower array (Plg.l), apraad over an area of 700ax700a on the mountain slope near the summit,' consists of twelve 0.»7m* unahlelded faat-timing ecintillation detectors (PI-РЖ, Indicated by aquaraa, scintillator thickness 9.tea) and four 1.00m* unshielded fast-timiag scintillation detectora (РЯЕ-ГП, added in 1974, indicated by aquaraa,' aclatlllator thickness 10.Oca) to measure arrival times of abower-front particles as wall as to aeaaure densities of charged particles (essentially electrons), twenty О.еЭа* unshielded scintillation detectora (М1-И20, Indicated by circlea, scintillator thickness 7.Sea) to meaaura

209
Л.
danaltlea of charged particles, eight l/16aa unahleldad acin-tillation datectora (Н'-Ив', added In 1973, indicated by email circlee, acintlllator thicknaaa 2.Oca) to meaeure denaitlec of charged particlu and a 60a1 shielded scintillation detector - a aatrlx of fifteen 4m* detector* (HD1-И015, Indicated by double circlee, scintillator thickneaa 5.Oca) - to measure the local deneity of auona above 600K*V.
The response of photoaul-tiplier and logarithalc amplifier (T.lOus) In all detector* baa been calibrated for a dynamic range of about four decade* with a hydrogen light puleer aa a alaulator of aclatlllator light and a aet of Kodak Wrattan neutral deneity filter*, «ad the reaponaa he* been alao checked for aultlpl* incidence of electrons on tht window-glass of photoaultlmlier with IStoV electron* froa a linear accelerator.
Two different triggering condition* nave been required to record elr «hovers: (a) any one of three four-fold coincidence* (т*1+га+Г»,тУ*+та+ЛП1,ГК+ГХ+ГЖ+та; 30 particle* In each detector; for whole period except November 1973 to February 1974), (b) a four-fold coincidence (ГУ+ГМ+ГЩ+ГМШ, 10 particles in each detector; froa moveaber 1973 Co February 1974).
Fig. 1. array.
The Chaceltaya air shower
3. Analysis. The arrival direction, zenith angle <6) end azimuth angle, and the radius of curvature of shower-front particle» of a ahower were determined with the unahleldad faat-tlaing detector». The core location and the electroa-alae were deterainad froa densities observed in the unshielded detectors, fitting the denaltiae to the empirical lateral distribution (Kaneko at al 1975). The detector wea excluded for fitting, in which the obaerved density waa over the calibrated range of photomultiplier and logarithmic amplifier.
The transition effect of electrons in scintillators has been estimated by comparing deaeltlee observed la detectors with scintillator of different thlcknee* at the same distances froa the axis. The obaerved density (Д0Ъ») la related to the Incident density Wine) ее hob,mb±nc*xp(-t-**сЪ1Х), where t la the thickmaea of aclatlllator and Л la 34.1cm independent of N. between 107 and 10* ami of dlstaacee between 0.2*0 and 3ko (*<,: characteristic scattering length at SSOgca-1, 155a).
Systematic ahlfta and uncertainties In determined sizes and zenith -angles have been estimated froa result* of an analyals of ahowera aiaulated considering the transition affect of electron* mentioned above, the fluctuation In densitlee and uncertainties in measurements of arrival time* of

210
shower-front particles. Shifts In determined core locations have been also estimated fro* results of an analysis of the simulated showers.
<. Lateral distribution of electrons. The average lateral distribution of incident electrons as a function of size and zenith angle has been determined from the composite lateral distributions for showers whose axes fell inside a square of ГУ+га+ЛП+ГИ for sizes smaller than 5x10* and inside the array for sizes larger than 5x10*. The distribution is expressed as
u«(i.,»e)-(1.03CiMe/2itlloJ)x""2"(l+x)*-*- 5(1+C2x2' °) x 1-0.20exp [-(lnx+0.3) V0.50] m"2,
c rr(s)I4».5-2s) r(2.0ts)r(2.5-?.s)1-i Cl l 144.5-s) *°2 r(*.5-s) ' '
C2-0.100*0.125(в«св-1).
«-0.660-0.1051og10(Ke/107)+0.125(sec9-l.0),
(1)
for Э х М ^ в ^ х М » , 0*<е<60* and 0.1<x-K/Ko<3.0. The normalizing factor*comes from the last term and is almost independent of M(, 6 and s within the ranges mentioned above, a Is an age parameter. The lateral distribution within O.lKo has not been well determined due to uncertainties in core locations. The apparent distribution is proportional to I"1 in this region. But the real distribution seems to be steeper than *."', considering th* uncertainties in core locations.
Lateral distributions of electrons have bean determined by the Volcano Ranch group (Llnsley Ш З а ) at 820gca~* and by the Yakutsk group (Diminstain at al 1975a) at 1020gcm~*. The lateral distributions are flatter than the present lateral distributions within lto for sec9»1.49 and sec6 •1.85 which correspond to the depths of 820gca~2 and 1020gcm~2, while the distributions within lay, have not been determined with enough accuracies due to larger . -spacing of detectors by these groups. Fig.- 2 shows the comparison at K.-10*. The ordinate is represented by Д-m"* times Bo2, to eliminate the difference of Rg.
Fig. 2. Comparison of the present lateral distribution of electrons with those by the Volcano Ranch group and by the Yakutsk group.

211
As Is seen In this figure, the electron-sizes are underestimated by these groups.
5. Longitudinal development of electrons. Integral electron-size spectra at different xenith angles or atmospheric depths have been obtained with following three distinct methods. (1) with effective areas calculated analytically. (2) with effective areas determined from an analysis of showers simulated as mentioned in Section 3. (3) Intensities have been determined experimentally. In the last method. Intensities of showers with a given sis* were plotted against areas,.counting the numbers of shower axes in squares whose centers are situated at the center of array (N11), anlr-the plateau value of the Intensities at smaller areas was taken as the intensity of showers. All three methods give consistent results. Distortions of the incident intensities, due to systematic shifts and uncertainties in determined sizes and zenith angles, have been corrected for. In the last method, distortions of the intensities, due to systematic shifts in determined core locations, have been also corrected for.
Longitudinal development of electrons has been determined from these integral electron-size spectra with the method of equi-intensity cuts.
Fig. 3 shows the longitudinal
Ю"
10"
development for intensities "V'sr'1 to 10-1'т-гв-10 _
10* И CO 10"
107
10* 400
rtWrf 1
itf"
10*
to'" ю-" to"
. ю-*
. m-7
• •
• *
• •
1 •
» •
> •
1 ь. •
s •
• • t
4 •
•
"l
T
T
1 r 4
ex'1, together with electron-sizes for 10 "* "m^s^sr •* and 10" *sr"' from longi-
600 800 1000 ATMOSPHERIC
DEPTH (genrf2)
1200
Fig. 3. Longitudinal development of electrons. Squares: by the Volcano Ranch group, triangles: by the Yakutsk group.
tuditial developments obtained by the Volcano Ranch group (Llnsley 1973b) (indicated by squares) and the Yakutsk group (Dimlnstein et al 1975 b, Krasilnikov et al 1975) (indicated by triangles).
The electron-sizes by these group's are smaller than those in the present experiment. The sizes are underestimated by these groups as mentioned in Section 4. Therefore, the sizes have been reestimated using Equation (1), and the reestlmated
' sizes are shown In Fig. 3 with strips. Thus, the discrepancy may be explained by the difference of lateral distributions. •
Electron-sizes in the present longitudinal development for 10~7m"*e~ler~l to lO^'m-'s-'sr-1 are larger than those for corresponding intensities determined previously at Chacaltaya (LaPolnte et al 1968). In the analysis, the electron-sizes were under-

2!?
stiinaired due tJ adopting the "MKG function of s=0.8 and the showers with .ill square larger than 3.0 for density fitting vere excluded for further rnaly.'Tis. A longitudinal development corrected for the underestimates of -i.zes and including all showers irrespective to chi-square is consistent ri *-' the present one.
The present longitudinal development is consistent with that calculated .i the scaling law or a InE multiplicity law for primary Fe nucleus
.uaisser 1974). Barret (1976) claims that at least 40% of primary cosmic 'ays near 3*103 7eV are protons. 7/herefore, the scaling law or the InE multiplicity law may be excluded. The present longitudinal development is consistent with that calculated vtth an E1/,f multiplicity law for pr-imar,y nucleus with A->10 and that calculated with an E : / z multiplicity law for nrimary proton (Dixon et al 1974a 1974Ъ 1974с, Bourdeau et al 1975). The .•resent longitudinal development is also consistent with that calculated v;ith an Е multiplicity law for primary proton with a rising cross section v1th energy (Dixon et al 1974a 1974b 1974c, Bourdeau et al 1975). Anyhow, '. IN? development of electrons is faster than that expected from the conventional model with the Е multiplicity law for primary proton.
The longitudinal developments mentioned above have been calculated with an ordinary radiation length of 37.7gcm г or 36.4gcm in air. According to Genannt and PilUuhn (1973), the radiation length is 34.6gcnT if the molecular binding is taken into account. The present longitudinal development is consistent with that calculated with, the Е ** multiplicity law for primary pi-ocon and with the radiation length of 34.6gcm~'i (Bourdeau et al 1975).
Лг-ferences Sarret M L 1976 J. Phys. G 2. L73 Bourdeau M F et al 1975 J. Phys. У 1 821 Dirainstein О S et al 1975a Conf. Papers 14th Int. Cosmic Ray Conf., Munich 12 4334 - — 1975b Conf. Papers 14th Int. Cosmic Ray Conf., Munich 12 4325 riixon H Е et al 1974a Proc. Roy. Soc. A339 133
1974b Proc. Roy. Soc. A339_ 157 1974c Proc. Roy. Soc. A339 171
Gaissor T К 1974 Nature j!48 122 Genannt R and Pilkuhn H 1973 Conf. Papers 13th Int. Cosmic Ray Conf., Denver 4 2434 Ka-.ieko T et al 1975 Conf. Papers 14th Int. Cosmic Ray Conf., Munich ji 2747 Kvisilnikov D D et al 1975 Conf. Papers 14th Int. Cosmic Ray Conf., Munich 12 .',347 I.'1-jintc M et al 1968 Canadian J. Phys.. A± S68 Linsley J 1973a Conf. Papers 13th Int. Cosmic Ray Co--f., Denver _5 3212
• 1973b Conf. Paper* 13th Int. Cosmic Ray Conf., Denver 5_ 3207

MUONS IN LARGE AIR SHOWER:-' 'ib-'i.v.vU'.' Л г .,/ГЮ.п а.ь З.
Bolivian Air SV:.«ic.-.- Joir.t Expp.rimoi';-C. Aguirre, A. Trepp and H. "JoshiX; T.nstituto de
investigaciones Fisicas, Universidad Mayor de San Andres, LaPaz, Bolivia
Y. Miaumoto, F. Kakimoto and K. Suga, Department of Physics, Tokyo Institute of Technology, Meguro, Tokyo, Japan
P.K. HacKeown, Department of Physics, University of Hong Kong, Hong Kong
T. Kaneko, Department of Physics, Okayama University, Okayama, Japan
K. Murakami and K. Nishi, The Institute of Physical and Chemical Research, Itabashi, Tokyo, Japan
M. Nagano and K. Kamata, Cosmic. Ray Laboratory, University of Tokyo, Tanashi, Tokyo, Japan
Y. Toyoda, Department of Physics, Kobe University, Nada,- Kobe, Japan
Results are presented on the lateral distribution of muons above 600MeV in air showers with siaes 107 to 109 observed at Mt. Chacalta/з. Results are also presented on the muon-size spectrum at 644gcm~"2 and the longitudinal development of muons from 550gcm~2 to 990gcm-2 for intensities 10"em"2s _1sr *' to lO-^m^s-'sr" 1.
1. Introduction. The longitudinal development of muons In air showi-'. u л essentially important to study nuclear interactions at very high energies as a complementary information to the longitudinal development of electrons in air showers. Therefore, the lateral distribution of muons, which is the basis to determine the muon-size (Np), has been determined, correcting tor contribution of bursts produced by hadrons and muons, from air showers observed at Mt. Chacaltaya (5200m a.s.l., 550gcm~2). Integrating the lateral distribution of muons, the muon-size spectrum at 644gcm has bi-ep obtained to determine the energy spectrum of primary cosmic rays, and the preliminary result on the longitudinal development of muons is presented and compared with the theoretical predictions.
2. Experimental. The Chacaltaya air shower array, spread over an area of 700mx700m, consists of forty-four unshielded scintillation detectors to observe air shower particles (essentially electrons) and a 60m2 shielded scintillation detector to measure the local density of muons above 600MeV* sec8 in air shower (6: zenith angle of the arrival direction). The arrangement of detectors is shown in Fig. 1 of paper EA-57 in this conference (Electrons in large air showers observed at 5200m, hereafter, this paper i.-; referred to as Paper 1).
The 60m2 muon-detector, situated near the east boundary of the array, Is a matrix of fifteen 4m2 shielded detectors with plastic scintillator of 5cm thickness and a 16" photomultiplier. The shield Is composed of galena (PbS ore 231gcm"2), concrete (132gcm"2) and lead plate (23gcm"2). The preamplifier (xlO) and the main amplifier (x300) are logarithmic amplifier

214
with a tine constant of about lOus. The response of photomultipller and logarithmic amplifier to scintillator light has been calibrated for dynamic range of about four decades with a hydrogen light pulser as a simulator of scintillator light.
The triggering conditions and the operation of the array are described in Paper 1.
3. Analysis. The arrival direction» zenith angle and azimuth angle, core location and the electron-size (H,) of individual shower have been determined as described in Section 3 of Paper 1.
The local density of muons in a shower is determined from the average of particle numbers measured in fifteen detectors. The contribution of bursts, which were produced by nuclear interactions of hadrons and by bremsstrahlung of muons in the shield, has been examined from distribution of, particle numbers in fifteen detectors and the correction has been applied to determine the local density. The contribution of accidental incidence of muons unrelated to the shower has been also taken into account to determine the i.ocal density. The local density of muons within 60a from the axis has not been determined due to serious contamination of hadrons. Correction for unrelated muons Is Important only at' distances beyond 550m for Ne-107. Ю0
4. Lateral distribution of muons in nearly vertical showers. Showers whose axes fell Inside the array with sec6 not larger than 1.4 were classified into —. groups with an interval of 0.2 in lgNe. - Local densities of muons in showers in each group were normalized to the densities for N,-10*, and the normalized densities were plotted against the distances (r) froa the axes. The distances were divided into bins with a range of 0.1 in lgr, and the median densities in each bins have been fitted to a lateral distribution expressed as
РмСг.Н^-кда^г-»' 5
х[1+г/го(»е>Гг-5 in a - 2, (1)
for 60a<r<600a, and k(H.) and r0(Hc) have been determined in each group. Then, k(Ma) haa been converted to the value at the average of original * V The lateral distribution of muons thus obtained has been corrected for systematic shifts of determined N. and overestimates of H a due to uncertainties In determined Mc as mentioned in Paper 1.
0.01 Ю 100 1000
DISTANCE FROM CORE (r:m)
Pig. 1. Lateral distribution of auons at 644gcm~*.

21$ The final lateral distribution of muons is expressed as
PjKr,Ue)-<660±40)x(Ne/10,)b о»*»- "г"0' 75[l+r/r0(Ne)]-2- 5т"г
r0(Ne)"(98±6)-(43±3)Ig(He/10'). for 60m<r<600», sec6$1.4 (<sec6>ay-1.17) and 107<Н.<10'. The lateral distribution Is shown for Ne of 10'' , 10'•* and 10' * in Fig. 1. As is seen in this figure, the distribution becoaes steeper as Ne Increases.
Muon-size spectrua at 644«,ст~г. The auon-size as a function of
(2)
(3)
electron-sire has been obtained by integration of Equation (2) and is expressed as
Hu«(8.60±0.70)xlOs(H./10,),-,50*,-,it5,
for 107<Ne<10' and at an ataospheric depth of 644gcm~2 corresponding to <«ecS>av-1.17. Uncertainties in auon-slzes, due to ignorance of the lateral distribution within 60a and beyond 600a, have been considered in errors In Equation (3). The lower Halt was given from a auon-size calcu
lated under an assumption that the lateral distribution within 60a is- proportional to г'0'* which was derived froa a lateral distribution of auons at 540 gem"2 obtained theoretically by Capdevielle (1972) for primary proton with energy of lO^eV and an E1'* mul-tiplicity law. The upper Halt was given free a auon-size calculated under an assumption that the lateral diatrlbutlon within 60a is saae as the tangent at 60a of the lateral distribution for Nc-10*. Dncertaintles in onion-sizes due to Ignorance of the lateral distribution beyond 600a is much smaller than those within 60a.
The integral auon-size spectrua at 644gca~2 has been obtained from the integral electron-size spectrum at this ataospheric depth determined as in Section 5 of Paper 1 and the Np-N, relation in Equation (3). The muon-aize spectrum at 644gcm-2 is shown in rig. 2.
6. Longitudinal development
MU0N SIZE AT 6** gcrrr2
Fig. 2. Integral muon-aize spectrum at 644gca~*.

216 of юиопв. The lateral distribution of auon» in Equation (2) with single parameter of r0(N«) ia not satisfactory to express that of muons in shower* whose весб are larger than 1.4. Therefore, the lateral distribution function with three paraaatera -a, в and r„- ia adopted to express the lateral distribution. The lateral distribution function is
Ру(г.н«,е)-к.г-аи+г/г0)-в, (*) where k, a, 6 and r0 are functions of H» and 6. Showers whose axes fell Inside the array were clsssified into «roups with an interval of 0.2 .in __ secO and that of 0.5 in If»,- k, a, $ and r0 have been determined in each (roup, fitting densities of won» against distances to Equation (4) aa described in Section 4 by the least square method. a and В thus determined for showers with аесв«1.4 are consistent with 0.75 and 2.5, respectively, and a increases with see8 and В decreases with secB. r0 for showers with sece^l.4 is also consistent with r0 expressed in Equation (2).
The muon-size hss been obtained by integration of Equation (4) as a function of He *nd sec8 after the lsteral distribution was corrected for as described in Section 4. Ths longitudinal development of •uons has been determined from the Нц-Ne relatione at different secO or atmospheric depths and the longitudinal development of electrons which is shown in Fig. 3 of Paper 1. The longitudinal development of •uons is shown in Fig. 3 (full circles), together with muon-sixes at 644gcm~z for corresponding intensities (open circles) obtained from the integral muon-size spectrum in Fig. 2. In Fig. 3, also shown are sizes of •uons above 750HeV in vertical showsrs at sea level for corresponding intensities determined by the Sydney group (Bell et al 1974, sell 1976). The present longitudinal development and the results of Sydney group show that no appreciable attenuation of muons occurs above several hundreds of MeV between 600gca~* and 1050gcm"2.
The present longitudinal development of muons is compared with theoretical predictions for primary proton with 1017eV in Fig. 3.
10
^-10* UJ
81
10"
10
- W
i6"
id10 4 * . * . - • " - - . - • *
10"» f * •
iST" tsr—irar—лег ATMOSPHERIC DEPTH
SoTT (gari*)
Fig. 3. Longitudinal development of muons. Full circles and open circles: present results, squares: by the Sydney group (Bell et al 1974) and triangles: by the Sydney group (Bell 1976).

217
The dotted curve was derived from the longitudinal development of unions above lGeV obtained by Capdevielle (1972) with an Е1'* Multiplicity law. The full curve is the longitudinal development of anions above 750MeV obtained by Dedenfco (1975) with a model of CKF and isobar. It is to be mentioned that the energies of muons in the present longitudinal development increase with sec6 as Ey>6O0H«Vx««c9 and the effect of muon decay in the present experiment is different from that in the above calculations at the corresponding atmospheric depths. Although the decisive conclusion is not drawn from the comparison, the InE multiplicity law or the scaling law may be ruled out but the E1/"t multiplicity law may not be excluded. Since the uncertainty in radiation length which effects the longitudinal development of electrons as mentioned in Section 5 of Paper 1 does not effect the longitudinal development of muons, accurate and detailed simulations with various kinds of models for the longitudinal development of muon» are highly desirable to draw the decisive conclusion on the character of nuclear interaction at these high energies from the comparison with the present experimental result.
References. Bell 0 J et al 1974 J. Phys. A 1 990 Bell С J 1976 J. Phys. G 2 867 Capdevielle J И 1972 PhD. Thesis, Universite de Paris-Sud Centre D'Orsay Dedenko L G 1975 Conf. Papers 14th Int. Cosmic Ray Conf., Munich в 2857

ft 0009S 218
ENERGY SPECTRDM OF PRIMARY COSMIC RAYS FROM 1016eV TO 1019eV DETERMINED FROM AIR SHOWERS OBSERVED AT 5200a a.s.l.
Bolivian Air Shower Joint Experiment C. Agulrre, G.R. Mejia and H. Yoshii, Inatituto de
Investigations* Plaices, Univeraidad Mayor de San Andrea, LaPaz, Bolivia
T. Kancko, Department of Fhyalca, Okayama University, Окауавш, Japan
P.K. МасКаоип, Department of Phyaica, Univeraity of Hone Kong, Hong Kong
Г. Kakimoto, Y. Mizumoto and K. Sug», Department of Phyaica, Tokyo Inatitute of Technology, Meguro, Tokyo, Japan
M. Nagano and K. Kamata, Cosmic Ray Laboratory, Unlveralty of Tokyo, Tanaahi, Tokyo, Japan
K. Murakami and K. Hiehi, The Inatitute of Phyaical and Chemical Reeearch, Itabashi, Tokyo, Japan
Y. Toyoda, Department of Fhyaica, Kobe University, Nada, Kobe, Japan
Energy spectra of primary coemlc ray» from 10l'eV to 10l'eV have been'determined from electron-sizee aa wall aa from muon-slzcs of the aame air showara obaarvad at Mt. Chacaltaya. The apectrun from electron-eizea la aignificantly higher than that from auou-alzee. The diacrepancy la dlacussed yand an explanation la given under an assumption of possible existence of copious direct production of photons beaidea the production of charged and neutral picas at these high energiea. The apectra ara also compared with those by other groupa and the discrepancies ara diacuaaad.
1. Introduction. Energy apectra of primary cosmic raya above 1017e¥ have been determined by five groupa from electron-sizes (Hc) (Linsley 1963, Llnaley 1973, Uneley 1975, Dlmlnatein et al 1975, Krasilnikov et al 1975, Kaneko at al 1975a, Kaueko et al 1975b), energy loaaea In deep water Cerenkov detectora (Clarka at al 1975, Brownlee et al 1975) and muon-eizes (Иц) (Bell et al 1974, Bell 1976). Although energy spectra by thea.e five groupa are expreaaad by power functions up to lO^eV or 10zoeV, the absolute Intensities and the exponents show significant discrepancy. In particular, the energy spectrum of the Chacaltaya group la very high In intensity and haa tha amalleat exponent.
The reason of this diacrepancy has not bean clarified, am the energy spectrum has been determined mainly from the single sort of different parameter observed In sir shower by the individual group. Therefore, the energy spectrum has been determined from the electron-size spectrum at maximum development of showers observed at Mt. Chacaltaya (5200m a.a.l., SSOgcm'1) as wall as from the muor-size spectrum at 644gcm~* of the same showers.
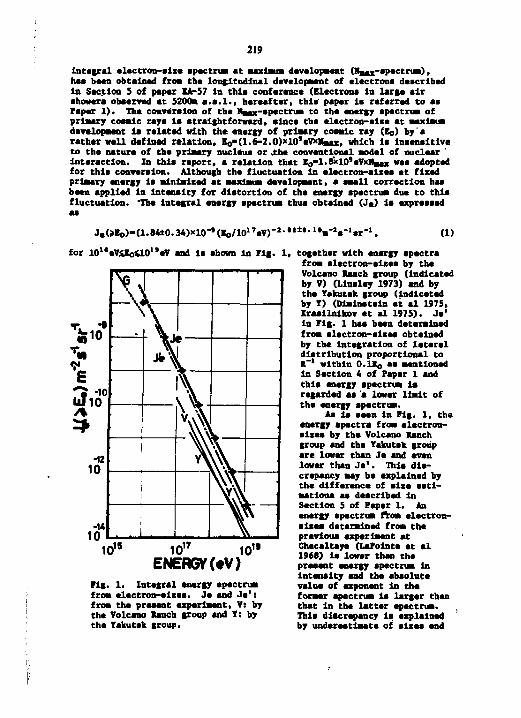
219 integral electron-slse spectrum at maximum development (Haax'Spectrum), has been obtained from the longitudinal development of electrons described In Section S of paper 1A-57 in this conference (Electrons in large air showers observed at 5200* a.s.l., hereafter, this paper is referred to es Paper 1). The conversion of the Xmax'Spectrum to the energy spectrum of primary cosmic rays is straightforward, since the electron-alse at maximum development is related with the energy of primary cosmic ray (Eo) by a rather well defined relation, Ео*(1.6-2.0)х10,еУхНвах, which Is Insensitive to the nature of the primary nucleus or ЛЬ* conventional model of nuclear ' interaction. In this report, a relation that a^l. 8xJ,0%Vxamax was adopted for this conversion. Although the fluctuation in electron-elzes et fixed primary energy le minimised at maximum development, a small correction has been applied in intensity for distortion of the energy spectrum due to this fluctuation. -The integral energy spectrum thus obtained (Je) is expressed
J,(>Eo)-(1.84±0.34)xlO-»(Eo/1017eV) -2.«2±«.It- CD for 10"eV$So&lnl*eV and la shown in Fig. 1,
10' ,15 10" 101» ENERGY (tV)
Fig. 1. Integral energy spectrum from electron-elses. Je end Je': from the present experiment, Vs by the Volcano Ranch group and T: by the Yakutsk group.
together with energy spectra from electron-sizes by the Volcano Ranch group (indicated by V) (Linsley 1973) and by the Yakutsk group (indicated by T) (Dlmlnsteln et el 1975, Krasllnlkov et al 197S). Je' in Fig. 1 has been determined from electron-sizes obtained by the Integration of lateral distribution proportional to R-1 within O.IRo as mentioned in Section 4 of Paper 1 end this energy spectrum Is regarded as 'a lower limit of the energy spectrum.
Ae is seen in Fig. 1, the energy spectra from electron-sixes by the Volcano Ranch group and the Yakutsk group are lower than Je and even lower than Je'. This discrepancy may be explained by the difference of else estimations aa described in Section 5 of Peper 1. An energy spectrum flrom electron-sizes determined from the previous experiment at Chacaltaya (LaPointe et al 1968) is lower then the present energy spectrum in Intensity and the absolute value of exponent in the former spectrum la larger then that In the latter spectrum. This discrepancy Is explained by underestimate of elzes end

220 rejection of showers with large chi-squara for density fitting in the previous experiment, as described in Section S of Paper 1.
3. Energy spectrum of priaary cosmic raya fro» auon-aiaes. The integral energy spectrua is deterained froa the integral auon-sise spectrum at 644gcm~2 obtained in Section 5 of paper EA-58 in this conference (Muons in large air ahowera observed at 5200a a.a.l., hereafter, thia paper is referred to as Paper 2) and an Np-Eo relation at the saae atnospheric depth for. priaary proton estimated froa the longitudinal developaent of auons calculated by Capdaviellc (1972) and Dedenko (1975). Capdevlelle used an Ел'ц • multiplicity law in which the multiplicity of produced pions is 2Е1/Ч (Е in GeV). Dedenko adopted CXP and laobar м the model of nuclear interaction. The auon-alze by Capdevielle is about 20Z larger than that by Dedenko. Therefore, the average of Nu by theae authors has been used. The integral energy spectrua thus obtained (Ju) is expressed as
Ju(*Eo)-(2.90±0.50)xl0-le(Eo/1017eV>-1,»'±0-16m-2s-1sr-1, (2) for lO^eVSEoilO^eV and is shown in Fig. 2> together with the energy spectrum by the Haverah Park group froa energy losses in the deep-water Cerenkov detector at a distance of 600n from the axis at sea level (indicated by H) (Clarke et al 1975, Brownlee et al 1975) and those by Sydney group froa muon-slses alao at sea level (indicated by S) (Bell et al 1974, Bell 1976) The fluctuation in auon-sizes at fixed electron-size has not been deterained in the present experiment, and that at fixed primary energy at the depth of 644gca~* is not known *t present. Therefore, the present energy spectrua is an upper limit.
As Is seen In Fig. 2, the present spectrin is consistent with the Haverah Park spectrum where the contribution of auons Is predominant. Although the Sydney spectra are lower than the present spectrua, the Sydney spectrua published in 1974 (the upper one in Fig. 2) becomes consistent with the Haverah Park spectrum if the same model of nuclear interaction
Та.
« .
10
АО ulio Л
-12 10
-14 10
1c-10" r.17 10" 10
ENERGY (»V) ,»
Fig. 2. Integral energy spectrua froa auon-sires. Ju: from the present experiment, H: by the Haverah Park group from energy losses in deep water Cerenkov detector and S: by the Sydney group.

221
adopted by the Havcrah Park group (Е1/ц multiplicity lav) is used to convert Nu to E0. The Sydney spectrua published in 1976 seems to be still lower than the Haverah Park spectrua. even if the saae conversion is used from Nj, to EQ. However, both Sydney spectra converted with the El/" multiplicity law from Np are consistent with the present spectrua, as far as the energy spectrum between lxlO,7eV and 7xl027eV is concerned.
4. Comparison of the energy spectrua from electron-sizes and that from muon-sizes. The energy spectrum froa electron-sizes (Je) is.about 6 tiaes higher in intensity and about 2.5 tiaes higher in energy than that from muon-slzes (J»)- * lower liait of the energy spectrua from electron-sizes (Je') la «till significantly higher than Ju, as is seen in Fig. 3.
If an Nu to E0 conversion is Bade with a InE multiplicity law or the scaling law, the energy spectrua becomes higher than the present one. However, Barret (1976) has claimed that it is necessary to invoke a fast-developing air shower model (an E 1 / a multiplicity law) to interpret the measurements of signal rise-times in deep water Cerenkov detectors at
primary energy near 3x10¹⁷eV and fluctuations- in these rlse-tiaes indicate the existence of at least 40% proton in priaary cosaic rays at this energy. Moreover, several arguments against the InE aultiplicity law or the scaling law have been published (Kalmykov et al 1975, Clarke et al 1975, Bell et al 1974, Kalaykov and (Christiansen 1975). If an tty to E 0 conversion is made with an E 1 / 2
multiplicity law or a high multiplicity model, the energy spectrum becomes lower than the present one. If the primary cosaic rays are mainly heavier nuclei, the energy spectra from muon-sizes become lower than those for priaary proton. The present spectrum from auon-slzes has been determined from auon-sizes calculated for auons above 750McV by Dedenko (1975) and those for auons above lGeV by Capdevielle (1972), while muons above 600MeV were observed in this experiment. Therefore, the present energy spectrum from union-sizes are regarded as an absolutely upper linit.
The energy spectrum froa electron-sizes is not consistent with that froa union-sizes, as explained just above. The
10" 10" ENERGY (»V)
K>"
Fig. 3. Comparison of the Integral energy spectra from electron-sizes (Je, Je') and that from muon-slze (Ju). Jt: the true spectrua estimated from Je and Jp.

'222
discrepancy is not easily reconciled within the context of a conventional model of nuclear interaction and electroaagnetlc cascade theory under Approximation B. However, the discrepancy may be explained by invoking a copious direct production of photons (electron pairs) in hadronic interactions at vary high energies besides ths production of ir**""»*. Under this assumption, the energy spectrum of primary cosmic rays Is overestimated fro* electron-sixes and underestimated from nuon-sliss, as the electron-six* of • purely electromagnetic cascade shower from a photon at maximum development is about l.C*(Bo/10'eV) while the electron-sizs of an air shower from a primary nucleus is about (0.5-0.6)x(Eo/10'«V). A consistent framework which will account for the two spectre es well es the longitudinal developments of electrons requires that (1) the primary energy is almost equally shared' between the production of photons and the production of *+«"**> (2) the energies of Individual photona are 10"2 to 10"' times lower then the primary energy» end (3) the true energy spectrum of primary cosmic reys (Jt) mey be expressed as
Jt(»o)»,l«0x10-'(lo/10l 7eV)"2 • •тГ*в_1аг~1, (3)
for 101(eV£IoS10"eV and even for higher energies. This true spectrum is also shown in Fig. 3. It is worth noting that the longitudinal development of electrons near the maximum la mainly formed by ceacade ahowera from the photons produced directly ae mentioned Just above.
References. •arret M L 1»76 J. Fhya. G 2 L73 Bell С J et el 197* J. Phys. A I 990 Bell С J 1976 J. Phys. G 2 867 Brownlee К G et al 1975 Conf. Papers 14th Int. Cosmic Say Conf., Munich .8 2704 Capdevielle J V 1972 PhD. Thesis, Dnivsrslte de Paris-Sud, Centre D'Orsay Clarke А К et al 1975 Conf. Papers 14th Int. Cosmic Kay Conf., Munich 8 2699 Dadenko L G 1975 Conf. Pepere 14th Int. Cosmic Bay Conf., Munich 1 2857 Dlminstein 0 S et al 1975 Conf. Papers 14th Int. Cosmic Bay Conf., Munich 12 4318 Xalmykov И M et al 1975 Conf. Papers 14th Int. Cosmic Bay Conf., Munich Ь 3034 Kalmykov M M and Christiansen G В 1975 Conf. Papers 14th Int. Commie Bay Conf., Munich 1 2861 Xaneko et al 1975a Conf. Papera 14th Int. Cosmic Bay Conf., Munich £ 2695
1975b Conf. Papera 14th Int. Cosmic Bay Conf., Munich 12 4343 Kraailnikov D D et el 1975 Conf. Papera 14th Int. Cosmic Key Conf., Munich 12.4347 LaPolntm M at al 1968 Canadian J. Phys. 46 S68 Llnsley J 1963 Proc. 8th Int. Conf. Cosmic Kays, Jaipur 4 77
1973 Conf. Papere 13th Int. Cosmic Kay Conf., Denver b_ 3207 — : 1975 Conf. Papera 14th Int. Cosmic Bay Conf., Munich 2. 598

223 SHOWER FRONTS OF LARGE AIR SHOWERS OBSERVED AT 5200m a.s.l.
Bolivian Air Shower Joint Experiment Y. Mizuaoto, P. Kaklmoto and K. Suga, Departaent of
Physics, Tokyo Institute of Technology, Meguro, Tokyo, Japan
P.K. MacKeovn, Department of Phyaica, Univeraity of Hong Kong, Hong Kong
T. Kaaeko, Department of Phyaica, Okayaaa University, Okayaaa, Japan
C. Aguirre, ж. Trapp and H. Yoahii, Institute de Invaatigaciones Fiaicaa, Univeraidad Mayor da San Andres, LaPaz, Bolivia
Y. Toyoda, Departaent of Phyaica, Kobe University, Kada, Kobe, Japan
K. Murakami and K. Hiahi, The Institute of Physical and Chemical Research, Itabaahi, Tokyo, Japan
Shower fronts of large air showers observed at Mt. Chacaltaya are not spherical as characterized by the radiua of curvature. Tha delay of shower front(d) from tha plana perpendicular to the axia ia expressed aa d-(6«.2±19.0)[r/(407±SO)]p in a, where r ia the distance from axla in a, at sizes
• 5x10* to 5x10'. Although p of individual ahowera are diatributed for a wide range, 76 percent of p remains in 1.0-2.0.
1. Introduction. An early ataga of longitudinal davelopaent of a ahouer may be directly reflected in the curvature of faat particle front of the shower observed at a high altitude. Preliminary results on the curvature was presented froa air showers observed at Mt. Chacaltaya (5200a a.s.l., 550gcm"2) at the 13th International Cosaic Kay Conference (Aguirre et al 1973). In that report, the shower front wss aaauaed to be spherical and the radius of curvature (КС) waa determined in individual shower. In this report, the atructure of shower front has been atudiad and a better parameter than КС is proposed to characterize the shower front.
2. Experiment»!. The Chacaltaya air ahower array is described in paper EA-S7 In this conference (Electrons in large air ahowara observed at 5200a a.s.l., hereafter, this paper is referred to as Paper 1). Sixteen fast-timing scintillation detectora, among which four detectora (WUT-FM) were added in 1974, have been used to observe arrival times of faat particles at the ahower front. Tiaa differancea between paira of detectora, FI-F», FB-FV, 1Ш-Г1, FY-FVE, FV-FdH, FVt-VVal, FVX-FVJI, П Ш - Р Ш , РЖ-РЖ, FX-РЖ, РЖ-FaI, FXE-FVI, РЖУ-РИД, PXV-FTO and FXW-ЛШ, have been aaasurad. The signala froa tha F-datactors ware discriminated at a leval corresponding to the passages of five, two or 0.2 vertical particles to make a stsrt or stop pulse fcr the time to voltege converter (main results described below hava been obtained for a level of two particles).
3. Analysis• Only timing-channels in which each of the two detectora recorded a signal greater than 8 particles were used in the analyaia. At

224 first, the arrival direction, zenith angle (3) and azimuth angle (ф), and the radius of curvature have been determined from time differences in effective timing-channels, looking for the chi-square minimum for в, ф and RC. Determination of core location and the size of shower is described in Paper 1.
4. Average structure of shower front. According to the preliminary results (Aguirre et al 1973) the mean radius of curvature increases apparently with size (N) from 3xlo' to lxio'. A result of further analysis extended to 1x10' and 5x10* alao shows the similar dependence of average RC on N. It was clarified afterwards that the apparent dependence is mainly due to the number of effective timing-channels and no significant dependence of RC on N is seen for a given number of effective timing-channels. Following these findings, the real structure of shower front has been studied.
The delay of spherical shower front (d in m) from the plane perpendicular to the axis is expressed as
d-r2/(2R-d), (1) where r is the distance from axis and R is the radius of curvature. If d or r Is small compared to 2R, d is approximately equal to r2/2R. It has been examined whether this relation is applicable to the real shower front.
The measured time difference between a pair of detectors is converted to the absolute time difference (tjj), taking into account the arrival
direction, the location of detector, length of signal cable, artificial delay in timing circuit and the factor of stretching time difference. The tjj expressed in m is divided by r^-rj, where гд and rj are distances of the i-th and j-th detectors from the axis, respectively. Then, г11^г1"гд) *» Plotted against r-tri+Tjm. гц/О^-Гд) corresponds to the derivative of delay of shower front by r. Fig. 1 shows the average of 'ij^ri-rj) against r for showers with sizes 5*10* to 5X10', together with three curves expected for RC of 1000m, 2000m and 3000m. This figure indicates clearly that the shower front is not spherical and the delay (dl is well expressed as d-krp, where p is smaller than 2.0 corresponding to spherical shower front. (m) woo
Fig. 1. Derivative of the delay of shower front by the distance from axis (r) against r.
5. Structure of shower front of individual shower. From the relation d-kr1* and mea- . aured time differences, в and

225 ф as well as к and p have been determined for Individual shower. 6 and ф determined with RC were used as the first approximations of 9 and ф for this procedure. Fig. 2 shows the distribution of p in showers with sizes 5X10' to 5*10'. Proportion of showers with p larger than 2.0 is about 9% and that with p smaller than 1.0 is about 152. It is worth noting that p of almost all showers are smaller than 2.0. к is connected to p, in individual shower, by a relation
k-(0.52±0.10)*10-<i-6l±"-05Hp-,). (2) From this relation,
d-(6ft.2±19.0)[r/(407±50))p in v. (3) This equation describee the structure of shower front defined by the second particles from the extreme front of shower with sizes 5X10* to 5X10'. Fluctuation of p as shown in Fig. 2 seems to be due to physical processes, but the detailed examination is not finished. The average value of p and the fluctuation are independent of the number of effective timing-channels.
Incidentally, average of 8(RC)-6(k,p) Is zero and the proportion of |e(RC)-e(k,p)|«3* is 74Z for 0*<e<60*, where 9(RC) means the zenith angle determined with RC and в(к,р) menas that with d«krp.
Fig. 2.
Distribution of p in d-krP.
1.2 1.4 1.6 EXPONENT (P)
2.0
References. Aguirre С et al 1973 Conf. Papers 13th Int. Cosmic Ray Conf., Denver .4 2576

226 Air Shower Cores of 10 1 5 - 101* »T Observed .by Chacaltaya Bmlsion Chambers.
BraslWapaa Eaulaion Chamber Collaboration
TheoMllcil Q Bnpariw»m«l(J3 Both Q
Chaoaltaya emulsion chamber detects an air abovar oore-aa a family of eolliaatad ataosphsaie gamma-rays and' eieotroba of high energy. One with the highest energy во far observed his 3.1016aT. Details of events with energy greater tbaa 1015eT will be reported, lateral structure of soever core» allow» them to be classified into group» which correspond to. types of their, parent ataoapherie lnteraotioaa, Oisoussions will be aada on composition ana;energy speatna af primary particles from th» observational data.
OoofdinatM: •4 3.4. (High energy Interactions)
•UlHngMldNBii rrof. CH.Q.Latte», Institute do Flsiaa Oleb sataghin; DXICillP.
Caixa Postal 1170, Qaapinaa BSE HUSH.. Prof. IJujimoto, Blkohken, Vaaada University,
17 likttl-eho, Shinjulni-ku, Tokyo, JAFil.

227
THE TIME STRUCTURE OP THE MUON COMPONENT OF EAS IN THE
ENERGY RANGE 10 1 6 to 5 x 10 1 7 eV -
E.J, de Vllllers and D.J. van der Walt.
Potchefetroom' University for CHE, Potchefstroom, South Xfrica'
Theoretical £ ] li... dentil Г) Both Q
The time structure of the union component up to 35 ns was measured near the core in extensive air showers by an array of five very fast Cerenkov detectors.
The time distributions are obtained with considerably accuracy from time difference measurements between muons only, instead of including the electron component for determining the arrival time of the shower front'.
Coordinate»: ffi 3 > 2 ( s t r u c t u r e,
Mailing address:
Dr E.J. de Villiers Department of Physics Potchefstroom University for CHE Potchefstroom 2520, South Africa

228
TEMPORAL CHARACTERISTICS OF AIR SHOWER ENERGY DEPOSITION IN PLASTIC SCINTILLATORS
D.M. McDonald, R.N. Clay, J.R. Prescott
Department of Physics University of Adelaide
Australia
The longitudinal structure of individual shower disks is under investigation with a system risetime of about 3ns at the Buckland Park array.
Preliminary results indicate that, within 50m of the core, the disk thickness varies surprisingly little between showers. Structured events are however observed. The observed mean pulse width is in reasonable agreement with previous work.
1. INTRODUCTION
The longitudinal distribution of charged particles in the disk of air showers is particularly relevant to observations of the time spread of Cerenkov light near the shower iT.re. The arrival times of penetrating particles have been studitj quite extensively but there have been rather few measurements on the longitudinal structure of all charged particles.
Woidneck et al (1971, 1975) have studied the a». ;ivi times of single electrons in a small detector (0.01m'' ) with respect to the arrival of many particles in a nearby Targe counter (lm2) and have been able to build up statistical distributions of arrival times as a function of core distance. The width ( a ) of these distributions varies from 2.9ns for A < r < 10m to 7.0ns for r > 63m. The tine resolution of this experiment fl.2ns) was excellent and superior to the present experiment but the interpretation of the sampling process is not straightforward if more than one particle passes through the detector and there must also be some uncertainty in the triggering of the larger scintillator.
We have completed a pilot study of the temporal distribution of signals from an unshielded plastic scintillator, avoiding sampling problems by photographically recording an oscilloscope type display of the scintillator output.
2. APPARATUS AND METHOD
A small area fast scintillation detector has been constructed for use in conjunction with the Buckland Park air shower

229
array. This detector consists of a 300 лап diameter :i;s!c (0.07m2 area, thickness 25 mm) of NE104 scintillator painte-l white on the back and enclosed in a black housing. The sc- '.t: J later is viewed by an EMI 1820B fast photoraultiplier (50 mm dianete--'! from a distance of 520 mm and the output of the tube processed by a Tektronix 7912 transient recorder with 500MHz bandwidth. The system risetine (104 to 90%) is - 3ns . The recorder consists of a snail cathode ray storage tube which is read using a TV type raster to produce an analog output. This is displayed on a TV monitor and photographed.
Operationally it can be thought of as an oscilloscope with a long persistence phosphor run at 10ns per division.
The recorder is triggered by one of the scintillators (lm*) in the fast timing section of the particle array and the test scintillator is run by the side of the larger scintillator. In this way, jitter problems are largely avoided. The recorder monitor is only photographed when the main particle array provides a trigger. The long persistence of the television monitor screen plus the internal delay within the recorder allows sufficient time for a mechanical camera shutter to be employed.
The main particle array provides the usual direcicnal and size information for each recorded event. Typical shower riles are in the range 105 - 5 x 10* particles and 70% of the analysed showers fall within SOm of the test detector.
The risetimes and the full width at half maximum (FWHM) of the recorded pulses are measured for each event. The system MS a • response to a single particle corresponding to a risetime (105 to 90%) of 3ns and a FWIM of 5ns.
3. EXPERIMENTAL RESULTS AND DISCUSSION •
The distribution of observed pulse widths for the response of our scintillator to air showers is shown in Figure 1 where the probability of a full width at half maximun of all measured pulses is plotted independent of pulse height. The peak of this distribution at 11ns is consistent with the data of Woidneck et al for all core distances, allowing for their superior time resolution. That is, the typical full width half maximum of the shower pulse is of the order of six nanoseconds after allowing for the instrumental resolution. We would comment that the distribution in pulse widths is rather small if taken in terms of its full width at half maximum, beigg only about 4ns. However, there was a significant number of events which showed considerable structure over a long tine period and we wish to comment on these.

230
32
!
Г
Г s
J]_
А . V I 12 Н
Full wrtth at half mMimum <ns)
Fig 1. The probability distribution of full width at half nxiaim for unshielded fast scintillator pulses. No allowance is made for the system impulse response.
Since the fast scintillator was triggered by the Buckland Park air shower array and was within the fast timing section of the array, we expect good shower analyses. The mean particle density over all showers at this detector was 6 particles per square metre, calculated using the core distance, size and direction of analysed showers. Thus, we expect a mean of only ~ 0.5 particles within the 0.07m* area of our detector, or roughly one particle detected for every two events. In fact, even with this small detector, only 1% of recorded events have no detectable pulse (less than 4% of the mean from a single vertical muon).
The apparent inconsistency is due to the definition of an air shower particle density as the observed pulse height in a particle detector divided by the mean response (allowing for Landau fluctuations) of the detector to a single vertical muon. Our detector is shielded only by a light roof and is sensitive to all charged particles. Thus, we detect a large number of particles apart from minimum ionising particles, many of which only produce a very small response in our detector.
The situation is illustrated in Figure 2 where three representative pulses are shown. The first (2a) corresponds in amplitude to a single vertical muon although it is somewhat wider than the system impulse response. The second (2b) corresponds to a typically observed type of pulse shape with some structure, apparently corresponding to the arrival of a number of particles and with a total enclosed pulse area of about that of the response to a single vertical muon. The pulse shown as 2c has a total area which is not dissimilar to that of a single vertical muon response but is in

231 . fact coaposed of a large nuaber ( ~ 10) particles arriving over a period of some 40ns. This pulse is slightly extreme but such extended pulses are observed in ~5% of our records.
и го Tin» (nc)
Fig 2." Representative teaporal responses of an unshielded fast scintillator detection systea to EAS.
The recording systea was run foT some time with the scintillator reaoved. Fast pulses attributable to Cerenkov light produced in the photoaultiplier envelope (Clay and Gregory 1977) were observed in about 20% of the events. However» these pulses were typically less than 20% of.the amplitude of the normal observed scintillator pulses and were also markedly narrower (FNHM 4ns) . They would thus be recognisable in any delayed pulses. In the remaining 80% of the events, no pick-up was observed with an upper limit of 0.3% of the "single auon" amplitude.
CONCLUSIONS
The longitudinal structure of individual air shower disks has been observed with a saall area scintillator. Allowing for the instrumental response, a pulse width (FMM) of 6ns is typical for showers falling within 50m of the detector and the distribution of these widths is not large С ~ 4ns ) .
Despite the detector's small area, many peaks are coaaonly observed even when the nominal particle density is only ~ 0.S in the area of the detector. The systea is almost able to resolve these peaks and the resolution of the systea is currently being upgraded . Steps are being taken to study the coaposition of the particles producing the individual peaks with the addition of a siailar detecting systea placed below the original and spaced from it with ~ 16g cm-' of lead.

232
S. REFERENCES Woidneck, СР., Boh«, E., Trunper, J., and de Villiers, E.J.
Proceedings of the 12th International Conference on Cosmic Rays, Hobart, EAS-30, 1038, 1971.
Noidneck, СР., and Bona, E., J. Phys A, 8_, 997, 1975.
Clay, R.W., and Gregory, A.G., J. Phys A, 10, 135, 1977.

233 The Cerenkov Light Pulse Spectrum From Low Energy Air Showers—
Measurements and Simulations D. H. Hartman and C. Y. Fan
Department of Physics, University of Arizona, Tucson, AZ, USA P. 6. Googh and K. E. Turver
Department of Physics, University of Durham, Durham, England Т. С weekes
Center for Astrophysics, Box 97, Amado, AZ ABSTRACT - A new series of measurements of the Cerenkov light pulse spectrum made with an assortment of single light detectors is presented. These measurements are without the <-*'•?£,ation uncertainties of previous measurements. It is sbc,„i cnat the originally assumed one to one correspondence between the measured light pulse exponent and the cosmic ray exponent is over-simplified. Fluctuations in the development of small air showers obscure the primary spectrum so that it cannot be unfolded from the Cerenkov spectrum by the present series of simulations.
1. INTRODUCTION - Primary cosmic rays have been well measured directly using balloon and satellite experiments at energies below 10'2eV and Indirectly using the air shower technique at energies above W'*eV. Only a few measurements have been made for the mass composition in the intermediate lO^-lO'^eV range and these have proved .difficult to interpret [see the reviews by Hillas (1975) and Juliusson (1975)].
A method of measuring the primary energy spectrum in this intermediate energy range which is in principle simple and inexpensive has been described by Gerdes et al. (1973). The method utilizes the Cerenkov radiation produced in the small air showers, the experimental requirement being a flux collecting system, photomultiplier and pulse analyzer. The technique appears at first sight to be very promising for the following reasons: (i) The method may cover the important energy range 101J-1015eV using the same ground based technique; the wide dynamic range is achieved by using light detectors with different apertures; (ii) The method provides a high event rate and a substantial photon count per event; (lii) The analysis is simple if. it is assumed that there are no variations in the lateral distribution function for Cerenkov radiation with primary energy and that there are no fluctuations in the development from shower to shower. In this case it has been shown by Gerdes et al. (1973) that the pulse spectrum exponent is identical to the cosmic ray energy spectrum exponent.
Preliminary results using the technique have been reported Gerdes et al. (1973), (1975)]. In the previous paper [Gerdes et al. 1975)] the interpretation was based on the air shower simulations
of Zatsepln and Chudakov (1962). Here we report the results of new rigorous computer simulations of Cerenkov radiation from cosmic ray Showers in the range 10"eV to 10"eV Initiated by primary nucleons which clearly show that fluctuations are important and that the lateral distribution of light does depend on energy. 2.1 LIGHT DETECTORS - Three different types of light detectors were used, each having a different range. In each case the detector was pointed to the zenith at the Mt. Hopkins observing site (altitude

234 2.3 km) and operated only on clear moonless nights. The parameters of the detectors are summarized in table 1 together with their estimated range of maximum response. 2.2 PULSE PROCESSUS ELECTRONICS - In order to maximize the observing time and to provide a cress check for systematic errors, two identical electronic systems were bul't, capable of accumulating and recording data simultaneously. Fig. 1 *!»ows a simplified block diagram of electronics used In one of these systems.
The dynamic range of the system was limited entirely by the PUT output current capability on the high end, and sky noise on the low end. The РИТ and recording electronics were linear over a range of a hundred above noise threshold. The non-linear (РИТ saturation) region was also usable but required an extensive series of calibrations. The total range then obtainable was a thousand. 2.3 С Ш ЮС0ИИИ6 SYSTEH - Data from the charge digitizers were read In the form of 10-Mt binary numbers and recorded on a digital magnetic tape recorder for subsequent computer analysis. In addition, a real time display was provided via a pulse height analyzer. 2.4 С М . И М П 0 И OF THE^VSTEH - To use the full dynamic range of the system, It was of prime importance to obtain an accurate calibration curve for the system. The light source used for calibration was a pulsed LEO which was capable of supplying a 10 ns light pulse strong enough to saturate the phototubes. This light source was then attenuated in 2db steps using neutral density glass filters. Calibration curves were obtained for a given PHT and electronic system at various tube currents, and various ambient (photocathode) temperatures. For the bare РИТ measurements, which were made on three consecutive months, this procedure was repeated after each month, to check for long range drift problems such as PHT aging. The appropriate calibrations were then folded into the Cerenkov light data according to the recorded ambient currents and temperature. In addition, an absolute calibration point was obtained from a radioactive Amricium source embedded in a plastic scintillator. This gave a fast light pulse of 2212 + 215, photons. 3. RESULTS - A total of 250 hours of observations were obtained, divided according to table 2. In fig. (2) is shown the results of (a) the 10я reflector experiments, (b) 1.5 m.experiment, and (c) the bare РИТ experiment. The 10m reflector data was obtained on two consecutive nights and was intended primarily as a system check, since this measurement has been made before: the non-linear portion of the response was not measured for these observations. The data obtained with the 1.5 я detector corresponds to a total of 3.5 x 10* showers. Each of the curves can be filled by a power of law of constant exponent over most of the range; the measured exponents are given 1n table 3 together with applicable range of photon densities, we note that the bare РИТ data exhibits a steepening at photon number of approximately 7 x 10*. 4. SIMULATIONS - In parallel with these measurements an extensive series of simulations have been made to check the validity of assumption (3) In the introduction. The simulation was made as rigorous as possible by employing Monte Carlo techniques throughout.

#ЯрМ*лОМСЯ1 аГГеПООПвЛТ* F1|. 2 (Mew) - Results of tht spectrm experiment.
(a) MN reflector system--dashed Una represents Unit of РИТ linearity
Ihi 1.M reflector system c) eare РИТ system xs
W p щ "1 ' ' " I
i
N " • • ' * J _ • • • • • • " ' ,
i ? • ? W - • • * • '
(a)
:
1*
Ц1 I ITH'| | | | f I I'TlfT
\
\
V X
*J - i ' • • T - |
(c)

236
m •tn. i.m 1.
4.1 THE NUCLEAR CORE - The cascading of all nucleons and plons was considered by Monte Carlo methods similar to those developed by Dixon et al. (1974) for cascading in one-dimension» but here the simulation is made In three-dimensions and tine. 4.2 THE ELECTRON-PHOTON CASCADE - The cascading of the electron-photor> component was simulated In three dimensions and time and used the numerical procedure pioneered by Bucher and Nessel (I960) which has been developed, T, corrected and improved by Baxter (1969), Narsden (1971), Browning and Smith (1973, unpublished) and Allan (1975). 4.3 CERENKOV RADIATION - The final quantity predicted by the simulations ««as the number of photoelectrons released at the photocathode of the photomultiplier for each of the detector£™ systems listed in table 1 and for the Ht. Hopkins altitude.
An лту of detector locations was considered in the simulations of each shower, ш и ; This array was composed of each type of detector described above at each location and the locations were spaced on the shower axis, 25, 50, 75, 100, 125, 150, 200, 300, 500 and 900 meters from the original particle axis, in each of eight directions at 45" Intervals In azimuth from the Northerly direction. At each detector the resulting photoelectron pulse was recorded in time bins of 5 nanoseconds width. 4.4 THE AVERAGE LATERAL DISTRIBUTION FUNCTIONS FOR PROTON INITIATED SHOWERS - The average lateral distribution functions for proton induced showers were calculated by sunning the densities for each detector in showers of a prescribed primary energy. The functions were then normalized by dividing by the primary energy so they would all coincide i f the literal distributions were Independent of energy. Fig. (3) shows these normalized lateral distribution functions for showers of 1 0 " , 10" and 10"eV primary energy. 4.6 DATA ON INDIVIDUAL PROTON SHOWERS -Isophotes based upon the detector response In Individual showers show that there are extremely large fluctuations, which decrease as the energy of the primary increases.
Ы . ёп t»l,
FitM (ft«1f. Аэачж. Смну • H i t ) t i i » . <» 1Q'?.V)
bUcttr (am. Cart. lit. Ига.
ion «t f l .
1.W4 МП.
•art mr
T«H«1
NUctor
юн M l .
1 .И M l .
mr
Jt.it»
holt»
I t t i t»
Olff. En».
t . H t l . H
г.» и м гм
2*
П
ПО
RMff (ИкСОМ/И*)
40 - 4 ж 10"
t t * - I t *
!•• - »•

237
Fig. 3. Normalized lateral distribution functions-for showers of 1 0 " , 1 0 " . and 101JeV primary energy.
•
i. L 1,
0
'•«Л 1 — 1 — Ч - » i < —
^ Л |
4\ 1 * >
i 4 i . i . \ T 4 -t -I 0 I * 1 4
Fig. 4. Expected pulse height spectrum from monoenergetic cosmic rays.
Highly asymmetric showers produced by the lower primary energy primaries t*nH to become more symmetric in showers Initiated by greater primary energy. 5. IHTERPRETATIOH - One of the main alms of this study was to refine Interpretation of the spectrum of Cerenkov light pulses measured by a single detector to provide data on the cosmic ray primary energy spectrum. He can see from the simulation results above that any attempt at this transformation must be heavily dependent upon results of computer simulations. , * , , . . .
The main problem In our approach was to correctly parameterize the wide fluctuations observed in modest number of shower simulations. The large fluctuations observed in-the proton initiated showers could cause a large light pulse to be produced more often by a low energy shower than by a high energy shower I f the cosmic ray spectrum is steep. This precision of the parameterization of the fluctuations has been shown to be the limit of our Interpretation despite knowledge of the average values of the expected pulses and a good representation of the overall range of fluctuations. л . . .
The fluctuations are so large that the energy dependence of the average lateral distributions Is obscured. In fig. (4) we have simulated the expected pulse height distribution from monoenergetic cosmic rays entering the atmosphere at random Impact parameters for a l.Sm reflector system. I t Is clear from the data of f ig. (4) that since the threshold of above measurement 1s about 70 photo-electrons this measurement is only sensitive to the tails of these distributions. In these regions the pulse height follows a power law up to -v500 photo-electrons for 10' eV and <v40O0 photo-electrons for 10"eV particles and 1t Is nearly Independent of entrgy. Thus on folding a cosmic ray primary energy

238 sptctruM with the simulation densities, the slope of the predicted pulst height distribution is substantially Independent of the Input cosmic ray spectrum slope within the errors of the available data. However, the pulse height distribution does steepen at very large photon densities. Unfortunately, the statistical accuracy of the distribution Is so poor that it Hakes the unfolding difficult for the detenirination of the prlnary spectrum.
The effect of fluctuations is so large that any given pulse size (or photon density) has an approximately equal chance of being produced by a range of energies of over t decade in width. It is thus not yet possible to label the abcissae of fig. (2) in terms of the energy of the primary particle, nor can we interpret the apparent steepening of the bare PHT spectrum at this time. ACKHOM.EDGEHEHTS.
This work was supported by grants from the Science Research Council of Britain, the Smithsonian Research Foundation and the National Science Foundation fDES-74-19507. BIBLIOGRAPHY. Allen, H. R., et al., Proc. 14th Inter. Cosmic Ray Conf., Munich, 8,
3071 (1975). Baxter. A. J.. J. Phys. AS, 50 (1969). Butcher, J. 6;, Ntssel. Я7. Nucl. Phys. 20, 15 (I960). Dixon let al.. Proc. 13th Inter. Cosmic Ray Conf.. Denver, 4, 2473 (1973). Gerdes, С et al., Proc. 14th Inter. Cosmic Ray Conf.. Munich. 8, 3040
..(1975). Gerdes, C , Fan, С Y., Proc. 13th Inter. Cosmic Ray Conf., Denver, 1,
219 (1973). Hillas, A. M., Phil. Trans. Royal Soc. (London) A, 277, 413 (1975). Jultusson, E., Proc. 14th Inter. Cosmic Ray Conf., Hunlch, 1, 355 (1975). Harsden, E. J., Ph.D. Thesis, Univ. of Leeds (Unpublished) T/1971).

239
CERENKOV LIGHT FROM EAS AT SEA-LEVEL
J.D. Kuhlmann, R.W. Clay, P.C. Crouch, P.R. Gerhardy, A.G. Gregory, J.R. Patterson, J.R. Preeoott, G.J. Thornton.
Phyeioe Department, University of Adelaide, Adelaide, South Australia 5000
The Buckland Park EAS array of the University of Adelaide has been extended by the addition of detectors of Cerenkov light: five stations are in routine operation and others are in the course of installation. Lateral distributions of light in individual showers in the energy range 10"-101* eV have, been measured using a 2.5MHz bndwidth recording system. The average lateral distribution function is consistent with theory up to 200 a from the core. Deviations of individual showers from average behaviour are being studied. Measurements have also begun on the nanosecond time structure and arrival time of the "light front". Preliminary results will be presented.
1. INTRODUCTION
It was pointed out by Dobrotin, Turver and others at the 13th International Cosmic Ray Conference that measurements of the lateral distribution and intensity of Cerenkov light could be important in an investigation se.eking to determine the primary composition of cosmic rays. Smith and Turver (1973) have shown theoretically that for a primary proton the Cerenkov light flux 300 m from the shower core at sea level is nearly independent of the height at which the shower originates, whereas the total flux is dependent on the height of the first interaction but largely independent of shower model. Thus simultaneous measurements at a number of distances from the core carried out for many showers could provide information on the magnitude of fluctuations in the height of the first interaction. This in turn should give an indication of the mass spectrum of primaries. An alternative approach is to study the longitudinal development of showers. This can be done for example, by correlating the time structure of Cerenkov light pulses observed some hundreds of metres from the core with the particle data on arrival directions.
There was strong evidence of a revival of interest in atmospheric Cerenkov studies at the 14th International Cosmic Ray Conference with work reported from Haverah Park, Pic du Midi and Mt Hopkins. However, very little has been published on Cerenkov light from showers of size 10s - 10* particles, which the Buckland Park array is designed to detect, since the pioneering work of Jelley and of Chudakov before 1960. In the present work it is intended to use the above techniques to provide evidence regarding the composition of primaries in the energy range 10" - 10" eV.
2. THE COMBINED CERENKOV-PARTICLE ARRAY
A plan of the Buckland EAS array is shown in Figure 1. Sites A, B, C, D, E, F, G and H represent the particle array described previously (Clay et al, 1975). Sites I, J and K, to be used for particle density measurement, will substantially complete the extended particle array. Sites A, H, G and CI were furnished with Cerenkov light detectors in our

240
/ \ /*\ ч Л N
/' е'
// / ' ц \ л
\ v \ \
\
*ч : г я •
Е
1
Н"К
FIG 1. Plan of the extended Buckland Park EAS Array. Solid squares represent detector sites, see text). Open rectangles represent recording stations. Sites 1 and К are offset from their corners to improve the shower analysis.
pilot study for the lateral distribution work. The present Cerenkov lateral distribution array consists of detectors at sites A, F, G, H and L; a further site at M is in preparation. The detector for the preliminary pulse profile work was at CI, but has now been moved to a point midway between A and J . It consists of a Philips XP 2040 photomultiplier with 45° angle collimation coupled to the recording system described in EA 63 McDonald et at) giving a system response with a rise time of ~2ns and FWHM of -4ns .
The lateral distribution detectors consist of EMI 9623 7" photomultipliers with circular collimators, giving a 45° half angle aperture, mounted just below roof level in small huts. Signals from the photomultipliers are fed via preamplifiers to Ortec 485 amplifiers in a caravan (CI) , sited between A and Б . Signals from A and G and from F and H are suitably delayed and multiplexed before amplification and the three resultant amplified signals (A + G, F + H and L) are sampled and digitized in 256 channels with a bandwidth of 2.5MHz by a transient recorder triggered from the particle array. The contents of the 256 data channels are then read out on to a chart recorder after each event. A typical set of traces is shown in Figure 2. Intercalibration of the detector systems is achieved with a portable LED light flasher giving 1 us pulses of green light (565nm) whose integrated flux over the photomultiplier is equivalent to that typically observed from a —5 x 10s particle EAS. Amplified outputs are fed to a multichannel analyser which gives the mean pulse height and standard deviation for each detector in turn* Frequent

241
Fig 2. A typical set of traces showing the responses of five Cerenkov light detectors to the sane air shower.
i i i I" j I b, Tk Е I 'I
CMC tillancr Imt
Fig 3. The average lateral distribution of Cerenkov light from 504 detector outputs, normalized according to observed shower size.
checks on the stability of each detector system are made with similar LEDs in fixed locations in front of each photomultiplier.
3. RESULTS
(a) Lateral Distributions
Cerenkov light pulses from a total of 121 showers observed on clear moonless nights have been analysed. These results have been treated in three different ways. First the overall lateral distribution in the shower plane using all 121 events (giving 504 detector outputs) was obtained by normalizing pulse.amplitudes to a standard shower size (range of sizes 10'- 3 x 10* particles) on the assumption of proportionality of amplitude with size, grouping these into 20 m 'bins' and plotting the mean amplitude against mean bin distance. The distribution is shown in Figure 3.
We expect the lateral distribution of Cerenkov photons to depend on a number of factors including the depth of shower maximum and the zenith angle of the shower. We have examined the lateral distribution for dependence on the observed shower size (which depends on the height of maximum) and the zenith angle of the shower. Figure 4 shows that the lateral distribution steepens as the shower size increases. The normalised data was split into size bins of (1-4) x 10' and (4-10) x 10' and the resulting lateral distributions shown as 4a and 4b. Figure 5 illustrates the dependence of the normalized lateral distribution on shower zenith angle. The data was grouped in three, consecutive 15° bins out to 45° and it is clear that there is a trend for a reduction in the Cerenkov amplitude with decreasing zenith angle for showers normalized by their measured size.
Finally, we used the events with observed pulses from several detectors to plot individual lateral distributions normalised to shower size. A representative

242
i
i I.. К i ь Е
1 t
J
(4a)
» ' l C*rt «iifafKt In)
I
! i V i 1 I
\\ C4b)
ij
C«n tiMantt In)
Fig 4. Energy dependence of the lateral distribution. (4a) Includes all outputs from showers with from 1 x 10* to 4 x 10* particles. (4b) Includes .all outputs from showers with froa-4 x "10* to 1 x 10* particles.
> •
•
.*
-
• •
1
£
• *
*
•
•
* M
e-ts*
X'-M*
1 1
'
(го
! L I
Fig 5. Zenith angle dependence of the lateral distribution.
о «5 To «5 So гоо « о * Ctfr» diatjnc» <m)
Fig 6. A selection of lateral distributions of Cerenkov light from individual showers.
selection is shown in Figure 6.
(b) Cerenkov Pulse Profiles
The rise times and full widths at half maxinum of the Cerenkov light pulses have been measured for 45 showers using a fast recording system. Showers with core locations in the region of O-бОо from the photomultiplier have been observed. The measured mean rise time was 4±1 ns and mean FWHM was 8±1 ns . These reduce to ~2ns and ~4ns respectively if the instrumental response is deconvolved from the pulses. The results are in agreement with calculations (G.J. Thornton, private communication) in this core distance range. Determination of shower longitudinal development will require the results of measurements

243 now being Bade at distances greater than 200 ж from the core.
4. CONCLUSIONS AND FUTURE WORK
We have obtained a mean lateral distribution in the shower plane for atmospheric Cerenkov radiation at sea, level froa extensive air showers in the size range (1-30) x 10* particles. The results are in agreement with other work. (Chudakov et at 1960). The dependences of the normalized lateral distribution on shower size and zenith angle have also been studied and are in qualitative agreenent with theory. However, the data show considerable fluctuations which remain to be interpreted. The full width at half maximum for Cerenkov pulses observed within 60 m of the core is ~4ns.
The Cerenkov array is currently being extended and a faster (~15MHz bandwidth) recording system is being incorporated to improve the signal to noise ratio at large distances. Observations of the pulse profiles Are now being made out to ~2S0m from the shower core.
REFERENCES
1. Smith, G.J. and Turver, K.E.. Proc. 13th Int. Cosmic Ray Conf. £, 2369, 1973.
2. Clay, R.H., Crouch, P.C., Gregory, A.G., Hough^J.H., Prescott J.R. Proc. 14th Int. Cosmic Ray Conf. £, 3093, 197S.
3. McDonald, D.M., Clay, R.W. and Prescott, J.R. EA63 (This Conference).
4. Chudakov, A.E. et al Proc. Int. Conf. on Cosmic Rays (Moscow) 2_, 50, 1960.

244 THE FURTHER STUDIES OF THE SHAPE OF THE EAS CBRENKOV RADIATION PULSE WITH THE YAKUTSK ARRAY
N.N. Kalmykov , G.B. Khristisnsen , Yu.A. Nechin, V.V. Frosin, Institute of Nuclear Physics, Moscow State University,
Msscow, USSR. V.M. Grigoriev, N.N. Efimov
Institute of Cosmophysioal Research and Aeronomy,Yakutek,USSR. ABSTRACT: Experimental data of the shape of the EAS Cerenkov radiation obtained recently with the Yakutsk array are §resented. The installation containing five detectors of the erenkov pulse shape is modified as compared with our earlier installation by increasing the sensitivity of the detectors by »«vtr*i timet ; a new device of the shower selection makes it possible to improve the statistics for the showers with NflO', is used. The experimental dependences of the Cerenkov pulse lengths at half-height X on such EAS parameters as the distance from the shower axis R and the size Я are found. The results are compared with the calculated data obtained in terms of the different models of the shower development. The dependence of the depth of the EAS maximum on the EAS size К has bee obtained for 10<< H < 5 x 10⁸.
The study of the EAS Cerenkov radiation pulse shape started in 1973 are now in progress with the Yakutsk EAS array. The results of the initial measurements are presented in /1/. The equipment Cor recording the Cerenkov pulse shape has been modified by now: the number of detectors has been increased up to five and the sensitivity of the detectors has been also increased. The layout of the arrangement of the detectors of the Cerenkov pulse shape is shown in Fig. 1 . Detector 1 is a single photomultiplier of FEU-65 type with a 180 em2 sensitive area of photoeathode. FEU-65 converts the short (T /- 2 nsec) light pulse into a pulse with the rise time X» =10 nseo and duration 14 nsee. Promt973 to April 1976, detectors 2,3,4 were also FEU-65. Since 1976, however, one FEU-65 in each of those detectors has been replaced by seven photomultipliers of FEU-110 type whose signals are summed up. To improve the time characteristics of the photomultipliers, only the central parts of the photooathodes of 6am diameter ( the total diameter is ~ 8 cm) and the rest surface is painted with opaque dye. As a result, the9total sensitive area of each of detectors 2,3,4 is about 200 cm . It should be borne in mind in this however, oase that the FEU-110 photoeathode sensitivity is 4 times the sensitivity of FEU-65. The characteristics of detectors 2,3,4 for transmission of short pulses are: the rise time Xf - 15 nsec, the halfwidth about 23 nsec. Detector 5 put in operation in February 1976 is a set of 19 FEU-110 ( without limitation of sensitive area) whose signals are summed up. The total sensitive area of detector 5 is " 800 em* at the following time characteristics• 7 = 1 7 nseo, the halfwidth ~ 35 nseo.

245 Tha high sensitivity of new detectors makea it possible (1) to inoreaae tha atatietica of tha events with diatancea from EAS axia > 400 • and (2) to determine the poaition of EAS axia and tha direction of ahower arrival, without using tha acintillation countera of the Yakutsk array, in case of aiaultaneoua detection of tha pulaea with four or five detectors. Such prooeaaing of tha ahowara which are not detected with acintillation counters, or detected within a small probability, aakes it poaaible to significantly increase the eta-tiatics for tha showers with Eo < 10'7 eV. For example, 80 ahowara auitabla for tha above described prooeaaing were detected in detectors 1-5 for 120 hours of operation of the array in Hovember-Deeember 1976 . Unfortunately,
we cannot uaa theae data in the present work since tha procea-eing of tha data for 1976-1977 haa not been completed yet. The pulses of detectors 2-5 are synchronized by a standard pulse coinciding in time with the pulse of central detector 1 and photographed on the oscillographic scanning of all fire detectors. The scannings of tha oscillographs detecting the Cerenkov pulses are photographed in case of coincidence of the pulaea of the central detector 1, any of the peripheral detectors 2-5 and tha acintillator of tha central point of tha Yakutsk array (located near detector 1). The oscillograms corresponding to EAS detected with the scintilla.-» tion oountara of the Yakutak array were appropriately marked '. The equipment for detecting the Cerenkov pulae shape was in operation in clear moonless nights. The total time of operation of the array from December 1973 to December 1976 was 720 hours. Tha showers with charged particle density at tha "master" points of the Yakuts array 0 ^ 1 m-* and zenith angle в < 4 5° war е selected. The position of the axis and the sise Ns of БАЗ were determined from the readings of the scintillators of the Yakutsk array . The showers for which the selection probability ia > 80% and the charged particle density at tha central point of the Yakuts array tgf > 0.5 were used in the further processing. The later requirement, which is similar to tha conditions inserted with the same purpose in /5/, excludes the email-size showers incident at great diatancea from the center of the Yakutsk array.
' The Yakutskarray detects a shower in case of coincidence of signala from three scintillators, namely the central scintillator and two oounters at 500 m faaom the о enter at the verteces of equilateral triangle. The showers selected on the basis of other coincidences are not considered here.

246 80 showers with alias within AT, « 10 7 j 5 x 10s, tha
diataneaa between tha shower axla and dataetora fi - 0*970 • and sanlth angles 9 < 45° were selected in aueh « way for tha period of operation of tha dateetora of tha EAS Cerenkov pulse ahapa.
Tha accuracy in determining tha aanith angle v ia batter than 1*»seo£ for proeeaaing tha data of four Cerenkov detec-toSa and 3°-ааов for Э dateotora of Cerenkov pulaaa. When determining the arriral directiona from the aeintillator data of the Yakutsk array , *.&<Зф-жв for maaaurementa at 5 and more point* and A6~S*. secQ for 3-4 points.
Determination of the accuracy of Af and ANS ia to be carried out by aimulating the experiment, which haa not been done as yet. The approximate eatlmataa of the accuracy &r ** 20 a and дЛ» ~> 20$.
Ac earlier /1/, the halfwidth of tha Сегепкот pulae f ia uaed aa ita main parameter since it may be more accurately measured in experiment. We hare calculated the Cerenkov pule* abase in texme of the aealing modal using the Monte-Carlo method for various nuclei (Am 1 , 4 , 15. 29, 52) and for varioue EAS incidence angles < в • 0°, 30°, 45°). The ealculationa were carried out using tha angular distributions and energy spsetra of the shower electrons calculated in terms of the electromagnetic theory in /3/. The uae warn also made of the model of the atmosphere differing from the conventional modal in that the aea-lerel temperature was ohosen to correspond to the mean temperature in Yakutsk in the measurement period, namely -30°C. The calculations described in /1/ have shown that the pulse halfwidth ia practically unambiguousely related to the depth of EAS maximum ( the scatter of X„ at a fixed Tr does not exceed 3$ Цеге/. Pig. 2 presents the dependences ZnvfXn,) and *<„н(Я*) obtained from the electromagnetic cascade theory in /4/ and recalculated to the conditions of the Yakutsk atmosphere. Our new calculations mentioned above confirm this dependence T (Xn,) and the unambiguity of the relation
between Z> and Xm.:.
The calculated dependence of T on senith angle в in the 0° f 30° range coincides well for the entire interval of distances Г - 300 у 900 ш with the earlier estimates /1/., For example, for rx • 300 m, the halfwidtb V 300 лэ соа'-Ф. Fig. 3 preaanta tha experimental dependence X(fj. Here, the values of Г meaaured in the intervals of distancea to EAS axis 250*350, 350*450, 450*550, 550*650 a have been recalculated to the fixed distances of 300, 400, 500 ,.,§00 m respectively using the calculated dependence x~ n *nd the, dependences if (6) similar to those preaentea above. The pointa in the 680-970 m interval have been averaged over distances *v and halfwidtha t . All values of T used in plotting the dependence X (n) have been recalculated to a vertioal shower. In this case, the events with (9< 30° were used at dlstanoss of 300 m and 400 и to reduce the erroas arising in recalculations to Q «0°. The events with <?<45° were used for other distances.

247 Pig. 3 elao praaanta tba calculated curves t ( r±) for primary protona and iron nucleus in terms of scaling. It can be aaen that the experimental dependence tlr±) differa strongly from that calculated for proton. For example, for fl • 400 ш , «hart T can be meaaured to the beat accuracy, the disagreement amounts to 6 RHS errors. A good agreement between the caloulationa and experiment can be, however, observed for the primary iron nucleus. It follow* from Fig* 2 and 3, in particular, that the BAS maximum depth measured from the halfwidth of Cerenkov pulse at a 400-Я diatance from the axia is 690 + 1 5 g/om* at ^ • S i 107. Fig. 4 ahowa the experimental dependence of T 400 on ahower sise 1$ plotted on the basis of 50 events J for which 6 < 30°. The values of X and A& for all the events were reduced to a vertical ahower ( в «9° being the
relatione Zy,„ ъ ел~3<9 and /Vs ~ яхр ^о^- *t&)\
The approximation of the experimental points by the method of least aquarea (the atraight line in Fig. 4) gives the following dependences T 300 «* н°.'°57 +6«<H° in th, lnterval of Я. from 1.9 x 10' to 1.3 x 10° . Uaing the dependence • v *аа&т) <"** и«- 2) and ^n preaented above, it is possicie to find the relation between Xn, »nd N% X m - ( 690 + 15) + (50 + 30) (йуЛГ; - 7.7)£в«"*3 We hope to apecify this result by increasing the statistics in the interval of email aisaa Aj uaing the above mentioned method.
It will be noted in conclusion that we have also made the calculations to verify the applicability of the method for EAS proeeasing sat forth'in /5/. The Monte-Carlo method was used to aimilate, in terms of the scaling model, aome 200 showers generated by primary protons and iron nuclei and to calculated theo expected Cerenkov pulae for each ahower at diatancaa from tho axes KL Я 309,600 , 900 m. In so doing, an unambigflDus relationship has been established between each point at the forward and rear fronta of the pulse and the corresponding phase of EAS development st altitude H in the atmosphere. Analysis of the calculation reaulta haa ahown that at Гл. s 300 m tha aoouraoy fef the temporal measurements tft * ± 3 nseo is insufficient to resolve the oasoade curve fluctuations even for the showers with tha most significant difference in th* depth of tha maxima (аХм^-130 g/coZ). It haa been also shown that the Cerenkov pulses should be detected st greater dietanoea ( f± = 500 ~ 600 m) to safely record the fluctuations in the shower oaaoadea to the above aaid aoouraoy. Obviousely, this osn be achieved by appropriately extending the bass of tho array and increasing the number of detectors, and by significantly enlarging the sensitivity of eaoh detector.

248 REFERKICSSt 1. I.H. Каймукот, G.B. Xhriatianaaa, V.V. Proain at « 1 .
Eroo. 14th ICCR Munehan, §., 3034 ,1975. 2. 0.3. Diminatain. T.A. Bgoror, H.N. Efiaor at ml.
Eroc. 14th ICC8, Munchan 12., 4334, 1975. 3. A.A. Balyar, Thaaa, Hoaoow State Univ. 1975. 4* I.F* Ivenanko, V.V. Hakarov, J.A. Hain. Preprint 98 Moacow, 1976. Р.И. babadar Phyaical Institute 5. K.J. Orford. K.E. Turrer. Vature vol.24, Rb.5588, December 23/30 ,1976.

249
®
3 0
0 tOOm
i ®
ЮОт
г 0
s ®
Fig. 1. Layout of the arrangement of the detectors of Сегепкот pulae chape in the Yakutsk EAS array.
100
400 ~$00 600 700 800 900
Fig. 2. Pulse halfwidth T veraua EAS development maximum ia the atmosphere Д* for the distance» from EAS axis fl M 300 and .400 BU:

250
200
too
ft
— i 1 1
, . i • .1
' ' J
/ /
— _ i _ i.. _ _ i
л / -
-
•
300 soo TOO soo
Pig. 3. Pulaa halfwidth T veraue the distanoa from EAS axis Гх • The points are the experimental data, the lines show the calculations for primary protona (p) and iron nuclei (Pe).
Pig. 4. Pulae halfwidth V varaua ahowar aise N* .The pointa are tha experimental data. Tha line ahowa tha approximation of tha experimental data Ъу tha method of least aquaree,

251
CERENKOV HADIATIOH 01 ТНК BAB SUPERHIGH EHEEGT • O.S.Dieinat^in, M.N.Dyakonov, N.N.BfJUsov, T.A.Egorov,
A.V.GlushkoT, V.M.Grigoryav, S.P.Knurenko.V.A.Koloaov, D.D.Krasilnikov, F.F.IAshchenyuk, I.I.Sleptaov',
V.F.Sokurov Inst itute of Coemophygical Research and Aeronony.Iakutak Branch', Siberian Department of the USSR Academy of Sciences,Yakutsk,USSR
N.H.Kalmykov, G.B.Khrlstianaen. Xu.A.Nechin, Y.V.Proein, S.N.Vernov
Inst i tute of Kuclear Physics,Moacow State University,Moscow,USSR
S.i.Hikoleky 1 .iI.Lebed.uv Physical Inst i tute , Moscow, USSR
Theorc-tica] [~j experimental . Q Both |x]
Kxperi.iental u;vta frcu the Yakutsk complex array on the Lateral distribution, to ta l flux and pulse shape of the Coren-kov l ight of EAS in primary entity interval 10 ' - 10 ° eV are presented. tteaults of aodel calculations of these parameters Cor different iiA3 models and primary energies are given. The results arc dlscusi.cd in respect to shwor iii'veiopiiicnt modal and determination c:' tiie priuiary energy.
Coordinatess ьА j . ? (Optical Emission) f
Mailing address) Irofessor Q.B.KnrietiunsQn . ,. ^ : Inst i tute of Nuclear Physics,'
Moscow ^take Untveral t-y, • . -•'••/• .'• Moscow 117333 USSR : 5 : i v

252
OBSERVATIONS OF EXTENSIVE AIR SHOWERS BY AIR FLUORESCENCE DESCRIPTION OF EXPERIMENTAL TECHNIQUES
G. W. Mason
Department of Physics, Brigham Young University Provo, Utah (USA) 84602
H. E. Bergeson, G. L. Cassiday, T.-W. Chiu, D. A. Cooper, J. W. Elbert, E. C. loh, D. Steck and W. J. West
Department of Physics, University of Utah Salt Lake City, Utah (USA) 84112
J. Boone
Department of Physics, California Polytechnic State University San Luis Obispo, California (USA) 93401
J. Linsley
Department of Physics, University of New Mexico Albuquerque, New Mexico (USA) 87131
We describe an experiment carried out at Volcano Ranch, New Mexico, to simultaneously measure extensive air showeTs by means of an air fluorescence detector and a conventional, ground-based, particle-sensitive scintillator array. The optical emission observations were made with an instrument which is a prototype for a large-scale air fluorescence detector (Fly's Eye).
1. Introduction. In understanding and extracting the physics which is available from the study of extensive air showers (EAS), it is very desirable to have data which give a picture of the longitudinal development of the. shower. Such a longitudinal "picture" of individual showers can be made by observing the passage of a shower across the night sky using fluorescence-light from excited atmospheric nitrogen molecules. The isotropic emission of this light from the path of the shower provides a means of viewing the showers from considerable distance, thus giving a compact instrument a considerable (-10* mz) effective sensitive area. Several pioneering groups (Greisen, 1965; Chudakcv, 1962; Suga, 1962; Tanahashi, 1969; Tanahashi, 1975) have proposed and attempted to examine the air fluorescence signal from showers, but the experiments have met with limited success. Although signals have been reported, they have been too weak to obtain a significant event yield. We describe here recent observations of the longitudinal development of showers by their optical emission. The showers impacted in the Volcano Ranch extensiveair shower array and, hence, a detailed comparison for purposes of intercalibration has been made. The results of the experiments are reported in a series of papers included in the proceedings of this conference (Cassiday, et al. 1977; Bergeson et al. 1977; Elbert et al. 1977). The present paper confines itself primarily to a description of the layout and operating conditions for the experiment.

253
2. Description of the Apparatus. Volcano Ranch near Albuquerque, New Mexico, USA is the site of a long-standing extensive air shower array (Linsley et al. 1962; Linsley and Scarsi, 1962; Linsley, 1963]. The array is located at an altitude of 1770 meters (835 g/cm2) in an arid region especially suitable for the operation of an optical detector because of the excellent viewing conditions permitted by the clean air and clear skies. The elements of the array are 0.8 m2
scintillation counters. In the present configuration the 79 counters are laid out uni- _ formly to cover a roughly hexagonal area of 1.7 km2.
The optical detectors were located in the plane of the scintillator array at a point 1.53 kilometers to the southeast of the array center (hence outside the array) and positioned so the field of view covered most of the array. Thus, most showers observed in the Volcano Ranch array during the experiment potentially arrangement is shown in Figure 1.
The optical detectors are shown schematically in Figure 2. Light from the shower trajectory is gathered by a 1.5 meter spherical mirror (f/l.o) and reflected to an array of 12 photomultiplier tubes located in the focal plane of the mirror. The light is funnelled to the tube faces by close-packed hexagonal Winston funnels (Winston, 1970) which are mounted to the front of the phototubes. Each phototube images a separate section of the sky with a field of view of 5.8 degrees along the maximum diameter of the hexagon. Three mirror assemblies, each with 12 tubes, were used in this experiment to image the sky over the Volcano Ranch array as shown in Figure 1. The two outside mirrors were pointed 15 degrees above the horizontal and the center mirror was pointed 30 degrees above the horizontal. The obscuration resulting from mounting the phototubes in the field of view of the mirror is approximately 13%. The reflectivity of the mirrors has been measured in the laboratory and corrected slightly for field conditions (dust, water spots, etc.) to give 85 ± 5 percent. The funnel surfaces have an estimated 80 ± 10 percent reflectivity, but since 30% of the light goes directly to the tube face without reflection on the funnel, the effective reflectivity is 86 ± 7 percent. The combined light gathering efficiency is thus 73 ± 7 percent. The characteristics of the optical detectors are summarized in Table 1.
The phototubes are specially constructed 9-stage, super S-ll Venetian blind type devices (EMI 9861B) with 23* peak quantum efficiency and extended ultraviolet response (the nitrogen fluorescence spectrum has strong lines w
between 3000 Angstroms and 4000 Angstroms). They were operated with typical
WcaraRonchArray HykEy*
Fig. 1. Experimental Layout
could be seen by the optical detectors. The

254 gains of 5 x 10 . Signals from the tube were current amplified by a factor of 200 at the base of the tube.
Phototube Housings
A simplified schematic of the data handling system is shown in Figure 3. To extend the sensitivity and dynamic range of the measurements, the signal from a given phototube was split into so-called "cast" and "slow" channels. In each case the signals were integrated to provide an input to a Schmidt trigger.. The voltage level at the Schmidt inputs was controlled on-line by a computer to optimize the triggering sensitivity. The Schmidt outputs were used to generate coincidences and to control a gate to the signal integrator. The signal was delayed by cable to allow this gate to be established. 3n the "fast" channel the integration time was -300 nsec and in the "slow" channel it was -800 nsec. Once integrated, the levels were held for sufficient time for a decision to be made as to whether the pulse was shower-related,then released or passed to the computer depending on the outcome of that decision. The integrated signal is proportional to the charge produced by the phototube, which in turn is proportional to the shower size during the time the shower is in view of the tube, provided the light observed is the isotropically emitted fluorescence light and not contaminated by the forward beamed Cerenkov light.
Mirror Surface
Fig. 2. Mirror unit with Winston funnels and phototube cluster.
.ЯД"" 1
225 пие Ostay
Passive Integrator RC'SOnsec
Passive Integrator R C ' 2 0 0 nsec
Schmidt Trigger
S Schmidt Trigger
Signal Integrator
RC-ЮООпис П
^Integrate and Hold Commends
Signal Integrator C'SOOntec RC
—To Coincidence Logic-».
• (-From Coincidence LogK-
Scater (Т-Measurement I
2 0 MHz Oscillator
*
To Computer " * * tor Event " * "
Analysis
"Fo*!"Chonnel "Slow'Channel Timing Channel
Fig. 3. Schematic of the data handling system for the optical detectors

255
Table 1
Optical Detector Characteristics
Number of phototubes Phototube type
Pull cone angle/phototube (along maximum diagonal of hexagon)
Solid angle/phototube Funnel area Number of large gathering mirrors Distance from minor center to front of funnel Mirror diameter Mirror f-number Mirror obscuration (n) Mirror off-axis aberration (6) Electronics time resolution Mirror reflectivity Effective funnel reflectivity Combined light gathering efficiency
36 EMI 9861B, 3.5 inch Super S-ll 0.10 radian
0.0066 steradians 149 cm2
3 1.50 meters 1.57 meters f/1.0 13% -0.02 radians 50 nsec 85 ± 5 percent 86 ± 7 percent 73 ± 7 percent
The measurements provide timing information crucial to the reconstruction of the trajectory of the shower. Each phototube was provided with a periodically re-synchronized scaler clocked at 20 MHz. The rising pulse in the'fast' channel halted the scaler, thus marking TQ, i.e., the time when the shower came into'the view of the phototube. Subtractions of time for succeeding phototubes in the path of the shower yield the time the shower was in the field of view of each phototube. For showers traveling at the velocity of light parallel to the faces of the tubes, these times are simply related by geometry to a rough measure of the distance of the shower from the detectors. With a 20 MHz clock our timing resolution was 50 nsec. A typical shower in this experiment was within the field of view of a single phototube for 250 nsec.
The device was designed to provide its own trigger. The trigger requirement was flexible, but generally a coincident signal from two tubes in each of two mirrors provided an acceptable shower trigger. In preliminary testing in the mountains near Salt Lake City, showers were in fact observed in this way. However, at Volcano Ranch triggers were generated and provided solely by the Volcano Ranch array. The coincidence pulse from tie scintillators was used to trigger a camera flash unit. The resulting light flash was collimated by several feet of six-inch diameter plastic pipe, travelled line-of-sight from the Volcano Ranch Station to a phototube located about 100 meters from the mirrors (to the side). The pulse from this receiver provided the signal to transfer to the computer the pulse heights and timing information currently being held by the data collection system. Triggers were provided for showers of size 2 x 10⁷ particles or larger, but not all such showers were close enough to provide signals over threshold in the optical detectors. The smallest shower observed by the Volcano Ranch array and by the optical detectors <s a complete track was 2 x 10' particles (size estimate from the Volcano Ranch data); the largest was 6 x 10s particles.

256
3. General Description of Ambient Light and Atmospheric Conditions. Although the major part of the data handling system was housed in a 40-foot trailer, the mirrors and phototube clusters were unprotected and set outside on simple stands. During the day covers were placed over the funnels and over the mirrors to protect them from dust, moisture and sunlight. The optical detectors were roughly located on a line drawn through the center of the Volcano Ranch array and the city of Albuquerque (about 25 kilometers distant). The city lights were directly visible from the site of the optical detectors, but were screened from the light funnels by the electronics van. Until a severe blizzard finally shut down the experiment, the nights were clear and cold. Ambient light levels were constant (as measured by the phototubes) with two exceptions. One windy night the ambient levels remained 50-100% higher than normal. This was presumably because of light from the city being scattered by dust in the air. The second exception occurred early one morning when ambient levels suddenly dropped precipitously. A visual inspection revealed that it was beginning to snow! The bulk of the running time was during moonless periods, but some running time was possible with the moon up (in its early phases) by disconnecting the high voltage to two or three tubes. A few shower tracks were observed under these slightly moonlit conditions.
4. System Tests. The gains of each phototube and current amplifier were carefully measured in several ways under controlled laboratory conditions before the experiment (Cassiday et al. 1977). Operating voltages for each tube were determined which would result in equal sensitivity and curves were generated to allow quick determination of the gain of any tube for any given operating voltage. Periodically during the course of the experiment in_ situ tests of the relative sensitivity of each phototube channel were made using a light pulser. Finally, a selection of 10 tubes were re-evaluated in detail in the laboratory after the close of the field measurements in order to understand any drifting in sensitivity of the detectors.
The light pulser used in the in situ testing was built along lines suggested by Kerns and Tusting (1963) . A GE W1A argon glow lamp with the carbon resistor removed from the base was pulsed with a 4 kilovolt, 10 nsec pulse to provide a light pulse. The light pulse rises in a few nanoseconds,then decays slowly over several microseconds. -Because of nitrogen present in the atmosphere of the bulb, the output is a good representation of the spectrum of light detected from showers. The light pulse was "piped" tnrough Dupont Type 1610 Crofon light guides to small openings drilled for them between the Winston funnels. The bundles were 1/8 inch (3.2mm) in diameter and 7.6 meters long. Four bundles served each mirror. The light emerged from the end of the bundle, was collected by the mirror and reflected back to the funnels and hence to the phototubes. The four bundles were positioned to give a uniform signal to all 12 phototubes in a cluster.
The light pulser was computer controlled. Upon command the computer initiated a series of 100 pulses and assembled distributions of response for each tube in the array. Distributions of this type revealed a systematic decrease in the sensitivity of the detectors amounting to about 20* over the two weeks of the experiment. A careful washing of the mirror surfaces with distilled water to remove the accumulation of dust resulted in restoring less than one-fourth of this loss. A more detailed discussion of the calibration

257
of the phototubes, including a discussion of possible sources of this problem are given by Cassiday et al. (1977).
5. Conclusion. We have described generally the apparatus and operating con-ditions for a successful observation of extensive air showers by means of their optical emission, including showers which by reason of their geometry are candidates for showers having been observed by means of their fluorescence light. Over a period of thirteen nights, 44 showers were observed both by the Volcano Ranch EAS array and by the optical detectors. Of these, sixteen were unmistakable shower tracks. The trajectories are known in three dimensions and, hence, a detailed intercalibration of the two observation techniques can be made.
6. Acknowledgements. This work is supported by the National Science Foundation, Washington, D. C , USA.
References
Bergeson, H.E. et al. 1977, accompanying paper in these proceedings. Cassiday, G.L. et al. 1977, accompanying paper in these proceedings. Chudakov, A. 1962, Sth Inter-American Seminar on Cosmic Rays (Bolivia). Elbert, J.W. et al. 1977, accompanying paper in these proceedings. Greisen, K. 1965, Proc. 9th Int. Conf. on Cosmic Rays (London), p. 609. Kerns, Q.A. and Tusting, R.F. 1963, Internal Report UCRL-10895, Lawrence
Radiation Laboratory. Linsley, J., Scarsi, L. and Rossi, B. 1962, J. Phys. Soc. Japan 17 Suppl •
A-III, p. 91-102. Linsley, J. and Scarsi, L. 1962, Phys. Rev. 128, p. 2384. Linsley, J. 1963, Proc. 8th Int. Conf. on Cosmic Rays (Jaipur) 4, p. 77. Suga, K. 1962, 5th Inter-American Seminar on Cosmic Rays (Bolivia), Tanahashi, G. et al. 1969, Proc. 11th Int. Conf. on Cosmic Rays (Budapest)
EAS 4/2, p. 24. Tanahashi, G. et al. 1975, Proc. 14th Int. Conf. on Cosmic Rays (Munich) U_,
p. 4385-4390. Winston, R. 1970, Journal of the Optical Society of America 60_, p; 245.

258 OBSERVATIONS OF EXTENSIVE AIR SHOWERS BY AIR FLUORESCENCE
SENSITIVITY TESTS AND RESULTS
G. L. Cassiday, H. E. Bergeson, T.-W. Chiu, D. A. Cooper, J. W. Elbert Е. С. Loh, D. Steck and W. J. West
Department of Physics, University of Utah Salt Lake City, Utah 84112, U.S.A.
G. W. Mason. Department of Physics, Brigham Young University
Provo, Utah 84602, U.S.A.
J. Boone Department ef Physics, California Polytechnic State University
San Luis Obispo, California 93401, U.S.A.
J. Linsley Department of Physics, University of New Mexico
Albuquerque, New Mexico 87131, U.S.A.
We present here experimental evidence that extensive air showers (EAS) have been detected via their isotropic light emission. In some cases, the light emitted from the shower was detected at emission angles up to ISO" and at distances more than several Km away from the detector. Furthermore, on the basis of observed data rates and shower size determinations we demonstrate that the resultant sensitivity of the detector for observing EAS is consistent with expectations.
1. Introduction. Night sky radiation provides a flux of background light against which faint optical sources (such as EAS. generated air fluorescence) must be detected. The relatively severe brightness of the night sky (about 10 photons sr"1 m"2 Msec"1 at Volcano Ranch, N.M.) coupled with the rather meager efficiency of the atmosphere as a scintillator (about 0.05%) might lead one to believe that an EAS would have to be improbably large in order to generate sufficient light to be visible to an optical detector. This requirement of large shower size coupled with a rapidly falling cosmic ray spectrum would thus render ineffectual almost any conceivable air fluorescence detection scheme. Thus, the fact that previous attempts at seeing EAS via the air fluorescence technique *> 2> 3 have not achieved hoped-for results is easily explained. However, we present here overwhelming evidence that EAS can and, indeed, have been unambiguously detected via their isotropic optical emissio-.i and in the accompanying papers4>s we present additional evidence that on the basis of such optical measurements (1) shower sizes can be accurately determined, (2) experimentally viable event rates can be achieved for showers in the energy range lO*** < Е < 1021 eV, and (3) the potentiality exists for measuring shower sizes throughout ы reasonable portion of their trajectories, thus making possible a new class of EAS experiments.
2. EAS Source Strength and Triggering Sensitivity. Here we estimate how large an EAS must be in order to.be seen by the Fly's Eye along with an assessment of the probability of simultaneous detection by the Fly's Eye and the Volcano Ranch Array. Shown in Fig. 6 (about which more will be said later) is

259 a reconstruction of one of the events actually seen simultaneously by the Fly's Eye and the Volcano Ranch Array. As a shower passes through the field of view Ав of one of the photomiltiplier "eyer," it will generate a photo-electron yield Npe:
Npe - NeY -i£- exp "R/A Ы CD
where N. > shower size in electrons Y • fluorescent light yield (*4 photons per meter per electron) е * combined light collection and photoelectron
conversion efficiency (0.17 ± 20%) A » effective light gathering area for ,
mirror array „ (1.7 i t It) X * attenuation length of 3600 A photons in air (-18 Km) R » distance of EAS source from Fly's Eye
/ Л1 • differential path length along trajectory during which EAS is within field of view Д9
Letting в be the optical emission angle for light seen by the Fly's Eye and Rx be the shower's impact parameter we have
* At = u(R±./tan6) = RMe/sin2G (2)
4TI_ J_ 1U f31
where we have neglected the attenuation of light due to atmospheric scattering since R « \. Clearly, the accuracy which we can obtain in measuring N depends upon how accurately we can determine the factors R± and N for each event as well as the other factors which are essentially event independent. We might anticipate that scatter in our size measurements most certainly will result from inaccuracies in measuring Ri. and N„e from event to event. Гп particular Npe is difficult to measure near threshold where noise and pulse slowing effects are most severe. We anticipate inaccuracies for near-threshold events of the order of ±(25-50)%. Systematic difficulties could result from uncertainties in the light generation yield factor Y. These efforts will be more fully discussed in the following paper.
In order to trigger the Fly's Eye signal discriminators, the photoelectron current must induce a voltage pulse greater than some threshold value which is determined primarily by the night sky background. With our optics, each eye was bathed in enough light to generate about 6200 photoelectrons/Msec. The lo fluctuation in this number which represents the noise is about 80 /7 photo-electrons where т is the pulse width. The voltage, then, at the input,to the discriminators due to noise pulses of No standard deviations is roughly
V * eG £ l Ro (1.,-TA) ( 4,
where е is the electron charge, С (« 8» 10^) is the electronic gain of the detectors, R0 (=75!)) is the relevant input impedance, and T (=0,2 usee) is the input filter time constant. Since noise photoelectrons scale as т1'2 we * t e i n N -т/Тл
V = 40 mV -fjj (1-е T/1) (5)

260
500
400
100
Node Induced Discriminator Voltage
Vi Pulse Width
0.2 0.4 0.6 0.8 Pulse Wiath г (fi sec) — •
1.0 1.2
Fig. 1. Noise-induced.discriminator voltage vs pulse width
where т is in usee and N is the number of standard deviations. We plot V vs T in Fig. 1 for various values of N. Mso shown by the solid line is the operating threshold (Vr . ISO mV) for our slow channel discriminators. (We ignore the fast channel which was primarily used for timing purposes.) In this experiment the range of impact parameters is about 0.75 S R < 2.25 Km while the range of angles в (see Fig. 6) is about (20° s е s 150°). These factors combine to yield a range of pulse widths (discussed in section 3) of about 100 nsec '- x - 1.3 usee. From the plot we estimate that all 5<r pulses regardless of pulse width =hould trigger the Fly's Eye.
h'e might note that our discriminator thresholds were under computer control throughout the course of the experiment. Count rates were monitored continuously from each photomultiplier and the discriminators adjusted up and down accordingly as the night sky brightness changed in order to preserve those counting rotes. Single tube counting rates were thus fixed at about100/sec thus holding the dead time constant to a value less than 1%. As a result'of this count rate wonitoring and control process, the relationship of the discriminator threshold
to noise pulse size indicated in Fig. 1 was preserved. Hence, our triggering sensitivity was always as good as it could be for any given level of night sky brightness.
The actual triggering of the Fly's Eye event by event is a fairly complicated function of geometry, but we can roughly estimate from equation (3) and Fig.1 a minimum shower size necessaryfora trigger. Let Ri be 1 Km, then Npe (5o) is about 250 photo-electrons and from equation (3) we obtain Ne (threshold) »3.5-107 electrons. Due to electronic pulse slewing and our consequent inability to accuratelymeasure pulse integrals for voltage levels near triggering threshold, we might expect an effective threshold
Fig. 2. Projection of EAS #14 as seen by the Fly's Eye onto a vertical plane above the Volcano Ranch Array. The solid line is the trajectory as determined by the Fly's Eye while the dotted line represents that determined by the VRA. The projected angles differ by 3°.

261 of N - 5*10 electrons. This is a very fortuitous situation since VRA triggers on showers of such sizes about 1 per hour. Hence, a rate of 1 reasonably well-defined shower once every several hours of operation time is not an unreasonable expectation. These estimates are, in fact, close to reality since we detected 44 events in coincidence with VRA in about 100 hours running time during November 1976. The smallest of these events triggered only two photo-multiplier eyes (the minimum number required for an "event" trigger) ami t>"pi cally the corresponding shower sizes were about 5-107 electrons.
3. Event Geometry. The crucial parameter of interest in the experiment is, of course, the number of shower electrons N e as a function of its trajectory. In order to measure this number the trajectory first must be accurately determined. This can be done by locating the plane in space which contains the shower axis and then by locating the shower's impact parameter Ri. and its ground impact angle ф (see Fig. 6 ) . The Fly's Eye observables used to make these determinations are the geometrical pattern of the phototubes which were triggered by the shower along with their sequential timing which
Event 14
Fig. 4. Fit to the vertical projection of EAS #14 as seen by the Fly's Eye obtained by constraining the ground impact point to the position determined by the VRA. The projected angle determined by the VRA ind the Fly's Eye is nearly identical.
Fig. 3. Projection of the plane containing th.-axis of EAS #14 and the Fly's Eye (the shownr-
detector plane)onto the horizontal VRA. The core location of the shower as determined by the VRA is denoted by X.
measured the progress of the shower through the Fly's live field of view. The geometrical triggering pattern is a direct measure of the shower's vertically projected zenith angle. This locates the shower-detector plane in space. We illustrate this by example for oneof our observed events. Shown in Fig. 2 is a projection of the 3 Fly's Eye mirror clusters onto the vertical plane above the center of the VRA. The horizontal extent of the VRA is about 1.5 Km and unfortunately wc do not completely cover its field of view. To some extent we

262 sacrificed total coverage (and subsequent event rate) by positioning the field of view of mirror 1 above mirrors 2 and 3 in order to gain more redundant information on a select sample of events. The X's in that figure indicate those "eyes" which were triggered by shower #14. Note that the shower makes a fairly well-defined line through our field of view. Furthermore, each eye was triggered in a well-defined time sequence, progressing downwards along the X's.
Shown in Fig. 3 is a horizontal view of VRA. The projection-of the shower-detector plane onto this horizontal plane is indicated by the straight line extending from the Fly's Eye. This particular shower impacted the ground
г 0 . ад» Light Emission Angle 0
Fig. 5. Time in ysec at which a given photomultiplier "eye" in the Fly's Eye (indicated by the X's in Fig. 2 and 4) triggered on the light generated by HAS #14 as it passed through the field of view.
1.52 Km away as determined by the VRA and marked by the X. In order to determine Rx and ф from our timing data we constrain the shower to impact the ground at this.position. The result of this constraint is pictured in Fig. 4. We now show in Fig. 5 a plot of the elapsed time of the shower as it passes through the field of view of each eye. The actual values of these elapsed times can be used to determine Rj. and ф (see Fig. 6) in the following way: since the shower tra
vels at the same speed as the light it generates, the light reaching the Fly's Eye lags the passing shower front by a time Even) 14
tee)- Rx с sine
R-t R±,„9 c -ttSe*r t a n2
Fig. 6. The solid line indicates the geometrical reconstruction of the shower trajectory using the Fly's Eye spatial and timing data. The dashed line represents the VRA-deterained trajectory.
(Eq. 6). A best fit of the data to this timing function yields the shower axis indicated by the solid line in Fig. 6.
4. Results. We present in Table 1 the results of our geometrical analysis for each of the 16 events (out of a total of 44) for which we had a maximum "2 mirror" field of view. In all cases, agreement with VRA-determiried parameters is quite good. The average value for our proj ected zenith

\ 263
Table 1 Comparison of EAS Geometry as Determined by Fly's Eye and VRA
Ground-Tropact Net Projected Zenith Angle Ф Angle ф Space-Angle
VCl't »
2 4 13 14 17 18 25 26 28 29 31 32 37 39 42 44 Averag
Unconstrained Utah VRA |йф| -21 - 6 15 -19 -36 1 7 -11 -13 2 -23 -20 3 - 2 - S . 3 4 9 5
- 1 -14 13 17 20 3 -28 -3? 4 - 6 6 12 -22 -19 3 38 ' 28 10 5 10 5 1 0 - 3 13 35 17 18 18 5 13
es 8.7°
Constrained. Utah VRA |Лф| -17 - 6 11 -25 -36 11 -13 -13 0 -20 -20 0 - 8 - 5 3 10 9 1 - 8 - 1 4 6 25 20 5 -21 -32 11 0 6 6
-20 -19 1 30 28 2 13 10 3 1 - 3 4 27 17 10 7 5 2
-1.2° -3.3° 4.8°
Constrained Utah VRA |д<|>| 108 113 ' 5 122 120 2 62 46 16 111 109 2 87 78 9 111 106 5 118 127 9 58 69 11 98 115 17 108 90 18 85 91 6 112 117 5 123 121 2 95 97 2 . 105 126 21 84 76 8 99° 100° 8.6"
UiliCICIH-C
ДВ 11 a 17 l 10 s и 12 20 19 6 6 4 5 24 9
10.6°
angle is -1.2°, thus no systematic geometrical bias is indicated. Events enter and leave our field of view from each direction with equal probability. The average ground impact angle ф (99°~) indicates a mild bias for events coming somewhat towards the Fly's Eye. This is to be expected due to the enhancement of triggering probability at small angles в via directly beamed or forward-scattered Cherenkov light. Nonetheless, it is extremely unlikely that such light could result in significant triggering enhancement at angles 9> 45°. Thij effect will be discussed in the next paper.
We conclude by reasserting our conviction that EAS have been unambiguously detected at distances far from our detector via their isotropic optical emissions.
Acknowledgements This work is supported by the National Science Foundation, Washington, D.C., U.S.A.
References 1. Greisen, K. 1965, Proc. 9th Int. Conf. on Cosmic Rays (tendon), p. 609. 2. Chudakov , A. 1962, 5th Inter-American Seminar on Cosmic Rays (Bolivia). 3. Tanahashi, G. et al. 1975, Proc. 14th Int. Conf. on Cosmic Rays (Munich)
12, p. 4385-4390. 4. Mason, G.W. et al. 1977, accompanying paper in these proceedings. 5. Elbert, J.W. et al. 1977, accompanying paper in these proceedings.

264
OBSERVATIONS OF EXTENSIVE AIR SHOWERS BY AIR FLUORRSCENCE RESULTS OF THE MEASUREMENTS
J, W. Elbert, H. E. Bergeson, G. L. Cassiday, T.-W. Chiu', D. A. Cooper E. C.'Loh, D. Steck and W. J. West
Department of Physics, University of Utah Salt Lake City, Utah 84112, U.S.A.
G. W. Mason Department of Physics, Brigham Young University
Provo, Utah 84602, U.S.A.
J. Boone Department of Physics, California Polytechnic State University
San Luis Obispo, California 93401, U.S.A.
J. Linsley Department of Physics, University of New Mexico
Albuquerque, New Mexico 87131, U.S.A.
The production of scintillation light in air by air showers has been observed using a prototype of the Utah "Fly's Eye" at Volcano Ranch., Shower size measurements from simultaneous observations made with the optical system and the EAS array are presented. As expected, light production was found to peak at small emission angles (<30° relative to the shower axis ) due to Cherenkov light. At larger angles C>45°) light production is only weakly dependent on the emission angle. The amplitude of the light production agrees roughly with expectations based on the sizes measured by the Volcano Ranch Array.
1. Introduction This paper presents results of the comparison of light production by EAS
to measured shower sizes. The optical apparatus was designed to detect light produced by air fluorescence, thus enabling the apparatus to detect showers at large distances and at large light emission angles (measured between the direction of the shower's motion and the direction of the observed light rays). This work was done in November 1976 at Volcano Ranch Array with an optical system consisting of 3 of the 67 mirror units being produced for the Utah Fly's Eye EAS detection system. In other papers in these proceedings, details of the experiment are presented by Mason et al. (1977) and the sensitivity of the system is analyzed by Cassiday et al. (1977). This paper concentrates on the analysis of the sizes of the observed showers and on the properties of a sample of 20 showers which were detected by the Volcano Ranch EAS Array, but which were not detected by the optical system.
Before discussing the treatment of the data, a description of the sources of the observed light is useful. A najor source of light is air scintillation or fluorescence produced by the charged particles passing through the air.

265
This light is emitted isotropically and the production is only weakly dependent on altitude when expressed in terms of photons per meter per particle. This weak dependence results from competition between increased ionization per meter and increased losses of energy by means other than fluorescence at higher air densities. A second major source of light is the Cherenkov process. A particle travelling at more than the local (altitude-dependent) speed of light emits photons almost in the direction of the particle's motion. .The angular distribution of electrons with more than the threshold energy is sharply peaked about the direction of the shower. This light can be received directly by the optical system or it can be received after a scattering of the light by air molecules (Rayleigh scattering) or aerosols (Mie scattering). The beam of Cherenkov light increases as the shower passes through the atmosphere, so that, neglecting losses from scattering, the scattered Cherenkov light depends on a certain integral over the earlier development of the shower. The above processes are expected to be significant sources of produced light from EAS, although aerosol-scattered Cherenkov light may be minimal under favorable atmospheric conditions.
2. Determination of Shower Sizes The Volcano Ranch Array (VRA) measured shower sizes, shower direction
zenith and azimuthal angles, and core locations for large EAS falling within the array area. The optical shower detector (OSD) was located 1530 * 30 I from the center of the VRA and measurement results were printed for events which triggered both the VRA and the OSD. There were 44 such events. Of these, 16 were judged to be "reconstructable" using the OSD data. The selection of these events was partly subjective but, roughly, events were selected in which at least three photomultiplier tubes could be classified as "active" and "interior" as defined below. Active tubes are defined as tubes in which an above threshold signal was detected in a given event. Interior tubes are those which are not on the upper or side edges of the OSD aperture. In addition, photomultiplier tubes in which the signals were less than 1.5 times the threshold signal were not included in the shower size determination because the response of the electronics was irregular very near the threshold. After this cut was applied to the data, 15 events remained for the size analysis.
The next step in the analysis was the conversion, for each tube in each event, of the integrated charge collected at each tube's anode to a quantity of photons incident upon the mirror. The factors entering this conversion are analyzed by Cassiday et al. (1977). Then the trajectory of the shower was used to convert this signal into an apparent number of electrons, N^, which would produce the observed amount of light if only scintillation light is present. The quantity N^ is observed within the aperture of the i'th tube along the shower trajectory.
The maximum angular aperture of each tube is 0.10 radians and the distances from the shower are often as short as 1 Km so the width of the light-producing region often exceeds the aperture of a single tube. The shower images are frequently 1, 2, or even 3 tube apertures wide. The procedure of adding together the contributions of the various tubes starts by defining a large number (100) of evenly spaced points spanning the OSD aperture along the shower's fitted trajectory. At each such point, a cross section of the track is taken and the (fy values for all active tubes within this cross section are added, forming a rather irregular histogram of the measured shower sizes. The resulting distribution is shown for Event 14 by the small points in Fig. 1. (Some of the points are covered by the bars described below.)

266
Fig.
Often a track from a shower that is near the detector is only one tube wide although light is received from a wider angular region. This occurs when adjacent tubes receive light but are below threshold. A procedure has been found which adjusts the measurements to conpensate for this "lost" light. The amount of lost light can be estimated by considering the cases in which a track shifts from a width of 2 or 3 tubes perpendicular to the shower to a width of one tube. A correction should adjust the size of the shower in the region where the track is one tube wide to be about the sane as the size of the adjacent part of the shower in which the track is 2 or more tubes wide. For regions of the track which are one tube wide, the correction procedure is to multiply the size measurements by D/250* meters, where D is the width of the part of the shower within the tube's aperture. The
correction factor is not allowed to be greater than 1.6 or less than 1.0. The parameters of this adjustment (250 m and 1.6) were obtained by a fit to the measurements.
In order to obtain a shower curve which is relatively unaffected by such irrelevant accidents as tube aperture boundaries, the following procedure is used to condense the data into a whole number of effective measurements. The total angular c-xtent of the usable data from each shower in the OSD is divided into the nearest whole number of tube apertures. Then the average size is obtained in each such interval by averaging the data (as adjuster abovn) occurring in the interval. The 6 resulting effective measurements for Event 14 are shown by the solid bars in Fig. 1. Let us call these measurement* rii» "apparent optical sizes." Note that points on the right side of the figure have been corrected upwards by the shower width correction discussed above. The solid heavy point at the far right in the figure shows the size measured of the VRA .for this shower.
3. Results of the Size Measurements As an indication of the relative contributions to the optical signal fTom
scintillation and Cherenkov light it is useful to plot the ratio of the apparent optical sizes to the VRA size for each event as a function of the light emission angle, 6, between the shower's direction and the direction the light travelled to reach the OSD. Fig. 2a shows this distribution. The first thing to note is that a curve is defined reasonably well by the set of measurements.
800 900 ATMOSPHERIC DEPTH (acnrf2J
1. Measurements of the shower size versus atmospheric depth for a shower observed with both the optical shower detector [small dots and bars) and the Volcano Ranch Array (heavy point at right). The optical measurements are calculated using fluorescent light only. (See text for details.)

267
LCHTEMISSION ANCLE в (degrees)
IO
Ю
л
.
• ч . 1
» 8 * >
.
(с
- [ 1 '4л
<d)
-
SHOWER SIZE N* SHOWER SIZE ^
Fig. 2. Comparison of sizes from the optical shower detector to those from the Volcano Ranch Array for 15 showers. The dependence on the light emission angle is shown in a and b, and the dependence on the VBA sizes is shown in с and d. Optical results are converted to shower sizes in a and с using scintillation light only (apparent optical size) and in b and d using both scintillation light and estimated Cherenkov light (corrected optical size).
Thus, knowledge of the light emission angle and the apparent optical size can be used to determine the VRA size reasonably well.
The distribution is approximately independent oi" angle ior angles above 45°. This supports the expectation that direct Cherenkov light is not significant in this angular region. A large peak is observed in the Kght prjunction at angles less than 30°, presumably due to Cherenkov light. Beyond 45°, ratios of apparent optical size to VRA size exceed 1.0. A possible cause el this discrepancy is indicated below.
A computer calculation has been done to evaluate the in stance» of the scintillation light, direct Cherenkov light, and Rayleigh-srittered Cherenkov light. Aerosol (Mie) scattering was neglected. The showers were assumed to vary in size with depth according to calculations using Feynman scaling and assuning the primary cosmic rays are iron nuclei. This assumption, together with the VRA measurements, completely specified the showers' development, neglecting fluctuations. Angular distributions of shower electrons were taken from the tables of Messel and Crawford (1970). The' Rayleigh-scattered Cherenkov light was evaluated and found to yield a significant contribution to the total received light. For each observation in each shower, the absolute number

268
of photoelectrons was calculated. The ratios of the observed number of photo-electrons to the calculated number are shown in Fig. 2b. The ratios are also equivalent to "corrected optical sizes" divided by VRA sizes. For intermediate angles, the ratios are clust'tered about 1.0. The drop in the ratios beyond 90° is due to measurements on a single event. This shower may represent a major fluctuation from average^conditions rather than a downturn of the distribution In this angular region. Even after the estimated effects of Cherenkov light have been removed, extra light appears to have been received in 3 or 4 events at small light emission angles. This excess may be due to an underestimate of the angular width of the Cherenkov light, neglected aerosol scattering or other systematic effects.
Fig. 2c presents evidence of a bias in the event sample which was studied. The smaller si^e showers have a high ratio of the apparent optical size to the size measured by the VRA. Showers of a small size which otherwise might not produce a track in the optical system can be detected if they occur in the detector's aperture with small light emission angles. This is because of the large quantity of Cherenkov light occurring at small emission angles and because the electronic pulses are short in time but high in amplitude under these circumstances and these pulses are more likely to be above the voltage threshold required for detection. Thus the smaller showers tend to be detected at smaller light emission angles and at higher ratios of apparent optical size to VRA size. Because of the steeply falling primary cosmic ray spectrum, fluctuations of small showers which allow them to be detected may be important. The estimated effects of Cherenkov light both direct and Rayleigh-scattered) have been removed in the results plotted in Fig. 4d.
4. Comparison of Observed and Missed Events Another result of the measurements is the threshold light level, above
which events are detected with high probability. The "detectability" of an event is approximately dependent on three parameters. These are the impact parameter of the shower, Rp, (i.e., the perpendicular distance from the detector to the shower axis), the size of the shower, N e, and ю 9
г the emission angle, 0, for light received from the shower. The charge, Q, produced by the photomultiplier tube is proportional to Ne/Rp (see Cas-siday et al. 19775. This charge is received in a time, T, proportional to Rp/(l+cos8). The pulse amplitude is proportional to the current Q/T and is therefore proportional to Ne (l*cose)/R_2 =D. Thus, the quantity D is a rough gauge of the detectability of an event with a fixed threshold amplitude.
A sample of 20 events missed by the OSD were analyzed using the VRA data.
20° 90* 60« 80* 100' APPROXIMATE EMISSION ANGLE в
120'
Fig. 3. Distribution of the approximate optical "detectability" of showers in this experiment. The symbols are defined in the text.

269
These appeared to be the most likely candidates for detection in the OSD based on measurement results from the VRA. Of these events 13 passed through the aperture of at least 2 photomultiplier tubes of the OSD and were candidates for triggering the OSD. The quantity D has been calculated for these events and the values are plotted as crosses in Fig. 3. Also plotted are the events which triggered the OSD and satisfied the aperture requirenents. None of the missed events have D > 7 x 10⁷ km-2. This value represents the level above which events are detected with high probability by the OSD.
It is useful to compare the value D 0 = 7 x 10' to the expected response of the system. The direct current levels in the photomultiplier tube correspond to about 6200 photoelectrons/vs due to the background light at Volcano Ranch. The time interval in which signals are integrated is about 1 us so the r.m.s. noise level is about 80 photoelectrons. The value of D0 corresponds to about S90 photoelectrons assuming 4 photons of light are produced per particle per meter. [In Teality, the shower width reduces the received light in each tube and Cherenkov light increases it relative to 4y/m.) The signal to noise ratio at this threshold is thus about 7. This is just somewhat above the signal-to-noise ratio of 5 that is required at threshold if the accidental coincidences in the mirrors are to be negligible. Thus the sensitivity of the Fly's Eye prototype is about what it would be expected to be for the measured background light levels.
Conclusion The results presented here demonstrate the capability of optical systems
to detect, reconstruct, and measure the sizes of remote extensive air showers. The Fly's Eye system under construction is expected to greatly improve upon the capabilities demonstrated by the prototype. Note that the value D0 is not the theoretical sensitivity limit for all locations or for all impact parameters. The light levels at Volcano Ranch are elevated due to the city lights of Albuquerque. Also, optimal threshold levels and light pulse integration times depend on the shower impact parameters and values of 6. In conclusion, the study of EAS by remote optical systems is very promising.
Acknowledgements This work r's supported by the National Science Foundation, Washington,
D. C , U.S.A.
References Cassiday, G. L. et al. 1977, accompanying paper in these proceedings. Mason, G. W. et al. 1977, accompanying paper in these proceedings. Messel, H. and D. F. Crawford 1977, Electron-Photon Shower Distribution
Function, Pergamon.

270 RATE ESTIMATES FOR PROPOSED EXPERIMENTS
USING THE FLY'S EYE AIR FLUORESCENCE DETECTOR
G, L. Cassiday, H, E. Bergeson, T.-W. Chiu, D. A. Cooper, J. W. Elbert E. С Loh, D. Steck and W. J; West
Department of Physics, University of Utah Salt Lake City, Utah 84112, U.S.A.
G. W. Mason Department of Physics, Brigham Young University
Prove, Utah 84602, U.S.A.
J. Boone Department of Physics, California Polytechnic State University
San.Luis Obispo, California 93401, U.S.A. J. Linsley
Department of Physics, University of New Mexico Albuquerque, New Mexico 87131, U.S.A.
We estinate data rates for experiments using the Utah Fly's Eye air fluorescence detector to (1) measure the primary cosmic ray spectrum for energies 1016 < Е < 1021 eV (2) measure the proton-air interaction length (3) separate protons and heavy nuclei in primary cosmic rays. Rate estimates are normalized to experimental results obtained with the prototype Fly's Eye detector/Volcano Ranch intercalibration experiment. Rates for experiment (1) are near 106/yr while rates for experiments (2) and (3) are near W V y r . The proton interaction length can be measured to ±10% while the component separation can be obtained to bettex than ±254.
1. Introduction. Previous papers ' ' have reported the successful obser-vation of the passage of extensive air showers (EAS) through the atmosphere by means of nitrogen fluorescence light given off after excitation by the relati-vistic electrons in the shower. The instrument (called the Fly's Eye) designed to make these observations has been discussed in other papers.4>5,6 Here we discuss the proposed program of experiments to be carried out with the Fly's Eye detector. 1'n particular, for certain of those experiments we present detailed rate estimates based upon our intercalibration studies of EAS performed in cooperation with the Volcano Ranch Array (VRA) at Albuquerque, New Mexico.
We list those experimental investigations we currently believe feasible to undertake with the Fly's Eye detector: (1) make a precise measurement of the primary cosmic ray spectrum in the energy range Ю^б-Ю 2* eV, (2) make a direct measurement of the proton-air cross section in the energy range 1016-lp19 eV from an examination of the distribution of primary interaction "starting points" in the atmosphere, (3) separate the heavy component and the proton coao,onent in the primary cosmic ray beam, (4) search for anisotropies in arrival directions of the primaries, (5) look for neutrino-induced showers near 10 2 0 eV. All of these experiments depend primarily upon the ability of

271 the Fly's Eye to: (1) determine the geometry of the EAS event, (2) measure its energy (size), and (3) achieve a significant event rate for the energy range in question. We believe that in previous papers we have already successfully demonstrated the ability of the Fly's Eye to carry out the first two of these three tasks. In this paper, we intend to present evidence that, in fact, based upon event rates obtained with the prototype Fly's Eye, the third task is also within our grasp simply by scaling the prototype detector up to its full-grown size (Loh et al. 1977)
Finally, there is one additional experiment which looks feasible but difficult: (6) make a detailed study of proton interaction models by measuring directly the longitudinal development of a shower throughout a significant portion of its trajectory. The difficulty does not stem from an insufficiency of light generated by the shower thus rendering visual identification difficult. If anything, the difficulty that may afflict the observation is perhaps an over abundance of light. In particular, our VRA calibration study3 seems to imply that our observed light yield is systematically too high, most probably as a result of scattered Cherenkov light contaminating the air fluorescence. If this proves to be the case, then the light we observe is a measure not only of the shower's current size at a particular point in its trajectory but also is a measure of i-ts previous history. However, this effect should be most pronounced at the trailing edge of the shower while its early development should still prove to be more or less free from such contamination. How we choose to use this additional light for our benefit in performing experiment (6) remains to be seen.
2• Rates for Measuring the Primary Spectrum. The geometry of a detector like the Fly's Eye is quite complicated. In order to simulate the response to such a detector to EAS, we developed a Monte Carlo program which generates showers at randoa which are then "observed" by the detector. The program determines the minimum energy Е which a shower of specified geometry must attain in order to "trigger" a sequence of N photomultiplier tubes, each of which is a certain minimum number of standard deviations above noise-. Both N and the number of standard deviations can be chosen to optimize data rate limited only by chance rate and dead time considerations. The simplest trigger thus envisioned requires that at least four phototubes out of the entire Fly's Eye Array (-1000 tubes) have signals at least five standard deviations above noise. In actuality, four parallel triggers will be implemented for fourdifferent integration time scales in hopes of optimizing signal to noise for events which occur far away as well as close by the detector. The effect on data rate of anyarbitra-rily chosen triggering scheme can be tested by the program.
Showers were synthesized with random geometrical parameters andthe energy of the shower is scaled up or down until it triggers the detector. The event rate is then
Rate =^I(>E) d(Afi) (1) •
where A is the detector aperture and I(>E) is the integral cosmic rayspectTum, Clearly, obtaining I(>E) is one of the design goals of the Fly's Eye. Hence, a way of measuring this spectrum involves fitting the observed data rates to the above integral function. Here, in order to a priori estimate datarates we carry out the inverse process. We use the spectrum I(>E) given by Greisen, 1965. However, we normalize our rate calculation to the experimental results obtained with the j,iototype Fly's Eye detector operating in coincidence with the Volcano Ranch Array (VRA) at Albuquerque, N.M. during November 1976. There we achieved an event rate of 0.5/hr and a size threshold of Ne - (0.5-1,0)'10& electrons at a distance of R± = 1 Km. We then plot in Fig. 1 the results of

272
Pulse Width Usee)—* .07 .33 1.7 6.7
юю_а>
our calculation normalized to that result. The rates have been readjusted to correspond to the brightness of the night sky at our Dugway, Utah experimental site which is not as severe as at Albuquerque, N.M. where the calibration experiment was performed.
We see from Fig. 1 that we can expect to see EAS at distances of 0.2 < Rt< SO km. The corresponding pulse widths range from .07 s ut < 17 usee. In order to trigger the detector, showers SO km distant would have to have a size of Ne - 4'Ю 1 1 electrons Cat ground impact) or an energy near 10^1 eV. Such showers would be observed at a rate of about 1/yr. Showers impacting within several hundred meters of the detector would require a size of about N e = 107 electrons or an energy of about 2'1016 eV. Such showers would occur at a frequency of about 106/yr. Hence, it should be possible to map out the cosmic ray spectrum in the energy Tange 1016 < Е < 1021 eV with significant data rates.
3. Rates for Cross Section and Primary Separation Measurements. In order to carry out experiments (2) involving the cross section measurement and (3) the separation of protons from the heavy component, significant data cuts will have to be made. These two measurements each require that a reasonably precise location of the starting point of an EAS be determined. Obviously, the shower's starting point cannot be directly observed. However, the Fly's Eye can be expected to observe the 1/4 maximum point which typically occurs at an atmospheric depth roughly 300 g cm"2 beyond the depth of primary interaction. This occurs somewhere between 300-600 g cm"2. The distribution of the 1/4 maximum points may be used as a measure of the distribution of interaction points. Unfortunately, many of the showers are seen early in their history traveling more or less towards the Fly's Eye. Hence, the optical emission angles are small and a sizable portion of the shower's trajectory may be contained in a single photomultiplier's field of view. For the purposes of estimating the rate of events acceptable for making the above two measurements we have accepted only Monte-Carlo events whose trajectories had no PMT fields of view containing slant depth bins greater than 120 g cm"2 at slant depths beyond 300 g cm"2. This requirement allows the 1/4 maximum point for all selected events to be located with precision =±25 gem"2. The result of this selection process leaves us with about 10,000 events/yr in the energy range 10 1 6 <_E < 10 1 9 eV useful for measuring the p-air cross section and separating protons from heavy primaries.
0.2 0.5 I 2 5 10 205010 Impact Parameter Rt ( K m ) —
Fig. 1. Rates (left scale) and observed shower sizes Ne (right scale) vs shower impact parameter Rt (lower scale) and corresponding pulse widths Cupper scale).

273 The method of separation is fairly straightforward. Essentially, it
involves a multiparameter fit to the composite "interaction point distribution" obtained after naking data cuts as outlined above. Ne have approximated such an analysis based upon a Monte-Carlo-generated sample of showers using standard composition at lower energies.8'9 The primary nuclei were grouped into four regions of composition as shown in Table 1. The Monte-Carlo program sampled this composition, choosing nuclei at random with probabilities based on their abundance on an energy per particle basis. The nuclear groups [3-6] and [15-23] were ignored due to their low abundances. The relative weights of the four "included" nuclear groups, shown in Table 1, were obtained after conversion to an energy per particle basis by the factor AT-1 with у • 1-7. The cross section for nucleus-air collisions are based on the results of Heckman et al. 1975.1° However, the proton-air interaction length was taken to be 75 g cm*2 corresponding to a total inelastic cross section of 325 nb. The composite interaction lengths for the remaining nuclear groups are given in Table 1. The resultant distribution of depths of first interactions for 5,500 events generated by the Monte-Carlo program was collected into 50 bins of 10 g cm-2 width. This distribution is pictured in Fig. 2. (For the sake of clarity only the final fit to the distribution is shown.)
A very simple fit-Table 1 ting procedure was emp-
Standard Composition of low-Energy Cosmic Rays 1 ^ о г т а ? 1 о п 1 г о т ° п ? ^ 1 Weighted by AT Carlo-generated composite
Fraction of Nuclei « ц ^ ^ , , , , . The He and the CNO groups were combined assuming that half of the resultant group had an interaction length of 49 g cm-2 and tnat t n e other half had an inter-, action length of 26 g cm . The Monte-Carlo distribu
tion was then assumed to be the sun of four exponentials of the form
where the Aj are the interaction lengths and the w^ are the relative weights of the relevant nuclear groups.
The above function was fit to three "centering points" for the distribution (X « 50, 100 and 250 g cm-2 indicated in Fig. 2) varying only the proton interaction length Xi while holding the others fixed. This particular procedure was carried out primarily for ease of calculation. However, these fits would not be expected to be nearly as sensitive to the interaction lengths of the heavier nuclei primarily for two reasons: (1) rather large centering depths were chosen to optimize sensitivity to the more penetrating particles and (2) the interaction lengths of the heavies do not scale linearly with the proton interaction lengths. A minimum x best fit (shown in Fig. 2) was obtained for Xj • 78 g cm" compared to an input value of 75 g cm-2.
In order to evaluate the accuracy of determining the proton cross section with this method, ten independent Monte-Carlo runs were analyzed
z 1 2
6-14 >24
Group H He CNO Fe
Interaction Length of cn"z
75 49 26 19
at a Given Energy/Nucleon
0.395 0.175 0.179 0.175

\'4ЗД у . . 274
laooo '. giving an average value of >T3.4 g c m . The r.ra.s. error in* a single test is 5.5 g cm"2. the average weight wi obtained for proton showers was 0.42 compared to 0.395 in the input. The r.m.s. еггот in this quantity for a single test is 0.10. These results imply that a proton component in the presence К
^>f a "nixed" composition is § indeed detectable and that the S interaction length can be de- 'S termined to order -10%. In the Jj real measurements, a full- £ blown multiparameter fitting z routine will be used over the whole range of data. Moreover, the measured p-air cross sections could then be used to recalculate the cross sections ojE the heavier nuclei. Thus,
iteration should be pos-le which should lead to ter accuracies in extracting relative weights of the
. ious nuclear components. It appears then that protons can te detected and their cross section measured if they make up 10-20% of the • primaries in our accessible energy range. The possible absence of low nass primaries is also detectable and would be an interesting discovery in itself.
IOO ZOO ' 300 Depth of First Interactions g crr i*-
5O0
Fig. 2. Monte-Carlo generated distribution of shower starting points for 5,500 events. Primary constituents were selected from nuclear groups H, He, CNO, and Fe. The curve represents a four-component best fit to the Monte-Carlo generated distribution.
Acknowledgements This work is supported by the National Science Foundation, U.S.A.
Washington,
rences Mason, G.W. et al. 1977, accompanying paper in these proceedings. Cassiday, G.L. et al. 1977, accompanying paper in these proceedings. Elbert, J.W. et al. 1977, accompanying paper in these proceedings.
4. Cassidoy, G.L. et. al. 1975, Proc. 14th Int. Conf. on Cosmic Rays (Munich) 8_, EAS-1S, p. 3059.
5. Cassiday, G.L. et al. 1975, Proc. 14th Int. Conf. on Cosmic Rays (Munich) у "8, EAS*l6, p. 3060. *, &ttsid#, G.L. et al. 1975, Proc. 14th Int. Conf. on Cosmic Rays (Munich) r 9. T5-18, p. 3397. 7. Sreiseri, K. 1965, Proc. 9th Int. Conf. on Cosmic Rays (London) 2_, p. 609. 8. Ryan et al. 1972, Phys. Rev. Let. 28, p. 985. 9. ElbeA, J.W. et al. 1975, Phys. Rev. D 12, p. 6 6 0 / 10. Heckman et al. 1975, Proc. 14th Int. CoiTF. on Cosmic Rays (Munich) 7,
p. 2319.

ЪапмоЮ 275
CERENKOV RADIATION Г80М LARGE COSMIC RAT SHOWERS
4,1 - COMPDTER SIMULATION DATA
S.J. Protheroe and K.E. Turver Department of Physics, University of Durham, South Road, Durham, U.K.
Detailed computer simulation» have been made for the Cerenkov radiation produced in large cos-nic ray showers. The hsdron cascade employed in the shower simulation incorporates Feynman scaling; primary particles ranging in mass from protons to iron nuclei are considered. The simulation data compare well with measurements of the average characteristics of Cerenkov light; satisfactory agreement is found between observations and predictions for showers of energy lo"-1018eV having their electron cascade maximum at depths of 700-800 g cm2.
1. INTRODUCTION. This paper gives results of simulations of light in showera based upon a contemporary model for high energy hadron interactions and detailed electron-photon cascades and Cerenkov light production and propagation in the atmosphere.
The computation, which follows broadly the pattern established in our earlier work (see Dixon et al (1974)), comprises three sections. Firstly,we consider the generation by the hadron cascade of the energy spectrum of pions produced at various depths in the atmosphere. Next, the high energy (>56 GeV) electron-photon cascade is followed in one dimension using cascade theory under Approximation A. This in turn is followed by a calculation of Crrenkov light based upon detailed Monte Carlo electron-photon cascades (using the scheme suggested by Butcher and Messel (1960) and consideration is taken of the absorption of the Cerenkov light in the atmosphere together with the spectral and temporal response of likely detectors.
Full details of the model and computing procedure are given in a recent paper (Protheroe and Turver, to be published). 2. THE DETECTOR RESPONSE. In calculating the precise form of the temporal characteristic» of the light pulse it is necessary to assume a response function for the light detector. We consider here a system which responds to a narrow puis* of light with a pulse shape characterised by a rise time of 9 ns and a FWHM of 19 ns. This we consider to be typical of a system having a bandwidth appropriate to an array of well separated detectors necessary for measurements in large showera. 3. THE LATERAL DISTRIBUTION OP CERENKOV LIGHT
The lateral diatribution of the total light density (the light pulse area) observed at sea level (Haverah Park) and averaged over 50 vertical showers initiated by protons and heavier nuclei of energy in the range 10lD-10lBeV are shown in Figure 1(a). Similar data are shown in Figura 1(b) appropriata to the Volcano Ranch site. The broader light pools of the heavier primary induced showers are clear at both altitudes of observation; the variation of tha distance at which the optical flux is independent of atomic mass number of the primary is seen to vary with

276
primary energy and observation depth.
4. THE TEMPORAL CHARACTERISTICS OF THE LIGHT
Here we consider Che shape of the light pulse at sea level predicted for a system with the response tine characteristics described above* We have considered the pulse shape in detail. We specify'the shape .of the pulse by the quantities 10-901S risetime (t ) , the width of the top of the pulse (between the 90Z full height levels of the rising and falling edges, t ) , the fallcime from the 90-50* levels (t£), and the full width at half mSSimum (FWHM). Son»? indication is given of the distorting effect of our non-zero response time system by quoting values for the pulse shape expected in an ideal system and for the effect of observing at a higher altitude (1980 m above sea level).
Pulse Risetime
The average risetime of the pulses at various core distances in iron nucleus, а-particle and proton initiated showers at sea level are shown in Figure 2. The effects of the bandwidth of our system are shown in Figure 2(a) where data for a zero response time system are plotted for a 10~'eV primary proton shower. Similarly.in Figure 2(c) we show the effects of observation altitude by plotting the expected values for a depth of 835 g cm-2 for a 1017eV icon nucleus initiated shower. The monotonic variation of t with the depth of cascade maximum, (irrespective of primary energy or atomic mass number) is shown by the data of Figure 3. Typically, for a core distance of 350 m, t increases by ъ 3ns per 100 g cm"* increase in depth of maximum.
Top Time The average values for the width of the top of the light pulse (at
the 90Z full height level) at sea level for iron, а-particle and proton primaries again depend principally upon the electron cascade depth of maximum - see Figure 4. The striking features of this parameter is ire non-monotomic behaviour. For showers developing very deep in the atmosphere (to be expected only for proton induced showers), the tt value shows a sharp increase at core distances ъ 500 m and subsequent decrease at core distances i» 700 га. Such structure, if observed in real showers, may be a useful indicator of deep development of a shower and thus the presence of proton primaries.
The Falltime of the Pulse The average values of the falltime of the pulse at various core
distances, а-particle and iron initiated showers at sea level and the -non-monotonic dependence of this quantity on the cascade maximum position 'max) are *hram i n Figure 5. Again, for core distances of 400-700 m, a change in variation of tf an with core distance occurs. The differences in falltime presumably reflect the constant shape of the falling edge of the electron cascade and the increasingly important effect of the scattering of the radiation electrons which is necessary if Cerenkov photons are to reach the detector from electrons low in the cascade.
Full Width at Half Maximum of the Light Pulse The average values of the FWHM are shown for various core distances
in proton, а-particle and iron initiated showers in Figure 6. Again, the effects of bandwidth and depth of observation are shown in Figure 6(a) and 6(c) respectively for 10*-'eV showers.

277
w» wo a » сок овтдмее imi
Ftt.l
МПН «F tLBEWM CUCMC tMMMM Ц.м'1 П О .
t — •!• i i b ,
в. v ю'л * rTtv • if it
1 •
•
• »
• -
>
J
-r
^ :
t
Hff l tW lUCtKN C*tC4DC MUIMUM ЬСА4!
I"
r: * _. i.
ill район»
(»|а1-ГДЯПС1Е$
1 К
l » U l l t D M NUCLEI
. / • :
a
* Ж
л. * к

278
5. THE HEIGHT 0? ORIGIN OF THE OBSERVED GERESKOV RADIATION Considerable interest attaches to the knowledge of those parts of
the electron^cascade which contribute Co Che various parts - the rising edge, the falling edge etc. - of the light pulse. Rigorous simulations make possible the identification of those electrons in the cascade responsible for certain aspects of the light pulse shape-. The origin of the rising edge of the light pulse becomes clear if we consider the sets of sub-pulses of light expected at various distances shown in Figure 8 due to the sub-showers of electrons indicated by the lines in Figure 7. Clearly, the view that the light close to the core originated low in the atmosphere is substantiated; however, the pulse shape at large core distances (r>2O0m) follows the electron cascade development with the earliest detected light originating high in the atmosphere. The contributions of the later parts of the cascade are attenuated at large core distances where the effects of Coulomb scattering of radiating electrons become more important. 6. THE CURVATURE OF THE LIGHT FRONT
Our simulations show that the light recorded in specified small parts of the light 'pulse by an array of widely-spread ground-based detectors originates from i small volume in the'sky. The possibilities thus exist to localise the origin in the atmosphere of the light recorded at various positions in the light pulse and so to estimate directly the electron cascade longitudinal development. The early light in a pulse at large core distances originates at large distances above thie array and is produced quasi-isotropically i.e. the light is produced by widely scattered electrons in a volume which is small relative to the extent of the observational array.
The Curvature of the Extreme bight Front He here define the extreme light front (ELF) a* the front of the
light at the level of 10Z full pulse height (appropriate to the system as specified above.) The depth of the origin corresponding to the radius of curvature (obtained by fitting a parabolic approximation of a spherical front to the times of arrival at distances in the range 100 - 500 m from the core) of this ELF in showers initiated by primary protons, a-p«xticles and iron nuclei in the energy range 10"-l0**eV 'ranges from 500 - 800 g ca . The justification for fitting a sphere to such data in the distance ranges 100- 500 ш is shown by the data of figure 9. The deviations from sphericity arise due to the increasing importance of the Coulomb scattering of the electrons for light produced low in the atmosphere and due to the bandwidth of the recording system. 7. TIME DELAY BETWEEN THE LIGHT AMD PARTICLE FRONTS
The Ccrankov light signal may be completely specified by the lateral distribution of pulse area, the pulse shape and the extreme light front shape. The Cerenkov component may be related to other components of showers, for example, the particle flux, by the time sequenting of the light and particle fronts. Our consideration here is confined to the time sequence at distances close to the core ( ISO m will be used here) where adequate samples of electrons (10 - 100 particles) may be recorded by fast response particle detectors of area ъ 1 m^. In such an environment the light pulse effectively occurs at a fixed time in the shower (varying by < Ins). The measure available is thus the delay of

279
the electron component with respect to a fixed time in the shower. This quantity depends on the experimental arrangement of the electron detector involved. Data are shown in Figure 10 appropriate to measurements to a prescribed signal level in the detector response (here chosen as the deposition of 50 MeV/m2 in the scintillator or alternatively to the 10% 4 of full signal level for a near гегл-response time electro detector). -*'• The predictions are for p and Fe induced showers of energy 10^-6, lO*' and ?' 10l8eV. "Щ
8. COMPARISON WITH MEASUREMENTS
'ЗШ$
A brief comparison with recent experimental data may be made; experimental data for vertical showers of average energy." 2 x j.Ql7eV and 2 x lol"eV are summarized in Table,1 - a good representation of the detail of most measurements is given by the present simulations. The predicted dependence of each parameter on depth of cascade maximum of the electron cascade has been used to derive a value for the depth of cascade maximum. The derived depth of maximum (averaged over the various measures with eat given equal weight) increases from i<680 g cm "2 to ъ 760 g cm"2 as the primary energy increases by a factor of about 10. 9. THE SENSITIVITY OF THE DATA TO THE MODEL FOR ENERGETIC INTERACTIONS.
Tha model for energetic interactions suggested by Cocconi e.t al (1962) ar.J employed for almost a decade has been here superceded by a model which incorporates Feyman Scaling. The difference between the Cerenkpv light in proton initiated showers of energy 10"eV calculated using CKP model and this contemporary model arise solely from the differences in the electron cascade. •:
Comments, based upon observations 'of Cerenkov light, on thp depth of cascade maximum for showers are thus substantially independent pf the energetic interactions model employed.
References
Butcher, J.G. & Messel, H. Nuc. Phys. В 20, 15.
(1960)
Cocconi, G. Koester, L.G. & Perkins, D.H., (1961) Lawrence Radiation Lab. Seminars, 28, pt. 2. VCID-144, 1.
Dixon, H.B., Earnshaw J.C. Rook J.R., Hough, J.H., Smith, G.J., Stephenson, W. 4 Turver, K.E. (1974) Proc. Roy. Soc, A 339, 133.
v-Wfc

280
ю5-окимжсы
CMt МГАНН | я I
1
.«•V
- V .
1 1 1 - 1 1 " Г 1 — '••
C0K PSMNCE H t N .
I I M fir N W I W F
\ \ TI»tfi»ll lb •
С<Р1И OP «IC1R0M CASCAOC KAMMUM tf. (»** !
fH4W*W
•HJSS*?"""
f»--" Мы M
N i l
M l
5rt
M t k
M » B
W k " M >
1 M B
M * k
W » k
!•*•
Н М Л
. 1 . И "
• t .B
Ml*)*
u я 11
• w и-U
и
•M
Ш
M
M
M
m M l
I I I
M
1 »
-» ,
"^" «*аи
» » 4
« » » " » «
— Ш
-m m
.» ... m
~ •» мч>*1Ц) | |» ' *иир>идо«>«

banmw - CERENKOV RADIATION IN LARGE COSMIC RAY SHOWERS
II - MEASUREMENTS AT SEA LEVEL
R.T. Haomond.K.J. Orford, J.A.L. Shearer, K.E. Turver.W.D. Waddoup
and D.W. Wellby
Department of Fhyaica, University of Durham, Durham, England, O.K.
ABSTRACT
Measurements are reported for the average characteristics of Cerenkov radiation produced by large cosmic ray ahovera. The measurements have been made with an array of eight widely-spaced detectors. Independent measures of 2he longitudinal development of the electron cascade are identified which «how correlated variations indicative of the fluctuation» in shower development.
1. IHUtODUCTIOM
Since 1971 an experiment has been developed at the Baverah Park array, capable of measuring characteristics of the pulse of Cerenkov light in large air ahowers. In this paper we present the results of our measurement» interpreted in the conventional way. We base most of our analyses on the shower characteristics (arrival directions, core location and primary energy estimates) derived from the particle detector array at Haverah Park and we investigate the dependence of the various Cerenkov light measures (pulse area, pulse shape, shape of the light front etc.) upon these shower parameters. It is our aim to establish the average values of the Cerenkov light parameters. A paper describing in detail our equipment and results is in preparation.
2. EXPERIMENTAL ARRASGEMEOTS
The majority of the measurements reported here were made during about 70 hours of clear sky, moonless night-time periods during the winter of 1975-76 with an array of eight light detectors spread over an area of *l km' at Haverah Park. Each detector comprises a faat photomultiplier with a 5" diameter photocathode viewing the night sky directly; the pulses of light ware recorded using a cable delay and oscilloscope display system with 35 MH* bandwidth. The results to be discussed here are based.upon.a sample of- showers of mean primary energy about 3 x 10¹⁷«V in which our detectors recorded light pulses at distances ranging typically between 150 and 600 * from the core.
The signals produced by the narrow light pulse outputs of the radioactive sources permanently mounted on the photomultiplier faces could be observed after having passed through the complete system. These provided a convenient "in situ" check of the bandwidth of the complete channels. The pulaes observed all have full width half maxima in the tang«a7-19n» and rise times between 8 - 10ns throughout the season.

282
3. ANALYSIS OF РАТЛ
The photographic records of those event* selected for analysis were printed to twice life size and the pulse shape data extracted. The parameters measured were the pulse height and the tine*- between the start of the tine base and the 10?, 50Z and 90S of the full height of the pulses on both the rising and falling edges of the pulse. From these figures were determined for each pulse the following quantities:
(i) The rise tine (10Z - 90?) (ii) The top time (90Z - 90Z down) (iii) The full width at hal maximum (50Z up - 50% down) (iv) The fall time (90* down - SOX down) (v) The pulse area (derived using a trapezoidal fit to the measured
points) (vi) The pulse arrival time, determined as the time between a time
marker and the 10Z on the pulse leading edge (vii) The arrival times of particles relative to the light signal.
4. THE AVERAGE CHABACTERISTICS OF CEREMKOV LIGHT Showers have been classified according to their zenith and primary
energy. Measurements in showers selected by zenith angle and primary energy have been fitted against core distance using appropriate functions and the values appropriate to various core distances between 100 m and 500 m derived. 4.1 THE LATERAL DISTRIBUTION FUNCTION FOR CEREHKOV RADIATION
Measurements of the pulse area at various' distances from the core of showers of primary energy about 3 x lO^'eV incident in different zenith angle bands are shown in Figure 1. A broadening of the light pool (a flattening .of the lateral distribution) is noted for those showers recorded at large zenith angles and developing at increased distances (in kilometre*) above the detecting area. We find that the structure function may be adequately represented by a simple power law for core distances in the range 100 - 300 m. The exponent of the power law, у , is observed to depend upon zenith angle of arrival (+ primary energy) as!
Y - 0.74 + 0.27 logL0 (р50О)те
+ 1.61 со*2в (Correlation coefficient 0.82, significance < 12, 5.E. on predicted values Y • 0.16)
We have estimated, for data incident at angles * 35°, that Y decreases by 0.40 for every additional 150 g cm"2 0f atmosphere between the cascade maximum and the observation level. We here assume that the. varying distribution of matter through the atmosphere ha* no significant effect.
The changes in the mean depth of development of the cascade with a change of one decade in primary snergy are small. (Recent computer simulations by Protheroe and Turver (1977) suggest a difference of * 100 g cm-? for a depth of maximum of showers differing by one decade in energy). This implie* an increase in Y of 0.26 over one decade of primary energy. We note that both attempt* to equate change* in Y with change* in the depth of maximum give result* which are entirely consistent.

283 Lateral distribution of photon fluxes in showers differing in value
of the Haverah Park ground parameter р(500)™ Ъу a factor of 10 are shown in Figure 2. The data are obtained from the present experiment with showers at ground parameter values P(500)VE O£ 0.194 and 1.95 cm~2. Results from the earlier work at the Yakutsk array by Dimenateinet al (1972) for showers of mean sea level size 1.4 x 10 and 1.7 x 10° particles are also indicated. The data are not normalised and here depend upon the estimates of absolute photon densities in the two experiments. Reliably relating the absolute photon measurements employing photomultipliers with different emissive surfaces and windows is difficult.
4.2 THE SHAPE OF'THE CERENKOV LIGHT POLSE
The Rise Time
According to our simulation data the pulse rise time reflects the growth of Che cascade and should thus show little sensitivity to the primary energy since the development of the showers (for constant primary particle mass number) .changes very slowly. This is so since the proton-air cross* section is either constant or changes only slowly over a decade in primary energy. Data for the rise time in showers of primary energy about 3x101'eV incident from the zenith are shown in Figure 3.
The Fall Time
The variation of the fall time of the pulse from the 90-5OZ levels (reflecting the light recorded by our detectors from the electrons in the tail of the cascade) in 3 x lO^eV vertical showers are shown in Figure 4 .
The Full Width at Half Maximum (FHHM)
The variation with zenith angle of the core distance dependence of the FWHM is shown in Figure 5 for vertical showers of primary energy * 3 x lol'eV. The FWHM is the only pulse shape parameter for which measurements are available from other experiments. A comparison of the present data with the measurements of Kalmykov et al (1976) is made in Figure 5. (The data of Kalmykov et al have been corrected by the authors for the bandwidth limitations of their equipment. Our present measurements include a small residual bandwidth effect which we make no attempt to remove and which we estimate should result in differences of 10 - 14ns between the two seasurements over the core distance range involved).
4.3 THE HEIGHT OF ORIGIN (THE RADIUS OF CURVATURE OF THE LIGHT FROl'T)
The height of origin (in ka away from the array) for the light fn showers in different bands of zenith angle have been calculated by fitting a sphere to the times of arrival of the light at 101 full height level at each detector. The mean heights obtained corresponded to 7.25 ± 0.5 km 'cor vertical showers of energy^ x lO^'eV. The corresponding value of the depth of origin of the light at the 10J level so obtained (from showers of all zenith angles) is 360 ± 30 g cm~2. (This removes the apparent anomaly noted by us in our earlier work and reported by Orford et al ( Ш 5 ) ) . 4.4 THE SEPARATION OF THE LIGHT AMD PARTICLE FRONTS
He consider that the time difference between the arrival of the light and particle shower fronts may be a further independent measure of cascade development which arises from the different heights of origin and effective velocities of propagation for light and particles. At the core distances

284
S K I O 6
™ 2x10
е >-| io* ё 2 S
£ 5x10
" • I .
2x1 . X ? .
J в <25' гБ^е^зв'
M. Л
* J i_ 100 200 500
CORE DISTANCE (m)
СМЕ ШПАКЕ 1Я1
FIG.1.
СМЕ DISTANCE Iml - * — ' — r f r C0 DISTANCE ( m )
ж
г i« s
•
/^"-^ *»
/V /sl
/s C'»
FH>.»
I .
' £ K A l W X O V i l *
. imi
COM М П П Ы I HI I
-
a » u и TIHC M l » ( m l

285
of interest here the light originating early in the shower is subjected to refractive index delays and the particles are also subject to an increase in transit time in the atmosphere due to path length differences and delays due to Coulomb scattering effects etc. Those showers developing high in the atmosphere have their cascade maximum at greater distances from the observation level and thus the light-particle front separation may be expected to be larger.
A direct measurement of the light particle delay using a co-located light detector and a (fast response) plastic scintillator particle detector has been made at core distances 100-200 m in shower of energy about lol?eV. The distribution in separation in time of the fronts are shown in Figure 6 (particle densities were typically 50 electrons m ~ 2 ) . Typical delays of the particles behind the light at such core distances are thus 3 0 - 4 0 ns, in substantial agreement with values from calculations. 5. A MEASURE OF THE PRIMARY ENERGY OF THE SHOWER
Cerenkov light measurements have been made in many showers for which there is no analysis of the data from the deep water particle detectors at Haverah Park. The requirement thus exists, if the measurements are to be fully exploited in future, for a measure of primary energy based only on Cerenkov light data so that all showers may be ranked according to their primary energy. Computer simulations suggest an appropriate measure could be the density of light at a core distance of 200 m, ф(200), which should vtry little with the detail of the cascade development and reflect mainly changes in primary energy. The variation of ф(200) with the established Haverah Park ground parameter p(500)ygis shown for a small sample of showers in Figure 7. The value of t(zOO) is here based on the core location indicated by the particle detector data - similar core location information must, of course, be provided from Cerenkov light measurements if this measure is to be used in the absence of particle detector data. The value of the ground parameter p(50O)yg is thst customarily employed by all supporting experiments at Haverah Park (see e.g. Allan et al (1971), Blake et al (1973), Dixon et al (1974))and has not been Che subject of any special analysis.
A • ' i t i
t пич, (if1) FIG7

286
6. SHOWER ANALYSIS
We here report the estimates of the arrival direction and core location of showers based upon air Cerenkov light measurements using conventional analysis procedures.
Arrival Direction Measurements The initial requirement for any analysis of a shower is to know the
arrival direction of that shower. These data have been determined using a procedure to be described in detail Hammond et al (1977,this Conference). The mean difference in spatial angles of arrival for a sample of t> 20 showers, according to the independent light and particle measurement techniques at Haverah Park, is 2.8?
Core Location Measurements The location of the shower core normally based upon the nonotonic
behaviour with core distance of a measureable parameter, 'usually the particle (or here the light) density. In measurements of air Cerenkov radiation various other parameters are available which are independent and fulfill this requirement. For example, in addition to the pulse area, the FWHM and pulse rise time are measurements which are suitable monotonic functions of core distance.
Analysis of 20 showers using each of these parameters have been made assuming an appropriate form of lateral distribution function; the optimization of the function has been achieved using a well-known computer procedure (MIHUIT - CERN program library). Equal weights have been given to all measurement» in the analysis.
The form of the lateral structure function assumed for the pulse • <r> - kfr • го)""
where r was fixed at 50 m. о The function employed for the distance dependence of the pulse rise
time and FWHM was: ,. , ч , /_ , t (r) - A. exp (Br)
Derivation of the core location for individual showers from the 3 independent analyses indicate rms errors in core position (x, y) of *_ 65 m, *_ 41 m for pulse area data, *_ 86 m and *_ 75 m for rise time data 'and + 71~m and * 70 m for FWHM data.
REFERENCES ' д
Allan, H.R., Jones, J.K., Mandolezi, N., Frah, J.H. and Shutie, P.(1971) Proc. 12th Int. Conf. on Cosmic Rays, 3_, 1102.
Blake, P.J.. Armitage, H.G. and Hash, W.F. (1973) Proc. 13th Int. Conf. on Cosmic Rays, U_, 2539.
Dixon, H.E., Machin, A.C., Pickersgill, D.R. and Turver, K.E. (1974) ' J. Phys. A, ]_, 1016.
Hammond, R.T. at al (1977), This Conference. Kalmykov, N.W. et al, Psp.r presented at European Symposium on Air Showers,
Sept. 1976, Leeds. Orford, K.J., Stubbs, R.J., Turver K.E., Haddoup, D.W., and Wellby, D.W.
(1975), Proc. 14th Int. Conf. on Cosmic Rays, 8_, 3014. Protheroe, R.J. and Turver, K.E. (1977), this conference.

287 DIRECT MEASUREMENT OF THE CASCADE DEVELOPMENT IN LARGE COSMIC
RAY SHOWERS
R.T. Hammond, R.J. Prottieroe, K.J. Orford, J.A.L. Shearer, K.E. lurver W.D. Waddoup and D.W. Wellby
Department of Physics, University of Durham, South Road, Durham, U.K.
A description is given of the analysis of the phase and amplitude of Cerenkov light signals in large shower*. Resultл from both measurements and simulations are presented which suggest simple and direct interpretations of the temporal structure of the Cerenkov signal which lead to accurate measures of the arrival direction, core location and primary energy of large coamic ray ahowers. The analysis also provides new information of the development of the electron caacade in individual showers which could lead to reliable estimates of the mass of energetic primary particles.
1. INTRODUCTION. In earlier pepers we have described the measurements and conventional interp.station of the pulses of Cerenkov radiation in showers of primary energy > 1017eV. Such data are relevant to the study of the atomic mass number of the primary coamic rays since they may be interpreted to give (indirectly) information on the longitudinal cascade of the shower. Here we describe the interpretation of such measurements based upon an analysis of the phase and amplitude of the Cerenkov light signal. This technique, reported briefly by Orford and Turver (1976), has already found application in other areas (Few (1975))and here provides directly a view of the development of the shower MS aeen in Cerenkov radiation. The image of the shower derived with this technique provides accurate measurements of the arrival direction; an extension of this analysis leads to the determination of the centre of symmetry of the shower (the core) at ground level. This procedure and related methods for the determination of the primary energy do not depend upon many of the assumptions made in conventional analyais. 2. BASIC DATA. The data employed here have been obtained using the equipment described in detail by Hammond et al (1977). Of greatest importance here ia the accuracy of timing measurements and the bandwidth of the system, both of which affect the recorded times of arrival of photons a* different points in the light pulse. It is of interest that in what follows the amplitude gain in the detecting system* is not involved and need not, in fact, have been known. Data for individual ahowers comprise at least six samples of the light signal, for each of which the times to the 10Z, 50J and 90Z of full pula* height on the leading and falling edges of the pulse ar* available. The accuracy of such measurements is governed largely by the limitations of the photography of our oscilloscope recording system and of subsequent film reading. We estimate the errors to be between 2 and 5 ns for each timing measurement for the data recorded in 1975/76. The basic data for a typical event are shown in Figure 1.
We note that the presence of Gaussian noise due to photon counting from the night sky will place a lower limit to the timing accuracy. For example, a small pulse shape with riae time ъ 20 ns and amplitude ten times the rms noise, will have an uncertainty for measurements on the rising
^

288 edge of the pulae of t J m . However, Boat pulses featuring in our analysis are considerably larger than thie and are thua subjected to much reduced effecta.
The fitting of apberical fronts to the tilling data ia undertaken using a least squares fit contained in the coaputer programme М И Ш ? (CERN program library). Here, a combination of three numerical procedures ia employed to obtain the leaat squares fit to the spherical front accommodating all timing data. Firstly, a random search procedure approximates the centre of the sphere before a simplex method refines the fit. Finally, checks inv olving the reassessment of the final fitting ensure the uniqueness of the chosen function minimum. In the procedure to date equal weights are given to all timing measurements. Ho significant effects were found «hen the observations were weighted according to the experimental precision.
The consequences of accepting a fit to the timing data which is worse by a prescribed amount than the chosen optimum are available from the computer programme. These are displayed as contours of equal goodness of fit in the orthogonal planes through the EAS array - ssc Figure 2. Typical fitting accuracy (for which the SKS residual is 3.7 ns) corresponds therefore to an accuracy of localisation of the origin to about 100 n in space. Again, a typical event is represented; worse and better fits arise in our data sample. 3. THE DETAILED SHAPE OF THE SHOWER FROKT
Typical experimental data for the curvature of the shower front are given in Figure 3. Here we ahow the curvature of the front* at the 10, 50 and 90Z level» on the rising and falling edges of the light pulse in individual showers. The shower represented has been chosen because it exhibits typical fitting residual*. In Figure 4 we show the deviations from a perfect spherical front of the fits at the 10Z levels on the rising edges of the pulses in a sample of shower* recorded at various zenith angles (thus having values of radius of curvature of the .sphere ranging ranging from 5 to 12 km). It is on the basis of such data (and errora of timing of a few n») that we justify the present assumption of spherical fronts. We have not yet optimised the interpretation of the pulse shape data - the five times presently used could reasonably be expected to increase to between 7 and 10 measures which would still be independent with the bandwidth of the current system 4. THE AVERAGE CASCADE DEVBLOPHEMT OF THE SHOWER HI CEREHKOV LIGHT
We here present the results of our analysis of ths phase and amplitude of the light pulses recorded by » 6 detectors in each of 19 showers. For each shower we have evaluated the depth in the atmosphere of the origin of the light at the 10Z full height level, d10, the thickness of atmosphere for the growth of the Cerenkov light image from 10 - 901 of full height, dR, and the thickness of atmosphere for the decay from 90 - 50% levels, d», together with the position of the production of maximum observed Cerenkov light in the atmosphere, d100. He note that although the value of dio is independent of the zenith angle of the shower the value of the distance of the detectors in km from this point in the atmosphere depends, as would be expected, on the zenith angle of the arrival of the shower. He consider that this is showing that our analysis of the Cerenkov light is distributing the position» of origin through the atmosphere but placing them, on average, at similar depthe into the etmosphsre; this limits the magnitude of any systematic fitting errors in the present work.

289
The average valuta of the quantitie» deacribed above are shown in Table 1. Also shown in this table is the expected light development curve according to the simulations of Frotheroe and Turver (1977) where the saae procedurea and interpretation» have been adopted in allowing for the system bandwidth and aphere fitting aa ware applied to our experimental aeaeureaenta. The simulation data referred to a showar of primary energy lo'7«V initiated by a primary alpha particle; this ia chosen because it produces an electron cascade in the atmosphere which adequately represents the light measurements when treated conventionally. Clearly, there is again substantial agreement between observation and expectations from thia (plausible) caacade model. The .only exception to this seems to be in the quantity dg which depends upon small tiae differences and 4s thus liable to larger errors at present.
5. AN ALTEMATIVE METHOD FOR THE ANALYSIS OF SHOWERS
The Arrival Direction» We aasume that the arrival direction of the primary is well represented
by the line through the origins of light at various positions in the pulse. A least squares fit for this line through the origins for our sample of showers has an IMS value of 15 m for the deviation of any origin point from the line. This corresponds, over the typical distance» (5-10 km) concerned, to an accuracy in arrival direction of better than one quarter of a degree. The IMS difference for a small sample of showers in the arrival direction according to the present analysis and that derived from the timing data from the particle detector array at Haverah Park ia 2.8°. Differencea are to be expected and they ariae from the different routine procedures employed to determine the arrival directions. For example, the particle detector shower direction is based upon the fit of a plane front to the timing data from the three outer, large area particle detectors at Haverah Park. The ahower direction baaed upon light timing measurement» is derived from a fit of a curved front. The differences may be largely accounted for by considering (in 2-0) the part of the curved (particle) front to which the plane is a chord.
A Primary Energy Estimator -The optical flux at core distances of about 200 m ha» been shown to
be a good measure of the primary energy, being largely independent of any caacade development fluctuation. The possibility exists of an easily obtained primary energy eatimator baaed upon two well measured (independent) shower quantities each monotonically varying.with core distance. Two such quantities are the area and the full width at half maximum of the pulae. The relation between these quantities for an individual shower is shown in Figure 5.
The readily derived quantity +(40n»), the pulae area when the width of the pulse is 40ns, corresponds to the pulse area ut a core distance of about 200 - 300 m. This quantity has bean evaluated for showers for which the established Haverab Park primary energy estimator p(500)VI
known. The variation of i(40ns) with the Haverah Park energy estimator ia shown in Figure 6.
The Core Location The intersection of the straight line defining the arrival direction
with the ground plane defines the core impact. The core position »o defined may be compared with that given by the conventional analyses of

290
•J * • • ' . . *ч>-
« но е и tee TIME I M i
•ни -ка к—• >n»
• \ .
JW 4(0 " 6M COKE Q&WKX fml
fiG.3
- I 1 1 1 -
* го юо PWHM (м>
1 i a 51
r
шит
J И
л
СОК OJSUNCC (M) .' ' ' v: %/
fm
j4*
A s '
1
НЯТ1С1С ARRAY EKEROV ESTIMATOR p I ED* *

291 Cerenkov light data. The rm> value for the difference between the core poiitioni derived conventionally and in the preient Banner is •ъвОш in x and у (arising froB core location errora in both technique»). No systematic difference between the core poiitioni ю derived it observed.
Reference!
Ген, А.А. (1975), Sei. ли., 233, 80 HaeMond, K.T. et al (1977), This Conference Protheroe, K.J. and Turver, Г..Е. (1977), Thia Conference.
Table 1
Depth of initiation, d,-
Depth for riling edge,d
Depth of light eexieuB, d100
Depth for falling edge, df.ll
Obierved
360 с ей2
250 g cii2
670 g ев2
97 g ci2
Prediction
360 g ci2
160 g ев2
600 g ев2
100 t en2
JIB. The prediction» are for a shower with electron cascade aaxiaua at 780 g ca~*
Orford, K.J. and Turver, C.I. (1976), Nature, 264, 727.

%61&09 292
CALCULATIOHS OF THB ANGULAR AHD LATBRAL DISmiBOMOB OF QKBKNKOT LIGHT FOB THE ЖАНКШ-AHGLB ВИЕЕСТ0В6 I .P . lvanenko, Y.V.makarov, b.A.Hela Institute of Huclear Physics, Moscow university, Uo»oo*.11723*. USSR
Abstract, lb» angular distribution of the Cerenkov radiation .(.СЕ) from the electron-photon cascades developing in th» atmosphere has baan calculated. The possibility oS rutins tp* CB аябШаг distribution to restore the pattern of longitudinal development of the cascade ia analysed., Iba CB lateral distribution for narrow--angle detectors has been calculated.
1. Introduction, the angular characteristics of CB were treated ia the earlier works/1,2,5/as the possible source of information on the Tarious cascade characteristics, namely the primary energy, position of the axis, lateral structure. It was also indicated in/5/that the time variations in the CB angular characteristics could ha-** been related to the longitudinal development of cascade. Generally speaking, the angular distribution Integrated over time can also yield information on the longitudinal development of cascade. Hbough the experimental solution of even this, much more simpler than ia the previous formulation» problem can hardly be obtained at present, it is nevertheless important to answer the question If such information can be derived In principle.
Another aspect of the study of the OS angular characteristics is their use to select the optimal parameters of experimental arrays, in particular the viewing angle and direction of detectors (In cue of search for the point У"-воигсо8). She analysis of the results of such experiments also requires the CB calculations for various viewing angles of detectors.
2. Model. The model used in the present work was introduced in/*/ and described in detail la/5/*. The model can be outlined as follows (see Pig.l). All the shower particles are assumed to be accumulated on a plane perpendicular to the shower axis and moving along the axis at the velocity of light. It is assumed that photons are emitted by electrons at angle @c to the direction of the electron motion. ЗЬе function of lateral angular distribution (FLAD) of electrons is

293
MLg. l
where
set i n tha for» . F ( E . , E , S > e , 7 > - J « * ) - N ( E - u J E ^ )
whex« I^X )ie the structural part of FLAK In the f o r » / ? / : ^(7La) = ^ g L < д + г - s)
where х * а ч Д +<адгС + а ^ She expression for the CR FIAD i s of the f o l lowing fOM г<Л4 24 •«»•&
X + 2 - S л -
1+t -EU-wW f ^ d x i-o , P> la the radiation unit and cr i t i ca l energy; j> , Ь«,ч. la the atmospheric density aai CR threshold energy at the emia-aion level; Л5Л г вс i s the number of photons emitted by a s ingle electron along the unit path; D(S) la the known cascade function»
3. Heanlta. The angular distribution of the Cerenlcov l ight detected at a distance of. 100 ж from the shower axle i s presented In Fig.2 with the llnea of equal in tens i t i e s .
3*
E„=5-<o"Sev
Kg. 2 The values of в and VL corresponding to a fixed ratio
<Kei*)/£rM«„ are aet in the polar coordinate system. The angle в determines the length of radius-vector, and the angle £ define» the polar angle. The figure also presents the reaulta ot/l/. TSam agreement of our data at В =5х1015 e7 and

294 Л* disagreement at Е =10 eV with the results of the calcula
tion* equilibrium nodal used in/l /are «plained by the fact that the vain* of the parameter S of the fuactiona determining Ф(ОД) at Е =5x10л? eV in our calculation» is eloae to unity, and far from unity at B=10 eV.
о 1 • -i о
Big.3 Fig.5 presents the light flux as a function of angle 6
in the plane running through the ahower axia, i.e. at 4 =0. She figure alao shows the results of/l/. Similarly to Fig. 2, the agreement for X «5rlo',s eV i* better than at £ =10 " eV. It can be noted that the shapes of the <K©|0) curves for R= =100 m and RaAOO m are similar to the shape* of the caeeade curves N(t) which may be explained as follows. The value Ф<.е,Ч>) is a result of integration along the beam £<!»,*) over the atmoapherie depth. At * = 0, the main value of the integral is collected in the vicinity of the beam intercept of the shower axis. SCne calculations showed that in the major part of the range of variations in 9 80S* of the. integral is collected along 1-2 rad.units, i.e. the light flux proves to

295
о* proportional to the electron Intensity at the depth t corresponding to the altitude z » | , Thus, the curve Ф(6(*),о) is a certain reflection of the caacade curve of the shower. It is of interest to note the analogy between the angular function Ф(©,«*) and the tine scanning of the Cerenkov pulse. It is natural to assume that, similarly to the tise scanning /в/, there exists a possibility of approximate restoration of the shower development with the depth t on the basis of the angular cross-section of CR. Fig.4 shows the comparison between the shower electron number N(4.) and the light flux Ф(611),о) presented as a function of depth t. Though the
curve shapes are similar, the curves Ф(8ЧЛ,о) proved to be strongly shifted towards smaller depths. This can be explained by the very rapid decrease in the structural function %-Щ 1) with decreasing altitude Z whioh forms, together with H, a part of the expression (J). .
.«Ke,<S> ,»«•) *«rbitrer7 -""
unit»
О 5 46 15 20 5У Fig.4 The light flux (the solid curve) and the shower
electron number (the dashed line) as function» of depth.
Pig.5 shows the results of calculations of the lateral distribution of CS recorded with the detectors with 0.5* and 1.5е viewing angles. The figure also presents the calculation results txom/&/. The primary У-quantum energy В «=10 * eV.

296
(U*£>
О 40O
W«.5
RofTonoo»
X. V.I.Zataapin. ZhKf, 42,, 8 , 689, 196*. 2. G.H.Biek*. l e t » Ph7a.Aead.8ei. Bungarioaa, 29, cuppl.3,
p.601, 1970. 5. C.Castagnoli, F.Ploehl, M.A.Looci. Киото Ciaanto 9B, 1972. 4. V.T.GushaTin, 1.Р.1тшмико, Т.Г.Макахот, T.M.RoganoTa,
C.J.Jadorova. Proo. 14th Int.Oont. on Ooamio Bus, 8, 3029, 1975.
5. I.P.lTananko, V.V.MaJcaroT, b.A.Hein. Preprint UAH 98, 1976.
6. H.Browning «ad K.I.lbrTax. Proo. 14th Iat.Conf. oa Omnia RnjiTl. 3008, 1975.
7. Y.Y.QushaTin, I.P.Iranonko, T.M.RogtaoTB. IiT.Akad.lank SSSR, ••r.fi».,22,«o.7, 1973»
8. I.P.Iranonlco, У.Т.Макагот. Report at tba present conference.

297
LITERAL МВТВИиМОЯ OF THE CEHSHKOV BADIATIOH FOB ТШ *Iu*VA*GLE DmTBOTOBS I .P .Ivanenko, v .r .nakarov, L.A.Hein Institute or Huclear Phyeiea, Moscow Onivaraity, Moaoow, 11723*, CSSH
Abstract. The xaaulta of the calculation» of spatial and temporal charaoteriatica of tba Oerenkov radiation (CH) from tba electron-photon abowara developing in tba atmosphere ага preeented. The affaot of tba various ahowax para-aetera on CB oharacteriatiee ia atudiad. The physical approximations which «ay be uaad i s calculating CH f roa EAS are analysed in deta i l . The raaulta may ba uaad to find siaple relatione between ahower parane.Jere and CB charact e r i s t i c s .
1» Introduction» CR from showers i s calculated by various authors on the basis of various assumptions. As a rule, the val id i ty of aueh assumptions ia not analysed. Therefore, the problem ariaea as to the effect of the aaaumptiona on the OB characterist ics and the features of shower development which should be taken into account either accurately or approximately. The reaulta of the relevant analysis of the electron-photon showers may ba used in case of SAS where the direct analysis of such kind i s much mora d i f f i cu l t . I t ahould be emphasised that, apart from the simplification and reduction of the calculations» the • insertion of just i f ied assumption into the modal makes i t poss ible to reveal mora expl ic i t relationship between the CB and shower characteriatiea.
2 . modal. The modal described i n / l / w a a used. The expression for the function of latazal dletribution (FID) of cat detected within, a 90* aperture ia of the form
(The denominations are the aame em in/г/, where the detailed description of the derivation of the formula was preaented).
3 . lateral distribution. Fig . l presents the results of the calculations of OB FID for a primary V-ajuantua with В^Ю 1 7 eV together with «ha calculations o f / 3 / f c h e dot l ine a n d / V ( the dash-dot l i n e ) . She experimental data are £ r o a / 5 / i
Flg.2 shows the dependence of OB FLD on the primary energy

• Fig . l Fig.2 Fig.3 and the shower generation leve l . * showers generated deep in the atmosphere transfers a smaller portion of energy to CB since their development ceases »elow the observation level.This fact can be aaan i n tb* figure aa a shi f t of tha curves corresponding to tha high-eaergy primary )f-quanta with inoraaaing •tna dapth of shower generation, Ъ~п (the numerals right of tha curves).
Since most OR ia generated in the region of ahower maximum, tha form of OR ТЫ) ahould correlate with the position of the ahower maximum. Fig. 5 illuatrataa this circumstance by comparing between CR FID for a ahower with Eo=1016 ev, t •0(tM f T«ia.6) and tha showers with other B0 and t a (the nuaerala right of the curves). Bare tha ratio IHR)4 ^jjufafi** presented. The constancy of ц(.10 can be aaan whan thenhmerator and denominator oorreapond to almilar depth* of the maxima (the numerals аЪоте tha ourrea).
*ч ftBflTfIf ° f *be Physical models and tha possible approximation», (a) The altitude above the sea level of tha effective interval of depths from which tha main portion of CB ia detected for showers w^ith B0 10 1 8 ev ia high aa compared with Л 7 - of electrons. Only the electron ILD can be known to oaleulate the contribution fro* thia interval to CB FID. in fact , the f i r s t

299
and aacond «ddanda in tba factor B = ( ^ 4 ^ 1 ^ * ^ ) f r o " (1), which аха determined by tba lateral and lateral-angular moments of tba electron dlatributioa, become wall at sufficiently great Z a» compared «1th the third addend determined by the angular distribution averaged over X . The minimum altitude ?„, corresponding to an up to 10* contribution, to BC^Oa/*») from the first two term* ал compared with law third termi Zn>1.7 km шЬ» \*улх - « . / г . ) / , , £ 0.-»
(b) Another poaaible approximation i s the neglect of the value X<.=» 0, 2-a«»>) where ©* i s the angle betareen the motion directions of aa electron and the electron-emitted photon. It can be seen from the expression ^ОДОД'-З^*»* **•* t h i e «PProxima-tion may be used when 'ЬуцЗЫ , lor vertical showers. L^** »-Й0п».
Hence, i t may be assumed at В > 140 m that the electrons emit in the direotion of their motion.
Fig.4 illustrates the scopes of applicability of the approximation» (a) and (b). The figure shows the ratios of CR intens i t ies calculated using the corresponding approximation» to the exact function.
i> k m
Ив»* W«.5 (c) The neglect of the energy dependence е,СЕ)=<Л«»5 ^ д ^ . ^
namely the use of б е б ^ ю ) for al l the emitting shower par-t i d e s has been used in the present work. The total number of photons emitted by a shower is determined as

300
46/оГ * *м/ы * »«/Q *
10 32 20
го 19 9
зо 13 4
Tb* Table present* to* results of the calculations of tbe number of photon* д Ц , emitted Ъу А.М electrons 1A the energy rang* B t h r - I j , where »j 1» *e-
„ leoted on tb* t tu l* of the condition that the ratio Q* Tgi&d should be 0.1» 0 .2 , 0 .3 .
(d) The equilibrium character i s t i c s of electron-photon cascades are used inataad of tb* exact expression* for the e lectron-energy apaotrum and VU> i a calculating MS GB. The correctness of auob raplaeaa*nt ia determined by tb* sens i t iv i ty of CB to the shower development stages before and after the n " ^ " i i I t oaa be aeen from Tie.? presenting tb* rat io of OB 1Ы> obtained for tbe equilibrium FID approximationTth* exact function that the approximation of equilibrium ia properly aatiafled for a l l but tb* amalleat S. The difference between GB JIA oaloulatad for tb* equilibrium apaotrum approximation and tb* exact on* doe* not *x***d i 5/, for a l l 8.
5. Temporal aharaot*rl*tlcs. The temporal oher*.ct*risties «era oaloulatad using tb* model of ahower a» an emitting point. I t ins shown in / 2 / t h a t tb* inclusion, of tb* f in i te shower s i s * i s necessary only at В 4 20O-30O m. The difference between tb* Telocltie* of th* Ceraakov quanta and tb* *l*otrons was taken into account, lb* CB half-width X i s tb* most eas i ly measurable characteriatio of the OB time scanning. I t was shown l a / 2 / t h a t there existed an approximate relation X«- R* • Jig»6 snows tb* slowly varying value V ' R * as a function of В for tb* various depth* of showwr generation and primary energies. Tbe experiment a l data are from/б/С в * appreciable d*cr*aa« I A "5Л at small В i s determined by tb* neglect of the shower s i s * . A steady i n crease of V R 1 with increasing the depth of shower »"1ч"» (tbe numerals l e f t of tb* curves) can be seen. Tlg.7 shows X and T%, (tb* tlm* of the pulse r i se from 0.1 to 0.9 of th* amplitude) as functions of SQ. The sol id l ines show the valuea at

301
И С . 6 **e*7 fixed t , tbe dashed liaea pxaaaat the rabies at fixad t„_. gen ••* Tbe daahed euiraa are such flatter than the aolid oaaa. Btla la explained by the fact that In the f Ixat eaaa X and Т г тагу due to the inoreaaa of the oaaeada ourve width, and In the ae-oond oaaa also due to the ahift of the «bower aaxiaua.
6T ooaclualon. (1) The CE 1U> ateepneea in the interval of diatanoea fro»
ahower axia R > r*** la Mainly determined by the poaition of shower aarlaua and depends little on primary energy.
(2) The electron lateral diatribution. and the Oerenkov radlua for shower with X0 •» ДО18 aV at Е > 200 m say be neglected within an error ^ 15%.
(3) The teaporal eharacterlatioa t. «ad Ti • similar to the spatial characteriatioe, are senaitlTe first of all to the poaitlon of ahower aazlaua. The rest ahower paraaatera alao affeot the teaporal oharaoteriatloa of OS, but to a aaw.1-ler degree. t «ad T\ тагу with a factor of 2-4 with changing 1 0 froa. 1012 to 1017 aV.

302
1. V.V.OuibMln, #t *1. Eroc. 14th Int.Conf. on C.H., 8, J029, 1975.
2. i.p.lniimko, V.Y.Ifckirov, L.A.Htin. Preprint КАН, Ho.98, 1976.
5. М.Ж.Игакопотг, *t *1. Isv.Akad.Hftuk SSSH,«»r-fia., 39» Ho.6, 4. J.B.ttsbiMra. Fxoe. 14th Int.CeaT. onC.B., 12, 4318, 197$. 5. Diminatein, «t «1. Eroe. 14th Int. Oonf. on C.S., 12,
4318, 1975. 6. M.X.KUagrkoY, «t al . Pia>M ZbKXP. 21, 1. 1975.

303
DETERMINATION OP THE LONGITUDINAL EAb DEVELOPMENT ON THE BASIS OP THE DATA ON THE TIME
SCANNING OP CERENKOV RADIATION PULSE
LP. Ivanenko , V.V. Mafcarov Institute of Nuclear' Physics, Moscow State University;Moscow,USSR.
ABSTRACT: Tha problem of restoration or the cascade curve of an electron-photon shower on the basis of tha experimental time scanning measured with Cerenkov counters has been solved .• It has been shown that , in case of formation of Cerenkov pulse (CP), the same values of VtTl/jfT^gj,) measured with the counters at 0.2 - l km from EAS axis are due to the EAS electrons from the same altitude. This fact makes it possible to use a system of synchronised detectors for determining the position of EAS axis and the pattern of EAS longitudinal development .
i. Introduction •
The experimental data on the time dependence of the CP shape obtained from several synchronised detectors / l / make It possible to determine tha dependence of the Е AS electron component intensity on atmospheric depth . The measurements of the CP time scanning with several detectors were used in / l / to determine EAS axis and to establish the correspondence between the EAS generation altitude and a certain value "3frJ/*(7**Jot CP . The authors of ll/, however, failed to find the relationship between the CP shape and the form of the electron cascade curve of EAS . The results were obtained from the analysis of the experimental data involving considerable experimental errors, so that it ia difficult to us to separate the physical error of the applied model from the errors due to the measurement bias and the methods of processing of the experimental data ,
The data of /l7 and the calculations of /2/ make it possible to conclude that the dependences of the CP shape and the EAS cascade curve shape at small depths £ are similar. It will be shown below that the curve of tha CP dependence in variables 6 i s shifted towards greater depths relative to the electron cascade curve of the EAS electron component due to the effect of the electron PAD (function' of angular distribution ).
2. Modal of the emitting system The size of the emitting system and the difference between the
velocities of elect rons and Cerenkov photons a s well as the angle (Cerenkov angle) may be neglected within an error of <C 10% for the showers with effective development altitude Z *y »r*?f where
f* Is the second moment of the electron T^LD (function of lateral distribution ), and tha axas at R > 0.2 km from tha detectors /3,W. Thus, it-may be assumed when calculating tha CP characteristics at 0.2-1 km from EAS axis that the EAS particles are accumulated at a point moving at velocity С along the axis and that.each EAS electron emits light along the velocity vector. In Pig. 1 , the emitting point moves along tha 00* axis . The photons emitted from point

304
7 will be in tha detector и later than the electrons in 0 by the time determined from the expression
(1) с where С Is the velocity of light
Determine the density of the photon flux arriving at the detector D in unit time per unit area:
Here /V is the integral spectrum (the cascade curve) at depth С (rad,unita) of tha electrons with energies above the threshold
energy in air E fc. f & ) generated by a primary with energy Bo ; •f(9. tl is, the electron РАО for which, similarly to /4/, the
following expression will be used :
*(** *)—27Г r/S) **-* parameter determin
the electron PAD; go it/&U4t)i* the Б AS age; U=~ &1 Е~./Л / i s dhe critical energy . Since we are interested in the atti<
£ from which the emission occurs at di О(Г.Й) will be determined in variables
( 3 ) , artd the value Jt/JT» с /Zt ', Z
( 2 )
Here *£ '» the parameter-determined from the second moment of O)
'finite moment Tf the value * . Substituting (1) ,
• 8 km , in (2 ) , we get
ЯЩЛ]" 2w л* г/5;г. ( 4 )
The calculation» show that 7 t varies little with changing с Ж it is assumed that S « 1 in (4 ) , i.e. tha equilibrium electron PAD in used) the dependence of У (t) on t detected at various R will be tha same aa tha dependence *t ( £4 Ец, t J»* Smaff t Tha inclusion of tha FAD dependence on $ in (4 ) results in the appearance of the factor 2*~'- Л* • The value ^s-i decreases with increasing 8 at S <~ 1 and increases at S > 1 . Thus results in a change of the dependence 1(1) . a » compared
with tJ f £,, * * * , . , £ / on- t and in a shift of the altitude of the 7(-t) maximum towards greater Ж . The value of the shift is practically independent of R and ia a function only of Co , R is essential that the dependences of VCT(t)J on t are similar for different R due to a smaU change Ы **W/*-«'*fr/>ae compared with the change of tha rest part of ( 4 ) with depth t. This means that the same values of jr / 3 . w of the pulse detected at different

305
R are generated at the aame altitude. The above considerations are confirmed by the results of
calculations shown in Fig. 2 which demonstrates a similarity of the curves of OtTftfJ for different R . The figure also presents the cascada curve whose peak is shifted ( a s it was noted above) to tha right ot the VLTiHl maximum .
It can be seen from Table 1 that the same С / Зм«лг are emitted from the same depths for R - 0.2 •? 1 km . within an error smaller than a single rad.unit This fact makes it possible to use a system of synchronised detectors for determining the Е AS axis position and the cascade curve shape without using ihe particle detectors. In the simplest case of a vertical shower aS.(R/i< l/y we obtain the equation
Tj'm tf/ZjJC where lj~ is the time when the value of the signal from the i-th
detector reaches a value < J ' of the maximum - signal at given R i 2 \ i s the altitude from which given isgnal was emitted. The distan
c e s R from Б AS axis may be found from the experimental value of Tjl . Tha cascada curve can be obtained by substituting the values
of the pulses in ( • ) .
3. Conclusion (1) It has been shown that the pulse shapes of the C P time :
scanning in variables t are similar for the detectors at 0.2-1 km from EAS axis . This means that the same phases of the pulse
g(Tf *•) /Я ("К**,, Я) tor *Я»*еп1 R «re emitted from the same attitudes, which permits a system of synchronized detectors to be used for restoring the cascade curve .
( 2 ) The С Р'shape maximum is shifted towards higher attitudes relative to the peak of the electron cascade curve; the value of the shift i s a function of the primary particle energy and the electron PAD shape .
REFERENCES: 1. K.J. Orford , K.E. TUrver Report at the European Symposium
ot Cosmic Ray Physics, Leeds, 1976. 2. Yu.A. Pomin, G.B. Khristiansen. Sov.NucLPhys.,14, 642, 1971. 3. V.V. Gushevin, J. P. Ivanenko , V.V. Makarov, T.M. Roganova,
Proc 14th InUConf. on Cosmic Ray 8, 302,9, 1975. 4. UP. Ivanenko, V.v. Makarov, L.A. Hein, Preprint No.98, PIAN ,1976.

306 TABLE 1
Table 1 list» the. v a l u e s of the depthtthe from which the s a m e a r e emitted for Е A S with
E o - 1 0 1 * eV and XO 1 6 eV .
I&Si _!°?.
E^IO 1 *
Eo=I01 6
0,1 • 4,4 0,5 6,85 0,9 9,2 I I I
- 0 ,9 12,75 -0 ,5 15,7 -0 ,1 20,1 0,1 6,7 0 ,5 . 9,75 0,9 12,4 I 14,5
-0 ,9 16,2 -0 ,5 19,5 -0 ,1 22,6
t 400
5,1 7,5 9,9 П . 5 12,5 15,45 20,2 7 9,8 12 14 16,3 19,3 22,6
j 700
5,25 7,85 10,2 12 13,5 16,2 19,75 7,л 10,4 12,6 14,5 16,3 18,7 21,7
[ 1000
5,4 7 ,7 10,1 И . 5 13,25 15,55 19,2 7,3 10 12,5 14 15,5 13,2 21,5

307
•з 400
/ 700 \
/ / / /100° '
\V
ID IS SO 25 t
ftg.2

308 OWICiL С&иЛЖОУ BADIATIOS FROM EXMJSIVB AIR SHOWERS
i
T. Hara, K. Kamata and G. Tanahasbi JiAS Division, Cosmic Bay Laboratory, University of Tokyo
Tanashi, Tokyo, Japan, The various featutes of Cerenkor radiation from EAS of J*" and proton primary are calculated under the different multiplicity law models. Comparing the lateral distribution and the pulse width at half maximum of Gerenkov pulse with the experimental data, the data are favour to high multiplicity model than the others.
1. Introduction. As the Cerenkov radiation produced by electrons of EAS goes straight through the atmosphere, we can get the information on the early stage of developement of EAS by the obsevation of Cerenkov light at sea level. Recently both the theoretical and experimental works have been performed by Havarah Park /1,2,9/ and Yakutsk and Moscow/3/ groups up to about the distance of 1 Km from the core. The photon intensity and the pulse waveform of cerenkov light have a strong correlation to the longitudinal shower developement. This paper describes the results of calculation for lateral distribution and the pulse shape up to the distance of 4 K»-fro»Lthe core under the-assumption .of the different multiplicity law, E;1, E^t and InE,. 2. Assumption for the calculation. In our calculation the angular distribution of shower electron is taken into account, but the spatial displacement is neglected. An electron produced at any stage of the cascade developement is emitted with a deflection angle, ве , to the EAS axis, which produces the Cerenkov radiation with the conical emission angle, © t, to the electron movement direction. We assume the emission angle of Cerenkov light, 8 , is the same with the angle of electron movement,ве» for large angle (82c\) and qonstant angle, Qt, for narrow angle ( в< 6V ) • , I*ets K(E #,E',X) be the production rate of photons with energy Е in the ehower induced by a primary proton with energy E« at a depth X, tf(E',E,X) the energy spectrum of electrons in the cascade shower by photon with energy E', F(B,E) the angular distribution of electrons with energy E, Yc(E,X) the light yield per an unit electron(eaergy £) path length ds and T(r) the transmission factor of light in the atmosphere. . The number of Cerenkov photons received with the collecting area A per ds• is given by
Ic(X,e,Ejdsda=-p/ I W(E(>,E,,x')W(E',E,X-X*)F(e,E)Tt(E,X)T(r)dsdX'dE'dE
The number of electrons in an electromagnetic cascade shower induced by Jf ray of energy Е at the depth X (in radiation unit) from the initial interaction point is assumed to be given by a modified Greisen'e formula/V as follows.
total number of electron; 1 v W(E',EiO,X)=0.31exp[x(l-1.5 lnS.)J/K* with S,=3X/(X+2f.), J,=ln(E'/Et) and Et=S*.2 KeV,

309
energy distribution) f 1 i/ W(E',*E,X) «t explX(l-1.5 lnS)J/p% -with S=5X/(X*2f) and а =1П[Е /<0.4E C*E)J. The angular distribution of electrons in cascade showers is assumed
to be as follows/6/. angular distribution; ^
Г(в,Е) e<exp(-t>/ft) with вГ=0.г45(1*0.032Е)'* (Е in MeV).
The energy distribution and the integral angular distribution calculated under the above assumptions are in good agreement with the results of Monte Cairo simulation by Messel and Crawford/iy for low energy region(E.* 50 GeV).-For the proton primaries, the parameters for nuclear interaction are assumed as follows;
Proton Fion
Int. Mean Free Path I So gem"»
120 gc»r* I
Xnelastiaitv 0.5 1.0
The calculations were made for three different assumptions on multiplicity law i.e., 1.07E,* , г.^Е^апа 1.09 InE.. The energy distribution of secondary particles is given by,
f ( Е )dB=ty exp( -Е/Ё)ав/3, where Hf and 2 mean the total number and average energy of secondary particles. It is assumed that one third of the total number of secondary particles are neutral pions. The Cerenkov photons are produced by the shower electrons at every stages of longitudinal development of the cascade shower initiated by the photons. _ The relation between the depth and the height is assumed to be U.S. Standard Atmosphere. The transmission factor of Cerenkov light.in the atmosphere is given by expfUKmVff]' where <$" is taken as «• =18 Km~< which is the total attenuation coefficient for 4,000 A /Xi/ and L is the distance through the atmosphere in Km. 3.1. Relation between Carenkov pulse peak and shower maximum. The calculated results of longitudinal shower development initiated by photons and protons under the three different multiplicity models are shown in Fig.l. As the major part of Cerenkov photons is produced by low
0 500 1.000 DEPTH N ATMOSPHERE (g cm'2 )
, ^ _... figure 1. The longitudinal shower energy electrons (2o'MeV «. a few of developeaents of I" ( -) and 100 MeV), the observed intensity Proton primaries with different and pulse shape of Cerenkov light multiplicityJ.aw, proportional to are strongly dependent upon the s» * >i E * ( ) and lnE,(—•—•).

110
E.40"tV в . О '
— t «W«AHY PHOTON
-юн.» m - l
OP SHOWER M U .
longitudinal developement of showers. Fig.2 shows the pulse waveforas of Cerenkov light calculated under different assumptions for EAS of ,5 primary energy E.-10,T *V. One is ю [ ' ' I ' "^Т—' •" initiated by ^primary, and the other is by proton under the «•sumption of E? multiplicity law. Ihe former produces the shower naxinun at the depth of 770 gem and the latter at the depth of 550 gem-* in the atmosphere. It is seen in the figure that the peak of Cerenkov pulse lies always above the shower maximum. 3.2. Lateral distribution In fig.3, the lateral distributions of Cerenkov light from EAS of |* primary are shown with the other authors, which are corrected for the wavelength region to 7,000 A ~ 7,000 i.
Although the spatial distribution of «lectrons in EAS is neglected, the calculated lateral distribution of Cerenkov light initiated by f primary Figure is reasonably in agreement to the others up to short distance(~ 100 a) Fig.* shows the lateral distribution of Cerenkov light initiated by protons of various energies with three different multiplicity models of nuclear interaction. The lateral distribution is flatter for the high multiplicity model as is seen in the figure. J. "ishimura/5/ calculated the lateral distribution of Cerenkov light from EAS initiated by X- primaries of various energies and concluded 'crossing point', the core distance where the photon intensity is proportional to the traeklength of'Shower electrons, which is, in Principe, a sole function of primary energy» In our calculation, the 'crossing point' means the location where the photon intensity is almost Independent on the model of nuclear interaction. In "'ig.'f the lateral distributions of Cerenkov light are shown for different multiplicity laws, and for different energies. km is seen from the figure, the 'oroasing point* varies with energies. The energy dependence of 'crossing point
i d * i d * TMEIMC)
She pulse waveforas of cereakov light from SA.S of incident angle В=0* at various distances froa the core.
h end shown in Fig.5. - As is шева
OeUNCE WOM THE СОНЕ ( m l
figure . The lateral distribution of cerenkov light
— г — Ivou E A S ini*l»ted by Г primary. is°rearfrom"figure o t h* r »u*h,f '• rea4lts are corrected the wavelength region
to 3,v00 I »v ?,000 J

311 froB the fogure, 'crossing point' varies with primary energies. Fig. 6 ahowa the. lateral distribution of Cerenkov light intensity of the ahower wit» aise 5«107 at sea level. The experimental data of Takutsk/11/ can be fitted only with tha curve of proton primary with multiplicity law, *t«C Si4. If we take account of tha fluctuation of longitudinal developeaent, the calculated photon intensities in Fig.6 go down to the smaller values. Therefore the experimental data are-much in favour of the high multiplicity model. 3.3. The full width at half МДД*"" °f Cerenkov light pulse" An experiment to observe the Cerenkov light from iftS at large distances from the core was carried out from December 1973 to January 197* at the ecntbern part of the Ixu peniaura •bout 200 Km to the south of Tokyo. The observation telescope consist» of large area Fraanal lenae (4 a in diameter, transmissible wavelength is longer than 4,000 A) inclined to the senith angle of 30' and 42 photomultipliera sat at the focal plane of lens. Each photomultiplier baa the saae field of view (l.S«l#.8% The overall field of view ia 10.&20* as presented in /13/. The integration time of the circuit is 0.5.S . and the Cerenkov light pulses displayed on the cathode ray tubes were photographed on the films. As no shower array was arranged besides the Cerenkov telescope, we have no other information on EAS
I 1 s,0
I г Ь°5 1 5 I
1 ' i • — " * i
\ v | 1
i . 1
i \ ; ;
i * * 4 - * ^ -i i ~ ~ — ; I , ., I . . ! . .
DISTANCE BiOM THE COHEOnl
Figure <•. The lateral distribution of cerenkov light from EAS initiated by f and proton primaries. The wavelength region is 3,000 A ~ 7,COO I.
e«o"
к / 5 U P DISTANCE ПОМ TIC COKE (m)
Figure 5. The 'cross point' for various primary energies.
figure 6. The lateral distribution of cerenkov light from EAS at the shower size *f 5«10'.

312 except the data -from the telescope^ Accordingly it was not ao eaay to determine the distance from the core and the incident angle of EAS. However, we can estimate the perpendicular distance H to. th*.*bsmr axis by the relationship betwee* the delay times of Cerenkov pulses and the opening angles of photomulttpliers as shown in Fie;.7.
At, tan( ii±±fi *> where а Ц delay time of the signal
of nth photomultiplier from the first one,
В ; perpendicular distance to the shower axie,
С i light velocity 0, ; angle of Cerenfcov light
to the first deflect photoaultiplier,
Atn i angle of nth photomultiplier signal from the first one.
for small 0« and »#„, st»i= approximately given by a function of only К and»» , •
At. - • я * * .
•nn tereacope
Figure7. geometrical relation between the telescope and the EAS
The uncertainty in the estimation of the distance is less than+500 m. The incident angle was eatimated by its correlation wit» the deflectiea.aacl* emresasasm to the roaitiem of Oereakov ligm»( . am sbema ia tig.Z), 9km-deflection angles are almost constant (less than 30 ) for the average showers of energies, 10* eV to 10w eV in our calculation. For the observation time of 103 hours, 27 distant showers were observed. The absolute intensities were calculated with the photon intensity of glass Cerenkov light produced by relastivistic cosmic rays. The primary energies of observed showers are distributed among the energy of 10lb eV and 10'» eV. Fig.8 shows the full width at half maximum of Cerenkov light pulses of 27 events normalized to the primary energy! а^Ю'^еУ, aad the laaident angle to в «0*, for three different shower curves. In the figure, «t neans the integration time of the recording system. Although the ambiguity in the estimation of the distance is very large, the greater part of
i | K T -Й Ul U
& ы -I
1
Ee*10,7tV
i OflFORD * t ( H 9 )
J KALMYKOV et &m
*ls40r« ,*'
3 Юг Ю5 "• DISrANCE FROM IH£ CORE(m)
Figure 6. The full width at half maximum of cereakov light pulse expected from various shower developements (Е.жМ^еУ). Our experimental data С ' • ' ) are normalised to the shower of energy B.«104sV and senith angle 6»0 .

313 the events have a tendency to indicate more narrow pulse width than the expected onaa. It means that the events ага in favour of the high multiplicity modal in nuclear interaction. ii Acknowledgement. We »r* thankful for the ataff of computer center of Institute for Nuclear Study, Unireraity of Tokyo for permitting u* to use the computer for many hour*.
References 1) It. J. Frotheroe at al, Froc. 14th Int. Con. oa Coamio Baye, 8 3008
(1975). 2) X. J. Orford at al, Pre. 14th Int. Con. on Cosmic Bays, 8 3014(1975). 3) Ж. ». Kalmykov at al, Proe. 14th Int. Con. on Cosmic Kaya, 8 3034
(1975). 4) X. ureiaen, Progr. in Cosmic Bay Phya., 3(1956). 5) J. Ximhimura, Proc. 14th Int. Con. on Cosmic Rays, 12 4379(1975). 6) V. I. Zatsepln, SoTiet Pbya. JEIP 20 459(1965) 7) M. H. Dyakoaov at al, Proc. I4tb Int. Con. on Cosmic Ray»,'12 4339(
X975). 8) V. V. Gushavia at al, Proe. 14th Int. Con. on Cosmic Bays, 8 3024(10-
75). 9) K. J. Orford at al. Proa. 14th Int. Con. on Cosmic Rays, 3019(1975). 10) H. H. KalmykoT at al, JK'iP Lett. 21 50СХЭ75). 11) H. K. DyaJconor et al, Proc. 13th Int. Con. on Cosmic ray, 4 2389(1
973) 12) С W. Allen, Astrophysieal quantitiea(196»). 13) T.Bara et al, Annual Report .of Institute for Jtaelear Study,Univ.
of **yeU9W> 77. 14) H. Mesael and О. Г. Crawford, Electron-Photon Shower Disrtioution
function Tables for Lead, Copper and Air Absorbers(1975).

314 SO EAS OBSERVATIONS RULE OUT FEYNMAH SCALING?
Т. к. Gaiaaar Bartol Research Foundation of The Franklin Institute
Unlvarelty of Delaware Newark, Dalavara 19711
Я. J. Protheroe and K. I. Turvar Department of Phyalca, University of Durhaa
Durham DH1 3LE, United Klngdoa
Abitract. It is now wall known that certain obaerved feature» of EAS are inconsistent with Feynaan acaling froa accelerator data around 1000 GaV If the prlaary coaaic ray» above lO*5 eV are aoatly proton». On the other hand, the aaauaptian of iron primaries plu» scaling gives a satisfactory account of many average characterlatlca of EAS. »
In thla paper we report the raaulta of a consistent set of computer elaulatione aade for a wide range of EAS data in the energy range 10 1 5-10 1 8 eV.'
1. Introduction. Is racant year» thara have been many testa made of the validity of scaling at the.highest energiea (* 10 1 5 eV) on the baala of EAS data. The conclusions, based sometlmee on an assessment of data from a limited set of experiments! have varied from the suggeeted rejection of acaling [Kalmykov and Xhrletianean (1975), Olejnloaak, at al. (1977)], the auggaation that scaling may be applicable if the primary particlaa are heavy iGaiaaer (1974a), Turver (1974)3, or that the primaries must hava aass numbers in excese of 200 if scaling ia valid Olejnicaak, at al. (1977)).
In an attempt to clarify the situation, we report here the reaulta of. a conalatent set of coaputer simulation» made for a broad range of data at anergiea of 10 1 5-10 1 B eV,
2. The simulation. The computation follows broadly the pattern established in our earlier work [see Gaiaaer (1974b) and Dixon et al. (1974)] and coaprisas four aectiona. Firstly, we consider the generation by the hadron cascade of the energy spectrum of plons produced at various depths in ths atmosphere. Hext the high energy (>56 GaV) electron-photon caacade ia followed ia ona diaanalon using caacada theory under Approxiaation A. Thla In turn is followed by a calculation of the electron photon caacade and Cerenkov light baaed upon detailed Monte Carlo caacalaa (using the schema first suggested by lutcher and Meeaal (I960)). Conaidaration la taken of the absorption of the Cerenkov light In the atmosphere together with the apactral and temporal response of typical detectors [sea Hammond at al.(1977)J. The auon component ia derived froa a detailed Monte Carlo calculation which has been described by Turver (1975).
We hava uaed production cross ssction»F„ c and F c c

3IS
baaed upon ttiosa given by Gaisaer (1974b) whara.
IT f **•» . 2 . / a . b F.b " oT-T J E75— d»i " a "ТЗ—
inal ' d p d p ia tha Invariant croaa «action for С ha process a + air nucleua •* b + anything. Ко diatinctlon ia mada batwaan piona and kaona (which ara included in tha production croaa aactiona for piona) , and F-c.o * n d 'wiro * T* aaauaad to ba half of I . c and *ы_с respectively.
Tha breakup of tha haavy primary nuclal ara traatad aa deacrlbad by Dixon, Turvar and Vaddington (1974.) axcapt that tha proportion of nucleone interacting in tha fragmentation of th* haavy nuclaua la now based upon aeasureaente by Tomaazawaki and Hdowcyzk (197S).
A datailad daacrlption of tha aodal and aiaulation procedure will be given alaawhere iGaiaaar, Protheroe and Turver (1977)J. 3. Reaulta. Tha data with which wa have coapared our prediction» fall into three broad catagoriea:
(1) Tha* bulk propartiea of EAS typified by the often-quoted measures of alactron caacada development (influenced auch by the reaulta froa the Chacaltaya axperiaent) and the auon/ electron number relationship (frequently reported by Khietlan-aen and colleagues).
(ii) The specific aspects of EAS of energy 10 1 7-10 1 8 eV studied in the detailed aeaaureaenta at the Haverah Park experiment uaing varloua auon and deep water detectora.
(ill) The recent aeaauraaenta of the average characteristics of Cerankov radiation in EAS.
A selection of graphical coapariaons of our sinulatloo results and data are given in figurea 1-9. In each caaa the aiaulatlona have been mada to avoid tha need for normalisation (e.g. the auon meaeuremente at Haverah Park are in shower a of specified ground paraaetar p(500) which haa alao been calculated
4. Diacuaalon. On tha basis of the data in figuraa 1-9, we agree with' the many earlier rejections of an extrapolation of pure acallng on aany counts if tha prlaary particlaa are protone. We find that many aapecta of EAS (particularly tha a-Y coaponant and tha closely related Carenkov radiation data (aae figurea 1, 8 and 9) aay ba adequately accounted for by a acaling aodel if tha priaariea are iron nuclei.
The depth of maxima shown in figura 1 ara takan froa the shower developaant curves obtained by LaPoints et al. (1968) ualng tha method of conatant intensity cuta. As shown by Gaiasar and Hlllas (1977) tha aaxlaua of Hc obtained in tha

t
316
1 « <л Ь т
W 1 « » , Г • w
•
^
*
и>
* > ^ • ^ J C i i i '
* J* /"
^r^1
« KALKrtCV ««Ml KHMMIMOEH М 7 Я
rf •
т м ш а м

317
•9МС ONTAMCC Iml
•г
г 1 1 , 1
rf
1 >p& ' \
•МИМа^Ч • Oi«*aVI \
\ \
- К Л -
\ \ -|Ы|И>С«а1|Шя\ -J L 1 . ,. Л..1
»• wW^-ana> l a M W I at al III»)
СМСОЖШКЕМ
• И * fcr*l
«У rf* »" пиши» миму iiv)

318 presence of fluctuations is loievhit higher In th* atmosphere than the maximum of IT. Since the calculation in figure 1 represents If, whereas the data is- obtained froa N.ut, this will tend to reduce the discrepancy shown in figure 1 (by perhaps 20 ga/ca2).
Olejnicxak at al. (1977) have calculated a value for the effective atomic u n A«ff f r o " a depth of maximum vs.-E0 plot by eetiaatlng what atomic mass is needed to bring their calculated depth of aax up to the observed depth of maximum. They find a lower Halt of A-200. Such a calculation, however, involves exponentiating all the uncertainty Involved in obtaining an estiaate of depth of maximum from the data. This can be seen by noting that the calculated value of ym*x for a nucleus of mass A Is approximately givan by Увах " С + Bin (E0/A). Then Aeff is obtained by requiring y B a x (calculated)- yaax (observed);
C-y (observed) , i.e. A e f f « Io exp I B J, where В -ч 37 ga/ca . We therefore conaldar that there is no significant inconsistency between the Chacaltaya data iLaFolnta, et al., 1968] and the prediction for scaling and iron primaries.
The representation of the muon component (and the u/e ratio) by euch a model-is, however, lees satisfactory, although not necessarily fully unacceptable. The fit of our simulation results to the u/e aeasureaents is considerably closer than that of earlier simulations but still shows the discrepancy in slope for the My-He P l o t noted by Vernov et al. (1976).
He note that the acceptance of the validity of a acaling model with iron primaries falls to account for the long established inseneltivity to primary energy of the shape of the Uevereh Park deep water detector lateral distribution function (see figure 6). Furthermore, such a model would lead to values for the assigned energies for showers recorded at Baverah Park which are 2-3 tiaes greater than customarily assigned (see figure 7).
We consider the aost likely aodel to provide all-arouna representation of the data would be one in which scaling was valid in the fragaentatlon region (thus ensuring the continued , good fit of e-v end Cerenkov light data), but with an enhancement of partlcla production occurring in the central region, giving a aora populous low energy auon component. Such a aodel has been investigated by us and ths results will be reported [Galsser, Prothereе and Turver (1977)]. Prallalnary results indicate that good all-around representation of observational data is possible but a requlreaent for a heavy priaary still exists.
We hsve not considered the existing measurements of fluctuations In IAS here. We note that a suggestion that good agraeaent with data follows for a scaling aodel with iron primaries aay be tested against the fluctuation data froa experl-

319 aents nov In operation late e.g. Tur'ver (1975), Appleby at al. (1977), Hammond at al. Ц977) and Bergeson et al. tl975)J.
Ref«rancaa Appleby, K.P. et al., (1977), this conference. Bergeaon, B. at al.', (1975), Proc. 14th International Coaaic Ray
Conference (Munich) jJ, 3059 and 3064 and 9_, 3397. Butcher, A.M. and H. Messel (I960), Nucl. Fhya. B20, 15. Dixon, H.E., et al., (1973), J. Fhya. A 7., 1010. Dixon, H.E., et al., (1974), Proc. Roy. Soc. A339, 133. Dixon, H.E., K.I. Turver, and С Haddington (1974), Froc. Roy.
Soc. A 339, 155. -Earnahav, J.C., et al., (1973), J. Fhya. A 6, 1244. Edge, D.H., et al., (1973), Proc. 13th Int. Conf. on Cosmic Rays,
Denver, 4., 2513. Gaisser*, T.X. (1974a), Nature, _24_8, 122. Gaiaser, Т.К. (1974b), J. Franklin Institute 298, 271. Gaisaar, Т.К., R.J. Frotharoe and K.E. Turver (1977) to be
published. Gaisaer, Т.К. and A.M. Hills», (1977), EA88 this conference, Haaaond, R.T., et al. (1977), this conference. Kalaykov, N.N., and G.B. Khrlstianaen (1975), Proc 14th Int.
Conf. on Cosalc Raya, Munich, 8_, 2861 and JETF Letters 21, 315.
•Christiansen^ G.B., at al., (1971), Froc. 12th Int. Conf. on Coaaic Raya, Hobart, 6, 2097.
LaPointe, M., et al., (1968), Can. J. Phys. £6, S68. Olejniczak, J., J. Wdovczyk and A.W. Wolfendale, (1977), J. Phys.
(to ba published).
Strutt, R.B. (1J76), Ph.D. Thesis, Univ. of Nottingham.
Toaa'azevakl, A. and J. Wdowczyk, (1975), Froc. 14th Int. Conf. on Coaaic Raya 8_, 2899.
Turver, K.E., (1974), J. Fhya. G 1, 134.
Turver, K.E. (1975), Proc. 14th Int. Conf. on Coaaic Raya £, 2851.
Vernov, S.H., at «1., (1976) paper presented at the Sth European Coaaic Ray Syaposiua (Leeds).

320 VIOLATION OP THE HAORON INTERACTION CHARACTERISTICS
OBTAINED WITH ACCELERATORS IN THE SUPERHIGH-ENERGY RANGE PROM EAS DATA S.N. Vernov, G.B. Khrittianian. , A.T. Abroaimov, N.N. Kalmykov, G.V. KuLkov, V.L Solovieva , Yu.A, Fomin, B.A. Khrenov
Inatitute of Nuclear Physics, Moacow State Univeraity;Moac6w 117234, USSR.
ABSTRACT: It haa been shown that, if the scaling in the hadeon-hadron interaction» ia reacted at energies Е л, 2xlOl2 . v and x» 0.I7I within an accuracy of up to 10%, the extrapolation of the scaling to tha superhigh-energy range of 1015-10 1 7 eV reautta in a drastic contradiction to the experimental data on cosmic ray extensive air showers.
Tha fundamental accelerator studies of recent years have shown that in tha x > 0.1 region , tha inclusive pion and nucleon spectra are
invariant in the 30-2x l0 3 GeV energy range within a 10% accuracy. This makea if possible to suggest the concept of i.ie scaling of the hadron interactions in the superhigh energy range ДА On* the other hand, the quality of the EAS experimental data has been significantly improved. In connection with this we have again analyzed the experimental data obtained recently from the EAS array at the Moscow State University and from some other EAS arrays. The analysis was based on the comparison between the experimental data and the calculations in terms of the model using the accelerator data on the elementary event and their extrapolation to the suparhigh-energy range in conformity to the concept of scaling.
' The main assumptions of the scaling model used in the present „ work are: (1)~ the inelastic scattering path of nucleon in air is 82 g/cm at an energy of 1 TeV and decreases by 10% with increasing energy by an order;(2) the pion interaction path in air is 120 g/cm at 1 TeV and varies in the same way as the nucleon path; (3) the forms of the inclusive spectra of pion generation in the nucloon-nucleus and pion-nucleus interactions and the inclusive spectra for secondary nuclaona are tha same as in /2/, • inclusive spectrum for #"° -mesons was taken to be 1/2 of the Xi -inclusive spectrum.
Tha experimental data discussed below were obtained when studying EAS with fixed electron number /Ve and, therefore, the fluctuations of the various shower components at a fixed Е were taken into account . It i s of importance to emphasize that the EAB characteristics of Interest to us can be calculated using only the data on the mean characteristics of the elementary event.-
Pig. 1 presents the results of the calculations of , /r> (> 10 GeV) in EAS with fixed size Afe for Ыд varying within 10 -10 carried out in terms of the scaling model on the assump;ion of pure proton composition of the primary cosmic rays. Additional calculations were used to verify the sensitivity of the calculations to the assumptions concerning the Inclusive spectrum and showed that, for example, a 1.5-fold increase in the multiplicity of secondaries due to variations in the inclusive spectra at small X resulted, at given N in a increase of lift by not mora than 20%. Tha replacement of the inclusive spectrum for the Jfp interactions by the spectrum for tht pp . interactions (including the corresponding inelasticy coefficient )aiso fails to change the results within a 10-20% accuracy . Moreover, the use the now most accurate approximation of tha inclusive spectrum for the pp-interactions /4/ and

321
the inclusive spectrum Cor the 31 -p-interactiona including the diffraction generation /5/ results in a 5-10% change of the шоп content as compared with the initial version of the calculations.
The experimental muon number is 5 times the calculated value at Afe _ 105 and 10 times at N e • 10'. Thus, both the absolute values
and the shape of the dependence И/ч(^е) disagree. According to experiment •»„ .,0.78*0.01 . .. , , . . . . . _, . , 0.60
Nfl ~ Ng , whereas the calculated N ft " /re "•"" Pig. 2. presents, the experimental data on the Б AS muon energy
spectrum at N - 10 obtained with the magnetic spectrometer of the array of the Moscow State University. The figure also presents the data calculated in terms of the scaling model . Thus, the disagreement between the calculations and experiment for the absolute muon number observed at sv 10 GeV also persists for the higher-energy muons ( -v 100 GeV).
Pig. 3 shows the results of the calculations cf the ;• 1 TeV hadron number in Б AS with size N - 105-107 at mountains and the experimental data from / 6,7,8,9 / .
It can be шлеп from Pig. 3 that the theoretical hadron number is 3-5 times the experimental values. The shape of the theoretical depend e n c e Ыц ~ Afg* is such that <A < 1 and is 0,90+0.03 .
It is also of interest to compare the calculations with the experimental data reflecting the longitudinal development of the Е AS electron component in the atmosphere. The results of the new study of the shape of the В AS Cerenkov Dulse at ~ 300 m from CAS axis and in EAS with sizes of 10'-108 may be used as such experimental data. The study was proposed and substantiated in /10/ and carried out with the Yaku tak Б AS array .
Pig. 4 presents the data / l l / on the dependence of the mean duration ( half-width) of EAE Cerenkov pulse on the distance from the shower axis. It can be seen that the calculations predict a high value of the mean duration of the pulse and a more pronounced dependence of this value on the distance to the shower axis. It will be also noted that the contradiction between the calculations and the experimental data for the mean cascade curve obtained by the Chakaltaya group (Bolivia) was already noted in /2,12/. However, the experimental data of the Chakaltaya group are still being discussed .
It was shown above that the experimental data on the muon and hadron EAS component were drastically at variance with the scaling model on the assumption of БАБ generation by primary protons. To answer the question whether this contradiction can be eliminated by changing over to heavy nuclei, it is of importance to know the mode of primary nucleus interactions with air atom nuclei . Thorough experimental studies of the problem give no indication of wry significant importance of the collective interactions of the nucleus nucleons . The studies have shown that the multiplicity of secondaries is a weak function of A (as AO.12, and is at «11 independent cf A in the fragmentation region ). The dependence of the various EAS characteristics on the value of A of the primary nucleus was treated in /13,14/ in terms of the model described above • Por a very rough approximation of total fragmentation of nucleus at the atmospheric boundary, EAS from nucleus A is A showers from protons with energies Eo/A . Therefore, Ыя ~ Й (£0/ ft)
and the resultant value is Afo = Й Np) б/?/*д = (<Spf^/>)jЯ

322 A more thorough inclusion of fragmentation somewhat changes
the above presented relations without affecting their essence . As a result the A dependence of both the mean EAS particle number «and the RMS error proves to be weaker than in the superposition model • Therefore, the variations of the mean EAS characteristics in case of transition from primary protons to nuclei will be maximum for the superposition model.
It follows from the above presented expression that, for example , in terms of the scaling model at ^.jif/aCg - 0.6х the. EAS muon number at N - 10 s may be obtained as corresponding to the experimental data subject lo A • 56 , Such value of A for the superhigh-energy primary cosmic rays is, however, drastically at variance with the data on fluctuations in M/v _at given Л'е . According to the sea-level experiment /3/ > _ <SftJЛ>/ - 0.5 * 0.05 in the studied range of //e » 105-10 , whereas in the scaling model С5>//Л « 0.2 even for protons .
In view of a fairly strong dependence of *A* on A ( N ^ A ' ), the experimental data for the fluctuations in Hf» may be satisfied by assuming a mixed composition of primary cosmic rays; In this case , however, it proves impossible to satisfy the data on the absolute muon number in the showers with given He • The next experimental fact that cannot be satisfied assuming only the heavy nuclei of primary cosmic rays is the dependence Ы/ч(Ые) . То reach an agreement between the scaling model giving <*-/t/dLe - 0.6 and the experimental value 0.78+0.01 , it is .necessary to assume that A increases by about an order as the primary energy increases from eV, which is of low probability in itself . Besides that, even on such assumption it is impossible to eliminate the contradiction between the scaling model and experimental data on the EAS hadron component (see Rig. 3) since
oLu/Ае < 1 and, as A increases , the disagreement between the experimental and calculated data on the hadron components fails in any case to decrease V
According to the accelerator data, the scaling is valid for most of the secondary particles (pions). The question arises if the observed disagreement between the experiment and the calculations is associated with the disregard of probably ever increasing importance of the nuc-leon-antinucleon pairs as the hadron energy increases . Such< anaiyr » was carried out in /15/ where the sensitivity of the muon energy spectrum in the ratio 1 - /г/Р/ЗТ was studied. The spectrum varies considerably (toy a factor of 2-3) in the muon energy range £ 10 GeV and by only tens of percent in the range ~ 100 GeV . Thus, the experimental data on the absolute muon num
ber (in any case with energies ~ 100 GeV) cannot be coordinated with the calculations even on the assumption that 1 increases up to 0.4» Another possibility of the violation of the scaling can be, at the first glance, associated with a more pronounced increase of the cro.s section of the hadron inelastic interactions with increasing the hadron nnergy
°t*, " • / ' , * * are the exponents characterizing the depond*nc0 of the electron , muon and hadron numbers respectively on the primary energy .
XX'our calculations show that the scaling is violated mainly for the ion-nucleus events since 90% of the hadron-and - muon producing events are , the pion interactions.

323
than it folio»* from the extrapolation of the accelerator data and/or with the increase in the mean inelasticy coefficient К of the leading nucleon . The estimates have shown that such a significant increase of the cross section of inelastic scattering of nucleons and plans ( ~ Йч г E) i s required to reach an agreement between the scaling model and experiment that it would be explicitly at variance with the data for the single cosmic ray component . The calculations of the effect of К on the muon content have shown that, as К increases from 0.5 to 1 for the particles with energies above 2 x 10 eV, the value of the muon content is still 3 times below the experimental value .
Therefore, other possibilities of violation of the scaling should be applied, tor example to variations in the pion spectrum, the secondary particle multiplicity , and its dependence on energy. Pigs 1,3,4 show the results of the corresponding calculations of the CKP-type models ( curve l ) and high-multiplicity model (HMM). It i s assumed in the models that the hadron interactions up to 2x10*2 eV conform the scaling model. At higher energies, the CKP model holds (or which the pion multiplicity hjf - 2Б'* ( Е is expressed in GeV) and the energy spectrum in the laboratory system is described by the expression
It was assumed in HMM that, from energies of 2 x Ю1,*. eV, the с CKP model i s replaced by the model with multiplicity ЛЯ^-Е'1 . It can be seen from Pigs 1 and 3 thai the above mentioned models make it possible to obtain an agreement with the experimental data for the electron and muon components; the disagreement for hadrons, however, still increases. Taking into account that the scaling is probably violated in the « 1 3 - 1 0 1 S eV range to which the unitary limit energy belongs, the effect of more exotical possibilities of the scaling violation should be examined, namely the violation of the charge invariance and the direct or £»ct (through new particles) production of leptons ( J4, Sj $ ) . When the change invariance is violated in favour of ЗГ" - mesons, the EA£ electron number increases at given primary energy and therefore, though the calculated hadron content In EAS approaches the experimental value (decreases) , the muon content is more and more at variance with experiments (since it also decreases) . An inverse pattern will be probably observed in case of the violation of the charge invariance in favour ..of Я 1 - mesons. Thus, the violation of the charge invariance cannot improve the agreement between the calculations and experiments. The fast generation of leptons is another matter . Such generation may result in an Increase of the hadron content due to a decrease of the number of pions generated in the elementary act In this case the EAS electron number may be invariable since, despite the decrease in the
•Я" - meson number, Q* + e~ are generated .
REFERENCES; 1. R. Peynman, Phys.Rev.Lett 23, 1415,1969 . 2. N.N. Kalmykov, G.B. Kbristlansen . Pis' ma ZhETF, 21,666,1975. . 3. S.N. Vernov, G.B. Khristiansen, A.T. Abroaimov et aL Canad.J. Phys.
«6 , S197 , 1966 . 4. G.D. Badhwar, S.A. Stephens, R.b. Golden, Proc. 14th IntConf.
Cosmic Rays, MUnchen, 6, 2077, 1975 . 5. A.M. Dunaevsky, A.V. Uryson. Preprint No.150, PI AN, Moscow, 1975. 6. S. Miyake et aL Acta Phys. Hunger. SuppL 3,463 ,1970.-7. R. Vatcha, B.J. Snekantan , J.Phy». A . 6 , 1050, 1973. 0. Ri Von Staa, B. Aschenbach , Bohm E. et aL Proc. 13th Int. Conf.

324
Cosmic Rays, Denver. 4 , 2676, 1973 . 9. R.A, Nymmik. Thesis , Moscow Stat* Univ. 1970 . 10. Yu.A. Pomin, G.8. Khristiansen. Sov. NucL Phys. 14,642, 1971. 11. N.R Kalmyk*. Khristianssn G.B. at aL Proc 14th Inter.Conf.
Cosmic Rays, MUnchsn ,6, 3034 ,1975 . 12. P.M. Fishbane, Т.К. Oaisser, R.H, Maurer at aL
Phys. Rev. D, 9 , 3083 ,1974 . 13. N.N. Kalmykov , G.V. Kulikov, Izv.Akad.Nauk SESR, sar.fis.38,
1024 , 1974 . 14. H.E. Dixon , K.E. Turver , C.J. Waddington , Proc.Roy.Soc.
339 , 157 , 1974 . 15. P. Griadar . Proc. 13 th Inter. Conf. Cosmic Rays, Denver,
4 , 2467, 1973 .
NM(>£)
N. «J T o 1 To4 Jo7 «F HF~
Figf Pip. 2
Pig. 1 . The > 10 GreV muon number as a (unction ot Б AS sice at sea level: - the scaling model 1 - CKP model , 2 -HMM , • - experimental data from the array of the Moscow State University.
Pig. 2. The muon energy spectrum at aaa level ( " е - Ю6) — -the scaling model, е - the experimental data from the array of the Moscow State University .
# / П

325
т
юо
to
60
40
Т. плес
Fig. 5 МО 400 *0р в;
FiaA
Pig. 3 . Tha > 1 T#V hadron number a s a function of Е AS siza at mountains: — — tha scaling modal for primary
protons and iron nuclei i 1 - CKP modal ; 2 - HMM; tha experimental data; • - /б/ , * - /7/ • - /в/ • - /9/ .
Fig. 4 . Tha Е AS Cerenkov pulse duraiion aa a function of the distance to the shower axis. — - the scaling modal, l - CKP modal , 2 - HMM, a - the experimental data from the Yakutsk array .

326
SCALING AND ITS BREAKDOWN AT VERY HIGH ENERGIES
Peter K. F. Grieder
Physikalisches Institut, University of Bern, Switzerland
Abstract: The scaling model has been worked out in the form of a very detailed, pure monte carlo type computer program. All relevant constraints have been built in, such as the leading .particle effect, logarithmic energy dependence of the average multiplicity, poissonian distribution for the actual multiplicity and a plateau-like distribution of (he secondaries, on the average, over the available rapidity interval. The model has been tested extensively at fixed energies, ranging from lOGeV to 10* GeV, before incorporation into an entire shower simulation program.
1. Introduction. It has been shown by several authors in the past that the scaling model (1) encounters serious difficulties if applied to air shower s i mulation calculations that cover an adequately large energy range (2-4). , Others have pointed out that in some cases the scaling model cannot yet be ruled out completely even for very large energies (5), or in particular cases (6).
The work which is presented here is a preliminary account of a new approach to study and analyze the scaling model in all its implications for air shower particle spectra and distributions, in an attempt to answer the still pending question concerning the validity of this model well above present-day accelerator energies.
We have shown recently in a very detailed report (7) that the two-component cluster model, i. e . , the fragmentation and pionization model, in conjunction with simulation calculations yields particle spectra and distributions that are in excellent agreement with experimental air' shower data. It has also been pointed out in this context that the basic frame, the so-called superstructure of a simulation calculation that includes the propagation properties of the( different shower constituents, i. e . , all the well known processes, such as the competition between interaction and decay for pions and kaons. elastic nuclear scattering of hadrons, ionization losses for charged particles, coulomb scattering of muons, and other aspects,are of great importance. They affect the results of the calculations significantly and must be accounted for properly. We have therefore taken the identical basic frame for the computer program of the scaling model calculation as for the earlier calculations, where we have used the two-component cluster model, in order to insure the most realistic and unbiased comparison, exchanging only the particle production part.
The latter has to satisfy all conditions imposed by the scaling model, togeth-

327
er with a number of other, auxiliary requirements, that have hardly ever been met before in a previous scaling model shower simulation. These can be summarized as follows: Logarithmic energy dependence of the average secondary particle multiplicity, poiasonian distribution of the actual multiplicity at any energy, a flat plateau-like rapidity distribution for the secondary pions emerging from an interaction, a leading particle effect that is well pronounced for nucleon initiated interactions and rather weak for pion initiated collisions, full energy and momentum conservation not only on the average but in each individual interaction, accounting also for the transverse motion and rest mass energy of all particles involved.
It is evident that all of "these requirements can only be met simultaneously with an elaborate and time consuming phase space calculation, unless we relax on some of the constraints outlined above. There are several ways in which one can approach the problem outlined above. For instance, one can handle first the leading particle effect of an interaction and subsequently the mutliparticle production process, or, vice versa. We have chosen both approaches for reasons of comparison and to study the effects of various constraints on particle spectra and distributions.
Another important aspect is the production of nucleon-antinucleon pairs in high energy hadronic collisions. We have advocated for a long time the great importance of this process for the development of an air shower. It i s significant for energetic, kinematic and propagational reasons, and we have been among the first to include it in simulation calculations (8,9). However, because of the considerable complications which the introduction and correct handling of nucleon-antinucleon production presents in general, and particularly within the frame of this analysis, we have disregarded this process as well as kaon production in our first calculations, presented here. It will be introduced in our future work in a similar way as we have done it in our cluster model calculations. The present calculations in conjunction with our future work will show to what extent nucleon-antinucleon production influences air shower spectra within the frame of the scaling model.
2. Calculations and Results. It is beyond the scope of this paper to discuss the details of our calculations at great length. However, we include two figures to illustrate that our model and method of calculation satisfy all relevant requirements imposed by the scaling model. In addition we consider the leading particle effect. Figure 1 show* the multiplicity distributions for pp- interactions at eleven different energies, ranging from 10 GeV to 10* GeV in the laboratory. The poissonian character of the distributions is evident for the low energy, low multiplicity data (10 and 30 GeV). A flat distribution has been used to compute the momenta of the leading particles in this case. For pion-proton collisions the momenta of the leading pions were calculated from an exponential spectrum.
Figure 2 shows the rapidity distribution for secondary pions emerging from the same 10* GeV sample of proton-proton collisions, whose multiplicity distribution is illustrated in figure 1. The two initial protons (target and

328
projectile) are located at almost exactly five unite of rapidity from either side of the origin. The theoretical limit for piona ia at ± 6. 9 unitt of rapidity. The flat plateau-like character of the distribution ia obvioua.
Figure 1: Multiplicity diatri- Figure 2: Rapidity distribution buttons for pp-intsrections and of piona for 10* GeV pp-inter-sceling model- actions and scaling model•
The first set of calculations carried out with the scaling model version has been made for a primary energy of 10 GeV and includes logarithmically rising cross sections. The rate of rise haa been chosen such thta the cross sections are 50 percent larger at 10* GeV than at 500 GeV. This gives an increase of about 16. 5 percent at 10* GeV and 33 percent at 10* GeV. Constant cross sections were used up to 500 GeV. The vary low primary energy has been taken for reasons of comparison with other models. The scaling model.like all other models, is fitted to accelerator and ISR data. All acceptable model* must yield the same multiplicities and kinematic features Up to a few thousand GeV. if properly adapted. Thus, wa expect that a simulation with the scaling model will produce very similar shower spectra and distributions for very low primary energise as our cluster models. It is only the first and some of the second generation interactions that take place at sufficiently high ene.gies to produce slightly lower average multiplicities,at comparative energies. Consequently we do not yet expect to observe major difference*. Neither are we expecting a large effect from ignoring nulceon-antinucleon production at these energies.
The results of these calculations are shown in figures 3 and 4. The difference between the two sets of calculations is that in the first caee (fig. 3) the lead-

32»
ing particle effect has first been calculated and subsequently the multiparti-cle process. In the second case (fig. 4) the interaction processes have been treated in the opposite sequence. Thus, in the second approach the scaling aspects have priority, i . e . , the multiplicity and rapidity distributions. Target and projectile share then the remaining energy in such a way as to conserve the total momentum of the interaction. Thus, the leading particle effect is to tome degree attenuated. Nucleons are more affected than piont because of the form of the retpective epectra.
»' ^
in
£ i h
""•>ч \ \M \
I \
1 T X \
\ \ V \ \ \
ENERGY [G*v] ENERGY [G»v]
Figure 3: Energy spectra for 10 GeV proton Initiated showers anc* scaling model. Leading particle has preferential treatment.
Figure 4: Ensrgy spectra for 10 GeV proton initiated showers and scaling model. Leadiпя peniclc has lower priority.
The overall effect is evident when comparing corresponding spectra of figures 3 and 4. The reason for the drop of the hadron spectrum (NAP) in figure 3 is because the leader is energetically favored. Less energy is available for the secondaries that, nevertheless, still satisfy the essential criteria of the scaling model. The leading particle effect it not much emphasised in the nucleon spectrum (N) at sea level, at the low primary energy considered here. It is almost lost within the tail of the recoil spectrum, except for the hump around 10 GeV, that is absent in figure 4. (A primary nucleon undergoing 12 average collisions on its way through the atmosphere, down to tea level, each having an elasticity of 0.4, would be attenuated by a factor of approximately 10 ). The larger extension of the nucleon spectrum in this figure, beyond 100 CeV, is statistically insignificant. It is due to a
\

330
lone aurviving proton having an energy of 200 GeV. The average muon content par ahower ia larger for thoae calculation» where the leading particle play» a mora dominating role (fig. 3). Thia ia a conaequence of kinematic». Both «ample» include twenty aimulated ahoweri.
A detailed comperiaon with the re-aulta from calculation» with other model» (not preiented here) «how» that the apectra of hadrona and muona obtained with the acaling model have a leaaer alopa, particularly at higher energiei, even for very «mail aaow-er». If the affect of riaing croaa aec-tion» would have been diaregarded, the apectra would be even flatter be - _ cauae of th* «lower energy degrada- !£ Ю tion. Above all the hadron «pectrum would lie well above the experimental data. i
ю-
> • '
^v» • N v V. V*4 • \ N
\ \
\
-
'V X 1
m
ю ю2 ю' ENERGY [Gtv]
Ю'
„6
Figure 5 ah'owa the energy apectra of hadrona and muon» for 10* GeV pro -ton initiated ahowara. uaing the aame appraoch aa diacuaaed for figure 4. Some experimental point» are indicated for comparison. Tha aroall and large aolid dot* and th* croaaee are for hadrona and were taken from the work» of Tanahaihi et al. (10), Baruch et al. (11) and Matano et al. (12). reapectively. The open circlea •how tha muon data from the work of Earnshaw at al. (13) and Chatter jae etal . (14). The diiagreament between theory and experiment ia evident. We «hould «tre«» tha fact that th* apparently loat leading particle at aaa level reappear» a* loon • • we are at elevated altitudaa. Ita preeence at aea level ia reitored for larger primary energiea. Other model» manifeat aimilar feature». Of cour»e, the form of the elaaticitiy diatribution play» an important role.
Figure 5: Energy «pectra for 10" GeV proton initiated ahower* and icallng model. Same model version aa uaed for figure 4.
3. Concludlna Ramarka. The acaling model aa we have worked it out for our calculation» reproduce» all major feature» of high energy hadronic interaction» aa wa know them, over the entire accelerator and ISR energy range*. It aatitfi** all requirement* impoaed upon it at any energy.
If applied to air «hower aimulation», the «caling model produce» particle •pectra that exhibit an increaeing disagreement with increasing primary energy. At 10 GeV the diecrepancie» are «till relatively «mall, for obviou»

331
reasons . However, already at a primary energy of 10* GeV the theoret ical spectra show appreciable difference» with reapect to experimental data. The muon number ia too low and the number of energet ic hadrona too large. Moreover, the predicted alope of the hadron apectrum beyond 1000 GeV ia much «mailer in compariaon to the experimental alope.
Thia work ia being continued. The electromagnetic component aa wel l aa n u -cleon-antinucleon production wi l l be included in the near future and the c a l culations wil l be extended to higher primary energ ies .
4. References .
1) R. P . Feynman: Phya. Rev. Lett. 23. 1415 (1969) and Third Internet. Conf. on High Energy Coll is ion», Stoney Brook, N. Y. 238, "(1969).
2) P. K. F . Grieder: Proc . ХШ. Internet. Cosmic Ray Conf. , Denver, 4, 2639 (1973).
3) J. N. Capdevielle e t al . : Proc . XIV. Internet. Coamic Ray Conf. r Munich, 8, 2930 (1975).
4) N . N . Kalmykov and G . B . Khristiansen: Proc . XIV. Internet. Cosmic Ray Conf., Munich 8, 2861 (1975).
5) K. E. Turver e t al . : Paper presented at the V. European Cosmic Ray Symposium, Leeds (1976).
6) A. Goned et al . : Nuovo Cimento Z9A. 117 (1975).
7) P. K . F . Grieder: Rev. del Nuovo Cimento 7, 1 (1977).
8) G. T. Murthy e t a l . : Can. J. Phya. 46, 147, 153 and 159 (1968).
9) P. K. F . Grieder: Acta Phye. Acad. Scient. Hung. 29, Suppl. 3, 563 and 569 (1970).
10 G. Tanahashi: J. Phya. Soc. Japan, 20, 883 (1965).
11 J. E. F . Baruch et al. : Proc . XIV. Internet Coamic Ray Conf., Munich, 8, 2949 (1975).
12) T. Matano et a l . : Acta Phy». Acad. Scient. Hung. 29, Suppl. 3, 451 (1970).
13) J . C . Eamshaw e t a l . : Can. J. Phy». 46, S 122 (1968).
14) B. K. Chattarjee e t al . : Can. J. Phy». 4£, S 13 (1968) .

332
INADEQUACY OF SCALING MODELS WITH EAS PROPERTIES AT 10 GEV
И-Р. BOUBDEAU, J-N. CAPDEVIELLE, J. PROCUREUR Laboratoira da Physique Theorique, Universite da Bordeaux I, Prance
Contradictions of "scaling modela" included in EAS aiaulatione *r* ascertained on several pointa x muon-electron ratio, aaxiaua depth, altitude variation of intensity at fixed size, electron absorption length at aea level and in altitude. Comparison with experimental remit» even in favourable circumstances (p-air energy rising cross-section, W-air energy rising cross-section, shorter electron radiation length in air, heavy nuclei priaaries) suggests hopeless agreement for lov multiplicity models in a large energy range.
I. INTRODUCTION During the last few years, the contradiction of acaling models with
cosmic air shower data at more than 15 degrees of rapidity haa been underlined by several authors (Wdowczyk and Wolfandale 1973, Gaiaser *t al. 1972). Those difficulties have been detailed mora recently, in several works taking into account recent accelerator raaulta. We extend hare the diacuaaion about eome conditions of re-establishment suggested in a precedent work (Capdevlelle at al. 1977) ! it had been shown that if the disagreement was reduced, even in the case of conjunction of these conditiona, the amplitude of this reduction was hopeless.
One condition was external to the interaction model, the reduction of the electron radiation length in air (from 37-7 to 2k.6 g.cm ) and ita conaequences in EAS development (Bourdeau et al. 1976).
The aecund was the hypothesis of an energy rising f-air cross-section.
Va shall examinate hare the hypotheais of an energy riaing p-air cross-aection combinated with the previous hypothesis. II. INTERACTION MODEL AND SIMULATION
The scaling model haa been obtainad by integration of the differential cross section versus transversa momentum and the energy distribution obtainad for sacondary particles is datailad elsewhere (Capdevielle et al. 1977). The multiplicity of charged secondaries has been taken as
< n;h > - 3.0» In s - 4.33 a > aoo 6eV2 < n . > • l.aj »°-3a5- a < aoo GOV As a modal of reference, wa have used the CKP modal. In the simula
tion all aecondarles were treated as pions. Tor simplicity of

333 calculation, only the forward cone li.is b«en assumed to participate to the successive collisions.
The different observables considered are the muon-electron ratio, the maximum depth, the electronic and hadronic absorption length at different levels, the variation of intensity with depth at fixed size, the ratio between number of particles and Maxima at sea level.
When heavy primaries are involved, the superposition model for nucleus-air interaction is assumed.
For p-air and ff-air energy cross section, the parametriasation (Yodh 1973)
в . « 2B0 + 2.5 (Log E/100) p-alr is usad (X_ , ж 3/2 X _.<_) »nd I» •!* other cases, for comparison X . and X_ , are fixed as usually to 80 and 120 g.cm~ . p—axr IF—air III. COMPARISON WITH EXPERIMENTAL DATA
The principle to research a better muon electron ratio in the case of scaling model is to use processes increasing the absorption of the cm. component s increaae of С . and o_ . (higher levels of ini-
p-air w-air tiation ror the different cascades), increase of inelasticity, reduction of cascade unit (radiation length t in air) or together increase the
о muon production efficiency and absorption for electron (heavy primaries with superposition).
The situation is shown in Fig.l with respect of the points of the H.S.U. group (Kristiansen 1973) in muon-alectron dependence (E >10 GeV) for U and the following auumptions (appearing the most efficient)
1. Scaling -f pure nucleons primaries (t » 37.7) 2. Scaling + riaing p-air cross-section + t * 34.6 3. Scaling + pure iron primaries * t » 37.7 4. CKP model • 37.7 + X l r - 80 g.cs"8.
At mountain altitude, the experimental points for muons of energies larger than tCr GeV »r* Tien-Shan measurements, corrected by us, from possible underestimation in sis* (EA-87) (Pig.2). New measurements are coming at very high'altitude from the Chacaltaya Brazil-Japan collaboration (Suga et al. this conference) giving evidence for an unexpected muon abundance at this altitude for a very large size range (fig.3). As our calculations are for muons of more than 1 .GeV, the experimental situation is estimated by us at this energy from actual measurements with Е > 600 MeV. The maximum depth Т - Щ х is also calculated (fig.4) and is consistent with previous works. The experimental points for the

334
Fla . l
*д .5 . » M .
f<s*

335
ftfjf'-*^
•Uy.S)
4(0
*д «Ов,.^-«
'в'
,•1
fe „' fag
«•
h
е,1м)

336
lowest sizes are the points recently revised (Olejnitchac et al. 1977). For the intensity variation with depth (fig.?) at fixed size (N = 10 particles), the experimental points are со timing from the work of Kris-tiansen et al. (1973)- Model dependence of the factor of conversion size primary energy (Xrasilnikov 1973) is also presented (fig.6) and the sensitivity of the absorption length (fig*7j&) for the electron compo-
-2 nent at sea level and 900 g;cm with experimental data taken in the work of Popova et al. (1975)* IV. DISCUSSION
If we consider the mean multiplicity model it is necessary to have in mind that only comparatively weak transformation could give at sea level a tolerable agreement with experimental data, but for conversion energy (it could be suggested that in this case, size could be underestimated by some bias in age parameter estimation and that experimental value would be lower)•
Even with conjunction of the most favourable conditions (rising energy cross section, reduced radiation length), the low multiplicity model is clearly ruled out in the assumption of a pure (or mainly) nucleon primary composition.
It appears particularly difficult to conserve agreement in altitude in the conjunction pure iron primaries + scaling* Prom other part, the variation of N versus N at sea level cannot be obtained on a large size range and the disagreement is increased with primary energy.: the age parameter would be more important for such composition, thus in larger contradiction with the Tien-Shan results (this is of course submitted to a possible revision of NK theory). Furthermore, the situation is hopeless, as It concerns muon-lectron ratio at 600 g.cm~ (even if in our calculation the backward cone contribution has been neglected). The general tendency is in favour of high multiplicity models wi'th dominant pionization, rising energy cross sections ; more refined calculations would be required for appreciation of the proportion of such tendency or to point out new processes in the interaction.

337 REFERENCES
Bourdaau M.F., J.N. Capdavielle and J. Procureur, 1976, J.Phye.f! j!,257. Capdevielle J.N., J. Procureur and K.F. Bourdeau, 1977, Nuov.Ci». 18,
469. Gaiaaer Т.К. at al., 1978, Phya.Latt. 42B. 444. Kraailnikov D.O. at al., 1973, 13th ICCR, Denver, 2384. Kriatianaen G.B. and N.N. Kalaykov, 1975, JBTP Lett. £1, 315.
Matano at al., 1973, 13th ICCR, Denver, 2683.
Olejnltchac, J. Wdowczyk and A.W. Wolfendale, 1977, J.Phya.G, In the preaa.
Popova L. at al., 1975, l4tn ICCR, Munich, 2528.
Suga K. et al., 1977, to be published in Phya.Rev.
Vdovczyk J. and A.W. Wolfendale, 1973, 13th ICCR, Denver, 2336.

338
«VALUATION OF THE РЩМЛК1Г Sl'BCTKUH TNDEX NEAR OF lO GeV BY THEORETICAL. ANALYSIS OF CENTRAL DENSITY FLUCTUATIONS
M.F. BOUP.DEAU, J . N . CAPPEVIELLE.' J . PfcOCUREUR Laboratoire de Physique Theorique, U n i v e r e i t e de Bordeaux, France
Theoretical Q Experimental Q Both [£J
By.a mixed Monte-Carlo analytic procedure, we have obtained the fluctuations of central electron density at fixed sis*.
The spectrum obtained can be described by a power law at densities larger than the soft probable density. This index is correlated with the index ot the ргХшлту spectrum.
An analysis of the hodoscope experiment of Kiel lead to an evaluation of this index near of 10° GeV.
Coordinates: БА 3.1 (Primaries and apectra)
Mailing address: j.N. CAPDEVIELLE ' Laboratoire de Physique Theorique University de Bordeaux I Chemin du Solarium ЗЗ17О GRADIGNAN, FRANCS

339
EXTENSIVE А1П SHOWER DETECTION AT PIC DU MIDI LEVEL <M>13"14 eV) A. CACHON*, J.N. CAPDEVIELLE. J. WDOWCZXX**,....
Laboratoire de Phjraique' Theorique, Univeraiti.de Bordeaux I, France Obsorva£oire du Pic du Midi, Bagneres de-Bigorre, France
** w Inatitute of Nuclear Research, Eodz, Poland
Theoretical • Experiment»! Q Both [£]
I Fluctuationa and average properties of the ID and 3D electromagnetic conponent are obtained by aimilation at the altitude of Pic du Midi for •tandard and acalino Models in the caae of EAS of primary energy between
10 -lO GeV. The effective EAS area is studied and compared with the previous Pic du Nidi experiment of the Daudin group.
The new French-Polish project at Pic du Midi (ASMODEE - Air Shower Mountain Detector for Electrons) to get informations on strong interactions will be presented.
COofdinites: EA 3.8 (structure)
MailingaddiMt: J.N. CAPDEV I E L L E Laboratoire de Physique Theorique Univsrsiti de Bordeaux I Chemln du Solarium 33170 GRADIGNAN, FRANCE

340
PRIMARY MASS COMPOSITION AND SHALL HAS AT VERY HIGH ALTITUDE
H.P* BOURDBAU, J.N. CAPDEVIEU.E, J. PROCUHEUR
Theoretical (£] Experimental • Both
A apacial simulation of 3D alactron development ia carried out between 10.000 - 20.000 meters of altituda for small EAS. The depandanc* of the affective EAS Area is studied for protons and heavy nuclei.
By a Monte-Carlo procadura wa point out tha important sensitivity of 3-fold and k-fold coincidence intanaity varaua altituda for different primary compositions (pure nucleon, mixed or pure heavy) and with different assumptions for fragmentation or auparpoaition models of nuclei interactions.
Coordinate»: об 1.5 (Nuclear Composition of Cosmic Rays)
ШШгкaddress: J - N. CAPDEVIELLE Laboratoire da Phyaiq.ua Thaoriqua Universite de Bordeaux I Chemin du Solarium 3317O GRADIGNAH, PRANCE

341
NON VALIDITY OF AGE PARAMETER IWICITIf IN THE DESCRIPTION OP THE LATERAL ELECTRON DISTRIBUTION
* J.N* Capdevielle, J. Gavin ,J. Procureur Laboratoire de Physique Th6orique,Universite de Bordeaux, France
Institute of Nuclear Research, odz, Poland
Using simulation by superposition of all possible individual cascades in CAS of lateral electron distribution -at sea level and Mountain altitude, we point out the average dependence of age parameter which is rising with axis distance, lower than the theoretical age it obtained by the Method of the moments near from axis (and larger far from axis). We suggest a correlation : i(r) • A Log (fir) * st and a modification of NKG foraula. Fluctuations of age parameter are also presented, as well as interpretation of experimental results at fixed size in terms of model dependence.
I. Introduction The difficulty to describe in EAS the lateral electron distribu
tion by a single age parameter has been noticed in the last decade by several workers (Hiyafce et al• 1968, Kristiansen 1971) ; the tendency of the local age parameter to increase with axis distance has been noticed (Linsley 1973, Aguirre 1973, Porter 1973) and it was confirmed recently (Kristiansen et al• 1975, Kawaguchi et al. 1975) that at large axis distance the distribution is flatter whereas belov one Moliere unit it is rather steep-
In this work, the investigation on age parameter dependence versus г is carried out by the same simulation technique used for a comparison with the results of the Tien-Shan experiment (Capdevielle et al. this conference EA-87) in a more general way : the analysis is not limited
—2 to mountain altitude (700 g.cm ), but extended to other levels (820, -2 5 8 i
1033 g.cm ) for several bands of size between 10 - 10 particles for different assumptions in models and primary composition (see EA-87). II. The local ape parameter
As a consequence of the contribution of all possible e.m. cascades, -2 we get firstly 700 g.cm , the general dependence t s(r) ,- a Log fUr/rJ + st 15 < r < 150m , 105 < N < 4.5. Ю 6 .
At distances lower than 15 meters or larger than 150m, the increase of s with r is less important.
For a given nuclear model, a »nd 0 can be expressed versus size :

342
0(N ) = 3.8. Ю - 2 • 0.326 Log ( IO /I» )
/J(Ne).. 2.55 [th (Ne/5.105)1°-25
For В = г /Я we have a(R) = s. . о ^ t
Of and fi are alightly model dependent anaV it appeared possible to express those coefficients versus s. in a pure phenomenological picture.
s(r) = a Loj |) - » »t st > 0-9 о
with 0t(st) = 0.186 st - 0.0993
and jj(et) = 6.99 - 4.2 st
6.99-4.2it For all aodels and all sizes, it can be considered in first approximation (42 < R < 52m) that the local age parameter at the average crossing point (r = 45m) is equal to the longitudinal age parameter s(45) = e..
-2 5 '7 ' The general formula at 700 g.cm 10 < N < 10 Is, thus, derived to from NKG formula describe the lateral electron distribution (15 < r < 150m) :
Ыт) =-^2o(rTrts(r)]fT4.5-J.(r)]lr;) \T-O^ о
tp(r) = 1.04 [0.7326/r - O.O163] if r < 45m <p(r) = 1.04 + 0.0428 th [0.52 (- 55 )] if r > 45m
is introduced to renormalize NKG formula (non normalized with s = a(r)). It can be noticed, in experimental situation that the determination of. s(r) = a' Log r + 0' can be obtained directly by a' and Я' coming from measurements of s(r) in two points and simultaneously all the lateral distribution by the last formula (N being obtained from the proportionality at 45 meters).
The dependence of age parameter (at 700 g.cm ) from size is shown in fig. 1 where st and .s„ »гв the age parameters of the Tien-Shan experiment, s(15), s(75), s(H5) the age parameter for r = 15,75,115m, s. is the theoretical age.
• 5 5 Simulation always at fixed size at sea level between 3.10-4.5.10
particles reveals a similar dependence s(r) - at Log (в £-) + s

343
with »t = 1.285 , p" = 1.525 , a = 0.0714 . The increase of • with r is more important (by 7% at T.S. altitude and by 12% at sea level whenyfs rising from 20m up to 120a). The amplitude of the variation of s(r) ia again 9% at sea level for
о large air showers (Э~4.5*Ю particles) when r is riming from 50 meters up to 1 km (fig. 2).
T i «
«. : Nf ..».« bS \rf -. t«IS (U)
e.:»J»J.«i» i; «4.111 : — — • ;;, 1 » — i — > _
F i g . 1 P i g . 2
III. Model dependence -2 At the altitude of 700 g.cm , the effect of a scaling model has
been calculated for showers at fixed size. The amplitude of the variation is not changed, and the variation is
not very different in comparison with the theoretical age parameter s . This parameter is reduced by about 4.5% for all sizes (and s(r) in the aame proportion) when the CKP model ia replaced by the scaling model.
The case of a pure iron primary composition has also been involved for both models ; at 700 fl.ca* , a general increase in both cases by 9% as well for theoretical age as for local age parameter is observed.
In th» case of rising energy p-air cross section 4Yodh et al. 1972) a general increase by 9.8% (near 10 GeV) is again ascertained. The distance where a - s(r) appear slightly model dependent and alao the situation of the crossing point.
At 700 g.cm" , we have noticed furthermore that the relative in-craasa was more important (by 40% between 20-180 m) when tj was increased from 0.45 up to О.бО. IV. Discussion
In consequence of the general increase of the local age parameter,

344 it is interesting to discuss rapidly soae experiaental values of the age paraaeter and also about tha behaviour of this paraneter with size*
Ve hare plotted on fig. 3 soae results on a large size range [6.JO -6.iO particles] froa the experiaents of Tien-Shan, Norikura, Volcano Ranch.
Pig. 3 As the levels of those arrays are different, the points of Norikura
and Volcano Ranch would have to be lower, respectively by 0.03 and 0.075 for effective coaparison at Tien-Shan altitude.
For all aodels and in all conditions, the age paraneter (theoretical or local at a fixed distance) is slowly decreasing with size. The
3 4 fast decrease of s by 6.10-4.10 particles (by about 33%) is out of proportion with all predictions, s is obtained here froa density aeasu-reaents at 6 and 70a (Aseikin et al. 1973). Even with a change of pri-вагу coaposition (pure iron priaaries at 6.10 particles and pure 4 nucleon at 4.10 particles), a decrease by no aore than 1554 could be observed. Froa other part, such a change of priaary aasa would require a lower rise of N versus N ; soae flattening has been noticed in the Tien-Shan for auons, but in very weak proportion near of 1.6.10 particles.
Such decrease cannot be explained by aoasureaents of s far froa axis for the lowest sizes and near froa axis at higher size as the distances are fixed. An other possibility could be a change in the slope of the priaary spectrua changing the equilibriua between young and old showers (in such case the slope of the priaary spactrua would have to decrease). Host recent values of the Tien-Shan experlaent gave 1.3 (r < 10a) for s and 0.8 (30 < r < 80a) for showers between 2-3.7.Ю5
particles and 2.6-20.10 particles. Those results suggest, on the contrary of the present work a decrease of age'paraaeter with axis distance.

345 The value of 0.8 cannot be approached (even if we take the corres
ponding NKG age parameter of about 0.9) br any model ) the lower disagreement would be obtained for scaling aodel, but we remark in this particular case, the admixture scaling + pure iron primary composition would not be in favour of young age parameters.
In the case of No-ikura experiment, the low age of the lowest size is explained by the authors (Miyake et al. 1973) •» * result of fluctuations for low sixe below the knee, and older age parameter being gradually reached at higher six».
Between 5-10-2.10 particles, the data are in very good agreement with our prediction (СКР aodel and pure nucleon composition) and this fact suggests stability for the character of the interaction and also primary mass between 3.10 -8.10 GeV. The rapid increase of s with size
7 8 between 2.lO -1.5.10 particles (by 6%) could be explained by an increase of primary mass (mainly nucleon to pure iron at the upper limit), by an increase of inelasticity (minimum 20%), or by the fact that for
7 N > 2.10 , the shower axis are falling at larger distances and that • n
the local age parameter is measured near of 40a for N < 2.10 and near of 150 m at the highest size.
The first possibility will require at same sise an increase of the auon-electron ratio, presently not observed at so high energy. The dis-sgreement between the last value obtained at Norikura and the value
g obtained by Linsley (1973) for 707 events of 10 particles is tolerable if in this last experiment s is considered measured near of 1 Holiere unit. The increase of a(r) with axis distance is obvious in the case of Volcano Ranch (up to 1,4 after 5 Holiere radius) but is larger than expected in our models. Similar situation appears for showers of 6.10 particles where a is rising from 1.0 at„ 100m to 1.2 at 1000a. V. Conclusion
Independently of all the possible consequences of the dependence of • from r tor size estimations, analysis of age behaviour suggests
6 7 that between 3.10 -8.10 GeV, there is no change in interaction character and primary composition, as also suggested by the variation of the muon content versus size in the sane energy range. A more important incraaae of s(r) with r could be caused by structure function steeper than in NK theory, for individual electromagnetic cascades, as proposed recently by Hillas (1976).

346
REFERENCES Aguirre С. et al., 1973, 13th ICCR, Denver, 4, 2592. Aseikin V.S. et al., 1973, 1.3th ,ICCR, Denver, Jt, 2599. Aselkin V.S.. et al., 1976, Akad Nauk, USSR, prep. 142. Capdevielle et al., thia conference EA-87. Hillaa H., 1976, European Syapoaium on Cosnic Rays, Leeds. Kavaeuchi et al., 1975, 14th ICCR, Munich, _8, 2B26. Krtatiansen G.B. et al., 1971, Izv.Ak. Nauk, USSR, j£, 2107-Kristianaen G.B. et al., 1975, 14th ICCR, Munich, 8, 274?.
Linsley J., 1973, 13th ICCR, Denver, 5., 3313.
Miyake S. et al., I968, Can.JourNPhya., 46, 17.
Miyake S. et al., 1973, 13th ICCR, Denver, 5_i 3220.
Porter N.A., 1973) 13th ICCR, Denver, £, 2657.
Yodh G.B. et al., 1972, Phys.Rev.Lett. 28, 1005.

347
SIMULATION OF LATERAL ELECTRON DISTRIBUTION AT TIEN-SHAN ALTITUDE *
J.N. Capdevielle, J. Gavin, J. Proeureur
Laboratoire de Physique Theorique.Universite de Bordeaux,France
Institute of Nuclear Research, £odz, Poland
Assuming N-K theory, we have simulated completely the lateral electron distribution. The crossing point of individual distributions appear, in average, to be nearer from axis by 20 meters than assumed in the Tien-Shan experiment and average ratio between size and density at 70 meters looks to be elevated by about 16 %* This fact introduces a systematic size underestimation increasing with lower values of age parameter.
1. Introduction
The lateral electron distribution has been measured by the very 4
refined Tien-Shan EAS array those last years in the size range 10
5.10 particles and some results about age parameter and its fluctua
tions have been obtained. The low value of the age parameter (в ££ 0.85) was not expected from simulations with usual models and it was sugges
ted (Dedenko 1975) t o distinguish longitudinal age parameter and sA with
the assumption •* *A * *X being measured in the experiment.
An other assumption used in this experiment was coming from consi
derations on lateral electron distribution in pure electromagnetic
cascade ; the property that all structure functions were crossing at a
general distance of 70 meters from axis was derived, as at this distan
ce one constant of proportionality between size and density K(s2),very
slightly dependent of s_ (Aseikih et al. 1976), s ia the age calcula
ted from densities measured at 6 and 70 meters axis distance. The
value of K(s„) is coming from the analytic description of Nishimura and
Kamata (1958) and directly used for size determination by the relation
*. - K(»2> Л, 2. Siwulation procedure and nuclear Model»
We have used the hybrid Monte-Carlo analytic procedure described elsewhere (Procureur 1977) and the lateral electron distribution is obtained by the accusnilation technique (Capdevielle 1972) i all electron densities ars gathered for all possible individual «-• cascade inside each extensive air shower and numerical lateral distributions are obtained by simple superposition at given axis distances* In

348
parallel, the theoretical age parameter s is calculated in each shower by the method of the moments. The primary spectrum index is taken as 1.6 and the distributions have been obtained at fixed size in different ranges 5-7»5.Ю3, 3-4.5 « Ю , 3-4.3-to5, M.3.10 , 3-4.5.10 particles.
The models used have been the CKP model and one model derived from recent accelerator data in agreement with scaling predictions (Pedrazzi 1976). In both cases, rising energy proton cross-section are not considered (X , - 80 g.cm" , X„ , * 120 g.cm )• In the case of heavy
p—air w—air primaries, the superposition model has been involved- NKG formula (given a better accuracy for low values of s) has been involved for all individual cascades. 3. The statistical tromsing point
In a first time, we have counted in eaci» interval of space the points of crossing between all possible structure function in a given size interval t simultaneously, a minimization method based on reduction with axle distance in discrepancies between densities of individual EAS is employed in the same finality. The average crossing point R has been localized at distances quite lower (Capdevielle et al* 1977) than assumed (70 m), near of 45 meters far from axis. It is shown on the histogramm (fig. 1) obtained for 6 ' 6 Ю < N < I.5.IO that tor both methods the center of gravity is equal to this value of 45 meters, which can be considered in first approximc < tion like a universal distance. R is slightly decreasing with size,or with younger showers- The reduction of R when compared with pure elec-
c tromagnetic cascades is caused by a more important steepness in EkS coming from regeneration by photons produced in lower altitude by the hadronic component- As it will be related further, this is a consequence of the dependence of s from axis distance r.
Some other histograms^ of crossing point are presented for sizeu 3-4.5.105, 3-4.5-10 ....

и \ Т" X \ L +
I ! -
ч £ •
- 4 -,
• ! -
ЕЕ] Ж _Гп Т Т г
4 г + -
Е Е - 1 - '
]•[ Hi ::
1таж|:.. £ННЙ:Ё>" Т-П T I E г ' И T 1 / V
т ттгт т т""' Т Г Г ' Т ' Т Г 4- 1ТТ -С -С + '- ~'-
ЗшШШ
::т-тт . '. Л J- • -I ' " Т JT * Т
::i|i| - M ' i -iff "ills : T[F? it
-lT -jr i ;£
• J - |- : - -
"ifri Jl'!
MI J
x ;: Ж ' , ' • • • • • ; : •
[ T . ; i ji
i .Li-iii .fl!];
. j _ ; [ . i i . . L. ^
; - : r ; - - : ". - 1 J
: : H is ^ \ •'
i^.ii'.y.:
s4+--=
i
w
Hiatrogramm of crossing points
Fig.2

350
4. The proportionality aize-density The lateral electron distributions averaged on about 300 shavers
(coming from our calculation) shown on fig.2 and compared with the distribution calculated with N.K. approximations with a single value of the age parameter, s,, calculated in the same size interval. The distribution is clearly younger near from axis and older at large distances- On those distribution, ve have calculated in each interval of 10 meters, the local age parameter s(r) describing the densities in r±5m.
Thtf dependence of s from r can be approximated for 15 < r < 150m by the general formula for 105 < N 5-106 (fig-3) :
s(r) = a Log & -— + s. . r x •• о Detailed considerations on this dependence are discussed in one
accompanying paper (Capdevielle et al- 1977) and s(r) is equal to a near of the crossing point, i.e. 45 meters.
This dependence exists also in individual showers and ve have calculated the coefficient K(s_) versus s_ in each individual showers from Ats_)/N , at several distances 70, 45, 34 meters (fig.4).
Fig.3 Pig.4

3S1
«T.S. (?0J • o.t. (<c5m)
Fig.5a Fig.5b
The dependence from s^ is less important near of the crossing point where simple proportionality can be assumed according to
N = 0.435.105 #45 meters) . When compared to the curve K(s„) at r = ?0m used in size density convex sion, with N.R. approximations, a larger value of K(s ) can be ascertained in our calculation and also larger increase for lower ages (the situation is not so bad at 34m). This situation implies a general underestimation of size by about 16 * and larger than 20 % for s « 1, and obviously underestimation of primary intensity.
This consequence is independent of the model and of the primary composition, which generate only slight displacement df а_ (to the left for scaling and to the right for pure iron primaries, respectively by about 4 and 8 * ) .
The interest t'o measure densities at 43 meters is shown on fig.5a,b for a sample of individual where the size is calculated assuming Ne = 0.435 Д(45) and К(я2)Л(70) like in the Tien-Shan experiment and compared to the size calculated from longitudinal development.

352
REFERENCES
Aseikin V.S. et al., 1976, Acad.nauk., USSR, prep. 142.
Capdevielle J.N., 1972, University of Paris XI, Thesis.
Capdevielle J.N., Gawin J. and Procureur J., 1977, J.Phys.G, in the
press.
Capdevielle J.N., Gavin J. and Procureur J., 1977, accoapanying paper,
Plovdiv.
Dedenko L.G. et al., 1975, Proceedings of the 14th ICCR, Hunich 8,2731.
Niehiaura J. and Kaaata K., 1958, Prog.Theor.Phys. (>, 93.
Pedrazzi E., 1976, Nuov.Cia. £, 217.
Procureur J., 1977, University of Bordeaux I, Thesis.

353 RELIABILITY ОТ THE METHOD OF CONSTANT INTENSITY CUTS
FOR RECONSTRUCTING THE AVERAGE DEVELOPMENT OF VERTICAL SHOWERS
Т. K>. Gaisser Bartol Research Foundation of The Franklin Institute
University of Delaware Newark, Delaware 19711
A. M. Hillas Department of Physics, University of Leeds
Leeds, U.K. Abs_tra_ct. We present the results of some simple model calculations that investigate the validity of the Intensity-cut method of reconstructing the shower development curve. We find that N _ ^ N > ff. cut rms
1. Introduction. The longitudinal development of extensive air showers is undoubtedly an essential feature that reflects both the composition of the primary cosmic rays and the gross features of particle interactions for Е > 10 -5 eV. In the past, however, this crucial property of showers has only been determined indirectly by taking cuts of constant intensity in size spectra for showers of different zenith angle bins. The question thus arises, how well does the development curve obtained in this way (call it N c u t) represent the true, average longitudinal development (ТГ) of showers of fixed primary energy? Dedenko has argued that the method of constant intensity cuts seriously misrepresents the true average development of showers. He calculates [Dedenko, 1975] that the depth of maximum of N c u t is 100 gn/cm- (or more) higher in the atmosphere than the maximum of 'N. This discrepancy is comparable to that between ¥ calculated with scaling and proton primaries [Fishbane et al., 1974] and N c u t obtained in the Chacaltaya experiment [LaPointe, et al. » 1968] . If this discrepancy is largely due simply to a difference between N c u t and N, then arguments against scaling and proton primaries based on the Chacaltaya data would have to be revised.
We have therefore investigated the relation between NCut and TT from several points of view in an effort to clarify both the meaning of N c u t and the circumstances under which such a large discrepancy as found by Dedenko may exist.
2. Analytic Estimate of NCut« We first carry out a calculation of Ncut along the lines of Dedenko (1975) but using a simple analytic parametrization of the size of a shower initiated by a proton of energy Е at depth t=0 (t measured in units of X*70 gm/cm2):
S l ( E , t ) - SQ | e X P I t n a x J C t / t ^ ) ' » » e " ' . (1)
with t m a x - .51 Яп(Е/е) - 1 , So - 0 .045, and е - 0.074 GeV. * Work supported in par t by the National Science Foundation.

354 The first step is to construct the probability,
^(>NJE,t0,6) that a shower of energy Е and angle 9 will produce more than N pajrticlcs at slant depth t0"y0 sec 9, where yQ is the vertical depth of observation.. In the simple model defined by Eq. (1) t
iK>H|B,t0) - HCE- f E) / 4± е F HCt-tiJIKtj-O (2) м (Пях* H(x) i» * it»p fimotlon)
In Eq. (2), -r— е is the minimum energy required to produce а shower with N particles at its maximum of development, lo give a shower with size >N at t0 the cascade must be initiated at slant depth t between t^ and t2 (0 < t \ < t2) where tj_ and t2 are roots of ^ t *
• - . * exPit i p q ~ . - < v ' > . шах' 1 1
We have taken Io"10-' m~2 sec"1 sr"1, Eo«5xl07 GeV and v-2, a we have compared N c u t for 1 (>Ю » 10"' m"2 sec"1 sr - 1 with Tf
In Eq. (2) if i J to allow for the fact that there are other sources of fluctuation than point of first interaction.
One next calculates the size spectra at various slant depths and takes constant intensity cuts to construct N c u t(E,t). We have used an integral primary energy spectrum
I(>E) - In(E/E0)"Y (3) and for
XpA«l, Xp/X«1.43 and XF/X«2.14. To compute IT we have taken Е to be the solution of Eq. (3) with l(>E) - l(>K). For 1(>H) -10 - 9 a - 2 sec-1 sr"1 this gives Е - 5xl07 GeV. The result for Xt/X - 1.43 is shown in Fig. 1.
Our result differs from that of Dedenko in three significant ways: 1) We find a depth of maximum about 20 gm/cm2 higher in the atmosphere for N c u t than forjff (rather than 100 gm/cm2 higher). 2) We find S c u t (tmax) > N ( t m a x ) , whereas Dedenko has N c u t (tm ) - IT (tmaxJ" 3J 0 u r Nc ut l s b r o a d e r t h a n
ft but the two curves do not cross, as Dedenko finds. To explore the source of these differences ve look at the general relation between Ncujt and IT. We also must consider the effect of the fact that the simple model discussed so far probably underestimates fluctuations tfatson, 1976J. 3. General relation between N .. and N. It can be shown that N c (t,E) ъ Hr._ (t,E) (rather than V (t,E)) under rather general conditions;, including that of a mixed composition.
First, if the shower development curve has a shape which fluctuates from one shower to another, but has no dependence on energy, one can establish (his result accurately. Thus let Ec be the "calorimetric energy", which is deposited in ionization (somewhat less than E, because of neutrinos, etc., and probably not exactly proportional to E). Then we take N(t,E)-n(t).Ec in a particular shower, and assume that the probability

3SS
distribution p(n,t)dn is independent of E c. Let the integral flux of primary particles be expressed as in Eq. (3) with E+Ec. Then the integral flux of showers of size >N at depth t is
I(t,N) - / p(n,t)«l0-(N/nEo)"Ydn - Ij(H/E ) ~ Y J nYp(n,t)dn о о
- Io.(M/Eo)~Y <n<t)Y>.
Hence, the shower size Ы for which I(t,N) • 1 is given by
"cut ' Eo <°<t)Y>1/Y- <N(t,Eo)Y>1/Y- N Y_ a v<t,E o).
»<е'Жо>г... if Y-2.
ThuB H c u (t,E) should always be larger than Jf(t,E) if there are any fluctuations, as the example in Section 2 illustrates. The actual variance in N at depth t could, if known.,, be used to correct the value H c u t С -N r m s if у - 2) to obtain N. Alternatively, one can compare the experimental values HCu.£(t,E) with theoretical curves for N r m s(t,E), rather than with N(t,E). Also, if one has estimates for the difference between N r m s and N a v one can find the.ratio of areas under these two curves, and hence find the error in the calorimetric energy which is deduced for these showers, from this area.
200 400 600 800 1000 1200
DEPTH I jm/tm' l
100 200 300 400 S00 600 700 600 900 IOO0
Depth (gm/cm2)
Fig. 2

356 The general nature, but not the correct magnitude, of the
differences between N(t), Ncut(t) and Nrms(t) can be Illustrated by taking a rather extreme model of shower development which gives unrealistically large fluctuations (in contrast to the model of Section 2, which gave rather low fluctuations). At the same time we investigate the effects of a shape that changes with E. For this illustration, each shower will be taken to have a shape corresponding to an electromagnetic cascade generated by л ° mesons of energy E^a injected at a depth x which fluctuates with the distribution exp (-x/L)dx/L for x<L, but (x/L)exp(-x/L)dx/L for xib. The latter part roughly corresponds to the fact that in reality many cascades are generated, but that the mean point of injection of energy is at the second interaction of the primary particle, whilst the first part allows for extra fluctuation at high altitudes as though all the energy can go into the products of .the first collision (L*80 g/cm2).
The worst assumption, for the case of energy-independent composition, is to assume a scaling-type model, in which the effective -n° energy E.^ rises proportionately to E. The case E^o = (E/E0) x 3.10 eV has been taken to produce the results plotted in Figure 2 (for Y e 2) as the points Э, which show the calculated values of N c u t for the intensity 10 (which corresponds to the primary energy E Q ) . The results do not differ much from N r m q. If instead one takes the slower variation of shower shape given by E^o = (E/Eo)°'sx3.1013 eV, which is rather like that obtained when particle multiplicities rise as E^M (noting that E^o is not just the energy of pions from the first generation), one gets the values of N c u t shown by the solid points, very close to Nrtng. So N r m s is still a good match to N c u t, even when the shower shape is varying systematically with E. If у = 2.5 rather than 2, the curve Ny-av *s °^ course rather further displaced irom N a v, as shown for this extreme shower model by the dotted line in Figure 2.
4. Discussion. The calculations of Section 3 confirm the results of Section 2 and show in general that N c u t ^ N r m s if Y г 2. We have also confirmed the latter result for a mixed composition of Fe and p. Even in the model with rather extreme fluctuations, the depth of maximum was shifted up typically only by 20-40 gra/cm and the area__under the curve increased by ^18-25% for NCut as compared to N. We have been able to think of two possible sources of the difference between our result and that of Dedenko: 1) in averaging over the zenith angle bin 0-30° Dedenko has plotted the resulting Ncut at tvertical rather than at <с>д»о-30°' W e h a v e
found that this can lead to a shift upward of the dejjth of max. of N c u t by ^30 gm/cm2. 2) Dedenko has N c u C(t m a x) - N(tmax>. He may have defined Ж (the energy used to c_ompute IT) to achieve thip equality. But this would require Е > E c u t and hence cause the depth of max for M to be shifted down in the atmosphere (by ^10 Ё Ш / С Ш 2 ) relative to N c ut(E Cut)* We can thus account for about 40 gm/cm2 of the discrepancy between our result and Dedenko r s.
5, Conclusloju, The main point oi" this work .is to present a different way of viewing N (u,I ) , whitfh can Ь-л carried over into

357 situations where one has папу other complicating factors. We are measuring Nrms(t,Eo) for the whole group of primaries of energy E Q, and it could be more satisfactory to compare with theoretical N r m s curves. However, when N(t,E0) really is the quantity of interest, as when es timating the area under the curve for calori-tnetric purposes, one may either use experimental (scanty) data on the variance in N(t,E) to correct N r m s to H, or one may apply a more realistic model to estimate these differences. Even with the crude model of Section 3, the area without such correction exceeds the "correct" area by typically 18-25%: in reality the error should be much less. Thus it seems unlikely _that previous conclusions based on a comparison between N C u t and N will be qualitatively changed, although the difference is large enough to be significant, and it should be taken into account in future calculations.
Acknowledgments. We wish to thank L. G. Dedenko, G. B. Khristlansen, John Linsley arid A. A. Watson for useful correspondence and discussions One of us (TKG) is grateful to the Science Research Council (U.K.) and to the Physics Department for a visit to the University of Leeds where part of this work was done.
Ref erences. Dedenko, L. G.* 1975, Proc. 14th Int. Cosmic Ray Conference
(Munich), 2857. Flshbane, P.M., 1974, Phys. Rev. D9, 3083. LaPointe, M. , et al., 1968, Can. J. Phys. ^6., S 68. Watson, A. A., 1976 (private communication).

358
Longitudinal behaviour of cosmic ray particles in the atmosphere Toru Shibata
Aoyama Gakuin University, Setagaya, Tokyo, Japan Recently, the author derived analytically lateral structure functions of hadronic? muonic2and electromagnetic Components. Here, we present the results of numerical calculations of the aboves, focussing our interests to the longitudinal motions.
§1. Model of multiple meson productions Japan-Brasil Emulsion Group has investigated the nature of fire-ball, by means
of emulsion chamber with artificial producing target?' Through the series exposures of large emulsion chambers at Mt. Chacaltaya, they found directly three kinds of fire-balls, H-, SH-, and UH-quanta. Though the statistics of the latter two are not yet enough, characteristics of the above three are summarized as
<N > <P™ > Y TY
H-q ; ч, 8 * 130 MeV/c SH-q s ч. 25 "> 250 MeV/c UH-q ; ъ 100 -v 500 MeV/c
Distributions of the energy and the transverse momentum are both approximately represented by exponential function.
Here, we assume following production spectra"'^ f(EElr,Elr,e)dE1rde/ir = N^ exp[-X(l+Y2)] XdXdY2, with X = H ^ / E E ^ , and Y * r e , (1) and moreover suppose the increase of multiplicity and transverse momentum, N„ - N o ^ / l O ^ e V ) 0 , and <pT7Y> - pQ (ZE^/IO^ e V ) 6 , (2) giving gross feature of the productions of the above three.
In the present work, we calculate the longitudinal cosmic ray components in the cases of a-0, 1/4 and 1/2, which are distinguished in the figures presented in later sections with use of lines, a-0 : , a-1/4 : , e-1/2 : , respectively, throughout the present paper. Concerning the transverse behaviour of shower particles, we report in Ret. 6 ) .
Collision mean free path of nucleon vs. air nucleus and pion vs. air nucleus are assumed as 70 gr/cm2 and 105 gr/cm2, respectively. Inelasticity distribution for N-N collision is of the uniform one with average value 0.5, while that for и-N collision is catastrophic as we can not distinguish surviving pion among secondary ones. 52. Electronic component
He show the relation between electron size and energy of primary nucleon in Fig. 1, for the cases of three observation points. A: sea level(1033 gr/cm 2), B: Mt. Nori-kura(738 gr/cm2) and C: Mt. Chacaltaya(540 gr/cm2). In the cases of mountain levels, except the case of a-0 at Mt. Chacaltaya, the relation is not affected by the choice of Increase parameter a. While in the case of sea level, It is critically influenc-
-ь 1.3 GeV/c2
1. 8 GeV/c2
60 80 GeV/c2 .

359
ed by the magnitude of a. Therefore, when we estimate the energy of primary nucleon using the relation He-E0, we must take care this effect.
In Fig. 2, we show the relation between electron size at shower maximum and the energy of primary nucleon. From this figure, one finds the relation doesn't depend on the choice of increase parameter a. In turn, if one catches the electron size at shower maximum N e m a x, the energy of primary nucleon is straightforwardly estimated vltboift Buffering the choice of model of nuclear interaction. From Fig. 2, one gets the relation between Umax an<l E0 i n t n e following.
"emax * 2 8 0 * <En/1012eV) (3)
rNim
»'. Ю"
Ю*
«C Eo(eV)
Ю" Ю" НУ КГ
Fig. 1. Belation between electron size Fig. 2. Relation between electron size at and the energy of primary nucleon. Three shower maximum and the energy of primary kinds of curves are explained in §1. nucleon.
92. Hadronic component
In Figs. 3-a) t'-c), we show the energy spectra of hadronic component for various shower sizes, which are related to the energy of primary nucleon as presented in Fig. 1), at sea level, Mt. Norlkura and Ht. Chacaltaya, respectively. We should remark that the slope of the spectrum becomes steeper as a increases.
In Figs. 4-a) - c ) , we present the relation between electron size N e and hadron size Hn, for different minimum energy of hadron. One finds It is approximately expressed by N„ «Ng and the exponent $ Is around 0,7-1.0 without strong dependence on the increase parameter a . However absolute number of hadron size is seriously affected by a.
From Figs. 3) and 4), one finds contribution of charged plons with energy larger than 1 GeV is smaller than 0.1 Ж in comparison with electron component.

360
W Xf E.W) tf EJiW)
Fig. 3-a. Integral energy spectrum of charged plons at sea level.
Fig. 3-b. Integral energy spectrum of charged plons at Mt. Norlkura(738 gr/cm2).
ЮГ
о"
rf ы*1
tf , U»HG*T|
Fig. 3-е. Integral energy spectrum of Fig. 4-a. Relation between electron size charged plons at Mt. Chacaltaya(540gr/cm2). H e and hadron size N at sea level.

361
tc\
Fig. 4-Ъ. Relation between electron size Fig. 4-c. Relation between electron size M e and hadron size Ип at Mt, Norikura. N e and hadron size Nff at Mt. Chacaltaya.
§3. Muonic component
Here, we consider the case that all the muons are originated In the decay of charged pions. Contribution of the kaon decay is reported In sunsequent paper.
Figs. 5-а) ъ -с) are the integral energy spectra of muone at sea level, Mt. Norikura and Mt. Chacalta). , respectively. In Ref, 2 ) , we neglected the effect of the ionization loss and the anion decay, which are effective In the energy region % 1 GeV. In the present calculation, we take into account those also.
Figs. 6-а) ъ -с) are the relation between electron size N e and muon size NM. It is approximately given by N^ « N | , with exponent В around 0.6 % 0.85. It seems to depend on the increase parameter a, i.e., the slope becomes gradually steeper as higher value a. One should notice that the absolute value of muon number depends strongly on a.
rNM*$,)
tf tf» ю" »ч tf*e*«)
Fig. 5-а. Integral energy spectrum of muon at sea level. -

362
N0(2Ep)
*"Щ*>
Fig. 5-b. Integral energy spectrum of muoti at Mt. Norikura.
iff «ЧДО
Fig. 5-c. Integral energy spectrum of muon at Mt. Chacaltaya.
Fig. 6-a. Helation between, electron size Fig. 6-b. Relation between electron size N. and muon size N„ at sea level. He a nd muon size Kg at . Norikura.

363
§5. Discussion
We have presented syatenatlcally the results of numerical calculations of longitudinal cosmic ray particles, electron, hadron and ouon, at three observation points, sea level(1033 grj cm 2), Ht. Norikura(738 gr/cm2) and Mt. Chacaltaya(540 gr/cm2). Through those calculations, one finds that the muonic component is particularly affected by the choice of increase parameter a , while electronic component is rather weak for the model of nuclear interaction in comparison with the other two. From this fact, one can say that the observation of soft component is meaningful rather for the energy calibration of primary nucleon.
In the present paper, the author gave the numerical calculations only. In the following paper, he will report the comparison with experimental data of air shower, and discuss in detail the model of nuclear interaction, in relation with the accelerator and emulsion chamber experiments^)
Acknowledgement
The author express his sincere gratitude to Prof. K.Yokoi for his valuable discussions and encouragements. Thanks are also due to Miss. K. Akiyama who helps him to operate computor at Aoyama University.
References
1) T. Shibata, Prog. Theor. Phys. Vol. 57, No. 3(1977). 2) T. Shibata, Prog. Theor. Phys. Vol. 57, No. 5(1977). 3) T. Shibata, Prog. Theor. Phys. Vol. 57, Ho. 6(1977). 4) Brasil-Japan Emulsion Chamber Collaboration, Conference paper, Munchen con
ference on Cosmic rays (1975), Vol. 7, p.2386, 2387,2393. See also papers of Brasil-Japan Group reported in this issue. -
5) E. Konishl, T. Shibata and N. Taceyama, Prog. Theor. Phys. Vol.57, No. 1(1977). 6) T. Shibata, in this issue.
*) Comparison of the present calculations with experimental data will be reported orally in conference, and tHe detail will be published in CKJ-report, Cosmic ray Laboratory, Tokyo University.
«" » " .——. . . V » « ti »•
Fig. 6-c. Relation between electron s ize Ne and muon s i z e Np at Mt. Chacaltaya.

364
Transverse behaviour of cosmic ray particles in the atmosphere
Toru Shibata Aoyama gakuin University, Setagaya, Tokyo, Japan
With use of the lateral structure functions of electronic, hadrortic and rauonlc components derived analytically by the author, we show the results of numerical calculations of the aboves at sea level» in relation with the increase of multiplicity and transverse momentum.
§1, Introduction In Refs. 1), 2) and 3), the author derived analytically the lateral structure
functions of hadronic, muonic and electronic components, respectively. Until now, most of the studies of shower phenomena in the atmosphere are mainly performed by the Monte Carlo Method, in particular, recent works Ъу Grieder and Turver et al are systematical in connection with the model of high energy particle productions. Though the development of the computor technics are remarkable, the Monte Carlo method is prodigious effort to get physical quantities with rich statistics. While, in the case of analytical calculations, once constructing the structure functions under setting the model of nuclear interaction, it is easy task to carry out numerical calculations.
In the present paper, we show numerical results of lateral distributions of electronic, hadronic and muonic components at sea level. Longitudinal ones are presented in Hef. 6)(in this issue). The model of nuclear interaction is the same as in Ref. 6). In the present work, the increase of transverse momentum is also taken into account as <PTTT> - p0T(£En/10
I2eV)5. (1)
Here, we consider threr cases of a and 6, with use of following curves appeared in later figures.
a=0\ ; 9 o-l/4\; , a»l/2 \ ; 6=0 J 5*1/8/ 6=1/4 )
§2. Electronic component
Lateral spread of electronic component in the case of approximation В is essentially due to the coulomb scattering of low energy electrons, and the angular spread of nuclear Interaction is negligible in comparison with the above.. Therefore, we don't need to take into account the angular production spectra of nuclear interaction , but can use one dimensional structure function for nuclear cascade, in which electronic cascade shower is originated through the decay of neutral pion.
In Fig. 1), we show the lateral distribution of electronic component for various shower size at sea level. Here, we don't take into account the density effect of nir , but as pointed out by Nishimura, if one uses the value of Moliere unit at about 2 radiation length above the observation level, such effected is eliminated.
*) According to Ref. 7), the magnitude 6 is nearly half of a, which is obtained by the analysis of emulsion chamber experiments.

365
From this figure, ve can determine the total size oi electrons by fitting expeimental data. This method may be different from usual one, which is obtained by determining age parameter s. In the present method» we take into account the effect of nuclear interactions. Looking carefully Fig. 1 ) , one finds that as far as adjusting total electron size N e, the difference due to the increase parameter •.:. is very small, which enables us to determine straightforwardly electron size without worrying the choice of model of nuclear interaction.' However, one must take care that the estimation of the energy of primary nucleon, using the electron size thus obtained. Because the relation between electron size and the energy of primary nucleon is now critically affected by the ciwice of a, as shown in f,2 of Ref. 6) .
?3. ii^dronic component
In Figs. 2-a) ^ - d ) , we show the- lateral distrubutions of charged pions for various electron size , in the c*:ses of minimum detection energies, 1, 10, 100 and 1000 GeV, respectively. Here, we take into account the density effect of air. In those figures, the scale of lateral distance is normalized by
1 Fig. 1. Lateral distribution of electron component at sea level. Three kinds of curves are explained in SI, and Г] equals to E s/E c radiation length (Ев-21-MeV and Ec=81 MeV).
(2) r0 = (NoE-nrpoho/ETT, with г = 6/(1-0 , and h0=6.7 Km scale height). • The value r0 should be compared with rj(=ES/EC radiation length) appeared in the lateral spread of electromagnetic cascade shower. We can consider it as hadron scattering Jength, originated in transverse momentum p0 of secondary particles produced by nuclear interaction. For example, in the case a=l/4, 6=1/8, Из=10, ро=АОО MeV/c, and E^-IO GeV, we get
ro = 182 m (3) Vertical axis is multiplyed by r$. Therefore, when we compare Fig. 2) with experimental data, we must slide it along slope -2. One must take care that the value r0 depends not only on E„,'but also on the parameters a and 5.

366
r.'N.(2E.,r) tfHr(a&.r)
КГ* Iff» vu vu
Fig. 2-a. Lateral distribution of Fig. 2-b. Lateral distribution of hadronic component with energy * hadronlc conponent with energy larger than 1 GeV at aea level. larger than 10 GeV at sea level.

367
i?N,,(4E;.r) М0*\;
Fig. 2-е. Lateral distribution of Fig. 2-d. lateral distribution of hadronic component with energy hadronic component vith energy larger than 100 GeV at sea level. larger than 1 TeV at sea level.

368
§4. Muonic component
Figures 3-а) ^ -d) are the lateral distributions of muonic components, for various electron size, in the cases of minimum detection energies of muon, i, 10, 100, and 1000 GeV, respectively. Here, we take into account the effects of ionization loss and the decay of muon, which are effective in the energy region -ч, 1 GeV. r0 is defined in Eq. 2), replacing E^ by E g. Similarly as in the case of hadronic cascade, we can consider ro as muonic scattering length originated in the transverse momentum of secondary particles.
From those figures, one finds the lateral distribution of muonic components is strongly affected by the model of nuclear interaction.
§5. Discussion
We have shown the lateral distributions of electronic, hadronic and muonic components at sea level. It is very important to evaluate these components simultaneously under setting a model of nuclear interaction. Through these calculations, one finds that the muonic component is much more sensitive to the choice of model of nuclear interaction than the other two.
The present paper is focussed to give the numerical results only. In subsequent paper, we will report the caomparison of our results with experimental data, as well as longitudinal studies of shower particles?)
Acknowledgement
The author thanks Prof. K. Yokoi for his valuable discussions and encouragement through the present work. He also expresses gratitude to Miss K. Akiyarna for her help to operate the computer at Aoyama Gakuin University.
References
1) T. Shibata, Prog. Theor. Phys. Vol. 57, No. 3(1977). 2) T. Shibata, Prog. Theor. Phys. Vol. 57, No. 5(1977). 3) T. Shibata, Prog. Theor. Phys. Vol. 57, No. 6(1977). 4) P.K.F. Grieder, Acta phys. Hung. 29(1970), Suppl. 3,-563-568. 5) H.K. Dixon, J.С Eamshaw, J.R. Hook, J.u. hough, G.J. Smith, K. Stephenson,
and K.E. Turver, Proc. R. Soc. Lond. A. 339, 133-155(1974). 6) . T. Shibata, Jn this issue. 7) E. Konishl, T. Shibata and N. Tateyama,Prog. Theor. Phys. Vol. 57, ЕЮ.2(1977). 8) J. Nishimura, Handbuch der Physik (Spri^jer Verlag), XLVI/2.
See also, h. Oda and S. Yagl, Uchusen-Kenkyu (Mimeographed circular in Japanese) , Vol. 18, No. 4(1974), p.336.
*) The comparison of the present numerical results with experimental data will be orally reported in conference, and the details will be published in CKJ-report, Cosmic Ray Laboratory, Tokyo University, in near future.

369
44ftV>
V
ft
-c:
Е,ИО*
Fig. 3-a. Lateral distribution of muonic component with energy larger than 1 GeV at sea level.
Fig. 3-b. Lateral distribution of mionic component with energy larger than 10 GeV at sea level.
I 0* Fig. 3-е. Lateral distribution of auonic co-pontnt vlth energy larger than 100 GeV at м а level.
tf
l
EpZtTtV
V IP V i О т, Fig. 3-d. Lateral distribution of auonic component with energy larger than 1 TeV at sea level..

370
ON THE SEPARATION OF THE EFFECTS CAUSED BY DIFFERENT
PRIMARY MASSES, RISING CROSS SECTIONS AND A CHANGING
MULTIPLICITY LAW ON AIR SHOWER SPECTRA BY A
SUITABLE CHOICE OF OBSERVABLES
Peter K. F. Grieder
Physikalisches Institut, University of Bern, Switzerland
Abstract: A changing primary mass composition in favor of heavier particles, rising cross sections, or a changing multiplicity law with increasing energy, tend to manifest similar gross features on air shower observables. Above all, they increase the number of particles in a shower for a given primary energy and affect their spectra. We have carefully analyzed the effects produced by each of the causes mentioned above and arrive at the conclusion that they can be resolved.
1. Introduction. Two of the major problems in ultra high energy physics today are the determination of the multiplicity law for secondaries and the energy dependence of the inelastic cross section for hadrons. These two physical properties of high energy hadronic interactions are of fundamental importance for the understanding of the collision mechanism and to formulate a valid model.
It is plausible that in a cascade process, such as an air shower, the known general trend of the energy dependence of both, the multiplicity and the inelastic cross section for hadrons tend to cause similar overall effects on most of the easily accessible observables, after a fev. generations of interactions. Thus, it appears that, at least in a simple analysis, a unique interpretation of experimental data is not possible.
A further difficulty arises from the fact that the primary cosmic ray beam contains not only protons but heavier nuclei up to and possibly beyond iron. The fraction of heavy primaries in the air shower energy range "is practically unknown. In a collision between a heavy primary and a light nucleus of the atmosphere, such as nitrogen or oxygen, a larger number of energetic secondaries are produced, together with energetic primary fragments, in comparison to a proton initiated interaction with the same collision partner at the same energy. Thus, heavy primary initiated collisions manifest similar overall effects in a cascade process after a few generations of collisions as would be the case for larger inelastic cross sections, or higher multiplicities, in proton initiated events at comparative energies, and obscure the problem even more.
The overall problem ia in fact one of h'gh energy and astrophysics combined,

371
as we hope to determine not only the asymptotic properties of high energy hadronic collisions, but also the nature of the primaries that initiate the very energetic air shower events.
The work presented here is part of a major analysis whose aim it is to search for observables and correlations among observables that are sensitive to only one oi the three phenomena mentioned above* i. e, , to purely model dependent multiplicity effects, to cross section behavior, or to primary mass.
2. Theoretical Analysis. The calculations are based on our well known two-component cluster models, described elsewhere (,1, 2). Othejr, realistic models do not lead to fundamentally different results. Most of our earlier calculations were carried out for proton initiated events. However, the models and calculations include the necessary options to extend their validity to any kind of primary nucleus initiated shower.
As soon as we are dealing with heavy primaries, the question arises whether one should use the partial or total fragmentation model (1, 3, 4). We have studied this problem and-found that the differences between these two models for handling the break-up of heavy nuclei cause very small differences on the observables, particularly at greater atmospheric depths. There the differences lay mostly within statistical errors. We therefore chose to carry out our calculations for primary nuclei initiated showers with the less time consuming total fragmentation model.
In view of the large number of possibilities that exist for combining various phenomena, parameter choices, primary energies and masses, we had to restrict our analysis for the time being to the most essential questions. Thus, the primary mass dependence has been studied within the frame of one particular model, whereas the cross section effects have been studied for different models but proton initiated events only. All calculations that are presented here are for a total primary energy of 10' GeV.
The analysis of the results of our calculations has shown that the energy spectra of hadrone and muons manifest the largest sensitivity with respect to any one of the particular physical properties of high energy hadronic interactions that are under consideration here. This is not surprising, as earlier investigations have clearly shown that energy spectra respond most sensitively to almost all significant model parameters (1, 5, 6). The essential results of our analysis are summarized in figures 1 to 4. The presentation of these four figures on a single page and with the same scale for the ordinate and abscissa simplifies the comparison very much and helps to identify at once major differences.
Figures 1 and 2 show the model dependence of hadron and moon energy spectra, respectively, for proton initiated events at sea level. Corresponding spectra have the same number. A table in each figure helps to identify the particular model, the behavior of the cross section and specifies the value

372
10*
е 10* ш
а 1С 10 -Z
о 1 < X
Ю"
Model 1 SMFB
-2IDFB 3IDF8 4SFB 5SFB
' ч ^ ^
6 const, const, rising const const.
E, - 10eG*V Sea Level Proton Primaries -Zenith - * » 0*
• Rel. 7
* 4Y^ i ai \\S>. аг \ W i . 02 V V i V CIS 3f \ X 0.25 \ V
1 10 10г Ю3
ENERGY [GeV] Ю*
E,-W6GeV Sea Level
\ Proton Primaries w 4 Zenith - * « 0 *
4
Ю 102 Ю3
ENERGY [GeV]
Figure 1 : Energy spectra o f hadrons fo r d i f f e r e n t I n t e r a c t i o n models.
Figure Z: Energy spectre of muons f o r d i f f e r e n t I n t e r a c t i o n models.
10 . Ю2 Ю3
ENERGY [G*V]
Ю*
4>"
ifiio3
* о X « В 1
or ы 0.
Ю (Л z о э Z 1
* ' .>-F e 5 6
^v>m^wo
S Rtt.11 A Ret. U
* • Ref.H
Ю
I I E, - Ю6 GeV Sea Level SMFB Model Zenith 4 - 0 '
Ю* _i_UJ
ENERGY [GeV]
Figure 3: Energy spectra of hedroni for different primary particles.
Figure 4: Energy spectra of muons for different primary particles.

373
of the parameter a. The latter is a measure for the production ratio'of nu-cleons and antinucleons to pions. It is described elsewhere together with the models (1, 2). The values stated are close to what we believe to be true at high energies, i . e . , approximately 15 to 20 percent. The calculations with rising cross sections are based on the assumption that the energy dependence is logarithmic and has its threshold at 500 GeV. The rate of rise is such that the inelastic cross section is 50 percent larger at 10° GeV than at 30 GeV.
Figures 3 and 4 show the primary mass dependence of hadron and muon spectra under otherwise identical primary and observational conditions, as outlined above. Corresponding spectra are identified by equal labels, i. e . , p for proton, В 10 for boron and Fe 56 for iron primaries. The SMFB model has been used in this case, with constant cross sections. Apart from the larger cross sections for primary nuclei prior to collision and besides the handling of their break-up, all model parameters that concern the further development of the shower beyond the first interaction are the same as before.
It is evident from figures 1 and 2 that the purely model dependent properties affect mostly the slope of the muon spectrum and to a lesser extent the total number of muons in a shower. This can be verified when comparing curve 2 with 4 or 5 in figure 2. It is above all the high energy muon component that contains the significant information. This part of the spectrum is closely linked to the multiplicity law and kinematic properties of the model. Both, multiplicity and kinematics are closely interrelated through energy and momentum conservation. The asymptotic energy dependence of the multiplicity of the SFB, SMFB and IDFB models are proportional to s f t* , e°-37s and вв.Ч37 t respectively, s being the center of mass energy squared (1).
On the other hand, the hadron spectra shown in figure 1, and their slope exhibit only a slight model dependence. This is evident it we compare the corresponding spectra, i. e. , curve 2 with 4 or 5 of figure 1. The reason for this behavior of the spectra is that the muon population in a shower, particularly the very energetic muons, are essentially surviving daughter products from the first few interactions. They carry, so to say, the early history of a shower down to sea level, above all the characteristic properties of the most energetic hadronic collisions. The spectral composition of these muons depends chiefly on the kinematics of their parent pions, emerging from these collisions.
The effect of rising cross sections is evident if we compare curves 2 and 3 in figures-1 and 2. Here it is chiefly the high energy portion of the hadron spectrum that is affected and not the muon spectrum. The general behavior of the spectra is plausible. Energetic hadrons are subject to one or even a few more interactions when traversing a given trajectory in the atmospheric target, in comparison to the. case where the cross sections remain energy independent. Hence, rising cross sections accelerate the energy degradation of energetic hadrons in air showers, thus causing a faster drop of the

374
high energy portion of their spectrum.
Generally, we can say that the products oi a nuclear cascade at a given target depth, that has been simulated with a low multiplicity model, such as the scaling model, are stronger affected by rising cross sections in comparison to constant cross sections, than the products resulting from a high multiplicity model in an otherwise comparative event. This is because the energy degradation for secondaries resulting from a low multiplicity model is smaller. The secondaries remain for more generations of interactions in an energy region wfcere the cross sections vary with energy. Vice versa, the products resulting from high multiplicity models a^e subject to a rapid energy degradation. They drop quickly into energy regions where the cross sections are constant.
The primary mass dependence of hadron and rnuon energy spectra is illustrated in figures 3 and 4, respectively- The dominating primary mass effect occurs in the high energy protion of the hadron spectrum. The sharp cut-off for the iron initiated events (curve Fe56, fig. 3) is a typical consequence of the limited energy per nucleon, as compared to proton initiated events of equal total energy (curve p, fig. 3). The rising low energy tail is due to neutron enhancement, which is also typical for heavy primary initiated events.
The total muon content of iron initiated showers is about a factor of two la r ger than for proton showers, as shown in figure 4. The larger number of very energetic muons is a consequence of the early development Of the nuclear cascade at great height. The rapid initial build-up in the very low density environment, where pions decay rather than interact, enriches the content of high energy muons, that survive down to sea level, slightly. Simultaneously, a corresponding depletion of the hadronic component occurs, that accelerates the drop of the hadron spectrum at high energies, as outlined above.
3. Comparison with Experiments and Conclusions. A small but fairly r e presentative set of experimental data has been included in figures 1 to 4, for comparison (7, 13). The normalization of the data has been discussed elsewhere (1, 5, 6).
From figures 1 and 2 and from our discussion above, we arrive at the conclusion that the high energy, protion of the muon spectrum exhibits by far the greatest sensitivity with respect to purely model dependent properties, such ав multiplicity and kinematics. The experimental data favor definitely the high multiplicity model. If we renormalize the data to the other theoretical spectra, the discrepancies at high energies grow very, large, even if we consider the er ror bars (not indicated here).
The primary mass effects, illustrated in figures 3 and 4, are strongly emphasized by the hadron spectrum. A comparison shows that even the lowest lying set of experimental data (7) lies well above the predicted spectrum for

375
iron initiated showers (curve Fe 56, fig. 3). Most of the measurements are in good agreement with the results obtained for proton primaries, or for very light nuclei. If we consider in addition the effect of rising cross sections, illustrated in figure;. 1, and estimate its influence on the iron initiated spectrum, show~n in figure 3, it becomes evident that the latter will drop even faster. Thus, the agreement with experiment would be even worse. Of course, the effect is expected to be somewhat attenuated in this case, because of the lower energy per nucleon at comparative total primary energies.
A similar comparison for muons shows that here the low energy data are in good agreement with the spectrum for primary iron nuclei. However,* at energies beyond 100 GeV the experimental points tend to be lower and drop even below the spectrum for primary protons. It is also instructive to compare figure 4 with figure 2f to recall the model effects. An important fact that must be kept in mind when comparing and correlating hadron and muon data is, that in most cases the respective results originate from completely different experiments. This may leave an additional degree of freedom in-asfar as hadron and muon data do not necessarily require the same normalization factor, when converting shower size to primary energy, for two different sets of data from apparently equal events.
We conclude from the above that multiplicity and primary mass effects can definitely be separated. Cross section effects, too, can be separated, however, they are somewhat masked by mass effects. Both tend to influence the spectra alike. Furthermore, we conclude that the primary composition in the air shower range up to at least 10 GeV is essentially the same as at much lower energies, i. e . , protons are still the dominating component.
References. 1) P. K.F . Grieder: Rev. del Nuovo Cimento. T_, No 1 (1977). I) P. K. F . Grieder: Institute for Nuclear Studies, University of Tokyo,
Report No. INS-J-125 (1970). 3) C.J . Waddington and P. S. Fre ie r : Proc. ХШ. imernat. Conf. on
Cosmic Rays, Denver, 4, 2449 (1973). 4) H. E. Dixon et al. : Proc. R. Soc. bond. A. 339, 157 (1974). 5) P. K.F. Grieder: EA-93, this conference. 6) P. K. F . Grieder: EA-94, this conference. 7) G. Tanahashi, J. Phys. Soc. Japan, 20, 883 (1965). 8) J. E. F . Baruch et al. : Proc. XIV. Internat. Cosmic Ray Conf.
Munich, 8, 2949 (1975). 9) E. BOhm et al. : Can. J. Phys. 46, S 50 (1968).
10) T. Matano et a l . : Acta. Phys Acad. Scient. Hung. 2Э, Suppl. 3, 451 (1970),
11) J .C . Earnshaw et al. : Can. J. Phys. 46, S 122 (1968). 12) S, Fukui et al. : Proc. IX. Internat. Conf. on Cosmic Rays,
London, Z, 642 (1965). 13) R.H. Vatcha and B. V. Sreekantan: J . Phys. A, 6, 1078 (1973).

376
THE EFFECTS OF LARGE TRANSVERSE MOMENTA ON AIR SHOWER
SPECTRA AND IMPLICATIONS FCR PARTICLE PRODUCTION MODELS.
Peter K. F. Grieder
Phys ikal i sches Institut, University of Bern, Switzerland
Abstract. The effects of energy dependent, large transverse momenta on air shower spectra and distributions have been investigated. It i s shown that in order to explain the exper i mentally observed lateral density distribution of energetic hadrons in air showers , the energy dependence of the t rans v e r s e momentum distribution must be such that i t s average value, too, i s affected, and not only the high momentum tail . However, no dramatic change of the average i s required to account for observat ions in events having a primary energy up to and even in e x c e s s of 10* GeV primary energy.
1. Introduction. The ex is tence of occasional ly very large transverse m o menta in very high energy hadronic col l i s ions has been known from cosmic ray experiments for more than ten y e a r s (1 ) . Today we know, chiefly from ISR and NAL experiments , that the c r o s s sect ion for the occurance of large t ransverse momenta is very smal l , however, it increase s significantly with energy in proton-proton co l l i s ions over the energy range from 100 GeV to wel l over 1000 GeV in the laboratory frame of reference (2).
A number of interesting and important questions a r i s e in connection with large t ransverse momenta. Some of these are related to the nature and d e tailed structure o£ the eventm, others concern the energy dependence of the transverse momentum distribution at much higher e n e r g i e s , i . e . , the a s y m p totic behavior. The former are evidently problems that must be studied by suitable acce lerator experiments , whereas the latter can only be trackled by means of high energy cosmic rays, at present.
This paper g ives a f irs t account of an investigation whose a im it is to study the consequences of large transverse momenta on air shower particle s p e c tra and distributions, in an attempt to answer the question concerning the energy dependence of the t ransverse momentum distribution, and of its average, of secondary particles emerging from very high energy hadronic c o l l i s i ons .
2. Assumptions for the Calculations. In principle, the particular type of model that is being used for such an analysis is of l e s s e r importance, provided that it is adequately real i s t ic . It i s n e c e s s a r y , of course , to carry out the comparison within the frame of a particular model , to avoid any masking of the effects due to large transverse momenta by kinematic and other model

377
effects.
The following three sets of calculations presented here were carried out within the frame of the SMFB two-component cluster model, described elsewhere (3, 4). The first set was calculated with the standard version, that has been used extensively in the past (3), Its distribution for computing the transverse momenta of secondary particles is energy independent. Apart from lower limits that may be imposed by phase space considerations, an absolute kinematic cut-off of 5. 0 GeV/c has been imposed on the distribution. This is well justified under the assumption that the distribution is energy independent, since transverse momenta of this magnitude are about ten orders of magnitude less probable than the average value at a laboratory energy of 1000 О - V.
For the second and third sets of calculations the transverse momentum distribution has been modified such that its average increases logarithmically with the center of mass and laboratory energy, respectively, above a given threshold.* The latter was chosen to be 50 GeV for the center of mass and 1000 GeV for the laboratory energy dependencies. The rate of rise has been chosen such that the average of the transverse momentum distributions, that is applicalbe to a 10 GeV laboratory energy initiated interaction, is 4 times that of a corresponding 10* GeV initiated event for the second set of calculations, and 8 times larger in the case of the third set.
3. Results and Discussion. The results of these calculation* are presented in figures I to 4. The numbers attached to the curves refer to the particular sets of calculations, outlined above. One expects, above all, that the lateral density distribution of shower particles be most affected by changes in the transverse momentum distribution of secondaries. This expectation is confirmed by figures 1 and 2. These show the lateral density distributions for two energy groups each, of hadrons and muons, respectively, for the three cases discussed here.
It is evident from these figures that the near-core region is most affected, and muons stronger than hadrons. The latter is a consequence of the fact that muons are essentially the sole direct decendents of the products resulting from very high energy hadronic interactions, occuring at great hight, where large transverse momenta are produced, that survive down to great atmospheric depths. Both figures show a strong depletion of the particle density in the vicinity of the core for the calculations with energy dependent, rising transverse momenta. One notices, too, that the low energy components of both, hadrons and muons, that are scattered further away from the shower axis, are not recovered at larger core distances (curves 2a and 3a, figures 1 and 2). The extended trajectories are chiefly responsible for the removal of a larger fraction of these particles through various processes. Only the more energetic particles overtake these effects and spread out to larger distances (curves 2b and 3b, figures I and 2), than the same group of particles in the case of an energy independent transverse momentum distribution (curve lb, figures 1 and 2), in spite of the fact that the total num-

?78
10"' 1 ТО К>г JO3
CORE DISTANCE[m] 10'1 1 10 10г 103
CORE DISTANCE [m]
Figure 1; Lateral density distribution of hadrons.
Figure 2: Lateral density distribution of muons.
10*
10J
tr ui §10'
a.
z 1 о cc < 10й
Ю-2
1 1 1 E„«106GeV Proton Primaries Zenith •£ -Sea Level
Cj>\ ^ ^ K N J \
4N • «Ret. 6 ^ L
• Ret.K) T i • Ret. 9 * Ret. И # Rel. 12
0' -
-
l 4 ' & *i. V •.
1 10 Ю2 103 10* ENERGY [GeV]
10*
Ю 3
QC Ш
§ 102
a Ю
1 in z О
Ю -2
*sx з^ч \
\ V
E0 = TO6 GeV Proton Primaries Zenith <t Sea Level
w о Rel. 12
. a Ref. 13 л Ref. 14
\
_ l X.
- 0 # -
V -\ \ • 1
10 102 Ю3
ENERGY [GeV] 10*
Figure 3: Integral energy spectra of hadrons.
Figure 4i Integral energy spectra of muons.

379
ber of kadrona and muons is smaller in the former cases.
It is also evident upon inspection of figures 3 and 4, that show the energy spectra of hadrons and muone, respectively, resulting from the three sets of calculations, that the total number of produced particles is less if the average transverse momentum increases with energy. This is because fewer particles can be produced at a given energy if a larger average transverse momentum is available for the created particles, due to energy conservation.
The shape of the energy spectra are very similar, as expected, since the basic model is the same for all three calculations. Only the high energy portion of the muon spectra deviate from each other. The relative enrichment of the content of muone having an energy in excess of some hundred GeV, which spectrum 2 and even more so, spectrum 3 of figure 4 show, is not due to statistical fluctuations. It is a consequence of the larger average 'ransverse momentum, that causes a more rapid spread of the bulk of the shower particles, away from the axis, after a few generations of interactions. As a result, even energetic pions traverse longer geometric trajectories per interaction mean £ree path, since they remain longer in the low density environment. Hence, a larger fraction of energetic pions is subject to decay, thus enriching a particular energy group of muons, in comparison to a corresponding group of pions resulting from an interaction where the average transverse momentum is energy independent. The deviations among the muon spectra above 1 TeV, shown in figure 4, is mainly statistical and much influenced by fluctuations in the height and multiplicity of the first interaction. Moreover, trajectory differences imposed by large transverse momenta at these large longitudinal momenta are vanishing.
4. Comparison with Experimental Data and Conclusions. Some experi- -mental data points are included in all four figures,for comparison (5 - 14). A more extensive compilation of experimental data together with a bsief discussion of the normalization problem are presented in two additional contributions to this conference (15). However, the data presented here are sufficient to lead us to the conclusion that the average transverse momentum imparted on secondary particles emerging from high energy hadronic collisions does not exhibit a dramatic energy dependence, but rises very slowly with energy. It is evident from our comparison that the average transverse momentum must rise even slower than had been assumed in case two. Its average value delivered to pions emerging from a 10 GeV (laboratory energy) collision appears to be less than four times that observed at accelerator energies. Otherwise, we cannot reproduce the observed lateral density distribution of particles in air showers at sea level in any reasonable simulation calculation. This conclusion is not in conflict with results from direct observation made with cloud chambers or emulsion stacks. More details concerning the energy dependence of the shape of the entire transverse momentum distribution are not yet available from this analysis.
It should also be noted that a strong energy dependence of the average trans-

380
verae momentum of hadroni i lowa down the rate of r i l e of the multiplicity with energy quite significantly. Consequently, a «low logarithmic mult ipl i city law and a too strong energy dependence of the t ransverse »~"*nentum appear to be incompatible with air shower observat ions.
5. Reference» .
1) Japanese-Brazi l ian Collaboration: M. Akashi et al ,: Proc , of IX.lnt. Conf. on Cosmic Rays , London, 2, p 744 (1965).
2) See for example H. Boggild and T. Ferbe l : vAnnual Rev. Nuc. Sci . 24, p p 4 5 1 - 513 (1974) .
3) P . K. F . Crieder; P r o c . XIV. Int. Cosmic Ray Conf. , Munich, 8, p 2889 and p 2895 (1975).
4) P . K. F . Grieder: Rivista del Nuovo Cimento, Jan. - M a r c h , (1977).
5) T. Kameda, T. Maeda, H. Oda and T. Sugihara: P r o c . IX. Int. Conf. on Cosmic Rays , London, 2, p 681 (1965) .
6) J. F . DeBeer , B. Holyoak, J. Wdowczyk and A. W. Wolfendale: Proc . Phys . Soc. 82, p 567 (1966).
7) B. Bonczak, R. Firkowski, J. Gawin, J. Hibner, R. Maze, J. Wdowczyk and A . Zawadzki: Can. J. Phys . 46 , p S 102 (1968).
8) G. Tanahashi: J. Phys . Soc. Japan £0, p 883 (1965).
9) J. E. F . Baruch, G. Brooke, E. W. Kellermann and Azar Rezazadeh: Proc . XIV. Int. Cosmic Ray Conf., Munich, 8, p 2949 (1975).
10) E. Bohm, R. F r i t s e , F . Kassner , U. Roose , M. Samorski , R. Staubert and J. Trttmper: Can. J. Phys . 46 , p S 50 (1968).
11) T. Matano, M. Machida, K. Otha and G. Tanahashi: Acta. Phys . Acad. Scient. Hung. 29, Suppl. 3, p 451 (1969).
12) S. Fukui, H. Hasegawa, T. Matano, I. Miura, M. Oda, K. Suga, G. Tanahashi and Y. Tanaka; Proc . IX. Int. Conf. on Cosmic Rays, London, 2, p 642 (1965).
13) J . C . Earnshaw, K.J . Orford, G. D. Rochester , K. E . Turver and A. B. Walton: Can. J. Phys . 46. p S 122 (1968).
14) R . H . Vatcha and B. V. Sreekantan: J. Phy». А, £ . р 1078 (1973).
15) P . K . F . Grieder; EA-93 and EA -94 this conference.

381
GLOBAL COMPARISON OF EXPERIMENTAL AND THEORETICAL AIR
SHOWER SPECTRA AND DISTRIBUTIONS, AND THE MOST LIKELY
MODEL OF HIGH ENERGY MULTIPARTICLE PRODUCTION
PART I: Energy Spectra
Peter K. F. Grieder
Physikalisches Institut, University of Bern, Switzerland
Abttract: An extensive compilation of experimental and theoretical hadron and muon energy spectra and lateral density distributions is presented. The theoretical work includes different but likely two-component cluster models of high energy interaction and multiparticle production. The scaling model is discussed in a separate contribution. Consideration has been given to all known effects that can obscure the interpretation of the data. In part I we compare and discuss the energy spectra. The lateral distributions are presented in part II, together with the overall conclusions.
1. Introduction. Our earlier attempts to find a unique phenomenological model of high energy interaction and particle production, that is valid e s sentially from the one-pion threshold well into the mid-range of cosmic ray air shower energies, i. e . , beyond 10 GeV primary energy, have been continued. In the course of this work we have been carrying out a large number of air, shower simulations, using a variety of very detailed models, that contain all relevant experimental facts, to study the model sensitivity of air shower observables and to compare the latter with experimental data. The current work considers the phenomena of rising cross sections, energy and mass dependent large trar averse momenta for all hadrons, as well as the existence of heavy primaries initiating the showers. However, the data concerning large transverse momenta are presented in a separate paper (1), and likewise, an attempt to resolve multiplicity, cross section and primary mass effects (2).
Our paat work has shown that the two component cluster model, i. e . , an isobar-fireball or fragmentation and pionization model, is most promising (3, 4). Such a model ia not only an off-spring of earlier cosmic ray work (5). Recent CERN ISR data can also be interpreted alike (6, 7). We have therefor* concentrated part of our current work to this kind of model, varying essentially only the dynamics of the central clusters (fireballs) and of their decay modes. Ths scaling model ia discussed separately, in another contribution to this conference (8).
In order to carry out an unbiased and reliable global comparison with experi-

382
mental data, it was necessary first to work out a comprehensive compilation of experimental data. Subsequently, the difficult task of normalizing these data to a common shower size, usually 10* particles, or a corresponding common primary energy of about 10* GeV, for which the bulk of our calcu-ations have been carried out, had to be preformed. In those cases where shower size or primary energy were close to these figure», the data were used without normalization. The experimental data were then devided into two groups. One comprising the sea level observations up to altitudes of 500 m, the other the mountain level data, covering an altitude between 1200 m and 3860 m. The corresponding levels for which the simulated data, used for the comparison, were calculated, are sea level and 3000 m. The latter is an acceptable compromise for most of the mountain level data. Only those experimented data were taken that were adequately well defined. No Chacaltaya data are included in this comparison as most of these data apply to very large showers, only.
The comparison of corresponding normalized data within a particular group is very instructive. The differences in absolute scale are a measure for the accuracy and reliability of the calibrations and normalizations, whereas the differences in (lope of the energy -nectra, and to some extent of the lateral density distributions, reflect chiefly the physics of the detectors, mostly that of the hadron detectors, the trigger criteria and also the age group to which the particular sample of recorded showers belongs. These topics will not be discussed separately but in conjunction with the simulation results in the following section.
As mentioned above, most of the simulated data presented here i re for showers initiated by primaries having an energy of 10* GeV. This simplifies the comparison considerably without losing too much significant information. It is a fact that the majority of the detailed experimental data are acquired in showers having a size between 10* and a few times 10* particles. Large arrays «that are equipped to detect and evaluate much larger showers efficiently are usually lacking the capability of recording the necessary had-ro'nic details in the vicinity of the core. Vice versa, smaller showers have inadequate particle densities, particularly at шел level, and are energetically uninteresting. Thus, showers that are initiated by primaries in the energy range between 10* and a few times 10~GeV represent in many ways an optimum compromise to study high energy interactions.
2. Energy Spectra. Combined experimental and theoretical hadron energy spectra at sea level and mountain altitude are presented in figures 1 and 2, repsectively. The experimental'data at sea level are relatively consistent. The different experiments agree well at moderate hadron enorgies but deviate more and more with increasing energy, due to the different slopes. This may be attributed to the different experimental methods and techniques used for the detection and energy determination of the particles, such as cloud chambers, total absorption spectrometers, calorimeters, emulsion chambers, etc . . However, even if.we consider the error bars, it is evident that the data occupy a reasonably narrow region. The latter lies

383
within a larger region that is bounded by two curves, labelled 2 and 4.
r.3
ENERGY [G«v] ENERGY [GeV]
Figure 1< Experimental and theor e t i c a l energy spectra of hadrons at sea l e v e l .
Figure 2 : Experimental end theor e t i c a l energy spectra of hadrons at mountain l e v e l .
These curves represent two rather different but not really extreme caaes. Curve 2 is the result of a simulation calculation using the earlier described IDFB model (9) (multiplicity nt a« E^i , asymptotically) with constant cross sections and primary protons,whereas curve 4 is for the SMFB model (10) (nj ac EVH , asymptotically) with constant cross sections and primary iron nuclei. The two curves 1 and 3 that lay inside this larger region represent hadron spectra for proton initiated showers, simulated with the SMFB model with constant cross sections and the IDFB model with logarithmically rising cross sections, respectively. These two curves happen to form the boundaries within which the majority of the experimental data (11 - 15) fall, even if we consider horizontal error bars. Only the cloud chamber data of Kameda et al. (12) lay partly outside and show a lesser slope.
The effects of rising cross sections and heavy primaries are rather strong. They affect the hadron spectra that result from low multiplicity models relatively stronger than those from high multiplicity models, because of the slower energy degradation, that is characteristic for the former. Spectra resulting from the SFB model, discussed in earlier papers (3, 9), are least affected since n, approaches E « at energies in excess of about 10* CeV. Likewise, spectra of heavy primariy initiated showers are also little affected because of the low energy per nucleon of the primary fragments. Thus,

384
curve 4 would be ilightly deeper if rising cross sections were included. On the other hand, the scaling model with its slow rising multiplicity is expected to show a significant steepening when rising cross sections are included, as compared to constant cross sections.
Thus, we conclude from these observations that a two-component cluster model of the IDFB or the very similar SMFB type, that includes rising cross sections, can describe the experimental data quite well. It also follows from this analysis that a power law is fully acceptable for the energy dependence of the multiplicity of secondaries and that the exponent must be larger than 0. 25 at laboratory energies in excess of 10*GeV. Moreover, it appears that the primary composition at 10" GeV is the same as at much lower energies, i. e . , it consists chiefly of protons.
The mountain level spectra illustrated in figure 2 show that the experimental data from smaller, less energetic showers (16, 17),agre« fairly well with the calculated spectra for 10» GeV proton initiated showers, using the IDFB model with rising cross sections. But also the SMFB model with rising cross sections (not shown in figure 2) yields similar results. It should be remembered that both, the IDFB and the SMFB model converge eventually to the SFB model form (single central fireball), at very low energies. Moreover, they do not yet differ significantly at 10* GeV.
If we compare the results from the 10* GeV calculations with corresponding experimental data (18, 19. 20), we notice that the latter have a steeper slope. This is contrary to expectations. Hadron spectra should have a smaller slope at higher altitudes because of a lesser energy degradation. If this observation is not an instrumental effect, the conclusion one has to draw is that either we are dealing with a significant fraction of heavy primaries, since the slope agrees with the spectrum for iton initiated showers (curve 3), or, the nature of the interaction changes with energy, as proposed by Miyake a long time ago (21).
The first conclusion is in contradiction with those made before when discussing figure 1. Hence, we must seriously consider and explore the second, i. e . , the possibility of a changing nature of strong'interactions at very high energies. Besides the fact that more data are needed to resolve this problem, we should also stress the necessity for low energy hadron data, above all at mounatin level. These data are also important because of the large number of particles involved and for calibration purposes. Such data would improve the accuracy and reliability of conclusions drawn from simulation date.
The muon energy apectra are vary similar at sea level and mountain altitudes up to about 3000 m, even though the muon population changes considerably within a shower over this distance (4, 10). Figure 3 shows four simulated spectra and a series of experimental points (22 - 29). Curvee 1 to 3' are the results of proton initiated showers using the SMFB and SFB models, both with constant cross sections, and the IDFB model with rising cross sections, respectively. Curve 4 is for primary iron nuclei and the SMFB

385
model with constant croi» aectiona. The high energy portion of the muon spectrum (howl a clear model and с roia tection sensitive behavior. Heavy primaries manifest themselves essentially in the low energy portion of the spectrum, where they enhance the flux of muon» by about a factor of two with respect to curves 1 and 3.
The experimental points follow curves 2 and 4 very closely up to a few 100 GeV. However, the slope of curves 1 and 3 are very similar over this energy region and it is cheifly a question ,of normalization to fit the experimental points with these curves. Above 300 GeV the experimental data are statistically very poor and there are no data above 800 GeV.
The large error bars and die lacking data do not allow to draw any conclusion about the trend of the experiment tal spectrum much beyond 1 TeV. This is most unfortunate as this portion of the spectrum holds a major key to answer vital questions concerning the kinematics and dynamics of the most energetic interactions that take place in air showers. Without this information it will be very difficult to prove the validity and uniqueness of particular properties of interaction models at very high energies. Thus, we need very urgently more data on high energy muons in air showers.
Further implications concerning the energy spectra are discussed in conjunction with the lateral distributions in part II of this paper.
3. References.
1) P. K. F. Grieder.' ЕЛ-92, this conference. 2) P. K. F. Grieder: EA-91. this conference. 3) P. K.T. Grieder: Institute of Nuclear Studies, University of Tokyo,
Report No INS-J-125 (1970). 4) P. K. F. Grieder: Rev. del Nuovo Cimento, 7, No. 1 (1977). ?) Y. Pal and B. Peters: Mat. Fys. Medd. Dan. Vid. Selsk. 33,
No. 15 (1964).
10 10 10 ENERGY [GeV]
Figure 3; Experimental and theoretical energy spectra of muons. .Theoretical curves apply to sea levsl but are similar at 3000 m.

38b 6) G. Bel lett ini: Invited Paper, V. International Conference on High
Energy Colliaion», Stony Brook (1973).
7) T. Del Prete: Rev. del Nuovo Cimento, 5, p 532 1975).
8) P. K . F . Crieder: EA-81 , thia conference.
9) P K. F . Griedar: Proc . ХШ. Internat. Coamic Ray Conf., Denver, 4 , 2639 (1973).
10) P. K . F . Grleder: Proc . XIV. Internat. Coamic Ray Conf., Munich, 8, 2889 (1975) .
11) G. Tanahaahi: J. Phya. Soc. Japan, 20, 883 (1965).
12) T. Kameda e t a l . : Proc . IX. Internal. Conf. on Coamic Ray*, London, Z, 681 (1965).
13) E. 3 o h m at a l . : Can. J. Phya. 46, S 50 (1968).
14) T. Matano et a l . : Acta. Phya. Acad. Scient. Hung. 29, Suppl. 3, 451 (1970).
15) J. Е. Г . Baruch at a l . : Proc . XIV. Internat. Coamic Ray Conf., Munich, 8, 2949 (1975) .
16) R. van Staa et a l . : P r o c . ХШ. Internat. Coamic Raya Conf., Denver, 4, 2676 (1973) and J . Phya. A, 7, 135 (1974).
17) O.J . Dovzhenko e t a l . : Proc . VI. Internat. Conf. on Coamic Raya, Moacow. 2. 144 (1959).
18) B. K. Chatterjee e t a l . : Can. J. Phya. 46, S 136 (1968).
19) R. H. Vatcha and B. V. Sreekantan: P r o c . ХШ. Internat. Coamic Ray Conf., Denver, 4, 2625 (1973).
20) S. Miyake e t a l . : Acta Phya. Acad. Scient. Hung. 29, Suppl. 3, 461 (1970).
21) S. Miyake: J. Phy*. Soc. Japan, 17. Suppl. A-III, p 291 (1962).
22) J . C . Earnahaw et a l . : Can. J. Phya. 46, S 122 (1968).
23) S. Fukui et a l . : Proc . IX. Internat. Conf. on Coamic Raya, London, 2, 642 (1965).
24) B. K. Chatterjee at a l . : Can. J. Phya. 46, S 13 (1968) .
25) A. D. Erlykln e t a l . : Proc . XIII. Internat. Coamic Ray Conf., Denver, 4, 2500 (1973) .
26) S .R. Rozhdeatvenaky et a l . . - P r o c . XIV. Internat. Coamic Ray Conf., Munich, 8, 2790 (1975)
27) V . S . Aaeikin e t a l . : Proc . XL Internat. Coamic Ray Conf., Horbart (Taamania) , 6, 2132 (1971).
28) S .N Vernov at al: Acta Phya. Acad. Sciant. Hung. 29, Suppl. 3, 429 (1970).
29) R . H . Vatcha and B. V. Sreakantaa: J. Phya. A, b, 1078 (1973).

387 GLOBAL COMPARISON OF EXPERIMENTAL AND THEORETICAL AIR
SHOWER SPECTRA AND DISTRIBUTIONS. AND THE MOST LIKELY MODEL OF HIGH ENERGY MULTIPARTICLE PRODUCTION
PART II: Lateral Distributions and Overall Conclusion* Peter K. F. Grieder
Physikalisches In»titut, University of Bern, Switzerland
Abstract: We discujf first the lateral density distributions of hadrons and muons in air showers. The theoretical data used for comparison with the experimental results are front the same calculations as outlined in part I. Discussion and conclusion cover both, parts I and II. We conclude that with increasing energy a) the central region contributes an increasing fraction of all secondaries, b) the fragmentation region remains energetically dominating and c) a two-component cluster model gives a good description of the phenomenology of very high energy interactions.
I. Introduction. In part I of this paper (EA-93) we have discussed the theoretical and experimental aspects of the energy spectra of hadrons and muons in air showers. Here, we will now deal with the lateral density distributions of these two groups cf particles. The theoretical considerations are kept within the same frame of models for multiparticle production, as outlined in part I. Subsequently, the combined result* from both papers are summarized and overall conclusions are drawn.
Some of the references referred to in this paper have already* been used in part I. In order to avoid a partial duplication, 'we are re-using these references with the same numbers, here. "New, additional references are listed in the back of this paper and have numbers that are consecutive to the previous list.
2. Lateral Density Distributions. A selection of theoretical and experimental lateral density distributions of hadrons are shown in figures 1 to 3. The data are again divided into two group*, as before, according to altitude of observation. One includes ше* level (fig. 1), the other mountain level data ( fig. 2 and 3). The latter cover an altitude ranging from 2200 ,m to , 2900 m.
A rough inspection of the experimental data shows that the majority are consistent at moderate core distances. There, corresponding data from different experiments show similar densities and slopes. Larger deviations occur either very near the shower axis, particularly among the lower energy measurements, or, at relatively great distances, mostly for energetic particles.

388
at sea level. The former may be partly due to errors in the core position, whereas the latter can be attributed to inadequate statistics. Of course, one is also faced with the problem of normalization. Calibration with respect to shower size is only one of the problems. More difficult to account for are differences in detector response and energy calibration of hadron detectors, that are used in conjunction with the lateral distribution measurements.
The theoretical distributions shown for comparison in these figures are for proton initiated showers that were simulated with the SMFB model, using constant сгрее sections and an energy independent transverae momentum distribution. Neither rising cross sections nor heavy primaries change the shape of the lateral distribution of hadrons significantly (4,10). Only the absolute number of particles in a shower and the densities are slightly affected, provided that we compare events that have the вате total primary energy. The effects of large transverse momenta, rising cross sections and heavy primaries'are discussed in greater d-*ail in two other contributions to this conference (1, 2).
10"' 1 10 10' CORE DISTANCE [m]
Mountain Level 2200 - 29O0 m E„ -10 6 Gev SMFB Model
AN
п Ftef.31 .Ne-S.0-13-104
ю-' 10 10' СОВЕ DISTANCE fm]
Figure 1 : La tera l density d i s t r i b u t ion o-F hadrons at sea l e v e l .
Figure 2 i La tera l density d i s t r i b u t ion of hadrons a t mountain l e v e l .
It will be noticed that the slopes of the experimental distributions decrease in general more rapidly with decreasing core distance than those predicted by the SMFB model. This trend is emphasized at elevated observation levels, as is evident from figures 2 and 3. The higher multiplicity SFB model (3, 9), not indicated in these figures, produces distributions that have the least slope at small and intermediate distances from the core, of all comparative models that we have studied, so far. In spite of this, the slope is still too large within the first few meters from the shower axis. At larger distances

389
the agreement i s good in either свае, except for the very energetic part ic les , that s e e m to scatter out to larger distances than expected.
ш 10'
z ° in3 or 10 a < x
"»5"*^6
>tOOG*V
1 — »»00G»v V Rule scaled 10-limcs
-L_ - J _ 1 10 I 10 CORE DISTANCE [m]
Figure 3; Lateral density distribution of hadrons at mountain level. Theoretical curves are for 3000 m.
£ 1
oiio"
' - - ^ o 4
fNSB V r
J *
Екр. Data < Ref. 33 о Ref 3* о Ref 30 * R * f 3S о Re! 13
. + Ref 36 ж Ret 37
? R e U 3 8
к j Е Е Е
Sea Level Normalized to N, = !05
^ ^ > V WRSb.
=»2GeV v$S*
>0.3GeV i V . =»t Gev « *
*»«5:s 10 1 10 10' 101
CORE DISTANCE [ f !
Figure 4: La te ra l d i s t r i b u t i o n of mucins. Theoret ica l spectra ara fo r energies la rger than 1.0 GeV.
The trend'of the experimental data to exhibit a flattening of the lateral d i s t r i bution of hadrons, a s outlined above, appears to be real and systemat ic . It wi l l be shown in a separate paper (1) that this trend cannot be explained on the bas i s of a significant increase of the c r o s s sect ions for large t ransverse momenta with increasing energy, only. The entire distribution must be affected such that the average t ransverse momentum manifests a modest e n ergy dependence, too.
Our experimental survey shows that the number of data on the lateral density distribution of muons in air showers i s much larger than the c o r r e sponding figure for hadrons. This i s evident from figures 4, 5 and 6. The theoret ical distributions shown in these figures are labelled from 1 to 4. Equal labels imply equal mode l s and pr imaries . Thus curves 1 to 3 in f igures 4, 5 and 6 are for proton initiated showers , calculated with the SMFB, SFB and IDFB models , respect ive ly . The f irs t two are for constant c r o s s sect ions whereas the third includes r i s ing c r o s s sec t ions . Curves 4 are for iron nuclei initiated showers and the SMFB model with constant c r o s s s e c tions.
We note with satisfaction that the data from any particular exper iment at s ea l e v e l or mountain altitude, are very consistent and show a rather smal l scatter . Furthermore, considering the spread in shower s i ze and age group, '•he differences in layout and instrumentation, we must admit that the different exper iments , too, yie ld fairly consistent re su l t s . It is a l so evident that the c lass i f iact ion according to age is very important s ince the muon lateral

390
CORE DISTANCE [m] Figure 5: Lateral distribution of muons. Experimental data are for energies larger than 10 GeV.
Е 1
ю-'
;S>^ *i.o*s«i2 - 7 ^ w «U<S«16
«S^L
\
0 Н»-Ю-1Л»0 5
• чг-.«-аг-к>5
О К*«3.2-5.6-Ю5
л E^OSGev 1 Ne*2-5K> 5
Г Z770 m
ЕЦ>50«У \ 3340m
R-141
1 10 10' Ю3
CORE DISTANCE lm) 10'
Figure 6: La te ra l d i s t r i b u t i o n of muons. Theoret ica l curves are fo r 3000 m and an energy 10 GeV.
distributions are quite sensitive to shower age. A comparison with the predicted distributions for 20 GeV muone at sea level shows that the SFB model (curves' 2) gives an excellent fit to only one set of experimental data (fig. 5). But the absolute densities which this model yields for medium and large distances are in good agreement with most experiments. We must stress the fact that all theoretical data shown in figures 4 to 6 are based on a standard, energy independent-transverse momentum distribution.
If we normalise curves 1, 3 and 4 to the most likely experimental distributions, we observe that the theoretical densities rise too fast at small dis- . tances from the core. Hence the discrepancy is of the same nature as we have noticed before, when discussing the hadron distributions. We will show in a separate paper mentioned above (1) that here, too, a minor energy dependence of the average transverse momentum as well as an extension of its distribution will lower the theoretical lateral distributions nea'r the shower axil. It will alio increase densities of the energetic components of hadrons and muons at larger distances and helps to establish agreement chiefly in shape, but also in absolute densities, provided that we readjust the normalization slightly.
The experimental muon distribution* at high altitude exhibit the same characteristic features as at sea level. This is evident from figure 6. The consistency of these data is striking.
3. Discussion and Conclusions. Many of our efforts have been devoted to the determination of the hirarchy of the model and parameter sensitivity of

391
air ihower observable, and to the autdy of correlation! among obaervable quantities. These yield valuable information that can nerve aa a guide for future experimental work. Another important question that awaits an answer is: Which one is the "correct model" for describing high energy interaction and multiparticle production processes, and is this model unique.
Table I: Model and Parameter Senaitivity of Air Shower Obaervablea.
Ob»erv.able
N
« N B
N H , H E
V E > i ! E
V E « E
N И
И » , Н Е
VE>L*E VE1H*E
< W L E <W>HE Н Х ( Г . Е)
N / N 1» •
X
Sensitivity w. r. t. Madclt or P ir tmct t t r i
Eo V * ' a. Mod. , kin. i <T. h .
M , <S , Mod. , a, k in . , к ;
т. Med, . k i n , , t decay dominated)
M , S , Mod. , k in . , a. h . о а
Mod. , e. k in . . M . S . h . о о
Mod. . k in . . . , H . 0» . к . о о
a. Mod. . k i n , . (decay dominated]
Mod. , k in . , е. Ы , S . h . о ' о
a. Mod. , n . 6 .
Mod. . e, k in . , 6 , к . о
е
Лее . h e , S . M e
< F, > (Е) . »tr<Mod. M e . « . h
** М
о
М.
М.
М.
М.
ТаН» 1: Utt «Г ЯрЛЛш м * Д М т к М т .
N H . H S 1 „ f MMftvar «I M|fc Marty \.не J N„(E) I
V « м г м носатат «Г
haslna»
I r i m i
(Nu /H I . - l fle>1 * > e ie iM • > • • • гена» etc Уемгег
<V"A.cJ UJ Nx1tf. Bt * * • » *шМШЧт to «« i«« t
M И м г г " * * •
• пас la** * MtiMctotM и K 4 M rati»
С « • • • ttcHMt
» t Г М • * • ! • • meMMMtHlfl аНИгНИаЫМ.
h Might •** tint imttntUtn
£ «и^Р- ^"Ь^— LB 1 f U . 1
HI J I hH* J N tkmr Ми
N / N f l NMMt tWlNR Г»Ы*
Ja. fr . * ) «wwitr АаЫЬмйв. U f i m i l
** tlTtc. M lm«rRn«dMa« cert tit « и м *
Ш*. M M
kin. •! Mm* tic a
< f ( > W «ЧГ|Т *tfja*M|*jee. * f *Jf>^

392
Definite ana w e n can now be given to aome of the questions mentioned above. For others only tentative answers can be offered. We have to refrain from a lengthy discuss ion on the foundations of our answers and conclusions , it would surpass the scope of this paper. F o r a detailed account the reader i s referred to a recent review (4). However, an attempt has been made to summarize part of our resul ts concerning the model and parameter sensit ivity of air shower observables in a highly condensed qualitative form, in table 1.
We conclude on the b a s i s of the comparison between experimental and theoret ical data', presented in parts I and II of this paper, that a tv. о-component c luster model , such as the SMFB or IDFB model , i s capable to descr ibe the phenomenology of air shower particle spectra .and distributions within the frame of a simulation calculation very well . This impl ies that, from the point of view of particle production, the central region, i. e . , the region of smal l rapidity, becomes more and more important with increasing col l i s ion energy. The fraction of secondaries that occupy this region i n c r e a s e s with energy. However, energet ical ly the forward fragmentation region maintains its dominating role. Leading particle effect and l imited fragmentation, which are c lose ly linked, remain valid even at air" shower e n e r g i e s . The introduction of rising c r o s s sect ions , large transverse momenta and the cons ideration of heavy pr imaries , d i s c u s s e d e l sewhere ( 1 , 2), do not alter these conc lus ions significantly.
References . 1) to 29) For these re ferences see previous paper, EA-93 . 30) R. Fr i txe et al. : Acta Phys. Acad. S c i e n t Hung. 2?.. Suppl. 3,
439 (1970). 31) R .H. Vatcha and B, V. Sreekantan: J. Phys . A, 6, 1 0 5 0 ( 1 9 7 3 ) . 32) H. Yoshii: J. Phys . Soc. Japan, 32, 295 (1972). 33) J . F . De Beer et al. : Proc . Phys . Soc. 89, 5 6 7 ( 1 9 6 6 ) . 34) R. Staubert et al . : Acta Phys . Acad. Scient. Hung. 29, Suppl. 3
661 (1970). 35) B. Bonczak et a l . : Can. J. Phys . 46, S.I02 (1968). 36) P . R. Blake et al: XIV. Internat. Cosmic Ray Conf. , Munich,
8, 2768 (1975). 37) H. E. Dixon et a l . : Proc . XIII. Internat. Cosmic Ray Conf.,
Denver, 4, 2556 (1973). 38) G .B . Khrist iansen et a l , : XIV. Internat. Cosmic Ray Conf.,
Munich, 8, 2801 (1975). 39) G. B . Khrist iansen et a l . : Proc . XI. Internat. Conf . ,on Cosmic
Rays , Hobart (Tasmania) 6, 2079 (1971) . 40) N. P., Iliyna et a l . : XI. Internat. Conf. on Cosmic Rays , Hobart
(Tasmania) i , 2 1 0 9 ( 1 9 7 1 ) . 41) V . S . Asaikin at a l . : XIV. Internat. Cosmic Ray Conf.. Munich,
8. 2807 (1975). 42) S. Miyake et a l . : Can. J. Phys . 46. S 107 (1968).

393
SBISITIVITX OF VARIOUS U S PROPERTIES TO PRIMARY MASS COMMSniOH A M HIGH EHERQX COLUSIOB MODUS
J.Olejnletak, J.Wdowcxyk and I.ZuJewaka, Inatituta of Hucleer Reoeareh and University of tod». Lode, ul.Uniwereytecka 5, Poland.
Tha experimental data on exteneive air ahowtra art analyaed and coaparad with pradictlona baatd on models of high energy collisions in which Multiplicity of secondsry particles incraaaoa ее power law. It la shown that such aodelo together with rtaaonabla assumptions about primary вааа eoapoaition give auch batter dsaeription of BAS propcrtioa than tha model baaad on Scaling.
1. Introduction. It haa baan shown by Olejnicxak at al. /1977. aee alio HX-J4/ that it ataaa тагу difficult to obtain a oonalatcnt picture of U S development eeauaing validity of Sealing. In that papar /to ba rafarand aa I/ variety of tho data on U S have bean analysed taking m» a frae paraaatar the effective average вааа of tho priaary particles. In general it haa been deaonetrated that tha requireaante for different paraaatera leade to different and In fact contradictory dependences of the A effective on energy.
In I /aee also OQ 148/ there waa obtained a priaary вааа eoapoaition at tO'5 - IO,b aV which follows froa careful extrapolation of the experimental data froa lowar energiee /below ~ 10'? eV per partiele/. In the extrapolation among othara allowance haa been aada for propertiea of the coenie ray propagation in tha Galaxy.
tha present work eontaina analysis of a siailar type aa in I but for tha models with faater increaaa of multiplicity, naaely the Bodele baaed on the.ao-called CKP formula with multiplicity dapendencaa na « 2.7 1К» end n# • 0.57 I'« have been taken /1 - energy in OeV/. 2. Total number of muons aa a function of ahower alia. The predicted dependencies of >. vere R e f o r the two considered models and for two different assumptions about the aaaa of priaary partiolea /protons, the nixed eoapoaition Mentioned earlier/ are given In Figure 1.
The experimental pointa take* after Xhristianatn and Kalmykov /197$/ lay between the prediction* of the two model*. The conclusion that the aaa* aort of intermediate model ie the right one, however,

394
Figure t. Total nuabtr of muone of aa a fuaotlaa af tha ahower aise.
at thi* atego ia certainly preaature. Tha model» uaad hera eartainly ara to crude, thara are certainly a nuaber of paramotera which ara unknown and which aay change the various prediction* to put.them cloaer to the experimental data. Ona amy quota hare euch paraaatera aa tha total croee-eection, eompoaitioi of tha aacondary particle a, primary aaaa eoapoaition and other. Iffaet of varloue parameter of thet type ia known to be not vary aignifleant, but variation of order of 90 • certainly ia acceptable and would be auffieient for agreeing the pointa with predictlona of other model.
It ahould ba alao reaeabered that the experimental pointa aay ba of a aubject of eyatemetical errora. That errors-on tha level of 20 - 30 «are atill poaaibla. Э. The analvaia of the effective адее needed on tha baaia of varioua experimental d a t a . T h e affective average maaaaa needed for explanation of the 'obaerved values of three ahower parametere /depth of maximum, */•. vara Ma and absorption length -A / aa a function of energy ara given in Figure 2 for the eaaa of tha model with na * V/A. The affective maaaea for the aaaa perametera and for the considered in thia paper mixed maee conpoeition taken after I are given in Figure 3. Tha effective aaaa ia defined here aa a aaaa of a pure beam of particlae which would give the eame effaet »ш tha mixture resulting from tho assumed mass composition.

395
Ep[.v] Figure 2. ж off venue prlaary energy for tha caaa of tht *etenderd" wxl«l.
Rf« 100-
«
-Depth ol mo».
КГ «* ** Cp(«vi
Figure 3. A off тага prinerj energy for-the aixed coapoeition eonaldopad In tho paper.
It can be aaan that tha needed offeotivo naaaaa are clearly higher than thoae following fron the addoptad а м а ooapoaltion but the difference le not too draatio, clear!» aaallar than in the oaae of Sealing /eee H«-J4/.

396 1 /2
In the eaaa of the high multiplicity model /n» ~ Ж " / the needed effective мааеа are rather cloae to unity. The situation in the caaa of the dapth of ahower aaxiauB la given in Figure 4. In the,figure there la alao plotted the curve correaponding to na «v I and inoreaaing croea-aection. It ia aaan that in thla eaaa although the height of aexiaua alightly inoraaaaa the agreement ia practically not improved.
n-1
M*l Figure 4. Depth of the ahower aaxlaum
for varioua node la.
Froa the inapection of the figures 2 - 4 the eoncluaion of the aaaa character aa that given, ia the pravioua paragraph can bt drown. The Model witb/D» ~ I ' ааева to be not aufficien and the Multiplicity n§ ~ I '* already to high /whan alxed cospoeition ia aeaumed/, but thie concluaion by no веапа is definite. 4. Huon to electron ratio fluctuations. In Figure 5 the fluctuation! of я>/И* ratio are given for the two coneidered •odela. The pure proton' beam and the conaidered in the preaent paper aixed compoaition are assumed. It ia aaan that the fluctuation! in the caaa ara aaaller than for the pure proton beam. This ia especially clearly aeen in the aedal with high multiplicity.

397
Figure 5. Jlelative width of tha 4/i/H» ratio fluctuation*.
5. Coneluaione. Tha conaidarad htra aodela with power law incraaaa of auitiplicity of th» aecondary partielaa produced in high energy eolliaiona give audi better deaeription of the propartiea ofextenaive air ehowere than tha aodel baaad on Sealing.
In general if the priaary aaaa coapoaition ie taken on th* baaia of raaaonable extrapolation of the data froa lower enorgiea tha beat fit to tha EAS data ia obtaiaed taking apdal with aultiplicity intaraadiate between n, л Г * шпа n a ~ i v * . However, due to uneertaintiea both in propartiea of high energy eolliaiona and priaary aaaa th* laat eoneluaion ehould be conaidared only aa a tort of indication. At th* pr*a*nt aoatnt it aeaaa relatively eaay to reconcile the reault with either the aultipl'leity lew by appropriate choice of the other paraaatera of the aodel or priaary particle aaaa. Certainly tha adjuataent hare ia auoh eaaier than in the caae of Scaling! if in the latar eaaa were poaeible at all.
«aferance». Kbriatianaen O.B. and Ха1вукот И."., 1975, Proc. 14 t h Int.Conf.
on Coaaic Raya, Mflnchen, 2861. Olajniczak J. at a l . , 1977, J.of Phya., / in preaa/. Shibata I . , 1979, Proc. 14 t h Int.Conf.on Coeaic Ray*, Mflnehen,
S, 29Ю.

390 A Detailed Approach to the Structure of
the Sxtensive Air Showers ( I - Fluctuations)
b.fopova,
Snetitutе of Nuclear Hesearch and uclear Energy, Bulgarian Academy of Sciences, Sofia,Bulgaria
Correlations between the measured shower characteristics at 690 g/csT and the parameters of the high energy interactions have been investigated.Fluctuations of the muon density have been discussed on the basis of models with power law of the multiplicity.
Introduction» Some general problems about* the high energy interactions and the nature of the primaries require a detailed investigation of the EAS structure taking into account the fluctuations of the measured values,the contribution of the successive hadron interactions on the experimental data and their correlations with the different parameters of the elementary act.
In the present paper the main parameters of the interaction: the inelasticity cross section,the multiplicity of the secondaries and their transverse momenta as well aa the nature of the primary particles in the energy range 101* eV -1016 eV have been discussed on the basis of the experimental data from lien Shan station (the muon-electron ratio,the mean values and the fluctuations of the muon density at different distances).
Ihe assumption about the*mode of interactions and the primary spectrum as well as the method of calculations are explained in the paper of Fopova L, and Popov O.-this Conference,ЯА-99» general Characteristics. As it has been mentioned in the paper of Popovs et al.,ithis Conference') the main snower characteristics har l-> be calculated for a fixed shower size /Ne/,

399 taking into account the conditions of the experiment.That ha» been done in the precent work and the effect due to the fluctuationa has become evident.
On Sable I there are preaenred the reeults ot the calculation for the case of a fixed primary energy JJQ and for a fixed shower aise K9.There are assumed a pure proton primary spectrum (with a slope 2.6) and a composite primary spectrum after the paper of Olejniczak et al.,1977.
XABLB I Characteristics of SAS for a fixed primary energyftg) B0/GaT/
». !y>5GaV) j>(8m)/m-? ^ОЗОш/вГ?
10*
4.62 >104
6.39 <102
0.22 0.14 «ID*
10b
5.21 »105
4.02 »103
1.48 0.83 « 10*
w' 5.55 * 10* 2.51 « 10* 1.12.. 101
1.04 «10*
Characteristics of EAF for a given sice (lO (Proton primary composition)
% р^(130т)
105 0.24.10
1,8»105 8 8.37.10*
3.2.105
O.57.l0z 6.105
0.90*10г 1.8*Юб
0.31,. Ю 1
Characteristics of SAS for a fixed else (I»e) (Composite primary spectrum)
«.
"rttSPj-O />,.*) ^Jfl30m)
Ю 5
J.22**0* 0.39 0.28,10*
1.8.10s
I.95.10-» 1.64 ).43«lOi!
3.2.105
J.W..103
1.03 Э.67,10*
6»105
5.12.103
1.74 i,oo«iOa
10b
7.53.10*
1.d 10b
1.25.Ю4
The existence of hsaVy primaries change considerably the main characteristics.The X /Horatio increasea by a factor of 1.3»

400 Espatially the density fluctuations are sensitive to
the primary шазз composition. Kaon Density Fluctuations. In this aspect a very important information can be given by the fluctuation investigations. Experimentally the fluctuations of the muon to electron ratio fluctuations axe measured.For that reason in the present work the fluctuations of the muon density have been calculated for a giv.n siae following the experimental conditiona(£A-99).
On ths table II and M.g.1 the obtained fluctuations of the
muon density assuming a pure proton аз well as a mixed primary composition are compared with some of the experimental values, taken from the paper of Betev at al.thls Conference,EA-38.
.6
.3
.4
,i
.1
о/РуГ
, Composite Primary Spectrum
iflL ProtoirTrimarj
Spectrum
•l t i l \0 Г С ™ 1 <°o
Figure I.Muon Density Fluctuations in,ShowersI (1.8X10⁵ -1.8„106)
It is evident that there is a general agreement between the fluctuations detected at Tien Shan station and tiK.ee predicted by our models.The fluctuations calculated for a pure proton spectrum are about two times smaller ta.su those fo» a mixed primary composition.2hat gives a poaibility to draw a conclusion about the primary spectrum on the basis o$6uch investigations.From the present results it is obvious that they are in a better agreement assuming a OIXDJ primary composition.

401 Talcing into account the experimental accuracy from Pig.1'"4*
ie evident that the predicted dependence of the «won density fluct uation oft. the dietance from the core has not been supported by the experimental data. A eimilar tendency of an indonepdence of the muon deneity fluctuations on the distance from the core ehovr the experimental data of Dsikowekl et al. (this Conference M-21).
The theoretioaly obtained dependence of the muon density fluctuations on radial distance for the present model can be explained mostly by the fluctuations of the depth of the first interaction. They have something more influence on the muon density at large distances. It is illustrated on the Fig.. 2, where the contribution from the first interaction to the muon density at 8m,52m and 130 a are put versus the depth of the interaction. In thj limited interval - by dash lines - where predominantly is the- place of the first interaction, the slope of the curves becomes steeper getting far from the axis.
ttABbB II Experimental data about the muon deneity fluctuations
(mean value from paper EA-38,this Conference) FT 1L..10 1-1.8 1.8-3.2 3.2-5,6 5.6-10 10-18
Й-1СШ 0.46*0.06 «-38a 0.46+0.03 Ячвйп О.Э7+.0.03
Calculated results about the muon density fluctuations (for composite primary spectrum)
R-8m 0.20 0.22 0.2Э 0.25 R«130m 0.57 Г 0.60 0.62 0.68 0.72
Calculated results about the muon deneity fluctuations primary spectrum) _££or_
B-13UB 0.30 0.31 0.32 0.34
^""'"WHgl conclude that the present results about the rauon
density fluctuations on mountain altitude support the
assumption tk'att the primary particles are prsdomimently heavy
nuclei*,rather than protons.

402
Che with of the fluctuations confirmes also the model with high multiplicity rather than the standard model.The relative fluctuations obtained by assuming the standard model (n г*И /4 ) are about 10J» less than those that gives the high multiplicity model, assuming for the width of the fluctuations of the multiplicity 6/ng =0.5 .
The present results on the fluctuations of the muon densities of 3A3 at mountain altitudes show the optimistical fact that the observed fluctuations are strongly affected, by the, primary mass composition and the
fobo kind of the elementary interactions.In this way,the muon fluctuation investigations are real tool for studing the primaries in this energy range.
It is evident.nevertheless,that it is neccessary to do some more work for a sake to be explained the observed disagreement,especially about the lateral distribution of the muon density fluctuations.
References Popova L.and Popov 0.,1977,Kiis Conference,EA-99. Betev B.et al.,1977,this Conference 2A-36 Deikowski et al.,1977,This Conference,'BA-21 Olejniczak J.et al.,1977,J.Phys.G,in press.
100 Depth of interaction/g/cm' Pig.2,Dependence of the Muon Density Fluctuations on the Depth of the first Interaction.

403 A Detailed Approach to the Structure of the Estensive Air Showers ( и . Correlations)
L.Popova, Institute of Nuclear Research and Nuclear Energy, Bulgarian Academy of Sciences, Sofia,Bulgaria
Correlations between the measured shower characteristics at 690 g/cm and the parameters of the high energy Interactions have been' investigated.**» problem of the primary mass composition has been treated in this aspect.
Introduction. In connection with the previous paper (this Conference ,£А-9б), the correlations between the measured shower characteristics at 690 g/cm and the parameters of the high energy interactions have been investigated.lt has been done for the total number of the electrons and muone(>5CeV) and for the muon density at different radial distances measured by the Tien Shan apparatoua.Special attention has been thrown to the inelastic cross section in the energy interval of question (10"eV-10 eV),the Inelasticity eoeffi-clent ind the multiplicity of the secondaries.The theoretical investigations has been made on the basis of several modification of the elementary interaction model with a power multiplicity law, see paper EA-96 .this Conference)*
The problem of the primary mass composition has been also treated in this aspect*
Correlations of the Muon and Electron Total Number. On the basis of several handreds simulated proton showers-the correlations between the main parameters of the applyed models of elementary interactions and the electron and muon total numbers have been studied,An especial attention deserve the correlations

404
with the mean free path and the hight of the first hadron
interaction.She correlations of the muon number with these
values are much bigger than those of the electron numbers.It
is illustrated on figure 1 a,b,c.
This fact supports the assumption of a considerable incjt
rcase of the interaction cross sections,that cauld improve the
muon-electron ratio consistence with the experimental data on
the showers at mountain altidudea (Popova and Idowceyk,1977)»
This problem has been treated in more detallpjin the paper of
Popova et al,1976.There it has been shown that by increasing
the inelastic cross section,in the frame of the theoretical pre
dictions,the electron number change is negligible,beoause the
electron cascade curves for models with pawer laws of the multi
plicity have their maxima near the mentioned mountain level.
She number of muons rises considerable with the increasing
of the inelastic cross section.The muon cascade hare not ricjbed
their maxima and there is a domination of the processes of
particle multiplying,
Muon Lateral Distribut&on.The calculated lateral muon distri
bution for a given primary energy in a proton shower ie compared
with the experimental data from lien Shan station on Fig.2 .
It seems that for the model used with its extremely high multi
plicity and proton primary composition the calculated mean late
ral distribution is still steeper than the experimental one.As
well as depending on multiplicity,the lateral spread of the muone
depends on the transverse momentum distribution of the pions
and on the mean length of hadron interactions.In our calculations
we hare neglected the lateral spread of the parent pions at
different depths because for the muon energy threshold of question
-5 OeV,it has a negligible influence.We have supposed a CKP
transvera momentum distribution (Cocconi et al.,1961) with a
mean value jL * 0.34 GeV/c,independing of the energy of interaction.
Ihere is no need tp suppose an increasing p"t with energy
above 1012 eV,because the muons xegisterd by Xien Shan detectors
for size 10^ - 10^ of showers^ and for the present model of
interactions have Jseen generated at energies below 10. e*.

*д*
04
o.(L
o.HV
QA-
tv^J ;.,. ~> * : M ;b^
V-*^*'
, * • .
•,0
ft*
0.9
0,1
-1 • • > t_
< » <• •
Figure 1 .
*;л
^.-г
ле
0.6
э 4 /fy(>?i*fe4
.> \
J L. 3 4 ff
• 2 a.Correlations of the electron murterwith the heigh (1л Л-я=120 g/om ) of the first b,Correlation of the muon number with the heigh of the first intaraSltSSu'1'0" e.Correlations of the muon пшвЪег with the mean path of interaction
(E0 « Ю 6 GeV)

406 E.= 1(fGeV
Т&ф-Цю*
10 Ю0 radial distance
гИ
figure 2. Muon Lateral Distribution 1 - in proton showers of fixed •- :l 2 priaary enery 10° GeV(^-80 g/опГ) 2 - in the aaae conditions but the -depth of the firat interaction *60 g/c* 3 - the same as?ia (2) with the addition that the jjL>60 g/em% с 4 - Sirahowere of a given size 5.2 10 ,assuming mixed primary composition 5 - experimental data from Tien Shan
It remain» to check on influence of the increasing crose aection for p-air nucaua interactiona at high energles.Xhe assum-tion concerning an increae of .the inelastic cross section leada to a' better agreement with the axperiemntal data about the muon lateral distribution.
On Pig.2 the muon lateral distribution ia presented by a daehed curre assuming that the depth of the first interaction is higher than 60 g/cm .There is quite.good agreement,presented by a dotted line,assuming in addition,that the mean path length is .Л я н * ., go g/cm* These raluaa are reasonable for the first few
|o|iUifioB« at high energy .These interaction* produce the bulk of jjfe*. particles.

407
*>
SO -
I 1 30
Ф
I (9 . I *" r~~~4 oxmvmnbi free ohower core U /
figure 3. The contribution to the muon density in showers from the sub-showers due to the subsequent interactions of the leading pcrticle.
It has been made a detailed investigation on the contribution of the successive hadron interactions on the measured muon densities (Popora 4,1977). Because of the paralel shapes of the successive generation contribution curves (Fig.3) it ia evident that the variation of the inelasticity coefficient plays a negligible rol* for the ahape of the muon lateral distribution.
At last,the influence of the primary mass composition has been cneckadaXhera is a batter agreement ,presented by a string of dota on Fig.2.when the calculations have been made for a given »ise (5.2 К г ) , taking into account the experimental conditional mixed primary"spectrum.with a predominance of heavy particle* has been assumed.In thia model the mean free path of interaction has been taken as a constant (80 g/cm2) and a simple superposition model has bean also assumed (£A 96.this Conference).
Conclusions, there exist quite raaaonabla aupporta for th* assump
tion that the interaction cross section increases in the high
energy range as «real that th* primary particles are very heavy.

«и Theae asaumtions explain quite well aone of the experimenal data.But the existence of contradiction in some extent, between the oonoluaionefaade on the basis of the present interpretation of A 3 resulted especially about their longitudinal development^ that concern the problem of the multiplicity,and the result* in the lower energy range, show that it is necceesary to make iaprovmanta of the accepted model of the high energy interaction. We need to take into account production of any particles but piona, processes as gaaaanlsation e.g. or new processes.
References Fopova J,,, 1977, this Conference ,ЗЛ-9б Ророта I. and Idowcsyk J.,1977,J.Phya. G.,(in press). Popovs i.et al, 1976,Bulg.Joum.Phya., 111,3. Cocconi 0.,Koeater I.J.and' Perkina D.H.,1961,lawrence nad.Lab.High Energy Phya.SesdBar,28,2,UCfDD,144,1-36. Popovs I. ,1977, OR, 1677/И/РН/Л. РорОта L". and ffdowcsyk J.,1977,J.Phya. 0,in press.
\

409
PROPttTXIS OF НКИ ПШЮТ IHTIRACTIOMS ATO SHOW» CHARACTERISTICS AT THX DIPTH or 690 g/ca2
L. Popovs, Inetitute of Nuclear Raaaaroh and Nuclear Energy, Bulgarian Academy of Saianoaa, Sofia, Bl Ltnin 72, Bulgaria. J.Wdowcsyk, Inatituta of Nuclear Raaaaroh, Lods,
ul«Uniwerayteeka 5, Poland.
The muon and alootron aiaaa of extensive air ahowera пата been calculated for variety of high energy еolliaion models. The data has been eoaparad with experimental reaulta from.Tien-Shan experiaont. It и ш that the beat description of data giT*a the model with high multiplicity taken together with nixed aaaa composition.
1. Introduction. The present work give* an analysis of the data from experiment carried out at the Tien-Shan atatioh /Aaaikin at al.,1975 a,»/ located at 690 g/owT using results of calculation for variety of high energy collision models. Three different rather extreme aaauaptiona about the spectrum of the secondary partielea пате bean taken. The apeetrua originating from the Sealing hipotheaia ia taken aa one of the extreme aaauaptiona and a high multiplicity model with n e ~ ^ / z •• the other. The "standard* nodal with пш~1'/4 ia taken aa an intermediate eaaa. In the aacond and third caaaa tha actual energy spectra пат* bean taken in the for* given by the ao called CXF foranla. In tha analyaia there waa taken into account the faot that tha extenaive air ahowera ara originated not only by protona but alao by heavier nuclei. Tha aaaa composition derived recently by Olejnicsak at al./1977/ on the baaia of careful extrapolation of tha low energy data haa been used in our consideration /Tor the information about the aaaa composition aae alao Olejnicsak at al. - thia Conference, paper 00 148/.
2. Total number of auona aa a function of shower aiia. The experimental data on ay т а г а Я е , obtained by authora on the baala of U S aiae apectra for eleotron* and muons given by Aeeikin at al./1975 a/, ara compared with theoretical predictions in rigura 1. The predictions ara given for the three above atated models at high energy collisions. All tha predictions have been averaged over the actual angular distributions observed in the Tien-Shan experiment. In obtaining the curves it haa been assumed that tha primary partlolea are protons.

410
Shower also / Ma /
Figure 1. Я/ь тагам Шщ dapandanoa calculated for different interaction aodels eoaparad with tha data froa tha Tien-Shan experiaent. t - experimental data 2 - na«-"lW 3 - n.~ iW 4 - D | « l D l
It can ba aaen froa the figure that all the predicted auon nuabsrs are below tha axpariaantal reaulta. the agreement with aoaa of the pradietiona can ba reatored if it ia aseuned that tha primary particlaa are predominantly heavy nuclei rather than protons. The eaaiast ia the situation in tha ease of high aultiplieitjr when an effective average ease of about 4 would be aufficiant. Tha eaaa of the "stsndard" aodel with в* л.Ж'4 ia •ore difficult ainca an effective A of about 1 6 - 2 0 ia needed and the eaaa of Scaling aaeaa ta ba extremely diffioult to restore since in this oaaa not only the effective value of A anat ba vary high but it- auet increase with energy /from about 50 to 200 in the energy range in question/. The predicted a V vers *e dapandanoa at aountain altitudes in the eaaa or Scaling ia aignifioantly flatter than the experiaental one. Situation hare ia siailsr to that at asa level. In general aimilarly as in aea level, extensive air

411
•howtra obaerved at mountain altitudea appaar to bo rather rich in 3. The Primary energy anactrua. The primary energy apaotra deduced его* the я м а and electro* aisa apaotra are given in Figure 2 . Tha experimental data have baan takan froa Aeeikin at al./l97$ «/ with aorne recent eorreotiona /Staaanor - private coaaunicatien/. The earlier aentioned priaery aaaa coapoaition
« ' 10» mf EeE»«4 figure 2. The primary energy apectra deduced froa electron / 1 / and auon / 2 / aisa apaotra. Tha ahaded line ia taken after vdewesyk and Wolfandala /197Э/. of Olejnienk at al./l 977/ together with reaulta of calculationa for tha high aultiplioity modal ware takan. The predicted apaotra ware obtained aaeuaiag that tha aisa apectra given by Aaeikin at al. eorraapond to tha vertical direction /thio ia minimisation of the primary inteneity/. Гог ooapariaon » v alao plotted tha lower liaita for primary intenaitiea deduced by «dewcayk and Wolfendala /197 ) / on the baaia of tha experimental data froa Chaoaltaya experiaent.
The obaarvad difference between tha epectrua deduced free electron data and that froa auon data ia aiaply a oonaequenoe of tha fact that tha obaerved ahowora are relatively auon-rieh.

412 4. .FHWlfHttyn of thf w o n ^o alfe^roft гщЩ. At tha Mountain altitudes whara actual fluetuationa in IAS development art rathar small, tha fluotuationa of Км/Be ratio eeema to be due to tha distribution of tha primary particle maaaee. Taking the earlier mentioned maae composition and tha results of calculations for the high multiplicity model the value of the relative width of fluctuations amounting to • / " и * 0.36 - 0.38 in the energy region in question hare /to»5 . ioT* e»/.
The result ia in moderately good agreement with the experimental reaulta of Kabanova et al. /1975/. 5. Conclusions. -The considerations given above show that the data on muona in IAS at mountain altitude are in good qualitative agreement with the picture of ahqwera from tha variety of other experimental data. In particular thia data confirm tha conclusion about rapid development of IAS.
Intereeting and important ia the fact that II.vers Be dependence at mountain altitudes has-practically the same slop* aa that at aea level /eee for inatanoe Khriatianaen and Kalaykov, 1975/. It ia therefore very unlikely that the relatively fast increase of ML with K» ie due to variation of effective primary aaae taken -together with Scaling. /Tor detailed discussion of tha problem of I» versus Be variation aea Olejnicxak at al,, 1977 and Popovs and fdoweayk, 1977/. The considerations preaented above suggest that the high multiplicity model taken together with the mixed composition obtained by reasonable extrapolation from the low energy data give moderately consistent deecription of the picture of IAS et mountain altitudes.
R£ferej£ee.. Aaeikin V.S. et al., 1975 a, 14 t h Int.Conf.on Cosmic Rays,
HOnchen, 2726. Aseikin V.S. et al., 1975 b, 14 t h Int.Conf.on Cosmic Baya,
Hflnchan, 2807. Kebanova H.V. et al., 1975, '4 t h Int.Conf.on Coaaic Baye,
Hflnchen, 4347. Kalmykov R.M. and Khriatianaen O.B., 1975, 14th Int.Conf.
on Coeaic Rays, MQnchen, 2961. Olejnicxak J. at al., 1977» Thia Conference, 00 148. Olejnicsak J,, Wdowcsyk J. and «olfendale A.W., 1977, J.Phye.
0., /in presa/. Fopova L. and Wdowcsyk J., 1977, J.Phye. 0., /in preaa/. Wdowcsyk J. and Wolfendale A.W., 1973, J.Phye. A. 6, 1594.

•13
Characteristics of btanaive Showara from
Nucleus-Nucleus Intaractiona at Energies above 10 4 aV
L.Popova,0. Popov
Institute of Nuclear Research and Nuclear Energy,
Bulgarian Academy of Sciences,
Sofia,Bd.Lenin 72,Bulgaria
The Maine characteristics of the electron and muon components in EAS at 690 g/cm have been calculated assuming that the
Srimary particles are predominantly aavy nuclei rather than.protons.The data has been compared with the experimental results from Tien Shan experiment.Conclue Mionm about the mass composition of the primaries and the properties of high energy interactions hare been derived.
introduction. The main characteristics of BAS measured at
Tien Shan station (Kabanova at al.,1973,Aseikin et al.,1975,
Aselkin et al.,1975) hare been analysed assuming a high
multuplicity model with nB~£ ' and a complex primary spectrum
after Olejnicsak at al.,1977.
It has been shown that the model with high multiplicity
gives qute good agreement with the -experimental measurments of
shower development (longitudinal) in the atmosphere by Popova
and Wiowotjk,1975.This fact concerncasthe electromagnetic com
ponent,but not neccessary be related to the development of the
nuclear actirs particle cascade.So it is quite important the
characteristics of the hadron and muon components of SAS to be
investigated on the basis of that model.Such Investigations have
already bean made by Popova ,1975,but for a fixed primary
energy.Because of the fluctuations our goal in this work is to
examine the shower characteristics of fixed size as they are
measures «xpsriaenMy*

414
Theory «ad Method of Calculation. Рог lack of a consistent theory of high energy hadron-hadron interaction,a simple phe-noaenological (fireball) model has been used.It is a modification of the standard model used by Wdowczyk and Wolfendale, 1973,for ehower development.She presently used model substen-tionally differs from the standard model In that it assumes a higher multiplicity of the secondary particles n ~ Б1'2 in euper high energy collisions.The reason for assuming a higher multiplicity law is expounded in the paper of Popova and Mow» cxyk,1975.Another important difference in the present model is that the fluctuations of n have been taken into account.
An analytical method,similar to that in the paper of De Beer et «1,1966,of solving the diffusion equations of chatged pions has been used.
An ipmortent difference in the present treatement is the method used for the calculation of the probability P(3) for interaction of pions between the level of generation x and the level or observation *0jj8«It equals the ratio of the interacting to the non interacting pions:
whereii (E^e the number of charged pions which decayed into muone.
It have been uaed the general solution about the number of the electrons and muona for a fixed primary energy:P(N /S), P(H^/B),P(jl/E) to ohtaine the corresponding functions: P(B/irt),P(iy/H#),P(j>/He) for a given size Ne:
P(B/M#)dE« T i ж* I • ^-J *j(VE).AjC*i)dE
*Сиун #)- / Р(Яр/Е).Р<Е/Н#)сШ-
( Г P. (•»/?).*: (Я./В).А| (Е) J -r-У С *—2 «I dE , I Г J Pj (VS,'Aj <S>dE<

415 *(jVV- /p(j>/E).*(B/lre).dE. J f.?(p/B)».?(VB)»A;1(B)
fsf *,(4./w.v«> 4»,
-is the complex differential energy where ST spectrum of the primary particles (Olejnicsak et al.,1977).
A As) as
A simple fragmentation model has been also used»
Results and Discussion. The primary energy of the shower of given total electron and muon number appriciated using the above mentioned method is shown with the standard deviations on Table I foe;both mixed and pure proton primary composition *
"*АВЬВ I Primary Snergy of Showers of Fixed Sise (It -Composite Primary Sp. И- 10' 1.6 10J 3.2 105 б 10э 10й 1.8 10'
V10 2.7 4.8 8.6 16 26 47
оувв 1.8 1.8 1.9 1.9 1.9 1.9 Primary.Energy of Showers of Fixed Sise -Proton Primary Spectrum
B.10-гв 3.4 6.0 11.1 «?
33.3
.14 0.14 0.14 0.14 О'1? Primary ^nergy of Showers of Fixed Kuon Humber(H<l)-Composiite Pr.S.
ж^>аввт 660
h' ,-5 t . t 1.9
/*„ 0.62 0.60 The numoer or anions witn energy aoore i usv in snower sue inter-
rale,where Tien Shan meaeutmente hare been performed,*» present'ed vers R0 by a dotted line in Tig. 1, In obtaining the. full and the dashed curves it has been assumed correspondingly that the primary particles are only protons (in the first case),or exclusively Fe nuclei (in the second eaee).
It oan be seen that the beat agreement gives the assumption 'about mixed ease composition.
'A similar result (the circle assuming a pure proton composition
» on Fig,1),we have obtained by i,butt*°e я в < ш **•• P**a of int/iOy/h,

4 10
ю3
10* 1С6 W7 Ne
figure 1* If versus N dependenoe compared with the data from Tien Shan experiment 1- pure proton primary epecrum. 26 pure 7* primary spectrum 3- mixed primary spectrum I.S.- experimental data from lien Shan station
Xhe electron atruoture function of showers with else 5«2 10* for pure proton.pure »• and mixed prlmaty eompostion iB p r M W _ ted on W.g»2 .Xhis function is compared with the experimental?esilta. It is obviuos that the oalculated lateral distribution- is wide? than the experimental one.Beet agreement give» the assumption of a pure proton primary composition*
Xhe age parametei$f the theoretical functions differs quit* negligible for the cases of pure or mixed primary compositional* is about 1.1 and 1.15 and is bigger than the value obtained by testing with )f method the densities from the SM counters (0.9)^
Xhere eslsta the opposite situation when the oalculated muon lateral distribution is compared with the experimental aeasuments (Wg.3>.
In addition the observed correlation between the electron and the muon lateral distribution for a given primary energy is. shown on yig.4»

1000
present calculation p
•Ме-бТГГ "* m
(Ee*10*GeV)
417 "I a.
ue.si.lO*
r*.
Nt*M-S*).iO
Fig.3» luon lateral distribution 1-P primary spectrum,2-mixed coop.
Fig.г Lateral distribution of the electrons in showers of a given- eiae (5.2 105) 1-for p primary spectrum 2-for Fe — " 3-for mixed « л> T.S.-exp.data from Tien Shan
The total electron-moon ratio for "younger" showers is about 2 times more than that for "older" ones.Ihisfact can explaine the observed overestima tion of the muon contents in the shower*partly by a better sensitivity if the apparatus to the younger showers due to the fluctuation effects»
3-Pe 'JL > M 10*
.j&
10
•DI>. COfflD - .TiS£»eTD.dfl tn
Л \ \ \ S \ \ \ \ \
4 \ \ \ S*12
\ \ \ \ \ \
SSC195 \ X
|-Л/1.10* \ I N • 2,2.10' \
i
. - i
1- _J |Ny4J6.10
•
. . Wrtdial distance 10й6Гт] Fig.^.nuon lateral distribution/TOrS, OeV

418
Cpnclnjiofls . She observed .effects of improving the consistanoy with the experimental results due to the reasonable assumption about the mixed primary spectrum in the energy range 10 * e^V -10 eV and an increase of the interaction cross section in the above energy range can be trated as an indication that we can get round |he necessity to suppose the extremly high multiplicity law, but involving essential; some new presses (each of the tips of* "gammanisation" or intranuclear cascade),causing a quick shower development*
BBefferencea Kabanova N.V.,et al.,1973,13 th Int.Conf.on Cosmic йаув,25Э4. Aseilcin V. et al.,1975,Preprint 153.FIAN. Aseikin 7. et al.,1975,14 th Int.Conf.on Cosmic.Bays,2807. Olejnloaak J. et al.,1977,J.Phys.G«,(in press). Popova L. and Wdowciyk J.,1975,14 th Int.Conf.on Cosmic Hays,2818. Popova Ь.,1975,И th Int.Conf.on Cosmic fiays,2819 Wdowcayk J.and Wolfendale A.W,,J.PhyeiA.Math.Nuc),#<l«i.6,1594. Popova b,,1973,Iev.AN USSa,a.ph.37,7,1439. Be Beer J. et al.,1966,Proo.Phys.Soc.,89,567«

l&wooioo 419
GBN33IS OP TMS УЛО-HZSt PARTICLES AKD THE MKA.SURECT?IT OP THB CE0SS-3ECTI0-T AT V, A S ENERGIES
T.Stanev Institute of TJuclear Research and Kuclear bnergy Bulgarian Acadeir.y of Sciences 72 blvd Lenin, Sofia 1113
The particles at dii.' • ji- i nee from the shower axis are produced raai з-gh leading particle interactions at differ ...:»ht. This is true aleo for the densities of <•. . ':.it shower components at equal distance. This fact car. Ъ=. uTad for study of the energy behaviour of the .\гсзз-section. Аз an example with the help of an :• \3 development model, accounting for the detector configuration of the Tien Shan array, is shown thit the ratio of the hadron energy to the electron density over the Tien Shan calorimeter is sensitiva to the cross-section energy dependence.
1. Introduction In many papers the difficulties to study the cross-
section energy dependance are discussed. The troubles are due to !
a. The relative differences between the values of the nuclson-nucleon total сгозз-section are reduced by a factor of 3 in the nucleon-air cross-section.
b. The total characteristics of the ЙА8 - electron and muon number are quite insensitive to the little changes of the сгозз-section.
We want to state, that by attentive study of the behaviour of the different~£AS components can be found possibilities to investigate the cross-section through
examination of the correlations between them.
2. Model calculations
The "observable" quantities of EAS were calculated
with a shov/er development model, accounting for the detector
configuration of the I'ian 3han array, 'ihe computed total
ohower characteristics and a detailed description of the

420 method агз published in (1) . .,'e used the standard description of theK-N interactions and the p*N interactions were characterized through :
a. logarithmic energy dependancs of the mean multiplicity ^
b. distribution of Kp in accordance with the accelerator measurements.
The calculations were performed in two stages, in the first one the "observable" quantities in areas, corresponding to certain detector groups were calculated as result of the Isading proton interactions at definite energy and atmospheric depth. The obtained in this way matrix Is of some interest, as it allows us to determine the atmospheric depths, which for reasons of geometric nature contribute mostly to the density at certain distance to the shower axis. On Fig. 1 is well seen, that the maximal contribution in the electron density correspond» to lower interactions when approaching the shower axis. The curves on Pig. 1 are for leading proton with energy 204800 GeV. The curves -2 signed 6,20 and 70 show the number of electrons in rings with 6,2oand 70 m. radia , and these with 9 and К -circles with 1,9 and 5,4 m radius respectively.
The same effect exists and is much stronger for the EAS hadron component. Our calculations were concentrated on tb* electron component but some characteristics of the hadron
200 300 400 UZ (Я.СГТГ2)
fig. 1

421 components as control point*. One of them was the total energy of the hadrono, fallen on the Tien Shan calorimeter. The comparison of the matrix data on hadron energy and the electron number In the calorimeter gave us the possibility to drow Interesting conclusions. While at fixed leading particle energy the electron number shows a maximum In the atmospheric depth, the total hadron energy has a nonotonic rise with the lowering of the Interaction level. The total hadron energy in the calorimeter is тегу sensitive to the energy of the leading proton near to the observation level. As this energy depends on the high-energy behaviour of the nucleon-alr cross-section this fact can be used for evaluation of the cross-section energy dependence.
Three sets of showers with different energy dependence - constant mean free path ( Xf. ж 80 g.cm ) and the asymptotic extrapolations of yodh, „Pall and Trefil ( YPT ) and of leader and Kaor ( JM ). In our calculation's scheme individual showers are computed by interpolation in energy and depth of the data of the basic matrix»
The results of the39 calculations are shown on *'ig.3. The electron number of the showers la calculated following the experimental methodica - from the electron densities at 6 and 70 m. to the shower axis.
11*
« *
11
1 1 1 i i i E°
' /~У\ - /•£• A / •
> Л — 'J
jGeVJ -
' « . H * '
-
Е" /' у) -1вяМ/> /
X ' / - / / ЛшГ 7 / >'/ • У ' /
^г / / ж ^ S • г t ж
/ у i/ S St
S 1 • г '
i • ' i i i i i
Ю0 300 500 Z»c*r*) Pig.2 Total hadron energy and electron number for LP interactions at fixed Б and

422
3.Uiscu33ion •i'he curves at J?ig. ,-л1 y D T
3 show the sensitivity of pjj^ 4f" the ratio E*/», to the chosen asymptotic extrapolation of the eroas-section. The difference between the three curves is observable for 10 particles, where not only tha absolute values, but also the shape of tha shower size dependence is quite different..
All throe curves can well be fitted with £ /pe « a + b.lnAt
The beat values of a
and Ъ are given in the following table.
i'ig.3 аз a function of for different asymptotic extrapolations of the сгозз-asction.
• ^ M *
a
b
15~ 80 g.cm "•
1.45
0 ,43
YPT
1,21
0,31
ш 1.11
0,26
4. Conclusions The study of the shower size dependence of the ratio
can give information about the high-energy behaviour of tha nucleon-air cross-section. It is possible to find in EAS even better, more sensitive to the сгоэз-sect ion correlations,, perhaps involving some characteristics of the muona in tha central parts of the shower.the union component seems to Ьэ suitable, as it do not depends strongly on the leading particle energy near to the observation level. However, for this

423
purpose wo need not only more precize experimental works, but
alao'detailed calculations of the development of the extensive
air showers accounting as better, as possible for the indivi
dual features of every experimental arrandement.
Reference
1. I.StaneY, Bulg Journ Fhya, 2 0976>

424
COULD THE NEW THEORETICAL IDEAS OF THS MULTIPARTICLE PRODUCTION BE USEFULL IK THE Е A S STUDIES
( Abstract )
B.karlcoTskijT.StaneT and Ch.Vanlcor Institute of Nuclear Research and Nuclear Energy Bulgarian Academy of Sciences 72,bird Lenin, Sofia 1113
Two sets of high energy interaction models : parton and statistical predict rising high Pt cross-section with ths incident energy. The increasing multiplicity in the High ?t •rents can also be taken into account.
Such models are тегу suitable for the EAS investigations as they could simultaneously rize tbe depth of the shower maximum and explain the shower particles lateral distribution and the multicored showers.
in a shower development model the rise of the cross-asction ( as in the YPT and LH assymtotic extrapolations ) is attached to a process, characterized by large ^ and associated high multiplicity of the secondaries. The depth of the shower maximum is calculated and compared with the case of constant cross-section. The proportion of multicored showers is also studied.

^ 425
ISDITICORED В А З А1ГО THE HIGH P t CROSS-SECTION E l THE 1 O * - 1 0 * QgV EHERGY REGIOH
T.Stanev Institute of nuclear Research and nuclear Energy Bulgarian Academy of Soleheaa 72 bird benln, Sofia 1113
A atudy of the poaalble parent proceaa of the multi-cored extensive air ahowera had «hown that тегу high transverse moments (> 5 CoT/'c) are needed for explanation of the experlaental data from the Tien Shan aointillator array. The oroaa-section for suoh tranaverae momenta has to be even larger than hard acattering modele with gluon exchange predict l В d^r/dp-*^ St~* fut) )• From 'tba KAS data the ratio of the cross-section for Pf> 5 OeV/c to the total cross-section is evaluated to be not less than 0,02 in the energy region 10*-10o GeV.
Kearly a quarter century has passed since the first (1) observation of multiple cores in ВАЗ.1 (Tell separated peaks in the electron density, breaking the radial symmetry of the ahowar have been proved by many groups, but the nature of this phenomena has not yet find it»s explanation. An attempt to explain the multiple cores is taken in this work.
Model calculations of multloored IAS On the basis of a shower development model, which is
described in ( 2 J multicored showers, initiated by two high P-t prooeeses , were simulated :
a. High ?t transfer to the leading proton of the cascade. For ths realization of this process the shower was "broken" at definite depth. "Multicore parameters" are the depth of braking and the separation of the cores at the observation level.
b. High ?t transfer to a fireball, in one of the leading proton interactions • fireball is emitted under laxge angle, which provides * secondary core at separation distance Rs • In the adopted model of к -H interactions ( K^1*1 • 1 ) this equals to a hihg P^ pion.

426 Different characteristics of the ЕAS, connected with the
experimental? measured with the lien Shan installation, were computed ( observation level 690 g.cm ). The electron .densities at 6, 20 and 70 a from the shower axis were used , as In the experiment, to obtain the age parameters 31 (•»/?!») s 2 ( W ° w ) *nd th* «Ьоъгг size ffe. The values of В ( ratio of the electron densities in 1,9 ш radius circle and in 5,4 m radius crcle ) and the maximum density in one scintillation counter Д e , out of which consists our multiple core showers criterion (3) , were also computed.
Heavy nuclei initiated showers were also computed. The "superposition" model, where the transverse momenta of the nucleons in the fragmentation were taken into account, was used. Fragmentation transverse momenta were distributed as w ( P t ) ^ e" pt/2<^ with <Pt>- 0,35 OeV/c as in Г4] and <?t> » 0,7 GeV/c. The results of the simulation are described in details in [5J and the main points are :
a.The multicored showers , initiated as by a high P-t process as well by the fragmentation of nuclei in the atmosphere lead to change in the important for the experiment value of 9* •
b. on the B-dc plot three reagions are formed, as shown on Pig.1. The stripe with 1,3xlogAc slope corresponds to proton showers without high Pt transfer, the upper left part of the plot is the fragmentation region and the bottm .right - to the high ?t «vents,
c. With the scintillation centers array of the Tien Shan installation can be observed events of transfer of Ft > 5 GeV/c to objects with energy greater than 10* GeV. It la impossible with fig. 1 this methodios to differe between proton and pion.

427 Experimental data /ith the В-Д е criterion were treated 768 showers
within the size interval [1o'-3,2x1O'lwith axis inclination 0-30° and 3u°-50°. The frequency of multicorod showera is u,29iO,03 and 0,3720,08 .A sample of these showers is* shown at the В-Д с plot of Fig.1.
Some showers with their axes right in the centre of the array (|x,y| 1,4 m) in four intervals of the shower size and for <T< 30° were tw.tjJ with another criterion, which correlates well with the first one. As multicored were taken showers with S1 < S2 - 0,1 . Both results are shown on fi«.2 with the data from Sidney and.Mt.Uorilcura. f6] , [7j
I U II H 1Г H 1ПП и,*.,, ns. г ч*т I И |ПЛПГ
5 Ю5 2 S 10* 2 5 Ю?
as function of the primary enorgy E°. For comparison ara obtained data, obtained with
experimental arrangements, which do not differ strongly . Аз can be seen from fii>2 the data are in good accordance, whan thsy are presented as function of the primary energy.
Discussion jj'rom the frequency of the multicorad showers , as
we have already evaluated the conditions of their genesis (at least for the conditions of the lien Shan array ) one may come to the evaluation of the high Pt events cross-section at EAS energies. All we need is the number of the particles in the shower with energy above 10* QeV. We evaluated roughly the lower and the upper limit of the number of such nucleons in the following manner :

428
a. Lower limit - only the leading proton takes a sufficient part of the E° in every interaction.
b. Upper limit - in every interaction two particles
with energy 0,1xB° are generated.
On fig.3 the obtained
in this manner point for Pt>
5 GeV/c is shown for the
energy Interval £10*-1061 GeV.
Within the interval the particle
energies are distributed as
usual in ВАЗ. For comparison the predictions of the hard scattering model with gluon exchange [8] are drown for the intarval
Pt"*.fUt)
t\ GeMte
boundaries. E 3 * dp
The dashed line accents for the rize of the high Pt cross-section with the atomic number of the target f9? .
On fig. 4 the experimentaly measured dependence on the primary energy is shown in comparison with the expected from the high ft cross-section of [8j and the described evaluation of the number of the energetic hadrons in the EAS. A S the experimental values have big errors the two dependences cannot be directly compared, but nevertheless the difference of the
Jfig. 4

429
shapes can be explained with the loss of some number of high
P^ events which have taken place in the very upper atmosphere
or too near to the observation level.
Conclusions
The measurements of the proportion of the raulticored
showers show extraordinary high cross-section of processes,
where' high P-t particles are generated at energies above
10 GeV. Such cross-sections cannot be explained from the point
of view of the existing interaction theory. However, it is
possible that our evaluation of the cros3-seetion is something
high, because in this work we do not take into account some
associated with the high F-fc events phenomena. The most
important of these for us is the associated multiplicity
rlze, which can make more high P^ events observable in the
GAS and thus decrease the neeessary for the explanation of the
multicored showers cross-section.
References
1. R.E.Heiaeraan and fl.E.Hazen, Phys Rev 9J> (1953), 496
2. T.Stanev, Bulg J Phys 2 (1976) 3. T.Stanev, Comp Phys Comm, £ (1972), 47
4. B.Judek, Proc XIV ICCR.Mtinchen, 1975,1, 2342 and 2349
5. T.Stanev, Thesis, 1977
6. A.M.Bakich, C.B.A.McCusker and iu.M.Winn.J Phys A : Gen Phys 2 (1970), 662
7. S.Jliyake, K.Hinotani, H.Ito e t a l , Can J Phys £6 (1968) lio 10, part 2, 25
8. S.B.Berman.J.B.Bjorken and J.B.Kogut, Phys Rev D4.0971) 3388 9. J.W.Cronin, Talk at. the SLAC Summer In s t i t u t e on pa r t i c l e
physics, EFI prepr in t , 1974

430
ШИЕ-CARLO SIMULATION OF THE LATERAL DISTBIBUTIOK OF PARTICLES IN EXTENSIVE AIR SHOWER COEES
B.R. Green .Department of Physics, University of Leeds, England.
Theoretical [7J Experimental Q Both Q
Evidence for the existence of double- or multiple-cored extensive air showers has been presented at many previous Cosmic Ray Conferences. The purpose of the present study is to investigate the possible causes of such structure in shower cores, by means of Monte-Carlo simulations. In particular, the effect of possible interactions (with a high energy threshold) involving the emission of particles with unusually high transverse momenta is investigated. Preliminary results will Ъе given.
Coordinate* EA 3.U (High Energy Interactions)
Mailing address: Dr. B.R. Green, Department of Physics, University of Leeds, Leeds LSS OJT, England.

431
INTERPRETATION OP AIR SHOWER DATA RELEVANT TO COSMIC-RAY COMPOSITION
John Linsley
Department of Physics and Astronomy, University of New Mexico, USA
(Theoretical)
Attention is directed to a simple method for combining measurements of several different air shower structure parameters for the purpose of drawing conclusions relevant to cosmic-ray composition at energies greater
than 1017eV.
Coordinates: EA 3.1 Primaries and Spectra
Mailing address: Professor John Linsley Department of Physics and Astronomy University of New Mexico Albuquerque, New Mexico (USA) 87151
This work was supported oy the National Science Foundation.

432 ANALYTICAL SOLUTION FOR THE BASIC EQUATIONS OF THE CASCADE THEORY USING THE ENBRGY-INHOMOGEKBOUS CROSS-SECTIONS I.P.Ivanenko, A.A.Kirillov Institute of Nuclear Physics, Moscow University, Moscow, 11725*. USSR Abstract. AMthod for solving the equations for the
cascade theory is proposed. The method permits the analytical expressions for the function of particle distribution in a cascade shower to be obtained within any required accuracy for energy-homogeneous and inhomogeneous cross-sections. The results for the one-dimensional and angular problems have been obtained for the innomogene-ous cross-sections in a broad interval of depths and energies of primaries and secondaries (including the ionization lose and the Landau-Pomeranchuk effect). The energy-inhomogeneous cross-sections must be treated
to obtain more accurate characteristics of the electron-photon cascade development in matter. This is necessary, for example, when studying the showers generated by superhigh-energy particles taking account of the Landau-Pomeranchuk (IKS) effect [1].
1. Consider first the one-dimensional problem. Then, according to [2]» в
Е • " here P(EC,E tt) or Г(ЕС,Е ,t) is the number of electrons and photons with energy Е in a cascade produced by a primary with energy E e at depth t; ffc(E,E^) and Wf(E,E) are the crosa-aec-tions of the radiation deceleration for electrons and tha pair production for photons with energy E; W^CEjE1) is the possibility for an electron with energy Е to lose energy E-E* for excitation and ionization of the atoms of the medium on a unit path. Changing over to the Laplace images ^ * t by excluding the function Г(Е,,Е,*) from the second equation, we get

433
Consideration will he given to the shower produced by a primary electron with energy E,. Then the expression (2) takes the for» _ ._ ., .
where L[Pj is the linear operator. Insert the free parameter $ and examine
в" Е The Kernel ( (С,Е',Х $) "ЙУ De presented in the following
For further operations, it is convenient to present (4) in the "dimensionless" units:
Амлйй^-ву C6) kernel The following method for approximating the
Л И Е & Ь У will be used to find t^e^E1,».) . distracting from the form of the dependence on the eigenaxguments In the kernel and using the theorem of the mean, we assert that such ^(B.,E,X,t) exists that %
Expression, for P(E,,E,X^ will be obtained using the ty(E«,E,X>*) inserted above: ,^ .
Substituting (8) in (6), we get:
[И»Н-*£3 *£#^E'- (JiJ. 0 (9) Equation (9) is equivalent tp (6), but is the equation relevant to the function ^(Е^Е,*)*)
It is evident from (7 )f that the dependence of А(^,Е>Х» 5)

434
on E is determined by (E.E',*,*) . The weakest dependence will take place of the free parameter £ is related to the expression (Xjtj p , where. "ftXAi is the known £2] cascade function. If fy(Eo,E,J\M) is a weak function of Б, the equation (9) may be replaced by
4 t7/-S-\*« tfieXMwi. реч* л . фЕ^\<^У^^—^'9)т0 ао) The relation (10) ia algebraic relative to the function A(E.,E,A(S)) 'and can be easily resolved:
The relation between A (the absolute error in the function ^ (€в,Е,Мв) ) and Щ)- ( otUcwfe-iw determined by this error) can be easily obtained for <10)j
A«(^A(«)4 or У - Й $ А Й ) (12) where £ is the relative error of SjJE. ,£.,()
It will be noted that the relation of the type of (12) for (9) is much more complex, but (10) may be treated as an approximation of (9) after including and verifying the above said limitations on the variations in the function fy^E^E, Х<Л"у. Therefore, the relations (12) may be treated as approximations f«r(9). These relations make it possible to construct a convergent iteration process for solving (9): determined by (11) may be taken to be a first approximation for the solution of (9)s substitution of ^;(b,E,Ms) in (9) gives the discrepancy b(tyi); the next approximation may be determined using the formula tyb* =fy -t-Д; where. Л; is determined by (12) on discrepancy Afo.;) •
To specify the solution of (9), it is convenient to set a certain form of the dependence for Л,(Ео,ЕД(*)) • For example, at small E, let
to include the ionization loss. Ihen, substituting (13) in (9), we shall obtain the expression for the discrepancy: j
лял**!»-k$ii*&ffcpy^*fai)iw*ib '

4 »
•ad toea -«-«-«м the diaerepeaey ia the neoeaaary Interval by «electing the valnea o* «ДО , 4ДО , e&) . tt* optlana aholoe of the paranatal* вакее i t poaaibl* to obtain a aux-flclantjy noonrata eolation at l > 0 . 5 Мат. ь
- After oaloulatlac tba Laplaaa lane* of the function of tha m i b n ot partlolaa with energy above I . «a get aoeovi'xur to (8)1
A* laveree Laplaea tranefometloj. J. ^.rrled out, aa i t ia uaual practice ia to* eaaeada taeor,/, uaing the aaddle point netted. Jh* uae of the approximation» for the LEE adoptad In [3З end the approximation* for the ioaisation loss схоаа-вео-tion* adoptad in, £ 4 reaulta ia cuabexaoae operation*. Such operation* ia da* not to the retuaal fsoa the propertiaa ot the eroaa-aacUoa hoaogeneity but to the examination of a more complex torn, lb» eaaa of the primary photon la treated in tba aarne aaaaar. Ia thia eaaa, the function ^(E*,E,)) ia provided with the factor ft+j&ffiftft-.fef*^4 which eau-aaa tha ahift ia t.
Fig.l preaent* the function* ф(Е»Е,МЧ) 0 £ в for primary electron* with B,«lxl09 M»7 (the aolid eurrc) E,xlxl06
a»V (tha daahed curiae). 2a* auaarala at tba currea corras-poad to the values of S . A t B,*lxl07 neV tba Influence of the IfS ia lacoaaiderabla*; the variation at low В ia due to the Inclusion of ioniaatioa loee. lb* qualitative atudy and
*fc.,M<'»
P t a l
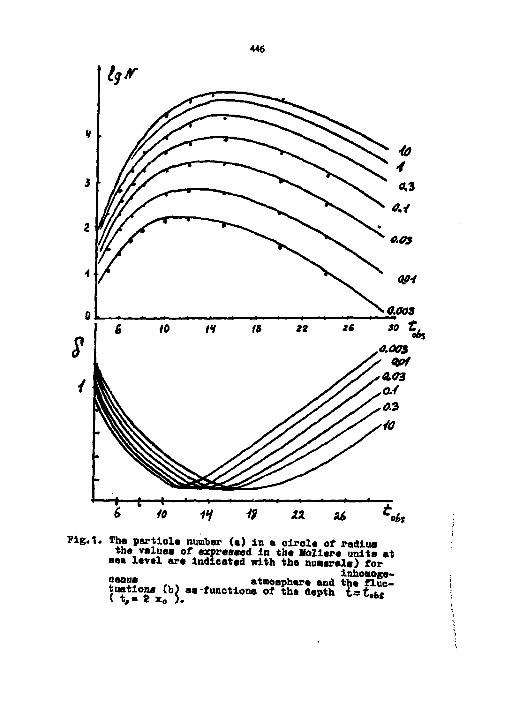
446
Fig.1. The partlole number (a) in a circle of radius the value» of expreseed in the Holier* unite at eea level are indieated with the numeral») for inhoaoge-?*°2? ^ч ^ atmoephere and the fluc-tuatione (b) aa-functions of the depth 1st ( t,> i z, ). tabs

437 _ .. The method of approximating the operator L | P J developed in the previous Section will be used below. Let (18) be multiplied by B*"z and integration отег Е be carried out as in the one-dimensional problem: E« ^1*)ДОЦ^^ C19)
The function ^(E^EjX,* will be so chosen that
The joint fitting of (20) and (21) makes it possible to construct an approximate solution of (19) since a weak .function of 9 . This solution may be used as an approximation for calculating tee last term when numerically integrating the differential equation. $or the case studied in И . i* "«J be set that JL* ОМ +0Л*,1'* , V * 2 - < and the solution will be obtained in the form
ПЪЛНИШ-*в%»&8*Л <-> The second angular moment obtained from (22) coincides with the moments of £7] within several percent.
The inclusion of the mean angles [в ]« i . e . the changeover to the Legend» equation with the operator L[P]. i s indicat ive of a change in the steepness of the distributions at Perl. The effect of tbe inclusion of large ang les , i . e . the examination of the Legandre equation with replacement of LQ3] by the operator L|PJ, i s most considerable In case of changeover to the variable "t since the dependence of ф^ДОЛкш the angular variable can be f e l t in this case.
References 1. L.D.Landau, I.T.Poaeranchuk. Dokl.Akad.5auk SSSR,92,533
«nd 735Д953. 2. A.V.Migdal. zhETF, 32, 633» 1957» 2. Bossi, Bruno. High-energy part ic les . Hew-Tork,1952. 3. V.v.Guiarin, I.P.Ivanenko, A.A.Kirillov, TJt.Roganova.
Prbc.of 14th mt.Oonf.on Cosmic Rays, 7,609(1975). 4. A.A.Belyaav, I.P.Ivanenko, A.A.Kirillov. Vestnik MSU.ser. fi«..matron.,18,2,20,1977. 5. I.P.Ivanenko, B.L.ranevsky.A.A.Kirillov.I.S.Lim.A.A.Be-lyaev,TU.G.Lyutov,T.M.Hoganova.Beport at the pxes.conf. e.S.Z.Belenky. Cascade Processes in Cosmic Rays. Gostekhiz-dat, Moscow, 1948. . 7. V.V.Guzavin, I.P.Xvanenko. Suppl.del Nuovo 0im.N2t8,?49, 1958.
8. I.P.Ivanenko. Electromagnetic.Casoade Processes. M.,1972.

438 ТНВ ГШЮТ10Ш Of AHGTOLAB AMD LATERAL DISTRIBUTIOBS Of FARTI0LB3 IX ВЫК5ЮШ-РНОТОЯ CASCADt A.A.Belyaev, I.P.Ivanenko, v.A.Makhrov Institute of Nuclear Physics, Moscow University, Mosoow, 1172J*. Ш 8 Й
Abstract» Solution for the equation* of the funo-tion* or angular (FAD) and lateral (PUD) distributions of particles of the electron-photon oaaoade (KPO) par-tiolea at the various stage* of cascade development in light substanoea ha* been obtained by numerical methods using tm» functional transformations and tb* o-teeh-nlque. The calculations are carried out in the Landau approximation with special emphasis to derivation of the correct values of the functione at large values of the argument. The В approximation of the theory is used in the calculations for the various energies of secondaries ! ( • • The results of the calculations are compared with the data on FAS and FLD published elsewhere. 1. Introduction. Analysis from the data from the Tien Shan
ВАЗ array in terms of the conventional model calculations of EAS has shown С11 that the electron FLD in a cascade generated by a high-energy jf -quantum is probably steeper, especially at great distances from SAS axis r>rt (rt is the Itoliere radiuat?]), than it is usually assumed according to the Niabimura-Kamata theory (Я.К)£2,4]. The oomparison with the experimental data from the arrays of Chakaltaya [5], Horikura £6], Moscow state University [7], and Institute of Nuclear Research [в conforms tb* relation obtained fro» the Tien-Sban array data
S и « Si.+ aS, 4 3 > 0.15-0.20 (1) Hex* S|| and Sj_ are the parameters of the shower age whose value is determined from the best agreement of the experimental functions of the longitudinal and lateral development of IPC with the theoretical H.K function in the Oreisen approximation [9].
The results of Ш * Monte-Carlo calculations [10,11] precludes an unambiguous conclusion about a steeper FLD than the N.K function sine* all Monte-Carlo calculations involve finite B./B, while according to tf.K >,* oo and the difference in the FLD be-,haviour say be attributed to the «aid differences in the calculations, which has been indicated in С10. тле problem of the dependeno* of the FLD moment < r 2> and FLD themselves on S0/B has been examined in details in С 12,13]. It follows from £12,13j that the application of the В • oo approximation for the oha-

439
racter ls t lc value* of Bo>10*•* aV tad the threshold energies of seooadary paxtlola detection B^IO6 eV should not affect the accuracy of ВД) for r > r j . The H.K FID were obtained by solving tha kinetic aquations In tba В approximation of the BPG theory written to tba approximation of Mal l angles and multiple Beat-taring. For f in i ta threshold energies В >10~2 f ( f ia the c r i t i c a l energy of medium) In l ight substances, the FAD and FID sonants and FAS themselves up to 9 4 i obtained in terms of tba said approximations by various authors £12-1*1 are I» * 6°od agreement with aaeh other and with experiment.
Therefore, tha approximations uaed by H.K when solving tha oasoada aquations make i t possible to calculate FIB in l i ght substances to a sufficient physical accuracy up to E£10"gp . Due to lnoonsiderabla ssitheaatieal d i f f i eu l t l ea , however, H.E calculated FIB only at B=0 and did cot study the effect of f in i te threshold energies on 110 form. I t can be seen fro». F ig . l that tha foxm of the electron FAD calculated In the В approximation of the theory for f i n i t e E> 0 i s essent ia l ly dependent on В even near E«0. The Monte-Carlo data [15.16jaleo indicate that the l a teral distribution steepens with increasing B. This seana that the effeot of variations i n Е on FED secondaries for ESO should be determined to understand the found disegreements of (1) and to correctly use the theoretical data for interpretation of experimental results»
2. Calculation technique. A new version of numerical integration of the kinetic equations of the EPC theory i s proposed here to solve the problem formulated above, i . e . to calculate FAD and FID of seoondariee in the В approximation of the theory and the approximations of small angles and multiple scattering for E«fO. The calculation procedure i s во organised as to obtain the most accurate values at high values of the agreements.
The equations for the Fourier-transformants of the input functions СЗЗ ***• fc*ken as the input equations. This permitted the number of the variables to be reduced from 6 to 4 . I t w i l l be reminded that the corresponding FAD and FLD are related to the transf ormant TFAD and TFLD as [ 3 3»

440
V (2>
4>(e.,6,*,S)"2!ry-0(e.,E,o,k«o,S)3.(o»)pJp Hera p ,к ага the Fourier-variables oonjugatad la r and angle в with IAS axis.
Tba behaviour of the function* at large 0 and r la determined, by the behaviour of their traasforaanta la а certain near--xero region at variables £ 1?]. This авале that the transfor-aanta ahould he ealoulated to the mewl ana accuracy whan calculated the tranaforaant of thla region.
The variables к and p are separated near aero and, therefore, the ^-technique equations, where aolutioaa are well known [18], may ha written for the coefficient of the k- and j>-power serlea. Thus, we immediately obtain an expression for MAD and TPLD integrated over 3 near О to the A and В approximations of tba theory.
It will be noted that the expansion coefficients are simply related to the corresponding aomemts of FAD and IXD. To obtain the values of FIJI in the range of the moderate and email values of the argument and to control the accuracy of the aaymptotio expanaiona, i t ia necessary to calculate TIED and TFAD for mean
К and f and to "Joint" them to the known aaymptotloa for the traaaforaanta [ 19]. The solution of the aquations for the trana-foraanta in the range of mean к , f takea the fora of the apline-functioaa [ 20]. The ooefficienta of aplina-pieoawiae polynomial are determined from the conditioaa of the coincidence of the function and i t s derivatives in the nodes of the net of variables. The accuracy of the solution approximation by the spline within a oall of the net can be easily controlled by varying ita aise.
The calculations in the intermediate region of к and f were carried out in two steps. First, the solution was obtained for TPAD and ТУШ differentiated in В to the A approximation of the theory. The many-group method (M3-method)Ll21 i s used to solve the problem in the low-energy range where the ioniaatlon lessee are slgnifieant. The obtained one-group equations proved

441 to be similar to the A approximation equations and нага alao solved uslag tha spline functions. One accuracy of tba oalcule-tloma in Ж was controlled by varying tba alsaa of tba groups. At sufficiently high valuea of tha variablee к and у < tha apllna Amotions wars jointed to tha asymptotes.
Tha use of tba spline-functions has nada it posslbla to obtain TFAD and TFIB in an analytical for» <utd to avoid numerical integration when converting tha Hankoi transform (2). As a result, tt» eventual error In -the calculated FAD and И В falls to exoeed several percent for r r< •-1 0 -6 i .
The technique desor" -. above waa used to calculate PAD integrated over I in the В approximation and differential FED in A «pproxlmstlom. In Fig.l tha FAD of eleotrona in аат!sum of SAS evaluated In water for the different threehold energies аха presented. She threshold energies (in Me?) are written near erarj curve. From Flg.1 It follows that one nor» parameter, namely tha effective threshold energy of tha array > # « t should be fitted whan comparing between the theoretical and experimental data. If tha approximate energy spectrum of tha cosmic rays. Incident onto tha array and the detector geometry are known. B # f f of tha array can be eatlamted within a euffieient accuracy using the already available Monte-Carlo program £15].
Presented in Fig. 2 is tha comparison between differential FID calculated in the present work (ourve 1) and FID reconstructed on the basis of tha moments (curve 2) in A approzlmation[13]
Since tha curve 2 is in a good agreement with data of Я.К the obtained diaerepaney shows that FIB is steeper than the H.K FID in A approximation. The Tables of FAD and FIB and corresponding the FOBTRAI programs of calculation of the cascade functions and their momenta are planned to be published in the near future.
References 1. I.K.Stemenov. Iar.Akad.Bauk SSSB, aer.fls. ,39.1201, 1975.
2. L.a.Sidenko, I.K.Stamenov, et al. Short Communications in Physics» Bo.l, 50, 1976. 3. J.Hishmr*. Handbuoh der Pbysik, Bd.46/2, 196?. 4. V.a.Aeeikin, et al. PICOB. Munich, 8, 230?, 1975. 5. I.Zecobar, et al. PIOCR, Jaipur, 4, 166, 1966.

442
6. S.Hijake. Caned.J.Phya., 46, 16, 1968. 7. B.H.Alexejrev. PIOCR, Mttooben, 8, 2996. 1975. 8.S.l.r«moT, G.B.KbriaUeneea, at al. Isv.Akad.Hauk SSSE, aer.fU., 2g, 458, 1968. 9. Progress In. Coaaio Bay Physic». Bd. by J.U.Wilson,vol.Ill,
Aastexda», 1952. 10. A.Adaobi. Suppl.Proe.Tbaor.Phye., J2, 154, 1964. 11. A.lUaaki, Three-Ola. Cascade Shower in Mad. Tokyo, CHb-
RBPOHT-36-76-5. 12. A.A.Belyeev, Y.Y.Gushavin, I.P.Ivananko. Preprint ИАН
«0.54, part I, 1975. 15» lu.I.Baekhalov. Sheses, Ifoeeow State Unlr. .Moscow, 1972. 14. V.A.Aataflev, at al. Iav.Akad.Hauk SSSH, aer.fix., 40,
969, 1976. 15. E.H.Ragal. Z.Phya., 186, 319. 1965. 16. В.Вгоекмап, at al. Z.Pfaya., 243, 464, 1971. 1?. *.w.01ver* Brror bounds for stationary phase approxima
tion, SIAM jr.lieth.Anal., £, 19. 1974. 18. l.P.lvananJto. Electromagnetic Caacada Processes. Moscow
State Univ., Ifoaoow, 1974. 19. Vortrflge tttav Koraisohs Stxeblvuig voa tr.Reieenberg, 524,
Springer, 1953. 20. S.B.Steebkln, Xa.K.Subbotin. Splines la Computing. Mathe
matics. H., 1976.

443
т.)
-
tc и
w *
гшКХ
• ' i
r/J и
ftg.2

444 LATERAL DISTRIBUTION OF ELECTRONS WITH ENERGIES
ABOVE 7T40 IH THE CASCADES PRODUCED BY A PHOTON WITH ENBRGItJ 1011 101V eV IN THE ISOTHBRMIC ATMOSPHERE' R.A. Antonov, V.A. Astafiev, Т.Г. Ivtmenko, A.A. Kirillov,
T.S.LIm, Yu. 7- Paskhalov Institute of Nuclear Ph„ Tica,Moscow State University;
Moscow, 4SSR. ABSTRACT; The following, mor'el of electromagnetic cascade nas oeen used to caloulate tr.n ~u -ctlon of the electron lateral distribution in isothermic - иогрЬеге at the e>bsej."V2tion level in the upper atmosphere: the particles of up to Е > 0.01 - 0.9E are traced in the A approximation of the cascade theory including multiple scattering and inhomogenei-ties of the medium on the basis of the Monte-Carlo method. The contribution from the electrons and photons with Е < E M C to the lateral distribution function is calculated in the В approximation of the cascade theory with approximate inclusion of the inhomogeneity of the atmosphere.
1. Introduction The modelu>of electromagnetic cascade including the cascade
fluctuations^has been developed to calculate EAS «t various observation levels. The program is intended for calculations of EAS in the upper atmosphere.
2. Model of electromagnetic cascade The use is made of the mixed model of electromagnetic
cascade generated by a photon with energy Eo , namely the cascade particles are traced in the к approximation up to the energies Е • 0.01 - 0. 9 Eo using the Monte-Carlo method/2/ The contribution of the particles of lower energies to the function of lateral distribution (FID) of electrons at the studied observation level t^,s (in cascade units, Xo) is calculated on the basis of the cascade theory formalism to the В approximation. The Niahlmura-Kamata approximation /3/ has been used to derive the electron FLD. The effect of the finite Eo is included in accordance with /4/; the condition of FLD normalization to unity was met by calculating the nor-' malxzing constants which are functions of Eo/A I / is the critical energy of air) and the longitudinal age of the cascade.
3. Results and discussion Pig. la presents the results of calculations of the
particle number in a circle of radius » • 0.094 O.OIH, 0.03, O.f, 0.3, 1,-Wr», where r, »(Е,/л )X0 is the Holieve unit at sea level) as a function of depth -&#bs for Eo • 100/1 and the cascade generation depth i , >!«, for inhomogeneous
medium calculated in terms of the given model for Е - О. У Eo ( averaged over 300 cascadeti). The inhomogeneity

445
of the medium was taken into account using the Greizen rule according to which the value of the radiation unit in cm. was taken to be 2 x« higher than the observation level when calculating the value of the Moliere unit at given level. Pig.1Ъ presents the corresponding fluctuations, of the particle number in a circle of radius Г calculated at
E M C = 0.9 £„. Fig. г presents PLC at depth i • 10x for t„- 2x/:alculated
in terms of the above described model with approximate inclusion of the inhomogeneities. The dots denote the results of calculations of the electron FLD obtained in case of correct inclusion of the isothermism of the atmosphere /5/ . It can be seen thai the discussed model of electromagnetic cascade makes it possible to obtain the mean characteristics within an error of not above 20$ and to include the cascade fluctuations.
REFERENCES! '•T.V. Borog, V.V. Тяакот, A.A. Petruohin. Free, of National
Conf. on Cosmic Hays, Toshkent, Part 1, isa.3 p.14 ( 1968) 2. V.A. Astafiev, I.P. Ivanenko, T.S. Lim, V.V. Makarov,
The Effect of the Generation Depth on the Electromagnetic Cascade Shower Development in Isothermic Atmosphere. Report at the present Conference.
3. K. Kamata, S. Nishimura, Prog. Theor.Fhys. Suppl.6,93,1958. 4. V.V. Guzhavin, I.P. Ivanenko, ZhETF, 28, 2, 662,1960. 5; V.V. Guzhavin, X.P. Ivanenko, Yu.I. Paskhalov. Sov. Nucl.
Phys., 16, 4, 1972.

446
»ig.1. Tha particle nueber (a) in a circle of radiua the value* of expreaaed in tha Moliera unite at aaa level are indioatad with the auaerala) for
iohoaoge-nenua atmoaphera and the fluctuation» (o) aa function* of the depth t=t0bf ( t, - 2 ж0 ).

447
I I I I L r
Я 9-a-
0.1 \^_ ^-—^ 1 1 1 1 _ «r* to'1 /<r' io' r/fc Fig. 2. The electron FLD in terms of the presented model (a) and the FLD fluctuations (b) averaged over 300 cascades at E„^ 0.9E,for homogeneous (the iolid line) and inhomogeneous ( the 4a*bed line) atmosphere. The dots show the results of calculations of FLU with correct inclusion of the lnhoraogeneity(ry, is tke Modem
unit at *Ae 4tvee t= fax*).

ЪЬПоо404 448
ЕРШИ OF ТШ GENERATION DEPTH ON ФЕБ ELBOTHOMAGKBTIC CASCADE SHOWER DEVELOPMENT IN ISOTHERMIC ATMOSPHERE V.A.Astaf iev , I .P . lvanenko, T.S.Lim, v.v.Makarov Nuclear Physics Institute, lioscow University, Uoscow 117234-, USSR
Abstract. The Monte-Carlo method has Ъееп used to study tbe three-dimensional development of electromagnetic cascade showers in isothermic atmosphere under approximation A of the cascade theory including multiple Coulomb scattering. She accurate function of the lateral--angular distribution of electrons for isothermic atmosphere' is used when simulating the lateral-angular shift due to multiple scattering along the bremsstralung path. The electron and photon spectra and function of lateral distribution as wall as the various moments have been obtained as functions of the development depth of the photon-initiated cascades at the various generation depths. The Monte-Carlo data are.compared with the results of analytical calculations carried out for isothermic atmosphere. 1. Introduction. Interpretation of the experimental data obtained with X-ray emulsion chambers at various atmospheric altitudes is essentially associated with the use of the results of the calculations of the electromagnetic cascade showers in the real atmosphere. It should be expected that the spatial-energy characteristics of the shower will be functions of the shower generation depth and will differ from the corresponding characteristics calculated for homogeneous medium. The three-dimensional simulation of the development of photon-initiated electromagnetic cascade showers in isothermic atmosphere is used in the present work to study the effect of the shower generation deptb on the shower spatial-energy characteristics as functions of the shower development depth. 2. Physical model. The processes considered with the cas&ufe thewjundW approximation A and the multiple- scattering with accurate account of the inhomogeneity of the medium were taken into account when Monte-Carlo simulating shower development. The differential cross-sections of tits breoestsahlung and pair production per radiation unit K„ were taken in i;he Bate--Geitler form with complete screening \V\. To include the effect of the inhoaogeneity of the medium on the electron lateral-angular shift due to multiple scattering, we shall examine the problem of multiple scattering of an electron with energy Е produced during shower development at depth tQ(the generation depth for, a considered electron in isotheioic atmosphere)
(fe •&.**>'-A %> *(**Ь*>*М**ЫШ CD where at is the electron path, t0 and at are measured in radiation units., H» is the altitude of isothermic atmosphere, B,=2l Her. solution of (1) will be written in the form

449
where a . ^ tn%b)\ 6= fa(l*t) i W*= £*i i t**t/to. Integration of зг(е,л*,*,вл) over 0Д and x gives the gauseian distributions for the function of lateral (FID) and angular (IAD) distributions* i n th i s case PAD variance coincides with the same value for homogeneous medium, Oi z=£/i£#£, and the FIB variance, « , measured in lioliere units at observation leve l f^i= y£)(4oM*tii), i s expressed through the variance for homogeneous medium Cj t
' function F*>) i s presented i n F ig . l . The parameter ф cha-er i ses the tnhomogeneity of medium for various л t and tv
The raeterises
F ig . l Function F(e ) .
At в -* О СГ2-*<г/ , and at ч -**>,<rK*6cr*: At various values of tot the sane inhomogeneity effect can he felt at different At , For example, for i0 = =0.3 and 3.0 x0 the formula for homogeneous medium gives a 10% systematic error at at =0.01 and 0.1 x„ respectively.
The simulation of the lateral-angular shift for homogeneous and iso-ж ш „ thermic atmosphere was carried out for four independent gaussian distributions with the appropriate variamces.
3. Results and discussion. The method of correlated tests was used in the calculations, namely all the characteristics in various versions (homogeneous medium and isothermic atmosphere at fixed t =0.001, 2, 5. lO.and 20*c)were studied for the earns ehower histories at the ratio of the primary photon energy Е „ to the minimum energy E«, of the examined shower particles S./E-clO . The data have been averaged over 600-1000 showers. The dependences of the various electron (*) and photon (*•) characteristics (the mean particle number 4t energies axis
,s*j»,r«* , w» ввсш ниш oi -сое squared produces or tne , « fractional energies and radial particle distances < Z **/&£,>/ on the shower development depth t were calculated during the simulation. Similar Information has also been obtained for the angular characteristics. Together with that, the electron and photon FAD and FID were derived.
The calculation results have shown that all the one-dimensional, angular, and energy characteristics (and spatial ones for homogeneous medium) in thg examined versions coincide within the 10» errors due to statistics, with the analyticalW

450 c h a r a c t e r i s t i c s and agree siith other Monte-Carlo data Q2] .
P/a.2, < ^ / , j > u s a. i^rvctloix of t a--re/o.t«c/ to N6IWr« u/ii'< syiAO^re at sea. level -for te-0,2,5~,/ОалЛ20ле, t/>* Croats tt.re our Juia for Aoihqjftx'""* ned,um ; tl,e daii Г4) , ike (let linfc is tat«n from Li j j b - relaAed i o r„f .Levels " in J 30 coinciJt yvitk A^elylua.1 da-tn. £i'J s

451 Fig.2a parents < fy ,f > as a. function of ~t * £0i <,"*•,,
for fixed t» iu isothermio atmosphere (the solid (уз) and dashed (f) curves show the Monte-Carlo results related to the square of the Moliere radius at sea level T„ =2Л13 x„). The figure also shows the results of the analytical calculations II3 ] for homogeneous medium (the dot line) and our control Monte-Carlo data (tie crots*s). It can be seen that the mean squared lateral distance of photons at low depths is smaller than those of electrons (only electrons experience the Coulomb scattering) and that the situation reverses (at t>5) who . - fflection of photons is determined by geometric path o1 •• .'-.ос*:- to a greater extent than, by the multiple Coulomb 3 i„- of electron. Thus» qualitatively the same pattern ... . observed in isothermic atmosphere as in homogeneous me9 •' -. However, the absolute values of the lateral moments <Ra,*>, are strongly sensitive to
i0 , and the larger values of < Ky> eorresponi to the smaller values oft,. „г. у z Fig.2b shows the ratios <.Rji,f>/ rtbs , where Vd,s is the Moliere radius at the observation levels Ь01л=5, 10, 15,
20а.гЩ 3<\as functions of t. The presented curves may be obtained from Pig.2a by multiplying by the scaling factor (EOK/'O ) * • T b e curves for other tus c a n b e sinuJ-sorly obtained, rransition to the Uoliere radius at observation level г0ь5 decreases to inhomogeneity effect and shows that at all Cois tneTufference of <'*yi, >in isothermic atmosphere from the corresponding values for homogeneous medium t he smaller i„ and greater t ; at t, =0 the difference is the largest, as it should be expected.
<&Ф ^ s a_ fu»ctia* of i .
the s w « t «•* °-
0 1 1 6
Tig.5 presents the dependences <%• (eK/£o)/3>r > re la ted to a s ingle shower as functions of for t =0.001, 2 , 5, 10. Similarly to the case of < * £ * > (Fig. 2a)
-г— there* dependences are t,X„ Quali tat ively the same
for inhomogeneous me-

diua a» in the homogeneous oas* and their absolute value* are •trongly dependent on t , . Kg»* «bow* the electron Ш) normalised to unity at depth tm 2, .and Sx,tor t # « 2x.and homogeneous medium. It can Ъе seen that the-'results of the
Fig.4 The function of lateral distribution of electrons P at tr 2, 5 for homogeneous (dash lines) and iahomogeneous (the solid lines, t« =2Xe) nedium. The hystograma present the Monte-Carlo data. The solid lines show the analytical calculation» [4J, the dot* present the Honte-Oarlo data [2].

453
analytical calculations [ 41 obtained considering the finite-nsss of Kj and our Monte-Carlo calculations are in agreement within the statistical accuracy of the latter. The Monte-Carlo data obtained by adaehi et al.[2] are in a good agreement with ours and analytical [4] reculta.
References
1. B.Bossi. Hlgh-Bnergy Particles. . Bnglewood Cliffs, K.J. i Precentice-Hall Inc.«1956.
2. A.idachi «.a. Prog.Theor.Phys.Suppl. R0.32, P.160 (1964). 3. A.Mlsaki. Prog.Theor.Fhye.Suppl. Ho. 32, p. 100 (1964). 4. TU.I.PashaloT. Dissertation. Moscow, 1972. 5. O.Hiroshi, K.Sumito, Ta.Shinotoro. Prog.0beor.Phys.,Y.54,
Ho. 6, p. 1720 (1975).

454 THE ANALYTICAL EXPRESSION FOR THE FUNCTION OF LATERAL DISTRIBUTION OF ELECTRONS IN ELECTRON-PHOTON CASCADE
A.K. Bakhtadze Institute of Nuclear Physic», Moscow State University;Moscow 1192Э4,
U S S R
ABSTRACT: The analytical expressions permitting the function of lateral distribution of electrons from primary electron to be calculated including and disregarding the ionization loss for the approximation of small angles if multiple scattering have been derived .
Unlike the works by L Nishimura fl»2j and other owrks in which the developed exact analytical theory is limited to formulating the differential-difference equations for the sought functions whose analytical solutions are not presented* our work presents the algebraic finite-difference equations for the same functions. Solution of such equations for any integer values of the finite-difference arguments can be easily obtained with a computer. The same functions may be obtained for arbitrary values of the arguments though interpolation. The lateral distribution function for electrons with energies above a given one disregarding the ionization loss and the same function for electrons with energies above zero including the ionization loss can be represented by the lVlellin double integral calculated by the saddle-point method. Thus, the accuracy of the sought functions in terms of the assumptions made when formulating the input equations is completely determined by the interpolation accuracy and the saddle-point technique precision. The solved sought equations were the same as in Г1|2| • After deriving, similarly to fl ,2 I , the differential-difference equations for the sought functions, we obtained their analytical solution satisfying the physical requirements made in the problem. This technique was partially outlined in y j j for the A approximation of the theory . bubsti-titing the obtained partial solution in the inpuk differential-difference equations , we obtained simpler algebraic finite-difference relations.and determined the position of the first pole of the obtained functions in the left semiplane of variations in one of the arguments which completely determine them. The final result of the calculations may be presented in the following way.
The lateral distribution functions of electrons with energy Е at depth •£ of matter at distance t ( t t are expressed in rad.units) from the core of a shower generated by a primary electron with energy

4S5
Е which is "Vertically incident onto the boundary of matter is of the following form for the A approximation of the theory:
омел * J - T d CK •
* - - х-® (u¥ - ±) ®
-1<X< 0 (3)
The same function to the В approximation for the electrons with energies above zero is of the form ( l ) with Е replaced by в and the function fl< by fjf , where
In this case, S < 2. The function Й» [ iVl Г J ^J i s d e t e r m i n e d
by a eel of finite-difference equations indicated in expressions (8 ) - ( l8> . For the axis approximation at С л, ^ j 1, the same function is of the form **W

vw=jt Aw rw ft)
it will ba noted that aarliar £ b j wt obtained the approximate formula»
Tha value, of the function. J f o Z ) ~£ Jtt$j4 *»* Щ&). Kl&J are li.ted in Table . 1 and 2 . I ' *^ i /
'<».»,«лН и (г/
Хи K=4

457
Tabto I
0.6
1.0
1.4
2.0
--P — -2.591 -I.4I4 -0.9745 -0.5598 -0.2336 -2.627.I0-5
0.3469
-&.84I -I.6I6 -I.I42 -0.8707 -0.6850 -0.2679 3.885.I0"2
-3.284 -1.938 -1.393 -0,8534 -0.4555 9.0I4.I0"2
-2.245 -1.655 -1.287 -0.8401 -0.4678 -0.I8I8 3.I33.I0"3
__£ 2.567.I0-3
3.858.10-2 0.1060 0.2755 0.5552 . .rf4I3 1.432
i.i^.icr3
2.493.I0-2
7.I96.I0-2
0.1347 0.2065 0.5396 1.093
5.202.I0-* I.I52.I0-2
4.047.I0-5
0.1402 0.6837 2.773
_, _J 5.689.KT3
2.2I2.I0-2
5.I64.I0-2
0.1445 0.3405 0.6580 1.007
0.3209 0.2001 0.1286 5.759.IO-2
2.013.10-2 6.040.I0-3
I.675.I0"3
0.8621 0.6II6 0.4346 0.3124 0.2277 7.283.I0-2
I.776.I0"2
2.605 1.742 1,186 O.SOOO 0.1086 4.896.10^
13.61 6.6G7 3.6P5 1.465 0.5287 0.2140 0.I58I

458
_ _ _s " ~ 0.2 " ~
0.4 0.6 0.8 1.0 1.2 1.4 1.6 1.8 , 2.0
IM 0.050 0.270 0.4SI 0.727 1.09 1.77 3.38 8.39 38.3
0.067 0.202 0.400 0.675 1.09 1.81 3.36 7.90 33.4 Co
. Ы-$ш. H'Si 0.38
1.01 •*
2.5
Co
tfp(^,^\)=£.^.[(s^»,fnj)gK(s,wl»i--fJ\J +
l>\

4S9
ъ z *4fa>a'\KM,?4^VJft>
The author is indebted to Dr, N.M. Qerasiaova for helptui discussions.
REFERENCES: 1. J. Niahi/nura, K, Kamuta , Suppi. Progr. Theor .Phye. 6,93-155,1958. 2. J. Niahlmura, Handbuch der Phyaik , v. XLVl/2 , pp.1-114, Berlin ,
Springer-Verlag, 1967. 3. A.K, Bakhtadze. Veetnik MGU, ser.flz. astroru, No.6, 1975, 726-734.

b&WMO) ELECTEOK-PHOTON CASCADES 1H THE ATHOSFHEBE ADD IB MTBCTOHS
A. H. H i l l a s and J. lapikone
Physios Department, Oniversily c ' Leeds, Leeds 1S2 9JT, IT. It.
Deta i led Ilonte-Carle eic- la t iona have been made of e l eo tron-photon eaaeadaa i n i t i a t e d by photons and e l ec trons of 1, 10 and 100 OeV a t various depths i n t i e atmosphere (and f o r 10 OaV i n a i r of constant denaii.. ,). we confirm the report of U l a n a t a l . that l a t e r a l зр-?ы!в are i:joh laaa than the Hishi -Mnra-Keaata-(Greissn) va lues , .-.яо although our widths ата somewhat greater than thoae of Allan at a l . , there are now 5 independent c a l c u l a t i o n s which agree t o wi thin ~ 556 on the spread. Examples of the r e s u l t s are g iven , and other r e s u l t s are a v a i l able on request . The response of cer ta in detec tor* has a l i o bean ca l cu la ted .
1 . Introduction» def lo ieno iea i n SOBS previous c a l c u l a t i o n s In тегу «any experiments on a i r showera, the r e s u l t s of Hishinum
and Kamata have been used, or the "НЮ" foraula haa been taken aa a good approximation t o the l a t e r a l d i s t r i b u t i o n of the e lec tron» . However, there have been ind ica t ions that t h i s formula may be s e r i o u s l y wrong. Allan and co l laborators (1975) reported Monte-Carlo c a l c u l a t i o n s which gave widths of showers ( e . g . г^щ, Гдвздщ) very much leaa than HE ( e . g . by a f a c t o r 2 ) j and experiment* on a i r ahowers near iwrlmuii, wh i l s t admitt e d l y not studying pure eleotron-photon oaaeadaa, have found that the age parameter a necessary t o f i t the l a t e r a l d i s t r i b u t i o n s may be union l e a s than that whioh deaoribea the s t a t e of longi tudinal development ( e . g . a * 0 . 6 - 0 . 8 for showera whioh have paaaed maximum a i a e ) . In addi t ion , i t appeared that the ex tens ive tabulat ions of, lfonte-Carlo r e s u l t s by Vessel and Crawford (1970) were quite wrong, a t l e a s t f o r a i r .
In the Eaverah Parle experiment, Honte-Carlo oaloulat iona by Baxter and by Harsden (1971) have been used f o r several years , and i n these the quantity obtained waa the response of a par t i cu lar kind of d e t e c t o r t o the p a r t i c l e f l u x , во not much a t t e n t i o n was paid t o the e l e c t r o n dens i ty f o r comparison with ЛЕО, and the disagreement had not reoeived a t t ent ion . IB these c a l c u l a t i o n s t o o , some errors have oome t o l i g h t (though they seem t o have l i t t l e e f f e c t ) , so mora e laborate c a l c u l a t i o n s have now been made.
The alma of the present work have bean the fo l lowing! ( a ) To aee whether Allan a t a l . ware correct i n s t a t i n g that the width of
eleotromagnetio oaaoadea should be ouch l e a s than given by ШОВ,
ib) To t e s t f o r cons i s tency between several c a l c u l a t i o n s , о ) t o oheok for ser ious errors i n the old Havarah Park o a l o u l a t i o a e , d) t o ca l cu la te deteotor responses i n more d e t a i l , e ) t o examine the e f f e c t s of magnetic f i e l d s - i n the atmosphere, f ) t o include smaller a f feota of ten omitted from o a l o u l a t i o a s , aad t o
i d e n t i f y the phyaioal assumptions whioh have aa laportant e f f e c t on the dens i ty oaloulated at large d i s tances ( r % 500m), with the aim of anauring that th ia vary small f rac t ion of the oaaoade energy l a being oorreot ly eetimated.

461
(g) (eventually) to obtain good statietioa to teat funotioaal form. la tli* following aeotioa, eono comparisons ara male with previous
calculations, and for this purpose oaaoadas la air of constant density are ooaaldered. Then, soae new result* are givea for cascade» la the real atmosphere, la which care la taken to iaolude accurately even quite small effects in the oaaoade prooeis.
g. The lateral spread as compared with other oaloulatioas The results obtained in this ssotlon xetar to oasoades in air of con
stant density, and • radiation length of 38.5 в om"2, in order to cheokue result» of ilia» at el. (1975), and two quite independent eomputatioas have Ъееа aade (by Alffl and JL), using different methods of simulation as a oheefc. For the same reasoa, o-rays were not generated here.
For thia oheck, the results are expressed in terns of % р ц в г в ( - 0.25 radiation length, - 74.5 " if "the air density is 1.39 kg m~3) we obtain the results shown in the table below, and in Figures 1, 2.
Showers initiated by 10 OeV photon (in uniform air)i r _ averaged over the whole shower r.n.»»
Electron» above 4 li»V counted. . . . above 0.5 MeV. Allan at si. Hilla» Koberg & Vordheia
Hleaisura к Kanata Hlllas Vessel & Crawford
0.6 Еи
0.8 Еи 1.0 RM
0.8 E„ at shower aazlauD (a " 1 )
0.7 B« 0.44 B„ 1.2 H„
(quoted by Alia»)
Fig. 1 shows how ття- and г^дещ т а гУ *i*b depth in the 10 OeV shower, aooerdiag to Allan, a l l i e s and Lapikeaa. The two present authors agree olosely oa Txm. (JL has not calculated г м а ^ ш , but finds < |r |> larger than do Allan et a l . . )
100 1000 Е (MeV)
Fig. 2. r.a.». eagle of electrons and photon», averaged over whole shower, es function of energy. (10 OeV photon primary.) |
Jm) 50
20
10
S
О 7 • • > • , ' - ' :
ь/ «V ' • • / . > " •
/ . »' * V"VL JJ : / • / Nr : / » / Allan etai.— :
. / , ' Hillas \ » / Lapikens о '•, , , \
200 400 Ug/cm*)
Fig. 1. r.m.s. and « d i e s distances I of a l l eleotroas above 4lleV threshold aa f• of depth.

462 JL has oonpared preliminary results of Browning, Prothero» and Tur-
ver (private communication) with our own work, for cascades in a real atmosphere, and the detector signals calculated by D.J.Harsden (1971) as a function of r have Ъееа compared with the present work, adding over broad annuli, with the following conclusions:
Г Vessel & Crawford Very much greater spreads. I Alia», Orannell, Sun et al . . . Spread 28$ less than "*".
Monte-Carlo J Browning, Protheroe 4 Turver") « , « 4 . *. ^ , , .. < -,,•, I Seem to agree to ~5?ь
• calculations: | Billas I „ . „ _Z „v-i- U , Lapikens Г * w h e r e е?»»?»"* results
*liSZ» J are l i a b l e . С Roberg & Nordheim Agree with x where ohecked.
Others: < ffishimura & Kamata . . . . . Much wider spreads. [_ Ivaaenko et al Comparable figures not yet
available. So, although there are serious doubts about HKG, and the llessel and
Crawford calculations for air are seriously wrong (the longitudinal development of the photons is also wrong here), it seems that mutually agreed results will be obtained from current work. Although the widths obtained by Allan et al. are too snail by about 28j£, we agree with them that the widths should be much less than given by NKG.
The large-distance results of llarsden (used ia the past at Haverah Park) are unlikely to be detectably wrong: the total signal ia a water tank extending out from 400m (or from 200m) agrees to 10$ with JL's value.
We have not been able to find the reason for the disagreement with Allan et al.. Fig. 2 shows the r.m.s. angles of electrons and-photons to the shower axis as a function of energy, averaged over the whole shower (i.e. weighted by track length), aad there appears to be a difference ia the photon eagles, though insufficient in itself to explain the different widths completely.
3. Effect of magnetic field (in real atmosphere)
Only a little work has beea done oa this so far (by JL). It seems that magnetic deflections cause a serious distortioa of the Cereakov light distributioa from showers starting near the top of the atmosphere. Thus, denoting the Cereakov signal at dietanoe r metres by ft(r),
ft(300)Bast • i 8 for a shower initiated by a 100-GeV photon Q(300)jfOrtm
T ' produced at the top of the atmosphere.
However, for a vertical 10 »V proton shower (non-scaling model), this ratio is only 1.07, though if the shower approaches at a zenith angle of 33 fron the North (latitude of Leeds), the ratio increases to ~1.25 .
The magaetio effects oa particle densities on the ground, for a 100 QeV photon shower, initiated half-way down through the atnoaphere, are very ••all1 the last-Vest aad North-South spreads agree to within 2J(.
Host of the work on showers in a real atmosphere has so far used no magnetic field, as similarity transformations oan thea be used to shorten the computing tine very considerably, hut the magaetio effeots will later be re-exaalaed ia connection with signals at very large r.

463 4. Mora detailed simulations la real atmosphere with ao magaetlo field.
The oaloulatioaa reported la section 2, like several la the past, included the following processes: Baergy-depeadeat pair-production and oreaestrahluag oross-seotioas (with appropriate detailed screening faotora) eorreot to the Bora approximation) ionization loss, Vaiyiag with energy (logarithmic rise); Compton effect; multiple Coulomb scattering, or Holier»' s combination of single and multiple scattering. Jo other angular defleotioas were introduced.
* la seotion i, magnejic defleotioas «ere added. The more detailed simulations Include»
Knock-on eleetrone above 1MS7, with consequent reduction in the expression for ionization loss (no logarithmic rise, ultimately); separate expressions for ionization and keook-on for eleotroas aad positron! (with a formula giving aa accurate representation); Sommerfeld angular distribution of electrons and photons on production (la pair production or brems-strahlung) with 3~4 tall; more accurate treatment of plural and single scattering, aot using small-angle approximations annihilation ia flight of positrons; radiation length reduced to 35 g on-2 (Gennant 4 Pilkuha,1973).
The electrons are followed in very short track segments at low energy (0.15 g on-2 below 2.5MeV , for example). However, below lUeV the photons are oaly followed in an approximate way, their notion being represented as a completely inelastic photoelectric absorption with m.f.p. 45 g cm"2, rather than diffusion by multiple Compton scattering. Bleotrons are followed to 0 lieV. Photoelectric effect is oaly introduced in this fictions form, ill bremsstrahlung photons down to 1 « W are followed: those of lower energy are aot generated, but the energy loss they represent is accounted for.
Calculations have been made for showers initiated at intervals of 40 g en-2 aloag an axis inclined at 25° to the vertioal in the atmosphere, aad the particles and paotoas reaching atuospherio depths of 200, 530, 680, 620 and 1016 g ear2 (measured vertically) are recorded. Primary photons and electrons of
0-1 Fig. 3. Lateral
distribution of electrons in photon initiated showers, compared with ШЕВ formula, near shower maximum (s - 1.03). r 2! particle density is plotted, normalised to one particle In the shower. (Sea level)
1, 10 aad 100 GeV are studied.
NKG е X (5=1-03)
0'001
50 100 200 500 1000 г (m)
Eleotroa densities (including positrons, of oourse) ia 10 OeV and 100 BeV photon showers are compared with the1И distribution at 1016 g cm"2, near shower aaxiaum (182 and 262 g on-2 beyond point of Initiation in the two oases). The narrower spread is again seen.
Fig. 4 shows the total number of electrons (above 0 UeV) as a funo-
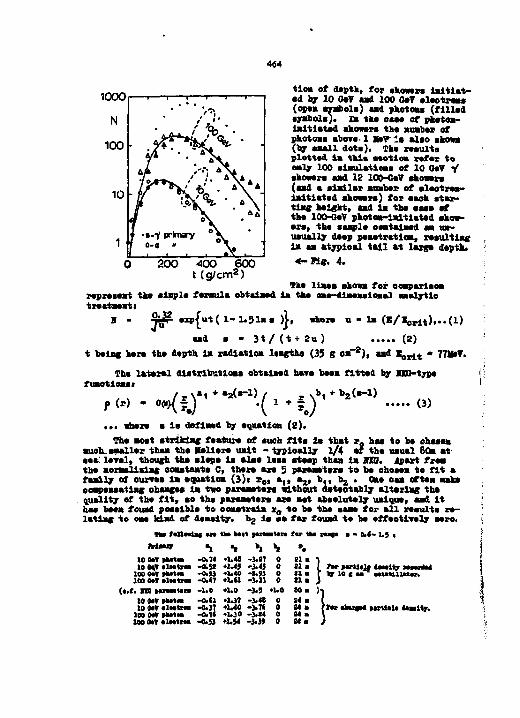
464
1000
N
100
10
1
т 1 1 1 1 1
" ' '"Л / < • -^JK-
• tf^*kC% • ХА • 'лЧ 7 * \ А
'А '''\ 4 Л* •/1**>. '' /• ДУ»л / / " V Ь • * \ *. 'а щ% • Л Г %. • л^ cf o \ • -«-У primary "V Г ""' " \ e
tioa of depth, f or актам laltlat-•d by 10 OaV «ad 100 OaT eleotrea» (орав ayabola) аж! photoae (filled ayabola). in tke ом* of pketoa-laltlatad akowera the auaber of pkotoaa аЪоте 1 lfe?li alio akowa (by aaall dote). Tke reeulta plotted la tale aeotloa refer to oaly 100 aiaulatioaa of 10 OaT Y akowara aad 12 100-OeV ehowera (aad a alallar anaber of eleotrea-ialtiated akowara) for aaok atar-timg height, «ad la the aaae ef tka 100-QeV pkotea-laltlatad akow-era, tke aaapla oeatalaed aa ua-ueually daap paaatratloa, reaultiag la «a atypioal tall at large deptk. *~Пе. 4. 0 200 400 600
t (g /cm 2 ) Tke liaee shorn for ooaparlaoa
repreeeat tke aiaple feraula obtaiaed la tke oae-diaeaaioaal aaalytlo treataeatt
I . £ • £ e x p u t ( l - 1 . 5 1 a a ) , якета u - la ( • / * « , ! , ) , . . ( l )
aad a - 3 t / ( t + 2 u ) (2) t being here the daptk la xadiatioa leagtha (33 g oa""2), aad l o r i t • 77M»T.
The lateral dlatrlbtttloaa obtaiaed ката beea fitted by KO-type fuaotioaat
f M - ce>(f#) •( i * § y (3) ... where a la defiaad by equatioa (2). The aoat atrikdag feature of aueb fit» la that r. haa to be oheaea
euoh.aaaller tbaa the Holier* ualt - typioally 1/4 ef the uaual 80a at aaa: 1ете1, though the alepe la alia leaa ateep thaa la ЯТО. Apart frea the aoramlisiag ooaataata C, there a n 5 paraaatere to be ohoaea te fit a faally of ourrae la equatioa (3)i r0, a,, a2, b „ b 2 . Oae oaa of tea aak» ooapeaaatiag ohaagea ia two paraaatari without deteotahly altarlag the quality of the fit, ao the paraaetara are aet abaelutely uaique, aad it haa beea touad poaalbl* to eoaatvaia x0 to be the eaae for all reeulta re-latiaa; to oae kind of deaaity. bg la ae far fouad te be effeotiyely «его.
Те* fftllntac ям tt» b«rt | « W 1 « f«r tha raafa • 0.«- 1.5 t
Maaqr «I 10 Ort tkMai -0.14 .1.48 -3.S7 10 ЩТ «lMtna -0.il *U* -3.45
WO OCT H M O -O.SJ .1.40 - 1 . » 100 О»» «lMtiM -0.67 «l.*I -3.13
(».f. I D l — I H -1.0 19 MT ftotai -0.(1 lOMTalNttH -0.37
IDS 0*T »kat« -0.7»
*1 *i
0 «1.0 -3.5 rt.0 •1.37 -3.4* 0 •MO -3.lt 0 .1.30 -3.14 0
lOOMVdMtn* -0.53 +M4 -3.3» 0
21 • 21 • 21 • i l a
Mm I Me f: s«« \ Me )
IT u i и MUUI:
to tbaai* wriUlt luiitr.

465
Further atteapta «111 Da made to gat a more systematic representation. Hoar answer mariaum, thaaa distributions tead to be flatter by about
0.5 in the exponent «f r both at email aad at large r, compared with НИЗ, but the expoaeats v w j lata with s at large r. It should be aoted that ia theae represeatationa, for. eoaveaieaoo of applioatioa, a la defined by equation (2)» nfcioh doaa not really give the correct age for eleetroa-imdueed showers, «hloh reach maximum earlier than do photo» showers.
Fig. 5» oppoaits, iadi- 1 oataa the adequacy of the fit. The palate show results of the M HMt'e-Carlo slmulatloae for <x "acintillator deaaitiaa" at 4 T
depths lm showers initiated by о-1 10 OaT photons, aad obaeived at sea„level. (actually 1016 g ca ) An average over 100 ehoware ia ahowa ia each oaaa. ("Soinpillator denaity" ia 0.01 multiplied Ъу г2 for aaaa ef plotting.) The linos represent the formula, usiag param-etere girea ia the first part of the table oa the previous 04 i 2 5 10 20 so 100 200 5001000 peg*.
At small s there is am exoeaa deaaity at large distances, aad it is always found that for showers past maximum the deasity fallb off more ataeply bayoad 500a (where it probably aaver beooaee flatter thaa r " ) .
The ataadard atmosphere whioh ia used la the ealoulationa has a» air deaaity of 1.186 kg m"3 at the observation level 1016 g ca~2 foi which reaulta are quoted aad 1.104 kg m~3 »t lOOg ев~г higher thaa this (i.e. 916), altheugh results hare also beaa ebtaiaed for different obaerratioaal levels, as listed earlier.
Oaa poiat worth emphasis is that for ahowara of age ia the raage 1.0 to 1.3, half the partiolas are contained withia a circle ef radius 13 to 28 aatraa, roughly, as that it is virtually iapeaaible to determine directly the number of partioles ia vary large ahowara. Whoa measurements are made at snob, grater radial diataaoss oaa fiada low-energy photons to be auaereua, aad the detailed response of the deteotor ia iaportant. simulations of oasoades aad Ceraakov light produotioa iaslde Haverah-Park-type water tasks have therefore been made, taking aooouat of the walls of the tanks aad the roof ef the hut. The oaloulated aigaala for iaoideat muoaa, photons and eleotrona of varioua energies will be published separately.
Щ а , S.E.. M l n n l l i J . 4 o u » i , r.r.SVitl» ud *>Fk»m (1?75)> 14*h ICCI, Utnlob, S, 3071-6, u l print* •oeunic.tio».
uuist. в., a cnuubi (i97J)i i3tb loo, ют», t, г*г*-т. S o t a , t.J. (1971) I Tbulii Okinnilr «f !»<•• BMMlf !•• a Г.Г.0м»г»гй (I970)i llMtns-ph«tn акот dUtrlkutlca fuutlo taktei..
(Pus**» й<||) .

466 THE ANGULAR STRUCTURE FUNCTIONS OF ELECTRONS
AND PHOTONS L.G.Dedenko
Moscow State University, Physical Department
The new method is suggested to calculate the projections of the pngular structure functions of electrons and photons in an electron shower in the Landau approximation.
1. Introduction. In recent years there has been an increase in interest in the Cerenkov radiation produced in large air showers. To interpret experimental data in terms of both as a measure of primary energy and as an indication of the longitudinal development of showers (Efimov et el., (1973), Smith and Turver (1973)/one has to calculate the lateral-angular distribution of the light (Ityakonov et al (1975), Guzhavin et el. (1975) and Orfbrd et al. (1975)- ffiese calculations need the angular structure function for an electron shower. Some calculations of this function were carried out by Belayev et al.(1975).
But because the electron lateral structure function is under discussion (Allan et al., 1975» Dedenko et al., 1975) it is iapor-tant to calculate the angular spread by various methods. The Monte Carlo simulations provide results only for not large value of energy of primary photon. Therefore some semianaMtical and numerical schemes specially developed may be useful.
2. Method of Calculation. We take the coordinate frame as fol-lows. Let us put the axis Z along the shower one and the axises Х,У perpendicular to it. We shall calculate the projections of the ansilar structure functions of electrons and photons in Landau approximation on vertical plane ZX which passes along the shower axis. Let us measure the depth t in radiation lengths. Then.the equations for the projections of the angular distributions of electrons and photons on plane ZX are given by
T& = -»r + f ?*!<' a) where P (S,t,e) dBdtd© and r(E,t,e) dEdtdS are the average numbers of electrons and photons of energy (E, K+dE) at depth between t and t+dt and with deflection angle between в and e+de from the shower axis in the plane ZX; S(B,t,e) is the source function; /We and f*f are the absorption coefficients of electrons and photons; Wjj and Wp are the probabilities of radiation and

467
pair creat ion under the assumption of complete screening» Bk i s the "scat ter ing energy" of about 0.021 GeV. The term with fi i a -cludes-the effect of the constant ionizat ion l o s s . If we cut the r a i i a t i on cross section at small fract ion С of energy of emission photon then /*e wi l l be f i n i t e , bet us solve the system (1) for the v e r t i c a l primary photon with energy of E 0 . In t h i s case the boundary conditions for (1) can be expressed as
P-b la-t 1 = 0. r = 0.J (2)
and the source term in (1) become
where О(©) is the delta function which takes account of motion of primary photon along the shower axis. Thus the primary photon is not included into the system (1) and has to be described elsewhere as follows
w bet us derive the solution for the first equation of the system (1) which is more difficult to solve. We shall interpret this equation as an ihhomogeneous parabolical one. 3?he corresponding homogeneous equation reduces to
(5i The solution of (5) with boundary condition at depth t 0 expressed as P v (E, t0, 0) (the vertical electrons at depth t0) is given by / 1 2
/ft i *H[**/P-4 *Je е-£ц1/г*£ ™ where
(7)
The expression (7) is given by Belenky (1948). If one takes the boundary condition at depth t 0 as
PD (E, 6, t0) then the solution of (5) becomes
t where бх2 i s expressed above.

468
Let us take into account now the inhomogeneous terms in (1) . The solution of (5) i f the source term i s added on the r igh t side of (5) becomes /4-TJ &z
4ФЖ£уЫФ~ ' е"Ф(Аг/#£*? (9) where
Finally the solution of (5) which takes account of radiation and pair creation is expressed as KA.7"/ C0-1P)г
kK *< eJ= J^r Tc/g> e~^ е "Я? *
where в^2 ia given by (10). Рог photons the solution of the second equation of (1-) is
eivenby »J4-t.J * »M r ,
where Г (E,e,t0) is the boundary condition at depth to-p To construct the numeral scheme we shall combine the suc
cessive generation method (Hozental and Zatsepin (1954) and the "step by step" method (Dedenko (1965) as follows, let the 0-th generation of electrons PQ
b e expressed by (8) and the l~t one £rom the source term 2\ff by (9). The 1-t generation from the 0-th one P^Q can be calculated if we replace P and Г in (11) by % and lb. The 2-d generation "Bs. is also given by (11), if one uses Pi and Ti Instead of P and Г, where & *Pigr+£ Finally the more accurate approximation, can be evaluated by t "step By step" method as follows Finally the more accurate approximation, can be evaluated By the
(13)
where 8x2 is given by (10). Evaluating integrals in (13) one has to use in the current point the sum of generations instead of P and Г.
The 0-th generation for photons is given by

469
and the 1-t and the 2-й one's are expressed as
Qfci Qt-JJre*H'*JJZ К'***' and
3. Conclusions. Ihe new method is suggested to calculate the projection of the angular structure functions for electrons and photons in an electron shower. Ihe method can be developed to calculate the projection of the lateral-angular structure functions.
Acknowledgements. The author is indebted to Professor G.B.Christiansen for his constant encouragement.
References Allen.H.R.et al.,1975f PICCR, Munich, 8, 3071-6.
: Belenky,S.3.,1948, Cascade Processes in Cosmic Rays,GosteJchizdat, Moscow.
» Bel4J6*4A.A.,,et al.,1975. Preprint P.N.Xebedev, Physical Institute, Я 5'!, Moscow.
; Dedenko,L.G.,1965, Izv.Akad.Nauk SS3R, ser.£iz.,29.H 9» 1722-4. i Dedenko,L.G.,et al. ,1975» PICCR, Munich, 8, 2731::5. i- Dyakonov,«.H.,et al., 1975, PICCR, HunichT 12, 4-359-42. i Bfimov,H.H.,et el», 1973, PICCR, Denver, 4,~23?8-82. Г Gazhavin.T.V.et; al.,1975, PICCH, Munich, 5, 3024-S. I Orford.K.I.et al., 1975, PICCR, Munich, 87 3014-B. I RoBental.I.L., and Zatsepin.G.T., 195*i DoM..Afcad.Nauk SSSR, 39,369. i Smith 6.1.,and Turver,K.B., 1973, tf.Phys. A, 6, L 121.
(14)
(15)
(16)

470
THE SECOND MOMEKTS AHD THE NKG FOHMUIA L.G. Dedenko
Moscow State University, Physical Department
The mean square deviations of the lateral-angular structure functions of electrons and photons in electron showers are calculated by the new method in the tandau approximation for the air. The calculated lateral spread of electrons is compared with that given by the HKG formula.
1. Introduction. The possible anomaly in electron lateral dis-tribution in the primary energy range of 10 f 10' SeY was suggested in an earlier paper (Stamenov,1975) and was discussed in some papers at the Munich Conference on cosmic ray (Allan et ,al.(1975)> Dedenko et al.(1975). One way to understand this anomaly in the frame of the classical -cascade theory is to represent it as the effect of the finite ratio E/E0> where Bo is the primary photon energy and S is 'energy of shower particles (Astjfiev et al.(1976). The alternative hypothesis is to revise (Dedenko et al.(1975) and (1976) and Allan et al.(19?5) the HK& formula introduced by Qreisen (I960). If so then it is important to calculate the spread of electrons or even the mean square deviation of this spread by the methods which are quite different from the method of.functional transformations used in classical theory. The Monte Carlo simulations provide results only for ratios E/E0 of lO"^ *• 10"* . So the methods which can be effective for much smaller ratios are of importance. We hope that some semianalytical and numerical schemes specially developed may be useful.
2. Method and Results. One analytical method of calculation or the mean square deviations which takes into account the constant ionization loss but disregards absorption and reproduction of' electrons and photons has been developed by Belenky (1948). Following Belenky (1948) but taking into account absorption and reproduction of shower particles'let us write the couple of equations for projections of the lateral-angular structure functions of electrons and photons in bandau approximation on any vertical plane which passes along the shower axis (e.g. on ZX plane if the axis Z is put along the shower one and the axis X is perpendicular to it).
^--ГЬг-е-ъхТЪ£ ЧЕ* ив* * J k n)
^---frr-e¥x+fP™?dE' Эг" " Ъх

471 where P(E, t, в, x) dEdtdSdr and Г (В, t, в, x) dEdtd©dx are the average numbers of electrons and photons of energy (E,B+c!K), at depth between t and t+dt, with deflection angle between в and в+dS and lateral deviation between x and x+dx fron the shower axis; S(E,t,e,x) is the source function;/«eand /^- are the absorption coefficients of electrons and photons; Wb and Wp are the probabilities of radiation and pair creation under the assumption of complete screening; Bjj is the "scatteringo energy" of about 0.021 GeV. The tera with^ includes the effect o~ the constant ionization loss. The depth t and the lateral displacement x are measured in radiation lengths. If we cut the radiation cross section at small fraction $ of energy of emission photon then //e will be finite, bet us solve the system (1) for the vertical primary photon with energy of Eo. In this case the boundary conditions for (1) can be expressed as
and the source term in (1) becomes
SIE, i, в, Ф е* V (etj e)S(e)S(>c) o> where x) are the delta functions which take account of motion of primary photon along the shower axis. Thus the primary photon is not included into the system (1) and has to be described elsewhere as follows
Грг (E, 6 e, t) = e* S(s0-E)S(e)S(x) W In a one-dimentional shower theory the everage numbers pf e lect rons and of photons with energies between В and E+dE in a shower a t a depth t" are given by
Multiplying by 1 on both sides of the equations of the system (1) and then integrat ing with respect to в and x, we have
The obtained system (6) describes a one-dimensional longitudinal development of electron shower. In what follows our purpose i s to ca lcula te the second moments. Multiplying by в 2 on both sides of the equations of the system ( l ) and then integrat ing with

472 respect to в and x and finally dividing by P(E,t) on both side of the first equation and by P(E,t) on both Bide of the second one, one gets
where Q?(E,t) and 6§( B,t) are the projections of the mean square deviations for deflection angles of electrons and photons.
Finally multiplying ia succession by Ox and by X 2 on both side of the equations of the system (1) and then integrating and dividing as above (see (7). we have
where (6fc)e and (bx)f are the projections of the mixed moments hoti
1- л 4*$ *sH4*gW**!y$ft* , (9)
for electrons and photons.And
where X§(B,t) and )&(B,t) are the projections of the mean square lateral deviation for electrons and photons.
It can be seen that the systems (6) ,(7), (8), and (9) ax* the "catching" each other systems, which can be solved in succession starting with the first system (6). tor example, let us derive the solution for the first equation of the system (6), which is an integro-differential equation. We shall combine the successive generation method. (Rosental and Zatsepin (1954) and the "step by step" method (De'ienko (1965) as follows, bet the step in depth t-t0 be sufficiently small. Then the sua of the O-th, 1-t and 2-d generations approximates the solution of equation in question with sufficient accuracy. KLnnaly, using this approximation in the current point, the more accurate ap-

473 proximation can be evaluated by the "step by step" method. For example, let the solution.P(S,t) of equation be known in the energy, range In т Sth ' •»* in the range of depths О 4- t0. Then the O-th generation at depths t> to is given by
The 1-t generation from the source and from the 0-th one and the• 2-nd generation are expressed as
p(S (E,tfcfa в» * "'"Sfc 9J (U)
f>t (E, V*)/i е"л ";//£<-«•;//; щ de'f (13)
where Pj. - Рц + P^Q. Finally, the "step by step" method gives
evaluating integrals"in (14) one has to use in the current point the sum of generations instead of P and T. The preliminary calculations show that for_I0 - 10 GeT at shower maximum the mean square lateral deviation_is about
- 33 m. It is noticeably less than in case of the - - -How calculations for S 0 - 10" в в Т •*• ** progress
3. Conclusions. The new method is suggested to calculate the mean square deviations of the lateral-angular structure functions for an electron shower. The preliminary calculation shows that the width of electron cascade is possibly less than the HKG formula gives.
Acknowledgements. The author is indebted to Professor в.В.Ahxlatianeen for his constant encouragement.
References Allan-,H.R.et al.,1975, PIOCR, Munich, 8, 3071-6. Astafiev.T.A.et al.,1976,lev.Aced.Hauk SS8R,ser.fi2.,40,H5.959-73> Belenky,S.Z.,l?A8,Cascade Processes in Cosmic Raye,QosTekhisdat, Moscow. Dedenko,L.0.1965flEV.Akad.HauVc 8S8R,eer.fi8.,29,n-9» 1722-4. Bedenko,b.a. et al.,1975, PIOCR, Munich, 8, 2731-5. Dedenko.L.Q.et al.,19?6,Kratk.soob8h.po fTe..P.N.Lebedev Xnstitut
M 1, 30-4. Oreiaen.K.,I960, Ann.Bev.Hucl.8ci., 10, 63.

ЬЬПЪМоь THE LATjSRAL STRUCTURE FUNCTIONS OF ELECTRONS AND ИТОЯВ IN EAS IN THE ENERGY RANGE OF 108 * 1010GeV
L.G.Dedenko and G.B.Khristiansen Moscow State University, Nuclear Research Institute
The calculated lateral structure functions of electrons and unions are compared with the experimental data on the lateral spread of electrons and muoas in HAS. The experimental lateral structure functions are discussed in terms of various possible factors which affect the lateral spread of shower particles.
1. Introduction. In recent years measurements at extensive air shower arrays have yielded the extensive data on the lateral spread of electrons and muons in large air showers (primary energy у 10°GeV). Accurate information on the lateral distribution of electrons and muons is important to evaluate the shower size and the energy of the primary particle. HilZas et al.(1971) have shown that in case of air shower arrays with the large detector spacing the "core erroi-e" can introduce some distortions in the determination of the structure function and that the analysis in terms of parameter most directly measurable with such arrays is needed to relate theory and experiment. So the analysis of data on the lateral spread of shower particles is of importance.
2. Method of Calculation. We have used the CKF model with the isobar pions, which have been described elsewhere (Dedenko, 1968). The NKG formula have been used to calculate the electron structure function. The muon lateral distribution have been evaluated by the method developed by Dedenko et el.(197.2). The calculations were carried out for the vertical and inclined at zenith angle of 60° showers for primary protons with energies of 10°, 3.87.10s, 109 end lOlO GeT. To compare the calculated and experimental data we have used the experimental structure functions for the calculated electron or muon shower size or for the same primary energy
5. Results and Discussion. The calculated and experimental structure runctions of muons with the energy above 0.6 GeV are shown in Figure 1 tor showers at Chacaltaya level. Inspection of Figure 1 suggests that calculations are in good agreement with the experiment by Kaneko et al.(1975) for primary energies of 10° * 10lu SeV and at distances of 10 * 500 m. from the core.
Figure 2 shows the agreement of calculated structure function of unions with the energy above 0.3 Gev with the experiment by Blake «t al. (1975) at зеа level. The flattening of the experimental points is noticeable* only at distances above"700 m. Figure 3 show* the structure functions of muons with the energy above 0.75/Совв GeT at sea level. The calculated curves for the

475
згб R,m.
vertical showers are in good agreement • with the experiment- |Q al. data by Bray et al. (1975) up to 700 т a[, 1000 m. froa the core. fv> It is a puzzle why J the experimental points . start flattening at 1 distances from the core above " 700 ш for hlgher-jprieary energy of 10I0^Qet while for
sea CeveC tmoHeV
\-A energy of 10е QeT they .g do so at distances lw _ above •> 1000 m. for Irt* the inclined showers calculated curves are irach steeper than the R>

476
experimental points. It should be noted that the calculated curvee for inclined showers are more flat up to "300 m. and steeper above " 300 m from the core than the one's for vertical shower». The calculations in which the geomagnetic field is properly taken into account would possibly £ivo more flat structure functions.
Figure 4 shows tact at Chacaltuya level the experimental electron lateral distributions by Kaneko et al. (1975) is much steeper, than the calculates, ->ne-'s at all distances from the core for vertical and inclined sht/'ers ana for «11 primary energies in question. On the contr<*r*, a*- sea level as it can be seen in figure 5 the calculated electron ' "teral structure functions for vertical showers are in good agreement with the experimental data by Diminstein et al. (1975)» The experimental electron structure functions'by Kawaguchi et al. (1975) are steeper up to ~»100 m and more flat above м 100 m from the core than the calculated curves.
4. Conclusion. With the exception of the inclined showers at sea level the calculated muon structure functions are in good agreement with the experimental data at atmospheric depths of 530 gem-2 and 1020 gem*"2. If so then the longitudinal development of showers may be approximated by the 0ЖР model and the average transverse momentum does not increase noticeable above ~ 0.4 GeV/c. On the contrary in respect to the electron structure functions only the experimental data by PImlnstain et al. (1975) are in agreement with the calculated curves.
References Blake,P.H., Haah.W.f.et al.,1975> PICCR, Munich, 8, 2768-72. Bray,l.D.t Ooorevich.b.,et al.,1975, PICCR, Munich, 8, 2762-67. DedenkO|£.G.,1968, Canad.J.Phys., 46, 8 178. * Oedenko,£.G. and Diaova,I.A.,1973. PIOCH, Denver, 4, 2444-8. Diainstein.O.S., Igorov.T.*,. et al.,1975. PICCE, Munich, lg,
Hillas.A.M., Marsden,D.3. et al.,1971, PIOCR, Hobart, 3_, 1001-12. Kaneko.S., Aguirre.C. et al., 1975. PIGCH, Munich, 8, 2747-51. Kawaguchi,S., 8uga,K., Salcuyama.H., 1975• PICCH, Munich, 8,
2826-30. ~

477
\ \
10' N ю W- \
Sea €е*ев N
PS>
ю'
l
J
Й2
x \ * \ \
X *X N-x X. * \ \ XX *s v + ч X \ \ * X X +\ \ - * * ^ X ч юЧеТ * \ N \ \
* \ \ • \ \
\ \ — 0 *N \ — - GO' \ > „ e 0 6 Brcg€i4'(l9*S) \ 4.++60* brastfatdsis)
1 1
JO KTGeTT
\ \ \ V /02 R,ni /0-

478
CkacaCtcfijc
Капеко etat.(ws) Kaneeo tt«
10 102 R,m

479
ю '
#
к юг
юг
1
-2 КГ
" Ю8СгеГ
**^ > ^ ^ J $ > ^ ^
-lo'W^b
-i T- ' - г - _
Sea feve£
*. ^ s . |0'°G-e\T ^ N - ?Ss/
Г \ \мк
lO'owv^. **Ч. \ > 1 • « ч .
*"» _ A e V " ^ -
ло 0
_._ so"
V, * 4 Nc S >£
4* N v ^ 4 ^
"v. 4 .ooo Dirnintitin, lialOWS) ^ N
X \
+ t f *awa3*tU tial. CmS) ^ ^ ' s
ч N V.
Pty5 t \ i
y.6 100 316 (?,m

480
А МОИТЕ CARLO MODEL OF TIE ELECTROMAGNETIC CASCADE DEVELOPMENT
( Abstract )
T.Stanev,Ch.7anlcov and T.Vodenicharova
institute of nuclear Research and nuclear energy Bulgarian Academy of Sciences 72,blvd J*nin, Sofia 1113
Following the Vessel's method a model of electron-photon showers is realized. All routines used are designed to calculate the shower development in media with different atomic number. The ideas of iiessel are extended отег а time-sparing full screening version of the bremsstrahlung and the pair creation processes.
A set of photon initiated electron-photon showers with primary energy 10 UeV and a 5 ueV cut-off is simulated. Lateral and angular distributions of electrons and photons are presented, 'i'he results are compared with results from other Monte Carlo and analytical calculations of the development of the electromagnetic showers in air.

481
MONTE - CAB10 SIMULATION OF THE ELECTROMAGNETIC
CASCADE DEVELOPMENT IN THE ATMOSPHERE
E, Krys, A. Wasilcwski and J . Wdowczyk
Ins t i tu te of Nuclear Research and University of Lodz.
Throrelical ( j j Experiment»! Q Oulh £ ]
A detai led simulation of the electromagnetic cascade in the strat'sphere has
been .performed and trie resu l t s are compared with analyt ica l so lut ions
obtained so far .
Consequences of the re su l t s for HAS invest igat ions are discussed.
Coonlinaici: цдд 3 < ry (cascade models)
Mailing Kl i l rm- j , wdowczyk Institute of Nuclear Research, 90-137 Lodz, uli Uniwersytecka 5, Poland.

482
THE ROOT MEAN SQUARE OF LATERAL SPREAD OF ELECTRONS IN THE EXTENSIVE AIR SHOWERS
T.Nakatsuka, H.Oda Dept. of Physics, Kobe University, Kobe, Japan
Theoretical QT) Experimental П Both П
The root mean square of lateral spread of electrons In the air shower is Investigated for the first step of the 3-dimensipnal numerical simulation of the exetenslve air showers.
Several hundreds of the shower are analyzed. The variation of the root mean square with atmospheric depth is exetremely small from mountain altitude to sea level and the fluctuation of the root mean square Is very small, compared with those of the number of electrons.
Coordinates: EA 3.3 (Cascade Models)
Hailing Address^ H.Odb Dept. of Physics, Kobe University, Kobe, Japan

483
THE LATERAL STRUCTURE PUKCTION OP ENERGY DENSITY OP ELECTRONS IN AN ELECTROMAGNETIC CASCADE SHOWER
H.Oda Dept. of Physics, Kobe University, Kobe, Japan
Theoretical 0 . Ex*. -"' imnntal • Both Q
The lateral structure function of energy density of electrons in an electromagnetic cascade shower Is calculated by utilizing Nishimura's formarlsm of the three dimensional cascade theory under approximation В with Landau approximation.
The «^-function Is obtained from six strictry solvable points by extrapolation. The final Integration on a complex plane is carried out by comvolutlon theorem without using the saddle point approximation. The results are given as the nor-
) mailzed structure functions for various age parameters.
Coordinates: Н&ОД—С C**c*de~SUid4es )
Hailing address: H.Oda, Dept. of Physics, Kobe University, Kobe, Japan

484
FIST'S NS1VE АЩ SHOWERS AND RADIO FREQUENCY ELECTRO MAGNETIC FIEbDS
K. Sivaprasad '.V 'r- institute of Fundamental Research, Bombay 400 005, India
ABSTRACT
Radiation from EAS at frequencies < 20 MHz, due to a geoelectric r-jerfcanssw has been estimated. Reasonable assumptions are made regard ing the shower development and the fields are found to be comparable to that produced by the geomagnetic mechanism. Normal weather conditior э, shower propagation mechanism, and electron diffusion cannot yield the f&served fields. Higher fields can be obtained only with exceptionally high electric fields (lu6 V/m) or a mode' for electron diffusion radically different from the one assumed.
i. вдгнррустюу Ra iiatipn from EAS at a frequency of OJ 60 MHz was first observed
by Jelley et al*. and has since been studied by many groups at frequencies ranging from 100 kHz to several hundred MHz. Except at frequencies below 10 MHz, there has been a fairly good agreement between experimental observations and theoretical predictions. A comprehensive review of the early work done, including theoretical attempts to understand the mechanism nf radiation, has been given by Allan*. Owing to the rather fist lateral distribution of the radiation from the shower and the relatively fewer and lees complicated detectors needed it was thought that radio studies will prove to be the best means of investigating cosmic rays at energies exceeding 10*? eV. Detailed calculations of Allan et al' showed chat the lateral distribution of radiation was sensitive function of the longitudinal development of the shower. However, later studies'-1 seem to indicate that radio investigations Ml to yield unambiguous conclusions owing to observational difficulties.
The general mechanism for radio emission has been established to be the movement of the shower disc in the geomagnetic field - either charge separation and the consequent transverse current or the moving dipole formed by the separated charges4. However the fields observed at frequencies < 20 MHz are all in excess of that predicted by the geomagnetic mechanism. Even the inclusion of very low energy shower electrons5, neglected in earlier calculations, did not improve the fit between theory and observations. A new mechanism involving the vertical fjeeMectric field was suspected10.
The suggestion that the passage of a shower through the atmosphere will cause a detectable change in the geoelectrical field, due to the presence of a large number of ioisisation electrons, was first made by

Wilson . An attempt to measure this cringe, as reflect*;,. >, ' . ionospheric conductivity, was made by Curry at al". who obus.-1 .:„ Agnificant correlation between the arrival of an EAS and uva DC iiil-' w he shower core.
In the present work an attempt is made to estimate tne ti«x-..•.-.; .eld produced by the ionisation electrons left in the wake cf a alicv,: v a.->-uey drift in the vertical geoelectrie field of "-'100 V/m. The freq. .
region of interest will be between a few kHa and a few KBz.
DRIFT OF THE JONISATfON EI.ECTBOMB 8 Crompton has obtained results pertaining to the drift ol &>-:
•: ectron swarms in air at NTP and an electric field of 1000 V/m. .« ;Ъ? esent work his results have been scaled (linearly) to a field of UK . a;
i se is made of his results for dry air. The ionisation electrons a « •ermalised, from their initial energy of ~30 eV, in a time ~11Г1 ($, :;•: hereafter the swarm drifts in the electric field. The drift velocity г:.ысо
"or 10"8 s attaining a terminal value of 150 m/s. As the swarm drivfca >i: jntinuously being depleted, mainly, by attachment to oxygen moletui::. ith an exponential time behaviour. The time constant for this loss L 0~8 s'. Lose due to recombination is on the time scale of seconds. Ь . jmputational facility the time dependence of the drift velocity is asaut 6 > be as in Fig. 1. The linear variation is a good approximation to the irve obtained by Crompton.
CALCULATION OF THE FIELD
The field at different distances from ihe axis of a treitieaUy b -•lent shower of size 10° has been calculated by a superposition of ihn
.elds produced by the electron swarms left in the wake of the shower diss1. ' г computational convenience the following assumptions regarding it. -J
ower characteristics and electron swarm characteristic's have been cade: 1) The shower is approximated by disc of infinitesimal thickness oving vertically down with the velocity of light. 2) The shower elector; .e assumed to have a lateral distribution described by the NKG function
•-. ith • equal to 1.2, independent of the height at which the shower is cesent. The shower disc is assumed to have a diameter cf 200 u , al.'. lectrons beyond 100 m from the axis being neglected. 3) The shower •tarts at a height of 5 km and courses down unattenuated. 4) The electric ield in-which the ions and electrons drift is vertical and is 100 V/m
лд to 5 km. 5) The density of the atmosphere is constant up to 5 km «cx. л 1.203 x 10~3 kg/m3. (This assumption along with the previous one inplies that the characteristics of the electron swarm is independent a,: s position in the atmosphere.) 6. A uniform ionisation of 2.2 MeV/g л"2 is suffered by the shower electrons, losing 30 eV per ionisation.

486 CoMUtertteabmrerdUcatabtlH* a abort the obeemtioa totel
(ate Fig. I). The ahoworelectrouprodaceuelactroeawarm with a, oloctroaa I» the laJlattooimal Talamt tltimat «твааа Q.
Tela ewarm ptodacoa aa electric field at the obeervattoaeout P(ra,0,0), avwwMmm l u m a r
«hart
tsp\
(•) v aad т an tat drift velocity aaa tat rat* of caaage of velocity of tat electro* m m reeatcttTely. Thte fltM wlU hart tat tlmo dieamHaei detormtaod by the time dniiaaiain of п и т obtamed from * iaj. 1, bat atarttagfroMatia» t fteaaby t - (/»-'--j)/c . ThetotalfwUte obtalatd by aa iategral over the atmoaahere, cart Mac tab» te add the onmpoatatt of tht fl»M aa wall aa to hoop aceoaat of tat tlaaa depta'diaoo. Tht tint term la oawattoa 1te iaaaptedtat of tht valodtlaa or aoealorattoa aadwmbeezacUycaaeelledBythefleUdMtothepoemveioM. Tht velocity af Им роеШте ioaa te «early 10* ttawa amallar thaa that of tht aleotreae tad hoaot their eoatriamloate the fteldwm be а е Д О ^ thafteUat P «Шmehmeealythtvelocityaaiaeceltrattoa< termelaS.
Tht iatograUea baa hoaa aamtrically earrlad oat oa the ОЖС10 ooamater eyateai at ТОЯ.
4. жжАгтжм car ш и ш From tho aymmttry af the ahower aai the term of caaattea 9 tat
fclknrtef amwralfcetareocubodedaced. The field at aay poiat, ta ataeral, haa oaly vertical aad radial Biaaji—ц. The field oa the axte la completely vertical. The tteldvW be mercurial radially polarteedaa we move away from the ana. Aa the aiaaaaiaoi of Ж, tad » , oa time te differeat tbo act pomrttatloa will be a faaottoa of time. If tad ahower

487
«avelomaaat. toatoatoi by tha lateral «ad Inagltaitoal atraatera of ahawara. aoaa aot еааааа with aiaa, the (MM wffl alaa be acaaarttaaal ta ata». Caaiiialaal*wwr<wtloiaiiatiriUaateUoaadaTac>aaB»lataaaMial-taet awl Нае atraetere of (ha fiel* aaa the tola will caaaa to ba areaor-ttoaaltoaiM. Иаиаа1 baa 4taaaaaUta»afcawnettaatipirtimat X r aaa Kg far «Шаги* raatol atataaaaa trot* tbt uia ef tha ehewer.
Та «tabt a caaajtriaca t t t e^orttteatoi obttiTtaeae eao aaiaa to kaow tha raaaaaaa at aeteetora with ftaete aaaawieth to tha fleloa akawa ia Fig. SaaM. ThebaaawiethUaritoaaalee, M^ ft), to gfrtaay
«bar* f i aae tt are tha llarittos fraojaaaetos af tha paae baad aaa u ' l l T f . Bw , baa baaa ealeatotea tor baaewMtba aarf eaatral Iraqaeaeiea aaaa to atowrfiaeata. Те aufea tot eoaaaariaea eaaaplato, tba MIS vatot of tba haaawWh ttaritoa aalat, totagratoaovartoattoMatkt eenllaet aeriod to tba aaaa baM baa baaa «alealatoa to aaeh eaat.
Tabla 1 abowa a coeajartooaof tht cbearrod tad caicatotad Ottoe tba Utter bettog baaa iteaerly aaalea aa or dewa beat tba fteMa calcalated tor a «aower with 10* «article. Yaxtottoa to atat «aa to affltreet aJtttoaaa of obeeratloa baa baaa Igaored, all obaemttoae bMiag baaa meat aaar aaa level. Clay at al. aad AUaaatal. hart obeerod vertical fltlda whUa all otbar obaanraHaaa ага of borlaoatal ftolaa.
Tbt latoral atotrtoattoa of tba field la rather flat tba «aid at MO m batag «ely aowa by a factor of ~ J соврана with that aaar tha axle of tha ahower. Owto* *o * • *Wereat ttoM atraetara (traqaeacy ooatoat) af tba ftoMaataHetMatdtotaaaaa. tha fraaaaaey aaaetraaa «I tba ftola to a • totottoa of tht atotaaae.
I . ООМСЫШОШ
From Tabla 1 it to eviaaat «at tot obaerrauoaa dtvMe tote two claaaia. —a wbara tbt obeemd aaaar Itotlto ага cteetotiat with tha ealeamtoi BeUa aae othar to which tooeaaeetoa field falla abort of tba ebaartaa by a totter htttna • - 1*». К ahaaU ba aotoa that tot . aama obaertere wba abtotoad, krae OoMa to aarltor ea»erto>eete15'" hwo a t abaiwa tbaaa laear".n . Either tba ileal variability la aery еще or tot aarllar eaairltoeato baa w t a i t t i l aearcaa of arrar. •owever, U tht aarltor ibtn teniae are aaaatata to ba ttritot tbaa tba flalaa taabt eceeac«d by tot otoeloctrtc aiabaalaai oaly И tba alaatria m i n i nrlirt if-aipMifli amir itimi TIIT inrinrlij i i i i i l ia l IT" T.I i Tba aaaaialoaa irtaft oaetrwd by Alloa" atay have a aattlttUle orlgto.

488
м they have all occurred darlag or afttr thunder atorma. in tha 15% of caaaa «tor* tha geomagnetic origin of tha fiald u not eetabliaaed*, tka mechaalaa can be feoeleetric. Tha diurnal varlatioaa of tha IAS producedflelda have been obaerved to be similar to that of tha feoelactric field10. Bowever, correlation betweea the two ha* not been clearly established ши a eoaUauoua amitoriag of the latter oaring the experiment la neceaaary.
A near vertical abower of a 10" eV primary prodecea a Held of 1 p- V/и/ИИа at 800 a daa to the geomagaetic mechanism (either «Upole moment or charge excess) la the tea* of megaherta regloa. Tha preaent calculation yields a field of 0.1 ^V/at/UBa for a similar abower. The fielda at lower frequeaelea ( 100 kHz) from the two аиекааДаша are nearly eqaal.
la conclusion, the preaent mechaaiem doee not yield fielda larger than that given by the geomagnetic mechaaiim aad the ueefulaees of pare rxdlo-EAS atadtef ia eliciting lahrautioa oa either ahowar structure or the primary radiation ia yet to be established.
6. ACXWOwXEDGtMBNT
The ЬетегааЬпе Foaodation ia thanked for a Fellowship which enabled Ом author to gat intereetedla tha aubjact. The kind hoepltality of the Uaiveraity of Adelaide aad the aaeful diacussioas the anther had with Prof. J.R. Preaeott and other members of the Cosmic ray gronp at Adelaide are gratefully acknowledged.
7. REFER1NCES
1. Jelly, J.V. HatareLond., Mi, 337, 1»«6 2. Allan, В. К., Progress in Elemeatary Particles aad Cosmic Ray
Phyaica 10. 171, North Holland PabL Co. 1071. 3. Allan H.B. eTal. 13th Int. Cosmic Bay Conf., Denver, Papers i 3407 4. Prescott, J.R. etal, Nature Phya. Scl. 233, 100, 1071. 5. Clay, R.W.. J. Ate. Terr. Phya. 34. ЛИ", в. Wllaen, К. К., Phya. Her. 100, l t f T l W . 7. Curry, A. et al. i. Atai. Terr. Phya. 36, 111, 1174. 8. Crompton, B. W., Private Comanaatriatton and alao paper titled
"Blatory of Free eleetrooa prodaced by Coaatic «ays at Sea Level" preaeated at the Aaat. Iaat. of Phyaics, Matioaal Congraaa. Adelaide 1174.
». Baate Btoctroaugnetiam by Cowan, B.W., Academic Preaa, l t U . 10. Clay, K.W. etal. 13th net. Cosmic Bay Coaf., Denver, Papered,
3430, 1*73. 11. Allan, B.X. etal, 14th 1st. Cosmic Bay Coat. Menieh, Papers I,
30M, 1*71.

489
It. Atrukkmlch, Т.В. atal, Mtkltf. Comic Ray Coat., Dtavtr Ранг 4, Mtt.
M. Clay, B.W. tt al, 14th tat. Comic Bay Coat. Maaich Paper & SON, 19TI. э
14. МЫи, T.J., Matara, Pay*. Sci. MO, 171, 1971. II. Altaa. I .B . at al. Batata. tU, «ЯГШО. 1в. Baa*. J.M. at al. Natara Яуа. Sci. I » , 14. MIL IT. Ftlaat*, D.B. aadSMbbCT.J. NatttraTS*, 53*8, 1972.
.— ._...,'•
с , . . , ' .
- _ • •
.»*..»
KK,»
2= «-•a •• -s i
"ЪК -г::' - К . "
"••W.
••"SS
'-IS
„JJJ
!Г
....' ...
. ....' ,.!.-....'
1."
,.,.. .0»
, . . . »
^Vf-'w..
*. <«•*
lt^u-«
<** .... „ C O
— < M
c*wiu*e г ик
......
...
.,.,.. ..
. ,„..
.».-
...... Г
.,.,.-... ..... ..,...-
. . . , . •
4 i TA%I.« I
It M M I . ELIC1KC *K :•»>»» i j n

490 THE SPATIAL DISTRIBUTION OF RADIO EMISSIO* BY EXTENSIVE AIR SU0VES3
A.T. Kaminsky and E.3. Shaatko Stat* University of Kharkov, USSR.
Theory (X) Experiment (~ In ooaaon £)
The apatial diatribution of coharant radiation by axtanaiva air ahowara I EAS) ia calculated. 3*1* diatribution ia ahown to have oaeillationa owing to interference of radiation froa different altitudea but radiation aechanian ia not aseenti-al. It ia »ugg*»t*d to ua* obtained result» to de fin* significant parameter* of БАЗ.
1. Introduction. Many experimental data show that geomagnetic separation of shelter charge* haa a significant influence on radio pula* production in EAS £t] . The result* of [2] testify to the fact that Cerenkov radiation of a transverse current previals over the other type* of the given radiation. However according to (*3, 4J the intensity of Cerenkov radiation oftseparate shower particle is small a* compared to that of the synchrotron radiation propagating at Cerenkov angle withing the decametre radio band. The synchrotron radiation also exceeds the inductive field of aoving shower charges if their eneggy is below the Cerenkov threshold energy £ c . Beyond 8 C the diffraction effects lead to a considerable spreading of the radiation withing the mentioned band fsl Since the angle of synchrotron radiation is less than a couluab multiple Mattering angl* the angular diatribution of radiation froa EAS ia formed by angular distribution of shower particle*. It is analogous to [б, 7J where the fundamental rule of scattering has been underlined. 2. Method and details of calculation. The shower is ~ 1 aetre thick at a distance of some scores ot metre» froa the axis £8J , hence the radio emission of ВАЗ ia coherent withing the decame-tre band [9] . This radiation is a result of interference of wave* froa various points of the shower at different altitudes in the atao*ph*r*. Accordind to fll)] th* frequency spectrum of the

491
field due to a separate electron accelerating in a magnetic
field ia
where «If) ia the field strength of radiation, £ *• the
distance froa the point of emirplzu, f„ J (en/25Tac)(ac /£ ) '
is the basic frequency, e, m, £ are electron charge, aass
and energy, H is the streBgth of the magnetic field, % is the
angle between the electronic velosity and a vertical line,
f is a frequency. The scattering shift» the basic frequency
and decreases the field elf):
where AQp is the angle in which the synchrotron radiation
is contained, and &Osis the aultiple couluab scattering
angle. The condition дО^^>Д^1в satisfied withing the energy range of some пет up to £c • Since the radiation
with the frequency of f <(AOk/aOP)f !• iapossible the
only electrons which contribute to the total radiation of
ЕЛЗ are the electrons with>£^n, where £ ain is
To calculate the lateral distribution of the radio eaiej
тз1оп by IAS we added the magnitudes of the field strength elf) at a distance of H froa the shower axis:

492
Xe/cose. £c 09 2i
fv , , - j dx Jd€ j r d r |£j£ Nix)N(£)F(r)p(*)<W^4)
™ £И1г о о
«.ifre e'.f)/j£ is taken , -iu v <•'.') :•' '. ) is the electronic
energy spectrum £7] , . < "' J .- ••'• " ii>" .itudial N-K function П Л Fir) is tfte lateral distriuui.. : r ki >uer electrons Г?"] , И х ) is the angular distribution of snower electrons at the atmospheric depth of x obtained from the expression for P ( 0 Ы & given in Г7J > 4* is the phase factor :
(fin MHr), here 8 i s the age parameter,jb=2JTfftt 1 At i s
" • *-(±r-=kXfa»-iftr*)" £ ! H +
wh
where x 0 is the thickness of the atmosphere, U^0 and 6 0
are the asimuthel and zenithal angles at the shower axis,
О is the angle between a vertical and direction from the emission point to the observation point, 0=2.92-10 is the refractive index, h c is the relaxation length for the air density of the standard isoteroial atmosphere, If is the azimuthai an^le of the radius vector R. i_._ Be suits. Fig. 1 shows calculated functions of lateral iiswiLution of radiation by EAS with the fixed number of e-

ы 700g-em I BOOg-em'
X 500 gen
1 .
О 100. 200 Radial distance la)
Figure 1. lateral distributaon of the radiation at a frequency of 32 MHx. The apectra for showers having
•Z their aaxiaua developaenfc at 500,600 and 700 g-cm. Q,» 34? % - 180? f , 90?
leetrone ia the aaxiaua of ahower derelopaent but with different deptba of this aaxiaua. One can .вее a noticeable distinction in tba plots provided bj the variation of the aaxiaua depth, their foras depend only on seoaetrical pacularitias of the «hover developaent. "The amplitudes and foraa of thai* function мгта aa a crlterioa to deteraination of_th» aaxl-aua poaition. The eafor contributioa to the radiation ia aade by.thoae regions of the showar loncitudial developaeat where ratio of a auaber of tba particle» ecettered toward» the observation point has the greatest valae. The radio eaission froa EAS arises In geoaagaetic field aad ta.ua bavin*; an ani-aotropy on the aaieutaal and xeaithal aaglea, i.e. there exists the aoat favourable directloa to deteot the radio pulses. It eeaaa expedieat to registrnte the radiatloa by aeaas of high directieaal aerials, ualag for axaapla aateaaa array. A gala

494 in the detecting efficiency aay be «v 5 tiaee aa coapared with the ordinary dipole aeral. 4J Ackno vledgeaeata. Xh» author» are thankful to f.A.Za-buga for calculatione, to I.I. Zalubovaky for aupport and V.O. Volovik for diaeueaiona.
References t. I.H.Hough, J. Phya., Ajj, 893. (1973) 2. F.D.Kahn and bercha, Froc. fioy. З о е , A289. 200, (1966). 3 . V.M.CytoTich, Teatnic MGU, Ц . П, (1951). 4. K.Kitao, Frogreaa of Theoretical fhya., 12. 759 I19607 5. J.V.Jelley, CerenJcov radiation (Fergaaon Freaa, 1958) 6. V.I.Coldanaky, G.B.Jda&ov, JEIP, ££, 405 (1954). 7. T.I.Zataepin, A.fi.Chudakov, JETS, 4J, 1622 (1962). 8. C.P.Woidaeok and Bbha S, J. Fhya., Д£, 977 (1975). 9. (i.A.Aakeryan, JEXF, 48, 988 (1965). 10. L.0.I«ndau, a.H.Iifahitx, Theory of fielda. Uauka, Koacov 1967.)
11. K.Greiaen, Froc. in Соев. Rays Phya., 2, ' 0956).

495 Measurement of the Blectron-bositron
Ratio in Extensive Air Showers S.W.. Pong and b.K. Kg
Phjrsics Department, University of Hong Kong, Hong Kong.
Theoretic!! • Experiment»! | x ] Both Q "
One possible cause for the .radio emission from extensive air showers is due to the negative charge excess of the showers. In the present measurement, the positrons and electrons in the showers are identified by using a small air-gap magnet together with a stack of spark chambers..
1'he preliminary result obtained for the charge ratio e~/e + is 11«6 i 4«6. The experiment is in progress and йоге data are being accumulated.
Coordinate»: EA 3.7
Mailing «ddresj: Br. b.K. Kg, Physios Department, univereity of Hong Kong, Kong Kong.

496 CALCULATIOH OP THE DENSITY SPECTRUM OS THE ELECTRON AHD MUON EAS COMPONJOTTS AT SEA LEVEL
B.LI. Kakhmudov a n d R.I. Sharibdzhaaov Samarkand State University after A.Navoi, USSR.
This paper deals with a estimation of EAS density spectra basing on the phenomenological characteristics of EAS. The influence of the dietributiuon function parameters on the relationship between the EAS density spectrum and the size spectrum is studied.
When studing the question connected with the precise relationship between the density spetrum of the particle flux in EAS and size spectrum, one is interested in the estimations, based on the reliable phenomenological. characteristics of EAS.
As in the previous works /1,2/, our present, estimations are based on the following characteristics of EAS /3/:
1. The size spectrum has the following power form:
P(H)dJT-A exp(- т^весв -1))Н~(Л+1)dH (1), where H is the level of observation; Л is the relative absorption range of showers the particle number of which is H j в is the slope angle of the shower axis relative to vertical! and A=1.7«10 *'cm sec steradn-1 (at H< 3»10^). The size spectrum index for the electronic component is the following:
f 1.5, if N e < Э О 0 5
Эее- < 2.0, if 3«105 < H e<10 7 (2) 1,1.6, if He>107
2. For the muonic component: ^««,/0.78 (3),
Й(с-(3.24 ±0.22).103.(He/105)°*78±0'01 (4). 3. The particle flux density in the horizontal plane is:
P -N f(r) cos 9 (5), i.e. the f(r) function, describing the lateral distribution of particles, ie independent of If.
Substituting (2) into (1) and taking into account the dependence of X. on N, we may obtain the expression specific to the

497 density spectrum :
3 (i) 44f)dp«2: в^р.эе^) y~(* +1)do (6),
where ®max „„. «(I) Bt( о , эй^Ъ-гЯА^ desine exp(- -^(веов -1))cosae 9x
* J1 d r r f * (r) (7). ri-1
Here ae^ ' is one of three possible values of*the size spectrum index, SJ^J. is the maximal value of the shower axis slope angle at which it is still feasible to record the shower. In equation (7), r«0, г,» со and г.., r£ are determined from expression (2)
at N values corresponding to the size spectrum bends.
When computing the density spetrum of the electronic component,
one may ignore the contribution of sloping showers into <p (в) as exp(—|r=(весв -1)) as cos *'в /3/. It was assumed, when evaluating the density spectrum of the muonic component, that в
твхи^° апА
the exponent in (7) is equal to 1 as the range of the muon relative absorption is rather high /3/. She following Nishimura-Xama-ta function has been used for ?e(?) function, when calculating the density spectrum of the EAS electronic component:
fe(e,r)-C(e) х'г (г/г,)6"-2 (1 + r/r.,)*"4'5 (8),
where C(s) is the normalization constant, r.=80 m (at sea level). She calculations were carried out at the following "в" parameter values; s-0.8; 1.0; 1.2; 1.4; 1.6. She obtained results, presented on fig.1 indioate that the density spetrum is strongly depended on the "в" parameter. The density spectra have no distinct bends which are typical of the size spectrum. She - bends in the density spectra appear to be heavily smoothed as the "a" parameter is increased. This is illustrated on fig.2, presenting the curve atgC d ) of the density spectrum index if expressed in the power form; tft( ^ p )-Af"***f* .
She "a" distribution in showers at sea level is close to the Gaussian distribution with the mean value of в equal to 1.18±0.02 and the dispersion D* «0.08 /3/. She present paper has incorpo-

4У8
40.
3.0
2.0
e&t%c>.f)f53 5=0.8
Jli ГПГ
s=i.o
SH.2
* » j — i — H I — i i i п и » i 11
* ) 10 10' 10J 10 Fig.1 The integral density spectrum of the EAS electronic component, in iir . The points correspond to the experimental values; s is the result of averaging over "в".
2 . 0 -
1.5-"Г*Р %*
АЛ* '
Pig.2 The curves of 3£t -the density spectrum index of the EAS electronic
component. ( The given designations
correspond to that of fig.1. )

499
0 . 0 -
-0.5 -
*"1 10° 10 • • • • • • ' • ! * • • • • • " • 1 -j , , 1
t«aL^(?f)p'-7
Pig.3 The in tegra l density spectrum of the EAS muonic component ( iii hr )
2.5-
2.0-
*»lV K=0.5
KsO.6
i 11 ниц i 111 »i| i i ii и » > О yip
10"1 -JO0 -JO1 Fig.4 The curves of <£ц., the density spectrum index of the EAS muonic component

500 rated the averaging of the density spectrum over "a", taking into consideration the Gaussian distribution. Pig.2 presents the results for 32 ш # а п Р ) *nd the integral density spectrum, shown on fig.1 together with the experimental density spectrum /1/. The averaged density spectrum still does not display the distinct tending* derived experimentally /1/.
The estimation of the muon density epeotrum at E_> 10 GeV is derived from the following equation:
f|Jk,r)-C(k) r"k exp(-r/80) (9), where k«0,5*0.07 /3,4/. So consider the influence of the "kn
parameter on the resulting spectrum, one should carry out the calculations at k>6.4; 0.5; 0.6. See "the results on fig.3 and 4. Proa these ourves, it is evident that unlike the electronic density spectrum, the density spectrum of the EAS auonic component shows the clearly defined bends.
finally, the authors express their deep gratitude to prof. G.B.Khrletianeen for the auggested subject of investigation, his constant advioee and consultations.
REFERENCES 1. Ashton P. and farvareah A. 14-th Intern.cosmic Ray Conf. Papere.8,2719 (1975). 2. Makhmudov B,K., Sharibdchanov R.I., Sirodshev H., Aliev H, Izv. Akad. Hauk SSSR. Бег. Pis. 4j>, 1001 (1975). 3. Khristiansen G.B., Kulikov a.7. and Pomin Yu.A. Cosmic radiation of superhigh energy. Atomlsdat. lioaoow (1975). 4. Khristiansen G.B., Kulikov Q.V., Uakhmudov B.H., Sirodshev H. and Solov'eva V.I. Isv.Akad. Nauk SSSK. Ser. Pie. 40,991 (1975).

SOI THE PLAN OF EAS OBSERVATION AT AKENO
Akeno Group EAS Division,Cosmic Ray Laboratory.University of Tokyo,
Tanashi,Tokyo,Japan
Theonttcal • Exparinmtal Q Both Q
This paper will describe the basic idea of EAS physics for AKENO Air Shower Project.
This project aims at the study of interaction characteristics rl f h « па*111»Д rt4- n r i > a « u r>n«i^- *•*..> 4-*»<r> ««_«l...l~A I I I " _ III**-». ana tne nature ox primary cosmic rays tor energies III -111 ev.
For this purpose,we intend to perform he composite observation of different component of EAS,such as electrons,muons,hadrons, and air Cherenkov light,for each individual shower.
One of the important purpose of these simultaneous observation of different component is to find experimentally the parameters on the longitudinal development through the atmosphere of each observed shower. Some, of preliminuary observation will be also presented.
Akeno group consists of about 40 physisists from many universities and institutions in Japan. The paper will be presented by K.Kamata.
CoonUMtN: Е A 3 1 Г < » )
МаШас аМпи: Prof.X.Kamata Cosmic Ray Laboratory.University of Tokyo, Midori-Machi,5-2-1, Tanashi,Tokyo,188 Japan

S02
THE AKENO AIR SHOWER PROJECT Akeno Group EAS Division,Cosmic Ray Laboratory,University of Tokyo
Tanashi,Tokyo,Japan
Theoretical • ExBHhwatal Q •°*« П
The new inter-university air shower project in Japan will be described. « The new shower array will cover the area of 1 Km , and will be ed to observe ВЛ8 wf energies,Hr 1* ev. The array will be composed of; .
a)400-500scintillation counters,arranged -over the area of IK* , to observe particle densities and arrival direction ofplectrons.
bjeight muon(^»lGev) stations,each having the detection area of 2Sa z. c)four muon(aO.SGev) stations,each having the detectionarea of 100 m . These detectors will function as hadron/energy flow
detectors when hit by core, d)detectors of air Cherenkov detectors. The construction of this array started in 1975 at Akeno,900B a.
s.l.,about 100 Km to the west of Tokyo. The whole array will be completed in 1979,since when the project will be operated by inter-university collaboration.
''Akeno group consists of about 40 physisists from many universities and institutions in Japan. The paper will be presented by K.Kaaata.
Coordinates:
ЕАЭ.7 (Othetty
Mailing add raw:
PrOf.K.JCamata Cosmic Ray Laboratory.University of Tokyo; Midori-Machi,3-2-1, Tanashi,Tokyo 1(8, Japan

S03
THEPbAN OF OPTICAL OBSERVATION AT AKENO Akeno Group *
EAS division,Cosalc «ay laboratory«University of Tokyo, Tanaihi.Tokyo,Japan
ДамЧкИр КятаНимМ • *«*ffl
This paper describee • project of the optical obaervapion at AKENO. One of the observation station i» set it the dlatance of abouc ЗООи end the ather at about 2 or % .Ska fro* the center of AKENO air shower array. The former la for the observation of Integral light lntefteity and the latter la for the aMsureaent of the tie» sequence of Cerenkov' lijht pulaea fro* individual. EAS.
* Akeno group consists of about «0 pnysisists froa «any universities" and Institutions. The paper will be presented by K.Kamatai
EA 3. 7 (others)
Mialat siMiasr Prof. K.Kauta Cosmic lay Laboratory.University of Tokyo; Mldori-Machl,3-2-1, Tenaahi .Tokyo 118, Japan

504 COMPLEX INSTALLATION FOR INVESTIGATION OF EAS
G.B.Khristianeen, B.H.Makhmudov .N.Aliev, N.Sirodshev, A.A.Silaev, V.A.Chukanov
Samarkand Stata University aftar A.Navoi and institute of Nuclear Physics, Moscow Stata University, USSR
Thia paper ia devoted to the complex aclentific inatallation designed for EAS investigation. Favorable climatic condition» of ita location providea the unique capabilities for recording the CherahkOY radiation.
One of the important taaka of EAS investigation is to define the sealing factor between the number of particles (N) in ahowera and their primary energy (|Q) «a wall as to determine the relationship between thia faotor and the primary energy.
Baaing on the moat general ideas of EAS, one may try to solve tbia problem by recorging tba Cberenkov light flux and correlating it with the number of particles in showers close to sea level.
In the Yakut region, for instance, there was made an attempt to estimate (by the complex installation) the above factor for
17 the showara poaaaaaing over 10 eY energy. The given factor is not measured if the ahowera are of leaaer energy. It should be noted,
that the Charankov light is far from being measured by all existing inatallationa due to the specific weather and geographic condition* at their looations. Besides, the duration of these measurements may considerably vary depending on the locations of the complex installations. It makes up, for example, about T% of the total time should the installation is located in the Yakut region and about 1.5J» for Moscow /1,3/.
Within 17 kilometers from Samarkand, in Agalik settlement, where tthe complex installation may be found, there unique conditions for the Cherenkov light measuring /4/. The duration of these measurements reaches some 1l£ of the total time. Besides, the observations may proceed both in moonleaa and oloudlees nigths during the whole year. It is also to be noted that, owing to the mountal-noua nature of the country, the atmoapheric transmittsnoe here is very high. Moreover, the made measurements have illustrated that the local background of a night sky is 17 times less than in Moscow and 4 times less than in Samarkand due to complete absence of artificial illumination. The above-mentioned inatallation is loca-

SOS tad at 750 * аЪоте ааа level, hence for EAS of medium energies, i.e. $ .10 "eY, there are suitable conditions for the observation of practically full flux of the Cherenkov light emitted by the
% whole IAS avalanohe Into atmosphere. Tha complex installation, aa shown in figs.1 and 2, comprises
twenty-one hlgb-apeed aointillation dataotora (C-de tec tore) and fifteen Cherenkov detectors (4-detectore). The elope anglaa of the ahower axea are determined by the delay of ahowar partiolee In arriving at six O-detectora arranged In a regular hexagon within 30 a fro* each other, aa related to *:.<« central detector.
The delay factors are ~~ -oated by the aix "venier" time-delay analysers, having 3 naec measuring interval in 250 naec dynamic range,, whieh permit a to define the time delays in showers arriving at either angle. In the initial stage of measurement, all scintillation detectora ara euppoaed to be allocated within tha Internal hexagon. The density of the shower particles is determined.from the charge dapoaitted on tha anodea'of tha photoelectric multiplier incorpoted In tha 0-detector /2/. Tha effective area of a single 0-deteotor ia 0.5 • •
Tha measurements are performed by the amplitude converter provided with a 0-integrating oircult, having a dynamic range equal to 5*10 . Tha circuit frequency ia 1.5 Mha , which deliberately enables us to integrate.the aignal originating from the ahower par-tieles, the accuracy of integration thereat ia better than 5* even at maximal diatanoea (120 m).
Tha same accuracy of integration ia obtained by the uae of the 4-detector oonvertera built on the similar circuita, except that
. the oircult frequency ia 3 Mh«:. and the dynamlo range is 10 . The measurement accuracy of the converters ia assumed to be above 10f. Tha structure of tha Ч-detector eaeings allows for tha recording of the whole light coming from tha showers at any alope angle under 30°.
When recording the ahowers, tha data from tha amplitude converters and time-delay analysers ara atored in the flip-flop oiroulta during tha Interrogation time of their awitohee (1 вес), whereupon they ara auoeassively read out by tha awiteh and written on the correaponding line of the punched tape.
The further processing and oaloulation of all ahower parameters ahould be computeriaed.
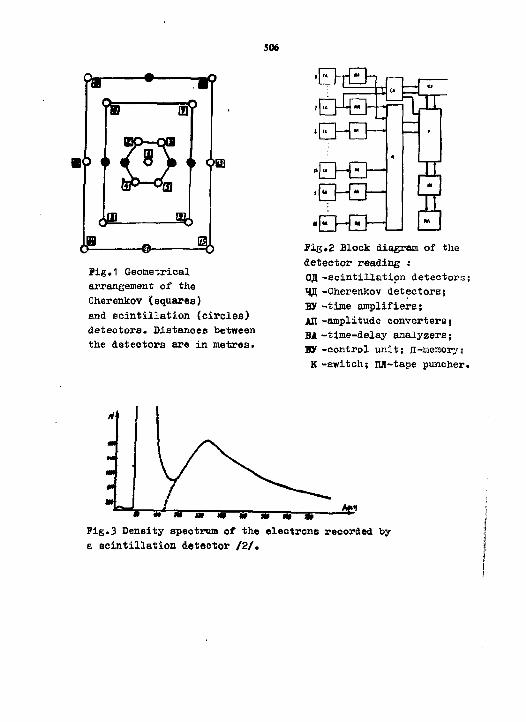
506
Pig.1 Geometrical arrangement of the Cherenkov (squares and scintillation (circles) detectors. Distances between the detectors are in metres»
•ET-rEh ' l " Г гЧ—'
•EIHZi—1_
Б Mf
Fig.2 Block diagram of the detector reading ; СД -scintillation detectors; ЧД -Cherenkov detectors; ВУ -time amplifiers; АП -amplitude converters; BA -time-delay analyzers; ВУ -control unit; П-memory; К -switch; ПЛ-tape puncher.
W*
* — я 4 - AM "S 5 Si Sr—3—Я—5" Pig.3 Density spectrum of the electrons recorded by a scintillation detector /2/.

507
Pig. 3 presented the spectrum of the single particles recorded by a scintillation detector • Tha lower boundary of this range enables us to complete the recording down to one particle .
REFERENCES: 1. S.N. Vemov at aL lav. Akad.Nauk SSSR, ser.fiz., XXIX,9,1690,1969.
2. A.A. Silaev , Prib., i Tekhn. Ekspar. 6, 62, 1S73. 3. S.N. Vernov at a l lsv.Akad.Nauk SSSR. ser. fic.64, 1955,1970 4. B.M. Makhmudov, at aL Isv.Akad. N»uk SSSR , «er.fi x.
40 , 998 , 1976.

SOS
EVXHMCE VOR « Т О И М Ш О OF COIMXC RAY PRXMAftY «растлим ИЖАЖ io15*v гном A CMHKOV н о я
URKTXOH «YSTJD4 AT OOLHAM
C.L.Ihat> &«£22dte> * . * • ' « • » «id .4.1».8apre •habha Atcetu Aeaeerch Centre, « L
•riaager-190c-<, Kashmir. India
A wide-angle phot;.* ' Ч ^ И ы system at Oulaaxy. Iaaia« hea been detect! :g Cmcenkov l ight pulses from BUI at a rate of о м par minute. The •rata* thraabold for ahowerf la approximately CxlOl«eV «ad a atat lat ical ly significant energy Interval of orar one decade la covered. A pulae-height analyaia of the Cerenkov pulaaa lndloataa a bramk near iO*5eV which paralata whan the system field of view la decreased. The break la argued to be primary la nature aad the region of change-over ia delineated.
1r lyiffiPrtiffT * hardening of the primary ooaaie ray spectrum somewhere between 1 0 " and 10 lseV haa been indicated by apoctram measurements (areekantan. 1972) carried out aaparataly In the energy Intervale i o l l -10"eV (Origorov et e l . , 1971) and 1оД4_1о1?вГ (Iradt at a l . . 19C5). The elae spectra of eleotroae end auons in the air ahOwera have been interpreted (Aaelken e t a l . . 1971) aa Implying a gradual bending of the spectrum between 10**-1О**вУ, while more recent work by Aaelken e t a l . , (1975) and Antonov at a l . . (1975) plaeea the break near 2xlOl5eV.
Inveetigatlone of the primary apeetral ahape are alao being oarried out through the atudy of Cerenkov l ight coaponent of the IAS (Oerdea et a l . . 1973. 1975). Thia la baaed on the theoretical calculationa for proton-init iated vertical ahowera by Zataepin and Cnodekov (19*2) and the experimental aupport thereof by aaVeral groupa, that the lateral distribution fanctlon of the Cerenkov l ight f <r) ia essentially Independent of energy between lolz-lolSeY. Following thia. Oerdea e t a l . . (1975) have shown that the pulse-height distribution of the Cerenkov pulses ehould reproduce the primary apeetral ahape directly. The aaae conclusion can be'shorn to hold even whan the effect of oblique showers and possible changes In the aky transparency are included.
A wide-angle photoaultiplier systea has been In operation in Oulaarg (altitude 2743a) since 1972 for detection of fluoreaeenoe effects in the upper atmosphere

509 dua t o cosmic X-ray and gamma-ray burata. Tha ayatam alao raeorda Cerenkov l ight pulaaa from the SAS secondaries for about 70 parcant of Ita operational run. The system threshold for showers la about 6.6xl0l*eV «ad l i a s in tba region, of Intaraat. The abower data raeordad on some clear nights war» investigated for tba reportad band in tn« spectrum. 2, Ptttfftlga, JYrtea «d, Thraahold Ittiffatt . Theeystom comprisee two adjacent Ю inch diameter photomultipliera viewing tha aky within 50° of tha aanith on dear , moon-laaa nlghta. The Ш Carenkov algnala after amplification, era detected in coincidence In the two photomultipllere, above tha shot-noise fluctuations In tha nlght-aky background l ight level end displayed on a dual-baa* osc i l los cope after a delay of 15 Microseconds. The signals are photographed* along-with the time of occurrence of the event provided by a digital clock.
Tha system threshold has been derived by comparing i ta geometry and electronics with that of a calibrated wide f ie ld of view eyetesi need by Barclay and Jel ley <<r alley, 1*67)/ the Minima» energy Kg of a primary detected by an optical system being related t o the diameter D of tha phototube, the semi-vertical view angle ф and tba upper cut-off frequency te of the amplifier by the relation Е о - ф Л о / ф , . For the calibrated system, X„ - 5х10**еГ, ф - 30°, О - 12.7 em and..f- » 5 Же, ao that for the present'detector, with f- в ЗяНа, ко turns out t o be 6.6xlol*eV. This threshold value agreea within е factor of 2 with the estimate baaed on nlght-aky background fluctuatlona and the relatloaahl» between tha Oarenkov photon flux Incident on the detector and the cosmic ray primary energy at Oulaarg altitude (lataapla and Chudakov, 1962) aa well as the estimate from tha recorded rata of showers and tha photon density spectrum at Qulmerg, derived from the ca l culations of Orelsen (1956). *- *TTTlf*if —Л BlTllltt- Ovar 3,000 events recorded in around 60 hours under clear-eky conditions have provided an nearly average pulse-height which 1* constant within s ta t i s t i ca l l imits . Indicating that tha small changes in the night-eky l ight level and the aky transparency have not affected the data sample. The integral pulse-height spectra for -the two detectors «re shown in Figs, la and lb, with two least-square lines f itted to the data-points In each eeae. The abeisaa ie shown In energy units, based on the estimate of the system threshold and on the assumption that a direct proportionality holda between the pulae height and tha primary energy. The straight l ines

S10
(a) (b)
Fig. 1
hav* slopes 1.9040.02 and 2.26 + 0.02 for detector 1 and 1.85 i 0.02 and 2.20 ± 0.02 for dataetor 2. with the change-over near 0.95xl0*5*v and l.OixlO^eV raapectiyaly. The change-over region i» further delineated in the following way. Starting with a «at of data point* from one end of the apectrwb a leeat squara straight' l ine f i t i s «ad* and i ta variance computed. The analyala la repeated by adding «*ch t in* « data point on the right. Varianoa ia expected to remain conatant t i l l there ia a ehang* of alope, whan i t ahould ahoot tap. Slai lar reaulta are expected by repeating the analysis backward» froai the other and of the spectrue. The plots of the variance for the two eaaea are also presented in Figs, la and lb. for the two detectors. For each detector, the variance changes beyond J r i t two different energy values for the forward and backward oaaaa which w* regard aa the ... region of change-over of slope. The values are o.85xlo15*v and l.OSxloiSev for detector l a n d I.03xl0l5«v and I . l«xl0l5 ev for detector 2.
In view of the arbitratrineas underlying the

511
U) Xb)
Пд. 2 procedure of f i t t ing two straight l ines directly» the general conic «action aquation of the form ax24bxy+ey +dx-tey+f - O. baa also been f i t ted to the data points. Tha beat f i t obtained in each eaae ia a hyperbola whose asymptotes are represented by dotted and ful l linea in J igs . 2a and 2b. The experimental points are seen to l i e closer to the full l ine for the f i r s t part and to the dotted l ine for the second part suggesting • change-over of slope. The change-over i s given by the maximum value of the curvature (1/R) of the hyperbola. The limits obtained for the detectors 1 and 2 are 1.01-1.15xl015eV and 0.88-1.2xl0 l s «V respectively and overlap with the limits obtained from the earl ier analysis» 4 t Discussion and Conclusion. The system phototubes and amplifiers have bean found to have linear response in the energy range investigated In this experiment and cannot produce the observed change of slope in the pulse-height distribution. Further, the inclusion of off-axis showers should ameer the break rather than accentuate i t . The pulse height registered from an off-axis shower at a distance r'from the detector wil l be leas by a factor f (r)/£(0) than that of a similar shower with Its axis through the detector. Conaagusntly, i f , » break ia a characteristic feature of the cosmic ray spectrum in the energy Interval In question» I t wi l l be'displaced

512
towards lower pulse heights in the pulse-height plot of the off-axis showers. Consequently, in the overall pulse-height spectrum, the observed exponent value will be higher in the region Immediately preceding the break. The oblique showers would produce a similar effect. The higher value of 1.8-1.9 obtained for the slope in the region prior to the break, compared to the commonly quoted value of 1.5-1.6 may be due to this effect. A study of the possible effects due to inclined showers is being carried out presently. As a first step, the detector field of view has been restricted by • cylindrical collimator. Xn this geometry, Cerenkov light from EAS, arriving within 10° of the vertical, covers at least half the detector area. The preliminary results again reveal a break in the pulse-height distribution around 10«eV, but with the integral exponent before the break having a value of only 1.4. The implications of this result are being studied in relation to the exponent value of 1.8-1.9 obtained for the wider field of view.
Although a change of slope is clearly brought out at an energy near 10Д5 eV by our analysis, the limitation of the study is still the basic assumption that the lateral distribution function of Cerenkov light is not a sensitive function of energy in the energy region of Interest. Recently Fan et al., (1976) have done.Monte Carlo calculations on small air-showers (ДОг-ДОЗеУ) for the Smithsonian air-shower set-up (Gerdes et al., 197S). The preliminary results indicate that the Cerenkov light distribution function does vary with energy and that there are fluctuations which lead to asymmetry in the distribution of the emitted light. The fluctuations, however, decrease with energy and the Cerenkov lsophotes tend to be symmetrical at energies of 10l3«v. The fluctuation effects are not, therefore, expected to dominate the pulse-height spectrum around 10«eV. Further, the reported energy dependence cannot produce a sudden change of slope unless there is a break in the lateral distribution function of Cerenkov light itself, which again should reflect on the primary spectrum.
He may reasonably conclude that the observed break in the site distribution of Cerenkov pulses la real and is transferred to the Cerenkov light component of air-showers by the primary cosmic rays themselves. The limited extent of the change-over region (0.8вхДО15_1.2ох1015) i« in good agreement with the observations of certain EAS parameters which exhibit rather sudden discontinuities at a shower size of approximately 106, corresponding to a primary energy of nearly 2xlOl5eV (Sreekantan, 1971, 1975). The result highlights the potential of a simple optical

513
syaten -in the study of cosmic ray showers at high energies. The possible Implications of the steepening from the point of view of high-energy physics and astrophysics have bean discussed by several workers including Karanan, 1972, Ramaty et a l . . 1973» Mdowczyk, 197S and Colgate, 1975. f- J'^jprnQylairfintff- ««• authors wish to thank Mr. 1.1С. Kaul for his help In running the experiment. 6. Baftrff lcej.
Antonov, R.A. and Ivanenkov, I .P . , Proc. 14th Int . Conf. Cosmic Rays, £ , 2708. (1975).
Aaeiken, V.S., et a l . , Proe. 12th Int. Conf. Coanle Rays, 6, 2152, (1971).
Aseiken, V.3. , et a l . , Proc. 14th Int . Conf. Cosmic Rays, £, 2726. (1975).
Bradt, H., et a l . , Proc. 9th Int . Conf. Cosmic Fays, 2, 715, (1965).
Colgate, S.A., Phys. Rev. Lett . . Ц , 1177, (1975). Fan, C , et a l . . Unpublished paper presented at Cosmic
Ray Conf. at Leeds (1976). Gerdes, c , et a l . , Proc. 13th Int. Conf. Cosmic Rays, 1,
219, (1973). Serdee, C , et a l . , Proc. 14th Int . Conf. Cosmic Rays, 8,
3040, (1975). Greisen, X., Prog. In Cosmic Ray Phys. 3, North Holland
Pub. Co., (1956). Origorov, J .L . , e t a l . , Proc. 12th Int. Conf. Cosmic Rays,
5, 1746, (1971). Jel ley, J,V., Prog. In Elementary Particle and Cosmic Ray
Phys., 9, North-Holland Pub. Co., (1967). Naranan, 8 . , Ruovo clmento, S, 12, 817. (1972). Ramaty, R „ et a l . . Science, 180, 731, (1973). Sreekantan, B.V., Proc. 12th Int . Conf. Cosmic Rays, 7,
2706, (1971). Sreekantan, B.V., Space Science Review, 21> ЮЗ, (1972). Wdowccyk, J . , Phil . Trans. R. Soc., London, A277, 443,
(1975). Zatsepin, V.I. and Chudakov, А.Ж., Soviet Phys. JRP, 15,
1126, (1962) **

514 The Spectrum of Muons to 1000 CEV accompanied by
Local Electron Showers
Ьт >. C. Bswkes and И. G. Thompson
Physics Department, University of Durham, Durham, O.K. and
B. Khrenov
Institute of Huclear Physics, Moscow State University, Moscow, D.S.S.I.
Abstract
The energy spectrum of muons in showers has been measured to %1000 GeV. The measurements agree with an extrapolation to 1000 CeV of the Greieen muon structure function but not with the observations of the Koscov/Lodz group. The observations are in better agreement with predictions based on.the so called CKP model than with those based on a scaling model.
1. Introduction The lateral distribution of the muon component of EaS is of interest
because of the information concerning the nature of the primary spectrum and/ or the nucleon-nucleus collision that can be obtained from its knowledge. Unfortunately, the predictions of the various models of the nucleon-nucleon collision differ most at the highest muon energies where it is most difficult to make measurements. The present experiment reports an analysis of 'shower' data recorded during runs of the Durham muon spectrograph carried out principally to determine the unaccompanied muon spectrum.
2. The experimental arrangement The investigations were carried out using the MAIS epparatue. This
equipment ha» been described in detail by Ayre et al (1972 ( t b ) end the general data analysis technique is described by Thompson and Halls (1972). However, a brief description of the apparatus will be given here so that the section on data analysis can be most easily understood. The HalS apparatus is shown in figure 1 and comprises four large magnet blocks,, three triggering scintillation counters Figure 1 down each side of the apparatus and, .- п и Г П _ in one side of the apparatus there . ~ - J ~ I ™ j . is a 'momentum selector". This «Pjctrograph device is a hardware device that лаке. biases the eide of the spectrograph on which it operates to trigger only on muons of relatively high momentum. Typically the momentum

51S
selector has tha relative acceptance shown in figure 2 for unaccompanied auons traversing tha apparatua. Both sidea of the spectrograph Figure 2 contain trays of snail dimeter „i,,*.. flash tuba* at each of tha ™ * ™ " „ f ,h. five .«.«ring l« . l . of th. « S - *.?Lt« apparatus to d.t.»in. 7Z*Z£3Z accurately the trajectory т и и ч ш ж and nance tba momentum of tha nuon traversing tha apparatus.
In the present investigations data IU ^.usidered which were obtained during the normal operation of tha spectre > «pa when It was being usad to determine the high energy and of the single auon spectrum: that is tha momentum selector was operational, and tha spectrograph was triggered on a three-fold coincidence from scintillation counters in the side of tha spectrograph including tha momentum selector. The data concerning tha discharged flash-tubes were stored in tha on-line computer attached to the equipment and analysed subsequently using techniques initially introduced by Thompson and Wells (1972) and developed subsequently by Piggott (1975).
3. The experimental data
During the operation of the spectrograph events were recorded which corresponded to small air showers falling near the apparatus. There are in each tray of flaah tubaa soma 89 columns of tubes, each column containing 8 tubes, and «ban a shower strikes tba apparatus the tubaa in several columns are discharged, A, single particle is unlikely to discharge tubas in more than 3 columns and so if tuba* ara discharged in mora than 30 columns or so this can be attributed to a shower of perhaps >5 or б particles striking the apparatua. In addition to this large number of discharged columns, a penetrating particle frequently traverses tba apparatus within its acceptance, accordingly,from the stored data, events were selected corresponding to the apparatus having been travaraed by a muon and alao having at least a cereuin number of columns of flash-tubes discharged in the unshielded tray at level 5 of the apparatua.
Tha data ware collected during the period 1973-1976 and correspond to tha analysis of 5118 hours worth of data which contained 1080 events appearing to have B U M S of momentum apparently greater than 20 GeV and which contained also discharged flash-tubas in at lsast 30 or mora columns of flash-tubas. Events ara classified at either 3 or 4 tray fits (there arc no five tray fits due to the incident showers having discharged a great number of tubes in the top tray of tha apparatus) according to the number of trays' data that are uaed in the determination of tba muons momentum. The 4 tray fit data ara included together with the 3 tray-fit data and ara shown in figure 3 corresponding toSO.JW and $50 columns of tubes i* measuring tray 5 having at laaat one discharged tube. The charge ratio of tha moons is given in figure 4 for completeness, and is sensibly unity. During tha latter part of the data recording the Durham 57m laf array was in operatic* and thia confirmed that tba majority of the selected events ware attributable to air showers. However, it was found that if 50X of the tubaa discharged in tray*5 were within 10 tuba spacings of the projection of the muons track into tray 5 than the' shower was probably vary local in origin. Consequently this type of event has been rejected from the data.

516
i I fSSSSrm — H4
тв tr
%шм
Figure 4 Tha charge ratio of «none in •bovsrs with »30 coluani of data in flash-tube tray at level 5. Overall excess for 1 >20 GeV, 1.07Ю.06.
Figure 3 The rate of events determined from the shower size spectruB.
4. Theoretical considerations
Calculations of the expected rate of events have been mode based upon an extrapolation of the anon structure function as reported by Greisen (I960)» and a function bated upon the experimental values produced by the Moscow-lode collaboration, loth calculations require the calculation of the triggering probability of the apparatus by shower. Problems arise in this latter calculation due to the selection efficiency of the momentum selector, above 100 GeV/c the efficiency of the momentum selector is finite and readily calculable and the probability of the electrons in the associated shower triggering the required number of columns of tubes in the top tray is a simple problem in statistics. Below 100 GeV/c the momentum selector efficiency is essentially sero for unaccompanied auoas, but due to the shower electrons triggering the top trey of the momentum selector the momentum selector as a whole cen be triggered even at ea low a momentum ea 20 OeV/c with reasonable efficiency. The triggering probability baa beeu calculated using е computer simulation assuming the electrons striking the epparatua do so isotropically; the momentum selector logic is included in the treatment and the flash tubes were assumed to have an efficiency of 95*. The correctness of the simulation has been verified by comparing its predictions for the limiting triggering probability at sero particle accompaniment with the spectrograph acceptance calculated analytically by Hhalley (1974).
Knowing the detection probability of the apparatus for various incident particles as a function of muon momentum the rate of events has been calculated assuming the following:
a) The integral aea level ehower eiee spectrum is as given by Bell (1974) namely. *(>*,) - 6.3101 K,"1,5 m"2 s'1 er"1 for M, »S.103
Г(>М.) - 8.48 105 » „ ~ 2 " 0 3 V 2 s~l sr"1 for И, >7.105
b) The lateral distribution of electrons is es Greieon (I960) 0 . /r,10.75/ r, 13.25 _ „

517 с) Tha lateral nuon distribution ta aithar
i ) aa Craiaon (1M0) , . . . '-0.75 П 0.75 j , J 0.1«r°-J7 _2
V". '• >V • l ^ % ? '•> ф Ё^О «fcja» or aa dadaead by tha authors aa a fit to tha Moscow/Lods data Ш Рц(»..г.>у - 2.124 1С"* « / • " И.0'1 г"0"» . - J - H U ' 3 « u - ' 0 ' ^
and ia theae expressions r la tha radial distance in a, froa a shower of alia Kc containing aaoas with energy 1ц GeV. Tha integrations parforaad cover tha ranges 0.1a<r<100a and 5.10<H,<10', aad tha results ara shown in figure 3. In additioa to calculations baaed upon the measured lateral structure
functions of tha Cornell and Moscow-Lois groups,ve have considered the predictions of the aeaaured rates of the present experiment baaed upon two models of high energy nuclear collisions, the eo called CK> model (Cuceoni, Koester and ?arkime, 1941) and tha Feynean (1*69) scaling modal. The rala-tioaahiaa given by Goaad (1975). Gaiaaar (1974 , 1972 >, de leer et al (1966, 19**) aad Fiahbaae et al (1974) ara interpreted with respect to the present results. The lataral anoa density distributions have been calculated froa the total auoa numbers and two radial aoaaats for primary proton cosmic rays given by Gonad. Tha lateral distributions are repreaented by
'^'hf^"*^* where f(r0) ia the radial distribution for a fixed transverse momentum rc aad has the form f(ro)-Cr0
a exp(-Sr0). The constants C, a and в are aa givan in table 1.
Г Threshold (GaV)
SO 100 500
С 2 .7 i 1 0 - 3
1.33 10"2
2.97 10 _ 1
CKP Scaling
a 8 С а в 4.244 0.274 4.49 Ю - 2 2.428 0.194 4.274 0.453 1.26 lo"1 2.318 0.319 4.100 1.269 4.95 i0_l 3.11 1.198
Table 1 Parameters in tha anon radial distributions for tp-105 GaV and в-0°, for a Beam Tt of 0.4 GaV/c.
Ia the calculation a knowledge of the primary spectrua ia required. To enable a coaparison of the aodels to be aade a measured datum must be con-sidered'and we hare taken tha sea level shower sixa spectrum aa the datum. For each modal the prediction of tha в а ш shower siaa for a given primary energy is used with the measured aaa level shower aita spectrua to generate a primary spectrua. Thia primary spectrum ia than used with the model to predict the experimental rata; thia approach ia adopted because tha primary cosmic ray spectrum has only been aeasured directly to tlO3 GeV/nucleon Ryan at al (1972) for example. To compare the predictions of a CXP model and a scaling nodal thrae different linaa have been followed.

S18 Modal a, - briefly.thia eonfidara the CKF nodal, and uaca th» data of Goned for th« muon diicributiona and the relationship* of de Bear et al (1966) for the answer aiae to primary energy converaion. Modal В - acaling aodele of Tiahbane et al. and Goned are combined to con-aider icaliag with a conatant proton air croaa-section and nucleon target. Modal С - allow* for the poaaiMe influence of a riaing proton-air nuclaua croea-aaction and intranuclear caacading baaed on the prediction* of Fi*h-bana et al. and of Goned. For thia latter model the muon lateral distribution ii cooaiderad to have the sane form ae that of model B. In the * calculation* tha integration* over the primary nucleon energy extended over the range 103 GaV <Ep<108 GeV, and the radial distance covered i* 0.1m<r<100a. the raault* of acme of the calculations are shown in figure 5.
Figure 5 The measured ratea of muon» compared with theoretical expectation; (a) greater than 30 diecharged column*, and (a) greater than 50 diecharged column*.
TWO poesiMe composition* of the primary apectrum are considered, a proton only •pactrun, ana а во called 'coapoiition spectrum' in which the main coaititueat nuclai are assumed to follow a power law of tha form loET with a break occuring ia the ipectral ahape of each aaaa component at a conitant rigidity. Tha proton apactrua of Жуан at al (1972) and tha survey by Ilbert at al. (197*) ii tha source of data concerning the proportion* of heavier auclei ia the primary apactrua.
5. Concilia ioaa
•afore categoric atataaeata caa be aada about the goodness of fit of one aedel as compared to another, some consideration auat be given to the accuracies of both the experiaeatal data and tha theoretical predictions, la tha eaaa of tha data the statistical error* are aa «nova, and alao tha affect of a SX error in tha' estimation of the triggering probability of the apaaratua i* (hewn a* tha hatched area oa the theoretical prediction*, tfcilst the figure» ao show that it would ha uawise at this stag* Co argue tha case for or against a mixed composition of tha primary «pectrua, it aaaaa clear that acaliag model I ia iaoonaieteat with the observation*. Further tha data confirm the extrapolation of the Oreiaea awoa apactrua to 1000 GaV, which la far in excess of tha original euggeetion, end do not agree with pradietiaaa baaed on the Maacow/Leds lateral structure function.

S19
lafaraacaa
Ayr», С. A. at «1., 1972a, Mud. Inat. and Math., 102, 12.
Луга, С. Д. at al., 1»72Ь, duel. Iaat. and Math., 102, 29.
•all,С J. at al., 1974, J.Phya.A., 7, 990. Coccoai, G., Keailar, L.J. aai Parkin», D. H., 1961, Lawranca Kad. Lab.
•i|h laarty Payaica Study taaiaars, Ho. 28 at. 2.
*a laar, J. F. at al., 19*4, Proc. Phya. Soc., 89, 567.
da 1мг, J. P. at al., 19M, Journal Phya. A, 1, 72. Blbart, J. W. at al., 1975, Journal Phya. A, 8, L13.
Fayaman, R. P., 1H9, Phyi. Кат. Lett., 23, 1415.
Fiahbaaa, 0., 1974, Phya. Uv. D, 9, Э06Э Gaiaaar, Т., 1972, Katura 248, 122. Gaiaaar, Т., 1974 , J.Franklin Inat,, 298, 271.
Gonad, A., 1975, Huovo Cia., 29, 301. Graiaaa. С , 19С0, iaa. Kav. Unci. Sci., 10, 63.
Piaaott, J. L., 1975, Ph.D. Thaaia, Univ. of Durham.
Kyan, H. J., at al., 1972, Phyt. tav. Utt., 28, 985. Thoaaaoa, И. G. aad Walla, S. C , 1972, Bucl. Inat. and Hath., 102, 35. Hhallay, И. »., 1974, Ph.D. Ihaaia, Univ. of Durhaa.

520 POSSIBLE DETECTION OF PRIMARY COSMIC RAY ELECTRONS BY THEIR SYNCHROTRON RADIATION IN THE GEOMAGNETIC FIELD AND INTERSTELLAR
MAGNETIC FIELD* B. Mc Breen.
Physics Department, University College, Dublin , Dublin t, Ireland .
New methods are suggested for distinguishing primary i к electrons above 10 eV from other primaries baaed on
their synchrotron radiation in the geomagetic field. In addition, it is shown that the synchrotron gamma
IB ray emission from electrons above S x 10ieeV may be used to detect these electrons at distances up to 10 m from the earth with collection areas of about 107km2.
1. Introduction» Primary cosmic ray electrons of energy greater than 10 eV traversing the geomagnetic field radiate synchrotron gamma rays. These gamma rays will pair produce in the first radiation length of the earths atmosphere giving rise to an inherently higher concentration of charged particles at this height, for these energies compared with other primary particles. The simultaneous direct detection of some of these gamma rays or the excess Cherenkov radiation generated by their electrons high in the atmosphere may provide methods of determining the electron spectrum. The possibility of simultaneously detecting primary electrons above 10 eV along with some of their synchrotron x-rays has been considered (1).
Furthermore, in the interstellar magnetic field electrons IB 12
above S x 10 eV radiate photons above 10 eV. The line of small air showers generated in the atmosphere by these synchrotron photons will provide a method of detecting these electrons out to distances of 10 a.u. from the earth with collection areas of «bout 107km2. * Research sponsored in part by the National Science Council.

521 2. Primary Electrons in the Geomagnetic Field. An electron of energy-уже radiates (2) synchrotron photons of average energy 4.8 x 10~9HY2eV. A 101*eV electron radiates gamma rays of average energy 60 HeV if H * 0.3 gauss is taken to be the component of the magnetic field perpendicular to the electron trajectory. The geomagnetic field decreases approximately as the cube of the distance from the earth and a value of H =.0.3 gauss is assumed at the earths surface at the equator. The
-3 2 2 -1 total synchrotron power radiated is 10 H у eV sec spread over a wide range of frequer-'- . The spectral density of the strength of the radiation from one electron is l.S x 10 HF eV sec H* . Values of the emission frequency dependant function F are given in reference 2. By comparison proton synchrotron
13 radiation is negligible being 10 tines smaller than that from electrons of the same total energy. Furthermore the maximum in the proton synchrotron spectrum occurs at a frequency which
Q is 6 x 10 times down on the equivalent electron maximum.
A 10 eV electron has a radius of curvature of about 1010m in the geomagnetic field. It is assumed that the gamma rays are emitted tangentially to this trajectory since the largest part of the emission is concentrated in a range of angles Y about the tangent. This electron traversing the last 1000 km of the geomagnetic field radiates approximately 80 gamma rays £ 20 MeV . As the electron is magnetically deflected from its straight line motion, the projection of its
trajectory will be a line of length W m at the top of the
atmosphere with the number density of gamma rays increasing
from 1 to 10 per meter of line length. To detect these
electrons it is necessary to simultaneously record two or more
gamma rays from the same direction on a line traversing a spark
chamber or other detector. These detectors will have large
effective linear dimensions because of the spread of the gamma
rays provided detection of the primary electron is not also
required.
An estimate of the expected rate of events may be obtained be extrapolating the measured electron spectrum from lower

522 energies. The differential electron spectrum that is a reasonable fit to the date (3,4,) from 1010 to 10I2eV is
$ « 13SE"?*° * 0,2electrons m"2 sec-1 sr"1 GeV-1
where Е is the electron energy in GeV. Extrapolation of this — 9 —2 —1 —1 •spectrum yields a flux of electrons of 6.7 x 10 » sec sr
above 1014eV| A gamma ray detector of geometric area lm with an effective linear length of 40m for two or more gamma rays, a conversion efficiency of 1.0, and a- solid angle of one steradian will detect only one multiple gamma ray event per SO days. In this energy range cosmic ray physicists have detected muon -poor air showers which may be initiated by either electrons or gamma rays. Such showers are observed up to primary energies of about 2 x 10 eV with a possible cut at higher energies (5) and require a primary flux of <6 ») x 10 quanta" m sec" sr
15 at energies greater than В x 10 eV (6). If the muon - poor showers are initiated by electrons, the electron spectrum must flatten between 1012eV and 101',eV (7). In this case the predicted counting rate of multiple gamma ray events is an underestimate by at least a factor of 10.
A more promising approach is to look at electrons above 14 S x 10 eV for the excess air Cherenkov light generated in the first few radiation lengths in the atmosphere by the electrons produced by the synchrotron gamma rays. A 10 eV electron traversing the last 8,000km in the geomagnetic field radiates almost 400 gamma rays above SO MeV, of which about 80 are greater than 5 GeV and about 125 between 500 MeV and 5 GeV. In the early stages of the longitudinal development of the electron induced shower in the atmosphere, there will be an anomalously large number of electrons and hence air Cherenkov radiation. With ground based Cherenkov detectors (8) it may be difficult to distinguish this light from the light generated by the cascade of the primary electron (9). These electron showers can be distinguished from showers initiated by other primaries with Cherenkov detectors carrind on an aeroplane or

523 balloon at an altitude of about 12 km. Detection at this altitude will provide the required discrimination between the excess light from the early development of the synchrotron gamma ray shower's and the light developed by the cascade of the primary electron or other primary particles. A number of Cherenkov detectors with effective light collection area of
с ч 10 m and a solid angle of 0.1 steradians, would detect a flux of 6 x 10 muon - poor showers above В x 10 eV initiated by electrons at a rate of one per six hours. 3. Electrons in the Interstellar Magnetic Field.
A 2 x 10 eV electron moving perpendicular to a uniform magnetic field of 2 x 10 gauss radiates a spectrum of gamma
13 rays with average energy of 1.5 x 10 eV. The total power radiated is 6-f x io".v see' with an electron half life of
е 3.2 x 10 sec. This electron radiates 0.1 photons per second above l.S x 10 eV and 0.13 photons per second between.l.S x 1012eV and l.S x 1013eV. The average distance travelled by the
Q electron between the emission of two photons is 1.2 x 10 m. The 20
electron radius of curvature is 3.3 x 10 m and hence the aver--12 age angle between the emission of photons is 3.6 x 10 radians. If this electron radiates at a distance of 10 m from the earth, the average distance between photons at the earth will be 3.6km. As the electron is magnetically deflected from it's straight line motion the photons at the earth will be spread out on a line of length about l.S x 10 m s 1.5 x 10 km. The width of * this photon line is у 10ls x 25 m. If the electron radiates closer to the earth the average separation between the photons will be reduced and also their line width. In a non uniform interstellar field the photon track on the earth will be scattered in direction reflecting the inhonogeneities in the field.
12 Such regular or irregular lines of gamma ray* above 10 eV
can be distinguished from individual air showers because a number of showers should arrive in time coincidence. A number of widely spaced Cherenkov light receivers would be required to

524
detect the individual showers. An estimate of the possible measurable flux of these events shall be made assuming the array has a field of view of 0.1 steradians with the ability to detect at least two showers arriving simultaneously in the field of view from the same direction and separated by up to 5km.
Б 2 The collecting area of tha" array will be 7.5 x 10 km i.e. the line length by the array diameter. An event rate of one
6 • —13 —2 —1 —1 every 3 x 10 sec would imply * flux о* Ч x 10 km sec sr . 19 The measured flux of eosmie rays above 10 eV is about
—8 —2 —1 —1 —5 3 x 10 tan sec sr (10). An electron flux as small 10 times that of the primary cosmic rays could be detected with such an array.
The sources of such high energy electrons in the interstellar medium will come from collisions of the cosmic rays
19 above 10 eV with interstellar gas, the pair production of 19 photons above 10 eV (11,12,) and the photoproduction of pions 20 by nuclei of energy exceeding 10 eV per nucleon (13,14,15). The electron flux in the interstellar medium will be less than the measurable flux by about three orders of magnitude.
REFERENCES (1) Prilutskii, O.F., JETP Lett., 16, 320 (1972) (2) Ginzburg, V.L., and Syrovatskii, S.I., Ann.
Rev. of Ast. and Acirophys., 3, 297 (1965). (3) Anand, K.C., Daniel, R.R., and Stephens, S.A.,
Proc. Inter. Conf. Cosmic Rays, 1. 355 (1973). CO Freier, P., Gilman, C , and Waddington, C.J.,
Proc. Inter. Conf. Cosmic Rays, 1. 425 (1975). (5) Kamata, K., Shibata, S,, Saavedra, 0., Domingo, V.,
Suga, K., Murakami, K., Toyoda, Y., La Pointe, H., Gaebler, J., and Escobar, I.,
Can. J. Phys., 46,S72 (1968). (6) Gawin, J., Maze, R., Wdowczyk, J., and Zawadzki A.,
Can. J. Pliys., 46, S7S (1968). (7) Ramaty, R., and Ligenfelter, R.E.,
Phys. Rev. Lett., 27, 1309 (1971).

525
(8) J e l l e y , J . V . , Prog. Elera. Part, and Cosmic Ray Phys. 9, 41 (1967) .
(9) Kalmykov, N.N., Prosin, V.V., Khristiansen, б.В., Grigoriev, V.M., Efimov, N.N., Krasalnikov, D.D., and Kuzmin, A.I.,
Proc. Inter. Conf. Cosmic Rays, 8, 3034 (1975). (10) Watson, A.A., Proc. Inter. Conf. Cosmic Rays, 11, 4019
(197S). (11) Jelley, J.V., Phys. Rev. Lett. 20, 752 (1966). (12> Gould, R.J., and Schreder, G.P., Phys. Rev. Lett.,
16, 25? (1966). (13) Greisen, K., Phys. Rev. Lett., 16, 748 (1966). (14) Zatsepin, G.T., and Kuzmin, V.A. JETP Lett., 4, 78 (1966). (15) Stecker, F.W., Phys. Rev. Lett., 21, 1016 (1968).

526
A SEARCH FOR COINCIDENT SINGLE AIR SHOWERS
.AT THREE WIDELY SPACED LOCATIONS*
C. O'Sullivan
Physics Dept., University College Cork, Cork, Ireland
D.J. Fegan, B. HcBreen, and D. O'Brien,
Physics Dept., University College Dublin, Dublin, Ireland
Three air shower detection systems, with
separations of between 20 and 250 km, have been used
to search for coincident single air showers. The
absolute arrtval time of each air shower (»4xl0lu«V) at
all three stations is recorded to an accuracy of 1ms and
the records later compared for coincident events. A
preliminary analysis is presented.
I. introduction
Several mechanisms have been proposed predict Ing "the
possibility of spatially correlated extensive air showers
developing in the atmosphere. Photodisintegration of cosmic ray
nuclei, of energies to 1 6 eV per nucleon, in the field of solar
photons, will give rise to such showers (I). The component
showers could be separated by up to 500 km at the earth (2).
Correlated air showers might arise from the breakup of rela-
tivistic dust grains in the solar photon field (3), provided
such grains can be propageted from sources to the neighbourhood
of the solar system (h). The synchrotron emission of'htgh energy
electrons (?1019eV) In the interstellar magnetic field will also
give rise to such correlated showers (5). It has been suggested
that intense bursts of anti-neutrinos from collapsing stellar
systems might, produce air showers of unusually flat lateral
distribution (6). One search for such showers has been negative
(7). These possibilities have prompted this search for air
showers correlated in time over long baselines.
*Research sponsored in part by the National Science Council

527
2. Air shower detection systems
Three Identical shower detection systems have bean built
using scintillators. One pair of stations constitutes a short
baseline with separation of 20 km. The third station forms two
longer baselines (250 km) with the first pair. Each shower
detection system employs four scintillation counters, each of
area 1m , operated In coincidence (8). Each scintillator is
biassed at the single particle level. Showers detected In all
four scintillators, coincident In time to 0.5 us, form an ewent
trigger. The shower rate at each station is typically 0.08 s"1.
The arrival directions at each station are not determined hence
showers are detected from a wide field of view. The effective
threshold energy for vertical showers at each station is
4xl011>eV. When a shower is registered a local clock Is interro
gated and the time recorded to an accuracy of 10"1* s. Each local
clock is calibrated every hour against the 60 kHz time trans
mission from Rugby, to an accuracy in absolute time of 10~3 s.
The dead time per ivent for writing a time Into memory is
8x10~6 s. The readout dead time is 5s per buffer of 32 events.
J. Analysis, results and conclusions.
Observations have been made at all three stations for an
overlap period of 98 hours. Approximately 27,500 showers haye
been detected at each station. To date, the data has only been
analysed for coincidences between two stations on the long
baseline. The analysis procedure adopted was as follows. Each
event time at the first station was checked by computer for any
events at the second station within ± 250 ms. A tabulation of
the number Np of such time differences was nade. Event times at
the first station were then augmented by 20s and a new grouping
(Nsl) generated. This procedure was repeated once more by
subtracting 20s from each event time at the 2nd station and a
third grouping (Ns2) generated. Table 1 shows these results.
The distribution in time of Np is shown in Fig (1).

528
TABLE 1. Total no. of showers
at each station.
27,081 28,1.11.
Np
1101
Nsl (+20s)
1101
Na2 (-20s)
1094
О SO 100 ISO 200 250 r Time distribution of prompt events out to 250ms
The numbers within each group of Table 1 are mutually compatible. Four of the Np events were observed at zero time difference, to within the systems resolution of ± 10~3 s. This rata is compatible with the random expectation rata of 4.4 events per millisecond bin. An upper limit at tha 953 confidence limits can be set on spatially correlated time coincident air showers above <>x1014eV> of 2 per day at two stations separated by 250 km. This upper limit can be significantly reduced whan analysis of the third stations data Is completed. It Is also Intended to repeat this experiment over a longer observational period.
Acknowledgements'. We thank Hary Hyland for her valued contribution to analysing the data and Michael Walsh (Computer Laboratory U.C.D.) for writing the coincidence, search program.

529
References:-
1.) N.M. Geraslmoya and G.T. Zatsepln, Soviet Phys. , JETP 11, 899 (I960).
2.) V.L. Glnzburg and S.I. SyrovatsklI, P 127 of The Origin of Cosmic Rays, Pergamon Press, \?ih.
3.) J.E. Grind'ay and G.G. Fa.-.о ,'.p. J. 187, L93 (1974). <t.) K.M.V. Apparao, Proc. l'lth n. Conf. on Cosmic Rays,
Munich, 2, 7*0 (1975). 5.) B. McBreen, Paper EA127, This Conference. 6.) W.S. Pellister and A.W. Wolfendale, Nature, 251, 488
(1974). 7.) .H.J. Garms.:on and A.A. Watson, J. Phys. A: Hath. Gen.,
9, 1199 (1976). 8.) O.J. Fegan, B. HcBreen, C. O'Sullivan and V. Ruddy.
Proc. l'lth Intern. Conf. on Cosmic Rays, Munich, 2, 7'Ю (1975).

430
ESTi"MATICK OF THE PARAMETERS OF MUOH DENSITY MSTRIBUHOH OF EAS
3,Betev, T.Stanev and Ch.Vankov institute for Suclear Besearch and tfuclear Energy, 1113 Sofia
A statistical method of determining the total spectrum of the muon density fluctuations has been developed* The parameters of this spectrum have been estimated using the maximum likelihood method»
!• Introduction. The sensitive area of the muon detectors of the existing EAS arrangements is relatively small. Because of that, for the time being, it is доге correct to set the problem of determining the fluctuations of the rauon density at a given distance from the axis, instead r,/ the fluctuations of the total number of muons,
A basic information for determining these fluctuations, practically in all EAS arrangements, is the distribution of the counters which £.rs ac-ually hit in a given cuon detector. Such a distribution is con
structed for з sample of events with a total number of electrons., arrival, cii ect tine and core coordinates, which are in known smaller or vider intervals.
The present paper gives a method of determining the muon density -j.3triouticn and its fluctuation by means of the distribution mentioned above. 'Jhe method has "seen developed for analysis of data froo the Tian-Shan EAS arrangement Тае considerations are however sufficiently general and applicable for analysis of the lata from other experiments.
2. Expected iistributicn of thfc counters hit and the total density spectrum of щцрпв. We shall consider the distribution of the number of counters hit Щю) in a given muon detector and for a sample of showers with ;:nown distributions of the total number of electrons /fe , arrival directions 9 , and position of the axis Л^ j( .
Let the gradient of the density p of the muons in the vicinity of the detector be negligible. If M Is tho total number of channels and

531
J their eene£tive area, the expected number of the counters hit сал be detoribed by the knovn formula
vhere ' is the duration of the "i ani-eufeut.
In (1) f(P) is the distribute '" *he muon density over tH* detector. This distribution,callec a . tu- -;ectrum, is a superposition of two independent classes of distributions. The first one reflects the processes of the longitudinal and lateral develc nment of the muon сош-•• ponent in the atmosphere. The second one is due to the conditions of receptions and grouping of the event* according to Vf, & , f , /(,.
In order to determine the development distribution, it is necessary first to determine the total spectrum. This problem can be Bolved only if we assume that is a function of a given type.
In this work we shall consider the case when F(f) is a translated gamma-distribution, I.e.
r 0 *< f'P* (2 2) P(P) " | -f
( ~- (f -A/' 1**p (• °-(fi -*•*) ** f *я • The first and the second moments and the relative fluctuations
of fy>) are:
. * r* f • <?- ^ (2.3) */»•/.* * • <f -- p J' p t ^
The assumed form (2.2) cannot be proved. At most ve can make some kind of a test, for instance * -teet, the results of which may or may not be in contradiction with the type of rffj.
The problem of determining therefire is a problem of estimating the best values of parameters f , Л and /& . For that purpose we shall apply the maximum likelihood techniques
PJ. The logarithm of the probability distribution function will be

S32
м
and in determining the beat values of the parameters we get the sys-tem of three equation*
The dispersions of the measured parameters are equal to the diagonal elements of the matrix £ , where"& is the symmetrical matrix whose elements are equal to the expected values of th< second deriva
tives of (2.4).
To solve the system (2.5) and to determine the elements of the
matrix «•• it is necessary to calculate < hf** ,1^)У and l^ejr firet and second derivatives. This numerical problem is a difficult ш э 'сы лаее the direct calculations from (2.1) or by the expression
I ' ho
( Xo * Pc 5 t °* <*•/£) , whioh is the solution of (2.1), are prao-tically impossible when the quantities in (2.1) or in (2.6) are with
fixed accuraoy.
. A method for numerical calculations. A suitable form for numerical
calculations has been found by expanding (2.6) in powers of i/(M-'"tl)*1.
Let us first consider the special oas» X0- Q . From (2.6) we get at m-0
'<IV(0)> = T I М+ь J
and a t m»l« '" „ *
(2.7) <».,>.(IfrifJX %L(»tk) & r

533
«hex*
(2.8) d(t* ,k) * (-f)m Sll ' (<*» * к ) !
If we coneider the r-th derivatives of the function ff~(l-e J at ' -»0 v« get the following relationships for (2.8)
(2.9) A(mtH)* ~ [oL(m, к.,). Ы(*<-*, <<)]
where cLfl»;*) -let » W and d(\ k)- -^(1, *"f) at к г 2.
The expression (2.7) together with the relationships (2.9) are тегу suitable for computation.
From (2.7) we get the following expressions for the first derivatives of * .M»»
ri *(„.**) i <>-":•.[ i-J—.] f t I л(*»,*) iP< (р*»*г->>
The seoond derivatives of (2.4) are

534
< P., > » - ± . " »":• ?р (?к <)/(»>•>
X1 (д < »>)* *
fbt solution of the system (2.5) bas bean found by Newton's its-ration» The first approximation Л and b„ of th* parameter* vae obtained using th* first and th* second moment of the observed histograms *t(m)\
w - ., • t 0M - д Mt* Мг*
and th* r*lation*hips
m k, •- M -=T w Л ' - A <Twl " ° A*
The statistio
x*x I 2 _—
has been applied as a consistency test. This дав а Л -distribution. The general eass *0Фо oan be easily reduced to the oas* Z0 «0
expanding exf> (- ix, ) in s*ri*s of ix0 ( ix„ is much smaller than an unity).
A. Conolusion. In determining the relative total fluctuation some authors *] transform ths observed distributions of the counters hit into distributions of densities. For this purpos* they us* the relationship i
u.i) P * &
Ths method described in this paper is more preoise «specially in

535 case» when Ml ie email and (4.1) is not valid.
Thi» method has been applied in processing th9 data obtained from the muon detector of the Tian-Shan arrangement. The results of the parameter estimations of the total density distributions and ~,he relative fluctuation* are given in
• The authors acknowledge Br B.Karkovsky'в helpful discussions,
REFERENCES
1. J.Gawin, K.Haze and A.Z&wadzki, The Seminar on Cosmic Hays Extensive Air Showers, Lodz, 1965, p. 119
2. l.Janoeey, Theory and Practice of t.'ie Evaluation of Measurements, Oxford University Press, 19°5
3. T.Daikoveki, J.Gawin, B.Gxochalska, S.Paohala and J.Wdowczyk, Conference Paper* of the 15th IGRC, Е A-2".
4. B. Betev ,et al. , Conference Papers o' ths 15 ih ICHC, si -3 8, V* 8. p. 123, 1977

536
Family and Extensive Air Shovcrs
Brasil Japan Emulsion Chamber Collaboration
Brasil Group: J.A.Chinellato, C. Dobrigfccit, C.H.G.Lattes ,11. Luk sys, M.D.Santos, E.H.Shlbuya, A. Turtelll Jr., Institute de FTsica - (Inivorsidade Estadual de Cam plnas. ' ~ N.H. Amato - Ccntro Brasileiro de Pesquisas FTsicas Rio de Janeiro - RJ
Japan Group: H.Arata, T. Shibata. K. Yokoi - Departament of Physics, Aoyama Gakuin University Setagaya, Tokyo. A. Ohsawa - Cosmic Ray Institute, Tofcyo University, Tanashi , Tokyo. Y. Fujimoto, S.Has'egawa, H. Kumano, T. Miyashlta, K. Sawayanagi, II. Semba, M. Tamaila Science and Engineering Research Laboratory, Uaseda University, Shinjuku, Tokyo.
ABSTRACT
Although the characteristics of gamma-rays families and EAS are not always similar, the authors show that the longitudinal develo£ ment of electrons and gammas can be analysed in the same way as in EAS. The different lateral spreads of families are interpreted as an evidence of different types of hadronlc interactions.
1. INTRODUCTION
The emulsion chamber detects both the eletroraagnct -c and the nuclei ar active component produced in hadronic interactions. Sometimes, a group of these particles arrive at the chamber "with the same in cident direction. This,group Is called "family". Л family Is a kind of "air shower" but not "extensive", because its lateral spread ts limited by the detection threshold (1 TeV). Description of the detection process and of the measurement method using emulsion chambers exposed at Chacaltaya (5220m, Bolivia) can be found in the reports presented at the He session by Brasil Japan Collaboration. Ue discuss some characteristics of the longitu dinal behaviour offamilies using the EAS approach while their tran£ verse diffusion is much more affected by the type of hadronlc inte raction
2. HETHOD AND RESULTS
The study of a family is done analysing its longitudinal development and its transverse diffusion. The first one is treated in the' same way as in EAS. The lateral spread of a family 1s much wider than that expected from the multiple scattering of electrons In the atmosphere, so, from the lateral distribution we get information on the primary particles produced in the parent interaction.
2.1 Longitudinal Development
We assume the shower function of a family:

537
»0>Y(E,TlEo).N*(E0/Eomin)SN (Е/Е„ ) 1 пЛ ехр (-Т/А) which reprosen gy above Е at primary partic sent the avera ponent through there are rath trio observatio "age" of nude ly. Л express the family. Tnble 1 shows experimentally
(1)
the expressions and values of the exponents of the obtained spectra together with the calculated ories.
TABLE 1 experimental
value allowed region (see Fig.1) spectrum
' e l e c t r o m a g n e t i c coin ponent i n f a m i l y ~
* * f a m i l y s i z e : i n energy f l o w i n p a r t i c l e number
* * * f l u x o f a tmospher ic e l e t r o m a g n e t i c com ponent
exponent
v/sN
YV S N
1Г31 ± 0.05
1.3 t 0 .1
1.41 ± 0 .1
2.05 ± 0.05
1.32 1.36
1.47 1.52
,£EY/TeY £ lOOOTeV * 29 f a n l l i e s o f CH 14 w i t h 103.6 « ТЕ /TeV « 539.1
* * f a m i l i e s of CH 14 w i t h 2 i&Ne £ 100Y and 2£TE / T
* * * f l u x measurements over a l l the chambers up to Cll 14 , i n t he range 0.1 % Ey/TeV * 100 TeV
F i g . 1 shows how ие can de termine Y / S M a n d S us i ng the f o l l o w ing expe r imen ta l r e s u l t s : ' ' • Y S
Y / S H " 2.05 0 .O5, ob ta ined f rom the gamma ray f l u x , i i . Under the e q u i l i b r i a c o n d i t i o n supposed t o h o l d a t mounta in
a l t i t u d e s we have:
л (s Y ) •1 /MS ), (2 )
where Л is the atternation mean free path, and A,(S ) is the usual cascade shower function. Assuming a primary spectrum of the from E"Y and using the zenital angle distribution one obtains
Y 95 t 5 g/cm , used 1n fig. 1,

S38
iii. S =• 1.31 i O.OS, obtained J* from the flux of the elotromag- "c~ ne.tic component of families, J N iv-t/St, » 1.* t O.l, obtained from the multiplicity distribu tion of famiHes. " | , As our emulsion chamber gives no jlirect information on the , c primary energy spectrum, only indirectly we can get v=l.8*0.1 using the data available on fa 1-1 rallies with ?*УЕ / T C V < 2 0 0 . Using this value не obtain '••* S„ » 1.16 i 0.12. " 1.2.
U 1.3 1A 1.5 1.6 S r
FIG. 1 2.2 Transversal Diffusion In a fawily one recognizes clusters of particles with dimensions of 1 cm or less, which are cascades started by a single namma-rayi or .a neutral pi.meson. The lateral spread of a fanily is governed by the following three factors: i. size of a family (or energy of initiating particle), ii. location of the parent nuclear interaction in the atmosphere, iii. mechanism of meson multiple production. For families produced at the same height and through the same mechanism (111.) the lateral spread will depend only on the "inverse of the energy. Thus we will analyse the lateral spread of particles using the variable rjE , where r is the distance of.the particle from the energy weighted center. Suppose a family initiated at the height h, hy the particles produced by a moving fireball. It is lateral spread will be characterized by the distance r ^ 2 « h/r , where г is the Lorentz factor of the fireball. The energy normalized expression of the lateral spread will be:
r1/2 Е E Y • no I ^ Y ln (T/T-t)/exp (t/Л) (3) using the semi empirical relation (1). T and t are the air thick ness from Chacaltaya to the top of atmosphere and to the point o? parent interaction, respectively. Ну is the part of the rest e-neVgy of the fireball released as gamma-rays'. h 0 = 7.5 Km is the scale height of atmosphere. Numerical calculation shows that the expression (3) can be approximated by a simple formula independent of t:

539
r1/2 I Er = 0.1 h irt,
in the region where t Is not very small, i.e. t 3 50 g/cm . Thus, unless the parent interaction happens to be very near the observa tion level, the energy normalized lateral spread will depend only on the fireball mass, i.e. on the type of nuclear interaction, ir respective of the interaction height in the atmosphere. If there is no cascade degradation in the atmosphere we conclude that the event occurred near the detector and it will be analysed as described in'our previous publications.
3. CONCLUSIONS
We are reporting results obtained on the nuclear interactions pro duced in the target layer of the emulsion chamber at the HE sessT on of this conference, and the report shovis the existence of two types of interaction: Hirim, snail pT and small multiplicity and Леи, large pT and large nultiplicity. In the fireball language, Mirim is the production of Н-quantum of TrT, = 1.3 GeV decaying with temperature KT = 130 MeV into pi-mesons and A;u is the production of SH-quantum of TY6 = 8 GeV with KT = 500 MeV. How, we conclude that those two types, [iirim and A^u, continue to exist up to the still higher energy region of se; veral TeV or more, after analysing the r LZ distribution of all families with £E ? 100 TeV. "
r ed
Fig. 2 shows the lateral distribution of each family with JE К 100 TeV observed 1n chamber n°. 14, divided in two groups. The first (Fig. 2a) consist of families showing г double peak in thei r £E distribution, which are interpreted as having been produce
at different altitudes. The other qroup shower (Fiq. 2c) ,iust one peak, with r./? JE * 4 TeV.m. In the first group we separate the
concentrated core and the diffuse outher part of the families and we construct again the r j£ distribution, that shows now just one peak (Fig. 2b) with r 1 / 2 JE « 0 . 8 TeV m, (now, we interpret the
one peak group as families produced through the decay of a SH-quaji turn, while the two peaks group come from the decay of a SH-quantum in a first interaction and an И-quantum produced in a second interaction in the atmosphere. The r^,g £E for the one peak group
(4 TeV m) gives H • 8 GeVc , and for the two peaks group we have
,, JE -v. 4 TeV m and 0.8 TeV m, corresponding to It ^ 8 GeV/c2
/ t Y о У 1 . -and -И. 3 GeV/c

540
jEY(TeV) ГЦ FIG. г
a)
540 509 210 214 194
65 46 32 21 55
117 35 , ^ &f. JLHU-Ulil-tL—
485 420 203 176 149 91
32 28 16 17 35 29
Л_ы,и_.._ ь)
i. i
JSL. i..L.-_,L_
C)
284 230 171 154 144 .131 111 114 110 107
73 77 47 44 25 46 44 26 24 31
SJ.JW.J
_.rvj_tJ.Jji,_„_1 tJ.tl.il_,
I I.
10 1 10 r yE- Y (TeV.m)
Results of systematic study on larne families in Chacaltaya Emu^ sion Chamber and the relative frequency of different types of interactions will be presented elsewhere. The results will show that there exists another type of family with still larger lateral spread than the previous two, which is supposed to be from a giant fireball of Ccntauro type or else. ACKNOWLEDGEMENT The collaboration experiment is financially supported in part by Consclho Nacional para о Desenvolvimento. CientTficoe Toc-nologico, Fundacao de Amparo a Pesquisa do Hstaclo do Sao Paulo In Urasil, and Cosraic-Ray Institute (Tokyo University) in japan.

541
DETECTION AHD ANALYSIS OP RADIO POISES PROM EAS
K.M.Pathak and S.K.Barfchakur Physics Department, Gauhati University, India.
Theoretical I J Experimental |X | Both I |
Radio pulses from Extensive Air Showers (EAS) at 30,44, and
60 MHz frequencies have been studied, from 1970 tO 1975, at
Gauhati, India, using wide band broad-side arrays of half-wave
dipole antenna systems. The experimental results support the
theoretical prediction that the field strength of radio emission
depends on the shower size. An asymmetry has been noticed in
the X'-.L\I piW.se height distributions of radio pulses detected
by North-South and East-West directed arrays. These observations
are in agreement" with the theory that the charge separation
mechanism is predominant in generating radio pulses from EAS
and radio emission is polarised in the East-West direction. i
lExperimental data are compared with those of earlier workers.
Coordinates: EA 3.6 (Radio emission)
Mailing address: Br. K.M.Pathak, Department of Physics, Gauhati University, Gauhati 78IOI4 Assam, INDIA.

PRINTED IN THE PEOPLE'S REPUBLIC OF BULGARIA
BULGARIAN ACAJDEMY OF SCIENCES 1113 Sofi», AowJ. O. Boochev Str., Block 1