International Research Conference - Chuka University
536
karim CHUKA UNIVERSITY Knowledge is Wealth/Akili ni Mali (Sapientia divitia est) Proceedings of the 3 rd International Research Conference Theme: Harnessing Research, Innovation and Technology to Realise the Sustainable Development Goals 26 th to 28 th October, 2016 Revitalisation of agriculture and food security for sustainable development Enhancement of education and health for sustainable development The role of science, engineering and technology in sustainable development Collaborators The role of arts, humanities and social sciences in sustainable development Harnessing affirmative action and gender equity for sustainable development Conservation of biodiversity, energy and water for sustainable development Chuka University is ISO 9001:2008 Certified Inspiring Environmental Sustainability for Better Life
-
Upload
khangminh22 -
Category
Documents
-
view
0 -
download
0
Transcript of International Research Conference - Chuka University

karim
CHUKA UNIVERSITY
Knowledge is Wealth/Akili ni Mali (Sapientia divitia est)
Proceedings of the 3rd
International Research Conference Theme: Harnessing Research, Innovation and Technology to Realise the Sustainable Development Goals
26th
to 28th
October, 2016
Revitalisation of agriculture and food
security for sustainable development
Enhancement of education and health for
sustainable development
The role of science, engineering and
technology in sustainable development
Collaborators
The role of arts, humanities and social
sciences in sustainable development
Harnessing affirmative action and gender
equity for sustainable development
Conservation of biodiversity, energy and water
for sustainable development
Chuka University is ISO 9001:2008 Certified Inspiring Environmental Sustainability for Better Life


CHUKA UNIVERSITY
Knowledge is Wealth (Sapientia divitia est) Akili ni Mali
Proceedings of the 3rd
Chuka University International
Research Conference held in the Main Campus
from 26th
– 28th
October, 2016
Theme:
“Harnessing Research, Innovation and Technology to
Realise the Sustainable Development Goals”
Published 2017

Proceedings of the Third International Research Conference 26th to 28th October, 2016 ii
CHUKA UNIVERSITY
Knowledge is Wealth/Akili ni Mali (Sapientia divitia est)
CHUKA UNIVERSITY FUNDAMENTAL STATEMENTS
Motto
Knowledge is Wealth/Akili ni Mali (Sapientia divitia est)
Slogan
Inspiring Environmental Sustainability for Better Life
Philosophy
Quality education, training, research, extension, environmental sustainability, and
entrepreneurship lead to social cohesion, human integrity, and economic development
Vision
A Premier University for the provision of quality education, training and research for sustainable
national and global development
Mission
To provide access, generate, preserve and share knowledge for quality, effective and ethical
leadership in higher education, training, research and outreach through nurturing an intellectual
culture that integrates theory with practice, innovation and entrepreneurship.
Corporate Colours Red
Blue
Green
Grey
The Chuka University corporate colours derived from the University’s registered Logo are Red, Blue,
Green and Grey, interspersed with White.
(1) Red: Signifies a torch and symbolises education is the light of the world; provision of higher
education is the core mandate of Chuka University.
(2) Blue: Signifies calming, soothing water and sky associated with heavenly, untouchable powers, and
symbolises honesty, stability and patriotism, which are virtues of Chuka University.
(3) Green: Signifies environmental conservation and renewable energy, designated to describe the
academic character of Chuka University.
Proceedings of the Third International Research Conference 26th to 28th October, 2016 iii
(4) Grey: Signifies fertility of the Mt. Kenya region land and depicts creation of wealth through
utilisation of knowledge – a phrase used to coin the motto of Chuka University.
(5) White: Signifies the snow on the peak of Mt. Kenya and represents integrity and social fairness,
which are some of the core values of Chuka University.
Core Values
(1) Customer Value and Focus: Enhancing customer satisfaction levels by providing
products and services that meet or exceed customer expectations.
(2) Diversity and Social Fairness: Appreciation of varied cultures and commitment to
ensure balanced distribution of resources and opportunities while instituting affirmative
action to cater for marginalised sections of the society.
(3) Environmental Consciousness: Considering the impact of all activities and programmes
to be implemented and taking measures that ensure zero tolerance to environmental
damage.
(4) Fidelity to the Law: Dutiful adherence to the Constitution and other legal, statutory and
regulatory requirements.
(5) Innovation: Creativity in undertaking programmes and activities earmarked to contribute
novel, effective and efficient ways of advancing humanity.
(6) Integrity: Upholding honesty, transparency, accountability and strong moral principles
and values in all decisions and actions taken.
(7) Passion for Excellence: Being outstanding in all services, activities and programmes
undertaken by the University.
(8) Peaceful Co-Existence: Living harmoniously with neighbours and the environment and
promoting the ideals of cohesion, integration and unity.
(9) Professionalism and Confidentiality: Professionalism is the skill, good judgment and
polite behaviour exhibited by an expert when discharging responsibilities and delivering
services, while confidentiality means commitment to not disclose classified information
to unauthorized parties.
(10) Prudent Utilisation of Resources: Utilising resources without wastage and
misappropriation by ensuring maximum value and complying with various planned
arrangements, internal controls and government regulations.
(11) Teamwork: Adopting a participatory and inclusive approach in undertaking operations
and functions of the University.
(12) Timeliness and Devotion to Duty: Timeliness refers to being time-conscious in
undertaking activities, assignments and programmes, while devotion to duty is selfless
commitment to undertake activities, assignments and programmes for the good and
advancement of humanity.

Proceedings of the Third International Research Conference 26th to 28th October, 2016 iv
FOREWORD
Ladies and gentlemen. I welcome you to this International Research Conference which is starting
today. This is the third such Conference to be held in Chuka University in as many years. We
intend to make these Conferences annual so as to provide scholars with an opportunity to
disseminate their research findings, exhibit their innovative ideas and network. Chuka University
is fast becoming a Centre of Excellence in the relentless search of new knowledge through
research. As a University we are focused on the pursuit of continual improvement in service
delivery and the results that we achieve. Our Quality Management System is based on the ISO
9001:2008 Standard, having attained it in 2013 and got recertified this year. By achieving this
Standard, we aim to continue providing improved services to our customers at all times. This
means that the teaching and research done in this University must be of high quality in tandem
with international standards that we have chosen to benchmark with. Some of this University’s
strategic goals lay emphasis on generation and dissemination of research findings, patenting and
commercializing of findings and innovations. In doing this, the University will continue to
strengthen the capacity for Science, Technology and Innovation through development of
appropriate infrastructure, recruitment and support for further training of Science, Technology
and Innovation specialists through forums such as this one.
As an institution of higher learning, Chuka University is expected to play a significant role in the
implementation of the social pillar envisaged in Kenya’s Vision 2030 by providing “globally
competitive quality education, training and research for sustainable development”. To benefit
and solve problems in the society, Chuka University will increase the quantity, quality and
relevance of research output with a view to creating innovations and inventions that will enable
Kenya to effectively transform into a knowledge-based economy. The University will continue
to provide incentives for research and increase the research fund so as to benefit more staff and
students. Furthermore, the University will continue to develop appropriate research
infrastructure, including construction of laboratories, as well as acquisition of modern research
equipment. The University will also transfer knowledge and disseminate research findings to
users through publications. In this regard, I am happy to note that the research proceedings of the
two previous Conference events held here have already been published and circulated.
Ladies and gentlemen, a cursory glance of the programme shows that this Conference focuses on
the broad thematic areas of agriculture and food security, quality education and health, science,
engineering and technology, the arts, humanities and social sciences, gender equity, biodiversity,
energy and water. These are some of the areas that the global Sustainable Development Goals
aim to tackle. They are, therefore, relevant and important priority areas that Kenya as a country
should focus on to address the many challenges that face our nation and humanity.
As part of the international community, our research should focus on areas of social, economic
and environmental importance to Kenya by identifying specific areas and priorities that will
benefit humanity. This requires that we embrace Information Communication Technologies
(ICT) in our endeavours. ICT is critical in the success of any innovation. Innovative systems
require the smooth flow of technology and information among the innovators and all actors in
the innovative process. The interaction between the actors is necessary because the innovator’s
idea has to be turned into a process, a product or a service to the public. Our research can never
be complete if it ignores the social and economic aspects of development. I am happy to note that
a number of papers to be presented in this conference are in these areas. It is a globally accepted
fact that Science, Technology and Innovation (ST&I) is a major driver towards the achievement
of the sustainable development. The research that we conduct should also integrate national and

Proceedings of the Third International Research Conference 26th to 28th October, 2016 v
regional policies on ST&I to achieve the much needed technological and industrial development
of our country in particular and the world at lage.
The main objective of this Conference is to provide innovators, scientists, students, industrialists,
academicians, policy makers, and the general public with a platform to disseminate and share
knowledge. It will also provide an opportunity to Kenyans to harness science, stimulate and
inspire current and potential researchers. The University plays an important role as a reservoir of
knowledge generated through research. This knowledge and industrially relevant technology are
the ingredients with which to build our modern knowledge-based economies. Due to this
recognition, the Government of Kenya has launched some initiatives to link universities to
industrial innovation. Among the three models of academia-industry linkage are: Knowledge
Transfer Partnership (KTP), The Triple Helix Relationship, and Africa Knowledge Transfer
Partnership (AKTP). Kindly embrace them too.
The government can increase productivity by tapping the knowledge, technology and skills
available from institutions of higher learning. Innovations in the Jua Kali Sector can lead to
national development through industrialization by reverse engineering and informal production
systems. This can best be done through the efforts of public private partnerships as witnessed
during this Conference. In this regard, I wish to thank the National Commission for Science,
Technology and Innovation (NaCoSTI), Safaricom, the National Environment Management
Authority (NEMA), the Kenya Wildlife Service (KWS) and the Government of Kenya for
continued financially and material support to this Conference. They have continued to partner
with us by providing the much needed research grants to our researchers. These grants are not in
vain for they support scientific research and technological innovation for national development,
technological advancement and acquisition of education.
Ladies and gentlemen, for the knowledge generated by researchers to be useful, it must be
packaged and published and disseminated to the end users. This is best done through mass media
and through organised extension services. We should, therefore, encourage a bottom-up rather
than a centre-periphery approach or top-down approach in developing our policies and plans.
This is the best way to realize the true benefits of devolution and ownership of discoveries.
Finally, ladies and gentlemen, I wish you a happy stay in Chuka University and fruitful
deliberations at the end of which we expect to churn out a number of innovations. Indeed I have
been challenging my staff that this University must produce a Nobel Prize winner by the year
2026. I believe it is possible and I know it can be done.
With these few remarks, I now declare the Third Chuka University International Research
Conference officially opened.
Thank you all.
Prof. Erastus N. Njoka, Ph.D.
Vice-Chancellor
and
Professor of Animal Science

Proceedings of the Third International Research Conference 26th to 28th October, 2016 vi
PREFACE
Chuka University became the 2nd
Chartered and 9th Full-Fledged Public University in Kenya in 2013. It is
located in Chuka Town in Tharaka-Nithi County at approximately 186 km from Nairobi City along the
Nairobi-Meru Highway. Chuka University has triple core Missions of Education, Research and
Extension. Great strides have been made in delivery of higher education. Impressive strides have been
made in pursuit of research and delivery of extension services in the region. The University desires to
strengthen and sustain these noble strides by hosting the 3rd
International Research Conference. The
theme of this Conference was Harnessing Research, Innovation and Technology to Realise the
Sustainable Development Goals. The subthemes were:
Revitalisation of agriculture and food security for sustainable development
Enhancement of quality education and health for sustainable development
The role of science, engineering and technology in sustainable development
The role of arts, humanities and social sciences in sustainable development
Harnessing affirmative action and gender equity for sustainable development
Conservation of biodiversity, energy and water for sustainable development
The objectives of the Conference are:
To disseminate and share current knowledge, innovations and technologies to spur sustainable
development.
To bring students, researchers, scholars, professionals and policy makers together to interact and
network.
To facilitate interested parties and stakeholders to acquire and exhibit the new knowledge,
technologies and capacities.
To provide a forum for students, researchers and industrialists to commercialise their creations and
innovations.
The theme is anchored on the 17 Sustainable Development Goals (SDGs) that the UN member states will
be expected to use to frame their agendas and political policies until 2030. The SDGs offer good coverage
and balance of socially, economically and environmentally sustainable development. Research,
Innovation and Technology (RIT) play important roles in sustainable development by facilitating
formulation of evidence-based ideas, targets and indicators, and assessing progress, testing solutions and
identifying emerging risks and opportunities. The SDGs framework contains a number of conceptual as
well as implementation challenges that require enhancing collaboration among scientific communities,
policy makers and other collaborators to overcome. This Conference has been coined to exemplify the
roles RIT can play in the realisation of Sustainable Development.
Ultimately, we have received nearly 150 abstracts to be deliberated during this Conference. Thus the
Conference promises to be educative, enriching, informative, inspiring and memorable. Sincere
gratitude goes to all scholars, researchers, authors and stakeholders who have provided their
knowledge for sharing. The organisers are grateful to the Vice-Chancellor, Prof. Erastus Njoka, for
being at the forefront of championing these kinds of forums and for availing the bulk of the funding
for the Conference. Similarly, we acknowledge our esteemed sponsors for subsidizing the
Conference’s financial support. We sincerely wish all delegates lively interaction and enjoyable visit
here with us and look forward to welcoming them again next year.
Arising form the Conference are these Proceedings of which we hope will go along way in
transferring and disseminating the knowledge that was shared during the plenary sessions. I wish you
informative reading that will culminate in their application to develop our country and the world.
Professor Dorcas K. Isutsa, Ph.D.
Deputy Vice-Chancellor (Academic, Research & Student Affairs)
and
Professor of Horticulture

vii
DISCLAIMER
Views and opinions expressed herein are those of contributing authors and not necessarily those
of the publisher, Chuka University. Only papers that were orally presented, consented by
authors, and had met overview criteria were published in these proceedings. The publisher
reserves the right to typeset the papers to meet the proceedings layout.
ACKNOWLEDGEMENTS
We acknowledge the monetary support from the Kenyan Government; the National Commission
for Science, Technology and Innovation (NACOSTI) and National Environment Management
Authority (NEMA). The Chief Guest Professor Geoffrey Wahungu, Director General, National
Environment Management Authority (NEMA) for official opening; the Chairman of the Chuka
University Council for gracing the occasion and participating in the Conference, the Members of
the Board of Research, Extension and Publication for Organising the Conference; the
participants for attending; and the Chuka University Management and Staff for financial and
logistical support.
ORGANISERS
Prof. Dorcas K. Isutsa - DVC (Academic, Research and Student Affairs)
Prof. Zachary M. Getenga - Director (Research and Extension)
Prof. George M. Muthaa - Director (Graduate School)
Dr. Lemmy M. Muriuki - Faculty of Agriculture and Environmental Studies
Dr. Christine Atieno Peter - Faculty of Arts and Humanities
Mr. Joseph Masinde - Faculty of Business Studies
Dr. Mercy Wanja Njagi - Faculty of Education and Resources Development
Dr. Eunice W. Githae - Faculty of Science, Engineering and Technology
Dr. Ombaka Ochieng - Senate Representative
Dr. Geofrey K. Gathungu - Senate Representative
Mr. Jotham Ainea Akhaya - Administrative Assistant, DREP
Ms. Ileen Chebet Chesire - Senior Clerk, DREP
PUBLISHED BY:
Chuka University, Division of Academic, Research and Student Affairs, P. O. Box 109-60400,
Chuka, Kenya, Email: [email protected], Website: www.chuka.ac.ke
© Chuka University, 2017
“No part of these Proceedings may be reproduced or transmitted in any form by any means,
electronic or mechanical, including photocopying, recording, storage or retrieval in device for
commercial purposes without the permission in writing from Chuka University.”
Citation: Author (s) 2017. Title. In: Isutsa, D.K. and Githae, E.W. 2017. Proceedings of the Third
Chuka University International Research Conference held in Chuka University, Chuka, Kenya
from 26th
to 28th
October, 2016. 530 pp.

viii
CONTENTS COVER PAGE……………………………………………………………………………………………… ........ i
CHUKA UNIVERSITY FUNDAMENTAL STATEMENTS…………………………………………… ....... ii
FOREWORD……………………………………………………………………………………… .................... iv
PREFACE ........................................................................................................................................................... vii
DISCLAIMER .................................................................................................................................................... vii
CONTENTS ..................................................................................................................................................... viiiii
REVITALISATION OF AGRICULTURE AND FOOD SECURITY FOR SUSTAINABLE
DEVELOPMENT
Moderating Effect of Operating Environment on the Relationship Between Branding Practices of Fresh
Fruits and Vegetables and Performance of Commercial Farmers ................................................................... 1 Nkari, I.M.
A Sustainable Financing Model Amongst Banks for Agribusiness Infrastructural Projects in Kenya ...... 10 Musuya, D., Matete, J.S., Kamau, and Fwamba, R.
Factors Affecting Access to Extension Service Among Cashew Nut Farmers in Kilifi County, Kenya ...... 13 Koech, R. and Karani, C.G.
Adaptability of Cowpea (Vigna unguiculata) Lines in Kenya Coastal Region .............................................. 16 Weru, S.M. Owuoche, J.O. and Kiplagat, O.
Reinventing Conservation Agriculture Practices Beyond 21st Century ......................................................... 27
Michura, E.G.
Nutritive Value of Wheat and Pumpkin Flour Blended Products ................................................................. 39 Kiharason, J.W., Isutsa, D.K. and Ngoda, P.N.
Evaluation of Released Maize Hybrids to Hasten Their Commercialization in Coastal Lowland Kenya .. 48 Muli, M.B., Karanja, J., Makumbi, D. and Beyene, Y.
Endogenous Chlorogenic Acid and Caffeine Associated With in Vitro Somatic Embryogenesis of Coffee
(Coffea arabica L.) .............................................................................................................................................. 53 Mayoli, R.N., Lubabali, A.H, Isutsa, D.K., Nyende, A.B, Mweu, C.M. Njoroge, E.K.
Evaluation of Sensory Acceptability of Baked Products of Blended Pumpkin Fruit And Wheat Flours ... 61 Kiharason, J.W.
1, Isutsa, D.K.
1 and Ngoda, P.N.
2
Effects of Natural Licks on Feed Intake, Nutrient Digestibility, Milk Production and Quality in Kenya Alpine
Dairy Goat Ration .............................................................................................................................................. 70 Nderi, O.M., Musalia, L.M. and Ombaka, O.
Effect of Replacing Fish Meal with Blood Meal on Chemical Composition of Supplement for Nile Tilapia
(Oreochromis niloticus) ..................................................................................................................................... 778 Kirimi, J.G, Musalia, L.M.
and Munguti, J.M.
Performance of Nile tilapia (Oreochromis niloticus) Fed diets containing blood meal as a replacement of fish
meal ...................................................................................................................................................................... 85 Kirimi, J.G., Musalia, L.M. Magana, A. and Munguti, J.M.
CONSERVATION OF BIODIVERSITY, ENERGY & WATER FOR SUSTAINABLE DEVELOPMENT
Mapping Environmental Health Injustice for Sustainable Urban Ecologies Using GIS Based Techniques94 Kibetu, D.K and Mwangi, J.M................................................................................................................................94
Socio-Economic Impacts of Invasive Alien Plant Species of Cactus (Opuntia stricta) in Ewaso Nyiro Area in
Narok County, Kenya ....................................................................................................................................... 100 Githae, E.W and Magana, A.M
The Solar Photovoltaic Facilities “Lake Effects”: An Environmental Hazard of Avian Species .............. 107

ix
Michura, E.G
Spatial-Temporal Changes in Land Use Land Cover and Impacts on Wildlife Conservation in Meru
Conservation Area………………………………………………………………………………………….. 117
Kiria M. E., Magana A. and Njue C.
Tips on Technology Commercialization and Leveraging of Intellectual Property Rights: An Eye Opener for
University Academia ........................................................................................................................................ 123 Isutsa, D.K and Amin, F.M.
ROLE OF SCIENCE, ENGINEERING AND TECHNOLOGY IN SUSTAINABLE DEVELOPMENT
2-D Inversion Of Gravity Data of Nyabisawa-Bugumbe Area of Migori Greenstone Belt, Kenya ........... 130
Information Seeking Behaviour of Computer Science Students in Kenya: Case of Chuka University .... 138 Tuei, N. and Kiruki, J.
Modeling Hiv/Aids Co Infection with Malaria and Tuberculosis: The Role of Treatment and Counseling143 Okongo, M.K., George, L, Musundi, S. and Magana, A.M.
Ultra-Low Noise Fibre Optic Sensor for Low Limit Of Detection in Aqueous Medium… ........................ 156 Kirwa, A.T.,
Williams, N.H. and Grell, M.
Coderepo: A Local Online Repository for Source Codes and Computing Research Projects ................... 161 Tuei, K.K.
Gerontechnology: Remote Patient Monitoring .............................................................................................. 165 Ndung’u, I. and Murerwa, E.G.
Morphological Characterization of Hypoxylon Wood Rot Fungus in Kenyan Tea .................................... 172 Langat, J.K., Ramkat R.C. and Muoki, R.C.
Algal Diversity and Distribution in the Esp Fish Ponds in Tharaka-Nithi County .................................... 179 Kibaara, D.I., Magana, A., Ochieng, O. and Githae, E.W.
ENHANCEMENT OF QUALITY EDUCATION AND HEALTH FOR SUSTAINABLE DEVELOPMENT
The Relevance of Education Expansion to Development in Kenya .............................................................. 184 Ngunjiri, J.N.
Interpersonal Adaptation on Academic Achievement Among Boys and Girls Students in Boarding Secondary
Schools in Meru County, Kenya ...................................................................................................................... 193 Nyaga, V.K. and Murithi, G.G.
Philosophical Foundations of Kiswahili Composition Writing ..................................................................... 199 Njagi, Z
and Odundo, P.A
The Interface Between Cooperative Education and Sustainable Learning: Lessons from Best University
Practices............................................................................................................................................................. 206 Wandera, M.
Effect of Computer Assisted Teaching Strategy on Studetns’ Achievesment in Agriculture in Secondary
Schools in Kenya ............................................................................................................................................... 215 Muchiri, J.M., Barchok, H.K. and Kathuri N.J.
The Double Edged Role of Indigenous Languages in National Development: A Case of the Lower Primary
Classroom in Kenyan Schools.......................................................................................................................... 221 Njeri, B., Rutere, A.M. and Yieke, F.
Psychosocioeconomic Challenges of Student Motherhood and Coping Mechanisms: A Multiple Case Study of
two Student Mothers in Kenyan Universities ................................................................................................. 229 Oundo, M.B. and Murithi, G.G

x
Linking Inclusive Education with Sustainable Development Goals and Transformation of Lives: A Case of
Kakamega County Kenya ................................................................................................................................ 235 Nanyama, E.M., Bota, K.N. and Aurah. C
Implementation Status of Kenya’s Language in Education Policy: A Case Study of Selected Primary Schools
in Chuka Division, Meru South District, Kenya ............................................................................................ 240 Mbaka, N.W.
1*, Peter, C.A.
2 and Karuri, M.
3
Enhancement of Quality Education and Health for Sustainable Development .......................................... 247 Kaniaru, S.K., Njiru, L.M. and Thinguri, R.W.
Traditional Herbs Used to Cure Meningitis and Sustainable Health Among the Abagusii ....................... 253 Okebiro, G.N., Nyakundi, I.N. and Nyakundi, E.G
Relationship Between Teachers’ Teaching Method Efficacy in Hiv/Aids Education and Students’ Knowledge
and Attitude Towards Sexual Behaviour in Secondary Schools in Coast Region, Kenya .......................... 255 Thuo, D.N., Nyaga, V.K., Bururia, D.N and Barchok, H.K.
Perceptions of Catholic Church on Tetanus Vaccine to Women in Kenya ................................................. 262 Rufo, B.M.
Cannibalization of Vacational and Technical Education Through Career Counselling at Secondary School
Level ................................................................................................................................................................... 267 Muriu, S.M. and Gichuhi, D.
Influence of Religious Education Teaching on Character Development Among Students in Secondary
Schools: A Case Study of Kirinyaga County, Kenya. .................................................................................... 277 Mune, C.W.
Educational Implication of ‘Sheng’ in The Learning of Kiswahili Among Secondary Schools Students in
Kenya: A Case Study of Kirinyaga County .................................................................................................... 285 Mune, C.W.
Critical Analysis on How Teacher-Related Factors Affect Application of Progressivisms’ Learner-Centered
Approaches in Teaching and Learning of Mathematics: A Case of Meru South Sub-County, Tharaka Nithi
County, Kenya. ................................................................................................................................................. 292 Mwangi, S.N.
ROLE OF ARTS, HUMANITIES AND SOCIAL SCIENCES IN SUSTAINABLE DEVELOPMENT
Drama and Orality in Kenya’s Radio Advertising ........................................................................................ 303 Njogu, J.G.
Conceptual Metaphors in Ken Walibora’s Novel: “Kidagaa Kimemwozea”.............................................. 313 Ntabo, V.O. and Kangangi, B.
This is Me: The Kenyan Political Autobiography as a Quest for Salvaging the Self .................................. 321 Mutie, S., Rutere, A.M. and Goro, N.K.
Consonant Substitution in Gichuka Loanwords ............................................................................................ 327 Mbaka, N., Muriungi, P.K. and Muriungi, C.K.
The Family Government and Sustainable Family Systems on Christian Principles for Sustainable
Development ...................................................................................................................................................... 337 Okebiro,G.N., Shatora, E., Nyakeya, I., Gesare, E., Okebiro, H., Mogere, C., Mouko, P. and Kerubo, A.
Utilization of Proverbial Wisdom in Devil on the Cross ................................................................................ 345 Mugo, J.W., Rutere, A.M. and Telewa, V.K.
Strategies Used for Persuasion in Kimuthambi ............................................................................................. 356 Ireri, H.K., Muriungi, P.K., Waita, Z.N. And Muriungi, C.K.

xi
A Linguistic-Stylistics Analysis of Francis Imbuga’s Betrayal In The City .................................................. 370 Miriti, E.K., Gathigia, M.G., Munene, G.W. and Gicuku, M.W.
Locating Sustainable Development In Africa: Discourses on Ekegusii and Lubukusu Proverbs in Kenya379 Opande, N.I. and Barasa, M.
Classroom Discourse in a Multilingual Context: The Case of Selected Primary Schools in Chuka Division,
Tharaka-Nithi County, Kenya ......................................................................................................................... 385 Mbaka, N.W.
Understanding History for Human Development .......................................................................................... 394 Kavulavu, L.
Psychosocial Challenges to Sustainable Development in Embu, Tharaka-Nithi and Meru Counties:
Psychosocial Issues Reported Between June 2015 and June 2016 ................................................................ 397 Manono, G. and Mwiti, K.
Social Media for Sustainable Development: A Framework for Success in County Governance ............... 408 Otieno, C.O.
A Cognitive Blending Analysis of Idioms in NTV’s Segment: “Bull’s Eye” ................................................ 418 Ogal, G.O. and Karuri, T.M.
A History of Social Exclusion and Poverty of the Thagichu of Igembe Sub-County, Meru County, Kenya,
from 1907 To 1962 ............................................................................................................................................ 426 Kithinji, C.M.
Hate Speech in the Creation of Socio-Political Dominance in Kenyan Parliamentary Debates ................ 440 Peter, C.A., Muriungi, P.K. and Mukuthuria, M.
Influence of Indigenous Peace Building Strategy in the Management of Interethnic Conflicts for Sustainable
Development in Bungoma County, Kenya...................................................................................................... 455 Chebai, J.M.
Proliferation of New Christian Religious Movements in Meru Town ......................................................... 462 Mwongera, P. K., Nkonge, D., and Bururia, D
Analyses of Kimeru Word Formation Processes in Three Fraternity Groups in Meru Speech Community474 Mikwa J.K.
HARNESSING AFFIRMATIVE ACTION AND GENDER EQUITY FOR SUSTAINABLE
DEVELOPMENT
Effects of Female Genital Mutilation on the Girl Child’s Social Life Among the Ameru Community of Kenya
............................................................................................................................................................................ 481 Kinyua, S.M
Kenya’s Proverb in Lubukusu and Ekegusii Languages: Empowering or Disempowering for Women and
Girls ................................................................................................................................................................... 489 Barasa, M.N. and Opande, I.N.
Effects of Imprisonment on Interpersonal Relationships Among Female Inmates in Selected Prisons in Kenya
............................................................................................................................................................................ 501 Kamoyo, J.M. and Mburugu, B
The Role of Women Retirees in Rural Development in Kenya .................................................................... 505 Waweru, I.W. and Njugiri, J.N.
Enhancing Gender Equality as an Affirmative Action for Sustainable Development ................................ 512 Gichohi, H.M.F.
Journal of Environmental Sustainability Advancement Research………………………….. 520

Proceedings of the Third International Research Conference 26th to 28th October, 2016 1
REVITALISATION OF AGRICULTURE AND FOOD SECURITY FOR SUSTAINABLE
DEVELOPMENT
MODERATING EFFECT OF OPERATING ENVIRONMENT ON THE RELATIONSHIP
BETWEEN BRANDING PRACTICES OF FRESH FRUITS AND VEGETABLES AND
PERFORMANCE OF COMMERCIAL FARMERS
Nkari, I.M.
Department of Business Studies, Chuka University, P. O. Box 109-60400, Chuka, Kenya, Tel.: +254722978836.
P. O. Box 64687-00620, Nairobi, Kenya. Email: [email protected]
ABSTRACT
The objective of this study was to establish the moderating effect of operating environment on the
relationship between branding practices of fresh fruits and vegetables and performance of commercial
farmers in Kiambu County, Kenya. The population of the study consisted of 213 farmers from whom a
sample of 140 farmers was drawn. A descriptive cross sectional survey design was used. Data was
collected using a semi structured questionnaire and analyzed using both descriptive and inferential
statistics. The study found that operating environment did not have a statistically significant moderating
effect on the relationship between branding practices and performance of commercial farmers. The study
was limited by the narrow scope which focused on few constructs and elements within the variables; self-
reported data with no collaborative evidence, gathering of cross sectional data and a localized population.
The study recommends that farmers should enhance their abilities and engage in value addition initiative
such as branding practices irrespective of the operating environment to improve their performance. To
increase objectivity and the level of generalization of the findings, future research should target other
fresh agricultural products; increase the variables and constructs being investigated, target other counties
with differing social economic and climatic conditions and adopt a time series design to gather continuous
data on study variables throughout the product’s life cycle.
Keywords: Operating Environment, Fresh Fruits and Vegetables, Value addition
INTRODUCTION
Aaker (2003) notes that there is continued fragmentation of mass markets which creates multiple
consumer offerings that require continuous identity clarification and modification. Consequently,
suppliers engage in various branding practices (BP) by utilizing different brand elements to differentiate
their products from competition (Kotler and Keller, 2009). Among the BP is the development of brand
elements designed to differentiate and create a clear visual identity for the products. Another category of
BP consists of activities that communicate brand offerings to target customers. According to Kotler and
Keller (2009) marketing communications represent the voice of the brand and assists a brand establish
dialogue and build relationships with consumers. The communication elements include advertising, sales
promotions, public relations, direct marketing and personal selling. The choice of any specific
communication element will depend on the target communication objective. The third BP involves
deciding on the nature of branding elements to be applied to new and existing products. This branding
option is referred to by Kotler and Keller (2009) as branding strategies and is geared towards classifying
the brands. Hedin et al. (2009) have identified the possible classifications to include generic, family,
individual, transnational, local, fighter, producer or private/retailer brands. The products can further adopt
descriptive, associative or alpha-numeric brand names.
Even though creating a successful brand is a difficult undertaking, it is even more difficult for fresh fruits
and vegetables (FFV) which as noted by Cook (2013) lack year round supply of quality products and also
require specialized handling due to their perishability. Similar to other firms, the micro-environmental
forces that influence the performance of commercial farmers will include customers, competitors,
suppliers and intermediaries (Kotler and Keller, 2009). Fresh fruits and vegetable consumers working in
urban areas attach increased importance to FFV in their diets due to increased level of consciousness on
personal health (Stanton and Herbst, 2005). These consumers prefer FFV over canned or frozen
alternatives (Clarke and Moran, 1996). Narrod et al. (2007) reported increased demand on food safety for
the export market necessitating small scale FFV farmers to either be sub-contracted by large farmers or
form groups under government and NGOs support.

Proceedings of the Third International Research Conference 26th to 28th October, 2016 2
The macro-environmental factors that have been identified to significantly affect performance of
commercial famers include differences in agro ecological zones; improved transport and storage facilities
(Clarke and Moran, 1996); development of rural fully equipped assembly points for the products;
increased competition, improved technology (Bremmer et al., 2002) and increased importance of
supermarkets as outlets for FFV (Neven and Reardon, 2006).
The concept of firm performance relates to the manner in which a firm’s resources are used to achieve its
overall objectives. Kinyua-Njuguna (2013) presents it as the actual output of an organization measured
against its intended outputs. Branding practices are demanding in terms of time, efforts and financial
resources. Both financial and non financial parameters are used to measure firm performance arising from
branding practices. Product output, price premium, profitability and satisfaction were the performance
measures adopted for this study since as established by Ailawadi et al. (2002), they are easy to assign and
are consistent with the focus of business executives.
This study was conducted in Kiambu County, Kenya. The county consists of 12 subcounties and has a
wide agro-ecological zone ranging from the cold climate of the upper highlands of Limuru and Lari to the
relatively dry and warm climate of the lower parts of Ruiru, Thika and Gatundu enabling the County to
produce tropical FFV such as bananas and mangoes as well as temperate ones such as peaches and plums.
Horticulture is widely practiced in the county in both small scale units and large farms. The County is
served by a network of all weather roads which facilitates delivery of FFV to the market. There is high
competition for the small land plots (averaging 0.36 Ha) between agriculture and housing estates. This
makes the farming of FFV most appropriate since they are labour and management intensive per crop and
have short maturing period allowing for two or more crops per year (Government of Kenya, 2012). The
county borders Nairobi City County and houses Thika, Kiambu, Kikuyu, Limuru and Juja towns which
provide a ready market for its FFV (County Government of Kiambu, 2012).
Statement of the Problem
Horticulture plays an important role in the economy of Kiambu County. In 2010, fresh fruits and
vegetables farming in the County covered 26,407 hectares equivalent to three percent of total area under
fresh fruits and vegetables in Kenya. Fresh fruits and vegetables earned the County Kshs 12.92 billion
equivalent to 5.7 percent of the crops’ total earnings in Kenya (Republic of Kenya, 2011). To achieve the
aspired increase in productivity, commercialization and competitiveness of agricultural commodities, the
strategy adopted by the government entails engaging value addition activities as product processing,
branding, quality certification and farm level quality improvements (Government of Kenya, 2012). The
effectiveness of these practices in creating unique offerings is influenced by environmental factors,
including weather, political and economic conditions as well as competitor and consumer characteristics.
Various shortcomings were noted in the reviewed studies which rendered them inadequate in establishing
whether there was a significant moderating effect of the operating environment in the relationship
between branding practices for fresh fruits and vegetables and performance of commercial farmers. The
study in Malaysia by Azizi et al. (2008) on export of furniture indicated that product certification
positively moderates the relationship between product adaptation, distribution strategy and design strategy
on export performance. The study further found that global economic situations had no moderation effect
on the relationship between export marketing strategies and export performance. However, this study had
a very low response rate at 31.16% and did not address branding practices. A study undertaken in China
by Lim et al. (2015) to examine the moderating effects of external and internal environmental orientation
on the relationship between eco-innovativeness and business performance established that the impact of
eco-innovativeness on business performance was positively moderated by both external and internal
environmental orientations. This study was not sector specific nor did it specify performance measures
used. In their study, Loniall and Raju (2001) found that environmental uncertainty was an important
moderator of the relationship between market orientation and organizational performance in the hospital
industry in 5 states of USA. This study dealt with the service industry while the current study focuses on
the agricultural sector.

Proceedings of the Third International Research Conference 26th to 28th October, 2016 3
All the reviewed studies did not cover the variables in the current study namely branding practices for
fresh fruits and vegetables, performance of commercial farmers and operating environment and were not
sector and performance measure specific. All these studies were conducted outside Kenya under different
social economic and regulatory conditions and are therefore location variant. To bridge the identified
gaps, the current study simultaneously considered three variables namely: branding practices for fresh
fruits and vegetables, operating environment and performance of commercial farmers. It addressed the
following research question: what is the moderating effect of operating environment on the relationship
between branding practices for fresh fruits and vegetables and performance of commercial farmers? The
specific objective was to examine the influence of operating environment on the relationship between
branding practices for fresh fruits and vegetables and performance of commercial farmers. The
hypothesized relationship stated that:
H1: The relationship between branding practices for fresh fruits and vegetables and performance of
commercial farmers is significantly moderated by operating environment
REVIEW OF LITERATURE
According to Peace and Robinson (2011), technological, economic, political, natural and demographic
environments affect branding practices (BP) and productivity. Adopting modern technology can improve
BP while the natural environment will facilitate BP due to differences in product attributes arising from
their GPO. Legal requirements and powerful buyers influence branding practices by putting demands on
product packaging and identification. Demographic characteristics lead to different consumer categories
which provide the basis for branding strategies while the economic environment influence branding
practices and performance due to effects on farmers’ financial strength and cost of goods and operations.
Poulton et al. (2008) identify the critical factors of an enabling environment for commercial agriculture to
include security, macroeconomic stability, protection of private property, provision of infrastructure and
extension services, supply of inputs and predictability of government policies. A favorable operating
environment facilitates effective branding practices which results in improved performance by the farmer.
Both internal and external environmental orientations were found to have a moderating impact on
business performance.
Various other studies have been conducted in regard to the moderating effect of operating environment on
different business relationships. Chan et al. (2015) established that eco-innovativeness provides the
stimulating phenomenon for firms to engage in innovative activities that enhance business performance.
Using survey data from 83 eco-entrepreneurial firms, the survey found that the impact of eco-
innovativeness on business performance was positively moderated by both external and internal
environmental orientation.
In their study on the moderating effects of business environment in the relationship between competitive
advantage strategies used by construction organisations and improved corporate performance, Oyewobi et
al. (2013) established that dimensions of business environment have moderating effects on organisational
strategies and performance. As concerns the moderating effect of environmental conditions on the
relationship between leadership style and performance of new ventures, Ensley et al. (2006) concluded
that environmental dynamism has a significant positive moderating effect on the relationship between
transformational leadership and performance of new ventures, and a significant negative moderating
effect on the relationship between transactional leadership and new venture performance.
Azizi et al. (2008) in their study on export of Malaysian furniture concluded that the global economic
environmental conditions did not have a moderating influence on the relationship between export
marketing strategies and export performance. The level of uncertainty in a marketing environment was
found to have a direct moderating influence on the relationship between market orientation and
performance. In their study, Loniall and Raju (2001) established that the relationship between market
orientation and performance is much stronger for hospitals in high uncertainty environments. On the other
hand, external environment was found not to have significant influence on the relationship between
technology strategy and performance. In a study to investigate the relationships among technology

Proceedings of the Third International Research Conference 26th to 28th October, 2016 4
strategy, external environment and firm performance in china, Man et al. (nd.) found a weak moderating
effect of environmental factors on the relationship between technology strategies and firm performance.
METHODOLOGY
To establish the moderating effect of operating environment on the relationship between branding
practices and performance of commercial farmers, a descriptive cross sectional survey design was
adopted. This design facilitates in establishing and describing the relationships among the key study
variables (Kothari, 2004). It was cross sectional since it was conducted once to pick the parameters of a
phenomenon at a specific time with an aim of accurately capturing the characteristics of the population
relating to what, where, how and when of a research topic (Cooper and Schindler, 2003).
The population of study consisted of 213 commercial farmers of FFV in Kiambu County. The population
consisted of individual farmers (male and female), women groups, resident groups, cooperatives, limited
liability companies and government departments growing between one and three crops in farms ranging
between 5.5 to 0.125 acres. They engaged in farming activities to generate income. This study adopted
stratified random sampling which allowed for making of probability based confidence estimates of
various parameters (Cooper and Schindler, 2003). The key target was the owners or managers of
commercial FFV farms. From the target population, the farmers were stratified into seven sub-counties
and a proportionate sample drawn relative to the size of each. To determine the sample size, a formula
proposed by Israel (2009) was applied as follows:
Where n is sample size, N is the population size, and e is the error term (0.05). Using
N = 213 in the formula, the resulting sample size (n) is 140 farmers.
The data was collected using a semi structured questionnaire through the direct interrogation method
(Cooper and Schindler, 2003). The questionnaire was administered directly to the respondents through the
assistance of Agricultural Extension Officers (AEO) who were recruited as research assistants due to their
close association with the farmers. The AEO offer technical advice and other related services to the
farmers in their normal day to day activities.
The study variables were operationalised and measured using direct measures and 4 point rating scales
ranging from 1=Not important to 4=Very important; 1=Not strong to 4=Very strong; 1=Not at all to
4=Great extent. Data was analyzed using both descriptive statistics (frequencies, percentages, mean and
standard deviation) and inferential statistics (chi square, linear regression and correlation analysis).
Stepwise regression analyses were used to bring out the individual effects in the form: Y1= a0+b1X1+e1;
for effect of BP on performance of commercial farmers.
Data Analysis Methods and Interpretation of Results
To determine whether the stated objective (to assess the moderating effect of operating environment on
the relationship between BP for FFV and performance of commercial farmers) was achieved and the
hypothesized relationship (H1: The relationship between BP for FFV and performance of commercial
farmers is significantly moderated by operating environment) existed, the following analytical model was
adopted for this study:
Multiple linear regression model: Performance of commercial farmers = f (branding practices of FFV and
the operating environment): Y1 = a0+a1BP+a2OE i.e.: Y1=f (BP+OE); where:
Y1 = composite index for performance of commercial farmers; a0 = intersect constant
a1, a2 = regression coefficients:
BP = composite score of branding practices and
OE = composite score of operating environment.
ANALYSIS AND PRESENTATION OF EMPIRICAL RESULTS
The data used for this research was corrected from 140 farmers spread across seven sub-counties in
Kiambu County. The 140 questionnaires were successfully filled and found suitable for further analysis

Proceedings of the Third International Research Conference 26th to 28th October, 2016 5
resulting in a response rate of 100%. This compared favourably with a similar study conducted among
farmers by Bremmer et al. (2002) which had a response rate of 86.5%.
Reliability and Validity
The study sought to establish the reliability of the research instrument by computing the Cronbach’s
Alpha coefficient in regard to the elements in the study variables. The Cronbach’s Alpha reliability
coefficients indicated reliability level of the instrument at 0.7364. The level was above the acceptable
minimum value of 0.50 (Cronbach, 1951) and above the recommended value of 0.7 (Nunnally and
Bernstein, 1994). The internal consistency of the measures used was therefore considered to have
adequately measured the relevant study variables.
Descriptive Statistics
Summary on branding practices
Branding practice undertaken by farmers included brand identification practices, brand name selection
practices, and brand promotion activities. Table 1 contains a summary of performance indicators of the
activities undertaken by the farmers in furtherance of branding practices. The branding practices summary
data in Table 1 (mean score=1.99, CV=30.75) show that branding as a marketing practice had low
adoption among the respondent farmers. Brand name selection strategies (mean score=3.05, CV=15.87)
were the most common branding practices the respondents engaged in. Making decisions on brand
identification (mean score=1.14, CV=42.19) was the least adopted among the branding practices.
Table 1: Summary of branding practices
Branding Practices N Mean Score Standard Dev. CV (%)
Brand name selection strategies 9 2.48 1.350 54.44
Use of support agencies 8 1.42 0.727 51.20
Brand promotion activities 140 1.77 0.631 35.65
Overall average score - 1.99 0.612 30.75
Source: Primary data.
Summary on environmental factors
Factors of the operating environment found to influence the performance of commercial farmers were
product attributes, climatic conditions, customer categories and competition. The extent to which each
individual factor influenced performance is summarized in Table 2.
Table 2: Summary on effects of environmental factors
Environmental Factors N Grand Mean Score Standard Dev. CV (%)
Product Attribute 140 2.46 0.621 48.05
Climatic Conditions 138 3.06 0.917 30.02
Customer Categories 140 1.88 1.087 56.84
Competition 138 2.14 1.084 50.71
Overall Average Score - 2.39 0.927 38.79
Source: Primary data.
The overall average effect of environmental factors on performance of commercial farmers is summarized
in Table 2. Climatic conditions which had the highest mean score and the lowest CV (mean score = 3.06,
CV = 30.02) had the greatest influence on performance of commercial farmers. The second most
important factor was product attributes (mean score = 2.46, CV = 48.05) while customer categories (mean
score = 1.88, CV = 56.84) had the least influence on performance.
Summary on performance of commercial farmers
The constructs used to describe performance of commercial farmers were price, volume, profitability and
satisfaction achieved by the respondent farmers. Table 3 contains a summary of the individual indicators
of the achieved performance.

Proceedings of the Third International Research Conference 26th to 28th October, 2016 6
Table 3: Summary on performance of commercial farmers
Overall summary of Performance
of Farmers N Mean score Standard Deviation CV (%)
Price premium 99 1.25 0.493 39.41
Sales Volume 126 1.59 1.089 68.62
Profitability 124 1.51 0.917 60.68
Satisfaction 140 2.72 0.619 22.77
Overall Average Score - 1.77 0.780 44.11
Source: Primary data.
The summary results in Table 3 show low overall average levels of the applied performance constructs of
commercial farmers (mean score=1.90, CV=40.23). Farmer satisfaction had the highest mean score (mean
score=2.72, CV=22.77) implying that on average, the farmers were satisfied with their undertakings.
Price premium had the lowest mean score (mean score=1.25, CV=39.41) which indicated that the farmers
were not earning the piece premiums they expected. Moderating effect of Operating Environment on the
Relationship between Branding Practices and Performance of Commercial Farmers. To assess the
moderating effect of operating environment on the relationship between branding practices and
performance of commercial farmers, the following hypothesis was set: H1: The relationship between
branding practices for fresh fruits and vegetables and performance of commercial farmers is significantly
moderated by operating environment.
The moderating effect of operating environment on the relationship between branding practices and
performance of commercial farmers was evaluated by first testing the main effect of branding practices
and operating environment on performance of commercial farmers and the interaction between branding
practices and operating environment. An increase in R2 and a statistically significant interaction between
branding practices and operating environment would suggest that a moderating effect of operating
environment on the relationship between branding practices and performance of commercial farmers
could be supported. Table 4 presents the moderating results.
Table 4: Regression results of the moderating effect of operating environment
(A) Goodness-of-fit
Model R R2
Adjusted
R2
Std. Error
of Estimate
Change Statistics
R2 Change F Change df 1 df 2 Sig. F
1 0.397a
0.409a
0.158
0.167
0.152
0.155
0.70328
0.70182
0.158
0.167
13.761 1
2
0.138
0.137
0.000
0.000
a. Predictors: (Constant), Branding practices
b. Predictors: (Constant), Operating environment, Branding practices
(B) Overall significance
Model Sum of Squares df Mean Square F Sig.
1 Regression 13.556 2 6.778 13.761 0.000a
Residual 67.480 137 0.493
Total 81.036 139
a. Predictors: (Constant), Operating environment, Branding practices
b. Dependent Variable: Performance of commercial farmers
(C) The composite score test
Model
Unstandardized coefficients Std coefficients
t Sig. B Std. Error Beta
1 (Constant) 0.482 0.495 0.974 0.332
Branding practices 0.523 0.109 0.380 4.803 0.000
Operating environment 0.266 0.212 0.099 1.254 0.212
a. Dependent Variable: Performance of commercial farmers
Source: Primary data.
Proceedings of the Third International Research Conference 26th to 28th October, 2016 7
Results presented in Table 4A indicate a significant change in the percentage of variation explained by the
interaction of operating environment and branding practices. The regression results presented in Table 4A
show a change in R2 when interaction of farmer characteristics and branding practices was introduced
(0.158, 0.167). Results in Table 4C suggest that the variation in the relationship between branding
practices and performance of commercial farmers on the introduction of operating environment (beta=
0.380, 0.099; P-value=0.000, 0.212) was not statistically significant. Therefore, we reject the hypothesis
at 5% and conclude that Operating Environment had no statistically significant moderating effect on the
relationship between Branding Practices and Performance of commercial farmers. This implies that the
influence of branding on performance of commercial farmers is not substantially altered by operating
environment. Based on these results, performance of commercial farmers can be predicted as follows:
Y= 0.482+0.380BP +0.099OE+ 0.167BP*OE ………………………….. (v)
Where: Y= Performance of Commercial Farmers
BP= Branding Practices
OE= Operating Environment
BP*OE= Interaction of Branding Practices and Operating Environment
0.482= y-intercept; constant
0.380= an estimate of the expected increase in performance of commercial farmers corresponding
to an increase in branding practices
0.099= an estimate of the expected increase in performance of commercial farmers corresponding
to an increase in operating environment
0.167= an estimate of the expected increase in performance of commercial farmers resulting from
the interaction of branding practices and farmer characteristics.
As presented in Table 4A, 4B and 4C and the model above, the regression coefficient of 0.380 implies
that a unit change in branding practices would lead to a 0.380 change in performance of commercial
farmers while a unit increase in operating environment would lead to a 0.090 increase in performance of
commercial farmers. The coefficient of 0.167 shows the increase in performance of commercial farmers
resulting from a unit increase in the combined effect of branding practices and operating environment. It
can then be concluded that the contribution of operating environment to the variation of the relationship
between branding practice and performance of commercial farmers was not statistically significant.
DISCUSSION
Evaluation of the moderating effect of operating environment on the relationship between branding
practices of fresh fruits and vegetables and performance of commercial farmers established that the
interaction of branding practices and operating environment yielded statistically insignificant results. This
implies that individual constructs of operating environment expected to positively and significantly
influence the relationship between branding practices and performance of commercial farmers did not
offer any tangible contribution to the relationship. Narrod et al. (2007) established that small-scale fresh
fruits and vegetable farmers were able to supply restricted export markets and earn high returns by
engaging in product inspection and certification, which separated products from uninspected competitors.
Contrary to this finding, the level of product inspection and certification was found to be low (5.0%).
Clarke and Moran (1995) established that supermarkets had immense power to drive the branding of fresh
fruits and vegetables leading to improved performance of the products. The current study found that
supermarkets were ranked poorly (mean score=1.58, CV=65.73) in the importance of outlets for fresh
fruits and vegetables in the County. This implies that the two constructs of operating environment
(inspection and certification and supermarkets) did not make the expected contribution to the relationship
between branding practices and performance of commercial farmers. The development of brand names
was found to be at a low level (6.7%). This is despite the recommendation by Pearson (2003) that brand
names be developed as a form of endorsement since some product attributes fluctuate and are hidden at
the time of purchase. Despite the presence of many product attribute due to the unique nature of the agro-
ecological zone of the study location, branding practices did not exploit them to improve the performance
of the products.

Proceedings of the Third International Research Conference 26th to 28th October, 2016 8
The findings of this study confirm earlier findings in other studies. Azizi et al. (2008) in their study on
export of Malaysian furniture concluded that global economic environmental conditions had no
moderating effect on the relationship between export marketing strategies and export of furniture
products. Similarly, Man et al. (nd.) found a weak moderating effect of environmental factors on the
relationship between technology strategies and firm performance. Other studies established a significant
moderating influence of operating environment on performance of different firms. Chan et al. (2006),
Oyewobi et al. (2013), Ensely et al. (2006), and Leniall and Raju (2001) in their various studies covering
different variables concluded that operating environment had significant moderating influence on
different independent and dependent business relationships.
The identified gaps as supported by some of the studies cited above explain some of the reasons why
operating environment did not have any statistically significant influence on the relationship between
branding practice and performance of commercial farmers in the current study. Based on these findings,
the hypotheses that operating environment has a statistically significant moderating influence on the
relationship between branding practices for fresh fruits and vegetable and performance of commercial
farmers is rejected.
RECOMMENDATIONS
Results of a multiple regression analysis to test the moderating effect of operating environment on the
relationship between branding practices and performance of commercial farmers indicated that the
variation in the relationship between branding practices and performance of commercial farmers on the
introduction of operating environment was not statistically significant. Consequently, the stated
hypothesis was rejected at 5% and it was concluded that operating environment had no statistically
significant moderating effect on the relationship between branding practices for fresh fruits and vegetable
and performance of commercial farmers. As a result, the influence of branding practices on performance
of commercial farmers was not substantially altered by consideration of operating environment.
Since the results of the study indicated that operating environment on its own had statistically
insignificant moderating influence on performance of commercial farmers, it is recommended that
commercial farmers should avoid over relying on favorable operating environment as a means of
achieving premium performance. They should instead undertake extra initiatives such as branding
practices and improving their ability by acquiring adequate relevant knowledge and funding to maximize
results. Since operating environment did not have a statistically significant moderating effect on the
influence of branding practices on performance, farmers should not feel constrained by operating
environments while deciding on value addition initiatives to undertake in their farms.
Suggestions for Further Research
The study focused only on fresh fruits and vegetables among all other agricultural products offered to the
market in their fresh unprocessed form. To expand the scope of the study, and improve the level of
generalization, future research should cover other fresh agricultural products. The number of variables
and constructs covered in both micro- and macro-environmental factors should be expanded to improve
the scope and level of generalization.
The study population was limited to Kiambu County which has unique characteristics that favour the
commercialisation of fresh fruits and vegetables sub-sector of the horticultural sector. While the findings
of the study provide useful insight into the interrelationship among the study variables, the unique
characteristics of the County may limit the extent of generalisation to other counties. This calls for an
extension of the study to other counties with differing social economic and climatic conditions to confirm
the hypothesized relationship in the current study. This study adopted a descriptive cross sectional survey
design which involved collecting data once at a specific time. It further relied on data provided by the
respondents to evaluate the contribution of different variables to performance of commercial farmers.
Some constructs in branding practices and operating environment take time to generate results. A time
series design would enable the gathering of continuous data to demonstrate the effect of the elements
throughout the life cycle of the product. A study should be designed to correct collaborative secondary

Proceedings of the Third International Research Conference 26th to 28th October, 2016 9
data to confirm the self-reported data provided by the respondents. This would reduce subjectivity in the
provided data and strengthen the reliability of the current findings.
REFERENCES
Aaker, D. A. (2003). Building strong brands. Kingsway, London: Simon and Schuster UK.
Ailawadi, K. l., Lehmann, D. R., and Neslin, S. A. (2002). A product-market-based measure of brand
Equity, Marketing Science Institute
Azizi, H.J, Adis, A. and Sidin, S. (2008). Impact of environmental factors as moderator on export
marketing performance in wooden furniture industry, Journal Kemanusiaan bil.11, Retrieved on
July 17, 2016 from http://www.management.utm.my/download/jurnal-kemanusiaan.
Bremmer, J., Alfons, G., Lansink, O., Olson, K., Baltussen, H. and Huirne, R. (2002). Analysis of farm
development in Dutch agriculture and horticulture, International Management Congress
Chan, H. K., Yee, R. W. Y., Dai, J. and Lim, M. K. (2015). The Moderating Effect of Environmental
Dynamism on Green Product Innovation and Performance, International Journal of Production
Economics, Retrieved on July 17, 2016 from
https://www.researchgate.net/publication/287506019
Clarke, J. and Moran, A. (1995). An investigation into the current market for fruit in the UK and the
measures taken to promote an increase in consumer consumption, Nutrition and Food Science, 6,
5–10.
Cook R. A. (2013). Trends in the marketing of fresh produce and fresh cut value added produce.
University of California
Cooper, D. R. and Schindler, P. S. (2003). Business research methods (8th Ed.) Tata, McGraw-hill
Publishing Co. Ltd.
County Government of Kiambu (2013). County Integrated Development Plan 2013-2017.
Cronbach, L. J. (1951). Coefficient alpha and the internal structure of tests. Psychometrika, 16
Ensley, M. D., Pearce, C. L. and Hmieleski, K. M. (2006). The moderating effect of environmental
dynamism on the relationship between entrepreneur leadership behavior and new venture
performance, Journal of Business Venturing, 21:243–263, Retrieved on July 17, 2016 from
http://www.hmieleski.com/Publications/
Government of Kenya (2012). National Horticultural Policy. Agricultural Sector Coordination Unit,
Kilimo House: Nairobi, Kenya.
Heding, T., Knudtzen, C. F. and Bjerre, M. (2009). Brand management, research and practice. Routledge
Taylor and Francis Group, London.
Israel, G. D. (2009). Determining sample size. Institute of food and agricultural sciences, Florida:
University of Florida.
Kinyua-Njuguna, J. W. (2013). Strategic social marketing, operating environment and performance of
community based HIV and Aids organizations in Nairobi County, Kenya. (Unpublished PhD
Thesis, University of Nairobi, Kenya).
Kothari, C. R. (2004). Research methodology, methods and techniques (2nd
Ed.). New Age International
(P) Ltd. Publishers
Kotler, P. and Keller, K. 2009. Marketing management (13th Ed.). New Jersey: Pearson Prentice-Hall.
Leniall, S. C. and Raju, P. S. (2001). The Impact of Environmental Uncertainty on the Market Orientation
– Performance Relationship: A Study of the Hospital Industry. Journal of Economic and Social
Research, 3(1), 5-27
Man, W. Y., Chan, K. F., and Lau, T. (nd.). Technology Innovation, External Environment and the
Performance of Technology Based SMEs in China. Conference Presentations, Retrieved on July
17, 2016 from https://www.eduhk.hk/apclc/
Narrod, C., Avendaño, B., Roy, D., Okello, J., Rich, K., Thorat, A. (2007). The role of public-private
partnerships and collective action in ensuring smallholder participation in high value fruit and
vegetable supply chains, Capri Working Paper, 70: International Food Research Institute.
Neven, D. and Reardon, T. (2006). Kenyan Supermarkets and Horticultural Farm Sector Development.
International Association of Agricultural Economists Conference; Australia: Gold Coast.
Nunnally, J. C., and Bernstein, I. H. (1994). Psychometric theory. New York: McGraw-Hill.
Oyewobi, L. O., Windapo, A. O., and Rotimi, J. O. B. (2013). The effects of business environments on
corporate strategies and performance of construction organizations, Annual ARCOM Conference,

Proceedings of the Third International Research Conference 26th to 28th October, 2016 10
Reading, UK, Association of Researchers in Construction Management, 691-701. Retrieved on
July 17, 2016 from http://www.arcom.ac.uk/-docs/proceedings/
Peace, J. A. and Robinson, R. (2011). Strategic management: implementation and control. McGraw Hill
Companies.
Pearson, D. (2003). Australia Fresh Fruits and Vegetables: Why do so many of them remain unbranded?
Australasian Agribusiness Journals Review, 11
Poulton, C., Tyler, G., Hazel, P., Doward, A. and Kydd, J. (2008). Commercial agriculture in Africa:
lesions from success and failure. All africa review of experiences with commercial agriculture
Republic of Kenya. (2011). Statistical Abstract 2011. Nairobi: Government Printers.
Stanton, J. L., and Herbst, K.C. (2005). Commodities must begin to act like branded companies: Some
perspectives from the United States. Journal of Marketing Management, 21, 7-18.
********
A SUSTAINABLE FINANCING MODEL AMONGST BANKS FOR AGRIBUSINESS
INFRASTRUCTURAL PROJECTS IN KENYA
Musuya, D., Matete, J.S., Kamau, and Fwamba, R. Kibabii University, P. O. Box 1699-50200, Bungoma
ABSTRACT
The inherent risks embedded in agribusinesses have made banks cautious in extending credit. Indeed the
agricultural sector is the backbone of the economy, contributing significantly to the GDP of the county
nevertheless is the least funded. The research study intended to test a model, financing through
cooperatives that can be used to mitigate the construed risks of agribusiness lending. The research’s null
hypothesis was that, packaging credit and extending it to agribusinesses through cooperatives would not
significantly mitigate default risk. This was deductive research using survey methods to collect data for
hypothesis testing. From the analysis results the null hypothesis was rejected, accepting the alternative
hypothesis that group financing, using the co-operative model, is preferred. Thus, transfer of surplus
funds from financial institutions to agribusinesses should be done through co-operatives.
Keywords: Banks, Credit, Co-operatives, Agribusiness, Financing, risk
INTRODUCTION
The Agricultural sector is the mainstay of the Kenyan economy and directly contributes 26% of the GDP
annually and another 25% is contributed indirectly (Ministry of Agriculture, 2015). Indeed sustainable
agricultural development is essential for economic growth and conservation of environmental resources,
which to a great extent depends on the physical infrastructure: roads, irrigation, storage facilities etc. In
support of this, the Food and Agriculture Organization (1996) report concludes that the existence of good
agricultural infrastructure is a key ingredient in stimulating agricultural investment and growth. The
Kenya government has initiated the existence of development banks and micro-finance institutions for
granting credit to the self-employed and the poor, including farmers. Nevertheless a survey in one of the
development banks, Agricultural Finance Corporation, showed credit granting to farmers having
significantly dropped for the periods as shown in Table 1. The period 2004-2012, the demand for credit
has more increased by more than 50%, at the back drop of reduced credit disbursement.
Research problem
Generally poor infrastructure is a hindrance to agricultural development: the state of roads,
communication systems and power installations in rural areas are in adequate to bolster growth (Gitu,
2006). Notably the high cost of power installations has hampered the investment in agribusiness
industries, irrigation, expansion, and storage. It is a fact that agriculture in Kenya is rain fed increasing the
uncertainty on yields, thus unattractive to funding. A preliminary survey at a number of commercial
banks showed that various loan products are offered to farmers, majority of which are short-term
reflecting the production cycle of the particular farming activity. This shows the risk averseness of banks
when financing individual farmers and a major setback to development of agriculture. Banks generally
should find a model through which they can extend significant credit, more so in funding physical
infrastructural projects in agribusiness.
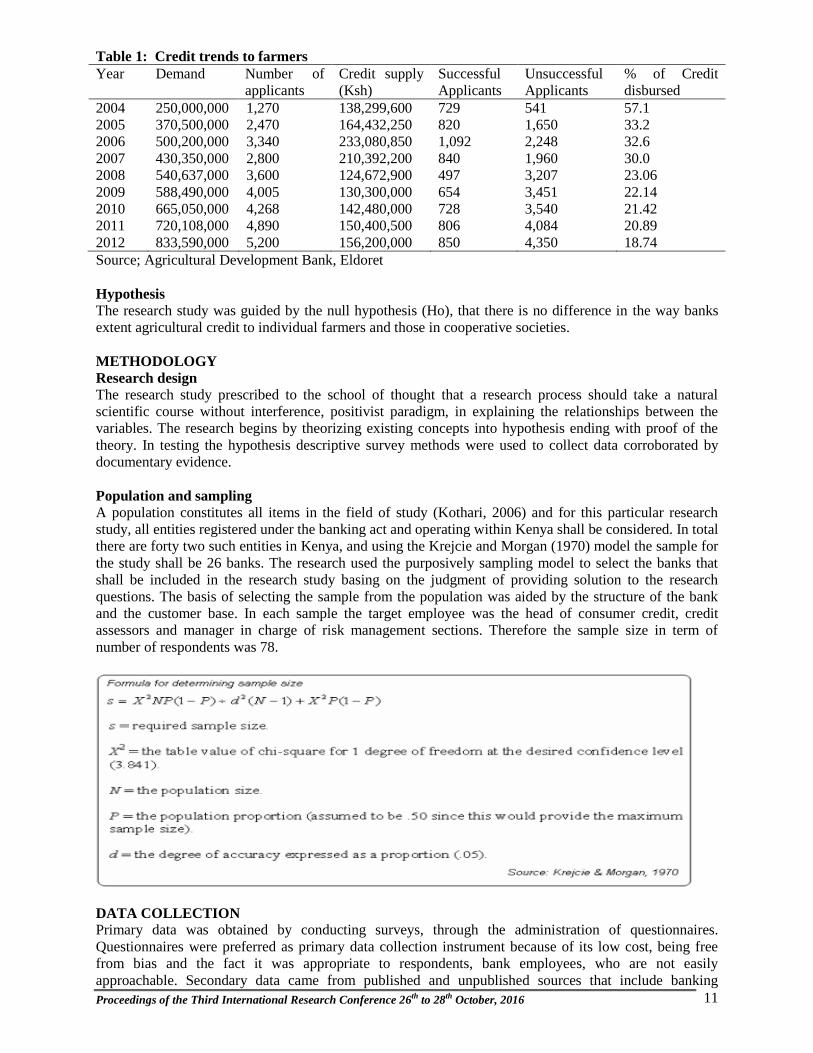
Proceedings of the Third International Research Conference 26th to 28th October, 2016 11
Table 1: Credit trends to farmers
Year Demand Number of
applicants
Credit supply
(Ksh)
Successful
Applicants
Unsuccessful
Applicants
% of Credit
disbursed
2004 250,000,000 1,270 138,299,600 729 541 57.1
2005 370,500,000 2,470 164,432,250 820 1,650 33.2
2006 500,200,000 3,340 233,080,850 1,092 2,248 32.6
2007 430,350,000 2,800 210,392,200 840 1,960 30.0
2008 540,637,000 3,600 124,672,900 497 3,207 23.06
2009 588,490,000 4,005 130,300,000 654 3,451 22.14
2010 665,050,000 4,268 142,480,000 728 3,540 21.42
2011 720,108,000 4,890 150,400,500 806 4,084 20.89
2012 833,590,000 5,200 156,200,000 850 4,350 18.74
Source; Agricultural Development Bank, Eldoret
Hypothesis
The research study was guided by the null hypothesis (Ho), that there is no difference in the way banks
extent agricultural credit to individual farmers and those in cooperative societies.
METHODOLOGY
Research design
The research study prescribed to the school of thought that a research process should take a natural
scientific course without interference, positivist paradigm, in explaining the relationships between the
variables. The research begins by theorizing existing concepts into hypothesis ending with proof of the
theory. In testing the hypothesis descriptive survey methods were used to collect data corroborated by
documentary evidence.
Population and sampling
A population constitutes all items in the field of study (Kothari, 2006) and for this particular research
study, all entities registered under the banking act and operating within Kenya shall be considered. In total
there are forty two such entities in Kenya, and using the Krejcie and Morgan (1970) model the sample for
the study shall be 26 banks. The research used the purposively sampling model to select the banks that
shall be included in the research study basing on the judgment of providing solution to the research
questions. The basis of selecting the sample from the population was aided by the structure of the bank
and the customer base. In each sample the target employee was the head of consumer credit, credit
assessors and manager in charge of risk management sections. Therefore the sample size in term of
number of respondents was 78.
DATA COLLECTION
Primary data was obtained by conducting surveys, through the administration of questionnaires.
Questionnaires were preferred as primary data collection instrument because of its low cost, being free
from bias and the fact it was appropriate to respondents, bank employees, who are not easily
approachable. Secondary data came from published and unpublished sources that include banking

Proceedings of the Third International Research Conference 26th to 28th October, 2016 12
industry reports, government reports and other historical records. The instrument was subjected to the
tests of reliability and validity. A data collection instrument is reliable if it provides consistent results; this
can be enhanced by broadening the sampled respondents or through repeat applications and standardizing
the conditions under which measurement takes place (Kothari, 2006). Measurement of the topic coverage
in terms of adequacy, an expert gave assurance that the instrument was within the standards.
RESULTS AND DISCUSSION
The study involved the use of statistical techniques, inferential analysis, in estimating the values of
unknown parameters of the population and testing of hypothesis for drawing inferences (Kothari, 2006).
The research incorporated various statistical measures that include; measures of central tendency,
measures of dispersion, and others. Data analysis involved conducting parametric tests to check the
validity of the null hypothesis on the basis of data collected using a significant level of 5%. The survey
was obtained as displayed in Table 1 and 2. The null hypothesis was to be rejected when the sampling
result has a less than 0.05 probability of occurring if it is true. There were 26 samples drawn from the
population, and within each sample there were THREE units of interest i.e. Credit manager, Head of
internal Audit and Manager in charge of risk. Therefore the number of samples (k) = 26, where (k-1)
represents the degree of freedom between samples, = 26-1 =25, the total number of items in all the
samples (n) = 26 * 3 = 78. The degree of freedom within samples (n-k) = 78 – 26 = 52. Given the large
numbers of the degree of freedom, the Xstrata software was used to conduct the F-test. If the worked out
value of F as stated above, is less than the table values of F, the difference is taken as insignificant i.e. ,
due to chance and the null hypothesis of no difference between sample means stands. The extract of
parametric tests performed on the results in table 1 and 2 is as follows:
Table 1: Parametric tests
Variab
le
Observati
ons
Obs. with
missing data
Obs. without
missing data Min Max Mean
Std.
deviation
3 25 0 25 0.667 3.667 2.653 0.605
5 25 0 25 3.670 6.000 4.813 0.631
z-test for two paired samples / Two-tailed test:
Table 2: Difference of Means
95% confidence interval on the difference between the means:
( -2.521 , -1.798 )
Difference -2.159
z (Observed value) -11.708
|z| (Critical value) 1.960
p-value (Two-tailed) < 0.0001
alpha 0.05
Test interpretation: As the computed p-value is lower than the significance level alpha=0.05, one should
reject the null hypothesis H0, and accept the alternative hypothesis Ha.
CONCLUSION
The results of this paper show that, for banks in Kenya, the extension of credit to agribusiness
infrastructural projects is preferred to those in groups or co-operatives than individual borrowers. These
results are in agreement with sentiments of (Mustafa et al., 2011) that group lending is the best way to
do for rural financial institutions. The main reason advanced for this is that the risk of default is
significantly mitigated as each member guarantees the other.
REFERENCES
Food and Agriculture Organization. (1996). “Market Oriented – Agricultural Infrastructure” Food and
Agriculture organization of the United Nations Rome, 2008
Gitu, K. (2006) “Agricultural Development and Food Security in Sub-Saharan Africa: The Case of
Kenya” Policy Assistance Unit of the FAO Sub-regional Office for East and Southern Africa.
Working paper No. 03

Proceedings of the Third International Research Conference 26th to 28th October, 2016 13
Mundlak, Y. Larson, F. and Butzer R. (2002). “Determinants of Agricultural Growth in Indonesia, the
Philippines, and Thailand” World Bank Policy Research Working Paper 2803
http://econ.worldbank.org [ 28th March 2015].
Mustaff, M., Ali, M. and Awaidh, M. (2011). “Risk management in rural finance in Near East and North
Africa" Agricultural Marketing and Finance, Working Doc 29 Food and Agriculture Organization
Ministry Of Agriculture Kenya. (2015) “Cabinet Secretary restructuring Notes”
http://www.kilimo.go.ke/reports/CS [26th March 2015]
Kothari, C.R. (2006). “Research methodology, Methods and Techniques” Second Edition, New Edge
International Publishers (P) Limited, New Delhi.
Salami, A., Kamara, B., Brixiova, Z. (2010). Smallholder Agriculture in East Africa: Trends, Constraints
and Opportunities, Working Papers Series No. 105 African Development Bank, Tunis. Tunisia.
Ulrich, H, Ritcher, K and Stopper, A. (2008). Weather Risk management for Agriculture and
Agribusiness in Developing Countries IFC, World Bank and Procom, Agr. Rome
******
FACTORS AFFECTING ACCESS TO EXTENSION SERVICE AMONG CASHEW NUT
FARMERS IN KILIFI COUNTY, KENYA
Koech, R.1* and Karani, C.G.2 1Department of Business Management and Economics, Pwani University, P. O. Box 195-80108, Kilifi
2Department of Crop Science, Pwani University, P. O. Box 195-80108, Kilifi *Corresponding author email: [email protected]
ABSTRACT
The main aim of the paper was to determine the factors that affect access of extension service among
smallholder cashew nut producers. The study was conducted in Kilifi County in coastal Kenya which has
favourable climatic conditions and a long history of cashew nut production. A structured interview guide
was used to collect data from 123 cashew nut farmers which were then analyzed using logistic regression
model. Results show that the determinants of access of extension service include gender, education, age,
household size and the size of land area cultivated. The study established management neglect of cashew
nut plantations which would otherwise be amended through access of extension services. It is thus
imperative that favourable policies based on the identified variables be formulated.
Keywords: Cashew Nut Farmers, Extension, Logistic Regression
INTRODUCTION
Kilifi County lies between latitudes 3o16’south and about 4
o south, and longitudes 39
o east and 40
o east in
the coastal region of Kenya. It covers an area of 12,609.7 km2. It borders Kwale County to the south west,
Taita Taveta County to the west, Tana River County to the north, Mombasa County to the south, and
Indian Ocean to the east (GOK, 2009). The vastness of the County makes it to experience different agro
climatic zones. The County has three main agro ecological zones namely agro ecological zones I, II, and
III (GOK 2009, Waithaka, 2002). The definition of a zone is based on the distance from the Indian Ocean
coast line. Zone I lies 0 to 15 km from the coast line, zone II extends from 15 to 35 km from the coast
line, and zone III extends from 35 km and beyond.
Agriculture is the mainstay of the majority of the people in the county. The main food crop produced is
maize while cash crops grown include coconuts, cashew nuts, citrus fruits and mangoes (GOK, 2009,
NEMA 2009). These crops are grown in smallholder farms which average 5.4ha. The growth of
agriculture sector is faced with many challenges which include unfavourable land tenure, crop diseases,
unavailability of modern agricultural inputs, inadequate soil management techniques, post harvest losses
and low acreage due to low use of modern farming methods and unfavourable climatic conditions which
causes drought and perennial food shortages in the semi-arid areas (GOK, 2009).
Agricultural Extension
Agricultural extension is the function of providing need- and demand-based knowledge in agronomic
techniques and skills to rural communities in a systematic, participatory manner, with the objective of
improving their production, income, and (by implication) quality of life. It is a source of information on
current and emerging technologies. Adeogun et al. (2008) say that the main source of technology is

Proceedings of the Third International Research Conference 26th to 28th October, 2016 14
through extension services. Extension is essentially education and it aims to bring about positive
behavioral changes among farmers. Ideally extension should be a two way process through which farmers
get access to modern technologies and on the other hand research institutions get to know the challenges
facing farmers which in turn will feed into new research to overcome these challenges.
Conceptualizing Extension Services
Extension service can be viewed as a good that is tradable in the market. It is subject to demand and
supply. Access to extension by a farmer denotes a demand for that good. There are several factors that
may determine how much of this good is demanded or what governs the demand of this good. Following
(Greene and Ng’ong’ola, 1993; Adeogun et al., 2008; Hadi et al., 2010) this scenario can be
conceptualized as follows:
ii
IgY (1)
n
j
jijiXI
1
0 (2)
Where Yi is the observed response for the ith observation (Yi = 1 for access and Yi = 0 otherwise
Ii is an underlying and unobserved stimulus index for the ith observation.
g is a functional relationship between field observation (Yi) and stimulus index (Ii)
Xji is the jth explanatory variable for the i
th observation
i = 1, 2, …, n is the sample size
j = 1, 2, …, k is the total number of explanatory variables
The model
The probability of access to extension given certain characteristics can be calculated based on the
following model (Burton et al., 2014):
X
XXDP
exp1
exp|1 (3)
Where P(D=1|X) is the probability that a farmer access extension service given X
D is a qualitative variable indicating access to extension with 1 indicating access, 0 indicating otherwise.
X is a set of k explanatory variables that influence access to extension
β is a set of k parameters to be estimated
Greene and Ng’ong’ola (1993) posits that the underlying stimulus index Ii is a random variable which
predicts the probability of access to extension. This can be presented as:
i
i
I
I
i
e
eP
1 (4)
Thus for the ith farmer:
k
j
jii
i
i
iX
P
PI
1
0
1ln (5)
The relative effect of each explanatory variable (Xji) on the probability of access to extension service is
measured by differentiating with respect to Xji. These yields:
ji
i
I
I
ji
i
X
I
e
e
X
P
i
i
1 (6)
Table 1 below gives the factors that were thought to affect access to extension services. These were the
factors which were assessed in the field.

Proceedings of the Third International Research Conference 26th to 28th October, 2016 15
Table 1. Explanatory variables affecting access to extension
Explanatory variable (Xj) Binary variable value Description
Gender 0 Female
1 Male
Education 0 No formal education
1 Primary level
2 Post primary
Access to credit 1 Yes
0 No access
Age Years Continuous variable
Household size Persons Continuous variable
Size of land cultivated Acres Continuous variable
Data Collection
The data used was collected from cashew nut farmers most of whom also doubled up as maize farmers.
Cashew crop is commonly intercropped with other crops chiefly maize. Data was collected from agro-
ecological zones I and II.
RESULTS AND DISCUSSION
The logistic regression results are as presented in table 2 below. Five variables that are thought to affect
access to extension were studied and the parameters obtained are as presented in the table. The logit
regression outcomes are presented in table 2 above. The gender of the household head and the size of the
land cultivated were negatively correlated with the dependent variable. The household size, age of the
household head and the level of education of the household head were positively correlated with the
dependent variable.
Table 2. Logistic regression results
Variable Parameter estimate Std. error z p>(z)
Household size 0.0382 0.023 1.27 0.202
Gender -0.973 0.523 -1.86 0.063*
Education level 0.265 0.455 0.58 0.561
Age 0.017 0.023 0.76 0.448
Land cultivated -0.087 0.083 -1.06 0.290
Constant -0.220 1.450 -0.15 0.879
*significant at 10%
All the independent variables examined were not significant except gender which was significant at the
10 per cent level. A surprising finding here was that age is positively correlated with access to extension.
The implication is that older farmers tend to be more receptive to extension services and actually attend
extension visits. This goes against the thinking that the young who are more educated and more receptive
to new technologies should be the one in the forefront of attending extension visits. That the level of
education is positively correlated with extension is not surprising. Education is a form of empowerment, a
social capital such that when one has it, it makes it easier for the person to acquire more. Given that in
most cases extension lingo is not in local languages the one with education is at an advantage of accessing
it. Some of the extension agents may also not be able to speak the local language.
The results also suggest that those households with more members have a higher utility for extension
visits. This may be because of need to produce more to meet the household needs in light of limited
resources especially land. They thus see adoption of modern technology through extension visit as a way
out of the situation. The land size cultivated had a negative sign meaning that the larger the land the less
the need to go for extension visit. The reasoning could be that the output is enough to meet the household
needs because land is not a limiting factor, hence the low utility for extension services. (Adeogun et al.,
2008) found similar results in a study of hybrid clarias in Lagos state, Nigeria.
Proceedings of the Third International Research Conference 26th to 28th October, 2016 16
CONCLUSION
It was found that gender affect access to extension. This then calls for gender sensitive approach to
provision of extension. It was also noted that the size of land cultivated affect the demand of extension.
Farmers may be going for quantity instead of quality. There is thus a need for farmers to consider the
productivity per unit of land instead of just looking at the total output. The efficiency of input use should
be the guiding factor.
REFERENCES
Adeogun O.A., A.M. Ajana, O.A. Ayinla, M.T. Yarhere and M.O. Adeogun. (2008). Application of Logit
Model in Adoption Decision: A Study of Hybrid Clarias in Lagos State, Nigeria. American-
Eurasian J. Agric. and Environ. Sci., 4 (4): 468-472.
Burton C. E., Roland K. R., and James A. L. (2014). A Logit Analysis of Precision Farming Technology
Adoption in Tennessee
Greene, D.A.G and Ng’ong’ola, D.H. (1993). Factors affecting fertilizer adoption in less developed
countries: An application of multivariate logistic analysis in Malawi. Journal of agricultural
economics Vol. 44, No.1
GOK. (1999). Coast Provincial Directorate of Agriculture Annual Report 1999
Had, F., Silong, D and Sarkar, S.K. (2010). Application of Logit Model in Innovation Adoption: A Study
on Biotechnology Academic Researchers in Malaysia. American-Eurasian J. Agric. and Environ.
Sci., 9 (3):282-287
NEMA (2009). State of the Coast Report: Towards Integrated Management of Coastal and Marine
Resources in Kenya. National Environmental Management Authority (NEMA), Nairobi 88pp.
Waithaka, J. 2002. Assessment of situation and development prospects for the cashew nut sector, Kenya ******
ADAPTABILITY OF COWPEA (Vigna unguiculata) LINES IN KENYA COASTAL REGION
Weru, S.M.1, Owuoche, J.O.2 and Kiplagat, O.3
1Kenya Agricultural and Livestock Research Organization-Mtwapa, P. O. Box 16-80109, Mtwapa
Email: [email protected]; mobile 0722454283 2Egerton University, P. O. Box 536-201151, Njoro, Email: [email protected]; mobile 0720710040
3University of Eldoret, P. O. Box 1125-30100, Eldoret, Email: [email protected]; mobile 0723967672
ABSTRACT
Cowpea (Vigna unguiculata L. Walp.) is one of the most important grain legumes grown in sub-Saharan
Africa. About 12.5 million tonnes of cowpea grain are produced worldwide each year with the majority
(over 94%) of the production taking place on low input, subsistence farms. This crop is most important in
the semi-arid and warm areas of Africa where other crops may fail due to poor adaptation to heat, drought
and low soil fertility conditions. The objective of this study is to contribute to increased food production
in coastal Kenya through development of high yielding, drought tolerant and farmer acceptable cowpea
lines. The experiment was conducted Kenya Agricultural and Livestock Research Organization
(KALRO), Mtwapa and its sub-centres at Msabaha and Mariakani. The agroecological zones for the sites
are; coastal Lowland 3 for Mtwapa, coastal lowland 4 for Msabaha and coastal lowland 5 for Mariakani.
The sites have sandy soils with pH of 5.3 to 6.9. Fifteen cowpea lines were sourced from the KARI Gene
bank which included three improved cultivars that have been tested in central and eastern regions of
Kenya. These genotypes have varying agronomic traits and were collected from various regions of Kenya.
They are; K033057, K033073, K003731, K005169, K026753, K027092, K003962, K046781, K028613,
K047079, K047078, K047121, KVU 27-1, M 66 and K 80. The checks were the local variety and
improve variety K 80. Planting was done in the short rains season of 2012 and in the long rains season of
2013. Planting was done at a spacing of 60 cm × 30 cm. The trial was randomized complete block design
(RCBD) with three replications. The data collected included both qualitative and quantitative traits. At
maturity the different lines were harvested, weighed with the pods, then threshed and the grain yield per
plot measured. 100 seed weight was also recorded per plot. The net plot was the two middle rows of the
plot. The year effects were clearly manifested in the agronomic traits and seed quality of the cowpea
evaluated. The superiority of K005169 in all the agroecological zones in high grain yield production is
observed making the genotype a candidate for consideration in the breeding with others to introgress the
genes for high yield potential. The 16 genotypes attained maturity within 70 to 76 days after planting and

Proceedings of the Third International Research Conference 26th to 28th October, 2016 17
can therefore be classified as early maturing type. Of the 16 genotypes tested in the three agroecological
zones of the lowland coast region, five have shown outstanding performance across the test environments.
They are K005169, KVU 27-1, M66, K003962 and K046781. These genotypes have manifested their
adaptability and stability across test environments and can be recommended for introduction in the region
and will contribute to increased production of cowpea.
Keywords: Genotypes, Adaptation, Agroecological zones, Qualitative, Quantitative, Introgression
INTRODUCTION
Cowpea (Vigna unguiculata L. Walp.) is one of the most important grain legume grown in sub- Saharan
Africa (Ehlers and Hall, 1997; Timko and Singh, 2008). About 12.5 million tons of cowpea grain are
produced worldwide each year with the majority (over 94%) of the production taking place on low input,
subsistence farms in Africa (Langyintuo et al., 2003; FAOSTAT, 2013). This crop is most important in
the semi-arid and warm areas of Africa where other crops may fail due to poor adaptation to heat, drought
and low soil fertility conditions (Gwathmey and Hall, 1992; Ehlers and Hall, 1997; Singh et al., 1999;
Singh and Matsui, 2002; Hall, 2004). Among the major six world producers of cowpea, five are located in
Africa and include Nigeria, Niger, Bukina Faso, Senegal and Mali (Fery, 2002; FAOSTAT, 2013).
Cowpea is the second most important grain legume in Kenya after beans (Phaseolus vulgaris) (Muthamia
and Kanampiu, 1996). The area under cowpea in Kenya is estimated at 215,269 ha (FAOSTAT, 2013).
Although 85% of the total area under the crop is in Eastern province, cowpea ranks first among grain
legumes in Coast province. The crop is mainly grown under intercropping systems with maize (Zea mays)
and/or cassava (Manihot esculenta). Two characteristics add to its agronomic importance: the plant is
generally drought tolerant and interacts with bacterial (Rhizobium sp.) to fix nitrogen in root nodule
thereby enhances soil fertility especially when used in rotation with cereal (Eloward and Hall, 1987;
Sanginga et al., 2003). It also play an important role in suppression of weeds, while at the same time it is
eaten as a vegetable while growing and dry seed after maturity (Kamau and Weru, 2001). It is a deep
rooted crop and grows well in sandy soils and is more tolerant to drought than other legumes (Dadson et
al., 2003; Lauriault and Kirksey, 2007). The crop can fix about 240 kg ha-1
of atmospheric nitrogen and
make available about 60-70 kg ha-1
for the succeeding crops grown in rotation with it (Kamau and Weru,
2001; CRI, 2006; Aikins and Afuakwa, 2008).
Cowpea is often referred to as ‘’poor man’s meat’’ because it has a high protein content of 20 -25% and
good nutritional value (Diouf and Hilu, 2005). The mean crude protein levels for leaves, grains and crop
residues are 32-34%, 23-35% and 11-12%, respectively (Imungi and Porter, 1983). The leaves are also a
good source of minerals including Iron (Fe), Calcium (Ca), Phosphorous (P) and Zinc (Zn). The crop is
highly palatable, very nutritious, and relatively free of anti-nutritive factors (Kay, 1979). The fruits are
consumed at all stages of growth (e.g., green pods, fresh or dry seeds) and young leaves are often used for
soups and stews (Quaye et al., 2009). In addition to its value as human food, cowpea hay is an important
source of animal fodder (Tarawali et al., 2002).
Cowpea is well adapted to arid and semi-arid areas due to its morphological as well as genetic makeup.
The deep rooted system and its earliness in maturity are some of the factors that make cowpea very
adaptable to hostile environment. Other than being a major source of cheap protein, cowpea is a
dependable source of income mainly from sale of leaves as a vegetable. Farmers at the coast of Kenya
experience very low grain yields (100 -300 kg ha-1
) and this has been attributed to a number of factors
including insect pest damage, lack of high yielding cultivars and poor crop management practices (Kega
et al., 1994; Otieno et al., 1994). Another problem is lack of appropriate seed varieties at planting.
Justification
Cowpea is the pulse of choice in Coastal Kenya where it yields well compared to other pulses. It is among
the staple foods in the region supplying basic energy, protein, vitamins and minerals (iron and calcium). It
is an inexpensive source of protein in the diets of most communities at the coast. The varieties the farmers
grow are inherently low yielding and it is against this background that new varieties could be introduced
to the area by testing their adaptability with the objective of availing to farmers suitable high yielding

Proceedings of the Third International Research Conference 26th to 28th October, 2016 18
varieties. The genotypes that show adaptability to the area can also be used in future breeding work for
improvement of the local germplasm.
Drought also is increasingly becoming a major yield limiting constraint in coastal region. It is manifested
in the form of high variability in rainfall amount and distribution over different agro-ecologies and
seasons. Hence, a breeding programme aimed at developing adaptable cultivars needs to be established.
Genotype by environment interaction and yield stability of different cowpea genotypes available in the
country, need to be investigated in order to identify the adaptable and stable genotypes for different
locations in the coastal region of Kenya. There is need to introduce new lines to test their adaptability and
stability with the aim of recommending them to the farmers to boost the production of cowpea.
MATERIALS AND METHODS
Experimental Sites
The experiment was conducted at Kenya Agricultural and Livestock Research Organization), Mtwapa
(former KARI) (E 039° 44.680’; S 03° 54.954’) and its sub-centres at Msabaha (040° 02.327’; S 03°
54.954’) and Mariakani (E 039° 28’; S 03° 50’). The agroecological zones (AEZ’s) for the sites as
described by Jaetzold and Schmidt, (2012) is coastal lowland 3 (CL3) for Mtwapa, coastal lowland 4
(CL4) for Msabaha and coastal lowland 5 (CL5) for Mariakani. The sites have sandy soils with pH of 5.3
to 6.9. The mean annual rainfall for Mtwapa and Msabaha is 1200 and 1000mm, respectively. For
Mariakani, the mean annual rainfall is 800mm. In all those sites rainfall is bimodal with the long rains
starting in April/May up to August. Short rains start in October and extend to December. However, due to
the prevailing global climate change, rainfall is erratic and therefore cannot be predicted with precision
like it was previously. The elevation at Mtwapa centre, Msabaha and Mariakani sub-centres is 30m, 15m
185m above sea level (asl), respectively.
Genotypes
Fifteen cowpea lines were sourced from the KARI Gene bank which included three improved cultivars
that have been tested in central and eastern regions of Kenya. These genotypes have varying agronomic
traits and were collected from various regions of Kenya (Table I).
Table 1: Cowpea genotypes indicating where collected and colour of the seeds
Genotype / Accession Where collected Seed colour
K033057 Eastern Province in Embu Cream
K033073 Eastern Province in Embu Cream
K003731 Eastern Province in Machakos Cream.
K005169 Eastern Province in Machakos Grey dotted
K026753 Eastern Province in Machakos Black
K027092 Eastern Province in Machakos Cream
K003962 Eastern Province in Machakos Red
K046781 Eastern Province in Makueni Red
K028613 Nyanza Province in Siaya Cream
K047079 Western Province in Busia Cream
K047078 Western Province in Busia Cream
K047121 Western Province in Vihiga Cream
KVU 27-1 improved cultivar Dark red
M 66 improved cultivar Cream
K 80 improved cultivar commonly grown Cream
Local variety(Mnyeza) Dark red
K80 is an improved cowpea variety that is well adapted in the coastal region and was one of the check
varieties. It is a dual purpose type and can do well in drier regions at 200mm of rainfall. Its grains are
creamy brown and its yield potential ranges from 1.8 – 2.0t/ha. The other check is one of the local
landraces (mnyeza) in the area where the trials were conducted.

Proceedings of the Third International Research Conference 26th to 28th October, 2016 19
Planting the Trial
After generating enough seeds for the three sites earmarked for the trial, planting was done in the short
rains season of 2012 and in the long rains season of 2013. Planting was done at a spacing of 60 cm × 30
cm at the seed rate of 10 kg ha-1.
The trial was randomized complete block design (RCBD) with three
replications. The location of the sites was at Mtwapa (CL3), Msabaha (CL4) and Mariakani (CL5). In
Mtwapa the trial site was previously planted cassava and after ploughing and harrowing, planting was
done on 22nd
October 2012. In Msabaha the site was on a field where maize was previously planted.
Planting was done on 7th November 2012 while at Mariakani the land was under fallow for two years and
planting was carried out on 12th November 2012. In April 2013, ploughing and harrowing of the trial sites
was carried out in the three locations. Planting of the trial was on 26th April 2013 at Mariakani, 29
th April
at Mtwapa and 30th April at Msabaha. The number of treatments per trial was sixteen which is the cowpea
genotypes being tested that included the local check and the improved check variety (K 80). There were
four rows in each plot whose spacing was 60×30 and two seeds were planted per hill. At planting,
phosphate fertilizer was applied at a rate of 45kg of P ha-1
. Routine spraying as a control measure for
biotic stresses was done using insecticides and fungicides. All the agronomic practices required were
carried out. Weeding was done three times in all the sites.
Data Collection and Analysis
The data collected included both qualitative and quantitative traits – it was on stand count, days to
emergence, days to flowering, days to pod-setting, days to maturity, number of pods per plant and number
of seeds in a pod. At maturity the different lines were harvested, weighed with the pods, then threshed and
the grain yield per plot measured. 100 seed weight was also recorded per plot. The net plot, or where the
data was collected, was from the two middle rows of the plot.
The data was analyzed using the SAS program.
The statistical model was a follows;
Yijklm = µ + Ei + Yj + Rk (i-j) + Gl + GEil + GYjl +GYEijl + Ԑijklm; Where:
Yijklm - is the observation of lth treatments (genotypes) in the k
th replication in the i
th environment.
µ - is general mean.
Ei - is location.
Yj - is year.
Rk - is kth replication in the i
th environment.
Gl - is lth treatment in the k
th replicate.
GEil - is the genotype and environment interaction.
GYjl - is the genotype and year interaction.
GYEijl - is the genotype, year and environment interaction. Ԑijklm - is the random error effect.
RESULTS
The potential of the genotypes were better revealed in 2013. The mean grain yield in the combined
analysis was 915.89 and 1644.19 kg ha-1
in 2012 and 2013 respectively (Table II). Number of pods per
plant, number of seeds per pod, length of seed, width of seed and weight of seed were also significantly
higher in 2013 compared to data obtained in 2012. Cowpea planted in 2013 physiologically matured
earlier than 2012 by four days (Table II). Pod weight was also significantly higher (p < 0.05) in 2013
(2591.63 kg ha-1
) compared to 2012 (1477.6 kg ha-1
). The mean weight of seed was 13.40 g in 2013,
significantly different (p < 0.05) in 2012 with 12.19 g. From the combined analysis, the performance of
the 16 genotypes in the three across test agro ecological zones (AEZ’s) was significantly different (p <
0.05) for all traits except in pod weight. The mean grain yield from Mtwapa and Mariakani, 1371.82 and
1385.71kg ha-1
respectively were significantly different (p < 0.05) from Msabaha’s. Flowering at Mtwapa
took 46 days and was significantly different from the other two agroecological zones (Table III).
There was no significant difference between 2012 and 2013 for days to 50% flowering in both years at
Mariakani (CL 5). However, the year effects were notable for all other variables measured to be
significantly different (p < 0.05). Mariakani had the highest mean grain yield of 1984.4 kg ha-1
in 2013
and the lowest grain yield of 787 kg ha-1
in 2012 compared to means at Mtwapa and Msabaha. In 2012,

Proceedings of the Third International Research Conference 26th to 28th October, 2016 20
cowpea flowered after 43 days at Mtwapa (CL 3) and flowered latest at Mariakani (CL 5) after 45 days.
In the same year, pods were produced and plants matured at CL 3 after 50 and 61 days, respectively. The
latest in 2012 to produce 50% of pods was CL 4 at 54 days and the latest to attain physiological maturity
was in CL 5 at 79 days (Table IV). Compared with 2013, the number of pods produced per plant was
lowest in 2012 across all the agro ecological zones (AEZ’s) at 12, 16 and 25 pods in CL 5, CL 3 and CL4
respectively. During short rain season of 2012, the highest number of seeds per pod was produced in CL 4
(18 seeds) and lowest in CL 5 (13 seeds). The highest mean number of internodes per plant was also
observed at CL 5 (13) and lowest at CL 3 (5). The lowest mean pod weight and the grain yield in 2012
were observed at CL 5 with 1231 kg ha-1
and 787 kg ha-1
respectively and the highest pod weight of 1705
kg ha-1
was detected at CL 4 and grain yield of 984 kg ha-1
at AEZ CL 3. The lowest 100 seed weight
recorded that year was 10.16 g at CL 3 while the highest was at CL 4 with 13.47 g.
In the long rains of 2013, cowpea took 43 to flower at CL 4 compared to CL 3 where it took 48. Cowpea
took 71 days to mature at CL 4 days in contrast to 80 days observed at CL 3. During this season,
Mariakani (CL 5) had the highest pod weight and grain yield of 2927.1 and 1984.4 kg ha-1
respectively
while the lowest was at Msabaha (CL 4) with 2204.3 and 1189 kg ha-1
of pod weight and grain yield
respectively (Table IV). Weight of seed varied across the locations. The highest seed weight was at
Mariakani (CL 5) (14.24 g) compared to Msabaha (13.49g) and Mtwapa (12.48 g) (Table IV). Genotype
K026753, flowered the earliest (42 days) at CL 3 compared to K046781, M66 and K80 which took 49.3,
48.6 and 48.5 days, respectively (Table V). At Msabaha (CL 4), K003731 and K046781 took 42 days to
flower compared to the rest of the genotypes. However, it took 46 days for K033073 to flower compared
to two check varieties which flowered after 43 and 44 days (Table V).
At Mariakani in CL5, genotypes – K047079 and K047121 flowered significantly earlier at 43 days than
others. The improved check (K80) and K033073 took significantly longer to flower than other genotypes
at 47 days. Following was K027092 at 46 days. The local check (mnyeza) took 44 days to 50% flowering
(Table V). K80 and M66 significantly (p < 0.05) took the longest to 50% podding at 56 days while the
earliest to 50% podding was K026753 at 50 days in CL 3 (Table V). At CL 4, the earliest podding (52
days) were detected on genotypes K033057 and K047079 while K033073 and K047078 took 55 days to
produce pods. The improved check (K80) achieved 50% podding at 53 days while the local check
(mnyeza) at 54 days. There were no significant differences for podding days at CL 5 (Table V). At CL 3,
K003962, K028613 and K027092 matured the earliest in 68 days, while K047078, K047079 and
K046781 took the longest time (74 and 73 days) to mature. Further comparison showed that it took 70
days for local variety to mature (Table VII). At CL 4, it took 77 days for the local check to mature
compared to 69 days for K003962. The improved check (K80) took 76 days to mature (Table VII). The
variation in period it takes cowpea to mature was further noted at CL 5. In this region, K027092 took 69
days to mature followed by K033073 and KVU 27-1 at 72 days. The improved check (K80) attained
physiological maturity at 80 days and the local check (mnyeza) 77 days. In fact, K047079 and K046781
took 81 days to mature. In this study, genotypes evaluated at CL 5 took longer time to mature compared
to the other agro ecological zones.
There was variability among cowpea genotypes evaluated across the locations for the number of pods per
plant. In AEZ CL 3, genotypes, K046781 and K005169 had significant high (p < 0.05) number of pods
compared to the rest with 24 pods per plant. The improved check (K80) had 23 pods per plant while the
local check had 19 pods per plant. KVU 27-1, one of the improved varieties being tested had significantly
low (p < 0.05) number of pods with 15 pods / plant (Table V). At CL 4, the local check produced 34 pods
per plant, a value that was higher than those observed on other genotypes. In comparison, 21 numbers of
pods per plant were observed on K033073 (Table V). At AEZ CL 5, genotypes K047078 and K028613
produced 25 and 23 pods /plant in contrast to improved check (K80) and M66 which produced 21 pods
per plant. The lowest number of pods was observed on K005169, K047121 and K003962. The local
check had a mean of 19 pods per plant (Table V).

Proceedings of the Third International Research Conference 26th to 28th October, 2016 21
Table 2: Means of agronomic traits and seed quality of 16 cowpea genotype in 3 environments (Mtwapa, Msabaha and Mariakani) in 2012 and 2013.
Year Days to
50%
flowering
Days to
50%
podding
Days to
physiologi
cal
maturity
Number of
pods/plant
Length
of pod
(cm)
Number of
branches/plan
t
Height
of plant
(cm)
Number of
seeds/pod
Seed
length
(mm)
Seed
width
(mm)
Number of
internodes
Pod
weight
(kg/ha)
Grain
yield
(kg/ha)
100
seed
weight
(g)
2012 44.31 a 52.92 b 72.52 b 17.68 b 17.21b 3.90 a 54.04b 15.36 b 7.19 b 5.89b 9.59 a 1477.6b 915.89b 12.19b
2013 45.73 a 54.62 a 76.06 a 25.75 a 18.06a 3.55 b 59.04a 17.30 a 7.24 a 5.96a 9.15 b 2591.6a 1644.19
a
13.40a
Lsd 0.529 0.474 0.768 1.151 0.316 0.134 2.416 0.389 0.073 0.061 0.354 182.00 114.35 0.216
NB: Means followed by same letter are not significantly different
TABLE 3: Means of agronomic traits and seed quality of 16 cowpea genotypes evaluated across 3 environments (Mtwapa, Msabaha and Mariakani)
Environ Days to
50%
flowering
Days to
50%
podding
Days to
physiological
maturity
Number
of pods/
plant
Length
of pod
(cm)
Number of
branches/
plant
Height
of plant
(cm)
Number
of
seeds/pod
Seed
length
(mm)
Seed
width
(mm)
Number
of
internodes
Pod
weight
(kg/ha)
Grain
yield
(kg/ha)
100 seed
weight
(g)
Mtwapa (CL 3)
45.97a 52.89 c 70.98 c 20.27 b 17.13b 3.23 c 56.78b 15.66 b 6.91 c 5.71c 6.22 c 2069.90a 1371.82a 11.32b
Msabaha
(CL 4)l
44.03 c 53.84 b 73.96 b 25.95 a 18.28a 3.52 b 58.79a 17.86 a 7.23 b 5.98b 10.06 b 1954.78a 1082.61b 13.48a
Mariakani (CL 5)
45.04 b 54.58 a 77.90 a 18.94b 17.47b 4.42 a 54.03b 15.46 b 7.51 a 6.07a 11.82 a 2079.28a 1385.71a 13.59a
Lsd 0.648 0.581 1.941 1.410 0.387 0.164 2.959 0.476 0.090 0.075 0.434 222.91 140.05 0.264
NB: Means followed by same letter are not significantly different
Table 4: Means of agronomic traits and seed quality of 16 cowpea genotype across three environments over two years. Environ Year Days to
50%
flowering
Days to
50%
podding
Days to
physiological
maturity
Number
of pods/
plant
Length of
pod (cm)
Number of
branches/
plant
Height of
plant (cm)
Number of
seeds/pod
Seed
length
(mm)
Seed
width
(mm)
Number of
internodes
Pod
weight
(kg/ha)
Grain
yield
(kg/ha)
100 seed
weight
(g)
Mtwapa 2012 43.45 b 50.10 b 61.29 b 15.83 b 16.59b 3.29 a 51.53b 14.18 b 6.80 b 5.67a 4.71 b 1496.2b 984.38b 10.16b
2013 48.50 a 55.68 a 80.68 a 24.72 a 17.67a 3.18 a 62.04a 17.14 a 7.02 a 5.76a 7.74 a 2643.5a 1759.26a 12.48a
Lsd 1.292 1.099 1.041 1.656 0.472 0.220 2.283 0.657 0.120 0.106 0.474 231.99 60.605 0.330
Msabaha 2012 44.14 b 54.43 a 76.67 a 25.25 b 18.75a 3.81 a 55.07b 18.28 a 7.23 a 6.00a 10.31 a 1705.3b 976.27b 13.47a
2013 43.91 a 53.25 b 71.27 b 26.64 a 17.81b 3.23 b 62.50a 17.44 b 7.22 a 5.97a 9.80 a 2204.3 a 1188.95a 13.49a
Lsd 0.717 0.639 0.740 2.319 0.607 0.257 5.971 0.584 0.113 0.112 0.608 310.98 157.85 0.444
Mariakani 2012 45.32a 54.22 b 79.58 a 11.98 b 16.26b 4.59 a 55.51a 13.61 b 7.54 a 6.01b 13.74 a 1231.5 b 787.0b 12.94b
2013 44.77a 54.93 a 76.22 b 25.89 a 18.68a 4.24 b 52.56a 17.32 a 7.47 b 6.14a 9.90 b 2927.1a 1984.4a 14.24a
Lsd 0.641 0.682 1.957 2.036 0.569 0.227 3.624 0.791 0.152 0.104 0.752 394.75 260.17 0.354
NB: Means followed by same letter are not significantly different

Proceedings of the Third International Research Conference 26th to 28th October, 2016 22
Table 5: Days to flowering, days to podding, number of pods and length of pods of 16 cowpea genotypes in Mtwapa, Msabaha and Mariakani 2012/13
Germplasm Days to 50% Flowering
MTP MSA MRK Days to 50% podding
MTP MSA MRK
Mean No. of pods /plant
MTP MSA MRK
Mean length of pod (cm)
MTP MSA MRK
K033057 44.3 bc 43.34 cde 44.67 bc 50.8 cde 52.67 d 55.00 a 19.3 bcd 22.06 d 16.84 cde 17.4 bcde 19.11 abc 17.91 bcd
K028613 47.5 ab 44.00 bcde 45.84 ab 53.7 abcd 54.00 abcd 54.84 ab 19.5 bcd 24.72 bcd 23.06 ab 16.0 ef 16.34 f 15.33 fg
K047079 44.7 bc 44.17 bcde 43.84 c 53.8 abc 52.67 d 54.00 ab 18.4 cde 23.22 cd 18.45 abc 16.3 ef 18.98 abcd 18.70 bc
K033073 46.8 ab 46.34 a 47.00 a 53.8 abc 55.50 a 55.67 a 19.2 bcde 21.67 d 20.78 abc 15.8 f 16.81 ef 16.73 def
K005169 45.8 ab 44.17 bcde 44.50 bc 52.2 bcde 54.50 abc 55.17 a 24.5 a 27.67 bcd 16.67 cde 17.3 cde 17.31 def 16.67 def
K047121 46.5 ab 42.50 e 43.84 c 52.8 bcde 53.17 cd 54.17 ab 18.4 cde 25.67 bcd 14.56 de 18.0 abc 18.36 bcde 17.63 cde
K026753 42.2 c 43.17 de 45.50 abc 50.0 e 54.17 abcd 54.50 ab 22.9 abc 26.28 bcd 19.17 bcd 14.1 g 16.35 f 14.52 g
K003731 44.5 bc 42.83 de 44.50 bc 51.2 bcde 53.67 bcd 53.84 ab 20.6 abc 29.22 abc 19.50 abcd 17.4 bcde 18.41 bcde 16.04 efg
K046781 49.3 a 42.34 e 44.67 bc 54.0 ab 54.00 abcd 55.50 a 24.7 a 25.73 bcd 17.78 bcde 18.6 ab 20.36 a 20.35 a
K027092 44.2 bc 45.33 abc 46.00 ab 50.7 de 54.00 abcd 54.17 ab 19.5 bcd 23.39 bcd 18.72 bcd 18.2 abc 18.74 abcd 19.21 abc
K003962 44.3 bc 43.50 cde 44.67 bc 50.8 cde 53.50 bcd 54.50 ab 14.7 de 24.06 bcd 12.89 e 19.3 a 19.81 ab 19.48 ab
M66 48.7 a 44.34 abcde 45.17 bc 56.5 a 53.33 bcd 54.00 ab 19.7 bc 26.61 bcd 21.17 abc 17.1 cdef 17.69 cdef 16.68 def
K80 48.5 a 44.17 bcde 47.00 a 56.7 a 53.50 bcd 55.00 a 23.5 ab 29.84 ab 21.17 abc 16.4 ef 18.21 bcde 16.73 def
KVU 27-1 45.8 ab 44.67 abcd 44.67 bc 52.2 bcde 53.50 bcd 55.17 a 14.5 e 24.17 bcd 17.73 bcde 18.7 ab 19.76 ab 19.09 abc
K047078 46.2 ab 46.00 ab 44.34 bc 53.2 bcd 55.00 ab 54.84 ab 23.5 ab 26.33 bcd 25.11 a 16.9 cdef 17.76 cdef 16.52 def
LOC (Mnyeza) 46.3 ab 43.67 cde 44.50 bc 54.0 ab 54.33 abcd 53.00 b 18.7 cde 34.61 a 19.50 abcd 16.8 def 18.51 bcde 18.02 bcd
MEAN 46.0 44.03 45.04 52.9 53.84 54.58 20.1 25.95 18.94 17.1 18.28 17.48
CV% 4.2 2.60 2.17 3.7 1.42 1.28 15.3 12.60 15.99 7.5 6.55 9.18
Means with the same letter are not significantly different.
Table 6: Number of seeds, seed length, seed width and number of internodes of 16 cowpea genotypes in Mtwapa, Msabaha and Mariakani 2012/13
Germplasm Mean No. of seeds per pod
MTP MSA MRK Mean Seed length (mm)
MTP MSA MRK
Mean seed width (mm)
MTP MSA MRK
Mean No. of internodes/plant
MTP MSA MRK
K033057 16.6 ab 17.45 bc 17.00 a 6.94 defg 7.38 bc 7.33 efg 5.95 bc 6.22 bcd 6.07 de 5.72 bc 9.00 c 11.39 bcdef
K028613 15.8 abc 17.28 bc 15.00 ab 6.55 i 7.05 def 6.95 gh 5.29 g 5.72 ghij 5.60 gh 6.11 abc 9.50 bc 13.17 abc
K047079 17.4 a 18.50 ab 17.06 a 6.57 hi 6.92 efg 7.60 def 5.74 cdef 6.15 bcd 6.43 bc 6.89 ab 9.33 c 14.83 a
K033073 14.6 cd 17.78 ab 15.11 ab 6.18 j 6.70 gh 6.88 h 4.83 h 5.40 j 5.68 gh 6.11 abc 9.61 abc 12.06 bcde
K005169 15.6 abc 17.28 bc 15.50 ab 7.03 cde 7.57 b 7.37 efg 5.90 c 5.80 efghi 5.82 fgh 5.67 bc 10.17 abc 11.06 cdef
K047121 14.9 bcd 18.33 ab 15.33 ab 6.82 efghi 7.18 cde 7.25 fgh 6.00 bc 6.12 bcde 6.32 cd 5.56 bc 10.17 abc 10.33 ef
K026753 13.3 d 16.11 c 13.89 b 6.58 hi 7.17 cde 7.27 fgh 5.29 g 5.92 defgh 5.77 fgh 6.78 ab 10.06 abc 11.78 bcdef
K003731 14.3 cd 18.06 ab 15.00 ab 6.90 efgh 7.18 cde 7.32 efg 5.79 cde 6.05 cdef 6.05 def 7.17 a 10.00 abc 10.89 def
K046781 16.3 abc 18.00 ab 15.00 ab 7.74 a 7.93 a 8.55 a 6.39 a 6.75 a 6.95 a 6.22 abc 10.28 abc 11.39 bcdef
K027092 15.5 abc 18.83 ab 15.72 ab 7.27 bcd 7.55 b 7.72 cde 5.71 cdef 5.97 defgh 5.87 efg 6.89 ab 10.06 abc 9.78 f
K003962 16.6 ab 19.28 a 15.89 ab 7.50 ab 7.60 b 8.30 ab 6.21 ab 6.03 cdefg 6.50 bc 6.22 abc 11.06 ab 11.56 bcdef
M66 15.2 bcd 17.67 abc 15.89 ab 6.60 ghi 6.53 h 7.05 gh 5.58 efg 5.77 fghi 5.88 efg 7.11 a 9.95 abc 13.50 ab
K80 16.4 ab 17.95 ab 14.94 ab 6.68 fghi 6.83 fgh 7.27 fgh 5.48 fg 5.68 hij 5.75 gh 5.61 bc 11.33 a 12.28 bcde
KVU 27-1 15.3 bc 18.11 ab 15.61 ab 7.35 bc 7.32 bcd 8.03 bc 5.99 bc 6.32 bc 6.63 b 5.39 c 10.33 abc 12.67 bcd
K047078 14.4 cd 17.72 abc 15.00 ab 6.89 efghi 7.17 cde 7.28 fgh 5.51 efg 5.48 ij 5.55 h 5.72 bc 10.11 abc 12.11 bcde
LOC (Mnyeza) 15.9 abc 17.50 bc 15.50 ab 7.02 cdef 7.62 ab 8.00 cd 5.83 cd 6.42 b 6.30 cd 6.44 abc 10.06 abc 10.44 ef
MEAN 15.5 17.86 15.47 6.91 7.23 7.51 5.7 5.99 6.07 6.2 10.06 11.83
CV% 6.8 4.04 5.04 5.82 5.17 6.45 6.8 5.83 6.72 9.5 5.70 10.91
Means with the same letter are not significantly different.

Proceedings of the Third International Research Conference 26th to 28th October, 2016 23
Generally, the mean number of seeds per pod also varied across the three environments. An average
number of seeds per pod (17) was detected on K047079 at AEZ CL 3 in contrast to 13 seeds/pod
observed on genotype K026753. The local check (mnyeza) and the improved check (K80) had 16 seeds
per pod (Table VI). At CL 4, K003962 bore pods that contained an average of 19.27 seeds which was
significantly higher (p < 0.05) than K026753 (16 seeds per pod). The improved check (K80) had an
average of 17 seeds per pod as was the local check (mnyeza). Genotypes K047079 and K033057
produced a mean number of seed per pod of 17 at CL 5. Significantly few (p < 0.05) seeds per pod were
in variety K026753 with a mean of 13.88 seeds per pod. The local check (mnyeza) and the improved
check (K80) had 15 seeds per pod and competed well with other genotypes (Table VI).
The seed weights of genotypes tested at AEZ CL 3 were comparatively lower than those in other
agroecological zones (Table VII). An average seed weight of 14.9 g was observed on K046781 in CL 3.
The seeds of check variety, K80 and local check weighed 10 g and 11 g respectively. The lowest seed
weight of 8.7 g was noted on genotype K033073 in CL 3. Just like in CL 3, the genotype with
significantly (p<0.05) low 100 seed weight recorded in CL 4 was K033073 with 11.81 g. The one with
the significantly high (p < 0.05) weight recorded was K046781 with a mean weight of 16.31 g. The local
check (mnyeza) and the improved check (K80) had 14.5 g and 12.93 g in CL 4 (Table VII).
Comparatively, in CL 5, the highest seed weight of 17.56 g was observed on genotype K046781 and was
followed by K003962 (16.37 g) and KVU 27-1 (15.32 g). Seeds from both local check and improved
check exhibited an average weight of 14.73 g and 12.47 g respectively. The weight of seed from K028613
and K033073 were among the lowest (Table VII).
At Mtwapa site (CL 3), grain yield also varied among the genotypes and the best yielding genotypes -
K005169, produced grain yield of 2025.5 kg ha-1
compared to the improved check K80 (1657.4 kg ha-1
).
These genotypes produced 32% and 17% more than the local check which produced 1377.3 kg ha-1
. The
lowest significantly different (p < 0.05) grain yield was in genotype K047121 with 1159.72 kg ha-1
.
(Table VII). At CL 4, the highest significantly different (p <0.05) grain yield were observed in genotype
K005169 with 1439.8 kg ha-1
. It was followed by KVU 27-1, K003962, K046781, M66 and K80 at
1395.8, 1331, 1169, 1136.6 and 1092.6 kg ha-1
respectively. The local check had yield of 990.7 kg ha-1
and had out yielded K027092, K033073, K033057, K003731 and K047079 which had low significantly
different (p < 0.05) yield (Table 10). In Mariakani, CL 5 the highest significantly different (p < 0.05)
grain yield were recorded in genotype KVU 27-1 with 1782.4 kg ha-1
. It was followed by K005169 and
M66 with 1708.3 and 1588 kg ha-1
respectively. K80, the improved check and the local check (mnyeza)
gave yield of 1527.8 and 1463 kg ha-1
respectively. The lowest significantly different yield was 993.1 kg
ha-1
by K047121 (Table VII).
DISCUSSION
The fact that that there were significant differences (p < 0.05) in most of the variables measured due to
the effects of the year (season), environment and the year × environment interaction in the combined
analysis is evident of the genetic variability of the 16 genotypes under test in three agro ecological
environments. The effect of the genotype × year interaction on the 16 genotypes was of no consequence
on the seasons. The genotype × environment interaction indicates the effect it had on the expression of the
genotypes in various characters studied. This is a pointer that not all genotypes express their potential
similarly in different environments. So there is need to select particular genotypes in different
environments. This observation supports the earlier reports of Agbogidi and Ofuoko (2005) that plants
respond differently to environmental factors based on their genetic makeup and their adaptation capability
indicating variability among species.
The potential of the genotypes were better expressed in long rains 2013 compared to short rains 2012 due
to favorable weather prevailing in 2013. In the short rains 2012, the rainfall recorded from November
2012 when the cowpea were planted to February 2013 when the crop was harvested was 67.95mm,
59.63mm and 83.95mm in Mtwapa (CL 3), Msabaha (CL 4) and Mariakani ( CL 5). In the second
planting in the long rains of 2013, from April to July the rainfall recorded in the sites at Mtwapa,
Msabaha and Mariakani was 165.85mm, 134.85 and 141.1mm.

Proceedings of the Third International Research Conference 26th to 28th October, 2016 24
Table VII: Mean height of plants (cm), number of days to physiological maturity, grain yield (kg/ha) and 100 seed weight (g) of 16 cowpea genotypes
tested at Mtwapa, Msabaha and Mariakani 2012/13 Germplasm Mean height of plant (cm)
MTP MSA MRK Days to 50% physiological maturity
MTP MSA MRK
Mean grain yield (kg/ha)
MTP MSA MRK
Mean 100 seed weight (g)
MTP MSA MRK
K033057 56.17 b 54.16 ab 57.67 abc 70.83 bcdef 74.50 bcd 77.34 abc 1481.9 bc 923.61 c 1391.67 ab 11.67 def 14.56 bc 12.83 de
K028613 48.24 c 56.74 ab 62.11 a 69.50 g 76.00 ab 79.50 a 1277.8 bc 1000.00 abc 1315.28 ab 9.53 hi 12.56 ef 11.83 ef
K047079 56.98 b 60.16 ab 50.28 bc 71.50 ab 71.00 fg 81.17 a 1288.9 bc 908.33 c 1430.56 ab 11.29 def 13.14 de 14.41 c
K033073 56.03 b 70.12 a 53.06 abc 69.83 fg 71.67 fg 72.00 cd 1294.4 bc 923.61 c 1113.89 ab 8.78 i 11.81 ef 11.26 f
K005169 65.31 a 51.84 b 50.34 bc 69.67abcde 73.84 cde 80.84 a 2025.0 a 1438.89 a 1708.33 ab 11.16 efg 13.37 bcde 13.06 d
K047121 56.84 b 61.52 ab 58.61 ab 71.50 bcdef 75.34 abc 79.84 a 1159.7 c 1005.56 abc 993.06 b 12.06 cde 13.31 cde 13.41 d
K026753 44.23 c 56.88 ab 51.00 bc 70.5 bcdefg 72.00 ef 78.67 a 1175.0 c 1048.61 abc 1036.11 b 9.67 hi 12.54 ef 12.05 ef
K003731 59.09 ab 60.60 ab 49.10 bc 70.00 defg 76.00 ab 76.00 abc 1179.2 c 913.89 c 1336.11 ab 11.12 fg 13.37 bcde 13.11 d
K046781 60.81 ab 63.99 ab 51.62 bc 73.13 abc 74.00 bcde 81.00 a 1252.8 bc 1168.06 abc 1583.33 ab 14.90 a 16.32 a 17.57 a
K027092 57.88 b 51.84 b 48.34 c 68.34 g 72.67 def 69.00 d 1295.8 bc 958.33 bc 1208.33 ab 12.15 cd 12.83 ef 13.32 d
K003962 59.50 ab 58.82 ab 53.22 abc 68.00 g 69.67 g 80.84 a 1490.3 bc 1330.56 abc 1284.72 ab 13.38 b 14.62 b 16.37 b
M66 57.94 b 57.69 ab 53.28 abc 72.67 abcd 74.17 bcd 80.17 a 1527.8 bc 1137.50 abc 1587.50 ab 10.23 gh 12.76 ef 12.63 de
K80 61.83 ab 65.62 ab 57.95 abc 72.0 abcdef 76.00 ab 79.83 a 1656.9 ab 1093.06 abc 1527.78 ab 10.27 gh 12.93 def 12.47 de
KVU 27-1 48.89 c 59.00 ab 57.84 abc 69.67 efg 74.67 bcd 72.83 bcd 1290.3 bc 1395.83 ab 1781.94 a 12.77 bc 14.09 bcd 15.33 c
K047078 59.91 ab 50.66 b 53.61 abc 74.67 a 74.67 bcd 79.67 a 1176.4 c 1086.11 abc 1409.72 ab 11.01 fg 13.01 def 13.12 d
LOC
(Mnyeza)
59.00 ab 61.06 ab 56.56 abc 70.34 cdefg 77.33 a 77.84 ab 1377.8 bc 990.28 bc 1463.89 ab 11.15 efg 14.46 bc 14.73 c
MEAN 56.79 58.79 54.03 70.76 73.97 77.91 1371.9 1082.64 1385.76 11.36 13.48 13.59
CV% 9.52 8.93 7.36 2.49 2.82 4.69 16.5 15.90 16.34 3.57 8.13 12.46
Means with the same letter are not significantly different.

Proceedings of the Third International Research Conference 26th to 28th October, 2016 25
This explains the superior performance observed in 2013 as opposed to 2012 in the grain yield and other
yield components. In the short rains of 2012, in all the agroecological sites where the trials were carried
out, it was noted that the days to 50% flowering, to 50% podding and to 50% physiological maturity came
much earlier than in the long rains of 2013. This is due to weather condition which triggered the
genotypes to mature early for their survival. In the long rains season of 2013, the mean days to 50%
flowering was 45.5. The days to physiological maturity were longer with a means of 75.5 days. This is
due to the higher rainfall that was well distributed during this season that afforded expression of the
genetic potential of the genotypes. In all the agroecological zones, the superiority of genotype K046781
in terms of the highest significant (p < 0.05) 100 seed weight is observed across all three agroecological
zones. K033073 shows the lowest 100 seed weight across the three AEZ’s suggesting its low genetic
potential in seed weight.
The superiority of K005169 in all the agroecological zones in grain yield was observed making the
genotype a candidate for consideration in breeding to introgress the genes for high yield potential. The 16
genotypes attained maturity within 70 to 76 days after planting. Egbe et al (2010) classified cowpea
varieties that matured in ≤ 60 days as extra early, 61 -80 as early and > 80 days as late. Therefore, most of
the 16 genotypes could be classified as early maturing. In CL 5, two genotypes took longer to attain
physiological maturity at 81 days and could be classified as late maturing in that specific environment.
There seem to be a relationship between the number pods per plant and the grain yield. In all the AEZ’s,
genotype K026753 recorded the lowest number of pods per plant and is among the lowest grain yielder.
K005169 recorded high number of pods in all the AEZ’s and it is among the highest grain yielder. The
number of seeds per pod follows the same trend. Genotype K026753 recorded significantly low number
of seeds per pod in all the agro ecological zones. The genotype having the highest 100 seed weight is
K046781 which indicate its genetic potential and is suitable to consider in crossing with other genotypes
for introgression of that characteristic. The superiority of the improved cowpea genotypes of KVU 27-1,
M66 and K80 is manifested across the three agro ecological environments. Not to be outdone is the local
check across the environment too. Other genotypes that performed impressively in specific environment
are K003962 and K033057 in AEZ CL 3.
In CL 4, other genotypes that had good performance are K003962 and K046781 while in CL 5 genotypes
with promising results apart from the ones with good performance across the environments were
K046781, K047079 and K047078. K003962 and K033057 are collections from Machakos and Embu,
respectively. K046781 is a collection from Makueni while K047079 and K047078 are from Busia. The
climatic condition of all these environments is quite diverse and is indication of cowpea genotypes
suitability in wide environments. The improved check (K80) and the local check performance in terms of
grain yield was impressive across the three agro ecological zones where the study was carried out. They
will be included in the breeding program so that their unique genetic characteristics can be used in
development of new varieties.
CONCLUSION
Of the 16 genotypes tested in the three agroecological zones of the lowland coast region, five have shown
outstanding performance across the test environments. They competed well and some even out performed
K80, the improved check variety that is popular in the region currently. They are K005169, KVU 27-1,
M66, K003962 and K046781. These genotypes have manifested their adaptability and stability across test
environments and can be recommended for introduction in the region and will contribute to increased
production of cowpea. The other genotypes had also some unique qualities which can be exploited for
development of new superior genotypes in terms of earliness, drought tolerance, high number of pods,
more seeds per pod, etc. All those characteristics contribute to the superiority of the genotype. K026753
and K003731 are early flowering while K027092 and K033073 attain maturity early compared to other
genotypes. A cowpea breeding program can be started at KALRO Mtwapa now that some

Proceedings of the Third International Research Conference 26th to 28th October, 2016 26
characterizations of those sixteen genotypes have been done. This can be by establishment of a crossing
block of all those genotypes where crosses can be done. Meanwhile for the aforementioned five
genotypes with superior performance, multiplication of seeds could commence for distribution to farmers
in the region.
ACKNOWLEDGEMENT
KARI (now KALRO) provided the sites where trials were carried out and the authors are grateful for that.
Also to thank are my colleagues at work whose selfless assistance in this study is highly appreciated.
REFERENCES
Agbogidi, O.M and Ofuoku, A.U. (2005). Response of sour sop (Annona muricata Linn.) to crude oil
levels. J. Sust. Trop. Agric. Res. 16: 98-102.
Aikins, S.H.M and Afuakwa J.J (2008). Growth and dry matter yield responses of cowpea to different
sowing depth. ARPN J.
CRI, (2006). Cowpea Production Guide: Introduction to cowpea production. Available on line
http://www.cropsresearch.org/publications/pdf/cowpea_introduction.pdf
Dadson, R.B, Hashem, F.M, Javaid, I., Joshi, J and Allen, A.L. (2003). Responses of diverse cowpea
genotypes to drought (CD-ROM)
Diouf, D. and Hilu, K.W. (2005). Microsatellites and RAPD markers to study genetic relationships
among cowpea breeding lines and local varieties in Senegal, Genet Resource Crop Evol 52:
1057-1067.
Ehlers, J.D. and Hall, A.E. 1997. Cowpea (Vigna unguiculata L. Walp). Field Crops Res 53: 187-204.
Elowad, H.O.A. and Hall, A.E. (1987). Influences of early and late nitrogen fertilization on yield and
nitrogen-fixation of cowpea under well watered and dry field conditions, Field Crops Research
15: 229-244.
FAOSTAT, (2013). http://www.//faostat3.fao.org/faostat-gateway/go/to/home/E.
Fery, R.L., (2002). New opportunities in Vigna. In: Janick, J., Whipkey, A., (eds.) Trends in New
Crops and New Uses. ASHS, Alexandria, VA, pp. 424-428.
Gwathmey, C.O., Hall, A.E., Madore, M.A., (1992). Adaptive attributes of cowpea genotypes with
delayed monocarpic leaf senescence. Crop Sci. 32: 765-772.
Imungi, J.K.J. and N.N. Porter, (1993). Nutrient content of raw and cooked cowpea leaves. Journal of
Food Science 48 (4) pp. 1252-1254.
Jaetzold, R. and H. Schmidt, (2012). Farm Management Handbook of Kenya, Vol.2/C Eastern Kenya,
Ministry of Agriculture, Nairobi, pp 290-366.
Kamau, G.M. and S.M. Weru, (2001). Cowpea/ maize rotation for soil fertility and soil management:
State of the art document KARI Mtwapa No. 29 – pp100-101.
Kay, D.E. (1979). Crop and product digest No. 3- Food Legumes. London: Tropical Product Institute.
86-101.
Kega, V.M., J.E. Jamoza, P. Kiuru, A.R. Ali, F.K. Muniu, A. Kiru, R.N. Ojiambo and K.K. Dzillambe,
(1994). Report of farming systems survey in Milalani sub location, Kwale district, RRC
Mtwapa. Internal report No. RRP/003.94 pp.9
Langyintuo, A.S., Lowenberg-DeBoer, J., Faye, M., Lamber, D., Ibro, G., et al. (2003). Cowpea
supply and demand in West Africa Field Crops Res 82: 215-231.
Lauriault, L.M. and Kirksey, R. 2007. Planting date and furrow irrigation effects on cowpea for edible
dry bean, Southern High Plains, USA, New Mexico State University Research report 757:8
Muthamia, J.G.N and F.K Kanampiu, (1996). On farm cowpea evaluation in the marginal areas of
Eastern Kenya. In: Focus on Agriculture Research for Sustainable Development in a Changing
Economic Environment. Proceedings of 5th KARI Scientific Conference. 14
th to 16
th October,
1996. KARI Headquarters’. Kaptagat Road, Loresho, Nairobi, Kenya.
Proceedings of the Third International Research Conference 26th to 28th October, 2016 27
Otieno, L., G.M. Kamau, M. Njunie, T.L Munga, A. Blokland, B.K. Kikuvi, F. Jefa and P. Chege,
(1994). A report on diagnostic survey using PRA/RRA techniques in Roka location, Bahari
division, Kilifi district, RRC Mtwapa Internal report No. RRP/0003.94. pp. 3.
Quaye, W., Adofo, K., Madode, Y., Abdul-Razak, A. (2009). Exploratory and multidisciplinary
survey of the cowpea network in the Tolon-Kumbungu district of Ghana: a food sovereignty
perspective. Afr. J. Agric. Res.4:311-320.
Sanginga, N., Dashiell, K.E., Diels, J., Vanlauwe, B., Lyasse, O., et al. (2003). Sustainable resource
management coupled to resilient germplasm to provide new intensive cereal-grain-legume-
livestock systems in dry savanna. Agric Ecosyst Environ 100: 305-314.
Tarawali, S. A., Singh, B. B., Gupta, S. C., Tabo, R., Harris, F., Nokoe, S., ... Odion, E. C. (2002).
Cowpea as a key factor for a new approach to integrated crop – livestock systems research in
the dry savannas of West Africa. In C. A. Fatokun, S. A. Tarawali, B. B. Singh, P. M.
Kormawa, and M. Tamò (Eds.), Challenges and opportunities for enhancing sustainable
cowpea production (pp. 233-251). Proceedings of the World Cowpea Conference III held at
the International Institute of Tropical Agriculture (IITA), Ibadan, Nigeria.
Timko, M.P. and Singh, B.B. (2008). Cowpea, a multifunctional Legume, In: Moore, P.H., Ming, R.
(eds.). Genomics of Tropical Crop Plants Springer, NY USA, pp. 227-257. ******
RE-INVENTING CONSERVATION AGRICULTURE PRACTICES BEYOND 21ST
CENTURY
Michura, E.G.
Kabarak University, P. O. Private Bag 20157, Kabarak-Nakuru. Email: [email protected]
ABSTRACT
Conservation agriculture (CA) is gaining prominence and has been found to be a better option in solving
food scarcity and biodiversity loss. Industrial agriculture (conventional) for a long time has been practiced
with the view of maximizing food production under economic gains without environmental integrity.
Approximately, 30% of the greenhouse gases emissions are produced from agricultural activities and this
has contributed to environmental degradation and poor human health. To save the world from losing its
potential to feed the increasing human population and interrupting ecosystem services, there is greater
need to reinvent agricultural practices and develop more environmentally friendly ways of producing food
and saving biodiversity. This research paper examined reinventing conservation agriculture practices
beyond the 21st century by studying CA practices in two different settings both in developed and
developing countries. The aim is to showcase the importance of CA as a means of saving the world from
further degradation and recommend to the farmers, policy makers, researchers, scientists, politicians,
economists, ecologists among others the dire need to adopt CA technologies. CA is undoubtedly an
option that can result in substantial benefits for certain types of farmers in certain locations. However,
benefits from CA at field level do not necessarily overcome the economic constraints at farm scale and
many of these benefits are only realized in the longer term. CA profoundly alters the flow of resources
(nutrients, labour and cash) at the scale of the farm and above, and hence strong trade-offs exist when
implementing CA. A survey design was employed to collect data through questionnaire and interviews.
The results were discussed and descriptive analysis was used. The study found that CA is a better option
to improve human health through feeding on nutritious food products, protecting biodiversity and
balancing ecosystem services.
Keywords: Reinventing, Farmers, Biodiversity, Food Production, Nutrition
INTRODUCTION
As the population of the world increase, land areas under agriculture are increasing through clearing of
vegetation to produce more food. On the other hand, agricultural land is reducing due to more land
allocated to urban expansion, industries, and other economic activities (Musa and Odera, 2015).

Proceedings of the Third International Research Conference 26th to 28th October, 2016 28
Agriculture itself is facing an immense challenge on how to feed the world global population at the same
time not destroying biodiversity, depleting soil in an environment faced with climate change
(Swaminathan, 2010). How to increase yields to feed a growing population is a huge task. The world
must double food production by 2050 while adapting agriculture to climate change and reducing its
emissions of greenhouse gases. Agriculture is responsible for about 30% of the total greenhouse gas
emissions of CO2, N2O and CH4 while being directly affected by the consequences of a changing climate
(Theodor et al., 2014). The type of farm power and farm machinery, have a significant influence on
intensification and optimization outcomes, and for profit. However, until now, agricultural intensification
generally has had a negative effect on the quality of many of the essential resources such as the soil,
water, land, biodiversity and the ecosystem services which has caused yield and factor productivity
growth rates to decline (Theodor et al., 2014). Recent study observed that, in Africa, the food situation,
coupled with degradation of the landscape is critical. There must be technological ways to increase food
production to avoid widespread starvation. Food production per capita has been declining, and cereal
yields have remained stagnant, since the 1960s. Is it possible to transform and achieve sustainable and
affordable agriculture so that food production is doubled in a way that benefits smallholder farmers and
does not further threaten biodiversity? (Morin, 2015)
There is an urgent need to pro react and reverse this trend by employing innovations that are appropriate
in addressing these environmental challenges affecting human and the environment. The question of
nature and its sustainability is now calling. What is the new paradigm? The new paradigm of “sustainable
production intensification” must recognize the need for a productive and remunerative agriculture, which
at the same time, conserves and enhances the natural resource base and the environment, and positively
contributes to harnessing the environmental services (Thoedor et al., 2014; Caroline et al., 2015).
Sustainable crop production intensification must not only reduce the impact of climate change on crop
production but also mitigate the factors that cause climate change by reducing emissions and by
contributing to carbon sequestration in soils (Seline et al., 2014). Intensification should also enhance
biodiversity in crop production systems above and below the ground to improve ecosystem services for
better productivity and a healthier environment. Agriculture should also aim at producing food products
that are nutritionally healthy for human consumption and avoid creating diseases like cancer.
A set of soil-crop-nutrient-water-landscape system management practices known as Conservation
Agriculture (CA) delivers all of these goals. CA saves on energy and mineral nitrogen use in farming and
thus reduces emissions; it enhances biological activity in soils, resulting in long term yield and factor
productivity increases (Theodor et al., 2014). Other studies indicate that, a few countries in Africa,
Zambia, Malawi, Niger and Burkina Faso are already successfully restoring exhausted soils with richer
sources of organic nutrients, and dramatically increasing both their crop yields and incomes through the
adoption of Evergreen Agriculture. Evergreen Agriculture is emerging as one particularly affordable and
accessible, science-based solution to caring better for the land and increasing smallholder food production
in the tropics (Theodor et al., 2014).CA is a set of soil management practices that minimize the disruption
of the soil's structure, composition and natural biodiversity. CA involves the following; maintenance of
permanent or semi-permanent soil cover (using either a previous crop residue or specifically growing a
cover crop for this purpose); minimum soil disturbance through tillage (just enough to get the seed into
the ground); regular crop rotations to help combat the various biotic constraints.
CA has also promoted; utilization of green manure/cover crops to produce the residue cover; no burning
of crop residues; agro-forestry; integrated disease and pest management; controlled/limited human and
mechanical traffic over agricultural soils; direct seeding; conservation tillage (AGNIC, 2016). It aims at
higher crop yields and lower production costs. Conservation Agriculture is widespread in developed
countries such as North America, Australia and some parts of South America and yet, adoption of CA on
farms in Africa has been limited (Kassam et al., 2009).

Proceedings of the Third International Research Conference 26th to 28th October, 2016 29
Adoption of CA
Given the complexity and knowledge-intensive nature of CA systems and the need to tailor CA practices
to local conditions, a strong capacity in problem-solving around CA among farmers, development agents
and researchers are required. Development and adoption of CA are a dynamic, iterative innovation
process, involving interacting agronomic, socioeconomic and cultural factors that are specific for the local
conditions and institutions. Production objectives and constraints, and risk attitudes of farmers on the one
hand, and the expected benefits and costs of implementing CA on the other hand are two important
aspects that influence adoption (Tangcalagan et al., 2014).
Farmers in Africa often attribute a substantially higher value to immediate costs and benefits than those
incurred or realized in the future, due to the immediate constraints of production and food security that
they face. Yet, many of the benefits of employing CA are only realized in the long term. Farmers adapt
and implement CA technologies with their own understanding of the principles, their aspiration and
possibilities to integrate it into their farming systems, and their actual access to knowledge, advice and
resource (Ngwira et al, 2014). Priority is often given to “demonstrating” CA rather than to reinventing or
adapting it in a participatory manner to the local context, even though the use of local group-based
learning approaches such as, farmer field schools “is increasing. Also, interventions tend to place little
attention on the need of a support system to make the necessary inputs and small equipment available to
farmers e.g. in village shops. Overall, the experiences with CA development in Africa teach us that no
blueprint or silver bullet exists, and no dogmas or rigid prescriptions will do (Theodor, 2014).
Case Studies
Two research studies was conducted in two areas where conservation agriculture is being practiced; one
in a developed country USA among the Amish community in Pennsylvania and another one in developing
country Kenya at Cheptebo community in Keiyo valley. The two areas have completely different socio-
ecological settings and practice CA uses different techniques in food production and land management.
One thing they both have in common is that their agricultural practices are based on deep spiritual values.
In this paper, Amish community was selected for study because of their long history of practicing
conservation agriculture for over 300 years without being influenced by any external economic mode of
farming. The farming tradition has been kept by their spiritual belief. Very little change has taken place
from Amish agriculture except a few cases of farmers who have tried to practice conventional agriculture.
The research was conducted in Lancaster County, Pennsylvania USA. Lancaster County's consist of 1,200
Amish farm families. The Cheptebo AIC Rural Development Project was chosen for study because of
practicing the Farming Gods Way, which in itself is one of the CA practices. Guided by the Biblical
principles, the Cheptebo project has transformed rural communities in Keiyo in farming skills and this,
has resulted in increased food production and conservation of the environment in the area.
CASE STUDY ONE
The Amish Community
The Amish are a group of traditionalist Christian church fellowships with Swiss Anabaptist origins. They
are closely related to, but distinct from, Mennonite churches. The Amish are known for simple living,
plain dress, and reluctance to adopt many conveniences of modern technology. The history of the Amish
church began with a schism in Switzerland within a group of Swiss and Alsatian Anabaptists in 1693 led
by Jacob Ammann. Those who followed Ammann became known as the Amish (Garret, and Garret,
1998) About 250,000 adults and children live in Amish communities in North America, in 28 US states
and the Canadian province of Ontario. Settling in Pennsylvania in the early 1700s, the Amish were
originally a breakaway group led by extreme Anabaptist Jacob Amman. As part of his holy experiment,
his followers live a devout, simple and family oriented life completely separate from the rest of the world.
The Amish have proved to be a resilient social group, but as in every society, there are pros and cons to
the Amish lifestyle (Garret and Garret, 1998).

Proceedings of the Third International Research Conference 26th to 28th October, 2016 30
The Amish community, a religious society is guided by a strong emphasis on family and community ties.
The Amish are an agrarian people who have a long history of using less energy-intensive, albeit
productive, agricultural methods. The low-input farming systems practiced today by Amish farmers have
developed over 300 years and have sustained the Amish as one of the most persistent and successful
subcultures in North America. Strict socio-religious rules control Amish farming practices. As a result,
Amish agriculture depends on traditional elements, such as horse farming and hand labor, and therefore
contrasts starkly with conventional high-input agriculture. However, contemporary Amish agriculture is a
blend of old practices with new ideas, similar in many respects to the low-input sustainable practices that
agricultural researchers are currently experimenting with and designing (Stinner et al, 2015). The Amish
view horses as farm equipment and work with the animals on a daily basis. Horses are used to pull farm
plows, as transportation, and to haul building materials. Knowing how to saddle a horse and enjoy a
leisurely trail ride is wonderful, but does not mean you possess the ability needed to harness a team and
drive them to accomplish food growing and building tasks. The Amish are expert horsemen (and
horsewomen) in every sense of the word. In an Amish community you will readily find a pseudo-vet,
blacksmith and leather shop. Much can be learned from the skilled craftsman for folks hoping to build an
off-the-grid homestead or individuals preparing for a power grid down scenario.
Amish Farming
Amish people honor the Amish farming traditions that have interconnected the family and community for
many generations. At the same time, farmers are building on those traditions by incorporating
conservation practices that will benefit their farms for generations to come (Gaber, 2013). By studying the
immune systems of plants, they have developed a technique that eliminates the need for chemicals.
Response from Amish Farmers
The interviews were conducted in three farms of Amish families. The results include some of the farmers
who tried to blend by embracing conventional practices, but found problems still with pest control. The
farmers narrated how they introduced conventional methods by using chemicals such as pesticides and
herbicides to keep crops healthy and away from diseases. Going out into the field to spray crops with
chemicals is “a chemical warfare”. A farmer explained how he almost lost the crops on his 50 acre farm
when attacked with funguses and pests. That the chemical treatments did little to reduce pest attacks.
Disillusioned by standard agriculture methods, he searched fervently for an alternative. After several
searches, he found what he was looking for. For two years, he studied research in biology, chemistry, and
agronomy in pursuit of a way to save his fields. The breakthrough came from the study of plant immune
systems which, in healthy plants, produce an array of compounds that are toxic to intruders. The immune
response in plants has been dependent on well-balanced nutrition just the same way our own immune
system works. Modern agriculture uses fertilizer specifically to increase yields, he added, with little
awareness of the nutritional needs of other organic functions. Through plant sap analysis, he has been able
to discover deficiencies in important trace minerals, which he can then introduce into the soil. With plants
able to defend themselves, pesticides can be avoided, allowing the natural predators of pests to flourish.
The farmer said instead of growing crops that are healthy with fungicides and pesticides, he grows crops
that are healthy with nutrition.
Methods to grow crops developed through experimentation on the farm are now being used across North
and South America, Hawaii, Europe, and Africa. The methods promise clients high-quality crops, bigger
yields, better taste, and produce that carries a lucrative “organic” label. The Amish farming technology
focuses on actively restoring the nutritional balance found in natural systems. The Amish farmers were
asked questions about their farming techniques and reasons why they have not changed their farming
systems for a long time. The responses were recorded:
Q. Are you Amish by tradition or birth?
R. All the farmers are Amish by birth and tradition.
Q. Are there any differences between how you used to farm and how you farm now?

Proceedings of the Third International Research Conference 26th to 28th October, 2016 31
R. We have kept our way of farming since the beginning except in a few situations (7 % of farmers) have
blended two practices.
Q. Why do you practice this kind of technology in your farms?
R. The technology is safe for human and the environment. Instead of trying to grow crops that are healthy
with fungicides and pesticides, we grow crops that are healthy with nutrition.
Q. Are you facing any pressure from County government to change to conventional methods of farming?
R. Yes, the government officials put pressure on us to go conventional by using chemicals and pesticides.
Q Are your methods of controlling pests effective in controlling pests and other diseases?
R. Yes, it is effectively safe with challenges. We would see a couple bugs out there and feel like doing
something about it. They learned that, if we do nothing about it, things will often take care of themselves.
In the beginning during summer for instance, we saw a lot of horn worms. Before that, we would have to
spray them right away, but this time we waited and a bunch of wasps came along and killed them. Once
we saw that, we started getting really excited.
Q. What are some of the problems that you are dealing with now?
R. One of my major issues in the greenhouse is spider mites, little insects that just love a warm, dry
environment. It’s very hard to control them, even conventionally. We usually get them under control, but
we often lose some yield.
Q. How do you get them under control?
R. Mainly through applying specific trace minerals like iodine and a whole line of ultra-micronutrients.
We analyzed the sap of the plants with the help of a lab and think we have narrowed the problem down to
excessive ammonium nitrates. If ammonia builds up in the plants, it’s bug food, so we need to figure out a
way to convert ammonia fast. One of the scientists developed an enzyme cofactor which we use to
stimulate that ammonia conversion. We figure things out ourselves now rather than call up the chemical
representative.
Q. What is your view on the use of chemical sprays on food crops?
R. Chemical sprays are dangerous not only to plants but to humans. Precautions are taken when spraying
so that you are not in contact with the chemical and children are kept away. One week period is given
which everyone must stay away from the field, but all that is gone.
Q. What else can you tell by looking at your plants not grown with chemicals?
R. They are healthier not just outside but inside also. I don’t fear of any disease.
Q. Do you think plants also have weakened immune system like animals when they take antibiotics
(chemicals like pesticides)?
R. Yes. It might kill the disease, but then because it has weakened the plant, a week later the plant is
much more susceptible to that same disease again. That is the way it is with a miticide. If you come in
here and spray the mites with it, it would kill some of them, but it kills by messing with their hormones,
and the ones do survive will then mature 50 percent faster. So, it is pretty much guaranteed that you have
a huge mite outbreak 10 years later. Instead of doing that, let us figure out what this plant wants and
provide it. They really do respond.
Q. What do agricultural experts say when you don’t need their services?
R. They kept on coming every week with the same story telling us to spray the crops with chemicals, but
we had made up our minds not to spray. The last time they came here, we were out picking tomatoes and
he walked over. He was looking around and talking about this and that, and he didn’t even mention
pesticides. “Well,” he said, “your tomatoes look pretty good.” I thought, “Yes!”
Q. What is the purpose of using minimal tillage or no tilling?
R. Not to disturb the soil and kill useful soil organism important for fertility of soil through aeration and
decomposition.
Q. I can see in your farm, you use organic manure. Why do you prefer this method?
R. It maintains soil fertility by keeping the soil structure in place, not killing microbes in the soil and does
not pollute environment like industrial fertilizer.

Proceedings of the Third International Research Conference 26th to 28th October, 2016 32
Q. Why do you apply mulch in your farm?
R. To protect the soil from exposure to soil erosion and reduce moisture loss.
Q. All the farm activities, horsepower are used and compressed air to operate some machine equipment
you have. Why is this so?
R. The fuel energy is dangerous to the environment and we don’t use it. Horses are part of the farm
equipment, are environmentally friendly and efficient.
Q. You don’t use fuel energy or mechanized system on your farm. Is it traditional or a farmer’s decision?
R. The farming system is deeply embedded from our faith and is passed from generation to the next. We
cannot break it, less it becomes a curse. The farm products are healthy and we depend on nutritious food
to keep us healthy and environment pollution free.
Q. Your crops look healthy, tasty and smell good. Is that the reason?
R. For human to stay free from modern diseases, we need to eat nutritious food free from any chemical.
RESULTS AND DISCUSSION
The survey showed 90% CA adoption practices such as cover crops, minimal soil disturbance and organic
manure. The Amish communities strive to live apart from the “world” and may be discouraged from
working with government entities and attending non-“Plain people” events. Educators must design
outreach strategies that take into consideration the diversity of Plain producers and that overall these
materials should be practical and straightforward. In most cases how farmers care for their land and
animals can be interpreted in dramatically different ways by individual farmers. This results in a myriad
of technological and philosophical adoptions that do not necessarily imply community consensus about
what it means to be an “Amish dairy farmer.” Views on organics, GMOs, agricultural technology, and
animal care differ not only between settlements, but family members. These attitudes are found to be
fostered through close attention to contemporary science, consumer trends, and national economic and
political infrastructures (Joerger, 2013). Horsepower is the main source of energy in the farms. 95% of
Amish farmers use horse power and about 5% modern machines. Modern farm equipment can be adapted
to horse-drawn power, or purchased ready to roll from the Amish farmers. Horse-drawn farm equipment
became scarce after the 1940s. Amish mechanics often operate shops which both serve their community
and members of the general public seeking non-gas powered farm machinery. Seed preservation, natural
fertilization procedures, crop rotation, irrigation and drought survival tips are also valuable agriculture
tips we can learn from the Amish.
Amish farmers have greatly diversified their crop farming and every member of the family participates in
farming activities including children who are taught techniques in farming. With diverse crops on small
farms, with a conservative approach to farm technology and with constant manual exertion, even by little
children, this region's Amish has largely escaped the high debt that has put over 300,000 family farms out
of business since the 1970’s.The Amish is providing a stable economic base for a country with one of the
nation's most vibrant farm economies. Sloping fertile Lancaster County is crowded with white
farmhouses and silos spring from the valleys like silver-topped mushrooms. Amish farmers protect
themselves from the cycles of boom and bust in agriculture by operating diverse production systems.
Most have herds of milk cows and grow feed corn, alfalfa, hay, wheat, tobacco, vegetables and fruits.
Some raise poultry and cattle. Others breed horses and raise mules. One farmer can own up to 65 dairy
cows, but most farmers own on average 45 dairy cows.
The Amish also avoided Government farm supports. The programs require farmers to idle acreage as a
requirement for receiving benefits. The farmers are proud of their system and do not need handouts. An
Amish system of farming has been found worth adopting and their system has been used as a model for
the Mennonite and ''English'' farmers in the region. The Amish community of Lancaster County numbers
approximately 7,000 people and is growing quickly. Although the Amish owns less than a quarter of
Lancaster County's 5,000 farms, Amish farmers generally till 70 to 80 acres, enough for one family to
handle, but one-fifth the size of the average American farm. The average non-Amish farm in the county is

Proceedings of the Third International Research Conference 26th to 28th October, 2016 33
not much bigger. Mules and horses haul implements at a cost Amish farmer say is one-third that of a
tractor. The Amish buys mechanical harvesting equipment that is pulled through the fields by teams, but
whose machinery is powered by independent gasoline or diesel engines. The Amish developed advanced
programs for rotating crops, applying manure and fertilizer and growing along ridge tops to lessen
erosion. They buy the best seed. Amish farmers produce as much corn per acre and as much milk per cow
even better than the conventional practice in dairy farming.
In the farming system labor is shared and hence less labor cost. From the time they are toddlers; Amish
children are regarded as important additions to the farm system. Children are educated in one-room
schoolhouses until the eighth grade, and then become full-time helpers. Eight children in a family are not
unusual. 'They have to work for it. Amish families help one another at planting and harvesting and that
children are taught that they are central in the community. ''We have to eat,'' they said. It was found that
the Amish system would not work for most American farmers and their families. ''People just don't want
to work that hard anymore, Lancaster County farm agents said. Farmers also believed that, that smaller
farms might be more suitable. Other studies have agreed with this finding that small farms would be
appropriate to practice conservation agriculture (Thuo, 2013). Net profits on Amish farms are unusually
high. An Amish farm of 80 acres, 40 cows, and five acres of tobacco, vegetables and fruit can earn a gross
annual income of $125,000 or more. Because of their religion's demand for ''plainness,'' annual expenses
for feeding, clothing and housing an average Amish family with six children total $6,000 to $8,000.
Amish farmers generally have moderate debts, principally in loans for land.
Discussions on Techniques of Amish Farmers
No-till planting techniques, has been used on the farms since 1979. No-till has kept the soil in place and
the crops in good condition. Contour strips also add extra benefit and improve crops. Farmers construct a
variety of on-farm conservation improvements that will do for the rest of his farm what the no-till and
contour strips have done in his fields; improvements like the construction of a new manure storage
facility, a storm water collection system, stream bank fencing and crossings, and the planting of
streamside trees and shrubs. Established on-farm conservation improvement effort and conservation,
nutrient and manure management plans (Garber, 2013). Pennsylvania Agriculture Program Manager
indicated that, Amish farmers really address all the conservation needs that we might find on a Plain Sect
farm and beyond (Garber, 2013). Other researchers found organic farming as a lark, a profitable process
for a handful of farmers and an indulgence for a handful of consumers, a pie-in-the-sky dream that sounds
nice but won't fly in our quest to feed the world. But a new survey suggests otherwise (Nosowitz, 2016).
Amish farmers, mostly use the forest as a buffer and to protect their farms. The Lancaster County in
Pennsylvania Sate is beginning to encourage farmers to use the forest as buffers in order to conserve and
manage wetlands. The County is making efforts in the restoration of entire stream systems--restoring
water quality, bringing back fisheries and aquatic life (Nosowitz, 2016).Some conservation practices
found include; a new manure storage facility; barnyard waste and run-off collection system; storm water
collection system, including gutters and downspouts; milk house waste rerouting system takes milk waste
to newly constructed manure storage pit; streamside tree planting of mixed native shrubs and trees; stream
bank fencing and stream crossing; cropland terrace; and grassed waterway.
Amish for a long time have used organic manure from the animals they keep. The four main pillars of
sustainability include productivity, economics, environment, and community well-being, which in
essence can all be answered with organic farming. Organic farming, is concerned primarily with soil
health, promotes better quality soil, less polluted water, lower greenhouse gas emissions, and greater
biodiversity of plants, animals, and microbes (Reganold and Wachter, 2016). Organic farming systems
produce lower yields compared with conventional agriculture. However, they are more profitable and
environmentally friendly, and deliver equally or more nutritious foods that contain less (or no)
pesticide residues, compared with conventional farming. Rather, a blend of organic and other

Proceedings of the Third International Research Conference 26th to 28th October, 2016 34
innovative farming systems is needed. Significant barriers exist to adopting these systems, however,
and a diversity of policy instruments will be required to facilitate their development and
implementation (Reganold and Wachter, 2016).
CONCLUSIONS
Amish community has practiced conservation agriculture for hundreds of years and have found that the
CA is one of the best in the world and for a long time have preserved it without any government influence
to practice modern farming known as conventional. Spiritual faith in the CA system is important and is
the stamina in maintaining the practice. Amish people have large families and in the light of the present
economic problems, they have kept a simple life using simple equipment to realize their goals and feed
their families with less cost. The Amish families are healthy because they strictly use technologies that do
not contaminate their environment and feed on agricultural produce that are grown with less or no
chemicals. They eat notorious food to keep them healthy and live a long life’. Their method of agriculture
is challenging, especially when the population of the world is growing fast to an extent that the CA may
not solve world food problems, but farmers who adopt CA believe that it can bring relief to the world
food crisis if all governments embrace it and support farmers. The issue here is not whether CA will
support human populations in the future, but it is how CA can be adopted in a manner befitting the Eco
socioeconomic differences. In conclusion CA is a better option for all the farmers in any geographical
region especially for smallholder farmers. American agriculture is steeped in a chemical-intensive system
that wastes money and pollutes the environment. But by making use of new technology and innovative
approaches, farmers can boost production and profits while at the same time improving soil quality,
enhancing biodiversity, improving human health and protecting habitat.
RECOMMENDATIONS
1. The US government should encourage Amish farmers and support the reinvention in conservation
agriculture, by providing them with the resources they need to improve their yields.
2. Conventional farmers should be encouraged to blend with CA practices until they are able to
accept the fact that CA is the system of the future.
3. The government to create a market for the healthy and nutritious Amish produce.
CASE STUDY TWO
Cheptebo AIC Rural Development Project
The data was collected through interviews and focus group discussions. Twenty staff from Cheptebo rural
project and thirty farmers from the local community participated in the discussion sessions. I also use
observation techniques to build on what was relevant for my study. Descriptive method of analysis was
used. The essence here was to establish the techniques used in Farming Gods way and its implications on
the farming environment.
Background Information
The conservation project started in 1986 by a missionary from United Kingdom with a view of changing
the lives of Cheptebo community in Keiyo valley in Kenya. The project was started on a Christian
foundation which targeted local community to do farming in a sustainable manner through spiritual value
guidance. This was later known as Farming Gods way. The aim is to improve the standard of living of
Cheptebo community in a sustainable way by growing healthy farm products and conserving the
environment for now and future (Kimeli, 2016). Since then the project has expanded greatly and is highly
diversified. The Cheptebo development project is now integrated and runs many activities such as
demonstration farms, forestry, training facilities, tourism agribusinesses, soil conservation among others.
The Cheptebo community rural life has been enhanced and poverty has been reduced. Feeding on food
raised in an environment involving healthy farming practices is the sole aim of Cheptebo rural
development project (Kimeli, 2016)

Proceedings of the Third International Research Conference 26th to 28th October, 2016 35
Farming Gods Way
The initial concept was developed by Brian Oldrieve in Zimbabwe in the late 1980’s who coined the
practice as “Farming God’s Way”. The reason for this unique title was in part to bring faith back into
agriculture. According to Oldrieve, this spiritual link contributes significantly to its widespread adoption
among small-holder farmers in Southern Africa (Twomlow and Lewis, 2006).Farming God's Way is not
just a technology but a well-balanced biblical, management and technological solution for the agriculture
domain, equipping the poor to come out of poverty with what God has put in their hands and revealing
the fullness of His promised abundant life (Dryden, 2013). Farming God’s Way’ encourages farmers to
adopt a Bible-based version of conservation agriculture to curb food insecurity in the continent. “This
method of farming helps farmers reap abundantly and in the same way enrich the soil by restoring its
original structure just how God made it (Dryden, 2013).
The new farming method is pegged on three principles that land should not be ploughed; cover vegetation
not disturbed and encouraging crop rotation. The technology, originally developed in Zimbabwe, is being
fronted over conventional farming as soil acidity owing to over exploitation of fertilizer had damaged the
soil micro-organisms thus lowering yield. That with mulching, water conservation is improved, unlike on
bare soil where there is increased evaporation. “There is no weeding thus cancelling out on the intensity
of labor,” and there were no cases of crop disease where the technology had been employed (Muchui,
2015).Cheptebo Centre is located in the Keiyo District in the heart of the beautiful southern Keiyo Valley.
It is served by a good tarmac road (C51) and is 33 Km from Iten town to the west and 20 Km from
Kabarnet to the east. The project is located next to the C51 about 5 Km west of Chebloch Bridge on the
Keiyo River. The Centre is clearly signposted on the main C51 road. The valley climate is mild with
temperatures usually below 28 °C (82 °F). Most rain falls during the March–June and October–November
periods and generally below 500mm. The vegetation is of semi-arid to tropical grassland. The soils here
are well drained, deep and in many places have an acid humus top soil. Natural fertility is rather good.
The soils here are prone to erosion sometimes experience landslides because of its slope degree.
Objectives of the Project
1. To preach the gospel of Jesus Christ in word and deed
2. Empower local community spiritually, socially, economically and environmentally.
3. Farming God’s way, meaning careful use of environmental resources to meet community needs.
4. Reduction of poverty level in a highly dry environment.
FINDINGS AND DISCUSSIONS
Activities Encompassing the Project
Livestock Farming; include dairy cows, dairy goats, poultry and bee keeping. The dairy cows and goats
are mainly under semi-zero grazing practices. Zebu animals upgrading (demonstration farm); Jersey,
Sahiwal, Friesian crosses – this is mainly to improve dairy animals in the local community and dairy
goats for milk. It was found that the dairy crosses are easily managed by the community. The project
started with six dairy goats which have increased so far and a lot has been sold to the communities both
for sale and milk production. The well-kept indigenous plants are ideal for bee keeping providing high
quality honey for consumption and sale. The project has several varieties of crops, mainly grown under
drip irrigation because the place is generally dry. Crop grown include; grains and fruits such as; maize,
beans, finger millet, sorghum, bananas, oranges, lemons, mango, avocado. Vegetable such as kales,
cabbages, onions, tomatoes, sweet potatoes are grown in open and greenhouses using drip irrigation.
The tree nursery stand includes many varieties of both fruit and non-fruit tree. The purpose of establishing
a tree nursery is to provide seedlings to the local community for increased forest cover to keep cool, their
environment, soil erosion control, increase soil fertility, attracts rainfall, beautification of the
environment, medicinal purposes, supply of food (fruit trees), fuel, timber for building and construction.
The project aim is to preserve indigenous tree species. Soil conservation is a primary goal of the project.

Proceedings of the Third International Research Conference 26th to 28th October, 2016 36
Since the area is on a gently sloppy terrain towards the floor of Keiyo valley, farmers are advised to
protect the top fertile soil (alluvial mix) for their continued use of the land to grow crops. This is done
through terracing, strip farming, crop rotation use of organic manure and tree planting.
Mulching is done through the use of Vetiver grass used for absorption of heavy metals. Vetiver can be
planted along the roadside for erosion control. Training facilities; the project center has created new ways
of empowering the local communities through training of farmers. The local farmers now rely on the
conservation expertise within the Centre, which is equipped with demonstration farms, equipment and
facilities for dissemination of information. The Centre is not only training local farmers at a low cost, but
is open to a wider society. Well organized groups, farmers, institutions, visiting teams, education
institution’s researchers, scientists from all over the world come here to learn “farming God’s way”. The
project Centre contains a wealth of resource information for all fields of research study and learning. It
was found that 92% of the local community has benefitted and about 20% from other communities of the
project since it started in 1986. Biogas production is made from animal waste. Here nothing is wasted.
There is recycling of waste from the farm, from the kitchen, latrine and waste from rotten crop products.
The animal manure is processed into production of biogas which the center uses. The local community
has been trained to use their waste generation into fuel gas production and other ornaments. 60% of the
fuel used to run the facility is from biogas especially used for cooking. Field days; local farmers and
visiting teams are invited for field days, which provide an environment for learning farming God’s way. It
is used for demonstration, farmer training and commercial production. Located in a semi-arid area, the
farm has developed a specialization in production techniques appropriate to such areas.
Farming Techniques
It was found that 95% of farming activity is farming God’s way. The main farming activities involve:
Farming focuses on drought tolerant crops such as millet, cassava, sorghum tolerant maize variety, sweet
potatoes, simsim among others. Vegetable and fruit production are under drip irrigation, which use little
water. It employs trials and demonstration of water efficient irrigation techniques. Crop rotation and
application of organic manure is of the essence in the farm. Fodder is grown mainly for livestock. The
Centre maintains a central tree nursery providing farmers with some 50,000 tree seedlings per year.
Seedlings are produced in a disease free environment and are of guaranteed type and quality. Fruit tree
seedlings, fodder trees, ornamentals and other varieties are normally available for sale. Grafted mango
seedlings are in particularly high demand. From a mature mother block at the Centre, Scions are available
for grafting from the following varieties – Apple, Ngowe, Van Dyke, Kent, Sensation and Tommy
Atkins. Grafted citrus (Washington Navel), papaya (local varieties and Solo), avocado indigenous tree
seedlings are available for sale. In addition to stock of seedlings for wood fuel, timber and indigenous
varieties are normally in stock. It was observed that the project has realized a number of its objectives:
The poverty rate in the local community has reduced by 30% especially household families practicing
new methods of agriculture-farming God’s way. Soil erosion has reduced in the area and soil fertility
maintained. More trees planted has reduced the temperature, hence lots of tree shades for cooling the
environment. Income source from dairy, crops, fruits, and beekeeping has been diversified and increased
in the Cheptebo community. More natural plants have been preserved and kept to provide medicine and
food products.
The Centre has also impacted positively by providing spiritual guidance to the entire community in order
to live a morally upright life. The project has created job opportunities for the community and therefore is
an important avenue for growth and development of the community. Compost and mulch; Compost are
the biologically active material that results from the decomposition of organic matter under controlled
circumstances. Mulch is any material, organic or inorganic, that is spread over garden soil to cover it.
They are used to keep the soil fertile all the time and helps to increase crop yield and reduce the cost of

Proceedings of the Third International Research Conference 26th to 28th October, 2016 37
purchasing industrial fertilizer or synthetic which is expensive for farmers and causes diseases in human
and kill organisms in the soil. The project has developed varies species that are found to do well in a hot
dry climate. Lucerne, is a leguminous, high protein livestock feed. Grafted Mango seedlings are now
produced in large quantities at the Centre tree nursery. Farmers are able to purchase quality assured
seedlings of various varieties suited to their particular needs and preferences. Mango Fruit Fly Pheromone
Trap technique is used to get rid of pests. With the very rapid increase in mango production in the
southern Keiyo valley, the mango fruit fly has become a major problem which seriously affects fruit
quality and harvests. Chemical spraying has been costly, fairly ineffective and leaves chemical residues
on the fruit. A very effective alternative control method, recently introduced at Cheptebo, is the Mango
Fruit Fly Pheromone Trap which uses pheromones to attract and destroy male fruit flies, thus breaking the
breeding cycle. The results have been very positive and local farmers are now adopting this innovation.
Tissue Culture Banana plantlets techniques are employed to increase banana production and produce
healthier plants.
Slow rates of natural reproduction and disease problems have necessitated the introduction of this new
innovation. Plantlets are raised in sterile, laboratory conditions of disease free parent material. The
plantlets are then supplied to Cheptebo for growing on and subsequent sale. The known varieties which
are disease free and suited to various growing conditions and market demands are made available in this
way to local farmers. Drip Irrigation provides a very efficient way of utilizing limited water supplies in
semi-arid areas. The Cheptebo farm operates and demonstrates various techniques based on water
efficient irrigation principles. The farmers felt they needed more support from the government and NGOs
and agricultural subsidies as incentives to food production and biodiversity conservation in the area. The
farmers need to be equipped with the right equipment to enable them realize conservation agriculture.
CONCLUSION
There is much more to it than teaching farmers about Conservation Agriculture. Farming Gods Way
teaches how to conserve the resources and produce healthy nutritional foods for human health and, not
only showing how to farm in a sustainable way but also providing training in transformational
development. We want people's lives to be changed through what they have learned. Ultimately, we want
the land and people’s lives to be restored. Farming God's Way is teaching farmers how to care for their
environment while increasing crop yields, locking carbon into soil and reducing soil erosion. It is also
teaching transformational development and key business skills and providing hope for the future. The
people in the Cheptebo rural community have their lives have been changed for good. Having the skills
and appropriate technology is the key to sustainable development. Reinventing conservation agriculture is
the way to go in the future. Farming God’s way is beneficial in a number of ways; less cost on land
ploughing, increase in yields, adapted to low rainfall regions, low labor cost, soil is kept fertile and grow
healthy crops.
RECOMMENDATIONS
1) Develop policy on Conservation Agriculture to support small-scale farmers with a view of increasing
their potential in food production.
2) Government forestry department and NGOs to supply free or less cost effective seedlings to farmers,
particularly fruit trees and indigenous species.
ACKNOWLEDGEMENT
I am grateful to my wife Anne Garry, who provided me with social and financial support and time to do
research, Dr. Eba Ong’ele who provided me with a research environment and facilities for collecting data
and writing my work in Maryland, United States, Heidi Gaultney who organized research interviews with
the Amish community in Pennsylvania.

Proceedings of the Third International Research Conference 26th to 28th October, 2016 38
REFERENCES
AGNIC. (2016). What is Conservation Agriculture. The Conservation Agriculture Group at Cornell
University Howard G. Buffett Foundation and the Atkinson Center for a Sustainable
Future.http://conservationagriculture.mannlib.cornell.edu/pages/aboutca/whatisca.html.
Caroline Brock, Jessica D. Ulrich-Schad, and Linda Stalker Prokopy (2015). Bridging the Divide:
Agricultural and Conservation Support for Plain Producers. The Amish and Agriculture.
.http://www.etown.edu/centers/young-center/amish-conference2016-fri-abstracts.aspx
Dryden, G. (2013). FARMING GOD’S WAY Field Guide. Liberty University.
http://docplayer.net/258936-Farming-god-s-way-field-guide-by-grant dryden.
Garber, L. (2013).A Model for Conservation Practices on Amish Farms. Saving A National Treasure.
Chesapeake Bay Foundation.
Garret, Ottie A and Ruth Irene Garret. True Stories of the X-Amish: Banned, Excommunicated and
Shunned, Horse Cave, KY: NeuLeben, 1998.
http://cbf.typepad.com/chesapeake_bay_foundation/2013/02/raymond-king.html Impact Factor:
3.40 · DOI: 10.1016/0167-8809(89)90074-1
Joerger, W. N. (2013). Religion, Science and Diverse Farming Methods among the Amish.The Amish
and Agriculture.http://www.etown.edu/centers/young-center/amish-conference2016-fri-
abstracts.aspx.
Kassam, A., Friedrich, T., Shaxson, F., and Pretty, J. (2009). The spread of Conservation Agriculture:
justification, sustainability and uptake. International Journal of Agricultural Sustainability, 7(4),
292-320. http://dx.doi.org/10.3763/ijas.2009.0477
Kimeli J. (2016). Farming Gods Way. Cheptebo News. http://www.cheptebo.org/news.htm.
Morin R, (2014). Amish-Farmer-Replacing-Pesticides-With-Nutrition.
Http://Www.Theatlantic.Com/Health/Archive/2014/10/380825/
Muchui, D. (2015). Farming Gods Way Pass off for Groups. Daily Nation Saturday 2016.
http://www.nation.co.ke/business/seedsofgold/Farming-Gods-way-pays-off-for-group-/-
/2301238/2718036/-/if0qsyz/-/index.html.
Musa M. Kiio and Odera, P. Achola (2015). Land Use Land Cover Changes and their Effects on
Agricultural Land: A Case Study of Kiambu County – Kenya. Kabarak Journal of Research and
Innovation Volume 3 Number 1 (2015) ISSN 2305-784X (print) ISSN 2410-8383 (online)
http://eserver.kabarak.ac.ke/ojs/
Ngwira, F. H. Johnsen, J.B. Aune, M. Mekuria, and C. Thierfelder (2014). Adoption and extent of
conservation agriculture practices among smallholder farmers in Malawi. Soil and Water
Conservation Society. Journal of Soil and Water Conservation 69(2):107-119. www.swcs.org
Nosowitz, D. (2016). Organic Farming Could, Maybe, Feed The World, Say Scientists. Farm Food and
Life. Modern Farmer.http://modernfarmer.com/2016/02/john-reganold-organic-agriculture
Reganold, P. J. and Wachter, J.M. (2016).Organic agriculture in the twenty-first century. Nature Plants 2,
Article number: 15221 (2016) doi:10.1038/nplants.2015.221
Seline S. M., Delia, C., Oluyede C. Ajayi, G., W. Sileshi and Maarten N. (2014): The role of Knowledge,
attitudes and perceptions in the uptake of agricultural and agro forestry innovations among
smallholder farmers in sub-Saharan Africa, International Journal of Agricultural Sustainability,
DOI:10.1080/14735903.2014.912493
Stinner, D. Paoletti, G. M. and Stinner B.R. (2015).In search of traditional wisdom for a more
sustainable agriculture: A study of Amish farming and society. In Agriculture Ecosystems and
Environment 27(1-4):77-90 · October 1989 with 154 Reads
Swaminathan M. S. (2010). Reinventing Agriculture in the 12st Centaury.1987 World Food Laurete.
http://intranet.icraf.org/docs/evergreen_brochure.pdf.
Tangcalagan, C, Kent; Ma. Elena Chiong-Javier and Manuel R. Reyes (2014). Gendered Benefits and
Challenges of Conservation Agriculture: Implications for Smallholder Adoption in Developing
Countries. De La Salle University, Manila Philippines

Proceedings of the Third International Research Conference 26th to 28th October, 2016 39
Theodor Friedrich, Josef Kienzle and Amir Kassam (2014) Conservation Agriculture in Developing
Countries: The Role of Mechanization 1.Food and Agricultural Organizations of United Nations.
Research Gates Publishers.
Tunoi K., (2013). Farming Gods Way Needed Eases for Princely Fertilizers.
http://www.standardmedia.co.ke/article/2000089802/farming-god-s-way-eases-need-for-pricey-
fertilisers
Twomlow, Steve and Lewis Hove (2006). Is Conservation Agriculture an Option for Vulnerable
Households? Department for International Development. ICRISAT. Briefing Note No. 4.
Retrieved February 24, 2009
******
NUTRITIVE VALUE OF WHEAT AND PUMPKIN FLOUR BLENDED PRODUCTS
Kiharason, J.W.*1, Isutsa, D.K.1,2 and Ngoda, P.N.2
1Chuka University, P. O. Box 109-60400, Chuka; P. O. Box 484-60400, Chuka, Kenya 2Egerton University, P. O. Box 536-20115, Egerton, Kenya
*Correspondence: [email protected], [email protected]
ABSTRACT
Pumpkin (Curcubita moschata Duch.) is utilized for its leaves, marrow, fruit pulp and seeds. There is
need to add value to the raw pumpkin products to fit into the dietary need of consumers, who are
exhibiting a shift in eating habits and preferences. The shift of mineral compositions of composite flours
after processing to end products necessitated the present study to be undertaken to determine the effect of
preparation of different pumpkin-wheat flour-blended products. Uniform mature pumpkin fruits grown by
the researchers in the Chuka University research farm were harvested and processed into flour, using a
previously developed protocol. The pumpkin flour was blended with wheat at 0%, 5%, 20%, 80% and
95% w/w and used to bake bread, cakes, cookies, scones and mandazi, analyzed for protein, beta-
carotene, zinc, iron and calcium, using distillation and spectrophotometric methods. Analysis of variance
revealed significant differences among the products and nutrients. In bread, there was significant
difference (P<0.05) in zinc, with 0% flour giving 5.8 ppm and 95% flour giving 1,011.3 ppm, which was
above the recommended daily intake. In cakes, significant difference (P<0.05) was observed for protein,
iron and calcium, with 95% flour giving a high of 12%, 469 ppm and 4126 ppm, respectively. Cake
contents were higher than bread contents. In cookies, significant difference (P<0.05) resulted in protein,
beta-carotene, iron and calcium. The 95% flour had high 4,379 ppm calcium and 367.5 ppm iron, which
were above RDI levels, while protein and beta-carotene were below daily intake requirements. For
mandazi, protein, iron and calcium showed significant difference (P<0.05) and a high of 11.17%, 228
ppm and 4,000 ppm, respectively. It is evident that augmenting pumpkin flour increases nutritive value of
food products. Augmentation levels recommended for adoption in human food will be discussed.
Keywords: Baking, Nutrition, Postharvest loss, Preservation, Value Addition
INTRODUCTION
Pumpkins belonging to the genus Cucurbita are natives of Central and South America and have spread all
over the tropics and subtropics. Pumpkin (Curcubita moschata Duchesne) is a multipurpose fruit and leaf
vegetable (Mnzava and Mbewe, 1997). Pumpkins are extensively grown in tropical and subtropical
countries where they are traditionally consumed as freshly boiled and steamed or as processed foods such
as soups (Bhaskarachary et al., 2008). The cooked mature fruit of pumpkin is popular for making sweets
and desserts in South-East Asia where fruit flesh is steamed with grated coconut and sugar, or steamed
fruit flesh is dusted with cassava flour and fried into crisps. The fruit is prepared into multiple dishes. In
Swaziland, the flesh is cut into cubes, boiled and thickened with mealie meal to make sidvudvu; when
milk is added it is called ludvwidvwi. Commercially in China, India and USA, pumpkin is canned.
Cucurbita moschata has medicinal applications in Thailand and China (Mnzava and Mbewe, 1997).
Proceedings of the Third International Research Conference 26th to 28th October, 2016 40
Pumpkin can be processed into flour which has a longer shelf life. Preservation of vegetables and fruits is
an excellent way to curb post-harvest losses which are major challenge in Sub-Saharan Africa countries
(Ptichkina et al., 1998; Gajigo and Lukoma, 2011). The rich nutrition base of pumpkin can be tapped to
improve the nutritional quality of baked products, soups and sauces. Pumpkin powder contains 40%
cellulose, 4.3% hemi-cellulose and 4.3% lignin, the main components of insoluble dietary fibre (Ptichkina
et al., 1998). Consuming this fibre is reportedly protective against degenerative disorders such as diabetes
mellitus, cardiovascular diseases, constipation, appendicitis, hemorrhoids and colon cancer. Fruit fibre
buffers the stomach pH by binding to the excess acids produced by the digestive system, helps in fecal
bulking and intestinal emptying (Vergara-Valencia, 2006).
Pumpkins are very rich in macro- and micro-nutrients, including calcium, iron, vitamin A, specifically
unsaturated oleic and linoleic acid oil, protein, with high amounts of arginine, aspartate and glutamic acid
(Usha et al., 2010). Due to high omega-3 (6 and 9) fatty acids, seeds and oil have been claimed to
promote HIV/AIDS wellness. The lignins and phytosterols, such as delta 7-sterols and delta 5-sterols, are
of special interest. Anti-oxidative compounds such as vitamin E, gamma-tocopherol are also high. In
fresh dried seeds, content of alpha-tocopherol is 37.5 μg/g and gamma tocopherol is 383 μg/g. However,
the potential of pumpkins in food and nutrition security is not fully exploited (David et al., 2007).
Experimental studies suggest that a higher dietary intake of carotenoids offers protection against lung,
skin, uterine, cervical, gastrointestinal tract cancers, muscular degeneration, cataracts, and other health
conditions linked to oxidative or free radical damage (Mavek et al., 2007). Special physiological activity
of these compounds as vitamin A precursors and antioxidants provokes increasing interest among
researchers in determining their content in different products (Mavek et al., 2007). Pumpkin is high in
beta-carotene, a major source of vitamin A, which gives it yellow or orange colour and plays a crucial
role in prevention of chronic diseases during adult life due to their antioxidant abilities (Blumberg, 1995;
Jones and Engleson, 2010).
Today rapid changes are taking place in every human activity domain, prompting deepening of consumer
choice issues. Consumers are becoming more conscious of healthy eating and prefer locally grown foods
that support a healthy lifestyle more than imported foods. To find success in today’s market, food
products must be conveniently prepared, while cutting back on saturated fat, cholesterol, sodium and
calories (Barkema, 1993). But with changing lifestyles, there has been a fundamental shift in people’s
eating habits in favour of convenience, speed and nutritional benefits. Consequently regardless of culture
and region, urban households are changing food consumption patterns by moving from home cooked
meals to processed ones (Goyal and Singh, 2007). Thus, modern consumers are counting on the food
industry to play a major role in meal preparation (Barkema, 1993; Ene, 2008). Consumer preferences
have taken over and are geared towards taste, price, nutrition, health, technological innovation and
convenience (Ene, 2008). The increasing demand for convenience is due to time constraints. Presently,
there are more convenience products and snacks consumed at the workplace than before (Ene, 2008).
The downturn of this shift is that traditional food crops are facing poor consumption, especially in urban
and cosmopolitan centers where dwellers are purchasing more processed and packaged food (Onyango et
al., 2008). Traditional cuisines have been replaced with away-from-home consumption meals, comprising
mainly fast foods. Furthermore, pleasure in eating fast foods is a major characteristic of today’s
demanding or “spoilt” consumer, who is looking for reward and comfort in food (Ene, 2008).
The consumption of baked products such as bread, cakes, biscuits and doughnuts made from wheat flour
is very popular (Young, 2001) and such are the third most important components of staple diets (Cichon
and Misniakiewicz, 2001). Their nutritional value depends on the recipes used in production. The low
protein content of wheat flour, due to deficiency in one or two essential amino acids, and yet it is the most
vital ingredient in these baked products, is the major concern in its utilization (Gopalan et al., 1991;

Proceedings of the Third International Research Conference 26th to 28th October, 2016 41
Young, 2001; Cichon and Misniakiewicz, 2001). The use of white flour from processed whole wheat
grain leads to drastic reduction in nutritional density and fibre content (Maneju et al., 2011). These days,
awareness by consumers on the need to eat high quality and healthy foods, known as functional foods that
contain ingredients providing additional health benefits beyond the basic nutritional requirements, is
increasing (Ndife and Abbo, 2009). Therefore, the trend is to produce specialty breads made from whole
grain flour augmented with other functional ingredients. Use of functional ingredients is increasingly
becoming important in bakery industries and emerging markets (Dewettinck et al., 2008). Bakery and
confectionary products are fortified with nutrients for enrichment (Tee and Lim, 1991). Functional snacks
that combine the nutritional benefits of wheat flour with the rich pumpkin four has been proposed for the
market to cater for different clientele looking for increased intake of essential nutrients and fiber. The
objective of the present study was to formulate and develop functional baked and deep-fried snacks using
wheat flour composited with pumpkin flour.
MATERIALS AND METHODS
Preparation of Pumpkin Flour
Pumpkin flour was prepared from mature pumpkin fruits of one landrace grown in the Chuka University
farm. Fruits were peeled, enhanced-solar-dried and ground to powder using previously developed
procedures (Kiharason et al., 2017).
Formulations of Pumpkin-Blended Products
Five types of bakery products namely: cake, cookies, scones, bread and mandazi were prepared using five
levels of pumpkin flour to substitute wheat flour in the formula of each product at 0%, 5%, 20%, 50% and
95% rate. The ratio of pumpkin and wheat flours was varied in each recipe, while holding all other
ingredients constant. All products were arranged and tested in a Completely Randomized Design (CRD).
Recipes used in preparing the products are as described below:
Wheat and pumpkin flour blended cake
The ingredients were 200 g (50%) all-purpose wheat flour, 200 g (50%) pumpkin flour, 200 g margarine,
200 g sugar, 10 g baking powder and 3 eggs. The flours and baking powder were sifted, margarine rubbed
in followed by sugar addition and mixing. Eggs were then beaten, added to the mixture and mixed
thoroughly. The mixture was poured into tins and baked at 135oC for 35 minutes until the cake developed
a distinct scent and golden brown crust.
Wheat and pumpkin flour blended cookies
The ingredients were 200 g (50%) all-purpose flour, 200 g (50%) pumpkin flour, 160 g butter at room
temperature, 40 g shortening, 2 eggs at room temperature, 200 g sugar and ½ teaspoon salt. The butter
and shortening were mixed together using a wooden spoon until uniform. Sugar was added and mixed
until ingredients were light and fluffy. Eggs were added and the mixture stirred until ingredients were
well combined. The flour, baking powder and salt were whisked together in a separate bowl and ⅓ of the
dry ingredients added to the bowl of wet ingredients and stirred until they were just combined. Dry
ingredients were gradually added continuously while stirring. The oven was pre-heated to 205°C and a
baking sheet lined with parchment paper. The dough was scooped out using a tablespoon and shaped into
balls using clean hands. Each ball of dough was placed onto the baking sheet, leaving about 5cm of space
all around for spreading as it cooked. The cookies were baked for up to 10 minutes, removed from the
oven, cooled for 2 minutes, loosened using a spatula and placed on wire racks to cool down.
Wheat and pumpkin flour blended scones
The ingredients were 200 g (50%) all-purpose flour, 200 g (50%) pumpkin flour, 30g fat, 125 ml milk,
12.5 g baking powder, and 2.5 g salt. The flour was sifted with other dry ingredients into a large mixing
bowl and rubbed in fat while aerating at the same time. A deep well was made in the flour where almost
all liquid ingredients were poured and mixed to soft dough with a palette knife. The remaining liquid

Proceedings of the Third International Research Conference 26th to 28th October, 2016 42
ingredients were added. On a floured surface, dough was kneaded very lightly until it was just smooth and
divided into two pieces that were each lightly shaped into a ball. Each piece was then flattened to 2 cm
thickness and cut into 6 triangles. The oven was pre-heated and scones brushed with beaten eggs for a
glossy crust. Scones were left to rest for 10 to 15 minutes before baking at 245oC at the top oven, until
well risen and brown.
Wheat and pumpkin flour blended mandazi
The ingredients were 200 g (50%) wheat flour, 200 g (50%) pumpkin flour, 100 g margarine, 100 g sugar,
500 ml cooking oil, 3 eggs, 2 teaspoons baking powder and 125 ml milk. All ingredients were mixed by
combining dry ingredients well, then adding the beaten eggs and milk. The dough was left to stand for
about 15 minutes to rise. Meanwhile, oil was heated in a deep frying pan. Dough was rolled over a lightly
floured surface into 0.625 cm thickness, cut into desired size and shape, deep-fried until golden brown
and then drained on paper towels.
Wheat and pumpkin flour blended bread
The ingredients were 200 g (50%) strong flour, 200 g (50%) pumpkin flour, 12 g vegetable fat, 240 ml
water, 16 g fresh yeast, 16 g sugar and 8 g salt. Baking tins were lightly greased. Flour and salt were
sifted into a large bowl. Fat was added and rubbed into flour using finger tips. One-third of water was
boiled and added to the remaining cold water to make it warm. Fresh yeast and sugar were put into a
basin and mixed with the liquid. A deep hole was made in the flour and the liquid mixture added and
mixed thoroughly using hands with a clawing movement for 3 minutes until the dough freely peeled off
fingers. Dough was turned onto lightly floured surface and kneaded for 10 minutes until smooth and
elastic. Dough was shaped, covered with greased heat-proof polythene and left to rise for 45 minutes.
Dough surface was then dusted with flour and baked in a hot oven at 245oC until golden brown.
Determination of products’ nutritive value
In determination of nutrient contents, four replicates of each blending level and product were analyzed for
β-carotene, protein, zinc, iron, calcium and calories. Beta-carotene was determined by extracting 2 g of
each sample using acetone. The sample was crushed using a mortar and pestle until the residue turned
colourless. The extract was passed through a funnel stuffed with glass wool, and then 25 ml of this extract
was put in a round-bottomed flask and evaporated to dryness at about 60°C. A 1ml of petroleum ether
was added into the evaporated sample to dissolve the β-carotene. The solution was then eluted using a
column chromatography. For preparation of the column, slurry made from silica gel with 60-120 mesh
and petroleum ether was laid in a glass column of 15cm in length fitted with glass wool at the elution
point. After the slurry had settled, the column top was packed with anhydrous Na2SO4, and 1 ml absolute
ethanol was added to activate both anhydrous Na2SO4 and silica gel. The mixture was then eluted using
petroleum ether until a volume of 25 ml had been collected. The elute absorbance was read in UV-VIS
spectrophotometer (Shimadzu Pharmaspec Model 1700) at 450 nm. Five standard solutions of β-carotene
with concentrations between 0.4 μg/g and 2.4 μg/g were prepared and their absorbance read at the same
wavelength and plotted against their corresponding concentrations to give a standard curve (Okalebo et
al., 2002). Beta-carotene was determined using the formula: Beta-carotene =
(0.4/0.12)*(Absorbance*FV/sample weight)*DF, where FV = final volume, DF = dilution factor.
Protein analysis was done by weighing 0.3 g sample, putting in a test tube, adding 4ml of digestion
mixture with H2SO4, H2O2 and selenium catalyst, and reagent blanks for each sample batch. These were
digested for 1 hour at 110°C and 330°C to complete digestion in a digester. Mixture turning colourless
indicated complete digestion then 25 ml of distilled water was added and mixed well until no more
sediment dissolved. The mixture was allowed to cool and made up to 50 ml using distilled water, allowed
to settle and then a clear solution was taken from top to determine total nitrogen by Kjeldal method,
where 25 ml NaOH were dispensed in the digested sample in a conical flask, then 25 ml of boric acid
added plus 3 drops of mixed indicator with 0.99 g bromocressol green, 0.066 g methyl red and 0.011g

Proceedings of the Third International Research Conference 26th to 28th October, 2016 43
thymol blue in 1ml ethanol. Distillation was done to 150 ml in a conical flask. The pale pink colour of the
distillate turned to green. The distillate was back-titrated with 0.1 M HCl until the colour changed from
green to pale pink (Okalebo et al., 2002). The amount of HCl used was recorded and the percentage
protein determined using a conversion factor 6.25 (AOAC, 1990). Protein % = (T5-
TB)×0.1×N14.007×100/[0.3×6.25 (F)], Where: T5 = titration volume for sample (ml); TB = Titration
volume for blank (ml); N = normality of acid; F = conversion factor for N2 to protein.
Mineral analysis was done by weighing 10 g of samples from four replicates of each of the blending
levels. For analysis of Ca, Fe and Zn contents in the sample, 0.3 g of the sample was weighed and placed
in a dry clean glass digestion tube, 4 ml of the digestion mixture with selenium-sulphuric acid mixture
added and heated to 300oC in a block digester, until the digest turned colourless or pale yellow. The tubes
were then removed from the block digester and cooled to room temperature. The digest was then
transferred into a 100 ml volumetric flask and filled to the mark with de-ionized water. After cooling, the
digests were analyzed for trace metals of calcium, iron and zinc by measuring their absorbance at 422.7
nm, 248.33 nm and 213.86 nm, respectively, using an Atomic Absorption Spectrophotometer (Shimadzu
Model AA-6300, Tokyo-Japan). Standards of 2.5, 5.0, 7.5 and 10ppm were prepared from 1000 ppm
standard stock solution and absorbance determined. The stock solutions were prepared from salts of
calcium, iron and zinc nitrates for calcium, iron and zinc standards, respectively. The results were used to
construct calibration curves with absorbance against corresponding concentration.
Determination of calorific value of the products was done using oxygen combustion bomb calorimeter
using benzoic acid as standard (AOAC, 1990) whereby 1 g of sample was weighed in a crucible and
placed inside a stainless steel container filled with 30 bar of oxygen. The sample was ignited using a
cotton thread connected to an ignition wire inside the bomb calorimeter and burned. Temperature change
was monitored and recorded at 3 minutes intervals. The heat created during the burning process was
determined by comparing with the heat obtained from 1 g of standard benzoic acid. The calorific value of
the food sample was calculated by multiplying its temperature rise in the calorimeter by the previously
determined energy equivalent from the standard and dividing by the weight of sample.
Data Analysis Data were subjected to ANOVA using SAS version 9.3. Significant means were separated using the Least
Significance Difference test at P = 0.05.
RESULTS
Content of various nutrients in cake was determined and results are shown in Table 1. ANOVA analysis
showed significant difference (P<0.05) in protein, iron and energy at different pumpkin flour (PF)
blending levels. The 95% blending had the highest 12.3% protein, while 0% blending had a low of 2.9%
protein. Iron content increased with increasing PF, and 95% blending yielded the highest 0.4690 mg/g,
while 0% blending yielded the least 0.3789 mg/g. Calorific value was lowest at 2.49 kcal/g for 95%
blending and highest 3.49 kcal/g for 0% blending. All the nutrients increased with increasing PF, but
energy content had a slight decrease with increasing PF.
Analysis of cookies indicated a significant difference in protein, beta-carotene, calcium and iron. Beta-
carotene was highest at 5.8μg/g for 95% blending and lowest for 5% blending (Table 2). Calcium and
iron also showed an increasing trend with increasing PF, where calcium reached a high of 4.3759 mg/g.
Results for mandazi generally revealed higher amounts of protein, calcium and zinc with increasing
pumpkin flour. Table 3 shows higher levels of protein (11.1%), beta-carotene (13.8 μg/g), 0.9422 mg/g of
calcium and zinc (0.1922 mg/g) for 95% blending, compared to less amounts of the same nutrients at less
PF levels. Calories were 3.0 kcal/g for 95% blending, compared to 3.2 kcal/g for 0% level. Significant
differences (P<0.05) occurred in protein and iron contents across the various blending levels.

Proceedings of the Third International Research Conference 26th to 28th October, 2016 44
Table-1: Means of nutrient content of pumpkin cake at five blending levels. Level (%
PF)
Protein
(g/100g)
β-carotene
(μg/g)
Calcium (mg/g) Iron (mg/g) Zinc (mg/g) Energy (kcal/g)
1 (0%) 0.0291c * 0.500b 3.401b 0.3789c 0.1206a 3.4958a
2 (5%) 0.0328c 1.2025ab 3.627ab 0.4095bc 0.1448a 3.4712a
3 (20%) 0.0897b 1.655ab 3.797ab 0.4419ab 0.1442a 3.0785b
4 (50%) 0.0992b 2.1275ab 3.877a 0.4643a 0.1426a 2.7990bc
5 (95%) 0.12.3275a 3.040a 3.922a 0.4690a 0.1416a 2.4942c
F-value 76.51 2.46 2.31 4.91 0.91 17.28
P-value <.0001 0.1015 0.1178 0.014 0.4914 <.0001
LSD0.05 1.4749 1.8798 0.4325 0.0531 0.0332 0.3204
RDI (adult) 34-71g/d *600-1300μg/d 1000-1300mg/d 8-18mg/d 8-13mg/d 2403-3067kcal/d
RDI (child) 13-19g/d *300-400μg/d 500-800mg/d 7-10mg/d 3-5mg/d 1046-1742kcal/d
*Means followed by the same letter within a column are not significantly different at P = 0.05. PF =
pumpkin flour. g/d = grams per day. mg/d = milligrams per day. kcal/d = kilocalories per day. *applies to
retinol: 1 μg retinol=12 μg β-carotene, hence RDI values should be multiplied by 12 to relate to table
values (Wardlaw et al., 2004).
Table-2: Means of nutrient content of pumpkin cookies at five blending levels. Level (% PF) Protein
(g/100g)
β-carotene
(μg/g)
Calcium (mg/g) Iron (mg/g) Zinc
(mg/g)
Energy (kcal/g)
1 (0%) 0.0321b 1.455b 0.3416c 0.2393c 0.1355b 4.3563a
2 (5%) 0.0415b 1.708b 0.6476c 0.2781bc 0.1522ab 4.1563ab
3 (20%) 0.0474ab 1.763b 3.8999b 0.2970b 0.1548ab 4.1515ab
4 (50%) 0.0532ab 4.293a 4.1606ab 0.3076b 0.1648ab 4.1118ab
5 (95%) 0.0656a 5.835a 4.3759a 0.3675a 0.1729a 3.9921b
F-value 3.28 5.99 181.2 6.9 1.85 2.37
P-value 0.0492 0.0069 <.0001 0.004 0.1838 0.1108
LSD0.05 2.14 2.4611 0.46 0.0549 0.0319 0.2627
RDI (adult) 34-71g/d *600-1300μg/d 1000-1300mg/d 8-18mg/d 8-13mg/d 2403-3067kcal/d
RDI (child) 13-19g/d *300-400μg/d 500-800mg/d 7-10mg/d 3-5mg/d 1046-1742kcal/d
Means followed by the same letter within a column are not significantly different at P = 0.05. PF =
pumpkin flour. g/d = grams per day. mg/d = milligrams per day. kcal/d = kilocalories per day. *applies to
retinol: 1 μg retinol=12 μg β-carotene, hence RDI values should be multiplied by 12 to relate to table
values (Wardlaw et al., 2004).
Table-3: Means of nutrient content of pumpkin Mandazi at five blending levels Level (% PF) Protein
(g/100g)
β-carotene
(μg/g)
Calcium (mg/g) Iron (mg/g) Zinc (mg/g) Energy (kcal/g)
1 (0%) 0.0262c * 6.278b 0.5900a 0.1467c 0.1418a 3.2573a
2 (5%) 0.0306c 6.563b 0.6136a 0.1584c 0.1696a 3.2445a
3 (20%) 0.0350c 10.250ab 0.6581a 0.1777bc 0.1845a 3.2416a
4 (50%) 0.0649b 10.858ab 0.8856a 0.2094ab 0.1867a 3.1658a
5 (95%) 0.1117a 13.830a 0.9422a 0.2289a 0.1922a 3.0952a
F-value 16.76 2.18 0.65 5.36 0.99 0.39
P-value <.0001 0.1327 0.6373 0.0103 0.4495 0.809
LSD0.05 0.0269 6.6078 0.6247 0.0459 0.0629 0.3394
RDI (adult) 34-71g/d *600-1300μg/d 1000-1300mg/d 8-18mg/d 8-13mg/d 2403-3067kcal/d
RDI (child) 13-19g/d *300-400μg/d 500-800mg/d 7-10mg/d 3-5mg/d 1046-1742kcal/d
*Means followed by the same letter within a column are not significantly different at P = 0.05. PF =
pumpkin flour. g/d = grams per day. mg/d = milligrams per day. kcal/d = kilocalories per day. *applies to
retinol: 1 μg retinol=12 μg β-carotene, hence RDI values should be multiplied by 12 to relate to table
values (Wardlaw et al., 2004).

Proceedings of the Third International Research Conference 26th to 28th October, 2016 45
In scones, a significant difference (P<0.05) was noted in all nutrients except zinc. Specifically, zinc was
lowest (0.1143 mg/g) in level 1 and highest (0.1202 mg/g) in level 5, although there were no significant
differences in zinc content across the five levels (Table 4). Both beta-carotene and calcium showed an
increasing trend with increasing pumpkin flour levels, with a high of 5.2 μg/g and 4.0246 mg/g
respectively in level 5. Energy levels were noted to reduce with increasing pumpkin flour, whereby level
5 recorded the lowest (2.2 cal/g). When bread was analyzed for various nutrients, higher contents were
found in 95% for calcium, iron and beta-carotene that were 1.011 mg/g, 0.149 mg/g and 5.1 μg/g,
respectively. Protein content was high (>12%) in 5% to 95% blending, as compared to 0% blending that
had a low of 11%. Significant differences (P<0.05) resulted in iron content and calories (Table 5).
Table-4: Means of nutrient content of pumpkin scones at five blending levels Level (% PF) Protein
(g/100g)
β-carotene
(μg/g)
Calcium (mg/g) Iron (mg/g) Zinc (mg/g) Energy (kcal/g)
1 (0%) 0.0372c * 0.6375b 3.1747c 0.0563b 0.1143a 2.8401a
2 (5%) 0.0517bc 0.290b 3.2200bc 0.5712ab 0.1143a 2.6789a
3 (20%) 0.1014ab 1.300b 3.5940abc 0.6068ab 0.1172a 2.6438a
4 (50%) 0.1116a 3.920a 3.6619ab 0.6567a 0.1190a 2.6687a
5 (95%) 0.1269a 5.250a 4.0246a 0.6595a 0.1202a 2.2189b
F-value 5.33 23.78 5.02 3.65 0.1 5.36
P-value 0.0106 <.0001 0.013 0.0362 0.9795 0.0103
LSD0.05 5.22 1.3818 0.4805 0.0919 0.0259 0.3087
RDI (adult) 34-71g/d *600-1300μg/d 1000-1300mg/d 8-18mg/d 8-13mg/d 2403-3067kcal/d
RDI (child) 13-19g/d *300-400μg/d 500-800mg/d 7-10mg/d 3-5mg/d 1046-1742kcal/d
*Means followed by the same letter within a column are not significantly different at P = 0.05. PF =
pumpkin flour. g/d = grams per day. mg/d = milligrams per day. kcal/d = kilocalories per day. *applies to
retinol: 1 μg retinol=12 μg β-carotene, hence RDI values should be multiplied by 12 to relate to table
values (Wardlaw et al., 2004).
Table-5: Means of nutrient content of pumpkin bread at five blending levels Level (% PF) Protein
(g/100g)
β-carotene (μg/g) Calcium (mg/g) Iron
(mg/g)
Zinc (mg/g) Energy (kcal/g)
1 (0%) 0.1108b * 1.433b 0.2736b 0.0216a 0.0344b 2.6792a
2 (5%) 0.1284ab 3.583ab 0.2850b 0.0739c 0.0407ab 2.4494b
3 (20%) 0.1298ab 3.768ab 0.4549ab 0.1064bc 0.0512ab 2.3141bc
4 (50%) 0.1350a 5.125a 0.8063ab 0.1175ab 0.0551ab 2.2147bc
5 (95%) 0.1378a 5.128a 1.0113a 0.1495a 0.0631a 2.1104c
F-value 1.91 1.8 2.84 13.45 1.99 4.67
P-value 0.1743 0.1931 0.0717 0.0002 0.1605 0.0167
LSD0.05 2.35 3.4745 0.601 0.0408 0.025 0.3151
RDI (adult) 34-71g/d *600-1300μg/d 1000-1300mg/d 8-18mg/d 8-13mg/d 2403-3067kcal/d
RDI (child) 13-19g/d *300-400μg/d 500-800mg/d 7-10mg/d 3-5mg/d 1046-1742kcal/d
*Means followed by the same letter within a column are not significantly different at P = 0.05. PF =
pumpkin flour. g/d = grams per day. mg/d = milligrams per day. kcal/d = kilocalories per day. *applies to
retinol: 1 μg retinol=12 μg β-carotene, hence RDI values should be multiplied by 12 to relate to table
values (Wardlaw et al., 2004).
DISCUSSION
There were changes in the contents of various nutrients in products prepared from various wheat-pumpkin
flour composites as compared to the control products. Most of the micronutrients as well as protein
increased with addition of PF into the recipe. In cookies, scones and bread the trend was similar, with up
to 50% more protein realized in pumpkin blended products, while mandazi recorded as high as 450%
more protein with increasing PF level in the recipe. There was more iron content in the products with
increasing PF in all the products, some of which showed drastic improvement. Scones had more than

Proceedings of the Third International Research Conference 26th to 28th October, 2016 46
1000% more iron in 95% blending level compared to 0% level. The other products had between 14% and
64% more iron in blended products compared to the control. Calcium also showed a similar trend where
products had between 11% and 24% more calcium from level 3 through level 5. The nutrient increases
were attributed to the addition of PF which is very rich in both macro- and micro-nutrients. Usha et al.
(2010) observed calcium, iron and vitamin A to be among the most abundant micronutrients in pumpkin,
as well as proteins especially as amino acids arginine, aspartate and glutamic acid. Hence increasing PF
levels in the recipes was the reason for increase in the nutrients.
The results are comparable with previous studies which reported increased beta-carotene content from
trace amounts in a standard weaning mix compared to 110.8μg/g in weaning mix fortified with 20% PF
(Usha et al., 2010). Das and Banerjee (2015) in their study similarly reported significant enhancement in
the protein, beta carotene and fibre contents of bakery products supplemented with PF. Previous studies
have shown increased protein levels with increased PF (Pratyush et al., 2015). Usha et al. (2010) reported
an increase of protein from 4.61g in a standard weaning mix to 5.8g in the same product enriched with
20% PF. A study on pumpkin blended biscuits recorded more calcium, iron and phosphorus compared to
the control biscuit, as reported by Kulkarni and Joshi (2012).
Energy content, on the other hand, showed a uniform trend of slight reductions with increasing PF across
all products. At highest PF levels, cake had up to 11% reduction in energy content, while cookies showed
a 5% reduction, mandazi up to 7% and scones up to 21% less energy. The reduction of calories with
increasing PF can be associated with more fibre content, and PF has been found to contain high amounts
of fibre which includes cellulose at 40.4g/100g, hemicelluloses (4.3g/100g) and lignin at 4.3g/100g
(Pratyush et al., 2015 and Ptitchkina et al., 1998). See et al. (2007) reported that substitution of PF to
wheat flour led to a reduction in total carbohydrate content of breads. Similarly, Ndife and colleagues
(2011) reported lower carbohydrate content in wheat and soy flour composite breads, which had higher
fibre content. High level of fibre was the reason for reduced calories as was observed with increased PF
levels in the recipes used in this study. Snacks with more fibre and reduced calories are considered
healthier as they are associated with reduced risk to lifestyle diseases (Vergara-Valencia, 2006).
CONCLUSIONS AND RECOMMENDATIONS
The present study revealed the positive effect of replacing wheat flour with PF on the nutritional qualities
of the snacks. Therefore, augmentation of PF in baked products increases the content of essential nutrients
present. Increasing levels of PF in the recipes significantly enhanced iron, calcium, beta-carotene and
protein contents of the products. Consumption of such pumpkin blended wheat products will lead to
higher intake of these essential nutrients, coupled with reduced calorie intake. Nutrient dense snacks with
fewer calories and more of the essential nutrients as well as fibre would be a healthier option due to their
important role in health promotion. There is need to determine consumer acceptability levels of such
wheat and pumpkin flour composite products to determine the most appropriate percentage of PF for
adoption into commercial products. Formulating snacks with up to 20% PF is recommended to boost
human nutrient intake. Much higher PF levels would result in poor quality products due to dilution of
wheat flour which contains good baking properties.
ACKNOWLEDGEMENTS
This research was made possible by funds provided by the Kenya Agricultural Productivity and
Agribusiness Project (KAPAP) and the Kenya National Commission for Science, Technology and
Innovation (NaCoSTI) to whom we are indebted.
REFERENCES
AOAC (1990). Official Methods of analysis. 15th ed. Association of Official Analytical Chemists.
Washington, DC.

Proceedings of the Third International Research Conference 26th to 28th October, 2016 47
Barkema, A. (1993). Reaching consumers in the twenty first century: The short way around the barn.
Amer. J. Agr. Econ. 75 (5): 1126-1131.
Bhaskarachary, K., Ananthan, R. and Longvah, T. (2008). Carotene content of some common (cereals,
pulses, vegetables, spices and condiments) and unconventional sources of plant origin. Food
chemistry 106:85-89.
Blumberg, J. B. (1995). Considerations of the scientific substantiation for antioxidant vitamins and beta-
carotene in disease prevention. Am. J. Clin. Nutr 62:1521-1526.
Cichoñ, Z., Miœniakiewicz M., Research of consumers’ preference of bread in aspect his qualities. 2001.
In: Technology of Food and Expectations of Consumers (Eds.). T. Haber, H. Porzucek). Wydz.
Techn. ¯ywn. SGGW, KTiCh¯ PAN (materials on CD) Warszawa, p. 6 (in Polish).
Das, S. and Banerjee, S. (2015). Production of pumpkin powder and its utilization in bakery products
development: A review. Int. J. Res. Eng. Techolol. 4 (5): 2319-2321.
David, G. S., Fred, J. E., Liping, W., Jay-Lin, J., Tong, W. and George, E. I. (2007). Oil and tocopherol
content and composition of pumpkin seed oil in 12 cultivars. J. Agric. Food Chem. 55:4005-4013.
Dewettinck K, Van Bockstaele F, Kuhne B, Van de Walle, Courtens T, Gellynck X (2008). Nutritional
value of bread: Influence of processing, food interaction and consumer perception. Rev. J. Cereal
Sci., 48: 243-257.
Ene, C. (2008). Consumer Food Choices-Trends and Challenges. Petroleum-Gas University of Ploiesti,
Bulletin No. 2 (60): 77-82.
Gajigo, O. and A. Lukoma. (2011). Infrastructure and agricultural productivity in Africa: Market Brief,
AFDB (African Development Fund).
Gopalan, C., Rama, S. B. V. and Bala-Subramanian, S. C. (1991). Nutritive value of indian foods.
National Institute of Nutrition (ICMR). Hyderabad.
Goyal, A. and Singh, N. P. (2007). Consumer perception about fast food in India: An exploratory study.
British Food J. 109 (2): 182-195.
Jones, J. M. and Engleson, J. (2010). Whole grains: Benefits and challenges. Annu Rev Food Sci Technol
1: 19-40.
Kiharason, J. W., Isutsa, D. K. and Ngoda, P. N. (2017). Effect of drying method on nutrient integrity of
selected components of pumpkin (Curcubita moschata Duch.) fruit flour. Journal of Agricultural
and Biological Sciences. 12(3):110-116.
Kulkarni, A. S. and Joshi, D. C. (2013). Effect of replacement of wheat flour with pumpkin powder on
textural and sensory qualities of biscuit. International Food Research Journal, 20 (2): 587-581.
Maneju H, Udobi CE, Ndife J (2011). Effect of added brewers dry grain on the physico-chemical,
microbial and sensory quality of wheat bread. Am. J. Food Nutr., 1(1): 39-43.
Mavek, G., Jadwiga, R. , Honorata, D., Elvyra, J., Judita, C. (2007). Quality of pumpkin cultivars in
relation to sensory characteristics. Not. Bot. Hort. Agrobot. Cluj 36 (1):73-79.
Mnzava, N. and J. E. Mbewe. 1997. African traditional vegetables: Selecting dual-purpose local
pumpkins, Cucurbita moschata (Duch. ex Lam.). Report.
Ndife J. and Abbo, E. (2009). Functional Foods: Prospects and challenges in Nigeria. J. Sci. Technol.,
1(5): 1-6.
Okalebo J.R., Gathua K.W. and Woomer P.L. 2002. Laboratory methods of soil and plant analysis: A
working manual. 2nd
Edition. TSBF-CIAT and SACRED Africa, Nairobi: Kenya.
Onyango M. O. A., Habwe F. O. and Walingo K. M. 2008. Food processing and preparation technologies
for sustainable utilization of African indigenous vegetables for nutrition security and wealth
creation in Kenya. International Union of Food Science and Technology. Chapter 13: 1-9.
Pratyush, K., Masih, D. and Sonkar, C. (2015). Development and quality evaluation of pumpkin powder
fortified cookies. Int. J. Sc. Eng. Technol. 3 (4): 1034-1038.
Ptitchkina, N. M., Novokreschonova, L. V., Piskunova, G. V. and Morris, E. R. (1998). Large
enhancements in loaf volume and organoleptic acceptability of wheat bread by small additions of
pumpkin powder: Possible role of acetylated pectin in stabilising gas-cell structure. Food
Hydrocolloids, 12: 333-337.

Proceedings of the Third International Research Conference 26th to 28th October, 2016 48
See, E. F., Wan Nadiah, W. A. and Noor Aziah, A. A. (2007). Physic-Chemical and Sensory Evaluation
of Breads Supplemented with Pumpkin Flour. ASEAN Food Journal 14 (2): 123-130.
Tee, E. S. and Lim, C. L. (1991). Carotenoid composition and content of Malaysian vegetables and fruits
by AOAC and HPLC methods. Food Chemistry 41: 309-339.
Usha, R., Lakshmi, M. and Ranjani, M. (2010). Nutritional, sensory and physical analysis of pumpkin
flour incorporated into weaning mix. Mal J. Nutr. 16(3): 379-387.
Vergara-Valencia, N., Graados-Perez, E, Agama-Acevedo, E., Tovar, J., Ruales, J. and Bello-Perez, L. A.
(2006). Fibre concentrate from mango fruit: Characterization, associated antioxidant capacity and
application as a bakery product ingredient. Lebensmittel-Wissenchaft und-Technologie 40 (4):
722-729.
Wardlaw, G. M., Hampl, J. S. and DiSilvestro, R. A. (2004). Perspectives in Nutrition. McGraw-Hill
Companies, Inc.
Young J. (2001). Functional bakery products: Current directions and future opportunities. Food Ind. J., 4:
136-144. ******
EVALUATION OF RELEASED MAIZE HYBRIDS TO HASTEN THEIR
COMMERCIALIZATION IN COASTAL LOWLAND KENYA
Muli, M.B.,¹ Karanja, J.,² Makumbi, D.³ and Beyene, Y.³
¹Kenya Agricultural and Livestock Research Organization-Mtwapa, P. O. Box 16 Mtwapa, 80109
²Kenya Agricultural and Livestock Research Organization-Katumani, P. O. Box 340 Machakos, 90100
³International Maize and Wheat Improvement Centre (CIMMYT), P. O. Box 1041 Nairobi, 00621 E-mail: [email protected], [email protected]
ABSTRACT
The coastal region of Kenya is a food deficit area with households purchasing one third of their food
requirements. Although maize is the most important food crop, the region produces 1.56 million bags,
while the demand is 3.80 million bags. This could be attributed to inadequate number of improved
hybrids adaptable to the region and also to poor crop management practices including planting patterns.
Several high yielding hybrids have been released for the region over the last few years but they have not
been commercialized to be accessible to farmers in the region. A study was conducted to evaluate the
performance of selected released hybrids under two maize planting patterns (one and two seeds per hill
respectively) in a split plot design with planting pattern as the main plots and maize hybrids as the sub-
plots. Five maize hybrids (CKH08069, pH4, WE1101, WE2109 and WE2111) were evaluated under the
two planting patterns. The results indicated that hybrids WE1101 and CKH08069 had significantly higher
(P<0.05) grain yield than the other hybrids including the local check (PH4). Hybrid CKH08069 had
significantly higher ear height than all the other hybrids including the local check. The same trend was
observed for ear length with an exception of the local check. The planting pattern had no significant
influence, except for grain yield where the pattern of one plant per hill had significantly higher grain yield
than that of two plants per hill.
Keywords: Maize hybrids, planting patterns, Grain yield, CKH08069, WE1101
INTRODUCTION
Maize is the main food staple in Kenya, produced by more than 90% of households (Waiyaki et al.,
2006). It accounts for more than 20% of agricultural production and 25% of employment in the
agricultural sector. More than 70% of maize area is cultivated by smallholder farmers in less than 20
hectares of land (Doss et al., 2003). These small farms produce more than 65% of the maize consumed in
the country. Land under maize is about 1.5 million hectares with a total production of 2.34 million tons
per year (MoA, 2004). This accounts for 76.5% of the annual consumption estimated at 3.06 million tons.

Proceedings of the Third International Research Conference 26th to 28th October, 2016 49
Maize is the most important food crop on coastal lowland Kenya and is grown in all agro-ecological
zones of the region including arid and semi-arid lowland areas more suited for sorghum and millet
(KARI, 2005; Wekesa et al., 2003). The region faces a large deficit: while maize is the major staple food,
the maize production for its 2.5 million inhabitants (Central Bureau of Statistics, 2001) amounts to only
20 kg/person. The average maize food consumption per person for Kenya is estimated at 94 kg/person
(Pingali, 2001). The deficit has to be imported from abroad or other parts of the country. Among the
major constraints for maize production in coastal lowlands especially in the semi-arid lands is low soil
moisture and lack of improved drought tolerant maize hybrids. Average annual rainfall is low in most
areas and total annual evapo-transpiration is high. The evapo-transpiration exceeds rainfall in most
months of the year (Jaetzold and Schmidt, 1983). Release of new maize hybrids is constantly taking place
in an effort to improve on yields and to widen the choices available for the farmers. However, the region
is still constrained by narrow choice of maize hybrids adaptable to the region (Muli, 2000). Coast
composite maize (CCM) was released in 1979; Pwani Hybrid I (PH1) in 1989 while Pwani hybrid 4
(PH4) was released in 1995. These hybrids were recommended for the medium to high rainfall zones in
the region but due to population pressure people have moved to marginal areas considered best suited for
extensive grazing and introduced crop farming. It is also a common practice by farmers to plant two seeds
per hill but visual observation has shown that, one of the plants is usually smaller than the other and this
is also reflected on cob size.
Several high yielding hybrids with special attributes such as drought tolerance, water use efficiency and
maize stalk borer tolerance have been released for the region over the last few years but they have not
been commercialized to be accessible to farmers in the region. For the seed companies to commercialize
these new hybrids, they need to be provided with information on yield and other special attributes and the
advantages over the existing hybrids in the region. There is also need to prioritize the new hybrids to
ensure that only the best bet is commercialized to maximize profits by the seed companies. To achieve
this objective, a study was conducted to evaluate the performance of selected released hybrids under two
maize planting patterns (one and two seeds per hill respectively).
Objectives
1. To prioritize released hybrids for coastal lowland Kenya to enhance their commercialization
2. To determine the effect of planting pattern on yield and yield components of maize hybrids while
maintaining the optimum plant population per unit area.
3. To determine the criteria used by farmers in selection of maize hybrids and involve them in the
prioritization of the new hybrids for commercialization
MATERIALS AND METHODS
Experimental Site
The study was conducted at Mwabandari in Lungalunga sub-county (Lat. S 04.26.709; Long. E 039
18.540), Kwale county in 2014 and 2015. The study area is described as a coconut - cassava zone in
Agro-Ecological Zone (AEZ) Coastal Lowland (CL) 3 (Jaetzold and Schmidt, 1983). The altitude of the
area is 142 m above sea level. The site has loamy with a pH of 6.5. The mean annual rainfall for the site
is 1100 mm distributed between two seasons of April to August and October to December. The mean
monthly minimum and maximum temperatures are about 21 and 28°C, respectively.
Newly released drought tolerant and water use efficient maize hybrids: WE1101, WE2109, WE2111 and
CKH08069 alongside a commercial check (PH4) were used in this study. The five hybrids were evaluated
under two planting patterns of one and two seeds per hill but maintaining the same plant population of
53,333 plants per hectare. The inter-row spacing was 75 cm and within row spacing was 25 cm for one
plant per hill and 50 cm for two plants per hill. The treatments were laid out in a split plot design with
planting patterns assigned to main plots and maize hybrids assigned to sub-plots. The treatments were
replicated three times. Plots consisted of six rows of maize and the net lots comprised of four rows. Both

Proceedings of the Third International Research Conference 26th to 28th October, 2016 50
phosphate and nitrogenous fertilizers were applied at the rate of 46 t ha-1
P2O5 and 60 t ha
-1 respectively.
Phosphate fertilizer was applied at planting alongside the first split of 18 t ha-1
Nitrogen. Additional
nitrogen fertilizer was applied as top-dress at a rate of 42 t ha-1
four weeks after planting. To control
maize stalk-borer, bulldock (0.05 GR 0.5g/kg beta cyfluthrin) was applied at the rate of 8 kg ha-1
three
weeks after planting.
Twenty two farmers were invited to evaluate the maize hybrids at both vegetative stage and at harvest on
a cross-sectional basis (without differentiating the evaluating panel on gender, age, and other socio-
economic variables). The farmers developed the evaluation criteria through consensus and used the same
to evaluate the maize hybrids. The criteria at vegetative stage were given as: Ear size, maturity period, ear
height and husk cover. At harvest the criteria were as follows: Cob size, cob filling, ear rot and grain
texture (grain recovering after pounding the maize). Maize varietal evaluation was then conducted by pair
wise comparison of hybrids and both frequencies and mode determined.
Data were collected on: stand count, plant height, ear height, ear weight, and grain weight and grain
moisture content. Stand count entailed counting all the plants in each plot excluding the end plants. Both
plant and ear height were measured using a metre rule and recorded in centimetres. The harvested maize
was shelled, grain weighed and moisture content measured using a moisture meter.
Agronomic data were subjected to analysis of variance using the linear model:
Yijk = μ + αi + βj + (αβ)ij + γk + (αγ)ik + εijk; Where:
i = 1,...,a indexes the main plot levels
j = 1,...,b indexes the blocks (replications)
k = 1,...,r indexes the subplot levels
The variance associated with (αβ)ij (Error 1) is used to test the main plot effects.
The variance associated with εijk (Error 2) is used to test the subplot and interaction effects
RESULTS AND DISCUSSION
Analysis of variance results for the five maize hybrids under the planting patterns is summarized in Table
I. The data presented is for the combined two subsequent long rainy seasons of the study period. There
was no significant interaction between the hybrid and the planting patterns and therefore the main effects
of the two factors are presented separately.
Table I: Analysis of variance results for the five maize hybrids under the two planting patterns
SOURCE DF Type 111 SS Mean Square F Value Pr > F
REP 2 6.52200000 3.26100000 9.95 0.0068
PP 1 5.46133333 5.46133333 16.67 0.0035
ERROR 1 2 0.26866667 0.13433333 0.41 0.6769
HYBRID 4 10.37800000 2.59450000 7.92 0.0069
PP*HYBRID 4 3.14866667 0.78716667 2.40 0.1356
ERROR 2 8 2.10800000 0.26350000 0.80 0.6173
All the hybrids were similar in terms of plant height, however, significant (P<0.05) differences were
observed among the hybrids in terms of ear height (Table II). Hybrid CKH08069 showed significantly
(P<0.05) higher ear height than all the other hybrids including the check. Hybrids WE2109 and WE2111
revealed significantly (P<0.05) lower ear placement than the check (Table II). Ear height is an important
factor since it has a bearing on stem lodging and also damage by domestic animals. Plants with very high
ear height and prone to stem lodging and plants with very short ear height are liable to damage animals
including dogs and chicken. Ear length was similar among the hybrids but significant (P<0.05)
differences were observed between CKH08069 and both WE2109 and WE2111. The same trend was

Proceedings of the Third International Research Conference 26th to 28th October, 2016 51
observed for a 1000 kernel weight with an exception of WE1101 which showed significantly (P<0.05)
higher at 1000 kernel weight than the rest of the hybrids including the check. The 1,000 kernel (1,000 K)
weight is a measure of seed size. It is the weight in grams of 1,000 seeds. Seed size and the 1,000 K
weight can vary between varieties of the same crop and even from year to year. By using the 1,000 K
weight, one can account for seed size variations when calculating seeding rates acreage.
Both ear length and 1000 kernel weight play a big role in determining the final grain yield. Inamula et al.
(2011) and Rafique et al. (2004) reported positive correlation (P<0.05) of ear length with 1000 kernel
weight and grain yield. Grain yield for the hybrids ranged from 5.22 to 6.8 t ha-1
for WE2111 and
WE1101 respectively (Table II). Generally, the yields were high compared to the expected yield for
existing commercial hybrids and this was attributed to high yield potential of some of the test hybrids and
favourable weather conditions during the cropping season, especially in 2015. Hybrids, WE1101 and
CKH08069 had significantly (P<0.05) higher grain yield than the other test hybrids and the local check.
However, hybrid WE2111 showed significantly (P<0.05) lower grain yield than the check. There were no
significant (P<0.05) yield differences between WE2109 and the check (Table II).
Table II: Mean effect of maize hybrid parameters for the two seasons
Maize hybrid Plant height
(cm)
Ear height
(cm)
Ear length
(cm)
1000 K WT
(g)
Grain yield
(t ha-1
)
WE2109 221.9 95.7c 16.0
b 281.0
b 5.96
b
WE2111 216.7 92.1c 16.6
b 278.7
b 5.22
c
PH4 215.6 107.0b 17.3
ab 288.5
b 5.75
b
WE1101 215.2 101.6b 17.2
ab 331.2
a 6.80
a
CKHO8069 209.6 112.8a 17.9
a 297.9
b 6.67
a
CV
LSD
2.8
17.66
9.8
5.58
3.7
1.32
3.1
27.55
9.4
0.68 Means followed by the same letter are not different (P≤0.05) within the same column
The pattern of planting had a significant (P<0.05) influence on plant height, ear length and grain yield but
not ear height and a 1000 kernel weight (Table III). The treatment of one seed per hill showed
significantly taller plants than the treatment of two seeds per hill. This result also confirmed the visual
observation that when two seeds are planted per hill, one of the plants is always smaller than the other and
this observation is also reflected in ear size. This is attributed to intra-plant completion for soil resources.
As visually observed, the treatment of one plant per hill revealed significantly (P<0.05) higher ear length
than that of two seeds per hill. Though not significant, the one seed per hill treatment had higher at 1000
kernel weight than that of two seeds per hill. The results also show that significantly (P<0.05) higher
grain yield was obtained for the treatment of one plant per hill that that of two seeds per hill. This was
expected because ear length and a 1000kernel weight are important components of final grain yield
Table III: Mean effect of planting pattern on plant parameters for the two seasons
Planting Pattern Plant height
(cm)
Ear height
(cm)
Ear length
(cm)
1000 K WT
(g)
Grain yield
(t ha-1
)
One seed/hill 220.8a 105.5
a 17.7
a 301.6
a 6.51
a
Two seeds/hill 210.8b 98.2
a 16.3
b 289.3
a 5.65
b
CV
LSD
2.8
8.04
9.8
13.71
3.7
0.61
3.1
16.36
9.4
0.58 Means within the same column followed by the same superscript are not different (P≤0.05)
Farmer evaluation of the hybrids at vegetative stage and at harvest
From farmer evaluation, hybrids were selected and ranked based on attributes discussed herein. Farmers
ranked hybrid CKH08069 as number one because it scored highly in nearly all the attributes especially

Proceedings of the Third International Research Conference 26th to 28th October, 2016 52
ear size, early maturity and ear height (Table IV). They also justified their selections/scores as follows:
Ear size is an indicator of yield and early maturity guarantees early access of food during the season. The
results agree with Zaire et al. (2012) who documented positive correlations of cob length and yield among
maize hybrids in Iran. The farmers also said that ear height is an important attribute as a means of
protection against damage by domestic animals such as dogs and chicken
Table IV: Maize hybrid pair-wise ranking by farmers at vegetative stage
Hybrid Ear size Early maturity Ear height Husk cover Overall Rank
WE2109 3.8 4.1 3.7 4.1 3.9 2
CKH08069 4.3 4.1 4.0 3.9 4.1 1
WE2111 3.6 3.4 3.8 3.6 3.6 5
PH4 3.7 3.8 3.9 3.3 3.7 4
WE1101 4.0 3.7 3.8 3.5 3.8 3
At harvest, hybrid WE1101 scored highly in all the attributes used as criteria by the farmers. A very high
score was given for ear size and grain texture (Table V). The results demonstrate transitivity and
preference for cob size as having linear relationship with grain yield as observed by Rage wetter, et al.
(2011). Grain texture has a bearing on grain recovery when maize is pounded which is common practice
by farmers in the study site. Both CKH08069 and WE1101 are suitable hybrid that can improve food
availability between harvests since cob size is a good indicator of harvest quantity.
Table V: Maize hybrid pair-wise ranking by farmers at harvest
Hybrid Ear size Grain filling Ear rot Grain texture Overall Rank
WE2109 3.5 3.4 3.5 3.2 3.4 5
CKH08069 4.5 4.3 4.1 3.1 4.0 2
WE2111 3.6 3.4 3.8 3.6 3.6 4
PH4 4.1 3.8 4.1 3.2 3.8 3
WE1101 4.6 4.1 4.4 4.5 4.4 1
CONCLUSION
CKH08069 is suitable candidate for any seed company to commercialize because of its high yield and
preference by farmers. Planting pattern plays a role in determining the final yield and farmers should be
encouraged to plant one seed per hill. It is important to involve farmers in varietal development since they
provide an insight on their preferences for any particular variety.
ACKNOWLEDGEMENT
The authors acknowledge the financial support provided by CIMMYT through Water Efficient Maize for
Africa (WEMA) and Drought Tolerant Maize for Africa (DTMA) projects and are grateful to Director
General, Kenya Agricultural and Livestock Research Organization for the support provided. They also
thank the Centre Director, KALRO-Mtwapa for their support during the study.
REFERENCES
Central Bureau of Statistics. (2002). Economic Survey. Nairobi: Ministry of Finance and Planning.
Doss, C. R., Mwangi, W., Verkuijl, H., and De Groote, H. (2003). Adoption of Maize and Wheat
Technologies in Eastern Africa: A Synthesis of the Findings of 22 Case Studies. CIMMYT
Economics Working Paper 03-06. Mexico, D. F.: CIMMYT.
Inamula, L., Rehman, N., Shah, N., Arif, M., Siddiq, M. and Mian, I.A. 2011. Correlations among grain
yield and yield attributes in maize hybrids at various nitrogen levels. Sarhad J. Agric. 27:531-538.
Jaetzold, R. and Schmidt, H. (1983). Farm Management Handbook of Kenya, Volume IIC. East Kenya
(Eastern and Coast Provinces). Farm Management Branch, Ministry of Agriculture, Nairobi.

Proceedings of the Third International Research Conference 26th to 28th October, 2016 53
KARI. (2005). Research Priorities for KARI Mtwapa mandate area (coastal lowland Kenya). KARI
Mtwapa
Ministry of Agriculture (MoA). (2004). “The Status of Maize Seed Industry in Kenya: A Value chain
Analysis”. A Report Prepared in Collaboration with Kenya Institute for Public Policy Research
and analysis, Kenya agricultural Research Institute and Tegemeo Institute.
Muli, M.B., Gethi, J.G., and Kamau, G.M. (2000). The response of maize (Zea mays L.) varieties to
fertilizer, processing and storage methods in coastal Kenya. Proceedings of the 7th KARI
Scientific Conference, Nairobi. 13-17 November 2000. Pp179-187.
Pingali, P.L. (ed.). (2001). CIMMYT 1999-2000 World Maize Facts and Trends. Meeting World Maize
Needs: Technological Opportunities and Priorities for the Public Sector. Mexico, D.F.:
CIMMYT.
Rafique, M., Hussain, A., Mahmood, T., Alvi, A.W., and Alvi, M.B. (2004). Heritability and
interrelationships among grain yield and yield components in maize (Zea mays L.). Int’l. J. Agric.
and Biol. 6(6) 1113-1114.
Regenwetter, M. M., Dana, J., and Stober, C. P. (2011) Transitivity of preferences. Psychological Review,
2011Vol 118. No. 1, 42-46
Waiyaki, N., Mwakubo, S., Odhiambo, W., Nzuma J., Murithi F., Gamba P., Muhammad L., Nyongesa
D., Nambiro E., King’ori, B., and Obunde P. (2006). Determinants of Seed Maize Pricing in
Kenya. Kenya Institute of Public Policy Research and Analysis. Nairobi Kenya. Discussion Paper
No. 61.
Wekesa, E., Mwangi, W., Verkuijl, H., Danda, K., and H. Degroote. (2003). Adoption of maize
production technologies in the coastal lowlands of Kenya. Mexico, D.F.: CIMMYT.
Zarei, B., Kahrizi, D., Alireza Aboughadareh P., and Sadeghi, F. (2012). Correlation and path coefficient
analysis for determining interrelationships among grain yield and related characters in corn
hybrids (Zea mays L.) IJACS/2012/4-20, 1519-1522. ******
ENDOGENOUS CHLOROGENIC ACID AND CAFFEINE ASSOCIATED WITH IN VITRO
SOMATIC EMBRYOGENESIS OF COFFEE (Coffea arabica L.)
Mayoli, R.N.1,2, Lubabali, A.H.1, Isutsa, D.K.2,3, Nyende, A.B.4, Mweu, C.M.4, Njoroge, E.K.1
1KALRO-Coffee Research Institute, Kenya, P. O. Box 4-00232 Ruiru, Kenya 2Chuka University, P. O. Box 109-60400, Chuka, Kenya
3Egerton University, P. O. Box 536-20115, Egerton, Kenya 4Jomo Kenyatta University of Agriculture and Technology, P. O. Box 62000-00200, Nairobi, Kenya
ABSTRACT
Coffee plays a central role in Kenyan economy through foreign exchange and income earnings. However,
its production has been constrained by factors like high production cost, inappropriate technology and
inadequate seedlings. Coffee somatic embryogenesis is another vegetative propagation method, besides
cuttings and grafting. Its main use is for F1 hybrid propagation to avoid manual hybrid seed production.
Developmental processes and factors related to coffee somatic embryogenesis are not well established,
resulting in poor induction or few embryos and low subsequent seedling regeneration. This study
identified and quantified endogenous chlorogenic acid (CGA) and caffeine phenols and alkaloids
associated with Coffea arabica ‘Ruiru 11’ somatic embryogenesis. Third leaf pairs of greenhouse-grown
mother plants were cultured in half-strength Murashige and Skoog, 1962 media. Both green and brown
leaf discs with and without embryos constituted treatments, and embryos with fresh culture media and
leaf explants constituted controls. A completely random design replicated thrice and repeated once in
2014 was used. Chlorogenic acid and caffeine were extracted and analyzed using a Knuer HPLC system
and identified by comparing their retention time with that of standards. Fresh leaves had high 6.51 mg/g
FW CGA and 1.14 mg/g FW caffeine. Chlorogenic acid amounting 5.34 mg/g FW was significantly
(P<0.05) high in embryos on green leaf discs. Embryos on brown leaf discs had significantly (P<0.05)

Proceedings of the Third International Research Conference 26th to 28th October, 2016 54
high 0.5778 mg/g FW caffeine. Green leaf discs with embryos had 0.004 mg/g FW highest endogenous
CGA. Culture media with embryos on green leaf discs had 0.6935 mg/g FW highest caffeine. Generally,
higher CGA was in non-embryogenic brown and green leaf discs, compared to embryogenic brown and
green leaf discs. Embryogenic capacity seemed to be associated with a balance of phenolics. High
caffeine in embryos formed on brown leaf discs was a result of accumulation during embryogenesis. The
inference that high caffeine in culture media allowed development of somatic embryos when embryos
avoided caffeine auto-toxicity through space and time separation will be presented and discussed.
Keywords: Alkaloids, Coffee seedlings, Leaf explants, Phenolics, Plant propagation
INTRODUCTION
Coffee is the second most valuable traded commodity in the world, with sales estimated to be US$ 90
billion annually. In addition, production of coffee forms the economic backbone of many countries
worldwide (FAO, 2003). Presently in Kenya, the coffee industry contributes about KES 10 billion per
year to the national economy and is the fourth largest foreign exchange earner after tea, tourism and
horticulture (Karanja and Nyoro, 2002). Plant tissue culture plays an important role in agricultural
biotechnology and plant propagation. It allows in vitro regeneration and multiplication of plants under
aseptic conditions through a process known as micropropagation. In vitro regeneration of coffee is mainly
through somatic embryogenesis because it presents the highest rate of multiplication (Fernandez-Da Silva
et al., 2005). Coffee is a relevant model species for fundamental research in molecular biology,
biochemical and biotechnological research (Santos-Briones and Hernández-Sotomayor, 2006) particularly
for investigation of release of inhibitors and stimulation of compounds in vitro.
Phenolic compounds are predominantly present as a family of esters formed between quinic acid and
hydroxycinnamic acids, collectively known as chlorogenic acids (CGA) (Clifford, 1985). The up to 14%
CGAs in green coffee seeds have a marked influence in determining coffee quality and contribute
immensely in the formation of flavour (Farah et al., 2006). The relatively high levels of chlorogenic acids
and other related phenols in coffee seeds give emphasis to their physiological importance for the coffee
plant. Phenolic compounds are often associated with somatic embryo formation. It was observed that
embryogenic calli developed only after browning of the initial coffee explant through a necrosis-like
process which does not impair somatic embryo formation (Neuenschwander and Baumann, 1992).
Caffeine is the most abundant and important purine alkaloid derived from several important crops, such as
coffee, tea, cocoa and guarana (Pompelli et al, 2013). The importance of caffeine in the coffee beverage
seems to be solely as a stimulant. Caffeine is known to have a toxic effect on insects and fungi (Indu,
2004). Frischknecht et al (1986) postulated that this may be defense strategy since as the leaflet emerges
from the stipules that confer mechanical protection, caffeine increases as a chemical defense. Caffeine in
coffee plants is actively biosynthesized during leaflet emergence and then decreases when leaves reach
their optimal photosynthetic capacity (Zheng and Ashihara, 2004). Stimulation of caffeine production in
cell cultures of C. arabica is achieved by application of stress (Frischknecht and Baumann (1985).
Despite great progress in development of somatic embryogenesis, recalcitrant crops such as coffee have
difficulty regenerating somatic embryos. Factors particularly those involved in regulation of the induction
and development of coffee somatic embryos are not clear. Therefore, it is imperative to determine the
endogenous inhibitors and stimulators present during somatic embryogenesis of coffee so as to counteract
and augment them, respectively.
MATERIALS AND METHODS
This research was conducted in laboratories and greenhouses of the Coffee Research Foundation at Ruiru
in Kenya using Coffea arabica cultivar Ruiru 11. Third leaf pair explants were excised from 6-month-old
greenhouse-grown mother plants between March and April, 2014. The explants were washed thoroughly
under running tap water, followed by water containing Teepol detergent and finally sterile distilled water.

Proceedings of the Third International Research Conference 26th to 28th October, 2016 55
The subsequent sterilization steps took place in a laminar flow cabinet. The explants were dipped quickly
for approximately 30 seconds in 70% alcohol and rinsed 2-3 times in sterilized distilled water. The
explants were further sterilized using 20% sodium hypochlorite for 20 minutes followed by rinsing
thoroughly 4 times in sterilized distilled water. The culture media contained half-strength Murashige and
Skoog (MS 1962) inorganic basal salts, supplemented with vitamins namely 0.2g/L thiamine, 0.1g/L
nicotinic acid and 0.1g/L pyridoxine 30 g/L sucrose, 100 mg/L myo-inositol, 100 mg/L cysteine, and 1
ml/L Thidiazuron. The pH of the media was adjusted to 5.7 using 1 M NaOH or 1 M HCL and 3 g/L
gelrite added before autoclaving for 15 minutes at 121oC and at 100 kPa. Culture media measuring 25 ml
was poured into Magenta vessels (Sigma Chemical Co.) and 5 leaf discs measuring approximately 1 cm2
cultured in each vessel that was maintained in the dark at 25oC ± 2 and 70% humidity.
After 6-8 months of culture, treatments were applied as follows: brown leaf discs with and without
embryos, green leaf discs with and without embryos, fresh culture media and leaf explants excised from
greenhouse-grown mother plants served as controls (Figure 1). The treatments were used to identify and
quantify endogenous CGA and caffeine in the leaf discs, developed embryos and culture media, as
appropriate. A completely randomized design, replicated three times and repeated once was used.
Sample Preparation, Extraction and Analysis of Chlorogenic Acid Extraction of chlorogenic acid was done as described by Kathurima and Njoroge (2012). Thus, leaf disc,
embryo and culture medium, were weighed into a 100 ml conical flask and their weights noted. About 50
ml of 96% ethanol (AR) and 10 ml acetone were added to the samples, which were first homogenized at
approximately 4oC, and then transonicated using an ultrasonic bath for 10 minutes. The homogenate was
filtered using Whatman 42 filter paper. The filtrate was recovered in a 100 ml round bottomed flask and
evaporated under 40oC. The sample was reconstituted using 2 ml of 50% methanol. The sample was
filtered through a 0.45 µm Chromafil micro-filter. About 50 microlitre of the sample extract was injected
into Knuer HPLC.
A B C
D E F
Figure 1. Treatments used for biochemical analysis. A: Brown leaf discs with embryo. B: Brown leaf
discs without embryos. C: Green leaf discs with embryos. D: Green leaf discs without embryos. E: Fresh
leaves (control). F: Fresh leaves (control).
Chlorogenic acid was analyzed using a Knauer HPLC system equipped with a BDS HYPERSIL C-18 for
chlorogenic acid. The detector was diode array at wavelengths 324 nm for chlorogenic acid. The mobile
phase was methanol HPLC grade (PANCREAC) 35%, distilled water 65%, acetic acid (PROLABO)

Proceedings of the Third International Research Conference 26th to 28th October, 2016 56
0.1%, at a flow rate of 1 ml/minute under ambient temperature. Chlorogenic acid was identified by
comparing the retention time of 99% Chlorogenic acid standard (Acros Organics) and concentration
calculated from peak areas using calibration equations where: Concentration of analyte (C1) = Peak area
of analyte/slope of the standards’ calibration curve. Content (mg/g) of the analyte = [C1 x V x 1000-3
]/W,
Where C1= the concentration (mg/L) of the analyte in the test solution, V= the volume (mL), of the test
solution, and W= the weight (g) of the sample used for the preparation of the test solution.
Sample Preparation, Extraction and Analysis of Caffeine
Caffeine was extracted as described by Kathurima and Njoroge (2012). The culture medium, each leaf
disc and embryo were weighed into 250 ml flat-bottomed flasks with a round neck. Thereafter, 0.5 g
magnesium oxide (Merck) and 200 ml distilled water were added. Refluxing was done for 25 minutes and
the contents left to cool. After cooling, filtration was done under vacuum on celite and the filtrate
recovered in 250 ml volumetric flask. The volume was topped up with distilled water to the mark, and 20
ml of the filtrate was drawn and put into a 100 ml volumetric flask. The volume was adjusted to the mark
with 20% acetronitrile. The eluate was filtered through a 0.45 µm Chromafil micro-filter and about 50
microlitre of the sample extract was injected into Knauer HPLC.
Caffeine was analysed using a Knauer HPLC system equipped with a super Co Discovery C-18 column
for caffeine. The detector was diode array at wavelengths 278 nm for caffeine. The mobile phase was
methanol HPLC grade (PANCREAC) 35%, distilled water 65%, acetic acid (PROLABO) 0.1%, at a flow
rate of 1 ml/minute under ambient temperature. Caffeine was identified by comparing the retention time
of 99% caffeine standard (Fischer Scientific) and concentration calculated from peak areas using
calibration equations where: Concentration of analyte (C1) = Peak area of analyte/slope of the standards’
calibration curve. Content (mg/g) of the analyte = [C1 x V x 1000-3
] W, Where C1= the concentration
(mg/L) of the analyte in the test solution, V= the volume (mL) of the test solution, W= the weight (g) of
the sample used for the preparation of the test solution.
Data Analysis
The SAS 9.2 computer software was used to analyse data. Data were subjected to analysis of variance
(ANOVA) and significantly different means were separated using the least significance difference (LSD)
test at P=0.05. Chlorogenic acid and caffeine content in the leaf discs, embryos and culture media were
correlated using Pearson correlation coefficients.
RESULTS
There were significant differences in the endogenous CGA content in all the leaf discs (Table 1). Fresh
leaves had the highest (P<0.05) CGA content of 6.5106 mg/g FW. Chlorogenic acid content of 5.34 mg/g
FW was significantly (P<0.05) high in embryos developed on green leaf discs. There were significant
(P<0.05) differences in CGA content in the culture media. Green leaf discs with embryos had the highest
endogenous CGA content of 0.004 mg/g FW. Significant (P<0.05) differences resulted in endogenous
caffeine content among the sample leaf discs tested (Table 1). Fresh leaves had the highest caffeine
content of 1.14461 mg/g FW. Embryos that had developed from brown leaf discs had significantly
(P<0.05) higher caffeine content of 0.5778 mg/g FW. The highest (P<0.05) caffeine content of 0.6935
mg/g FW resulted in the culture media that had green leaf discs with embryos. Chlorogenic acid content
in the leaf discs showed negative non-significant (P>0.05) correlations with CGA content in embryos and
the culture media (Table 2). Significant positive correlation (P<0.0001) resulted for CGA content in the
embryos and media. The caffeine content in the leaf discs showed negative correlations with caffeine
content in embryos and media, although these correlations were not significant(P>0.05) (Table 2).
Caffeine content in embryos was negatively correlated with caffeine content in the media and the
correlation was also not significant (P>0.05). Figures 1 and 2 showed that the number of somatic embryos
had a positive, but insignificant correlation with either chlorogenic acid or caffeine content (R2 = 28%).

Proceedings of the Third International Research Conference 26th to 28th October, 2016 57
Table 1: Chlorogenic acid and caffeine contents in leaf, embryo and culture media
Treatment
Chlorogenic acid (mg/g FW)
specimen
Total
no. of
embryos
Caffeine (mg/g FW) specimen Total
no. of
embryos Leaf Embryo Media Leaf Embryo Media
CM na na 0.0000000e na na na 0.00000c na
CL 6.5106a* na na na 1.14461a na na na
GW 1.3777b na 0.0021277c na 0.2734b na 0.01643bc na
GE 1.3334b 5.3411a 0.0046457a 147 0.21545bc 0.03717b 0.69350a 191
BW 0.0699c na 0.0013140d na 0.21202bc na 0.01488bc na
BE 0.0589c 3.3057b 0.0038589b 144 0.15639c 0.57780a 0.03503b 124
CV (%) 13.48 15.37892 21.84 19.61 29.09 13.25 na
LSD 0.05 0.3737 0.3943 0.0008 0.1164 0.0530 0.02980 na
* Values followed by the same letter within a column are not significantly different at P = 0.05. BW =
Brown leaf discs without embryos, BE = Brown leaf discs with embryos, GE = Green leaf discs with
embryos, GW = Green leaf discs without embryo, CL = Fresh leaves (Control), CM = Fresh media
(Control), na = not applicable
Table 2: Correlation coefficients between chlorogenic acid and caffeine contents in leaf, embryo
and media
Variables for chlorogenic acid content (mg/g FW) Variables for caffeine content (mg/g FW)
Leaf Leaf Leaf Leaf
Embryo
P-value
-0.21045
0.4019
Embryo Embryo
P-value
-0.08583
0.7349
Embryo
Media
P-value
-0.36459
0.1369
0.86568
<0.0001
Media
P-value
-0.22375
0.3721
-0.09792
0.6991

Proceedings of the Third International Research Conference 26th to 28th October, 2016 58
DISCUSSION When the origin of the leaf node and the growth stage were taken into account, the concentration, nature
and localization of chlorogenic acid varied during leaf development, with juvenile leaves clearly showing
to be highly accumulating organs (Mondolot et al., 2006). In this study, fresh leaves had the highest CGA
content. This was in agreement with previous analyses of C. arabica and C. pseudozanguebariae leaves
(Aerts and Baumann, 1994). Sartor and Mazzafera (2000) reported contents of 5.64 mg/g and 16.78 mg/g
chlorogenic acid, in C. arabica and C. dewervei, respectively. Baumann et al. (1991) reported a
concentration of 4.55 mg/g of chlorogenic acid in leaves of C. arabica. Generally, higher concentration of
chlorogenic acid resulted in non-embryogenic brown and green leaf discs as compared to embryogenic
brown and green leaf discs. Similar trend was observed in cocoa where high concentration of phenolic
compound hydroxycinnamic acid was associated with non-embryogenic response (Alemanno et al.,
2003). Embryogenic capacity seemed to be associated with a balance of phenolics.
Neuenschwander and Baumann (1992) found that embryogenic calli developed only after browning of the
initial explant. In some instances, the browning of explants did not affect somatic embryo formation in
their experiment. In this study, somatic embryos also developed after browning of leaf explants. These
results demonstrate that somatic embryogenesis induction is not incompatible with phenolic compound
production during in vitro culture. Excessive accumulation of phenols that cause browning of the tissues
is necessary for the somatic embryogenesis process in coffee (Quiroz-Figueroa et al., 2001). It is possible
that these phenolic compounds act as signals to induce the differentiation process. Khosroushahi et al.
(2011) observed a positive correlation between phenolics and callus growth of Taxus brevifolia and this
indicated that phenolics lead to cell proliferation and increase in callus growth instead of secondary
metabolite such as paclitaxel production. The results of this study are in agreement with a study by Liu et
al. (2015), who reported that the polyphenol content in Fraxinus mandshurica (1%) was not significantly
higher than that in Syringa reticulate var. mandshurica (0.7%), but the browning percentage of F.
mandshurica was significantly higher than that of S. reticulata var. mandshurica, which indicated that
explant browning of F. mandshurica might not be greatly related to accumulation of polyphenols.
In coffee plants, caffeine is actively biosynthesized during leaflet emergence and then decreases when
leaves reach their optimal photosynthetic capacity (Frischknecht et al., 1986). Caffeine content of 1.4
mg/g FW in the explant reported in the present study was in agreement with previous reports. Ashihara et
al. (1996), reported caffeine content of 2.1 mg/g FW in mature leaves. Sartor and Mazzafera (2000)
obtained 9.29 mg/g DW caffeine content in C. arabica. In addition, Mazzafera (2004) indicated that the
control of caffeine levels in plants is a function of the balance between rates of synthesis and degradation
although this balance seems to vary depending on the plant species and the tissue developmental stage.
Indu (2004) reported that plantlets (i.e. cotyledonary embryos) formed highest amounts of theobromine
and caffeine as compared to callus, globular and torpedo embryos, indicating that caffeine accumulates

Proceedings of the Third International Research Conference 26th to 28th October, 2016 59
during embryogenesis. In the present study, high caffeine in embryos formed from the brown leaf discs
can be as a result of the accumulation of caffeine during the embryogenesis process.
The ability to produce coffee cell cultures from callus cultures, which maintain the ability to produce
caffeine and theobromine, and release these purine alkaloids into the medium, has existed since time
immemorial (Keller et al., 1972; Waller et al., 1983). Caffeine formation in Coffea arabica in vitro
paralleled tissue growth; however, as the callus grew older, less caffeine remained in the tissue and more
was found in the medium (Waller et al., 1983)). In this study, the green leaf discs had the least caffeine
content in the leaf discs and embryos and had the highest amount of caffeine in the medium. These results
were in agreement with previous reports by Waller et al. (1983), who reported up to 49.9 + 4.8
µmoles/mg DW caffeine released into the culture media. Nic-Can et al. (2015), in their study to identify
secreted compounds by Coffea arabica explants, reported caffeine content of 11.042 µmole/flask and
10.982 µmole/flask in low molecular mass of conditioned medium. These authors reported that caffeine
in media allows somatic embryos to develop in C. canephora. Similar results have also been observed
during the development of zygotic embryos in coffee (Friedman and Waller, 1983). These authors
inferred that the embryos have the ability to avoid caffeine autotoxicity, suggesting that the accumulation
of caffeine is separated by space and time as a way of avoiding autotoxicity. This may be the reason why
somatic embryos were formed in media that had high caffeine content. The mechanism of phenolics
action in promoting somatic embryo formation is unclear. However, it is supposed that there is a factor
involved in determining the capacity of plant tissues to regenerate (Cvirková et al., 1999). It is known that
high caffeine concentrations are accompanied by accumulation of chlorogenic acid as a pathway to a
complex to store the caffeine in the vacuole (Mösli and Baumann 1996).
CONCLUSION AND RECOMMENDATIONS
The results indicated that high CGA and caffeine in culture media allows development of somatic
embryos through space and time separation-avoidance of CGA and caffeine auto-toxicity. Embryogenic
capacity seemed to be associated with a balance of phenolics. Therefore, augmentation of media with
balanced phenolics is recommended to enhance coffee somatic embryo regeneration.
ACKNOWLEDGEMENTS
The authors thank staff of Crop Physiology and Chemistry- Quality, Coffee Research Institute (CRI) for
their assistance. This paper is published with the permission of the Institute Director, CRI on behalf of
Director General, Kenya Agricultural and Livestock Research Organization.
REFERENCES
Aerts, R.J. and Baumann, T.W. (1994). Distribution and utilization of chlorogenic acid in developing
coffea seedlings. J. Exp. Bot. 45: 497-503.
Alemanno, L., Ramos, T., Gargadenec, A., Andary, C., and Ferriere, N. (2003). Localization and
identification of phenolic compounds in Theobroma cacao L. somatic embryogenesis. Ann. Bot.
92: 613–623.
Ashihara, H., and Suzuki, T. (2004). Distribution and biosynthesis of caffeine in plants. Frontiers in
Bioscience 9:1864-1876.
Bertrand, C., Noirot, M., Doulbeau, S., De Kochko, A., Hamon, S., and Campa, C. (2003). Chlorogenic
acid content swap during fruit maturation in Coffea pseudozanguebaria: Qualitative comparison
with leaves. Plant Science 165: 1355–1361.
Clifford, M.N. (1985). Chlorogenic acids. In: Clarke R. J., Macrae R (eds.). Coffee. Vol. 1. Chemistry.
London, UK: Elsevier Applied Science Publications.
FAO. (2003). World Agriculture: Towards 2015/2030. A FAO Perspective. Available at
www.fao.org/fileadmin/user_upload/esag/docs/y4252e.pdf; accessed on 8/11/2012.
Farah, A., Monteiro, M.C., Calado, V., Franca, A., and Trugo, L.C. (2006). Correlation between cup
quality and chemical attributes of Brazilian coffee. Food Chem. 98:373-380.

Proceedings of the Third International Research Conference 26th to 28th October, 2016 60
Friedman, J., and Waller, G. (1983). Caffeine hazards and their prevention in germinates seed of coffee
(Coffea arabica L.). J. Chem. Ecol. 9: 1099–1106. doi: 10.1007/BF00982214
Frischknecht, P.M. and Baumann, T.W. (1985). Stress induced formation of purine alkaloids in plant
tissue culture of Coffea arabica. Phytochemistry, Oxford, 24:2255-2257.
Indu, E. P. (2004). Micropropagation of somatic embryogenesis and agrobacterium mediated
transformation of Coffea canephora Pierre ex. Froehner. (Unpublished Ph.D. Thesis University of
Mysore). Retrieved from http://ir.cftri.com/149/1/1899_E_P_Indu.pdf
Karanja, A. M., and Nyoro, J. K. (2002). Coffee prices and regulation and their impact on livelihoods of
rural communities in Kenya. Available at
http://aec.msu.edu/fs2/kenya/o_papers/coffee_study_sc.pdf; accessed on 22/1/2013.
Kathurima, C.W. and E.K. Njoroge. (2012). Effect of different shade regimes on coffee quality.
Proceedings of the 24th International Conference on Coffee Science (ASIC) held at San Jose,
from 11th to 16
th November, 2012.
Keller, H., Wanner, H., and Baumann, T.W. (1972). Caffeine synthesis in fruits and tissue culture of
Coffea arabica. Planta 108:338-350
Liu, C., Yang, L., L and Shen, H. (2015). Proteomic analysis of immature Fraxinus mandshurica
cotyledon tissues during somatic embryogenesis: Effects of explant browning on somatic
embryogenesis. Int. J. Mol. Sci. 16: 13692-13713; doi:10.3390/ijms160613692
Mazzafera, P. (2004). Catabolism of caffeine in plants and microorganisms. Front. Biosci. 9: 1348-1359.
Mondolot, L., La Fisca, P., Buatois, B., Talansier, E., De Kochko, A., Campa, C. (2006). Caffeoylquinic
acid content and histolocalization in C. canephora developing leaves. Ann. Botany 98:33–40.
Mösli, W.S., and Baumann, T.W. (1996) Compartmentation of caffeine and related purine alkaloids
depends exclusively on the physical chemistry of their vacuolar complex formation with
chlorogenic acids. Phytochemistry. 42: 985-996. doi: 10.1016/0031-9422(96)00072-6.
Neuenschwander, B. and Baumann, T.W. (1992). A novel type of somatic embryogenesis in Coffea
arabica. Plant Cell Rep. 10:608-612.
Nic-Can, G.I., Galaz-Ávalos, R.M., De-la-Peña, C., Alcazar-Magaña, A., Wrobel, K. and Loyola-Vargas,
V.M. (2015). Somatic embryogenesis: Identified factors that lead to embryogenic repression. A
case of species of the same genus. PLoS ONE 10(6): e0126414.
doi:10.1371/journal.pone.0126414
Pompelli, M. F., Pompelli, G. M., Oliveira, A. F. M. and Antunes, W. C. (2013). The effect of light and
nitrogen availability on the caffeine, theophylline and allantoin contents in the leaves of Coffea
arabica L. Aims Environmental Science 1:1-11.DOI: 10.3934/environsci.2013.1.1
Quiroz-Figueroa, F.R., Méndez-Zeel, M., Larqué-Saavedra, A. and Loyola-Vargas, V.M. (2001).
Picomolar concentrations of salycilates induced cellular growth and enhanced somatic
embryogenesis in Coffea arabica tissue culture. Plant Cell Rep. 20: 679-684. doi:
10.1007/s002990100386
Sartor, R. M. and Mazzafera, P. (2000). Caffeine formation by suspension cultures of Coffea dewevrei.
Brazilian Archives of Biology and Technology, 43(1) Retrieved April 20, 2015, from
http://www.scielo.br/scielo.php?script=sci_arttextandpid=S1516-
89132000000100009andlng=enandtlng=en. 10.1590/S1516-89132000000100009.
Waller, G. R., MacVean, C. D. and Suzuki, T. (1983). High production of caffeine and related enzyme
activities in callus cultures of Coffea arabica L. Plant Cell Rep. 2:109–112
Zheng, X.Q. and Ashihara, H. (2004) Distribution, biosynthesis and function of purine and pyridine
alkaloids in Coffea arabica seedlings. Plant Sci. 166: 807-813. ******
Proceedings of the Third International Research Conference 26th to 28th October, 2016 61
EVALUATION OF SENSORY ACCEPTABILITY OF BAKED PRODUCTS OF BLENDED
PUMPKIN FRUIT AND WHEAT FLOURS
Kiharason, J.W.1, Isutsa, D.K.1,2 and Ngoda, P.N.2
1Chuka University, P. O. Box 109-60400, Chuka, P. O. Box 484-60400, Chuka, Kenya 2Egerton University, P. O. Box 536-20115, Egerton, Kenya
Correspondence: [email protected], [email protected]
ABSTRACT
The pumpkin fruit of the species Cucurbita moschata Duchesne has great nutritional potential, but
remains under-utilized in Kenya. Its fruits have diverse health enhancing properties. This vegetable-fruit
has potential to be processed into various products both for home and industrial use. Despite these
benefits, the fruit is underutilized as characterized by the few available pumpkin fruit flour products’
recipes and little contribution to food security in Kenyan households. The present study determined
sensory acceptability of baked products of blended pumpkin and wheat flours. Uniform mature pumpkin
fruits grown on the Chuka University farm were harvested and processed into flour using a previously
developed protocol. Pumpkin flour was augmented at 0%, 5%, 20%, 50% and 80% into wheat flour and
baked to make cake, bread, mandazi, scones and cookies. The products were then subjected to sensory
acceptability tests using a 5-scale hedonic rating, with 1 being least preferred and 5 most preferred by
trained and untrained panelists at KALRO-Njoro and consumer groups in Nyeri County, Kenya. The
ANOVA showed that products significantly (P<0.05) differed in acceptability. Among Nyeri consumers,
50% cake and 5% mandazi and scone formulations were highly preferred for colour, texture and flavour.
In Njoro, there were significant differences (P<0.05) among the trained and untrained panelists, but
overall in all products, the 0% and 5% formulations scored highest across all test parameters. Value
addition and commercial utilization of any food product greatly increases its demand. This study shows
the great potential of value-added pumpkin flour, in enhancing and enriching textural and sensory
qualities of different commercial food products in the Kenyan food industry, which should be promoted
for adoption and commercialization.
Keywords: Vegetable-fruits, Food security, Organoleptic taste, Value addition
INTRODUCTION
Pumpkin belongs to the genus Cucurbita of the family Cucurbitaceae. Pumpkins are a native of Central
America but have been domesticated in several tropical and sub-tropical countries around the world (Juna
et al., 2006). The varieties of pumpkin grown widely in Kenya are of the species C. moschata and C.
maxima (squash pumpkin), of which C. moschata remains locally naturalized and widespread in the high
potential areas as well as the arid and semi-arid lands (ASALs). Pumpkin is high in β-carotene, which
gives it yellow or orange colour. It is also high in carbohydrates and minerals. Beta-carotene in plants that
have a pleasant yellow-orange colour is a major source of vitamin A (Lee, 1983). Consumption of foods
containing carotene helps prevent skin diseases, eye disorders and cancer (Bendich, 1989). Incorporation
of β-carotene-rich materials in the human diet is considered a cost-effective approach to managing health
problems related to vitamin-A deficiency (Berteram and Bortkiewicz, 1995). Pumpkins supply calcium,
iron, 25% to 55% oil rich in unsaturated oleic and linoleic acids, 25% to 35% protein with high amounts
of arginine, aspartate and glutamic acid, although it is deficient in lysine, and sulphur-containing amino
acids (Usha et al., 2010). Pumpkin has high nutritional potential that is equal to no other single crop
(Encyclopedia of Foods, 2004).
Pumpkins are widely used in most African countries for their food value. The cooked mature fruit of
pumpkins is the preferred food product. It is also popular for making pie. In South-East Asia, it is made
into sweets and desserts, of steamed fruit flesh with grated coconut and sugar, and into crisps made by
frying steamed fruit flesh mixed with cassava flour. In Zambia, the ripe fruit flesh is dried for longer
preservation (Mnzava and Mbewe, 1997). Commercially, in China, India and USA, pumpkin is canned. In
Nigeria, pumpkin leaves are used to make soup, cassava salad, plantain porridge and ‘Asaro or Ebe’ (yam

Proceedings of the Third International Research Conference 26th to 28th October, 2016 62
pottage). M’chicha Wa Nazi, common in Tanzania, is a soup made by blending pumpkin leaves, peanut
butter, onion, chili and coconut. Pumpkin has not been regarded as a delicacy by many households in
Kenya. It is ‘a forgotten super food’, whose fruits are only consumed due to lack of potatoes, while leaves
are used in absence of cabbages or kales. Sometimes, the fruit is blended in mukimo, a main meal
prepared by mixing cooked maize and peeled potatoes with pumpkin leaves (Arimi Foods, 2011).
Traditional food crops face poor consumption especially in urban and cosmopolitan centers where
dwellers tend to purchase processed and packaged food for convenience (Onyango et al., 2008). It has
been reported that per capita consumption of fruits and vegetables in sub-Saharan Africa lags behind that
of other regions (Shiundu and Oniang’o, 2007). Dietary diversification is a long term strategy which plays
an important role in preventing micronutrient malnutrition by increasing the availability and consumption
of different varieties of micronutrient-rich foods. Dietary diversity can be achieved through increased
production and consumption of micronutrient-rich foods as well as better food preparation methods
(MOH/UNICEF, 2004). Incorporation of β-carotene rich materials in human diet is considered a cost-
effective solution to vitamin-A deficiency related health problems (Berteram and Bortkiewicz, 1995).
Wheat has been used worldwide in a variety of food products and confectionaries (Lee et al, 2002 and
Pongjanta et al 2006). Currently, wheat bakery and confectionary products are fortified with various
vitamins and minerals nutrients to enrich them to become a complete food. Wheat flour contains a limited
amount of important nutrients like zinc, iron and important phytochemicals including beta-carotene,
which are available in variety of fruit and vegetable products (Tee et al 1991 and Olson, 1989) such as
pumpkin powder for blending. Development of food products with attractive colour has been a major goal
in the food industry (El-Demery, 2011) and pumpkin flour is popular due to its highly-desirable flavour,
sweetness, deep yellow-orange colour and considerable amount of dietary fiber. It is reportedly used to
supplement cereal flours in bakery including soups, sauces, instant noodle and spices, and as a natural
colouring agent in pasta and flour mixes (Djutin, 1991). The objective of the present study was to
investigate acceptability of various bakery products made from blended wheat and pumpkin flours.
MATERIALS AND METHODS
Pumpkin Flour and Products Preparation
Mature pumpkin fruits of one landrace (C. moschata) that had previously been grown on the Chuka
University Experimental Farm were washed, peeled and cut uniformly into 2.5cm by 0.5cm by 0.5cm
slices. The slices were blanched in 98oC boiling water for 1 minute and dried in an enclosed solar cabinet
until brittleness was achieved (Wokneh et al., 2012). Dried slices were then milled into flour and utilized
in product blending using recipes described earlier (Kiharason et al., 2017).
Formulations of Pumpkin-Blended Products
Five types of bakery products; namely: cake, cookies, scones, bread and mandazi were prepared using
five levels of pumpkin flour to substitute wheat flour in the formula of each product at 0%, 5%, 20%,
50% and 95% (tables = 80%) rate. The five levels of the products were subjected to organoleptic test by
trained and untrained panelists in KALRO-Njoro, as well as consumer groups in Nyeri County of Kenya.
The amount of pumpkin and wheat flour was varied in each recipe, while holding all other ingredients
constant. All products were arranged and tested in Completely Randomized Design.
Wheat and pumpkin flour blended cake The ingredients were 200 g (50%) all-purpose wheat flour, 200 g (50%) pumpkin flour, 200 g margarine,
200 g sugar, 10 g baking powder and 3 eggs. The flours and baking powder were sifted, margarine rubbed
in followed by sugar addition and mixing. Eggs were then beaten, added to the mixture and mixed
thoroughly. The mixture was poured into tins and baked at 135oC for 35 minutes until the cake developed
a distinct scent and golden brown crust.

Proceedings of the Third International Research Conference 26th to 28th October, 2016 63
Wheat and pumpkin flour blended cookies The ingredients were 200 g (50%) all-purpose flour, 200 g (50%) pumpkin flour, 160 g butter at room
temperature, 40 g shortening, 2 eggs at room temperature, 200 g sugar and ½ teaspoon salt. The butter
and shortening were mixed together using a wooden spoon until uniform. Sugar was added and mixed
until ingredients were light and fluffy. Eggs were added and the mixture stirred until ingredients were
well combined. The flour, baking powder and salt were whisked together in a separate bowl and ⅓ of the
dry ingredients added to the bowl of wet ingredients and stirred until they were just combined. Dry
ingredients were gradually added continuously while stirring. The oven was pre-heated to 205°C and a
baking sheet lined with parchment paper. The dough was scooped out using a tablespoon and shaped into
balls using clean hands. Each ball of dough was placed onto the baking sheet, leaving about 5 cm of space
all around for spreading as it cooked. The cookies were baked for up to 10 minutes, removed from the
oven, cooled for 2 minutes, loosened using a spatula and placed on wire racks to cool down.
Wheat and pumpkin flour blended scones The ingredients were from 200 g (50%) all-purpose flour, 200 g (50%) pumpkin flour, 30 g fat, 125 ml
milk, 12.5 g baking powder, and 2.5 g salt. The flour was sifted with other dry ingredients into a large
mixing bowl and rubbed in fat while aerating at the same time. A deep well was made in the flour where
almost all liquid ingredients were poured and mixed to soft dough with a palette knife. The remaining
liquid ingredients were added. On a floured surface, dough was kneaded very lightly until it was just
smooth and divided into two pieces that were each lightly shaped into a ball. Each piece was then
flattened to 2 cm thickness and cut into 6 triangles. The oven was pre-heated and scones brushed with
beaten eggs for a glossy crust. Scones were left to rest for 10 to 15 minutes before baking at 245oC at the
top oven, until well risen and brown.
Wheat and pumpkin flour blended mandazi The ingredients were 200 g (50%) wheat flour, 200 g (50%) pumpkin flour, 100 g margarine, 100 g sugar,
500 ml cooking oil, 3 eggs, 2 teaspoons baking powder and 125 ml milk. All ingredients were mixed by
combining dry ingredients well, then adding the beaten eggs and milk. The dough was left to stand for
about 15 minutes to rise. Meanwhile, oil was heated in a deep frying pan. Dough was rolled over a lightly
floured surface into 0.625 cm thickness, cut into desired size and shape, deep-fried until golden brown
and then drained on paper towels.
Wheat and pumpkin flour blended bread The ingredients were 200 g (50%) strong flour, 200 g (50%) pumpkin flour, 12 g vegetable fat, 240 ml
water, 16 g fresh yeast, 16 g sugar and 8 g salt. Baking tins were lightly greased. Flour and salt were
sifted into a large bowl. Fat was added and rubbed into flour using finger tips. One-third of water was
boiled and added to the remaining cold water to make it warm. Fresh yeast and sugar were put into a
basin and mixed with the liquid. A deep hole was made in the flour and the liquid mixture added and
mixed thoroughly using hands with a clawing movement for 3 minutes until the dough freely peeled off
fingers. Dough was turned onto lightly floured surface and kneaded for 10 minutes until smooth and
elastic. Dough was shaped, covered with greased heat-proof polythene and left to rise for 45 minutes.
Dough surface was then dusted with flour and baked in a hot oven at 245oC until golden brown.
Sensory Evaluation
The products were cooled and packed in clear polythene bags and kept at room temperature awaiting
sensory evaluation the following day. Each of the products was then cut into 3-cm x 1-cm x 1-cm-pieces.
The consumer likability test was carried out in Nyeri County of Kenya among 25 consumers for each of
the five products. All the panelists were screened before included to eliminate personal prejudice thus
ensure objective evaluation ad description of product characteristics (Singh-Ackbarali and Maharaj,
2014). Criteria included state of health thus avoiding ill individuals, age i.e. excluding too young and too
old as their tasting, visual and judgment abilities may be extreme. Women’s physiological status was put

Proceedings of the Third International Research Conference 26th to 28th October, 2016 64
into consideration to avoid those who were expectant due to altered taste perceptions. The rating was
done on a 5-point hedonic scale with 5 indicating like extremely to 1 indicating dislike extremely (Watts
et al., 1989). Samples were served on white plates and water was provided to rinse the mouth between
samples. In addition, Focus Group Discussions were done to obtain qualitative data among different sets
of consumers selected following the same criteria described earlier for best results. The qualitative data
were meant to corroborate the quantitative data and provide explanations on reasons of like or dislike of a
particular blended product. The evaluation of the five products was staggered over several days to avoid
consumers being exhausted during tests and for data quality control. In addition, panels of 6 food experts
at KALRO-Njoro Food and Nutrition laboratories were involved in tests on the same set of products so as
to determine if the blended products possessed the generally acceptable characteristics of each specific
product. Another 25 untrained panelists in the same place were involved in the tests to remove the likely
bias with trained panelists.
Statistical Analysis
Data were subjected to analysis of variance (ANOVA) using SAS version 9.3 and significantly different
means were separated using Least Significance Difference at α = 0.05.
RESULTS
Sensory evaluation for cake in Nyeri showed that level 1 was ranked best in terms of taste, flavour and
texture, while level 3 was rated best for colour (Table 1). Level 5 was ranked least liked for taste, flavour,
colour and texture hence generally least liked by the consumers. Levels 1, 2 and 3 were generally liked,
with no significant difference in taste and texture among all the three products, while results also showed
no significant difference in colour of levels 1 and 2.
Untrained panelists ranked level 2 as most likable in all aspects, while levels 1 and 3 were ranked second.
There was no significant difference (P>0.05) in the taste, flavour, texture and general acceptability of
cake product at levels 1, 2 and 3, while colour showed a significant difference (P<005) in all levels.
Trained panelists on the other hand maintained that level 1 was most likable in taste, colour, texture and
general acceptability, while level 2 was ranked best in flavour. Both panels ranked level 5 least liked for
taste, flavour, colour, texture and acceptability (Table 1).
In Nyeri, the cookie taste and flavour scores of levels 1, 2 and 3 were not significantly different (P>0.05).
Generally, level 2 was ranked best for taste, texture and colour while flavour for level 3 was rated the best
of all the five levels. Flavour of levels 1 and 2 were rated second best. Level 5 was least liked in all the
tested parameters (Table 2). Among trained panelists in Njoro, level 1 cookies were ranked best for all
test parameters. There was no significant difference (P>0.05) in the colour of the 5 levels. There was also
no significant difference (P>0.05) in the texture of levels 1, 2 and 3. On the other hand, untrained
panelists ranked level 2 as best liked generally (Table 2). Level 5 was generally ranked least liked for
taste, flavour, colour, texture and acceptability by both groups (Table 2). It is clear that both consumer
groups indicated level 2 of cookies as having more desirable characteristics compared to the control level
1, then followed by level 3.
Results for scones evaluation show that the taste of levels 1, 2 and 3 was not significantly different
(P>0.05). Level 2 was ranked highest in all organoleptic parameters, meaning it was the most liked (Table
3). The colour of scones was significantly affected by addition of pumpkin flour, with an increase in
likability at 5% and reducing likability with increased pumpkin flour. Level 5 was least liked in all
parameters. Both trained and untrained panelists in Njoro ranked level 1 of scones as best liked in all test
parameters followed by level 2, while level 5 ranked least liked taste, flavour, colour, texture and general
acceptability. Table 3 shows that among untrained consumer groups in Njoro, only the colour of scones
had a significant difference (P<0.05) among the different levels. Trained panelists reported no significant
difference (P>0.05) in the taste, flavour and texture of scones in levels 1, 2 and 3.

Proceedings of the Third International Research Conference 26th to 28th October, 2016 65
Table 1: Organoleptic test results in Nyeri and Njoro for cake made from wheat and pumpkin composite flour
Level
(% PF)
Nyeri consumers Njoro untrained panelists (consumers) Njoro trained panelists
Taste * Flavour Colour Texture Taste Flavour Colour Texture General Taste Flavour Colour Texture General
1 (0% ) 4.16 a 4.20a 3.48b 4.08a 3.75a 4.00a 3.67bc 3.83a 3.83a 3.27a 3.27a 3.86a 3.64a 3.64a
2 (5%) 3.88 a 3.80b 3.76b 4.00 a 4.33a 4.25a 4.42a 4.17a 4.25a 3.09a 3.41a 3.36a 2.86b 3.41a
3 (20%) 4.12a 3.96 ab 4.08a 3.96 a 3.75a 4.00a 3.92ab 3.79a 4.00a 2.27b 2.77b 2.68b 2.45bc 2.32b
4 (50%) 2.96 b 2.76 c 2.40 c 3.12b 3.04b 3.21b 3.04c 2.88b 2.71b 1.55c 2.32c 2.18bc 2.18cd 1.82bc
5 (95%) 2.20 c 2.24 d 1.68 d 2.40 c 2.17c 2.33c 2.13d 2.25b 2.00c 1.18c 1.77d 1.95c 1.73d 1.64c
LSD0.05 0.6841 0.5885 0.6672 0. 6525 0.6841 0.5885 0.6672 0.6525 0.646 0.5195 0.4526 0.6302 0.5857 0.5821
P-value <.0001 <.0001 <.0001 <.0001 <.0001 <.0001 <.0001 <.0001 <.0001 <.0001 <.0001 <.0001 <.0001 <.0001
*Means followed by the same letter within a column are not significantly different from each other at P=0.05. PF = pumpkin flour.
Table 2: Organoleptic test results in Nyeri and Njoro for cookies made from wheat and pumpkin composite flour
Level (%
PF)
Nyeri consumers Njoro untrained panelists (consumers) Njoro trained panelists
Taste * Flavour Colour Texture Taste Flavour Colour Texture General Taste Flavour Colour Texture General
1 (0% ) 3.75a 3.83 a 3.33 b 3.67 b 3.92a 3.76ab 3.14a 3.84a 4.04ab 4.30a 4.30a 4.20a 4.40a 4.20a
2 (5%) 4.00 a 3.83 a 3.79 a 4.04 a 3.92a 3.92a 3.14a 3.96a 4.28a 4.00a 4.10a 4.10a 3.70ab 3.80a
3 (20%) 3.71a 3.96 a 3.71 a 3.54 b 3.40ab 3.20bc 3.14a 3.64a 3.68b 3.10b 3.20b 2.60b 3.40bc 3.00b
4 (50%) 3.21 b 3.21 b 3.33 b 2.83 c 3.08b 2.80c 3.14a 3.00b 3.04c 2.80bc 2.50bc 3.00b 3.10bc 2.60bc
5 (95%) 2.00 c 2.00 c 1.42 c 2.25 d 2.44c 1.96d 3.14a 1.84c 1.92d 2.10c 2.10c 2.10b 2.80c 2.00c
LSD0.05 0.5546 0.6534 5.6352 0.6165 0.5546 0.6534 5.6352 0.6165 0.5923 0.7772 0.8056 0.9087 0.776 0.7783
P-value <.0001 <.0001 1.0000 <.0001 <.0001 <.0001 1.000 <.0001 <.0001 <.0001 <.0001 <.0001 0.0018 <.0001
*Means followed by the same letter within a column are not significantly different from each other at P=0.05. PF = pumpkin flour.
Table 3: Organoleptic test results in Nyeri and Njoro for scones made from wheat and pumpkin composite flour
Level (%
PF)
Nyeri consumers Njoro untrained panelists (consumers) Njoro trained panelists
Taste * Flavour Colour Texture Taste Flavour Colour Texture General Taste Flavour Colour Texture General
1 (0% ) 3.65 a 3.65 a 3.19 bc 3.46 bc 3.90a 3.86a 4.14a 4.14a 4.10a 3.75a 3.75a 4.00a 3.83a 4.08a
2 (5%) 3.69 a 3.65 a 3.85 a 3.81 a 3.67a 3.76a 3.62b 3.71a 3.95a 3.50a 3.67a 4.00a 3.75a 3.75ab
3 (20%) 3.50 a 3.27 b 3.42 b 3.62 ab 2.90b 3.14b 2.71bc 2.90b 3.05b 3.17a 3.25a 2.58b 3.33a 3.17b
4 (50%) 2.88 b 2.62 c 2.88 c 3.19 c 2.10c 2.52c 2.81b 2.24c 2.33c 2.25b 2.33b 2.42b 2.58b 2.50c
5 (95%) 1.96 c 1.88 d 1.92 d 2.42 d 1.76c 2.29c 2.10c 1.90c 1.71d 1.50c 1.92b 1.83b 1.83c 1.67d
LSD0.05 0.6241 0.4761 0.695 0.5687 0.6241 0.4761 0.695 0.5687 0.57 0.7164 0.8012 0.8791 0.6542 0.6655
P-value <.0001 <.0001 1.0000 <.0001 <.0001 <.0001 <.0001 <.0001 <.0001 <.0001 1.0000 <.0001 <.0001 <.0001
*Means followed by the same letter within a column are not significantly different from each other at P=0.05. PF = pumpkin flouR

Proceedings of the Third International Research Conference 26th to 28th October, 2016 66
Table 4: Organoleptic test results in Nyeri and Njoro for mandazi made from wheat and pumpkin composite flour
Level (%
PF)
Nyeri consumers Njoro untrained panelists (consumers) Njoro trained panelists
Taste * Flavour Colour Texture Taste Flavour Colour Texture General Taste Flavour Colour Texture General
1 (0% ) 3.50bc 3.50b 3.42 c 3.50b 3.62a 3.81a 4.05a 4.00a 4.10a 3.92a 4.08a 4.75a 4.33a 4.42a
2 (5%) 3.96a 4.25 a 4.38 a 3.92a 3.62a 3.81a 4.10a 3.81a 3.67a 3.67a 3.58ab 4.17b 3.83ab 3.67b
3 (20%) 3.71ab 3.54b 3.83b 3.38b 2.81b 3.10b 2.71b 2.95b 2.90b 3.33a 3.25b 2.50c 3.33b 3.25b
4 (50%) 3.21c 2.71c 3.04d 2.83c 1.71c 2.29c 1.62c 2.43bc 1.95c 2.17b 2.25c 1.50d 2.25c 2.08c
5 (95%) 2.42d 2.08d 2.42e 2.54c 2.00c 2.33c 2.24b 2.29c 2.00c 1.58b 2.08c 1.42d 1.58c 1.50c
LSD0.05 0.6043 0.4712 0.5605 0.6526 0.6043 0.4712 0.5605 0.6526 0.5095 0.8019 0.7742 0.5035 0.7164 0.6409
P-value <.0001 <.0001 <.0001 <.0001 <.0001 <.0001 <.0001 <.0001 <.0001 <.0001 <.0001 <.0001 <.0001 <.0001
*Means followed by the same letter within a column are not significantly different from each other at P=0.05. PF = pumpkin flour.
Table 5: Organoleptic test results in Nyeri and Njoro for bread made from wheat and pumpkin composite flour
Level (%
PF)
Nyeri consumers Njoro untrained panelists (consumers) Njoro trained panelists
Taste Flavour Colour Texture Taste Flavour Colour Texture General Taste Flavour Colour Texture General
1 (0% ) 3.58a 3.70a 3.62ab 3.54a 3.27a 3.27a 3.86a 3.64a 3.64a 3.08a 3.25a 3.67a 3.58a 3.50a
2 (5%) 3.62a 3.75a 3.95a 3.79a 3.09a 3.41a 3.36a 2.86b 3.41a 2.83a 3.08a 3.17a 2.83ab 2.92ab
3 (20%) 3.50a 3.20b 3.45b 3.45ab 2.27b 2.77b 2.68b 2.45bc 2.32b 2.50ab 2.67ab 2.92a 2.83ab 2.75ab
4 (50%) 2.79b 2.50c 2.79c 3.12b 1.55c 2.32c 2.18ab 2.18cd 1.82bc 2.00bc 2.08b 1.92b 2.08bc 2.25b
5 (95%) 1.79c 1.70d 1.83d 2.70c 1.18c 1.77d 1.95c 1.73d 1.64c 1.42c 1.83b 1.33b 1.67c 1.42c
LSD0.05 0.5195 0.4526 0.6302 0.5857 0.5195 0.4526 0.6302 0.5857 0.5821 0.7993 0.8432 0.8317 0.7788 0.759
P-value <.0001 <.0001 <.0001 <.0001 <.0001 <.0001 <.0001 <.0001 <.0001 0.0007 0.0044 <.0001 <.0001 <.0001
*Means followed by the same letter within a column are not significantly different from each other at P=0.05. PF = pumpkin flour.

Proceedings of the Third International Research Conference held on 26th to 28th October, 2016 67
Evaluation of mandazi among the study consumers showed significant differences (P<0.05) for all test
parameters in all the five levels. Table 4 below shows that level 2 was ranked best in all test parameters
hence most liked, followed by level 3 for taste, flavour and colour. Therefore, addition of pumpkin flour
had significant effect on each test parameter. Level 5 was ranked least in taste, flavour, colour and
texture, thus it was least liked.
Trained panelists in Njoro laboratories, rated level 1 mandazi products best in all test parameters, while
among untrained panelists, levels 1 and 2 were equally liked in taste, flavour and colour. Levels 1 and 2
had no significant differences in all test parameters (Table 4). Levels 4 and 5 were clearly disliked in all
aspects by both groups.
Evaluation of bread among the study consumers showed significant differences (P<0.001) for all test
parameters in all the five levels. Level 2 was ranked superior in all parameters, while level 1 was also
preferred in taste, flavor and texture. Table 5 also shows that level 3 was also liked in taste. It is notable
that level 5 was least preferred for all test parameters.
Levels 1 and 2 of bread ranked high in all organoleptic parameters for both trained and untrained panelists
in Njoro (Table 5). Level 5 ranked least liked for taste, flavour, colour, texture and acceptability. There
were no significant differences (P>0.05) in the taste, flavour and colour of levels 1 and 2 of bread among
both groups. Texture was affected significantly up to level 5, which was least liked by both groups.
DISCUSSION
Addition of 5% and 20% of pumpkin flour into cake recipes introduced desirable characteristics. As much
as study consumers rated level 1 as best liked generally, level 3 according to them proved to be the best in
appearance. Focus groups discussions indicated that levels 2 and 3 of cake were best in colour due to the
nice orange colour introduced by the pumpkin flour. Level 5 was rated worst in all aspects because the
colour was too dark, which is unpleasant and that the texture was too soggy for a cake. It caused a bitter
flavour and too much unpleasant pungent pumpkin taste. Substitution of pumpkin flour caused the
pungent flavour due to presence of cucurbitacins in the pumpkin fruit which are extremely bitter with a
disagreeable taste (Gry et al., 2006).
The darkening was attributed to caramelization and maillard reactions where the protein contributed by
pumpkin flour reacted with sugar during baking (Dhingra and Jood, 2001 and Mohsen et al., 2009).
Sogginess of 95% cake is indication that the product had too much moisture in it, and the level of
moisture in a product correlates with the fibre content. PF as reported by Pratyush et al., (2015) contains
high amounts of fibre (hence much retention of water in the finished product). Similarly, See et al., (2007)
in their study reported that an increase in the level of pumpkin flour increased the moisture content of
breads, explaining that composite flours which result to increased fibre have a higher water absorption
capacity as compared to wheat flour.
The results are similar to the trained and untrained panelists, who seemed to agree that addition of 5% and
20% pumpkin flour into the recipes produced desirable effects, while addition of too much pumpkin flour
spoiled the products. A similar study by Pongjanta et al. (2006) showed that 20% pumpkin flour addition
to wheat flour was optimum for cakes, while 10% to 20% pumpkin powder in Thai desserts improved
yellow colour, β-carotene content and was accepted by consumers.
Considering cookies, the first three levels were comparable in terms of taste and flavour, with addition of
5% pumpkin flour producing best results in taste, texture and colour. As pumpkin flour increased,
however, the likability level decreased. This was explained in the Focus Group Discussions that the
colour of level 5 was too dark, that the crumb texture was too tough and left a bitter flavour in the mouth.
Tough crumb texture has been associated with increased fibre due to substitution of refined wheat flour
with pumpkin flour (Elimam et al., 2008).
The level 2 of scones proved to have the most desirable characteristics among the study consumers, while
both panel groups in Njoro appeared to dislike any pumpkin blended scones, rating level 1 as the best

Proceedings of the Third International Research Conference held on 26th to 28th October, 2016 68
product and level 2 coming second. As pumpkin flour ratios increased, likability decreased greatly. The
Focus Discussion Groups revealed that the dislike of level 5 was due to too dark colour that made scones
appear burnt. A dark crust has been reported for whole wheat bread, fortified breads and biscuits and
could be directly related to the increase in fibre content (Akhtar et al., 2008, Serrem, et al., 2011 and Hu
et al., 2007). Similarly the flavour was reported to have bitterness for level 5 and texture too tough
compared to other levels, both attributed to presence of cucurbitacin and fibre as explained earlier on.
For mandazi product, any addition of pumpkin flour had a significant effect on all test parameters. Level
2 of 5% pumpkin flour addition produced the best results, while level 5 of 95% pumpkin flour addition
spoilt the product. Focus Discussion Groups explained that level 5 caused a bitter taste, darkening and
closed texture. Bitter taste as explained earlier is associated with presence of cucurbitacins while
darkening is attributed to high fibre content. In addition, a closed texture was clearly due to less gluten in
recipes with more pumpkin flour. More pumpkin flour in the recipe causes less gluten level hence loss of
the cohesive property and plasticity of the dough (Sigh et al., 2013). It is also due to increased fibre
content; dietary fibre has been reported to have pronounced effects on dough properties and smaller
extensibility (Gomez et al., 2002 and Elleuch, et al., 2011).
Trained panelists most preferred bread was the control level 1 of 0% pumpkin flour and level 2 of 5%
pumpkin flour came closely second. Similarly, the untrained panelists indicated highest liking of level 1
for taste, colour, texture and general acceptability, while their most preferred flavour was of level 2. It
appears that for bread, only slight additions of pumpkin flour would produce desirable characteristics.
Clearly the presence of more pumpkin flour in the formulations especially for bread affects dough
structure and reduces bread volume due to addition of fibre. More substitution of wheat flour leads to
dilution of gluten network thus impairing gas retention in bread making (Dewettinck et al., 2008, Eliman
et al., 2008 and Elleuch et al., 2011). Similarly in a study by El-Demery (2011), 5% to 10% wheat flour
substitutions with pumpkin flour had highest scores for all quality attributes in toast bread. A study by
See et al., 2007 also reported that adding 5% pumpkin flour into bread recipe resulted to a high loaf
volume and good overall acceptability.
CONCLUSIONS AND RECOMMENDATIONS
This study shows that replacement of refined wheat flour with 5% to 20% pumpkin flour produces
likeable organoleptic qualities in snacks and confectionaries of cake, cookies, scones, mandazi and bread.
On the other hand, too much pumpkin flour leads to too much dislike of the products. It is concluded that
level 3 (20% pumpkin flour substitution) of the cake formulation has a great chance of adoption into the
market given that it leads to desirable sensory attributes compared to other blending levels. It is therefore
recommended to roll out this product blend into the market and test its marketability so as to determine
the possibility of adopting the same into Kenyan market of convenience foods. It is also concluded that
level 2 of cookies have the most desirable attributes according to the consumer groups involved. This
formulation should be tested in the Kenyan market to determine its acceptability as a snack food. For
scones, mandazi and bread, level 2 is the best candidate for tests to determine their marketability.
Pumpkin-wheat composite flour improves the texture, flavour, taste and colour of different bakery and
food products and should be used as important ingredients in bakery products. This study shows the great
potential of value addition to various commercial food products in the food industry by pumpkin flour to
produce high textural and sensory qualities. Preparation and processing of the above-tested products that
have good organoleptic characteristics due to pumpkin flour supplementation in wheat flour, followed by
consumption, promotion and marketing alongside their rich nutrient base, is highly recommended.
ACKNOWLEDGEMENTS
This research was made possible by funds provided by the Kenya Agricultural Productivity and
Agribusiness Project (KAPAP) and the Kenya National Commission for Science, Technology and
Innovation (NaCoSTI) to whom we are indebted.
REFERENCES Akhtar, S., Anjum, F., Rehman, S., Sheikh, M. and Farzena, K. (2008). Effect of fortification on the
physico-chemical ad microbiological stability of wole wheat flour. Fooghyd Chem., 112:156-163.

Proceedings of the Third International Research Conference held on 26th to 28th October, 2016 69
Arimi, J. (2011). Arimi foods: Pumpkin-a forgotten super food. http://www.arimifoods.com. Accessed on
15th January, 2013.
Bendich, A. (1989). Carotenoids and the immune response. J. Nutr., 119:112-115.
Berteram, J.S. and Bortkiewicz, H. (1995). Dietary carotenoid inhibit neoplastic transformation and
modulate gene expression in mouse and human cell. Am. J. Clin. Nutr., 62: 132S-136S.
Dewettinck K, Van Bockstaele F, Kuhne B, Van de Walle, Courtens T, Gellynck X (2008). Nutritional
value of bread: Influence of processing, food interaction and consumer perception. Rev. J. Cereal
Sci., 48: 243-257.
Dhingra, S. and Jood, S. (2002). Physio-chemical and nutritional properties of cereal-pulse blends for
bread making. Nutritional Health 16 (3): 183-94.
Djutin, K.E. (1991). Pumpkin: Nutritional properties. Potatoes and Vegetables 3, 25-26.
El-Demery, M. E. (2011). Evaluation of physical-chemical properties of toast breads fortified with
pumpkin (C. moschata) flour. The 6th Arab and 3
rd International Annual Scientific Conference on:
Development of Higher Specific Education Programs in Egypt and the Arab World in Light of
Knowledge Era Requirements. Faculty of Specific Education, Mansoura University, Egypt. 13-14
April 2011.
Elimam, H., Amir, M. and Mustafa, A. (2008). Effect of fermentation and particle size of wheat bran on
the antinutritional factors and bread quality. Pak. J. Nutr., 7(4): 521-526.
Elleuch, M., Bedigian, D., Roiseux, O., Besbes, S., Blecker, C. and Attia, H. (2011). Dietary fibre and
fibre-rich by-products of food processing: characterization, technological functionality and
commercial applications. Rev. Food Chem., 124:411-421.
Encyclopedia of Foods and Their Healing Power: Volume 1 (2004). Education and Health Library
Editorial Team (Ed). 2004, ISBN-10:8472081842.
Gomez, M., Ronda, F., Blanco, C. A., Caballero, P. A. and Apestegula, A. (2002). Effect of dietary fibre
on dough rheology and bread quality. Europ. Food Res. Technol, 216 (1):51-56.
Gry, J., Soborg, I. and Anderson, H. C. (2006). Cucurbitacins in plant foods. Nordic Council of Ministers,
Copenhagen.
Hu, G. H., Yang, F., Ma, Z. and Zhou, Q. (2007). Development of research and application of rice bran
dietary fibre. China Food Addit. 84 (5): 80-85.
Juna, H. I., C. H. Lee, G. S. Song and Y. S. Kima. (2006). Characterization of the pectic polysaccharides
from pumpkin peel. LWT-Food Sci. Technol. 39:554-561.
Kiharason, J. W., Isutsa, D. K. and Ngoda, P. N. (2017). Effect of drying method on nutrient integrity of
selected components of pumpkin (Curcubita moschata Duch.) fruit flour. Journal of Agricultural
and Biological Sciences. 12(3):110-116.
Lee, C. H., Cho, J. K., Lee, S. J., Koh, W., Park, W. and Kim, C. H. (2002). Enhancing β-carotene content
in Asian noodles by adding pumpkin powder. Cereal Chemistry 79 (4): 593-595.
Lee, F. A. (1983). Basic Food Chemistry. AVI Publisher, Westport. Pongjanta, J., Jomduang, S. and
Panomwan Na Ayuttaya, R. (2003). Effect of processing and drying treatment on quality of
pumpkin powder. Food J. 33: 68-76.
Mnzava, N. and J. E. Mbewe. 1997. African traditional vegetables: Selecting dual-purpose local
pumpkins, Cucurbita moschata (Duch. ex Lam.). Report.
MOH/UNICEF. 2004. Policy guidelines on micronutrients deficiency control in Kenya. National
Micronutrient Deficiency Control Council Task Force, Ministry of Health and United Nations
Children Fund, Nairobi: Kenya.
Mohsen, M. S., Fadel, H. H. M., Bekhit, M. A., Edris, A. E. and Ahmed, S. (2009). Effect of substitution
of soy protein isolate on aroma volatiles, chemical composition and sensory quality of wheat
cookies. Int. J. Food Sci. Technol. 44: 1705-1712.
Olson, J.A. (1989). Provitamin A function of carotenoids: The conversion of β- carotene into vitamin A.
J. Nutr. 119: 105-108.
Onyango, M. O. A., Habwe F. O. and Walingo K. M. (2008). Food processing and preparation
technologies for sustainable utilization of African indigenous vegetables for nutrition security and
wealth creation in Kenya. International Union of Food Science and Technology. Chapter 13: 1-9.
Pongjanta, J., Naulbunrang, A., Kawngdang, S., Manon, T. and Thepjaikat, T. (2006). Utilization of
pumpkin powder in bakery products. Songklanakarin J. Sci. Technol. 28(Suppl. 1): 71-79.

Proceedings of the Third International Research Conference held on 26th to 28th October, 2016 70
Pratyush, K., Masih, D. and Sonkar, C. (2015). Development and quality evaluation of pumpkin powder
fortified cookies. Int. J. Sc. Eng. Technol. 3 (4): 1034-1038.
Singh-Ackbarali, D. and Maharaj, R. (2014). Sensory evaluation as a tool in determining acceptability of
innovative products developed by undergraduate students in Food Science and Technology at the
University of Trinidad and Tobago. J. Curric. Teach 3 (1): 1927-2677.
See, E. F., Wan Nadiah, W. A. and Noor Aziah, A. A. (2007). Physic-chemical and sensory evaluation of
breads supplemented with pumpkin flour. ASEAN Food Journal 14 (2): 123-130.
Serrem, C., Kock, H. ad Taylor, J. (2011). Nutritional quality, sensory quality and consumer acceptability
of sorghum and bread wheat biscuits fortified with defatted soy flour. Int. J. Food Sci. Technol.
46: 74-83.
Shiundu, K. M. and Oniang’o, R. (2007). Marketing African leafy vegetables: Challenges and
opportunities in the Kenyan context. African Journal of Food Agriculture, Nutrition and
Development 17: 4-12.
Singh, P., Signh, R., Jha, A., Rasare, P. and Gautam, A. K. (2013). Optimization of a process for high
fibre and high protein biscuit. J. Food Sci. Technol. 52 (3): 1394-1403.
Tee, E. S. and Lim, C. L. (1991). Carotenoids composition and content of Malaysian vegetables and fruits
by AOAC and HPLC methods. Food Chemistry 41: 309-339.
Usha, R., Lakshmi, M. and Ranjani, M. (2010). Nutritional, sensory and physical analysis of pumpkin
flour incorporated into weaning mix. Mal J. Nutr. 16(3): 379-387.
Watts, B. M., Ylimaki, L. E., Jeffery L. E., and Elias, L. G. (1989). Basic sensory methods for food
evaluation. IDRC, Canada.
Workneh T. S., Zinash A. and Woldetsadik K. 2012. Blanching, salting and sun-drying of different
pumpkin slices. Journal of Food Science and Technology. Association of Food Scientists and
Technologists. DOI 10.1007/sI3197-012-0835-4. ******
EFFECTS OF NATURAL LICKS ON FEED INTAKE, NUTRIENT DIGESTIBILITY, MILK
PRODUCTION AND QUALITY IN KENYA ALPINE DAIRY GOAT RATION
Nderi, O.M.1, Musalia, L.M.1 and Ombaka, O.2
1Animal Science Department, Chuka University, P. O. Box 109-60400, Chuka, 2Physical Sciences Department, Chuka University, P. O. Box 109-60400, Chuka,
Correspondence: [email protected], 0722487887
ABSTRACT
Consumption of natural licks is common among domestic animals under natural circumstances, and as a
substitute to commercial mineral licks among smallholder livestock keepers in Tharaka-Nithi County,
Kenya, with a believe that animals obtain potential nutritional benefits. However, this has never been
established through an experimental research using natural licks from the study area. Therefore, this study
was aimed at determining feed intake, nutrient digestibility and milk production performance in dairy
goats fed on natural licks. Four lactating Kenya Alpine Dairy Goats (KADG) in their second lactation
stage and weighing 47.5 ± 3 kg were randomly assigned four treatment diets that consisted of three
natural licks from Kang’au, Nagundu and Kabariange, and a standard commercial lick (control) in a 4 by
4 Latin square design. A basal diet of Boma Rhodes grass hay and a standard concentrate were fed to the
animals, and feed intake, fecal output and milk yield were measured. One way Analysis of Variance
model was used for the lick intake, nutrient intake, and apparent digestibility and milk parameters.
Correlation analysis was carried out to establish the relationship between natural lick sources and milk
parameters. There was no significant difference on dry matter intake, nutrient intake, apparent
digestibility and milk yield and quality (P>0.05) among goats consuming natural licks compared to
commercial lick. However, there was a positive correlation (r) with a value of 0.70 between milk
production and lick intake. Natural licks can be an alternative source of mineral supplementation where
commercial mineral licks are not available.
Keywords: Digestibility, Feed intake, Goat ration, Milk production, Natural lick
INTRODUCTION
Consumption of natural licks (geophagy) has been studied widely in wildlife, and animals are expected to
obtain essential minerals and be protected from the effects of plant secondary metabolites such as tannins,
Proceedings of the Third International Research Conference held on 26th to 28th October, 2016 71
and digestive disorders which are associated with ingestion of lush pastures or greening plants (McDonald
et al., 1995, Rice, 2010 and Blake et al., 2011). Studies have showed that animals travel long distances
away from their natural habitats to consume the naturally occurring minerals (Hishashi, et al., 2006 and
Ulli, 2010), and this demonstrates how useful the licks could be in animal’s health. It is believed that
natural licks are major sources of sodium for herbivores because tropical plants do not accumulate
adequate levels for the animals to depend on them, due to poor aerosol deposition especially in areas far
from the ocean (Bravo et al., 2010 and Dudley et al., 2012). Sodium plays a significant role in pregnant
and lactating animals especially on maintenance of acid base balance. However, studies have revealed
presence of higher levels of other essential minerals in the licks thus refuting arguments that sodium is the
only reason for geophagy (Ayotte, 2006, Houston, 2011 and Nderi et al., 2015). For example, Katherine
et al. (2004) reported high levels of magnesium for wet and dry licks, which is thought to supplement
diets when there are high concentrations of potassium in spring forage that reduces absorption of
magnesium by ruminants, thus interfering with rumen fermentation. Livestock production in the tropics
largely depends on climate-regulated feed supply whose nutritional value rises and falls according to the
season (Hogan et al., 1996). During the dry season, animals are unable to derive nutrients from plants due
to high fiber that leads to low microbial attack, low level of protein and minerals for use by rumen
microorganisms and in animal tissues (Bakrie, 1996). However, poor animal performance is common
even when forage supply is adequate. This is associated with mineral deficiencies caused by mineral
imbalances and low concentrations in soils and associated forages, and this result into poor production
performance in ruminants (McDowell, 1997, Tiffany et al., 2000 and Khan et al., 2003). It is universally
known that animals require certain essential minerals for maintenance and production, but most livestock
in the tropics hardly receive mineral supplements (Garg et al., 2009). Proper nutrition is however, the
cornerstone for the health and productivity of all animals, and it is the basis of successful livestock
production. Despite the fact that many studies on geophagy have been conducted, consumption of natural
licks by livestock has received less attention even though some farmers feed animals on this earth
material with an aim of enhancing productivity (Karbo, 2006 and Nderi et al., 2014).
Most studies focus on wildlife visitation and chemical characterization of natural licks but little is known
on the association between geophagy and domestic ruminant’s production performance. The influence of
natural lick on livestock production is poorly understood probably due to the promotion of commercial
mineral licks in livestock farming. However, studies by Sisay et al., 2007, showed that consumption of
natural licks improved total weight gain in sheep, which indicates a positive performance in livestock
production. Knowledge of production performance in an animal is important in order to plan on how to
incorporate natural licks in the animal’s diet, predict milk production response following consumption,
and development of quality and effective feed rations. Natural licks can be an intervention measure to
mitigate against mineral deficiencies in the diets and hence maintain healthy animals which translates into
improving food security (Bishaw and Melaku, 2008). This is particularly important in Kenya where most
livestock are owned by smallholder poor farmers who cannot afford the commercial mineral licks
(Yinnesu and Nurfeta 2012). Traditionally, some communities in Tharaka Nithi County incorporate
natural licks in livestock diets with believe that animals obtain potential benefits such as improved
digestion and increased milk production (Nderi et al., 2014). This perception was explored by finding out
the relationship between natural licks and feed intake, digestibility and milk production using Kenya
Alpines Dairy Goats.
MATERIALS AND METHODS
The feeding experiment was carried out at Chuka University in Tharaka-Nithi County, Kenya between
January and April 2015. Before data collection, research approval was sought from the National
Commission for Science, Technology and Innovation (NACOSTI) and the permit obtained was presented
to the Meru-South Sub County Education and Commissioner offices for clearance. Four lactating Kenya
Alpine Dairy goats (KADG) in their second lactation and weighing 47.5±3 kg were used in the
experiment. The animals were purchased from farmers self help group in Matanya, Laikipia County. All
animals were housed individually in 1.4 by 1.1 by 1.1 meter wooden pens. Prior to commencement of the
experiment, the animals were kept for 14 days in order for them to acclimatize while observing their
health status, drenched with Albendazole 2.5% and treated against external parasites using pour on
preparation (Ectopor®) (Osuji et al. 1993 and Gaylean, 2010). The animals were then randomly assigned

Proceedings of the Third International Research Conference held on 26th to 28th October, 2016 72
four treatment diets that consisted of three natural licks and a standard commercially prepared mineral
mixture which served as a control.
Experimental Diet
The experimental diets consisted of three natural licks and a standard commercially prepared mineral
mixture (control) (Table 1). The licks were selected based on the sum total of the quantities of three
macro minerals, calcium, sodium and magnesium in each lick using the values obtained from the mineral
characterization of the natural licks in the study area (Nderi et al., 2015). In preliminary stage of the
experiment, natural licks from Kimenyi, Kieroo and Kang’au sites were selected because they had the
highest content of the three macro minerals which were; 3.04%, 1.93% and 1.56% respectively. However,
licks Kimenyi and Kieroo were not consumed by goats when offered but lick from Kang’au was accepted.
This led to selection of two next best lick sites in the sum total of calcium, sodium and magnesium, and
these were; Nagundu and Kabariange licks, whose concentrations were, 1.23% and 1.09% respectively.
The selected licks were accepted by the animals. As a result, the treatment diets comprised of three
natural licks from site Kang’au, Nagundu, Kabariange and commercial lick. The mineral contents for
Kang’au, Nagundu, Kabariange and control were as follows; Calcium, 24545, 13762, 14512 and
69600mg/kg, respectively; sodium, 3227, 4150, 4290 and 39600 mg/kg respectively; magnesium 14063,
9584, 5891and 9900 mg/kg respectively. The natural licks were ground using a mortar and pestle sieved
to pass through 2 mm screen, weighed using a weigh balance (OhausTM
), and offered to goats ad libitum
in wooden mineral troughs that were firmly fixed in the animal pens. The licks were topped up whenever
the level went low to ensure adequate supply. The lick intake was estimated as the difference between the
amount offered and refusal at the end of each experimental period.
Table 1: Mineral quantities (mg/kg) of mineral licks from sites with the highest mineral profile and
commercial lick
Diet Ca Na Mg
Kimenyi 44445 7961 26640
Kieroo 19812 4756 24427
Kang’au 24545 3227 14063
Nagundu 13762 4150 9584
Kabariange 14512 4290 5891
Commercial lick 69600 39600 9900
Basal Diet
The animals were fed on a basal diet that comprised of Boma Rhodes (Chloris gayana) hay and a
standard concentrate (Table 2). Before feeding, the grass hay was cut into small pieces using a motorized
shredder (Marina®). Two thirds of the daily basal diet was offered in the morning at 08:00 hours while
the other one third was offered at 15:00 hours.
Table 2: Chemical composition of Boma Rhodes and concentrate
Parameters Boma Rhodes Concentrate
DM (%) 95.267 91.706
CP (%) 7.008 17.645
CF (%) 37.504 13.715
EE (%) 2.341 6.761
Ash (%) 11.391 9.958
NFE (%) 41.746 51.921
OM (%) 88.609 90.042
Ca (mg/kg) 5800 10300
Na(mg/kg) 7200 4700
Mg (mg/kg) 800 1100
Water was given in plastic buckets ad libitum during the entire experimental period. A fourteen day
adaptation period whereby the animals were fed the treatment and basal diets was followed by a 4 day
data collection period during which the exact amounts of feed offered and refusal were recorded. The feed

Proceedings of the Third International Research Conference held on 26th to 28th October, 2016 73
intake was estimated as the difference between the amount offered and refusals on daily basis. An
allowance of 10% above previous day’s diet intake was given to cater for increased feed intake (Irungu et
al., 2004). A 5% sample of feed offered and refusal was collected on daily basis and stored under
refrigeration for analysis. The dry matter (DM), crude protein (CP), crude fiber (CF), Ether extract (EE),
nitrogen free extract (NFE) and total ash were determined in accordance to the methods of (AOAC,
1995). The macro elements, calcium (Ca), sodium (Na) and magnesium (Mg) were determined using
Atomic absorption spectrometry methods. Faeces were collected every morning from each goat for the
last 4 days of each period, weighed, pooled and thoroughly mixed before sampling. A 5% aliquot of the
total daily fecal output from each goat was transferred into a glass stoppered bottle containing a
preservative of 25 milliliters of concentrated sulphuric acid to await analysis.
Determination of Milk Yield
The goats were milked once daily at 0800hrs, and milk volume recorded on the last 4 days of the
experimental period. After the morning milking a 20 ml milk sample from each goat was taken and
pooled into one composite sample which was put in glass bottles with rubber stoppers to prevent moisture
loss and stored in freezer until chemical analysis.
Laboratory Analysis
Proximate analysis method was done for the basal diet (Chloris gayana) hay, concentrates and feces
(moisture content, crude protein, crude fiber, ether extract, ash and nitrogen free extract) according to
Gupta et al. (1988). The moisture contents were estimated by drying the samples in an Air Forced Draft
Oven (Model: Gallenkamp) at 105 oC till a constant weight was reached (AOAC, 1995). The samples
were then milled using Thomas Willey laboratory mill (Model: Thomas/Arthur H. Thomas co. Phila, PA,
USA) for analysis. Crude protein content was determined using Micro Kjeldahl distillation apparatus
(Model: Gerhardt Bonn-VAP001460). Crude fiber of the samples was determined in fat free samples by
treating with (2.04 N) 1.25% sulfuric acid solution (H2SO4), and the left over material was subjected to
further treatment with (1.78 N) 1.25% sodium hydroxide solution (NaOH). Ether extract content was
determined using Analytical grade petroleum ether 40-60 oC (AR Loba chemie) as a solvent in Soxhlet fat
extraction apparatus. Ash quantities were determined by direct incineration of samples in a Muffle
Furnace (Model: Heraewl. wicheraeusGmbH.Hanan) at 600 °C for three hours. Nitrogen free extract
(NFE) was calculated using the following equation: NFE% = 100 – (moisture contents% + crude
protein% + crude fiber% + ether extract% + ash %). Concentrations of calcium, sodium and magnesium
were determined in the samples by using atomic absorption spectrophotometer (PG990). The milk
samples were analyzed for butter fat (BF), Protein, Solids-Not-Fat (SNF), Density, Lactose, Solids and
Freezing point content using milk analyzer (Lactoscan®).
Data Analysis
Data were obtained by employing a 4 by 4 Latin square design using four experimental units in four
periods. The feed intake was determined by difference. Further the data collected were subjected to
statistical analysis using statistical analytical software (SAS®, Version 9.1). One way Analysis of
Variance (ANOVA) model was used and the level of significance (P<0.05) for lick intake, nutrient
intake, apparent digestibility and milk parameters determined as outlined by Kothari (2004). Correlation
analysis was carried out in milk samples to establish the relationship between natural licks sources and
milk parameters.
RESULTS AND DISCUSSION
Effects of Natural Lick on Dry Matter Intake and Digestible Nutrients Intake of the Basal Diet
Table 3 presents results from natural lick intake, feed dry matter intake and digestible nutrient intake of
the basal diet in goats fed licks from different sources. The mean lick intake by goats were; 405.50, 33.75,
68.50 and 237.50 g/kg/goat/day, for Kang’au, Nagundu, Kabariange sites and commercial licks
respectively. There was no significant difference on lick intake (P>0.05) among goats fed licks from
different sources. However, the highest consumption was observed from Kang’au lick site and the lowest
was on those fed on lick from Nagundu site. The dry matter intake were as follows; Kang’au (1.95),
Nagundu (1.82), Kabariange (1.84) and commercial lick (1.89) kg/day, respectively.

Proceedings of the Third International Research Conference held on 26th to 28th October, 2016 74
Table 3: Intake of mineral lick (grams/animal/day) and nutrients of the basal diet (kg dry matter
basis/day) fed to lactating goats
Lick source Lick
intake
Dry
matter
Organic
matter
Crude
protein
Crude
fiber
Ether
extract
Nitrogen
free
extract
Ash Conc:
forage
ratio
Kang’au 405.50 1.95 1.73 0.17 0.66 0.058 0.84 0.22 5.08
Nagundu 33.75 1.82 1.61 0.16 0.60 0.056 0.79 0.20 4.66
Kabariange 68.50 1.84 1.63 0.17 0.61 0.057 0.80 0.21 4.73
Commercial
lick
237.50 1.89 1.68 0.17 0.63 0.056 0.81 0.21 4.88
P>0.05, Kang’au, Nagundu, Kabariange
Table 4: Effects of source of mineral lick on digestible nutrients intake (% of dry matter basis/day)
of lactating goats
Lick source Crude
protein
Crude
fiber
Ether
extract
Nitrogen free
extracts
Total digestible
nutrients
Kang’au 4.96 10.83 1.22 14.96 31.97
Nagundu 3.60 9.83 1.48 14.19 29.10
Kabariange 4.97 12.98 1.62 18.64 38.21
Commercial lick 4.58 14.01 1.84 19.26 39.71
P>0.05, Kang’au, Nagundu, Kabariange
Table 5: Effects of Source of Mineral Lick on the Apparent Digestibility (% DM Basis)
Lick source Dry
matter
Organic
matter
Crude
protein
Crude
fiber
Ether
extract
Nitrogen free extract
Kang’au 31.09 37.82 54.59 30.88 34.87 35.01
Nagundu 28.36 34.16 39.17 25.74 48.76 34.18
Kabariange 37.82 43.27 54.84 37.45 50.21 43.09
Commercial lick 40.46 46.00 51.07 40.55 59.64 44.91
P>0.05, Kang’au, Nagundu, Kabariange
Table 6: Effects of Source of Natural Lick on Milk Yield (ml) and Quality in Lactating Goats
Lick source Milk Volume (ml) Milk quality (%)
Butter
fat
Protein Density Solids Lactose Solid-
Not-Fat
Kang’au 474 3.67 4.39 30.45 0.78 3.69 8.95
Nagundu 373 3.32 4.35 29.46 0.76 3.50 8.67
Kabariange 383 3.67 4.53 29.43 0.77 3.43 8.75
Commercial lick 377 3.63 4.44 29.88 0.77 3.64 8.79
P>0.05, Kang’au, Nagundu, Kabariange
These results also revealed that there was no significant difference on dry matter intake (P>0.05) among
goats consuming different licks. Similarly, there was no significant difference on nutrients intake of the
basal diet (P>0.05), and concentrate to forage ratio intake (P>0.05) in goats following consumption of
licks from various sources. Results in Table 4, showed that there was no significant difference on
digestible nutrients intake of the basal diet (CP, CF, EE, NFE, TDN) (P>0.05) due to consumption of
natural licks from different sources and a commercial lick. Ingestion of natural licks has been reported in
both domestic and wild animals, and it is associated with mineral supplementation, detoxification of plant
secondary metabolites and alleviation of digestive disorders (Ayotte et al., 2006). This study shows that
there were no significant differences on lick intake (P>0.05) among goats, which supports results of a
previous study on sheep in Ethiopia (Sisay et al., 2007). Presence of essential macro minerals in the
natural licks may explain the observed similarities on lick intake in comparison to the commercial lick,
which suggests that a goat could consume natural lick to meet the body’s mineral demand.

Proceedings of the Third International Research Conference held on 26th to 28th October, 2016 75
The natural lick from Kang’au tended to be consumed more than the rest, which implies that this lick
could be more palatable for goats than other licks. Sodium was previously suggested to be the attractant
for animals to consume licks because it is easily lost through leaching in soil and due to inability of
terrestrial plants to accumulate enough for the animals (Montenegro, 1998). In the present investigation,
however, consumption of natural licks was similar to commercial lick despite the fact that sodium level
was 9-12 times lower (Table 3). As indicated in Table 1, natural lick from Kang’au site also had higher
level of magnesium than the commercial lick and Boma Rhodes (basal diet). This implies that there could
be a physiological demand for magnesium in goats that made them to seek for natural licks as suggested
by Heimer (1988). One of the possible physiological reasons could be the need for magnesium as an
enzyme activator and for metabolism of carbohydrates and lipids (McDonald et al., 1995). Further
examination of these results showed that there was no significant difference on dry matter intake and
nutrient intake (P>0.05) among goats consuming licks from different sources. A consistent trend was
found in digestible nutrient intake, whereby there was no significant difference (P>0.05). The mean dry
matter intake by goats was found to be 3.95% (w/w), which exceeded the minimum expected daily dietary
intake of 3% for lactating goats (NOP, 2010). This observation might have been due to low levels of
minerals in the basal diet fed to goats which could have contributed to goats consuming more dry matter
in order to satisfy their physiological needs (Worker, 2015). Further, the 350 grams of concentrate given
might have not been sufficient to meet the goat’s mineral demand.
Apparent Digestibility of the Basal Diet
The apparent nutrient digestibility coefficient values were not significantly different (P>0.05) across all
the treatments (Table 5). This indicates that digestion of nutrients in the goat’s rumen was similar after
consuming licks from various sources. The presence of essential minerals in the natural licks as reported
in Table 1, might have contributed in providing nutrition that was required for microbial fermentation
(McDonald et al., 1995). Though the commercial lick is expected to be well balanced in minerals, it was
not better than the natural lick in influencing digestibility. However, the dry matter and nutrient
digestibility’s were generally low and this could have been associated with high fiber content in the basal
diet. This situation was attributed to harvesting grass when it had overgrown (BLGG, 2013). These results
indicated that the effects of consuming licks were the same as consumption of a standard commercial lick.
Milk Yield and Quality
The milk production and quality from goats fed on licks from different sources is presented in Table 6.
The mean milk production was 474, 373, 383 and 377 milliliters from goats fed on licks from Kang’au,
Nagundu, Kabariange and commercial lick respectively. These results indicate that there was no
significant difference on milk yield and quality (Butter fat, protein, milk density, solids, lactose, solid not
fat (P>0.05) among goats fed on licks from different sources. Although there were no significant
differences on milk yield and quality across all treatments, goats consuming lick from Kang’au site
produced more milk. These results support the previous studies that consumption of natural licks could be
associated with meeting the lactation demands of animals (Ayotte et al., 2006). The highest milk yield
that was found in Kang’au lick might be related to the relatively higher dry matter intake that was
associated with this lick (Table 3) which led to ingestion of more nutrients that was translated into milk
production. According to McDonald et al. (1995), the more feed an animal consumes each day, the
greater is the opportunity for increasing production.
These findings are supported by the correlation analysis (Table 7) which indicate a positive correlation of
0.75 between natural lick intake and milk production. Additionally, the three natural licks contained
essential macro minerals which are known to have a significant influence in milk production. For
example, the composition of milk is highly regulated and a deficiency of sodium in the diet tends to
decrease milk production (Suttle, 2010). A lot of calcium is lost in milk of lactating animals and therefore
a higher supplement is required in the diet (Singh, 1987). This indicates that the natural licks were
competitive to the commercial lick in influencing milk production and maintaining quality. Therefore,
natural licks could be a source of nutrition for high producing animals especially in the tropical areas
where pastures and forages have inadequate minerals.

Proceedings of the Third International Research Conference held on 26th to 28th October, 2016 76
Table 7: Coefficient of Correlation between Lick Source, Lick Intake, Feed Intake, Milk
Production and Quality
Lic
k s
ou
rce
Lic
k i
nta
ke
Dry
mat
ter
inta
ke
Org
anic
m
atte
r
dig
esti
bil
ity
Dry
m
atte
r
dig
esti
bil
ity
Mil
k p
rod
uct
ion
Lac
tose
Lick source Pearson’s
Correlation
1
Sig. (2-tailed)
Lick intake Pearson’s
Correlation
0.343 1
Sig. (2-tailed) 0.194
Dry matter intake Pearson’s
Correlation
0.109 0.462 1
Sig. (2-tailed) 0.688 0.071
Organic matter
digestibility
Pearson’s
Correlation
0.069 0.286 0.379 1
Sig. (2-tailed) 0.0800 0.282 0.148
Dry matter digestibility Pearson’s
Correlation
0.058 0.297 0.443 0.981 1
Sig. (2-tailed) 0.830 0.264 0.085 0.001
Milk production Pearson’s
Correlation
0.092 0.75 0.261 0.122 0.162 1
Sig. (2-tailed) 0.734 0.000 0.329 0.653 0.548
Lactose Pearson’s
Correlation
0.316 -0.269 -0.001 0.234 0.187 -0.557 1
Sig. (2-tailed) 0.232 0.314 0.996 0.382 0.488 0.024
CONCLUSION
The mean dry matter intake by goats consuming natural lick exceeds the minimum expected daily dietary
intake. The dry matter and nutrient digestibility by goats consuming natural licks from Igambang’ombe
are sites are generally low compared to the normal average. The milk yield and quality of dairy goats on
consuming natural licks are comparable to the commercial licks. However, the natural lick from Kang’au
site has more influence on milk production when compared to commercial licks. In general, natural licks
can be an alternative source of minerals where commercial mineral licks are not available.
ACKNOWLEDGEMENT
The authors sincerely acknowledge financial grant from Chuka University. The technical support from
Chuka University especially Juliet Makau, the University of Nairobi (Animal Nutrition), National
Agriculture Laboratory (NAL), and Dairy Recording Centre (Karatina) laboratories in Kenya is
appreciated. Special thanks go to Prof. E. N. Njoka, a specialist in Animal science, for his suggestions and
criticism without which this work could not have been in its present status.
REFERENCES
Association of Official Analytical Chemists. 1995. Official Methods of Analysis 16th Ed., Association of
Official Analytical Chemists, Suite 400, 2200 Wilson Boulevard, Arlington, Virginia 22201 USA
Ayotte, J B, Katherine L P, Joselito, M A, and Michael P G. (2006). Chemical Composition of Lick Soils:
Functions of Soil Ingestion by Four Ungulate Species, J. Mamm. 87(5):878-888.
Bakrie, E J, Hogan J E, Liang A M, Tareque M and Upadhyay R.C. (1996). Ruminant Nutrition for
International Agricultural Research, Australian centre for Agricultural Research, Canberra, ACT,
2601, p. 2.
Bishaw, F and Melaku S (2008), Effects of supplementation of Farta sheep fed hay with sole or mixtures
of noug seed meal and wheat bran on feed intake, digestibility and body weight change, Trop.
Anim. Health Prod. 40, pp.597–606.
Blake J G, Diego M, Guerra J, Bette A. L, Romo D, and Swing K (2011), Mineral Licks as Diversity
Hotspots in Lowland Forest of Eastern Ecuador, Diversity, 3:217-234.

Proceedings of the Third International Research Conference held on 26th to 28th October, 2016 77
BLGG Research (2013), Study on the Kenya Animal Feed and Fodder Subsectors, SNV. Kenya
Netherlands Development Program, p. 52.
Bravo, A, Kyle E H and Louise H E, Puddles created by geophagous mammals are potential mineral
sources for frugivorous bats (Stenodermatinae) in Peruvian Amazon, J. Trop. Ecol. 26:173–184.
Dudley, R, Kaspari, M, and Stephen P Y (2012), Lust for Salt in the Western Amazon, Biotropica,
44(1):6-9.
Galyean, M L (2010), Laboratory Procedures in Animal Nutrition Research, Department of Animal and
Food Sciences, Texas Tech. University, Lubbock, p. 70.
Garg, M R, Bhanderi B M, and Sherasia P L (2009), Macro and Micro-Mineral Status of Feeds and
Fodders Fed to Buffaloes in the Semi-Arid Zone of Rajasthan, Anim. Nutri. and Feed Tech.
9:209-220.
Gupta, P C, Khata V K, and Manadal A B, Ed. Analytical Techniques in Animal Nutrition, Directorate of
Publications, Haryana University, Hisar-125 004 (1988)
Heimer, W E (1988), A Magnesium-Driven Hypothesis of Dall sheep Mineral Lick Use: Preliminary
Tests and Management Relevance, Proc. Bienn. Symp. North Wild Sheep Goat Council, 6:269-
278.
Hishashi, M, Lagan P, Noreen M, Tangah J, Jumrafiah A, and Sukor, K. (2006), Importance of Natural
Licks for the Mammals in Bornean Inland Tropical Rain Forests, Ecol. Res. Doi 10.1007/S 11
284-006-0313-4.
Hogan, J S, Weiss W P, and Smith K L (1993), Role of Vitamin E and Selenium in Host Defense against
Mastitis, J. Dairy Sci. 76:2795-2803.
Houston, D C, Gilrard J D, and Hali J (2011), Soil Consumption By Elephants Might Help to Minimize
the Toxic Effects of Plant Secondary Metabolites, Mammo. Rev. 31(3):249-253.
Irungu, K R G, Ondabu N, Kitilit J K, Changwony D K, Kenana R S, and Mwangi J N (2004), Nutrient
Intake and Digestibility by Sheep Fed Three Cultivars of Sweet Potato Vines, Agricultural
Research as Champion of Change: Proc. Kari Bienn. Sci. Conf., p. 91.
Karbo, N (2007). Natural Mineral Licks to Enhance Livestock Growth. Appropriate Technology, 34, No.
1. In Press.
Katherine, L P, and Ayotte J B (2004), Ecological Importance of Mineral Licks in Tuchodi Watershed,
North-Central British Columbia, Natural Resources and Environmental Studies, University of
Northern British Columbia Prince George.
Kothari, C R, Ed. Research Methodology. Methods and Techniques, 2nd
Edn, New Age International (P)
Limited, Publishers 4835/24, Ansari Road, Daryaganj, New Delhi – 110002: p. 257. (2004)
McDonald, P, Edwards R A and Greenhaugh J F, Ed. Animal Nutrition, 5th Edn, Longman Group (UK) Ltd.
England: pp. 33-46. (1995)
McDowell, LR. (1997). Minerals for Grazing Ruminants in Tropical Regions, Extension Bulletin,
Department of Animal Science, Center for Tropical Agriculture, University Of Florida, Gainesville,
Florida.
Montenegro, L O The Behavior of Lowland Tapir (Tapirus terrestris) at a Natural Mineral Lick in the
Peruvian Amazon, M.Sc. Thesis, University of Florida Gainesville:56 (1998)
National Organic Program, (2010). Dry Matter Organic Tables for Classes of Goats. USDA Org. NOP
5017-7. (202) 720-3252.
Nderi, O M, Musalia L M, Ombaka O (2015), Determination of Essential Minerals and Toxic Elements
Composition of the Natural Licks Consumed by livestock in Tharaka-Nithi County, Kenya,
IOSR, J. Agric. and Vet. Sci. 8 (10):54-62.
Nderi, O M, Musalia, L M and Ombaka O (2014), Livestock Farmers Perceptions on the Relevance of
Natural Licks in Igambang’ombe Division, Tharaka-Nithi County, Kenya, IOSR, J. Agric. and
Vet. Sci. 7(5):52-59.
Osuji, P O, Nsahlai I V and Khalili H (1993), Feed Evaluation, ILCA Manual 5 ILCA (International
Livestock Centre for Africa), Addis Ababa, Ethiopia:40.
Rice, C G (2010), Mineral Visitation by Mountain Goats (Oreamnos americanus), Canadian Field
Naturalist, 124(3):225-237.
Singh, UB, Advanced Animal Nutrition for Developing Countries. Indo-Vision Private Limited (1987).
Sisay, T, Vijchulata P, Chairatanayuth P, and Swasdiphanich S (2007), Effects of Mineral Soils on Body
Weight and Liver Minerals of Black Head Somali Sheep in Ethiopia, J. Nat. Sci. 41:288-299.

Proceedings of the Third International Research Conference held on 26th to 28th October, 2016 78
Suttle, NF, Ed. Mineral Nutrition of Livestock. 4th Edn, CABI Head Office, Nosworthy Way,
Wallingford Oxfordshire Ox10 8de UK, p. 17. (2010)
Tiffany, M E, McDowell L R, O’Connor G A, Nguyen H, Martin F G, Wilkinson N S, and Cardoso E C
(2000), Effects of Pasture applied Biosolids on Forage and Soil Concentrations over Grazing
Season in North Florida, I. Macro Minerals, Crude Protein and In Vitro Digestibility. Comm. Soil
Sci. Plant Anal. 31:201-203.
Ulli, G L (2010), Ingestion of Earth Materials for Health by Humans and Animals, Int. Geol. Rev. 52:7-
8:726-744.
Worker, S B, Kielland K, and Barboza P S (2015), Effects of Geophagy on Food Intake, Body Mass, and
Nutrient Dynamics of Snowshoe Hares (Lepus Americanus), Canadian. J. Zoo. Vo. 93:323-329.
Yinnesu, A and Nurfeta A (2012), Effects of supplementing Erythrina brucei leaf as a substitute for
cotton seed meal on growth performance and carcass characteristics of Sidama goats fed basal
diet of natural grass hay, Trop. Anim. Health Prod, 44:445–451.
******
EFFECT OF REPLACING FISH MEAL WITH BLOOD MEAL ON CHEMICAL
COMPOSITION OF SUPPLEMENT FOR NILE TILAPIA (Oreochromis niloticus)
Kirimi, J.G.a, Musalia, L.M.b and Munguti, J.M.c
aState Department of Fisheries, P. O. Box 775-60202, Nkubu, Kenya, Email: [email protected] bDepartment of Animal Sciences, Chuka University, P. O. Box 109-60400 Chuka, Kenya
cKenya Marine and Fisheries Research Institute (KMFRI)-Sagana, P. O. Box 451, Sagana, Kenya
Correspondence: Tel.: 0722-273792. Email: [email protected]
ABSTRACT
The objective of the work was to evaluate the effect on the nutrient content of replacing fish meal (FM)
with blood meal (BM) in fish supplement. Three isonitrogenous diets (35% crude protein) were
formulated using FM as the main source of animal protein (BM0); 50% replacement of FM with blood
meal (BM50); or 100% replacement of FM with BM (BM100). The chemical composition (ash, crude
protein, crude fat and crude fibre) and amino acids composition were determined. Replacement of FM
with BM did not affect the proximate composition of the diet apart from ash content which decreased
with the level of substitution. Substituting fish meal with blood meal reduced the level of methionine,
lysine, isoleucine, leucine, proline, valine and increased the levels of arginine, phenylanine and alanine in
the diet. Amino acid indices revealed that BM0 had more amino acids with highest chemical scores
followed by BM50 and BM100. In all the diets, methionine was the most limiting amino acid. The
essential amino acid index of the diets reduced with the level of replacement of FM (0.94, 0.88 and 0.77).
The study showed substitution of up to 50% FM with BM gave a useful protein diet and 100% gave
almost a poor protein diet.
Keywords: Amino acids; Chemical score; Essential a.a. index; Nutritive value
INTRODUCTION
The nutrient quality of feed ingredients is one of the major prerequisites apart from their availability for
the production of good quality feeds (Sogbesan and Ugwumba, 2008). In view of the high crude protein
level in fish diet, protein is the most significant and expensive single nutrient in preparation of this diet.
Formulating cost effective feeds that meet the essential amino acid (EAA) requirements of fish and
shrimp can be a challenge (Kaushik and Seiliez, 2010) and depend on relevant data on both EAA
requirements of the fish species and the EAA supplied with the feed. Fish meal has been the main protein
source and the use of alternative feedstuffs requires a thorough understanding of amino acid requirements
and their availability in feedstuffs.
Proximate analysis is used in the initial evaluation of feeds and feedstuffs to provide information on their
major nutrient and gross energy contents (Jobling, 2001; Bunda, et al., 2015). Another evaluation criteria
is the protein chemical score (CS) defined as the lowest ratio of the essential amino acid content in the
test protein to the content of each amino acid in the muscle protein or to the EAA required level when the
EAA requirement is already established. The assumption of chemical score was that whole egg protein is
of the highest biological value (BV) and therefore the most suitable for growth and that growth is limited
by that essential amino acid in the diet whose ratio to its content in the whole egg protein is the lowest

Proceedings of the Third International Research Conference held on 26th to 28th October, 2016 79
(Hepher, 1988). Bunda, et al., (2015), noted that although the first limiting amino acid has an important
role in determining the relative value of the dietary protein, it was realized that other essential amino acids
may also have some effect on it and this resulted in the development of the essential amino acid index
(EAAl). According to Oser (1959), essential amino acid index (EAAI) is the geometrical mean of the
ratio of all EAA in the evaluated protein relative to their content in a highly nutritive reference protein
such as whole egg. The objective of this study therefore was to investigate the chemical composition
(proximate and essential amino acids composition) of feed ingredients and the resulting ration when fish
meal is replaced with blood meal from local slaughter houses.
MATERIALS AND METHODS
Study Site
The study was conducted at the National Aquaculture Research, Development and Training Centre in
Sagana, located at altitude1230 m above sea level, latitude 0°39´S and longitude 37°12´E, and 90km
north of Nairobi.
Preparation of Diets
The feed ingredients (fish meal, wheat bran, cotton seed cake, soya bean meal and blood meal) were
obtained from the local markets. Bovine blood was collected from the local Sagana abattoir. Fresh blood
drained from freshly slaughtered cattle was collected into a clean container, transported to Sagana
National Aquaculture Centre and boiled immediately in a cooking container to 1000C for 45 minutes in
order to let water evaporate and destroy pathogenic organisms (Khawaja et al., 2007). As the blood
boiled, it was continually stirred until it formed dough. The product was removed from the fire then
drained and crushed manually to increase the drying surface area. The product was spread on a polythene
liner and sun dried for three days to a moisture content of below15%. The dried product was milled into a
fine powder with a hammer mill.
Three isonitrogenous diets (35% CP) were formulated in triplicate, using wheat bran, soybean meal,
cotton seedcake and either fish meal as the main source of animal protein (BM0); 50% replacement of
fish with blood meal (BM50) and 100% replacement of fish with blood meal (BM100) (Table 1).
Table 1: Ingredient composition and calculated chemical composition (%) of fish supplement
containing blood meal as a replacement of fish meal (as fed basis)
Ingredient BM0† BM50† BM100†
Fish meal 36.6 18.4 0
Blood meal 0 12.5 25.5
Wheat bran 48.4 53.8 59.5
Soybean meal 10 10.3 10
Cotton seedcake 5 5 5
Total 100 100 100
Calculated chemical composition (%)
Crude protein (%) 35 35 35
†, BM0, BM50 and BM100 represent replacement of fish meal at 0, 50 and 100%, respectively.
The ingredients were ground using a hammer mill to be uniform and mixed thoroughly by hand in desired
proportion. Water was added to form dough and pelleted using a pelleter machine to particle size 4.5 mm
diameter. The pellets were then dried in the shade.
Analysis of Feeds
The proximate analysis of ingredients and diets were carried out as described by the AOAC (1995) for
crude protein (CP), ether extracts (EE), ash and crude fibre (CF). Nitrogen free extracts (NFEs) were
estimated by subtracting the total moisture, crude protein, ether extracts, ash and crude fibre from 100.
The method for protein extraction was adopted from Hamilton et al., (2012) for amino acid analysis using
LC-Qtof-MS.
The amino acid score was calculated as:

Proceedings of the Third International Research Conference held on 26th to 28th October, 2016 80
Chemical score (%) = [essential amino acid insample/essential amino acid of the whole hen egg] x100
While essential amino acid index (EAAI) was calculated as:
EAAI= n ⁄ {(aa1/AA1) (aa2/AA2)... (aan /AAn)}, Where EAAI is the n th root of the essential amino acids
in the test diet (aa) to the content of each of those amino acids in the reference tissue (AA) and n is the
total number of amino acids evaluated (Tidwell et al., 1993). Measurements were done in triplicate. The
data were subjected to one-way Analysis of Variance (ANOVA) using Statistical Package for Social
Sciences version 17.0 (SPSS Statistics) and where there were differences, mean separation was done by
least significance difference (LSD).
RESULTS
Chemical Composition of Diets
The proximate composition of the feed ingredients is shown in (Table 2). Blood meal recorded the highest
crude protein content of 80.41% with soy bean meal recording the lowest crude protein content of
11.47%. Cotton seedcake had the highest crude fibre content (23.43%) with fish meal recording the
lowest crude fibre content (0.52%). The ash content was high in fish meal (16.13%) compared with
soybean meal (3.07%). Blood meal had a low residual oil compared to the cotton seedcake (0.62% vs
8.5%).
Table 2: Proximate composition of feed ingredients used to formulate fish supplements containing
blood meal as a replacement for fish meal
% Proximate
composition
Fish meal Blood meal Soybean meal Cotton seed cake Wheat bran
Dry matter 90.85c±0.24 89.47
e±0.06 92.31
a±0.07 92.06
ab±0.17 89.55
de±0.07
Crude protein 64.20b±0.27 80.41
a±0.13 11.47
e±0.04 27.07
c±0.40 14.49
d±0.02
Ether extracts 5.07c±2.14 0.62
e±0.21 5.85
bc±0.44 8.52
ab±0.40 2.13
abcde±0.33
Ash 16.13a±0.19 4.52
b±0.31 3.07
c±0.23 3.92
bcd±0.89 5.78
be±0.73
Crude fibre 0.52e±0.12 1.34
de±0.28 9.75
c±0.87 23.43
a±0.77 12.58
b±0.85
Nitrogen free
extracts
4.94d±1.63 2.62
de±0.28 62.17
a±0.47 29.14
c±0.66 54.6
b±1.14
Values are expressed as mean ± SE a,b,c,d,e
, Values in the same row having different superscript letters are significantly different (P <0.05).
The proximate composition of the formulated diets is shown in Table 3. Replacement of FM by BM
increased (P<0.05) the crude protein values. Ether extracts were the same for BM50 and BM100 with a
slight increase in BM0 (3.4%). Total replacement of fish meal had the lowest ash content with BM0
recording almost twice that of BM100. However, BM0 recorded the lowest crude fibre content (9.3%)
with BM50 and BM100 recording almost the same figure.
Table 3: Proximate composition of fish supplements containing blood meal as a replacement for
fish meal
BM0† BM50† BM100†
Dry matter 90.59c±0.10 91.15
b±0.13 91.37
ab±0.08
Crude protein 32.08c±0.15 33.88
a±0.39 33.69
ab±0.03
Ether extracts 3.41a±0.35 3.00
a±0.28 3.00
a±0.40
Ash 9.45a±0.10 7.13
b±0.07 5.1
c±0.58
Crude fibre 9.3c±0.23 11.37
a±0.20 11.28
ab±0.36
Nitrogen free extracts 36.36b±0.25 35.78
b±0.49 38.3
a±0.66
Values are expressed as mean ± SE. a,b,c
, Values in the same row having different superscript letters are significantly different (P <0.05)
†, BM0, BM50 and BM100 represent replacement of fish meal at 0, 50 and 100%, respectively.
Amino Acid Composition
Blood meal had the highest amount isoleucine (118.07 mg/g protein) although phenylalanine combined
with tyrosine had 137.01mg/g protein (Table 4). Alanine was the lowest (13.97) followed by arginine and

Proceedings of the Third International Research Conference held on 26th to 28th October, 2016 81
leucine. The chemical score was highest for phenylalanine and tyrosine (147.32%), methionine (71.91%)
and lysine (64.06%).
Table 4: Amino acid composition (mg/g Protein) and chemical score of blood meal
Amino acid Composition Chemical score
Methionine 40.99 71.91
Lysine 44.84 64.06
Leucine 30.03 34.92
Isoleucine 118.07 218.65
Valine 61.43 93.08
Phenylalanine + tyrosine 137.01 147.32
Alanine† 13.97
Arginine 23.45
Proline† 39.01
†, Nonessential amino acids
Methionine, leucine, isoleucine, valine and proline content of BM100 were lowest and highest in BM0.
Arginine was high in BM100 with BM50 and BM0 being almost the same. BM50 recorded highest
content of tyrosine and lysine compared to the other diets (Table 5)
Table 5: Amino acid composition (mg/g protein) of fish supplements containing blood meal as a
replacement for fish meal
Amino acid BM0† BM50† BM100†
Methionine 38.31a±0.08 35.11
a±2.39 30.09
a±3.00
Lysine 45.38a±14.35 59.79
a±3.01 47.60
a±9.50
Leucine 75.62a±1.40 61.43
b±2.24 47.18
c±1.35
Isoleucine 96.23a±0.20 76.85
a±10.43 73.88
a±11.07
Alanine 33.54a±4.82 30.89
a±7.44 46.62
a±8.99
Valine 62.06a±2.54 50.44
b±0.52 46.34
c±0.78b
Arginine 20.87a±0.85 20.03
a±0.88 24.05
a±1.58
Proline 57.09a±2.24 47.15
b±0.51 45.19
bc±2.12
Phenylalanine 71.36a±7.42 70.48
a±1.00 74.04
a±3.30
Tyrosine 27.31a±3.73 34.09
a±1.76 27.93
a±1.69
Values are expressed as mean ± SE. a,b,c
, Values in the same row having different superscript letters are significantly different (P <0.05).
†, BM0, BM50 and BM100 represent replacement of fish meal at 0, 50 and 100%, respectively.
Data on chemical scores and EAAI (Table 6) shows that isoleucine had the highest percentage chemical
score in the three supplements i.e. 178.20, 142.31 and 136.81 for BM0, BM50 and BM100, respectively.
However, the chemical score for methionine was lowest in BM100 with BM0 recording the highest score.
The chemical score for lysine decreased with the level of substitution of FM with BM (85.41, 68 and
64.83). BM0 had the highest chemical scores for methionine, leucine, isoleucine and valine while BM100
recorded the lowest chemical scores for methionine, valine, isoleucine, leucine and phenylalanine+
tyrosine. The EAAI was highest in BM0 (0.94) followed by BM50 (0.88) and BM100 (0.77)
DISCUSSION
Proximate Composition
The proximate composition of the test ingredients i.e. fish meal, cotton seedcake, wheat bran and blood
meal used in this study was within the range of values reported by other authors (Drew et al., 2007; UM-
E-kalsoom, 2009; Al Mahmud et al., 2012). The crude protein (11%) was markedly low in soybean meal.
Lovell (1988) noted that nutrient composition of feedstuffs depends on the origin, state and processing
methods used. However, according to the National Research Council, (1993), solvent extraction of the oil
results in soybean meal (SBM) containing 44% crude protein if the soybean hulls are included or 48%
crude protein without the hulls. The low CP content was due to adulteration of the soybean meal by
marketing agents using cheap low quality ingredients like saw dust. This was reflected in the high CF

Proceedings of the Third International Research Conference held on 26th to 28th October, 2016 82
content of SBM (9.75%) which was more than double that recorded by Agbo (2008) and Noreen and
Salim (2008) i.e. 3.82% and 1.09% respectively. It is important to note that although the crude protein
level of soybean was below the expected level, this had the same effect across the three diets formulated
because inclusion levels of soybean meal were the same at 10%. This reveals that farmers can purchase
adulterated ingredients leading to formulation of substandard feeds which intern is reflected by the poor
performance of the animal.
Table 6: Chemical scores (%) and essential amino acid index (EAAI) of fish supplements containing
blood meal as a replacement for fish meal
BM0† BM50† BM100†
Amino acid Chemical score
Methionine 67.21a±0.14 61.59
a±4.19 52.79
a±4.64
Lysine 64.83a±20.50 85.41
a±4.30 68.01
a±13.57
Leucine 87.93a±1.60 71.43
b±2.62 54.86
c±1.56
Isoleucine 178.20a±0.37 142.31
a±19.31 136.81
a±20.49
Valine 94.03a±3.84 76.42
b±0.79 70.21
bc±1.17
Phenylalanine +tyrosine 106.08a±11.99 112.44
a±2.97 109.61
a±1.73
Essential amino acid index 0.94a±0.60 0.88
a±0.35 0.77
a±0.20
Values are expressed as mean ± SE a,b,c
, Values in the same row having different superscript letters are significantly different (P <0.05).
†, BM0, BM50 and BM100 represent replacement of fish meal at 0, 50 and 100%, respectively.
Cottonseed cake recorded a higher crude fibre of all the ingredients (Table 2) which is considered a
limiting factor in its use as feed. Nagalakshmi et al., (2007) observed that high level of crude fibre in
cotton seed cake is inversely proportional to the concentration of protein and further revealed that the
crude protein of undecorticated cotton seed meal ranged from 22.2 to 30.31%.
The crude protein content of fish meal (64.20%) was below that obtained by Otubusin (2009) who
recorded 70% CP. This figure together with the ash content (16.3%) were within the normal range which
according to Drew et al., (2007), may vary from 50 to 70% and 10 to 21% respectively, depending on
fish species, the source and processing method. The crude protein of wheat bran was the same as that
obtained by UM-E-kalsoom (2009) and Al Mahmud et al., (2012) but ash and ether extracts were
relatively low. The crude protein of blood meal (80%) was close to the results by Drew et al., (2007)
while the ash content was double (4.5%). However, Otubusin et al., (2009) recorded similar results for
crude protein but ash content was zero.
The proximate analysis of the three supplements (Table 3) shows that the crude protein had slight
variation from the formulated diet on as fed bases (Table 1). This was due to fluctuation in the crude
protein content of the ingredients (Table 2), in particular soybean meal and cottonseed cake. Substitution
of FM with BM gave higher crude fibre content of 11.37% for diet BM50 and 11.28% for BM100. This
was due to increased amount of wheat bran incorporated in the diet to adjust for the CP content in the
formulation of the diets (Table 1). High fibre content reduces the total dry matter and nutrient digestibility
of the diet, resulting in poor performance (De Silva and Anderson, 1995). In addition it adds to the faecal
waste which affects the water quality and hence fish performance (Lovell, 1998). According to De silva
and Anderson (1995), crude fibre was within the normal range of 8-12% for diets of fish. A high ash
content of BM0 (9.45%), which was almost double when 100% of FM was substituted with BM, was due
to the high ash content in fish meal (Table 2). The FM is dried on sandy ground along the lake, which
contributes to the high ash content. There was little variation in lipid content (3-3.4%) with substitution of
FM. However, this was below the recommended levels of 5-12% for tilapia (Suresh, 2003).
Amino Acid Composition
Low methionine content on substitution of FM was due to low methionine in blood meal compared to fish
meal. Similarly, substituting fishmeal wholly with blood meal as in the case of BM100, reduced the level
of some amino acids in the supplement i.e. methionine, lysine, isoleucine, leucine, proline, valine and

Proceedings of the Third International Research Conference held on 26th to 28th October, 2016 83
increased arginine, phenylanine and alanine in the supplements. Thus, BM0 displayed better amino acid
profile with higher methionine, isoleucine, leucine, lysine, valine and proline.
It is worth noting that cystine was not detected in the supplements (Table 5) and according to the National
Research Council (1993) there exists a relationship among amino acids such that cystine can be formed
metabolically from dietary methionine at a rate sufficient to meet the requirements of fish but the reverse
sequence of reactions does not occur. Methionine can thus meet the total sulfur amino acid requirement of
fish, although some of this requirement may be met by cystine (National Research Council, 1993). Based
on this, the cystine requirement for fish can be met by the methionine content in the diet. In addition,
phenylalanine and tyrosine were present in the three supplements but a similar relationship exists between
aromatic amino acids (phenylalanine and tyrosine). Fish readily convert phenylalanine to tyrosine so that
phenylalanine alone can meet requirements for aromatic amino acids but the presence of tyrosine in the
diet reduces some of the requirement for phenylalanine (National Research Council, 1993).
Considering the amino acid profile in the supplements against the recommended levels for Nile tilapia
(National Research Council, 1993), the amino acid profiles were low which can lead to poor utilization of
the dietary protein and consequently reduce growth and decrease feed efficiency (Halver and Hardy,
2002). Dietary amino acid utilization requires that all amino acids are simultaneously present in adequate
concentrations at sites of protein synthesis. Hence, deficiency of an essential amino acid limits protein
synthesis to the level of that particular essential amino acid, the remainder being catabolized (Sveier et al.,
2001). For most essential amino acids, deficiency translates to a reduction in weight gain. In some species
of fish, a deficiency of methionine or tryptophan leads to pathologies, because these amino acids are not
only incorporated into proteins but also used for the synthesis of other compounds (Lovell, 1998). For
example, cataracts occur in salmonids and rainbow trout as a consequence of methionine (sulphur amino
acids) and tryptophan deficiency respectively in their diets (Lovell, 1998). The amino acids in
supplements were not met because they were not formulated based on an ideal protein concept and
according to Yamamoto et al., (2004), the diets could depress feed intake and growth of fish.
Chemical Score and Essential Amino Acid Index
In the present study, BM displayed a high chemical score for phenylalanine + tyrosine and isoleucine.
The most limiting amino acid in BM100 and BM50 was methionine. This could be attributed to the use of
blood meal. In the present study, high chemical scores were associated with low substitution of fish meal,
which is better balanced in amino acids than blood meal.
Although the chemical score is important in determining the relative value of dietary protein, other
essential amino acids could also have an effect on the nutritive value of the dietary protein, as reflected in
the EAAI (Table 6). The chemical score is based on the assumption that whole egg protein is of the
highest biological value and thus the most suitable for growth, which could be limited by the EAA in the
diet whose ratio to its content in the whole egg protein is the lowest (Hepher, 1988). The EAAI of the
three supplements, BM0, BM50 and BM100 was estimated to be 0.94, 0.88 and 0.77, respectively. Good
quality protein sources have an EAAI greater than or equal to 0.90, useful protein sources have a value of
0.80 whereas sources with values below 0.70 are considered to be inadequate (Oser, 1959; Penaflorida,
1989). Thus, BM0 in the present study could be considered to be a good quality protein supplement,
BM50 a useful protein supplement and BM100 was closer to a poor protein source.
CONCLUSION
The proximate contents of the three supplements were within the required level for growing fish.
However, considering the amino acid composition, substitution of up to 50% FM with BM gave a useful
protein diet and 100% gave almost a poor protein diet. It can be concluded that blood meal can partially
replace 50% fish meal in the diets of Oreochromis niloticus. Further studies on the use of blood meal as a
replacement for fish meal on the nutritive value of diets for Oreochromis niloticus is recommended.
ACKNOWLEDGEMENT
The authors thank Kenya Marine and Fisheries Research Institute (KMFRI) for funding the analysis of
this work. Special thanks goes to International Center for Insect Physiology and Ecology (ICIPE) and

Proceedings of the Third International Research Conference held on 26th to 28th October, 2016 84
Department of Animal Sciences, Egerton University for providing their facilities for proximate and amino
acid analysis.
REFERENCES
Agbo, W. N. (2008). Oil seed meals as dietary protein sources for juvenile Nile tilapia (Oreochromis
niloticus L.). PhD thesis. University of Stirling Scotland.
Al Mahmud, N., Robiul, M. D., Hossain, M. and Maruf, H. M. (2012). Proximate composition of fish
feed ingredients available in Lakshmipur region, Bangladesh. American-Eurasian Journal of
Agriculture and Environmental Science, 5, 556-560
AOAC, (1995). Official Methods of Analysis, 16th Edn; Association of Official Analytical Chemists
International, Arlington VA, USA.
Bunda, M. G. B., Tumbokon, B. L. M. and Serrano Jr. A. E., (2015). Composition, chemical score (CS)
and essential amino acid index (EAAI) of the crinkle grass (Rhizoclonium spp.) as ingredient for
aqua feeds. Aquaculture, aquarium, conservation and legislation. International Journal of Bioflux
8(3), 411-420
De Silva, S. S. and Anderson, T. A. (1995). Fish nutrition in aquaculture. Chapman and Hall Aquaculture
series. London 319 pp
Drew, M. D., Borgeson, T. L. and Thiessen, D. L. (2007). A review of processing of feed ingredients to
enhance diet digestibility in finfish: Nutrition technologies in animal feed science and technology.
Animal Feed Science and Technology, 138 (2), 118-136.
Halver, J. E. and Hardy, R. W. (2003). Nutrient flow and retention. In: Halver, J. E. and Hardy, R.W.,
(Eds.) Fish Nutrition,3rd
edn. Academic press, New York, pp. 755–770.
Hamilton, B. S., Xiangjie, S. and Changik, C. (2012). Acquisition of a novel eleven amino acid insertion
directly N terminal to a tetra basic cleavage site confers intracellular cleavage of an H7N7
influenza virus hemagglutinin. Journal of Virology, 434(1), 88–95
Hepher, B. (1988). Nutrition of pond fishes. Cambridge University Press, Cambridge, UK. pp388.
Jobling, M. (2001). Feed composition and analysis. In: Houlihan, D. F., Boujard, T., Jobling, M. (eds),
Food intake in fish. Blackwell Science Ltd, Oxford: p. 1-24.
Kaushik, S. J. and Seiliez, I. (2010). Protein and amino acid nutrition and metabolism in fish. Current
knowledge and future needs. Aquaculture Research, 41, 322-332
Khawaja, T., Khan, S. and Ansari, N. (2007). Effect of different levels of blood meal on broiler
performance during two phases of growth. International J. Poultry Science, 6(12), 860-865.
Lovell, R. T. (1988). Use of soya bean products in diets for aquaculture species. Journal of Aquaculture
Production, 2, 27-52.
Lovell, T. (1998). Nutrition and feeding of fish. 2nd edn. Kluwer Academic, Boston, MA/ London:
Nagalakshmi, D., Rama Rao, S. V., Panda, A. K. and Sastry, V. R. B. (2007). Cottonseed meal in poultry
diets: A review. Journal of Poultry Science 44, 119-134.
National Research Council, (1993). Nutrients requirements of fish. National Academy Press, Washington
D.C., USA.
Noreen, U. and Salim, M. (2008). Determination of nutrient digestibility and amino acid availability of
various feed ingredients for Labeo rohita. International Journal of Agriculture and Biology, 10,
551-555
Oser, B. L. (1959). An integrated essential amino acid index for predicting the biological value of
proteins. In: Albanese A. A. (ed.). Protein and Amino Acid Nutrition., Academic Press, New
York, USA, pp. 281-295.
Otubusin, S. O., Ogunleye, F. O. and Agbebi, O. T., (2009). Feeding trials using local protein sources to
replace fish meal in pelleted feeds in cat fish (Clarias gariepinus Burchell 1822) culture.
European Journal of Science Research, 31(1):142-147
Penaflorida, V. D. (1989). An evaluation of indigenous protein sources as potential component in the diet
formulation for tiger prawn, Penaeus monodon, using essential amino acid index (EAAI).
Aquaculture, 83, 319-330.
Sogbesan, A. and Ugwumba, A. (2008). Nutritional values of some non- conventional animal protein
feedstuffs used as fish meal supplement in aquaculture practices in Nigeria. Turkish Journal of
Fisheries and Aquatic Science 8, 159-164

Proceedings of the Third International Research Conference held on 26th to 28th October, 2016 85
Suresh, V. (2003). Tilapias. In: Lucas, J. S. and Southgate, P. C., (Eds.). Aquaculture: Farming of aquatic
animals and plants, Blackwell Publishing, Oxford, UK. pp. 321-345
Sveier, H., Nordas, R., Berge, G. E. and Lied, E., (2001). Dietary inclusion of crystalline D- and L-
methionine: Effects on growth, feed and protein utilization, and digestibility in small and large
atlantic salmon (Salmon salar L.). Aquaculture Nutrition, 7 (3), 169-181.
Tidwell, J. H., Webster, C. D., Yancey, D. and Abramo, L. R., (1993). Partial and total replacement of
fish meal with soybean meal and distillers by-products in diets for pond culture of the freshwater
prawn (Macrobrachium rosenbergii). Aquaculture, 118,119–130
Um-E-Kalsoom, M., Salim, T., Shahzadi. and Barlas, A. (2009). Growth performance and feed
conversion ratio (FCR) in hybrid fish (Catla catla x Labeo rohita) fed on wheat bran, rice broken
and blood meal. Pakistan Veterinary Journal 29, 55-58.
Yamamoto, T., Shima, T. and Furuita, H., (2004). Antagonistic effects of branched chain amino acids
induced by excess protein bound leucine in diets for Rainbow trout (Onchorhynchus mykiss).
Aquaculture, 232, 359-550
******
PERFORMANCE OF NILE TILAPIA (Oreochromis niloticus) FED DIETS CONTAINING
BLOOD MEAL AS A REPLACEMENT OF FISH MEAL
Kirimi, J.G.1,2, Musalia, L.M.1*, Magana, A.3 and Munguti, J.M.4 1Department of Animal Sciences, Chuka University, Chuka, Kenya
2State Department of Fisheries, Ministry of Agri, Livestock, Fisheries, Nkubu, Kenya. Email: [email protected] 3Department of Biological Sciences, Chuka University, P. O. Box 109-60400, Chuka
4Kenya Marine and Fisheries Research Institute (KMFRI)-Sagana, Sagana, Kenya Correspondence: Tel: 0722-273792. [email protected], [email protected], [email protected]
ABSTRACT
A 100 days experiment was conducted to determine the effect of feeding blood meal (BM) as a
replacement of fish meal (FM), as the main source of animal protein, on growth rate and economic
performance of Nile tilapia in fertilized pond. Three isonitrogenous diets (35% crude protein) were
formulated using either FM as the main source of animal protein (Diet 1); 50% replacement of FM with
blood meal (Diet 2); or 100% replacement of FM with BM (Diet 3). Three hundred Nile tilapia
fingerlings (12±3 g) were randomly distributed into three groups of four replicates of 25 fingerlings per
cage. The groups were randomly assigned the 3 diets which were fed at 2% of their biomass at 10 am and
4pm every day. Percentage daily weight gain (DWG), relative growth rate (RGR), specific growth rate
(SGR), survival rate and feed utilisation efficiency were measured. Fish fed diet 1 were larger (50.69 g)
(P < 0.05) than those fed diet 2 (48.47 g) and 3 (40.37 g). Replacement of FM with 50% and 100% BM
reduced the incidence cost (45.55, 37.83 and 31.88, respectively). The profit index was highest with
100% (9.42) replacement of FM, compared to 50% (7.95) and 0% (6.69). Although replacing FM with
BM was associated with reduced growth, the economic return was better (P < 0.05). Based on the present
results, it was economical to use BM as a major protein source instead of FM in formulating fish feed.
Keywords: Blood meal, Crude protein, Growth performance, Nile tilapia
INTRODUCTION A major determinant of successful growth and intensification of aquaculture production is aqua feed.
According to Higgs, Prendergast, Dosanjh, Beames, and Deacon (1994), research in fish nutrition is
focused on reducing the cost of feeds which accounts for 40-60% of the running cost of intensive system.
Dietary protein is the major and most expensive component of formulated aqua feeds (Wilson, 2002) and
the commonest source is fish meal, which is often scarce and expensive. Fish meal is considered the most
desirable animal protein ingredient in aqua feeds because of its high protein content, balanced amino acid
profile, high digestibility and palatability, and as a source of essential n-3 polyenoic fatty acids (Hardy
and Tacon, 2002). There is a growing concern to substitute fish meal with less expensive protein sources.
However, attempts to partially or completely replace fish meal component with alternative protein sources
have resulted in variable success notably reduced feed efficiency and growth at higher dietary inclusion
levels (Jackson et al.,1982; Viola, et al., 1982; Tacon and Jackson, 1985; NRC, 1993; Sogbesan, 2006).

Proceedings of the Third International Research Conference held on 26th to 28th October, 2016 86
The future of aquaculture in Kenya will depend on development of nutritionally sound and cost-effective
feeds based on non conventional feedstuff that can support increased production levels in both intensive
and especially semi-intensive systems. Utilization of non-conventional feedstuffs of plant origin has been
limited by presence of anti-nutritive compounds like alkaloids, glycosides, oxalic acids, phytates, protease
inhibitors, haematoglutinin, saponins, mimosine, cyanoglycosides, linamarin to mention a few despite
their nutrient values and low cost implications (Sogbesan, 2006). The non conventional feed stuff of
animal origin are high quality feed ingredients that could compare to some extent with the conventional
types (Gabriel et al., 2007). They are cheaper by virtue of the fact that there is no competition for human
consumption. Also according to (NRC, 2011), processed animal protein ingredients such as blood meal,
feather meal and poultry by-product meal, are comparable with many other protein sources used in fish
feeds on protein cost basis. However, the only problem with these feedstuffs is their unavailability in
large commercial quantities for the sustenance of aquaculture industry (Gabriel et al., 2007).
In Kenya, among the animal byproducts, blood meal, a byproduct after slaughter of cattle, is readily
available in abattoirs and offer alternative cheaper protein source to fishmeal. According to Agbebi,
Otubusin, and Ogunleye (2009), much can be achieved by intensifying research on blood meal inclusion
in fish feed for better balanced diets. To develop a feed for sustainable fish production, the evaluation of
proximate, amino acid composition, digestibility and performance efficiency as well as cost implications
and conditions of application is necessary (Watanabe, 2002). According to Jobling (2001), Bunda et
al.(2015), Kirimi et al. (2016), chemical analysis of feeds and feedstuffs provides information on their
major nutrient, gross energy and amino acid composition. Although BM was found to be a good
substitute of FM in terms of crude protein requirement and amino acid profile (Kirimi et al., 2016), there
is need to conduct a feeding trial to determine the performance of animals (Salim et al., 2004). The
current study therefore was designed to evaluate the growth performance and economics of replacing
fishmeal with blood meal on Nile tilapia in fertilized pond.
MATERIALS AND METHODS
The experiment was conducted at the National Aquaculture Research Development and Training Centre,
Sagana, altitude 1230 m above sea level, latitude 0°39′S and longitude 37°12′E, and 90 km north of
Nairobi. The fish were raised in net cages, of dimension 3 m × 2 m × 1 m that were fitted with six wooden
sticks and stuck in earthen pond.
Preparation of Diets
The feed ingredients were obtained from commercial sources in the local market and their prices
recorded. Bovine blood was collected from the local Sagana abattoir and processed according to Kirimi et
al. (2016). Three isonitrogenous diets (35% CP) were formulated using wheat bran, soybean meal, cotton
seedcake and either fishmeal as the main source of animal protein (Diet 1); 50% replacement of fishmeal
with blood meal (Diet 2); and 100% replacement of fishmeal with blood meal (Diet 3) (Table 1).
Table 1: Ingredient composition and calculated chemical composition (%) of supplement fed to
growing fish in a fertilized pond (as fed basis)
Ingredient Diet 1 Diet 2 Diet 3
Fishmeal 36.6 18.4 0
Blood meal 0 12.5 25.5
Wheat bran 48.4 53.8 59.5
Soybean meal 10 10.3 10
Cotton seedcake 5 5 5
Total 100 100 100
Calculated crude protein 35% 35% 35%
The ingredients were ground using hammer mill to be uniform and mixed thoroughly by hand in desired
proportion. Some water was added to form dough and pelleted using a pelleter machine particle size 4.5
mm diameter. The pellets were then dried under shade and packed in water impermeable bags to prevent
attacks by moulds and other pests.

Proceedings of the Third International Research Conference held on 26th to 28th October, 2016 87
Experimental Treatments
Three hundred, sex-reversed, Nile tilapia fingerlings from Sagana fish farm of average weight 12±3 g
were selected and acclimatized for two weeks in the experimental pond during which time they were fed
on a commercial ration. Using a completely randomized design (CRD), the fingerlings were picked and
transferred into twelve net cages at a rate of 25 fingerlings per net cage. The net cages were further
divided randomly into three groups of four replicates. The three groups were randomly assigned to three
diets to form 3 treatments (Diet1, Diet 2 and Diet 3)
Feeding and Data Collection After the adaptation period, the initial weight was measured and the fish were offered the experimental
rations. Feed was given at a rate of 2% of body weight throughout the experimental period, twice daily
i.e. morning (10 am) and evening (4 pm) in two equal meals. The amount of supplementary feed provided
was adjusted accordingly after weighing the fish fortnightly. Water parameters were monitored weekly
(dissolved oxygen, pH and temperature) using multiparameter water quality meter, model H19828 (Hanna
Instruments Ltd., Chicago, IL., USA). At the end of every two weeks, fish from each net cage were
weighed (g) for the entire experimental period of 100 days. The amount of feed consumed daily was also
measured and recorded.
The following parameters were used to determine the growth response of the fish:
(1) Survival Rate (SR %)
Survival rate is the number of fish that survive during the experimental period expressed as a percentage
of the stocked fish. It was calculated by substracting the number of fish dead during the culture period
from the fish stocked and then expressing it as percentage (Charo-karisa et al., 2006).
SR (%) = (Initial number of fish stocked – mortality)/initial number of fish stocked × 100 (1)
(2) Daily Weight Gain (DWG)
Daily weight gain (DWG) was calculated as the difference between the final body weight and the initial
body weight of fish over a period of 100 days.
DWG% = [(final body wt – initial body wt)/(Initial body wt × 100 days of experiment)] × 100 (2)
(3) Relative Growth Rate
Relative growth rate (RGR) was calculated as the change in weight of fish expressed as a percentage of
the final average weight (Otubusin, Ogunleye, and Agbebi, 2009),
RGR (%)= (Wf – Wi)/Wf ×100 (3)
Where, Wf = final average weight at the end of experiment; Wi = Initial average weight at the beginning
of experiment.
(4) Specific Growth Rate
Specific growth rate (SGR) is the instantaneous change in weight of fish expressed as the percentage
increase in body weight per day over any given time interval. It was calculated by taking natural
logarithms of body weight change expressed as percentage per day (Khalafalla and El-Hais, 2013),
SGR (% per day) = [(Ln final body wt – Ln initial body wt)] × 100/Experimental period (4)
Where, Ln = natural logarithm.
(5) Feed Utilisation Efficiency
Feed utilisation efficiency (FE) is the live weight gain (g) per feed consumed (g). It often serves as a
measure of efficiency of the diet. The more suitable the diet for growth, the less food is required to
produce a unit weight gain (Guroy, Emrah, Kut, and Adem, 2005),
FE (%) = [Weight gain (g)/Feed intake (g)] × 100 (5)
Economic Analysis
A simple economic analysis was conducted to assess the cost effectiveness of diets used in the feed trial.
Only the cost of feed was used in the calculation with the assumption that all other operating costs
Proceedings of the Third International Research Conference held on 26th to 28th October, 2016 88
remained constant. Cost of the feed was calculated using market prices of ingredients in Kenya as per
June 2014 (Table 2).
Table 2: Cost of ingredients used in formulating the diets
Ingredient Price(Kshs*) per kg
Fishmeal 100
Wheat bran 20
Cotton seed cake 80
Soy bean meal 70
Blood meal 20
Note. *, 1 US Dollar = 104 Kshs
The following parameters were used to determine the economic performance:
(1) Incidence Costs
Incidence cost (IC) was the cost of feed used to produce a kg of fish (relative cost per unit weight gain)
and the lower the value, the more profitable using that particular feed (Nwanna, 2003; Abu, Sanni,
Erondu, and Akinrotimi, 2010).
IC = Cost of feed/weight of fish produced (6)
(2) Profit Index
Profit index (PI) was calculated according to Abarike, Attipoe, and Alhassan (2012),
PI = Value of fish produced/cost of feed (7)
Data Analysis
Data on growth performance parameters and economic analysis were subjected to analysis of variance
(ANOVA) using statistical package for social science version 17.0 at P = 0.05 confidence level, to
determine whether there were significance differences and where the differences occurred, mean
separation was done by least significance difference (LSD). The basic linear model for the completely
randomized design (CRD) was:
Yij = µ + α i + eij (8)
Where, Yij = is the observation on the jth
fish and ith treatment; µ = is the overall population mean; αi= is
the effect due to level of blood meal {0%, 50% and 100%}; eij= is the random error term.
RESULTS
Water Quality
Water temperatures ranged from 23.06 oC to 29
oC with a mean of 26.8
oC in the cage and 21.19 to 28.92
mean of 26.6 oC outside the cage (Table 3). The pH ranged from 8.93 to10.62 mean of 10.1 in the cage
and 8.96 to 10.52, mean 10.08 outside the cage, dissolved oxygen ranged between 0.9 to 2.98 mean 2.19
mg/litre while outside the cage ranged between 0.9 to 2.78 with a mean of 2.12 mg/litre.
Table 3: Range and average of physico-chemical parameters of the water during the experiment
Parameter Range Average
Inside cage Outside cage Inside cage Outside cage
Temperature (oC) 23.06-29.0 21.19-28.92 26.78 26.6
Dissolved oxygen (mg/litre) 0.9-2.98 0.9-2.78 2.19 2.12
pH 8.93-10.62 8.96-10.52 10.11 10.08
Survival and Growth Performance
Survival rate was high and similar for the three diets (Table 4). Fish fed on control diet had the highest
(P<0.05) daily weight gain (0.4 g/d) followed by group 2 (0.37 g/d) and Diet 3 (0.28 g/d). Likewise, the
highest final average weight per fish (50.69 g) was recorded under treatment 1 while the least (40.37 g)
was under treatment 3. The highest specific growth rate was in fish fed the control ration (0.62%)
followed by those fed diet 2 (0.61%). The least specific growth rate of 0.50% was recorded among fish
fed diet 3. Relative growth rate was highest for group 1 and least for group 3.

Proceedings of the Third International Research Conference held on 26th to 28th October, 2016 89
Table 4: Growth performance of Oreochromis niloticus fed on blood meal as a replacement of fish
meal in concentrate supplement*
Parameter Treatment
Diet 1 Diet 2 Diet 3
Initial average body weight (g) 12.07±0.14c 12.24±0.17
bc 12.83±0.15
a
Final average body weight (g) 50.69±1.68a 48.47±1.40
ab 40.37±1.12
c
Daily weight gain (g/d) 0.4±0.02a 0.37±0.01
ab 0.28±0.01
c
Specific growth rate (%) 0.62±0.02a 0.61±0.02
ab 0.50±0.01
c
Relative growth rate (%) 76.48±1.04a 75.15±1.18
ab 68.18±0.53
c
Survival rate (%) 98±1.16 98±1.16 98±2.00
Feed conversion efficiency 0.03±0.00 0.03±0.00 0.02±0.00
Note. *: Values are expressed as mean ± SE; ab
: values in the same row having different superscript letters
are significantly different (P < 0.05).
Economic Analysis
The quantity of feed and cost per kilogram of feed offered and total biomass harvested with the estimated
value reduced with the level of substitution of FM (Table 5). Similarly the incidence cost and profit index
fell with the level of substitution of FM.
Table 5: Economic analysis of Oreochromis niloticus fed on the supplements*
Treatment Diet 1 Diet 2 Diet 3
Cost per kg of feed (Kshs†) 46.3 37.14 28
Feed input (kg) 1.27±0.08 1.24±0.03 1.15±0.04
Costs of feed (Kshs) 58.87±3.906a 46.17±0.99
b 32.17±1.07
c
Harvested biomass (kg) 1.29±0.06a 1.22±0.05
ab 1.00±0.03
c
Estimated value of biomass (Kshs)# 387.60±17.42a 367.28±14.809
ab 302.70±8.10
c
Incidence cost 45.55±3.07a 37.83±1.12
ab 31.88±0.55
bc
Profit index 6.69±0.49c 7.95±0.23
b 9.42±0.16
a
Note. *: Values are expressed as mean ± SE; abc
: values in the same row having different superscript
letters are significantly different (P < 0.05); #: Estimate was based on a market value of Kshs 300 per kg
of fish; †, 1 US Dollar = 104 Kshs.
DISCUSSION
Survival Rate
Survival rate was comparable among the diets (98%). The high survival rate in this study could be
attributed to good management procedures during the study i.e. proper handling and storage of feed to
avoid mould growth and contamination by rodents, proper handling of fish during sampling and
conducive physico-chemical parameters within the culture system. However, this high survival rate
contradicts with the findings of Eyo and Olatunde (1999) where fish fed the highest levels of blood meal
recorded the highest mortality in the cages. Whether this high mortality was caused by a nutritional defect
in the diet was not clear.
In the present experiment, it is clear that inclusion levels of blood meal had no effect on the survival rate
of fish which was in agreement with Agbebi et al. (2009) who reported that fish meal can be replaced
completely (100%) by blood meal with no adverse effect on growth, survival and feed conversion of
Clarias gariepinus juvenile. Aladetohun and Sogbesan (2013) also recorded no mortality and concluded
that blood meal can perform very well as a feedstuff at inclusion rate of 100% and can replace fishmeal in
Tilapia diet with no adverse effect on growth and survival of Oreochromis niloticus fingerlings.
Growth Rate
Growth performance in this study decreased with high levels of blood meal in the diet (Figure 1). Diet 1
had the highest growth rate; this can be attributed to the use of high level of fishmeal as the major animal
protein source. Fish meal is known to have balanced amino acid profile, high digestibility and palatability
which promote good growth of fish (Hardy and Tacon, 2002). Poor performance of blood meal based diet
in the present experiment agree with the study done by Otubusin (1987) in which the feed containing the

Proceedings of the Third International Research Conference held on 26th to 28th October, 2016 90
highest amount of blood meal gave the poorest performance in terms of growth and feed conversion ratio.
Huet (1994) reported that blood is known to be imbalanced in amino acids; however, he noted that it is
good food for fish if mixed with vegetable meal.
Despite the comparable crude protein content of the three diets, diet 1 still performed better than the other
diets in terms of growth performance and this implies that protein quality is important when considering
fishmeal substitutes. This can be due to imbalance of essential amino acid composition of blood meal
which was translated into the diet (Fasakin, Serwata, and Davies, 2005; Kirimi et al., 2016). Kirimi et al.,
(2016) observed that replacement of FM with 50% BM gave a useful protein diet whereas 100% an
almost poor diet.
There was more deviation in the growth curve in the earlier days which tended to narrow later as the fish
grew (Figure 1). This can be attributed to the reduced requirement of essential amino acids as the fish
matured (NRC, 1993) resulting in a narrow gap between requirement and diets for the fish fed 50%
replacement of FM and the control diet.
Figure 1 Growth response of Oreochromis niloticus fed on blood meal as a replacement of fishmeal
Summerfelt and Ketola, 1995; Abery, Gunasekera, and De-Silva, 2002; Agbebi et al., 2009; Bekibele et
al., 2013), reported that optimum bone meal with blood meal could effectively replace up to75% of the
fish meal in the diets fed to Oreochromis mossambicus fry. Good performance of fish have been observed
for fish fed diets containing approximately 8 to 20 percent BM in conjunction with high (more than 20
percent) fish meal levels.
The method used to process blood meal i.e. cooking for 45 minutes in the present study may have
denatured the amino acids leading to low growth rate (Cho, Slinger, and Bayley, 1982; McCallum and
Hings, 1989; Pike, Andorsdottir, and Mundheim, 1990; Luzier et al., 1995; Bureau, Harris, and Cho,
1999). The fertilized earthen pond offered fish extra nutrition from natural food in the pond. However,
this natural food could not compensate for what was deficient in blood meal based diets that led to low
growth performance. Attention should therefore be paid to the amino acid profile of alternative protein
sources and the resulting test diets.

Proceedings of the Third International Research Conference held on 26th to 28th October, 2016 91
Economic Analysis
The costs of using the three diets is indicated by the incidence costs (IC), which is defined as the cost of
feed used to produce a kg of fish (relative cost per unit weight gain) and the lower the value, the more
profitable it is using that particular feed (Nwanna, 2003; Abu et al., 2010). In the present study data
(Table 5), it was evident that it could be cheaper to raise Nile tilapia on diet 3 which contained blood meal
as the major protein source with the incidence cost of (31.88). However, diet 1 which contained highest
proportion of fishmeal as a major protein source had the highest Incidence cost (45.55), indicating that it
is more costly to use fishmeal in formulating fish rations. Moreover, the less the incidence cost, the higher
the profit index (PI) with diet 3 having the highest profit index (9.42) followed by diet 2 (7.95) and diet 1
(control) with the lowest profit index (6.69). These results agree with the experiment done by Aladetohun
and Sogbesan (2013) where blood meal was used as protein ingredient in the diet for Oreochromis
niloticus and the diet with 100% blood meal was cheapest.
In this experiment, high profit index in blood meal based (diet 3), arose from the fact that blood was free
from the local slaughter house and the only cost incurred was that of transporting blood to the research
station. More so, in this experiment, it is evident that use of non conventional protein sources of animal
origin such as blood meal could be more cost effective for semi-intensive tilapia production systems since
most are regarded as waste in our localities. The difference in economic performance for the three rations
was due to the high cost of fishmeal which was used to formulate diet 1 and diet 2. To increase profits,
the cost of feed must be reduced and considerable effort be focused on finding alternatives to fishmeal
from both plant and animal protein sources (El-sayed, 1998; Fasakin et al.,1999; Hossain et al., 2002).
In relation to culture period, Ogunji (2004) observed that when alternative protein sources are used in
tilapia feeds, the rate of fish growth may be reduced leading to increased rearing time. However, the low
cost of the protein sources would reduce the entire cost of raising the fish, compensating for the delayed
growth and time lost, consequently, increasing profitability.
CONCLUSION
The results of the present study showed that fish fed on FM based diet performed better in terms of
growth than those on BM. However, those on 50% (BM and FM) performed better than 100% BM hence
blood meal can substitute fishmeal at 50%. However, although blood meal cannot compete with fishmeal
in terms of growth performance, the economics of using it to replace fish meal is positive in the long run.
The contradictory observations were due to the very low cost of BM that was obtained free of charge
from the slaughter house. In conclusion, the results of the present study have revealed that it would be
economically sustainable to use locally available blood meal to raise Nile tilapia in semi intensive system.
REFERENCES
Abarike, E. D., Attipoe, F. K., and Alhassan, E. H. (2012). Effects of feeding fry of Oreochromis niloticus
on different Agro- industrial by-products. International Journal of Fisheries and Aquaculture, 4(8),
178-185. http://dx.doi.org/10.5897/IJFA11.028
Abery, N. W., Gunasekera, M. R., and De-Silva, S. S. (2002). Growth and nutrient utilization of Murray
cod (Maccullochellapeelii) (Mitchell) fingerlings fed diets with levels of soybean and blood meal
varying. Aquaculture Research, 33, 279-289. http://dx.doi.org/10.1046/j.1355-557x.2002.00672.x
Abu, O. M., Sanni, L. O., Erondu, E. S., and Akinrotimi, O. A. (2010). Economic viability of replacing
maize with whole cassava in the diet of hybrid Cat fish. Journal of Agriculture, 1, 1-5.
http://dx.doi.org/10.3923/aj.2010.1.5
Agbebi, O. T., Otubusin, S. O., and Ogunleye, F. O. (2009). Effect of different levels of substitution of
fishmeal with blood meal in pelleted feeds on Cat fish Clarias gariepinus (Burchell, 1822) culture in
net cages. European Journal of Scientific Research, 31(1), 6-10.
http://connection.ebscohost.com/c/articles/44066079/effect-different-levels-substitution-fishmeal-
blood-meal-pelleted-feeds-catfish-claria
Aladetohun, N. F., and Sogbesan, O. A. (2013). Utilization of blood meal as a protein ingredient from
animal waste product in the diet of Oreochromis niloticus. International Journal of Fisheries and
Aquaculture, 5(9), 234-237. http://dx.doi.org/10.5897/IJFA10.031
Proceedings of the Third International Research Conference held on 26th to 28th October, 2016 92
Bekibele, D. O., Ansa, E. J., Agokei, E. O., Opara, J. Y., Alozie-chidi, V. C. Arango, A. A., Ibemere, I.
(2013). The comparative effect of fish and blood meal based diets on growth and survival of juvenile
tilapia (Oreochromis niloticus) in concrete tank. Journal of Fisheries and Aquatic Science, 8(1), 184-
189. http://dx.doi.org/10.3923/jfas.2013.184.189
Bunda, M. G. B., Tumbokon, B. L. M., and Serrano Jr., A. E. (2015). Composition, chemical score (CS)
and essential amino acid index (EAAI) of the crinkle grass (Rhizoclonium spp.) as ingredient for
aqua feeds. Aquaculture, aquarium, conservation and legislation. International Journal of Bioflux,
8(3), 411-420.
Bureau, D. P., Harris, A. M., and Cho, C. Y. (1999). Apparent digestibility of rendered animal protein
ingredients for rainbow trout (Oncorhynchus mykiss). Aquaculture, 180, 345-358.
http://dx.doi.org/10.1016/S0044-848 6(99)00210-0
Charo-Karisa, H., Komen, H., Reynolds, S., Rezk, M. A., Ponzoni, R. W., and Bovenhuis, H. (2006).
Genetic and environmental factors affecting growth of Nile tilapia (Oreochromis niloticus) juveniles:
Modelling spatial correlations between hapas. Aquaculture, 255, 586-596.
http://dx.doi.org/10.1016/j.aquaculture.2005.11.041
Cho, C. Y., Slinger, S. J., and Bayley, H. S. (1982). Bioenergetics of salmonid fishes: Energy intake,
expenditure and productivity. Comparative Biochemistry Physiology, 73, 25-41.
http://dx.doi.org/10.1016/0305-04 91(82)90198-5
Davies, S. J., Williamson, J., Robinson, M., and Bateson, R. I. (1989). Practical inclusion levels of
common and by products on complete diets for tilapia (Oreochromis mossambicus) (pp. 325-332). In
Proceedings, Third International Symposium on Feeding and Nutrition. Tisa, Japan.
El-Sayed, A. F. M. (1998). Total replacement of fishmeal with animal protein sources in Nile tilapia
(Oreochromis niloticus, L.) Feeds. Aquaculture Research, 29, 275-280.
http://dx.doi.org/10.1046/j.1365-2109.1998.00199.x
Eyo, A. A., and Olatunde, A. A. (1999). The effect of replacement of soyabean meal with blood meal on
the growth of mudfish Clarias anguillaris (L.) fingerlings (pp. 232-240). 13th Annual Conference of
the Fisheries Society of Nigeria (FISON), November 3-8, 1996, New Bussa, Nigeria. Retrieved from
http://aquaticcommons.org/3861/1/13P232.pdf
Fasakin, E. A., Balogum, A. M., and Fasuru, B. E. (1999). Use of duckweed, (Spirodelapolyrrhiya, L.)
Schleiden, as a protein feedstuff in practical diets for tilapia (Oreochromis niloticus, L.). Aquaculture
Research, 30, 313-318. http://dx.doi.org/10.1046/j.1365-2109.1999.00318.x
Fasakin, E. A., Serwata, and Davies, S. J. (2005). Comparative utilization of rendered animal derived
products with or without composite mixture of soybean meal in hybrid tilapia (Oreochromis niloticus
× Oreochromis mossambicus) diets. Aquaculture, 249, 335-338.
http://dx.doi.org/10.1016/j.aquaculture.2005.02.059
Gabriel, U. U., Akinrotimi, O. A., Bekibele, D. O., Onunkwo, D. N., and Anyanwu, P. E. (2007). Locally
produced fish feed: Potentials for aquaculture development in sub Saharan Africa. African Journal of
Agricultural Research, 2(7), 287-295.
Guroy, D., Emrah, D., Kut, G., and Adem, A. (2005). Influence of feeding frequency and feed intake,
growth performance and nutrient utilisation in European sea bass (Dicentrarchus labrax) fed pelleted
or extruded diets. Turkish Journal of Veterinary Animal Science, 30, 171-177.
http://journals.tubitak.gov.tr/veterinary /issues/vet-06-30-2/vet-30-2-4-0502-7.pdf
Hardy, R. W., and Tacon, A. G. J. (2002). Fish meal: Historical uses, production trends and future
outlook for sustainable supplies. In R. R. Stickney and P. MacVey (Ed.), Responsible Marines
Aquaculture (pp. 311-325). CABI, UK. http://dx.doi.org/10.1079/9780851996042.0311
Higgs, D. A., Prendergast, A. F., Dosanjh, B. S., Beames, R. M., and Deacon, G. (1994). Potential for
reducing cost of salmon production by dietary inclusion of novel rapeseed/canola protein products.
In D. Murphy (Ed.), Proceedings of the 9th International Rapeseed Congress. Rapeseed Today and
Tomorrow (pp. 133-138). Cambridge, UK: GCIRC.
Hossain, M. A., Focken, U., and Becker, K. (2002). Nutritional evaluation of Dhaincha (Sesbania
aculeate) seeds as dietary protein source for Tilapia Oreochromis niloticus. Aquaculture Research,
33, 653-662. http://dx.doi.org/10.1046/j.1365-2109.2002.00690.x
Huet, M. (1994). Textbook of fish culture: Breeding and cultivation of fish. Fishing International 2004.
Nutrition Abstracts and Reviews: Series B, 74(9), 23-32.

Proceedings of the Third International Research Conference held on 26th to 28th October, 2016 93
Jackson, A. J., Capper, B. S., and Matty, A. J. (1982). Evaluation of some plant proteins in complete diets
for the tilapia Sarotherodon mossambicus. Aquaculture, 27(2), 97-109.
http://dx.doi.org/10.1016/0044-8486(82) 90129-6
Jobling, M. (2001). Feed composition and analysis. In D. F. Houlihan, T. Boujard, and M. Jobling (Eds),
Food intake in fish (pp. 1-24). Oxford: Blackwell Science Ltd.
http://dx.doi.org/10.1002/9780470999516.ch1
Khalafalla, M. M., and El-Hais, A. M. (2013). The influence of nutrasexylam© enzyme on growth,
carcass composition and plasma indices of Nile tilapia fingerlings. Journal of Fisheries and
Aquaculture, 4(3), 143-147. Retrieved from
http://www.bioinfopublication.org/jouarchive.php?opt=andjouid=BPJ0000265
Kirimi, J. G., Musalia, L. M., and Munguti, J. M. (2016). Effect of replacing fish meal with blood meal on
chemical composition of supplement for Nile tilapia (Oreochromis niloticus). East African
Agricultural and Forestry Journal, 1-9. http://dx.doi.org/10.1080/00128325.2016.1158898
Luzier, J. M., Summerfelt, R. C., and Ketola, H. G. (1995). Partial replacement of fish meal with spray
dried blood powder to reduce phosphorus concentrations in diets of juvenile Rainbow trout,
Oncorhynchus mykiss (Walbaum). Aquaculture Nutrition, 26, 577-587.
http://dx.doi.org/10.1111/j.1365-2109.1995.tb00948.x
McCallum, I. M., and Higgs, D. A. (1989). An assessment of processing effects on nutritive value of
marine protein sources for juvenile Chinook salmon (Oncorhynchus tshauytscha). Aquaculture, 77,
181-200. http://dx.doi.org/10.1016/0044-8486(89)90201-9
NRC. (1993). Nutrients requirements of fish. National Academy Press, Washington D.C, USA.
NRC. (2011). Nutrients requirements of fish and shrimps. National Academy Press, Washington D.C.,
USA.
Nwanna, L. C. (2003). Risk management in the aquaculture by controlled feeding regime. Pakistan
Journal of Nutrition, 2(6), 324-328. http://dx.doi.org/10.3923/pjn.2003.324.328
Ogunji, J. O. (2004). Alternative protein sources in diets for farmed tilapia. CABI International 2004.
Nutrition Abstracts and Reviews: Series B, 74(9), 23-32.
Otubusin, S. O. (1987). Effect of different levels of blood meal in pelleted feeds on Tilapia, Oreochromis
niloticus production in floating bamboo net cages. Aquaculture, 65, 263-266.
http://dx.doi.org/10.1016/0044-8486(87)90239-0
Otubusin, S. O., Ogunleye, F. O., and Agbebi, O. T. (2009). Feeding trials using local protein sources to
replace fishmeal in pelleted feeds in Cat fish (Clarias gariepinus Burchell 1822) Culture. European
Journal of Science Research, 31(1), 142-147.
Pike, I. H., Andorsdottir, G., and Mundheim, H. (1990). The role of fishmeal in diets for salmonids.
International association of fishmeal manufacturer technical bulletin (No. 24, p. 35). London.
Salim, M., Aziz, I., Sultan, J. I., and Mustafa, I. (2004). Evaluation of apparent digestibility of fish meal,
sunflower meal and rice polishing for Labeo rohita. Pakistan Journal of Life and Social Sciences,
2(2), 139-144.
Sogbesan, O. A. (2006). Effects of different organic substrates on growth and survival of winged termites
(Macro termessubhyabrius) under laboratory conditions. African Journal of General Agriculture,
2(2), 37-44.
Tacon, A. G. J., and Jackson, A. J. (1985). Utilization of conventional and unconventional protein sources
in practical fish feeds. In C. B. Cowey, A. M. Mackie, and J. G. Bell (Eds.). Nutrition and Feeding in
Fish (pp. 119-145). London, UK: Academic Press.
Viola, S., Mokady, S., Rappaport, U., and Arieli, Y. (1982). Partial and complete replacement of
fishmeal by soybean meal in feeds for intensive culture of carp. Aquaculture, 26(3-4), 223-236.
http://dx.doi.org/ 10.1016/0044-8486(82)90158-2
Watanabe, T. (2002). Strategies for further development of aquatic feeds. Fisheries Science, 68, 242-252.
http://dx.doi.org/10.1046/j.1444-2906.2002.00418.x
Wilson, R. P (2002). Protein and amino acids. In J. E. Halver and R. W. Hardy (Eds.), Fish Nutrition (3rd
version, pp. 144-179). Elsevier Science, San Diego, USA. ******

Proceedings of the Third International Research Conference held on 26th to 28th October, 2016 94
CONSERVATION OF BIODIVERSITY, ENERGY AND WATER FOR SUSTAINABLE
DEVELOPMENT MAPPING ENVIRONMENTAL HEALTH INJUSTICE FOR SUSTAINABLE URBAN
ECOLOGIES USING GIS BASED TECHNIQUES
Kibetu, D.K.1 and Mwangi, J.M.2
1Department of arts and Humanities, Chuka University; P. O. Box 109-60400, Chuka, [email protected] 2Spatial Data Indexing Section, Galaxy Geo-Consultancy Services Inc., P. O. Box 2639, Embu, [email protected]
ABSTRACT Issues of environmental concern especially health injustice, arising from urbanization, are becoming
increasingly important due to social activism and health problems associated with noxious land uses. In
Kenya, proximity of open dumpsites to residential areas is a basic form of environmental health injustice
due to toxic gas exposure, waste smoke plumes and olfactory nuisance. Environmental risk assessment
and equity analysis were carried out in Chuka town as a case study. GIS based techniques of land use
refinement method and dispersal modeling was applied to estimate the population at exposure risk to the
toxic waste smoke. Over 25% of sampled people were at high exposure, especially those living along
smoke plume dispersion route within hospital area, Ndagani and Rukindu. The exposure risks showed
spatial variations regarding prevailing land use, while direction and speed of wind flow varied on a
temporal scale. Subpopulations had similar socio-economic characteristics and were often disadvantaged
compared to the reference population. These results were consistent with findings of related studies in the
USA which found that the location of most noxious facilities especially wastes landfills was often in the
neighbourhoods of the minority poor urban immigrant subpopulations. There is a need to relocate the
current dumpsite to a suitably mapped less populated blocks and actively engage affected communities in
finding sustainable solutions to rising problem of environmental health injustice.
Keywords: Exposure risk, Dispersal modeling, Land use refinement method
INTRODUCTION
Management of Municipal Solid Wastes (MSW) is a big problem in developing countries despite
increased efforts to reduce wastes stream. The major challenge is mainly lack of appropriate waste
handling facilities as open dumping remains the principal way for managing MSW in many urban centers.
In most cases, these open dump sites are located near residential neighborhoods and have often been
linked to health risks and problems. Environmental health concerns related to olfactory nuisance and
respiratory tract infections have been reported commonly among communities living near these facilities
(Allen et al., 1997; Kim et al., 2005). Environmental justice refers to the fair treatment and meaningful
involvement of all people with respect to the development, implementation, and enforcement of
environmental laws, regulations, and policies (US EPA, 2009). However, the reality is that most people
continue to be exposed to environmental conditions that can adversely affect their health or expose them
to health problems. In developing countries, proximity of open dumpsites to residential areas is a basic
form of environmental health injustice to the surrounding communities who in most cases are not
protected from toxic gases, waste smokes and odour pollution. Today, both theoretical and applied
research in the areas of environmental risk assessment and environmental equity analysis are taking
increasing advantage of GIS technology and advanced methods of data visualization (Eric et al, 1999;
Kibetu, 2011). This is because all issues considered are spatial in nature and the application of GIS
provides opportunity for geographers to contribute to the ongoing debate of environmental health justice
vis-à-vis equity. GIS to be precise has been utilized in environmental equity analysis because it allows for
the integration of different data sources needed for analysis, application of spatial analytic techniques as
well as supporting cartographic representation of geographic information. To that extent, many studies
have applied GIS in the assessment and management of municipal solid wastes with such studies as:
Identification and mapping of radioactive sites, analysis of the geographic proximity between population
characteristics and pollution sources, geographic toxic plume analysis (Burke, 1993; Glickman, 1994; Sui
and Giardino, 1995; Cutter et al., 1996; McMaster et al., 1997). Recently the focus shifted from the
traditional mapping of affected population’s socio-demographic attributes and assessment of risks to
using GIS techniques to show the correspondence amongst contributing factors. Globally, many
community based resistances associated with municipal solid waste management has been over potential

Proceedings of the Third International Research Conference held on 26th to 28th October, 2016 95
health risks posed by noxious land uses and facilities to the sub populations in the neighbourhood
(Tammemagi, 1999; Rushton, 2003; Kibetu, 2011; Spokas et al., 2006; Gonzalez et al., 2000).
Problem Contextualization
In Kenya however, there is minimal activism and debate over environmental health injustice associated
with noxious land uses and in particular open waste dumping largely due to lack of empirical studies to
determine whether principles of environmental justice have been applied in the first place or violated
generally. At the same time, many studies in the area of MSW management have focused majorly on:
characterization and quantification of solid wastes, environmental impact assessments and site suitability
mapping analysis. Broadly speaking, studies of environmental justice with focus on exposure risks to
toxic hazards and emissions among target populations have not been undertaken or adequately publicized
in Kenya. This has to a larger extent limited the identification, documentation and mitigation of
environmental health burdens borne by the community especially the poor where these facilities are
located. With GIS, it is becoming a common practice to map instances of environmental injustice by geo-
referencing facilities or even land uses posing an environmental and human health risks. Locally no
studies on exposure risks to population from toxic hazards or assessment of spatial relationships between
pollution hotspots and the socio demographic characteristics of the affected sub population have been
done in chuka town. This study forms a first attempt to try quantifying the population at exposure risk
from open dumpsite smoke plumes. Then evaluation of potential health risks across land uses from the
dumpsite hotspot was done using the principle of risk assessment and GIS based dispersion modeling.
Conceptual Framework for Exposure Risk and Vulnerability assessment
To address issues of hazards, better understanding of the interplay components and relationship between
different factors is important. This study adopted a framework based on hazard assessment, control
analysis, strategy selection, implementation and evaluation as proposed by Kasperson, Kates and
Hohenemser, 1985 (Figure 1). The framework was found adequate for this particular study because it
integrates concepts of assessment, planning and management of risks and disasters from both technical
and social perspectives.
Case Study: Chuka Town Open Dumpsite
This particular study focuses on Chuka town dumpsite which has generated controversy owing to its
current location and the open burning of the dumped wastes (fig.2).This disposal site currently receives
unsorted solid wastes from all land uses within chuka town and adjoining areas. Open incineration of
wastes releases toxic smoke into the air forming a thick cloud of poisonous plume over the residential
areas and the nearby district hospital. In the past this dumpsite had been earmarked for relocation owing
to increasing public acrimony and considerable community resistance over its associated potential health
risks but it is yet to be relocated. It is hoped that this study will be useful for Tharaka-nithi county
directorate of environment a natural resources, department of county public health, environmental policy
makers, town planners, researchers and the affected communities because health issues widely discussed
in this research work comprise important factors to consider when choosing particular options for
managing any municipal solid wastes.
The objectives of this study were four fold: (i) Estimate the number of people at risk of exposure from
dumpsite smoke (ii) Identify and map environmental health risk zones within Chuka town (iii) Asses the
socio-economic characteristics of the affected sub populations. By carrying out this study we aim to
popularize the utilization of GIS based methodologies in the analysis of environmental equity for
sustainable social, economic and ecological development of Chuka town.
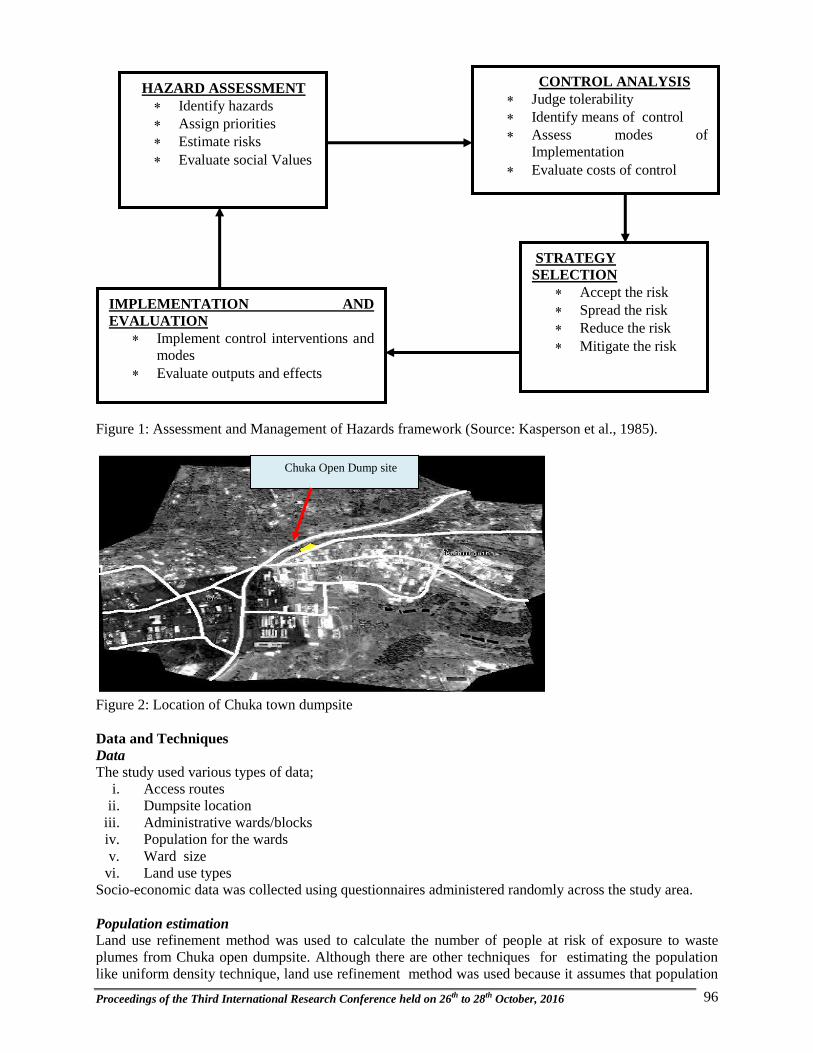
Proceedings of the Third International Research Conference held on 26th to 28th October, 2016 96
Figure 1: Assessment and Management of Hazards framework (Source: Kasperson et al., 1985).
Figure 2: Location of Chuka town dumpsite
Data and Techniques
Data
The study used various types of data;
i. Access routes
ii. Dumpsite location
iii. Administrative wards/blocks
iv. Population for the wards
v. Ward size
vi. Land use types
Socio-economic data was collected using questionnaires administered randomly across the study area.
Population estimation
Land use refinement method was used to calculate the number of people at risk of exposure to waste
plumes from Chuka open dumpsite. Although there are other techniques for estimating the population
like uniform density technique, land use refinement method was used because it assumes that population
HAZARD ASSESSMENT
Identify hazards
Assign priorities
Estimate risks
Evaluate social Values
CONTROL ANALYSIS
Judge tolerability
Identify means of control
Assess modes of
Implementation
Evaluate costs of control
STRATEGY
SELECTION
Accept the risk
Spread the risk
Reduce the risk
Mitigate the risk
IMPLEMENTATION AND
EVALUATION
Implement control interventions and
modes
Evaluate outputs and effects
Chuka Open Dump site

Proceedings of the Third International Research Conference held on 26th to 28th October, 2016 97
in a block group is present only in residential areas unlike the uniform density method which assumes that
population is uniformly distributed throughout entire the block group.
Modeling exposure risk
To determine the intensity and duration of exposure to waste smoke, dispersion modeling was used. In
assessing smoke exposure risk, a risk zone was created using dispersion method. The model used data on
wind speed and wind direction as forces acting to disperse smoke across the study area. Other data sets
applied in modeling the duration and magnitude of exposure were the digital elevation model and
obstructing structures along the dispersal zone.
METHODOLOGY
a) Development of source data layers
The study area was subsetted from an image downloaded from Google earth virtual globe. The study area
comprise of four administrative wards created from the Kenya National Bureau of Statistics 2009 census
summary report. Population data for each ward was retrieved from the 2009 census summary report and
later these values were assigned to the administrative wards to create the respective ward population.
Access roads and the dumpsite were digitized as vector data layers from the satellite image. Land Use and
Cover map was created from the image of the study area with four categories as: Residential, Crop land,
Open land and vegetation.
b) Creation of smoke dispersion risk zone
The dumpsite vector data layer showing the source of the smoke was rasterised into an image. Force
magnitude and direction images for dispersion modeling were created using local wind speed and wind
direction data respectively. Using Initial module in Idrisi software, parameters for creating wind speed
and direction images were copied from those of the rasterised dumpsite image as the source feature
image. The resultant images of dumpsite, wind speed and wind direction were used to calculate the smoke
dispersion distance from the dumpsite. Risk zone was then created as a Boolean image through
reclassification.
c) Calculation of population at exposure risk
To calculate the number of people at risk of exposure to smoke plumes from chuka open dumpsite, the
study applied land use refinement method. In this case, residential land use was created as a Boolean
image from the study area LULC map and then combined with administrative wards to get the residential
land use in each ward. Then each ward’s residential land use area was calculated as cells and then
combined with population for the ward to get population density per cell. Population at exposure risk was
then extracted as an attribute value of total population density based on the dispersal risk zone.
d) Characterization of the affected sub population
Information on the level of education, source of income and the number of family members for the
affected sub population formed part of socio-economic attributes. These factors were collected from the
fifty four questionnaires administered and comprised important criterion factors in the assessment of
spatial variation in environmental health risk spread across the study area.
RESULTS AND DISCUSSION
a) Population at risk of exposure
There were variations in the number of people exposed to smoke from the open dumpsite. Based on the
smoke dispersion region, different administrative wards were seen to have varying proportions of
exposure rates depending on terrain, the direction of wind flow as well as the speed of blowing wind at
the time. The affected blocks were found within Ndagani, Rukindu and Kathunguthe as they fell within
the smoke dispersion zone. The total population at risk of exposure to the toxic smoke plumes was
estimated at 55,162 persons. The number of vulnerable persons varied spatially across the identified
plume dispersion zone as 3,304 persons in Rukindu, 44,155 persons in Ndagani and 8,703 persons in
Kathunguthe block respectively as shown in Figure 3.

Proceedings of the Third International Research Conference held on 26th to 28th October, 2016 98
Figure 3: Vulnerable sub populations to waste smoke plume
b) Mapping Environmental Health Risks based on Smoke Dispersion
Proximity of residential land uses to the risk source varied in magnitude and distance as the intensity of
smoke decreased from source region. Using spatial autocorrelation, areas close to another were grouped
as cluster zones with similar exposure risks. Applying the principle of risk estimation based on residential
land use and terrain, the risk was spread across the entire area resulting to six risk zone cluster regions as
can be seen in figure 4. Very high exposure risk zones were identified as areas within 1500 meters
distance from the dumpsite, High risk zone represented areas within a range of 1500 meters to 1900m
from the target source with regions within a range of between 1900m and 2000 m classified as moderate
risk zones. Areas extending from 2000m to 2500m were categorized as low risk regions while zones from
2600m to 2800m represented a transition buffer area between risk and non risk prone zones. Regions
falling beyond the transition zone were classified as a non exposure risk areas (Figure 4)
Figure 4: Spatial distribution of environmental health risks based on proximity Analysis
c) socio-economic characteristics of the affected sub populations
Some of the social and economic variables considered in this study included level of education, marital
status and income earning activities. At least 56% of the sampled sub population were married persons
with at least two children and that a large population of these persons were residing in Hospital and
Kibumbu blocks. Over 80% of these families had at least one child and mostly were youthful couples.

Proceedings of the Third International Research Conference held on 26th to 28th October, 2016 99
Figure 5: Marital status of the affected sub population in lieu to residential blocks
Over 73% of the person in the sub-population had not been employed and that they were engaged in
informal income earning activities, comprising street food vending, casual labourers in the construction
sites and small scale service shops. Slightly above 46 % of the persons lived within hospital area
residential block and about 27% these residents had O-level education. In general the affected sub-
population had similar social and economic characteristics of minimal employment and with dependant
families. This confirms the vulnerability of marginalized population of urban residents to environmental
injustice due to their low economic power and social status.
CONCLUSION
Environmental health injustice is common amongst the low density residential blocks in many towns
especially in Kenya. There is a need for the county governments to embrace public involvement
especially those directly affected by these ecological injustices in the formulation of waste management
policies and by laws. As the world’s population becomes more urbanized especially in the transitional
societies, issues of environmental health justice will become more prominent in urban areas. Utilisation of
technologies especially GIS has proven valuable in scenario modeling and a breakthrough in simulation
of the possible implications of many decisions made on the urban communities by the concerned urban
local authorities. It is therefore imperative that the county government of Tharaka-nithi stop open burning
of the wastes as is the case and reconsider other ways of minimizing the town’s waste stream. There is a
need to relocate the current dumpsite to another site away from the residential land uses.
REFERENCES
Allen, M.R., Braithwaite, A., Hills, C.C. (1997). Trace organic compounds in landfill gas at seven U.K.
waste disposal sites. Environ. Sci. Technology. 31:1054-1061.
Burke L.M. (1993). Race and environmental equity: a geographic analysis in Los Angeles. Geo. Info.
Systems 3(9):44–50.
Cutter S., Clark L., Holm D. (1996). The role of geographic scale in monitoring environmental justice.
Risk Analysis. 16 (4):517–526.
Eric, S., Helga, L., Robert, B., Mcmaster, Hongguo, T. (1999). GIS-based measures of environmental
equity: exploring their sensitivity and significance. Journal of exposure analysis and
environmental epidemiology. 9:18–28.
Glickman T.S. (1994). Measuring environmental equity with geographic information systems. Renewable
Resource. 12 (3):17–21.
Gonzalez, C.A., Kogevinas, M., Gadea, E., Huici, A., Bosch, A., Bleda, M.J., Papke, O. (2000). Bio
monitoring study of people living near and working at a municipal solid-waste incinerator before
and after two years of operation. Archives of Environmental Health 55:259–267.
Kibetu, D.K. (2011). GIS-based Approach to Municipal Solid Waste Management: A case study of Embu
Municipality. Unpublished Master’s Dissertation, Jomo Kenyatta University of Agriculture and
Technology, Nairobi.

Proceedings of the Third International Research Conference held on 26th to 28th October, 2016 100
Kim Oanh, N.T., Chutimon, P., Ekbordin, W., Supat, W. (2005). Meteorological pattern classification and
application for forecasting air pollution episode potential in a mountain-valley area. Atmos.
Environ. 39:1211-1225.
McMaster R., Leitner H., Sheppard E. (1997). GIS-based environmental equity and risk assessment:
methodological problems and prospects. Cartography and Geographic Information. System.24
(3):172–189.
Rushton, L. (2003). Health hazards and waste management. British Medical Bulletin: 68:183–197.
Spokas, K., Bogner, J., Chanton, J.P., Morcet, M., Aran, C., Graff, C., Moreau-Le Golvan, Y., Hebe, I
(2006). Methane mass balance at three landfill sites: what is the efficiency of capture by gas
collection systems? Waste Management. 26, 516-525.
Sui D.Z., Giardino J. (1995). Applications of GIS in environmental equity analysis: a multi-scale and
multi-zoning scheme study for the city of Houston, Texas, USA. Proceedings GIS/LIS ’95.
GIS/LIS’95 Annual Conference and Exposition. 14–16 Nov. 1995. Nashville, TN. pp. 950–959.
Tammemagi, H.Y. (1999). The Waste Crisis: Landfills, Incinerators and the Search for a Sustainable
Future. Oxford University Press, New York.
U.S. Environmental Protection Agency, (2009). Environmental Justice Home page. Available on:
http://www.epa.gov/ environmental justice. Accessed on 15th July 2016.
******
SOCIO-ECONOMIC IMPACTS OF INVASIVE ALIEN PLANT SPECIES OF CACTUS (Opuntia
stricta) IN EWASO NYIRO AREA IN NAROK COUNTY, KENYA
Githae, E.W. and Magana, A.M.
Chuka University, Faculty of Science, Engineering and Technology, P. O. Box 109-60400, Chuka
Corresponding email: [email protected]; [email protected]
ABSTRACT
Several plants have been introduced in Kenya for various purposes. Some have become aggressive and
rapidly colonize and out-compete the indigenous vegetation. Among them are the Opuntia (Cactus pear)
species, one of them being Opuntia stricta Haworth, which was introduced as an ornamental but has
spread widely in natural ecosystems especially in the drylands. However, information about its impacts to
livelihoods and the sources of spread has not been well documented. This study investigated the
challenges faced as a result of invasion and the factors that contribute to the spread. It was done in Ewaso
Nyiro, one of the most invaded areas in Narok County, using questionnaires where a sample size of 50
was purposively selected since the area is not densely populated. Impacts caused by Opuntia stricta
invasion included denied access to land, injury to both human and livestock and reduced farm-land and
pasture-land, land productivity and the well-being of the community. Although majority of the
respondents were not aware of how the species got into their farms, some thought that the main source of
spread was due to planting the species as an ornamental and a fence. Others thought that it was spread
mostly by floods since new invasions occurred immediately after the rainy season. The most common
plants affected by O. stricta invasion were indigenous vegetables such as terere (Amaranthus), stinging
nettle (Urtica dioica), African nightshade (Solanum), spider plant (Cleome gynandra) and pumpkins
(Cucurbita pepo) since they were mostly found on the fence and farm edges and this heavily impacted on
the food security. The main methods used to control were chopping, burning, burying and use of
herbicides. These methods posed challenges in terms of practicality, expense and environmental impacts
and therefore other sustainable methods should be identified that can assist in control as well as improve
livelihoods. This should integrate the reported benefits such as source of food, fodder and medicine in
order to sustainably manage the species.
Keywords: Cactus, Invasions, Impacts
INTRODUCTION
Invasions by alien plant species are considered to be one of the largest threats to ecosystem processes and
services that are vital to human well-being (Pejchar and Mooney, 2009). They are able to reproduce and
spread at alarming rates across landscapes. They are recognized as the second biggest threat to
biodiversity loss after habitat destruction, and have been implicated in the decline of endangered species

Proceedings of the Third International Research Conference held on 26th to 28th October, 2016 101
across the globe (International Union for the Conservation of Nature [IUCN], 2004). Among the invasive
alien plant species that have developed adaptations to survive in dry areas are the cacti (Cactaceae), which
have invaded many parts of the world. They are one of the most interesting plants in the arid and semi-
arid regions due to their extensive set of peculiar adaptations to water scarcity, which allow them to be
perennial and evergreen despite the sometimes extreme dry conditions of their environment (Arechiga
and Yanes, 2000). The group is characterized by a fleshy habit, presence of spines and bristles, and large,
brightly colored, solitary flowers. Many of the species are grown as ornamentals or oddities. Among them
is the genus Opuntia (cactus pear) that mainly grow in the wild especially in semi-arid and arid regions. It
is native to South America and has invaded many parts of the world (Cronk and Fuller, 1995).
Approximately 300 species of Opuntia are recognized worldwide. However, description of these species
is difficult because of their phenotypes, which vary greatly according to ecological conditions, vegetative
reproduction by cladodes and the existence of numerous hybrids as almost all species blossom during the
same period of the year with no biological barriers separating them (Ochoa, 2003). Their high level of
invasiveness is probably due to the strong ability to grow from vegetative cuttings which can allow rapid
dispersal (Henderson, 2001).
A large number of alien cactus species have been introduced to Kenya and are known to be invasive
especially in the arid and semi-arid areas. They include: Opuntia stricta, O. engelmannii and O.elatior
(CABI, 2014). Opuntia stricta Haworth is native to America and was introduced in Kenya as ornamental
in the 1940s but has spread widely in natural ecosystems mainly due anthropogenic activities. The species
has rapidly replaced native vegetation especially in grazing areas. Some of the distinguishing features
include: much branched stems that are longer than they are broad, groups of two or more sharp spines,
showy yellow flowers borne along margins of the stem and fleshy fruit that turn reddish purple in color
when mature. In Narok County, O. stricta is mostly used as an ornamental and hedge plants in homes. As
a hedge plant, it is able to regenerate through vegetative growth when trimmed. This has contributed to its
fast spread in new areas. In the recent years there has been a steady increase in the number of areas that
are affected by the invasion of O. stricta in Narok County, which is a serious environmental problem that
threatens grazing and farm lands. However, little has been done on the socio-economic impacts and
consequences of these invasions to livelihoods.
This study therefore sought to find out the social and economic impacts resulting from O. stricta invasion
among residents in Ewaso Nyiro area of Narok County where cactus growth is widespread. Research
questions were (i) what are the challenges faced as a result of O. stricta invasion? (ii) What are the factors
that contribute to the spread of O. stricta? (iii) Which ways can be used to control the spread of O. stricta
and reduce new invasions? The findings enhance knowledge and awareness about O. stricta invasion as
well as their impacts.
RESEARCH METHODOLOGY
Study Area
The study was carried out in Ewaso Nyiro area of Narok County. The area is located in Maji Moto ward,
Narok south constituency in Narok County. According to the 2009 census report, Maji Moto ward had a
population of 8200 people and has an area of 270km2, some of the economic activities carried out in the
area include pastoralism, mixed farming and trade and tourism businesses.
Data Collection and Analysis
The study gathered information by use of structured questionnaires where a sample size of fifty was
purposively selected based on percentage cover estimates of farm invasions by O. stricta. Daubenmire
cover scale was used: 1 to 5 where, 1 = less than 20% cover, 2 = 20-40% cover, 3 = 41-60%, cover, 4 =
61-80% cover, and 5 = 81-100%. The questionnaire assessed the impacts as a result of O. stricta invasion,
mode of invasion, areas invaded and some of the strategies used to reduce spread. The target population
were residents of Ewaso Nyiro area both men and women above the age of 18 years. All collected data
was cleaned for the purposes of identifying any incomplete, inaccurate or unreasonable data followed by
coding. Data was analyzed using SPSS Statistics 15.0 for Windows.

Proceedings of the Third International Research Conference held on 26th to 28th October, 2016 102
RESULTS AND DISCUSSION
Fifty respondents, both men and women were interviewed. Figure 1 indicates that 54% of the respondents
were male while 46% were female. Most cases where women were interviewed were because the
husbands (the land owners) were away from home for livestock grazing or distance trading.
54%
46%
MALE FEMALE
Figure 1: Gender of the respondents
Age structure
Figure 2 shows the different ages of the respondents. The youngest respondent interviewed was 23 years
of age while the eldest was 72 years. Age structure between 31-40 years had the highest number of
respondents. The area was mostly occupied by middle-aged people who made up majority of the
population. In addition, early marriages enabled young people to inherit and own land at an early age.
Education levels
The researcher also took into account the different levels of education among the respondents. The levels
included primary, secondary, tertiary and also informal education. Majority of the respondents were
educated to tertiary level (33%) indicating high level of literacy among residents (Fig. 3). About 26% of
the respondents had received informal education, a good indication of transfer of indigenous knowledge.
0
5
10
15
20-30 31-40 41-50 51-60 61-70 71-80
Figure 2: Age structure of the respondents
Means of livelihood
The study determined what the residents did for a living and if the activities could have directly or
indirectly contributed to spread of cactus. Figure 4 shows diversification of livelihoods among the
residents. They were mainly engaged in farming, pastoralism, agro-pastoralism and trade. Most
respondents engaged in farming (mainly maize, wheat and potatoes) and agro-pastoralism. Only 20% of
the respondents engaged in pastoralism. Livestock kept were cattle, sheep, goats and donkeys. The results
indicate a high rate of diversification to increase income and enhance food security.

Proceedings of the Third International Research Conference held on 26th to 28th October, 2016 103
12%
29%
33%
26%PRIMARY
SECONDARY
TERTIARY
INFORMAL
Figure 3: Education levels among the residents
Figure 4: Diversification of livelihoods among the residents
Time duration
This is the time period which the respondents were aware of the O. stricta. This was backdated to a period
of fifteen years, where respondents were to choose the time frame from 0-5 years, 6-10 years and 11-15
years. Figure 5 shows that most invasions had taken place within the last five years. About 50% of the
residents agreed that they became aware of the species in the last five years while only 3% reported that
the species was present in the area for a period of more than 10 years. These results indicate that there is
likelihood of more ongoing invasions in the area.
0
10
20
30
40
50
60
0-5 years 6-10 years 11-15 years
Rep
onde
nts (
%)
Time (Years)
Figure 5: Time period which the respondents were aware of the Opuntia stricta

Proceedings of the Third International Research Conference held on 26th to 28th October, 2016 104
Mode of spread
From figure 6, almost 50% of the respondents were not aware how the species got to be in their farms.
They only recalled seeing it growing in different parts of their farms. Even those who agreed they found it
growing in their farms (16%), and those who said they found it growing in grazing areas (6%) could not
clearly explain how it came to be there. This would therefore mean that the residents were not aware of
the means through which O. stricta spread. About 28% of the respondents agreed having planted the
species as an ornamental plant in their compounds. It later spread fast than it could be controlled to other
different areas through cuttings, which were disposed in different new areas around the farm. Some
thought that the spread was mainly by flood water since some new invasions occurred immediately after
the rainy season.
Figure 6: Mode of spread of Opuntia stricta
Impacts of Opuntia stricta
The respondents were asked if there were any impacts they had experienced as a result of O. stricta
invasion. Half of the respondents agreed that the species had negative impacts on them and their
livelihood. 41% thought that the species had both positive and negative impacts while only 3% said that it
had no effect on their livelihoods.
The positive impacts were classified in terms of food, fodder, fencing, medicinal value and any other
benefit that the respondents may have identified. The most beneficial use was the use as a fence (84%).
Since it is thorny, it is very effective in keeping wild animals away from the compound. Only 5% of the
residents said that the species had medicinal value. It is used to sooth burns by rubbing the juice along the
burnt part which is said to reduce pain and prevent swelling. None of the respondents had ever used O.
stricta as either food or fodder.
FOOD0%
FODDER0%
FENCE84%
MEDICINAL VALUE11% OTHERS
5%
POSITIVE IMPACTS
Figure 7: Positive impacts of Opuntia stricta
Several negative impacts were identified (Figure 8). About 28% of the residents said that O. stricta
invasion had denied them access to their lands. This is because where the species had invaded; its thorny
stems couldn’t allow any farming or grazing activity. 22% of the respondents said that the species had
rapidly invaded their crop land. This had gradually reduced the amount of land available for farming.
Injury to livestock (21%) was another challenge. The large thorns pierce the eyes of the livestock causing

Proceedings of the Third International Research Conference held on 26th to 28th October, 2016 105
blindness, which happens when the livestock try to access the grass under the cactus. In some cases, death
may occur when livestock develop a condition called pear mouth (collection of pus in the mouth followed
by inflammation and swelling). This makes the livestock not to feed which can lead to death. Other
negative impacts identified included reduced yields from farms since the species reduced productivity of
land. Some respondents said that there was reduced land that was available for grazing which caused
overgrazing in the available land. The invasion also greatly contributed to heavy economic losses of both
crops and livestock.
DENIED ACCESS TO
LAND
27%
LOSS OF CROP LAND22%
INJURY TO PEOPLE7%
INJURY TO LIVESTOCK
21%
INVADING SETTLEMENTS
11%
OTHERS12%
NEGATIVE IMPACTS
Figure 8: Negative impacts of Opuntia stricta
State and rate of invasion
With regard to the state of invasion, about 60% of the respondents said that the rate of invasion had
increased in their farms. About 38% of the respondents were not sure while none said there was decreased
invasion. While many respondents agreed that O. stricta invasion increased with time, about half of the
respondents said that the species had spread to less than an acre since they first knew it. About 40% of the
respondents were not sure at what rate it was increasing since it was scattered all over their farm and thus
an estimate could not be made. Only 3% reported that it had completely invaded their farm.
Areas invaded
There were several areas that were identified as most prone to invasion. These are farmlands, grazing
lands, degraded lands, forest and wetlands (Fig. 9). According to the study, areas most invaded were
grazing lands and farmlands (32%). This reduced income for farmers and pastoralist since the land
productivity had reduced. For the pastoralists, less income was as a result of low milk and meat
productivity from livestock. If this trend continues there is likelihood of declining standards of living as a
result of declining income. Degraded areas mainly as a result of overgrazing are also prone to invasion at
26%. Continued invasion to these lands leads to more degradation hence reducing land available for
carrying out economic activities. If this goes on unchecked there is a possibility of higher economic losses
resulting in rising poverty levels.
Figure 9: Areas invaded by Opuntia stricta

Proceedings of the Third International Research Conference held on 26th to 28th October, 2016 106
Plants affected
The most common native plants affected by O. Stricta invasion included indigenous vegetables such as
terere (Amaranthus), stinging nettle (Urtica dioica), African nightshade (Solanum), spider plant (Cleome
gynandra) and pumpkins (Cucurbita pepo). From the study, these crops were mostly found on farm edges
and some hanging on the fence for support (climbers) where the invasion suppressed their growth and
productivity.
Methods used to control spread
The study sought to find out some of the methods that the respondents used to control spread of O. stricta
to other areas. Methods used include; chopping, burning, burying and use of herbicides. Most of the
respondents interviewed (52%) used chopping as their preferred means of control (Fig. 10). However,
chopping was not very effective therefore it was combined with other methods such as burning (10%) and
burying the cuttings (20%). Other method used was herbicides. However, respondents said that herbicides
used were very ineffective to control the spread. Some said that they used an approximate amount of Kshs
8000 annually in order to control the species through hiring of laborers to chop, buying herbicides,
fertilizers and other agricultural boosters to try and improve fertility of lands invaded. The herbicides used
were very concentrated with chemicals which are harmful to the environment. Respondents agreed that
about three days after spraying the herbicide, vegetation around O. stricta died but the cactus itself was
not affected. Several attempts had been made to control the spread of O. stricta in the area. Use of
herbicides was not successful on its own as the plant regenerated after some time from seeds. More
effective methods are therefore needed to ensure complete removal of the species.
0
10
20
30
40
50
60
Chopping Burying Burning Use of
herbicide
Resp
onde
nts (%
)
Methods of control
Figure 10: Areas invaded by Opuntia stricta
CONCLUSION AND RECOMMENDATIONS
From the findings, it is apparent that O. stricta invasion is a growing problem among residents of Ewaso
Nyiro, which if not controlled will be of severe consequences in future. The species has encroached areas
of possible grazing and farming with an indication of further spread. It is therefore a threat to the well-
being of humans, livestock and their environment. Despite its main use as a fence, the following should
form a baseline for policy interventions:
Environmental awareness to ensure that the residents know how the cactus is spread and prevented
Introduction of bio-control measures to this area.
Development of herbicides that are environment-friendly and effective.
ACKNOWLEDGMENTS
This study was funded by Chuka University under the Internal Research Fund. Special thanks go to Ms.
Mercy Kinyua for her assistance in data collection.
REFERENCES
Aréchiga, M.R. and Yanes, C.V. (2000). Cactus seed germination: a review. J. Arid Environ. 1:85-104.
CABI. (2014). Invasive Species Compendium [WWW Document]. CAB Int, Wallinford, UK. URL.
www.cabi.org/isc. Accessed on 2nd
February, 2016

Proceedings of the Third International Research Conference held on 26th to 28th October, 2016 107
Cronk, C.B and Fuller, J.L. (1995). Plant invaders, Chapman and Hall, London 420 pp.
Henderson, L. (2001). Alien weeds and invasive plants. Plant Protection Research Institute Handbook 12
Pretoria: Plant Protection Research Institute.
IUCN. (2004). Global Invasive Species database, IUCN–the World Conservation Union Species Survival
Commission, Invasive Species Specialist Group, IUCN
Ochoa, J. (2003). Principle characterization of different varieties of tuna (Opuntia spp.) in the Republic of
Argentina. In: P. Inglese and A. Nefzaoui (Eds.). Cactusnet Newsletter, FAO International
Technical Cooperation Network on Cactus Pear, Special issue, Rome.
Pejchar, L. and Mooney, H.A. (2009). Invasive species, ecosystem services and human well-being,
Trends in Ecology and Evolution 24 (9): 497-504. ******
THE SOLAR PHOTOVOLTAIC FACILITIES “LAKE EFFECTS”: AN ENVIRONMENTAL
HAZARD OF AVIAN SPECIES
Michura, E.G.
Kabarak University, P. O. Box Private Bag, Nakuru, Email; [email protected]; Tel.: +254720468476
ABSTRACT
The paper discusses and evaluates hazards posed by photo voltaic solar facilities on avian species. The
planet Earth faces various display of technological advancement, which can either be beneficial or
harmful to biodiversity. Concerns regarding the depletion of fossil fuels, global climate change, and
energy security have triggered rapid growth in the use of renewable energy technologies. The global
energy production is moving towards green renewable energy, which is one way to prevent environmental
degradation. Currently, large areas with high biodiversity and protected species are evaluated for large-
scale solar energy production. Research on effects on biodiversity such as construction and eventual
decommissioning of solar energy facilities on mortality of wildlife; environmental impacts of fugitive
dust and dust suppressants, destruction and modification of habitat, road and off-site impacts related to
construction material acquisition, processing, and transportation is lacking. Solar energy is clean and
considered a green source of energy. Its benefits include low carbon emission, no fossil fuel requirement,
durability and less payback time. However, concerns include wildlife destruction particularly avian. A lot
of migratory avian and other wildlife species are in danger with reference to Ivanpah Solar Electrical
Generating System in Mojave California USA where large population of avian species has been killed.
There is need for all countries to be more sensitive and consider ways of mitigation before our
biodiversity is lost for good. Kenya is embracing solar energy production and needs to put safety
mitigation measures to prevent and monitor solar energy activities from wildlife destruction. This paper
presents solar energy technologies (photovoltaic) evaluation results regarding their impacts and mitigation
to the sustainability of biodiversity.
Keywords: Avian species, Hazards, Wildlife, Mojave Desert, Mitigation,
INTRODUCTION
Concerns regarding the depletion of fossil fuels, global climate change, and energy security have
triggered rapid growth in the use of renewable energy technologies (Smith and Dwyer, 2016). The
enormous technological and economic reformation in the world on the energy consumption is increasing
exponentially. Total world energy use is also expected to rise by 56% between 2010 and 2040. According
to the International Energy Agency (IEA) statistics, 32.8% of energy generation is based on fossil fuel,
27.2% based on coal, 20.9% on natural gas; remaining 19.1% is based on nuclear, hydro, solar and others.
The current energy need is to shift from conventional fossil fuel plants to clean sources of energy. The
green energy is environmentally friendly compared to others such coal; fossil fuel and wood fuel (Aman
et al., 2014). Renewable energy and nuclear power are the world's fastest-growing energy sources; each
of them is increasing by 2.5% per year. The worldwide solar photovoltaic (PV) generation capacity
continues to increase and has become a rapidly growing industry (Miller, 2016). New innovations have
seen more solar energy development because of its cleanness to the environment. Solar energy benefits
ranges from low carbon emission, no fossil fuel requirement, long-term solar resources, less payback time
among others. However, like other power generation sources, solar energy has also some Safety, Health

Proceedings of the Third International Research Conference held on 26th to 28th October, 2016 108
and Environmental concerns, which needs to be addressed. For example, in Photovoltaic (PV) solar cells
manufacturing, some highly toxic materials like cadmium, lead, nickel and other compounds are used,
which have been restricted by the global environmental protection agencies. Use of such materials on
mass scale is highly unhealthy for the local habitat (Aman et al., 2014).
While renewable energy in general and solar power in particular, has been technologically developed with
the view of solving pollution effect but on the other hand, has created negative environmental impacts.
Some solar projects that have recently been placed in service; reveal mortal risks to wildlife, especially
avian species, which now require new ways of addressing and mitigation in the management of
biodiversity and prevention of any species loss. The planet earth wasn’t created for the complete comfort
of human but on the other hand, science has proved that human can only survive in a well-balanced
ecosystem (Miller, 2016). The new solar ecosystems developed to solve the problems of energy crisis and
pollution solutions have become the death net for the wildlife, migratory bird species in particular. Why is
such a noble technology becoming a death trap? Large concentrating solar plants use “power towers” that
consist of hundreds of thousands of computer-controlled mirrors to track the sun throughout the day
(Miller, 2016). The concentrated sunlight heats the water in the boiler pipes to create superheated steam,
which is then piped to a turbine to generate power (Aman et al., 2016). When the insects, birds and bats
fly through these beams, they are ignited in midair creating a plume of smoke, or streamer. The heat is so
strong that it kills the flying animals in mid air and waiting predators on the ground. A small number
sustain injuries that they can recover from when they are discovered and taken to wildlife rehabilitation
facilities. In California where there is high concentration of solar voltaic projects, one bird in every two
minutes, is trapped and killed. No documentation on statistics of birds killed is available (Miller, 2016).
The findings indicate that, the potential for solar energy development poses conflicts with natural
resources, especially wildlife and is also high, given the exceptional biodiversity and sensitivity of
ecosystems. In Mojave a semi desert in California, is highly fragile ecosystem and has been identified as a
“hotspot” for threatened and endangered species in the United States. For these reasons, planning efforts
should consider ways to minimize the impacts of solar project on wildlife. Paradoxically, the
implementation of large-scale solar energy development to solve environmental pollution as an alternative
to conventional energy sources may actually increase environmental degradation on a local and on a
regional scale with concomitant negative effects on wildlife (Lovich and Ennen, 2015).
Most avian-energy research has focused historically on direct effects of avian collision or electrocution
with overhead power systems, and more recently on avian collisions at wind energy facilities. While
research has expanded to consider indirect effects, large gaps in our knowledge persist. Some solar panels
installed on the ground shine and appear like lakes cheating water birds as large water bodies. The birds
then collide with them and are injured. This research addresses these gaps by increasing our
understanding of avian interactions with renewable energy infrastructures, challenges on future solar
facility expansions on avian community and identifying areas for future research.
Objectives
i) To assess the direct and indirect impacts of solar energy infrastructures on wildlife particularly on
birds based on peer-reviewed literature.
ii) Use our findings to create awareness to solar energy development in Kenya.
iii) Highlight important knowledge gaps and areas for future research.
METHODOLOGY
Information and data in this report were collected indirectly from solar energy companies, industry
organizations, and state and federal regulatory agencies, as well as through Internet searches. Compared
with other industries, there are relatively few reports that describe or quantify the interaction of birds with
utility-scale solar power facilities. Most of the available information on solar avian interactions is from
projects in the southwest United States. In total, avian monitoring plans and/or fatality data are known to
exist for 15 solar energy facilities (14 of them in the USA).

Proceedings of the Third International Research Conference held on 26th to 28th October, 2016 109
LITERATURE REVIEW
Solar Technology
In general, solar technology has two major categories i.e., solar photovoltaic (PV) modules and
concentrating solar power (CSP). PV cells convert sunlight energy into electrical energy by absorbing
photons from the light, and thus, atoms move from the lower orbit to higher orbit and finally leave the
parent atoms. CSP uses reflective surfaces to focus sunlight into a beam to heat a working fluid in a
receiver. The steam produced from the heat is used to drive the turbine and subsequently the generator is
run to produce power (Aman et al., 2014). As the number of utility-scale solar energy facilities using
these technologies is expected to increase worldwide, so are the potential impacts on wildlife and their
habitats. Recent attention is on the risk of fatality to birds. Understanding the current rates of avian
mortality and existing monitoring requirements is an important first step in developing science-based
mitigation and minimization protocols. The resulting information also allows a comparison of the avian
mortality rates from solar energy facilities with those from other technologies and sources, as well as the
identifying gaps and research (Lovich and Ennen, 2015).
Solar Voltaic Lakes Effects on Avian Species
Solar photovoltaic projects consist of hundreds or thousands of solar panels that convert sunlight directly
into electricity. Citing examples of effects of large solar fields such as those that have been built in the
last several years in Southern California, the facilities can fool birds into changing flight direction.
Sometimes during migration, the birds approach them because they appear to be lakes (false lakes) from
a distance (Miller, 2016). Many of the birds that have been killed at these large solar sites are water birds,
which indicate that these birds fly to solar fields and realize too late in their descent that the solar panels
are not water. The water birds then collide with the solar panels and are critically wounded or killed.
Some water birds also have great difficulty taking off from non-water surfaces, which could leave them
stranded in desert areas without food, water or shelter (Daily Mail Reporter, 2014).
Currently, Kenya is developing many solar panels to provide enough green energy for her domestic use
and to export the surplus to neighboring countries but what will be the cost on the biodiversity in future
particularly avian species? A research done in Hungary noted that shining dark surfaces of the solar cells,
which reflect light, resemble water surfaces resulting aquatic insects like mayflies depositing their eggs
on the solar panels. The solar panels are posing a false habitat hazard to more than 300 species of insects
and birds. This leads to a reproductive failure, which may have far-reaching adverse effects to the food
chain (Robert, 2016). The insects fall a prey to predators when they are harmed by solar power and cannot
escape easily. Reflected sunlight from expanses of dark surfaces that are shiny like glass-clad buildings,
even vehicles, solar panels of all sizes, becomes a worrisome new source for polarized light pollution.
This is what causes the caddis flies and other aquatic insects to mistake shining surface to be water
surface to lay their eggs (Robert, 2016).
Comments from Conference Discussions on Solar Lake Effects on Avian Species
Tom Dietsch of US Fish and Wildlife Service in 2014 gave the most complete and the most accurate
presentation on available avian mortality at solar projects so far. A high proportion of hummingbirds have
been found killed by solar flux. Most birds are insectivores. There may be a lake-effect that attracts birds,
mirrors or photovoltaic panels appearing like a body of water. Many bird species of regional concern may
be at risk. Long distance migrant population level effects may be hard to determine. There needs to be
robust monitoring strategies put in place in all the energy generation sites. There also needs to be
migratory pathway and migratory connectivity research; genotyping and telemetry are a few methods
being used by researchers. There are questions of what triggers settling response behavior in flying birds
so that they accidentally collide with panels or mirrors. A goal is to identify best management practices,
deterrents, and adaptive management, with solar bird and bat conservation strategies. Questions arose as
to what reference sites to use to compare background mortality.
There is little information at this juncture, but some solar companies said they were concerned about costs
of these requirements; pre-construction mortality surveys would double costs for companies. There is no
law enforcement concerning avian deaths, agencies are just trying to see what is happening. Dietsch said

Proceedings of the Third International Research Conference held on 26th to 28th October, 2016 110
the number of bird species has increased to 186 birds that have been found dead at solar projects, and the
list is increasing alarmingly. We recommend the agencies halt the construction of large-scale solar
projects on public lands until a valid Avian-Solar Science Plan is reviewed by the public and finalized.
The number of bird species is growing and not reducing, while impacts to bird populations in desert and
adjacent sky island montane habitats are unknown. More solar projects are being built or planned for the
Colorado River edges, and the impacts of lake-effect mortality are unknown but likely to be significant.
Impacts of Solar Projects on the Environment
All energy sources have some impact on our environment. Fossil fuels coal, oil, and natural gas do more
harm than renewable energy sources by most measures, including air and water pollution, damage to
public health, wildlife and habitat loss, water use, land use, and global warming emissions (UCS, 2013).
The exact type and intensity of environmental impacts varies depending on the specific technology used,
the geographic location, and a number of other factors. By understanding the current and potential
environmental issues associated with each renewable energy source, steps can be effectively taken to
avoid or minimize these impacts, as they become a larger portion of our electric supply (UCS, 2013).
Even technologies promoted for good environmental reasons can sometimes have unforeseen negative
consequences (Banks,. 2014), The environmental impacts associated with solar power can include land
use and habitat loss, water use, and the use of hazardous materials in manufacturing, though the types of
impacts vary greatly (UCS, 2013).
Solar energy is one of the cleanest forms of energy to-date, with remarkable solar potential available all
over the world. Benefits of solar energy lies with the minimization of utilization of natural resources
particularly those diminishing very fast (like fossil fuel, coal and others), reduction in emission of CO2
and consumption of water and the availability of huge amount of Si-semiconductor materials availability
for solar panel constructions. These advantages are discussed in detail in this paper (Aman et al., 2014).
Solar energy is considered as a ‘Green Source’ of energy. However, there are some Safety, Health and
Environmental issues, which should be addressed before the wide spread application of solar technology.
Solar panels are based on nano-technology, which is considered as a ‘clean tech’ technology. To see the
impact of solar panel, its life could be split into three stages, manufacturing, operation (generation),
decommissioning. It is true that photovoltaic solar panels do not pollute the air during power generation
however, studies have shown otherwise (Aman et al., 2014). The PV cell manufacturing process includes
a number of hazardous materials, most of which are used to clean and purify the semiconductor surface.
These chemicals, similar to those used in the general semiconductor industry, include hydrochloric acid,
sulfuric acid, nitric acid, hydrogen fluoride, 1,1,1-trichloroethane, and acetone (UCS, 2013)
Impacts on land use
Unlike wind facilities, there is less opportunity for solar projects to share land with agricultural uses.
However, land impacts from utility-scale solar systems can be minimized by sitting them at lower-quality
locations such as brown fields, abandoned mining land, or existing transportation and transmission
corridors. Smaller scale solar PV arrays, which can be built on homes or commercial buildings, also have
minimal land use impact (UCS, 2013). Different critics consider different criteria for finding out the land
usage in Life Cycle Assessment. Many critics consider that renewable energy resources occupy more land
as compared to conventional resources. However, some authors do not include the land transformation
(land use change) and land occupation (land use for a certain period) while comparing technologies. The
land transformation indicates the area of land altered from a reference state (unit: m2), while the land
transformation occupation denotes the area of land occupied and the duration of the occupation (Aman et
al., 2014). Wildlife occupies land as their habitats and careful planning is important to avoid waste and
not to deprive avian species and other wildlife species from their habitats because lack of planning may
lead to further biodiversity loss.
The research found that less than 15 % of solar projects were located on land already disrupted by human
development. The majority spanning 145 square miles are built on natural landscapes. More than 28 %
are located on croplands and pastures. This is compromising wildlife habitat and food crops reduction
(Morgan, 2015). It has been proposed that there is need to construct solar facilities on barren land or

Proceedings of the Third International Research Conference held on 26th to 28th October, 2016 111
designed on top of buildings to reduce the amount of land lost from solar coverage. This in essence will
conserve the environment and increase biological resources for ecosystem function (UCS, 2013)
Ecological impacts
Solar energy facilities have direct impacts on local habitats and nearby surroundings. The construction of
solar farms on large scale needs clearing of land, which adversely affects the native vegetation, wildlife,
and loss of habitat. If at the optimum solar site, trees and bushes exist and blocking the sunrays, it needs
to be removed thus further affecting the ecosystem. The native drainage and irrigation system is also
disturbed due to solar sites. The presence of cattle animals can reduce the efficiency of PV modules due
to the increased rate of dust and dirt in the surroundings (Morgan, 2015). Special chemicals are used for
dust suppressants and herbicides cleaning at solar facilities, which results in contamination of the
surrounding and ground water. Engineering methods can be used to mitigate these impacts. On the other
hand, CSP generates electricity by driving heat engines located on the ground. The high temperature of
fluids or materials is achieved by receiving the energy from optical concentrated solar receiver. The
height of CSP and the reflected light beams cause interference with aircraft operations and wildlife
disturbance (UCS, 2013).
Case Study: Mojave Desert Ivanpah Solar Project USA
The Ivanpah Solar Electric Generating System, the world's largest solar plant of its kind, was recently
switched on and in a short time, high number of avian population have been killed. The plant is located on
five square miles of the Mojave Desert, near the California / Nevada border. The plant is made up of three
generating units surrounded by more than 300,000 reflecting mirrors. At full power it produces enough
electricity for 140,000 homes but is still attracting controversy over environment (Daily Mail Reporter,
2014). Photos of birds with destroyed feathers flying into the hot 'thermal flux' around the towers, which
can reach 1,000 degrees Fahrenheit released by State energy officials confirms bird deaths. Intense heat is
incinerating birds that fly into the charged facility between the mirrors and the towers. Ivanpah, which
opened a year ago, is testing new ways to prevent bird deaths, trying everything from anti-perching
devices to spraying a bubble gum extract that birds hate. Its efforts could be critical in future technology.
Ivanpah's project owners have gone to great lengths to investigate and minimize wildlife impacts.
The management is evaluating the use of humane avian deterrent systems, similar to those employed by
airports and in food industry, and implementing other practices that go beyond conventional operational
procedures to reduce avian activity near the towers. Ivanpah has had an outsize amount of press attention,
possibly because it's the largest power tower project in the world (Taylor and Reporter, 2015). In April
2014 the Fish and Wildlife Service forensics report documented debris, birds and insects all known as
"streamers" going up in smoke at Ivanpah. According to the report one bird (streamer) every two minutes
is killed. 141 bird carcasses were found at Ivanpah from June 2012 to December 2013, one-third of which
likely died from the solar flux. Research has found that Ivanpah may act as a big death trap where
abundant insects attract small birds that are killed or incapacitated by the solar flux. Those birds in turn
attract larger predators, creating an entire food chain vulnerable to injury and death (Taylor and Reporter,
2015). Another report indicates that, an estimate of 28,000 birds were dying each year at Ivanpah, an
estimate the environmentalist admitted was loss of biodiversity. Ivanpah consultants said they believe no
more than 1,469 birds a year are being directly killed, 898 of which could be attributed to solar flux.
There is lack information and incomplete knowledge of the scope of avian mortality at these solar
facilities. A systematic study at Ivanpah is being conducted to determine its true impact on birds (Taylor
and Reporter, 2015)
Avian Species under threat at Ivanpah PV projects
Some of the species such as yellow-billed Cuckoos, southwestern willow flycatcher are threatened due to
the PV. The effects of wind turbines on birds, which is suggested kill far fewer birds per megawatt hour
than do fossil fuel plants, have long been a source of consternation for many environmentalists. Their
bird-killing effects have been serious enough to kill and hamper some planned projects. Now, as
concentrated solar farms start to sweep the globe, solar energy developers are facing similar outcries and
opposition for the harm that their clean energy facilities can cause to wildlife particularly avian

Proceedings of the Third International Research Conference held on 26th to 28th October, 2016 112
community (Banks, 2014). In Kenya, Flamingoes and other migratory birds are likely to suffer a lot from
solar power development, especially those that are located along the avian migratory paths. More deaths
will occur if no regulatory measures are taken. Scientists and engineers have to foresee the problems and
act now by developing strategies that will ensure that, solar facilities would not affect avian population
the way it is reported at most world solar facilities (UCS, 2013)
Causes of Avian deaths
Although renewable energy sources may offer a ‘greener alternative’ to traditional extractive energy
sources, mounting evidence suggests that renewable energy infrastructure, and transmission lines needed
to convey energy from renewable energy facilities to the users, may impact negatively on birds (Smith
and Dwyer, 2016). Peer-reviewed literature historically has focused on the direct effects of electrocution
and, to a lesser extent, collisions with overhead power systems, and on avian collisions at wind energy
facilities, with less consideration of indirect effects or other energy sectors. A study has reviewed and
examined direct and indirect effects on birds at utility-scale onshore wind and solar-energy facilities,
including their associated transmission lines. Although, both direct and indirect effects appear site
species, and infrastructure-specific, generalities across energy sectors are apparent. For example, large
bodied species with high wing loading and relatively low maneuverability appear to be especially
susceptible to direct effects of tall structures, and the risk of collision is likely to be greater when
structures are placed perpendicular to flight paths or in areas of high use (Banks, 2014). Given that all
infrastructure types result in direct loss or fragmentation of habitat and may affect the distribution of
predators, indirect effects mediated by these mechanisms may be pervasive across energy facilities. When
considered together, the direct and indirect effects of renewable energy facilities, and the transmission
lines serving these facilities, are likely cumulative. Ultimately, cross-facility and cross-taxon meta-
analyses will be necessary to fully understand the cumulative impacts of energy infrastructure on birds.
Sitting these facilities in a way that minimizes avian impacts will require expanded understanding of how
birds perceive facilities and the mechanisms underlying direct and indirect effects (Jenkins, et al., 2015).
Avian Community Mortality Estimates
Concerns on how solar energy facility has effect on avian community was not realized until 1986 at a 10-
megawatt solar One power tower facility in the Mojave desert in South eastern California USA, which
was the largest solar facility in the world at that time. The study reported that a number of dead birds were
found dead during the study (Mcray et al, 1986). Collisions with structures (predominately the mirrored
heliostats) accounted for 81 % of the bird deaths. The remaining 19% of the birds died as a result of burn
injuries, caused when they flew through areas of concentrated solar energy (solar flux). The study
concluded that, the only a small fraction of the local population was affected and that the impacts of the
facility were minimal. Surprisingly, there have been few scientific papers documenting the effects of solar
energy on birds since that study, although this initial research was not forgotten. In 2012 the US Fish and
Wildlife conducted more research and found that, the avian deaths had increased to alarming rate due to
large increase of solar energy facilities at Mojave Desert (Ralston, 2015).
Study observed that, it is not clear how many birds are injured or killed at solar-energy facilities
worldwide as little structured research has been undertaken. The effects of solar energy are likely to vary
from site to site, and it will be necessary to conduct surveys of facilities in different environments
(Ralston, 2015). Africa particularly East Africa is a corridor of avian migratory community between
Europe and Asia and increase of solar power facilities will definitely have profound effect on migratory
birds. Many birds are expected to be killed by solar fluxes if no regulatory measures are put in place
(Union of Concerned Scientists, 2015). Another study found that, estimated annual Mojave solar project
related avian mortality could be between 16,200 and 59,400 birds in the southern California region, which
was extrapolated to between 37,800 and 138,600 birds for all solar facilities across the United States that
are either installed or under construction (Meyers et al., 2016)
Avian mortality in Africa
The solar energy industry is expanding rapidly in southern Africa as is being experienced in other parts of
the world and, there are possible suggestions that this industry may be detrimental to birds through the

Proceedings of the Third International Research Conference held on 26th to 28th October, 2016 113
destruction of habitat, the displacement of populations from preferred habitat, and collision and burn
mortality associated with elements of the solar installations. The solar impact in Africa has been poorly
understood. In order to fully understand and successfully avoid and minimize the possible impacts of
solar energy on the region’s birds, it is essential that sufficient, project- and site-specific data are gathered
on avian impact assessment done to build understanding of the impacts and potential mitigation measures
(Jenkins, et al, 2015).
Solar power Project and Effects on Avian Community in Kenya
The energy sector in Kenya is largely dominated by petroleum and electricity, with wood fuel providing
the basic energy needs of the rural communities, urban poor, and the informal sector. An analysis of the
national energy shows heavy dependency on wood fuel and other biomass that account for 68% of the
total energy consumption (petroleum 22%, electricity 9%, others account for 1%). Electricity access in
Kenya is low despite the government’s ambitious target to increase electricity connectivity from the
current 15% to at least 65% by the year 2022 (World Bank, 2016). Since 2006-2007, the Ministry of
Energy has been actively promoting the use of solar energy for off-grid electrification. In particular, it has
funded the solar for schools programme and is targeting to extend this to off grid clinics and dispensaries.
Grid connected PV systems covering an area of 15-20 km2 (3% of Nairobi area) could provide 3801
GWh of electrical energy a year, equivalent to the total grid electricity sales for Kenya in 2002-2003. The
costs, however, are prohibitive. There are about 4 million households in rural Kenya, alone which present
a vast potential for this virtually untapped technology. The off-grid market is estimated to be over 40MW
(World Bank, 2016).
Kenya is embraced for big green energy development such as solar, wind and geothermal. The question is
how many birds and bats will be killed if Kenya goes the same way in solar and wind installation for
power generation as it is currently in the USA?. Kenya has one of the most active commercial PV system
market in the developing world, with an installed PV capacity in the range of 4 MW. An estimated
200,000 rural households in Kenya have solar home systems and annual PV sales in Kenya are between
25,000-30,000 PV modules. In 2002, total PV sales were estimated to have been 750 KWp and have
grown by 170% in 8 years, even without government intervention or policies to promote the uptake of PV
technology (World Bank, 2016). Kenya has identified nine sites to build solar power plants that could
provide more than half the country's electricity by 2016.
Construction of the plants, expected to cost $1.2bn (£73m), began this year and initial design stages are
almost complete. The partnership between government and private companies will see the state
contributing about 50% of the cost (Gitonga, 2014). The aim of the project is to protect the environment
and brings down electricity costs (Gitonga, 2014). The Uashin Gishu Solar Power plant will sit on a 371-
acre parcel of land at Kesses near Moi University on the outskirts of Eldoret town. It will have 159,920
panels. Although several solar farms have recently been set up in the country, this could be the first large-
scale plant producing a substantial amount of power for commercial purposes (World Bank, 2016).
The population of bird species in Kenya is very high and if solar panels become the new ecosystem, many
avian species will be destroyed. Well, they will install the technology and wait to see what happens. The
concerned scientists fill that, advanced knowledge is important and not to wait for what is being
experienced in Mojave solar power plant (UCS, 2016). Kenya is located on the corridor of avian
migratory community between Africa and Eurasian blocks. Large number of bird species fly from Africa
to Europe and Asia. In Africa the development of solar facilities along the corridors will adversely affect
the avian community, if no biodiversity conservation measures are put in place. Flamingos common in
Lake Nakuru are migratory birds and are sensitive to any changes in the environment. If large solar fluxes
are constructed along the flamingos’ pathways, many of them are likely to be killed. Death of flamingos
or disappearance of them will affect the tourism industry negatively.
Potential Mitigation
Specific mitigation measures to reduce the number of streamer impacts from concentrating solar projects
have been more challenging. Some approaches being tested include; turning off or replacing bright

Proceedings of the Third International Research Conference held on 26th to 28th October, 2016 114
lighting at the sites with LED lights to avoid attracting insects and use of netting to exclude birds from the
panel area; Creation of habitat areas located outside large solar project areas, to draw birds away from the
solar projects, has also been proposed; Removing vegetation that could be attracting birds to the project
area; Using predator and distress call recordings; Shutting down projects during key migration times; and
Using roosting and perching prevention. Remedies for existing and future solar projects will require
increased collaboration between design engineers, environmental specialists, developers and owners
(Taylor and Reporter, 2015).
Advocates for solar energy and conservationists are, naturally, eager to find solutions. It has been
suggested that PV and CSP panels should be marked so that birds can distinguish them as solid surfaces.
Minimizing the use of bright lights might reduce the number of insects (and therefore birds) attracted to a
facility. Covering ponds, discouraging roosting and perching on nearby infrastructure, and managing
habitat, could help prevent birds being attracted to an area. It has even been suggested that habitat be
located some distance from a solar facility, which should be restored and managed in a way that will
attract birds away from the danger. Power-tower CSP facilities could stop operating during peak periods
of bird movement (for instance, migration), and panels in standby mode should be positioned so that they
do not concentrate energy at a single point. While many of these suggestions make logical sense, their
practical efficacy remains uncertain (Ralston, 2015).
What is apparent is that transparent, systematic monitoring and research are required to better understand
the impacts and to test the value of mitigation measures. Until we have more data, a precautionary
approach should be adopted: solar-energy facilities should not be placed in or near habitats of range-
restricted and threatened species, and the costs and benefits of using power-tower technology must be
carefully evaluated (Ralston, 2015).
Monitoring new or emerging renewable energy
As new energy technologies are developed and popularized, it is important for the UN to maintain a
standard level of requirement. Fortunately, the emphasis of many new emerging energy technologies is to
minimize environmental impacts and CO2 emissions. Several of these technologies, however, will have
unexpected effects, such as the impact of wind turbines and solar installations on bird populations, which
are estimated to kill more than 6,000 birds a year in the US (Morgan, 2015). How many birds will be
killed in Kenya if there would be lack of monitoring and prevention mechanisms on avian mortality?
Alternative sites for solar project location
Instead of using arable or shrub land habitats, developed areas can be used as alternative sites. Solar
energy in developed areas, or for example on contaminated lands, would have great environmental co-
benefits, but this is not what is being emphasized instead, we see that big solar projects are competing for
space with natural areas. Most solar can be located over landfills, parking lots and rooftops putting 90%
of solar facilities in developed areas (Hernandez et al., 2014).
Our Role for Sustainable Environment
Since the world and its ever emerging technology have faced and will face environmental challenges now
and into the future, it is tempting to throw up our hands in helplessness. However, we all have a role to
play in securing a sustainable future. Every day each of us must make choices that affect energy
consumption and our environment. It could be good to remember to switch off light when leaving a room,
installing a solar geyser, buying energy-efficient appliances, or being conscious about what we purchase
and where we purchase it from. Energy has enormous benefits to our daily lives and to the economy, and
it is time we value it and conserve it. There is urgent need to protect avian community to ensure there is
no extinction of species especially in endangered species in areas facing development pressure. More data
use will ensure that the least-sensitive areas are targeted for solar energy projects (Kagan, et al., 2014).
Use of degraded land to avoid loss of biodiversity – a case study
Salmdorf Solar Plant near Munich, Germany a small 1 MW solar PV park in Salmdorf near Munich was
completed in 2007 and is built on a site that was previously used as a gravel pit in an area of intensive

Proceedings of the Third International Research Conference held on 26th to 28th October, 2016 115
farming. The abandoned sites or waste lands could be used to establish solar energy facilities (Peschel,
2010). With the growth, there is need to: avoid and minimize impacts on biodiversity through responsible
project development, and the opportunity to improve biodiversity by changing the use of the land (e.g.,
agriculturally used or sealed land and conversion land involving decontamination (Peschel, 2010).
Why a technology being developed cannot predict environmental impact (Weakness in LCA)
In looking at these impacts, environmental engineers use a tool called the Life Cycle Assessment (LCA)
to weigh the positive and negative environmental attributes of a new technology. The assessment analyzes
the impact of a product or process at all stages, from research and development, to manufacturing and use
and, finally, to future degradation and decommissioning. However, the LCA tool presents a fundamental
dilemma, one that engineers have grappled with for years. The tool relies on hard data that can only be
collected after the product and processes have been developed and marketed, a period of time when
significant, irreversible harm to the environment may already have occurred (Banks, 2014). Solar energy
facility is good on the one hand but is bad on the other. It is imperative for solar developers to come up
with ways of protecting biodiversity from extinction.
Importance of biodiversity
Prudence dictates that we preserve quickly as much biodiversity as possible, because life-support
functions often fail irrevocably at least in any time period meaningful to human habitation. Many life-
support functions are dependent upon ecosystem health, so preserving biological integrity is a top priority
(Lovich and Ennen, 2011). There is therefore need for functional ecosystems that would not be directly
exploited by humans. Each species from the pool of 1.7 million variety of life is important for every
reason why it was created. Losing any species means, unbalanced life system. Returning ecological space
to wilderness is critical, because one of the fundamental principles of biodiversity is that the larger the
area of a particular ecosystem, the greater the number of species present. With humans having
expropriated about 95 percent of the planet's surface from other species, this fundamental relationship
indicates that at least 50 % of the current species diversity will go extinct (Lovich and Ennen, 2011)
Future study and Plan on Solar projects Installations
This paper recommends that planners should try to understand how energy development will fragment the
landscape, and what mitigation measures can be put in place to keep the ecosystem functioning around
and within developed areas. This approach is especially important for developing countries with future
energy potential, including South America and Africa. There is lack of carefully planned energy strategy
anywhere in the world regarding biodiversity loss. It is imperative to get ahead of the curve and
understand the landscape impacts before it happens to avoid the same mistakes (Kiesecker, 2016).
Most of the studies have concentrated on Ivanpah solar project in southern California USA because it is
the largest in the world and has resulted in high impact on avian life. There are many other solar energy
projects that may be having same effects on the environment as far as avian mortality is concerned. The
present solar projects worldwide should be evaluated and more particularly new solar power development
in future for its potential in avian community mortality. The following are approaches that should be put
into considerations:
1. Consistency and standardization in avian monitoring and reporting protocols need to be improved.
2. Additional systematic data on avian fatalities are needed to decrease uncertainty about the risks of
solar energy development to avian populations.
3. Development of a solar-avian science plan will improve the scientific value of avian mortality data,
inform decisions about project sitting and design, and identify future research needs.
4. All concerned bodies and other stakeholders should work collaboratively toward developing and
implementing a useful and scientifically rigorous data collection program, evaluating avian mortality
related to utility-scale solar development and its causes, and identifying appropriate mitigation.
CONCLUSION
All energy production has both social and environmental costs. Solar energy project at Mojave Desert in
California is indeed a threat to avian community besides being beneficial. The Ivanpah solar project is

Proceedings of the Third International Research Conference held on 26th to 28th October, 2016 116
just one in a thousand of other developed solar energy population. The adverse environmental effects of
renewable energy development, states that “renewable energy sources are not the panacea they are
popularly perceived to be; indeed, in some cases, their adverse environmental impacts can be as strongly
negative as the impacts of conventional energy sources. Therefore, responsible, efficient energy
production requires both the minimization of environmental costs and the maximization of benefits to
society, factors that are not mutually exclusive. It is suggested that the analyses of costs and benefits
should include both wildlife use and existence values. The many other unanswered questions that remain
after reviewing the available evidence to provide opportunities for future research, as outlined above.
The shift toward renewable energy is widely perceived by the public as a “green movement” intended to
reduce greenhouse-gas emissions and acid rain and to curb global climate change. However, as noted by,
just because an energy technology is simple, thermodynamically optimal, renewable, or inexpensive does
not mean that it will be benign from an ecological perspective. The issue of wildlife impacts is much
more complex than is widely appreciated, especially when the various scales of impact (e.g., local,
regional, global) are considered. The analysis shows that, on a local scale, so little is known about the
effects of solar energy generation on wildlife that extrapolation to larger scales with any degree of
confidence is currently limited by an inadequate amount of scientific data. Therefore, without additional
research to fill the significant information void, accurate assessment of the potential impacts of solar
energy development on wildlife is largely theoretical but needs to be empirical and well founded on
supporting science. New solar PVC development in future should be evaluated on its effects on avian
community and mitigation measures put in place to avoid loss of avian community.
RECOMMENDATIONS
1. Reduction and step-by-step elimination of hazardous materials used in chemical processing of
semiconductor materials.
2. Lifetime for solar equipment should be improved, in order to increase the energy pay back ratio and
thus minimizing GHG and CO2 emission.
3. Efficiency of solar panels should be improved in order to minimize the land use and thus generating
minimum ecological impacts.
4. Need to carry out a thorough survey to understand the environ-mental impact of setting solar panels
on local habitants.
5. Need to carry out research to find out eco-friendly semi-conductor materials and other chemicals used
for their treatment.
6. Strict guidelines should be followed during manufacturing of solar panels, for human safety.
7. Strict guidelines should be followed in disposing hazardous wastes in solar panel manufacturing.
8. Generated wastes should be chemically treated before dumping into the sea, in order to protect the
aquatic lives in the sea.
9. Call systems should be developed for collection of dead solar panels from houses for safe disposal.
10. To minimize the cost of recycling, such modules should be developed, which are easy to disassemble
and detach the mate-rails from the glass.
11. Water based eco-friendly solvent should be developed for cleaning dust and dirt from the solar panels
12. The governments have building plans and designs to have all homes and office buildings, with their
own built solar panels for energy supply self to avoid large concentration of solar energy generation.
ACKNOWLEDGEMENT
The research was supported by Kabarak University funding, material contribution from my academic
advisers Prof. Jackson Kitetu and Dr. Eba Ongole, USA and moral support from my wife Anne Garry.
REFERENCES
Aman M.M., Solangim K.H., Hossain M.S., Badarudin A., Jasmon G.B., Mokhlis H. Bakar A.H.A., Kazi
S. N. (2014).A review of Safety, Health and Environmental (SHE) issues of solar energy system.
Journal of Renewable and Sustainable Energy Reviews.
Bank, J.P. (2014).10-exploring-environmental-impacts-solar-technologies Journal of Environmental
Science and Technology. http://phys.org/news/2014 Birds and Solar Energy Best Practice Guidelines.

Proceedings of the Third International Research Conference held on 26th to 28th October, 2016 117
Daily Mail Reporter. (2014). http://www.dailymail.co.uk/news/article-2560494/Worlds-largest-solar-
farm-SCORCHING-BIRDS-fly-it.html#ixzz4BrIFYaVx.
Gitonga J. (2014). Kenya to generate over half of its electricity through solar power by
2016.https://www.theguardian.com/environment/2014/jan/17/kenya-solar-power-plants
Jenkins A.R., Ralston S. and Smit-Robinson H.A.(2015). Best Practice Guidelines for assessing and
monitoring the impact of solar energy facilities on birds in southern Africa.
Kagan, R., Viner, T., Trail, P. and Espinoza, E. (2014) ‘avian mortality at solar energy facilities in
Southern California: A preliminary analysis.’ National Fish and Wildlife Forensics Laboratory.
Lovich J. E. and Ennen, R.J. (2011) Wildlife Conservation and Solar Energy Development in the Desert
Southwest, United States. Oxford Journals Scienceand Mathematics Biosciences, 61,12:982-992
McCrary, M.D., McKernan, R.L., Schreiber, R.W., Wagner, W.D., and Sciarrotta, T.C. (1986) ‘Avian
mortality at a solar energy power plant.’ Journal of Field Ornithology, 57 (2): 135–41.
Meyers, S. A Leroy J. W. , Rollins K. E., K. E. La Gory K. E., Smith, P. K.(2016).A preliminary
assessment of avian mortality at utility-scale solar energy facilities in the United States. Journal of
Renewable Energy.Volume 92, July 2016, Pages 405–414
Miller, D. (2016). Impact Of Solar Energy On Wildlife Is An Emerging Environmental Issue.
Infrastructure,Investment,SolarBlackandVeatchSolutionsPress.
http://breakingenergy.com/2016/03/24/impact-of-solar-energy-on-wildlife-is-an-emerging-
environmental-issue/
Morgan, Lee (2015). Solar Farms Encroach on the Environment. The San Diego Union-Tribune/October
20, 2015. http://www.govtech.com/fs/Solar-Farms-Encroach-on-the-Environment.html
Njoroge K. (2014). Solar company plans 40MW plant in Uasin Gishu. Posted Thursday, August
14 2014 at 20:39.http://www.businessdailyafrica.com/Corporate-News/Solar-company-plans-40MW-
plant-in-Uasin-Gishu-/-/539550/2419324/-/k61lb9z/-/index.html
Peschel, T. (2010). Solar Parks Opportunities for Biodiversity (pp. 1–35). German Renewable Energies
Agency: Berlin, Germany. Retrieved from www.renewables-in-germany.com
Ralston S. (2015) Burning issue. Is solar energy the next bird conservation challenge? Journal of African
Birdlife PP 56-59.
Robert B. (2016). Solar Panels – Are They A Threat To Biodiversity? Alternative energy news, and
information about renewable energy technologies. http://www.alternative-energy news.info/solar-
panels-threat-to-biodiversity/Science for a Healthy Planet ans Safer
World.http://www.ucsusa.org/clean_energy/our-energy-choices/renewable-energy/environmental-
impacts-solar-power.html#bf-toc-2
Smith J. A. and Dwyer J.F. (2015). Avian interactions with renewable energy infrastructure: Journal of
Condor Ornithological Application. 118: 411–423 DOI: 10.1650/CONDOR-15-61.1
Taylor,P. E and Reporter E. (2015). Bird deaths at Calif. power plant a PR nightmare for industry.
Greenwire: Monday, January 19, 2015
Union of Concerned Scientists (UCS). (2013). Environmental Impacts of Solar Power World
Union of Concerned Scientist (UCS). (2015). Environmental Impacts of Solar Power World. ******
SPATIAL-TEMPORAL CHANGES IN LAND USE LAND COVER AND IMPACTS ON
WILDLIFE CONSERVATION IN MERU CONSERVATION AREA
*Kiria, M.E.1, Magana, A.M.1 and Njue, C.2
1Chuka University. P. O. Box 109-60400. Chuka, kenya 2University of Brighton, United Kingdom
*Correspondence Email: [email protected]
Abstract
Habitat conversion is a major threat to biodiversity. Recent and current levels of human activities on
landscapes appear to be overriding the natural changes to ecosystems brought about by climate variations
in the past several thousand years. The impact of anthropogenic activities on wildlife habitat and species
vary depending on the spatial and temporal scales considered and the persistence of the activities in the
landscape. The study carried out in Meru Conservation Area (MCA) examined land use land cover
changes (LULC) that have taken place within and around the Protected Area (PA) between 1985 and

Proceedings of the Third International Research Conference held on 26th to 28th October, 2016 118
2015 with an emphasis of anthropogenic activities that have altered wildlife habitat and species depending
on spatial and temporal scales. The distribution of land use types within and around MCA has produced
land use patterns which the study seeks to establish their extent and effects in relation to wildlife
conservation. To establish the land use land cover changes (LULC), Landsat satellite images of medium
resolution were acquired and interpretation done using ArchGIS as the basic tool for analysis. In this
study, four satellite images with a span of 10 years from 1985 to 2015 were acquired for analysis as a
post-classification comparison for change detection. The results revealed significant changes in MCA
ecosystem over the 30 year study period, accounting for 9.9% and 6.1% increase in grassland and
bareland respectively. This could be an indication that agricultural activities are encroaching towards the
protected areas in the land that was formerly used as wildlife corridors and dispersal areas. It is also an
indication that there is a significant change in the forestland and shrubland which has respectively
reduced accounting to 2.3% and 15.7% decline resulting to bareland and grassland. The results of the
study provide a threat to the future survival of wildlife in their ecosystems due to decline in ecosystems
productivity as well as socioeconomic livelihood of communities living around MCA. This therefore calls
for an integrated planning approach towards management of protected areas to meet wildlife and human
needs in view of the changing climate regimes.
Key Words: Land Use, Land Cover, Wildlife, Ecosystems, Planning, Climate Change
Introduction
Habitat conversion is a major threat to biodiversity (Smucker, 2002, Olson et al, 2004, Syombua, 2013).
Recent and current levels of human activities on savanna landscapes appear to be overriding the natural
changes to ecosystems brought about by climate variations in the past several thousand years (WCED,
1987, Ojima et al. 1994, Parmesa, 2006). Land cover changes may occur as a result of natural factors such
as fire, drought and climate variations. However, in this case the changes may be temporary and irregular
and the ecosystem tends to recover from them. The most destructing land cover changes are as a result of
human alterations which have high a degree of resistance and consistency that minimize chances of
ecosystems to recover.
Landscapes such as vegetation cover are modified by land use activities (Esikuri, 1998). Such
modifications can lead to an increase or decrease in habitat quality and quantity for various species of
wildlife native to an area (Dublin and Hamilton, 1987; Guy, 1989). For instance, expansion and
intensification of agriculture is now recognized as one of the most significant human interactions of the
global environment (Matson et al. 1977, Francire, 2004). The use of land to produce goods and services
has been undertaken by humans around the world for the entire 10,000 years of settled agriculture
(Houghton 1994, Vitousek et al. 1997). In this regard, the impact of anthropogenic activities on wildlife
habitat and species vary depending on the spatial and temporal scales considered and the persistence of
the activities. Land use has been defined as a dynamic process that changes in space and time depending
on prevailing socio-economic and bio-physical conditions (Esikuri, 1998, Noe, 2003 Otuoma, 2004).
Further, (Njago, 2008) explains land use change as identification of environmental problems such as
habitat and species loss. The study carried out in Meru Conservation Area examined land use/ land cover
changes that have taken place within and around the protected areas between 1985 and 2015 with an
emphasis to identifying anthropogenic activities that have altered wildlife habitat and species depending
on spatial and temporal scales. The distribution of land use types within and around MCA has produced
land use patterns which the study seeks to establish their extent in relation to wildlife conservation.
The choice of Meru conservation Area as the basic unit of analysis was considered appropriate due to
several reasons. First is that MCA is one of the important wilderness areas in Kenya with diverse wildlife
species. Second, it portrays a classical example of a protected area network systems where there are
several PAs merged together to form the MCA ecosystem. Third, the area is surrounded by human
communities of diverse cultural backgrounds and with differing land use practices such as agriculture,
agro-pastoralist and pastoralist. Hence a potential to experience serious land use conflicts (Smucker 2002,
Otuoma, 2004;). Fourth, like many other savannas in Kenya, areas around MCA have been undergoing
major land tenure reforms since 1989 following government directive to shift the tenure systems from
communal ownership to privately owned individual subdivisions. According to Otuoma (2004), MCA has

Proceedings of the Third International Research Conference held on 26th to 28th October, 2016 119
over the past few decades witnessed a steady immigration of agricultural households for nearby high
potential agro-ecological zones into its buffer zones. This situation has subjected natural habitats that
formerly served as communal grazing lands and wildlife dispersal areas to sustained fragmentation and
alteration, since these migrant households take up land for settlement and crop cultivation. The most
affected are the wetter margins of the western and southern buffer zones which are critical for livestock
and wildlife especially during the dry season. Therefore, this situation has led to a reduction in the
livestock grazing range, decline in the livestock and wildlife resource base and increased competition
among wildlife, livestock and agriculturalist. As a result of the above challenges, studies by (Little 1994;
KWS, 1994; Said et al. 1997 and Seneels, 2001) have reported the reduction of animal home ranges as a
result changing land use/land cover within and around the Protected areas culminating to loss of species
and increased human wildlife conflicts.
METHODOLOGY
The objective of the study was to establish changes in land use and land cover that have occurred in Meru
National Park and Mwingi National Reserve in Meru Conservation Area over a period of 30 years and its
impacts on wildlife conservation and management. This involved acquisition of satellite images of the
past 30 years with a span of 10 years difference from 1985 to 2015 for analysis as a post-classification
comparison for change detection. The analysis specifically selected classes of land cover for analysis as
driven by the study objective. Field visits were made to identify current land uses, land degradation and
other notable changes on the ground to validate what was in the maps and images.
Figure 1: Map of the study area (Source: Auther, 2016)
Data Analysis
The images were first classified independently into land cover categories and then compared them using
Arch GIS software. Land use/land cover change data was then analyzed using descriptive statistics to
show the variation from 1985 to 2015 which was done by calculating the area under each land use for the
entire period under the database query module in Arc Map. The areas were then entered in Microsoft
Excel to determine specific land use change for particular class. The area of land in 1985 was subtracted
from the areas in 2015 to establish overall change in the study period. Pearson Correlation coefficient
statistical analysis was done to establish associations between land use changes in Meru National Park
and Mwingi National Reserve. The tests were considered significant if P-values were equal to or less than
0.05 and insignificant if P-values were greater than 0.05. The data was presented inform of narratives,
tables, charts and maps.
RESULTS
To establish the land use land cover changes, satellite image interpretation was used as the basic tool for
analysis. The use of remotely sensed information to describe and analyze wildlife-habitat relationships
and general ecosystem changes has seen increased application over time by several researchers. For
instance (Ondenyo, 1979; Pestena, 1986; Otuoma 2005) have used satellite images for cover type
mapping and assessment of wildlife ecosystem conditions in protected areas.

Proceedings of the Third International Research Conference held on 26th to 28th October, 2016 120
Classification of images into specific land use land cover (LULC) categories in Meru National Park and
Mwingi National Reserve produced six land use categories which included forest land, shrubland,
grassland, riverline forests, water and bareland. By 1985, the total land cover in Meru National Park and
Mwingi National Reserve was 284,728km2 where forest covered 46,677km
2, shrubland 152, 353km
2,
grassland 48,659km2, riverline vegetation 8,247km
2, water 727km
2 and 28,065km
2 of bareland. By
2015, the area occupied by forests hand changed to 40,255 km2, shrubland 107, 581km
2, grassland
76,923km2, riverline vegetation 12,677km
2, water 1,244km
2 and bareland to 46,048km
2. The results are as
summarized in the table below showing area each LULC class over the study period and the percentage
(%) of each class.
Table 1: Coverage of land use category and percentage cover (Source. Author, 2016)
LULC
Class
1985
(km2)
%
cover
1995
(km2)
%
cover
2005
(km2)
%
cover
2015
(km2)
%
cover
% LULC
change
Forest 46677 16.4 45792 16.1 75888 26.7 40255 14.1 -2.3
Shrubland 152353 53.5 207470 72.3 138449 48.6 107581 37.8 -15.7
Grassland 48659 17.1 6665 2.3 29773 10.5 76923 27 9.9
Riverline 8247 2.9 750 0.3 14278 5.1 12677 4.5 1.6
Water 727 0.3 538 0.2 7034 2.3 1244 0.4 0.1
Bareland 28065 10.1 23513 8.3 19306 6.8 46048 16.2 6.1
Total 284728 100 284728 100 284728 100 284728 100 0
The analysis of LULC changes in MCA has revealed significant changes in the protected area over the 30
year period in relation to the possible effects of anthropogenic activities on the protected area. For
instance, the results revealed that the grassland and bareland have expanded respectively from 48659ha
and 28065ha in 1985 to 76923ha and 46048ha in 2015, accounting for approximately 9.9% and 6.1%
increase in these land cover change. This could be an indication that agricultural activities are
encroaching towards the protected areas that were formerly used as wildlife corridors and dispersal areas.
It is also an indication that there is a significant change in the forestland and shrub land which has
respectively reduced from 46667ha and 152353ha in 1985 to 40255ha and 107587ha in 2015 accounting
to 2.3% and 15.7% decline resulting to bareland and grassland.
There was positive correlation between forests and water (r = .964, Df =2, P = 0.036), riverline and water
(r = .651, Df =2, P = 0.349), bareland and grassland (r = .860, Df =2, P = 0.140). on the other hand, a
significant negative correlation occurred between forests and bareland (r = .-692, Df =2, P = 0.308),
shrubland and bareland (r = -.631, Df =2, P = 0.369), grassland and shrubland (r = -.898, Df =2, P =
0.102) and between bareland and water (r = -.481, Df =2, P = 0.519). See table below.
Table 2: Correlations between various LULC classes in MNP and MNR (Source. Author, 2016)
Forest Shrubland Grassland Riverline Water Bareland
Forest Pearson Correlation 1 -.073 -.361 .473 .964
* -.692
Sig. (2-tailed) .927 .639 .527 .036 .308
Shrubland Pearson Correlation -.073 1 -.898 -.913 -.296 -.631
Sig. (2-tailed) .927 .102 .087 .704 .369
Grassland Pearson Correlation -.361 -.898 1 .648 -.153 .860
Sig. (2-tailed) .639 .102 .352 .847 .140
Riverline Pearson Correlation .473 -.913 .648 1 .651 .269
Sig. (2-tailed) .527 .087 .352 .349 .731
Water Pearson Correlation .964
* -.296 -.153 .651 1 -.481
Sig. (2-tailed) .036 .704 .847 .349 .519
Bareland Pearson Correlation -.692 -.631 .860 .269 -.481 1
Sig. (2-tailed) .308 .369 .140 .731 .519
*. Correlation is significant at the 0.05 level (2-tailed).

Proceedings of the Third International Research Conference held on 26th to 28th October, 2016 121
Fig. 3a: Image for 1985 showing land cover
characteristics
Fig. 6a: Image for 1985 showing only the
degraded and cultivated areas
Fig. 6b: Image for 2015 showing changes in
degraded and cultivated areas
Fig. 3b: Image for 2015 showing change in
land cover in various land use classes

Proceedings of the Third International Research Conference held on 26th to 28th October, 2016 122
DISCUSSION
Both MNP and MNR have undergone significant changes in land use land cover over the years which
have over time affected the wildlife populations and their ecosystems. As established in the study, MCA
is surrounded by communities who have diverse socio-cultural backgrounds depicted by their different
land use practices. The Ameru on the western boundary practice mainly agriculture, the Tharaka and
Kamba practice mixed livestock keeping and farming while the Borana and Oroma mainly practice
livestock keeping. This explains the significant increase in the bareland land use class which represents
the degraded areas, farm land and settlements.
Causes of land use land cover changes in MNP and MNR is as a result of climate change, population
increase, expansion agricultural land, increased demand and market for horticultural crops and Miraa
(Khat), changes in land tenure and drought that lead to encroachment into the protected areas (PAs) for
livestock grazing and charcoal burning. Bareland class around Meru National Park and Mwingi National
reserve are becoming important as they replace areas previously occupied by grassland, forests and shrubs
that initially served as dispersal areas and movement corridors for wildlife. Majority of the households
that occupy the buffer zones were migrants who came to the area in search for more land for agriculture
and livestock keeping. Majority of these had moved from agricultural rich areas of Meru, Nyeri,
Murang’a and Kiambu (Otuoma, 2004). The main affected areas of MCA were the northern and southern
buffer zones which led to permanent settlement due to higher rainfall gradient. The changes further
extend to inside the protected area boundaries as a result of continuous encroachment by communities for
firewood, building materials, pasture for livestock and charcoal burning. Observations in the field during
ground verification revealed that intensive irrigation on the western boundary of Meru National park
contributed to reduced river flow into the park with water being diverted to irrigate Miraa (Khat) and
horticulture crops through furrow and flooding methods.
These ongoing changes have had effects on existence, distribution and movement of wildlife in MNP and
MNR. The changes have led to cases of increased human wildlife conflicts as the wild animals move from
the PA boundaries to immediate areas that have been converted to farms hereby destroying crops, causing
injuries or even loss of life. The farmers on the other hand invest so much time guarding the crops against
wildlife which has resulted to resentment towards wildlife and withdrawn support for conservation
initiatives. This study recommends that for future existence of wildlife in MNP, MNR and Kenya at large,
integrated planning approaches for changing land use and land cover by incorporating the local
communities, their socio-economic needs and those of wildlife to enhance sustainability.
ACKNOWLEDGEMENT
The authors acknowledge the KWS for permitting the study in the protected areas and providing relevant
data, Regional Centre for Mapping Resources for Development (RCMRD) for providing satellite images
and Chuka University for research funding.

Proceedings of the Third International Research Conference held on 26th to 28th October, 2016 123
REFERENCES
DeFries, R., A. Hansen, B. Turner, R. Reid, and J. Liu. 2007.Land use change around protected areas:
management to balance human needs and ecological function. Ecological Application
17(4):1031–1038. http://dx.doi.org/10.1890/05-1111
Dobson, A.P, A.D. Bradshow, and A.J. baker. 1997. Hopes for the future: Restoration Ecology and
Conservation Biology. Science. Vol. 277. 515-522
Dublin, H.T and I.Hamilton, 1987. Status and trends of elephants in the Serengeti-Mara ecosystems.
African Journal of Ecology, 25: 19-33
Esikuri. E.E, 1998. Spatio-temporal effects of land use changes in a savanna wildlife Area of Kenya.
Virginia Polytechnic Institute and State University
Francine Madden (2004). Creating coexistence between humans and wildlife: global perspectives on local
efforts to address human-wildlife conflicts. In human dimensions of wildlife. 9:247-257
Guy, P. 1989. The influence of elephants and fire on the Brachystegia-Julbenardia woodland in
Zimbambwe. Journal of tropical ecology, 5: 215-226
Noe Christine, 2003. The dynamics of Land Use Changes and their Impacts on the wildlife corridor
between Mt. Kilimanjaro and Amboseli National Park, Tanzania.
Odenyo Victor, 1979. Application of LANDSAT data to the study of land and range resources in the
Narok area, Kenya. Research report 79-4. Canada Center for Remote Sensing, Ottawa. In:
Esikuri. E.E, (1998). Spatio-temporal effects of land use changes in a savanna wildlife Area of
Kenya. Virginia Polytechnic Institute and State University
Olson Jenifer. M, Misana S, Campbell D. J, Mbonile, M and Mugisha Sam (2004). Spatial patterns and
root causes of land use change in east Africa. Land Use Change Impacts and Dynamics project
Working paper 47. Nairobi, Kenya. International livestock Research Institute.
Otuoma John (2004). Land use change impacts and dynamics. (LUCID) Project Working Paper. Nairobi,
Kenya. International Livestock Research Institute.
Parmesan, C. 2006. Ecological and Evolutionary Responses to Recent Climate Change. Annual Review
of Ecology, Evolution, and Systematics 37:637–69.
Smucker Thomas (2002). Land tenure reform and changes in land use and land management in Tharaka,
Kenya. Land Use Change Impacts and Dynamics (LUCID) Working paper 11. Nairobi, Kenya.
International livestock Research Institute.
Syombua M. J (2013) Land use and land cover changes and their implications for human-wildlife
conflicts in the semi-arid rangelands of southern Kenya. Journal of Geography and Regional
Planning. Vol. 6(5), pp. 193-199, http://www.academicjournals.org/JGRP 10/05/2014
Vitousek, P.M., H.A Mooney, J. Lubchenco and J.M. Melillo. 1997. Human domination of earth’s
ecosystems. Science. Vol. 277: 494-499
World Commission on Environment and Development (WCED), 1987. Our Common Future. Oxford
University press. New York
******
TIPS ON TECHNOLOGY COMMERCIALIZATION AND LEVERAGING OF
INTELLECTUAL PROPERTY RIGHTS: AN EYE OPENER FOR UNIVERSITY ACADEMIA
Isutsa, D.K.1 and Amin, F.M.2
1Chuka University, P. O. Box 109-60400, Chuka 2Malaysian Technology Development Corporation, Kuala Lumpur, Malaysia
ABSTRACT
Technology commercialization is the process of transforming an idea or scientific discovery into new or
improved product, process or service. Technology commercialisation process is complex, non-linear, with
false starts, dead ends, changes in direction and feedback loops. It requires different skill sets, namely:
scientific, technical, business and marketing. There are various options for realizing value, namely:
licensing, start-up and alliance. An idea or discovery, by itself, has no direct economic value, but rather
economic value is created when an idea or discovery finds an application and gets translated into a
product, process or service. Commercialization provides returns to public investment in research and
ensures that new and promising ideas become seeds to innovative products and services.

Proceedings of the Third International Research Conference held on 26th to 28th October, 2016 124
Commercialization leads to creation of new ventures which are needed for competitiveness and economic
growth. Technology commercialisation happens post-research and has about 6 major steps: discovery,
proof of concept, product development, market-ready product, marketed innovation, and demand for
innovation. The circle repeats once it reaches this end. Discovery/conceptualisation phase has shown that
ideas evolve through constant iteration between a new technological capability and market need.
Researchers generate new technological possibilities that are embodied in new discoveries and methods.
Research could be triggered by real or perceived market needs or by researcher’s own convictions or
interests. Proof of concept entails evaluation of the technological feasibility and commercial viability of a
technology. Product development refers to the entire process of: identifying a market opportunity;
creating a product to appeal to the identified market; testing/trials; and modifying and refining the
product. This paper will present tips on how University academia could move from plain research
engagement to research outputs implementation or transfer for commercialisation.
Keywords: Intellectual Property rights, Licensing, Technology transfer, Patenting
INTRODUCTION Technology commercialization is the process of transforming an idea or scientific discovery into new or
improved product, process or service. The process is complex, non-linear, with false starts, dead ends,
changes in direction and feedback loops. It requires different skill sets: scientific, technical, business,
marketing. There are various options for realizing value, namely: licensing, start-up, alliance. This paper
covers: Technology commercialization scope; Importance of technology commercialization; Technology
process; Options for technology commercialization; Agents in technology commercialization; and
Determinants of commercialization success.
IMPORTANCE OF TECHNOLOGY COMMERCIALIZATION An idea or discovery, by itself, has no direct economic value. Economic value is created when an idea or
discovery finds an application and gets translated into a product, process or service. Commercialization
provides return to public investment in research. It ensures that new and promising ideas become seeds to
innovative products and services. Commercialization leads to creation of new ventures which are needed
for competitiveness and economic growth.
TECHNOLOGY COMMERCIALIZATION PATHWAYS
University practitioners should not operate in isolation, but should interlink as shown below:

Proceedings of the Third International Research Conference held on 26th to 28th October, 2016 125
TECHNOLOGY COMMERCIALIZATION PROCESS
Pathways from discovery to the marketplace: Commercialization is non-linear with feed-back loops
1. Discovery/Conceptualisation Phase •Technology commercialization commences with the techno-market insight
•Ideas evolve through constant iteration between a new technological capability and market need
•Researchers generate new technological possibilities embodied in new discoveries and methods
•Research could be triggered by real or perceived market needs or by researcher’s own convictions or
interests
You need to start with many ideas to get one successful product
2. Proof of Concept Phase Proof of concept entails evaluation of technological feasibility and commercial viability of technology
•How is it done?
- prototype for product/service
- scaling-up and/or pilot plant for process

Proceedings of the Third International Research Conference held on 26th to 28th October, 2016 126
•This phase involves high risks, requires large resources and is frequently the end of the
commercialization initiative – the phase commonly termed as “Valley of Death”
Resources for Technology Commercialization (a) Challenges
(b) Funding Options
R
e
s
o
u
r
c
e
s
Early Development
Research resources
Commercialization
resources
Private fund
Valley of death Public fund
Commercialization Discovery
Phases of Commercialization

Proceedings of the Third International Research Conference held on 26th to 28th October, 2016 127
3. Product Development Phase Product development refers to the entire process of:
- identifying a market opportunity
- creating a product to appeal to the identified market;
- testing/trials; and
- modifying and refining the product
4. Technology Commercialization Options
(a) Sale or Assignment of IP Rights •Sale by owner of all his exclusive right to an invention to another person or legal entity
•Outright sale is suitable for common technologies
•The permission by the owner to a patented invention to another person or legal entity to perform one or
more of the ‘acts’ which are covered by the exclusive right to the patented invention
Examples of Patents: Very straight forward stuff
An asparagus production technique for the subtropical region.
A micropropagation technique for virus-free garlic.
A micropropagation technique for giant taro.
‘Improved Chancellor' grape.
Piperine, Piperidine alkaloid from Piper nigrum L. as a synergist to pyrethrins for the control of
insect pests and vectors.
Improved process and associated technology for pre-drying green leaf tea.
Headwear.
Remote Global System for mobile communication internal lock.
Patenting is happening monthly. For more info, logo onto: http://www.kipi.go.ke/index.php/patents
(b) Licensing
•Licensing is one of the most common modes of technology commercialization
•Financial compensation typically include:
–Up-front fees or lump-sum payments
–Running royalties (e.g. based on sales volume)
–Milestone payments
A
s
s
i
g
n
m
e
n
t
L
i
c
e
n
s
i
n
g
A
l
l
i
a
n
c
e
N
e
w
v
e
n
t
u
r
e
High
R
E
T
U
R
N
Low
Low High RISK
J
o
i
n
t
v
e
n
t
u
r
e

Proceedings of the Third International Research Conference held on 26th to 28th October, 2016 128
Types of Licenses
Exclusive
Non-exclusive
ntion is useful to many companies thus not necessary to “induce” investment
Partially Exclusive
ensee has the rights to exploit only for the specified application
(c) Alliance •Collaborating with another person or legal entity to acquire assets or expertise to complement the
capabilities of the owner of the invention and that are essential to bring the invention to the market
• Examples of complementary assets are:
(d) Joint Venture •A contractual agreement between two or more parties for the purpose of executing a business
undertaking with mutual sharing of profits and losses
•There are 2 basic forms of joint venture (JV) namely equity JV and contractual JV
The equity JV is an arrangement whereby a separate legal entity is created
A contractual JV might be used where the establishment of a separate legal entity is not needed or
where it is not possible to create such an entity
(e) New Venture •Creation of new business or “start-up” by licensing technology
•Sometimes called “entrepreneurial technology transfer”
•In the USA 1-2 spin-offs per US$100 million research expenditure; best practice 5-20 spin-offs per
US100 million research expenditure)
DETERMINANTS OF COMMERCIALIZATION SUCCESS •A compelling commercial concept
•Continuing validation through the acquisition of new, ‘smart’ and meaningful investment
•A ‘champion’ well-matched to the needs of the project, especially during the uncertain early phases
•Conducive environment (e.g. supportive organization culture, compatible incentives, enabling laws)
•Efficient access to external networks of resource providers
•Efficient mechanism to share information within organization and with potential resource providers

Proceedings of the Third International Research Conference held on 26th to 28th October, 2016 129
AGENTS IN TECHNOLOGY COMMERCIALIZATION
Technology commercialization involves multi-sectoral collaboration sketched below. All must integrate
to realise success.
ACKNOWLEDGEMENT
The Malaysian and Kenyan Governments for offering the “MTCP-MTDC Technology Commercialisation
Workshop for Practitioners from African Countries” from 23rd
to 27th June, 2014 in Malaysia, and source
Amin, F.M. of MTCP-MTDC.
REFERENCES
Isutsa, D. K. (2014). Proceedings of the MTCP-MTDC Technology Commercialisation Workshop for
Practitioners from African Countries held from 23rd
to 27th June, 2014 in Malaysia. Chuka University,
Chuka, Kenya. Available at: http//:www.chuka.ac.ke

Proceedings of the Third International Research Conference held on 26th to 28th October, 2016 130
THE ROLE OF SCIENCE, ENGINEERING AND TECHNOLOGY IN SUSTAINABLE
DEVELOPMENT 2-D INVERSION OF GRAVITY DATA OF NYABISAWA-BUGUMBE AREA OF MIGORI
GREENSTONE BELT, KENYA
Odek, A.1 and Githiri, J.2 1Physical Sciences Department, Chuka University, P. O. Box 109-60400, Chuka
2Physics Department, Jomo Kenyatta University of Agriculture and Technology, P. O. Box 62000-00200, Nairobi
ABSTRACT
With the continuous extraction of minerals in Migori greenstone belt exploration is currently evolving
from surface based exploration to subsurface exploration. This necessitates a good understanding of the
geophysical features in the subsurface which are likely to have a direct bearing on the distribution of
minerals. In this study, a 2-D litho-prediction model of Nyabisawa-Bugumbe area was developed from
geologically constrained inversion of gravity field data. The measured gravity field data were subjected to
cleaning process to remove perturbations which were not of geophysical interest, and later enhanced by
removing long wavelength anomalies which are as a result of regional trend. The density variations were
then inverted for the geometrical parameters of the model. Gravity high trending NW-SE around
Nyabisawa, Kirengo towards Nyambeche was delineated. The gravity high is bounded by two major
faults along rivers Migori and Munyu. Integrating the 2-D inversion of gravity data and the geology of the
area, the gravity field perturbation is associated with banded iron formations.
Keywords: Gravity, Anomalies, Migori Greenstone belt, Inversion, Minerals
INTRODUCTION
Geological and Tectonic Setting
Migori greenstone belt runs west-northwest to east-southeast between Lake Victoria and the Great Rift
Valley. The belt is squeezed between the diapiric migori granite batholith to the south and a felsic
volcanic succession to the north. The structure of the Migori greenstone belt appears to reflect diapiric
movements of the migori Granite batholith. The geology of the area consists of Archean greenstone belt
that surrounds Lake Victoria. The Archean rocks in this area are principally of the Nyanzian system, the
Kavirondian system and the post-Kavirondian granites that surround Lake Victoria (Shackleton, 1946).
The history of gold mining in this area, especially the history of Macalder mine, situated to the north-west
of Migori town indicates the potential this area has for mineral production. In the vicinity of Macalder
mine, gold occurs mostly in concordant quartz veins, some of which crop out and are worked by artisanal
miners as shallow opencast workings (Ngira exploration works, 2009). An explorer may need to know
that systematic exploration is usually based on some conception of general or generic setting. In this case
an ability to define host structures or units as well as vein location and orientations, coupled with the
facility to discriminate mineralized from unmineralized terrain is required.
Gravity Technique
Gravity survey method can provide comprehensive structural, genetic and target evaluation and achieve
site discrimination in terms of potential economic deposits (Leaman, 1992). Gravity data is acquired with
the goal of determining distributions of density. This physical property can be interpreted in terms of
lithology and/ or geological processes and their geometric distributions can help delineate geological
structures and used as an aid to determine mineralization and subsequent drilling target (Philips et al.,
2010). Because gold, which is one of the suspected mineral is typically associated with small scale
structural features, dense, good-quality data and sharp positioning are important when searching an ore
body (Airo and Mertanen, 2007).
Once data is obtained from gravity survey, variations in the earth’s gravitational field which did not result
from the differences of density in the underlying rocks were corrected. Drift correction was done by
having a base station which was preoccupied periodically in the day. A drift curve was plotted and
readings made in other stations assumed to have a linear drift as fitted base readings. Using the drift rate
each reading was corrected to what it would have read if there were no drift.
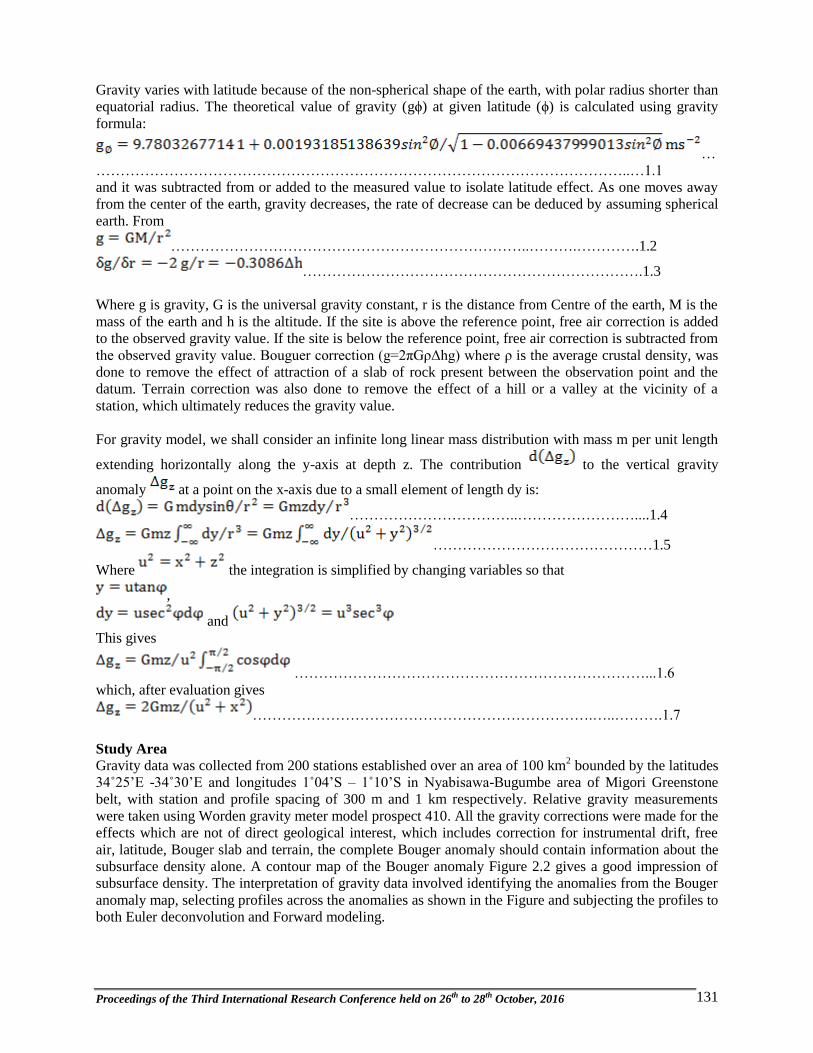
Proceedings of the Third International Research Conference held on 26th to 28th October, 2016 131
Gravity varies with latitude because of the non-spherical shape of the earth, with polar radius shorter than
equatorial radius. The theoretical value of gravity (gϕ) at given latitude (ϕ) is calculated using gravity
formula:
…
………………………………………………………………………………………………..…1.1
and it was subtracted from or added to the measured value to isolate latitude effect. As one moves away
from the center of the earth, gravity decreases, the rate of decrease can be deduced by assuming spherical
earth. From
………………………………………………………………..……….………….1.2
…………………………………………………………….1.3
Where g is gravity, G is the universal gravity constant, r is the distance from Centre of the earth, M is the
mass of the earth and h is the altitude. If the site is above the reference point, free air correction is added
to the observed gravity value. If the site is below the reference point, free air correction is subtracted from
the observed gravity value. Bouguer correction (g=2πGρΔhg) where ρ is the average crustal density, was
done to remove the effect of attraction of a slab of rock present between the observation point and the
datum. Terrain correction was also done to remove the effect of a hill or a valley at the vicinity of a
station, which ultimately reduces the gravity value.
For gravity model, we shall consider an infinite long linear mass distribution with mass m per unit length
extending horizontally along the y-axis at depth z. The contribution to the vertical gravity
anomaly at a point on the x-axis due to a small element of length dy is:
……………………………..……………………....1.4
………………………………………1.5
Where the integration is simplified by changing variables so that
,
and
This gives
………………………………………………………………...1.6
which, after evaluation gives
…………………………………………………………….…..……….1.7
Study Area Gravity data was collected from 200 stations established over an area of 100 km
2 bounded by the latitudes
34˚25’E -34˚30’E and longitudes 1˚04’S – 1˚10’S in Nyabisawa-Bugumbe area of Migori Greenstone
belt, with station and profile spacing of 300 m and 1 km respectively. Relative gravity measurements
were taken using Worden gravity meter model prospect 410. All the gravity corrections were made for the
effects which are not of direct geological interest, which includes correction for instrumental drift, free
air, latitude, Bouger slab and terrain, the complete Bouger anomaly should contain information about the
subsurface density alone. A contour map of the Bouger anomaly Figure 2.2 gives a good impression of
subsurface density. The interpretation of gravity data involved identifying the anomalies from the Bouger
anomaly map, selecting profiles across the anomalies as shown in the Figure and subjecting the profiles to
both Euler deconvolution and Forward modeling.

Proceedings of the Third International Research Conference held on 26th to 28th October, 2016 132
Figure 1.1: Local geology of Migori greenstone belt (Shackleton, 1946)
Theory
Euler Deconvolution aids the interpretation of gravity field. It involves determination of the position of
the causative body based on an analysis of the gravity field and the gradients of that field and some
constraint on the geometry of the body Zhang et al. (2000). The quality of the depth estimation depends
mostly on the choice of the proper structural index which is a function of the geometry of the causative
bodies and adequate sampling of the data Williams et al. (2005).

Proceedings of the Third International Research Conference held on 26th to 28th October, 2016 133
Figure 2.1: Location of Migori
Euler Deconvolution
It is based on the Euler equation of homogeneity:
)()()()(zzzzozyozxo
TBnTzzTyyTxx ............................................................ 1
for the gravity anomaly vertical component Tz of a body having a homogeneous gravity field, (xo, yo, zo)
are the unknown co-ordinates of the source body centre to be estimated. (x, y, z) are the known co-
ordinates of the observation points of the gravity and gradients. The values Tzx, Tzy, Tzz are the measured
gradients along the x-,y- and z-directions, n is the structural index and Bz is the regional value of the
gravity to be estimated. In 2-D this equation reduces to:
)()()(zzzzozxo
TBnTzzTxx ............................................................................... 2
There are three unknown parameters (xo,zo and Bz). In this study, a structural index of 0.5 was adopted
since it gives the most accurate depth estimates for gravity data where the typical source structures are
finite-offset (Williams et al., 2005). With selected window, there are n data points available to solve the
three unknown parameters. When n˃3, these parameters can be estimated (Zhang and Sideris, 1996).
Interpretation of Euler Solutions
In this study the results were generated using Euler 1.0 software after Cooper (2004).
Figures 3(a), 3(b) and 3(c) below, shows the vertical and horizontal gradients of the gravity field and 2-D
Euler solutions for profiles AA’, BB’ and CC’. The solutions cluster well at a shallow depth estimated to
be between 50 m to 750 m. The depth of these high gravity causative bodies under profiles AA’, BB’ and
CC’ coincide well with the geology of the study area which reveals stripes of banded iron formation
suspected to host majorly gold mineral. The scattered solutions which are not well constrained (spurious)
were rejected during the interpretation.

Proceedings of the Third International Research Conference held on 26th to 28th October, 2016 134
Figure 2.2: Complete Bouguer anomaly contour map.
Conventional Euler deconvolution produces spray of solutions, within which the correct answer for each
discrete body needs to be found. Weighted least squares minimize the errors in the solution for best fit
and also give local error estimates. In order to distinguish more reliable solutions from spurious ones,
some of the discrimination techniques proposed by Desmond et al. (2004) were used, these includes;
analysis of the clustering of solutions, rejection of bodies that have inadmissible structural index, low pass
filtering of the data to constrain the frequency content and rejection of solutions based on reliability.
Figure 3(a): Euler Deconvolution along profile AA’.

Proceedings of the Third International Research Conference held on 26th to 28th October, 2016 135
Figure 3(b): Euler Deconvolution along profile BB’.
Forward modelling
Theory
This interpretation technique is applied where the shapes and depths of anomaly sources are important, it
involves preparation of gravity field models of a subsurface using all available geological information, it
is then compared with the field actually observed (Parasnis, 1986). The model is then modified, within the
limits set by the geological constraints, until a satisfactory level of agreement is reached between
calculation and observation. This process was done using the grav2DC software developed by Talwani et
al (1964). The final model is not, of course, necessarily correct, and since other mass distributions will
exist that satisfy all the conditions, but it is at least a possible solution. In this study the modifications to
the model was performed interactively on a computer screen which shows both the model and the gravity
data. Two-dimensional approximations were used in which the geology is assumed not to vary at right
angles to the line of profile and section and is generally adequate provided that the strike length of the
anomaly is at least three times as great as the cross-strike width (Barker and Wohlenberg, 1971). The start
up model depth was obtained from the direct interpretation and Euler deconvolution solutions.
Figure 3(c): Euler Deconvolution along profile CC’.

Proceedings of the Third International Research Conference held on 26th to 28th October, 2016 136
2-D Forward modelling interpretations
Profile AA’ is used to model the gravity high anomaly centered at grid co-ordinates (668000, 9954500).
The result of the forward modeling shows a dense structure with the maximum depth to the top as 150 m,
density contrast 0.1832 g/cm3 and a width of 3.321 km. Figure 4(a) shows the fit between the computed
gravity anomaly curve and the observed anomaly along profile AA’. Similarly, Profiles BB’ is used to
model gravity high anomaly centered at grid co-ordinates (666000, 9955200). The best fit is obtained at a
depth of about 200 m, density contrast 0.3908 g/cm3 and a width of 604 m. Profile CC’ cuts across a
series of gravity high anomalies. The modeled structure is a dense body of density contrast approximately
0.1035 g/cm3 at a depth range about 50 m to 540 m and a width of 2.674 km. Figure 4(c) displays the fit
between the anomaly curve as a result of the calculated body and the observed anomaly curve.
Figure 4(a): Observed, calculated anomaly and forward model for 2-D body along profile AA’.
Figure 4(b): Observed, calculated anomaly and forward model for 2-D body along profile BB’.
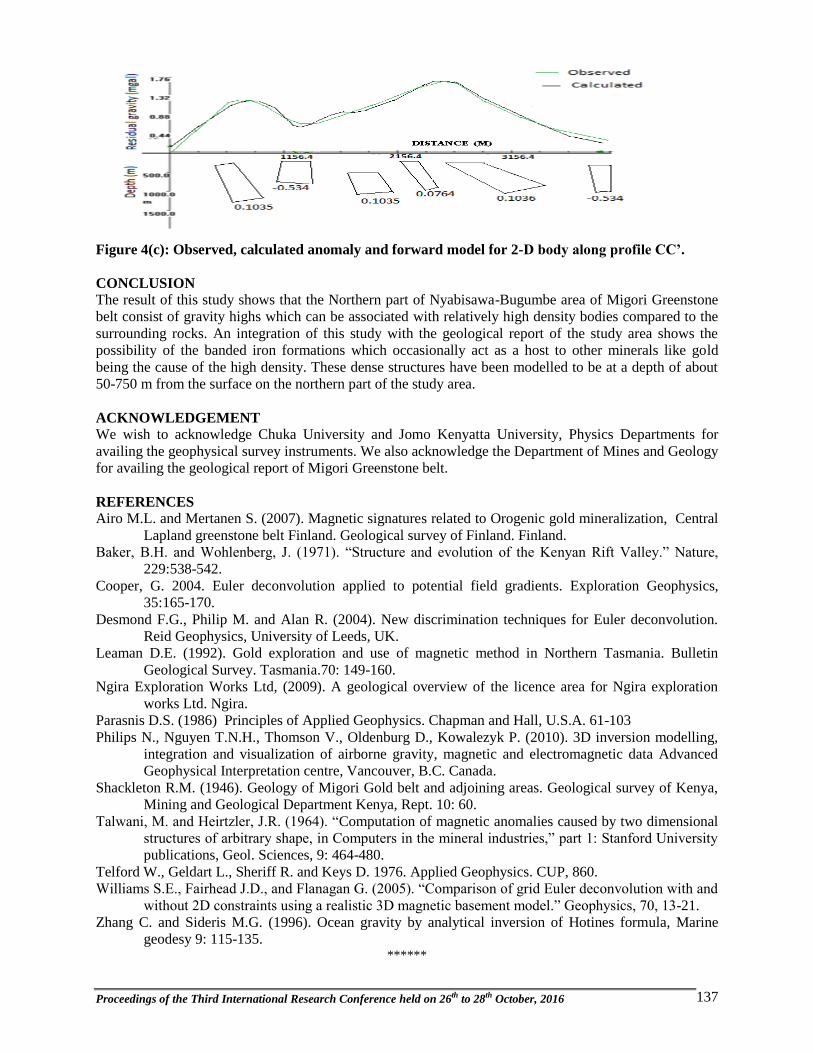
Proceedings of the Third International Research Conference held on 26th to 28th October, 2016 137
Figure 4(c): Observed, calculated anomaly and forward model for 2-D body along profile CC’.
CONCLUSION
The result of this study shows that the Northern part of Nyabisawa-Bugumbe area of Migori Greenstone
belt consist of gravity highs which can be associated with relatively high density bodies compared to the
surrounding rocks. An integration of this study with the geological report of the study area shows the
possibility of the banded iron formations which occasionally act as a host to other minerals like gold
being the cause of the high density. These dense structures have been modelled to be at a depth of about
50-750 m from the surface on the northern part of the study area.
ACKNOWLEDGEMENT
We wish to acknowledge Chuka University and Jomo Kenyatta University, Physics Departments for
availing the geophysical survey instruments. We also acknowledge the Department of Mines and Geology
for availing the geological report of Migori Greenstone belt.
REFERENCES
Airo M.L. and Mertanen S. (2007). Magnetic signatures related to Orogenic gold mineralization, Central
Lapland greenstone belt Finland. Geological survey of Finland. Finland.
Baker, B.H. and Wohlenberg, J. (1971). “Structure and evolution of the Kenyan Rift Valley.” Nature,
229:538-542.
Cooper, G. 2004. Euler deconvolution applied to potential field gradients. Exploration Geophysics,
35:165-170.
Desmond F.G., Philip M. and Alan R. (2004). New discrimination techniques for Euler deconvolution.
Reid Geophysics, University of Leeds, UK.
Leaman D.E. (1992). Gold exploration and use of magnetic method in Northern Tasmania. Bulletin
Geological Survey. Tasmania.70: 149-160.
Ngira Exploration Works Ltd, (2009). A geological overview of the licence area for Ngira exploration
works Ltd. Ngira.
Parasnis D.S. (1986) Principles of Applied Geophysics. Chapman and Hall, U.S.A. 61-103
Philips N., Nguyen T.N.H., Thomson V., Oldenburg D., Kowalezyk P. (2010). 3D inversion modelling,
integration and visualization of airborne gravity, magnetic and electromagnetic data Advanced
Geophysical Interpretation centre, Vancouver, B.C. Canada.
Shackleton R.M. (1946). Geology of Migori Gold belt and adjoining areas. Geological survey of Kenya,
Mining and Geological Department Kenya, Rept. 10: 60.
Talwani, M. and Heirtzler, J.R. (1964). “Computation of magnetic anomalies caused by two dimensional
structures of arbitrary shape, in Computers in the mineral industries,” part 1: Stanford University
publications, Geol. Sciences, 9: 464-480.
Telford W., Geldart L., Sheriff R. and Keys D. 1976. Applied Geophysics. CUP, 860.
Williams S.E., Fairhead J.D., and Flanagan G. (2005). “Comparison of grid Euler deconvolution with and
without 2D constraints using a realistic 3D magnetic basement model.” Geophysics, 70, 13-21.
Zhang C. and Sideris M.G. (1996). Ocean gravity by analytical inversion of Hotines formula, Marine
geodesy 9: 115-135. ******

Proceedings of the Third International Research Conference held on 26th to 28th October, 2016 138
INFORMATION SEEKING BEHAVIOUR OF COMPUTER SCIENCE STUDENTS IN KENYA:
CASE OF CHUKA UNIVERSITY
Tuei, N. and Kiruki, J.
Chuka University, P. O. Box 109-60400, Chuka. E-mail: [email protected]
ABSTRACT
Information centers such as libraries and research centers offer various services to their clients. This calls
for a shift by information professionals from common daily activities and focus on the information needs
of their clients. Computer scientists are very resourceful and contribute to the sustainability of the society.
The computer scientist creates networks where people can acquire, use and manage Information
Technology through innovations and social networks. This is an indication that Computer scientists have
potentials, which can provide the drive needed for achieving the Sustainable Development Goals (SDG).
The objectives of the study were: 1) Determine the information needs of computer science students at
Chuka University. 2) Identify the information sources they consult 3).Find out problems the students face
while seeking information. Descriptive design was used for the study. Stratified random sampling was
used to select 50 students studying computer Science at Chuka University. A questionnaire was used for
data collection. Data analysis was carried out using the statistical packages for social science (SPSS).
They sought information mainly for preparing for examinations and assignments. Among the main
information sources used were the Internet, friends, lecturers and books. Few used journal articles. Some
of the challenges they highlighted include difficulty accessing some websites and failed connections to
databases. The library should make more effort to reach out to the computer science students to encourage
them to ask for help while seeking for information.
Keywords: Library, Information needs, databases, computer scientists, ICT
INTRODUCTION
Information is an important resource for a student’s academic and social achievements. Therefore
knowledge about their information seeking behavior is crucial to effectively satisfy their information
needs. In order to effectively fulfill their information needs, an understanding of the kind of information
they require and the types of information sources they can utilize to fulfill these needs is important.
According to Shakeel and Vinayagamoorthy (2013), Information seeking behavior can be described as an
individual’s way and manner of gathering and sourcing for information for personal use, knowledge
updating and development. However the internet has affected student’s behavior while seeking
information. Nadzir and Salim (2013) state that information seeking behavior should start by identifying
the information needed then selecting the suitable information sources. However some students are
unfamiliar with this approach as a result their information needs are not adequately met.
Aim of the Study
The library is an important part of the academic world. Changes in the information environment have
resulted in the traditional libraries being converted to digital libraries. The phenomenal growth in ICT
technology has forced organizations to build library e-resources. This study examined the information
seeking behavior of computer science students in Kenya, a case of Chuka University. Computer scientists
are very resourceful and contribute to the sustainability of the society. They create networks where people
can acquire, use and manage IT through innovations and social networks. This is an indication that
Computer scientists have potentials, which can provide the drive needed for achieving the Sustainable
Development Goals (SDG).The study aimed at determining their information needs and the sources of
information they consulted. It adopted a descriptive survey design and data was collected using a
questionnaire administered to 50 respondents. Research has been carried out on information seeking
behaviour, but none on the information seeking behaviour of computer science students in Chuka, Kenya.
Objectives of the Study
1) Determine the information needs of computer science students at Chuka University.
2) Identify the information sources they consult
3) Find out problems the students face while seeking information.

Proceedings of the Third International Research Conference held on 26th to 28th October, 2016 139
LITERATURE REVIEW
Ingwersen (1995) defines information as being the result of transformation of the generator’s cognitive
structures.to makes use of information there has to be a need. Case (2012) states that information need is
the recognition that your knowledge is inadequate to satisfy a goal that you have. Information need as
defined by Dervin anmd Nilan, (1986) is a gap in individual’s knowledge in sense making situations. As
the need arises an individual is forced to seek information. Borgman et al.(2005) argue that information
seeking includes an individual’s recognition of a knowledge gap or a state of knowledge that instigates
the pursuit of information. This results in information seeking behavior which is According to Wilson
(2000), the purposive seeking for information as a consequence of a need to satisfy some goal. In the
course of seeking, the individual may interact with manual information systems. Williamson et al.(2007)
state their Information seeking behavior includes information needs, the use of information sources to
retrieve information and ends with the use of the retrieved information. For the purpose of the study, For
the purpose of the study, Williamson’s definition will be used to refer to the behavior of computer science
students at Chuka University while seeking information to fulfill their needs. This refers to the process of
identifying needed information, using the preferred sources of information to search for the needed
information and using the acquired information to fulfill their information needs.
A study by Ajiboye and Tella (2007) -examined the information seeking behavior of University
undergraduate and its implications for quality in higher education in Africa. The study showed that
academic information was the student’s main information needs. The study revealed that the most crucial
source of the academic information was the Internet. A survey by Kerins, Madden and Fulton (2004) on
engineering and law students’ information seeking behavior revealed that the internet was the first source
of information they used. Kakai, Ikoja-Odongo and Kigongo-Bukenya (2004), in their study on the of the
information seeking behavior of undergraduate students of Makerere University, Uganda revealed that the
students main information need information to help them in their course works and assignments.
METHODOLOGY
This study adopts quantitative data approach to information seeking behaviour, using survey method as
the primary tool for data collection. Questionnaires were distributed to 50 computer science students.
Data analysis was done using the Statistical Packages for Social Science (SPSS).
RESULTS AND DISCUSSION
Frequency of Library Visits
Respondents were asked whether they visit the library. Significant variance was evident, in term of how
frequently the computer science students visited the library. as shown in table 1 majority of the
respondents (21; 42%) visited the library 2-3 times in a week while (14; 28%) visited the library once or
twice in a month further, it shows that (7; 14%) of the respondents visited the library daily. Respondents
who visited the library once or twice a year are equal to those who visited several times a year.
Information Needs
The types of information needed by the computer science students were identified based on analysis of
the feedback from the questionnaire. Finding out the student’s information needs gives essential
information that would help the librarians in developing the library collection as well as the services and
facilities to provide better service to them.
Table 1: Frequency of library visits
Frequency Respondents Percentages
Daily 7 14%
2-3 times in a week 21 42%
0nce or twice in a month 14 28%
Once or twice a year 4 8%
Several times a year 4 8%
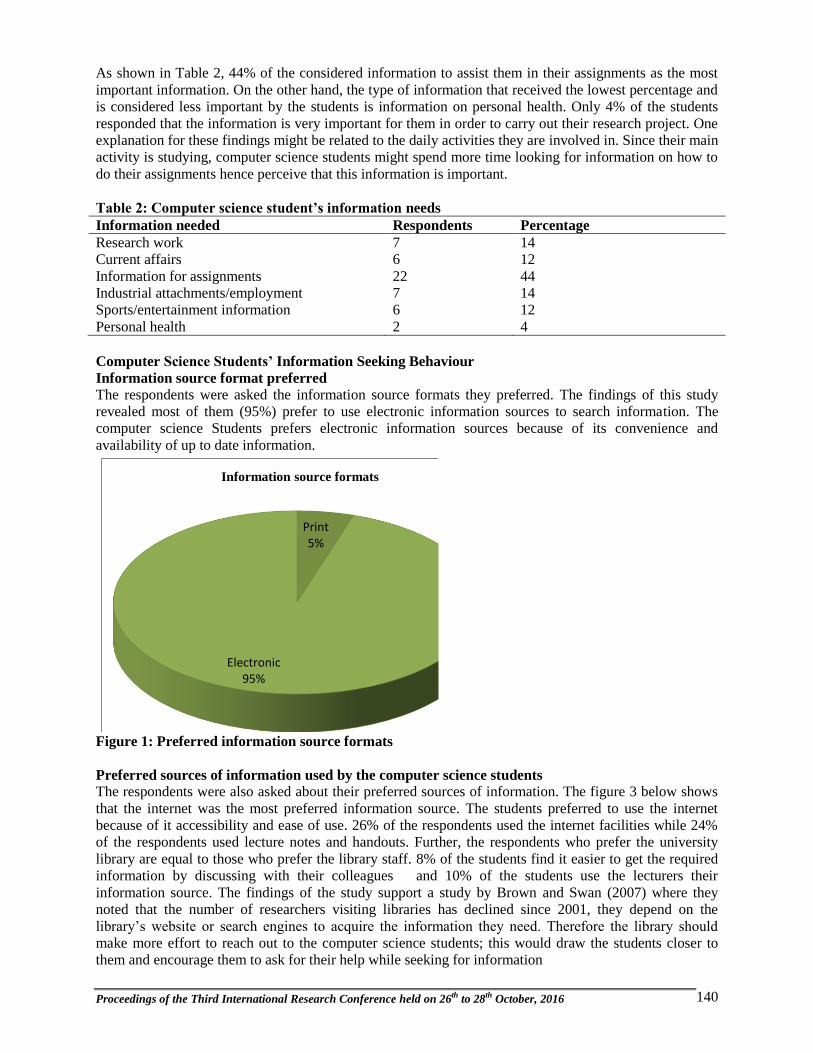
Proceedings of the Third International Research Conference held on 26th to 28th October, 2016 140
As shown in Table 2, 44% of the considered information to assist them in their assignments as the most
important information. On the other hand, the type of information that received the lowest percentage and
is considered less important by the students is information on personal health. Only 4% of the students
responded that the information is very important for them in order to carry out their research project. One
explanation for these findings might be related to the daily activities they are involved in. Since their main
activity is studying, computer science students might spend more time looking for information on how to
do their assignments hence perceive that this information is important.
Table 2: Computer science student’s information needs
Information needed Respondents Percentage
Research work 7 14
Current affairs 6 12
Information for assignments 22 44
Industrial attachments/employment 7 14
Sports/entertainment information 6 12
Personal health 2 4
Computer Science Students’ Information Seeking Behaviour
Information source format preferred
The respondents were asked the information source formats they preferred. The findings of this study
revealed most of them (95%) prefer to use electronic information sources to search information. The
computer science Students prefers electronic information sources because of its convenience and
availability of up to date information.
Print 5%
Electronic95%
Information source formats
Figure 1: Preferred information source formats
Preferred sources of information used by the computer science students
The respondents were also asked about their preferred sources of information. The figure 3 below shows
that the internet was the most preferred information source. The students preferred to use the internet
because of it accessibility and ease of use. 26% of the respondents used the internet facilities while 24%
of the respondents used lecture notes and handouts. Further, the respondents who prefer the university
library are equal to those who prefer the library staff. 8% of the students find it easier to get the required
information by discussing with their colleagues and 10% of the students use the lecturers their
information source. The findings of the study support a study by Brown and Swan (2007) where they
noted that the number of researchers visiting libraries has declined since 2001, they depend on the
library’s website or search engines to acquire the information they need. Therefore the library should
make more effort to reach out to the computer science students; this would draw the students closer to
them and encourage them to ask for their help while seeking for information

Proceedings of the Third International Research Conference held on 26th to 28th October, 2016 141
Table3: The most preferred information sources
Information sources Respondents Percentage
Lecture notes and handouts 12 24
University library 8 16
Internet 13 26
Consulting colleagues 4 8
Lecturers 5 10
Library staff 8 16
0
2
4
6
8
10
12
14
Lecture notes andhandouts
University library Internet Consultingcolleagues
Lecturers Library staff
Figure 2:The most preferred information sources
Challenges faced while seeking information
Table 4 indicates that the most challenging situation for the respondents while seeking is when the needed
information materials are not available at library. As shown in the table, 40% of the computer science
students responded that it is a challenge when the needed materials are not available. The least
challenging information seeking situation is when the information they need is scattered in too many
sources. The finding is similar with Singh and Kumari (2013) who reported that the major problem
students face while searching for information is the unavailability of required materials in the library.
Table 4: Challenges faced by computer science students while seeking information
Information sources Respondents Percentage
Unavailability of needed materials 20 40
Information scattered in too many sources 1 2
Inadequate knowledge of use of catalogue 5 10
Lack of time to access the information resources 10 20
Inadequate qualified librarians 2 4
Non- cooperating library staff 3 6
Lack of knowledge in using library resources 6 12
I don’t know how to identify relevant information sources 3 6
Possible solutions to information seeking problems
The respondents were asked to share their suggestions on ways to address the problems presented in
Table 4 above. Table 5 shows the responses received.
Table 5: Suggestions on ways to address the problems
Responses Frequencies
Relevant materials in library 22
Change in library staff attitude 2
Protection of library information materials 1
Training in the use of catalogue 2
Convenient library environment 2
Provision of computers and internet 18
Improved power supply/general lightings 3
Total 50

Proceedings of the Third International Research Conference held on 26th to 28th October, 2016 142
CONCLUSION AND RECOMMENDATIONS
In this study, information seeking behaviour comprised of identifying the information needs of computer
science students at Chuka University, finding the required information using information sources and
using the retrieved information with the intention of fulfilling their needs.
The findings of this study revealed that information for completing their assignments was the most
important information needed by the computer science.
While searching for the required information, the students prefer the internet due to its availability
and ease of use.
The study also found out that the unavailability of the needed information materials is the major
problem that the students face while seeking information.
Some of the possible solutions to the challenges noted in the study include, provision of relevant
materials in the library, provision of modern library facilities and provision of computers and internet.
The findings of this study could encourage further research on the computer science student’s
information seeking behaviour in the electronic environment.
The findings can also be used by librarians to develop collections that would meet the computer
science student’s information needs.
Investment in ICT infrastructure e.g. increases in bandwidth is necessary in order to increase access
and use of information resources by the students.
A detailed analysis can be taken to identify the factors influencing the computer science students’
behaviour in seeking information for a research project.
REFERENCES
Ajiboye, J. O., and Tella, A. (2007). University undergraduate students' information seeking behaviour:
Implications for quality in higher education in Africa. TOJET: The Turkish Online Journal of
Educational Technology, 6(1).
Borgman, C.L. Smart, L. J. Millwood, K. A. Finley, J. R.Champeny, L. Gilliland, A.J. and Leazer, G. H.
(2005). Comparing Faculty Information Seeking in Teaching and Research: Implications for the
Design of Digital Libraries. Journal of the American Society for Information Science and
Technology,56(6),636-656.
Brown, S., and Swan, A. (2007). Researchers' Use of Academic Libraries and their Services: A Report
Commissioned by the Research Information Network and the Consortium of Research Libraries
Case, D. O. (2012). Looking for Information: A Survey of Research on Information Seeking, Needs and
Behavior, London: Emerald Group Publishing.
Ingwersen, P. (1995).Information and information science. In: Allen Kent (ed.).Encyclopaedia of Library
and Information Science. 56. 19. New York: Marcel Dekker. 137-174.
Kakai, M., Ikoja-Odongo, R. and Kigongo-Bukenya, IMN. 2004. A study of the information seeking
behaviour of undergraduate students of Makerere University, Uganda. World Libraries, 14:14-26.
Kerins, G., Madden, R., andFulton, C. (2004). Information-seeking and students studying for professional
careers: the cases of engineering and law students in Ireland. Information Research, 10 (1).
Shakeel, A.G.T. andVinayagamoorthy, P. (2013). Information seeking behavior of business school
students: A special study of universities and colleges located in Academic City, Dubai, UAE.
International Journal of Library and Information Science,5(11), 447-456.
Nadzir, M.M. and Salim, J. (2013). Information seeking behavior factors: A measurement model. Paper
presented at The 3rd International Conference on Research and Innovation in Information
Systems, 27-28 November (pp. 168-173). Selangor: Malaysia.
Singh, N. and Kumari, D. (2013). Information seeking behavior: A case study of faculty members and
students of institute of higher learning of BhagatPhool Singh MahilaVishwavidyalaya, Sonipat,
Haryana (India). International Journal of Advanced research in Management and Social Sciences,
2(9):82-97.
Wilson, T. D. (2000). Human Information Behavior. Informing science, 3 (2), 49-56. ******

Proceedings of the Third International Research Conference held on 26th to 28th October, 2016 143
MODELING HIV/AIDS CO INFECTION WITH MALARIA AND TUBERCULOSIS: THE
ROLE OF TREATMENT AND COUNSELING
Okongo, M.K.1*, George, L.2, Musundi, S.W.1 and Magana, A.M.1
1Chuka University, P. O. Box 109-60400, Kenya 2Masinde Muliro University of Science and Technology, Kenya
Email addresses: [email protected]; [email protected]; [email protected]; [email protected]
ABSTRACT
HIV/AIDS remains one of the leading causes of death worldwide with its effects most devastating in Sub-
Saharan Africa due to its dual infection with malaria and tuberculosis. This study presents a co-infection
deterministic model defined by a system of ordinary differential equations for HIV/AIDS, malaria and
tuberculosis. The HIV/AIDS model is analysed to determine the conditions for the stability of the
equilibria points and assess the role of treatment and counseling in controlling the spread of co-infections.
This study shows that effective counseling reduces the value of the reproduction number for HIV/AIDS
(H
R ) to less than unity eliminating the problem. Numerical simulations show that applying anti-retroviral
(ARV) treatment without effective counseling increases the value of H
R , worsening the HIV/AIDS
problem. However, ARV treatment coupled with effective counseling reduces the value of H
R to a level
below one eliminating the disease. Also when the proportion of those receiving ARV treatment without
effective counseling increases, the value of H
R also increases to a level above one. Therefore, strategies
for control of HIV/AIDS should emphasize counseling and not only treatment.
Keywords: HIV/AIDS, Tuberculosis, Malaria, Stability, Counseling, Treatment
BACKGROUND INFORMATION
Research at the interface of mathematics and biology is increasing, and virtually any advance in disease
dynamics to day requires a sophisticated mathematical approach in order to map out the parameters
necessary for control and containment of epidemic outbreaks. Infectious diseases, alongside
cardiovascular diseases and cancer, have been the main threat to human health. Acute and chronic
respiratory diseases, especially pulmonary tuberculosis, malaria and HIV/AIDS are responsible for a large
portion of mortality especially in developing countries (Kramer et al., 2010).
Globally HIV/AIDS has killed more than 35 million people since it was first discovered in 1981 and
almost 70 million people have been infected with the HIV/AIDS virus making it one of the most
destructive epidemics in recorded history (World Health Organization (WHO), 2013). It remains one of
the leading causes of death in the world with its effects most devastating in Sub-Saharan Africa. One of
the key factors that fuels the high incidence of HIV/AIDS in Sub-Saharan Africa is its dual infection with
malaria and tuberculosis (Martin et al., 1995). World Health Organization statistics show that tuberculosis
(TB) is the most common illness and the leading cause of death among people living with HIV/AIDS,
accounting for one in four HIV/AIDS related deaths and at least one-third of the 34 million people living
with HIV/AIDS worldwide are infected with latent TB. Persons co infected with TB and HIV/AIDS are
21-34 times more likely to develop active TB disease than persons without HIV/AIDS. In 2011, there
were an estimated 1.1 million HIV/AIDS positive new TB cases globally and about 79% of these people
live in Sub-Saharan Africa (WHO, 2013).
According to the World Health Organization report of April 2008, malaria increases the viral load in
HIV/AIDS patients. Conversely HIV/AIDS increases the risk of malaria infection and accelerate
development of clinical symptoms of malaria with the greatest impact on the immune suppressed persons
(WHO, 2008). Since the co-infections were recorded, malaria has seen a 28% increase in its prevalence
and malaria related death rates have also nearly doubled for those with co infections (Centre for Desease
Control (CDC), 2007). The co infection between malaria and HIV-1 is the commonest in Sub-Saharan
Africa and, to a lesser extent, in other developing countries. It is estimated that 22 million Africans are
infected with HIV-1, and around 500 million are suffering from malaria annually (WHO, 2013).
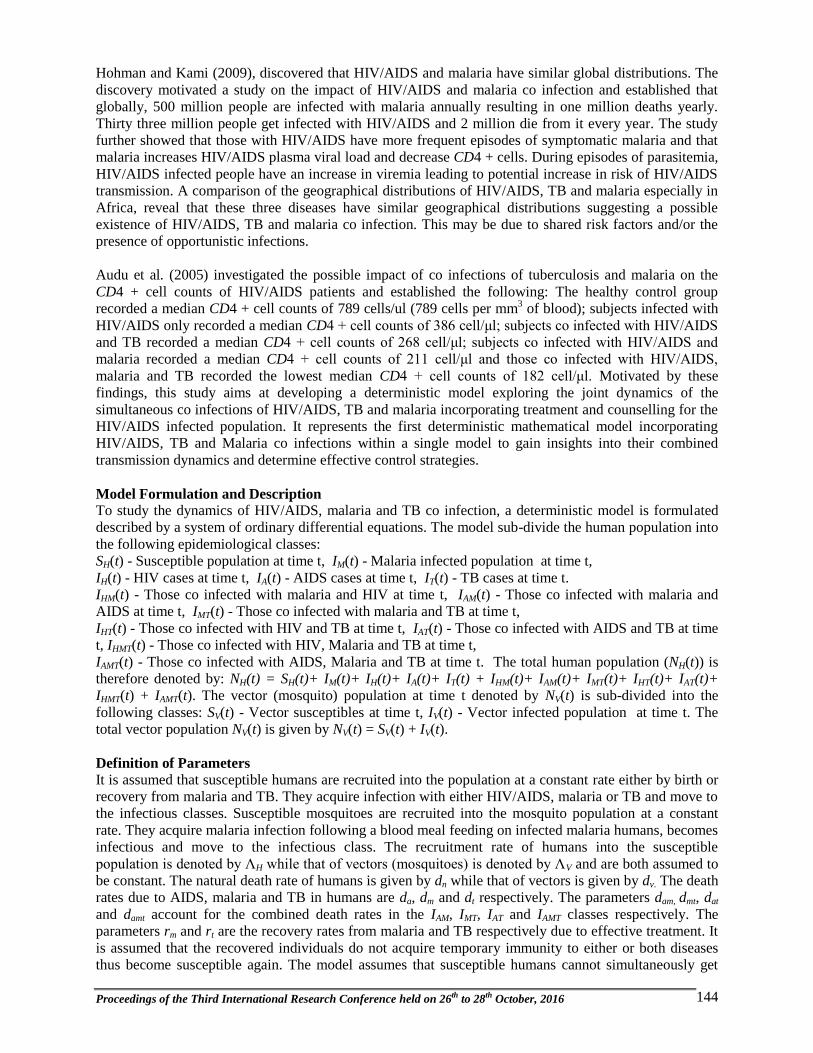
Proceedings of the Third International Research Conference held on 26th to 28th October, 2016 144
Hohman and Kami (2009), discovered that HIV/AIDS and malaria have similar global distributions. The
discovery motivated a study on the impact of HIV/AIDS and malaria co infection and established that
globally, 500 million people are infected with malaria annually resulting in one million deaths yearly.
Thirty three million people get infected with HIV/AIDS and 2 million die from it every year. The study
further showed that those with HIV/AIDS have more frequent episodes of symptomatic malaria and that
malaria increases HIV/AIDS plasma viral load and decrease CD4 + cells. During episodes of parasitemia,
HIV/AIDS infected people have an increase in viremia leading to potential increase in risk of HIV/AIDS
transmission. A comparison of the geographical distributions of HIV/AIDS, TB and malaria especially in
Africa, reveal that these three diseases have similar geographical distributions suggesting a possible
existence of HIV/AIDS, TB and malaria co infection. This may be due to shared risk factors and/or the
presence of opportunistic infections.
Audu et al. (2005) investigated the possible impact of co infections of tuberculosis and malaria on the
CD4 + cell counts of HIV/AIDS patients and established the following: The healthy control group
recorded a median CD4 + cell counts of 789 cells/ul (789 cells per mm3 of blood); subjects infected with
HIV/AIDS only recorded a median CD4 + cell counts of 386 cell/μl; subjects co infected with HIV/AIDS
and TB recorded a median CD4 + cell counts of 268 cell/μl; subjects co infected with HIV/AIDS and
malaria recorded a median CD4 + cell counts of 211 cell/μl and those co infected with HIV/AIDS,
malaria and TB recorded the lowest median CD4 + cell counts of 182 cell/μl. Motivated by these
findings, this study aims at developing a deterministic model exploring the joint dynamics of the
simultaneous co infections of HIV/AIDS, TB and malaria incorporating treatment and counselling for the
HIV/AIDS infected population. It represents the first deterministic mathematical model incorporating
HIV/AIDS, TB and Malaria co infections within a single model to gain insights into their combined
transmission dynamics and determine effective control strategies.
Model Formulation and Description
To study the dynamics of HIV/AIDS, malaria and TB co infection, a deterministic model is formulated
described by a system of ordinary differential equations. The model sub-divide the human population into
the following epidemiological classes:
SH(t) - Susceptible population at time t, IM(t) - Malaria infected population at time t,
IH(t) - HIV cases at time t, IA(t) - AIDS cases at time t, IT(t) - TB cases at time t.
IHM(t) - Those co infected with malaria and HIV at time t, IAM(t) - Those co infected with malaria and
AIDS at time t, IMT(t) - Those co infected with malaria and TB at time t,
IHT(t) - Those co infected with HIV and TB at time t, IAT(t) - Those co infected with AIDS and TB at time
t, IHMT(t) - Those co infected with HIV, Malaria and TB at time t,
IAMT(t) - Those co infected with AIDS, Malaria and TB at time t. The total human population (NH(t)) is
therefore denoted by: NH(t) = SH(t)+ IM(t)+ IH(t)+ IA(t)+ IT(t) + IHM(t)+ IAM(t)+ IMT(t)+ IHT(t)+ IAT(t)+
IHMT(t) + IAMT(t). The vector (mosquito) population at time t denoted by NV(t) is sub-divided into the
following classes: SV(t) - Vector susceptibles at time t, IV(t) - Vector infected population at time t. The
total vector population NV(t) is given by NV(t) = SV(t) + IV(t).
Definition of Parameters
It is assumed that susceptible humans are recruited into the population at a constant rate either by birth or
recovery from malaria and TB. They acquire infection with either HIV/AIDS, malaria or TB and move to
the infectious classes. Susceptible mosquitoes are recruited into the mosquito population at a constant
rate. They acquire malaria infection following a blood meal feeding on infected malaria humans, becomes
infectious and move to the infectious class. The recruitment rate of humans into the susceptible
population is denoted by ΛH while that of vectors (mosquitoes) is denoted by ΛV and are both assumed to
be constant. The natural death rate of humans is given by dn while that of vectors is given by dv. The death
rates due to AIDS, malaria and TB in humans are da, dm and dt respectively. The parameters dam, dmt, dat
and damt account for the combined death rates in the IAM, IMT, IAT and IAMT classes respectively. The
parameters rm and rt are the recovery rates from malaria and TB respectively due to effective treatment. It
is assumed that the recovered individuals do not acquire temporary immunity to either or both diseases
thus become susceptible again. The model assumes that susceptible humans cannot simultaneously get

Proceedings of the Third International Research Conference held on 26th to 28th October, 2016 145
infected with malaria, HIV/AIDS and TB since the transmission mechanics are completely different for
the three diseases. The model further assumes that humans acquire HIV/AIDS through sexual contacts
between an infective and a susceptible. The average force of infection for HIV/AIDS denoted λah is given
by
where βa is the average transmission probability of HIV/AIDS between an infective and a susceptible per
sexual contact and c1 is the per capita number of sexual contacts of susceptible humans with HIV/AIDS
infected individuals per unit time. The parameter δ measures the effectiveness of counselling through
condom use and a reduction in the number of sexual partners, where 0 ≤ δ ≤ 1. Effective counselling
reduces the value of the parameter c1. The model assumes that the classes IHMT, IA, IAM, IAT and IAMT do not
transmit the virus due to acute ill health and noticeable AIDS symptoms. Define α1 as the number of bites
per human per mosquito (biting rate of mosquitoes), βm as the transmission probability of malaria in
humans per bite thus the force of infection with malaria for humans, denoted λmh is given by
Whereas the average force of infection with malaria for vectors, denoted λmv is given by
where βv is the transmission probability of malaria in vectors from any infected human.
Finally the average force of infection for TB denoted λth is given by:
where βt is the transmission probability of TB in humans and c2 is the average per capita contact rate of
susceptible humans with TB infected individuals. The rate of progression from HIV to AIDS for the
untreated HIV cases is p. The parameters θ1p, θ2p and θ3p account for increased rates of progression to
AIDS for individuals co infected with HIV - TB, HIV - malaria and HIV - malaria - TB respectively
where θ1 < θ2 < θ3. Define α as the proportion of the HIV/AIDS infected population receiving effective
treatment. This involves the administration of ARV‘S that keeps the HIV patients from progressing to
AIDS while transferring the AIDS patients back to the HIV classes. The modification parameters ehm, e
ht
and ehmt account for the reduced susceptibility to infection with HIV for individuals in the IM, IT and the
IMT classes respectively due to reduced sexual activity as a result of ill health where ehm < 1, e
ht < 1, e
hmt
≪ 1. The parameters em
a , em
h , em
ht, em
at, account for the increased susceptibility to infection with
malaria for individuals already infected with AIDS, HIV, HIV - TB and AIDS - TB respectively due to
suppressed immune system where em
a > 1, em
h > 1, em
ht > 1, em
at > 1. It is also clear that em a < e
mat and
em
h < em
ht. The parameters eth, e
ta, e
tmh, and e
tam account for the increased susceptibility to infection with
TB for individuals already infected with HIV, AIDS, HIV malaria and AIDS - malaria respectively due to
suppressed immune system where eth > 1, e
ta > 1, e
thm > 1, e
tam > 1. Again e
th < e
thm and e
ta < e
tam.
Malaria and TB does not lead to the depletion of the CD4+ cell counts, however their association with
HIV/AIDS leads to a significant reduction in the CD4 + cell counts within an individual leading to faster
progression to AIDS.
The Model Equations
Combining all the aforementioned assumptions and definitions, the model for the transmission dynamics
of HIV/AIDS, TB and malaria is given by the following system of differential equations:

Proceedings of the Third International Research Conference held on 26th to 28th October, 2016 146
Positivity and Boundedness of Solutions
The model system 2.2.1 describes living populations therefore the associated state variables are non-
negative for all time t ≥ 0. The solutions of this model with positive initial data therefore remain positive
for all time t ≥ 0.

Proceedings of the Third International Research Conference held on 26th to 28th October, 2016 147
We can proceed in a similar manner and show that all the state variables are positive for all time t.
Lemma 3.2. The solutions of the model 2.2.1 are uniformly bounded in a proper subset
Ψ = ΨH × ΨV
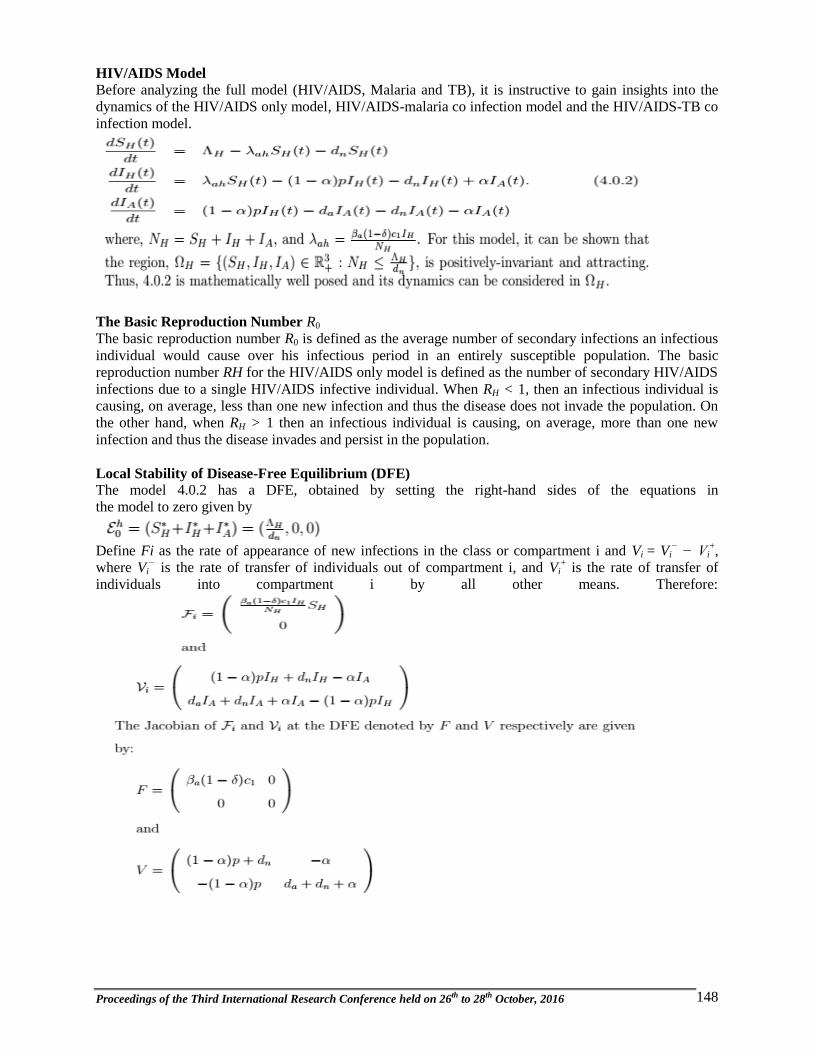
Proceedings of the Third International Research Conference held on 26th to 28th October, 2016 148
HIV/AIDS Model
Before analyzing the full model (HIV/AIDS, Malaria and TB), it is instructive to gain insights into the
dynamics of the HIV/AIDS only model, HIV/AIDS-malaria co infection model and the HIV/AIDS-TB co
infection model.
The Basic Reproduction Number R0
The basic reproduction number R0 is defined as the average number of secondary infections an infectious
individual would cause over his infectious period in an entirely susceptible population. The basic
reproduction number RH for the HIV/AIDS only model is defined as the number of secondary HIV/AIDS
infections due to a single HIV/AIDS infective individual. When RH < 1, then an infectious individual is
causing, on average, less than one new infection and thus the disease does not invade the population. On
the other hand, when RH > 1 then an infectious individual is causing, on average, more than one new
infection and thus the disease invades and persist in the population.
Local Stability of Disease-Free Equilibrium (DFE)
The model 4.0.2 has a DFE, obtained by setting the right-hand sides of the equations in
the model to zero given by
Define Fi as the rate of appearance of new infections in the class or compartment i and Vi = Vi
− − Vi
+,
where Vi− is the rate of transfer of individuals out of compartment i, and Vi
+ is the rate of transfer of
individuals into compartment i by all other means. Therefore:

Proceedings of the Third International Research Conference held on 26th to 28th October, 2016 149
It measures the average number of new HIV infections generated by a single HIV/AIDS infected
individual in a population where a certain fraction of infected individuals are treated and counselled.
Lemma 4.1.1: The DFE of the HIV Model is locally asymptotically stable (LAS) if RH < 1, and unstable
otherwise.
Lemma 4.1.1 follows from Theorem two by Van, P. and Watmough, J. (2002). This lemma is illustrated
graphically in figure 1 showing total infected population (IH + IA) against time in years, with RH =
0.517234.
Figure 1: HIV/AIDS local disease free equilibrium

Proceedings of the Third International Research Conference held on 26th to 28th October, 2016 150
Simulating the Role of Counseling and Treatment
From equation 4.1.1, it is evident that strategies for the reduction of HIV/AIDS infections in humans
should target the reduction of the parameter c1 (per capita number of sexual contacts) through counseling.
Effective counseling where δ = 1, reduces the value of c1 and RH to zero eliminating the HIV/AIDS
problem. The graph of RH against c1 is shown in fig 2.
Figure 2: The role of treatment and counseling (α = 0 .6)
Figure 2 shows that effective counseling (δ = 0 .9) reduces the value of RH to less than unity and
therefore very effective in controlling the HIV/AIDS problem.
Figure 3 combines the parameters for ARV treatment (α) and counseling (δ) within the same graph. The
graph shows that ARV treatment without effective counseling (α = 0.6 and δ = 0), increases the value of R
H, worsening the HIV/AIDS problem. However ARV treatment coupled with effective counseling (α =
0.6 and δ = 0.9) reduces the value of RH to a level below one eliminating the disease. This figure suggests
that there is a threshold level of counseling below which ARV treatment is disastrous. Above the
threshold level, ARV treatment and counseling would be very effective.
Figure 3: Simulation result of RH against per capita number of sexual contacts ( c1)
When the proportion of those receiving ARV treatment without effective counseling increases, the value
of RH also increases to a level above one, however effective counselling maintains the value of RH below
unity as shown in figure 4. Therefore strategies for the control of HIV/AIDS should emphasize counseling
and not only treatment.

Proceedings of the Third International Research Conference held on 26th to 28th October, 2016 151
Figure 4: Simulation result of RH against per capita number of sexual contacts (c1)
To further investigate the potential impact of counseling and treatment on disease progression, we carry
out sensitivity analysis of the reproduction number with respect to counselling and treatment. The
sensitivity index of RH with respect to δ is given by:
The negative sign in equation 5.0.2 indicates that there is an expected decline in the rate of new
HIV/AIDS infections when counseling is scaled up. Similarly, The sensitivity index of RH with respect to
α is given by:
Numerical simulations shows that the sensitivity index of RH with respect to treatment is positive
indicating that an increase in the proportions of those treated leads to an increase in new HIV cases as
shown in figure 5.
Figure 5: Simulation result of the sensitivity index of RH with respect to treatment
Biologically, lemma 4.1.1 implies that HIV/AIDS can be eliminated from the community when RH < 1.
This is only true if the initial sizes of the sub-populations of the model are in the basin of attraction of:

Proceedings of the Third International Research Conference held on 26th to 28th October, 2016 152
To ensure that elimination of the virus is independent of the initial sizes of the sub-populations, it is
necessary to show that the DFE is globally asymptotically stable.
Global Stability of Disease-Free Equilibrium (DFE)
The global asymptotic stability (GAS) of the disease-free state of the model is investigated using the
theorem by Castillo-Chavez et al. (2002). The model is rewritten as follows:
where the components of the column-vector X ∈ Rm denote the uninfected population and
the components of Z ∈ Rn denote the infected population. E
0 = (X⋆, 0) denotes the disease free equilibrium
of this system. The fixed point E0 = (X ∗, 0) is globally asymptotically stable (GAS) equilibrium for this
system provided that R0 < 1 and the following two conditions satisfied:
Theorem 5.1. The fixed point E0 = (X ∗, 0) is a globally asymptotically stable equilibrium of system 4.0.2
provided that RH < 1 and the assumptions H1 and H2 are satisfied.
Notice that G = (X, Z) ≥ 0 in ΩH. Therefore the DFE of model 4.0.2 is globally asymptotically stable if
RH < 1. This shows that HIV/AIDS will be completely eliminated from the community if the
epidemiological threshold, RH can be brought to a value less than unity independent of the initial sizes of
the sub-populations as shown numerically in figure 6.
Figure 6: Numerical simulation of the global stability of the disease free equilibrium
Existence and Stability of the Endemic Equilibrium
To find conditions for the existence of an equilibrium for which HIV/AIDS is endemic in the population,
the steady states of the system 4.0.2 are determined by solving
The equations for the population proportions are considered by first scaling the sub-populations for SH, IH
and IA using the following set of new variables: SH

Proceedings of the Third International Research Conference held on 26th to 28th October, 2016 153
Setting the right hand sides of the mo del 4.0.2 to zero and noting that

Proceedings of the Third International Research Conference held on 26th to 28th October, 2016 154
This endemic equilibrium is illustrated in figure 7 showing the total infected population against time in
years.
Figure 7: The global stability of the endemic equilibrium, RH = 1 .03447.
Lemma 6.1. The HIV model 4.0.2 has a unique endemic equilibrium whenever RH >1, and no endemic
equilibrium otherwise.
When an endemic equilibrium point of a disease is unique and stable, then we would expect easier
management of the disease because there is no bifurcation and therefore reducing the value of RH to less
than one eliminates the disease. In summary, the HIV Model 4.0.2 has a globally-asymptotically stable
DFE whenever RH > 1, and a unique endemic equilibrium point whenever RH > 1. This study shows that
effective counseling reduces the value of the reproduction number for HIV/AIDS (RH) to less than unity
eliminating the HIV/AIDS problem. When the proportion of those receiving ARV treatment without
effective counseling increases, the value of RH also increases to a level above one, however effective
counseling maintains the value of RH below unity therefore strategies for the control of HIV/AIDS should
emphasize counseling and not only treatment.

Proceedings of the Third International Research Conference held on 26th to 28th October, 2016 155
ACKNOWLEDGEMENTS
The authors are very grateful to Dr. Ochieng Ombaka (Chuka University, Department of Physical
sciences) for many excellent comments that have enhanced the model as well as the clarity of the paper.
REFERENCES
Abu-Raddad, L.J., Patnaik, P. and Kublin, J.G. (2006). Dual infection with HIV/AIDS and malaria fuels
the spread of both diseases in Sub-Saharan Africa, Science 314(5805): 1603-1606.
Allman, E.S. and Rhodes, J.A. (2004). An introduction to mathematical models in biology, New York:
Cambridge University Press, 365-382.
Anderson, R.M and May, R.M. (1993). Infectious diseases of humans: Dynamics and control, Oxford
University Press: United Kingdom, 114 - 513.
Audu, R.A., Onwujekwe, D.I, Onubogu, C.C., Adedoyin, J.A., Onyejepu, N., Mafe, A.G., Onyewuche, J.,
Oparaugo, C., Enwuru, C., Aniedobe, M., Musa, A.Z. and Idigbe, E.O. (2005). Impact of co
infections of tuberculosis and malaria on the CD4+
cell counts of HIV/AIDS patients in Nigeria,
Annals of African Medicine, 4(1): 10-13.
Bernoulli, D. (1766), Essai d`une. nouvelle analyse de la mortalite causee par la petite verole et des
avantages de l`inoculation pour la prevenir, in memoires de mathematiques et de physique,
Academie Royale des Sciences, Paris, 11-235.
Bhunu, C., Garira, W. and Mukandavire, Z. (2009). Modeling HIV/AIDS and tuberculosis co infection,
Bulletin of Mathematical Biology, 71: 1745–1780.
Centre for Disease Control and Prevention (CDC), (2007). Incorporating HIV prevention into the medical
care of persons living with malaria: MMWR 2006; 55 (No. RR-14):1-17.
http:www.cdc.gov/malaria/facts.htm, Accessed on August, 22nd,
2013.
Diekmann, O. and Heesterbeek, J. (2000). Mathematical epidemiology of infectious diseases. Chichester:
Wiley, 28(4): 365-382.
Chuncky, C.K. (2012). Modeling the transmission dynamics of HIV/AIDS-malaria co infection with
treatment: Published Msc. Dissertation, University of Dar es Salaam. Tanzania, 35-88.
French, N., Nakiyingi, J., Lugada, E., Watera, C., Whitworth, J. and Gilks, C. (2001). Increasing rates of
malarial fever with deteriorating immune status in HIV-1 infected Ugandan adults. AIDS
Bulletin, 15: 899-906.
Granich, R.M., Gilks, C.F., Dye, C., Decock, K.M. and William, B.G. (2008), Universal voluntary HIV
testing with immediate antiretroviral therapy as a strategy for elimination of HIV transmission,
Journal of Mathematical Biology, 28(1): 365–382.
Hamer, W. H. (1906). Epidemic disease in England, Lancet 1, England, 234-423.
Hohman, S. and Kim, K. (2009). The impact of HIV and malaria co infection: What is known and
suggested avenues for further study, Interdisciplinary perspectives on infectious diseases,
201(8):617-654.
Kamal, B., David, M., Svetlana, R., Ana, M., Tameru. F. and Sharquetta, T. (2007). Mathematical model
of HIV and malaria co infection in Sub-Saharan Africa, Alabama State University: USA, AL(5):
361-371.
Kermack, W. O. and Mckendric, A.G. (1927). Contributions to the mathematical theory of epidemics,
part 1, Proc. R. Sec., London, A115: 700-721.
Kirschner, D. (1999). Dynamics of co infection with Mycobacterium tuberculosis and HIV-1. Theory of
Population Biology, 55: 94-109.
Kivihya, L., Ochola, J., Otieno, G. and Muthami L. (1994). Clinical and immunological markers in
Kenyan pulmonary tuberculosis patients with and without HIV-1, East African Medical Journal,
71(24): 373-375.
Kramer, A., Mirjam, K. and Klaus, K. (2010). Modern infectious disease epidemiology. In: Springer
(Ed.). Statistics for biology and health, Science and Business Media, Germany LLC. 210-219.
Lih-Ing, W. R., Zhilan, F. and Carlos, C. (2009). Modeling TB and HIV co infections, Mathematical
Biosciences and Engineering, 6(4): 815–837.
Lima, V.D, Johnston, K., Hogg, S.R., Harrigan, P.R., Anema, A. and Montaner, J.S. (2008). Expanded
access to highly active anti-retroviral therapy - A potentially powerful strategy to curb down the
growth of HIV epidemic, American Journal of Infectious Diseases, 198:59-67.

Proceedings of the Third International Research Conference held on 26th to 28th October, 2016 156
Martin, D., Sim, J. and Sole, G. (1995). CD4+
lymphocyte count in African patients co infected with HIV
and tuberculosis, Journal of Acquired Immune Deficiency Syndrome, 8, 386 - 391.
Mckendric, A.G. (1926). Applications of mathematics to medical problems, Proceedings of Edinburgh
mathematical society, 44: 324 – 356.
Mukandavire, Z., Gumel, A., Garira, W. and Tchuenche, J.M. (2009). Mathematical analysis of a model
for HIV malaria co infection, Mathematical Biosciences and Engineering, 6(2):333-362.
Oluwaseun, S., Chandra, N. and Abba, B. 2008. Mathematical analysis of the transmission dynamics of
HIV/TB co infection in the presence of treatment. Mathematical Biosciences and Engineering, 1:
145–174.
Ronald, R. (1902). The Prevention of malaria, John Murray, London. 127 – 386.
S-F. Shu Schmitz (2000a). A mathematical model of HIV transimission in homosexuals with genetic
heterogenity, Journal of Theoretical Medicine,bf 2:285–296.
[70] S-F. Shu Schmitz (2000b). Treatment and vaccination against HIV/AIDS in homosexuals with
genetic heterogenity, Math. Biosci.,167:1–18.
Van, P. and Watmough, J. (2002). Reproduction numbers and sub-threshold endemic equilibria for
compartmental models of disease transmission. Mathematical Biosciences. 180: 29-48.
World Health Organization (WHO), (2008), Malaria and HIV interactions and their implications for
Public Health Policy, WHO Press, Geneva, Switzerland, 453 - 463.
World Health Organization (WHO), (2013), HIV - Associated TB facts: Challenges and key issues,
http://www.who.int/tb/challenges/hiv/, Accessed on 13th, August, 2013.
World Health Organization (WHO), (2014), The World Health Report; HIV/AIDS global maps, Global
prevalence of HIV/AIDS, malaria and tuberculosis, http://www.google.com/imgres?, Accessed
on 5th,
February, 2014.
Xiao, D. and Bossert, W.H. (2010). An intra-host mathematical model on interaction between HIV and
malaria, Bulletin of Mathematical Biology, 72(7): 1892-1911. ******
ULTRA-LOW NOISE FIBRE OPTIC SENSOR FOR LOW LIMIT OF DETECTION IN
AQUEOUS MEDIUM
Kirwa, A.T.1,3, Williams, N.H.2 and Grell, M.3
1Department of Physical Science, Chuka University, P. O. Box 109-60400, Chuka, Kenya. 2Centre for Chemical Biology, Department of Chemistry, University of Sheffield, S3 7HF Sheffield, United Kingdom
3Department of Physics and Astronomy, The University of Sheffield, Sheffield, United Kingdom.
Email: [email protected], M. Grell; [email protected], N.H. Williams; [email protected]
ABSTRACT
Water from some sources contains waterborne pollutants (e.g lead or cadmium cations) toxic to both
human beings and animals even at low concentrations. This calls for sensitive, low cost and portable
instruments that can be applied for on-site detection of these pollutants, e.g. ‘optrodes’ (optical sensors).
The limit of detection of existing optical sensors is still higher than the recommended safety standards,
which is attributed to the detector noise superimposed to the low level signal. In our quest to solve this
problem, we introduced a self- referenced evanescent wave optical fibre as a transducer, and a ‘light
balance’ with lock- in read- out for minimum noise levels. We coated a thin film of 1-(2-pyridylazo)-2-
naphthol as a Zn2+
sensitizer on a 2 cm stripped section of a 20 cm long sensing fibre optic and run
through a sample vessel. We report low noise levels of 64 nV due to lock-in detection and a lower LoD as
compared to earlier transducers. This was demonstrated with a clear signal response of ~10 μV from to
very low levels (50 nM) of dissolved Zn2+
. With suitable sensitizer, our transducer has a potential
application to field measurements of low concentrations of waterborne pollutants.
Keywords: Evanescent wave sensor, Lock-in detection, Dual beam detection, Noise level, 1-(2-
pyridylazo)-2-naphthol
INTRODUCTION
The levels of waterborne pollutant are important in guiding various countries to follow the set safety
standards (Organization, 2011) in provision of water to people and managing aquatic animals. This is
because some of the water pollutants, Cd2+
(Gunnlaugsson et al., 2004) and Hg2+
(Zhou et al., 2014) are
Proceedings of the Third International Research Conference held on 26th to 28th October, 2016 157
toxic even at low quantities. Recently in Lake Naivasha, which is an important source of fish to people
living in Lake Naivasha basin (Otachi et al., 2014), a shoal of fish deaths were reported and suspected to
have been caused by oxygen depletion (Njiru et al., 2015) due to algae bloom. This demonstrate clearly
the need for on-site portable techniques that can continuously monitor the levels of pollutants and relay
quantitative information to a central office for appropriate actions to be taken before a disaster occurs.
However, the output signal from existing spectrophotometers and hand-held portable instruments for
detecting waterborne pollutants is associated with Johnson noise from resistors within their internal
circuitry and shot noise due to their photodetectors (Pauchard et al., 2000). These instruments detect the
presence of waterborne pollutants by transducing the optical signal carrying the pollutant quantitative
information into an electrical signal. Therefore, with very low concentrations of pollutants in the sample,
the output signal is in a pool of noise and raise the limit of detection (LoD). In order to push the LoD
lower, researchers have developed a number of sensitive techniques based on atomic absorption
spectroscopy (Chiu et al., 2003), atomic emission spectroscopy (Xiong et al., 2006) and mass
spectroscopy (Wang et al., 2001) to detect these waterborne pollutants. These techniques require
expensive instrumentation (Liu et al., 2012) and prior separation and pre-concentration procedures (Citak
et.al. 2009) before analysis of samples. Due to these shortcomings, a number of cheaper and on site real
time analytical techniques for heavy metals dissolved in water have been reported; for instance, for
detection of dissolved Cu2+
in water with reported LoD 0.36 µM (Li et al., 2015) and for detection of Hg2+
with reported LoD 0.5 µM (Li et.al., 2014). However, LoD in these techniques are still higher than the set
safety standards (Organization, 2011) and need to be pushed down further.
As a solution to these shortcomings, we have demonstrated an evanescent wave fibre optic sensor (Tuwei
et al., 2016) based on lock-in detection to lower the LoD by improving signal to noise ratio. In this work,
we illustrated experimentally, how we have minimized both detector and source of light (LED, laser
diode) drift by introducing self-referencing technique. We also show how the low noise signal from Lock-
in detection translate into a lower LoD. Lock-in detection is achieved by using a digital lock-in amplifier,
which is configured (Medina-Rodriguez et al., 2014) to select the required signal at a specific frequency
of interest by the user from a spectrum of noise and more so for low level signals due to very low
concentration of dissolved water pollutants. Self-referencing was accomplished by a light balance circuits
(Hamamtsu, 2008) for low drift applications.
MATERIALS AND METHODS
A simplified block diagram for our designed low noise evanescent wave sensor based on fibre optic and
lock-in detection is shown in Fig. 1. A detailed designed procedure and instrumentation is documented in
(Tuwei et al., 2016). Basically, it consists of modulated source of light ie LED, beam splitter (BIF400-
VIS-NIR, Ocean Optics) and two photodetectors PD1 and PD2 (OSD5-5T, Centronic) connected such that
their output currents are subtracted electrically as indicated by R – S ie as “light balance circuit”
(Hamamtsu, 2008). Here, R and S are signals from reference and sample beams respectively. The
differential current ∆i, which carries the quantitative information for water pollutant, is conditioned by
current to voltage converter (i/v) (OPA380, Texas Instruments) and fed into the lock-in amplifier
(USBLockIn250, Anfatec) for processing and displayed to the user on a personal computer (PC). To zero-
in the instrument for 0 V output signal, we incorporated a grey wheel density filter (54079, Edmund
optics) into the sample beam to attenuate light when the two photodiodes are perfectly aligned to receive
equal light intensities.
For single detector mode, we removed photodetector PD1, reference beam and subtractor circuit (R–S)
and only work with a single photodetector (PD2) in the sample beam. There was no point of using the
filter, ND in this mode.
For drift and noise analysis, we modulated the LED (L-7113QBC-D, Kingbright) with an AC signal of
amplitude 3.6 V r.m.s from lock-in amplifier REF output and recorded the Lock-in vout DC signal using
LabVIEW routine. We then reduced the amplitude to 1.2 V and also recorded the Lock-in vout. Instead of
using the dual detector in our instrument (Tuwei et al., 2016), we used a single photodiode (OSD5-5T,

Proceedings of the Third International Research Conference held on 26th to 28th October, 2016 158
Centronic) in the sample beam without reference beam. The signal from sample beam was connected to
i/v converter and fed the resulting voltage into the lock-in amplifier for processing and recorded the Lock-
in vout.
Figure 1. Schematic of dual beam evanescent wave sensor based on fibre optic for waterborne pollutant
detection. A–Adder circuit, ND–Neutral density filter, PD1 and PD2 are photodetectors while PC–
personal computer. R–S is the subractor circuit where R is reference beam while S is the sample beam.
Finally, we fabricated a 20 cm long fibre where a 2 cm section was stripped in the middle and coated with
1-(2-pyridylazo)-2-naphthol (PAN) as described earlier (Tuwei et al., 2016). Then run though the sample
holder and light of λ = 555 nm from a modulated LED (SSL-LX5093PGD, Lumex) was propagated
through the fibre to probe the resulting complex between Zn2+
and PAN. We used a modulation of with
1.2 V and frequency of 5.641 kHz.
RESULTS AND DISCUSSION
Single verses Double Beam Detection
For a single detector, the signal drifted from 0.36 mV to 0.93 mV in 25 minutes, then stabilize as shown
figure 2 (blue curve). This mean the instrument should be run for 25 minutes before introducing a sample
for measurement. This is attributed to the temperature rise of the LED which is fabricated from InGaN
semiconductor. The increase in temperature increases the charge carriers with time until it reaches the
equilibrium concentration and levels off. It has noise levels of 0.0669 mV and this will raise the LoD. For
dual detection with the same LED and 50/50 beam splitter, there is no drift as can be seen clearly in figure
2 for 1.2 V modulation and noise levels of 0.0014 mV, which is ~ 48 times lower than in single detector.
However, there was a slight drift for 3.6 V modulation compared to the 1.2 V modulation signals in dual
detection. Therefore from this observation, dual detection with 1.2 V is adopted for sensing low
concentrations of waterborne pollutants in our sensor.
Modulation Amplitude
To account for the different results in 1.2 V and 3.6 V modulation in dual detection, we used the concept
of shot noise in a semiconductor. The number of photons reaching the two detectors per second is depend
on the modulation amplitude of the ac signal for a constant LED bias voltage, Vdc. Therefore, for 3.6 V
modulation amplitude, there are more photons reaching the detectors per second than in 1.2 V
modulation. Consequently, the shot noise in 3.6 V modulation is higher than in 1.2 V modulation and
causes more fluctuations as indicated in figure 3. The slight drift is suspected to be associated with PD1
receiving increasing photons per second continuously compared to PD2.
System Noise and Sensing of Waterborne Pollutants
To demonstrate how low noise in dual detection translate into lower LoD, we coated a thin film of 1-(2-
pyridylazo)-2-naphthol on a 2 cm stripped section of a 20 cm long sensing fibre optic as a Zn2+
sensitizer
and run through a sample vessel. Then titrated aliquots of Zn2+
solutions into sample vessel as described
earlier (Tuwei et al., 2016). Figure 4 (a) shows the dynamic response for a 50 nM and 100 nM aliquots of
Zn2+
solutions. The blank signal (part of the response between time 0 and 60 seconds before introducing
the 50 nM Zn2+
) is expanded as indicated in figure 4 (b) (Note the units on y-axis). The noise levels in the
blank signal is 64 nV and the signal response for the dissolved 50 nM Zn2+
is ~ 10 μV which is well
above the noise levels.

Proceedings of the Third International Research Conference held on 26th to 28th October, 2016 159
Figure 2. Designed evanescence wave sensor all the symbols in this schematic
The rise in signal in figure 4 (a) when 50 nM and 100 nM Zn2+
solution was titrated into the sample
holder is due to interaction of PAN with Zn2+
as detected by the instrument. In this case PAN and Zn2+
formed a complex with peak absorption λ that matched the λ of propagating light in the fibre optic.
Therefore the evanescent wave along the surface of the fibre optic is absorbed by the PAN + Zn2+
complex. The absorbed light in the sample beam is shown by a rise in the signal as observed.
Figure 3. Designed evanescence wave sensor all the symbols in this schematic
(a) (b)
Figure 4. Signal response of the sensitized fibre to 50 nM and 100 nM Zn2+
under (a) HEPES buffer and
(b) Blank signal

Proceedings of the Third International Research Conference held on 26th to 28th October, 2016 160
CONCLUSSION
Dual detection is better than using a single detector in sensors designed to detect low concentrations of
waterborne pollutants due to low drift. By introducing a self- referenced evanescent wave optical fibre as
transducer, and a ‘light balance’ with Lock-in read-out for minimum noise levels, we demonstrate a clear
signal response of ~ 10 μV from our instrument to very low levels (50 nM) of dissolved zinc cations. We
have also demonstrated noise level of a blank is 64 nV due to lock-in detection when measured within 60
seconds and 1.4 μV noise levels when a signal is measured for approximately 1 hour, which translates to
lower LoD from our approach.
ACKNOWLEDGEMENTS
The authors are grateful to Chuka University (Kenya) for granting study leave to the corresponding author
to go and pursue this project in The University of Sheffield, United Kingdom. We are also thankful to the
Commonwealth Scholarship Commission ((United Kingdom) in collaboration with The University of
Sheffield (Reg. No. KECS-2014-277) towards this work. The Kenyan Ministry of Education in Kenya is
also acknowledged for prioritising this project for funding.
REFERENCES Chiu, C. H., Sung, Y. H., and Huang, S. D. (2003). Simultaneous determination of manganese, iron and
cobalt in copper with a multi-element graphite furnace atomic absorption spectrometer.
Spectrochimica Acta Part B-Atomic Spectroscopy, 58(3), 575-580. doi:10.1016/s0584-
8547(02000271-9.
Citak, D., Tuzen, M., and Soylak, M. (2009). Simultaneous coprecipitation of lead, cobalt, copper,
cadmium, iron and nickel in food samples with zirconium(IV) hydroxide prior to their flame
atomic absorption spectrometric determination. Food and Chemical Toxicology, 47(9):2302-
2307. doi:10.1016/j.fct.2009.06.021.
Gunnlaugsson, T., Lee, T. C., and Parkesh, R. (2004). Highly selective fluorescent chemsensors for
cadmium in water. Tetrahedron, 60(49), 11239-11249. doi:10.1016/j.tet.2004.08.047.
Hamamatsu, (2008). Application Circuit Example of Si Photodiodes, Circuit in Fig 10, pg
43,https://www.hamamatsu.com/resources/pdf/ssd/si_pd_circuit_e.pdf (25.09.2016, 18:38
London time).
Li, G., Tao, F., Wang, H., Wang, L., Zhang, J., Ge, P., Sun, S. (2015). A novel reversible colorimetric
chemosensor for the detection of Cu2+ based on a water-soluble polymer containing rhodamine
receptor pendants. Rsc Advances, 5(24), 18983-18989. doi:10.1039/c5ra00745c.
Li, X., Su, X., Shi, Z., Cheng, X., Liu, S., and Zhao, Q. (2014). Highly selective and reversible
colorimetric detection of mercury ions by a hydrophilic cycloruthenated complex in water.
Sensors and Actuators B-Chemical, 201, 343-350. doi:10.1016/j.snb.2014.04.085.
Liu, T., Li, G., Zhang, N., and Chen, Y. (2012). An inorganic-organic hybrid optical sensor for heavy
metal ion detection based on immobilizing 4-(2-pyridylazo)-resorcinol on functionalized HMS.
Journal of Hazardous Materials, 201, 155-161. doi:10.1016/j.jhazmat.2011.11.060.
Medina-Rodriguez, S., de la Torre-Vega, A., Fernando Fernandez-Sanchez, J., and Fernandez-Gutierrez,
A. (2014). Evaluation of a simple PC-based quadrature detection method at very low SNR for
luminescence spectroscopy. Sensors and Actuators B-Chemical, 192, 334-340.
doi:10.1016/j.snb.2013.10.131.
Njiru, J., Morara, G., Waithaka, E. and Mugo, J. (2015). Fish kills in lake Naivasha, Kenya: What was the
probable cause?. International Journal of Fisheries and Aquatic Studies, 3(1), 179-184.
(29.09.2016, 18:00 London time).
http://www.fisheriesjournal.com/archives/2015/vol3issue1/PartC/2-5-50.pdf
Organization, W. H. (2011). Guidelines for drinking-water quality.
Otachi, E. O., Magana, A. E. M., Jirsa, F., and Fellner-Frank, C. (2014). Parasites of commercially
important fish from Lake Naivasha, Rift Valley, Kenya. Parasitology Research, 113(3), 1057-
1067. doi:10.1007/s00436-013-3741-4.
Pauchard, A., Furrer, B., Randjelovic, Z., Rochas, A., Manic, D., and Popovic, R. S. (2000). Integrated
microsystem for blue/UV detection. Sensors and Actuators a-Physical, 85(1-3):99-105.
doi:10.1016/s0924-4247(00)00332-0.

Proceedings of the Third International Research Conference held on 26th to 28th October, 2016 161
Tuwei, A.K., Williams, N.H. and Grell, M. (2016). Fibre optic absorbance meter with low limit of
detection for waterborne cations, Sensors and Actuators B-Chemical, 237:1102-1107. doi:
10.1016/j.snb.2016.05.065.
Wang, J. H., Hansen, E. H., and Gammelgaard, B. (2001). Flow injection on-line dilution for multi-
element determination in human urine with detection by inductively coupled plasma mass
spectrometry. Talanta, 55(1), 117-126. doi:10.1016/s0039-9140(01)00397-6.
Xiong, C. M., Jiang, Z. C., and Hu, B. (2006). Speciation of dissolved Fe(II) and Fe(III) in environmental
water samples by micro-column packed with N-benzoyl-N-phenylhydroxylamine loaded on
microcrystalline naphthalene and determination by electrothermal vaporization inductively
coupled plasma-optical emission spectrometry. Analytica Chimica Acta, 559(1):113-119.
doi:10.1016/j.aca.2005.11.051.
Zhou, Y., Dong, H., Liu, L., Li, M., Xiao, K. and Xu, M. (2014). Selective and sensitive colorimetric
sensor of mercury (II) based on gold nanoparticles and 4-mercaptophenylboronic acid. Sensors
and Actuators B-Chemical, 196, 106-111. doi:10.1016/j.snb.2014.01.060. ******
CODEREPO: A LOCAL ONLINE REPOSITORY FOR SOURCE CODES AND COMPUTING
RESEARCH PROJECTS
Tuei, K.K.
Chuka University, P. O. Box 109-60400, Chuka; and P. O. Box 15964-20100, Nakuru, Kenya
Mobile: +254712838653, [email protected]
ABSTRACT
Open Source Software are fast becoming popular and threatening to overtake the conventional
commercial applications. The convenience offered by open source applications is ease of access,
learning, download and vast communities of users who collaboratively and instinctively help other users
solve issues while using software. Technology enthusiasts, practitioners, programmers, software
engineers and even end users with minimal computer literacy find it easier to try out a software without
the restrictions of time that come with trials of commercial software. Improving on open source software
is key towards the viability of that product in the market as it progresses in time in the ever dynamic IT
industry. The proliferation of users on a web-based version-control and collaboration platform for
developers such as GitHub is evidence enough that even modern age software developers have moved
from re-inventing the wheel by coding from scratch to forking repositories to have a starting point for
their own ideas. A local repository for source codes would help local developers be more efficient in
their software projects, save time on completing them and also share ideas with other like-minded
developers that would help solve specific local problems or use technology to bridge gaps as well as
avoid redundancy in terms of starting out on a project that has already been done by another developer
and ultimately attain sustainable development. CodeRepo is a web-based repository that allows local
developers to deploy a localized repository to register and post links to their code repositories or create
one as well as have a forum to network local developers.
Keywords: Open Source, Localized, Networking, Software Development
INTRODUCTION Libraries are filled with books and theses, there is even proliferation of books, theses and research
materials in digital form disseminated in form of institutional repositories. Source Codes from open
source software as well as commercial software are also being kept in such a similar manner. The only
difference is that book versions do not change rapidly as source codes hence they cannot be stored and
disseminated in such a similar manner. Let us clearly put the terms repository, software repository and
source code repository into perspective before delving any deeper. A repository refers to a central place
where data is stored and maintained. It can be a place where multiple databases or files are located for
distribution over a network, or a repository can be a location that is directly accessible to the user without
having to travel across a network. [1] A software repository is a storage location from which software
packages. These packages can be accessed and installed on a computer. Whereas, a source code
repository is a file archive and web hosting facility where large amounts of source code for software, but

Proceedings of the Third International Research Conference held on 26th to 28th October, 2016 162
also for web pages are kept, either publicly or privately. They are also often used by open source projects
and multi-developer projects to handle various versions. [2]
This paper aims to explain the concept of open sourcing source code and software combined with linking
them to a one-stop shop repository that undergoes multiple redundant backups and acts as a central source
of computing research projects that are churned out locally by professors, lecturers and especially
students. Open Source is the term that is used to denote software whose source code is freely available
and accessible to anyone for assessment, enhancement and/or modification. Source code is the section of
software that is normally available only to the persons who developed the software. It is the part that
programmers manipulate in order to change how part or whole of the program works. [6]. The paper is a
concept which can be implemented as a platform or portal to solve the multi-faceted needs of a developer
and researcher in the computing field.
Motivation Each and every year undergraduate students and researchers come up with noble pieces of software as
well as concepts for great software such as the one explained in this paper. But they are just kept or stored
haphazardly or using ‘stone-age’ methodologies of burning them onto Compact Disks (CDs) and Digital
Versatile Disks (DVDs). This may have worked well a decade ago but the computing universe is
dynamically changing and at a rapid pace and institutions of research and higher learning need to play
catch up or else they will just be churning out graduates with multi-million ideas but end up gathering
dust somewhere as they trek looking to be employed. Globally there are several top source code
repository hosts such as Bit bucket, Cloud forge, Source Forge, Launchpad, Google Code, Assembla,
Codeplex, Codebase just to name but a few. [3]
The M-PESA innovation which is a novel Kenyan idea [4] where cash is sent and received through
mobile devices are just but a drop in the ocean of ideas that Kenyan software developers have. As at
August 2013, the number of users on GitHub that listed themselves as located in Africa was 4,527 out of
roughly over 3,850,000 users on GitHub then with Kenya accounting for 9.75% of the GitHub users then.
[5]. Considering that GitHub is one of the most popular source code repository and version control
systems that would be a warring statistics considering that was Africa alone. According to a study done in
2015, the number of users on Facebook in Nigeria and Kenya alone was nearly 20 million with Facebook
posting 20% growth in the number of users from 100,000,000 users to 120,000,000 users over a period of
one year. Nigeria boasts of 15,000,000 active monthly users, South Africa has 12,000,000 and Kenya
4,500,000 with 95% of those numbers accessing their profiles using mobile devices. By analyzing the
percentages alone this means that Africans are spending a significant amount of time on the web, the
question of constructive web time is a whole research topic in itself. [6]
Through these numbers we can infer that this concept is feasible because each year the number of IT
graduates from several Kenyan universities who come out to seek employment especially in Kenya’s
silicon valleys can be employers by their own right as the field requires novel ideas and well-articulated
software proposals, implementations and documentation.
SYSTEM DESIGN A. Case Scenario
To demonstrate the workability of this concept, consider the following case scenario. A Computer
Science student is required to actually come up with a novel software as part of the undergraduate and in
some cases postgraduate degrees. In the present scenario:
1. A student comes up with a software proposal which he/she presents to the supervisor.
2. The supervisor analyzes the proposal and if he/she deems it fit for implementation allows the student
to do further research and subsequent implementation of the same.
3. The supervisor periodically checks the students’ progress on the student’s computer and provides
advice where necessary on the features to add or remove.
4. Upon successful implementation, the supervisor allows the student to come up with appropriate
documentation for the software the student has developed.

Proceedings of the Third International Research Conference held on 26th to 28th October, 2016 163
5. The student then presents his/her work to a panel of lecturers for assessment.
6. After successful completion of presentation and submission of pre-requisite documentation and the
software written onto a disk as evidence of work done the student can graduate.
If a CodeRepo had been implemented in an institution the steps would be:
1. A student searches against various local source code repositories to check whether his/her idea has
already been thought of by another researcher and/or implemented by a developer.
2. If the idea is new and unimplemented, then he or she can come up with a software proposal for the
same, the supervisor analyzes the proposal and if he/she deems it fit for implementation allows the
student to do further research and subsequent implementation of the same and come up with a new
page on the repository as a canvas for implementing the new idea.
3. If the idea is found to have already been implemented, the student can suggest a significant
improvement to the idea and hence be allowed to come up with a newer version of the code in the
repository whilst maintaining the older version and under supervision
4. Upon successful implementation, the supervisor allows the student to come up with appropriate
documentation for the software the student has developed and upload them together with the code that
was being incrementally added onto the repo.
B. Tool Design
The CodeRepo can be initially implemented as a secure web-based database for all local software
developed by an institution coupled with links to the source code repository that hosts the particular
software and has the profile details of the developer who initially developed the software. This would be
similar to a digital institutional repository that host the theses for all post graduate students from a
particular department, faculty or institution. The next phase would actually be implemented the features
of a source code repository host which are development tools, track and review changes, version control,
comments on code, issue tracking, collaboration and discussion forums.
C. Hierarchy Chart Design
SYSTEM MERITS
1. Incremental Software Portfolio Creation
CodeRepo users will be able to continually exercise their software development skills by not only
completing a number of software projects but also improving on previously created software and
attaching their profiles to it.
2. Standardization of Software Development and Improvement Processes
By involving all stakeholders in the sector, privacy policies, code submission policies and code
improvement policies can be development to ensure that students adhere to the standards in the

Proceedings of the Third International Research Conference held on 26th to 28th October, 2016 164
software market even before they are inducted into to it and this will ensure a steady and hassle free
transition from the learning environment to the software development market.
3. Save on Development time through code Sharing
By implementing CodeRepo, users within the platform will share code, get to find more efficient code
than they have and eventually avoid reinventing the wheel and save on crucial development time
especially on time sensitive software development projects. Users will also be able to collaborate
through forums and chat widgets thus help each other solve problems and bridge the gap.
4. Avoidance of Redundancy in Software Development
Just as plagiarism is a menace in other areas of education and writing so is redundancy in software
development since there is no economic and intellectual gain in creating a solution that is already
there. Therefore, the only brilliant move would be to improve on it significantly. Since CodeRepo
would allow students and supervisors to search through software titles on software developed in
institutions of higher learning and in software development companies, it would save developers from
turning into what is termed in hacking as script kiddies to adding value on current software since the
only acceptable redundancy is in data back up and fault tolerance.
5. Global Availability of Code
Imagine being able to access source code from any device and also an online backup of what is
available on the computer on which the software is being developed. Developers have been at times
devastated when all their work goes down the drain due to computer crashes and power failures. But
having CodeRepo integrated to popular Integrated Development Environments as a plugin would
allow developers and researchers to come up with software programs and concepts that are available
even when they are on the move.
6. Ease of seeking funding
Through inclusion of all stakeholders, developers would not have to travel to major cities to seek
startup funding, seed funding or any other kind of funding since the investors will be onboard and all
they would have to do is do a search on software projects related to the area in which they provide
funding, analyze its feasibility and contact the developers who create and improve on the software or
research to do an online or a face-to-face pitch for funding.
7. Ability to sustain long-term software development and refinement
It would be much easier to initiate students and researchers into collaborating in long-term software
development without necessarily having to group them together and placing them on a short-term
crash course on software development as a team. Computing researchers and developers are more
likely to gel and develop chemistry with one another on a long-term software development and
refinement process than in a short one. CodeRepo would facilitate a platform for such endeavours.
IMPLEMENTATION CHALLENGES
1. Change Acceptance
For the success of any project especially in software development, user acceptance is key to
determining the growth and success of the project. As more users get into the platform and reap the
benefits that is when it would be easy to initiate change in the way the software development process
is done locally. Developers are more inclined to following their intuition and drive rather than a set of
standards.
2. Copyright and Patent Issues
Developers and researchers would want to clearly state that any developer who would wish to copy
part or all of his/her code to seek permission and acknowledge him/her as the owner of the code. This
would be easy in a theoretical writing setting but what happens when the code is copied and the
software is packaged in a different user interface and sold? These would deem as a non-issue for open
source software though since the developers have allowed any one to copy and improve on the code.
3. Funding the CodeRepo implementation process
It is evident that such a project would be enormous and would require a group of developers on a full
time basis to continually update the platform, track issues and bugs and ensure that search algorithms
work perfectly. Budgeting for developers, space, internet and such would require funding and thus
cannot be implanted without funds.

Proceedings of the Third International Research Conference held on 26th to 28th October, 2016 165
CONCLUSION
There are many brilliant ideas that may or may not have been implemented, performing a search on a
search engine would not necessarily do a search on the minds of every developer out there. Thus a
platform on which developers can bring their ideas to life would be such a life saver and ultimately help
in achieving Sustainable Development Goals. It will incline developers and researchers towards thinking
of the local challenges that are there and using totally new or globally implemented, tested and proven
methodologies to create sustainable solutions for a better future.
Strength in unity and key in diversity is what CodeRepo is pegged on. Collaborate in software
development to achieve more and be unique in your own way and let other researchers and developers
help refine your idea and aim it towards the ‘bull’s eye’ of success. There is no need to recreate what has
been already implemented, the real need is to customize it to solve the local problems and challenges.
Kenya is a hub of innovation as a whole and there are a lot more ‘innovation hubs’ in the minds of young
enterprising citizens ready to be tapped than in office spaces which are limited to physical locations.
Therefore, ideas with such great potential require a global platform on which they will be nurtured to
grow and ultimately spur Kenya and Africa towards sustainable development.
REFERENCES
“Repository Definition” August 2016. [Online]. Available:
http://www.webopedia.com/term/r/repository.html
“Software Repositories in Desktop Central” August 2016. [Online]. Available:
http://www.manageengine.com/products/desktop-central/software-repository.html
“45 of the Top Source Code Repository Hosts” September 2016. [Online]. Available: http://oss-
watch.ac.uk/resources/versioncontrol
“An Overview of M-PESA” September 2016. [Online]. At http://fsdkenya.org/an-overview-of-m-pesa/
“Are there only 4,527 Open Source Software Developers in All of Africa?” September 2016. [Online].
Available: http://www.ictworks.org/2013/08/26/are-there-only-4527-open-source-software-
developers-in-all-of-africa/
“Facebook rakes in users in Nigeria and Kenya, eyes rest of Africa” September 2016. [Online]. Available:
http://www.reuters.com/article/idUSKCN0RA17L20150910 ******
GERONTECHNOLOGY: REMOTE PATIENT MONITORING
Ndung’u, I. and Murerwa, E.G.
1Department of Computer Science, P. O. Box 885-60100, Embu, [email protected], 0712 205190 2Computer Science Department, P. O. Box 3000-00100, Nairobi, [email protected], 0724 178839
ABSTRACT
Gerontechnology is coined from two words; Gerontology which means the study of old age as well as
Technology. Research in the field aims at identifying the needs of the people in their old age as well as
encouraging and promoting technological innovations in products and services that address older peoples’
needs; in order to enhance personal independence, maintain health, prevent diseases and enhance leisure.
Improvement in diet, health care as well as environment factors has seen an increase in the life
expectancy of people. But as people become older challenges among them frail health arises.
Traditionally families lived together such that it was expected as one grows old there will be his/her
children who will take care of them. But in recent times there has been an upsurge in rural urban
migration where the young move to urban areas in search of employment leaving their old parents behind.
These are people who may not know when to take prescribed medications or monitor other vital signals.
Left on their own health deteriorates very fast and at times results with preventable death. The importance
for gerontechnology is increasing because of the high ageing population. This paper attempts to
awareness on technological responses to monitoring health of old people. The use of remote monitoring
tools to address health issues of the aged is considered.
Keywords: Technology, Gerontechnology, Health, Remote Monitoring
Proceedings of the Third International Research Conference held on 26th to 28th October, 2016 166
INTRODUCTION
Gerontechnology is coined from two words: Gerontology and Technology. Gerontology itself is defined
by two Latin words: “Gero” meaning “elders” and “ology” which means “the study of”. Gerontology
therefore seeks to understand the aged as well as the process of aging. Information Technology as a
technology is the application of computers and the computer networks including the Internet in the
manipulation and management of data and information. IT enables the creation, processing, storage and
securing of all manner of electronic data. Gerontechnology therefore refers to the use of technological
interventions to fulfill the needs, ambitions and opportunities of the old people. Bronswijk et al, (2009)
refers to gerontechnonolgy as an interdisplinary field that links existing and new technologies in order to
meet the needs of the aged.
The writers also note that gerontechnology is key in improving the quality of life expecially of the aged.
The aim of gerontechnology is to pursue good health, enable full social participation and encourage
independent living up to a high age. This is made possible through research, development or design of
products and services that are geared towards improving the quality of life. Fozald (2001) reported that
gerontechnology is that which has the potential to help older adults maintain physical fitness, cognitive
function and social activity, as well as provide opportunities for increasing independence and
productivity. It potentially brings together professionals both in interdisplinary academic discplines and
research environments from various fields in order contribute towards meeting all these needs.
Need for Gerontechnology
The importance and need for gerontechnology is increasing as a result of the increase in numbers of the
ageing population. Notably, there are more chances of survival due to improved diet, proper health care
and good environment surrounding the old. As population increases, the number of old people in the
society also increases. Micera et al, (2008) observes that improvements in education, health status as well
as economic resources in the last century have improved life expectancy moreso for women. They note
that the population is both quantatively aging and on the other hand qualitatively getting younger. Though
naturally aging, the population is now more aware of their potential and willing to contribute in the social
order of things rather than decline to weakness and self pity. More older people now know how to access
and use technology including basic mobile phones, more advanced smart phones, the internet, social
networks as well as other internet technologies. Through technology the aged are able to connect to the
world they are now no longer able to actively interact with physically due to age and age related
sicknesses. Technology enables the aged contribute economically by partaking on online related activities
which not only improves the financial welfare of the person but also maintains the self worth as the aged
person feel he is needed in society. Gerontechnology in the same trend can therefore be applied to
enhance our ability to provide care, and also influence research which incorporates technology in the lives
of the elderly. Gerontechnology is used effectively in prevention of age-related diseases and of age-
associated losses in strength, endurance, and other physical or cognitive abilities. These include design of
equipment to facilitate interventions and the design of monitoring equipment that allows feedback about
compliance with interventions and their effectiveness e.g. strength training equipment. It can enhance the
performance and opportunities of older citizens in new roles that fit their new ambitions e.g. changed
work, leisure, living, and modified social situations. It provides technology to compensate for declining
capacities e.g. eyesight, the challenge of aging. It also aids older persons indirectly by improving research
on aging e.g. technology allowing signal processing of neurological events and making other non-
invasive measurements, thereby revolutionizing the scientific study of the processes within the aging
body. According to Johanna et al, (2009), Gerontechnology ulitimately aims at implementing successful
aging. Gerontechnology has the potential to help older adults to maintain physical fitness, cognitive
function and social activity, as well as providing opportunities for increasing in dependence and
productivity Fozard (2001)
Aging and Health in Kenya
The aging scenario in Kenya is not different from the rest of the world. As the economy of the country
continues to improve, the middleclass are seen to live actually longer into old age creating problems
which were previously not of much concern. In past times the aged were revered in Kenya, seen as rocks

Proceedings of the Third International Research Conference held on 26th to 28th October, 2016 167
of wisdom. The nature of the society then was that the extended community used to live together or at
least close together and it was expected that as one grows older then care will be provided by the children.
But rural-urban migration has seen majority of the younger generation migrating from the rural and
remote areas to towns or the urban areas in search of better opportunities. Physical care for the old from
their children is no longer assured. Paid help is also not assured as the combined aspects of free primary
school, affordable high school and growth of Universities and middle level colleges encouraged by
devolution has opened ways for education for those previously not able to, who then used to serve the role
of paid help. In rare cases children will take their old parents to retirement and care homes. But in
majority cases the old are left to themselves. But as Spokus (2005) reported, using technology can greatly
benefit old people living in rural areas as technology use provides them with access to quality healthcare.
Challenges Facing the Old
The mandatory retirement age of civil servants in Kenya was set at sixty years a raise from the previous
fifty years of age in the year 2009. Those in the private sector have different retirements according to
contractual agreement. Aging comes with loss of ability to work. At best a person is let go with a
specified benefit or a monthly pension. Yet this is not equivalent to what one earned when in active
employment. Reduced income means reduced purchase power. A retired old person faces a situation
where the quality of life lived before has to be reviewed in most cases downwards.
Non-communicable diseases (NCDs) are the leading cause of death globally. Among them are high blood
pressure and diabetes. Diabetes mellitus is the 4th main contributor of death among the NCDs globally
(WHO, 2010). There is an increase of high blood presseure together with diabetes among the older
generation. Another common age related diseases which is starting to be widely visible in Kenya is
Alzeimer and Dementia. Alzeimer disease is presented as mental deterioration gradually leading to
dementia which is defined as memory loss coupled with difficulties in thinking, problem solving and
language skills. According to Devenand et al, (1996), depression moderately increased the risk of
suffering from dementia, primarily Alzheimer's disease. Loss of strength and other age related challenges
facing the old can contribute to Alzheimer’s disease and dementia. Of concern is that reduced income is
one factor contributing to these diseases. Tiffany (2013) notes a connection between poverty and diseases
such as diabetes. The old in the society are very important due to their words of wisdom and guidance.
They preserve the culture of any society and passing it on to the newer generations. There is a great need
in coming up with ways of ensuring they enjoy quality of life and cope with the challenges easily by
providing necessary conducive environment through technological innovations. To address the challenge
of health, remote patient monitoring is suggested.
Nursing and Care Homes in Kenya
In Kenya, there are only a few nursing and care homes for the old which are majorly run by non-
governmental and faith-based organizations. The Fairseat Retirement home in Rosslyn is such an
example. The home can only accommodate 35 residents who are 70 years and above. Coupled with the
high costs charged, only few can afford to stay there. Kilulu, a retirement home in Mombasa is developed
on three acres and has catered for the elderly for 16 years.The home has seen an increasing number of
elderly men and women who come into the home in search of companionship, care and a healthy
atmosphere. The average cost is between KSh90, 000 and KSh120, 000 per month depending on the
circumstances and need for each residents. The population is also limited to the space available
(Mwakilishi, 2013). The Nyumba ya Wazee, or house of the old people, based in Nairobi, is run by the
Little Sisters of the Poor, a Catholic organization that survives on donations. It has a capacity of only 65
residents. (Brown, 2009). According to the Kenyan government figures, the ageing population above 60
years stood at 1.4 million in 2015. This number is expected to double in the next 10 years.
This calls for us to channel our resources and attention to the care of the old and how to improve their
quality of life through the use of technology. A study of relationship between retirement preparation in
the psychological, financial and health domains and quality of life of retirees shows that more than half of
the 10% of the retirees sampled do not enjoy quality life in old age( Pauline et al, 2015).

Proceedings of the Third International Research Conference held on 26th to 28th October, 2016 168
Remote Patient Monitoring
It might be difficult to get and accommodate all the elderly into care homes across the country but it is
possible to offer specialized care and attention to majority of them in urban and rural setups by utilizing
remote patient monitoring technology. Remote patient monitoring, including home telehealth, uses
devices to remotely collect and send data to a home health agency or a remote diagnostic testing facility
(RDTF) for interpretation. Such applications might include a specific vital sign, such as blood glucose or
heart ECG or a variety of indicators for homebound patients. Such services can be used to supplement the
use of visiting nurses.Such technology could be an answer to help the thousands aged who are at our
homes in enjoying life including good health and social integration. This will ensure independent living
of the old and reduce the burden to families e.g. cut hospital costs, counselling and travelling costs to
medical centers and such other costs.
Calcagnini et al, (2008) proposed a short messaging service (sms) as a tool for monitoring of home-care
therapeutic or rehabilitative programs in elderly. Another remote monitoring system is proposed by
Heyoung et al, (2008). This implementation ‘smart house’ is a 24-hour continuous health monitoring
system in a house with the intention of aiding independent living of the elderly and / or people with
disabilities. Wu et al,.(2014) have proposed a portable prototype system for the automatic monitoring and
correction of elderly patients with the Obstructive Sleep Apnea Syndrome (OSAS). The system monitors
for sleep related breathing which then causes the stimulus module to change the patient sleeping posture
improving the respiratory pattern. iRxReminder is an iPhone system developed by Sterns et al, (2010).
The application stroke patients including reminding, to present multi-media educational materials, and to
present tailored surveys for capturing information about daily activities. A suite of apps that addresses the
issues affecting the aged has been developed by Sposaro and Tyson(2009).These include (iFall) Sposaro
and Tyson(2009) to monitor falling, iWander to monitor an old person who may have lost the way as well
as other monitoring tools all for the Android platform. If an emergency occurs, the phone can
automatically call several contacts using Google Voice technology.
Other Existing Remote Patient Monitoring and Care Initiatives Include:
Care coordination / home telehealth (CCHT)
Broderick (2013) describes the VHA’s CCHT. The Veteran Health Administration is an institution in the
United States of America that implements the medical assistance program of veterans. Care Cordination /
Home Telehealth is one of the programs in VHA. CCHT provides non institutional care and case
management to the veterans. Among health conditions monitored are diabetes, hypertension, congestive
heart failure, post-traumatic stress disorders among other conditions. All this is done by using remote
monitoring devices which are installed in veterans homes. The devices can capture and transmit biometric
data and communicate health status of the veteran. These remote devices are remotely monitored by
health care cordinators
Partners healthcare network (Boston)
Partners HealthCare network offers remote monitoring programs patients to track their health and
securely share their health data with their provider through a secure patient portal. Among diseases
remotely monitored are diabetes, hypertension, heart failure and weight management among other
conditions. An example of how this system works is in the case of heart failure patients who have been
treated and discharged, yet need close monitoring. For these patients, each morning, patients take their
blood pressure, pulse, oxygen levels and weight. In addition, patients answer symptom questions on a
small touch-screen computer, and transmit the data to Partners HealthCare at Home. A nurse reviews the
data and when readings are outside established parameters, appropriate intervention is taken. This
includes a call to the patient to check on their condition and, when necessary, coordination with the
patient's physicians. Diabetes patients upload readings from their glucometer via a wireless
communications device which gives the care giver idea on the sugar readings of the patient for monitoring
and further action. Same applies for hypertension and other conditions remotely managed (Patners-
Healthcare, 2016).

Proceedings of the Third International Research Conference held on 26th to 28th October, 2016 169
Remote home care (Australia)
Older Australians just like other aged elsewhere wish to remain in their homes for as long as possible
with the support of medical technologies that can delay or stop the transition into hospital or residential
care. In April 2012, the Federal Government of Austrarlia announced the living longer living better
intiative under the Aged Care reform plan. This is aimed at encouraging home based care with the
government planning to provide $3.7 billion in the next five years to support the older Australians’ and
their families. Aging and Aged Care, 2014.
Telestra health
An online platform for care and management of patients that seeks to empower them with effective home
and mobile monitoring solutions. Among the provisions are platforms to collect data, manage diseases
and give care to its clients right from their home remotely. MyCareManager is one example of these
platforms. MyCareManager has a portal, telemonitoring, videoconferencing and integration engine
through which data collection and remote monitoring is effected.Another one is MyHealthPoint, a chronic
condition management platform that gives carers access to patient health information in real time via the
web or mobile app, and helps patients manage their condition at home.
Telemedicine Africa (South Africa)
Telemedicine Africa is a South African medical platform that provides remote diagnosis and treatment of
patients. It has Patnered with the Industrial Development Corporation (IDC) and Dimension Data
technology company to establish a virtual telemedicine consultation center. General practioners and
medical specialists deliver medical services to remote patients connected to the virtual telehealth center.
The non-invasive blood glucose project
Implemented in Kelvin, a suburb of Sandton, Gauteng, S. Africa. The system uses visible light
spectrometry. The main function is to accurately measure blood glucose. A means of calibration is
provided to account for component variations and maintain accuracy. The measurement results are stored
in a data log that, upon request, can be uploaded to a PC via a USB serial cable. The data log is
implemented on a non-volatile memory (EEPROM) that keeps the data in the event of battery removal or
power loss. Diabetes Development NIBGM (Non-Invasive Blood Glucose Monitor Project, 2009)
CONCLUSIONS
The mounting challenges of population growth and demographic ageing will place a considerable strain
on healthcare systems across the globe, leading to increased healthcare costs and a risk of lowering the
standards, not only for older people, but across all population demographics. To address these challenges,
governments will need an increased focus on the research and design, commercialization and deployment
of smart technology to enable older people to remain in their homes longer and provide cost-effective
solutions to meet the needs of an ageing population.
Remote patient monitoring uses digital technologies to collect medical and other forms of health data
from individuals in one location and electronically transmit that information securely to health care
providers in a different location for assessment and recommendations. Monitoring programs can collect a
wide range of health data from the point of care, such as vital signs, weight, blood pressure, blood sugar,
blood oxygen levels, heart rate, and electrocardiograms.This data is then transmitted to health
professionals in facilities such as monitoring centers in primary care settings, hospitals and intensive care
units, skilled nursing facilities, and centralized off-site case management programs. Health professionals
monitor these patients remotely and act on the information received as part of the treatment plan.
Monitoring programs can also help keep people healthy, allow older and disabled individuals to live at
home longer and avoid having to move into skilled nursing facilities. It can also serve to reduce the
number of hospitalizations, readmissions, and lengths of stay in hospitals—all of which help improve
quality of life and contain costs.
Remote Patient Monitoring integrated with home telehealth is an important technology that should be
embraced in Kenya, Africa and the globe at large. Its benefits are way much great and its effectiveness is

Proceedings of the Third International Research Conference held on 26th to 28th October, 2016 170
of great help both to the governments and its citizens (older citizens). In taking care of the old in the
society, we need to think of better ways to simplify their care yet maintain the quality of service.
Technology can be used to achieve this through various ways, this being one of them. There are many
success stories around the world and I believe as a nation we can also make it to be counted among the
leading countries. Adopting this idea will bring greater joy to the ageing population and also affected
citizens of Kenya. Provision of care that enables individuals to be treated in the home environment is far
more cost effective than all other alternatives. It should therefore be embraced and implemented as a
priority for improved health care.There only few homes for elderly currently which are expensive for low
income citizens. There is therefore need to use technology to help the thousands who are at our homes in
enjoying life including good health and social integration.
Some of the devices used in data collection and doctor interaction include: alarms/alerts, pulse oximeter,
sphygmomanometer, peak flow meter, continuous glucose monitoring, drug delivery/infusion pump,
smart incontinence management system, heart rate monitor, spirometer, electrocardiogram (ECG), and
home hemodialysis among others.
There have been very poor condition and implementation of gerontechnology in Kenya and Africa at
large. However, there is great research that is going on in this area. Adoption of remote patient monitoring
and home telehealth in Kenya would see the nation achieve a great milestone in dealing with the ageing
population. Most of these are investments that the government has to be ready to undertake for the benefit
of its citizens. These technologies as seen above have many benefits and will reduce on costs by the
families affected and improve the quality of life of the older citizens. This will also contribute much in the
growing economy of the Kenyan government. This project would go a long way in reaching the many
underserved areas in Kenya. With the advances in technology and telecommunication, then it will be an
easy task to implement these systems in almost every county.
Remote patient monitoring and home telehealth however requires patient data to be stored electronically.
We are living in a digital world where every activity and service is digitalized. With digitalization of
health management systems in our hospitals, then we should be able to achieve these technologies easily
and within a very short time. Setting up of monitor centers, which could be situated in the local hospitals,
will ensure the government reaches most of the target population easily and be able to manage their needs
easily. Educational training can be available in these centers to ensure the patient or carers get to know
how to use the monitoring devices. The specialists can also communicate with the patients directly in case
of recommendations and consultations as depicted by the data transmitted.This will also help in reducing
admissions in hospitals and the problem of shortage of specialists and doctors in our country. Fewer
practitioners will be able to handle a bigger number of patients at a go compared to physical service
delivery. Chronic disease can be detected early and diagnostic measures undertaken on time. In cases of
emergency, then deployment of medicare services is faster and this will prevent extreme conditions,
including death, during travel of patients to medical centers.
Nursing homes are currently very few compared to the large population in Kenya. They are also quite
costly to majority of the older citizens and have limited capacity of accommodation. This technology can
be used to provide same care as nursing homes but in the individual’s homes and comfort zone without
change of environment.
Other benefits of using remote patient monitoring system include the following:
i. Improved Access – it has been used to bring healthcare services to patients in distant locations. It
helps to improve access to patients and also allows physicians and health facilities to expand their
reach, beyond their own offices. Given the provider shortages throughout the world, in both rural
and urban areas, it has a unique capacity to increase service to millions of new patients especially
the increasing ageing population.
ii. Cost Efficiencies – Reducing or containing the cost of healthcare is one of the most important
reasons for funding and adopting remote patient monitoring technologies. To reduce the cost of

Proceedings of the Third International Research Conference held on 26th to 28th October, 2016 171
healthcare and increase efficiency through better management of chronic diseases, shared health
professional staffing, reduced travel times, and fewer or shorter hospital stays.
iii. Improved Quality – Studies have consistently shown that the quality of healthcare services
delivered are as good those given in traditional in-person consultations.
iv. Patient Demand – Consumers want home based care. The greatest impact is on the patient, their
family and their community. Using remote patient monitoring technologies reduces travel time
and related stresses for the patient. Over the past 15 years, study after study has documented
patient satisfaction and support for the services. Such services offer patients the access to
providers that might not be available otherwise, as well as medical services without the need to
travel long distances.
However some challenges come with remote monitoring technology including:
i. Level of technology – low level of technology that may not meet the required standards for
implementation of the system in some parts of the country. However, the rate of
telecommunication and technology advancement in the country is promising to reach out to all
parts of the country.
ii. Illiteracy - especially on use of technological devices is a challenge to deal with. Many older
citizens are not oriented to usage of such devices and may proof difficult to use. However, some
can be trained whereas in other cases the carers can be trained on how to use the technology.
iii. Government participation – the government must be ready to embrace this project and fund it
accordingly for it to be realized. Several stakeholders involved must be ready to work together in
achieving this milestone in gerontechnology.
REFERENCES
Sterns, A.A. Lax, G. Sterns, H.L. Allen, K. Hazelet. S. (2010) Improving chronic care management: An
iPhone application for post-stroke recovery. Gerontechnology 9(2):251; Vol. 9 No 2
Ageing and Aged Care. (2014). Retrieved from Australian Government Department of Health:
http://www.health.gov.au/internet/publications/publishing.nsf/content/ageing-aged-care-reform-
measures-chapter1-htm
Broderick, A. (2013). Veterans Health Administration: Taking Home Telehealth Services to Scale
Nationally. Case Studies in Teleheath Adoption (p. pub. 1657 Vol. 4). Commonwealth Fund.
Brown, M. (2009). Kenya tackles a new problem: age. Retrieved from The National:
www.thenational.ae/arts-life/Africa/Kenya-tackles-a new-problem:age.html
Devenand, D.P. Mary Sano, Ming-Xin Tang, Stuart Taylor, Barry J. Gurland, david Wilder, Yaakov Stern
and Richard Mayeux, (1996) Depressed mood and the incidence of Alzheimer’s disease in the
elderly living in the community, Arch Gen Psychiatry 53(2):175-182
Diabetes Development Non Invasive Blood Glucose Monitor project. 2009. Retrieved from
southafricancentral.blogspot.co.ke/2009/04/diabetes-development-nibgm-non-invasive.html
Fozard, JL (2005). Impacts of technology interventions on health and self-esteem.
Gerontechnology;4(2):63-76
Calcagnin, G. M. Triventi, E. Mattei, F. Censi, D. Giansanti, G. Maccioni, P. Bartolini V. Macellari
(2008). Short message service (SMS) as a practical tool for monitoring of home-care therapeutic
or rehabilitative programs in elderly. Gerontechnology 7(2):83
Wu, H-C. Ting, H. Tseng M-H. (2014) Design and implementation of an automatic monitoring and
correction auxiliary system for patients with obstructive sleep apnea syndrome. Gerontechnology
13(2):307
Heyoung Lee, Yong-Tae Kim, Jin-Woo Jung, Kwang-Hyun Park, Dae-Jin Kim, Bugang Bang, Z. Zenn
Bien, H. Lee, Y.T. Kim, J.W. Jung, K.H. Park, D.J. Kim, B. Bang, Z.Z. Bien. A (2008) 24-hour
health monitoring system in a smart house. Gerontechnology 7(1):22-35.
Bronswijk, J.E.M.H. van Bouma, H. Fozard, J.L. Kearns, W.D. Davison, G.C. Tuan. P-C. (2009)
Defining gerontechnology for RandD purposes. Gerontechnology; 8(1):3-10.
Patners-Healthcare (2016), Patient-programs- Remote Monitoring, Retrieved from Partners Healthcare:
Connectedhealth.partners.org/patient-programs/remote-monitoring/default.aspx

Proceedings of the Third International Research Conference held on 26th to 28th October, 2016 172
Pauline Thuku, Lucy Maina and Margaret gechaga. (2015). The Relationship between Retirement
Preparation in the Psychological, Financial and health Domains and Quality of Life of Retirees in
Kenya: A case of Nyeri County.
Rural Barriers (2005) Healthy lifestyles program, using diabetes as a model D.M. Spokus. Vol 3, No 4 pp
192, Gerontechnology journal.
Sposaro, F, Daneilson J, Tyson G, iWander (2010) An Android Application for dementia patients, Conf
Proc IEEE Eng Med Biol Soc. ;2010:3875-8.
Sposaro, F. and Tyson G., iFall (2009) An Android Application for fall Monitoring and Response, Conf
Proc IEEE Eng Med Biol Soc. 61: 19-22.
Tiffany, L.E. Jones (2013) Diabetes Mellitus: the increasing burden of disease in Kenya South Sudan
Medical Journal, Vol 6. No 3. August, pp 12-16. WHO. 2010. Library Cataloguing-in-Publication. Data global status report on non-communicable diseases.
******
MORPHOLOGICAL CHARACTERIZATION OF HYPOXYLON WOOD ROT FUNGUS IN
KENYAN TEA
Langat, J.K.1, Ramkat, R.C.2 and Muoki, R.C.1
1Tea Research Institute, P. O. Box 820-20200, Kericho, Kenya 2Biological Science Department, Moi University, P. O. Box 3900-30100, Eldoret
ABSTRACT
Hypoxylon fungi species causes Hypoxylon wood rot disease in tea (Camellia sinensis (L) O. Kuntze). It
exists in both asexual and sexual states. To assess the diversity of the fungi in Kenya, 58 fungus isolates
were collected from different tea growing regions in Kenya and characterized based on cultural and
morphological features. Radial growth of the different isolates on PDA differed significantly. Based on
visual assessment of cultural similarity, 10 groupings were observed. The characteristics were mainly
effused pulvinate stromata, composed of mainly spherical perithesia and amyloid asci with brown
ellipsoid in-equilateral ascospores. Hypoxylon fungi were prevalent (disease index 0.76 to 0.82) in clonal
as compared to seedling teas (0.05-0.36). The disease was fairly prevalent at elevated tea growing areas
(2100-2250 m asl) than at 1826-1969 m asl. Morphological characteristics of the stromata did not show
much variation with respect to tea growing areas; however, treatment of stomatal bodies with 10% KOH
released extractable pigments (brown), indicating that H. species is infecting tea in Kenya.
Keywords: Hypoxylon, Cultural, Stromata, Characterization, Tea, Kenya
INTRODUCTION
Hypoxylon spp are generally wood colonizers found mostly in the tropics than sub-tropics. The fungus
belongs to the family Xylariaceae(Ascomycota) with about 41 genera andover 130 recognized species and
varieties (Sanchez-Ballesteros et al. 2000). Hypoxylonspp exists as saprophytes of facultative parasite in
the order Xylariales and class Ascomycetes (Rogers, 1979). Like most Xylariaceous members, the fungus
exists in both asexual (anamorphic) and sexual (teleomophic) states. The asexual state is known as
Geniculosporium serpens (Kenerley and Rogers, 1976). Generally, Xylariaceae fungi occur mostly on
dicotyledonous angiosperms with few incidences reported on monocotyledons and conifers (Rogers,
1979; Whalley, 1989). In Kenya, the pathogen causes one of the major diseases of tea (Otieno, 1993). The
fungus has significant economic and ecological importance as it affects productivity and biomass
degradation (Venkata Ram, 1974; Onsando, 1989; Otieno, 1993, 1994; Sánchez-Ballesteros et al. 2000).
Traditionally, Xylariaceae can be identified based on fruiting body morphological characteristics namely
stromatal form, stromatal colour, ascospore shape and dimension or ascus bearing sporocarp (perithecia),
ascus morphology and ascospore release (Ainsworth et al. 1971; Rogers, 1979; Whalley, 1996). Later, the
combination of teleomorphic and anamorphic characters, and chemotaxonomy through the stromatal
pigment colours in 10% potassium hydroxide (KOH) led to the recognition of new species (Ju and
Rogers, 1996). The general appearance of the ascalapical apparatus is an important characteristic amongst
members of the family Xylariaceae (Laessoeet al. 1989; Juand Roggers; 1996; Whalley, 1996). Detailed
ascal apparatus such as ascospore wall ornamentation can be distinguished through the use of scanning

Proceedings of the Third International Research Conference held on 26th to 28th October, 2016 173
electron microscope (Suwanasaiet al., 2013). Ascal apparatus in most species stain blue, dark blue
(amyloid) or occasionally reddish brown when pre-treated with Melzer’s iodine reagentor potassium
hydroxide solution after pretreatment with KOH (Eriksson, 1966; Kohn andKorf, 1975;Nannfeldt 1976).
Members of Xylareaceaus fungi have characteristic featureof the ascospore; Hypoxylon and Daldinia
have usually inequilaterally ellipsoid, Biscogniauxia have more frequently subglobose, Xylaria are often
broadly crescent-shaped, while in Rosellinia are typified by long attenuate ends (Petrini 1992).
Generally, the distribution of Xylariaceous fungi is affected by temperature as was evidenced in Thailand
and Philippines where the fungi exhibit high diversity due to the tropical climate (Okaneet al.
2008;Osonoet al. 2009; Seehananand Petcharat, 2011;Vasilyeva et al. 2012). In-vitro studies have
reported that growth temperature of the fungus range been 9oC to 30
oC with optimum growth at 25
oC
(Onsando, 1985). In Kenya, the disease was first reported in Kericho, Nandi and Limuru tea farms and the
prevalence increases with the age of the tea plant (Onsando, 1985). The disease manifests as gradual rot
of branches that form the tea frame, beginning from the pruning cuts on the primary branches, resulting in
sectorial death which ultimately culminate in the death of the whole bush (Otieno, 1997). On dead host
wood tissue it is recognized as fructification of dark grey or black irregular and raised patches (Venkata
Ram, 1970). The transmission agents of the pathogen propagules (ascospores) onto the exposed wood
(resulting from pruning cuts or damaged bark), include windborne ascospores, windblown rain splashes
and rain drop splashes (Otieno, 1997). There is limited literature on the diversity of Hypoxylon fungus in
tea growing regions and its disease prevalence. In this study, morphological characteristics of vegetative
(asexual) and stromata (sexual) states of Hypoxylon fungus prevalence in different tea growing regions
(counties), genotypes and altitude were assessed.
MATERIALS AND METHODS
Wood Rot Specimens Collection
Due to asymptomatic inversion of living host tissue, Xylariaceae are collected from dead wood of
angiosperms (Petrini and Petrini, 1985). The wood sampling was accompanied by the assessment of
disease incidence in different tea growing counties. Naturally infected tea wood bearing the fruiting body
was sampled from both East (Kirinyaga, Nyeri, Kiambu, and Meru North sampled in August 2015) and
West (Nyamira, Nandi and Kericho sampled in October 2015) of Rift Valley. However, disease incidence
for Kericho was not assessed because the pruned tea fields had fully recovered hindering satisfactory
examination of the tea frame. In fields where the disease incidence was high, random representative
plants were taken as compared to low disease incidence field where all infected plants were sampled. The
samples were put in a brown khaki paper bag, labeled accordingly and transported to the laboratory where
they were air-dried and stored at room temperature.
Fungal Isolation and Vegetative Comparisons
The fungi were isolated following a modified method used by Kenerley and Rogers (1976) which
involves taking a colony and maintaining iton potato dextrose agar (PDA). In total, 65 samples were used
with 58 new isolates and 7 stock cultures previously collected from Kirinyaga County. All the cultures
were coded with respect to the county and location from which they were collected. These were used to
study vegetative growth rates and cultural morphological comparisons on PDA. The cultures were made
by transferring 2 mm x2 mm block of inoculum taken from periphery of seven days old cultures on PDA.
Three replicates of each isolate were inoculated, and incubated at room temperature on a laboratory
bench. Radial growth of fungi isolates were measure in millimeter at two day interval for 10 days, and the
data subjected to ANOVA using SAS 9.1 statistical software. Cultural morphology were compared based
on visual similarities/differences on the tenth day.
The fungal stromata were analyzed for extractable pigments (chemotaxonomy) using 10% potassium
hydroxide (KOH) in three replications (Kohn and Korf, 1975;Nannfedt, 1976). The morphology of the
fruiting bodies (stromatal surface and vertical section) was examined under a dissecting microscope.
Squash preparations from the stromata for ascii and ascospores measurements was done using distilled
water. Apical ascal apparatus was examined using (Kohn and Korf, 1975; Nannfedt, 1976) methods.

Proceedings of the Third International Research Conference held on 26th to 28th October, 2016 174
Assessment of Hypoxylon Wood Rot Disease Incidence
Disease incidence was assessed in triplicateby randomly selecting a row of tea plants within a pruned
field of tea. In each row 25 tea busheswere cleaned by removing litter to allow thorough examination of
the entire tea frame. The tea bushes were successively assessed for the symptoms of the wood rot disease.
A dead tea plant with symptoms of the disease was regarded that the death was due to the wood rot.The
genotype of tea in each site was noted as mono-clonal, mixed clonal or seedling tea, and respective
altitudes were taken.The disease incidence was recorded as 1 to indicate presence and 0 for absence of the
disease and expressed as (Otieno 2003):
The calculated disease incidence in different regions were subjected to ANOVA analysis using SAS
statistical software and correlated with the altitude.
RESULTS
Vegetative Growth of Hypoxylon Fungi
The radial growth of the different isolates from different location varied significantly (P≤0.05) throughout
the period of growth. At the 10th, day growth ranged from 24.0 to 57.0mm diameter (Figure 1). Isolate
NAND30, had the lowest radial growth (24.0mm) while both isolate KERC5 and NAND13 had the
highest (57.0mm) (Figure 1). Colony growth and visual colony comparison did not show any trend nor
associate to the geographical locations (Figure 1 and 2).
Figure 1. Radial mycelia growth of 10 days old cultures of different Hypoxylon isolates grouped based
ontea growing counties. (Bar: LSD between any two mean radial mycelia growth)
Figure 2. Radial mycelia growth of different Hypoxylon isolates grouped based on cultural characteristics
(nature of mycelia, colony form, margins, zonated, wriggled pigmented exudates and colony size.
(Insert: LSD bar between any two mean radial mycelia growth)
Colonies were generally white throughout the growth period except isolate MERN1 and NAND32 which
had light brown-orange centers at the end of the growth period. Other differences visible included colony
texture, size, shape, elevation and zoning in concentric ring/rings. Using these characteristics, the isolates
were grouped in 10 groups (Plate1).
Total number of plants with disease
Total number of plants observed Disease incidence = x 100

Proceedings of the Third International Research Conference held on 26th to 28th October, 2016 175
Fruiting Body Analysis
All stomatal surfaces were made up of dark-grey to black carbonaceous matter with conspicuous ostioles
opening above the general surface of stromatal. Three main stomata forms were observed with
corresponding shapes of perithesia (Plate 2). All were effuses-puvinate with different surface topology
with respective shapes of the perithesia borne. Six wood samples had obovois shaped perithesia,45
samples had obovoid to spherical shaped perithesia and 7 had obovoidand smallperithesia (Plate 2). Ascal
apparatus when treated with iodine solution gave amyloid reaction (bluing of ascal apparatus) (Plate 3).
Plate 1. Representative isolates of Hypoxylonfungi on PDA, from the ten groups. (Note the Compact
mycelia, raised central plateau-, wavy or sooth margins, wriggled centre (NAND18), high convex
colony (KIRN10) flat, pigmented center with exudates, varying colony size).
2. 3.
Plate 2. Different stromatal forms of Hypoxylon species in tea; A1and2- Closs-up of effused-pulvinatestromatal
surface with obovoid shaped perithesia vertical section; B1and2- Closs-up of effused-pulvinatestromatal surface
with obovoid to spherical shaped perithesia and B1and2- Closs-up of effused-pulvinatestromatal surface with
small obovoid shaped perithesia
Plate 3. Amyloid ascal apparatus at the tips, stained blue with iodine solution

Proceedings of the Third International Research Conference held on 26th to 28th October, 2016 176
On treatment with 10% KOH, all stromata produced brown/amber extractable pigmentsm (Plate 4).
Plate 4. Chemotaxonomy test of the Hypoxylon fruit body 10% potassium hydroxide (KOH) showing the
release of extractable brown/amber pigment
Hypoxylon Wood Rot Disease Incidence
Generally, Hypoxylon wood rot disease of tea varied significantly (p ≤ 0.05) in the different tea growing
countiesand locations (Table 1).Clonal teas andmixed clones had significantly (p ≤ 0.05) higher disease
incidence than seedling teas. The disease incidence was4.0%and81.30%in seedling andclonal
teas,respectively (Table 1). The relationship between the disease incidence and altitude increased with
altitude however the relationship was not significant.
Table 1: Hypoxylon wood rot incidence in different tea growing counties
County and Location Altitude (M) Tea Genotype Incidence of Hypoxylon wood rot (%)
Kirinyaga Loc. A
Loc. B
2231 Mono-clonal 81.0 a
2047 Mixed clones 74.0 a
Nyeri 1969 Seedling 8.3 f
Meru North 1848 Seedling 6.7 f
Kiambu 2241 Seedling 16.7 def
Nyamira Loc. A
Loc. B
1658 Seedling 4.0 f
1794 Seedling 30.7 bcd
Nandi Loc. A
Loc. A
Loc. B
Loc. B
Loc. C
2134 Seedling 46.3 b
2197 Seedling 7.7 f
2087 Seedling 29.3 cde
2171 Seedling 41.7 bc
2117 Seedling 14.3 ef
C.V. (%)
LSD (p=0.05)
21.8
16.2
DISCUSSION
Hypoxylon fungi may affect an individual tea bush or a group of adjacent bushes as is often the case for
susceptible hosts. The affected primary branch breaks off reducingthe tea frameeventually affecting
productivity.Wood rot disease is characteristic with typical irregularly shaped, dark-grey to black
superficial and raised structures on the dead (rotten) host wood (Otieno, 1993). Hypoxylonwood rot
disease most frequently start from the pruning cut, at the upper part of the tea frame, and progress
downwards to the primary branches if not controlled. This nonetheless often extends to the collar region
killing the entire bush. The disease is further reported to be influenced by nitrogen and potassium
nutrition in tea. In a study by Otieno (2003), the disease development was slower where the potassium
was applied as straight fertilizer at different time from the application of nitrogenous fertilizer and
increased with increase in nitrogen. The plant genotype also influences the severity of the disease as
realized in this study (Table 1). During the assessment and collection of the samples, one of the tea fields
with long history persistent low potassium (K), had high disease incidence.
Proceedings of the Third International Research Conference held on 26th to 28th October, 2016 177
A wide range of cultural variations in radial growth rate, colony texture, shape exudation and
elevationwas observed. All fungal growth were initially white with few isolates showing yellowish brown
pigmentation. Previous studies have reporteddistinct variation in growth parameters among different
species of Xylariahypoxylon, a fungus related to the Hypoxylon spp. (Chacko and Rogers, 1981). More
distinctive morphological characteristics of anamorphic (asexual) states are observed under high
resolutionmicroscopy (i.e. diffractive interference-DIF and scanning electron microscopy – SEM). In
Europe, species ofHypoxylonwerefirst described based on growth rate, colour, texture, zonation,margin
forms,and anamorphic structures like conidiophores and conidia (Hsichet al. 2005; Faurnier, 2010; Hai-
Xia et al. 2012). In addition, detailed characterization of fruiting body has been used extensively to
distinguish H. species (Faurnier, 2010, Hai-Xia, et al. 2012). With advances in technology, molecular
tools such asrDNA, β-tubulin and α-actin sequencingareused to identify new collections of Hypoxylon
spp. (Mazzagliaet al., 2001, Hsichet al. 2005, Suwannasaiet al. 2013).
The fruit body of the Hypoxylon fungi in tea showed less diversity on its surface (topology) morphology
and form (Plate 2). Generally, all stromata were effused-pulpinate, with either obovoid, obovoid to
spherical and ovoid perithecia, bearing amylodascii (Plate 2 and 3. All fruiting bodies released
brown/amber extractable pigment with 10% KOH. The later is a reliable characteristic for separation
when other related species of Hypoxylonare involved (Ju and Rogers, 1996). The ascal apparatus were
amyloid when treated with iodine solution test and dark brown ellipsoid in-equilateral
ascospores.Faurnier (2010), Hai-Xia (2012) carried out detailed morphological characterization of fruit
body to distinguish new species of Hypoxylon collected (Faurnier, 2010, Hai-Xia, et al. 2012).
Hypoxylon wood rot disease incidence varied significantly (P ≤ 0.05) in the different tea growing
counties. However, the incidencewas found prevalent tomonoclonal andmixed clonalteas (81 and 74%,
respectively) as compared to the seedling teas (ranging between 4.0 to 46.3%) (Table 1). It was also found
to be more common in higher altitude than in lower altitude. Similarly, in vitro studies by Onsando (1985)
reported that the fungus has a wide growth temperatures range(9oC to 30.5
oC) with 25
oC being optimum.
Generally, temperature is one of the most important factors that influence disease occurrence and the
development of most plant disease because it can affect either the host or the pathogen itself.In the present
study, the weak relationship between the fungus and the altitude for the different tea growing regions,
imply that the fungus is well adapted to the different Agro-ecological zones where tea is grown. This
indicate that the host(tea genotype) is keyin disease severity. However, adequate nutritional regimes can
also be used to minimize the disease severity particularly in field with low incidence (Otieno, 2003).
RECOMMENDATION
Since Hypoxylon wood rot is a disease that occurs in older tea, above 15 to 20 years old from planting, it
is vital to have a clonal screening and selection criteria to avoid unwarranted loss of plants that may result
due to the pathogen inversion. In this study, it was found that the disease incidence is influenced mainly
by the teagenotype. Therefore, aselection criteria for tea needs to be sought for screening of tea clones
before release and probably breed for resistance to the disease.
CONCLUSION
Based on cultural characteristics,the Hypoxylon isolates are diverse which should be confirmed using
alternative techniques. Fruit body chemotaxonoxy confirm that the wood rot pathogen in tea is by the
Hypoxylon species. The disease incidence is mainly influenced by the host genotype.
REFERENCES
Ainsworth G.C., Hawksworth D.L., James P.W. (1971). Ainsworth and Bisby’s dictionary of the Fungi.
9th ed. Kew (UK): Commonwealth Mycological Institute.
Fournier, J. 2010. New species of Hypoxylon from W. Europe and Ethiopia. Mycotaxon. 113:209-235.
Hai- Xia Ma, Vasilyeva, L and Li, Y (2012). Hypoxylon from China- 2: H. dengii sp. nov.andH.
crocopeplum new to China. Mycotaxon. 122. 1-5

Proceedings of the Third International Research Conference held on 26th to 28th October, 2016 178
Hsich. H.M, Ju, Y. M, and Roggers J. D. (2005). Molecular phylogeny of Hypoxylon and closely related
genera. Mycologia. 97(4) 844-865.
Ju Y-M, Rogers JD. 1996. A revision of the genus Hypoxylon. MycologiaMem 20:1–365.
Kenerley, C. M. and Rogers, J. D. (1976). On Hypoxylonserpens in culture. Mycologia. 68 688-691.
Kohn LM, Korf RP (1975) Variation in Ascomycete iodine reactions: KOH pretreatment explored.
Mycotaxon3: 165–172.
Laessoe T, Rogers J.D and Whalley AJS (1989). Camillea, Jongiellaand light-spored species of
Hypoxylon. Mycological Research 93: 121–155.
Mazzaglia A., Anselmi N., Vicario S., andVannini, A. (2001). Sequence analysis of the 5-8S rDNA and
ITS regions in evaluating genetic relationships among some species of Hypoxylonand related
genera. Mycol. Res. 105 (6):.670-675
Nannfeldt J. A. (1976) Iodine reactions in ascus plugs and their taxonomic significance. Transactions of
the British Mycological Society 67: 283–287.
Okane I., Srikitikulchai P., Toyama K., Laessoe T., Somsak S., Nigel H.-J., Akira N., Wanchern P., Ken-
ichiro S., 2008. Study of endophytic Xylariaceae in Thailand: diversity and taxonomy inferred
from rDNA sequence analyses with saprobes forming fruit bodies in the field. Mycoscience49:
359-372.
Onsando, J. M. (1985). Effect of temperature on growth of Hypoxylonserpens(pers. ex. Fr.) In Vitro).
Tea.6(2) 13-18.
Onsando, J. M. (1995). Wood rot disease of tea, (Hypoxylonserpens) – A Review. Tea6: (2) 39-42
Onsando, J. M. and Langat J. K. (1989). Management of wood rot of tea, Hypoxylonserpens (Pers. Ex.
Fri.) in Kenya. Tea. 10: 180-186.
Osono, T.: To-Anum,C.; Hiros, D. (2009) Decomposition of wood and leaf litter by Xylaria species from
northern Thailand. Asian Mycological congress 2009, GTaichung, Taiwan.
Otieno, W. (1993). Hypoxylon wood rot of tea (Camelliansinensis (L) O. Kuntze): The causal agent,
symptoms and control – A Review. Tea14(1) 61-64.
Otieno, W. (1997). Epidemiology and management of Hypoxylon wood rot of tea. Tea: 18:175-183.
Otieno, W., Sudoi, V. Othieno, C.O., Langat, J.K. (1994). Management of Hypoxylon wood rot of tea
(Camellia sinensis (L.) O. Kuntze using sanitation practices and fungicides. Tea. 15 110-112.
Otieno, W. (2003). Integrated management of Hypoxylon wood rot of tea (Camellia sinensis L. (O)
Kuntze); The components and their applications. Tea: 24 (1) 4-13.
Petrini L. E. (1992). Roselliniaspecies of the temperate zones. Sydowia44: 169–281.
Petrini L. E. and Petrini O. (1985). Xylareaceousfingi as endophytes. Sydowia, 38:216-234.
Rogers J. 2000. Thoughts and musing on tropical Xylariaceae. Mycological Research 104:1412-1420.
Rogers, J. (1979). The Xylareaceae: Systematics, biology and evolutionary aspects. Mycologia. 71:1-42.
Sánchez-Ballesteros J., Vicente González, Oscar Salazar, Javier Acero, Maria A. Portal, María Julián,
Víctor Rubio, Gerald F. Bills, Jon D. Polishook, Gonzalo Platas, SagrarioMochalesand Fernando
Peláez. (2000). Phylogenetic Study of Hypoxylon and Related Genera Based on Ribosomal ITS
Sequences. Mycologia, (92), No. 5.964-977
Seehanan N., Petcharat V., 2011. Occurrence and distribution of Xylariaceae on different substrates in
Southern Thailand. Asian Mycological Congress 2011. Incheon, Korea.
Suwannasai N., Martı´n M. P., Phosri C., Sihanonth P., Whalley A. J. S., and Spouge, J. L. (2013) Fungi
in Thailand: A Case Study of the Efficacy of an ITS Barcode for Automatically Identifying
Species within the Annulohypoxylon and Hypoxylon Genera. PLoS ONE 8(2): e54529.
doi:10.1371/journal.pone.0054529
Vasilyeva L.N., Stephenson S.L., Hyde K.D., Bahkali A.H., 2012. Some stromatic pyrenomycetous fungi
from northern Thailand 1. Biscogniuxia, Camillea and Hypoxylon (Xylariaceae). Fungal
Diversity55: 65-76.
Venkata Ram C. S. (1970). Disease as limiting factor in tea production, wood rot and Zinc deficiency in
south India. UPASI Sci Dept. Butll. 28: 6-12.
Whalley, A. J. S. (1996). The xylariaceous way of life. Mycological Research 100: 897–922. ******

Proceedings of the Third International Research Conference held on 26th to 28th October, 2016 179
ALGAL DIVERSITY AND DISTRIBUTION IN THE ESP FISH PONDS IN THARAKA-NITHI
COUNTY, KENYA
Kibaara, D.I., Magana, A.M., Ochieng, O. and Githae, E.W.
Department of Physical sciences, Chuka University, P. O. Box 109-60400, Chuka
ABSTRACT
The algal species composition, distribution, abundance and the water chemistry of the ESP fish ponds in
Tharaka-Nithi County have remained unknown, although these greatly influence fish production in ponds.
The Results presented here are from investigations over a period of six months of a that is an ongoing
study Preliminary findings indicate that the major algal taxa in the ESP fish ponds in Tharaka are
Chlorophycea and Bacillariophyceae, both with a ubiquitous distribution in the study area. Cyanobacterial
species exhibited a higher abundance (with an average of 235 cells ml-1
) in the lower zone (Tharaka) than
the middle (Itugururu) or upper (Chuka and Chogoria) zones. Among the cyanotoxin-producing species
were Aphanocapsa, Anabaena, and Microcystis spp. Algal abundance exhibited a seasonal pattern with
higher values during the rainy than the dry seasons. The highest pond water temperature recorded was in
the lower zone, reaching a maximum of 31.9 0C in Tunyai (Tharaka). The minimum level of dissolved
oxygen was 3.2 mg l-1
. Molecular characterization of the algae cyanotoxin level determination and algal
biomass are important aspects of and form the next phase of the present study. The results obtained are
expected to play a vital role in formulating informed management policies in order to boost fish
production in the ESP ponds of the Tharaka-Nithi County and at the national level.
Keywords: Abundance, Cyanobacteria, ESP
INTRODUCTION
Algae form an important part of the diet of culture fish even where artificial feeding is practiced. They are
the producers, occupying the first level of trophic status in the aquatic food chain as they use solar energy
to convert carbon dioxide into organic matter that can be utilized by fish (Gross, 2003). Algal abundance
in aquaculture systems can be used in the estimation of potential fish yields (Paulette et al., 2011).
Cyanobacteria growing alongside the algae in the aquatic fish ponds also form a part of the culture fish
(Oreochromis nilotica) diet. These have been shown to have undesirable effects on the fish, the
environment and human health (Zimba et al., 2001; Reichwaldt and Ghadouani, 2012). The over-
abundance or blooms of certain forms in aquaculture ponds poses a threat not only to the culture fish
themselves but to human health as well. When produced in high quantities with sufficient potency,
cyanotoxins kill fish and other aquatic organisms (Shumway, 1990). Besides leading to decreased feeding
rates of the fish and other aquatic organisms and imparting undesirable ordours and tastes (Tucker, 2000).
Ingestion of toxic cyanobacteria causes stress, sluggish movements and reduced reflexes accompanied by
a reduction in overall health in Oreochromis niloticus (Marzouk et. al., 2013). An understanding of the
processes influencing algal assemblage in the ESP fish ponds in Tharaka-Nithi is crucial to sound
management of the ponds for sustainable fish production in the county. This study seeks to investigate the
algal forms occurring in the ESP ponds in relationship to changes in the aquatic environment.
MATERIALS AND METHODS
The Study Area
Tharaka-Nithi County lies between the longitudes 370 18”and 37
0 28” East, bordering the Meru County to
the north and the Embu County to the south. The County boundary is marked by Mt. Kenya to the west
and the Tana River to the east. It comprises the former Tharaka and Meru South Districts. The County has
a bi-modal rainfall pattern with rains falling during the months of March to May and October to
December (Republic of Kenya, 2016). The lower areas of the county are classified as semi-arid. The map
of the county is presented in Figure 1.

Proceedings of the Third International Research Conference held on 26th to 28th October, 2016 180
Figure 1. Map of Tharaka-Nithi County showing Location of the Study Ponds: 1. Chuka; 2. Chogoria; 3.
Itugururu; 4. Magutuni; 5. Kiaritha; 6. Tunyai (Source: Google Maps, 2015)
The ponds chosen for investigation was done following the Randomized Complete Block Design
(RCBD). The study area was divided into 3 zones: Upper-, Middle- and Lower zones. The upper zone
comprised Chuka and Chogoria areas, the middle zone Itugururu and Magutuni areas while the lower
zone comprised Kiaritha and Tunyai areas. The zones were chosen to represent the three subcounties of
Tharaka-Nithi. Each zone included two areas—one in the north and one in the east with 3 ponds in each
area. Thus a total of 18 ponds were chosen for investigation.
Sampling
Sampling was done once every month at regular intervals (on the same date of the month for each pond).
Investigations were carried out between 10.00 and 15.00 H each time. Water temperature, pH, dissolved
oxygen and conductivity were measured in situ using a digital multimeter readable to 0.01 units. Water
transparency or light penetration was measured using a 20-cm diameter Secchi disc bearing alternate
black and white quadrants.
Samples for morphological characterization and enumeration were collected using a horizontal, opaque,
plastic 2-litre van Dorn sampler at approximately 20 cm depth of each pond. Duplicate samples were
obtained from three different points (near both edges and middle) in each pond. Immediately after
collection, the samples were fixed using 0.5 ml of Lugol’s solution per sample. Besides preserving the
algae, Lugol's solution aids to accelerate cell settling and facilitates cell enumeration (WHO, 2000). Its
composition is 100 g potassium iodide dissolved in 100 of distilled water, 50 g iodine crystals dissolved
in 100 ml of glacial acetic acid. For algal cell enumeration, concentration was enhanced by settling 100
ml of the water sample in a Utermohl chamber of 2.5 cm diameter and a height of 1 cm, holding about 5
ml of the sample. Prior to enumeration, samples were allowed to stand in the chamber for 4 hours for
complete settling of the algae. Continuing was done on an AMSCOPE IN200TA digital inverted
microscope at x400 magnification with oil emersion.
RESULTS
Physicochemical Data
Changes in water temperature exhibited a pattern influenced by the prevailing (rainy or dry) season. In the
period of study it ranged between 23.52 oC in the upper zone during the wet season and 31.9
oC in the
lower zone during the dry season. Other physicochemical parameters of the pond water, too, seemed to
■2
■1
■4
■3
■6
■5
55

Proceedings of the Third International Research Conference held on 26th to 28th October, 2016 181
exhibit a seasonal pattern. Pond water pH generally dropped during the rainy season and to rise during the
dry months. Higher pH values were recorded in the lower zone than in the middle- and upper zones.
Ponds in this zone showed the largest variation in pH among the ESP ponds. It was between 5.26 in
February (dry season) and 9.8 in April (rainy). Sechhi depth ranged from 0.2-0.5 m.
Change in dissolved oxygen among the ESP ponds did not exhibit any seasonal pattern. For instance, the
highest value of 12.0 mg l-1
was recorded in the upper zone (Chuka area) during the dry month of March
while the minimum recorded was 3.2 mg l-1
in the lower zone (Kiaritha area) ( Figre 2).
0
10
20
30
40
FEB MAR APR MAY JUN JLY AUG
Tem
p
pH
DO
Temp
pH
DO
Figure 2. Changes in water temperature, pH and dissolved oxygen in the ESP fish ponds
Algal Assemblage
Following algal examination and enumeration, three main phyla were found to dominate the ESP ponds
in the study area: Chlorophyta, Cyanophyta and Bacillariophyta. These three were found to be ubiquitous
with Chlorophyta constituting the largest portion of the algal assemblage throughout the study period.
Besides these three phyla, others were encountered but constituted a minor portion of the total algal
assemblage. Table 1 shows the genera encountered of these three dominant phyla.
Table 1. The dominant algal phyla in the ESP Ponds
Phylum Genus
Chlorophyta
Scenedesmus
Chlorogonium
Pediastrum
Kirchneriella
Staurastrum
Coelantrum
Treubaria
Monoraphidium
Chlorella
Chlamydomonas
Bacillariophyta
Melosira
Navicula
Synedra
Nitzschia
Gomphonema
Asterionella
Cyanophyta
Microcystis
Chroococcus
Aphanocapsa
Oscillatoria
Anabaena
Lyngbya
2016

Proceedings of the Third International Research Conference held on 26th to 28th October, 2016 182
Of the three phyla shown in Table 3, Chlorophyta genera were the majority, constituting 41.3% of the
assemblage. Bacillariophyta constituted 22.4%, Cyanophyta 32.1% while 4.2% was composed of all other
genera (Figure 2).
0
20
40
60
80
100
Algal Phyla
Percen
tag
e Chlorophyta
Bacillariophyta
Cyanophyta
Others
Figure 3. Dominant algal groups in the ESP Fish Ponds
This pattern of assemblage was observed during the seven months of investigation over the entire study
area (Figure 4).
Figure 4. Monthly distribution of the dominant algal groups in the ESP fish ponds
DISCUSSION
The physicochemical properties of the pond water in the ESP ponds in the study area exhibit a seasonal
pattern. Water temperature tends to decline during the rainy months (March and April) and to rise again in
June through August at the onset of the dry season. Thus, air temperature seems to influence water
temperature to some extent. Overall, levels of dissolved oxygen too, exhibited a seasonal pattern during
the period of study. The high levels in March are likely associated with increased photosynthetic activity
of algae and macrophytes in response to increased irradiance although this could result from addition of
nutrients by through fertilization of the ponds together with application of artificial fish feeds. Pond water
pH rose during the rainy season as a result of dilution with precipitation whose pH is normally about
neutral (7.0). During the dry months, there is a higher concentration of ions, lowering the pH. The very
low Secchi depths measured in the ponds are indicative of low transparency, which may reduce
photosynthetic activity in the lower portions of the water column in the ponds. The higher prevalence of
the chlorophytes, bacillariophytes and cyanopytes than other algal groups in the ESP fish ponds is an
indicator of their better adaption for the aquatic environment in this area. This could be due to the
prevailing physicochemical conditions.
0
20
40
60
80
100
Percentage
FEB MAR APR MAY JUN JLY AUG
MONTH (2016)
Others
Chrophyta
Bacillariophyta
Cyanophta

Proceedings of the Third International Research Conference held on 26th to 28th October, 2016 183
Among the cyanopytes there were encountered some genera are known to form blooms (usually referred
to harmful algal blooms or HABs). These are known to pose problems in fish ponds because they lead to
massive fish kills as a result of toxins (cyanotoxins) they release, usually in concentrations high enough
to kill fish and other aquatic organisms. Among such genera were Anabaena, Microsystis, Aphanocapsa
and Lyngbya spp. Besides killing fish directly, blooms kill fish by depleting dissolved oxygen from the
water as they die off and as they undergo decomposition.
CONCLUSION
The results presented here are from investigations of a period of seven months. It is at the end of one
complete year of investigation that concrete conclusions can made with respect to the various aspects of
algae in the ESP fish ponds in Tharaka-Nithi County. For instance, the effects of the incidences of
cyanobacterial blooms in the ESP fish need to be understood with a view to averting them prior to their
commencement. Equally important is an understanding of the dynamics of algal growth in relation to
nutrients and eutrophication. Although algal groups have hitherto been identified from their morphology,
their characterization by molecular technique is vital.
ACKNOWLEDGEMENTS
Special thanks goes to Chuka University for funding this research through the Chuka University Internal
Research Funds. Special acknowledgement goes to Mr Bulemi, Mr Ogolla and Mr Livaha and all lab
technologists at Chuka University for their kind assistance.
REFERENCES
Gross, E.M. 2003. Allelopathy of aquatic autotrophs. Critical Reviews in Plant Sciences, 22:313-339.
Reichwaldt, E. S, and Ghadouani, A. (2012). Effects of Rainfall Patterns on Toxic Cyanobacterial Blooms
in A Changing Climate: Between Simplistic Scenarios and Complex Dynamics. Water Res. 2:
1372-1393.
Marzouk, M.S., Mostafa, M., Ibrahim, N.A., Pick, F.R., and Sharaf, M.S. (2013) Effect of freshwater
toxic and non toxic cyanobacteria, (Microcystis aeruginosa) strains on some biochemical
parameters of Oreochromis niloticus. J. Aquat. Biol. and Fish., Vol. 17, No. 1: 55-68.
Paulette, M.A., Allassane,O. and Germain, G. (2011) Seasonal variation in the diversity and abundance of
phytoplankton in a small African tropical reservoir. African Journal of Microbiology Research
Vol. 5(18), pp.
Tucker, C.S. (2000) Off-flavors in catfish aquaculture. Rev Fish Sci 8: 45 - 88.
Zimba, P.V., Khoo, L, Gaunt P, Carmichael WW, Brittain S. 2001.Confirmation of catfish mortality from
Microcystis toxins. J Fish Diseases 24:41–47
******

Proceedings of the Third International Research Conference held on 26th to 28th October, 2016 184
ENHANCEMENT OF QUALITY OF EDUCATION AND HEALTH FOR
SUSTAINABLE DEVELOPMENT
THE RELEVANCE OF EDUCATION EXPANSION TO DEVELOPMENT IN KENYA
Ngunjiri, J.N.
Jomo Kenyatta University of Agriculture and Technology, P. O. Box 62000-00200, Nairobi Email: [email protected], 0721365968
ABSTRACT In many developing countries, formal education is the largest "industry" and the greatest consumer of
public revenues. Consequently, poor nations have invested huge sums in education for numerous
reasons: Literate farmers with primary education are thought to be more productive and more responsive
to new agricultural technologies, trained literate artisans are better able to keep up to date with changing
products and materials, while secondary school graduates with arithmetic and clerical skills are needed to
perform technical and administrative functions in growing public and private bureaucracies. In former
colonial countries, many people with such skills are replacing departing expatriates. University graduates
with advanced training are needed to provide the professional and managerial expertise necessary for a
modernized public and private sector. The people themselves have exerted tremendous political pressure
for the expansion of schools in developing countries. Parents have realized that in an era of scarce skilled
manpower, more schooling and certificates increases their children’s chances of securing well-paying
jobs. More years of schooling have been perceived as the only avenue for poor children to escape poverty.
As a result of these forces acting on both demand and supply, there has been a tremendous acceleration in
LDC public expenditures on education during the past three decade. The proportion of national income
and budgets spent on education has increased rapidly. Unfortunately, there has been a growing awareness
in many developing nations that the expansion of formal schooling is not always associated with an
improved ability to undertake productive work, and that too much investment in formal schooling,
especially in higher levels, can divert scarce resources from more socially productive activities and drag
national development. It is on the basis of this growing reality that this paper seeks to explore the
relevance of education expansion to development.
Keywords: Public expenditure, Social environment, Skilled manpower
INTRODUCTION
Education and Human Resources
It is the human resources of a nation, not its capital or its natural resources, that ultimately determine the
character and pace of its economic and social development. Hence, a country which is unable to develop,
the skills and knowledge of its people and to utilize them effectively in the national economy will be
unable to develop anything else (Todaro and Smith, 2010). The principal institutional mechanism for
developing human skills and knowledge is the formal educational system. Most Third World nations have
been led to believe that the rapid quantitative expansion of educational opportunities is the key to national
development: The more education, the more rapid the development. All countries have committed
themselves to the goal of universal education in the shortest possible time. This quest has become a
politically sensitive, but often economically costly. Until recently, few politicians, statesmen, economists,
or educational planners inside or outside of the Third World would have dared publicly to challenge
formal education.
Nevertheless, the challenge is now gathering momentum, and it comes from many sources and can be
found most clearly in the character and results of the development process itself. After more than three
decades of rapidly expanding enrollments and hundreds of billions of dollars of educational expenditure,
the plight of the average citizen in many parts of Asia, Africa, and Latin America seems little improved.
Absolute poverty is chronic and pervasive. Economic disparities between rich and poor widen with each
passing year. Unemployment and underemployment have reached staggering proportions, with the
"educated" increasingly swelling the ranks of the unemployed. ( Ibid). However these problems cannot be
entirely blamed on the failures of the formal educational system. We must recognize that many of the
early claims made on behalf of the quantitative expansion of educational opportunities—that it would

Proceedings of the Third International Research Conference held on 26th to 28th October, 2016 185
accelerate economic growth, raise levels of living especially for the poor, generate widespread and equal
employment opportunities for all, acculturate diverse ethnic or tribal groups, and encourage "modern"
attitudes—have been shown to be greatly exaggerated and, in many instances, simply false.
As a result, there has been a growing awareness in many developing nations that the expansion of formal
schooling is not always to be equated with the spread of learning, that the acquisition of school
certificates and higher degrees is not necessarily associated with an improved ability to undertake
productive work, that education oriented almost entirely toward preparation for work in the modern urban
sector can greatly distort student’s aspirations, and that too much investment in formal schooling,
especially at the secondary and higher levels, can divert scarce resources from more socially productive
activities (like direct employment creation) and thus be a drag on national development rather than a
stimulus. ( Todaro and Smith,2010)
The educational systems of Third World nations strongly influence and are influenced by the whole
nature, magnitude and character of their development process. The role of formal education is not limited
to imparting knowledge and skills that enable individuals to function as economic change agents in their
societies. It also imparts values, ideas, attitudes, and aspirations, which may or may not be in the nation's
best developmental interests. Education absorbs the greatest share of LDC recurrent government
expenditures, occupies the time and activities of the greatest number of adults and children (almost 30%
of Third World populations), and carries the greatest psychological burden of development aspirations.
The economics of education is a vital yet somewhat amorphous component of the economics of
development Yet when we recognize the principal motivation or demand for education in Third World
countries as a desire for economic improvement by means of access to better-paid jobs, we must
understand the economic processes through which such aspirations are either realized or frustrated. This
paper seeks to explore the relationship between development and quantitative and qualitative educational
expansion in terms of the following basic issues:
Does education in general and the structure of Third World educational systems in particular
contribute to or retard the growth of domestic inequality and poverty?
What is the relationship between education and unemployment? Are rising levels of the educated
unemployed a temporary or chronic phenomenon?
Does the huge amount invested in education translate into development?
Do contemporary Third World formal educational systems tend to promote or retard agricultural and
rural development?
METHODOLOGY
The paper reviewed secondary data from development related materials, various studies, reports and the
capability theory.
Education in Developing Regions
Public educational expenditure
In many developing countries, formal education is the largest "industry" and the greatest consumer of
public revenues. Therefore, poor nations have invested huge sums of money in education reasons include;
Literate farmers with at least a primary education are thought to be more productive and more responsive
to new agricultural technologies than illiterate farmers. Specially trained artisans and mechanics that can
read and write are assumed to be better able to keep up to date with changing products and materials.
Secondary school graduates with some knowledge of arithmetic and clerical skills are needed to perform
technical and administrative functions in growing public and private bureaucracies. In former colonial
countries, many people with such skills were also needed to replace departing expatriates. University
graduates with advanced training are needed to provide the professional and managerial expertise
necessary for a modernized public and private sector.
In addition to these manpower planning needs, the people themselves, both rich and poor, have exerted
tremendous political pressure for the expansion of school places in developing countries. Parents have

Proceedings of the Third International Research Conference held on 26th to 28th October, 2016 186
realized that in an era of scarce skilled manpower, the more schooling and the more certificates their
children can accumulate, the better will be their chances of getting secure and well-paid jobs. More years
of schooling have been perceived as the only avenue of hope for poor children to escape from poverty. As
a result of these forces acting on both demand and supply, there has been a tremendous acceleration in
LDC public expenditures on education during the past three decades. The proportion of national income
and of national budgets spent on education has also increased rapidly. The question that this paper begs to
ask is whether the huge investment has translated into development. (Todaro, 2010).
RESULTS AND DISCUSSION
The Pivotal Role of Education in Africa’s Development
What is development? Until recently, development was conceived narrowly as no more than an increase in Gross Domestic
Product (GDP) of a country. Such a narrow and limited understanding of development is misleading and
obscures more than it illuminates. Most African economies have been experiencing steady economic
growth over the last five to ten years without corresponding social development. Take the case of Nigeria;
as at 1999, the International Monetary Fund estimates that the GDP of Nigeria was some miserable $36
billion. By 2010, it had risen to an estimated $247 billion and current prognosis suggests that it will rise
further. Such and similarly dizzying developments prompted the authors of the Mckinsey Report on the
African economy suggest that the African lions were finally on the move. However, the economic growth
has been accompanied by increasing poverty and unemployment. What then is development? According
to participants at the Farm House Dialogue on Leadership for Development, development was
conceptualized ``as a process concerned with people’s capacity in a defined area over a defined period to
manage and induce positive change; that is, to predict, plan, understand and monitor change and reduce
or eliminate unwanted or unwarranted change’. Some key words in this definition are:
People’s capacity to manage and induce positive change
Monitor change
Reduce or eliminate unwanted or unwarranted change
From the above, it is assumed that such a people must be informed, rational and clear about their choices
and their obvious destination and direction. In a nutshell such people must have a modicum of education.
The next logical question to ask is what type of education and what should be our understanding or
conceptualization of education that will aid the achievement of development as defined above?
Participants at the Dialogue on Education for Development defined education as “entailing a life-long
formal and informal process of equipping an individual to be fully aware of his environment and to
exploit, manage and dominate same for the benefit of himself and the society at large”. The definition
achieves two things. First, it throws light on the dynamics of education. It recognises that education is a
process and different individuals have different levels of education which can be formally or informally
acquired over a lifetime. Second, it captures the essence of education which according to Jekayinfa and
Kolawale (2008), is “to produce a useful citizen. A useful citizen is useful both to himself and the society
in which he lives, and generally, to the world community”. In 1990, participants at the World Conference
on Education for All made a significant contribution to the essence of education, acknowledging that it “is
an indispensable key to, though not a sufficient condition for, personal and social
improvement…education can help ensure a safer, healthier, more prosperous and environmentally sound
world, while simultaneously contributing to social, economic, and cultural progress.”
From the definitions of education offered above, the following words are very significant:
A life-long
Formal and informal process
Aware of his environment and
To exploit, manage and dominate same
For the benefit of himself and the society at large
Beyond literacy and numeracy

Proceedings of the Third International Research Conference held on 26th to 28th October, 2016 187
You can only produce a useful citizen if he or she is educated enough to be aware of his or her
environment, and is capable of dominating same.
The question that this paper begs to ask is whether the educational systems in Africa are designed based
on the principles highlighted above.
The State of Education in Africa The capacity to think, innovate, transmit, and utilize new knowledge is central to development. The world
today is a knowledge based economy and the benefits accruable from the increasingly blurring
geographical boundaries across nations can be maximised only by nations with highly skilled and
educated labour force. Since the Dakar World Forum on Education in 2000, significant progress has been
made in the Africa region regarding the attainment of the six Education for All (EFA) goals. Regarding
EFA goal 1 (expanding early childhood care and education), statistics show that pre-primary gross
enrolment ratios (GER) increased by 5% in nine years. It is in the area of EFA goal 2 (free and
compulsory primary education) that achievement rates show that significant progress has been made,
increasing from 43% in 2000 to 64% in 2008. It is estimated that 22 countries will reach the 100% EFA
target by 2015. The challenge of this narrative is that 40% of the primary school leavers cannot read.
Concerning goal 3, (technical and vocation education) the GER has decreased from 9% in 2000 to 7% in
2008. Regarding goal 4 (increasing adult literacy), much remains to be done: the number of illiterate
people in Africa increased from 140 million in 2000 to 153 million in 2008, the majority of whom are
girls and women. Concerning goal 5 (achieving gender parity and equality), in 2008, there were 94 girls
to 100 boys enrolled in primary school. In the first cycle of secondary education this was only 84%.
Finally, regarding goal 6 (improving the quality of education), the situation is still quite challenging and
is the focus of this paper.some 40 per cent of pupils having attended grade 5 of primary school can neither
master the basic competences required to avoid a relapse into illiteracy nor have the basic skills required
to perform a job.
Enrollment in primary education has continued to rise, reaching 89 percent in the developing world.
However, the pace of progress is insufficient to ensure that, by last year (2015), all girls and boys in
developing countries will complete a full course of primary schooling. Nonetheless, Africa has made
tremendous strides toward achieving universal primary education, increasing its net enrollment rate from
65 percent in 1999 to 83 percent in 2008.Today, there are more secondary schools and tertiary institutions
in Africa than there were in 1990. However, Africa’s gross enrollment ratio (GER) of less than 6 percent
is the lowest rate in the world. Most of the reasons for this low GER can be attributed to the continent’s
lack of capacity to absorb the demand, because the number of students seeking admission to tertiary
institutions far outpaces the rate of capacity expansion in these countries.
However, while it would appear that progress has been made in enrolment, the major gap remains in the
areas of infrastructure and most importantly the quality of education. This gap is important because, it is
the indicator with which any society’s development can be predicated. Besides, research shows more and
more that it is cognitive skills and learning, not years of schooling that makes the difference to
development in the long-run. The reason is that cognitive skills will foster innovation and promote
technology diffusion by equipping the workforce with the ability to absorb process and integrate new
ideas into production and service delivery. These cognitive skills are measured by reading, mathematics
and science tests for students. A recent survey article documents that cognitive skills have substantial and
robust effect on economic growth which dwarfs the link between years of schooling and growth.
The key question to ponder at this point is to ask if graduates of our school systems have had their
cognitive skills properly honed and sharpened to translate to development that is the crux of this paper.
This interrogates the qualitative aspect of our education. Earlier on while rolling out the statistics on
education in Africa the word quantitative was highlighted so as to draw attention to the fact that in several
instances in Africa it seems we were obsessed with the numbers and obviously not the quality in terms of
education. However, there is a major gap between the quality of education and its application to real life
situations and by extension its relevance to development. Inventions and research outcomes which should
form the basis of innovation and creativity for industries in Africa have not been sufficiently linked. The

Proceedings of the Third International Research Conference held on 26th to 28th October, 2016 188
relevance of the fields of study, the curricula, and the effectiveness of pedagogy for the development
needs of African countries and the general quality of programs and graduates remain a big challenge (
Ibid). Sadly, the value attached to education has been reduced to obtaining the paper qualification without
any care about the content. In the process both parents and school managers and owners have not only
missed the boat, but in most cases they have subverted the boat of education by drilling holes in it. The
result of that has been the achievement of pseudo-education by so-called educated people who in reality
cannot contribute to solving personal, let alone social challenges. Onyeani (2005) pointed out in his
article entitled Intellectual Bankruptcy of African Elite:
“A people (continent) which regards itself as independent should be able to produce independent thought.
Yet, Africans still depend on Europeans, 40 years after "gaining" their independence from their former
colonial masters and at a new millennium, to furnish us with books on any subject. Our so-called elites
cannot devote enough time to research or to duplicate the same research already conducted and
articulate it in a language Africans can understand. It is any wonder then that we go to school and still
come out illiterates. It is no wonder that despite our years of schooling, if we need our roads built, we
have to contract them out to European engineering firms to build for us; if we need electricity, we get
Caucasians or the Japanese to build them for us; if we need drinking water, we have to import European
or American experts to do them for us. We are "highly educated," yet we cannot even assemble a bicycle -
we have to import it; we cannot assemble a radio - we have to import it; we cannot assemble a fan - we
have to import it; we cannot assemble a television - we have to import it.
According to the United Nations, Africa constitutes the world's poorest land mass. There is poverty
everywhere and the pay of the average man is the lowest in the world. This captures the essence of this
paper that seeks to explore the relevance of our education system to development. In the case of Nigeria it
is pathetic, that in almost all sectors of the economy, investors, business owners and managers have lost
confidence in the ability of graduates of the Nigerian educational system to make meaningful contribution
to their enterprise. This lack of confidence in Nigerian graduates and skilled workers occasioned by
inadequate education portends danger for the nation’s economy in two ways. First, it ensures that
Nigeria’s labour force is at a disadvantage position when competing against foreign labour. The result is
that many Nigerian companies who can afford it would consider hiring a foreign worker ahead of his
Nigerian counterpart. This, in turn, has led to the influx of foreign workers into Nigeria. The situation is
so bad that Asian and Indian skilled workers are taking over jobs that could be done by the Nigerian
counterparts thus leaving many local skilled and educated Nigerians without employment. The situation is
not any better in Kenya where employers are forced to retrain university graduates to align them to the
required job skills and competencies.
Second, it significantly contributes to brain drain as the nation’s brightest prospects seek opportunities in
countries with better developed education systems where their skills and talents are better horned and
appreciated. In many cases, the quest for foreign education has been at the expense of local authorities
and/or governments who offer foreign scholarships to young Nigerians. Yet, such Nigerians hardly ever
return to contribute to the nation’s economy. Instead, they remain in their host countries contributing to
the growth of science, technology, business, art and other fields in such countries. Indeed, whereas it
appears Africa lacks the human resources to ensure its growth and has to look to Western nations for the
people to fix its problems, the reverse is the case. The human resources are abundant all over Africa.
What is lacking is the will, if not the vision, to harness human resources to achieve growth.
Relationship between Education and Various Key Components of the Development Process
Universal free primary education in Kenya and the unemployment situation
Education has been placed at the centre of a nation achieving its sustainable goals and individual’s
achieving full potential. When this goal was set, a threshold of 97% was set for determining whether
universal enrolment has been attained. According to the Ministry of Education in Kenya, the enrolment of
children aged 6 to 13 in primary schools since the introduction of free primary education in 2003 rose
from 87 per cent to 94 per cent between 1993 and 2009 to an impressive 114 percent in 2012. But while
the programme opened up education to the poorest, it has been criticized for compromising standards. A

Proceedings of the Third International Research Conference held on 26th to 28th October, 2016 189
research by Uwezo Kenya, which sampled 102,666 students aged between 3 and 16 in 2,030 schools
countrywide in 2010 found out that almost half of the children in primary schools including those in the
upper classes lacked basic numeracy and literacy skills. These dismal outcomes can be blamed on a weak
early childhood development foundation as well as on socio-economic factors such as poverty and
conflict. The growth in the population of school going children is indirectly proportional to the
infrastructural and human resource expansion. In the last five years, 1,196,200 new children have been
enrolled in primary education but only 3,455 schools have been built and 8,107 teachers with some being
untrained. (Tom Mushidi in Daily Nation, July 21st 2015). Additionally, the youth continue to face
challenges that choke their efforts to maintain an honest livelihood. For instance, about 67% of Kenya’s
unemployed are young people between 15 and 34 years of age. Session Paper Number 4 (2013) identifies
that the highest unemployment rates are for people around 20 years old at 35%. This indicates that
unemployment issue in Kenya is basically a problem of young people. The implication is that the youth
have limited income to sustain their livelihood and participate in social development. This is attributed to
several factors including: limited opportunities for employment, large number of youth seeking
employment due to high birth rates, lack of requisite and basic skills, little or no experience, gender and
cultural bias. Other factors include poor access to information on available opportunities, unfavorable
geographical distribution of available opportunities and ethnic considerations (Harry, 2014).
The challenges facing the youth can be addressed through youth empowerment processes such as giving
them a voice, increasing employment opportunities, ensuring their physical and mental wellbeing by
increasing access to healthcare facilities, expanding academic and skill training institutions, as well as
equipping them with skills that support their resilience after a life in the streets or involvement in conflict
or violence. Ansell (2005) believes that children and youth need to be given a voice and enabled to
participate in development initiatives. Garcia and Fares (2008) advise African nations to address
significant labor market entry problems, such as lack of skills and being unprepared, faced by young
people when entering and remaining in the labor market and which ultimately sabotage their
empowerment. To empower young people, consequently delaying rural-urban migration, the World Bank
(2009) recognizes the need for an integrated, coherent approach in which policies appropriate for the
youth in urban areas are closely connected with policies appropriate for the youth in rural areas. Such
strategies are meant to increase the attractiveness of rural areas to young workers and will facilitate
youths’ acquisition of suitable skills to take advantage of potential opportunities, as well as offer them
second chances by availing them with information and credit facilities.
Based on the aforesaid, educational reform, whether introduced from within or outside the system, has the
great potential for inducing corresponding social and economic reform in the nation as a whole. The
challenge is to align the education system to the developmental agenda of a Country. When it comes to
development, we can borrow a leaf from Todaro’s (2000) observation cited in Mulwa (2010) about the
three key questions to be asked as indicators of development. They include:
What has been happening to poverty?
What has been happening to unemployment?
What has been happening to inequality?
Where do we go from here? There is no single solution to Africa’s education challenges. For the continent to realize its full potential
and take advantage of its human and natural resource base for development there must be holistic reforms
of the approach to education. Such reforms must be tailored to suit the specific needs of individual
countries. Regional and sub-regional actors must recognise that not all African countries have the same
educational challenges. For instance while some countries in Sub-Saharan Africa are still battling with
school enrollment, others have achieved significantly high rates and are now more focused on improving
the quality of education or addressing gender gaps in enrolment. These disparities make it necessary to
review the challenges of individual countries in order to develop programmes that are effective in
promoting education in such countries. This does not imply that, regional interventions are impossible or
unnecessary. What is clear is that regional bodies can only provide guiding principles that will ensure the
utilization of education for the continent’s overall growth. Such guiding principles would include

Proceedings of the Third International Research Conference held on 26th to 28th October, 2016 190
recommendations on effective research and policy formulation, improved investment in education
infrastructure and service provision, gender mainstreaming, monitoring and evaluation, Vocational and
Technical Education, curriculum development, and training, . Ultimately, the success of achieving this
lies within the willingness of the individual countries to vigorous pursue reforms along these lines.
The starting point in reforming Africa’s education systems for the continent’s development is informed by
the need to deconstruct and reconstruct the philosophical underpinnings of the systems to meet the
specific needs of individual countries. Such a reconstruction of the system must place significant
emphasis on cognitive skills. The United Nations Economic Commission for Africa 2005 report on
Youth, Education, Skills and Employment observes that Africa’s youth face many challenges in gaining
an education that delivers them with the right set of skills and knowledge demanded by the labour market.
As a consequence, the transition from school to work is more often than not unsuccessful such that young
Africans end up either unemployed (typically university graduates) or underemployed in the rural and
urban informal sectors. There seems to be a consensus that African countries must significantly shift from
emphasizing quantity of schooling in their education systems to systems that promote more pragmatic,
practical problem-solving approaches of education. The current disconnect between our hopes and
aspirations as a continent and the value of education we offer expecting it to drive us to the destination is
still very much disjointed and calls for a holistic review. The key to economic success in a globalized
world increasingly lies in how effectively a country can assimilate knowledge and build comparative
advantage in selected areas.
While compulsory primary and secondary education will ensure that we lift a large number of African
youth above the illiteracy bar, sustained, strong, and diversified economic growth depends largely on
tertiary education that is attuned to the needs of the job market. Relevant tertiary education will also help
address Africa’s current challenges arising from climate change, population growth, uncontrolled diseases
and depraving poverty.
The outcome of these reviews will provide a clear picture of areas of interventions that can be harmonized
sub regionally and continentally to allow for more coordinated responses and interventions. This will also
provide basis for measuring progress when the interventions have been deployed. While the current
campaign to enroll all African children into school must be achieved alongside ensuring the Universal
basic Education target, we must also take a step further in Africa to ensure that our youth follow through
their education to Tertiary levels and also encourage technical and vocational skills acquisitions.
We must invest massively in educational infrastructure side by side huge investments in Teacher training
and curriculum review and development. Our Educational curriculum must speak to our societal needs
and aspirations. There should never be a disconnect if we are not educating people for other climes or
societies. Government must invest in research and development. Our youths must see that their critical
reasoning abilities are shaping the world they live in. Providing the platform for African youth to be part
of the development process must not only be based on necessity but also on their ability to contribute
meaningfully to development. We must encourage exchange programmes even within African
educational institutions.
Theoretical Orientation This paper is anchored on the capability approach. The capability approach was developed as a means for
re-conceptualizing human development (Sen, 1999, 2009). Sen starts with an alternative view of the goals
of human development from those suggested by human capital theory. For Sen, it is the realization of
human capabilities and well-being rather than the pursuit of wealth that should underpin development.
Thus while prosperity and growth are important, their significance lies in the extent to which they can
contribute to the realization of valued capabilities. Capabilities are the opportunities that individuals have
to realize different ‘functionings’ that they may have reason to value (Ibid). Over the last decade Amartya
Sen’s Capability Approach (CA) has emerged as the leading alternative to standard economic frameworks
for thinking about poverty, inequality and human development generally. Sen argues that “wealth is
evidently not the good we are seeking; for it is merely useful and for the sake of something else. In
Proceedings of the Third International Research Conference held on 26th to 28th October, 2016 191
judging the quality of life we should consider what people are able to achieve. Sen further observes that
different people and societies typically differ in their capacity to convert income and commodities into
valuable achievements. He goes ahead to describe a more direct approach that focuses on human
function(ing)s and the capability to achieve valuable function(ing)s. In a nutshell, development should be
contextualized as described below through Freire’s principles
Way forward; The Paulo Freire’s Principles (Adapted from Hope and Timmel, 1995)
To align education to development, we can adopt the following six distinct principles by Freire cited in
Mulwa ( 2010).
Aim of Education and Education should be Radical Transformation
According to Freire, the aim of education should be to transform life for the better as opposed to
reinforcing the status quo as the way life is today is not the way it was 50 years ago and we can also make
it different 50 years from now. The education system should also aspire to transform individual lives, the
lives of families, small groups, communities, institutions and the society at large. At personal level,
people need to confront their fears, negative completion, hostility, and anger, lack of trust, negative pride,
selfishness, stereo –typing, segregation, injustice, and egocentrism. This can occur through the belief that
change is not only possible but also desirable for a more fulfilling community life. Transformative
education is based on the hope that it is possible to change life for the better. The above can be achieved
through efforts of going deep into the root causes of problems like poverty, injustice and suffering.
Development Agenda and Education Curriculum should be Relevant to People’s Needs
In order to make education relevant to people’s needs, it is paramount to interrogate what is important in a
given community. Freire holds that there exist a close correlation between emotion and motivation to act.
It is not practical to expect to move people into action exclusively on the basis of rational debates and
logic if the content of such debates is irrelevant to what concerns them in their lives. Appeal to people’s
emotions motivates them to action and is achieved by ensuring the relevance of development agenda and
education curriculum to people’s needs. He asserts ( Ibid) that education that ignores human feelings is
incomplete since feelings are facts and the development process should of necessity begin from issues a
community has strong feelings about so that they feel that their struggles are worth. The issues that
address the felt needs of the people are what Freire calls”generative themes” which are the issues that
release the energy and break through the apathy.
Dialogue
Dialogue stems from the belief that nobody knows everything and hence nobody can claim the monopoly
of knowledge. Similarly, nobody is totally ignorant and has valuable information to contribute. Learning
therefore is no longer a process of a teacher depositing education into the empty mind of the pupil but
dialogue aims at drawing out insights of all concerned to discover the best solutions which perfects the
capacity to think and make judgments. This is based on the observation that people learn and apply more
when they learn from dialogue with peers than from lectures from experts. Dialogue then requires
patience, humility and faith in people and value in what they know and openness to new information and
willingness to be challenged.
Problem-Posing and the Search for Solutions
Once generative themes are established, you need to establish challenging and interesting ways of
presenting the issues back to the people for discussion and action planning which maybe an issue that
they are familiar but lacking systematic organized information. The teacher/ lecturer facilitate discussions
by giving a chance for everyone to contribute which paves way for collective planning and action.
Reflection and Action
As the group or community begins to implement what it plans, it derives a lot of energy and motivation
from achieving some of the goals in its dreams and in the process identifies gaps in what they do( areas of
dissatisfaction). They then identify new skills or information they would need for more fulfilling results
and where new training is required, it is planned for which further helps to dig deeper to address the root

Proceedings of the Third International Research Conference held on 26th to 28th October, 2016 192
causes of a problem. Some groups however learn better from the experiences of others through
occasional external inputs and exposure tours to learn from what others do and how they do it.
No Information or Information is Neutral – it will either Domesticate or Liberate No teacher is ever fully objective as we are all conditioned by our life experiences. Teachers/lecturers
should evaluate the extent that they use their role and power to try and shape others into our image and
instead encourage learners to develop along their own unique paths. Additionally, they should guard the
extent they have used their own education to domesticate others to fit “obediently” into the roles required
of them by the dominant culture as opposed to reinforcing and supporting their struggles for liberation
into critical, creative, free, active and responsible members of society.
CONCLUSIONS
Education is a strategic factor in development. The growth of any society is largely dependent on the
capacity of its human resources to confront challenges and find solutions that are useful and familiar to
the society. For Africa to achieve any meaningful development over the next few years, individual
countries must begin to develop well thought out policies that will ensure not just mass literacy but also a
full utilisation of the educated mass for economic and social growth. Previous development meetings
have highlighted the major challenges impeding the growth of quantitative and qualitative education in
Africa and consequently Africa’s growth. What is lacking, however, is the political will to implement and
sustain the recommendations of such meetings.
Developing nations are confronted with two basic alternatives in their policy approaches to problems of
education. They can continue automatically to expand formal systems at the fastest possible pace with
perhaps some minor modifications in curricula, teaching methods, and examinations, while retaining the
same institutional labor market structures and educational costing policies. Or they can attempt to reform
the overall educational system by modifying the conditions of demand for and the supply of educational
opportunities and by reorienting curricula in accordance with the real resource needs of the nation. Our
evidence leads to the conclusion that the first alternative is likely to exacerbate the problems of
unemployment, poverty, inequality, rural stagnation, and international intellectual dominance that now
define the conditions of underdevelopment in much of Africa, Asia, and Latin America and that the
second alternative should therefore be pursued that will hopefully translate into education for
development.
REFERENCES
Atchoarena, D. and A. Delluc (2001). Revisiting Technical and Vocational Education in Sub-Saharan
Africa: An Update on Trends, Innovations and Challenges. Paris: International Institute for
Educational Planning, World Bank.
Beggs, J. J. and Hurlbert, J. S. (1998). The Social Context of Men's and Women's Job Search Ties:
Membership in Voluntary Organizations, Social Resources, and Job Search Outcomes.
Sociological Perspectives, 40(4), 601-622.
Bennell, P. (1999). Learning to Change: Skills Development among the vulnerable and socially Excluded
in Developing Countries, Employment and Training. Geneva: sILO
Bentham, J. (1814-1831). Deontology in deontology, together with a table of the springs of action and the
article on utilitarianism. A. Goldworth (Ed.). Clarendon Press, Oxford 1983, pp. 117-281.
Chika O. - Intellectual Bankruptcy of the African Elite
http://africaunchained.blogspot.com/2005/08/intellectual-bankruptcy...
http://www.uneca.org/eca_programmes/policy_analysis/publications/yo....
ECOSOC Annual Ministerial Review Regional Preparatory Meeting for Africa “The right to Education
for All in Africa: Reinforcing quality and equity” Concept Note. Lome, Togo 12 April 2011.
Education for Development is the thematic focus of the Second Farm House Dialogue Held in Ota,
Nigeria.
Eric A. Hanushek and Ludger Woessman. 2008. “The Role of Cognitive Skills in Economic
Development.” Journal of Economic Literature 46:3, 607-668.
Government of Kenya. (2007). Kenya Vision 2030. Nairobi: Government Press.

Proceedings of the Third International Research Conference held on 26th to 28th October, 2016 193
Harry, L. K. (2014). Kenya Country Report for the 2014 Ministerial Conference on Youth Employment:
Policies, Mechanisms and Schemes for Integration of Youth into the Workforce and Job Creation.
Abidjan, Côte d’Ivoire.
Mulwa, F. (2010). Demystifying participatory community Development; Nairobi: Paulines.
Sen, A. (1980). Equality of What’ in Sterling M. McMurrin (ed.), The Tanner Lectures on Human Value.
Salt Lake City: University of Utah Press
The Africa Competitiveness Report 2011 © 2011 World Economic Forum, the World Bank and the
African Development Bank
Todaro, M and Smith, S. (2011). Economic Development (11thedn). England: Pearson education Limited
United Nations Development Program, World Development Report. 1992 (New York: Oxford University
Press, 1992), annex tab. 29. p.367 ******
INTERPERSONAL ADAPTATION ON ACADEMIC ACHIEVEMENT AMONG BOYS AND
GIRLS STUDENTS IN BOARDING SECONDARY SCHOOLS IN MERU COUNTY, KENYA
Nyaga, V.K. and Murithi, G.G. Chuka University, Department of Education, P. O. Box 109-60400,Chuka, Kenya
Email: [email protected] and [email protected]
ABSTRACT
Academic achievement among secondary school students in Kenya is important because this determines
future chances for advancement in life in terms of career options, further studies and sociopolitical
appointments in the society. Hence, there is need to examine factors that may influence academic
achievement among secondary school students in the country for which adaptation in school is key.
Consequently, this study sought to examine the impact of interpersonal adaptation on academic
achievement among secondary school students with special emphasis on comparing boys and girls in
boarding secondary schools in Meru County in Kenya. The study employed the descriptive survey
research design on a sample size of 384 students, school counsellors and deputy principals in boarding
secondary schools in Meru County. Questionnaires and interview schedules were used to collect the
required data. Descriptive and inferential statistics such as means, standard deviations and t-test statistic
were used to analyze the data with the aid of the Scientific Package for Social Sciences version 20.0. Data
analysis results revealed that although interpersonal adaptation impacted positively on academic
achievement, there were no significant differences in the impact between boys and girls in boarding
secondary schools. Thus, to improve and sustain academic achievement among secondary school
students, measures need to be put in place to enhance interpersonal relationships among students as well
as between students and school staff, school administrators, relatives and parents.
Keywords: Interpersonal, Adaptation, Academic achievement.
INTRODUCTION
A school is a place where children develop a variety of competences that help to define self and ability;
where friendship with peers is nurtured and the role of the community member is played out (Goods and
Weinstein, 1986). Typically, students do not learn or exist alone but rather in close collaboration with
their school colleagues and with encouragement from significant others (Weissberg and Myrisk, 2007).
Thus, interpersonal adaptation is essential for social acceptance which requires that a person obeys social
norms, beliefs and values set by a group, organization or society. The way the school is organized, its
rules and regulations, the routine work, the curriculum and teaching methodologies may make many
students to run from or stay in school (Wango and Mungai, 2007). How well a student adapts to the
school social environment will determine academic achievement.
A student’s interpersonal adaptation may have its foundation in the home environment and at school with
factors inherent in these two environments determining how well the student relates with other people.
Shengchao and Hannum (2007) argue that the home background has influence on a students’ intellectual,
psychosocial, moral and spiritual development. For example, parents who constantly fight and disagree
affect children emotionally and this could lead to dismal academic achievement at school. According to
Wango and Mungai (2007) a child may have psychosocial maladjustment as a result of parental pressure

Proceedings of the Third International Research Conference held on 26th to 28th October, 2016 194
and demand for perfection which take the form of criticism, abuse and scolding at the slightest mistake.
Children in broken homes may not get affection, love, sympathy and security thus vulnerable to social
challenges. There are some emotionally disturbed homes which may be in constant conflict between
parents and other members of the family; such provide conditions which may affect security, affection,
mental stability and fulfillment of needs of children (Wango and Mungai, 2007). Some parents reject their
children because of some personal inadequacies such as physical and mental disabilities; the rejected
child develops feelings of insecurity, helplessness and loneliness. This creates frustration and may lead to
psychosocial maladjustment that affects academic achievement. Inappropriate parent child relationships
may give rise to quarrels, disagreements and fighting resulting into truancy, stealing, dishonesty, guilt and
a sense of inferiority at school. This may end up affecting a student’s academic achievement.
Osterman (2000) asserts that when students perceive their teachers as supportive, disruptive behaviour
decreases and students perception of successful interactions with teachers increase. The quality of student
teacher relationship is positively associated with student academic motivation and attitudes towards
school. Teacher student relationship provides an essential foundation for effective classroom management
which is essential to students’ academic achievement. Teachers can influence the dynamics of their
classroom and build strong teacher student relationship that will support student learning. Wetnzel (1997)
points out that the teacher student relationship is a critical fact that motivates middle school to engage in
the academic and social activities of the classroom. The Government of Kenya, (2005) recommends the
need to set services that will equip learners with skills that enable them to meet growth and development;
the need for enhanced physical and psychosocial health.
To attain the goals of Vision 2030, the Kenyan learning institutions need to provide globally competitive
quality education and training to her citizens thus contributing to the development of individual
wellbeing. There is need to establish independent mechanism for effective and timely handling of
students’ complaints and issues such as commitment to duty, accountability, transparency, unfairness,
bias and sexual harassment (Vice Chancellors Report, 2002). Improving school systems and early
intervention may help reduce risk factors. According to Lockesh (1984) studies indicate that attributes
such as physical attractiveness and social skills such as the ability to self disclose and social competence
are instrumental in developing social support and promoting interpersonal adaptation. There is need to
examine impact of interpersonal adaptation on academic achievement among secondary school students.
Objectives
This study determined the impact of interpersonal adaptation on academic achievement with a view of
comparing this impact between boys and girls in boarding secondary schools in Meru County, Kenya.
METHODOLOGY
This study adapted the descriptive survey research design which was deliberately used to obtain important
and precise information concerning status of the phenomena and draw valid conclusions from the
discovered facts (Lockesh, 1984). The target population of the study was 55,224 respondents comprising
of students, school counsellors and deputy principals of secondary schools in Meru County. Purposive
sampling and simple random sampling techniques was used to obtain a sample of 384 respondents.
Questionnaires and an interview schedule were employed for collection of the desired data. The
researcher sought advice from University Supervisors and research experts to ascertain the validity of the
instruments. Reliability of the research instruments were estimated by use of split-half technique which
generated a correlation coefficient of 0.78. The research permit was granted by the National Commission
for Science Technology and Innovation. To mitigate unethical practices, informed consent was sought
from the respondents before administering the research instruments and thereafter confidentiality was
observed. The collected data were analyzed using inferential and descriptive statistics with the aid of
Statistical Package for Social Sciences version 20.0.
RESULTS
The following were the results of data analysis:

Proceedings of the Third International Research Conference held on 26th to 28th October, 2016 195
Demographic Characteristics of the Respondents
The information on demographic characteristics of the respondents was considered necessary in
understanding the nature of the study participants. The gender of student participants was proportional
with 180 students of each gender due to the comparative nature of the study. The age composition of the
students ranged from 16 years and below to 19 years and above with majority (50.6%) being 17 years old
followed by 33.9% of the 16 year olds or below. Students who were 18 years old comprised 10.8% while
only 4.7% were 19 years and above. General information was also sought on how students rated
themselves academically. Respondents who rated themselves as average were 63.3%, above average were
27.2% and 9.4% rated themselves below average.
School counsellors were required to indicate their gender and data analysis results revealed that 41.7%
were male while 58.3 were female. Majority school counsellors (41.6%) had served as school counselors
for more than 5 years, 25% had served between 3 years and 4 years, while 16.7% had served for less than
1 year and between 1 year and 2 years each. This denotes that most of the school counsellors had enough
experience to inform this study. Regarding the highest level of education, most school counsellors (50%)
had a Bachelors Degree, 41.75 had Masters Degree while 8.3% had a Diploma. Most school counsellors
(75%) were married while the remaining 25% were single.
The Deputy Principals’ gender was proportional with the age ranging between 40 and 50 years.
Concerning academic qualification, 58% had Bachelors Degree while 48% had a Masters Degree. Most of
the Deputy Principals (53%) had served in the current position for more than five years, 32% had served
between 2 years and 5 years while 15% had served for less than 2 years.
Impact of Interpersonal Adaptation on Academic Achievement
To determine the impact of interpersonal adaptation on academic achievement among students in
boarding secondary schools in Meru County, the student were required to indicate their level of
agreement with interpersonal adaptation statements. A 5 level likert scale rated 5=Strongly Agree,
4=Agree, 3=Undecided, 2=Disagree and 1=Strongly Disagree was employed. Since the interpersonal
adaptation statements were positively stated, a mean score below 2.5 indicated Low Impact, between 2.5
and 3.5 indicated Moderate Impact while a mean score above 3.5 indicated High Impact. The results of
data analysis were presented on Table 1.
Table 1 reveals a high impact of interpersonal adaptation on academic achievement depicted by an overall
mean of 3.86 and a standard deviation of 1.16. The interpersonal adaptation factors that had moderate
impact on academic achievement among the secondary school students were involvement in co curricula
activities and good relationship with school leaders (prefects) with a mean score of 3.47 each and
standard deviations of 1.31 and 1.37 respectively. A question item in the questionnaire required student
participants to rate their interpersonal relationship with other people. Information in Figure 1 represents
the data analysis results.
As indicated in Figure 1, majority of the students rated themselves as having fair, good or very good
interpersonal relationships with other people. This means that majority of the students were doing well in
interpersonal adaptation. Further the students were asked to indicate whether their interpersonal
adaptation had a positive or negative impact on academic achievement. Data analysis results were
represented in Figure 2.
Information in Figure 2 suggests that majority of the students felt that interpersonal adaptation positively
contributed to academic achievement. The school counsellors were required to indicate their level of
agreement with interpersonal adaptation statements. A 5 level likert scale rated 5=Strongly Agree,
4=Agree, 3=Undecided, 2=Disagree and 1=Strongly Disagree was employed. Since the interpersonal
adaptation statement were positively stated, a mean score below 2.5 indicated Low Impact, a mean score
between 2.5 and 3.5 indicated Moderate Impact while a mean score above 3.5 indicated High Impact. The
results of data analysis were represented on Table 3.

Proceedings of the Third International Research Conference held on 26th to 28th October, 2016 196
Table1: Students’ Views on Impact of Interpersonal Adaptation and Academic Achievement
Interpersonal Adaptation and Academic Achievement Statements N Mean
Standard
Deviation
Students who relate well with their colleagues achieves better
academically 360 4.13 1.06
Students who are friendly to their parents performs well academically 360 4.46 0.91
Students who get along well with others have a better academic
achievement 360 4.04 0.99
The commitment observed by students in teachers makes them to do
well academically 360 3.94 1.22
Those students who have a strong stand against peer influence do well
academically 360 3.99 1.19
Students who are friendly with teachers performs well academically 360 3.96 1.17
Students who choose to respect other students’ opinion performs well
academically 360 3.82 1.23
Students competence to choose friends wisely performs well
academically 360 4.20 0.98
Participation of students in group discussions exposes them to better
academic achievement 360 4.30 0.92
Involvement in co curriculum activities has a positive impact on
students’ academic achievement. 360 3.47 1.31
Those students who relate well with their school leaders(prefects)
have a positive achievement in their academic 360 3.47 1.37
Sharing freely of students with others has a positive influence on their
academic achievement 360 3.70 1.30
Students relationship with relatives enhances their academic
achievement 360 3.68 1.30
Students who have regular consultation with their guidance and
counseling master achieves better academically 360 3.64 1.31
Students ability to relate well with the school management boost their
academic achievement 360 3.54 1.25
Students ability to relate well with the school support staff boost their
academic achievement 360 3.46 1.03
Overall mean 360 3.86 1.16
Valid N (listwise) 360
Figure 1: Rating Boys and Girls Interpersonal Relationships with Other People
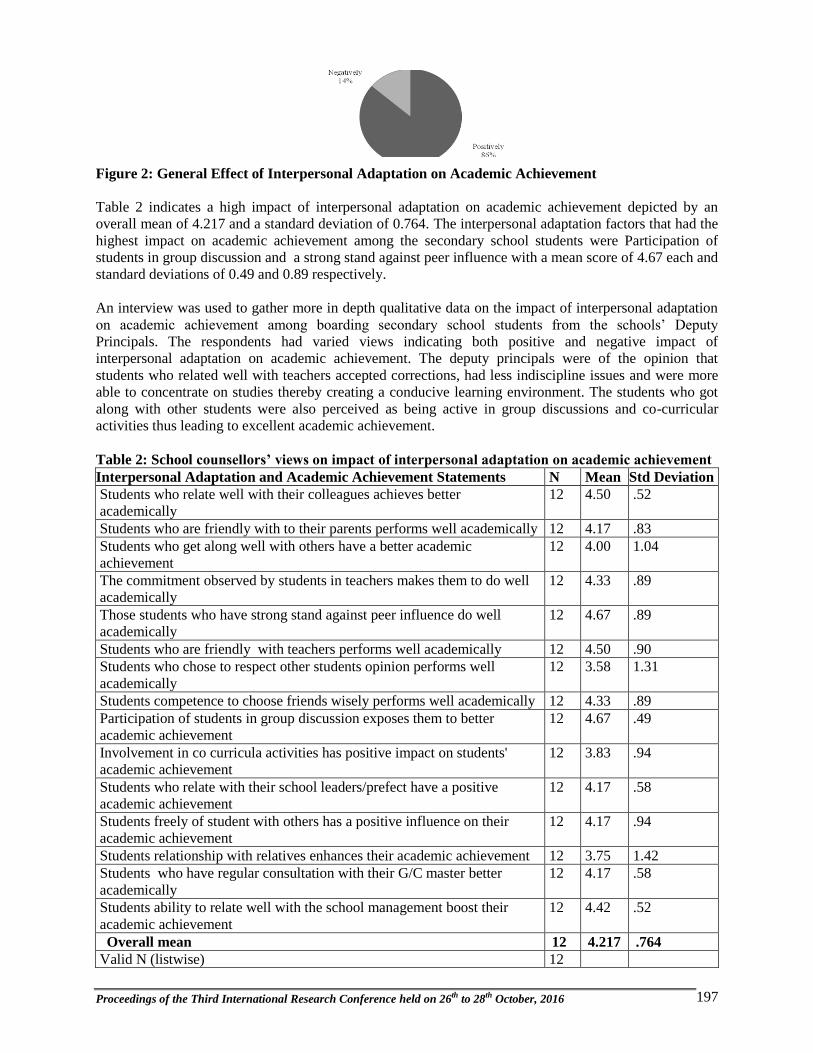
Proceedings of the Third International Research Conference held on 26th to 28th October, 2016 197
Figure 2: General Effect of Interpersonal Adaptation on Academic Achievement
Table 2 indicates a high impact of interpersonal adaptation on academic achievement depicted by an
overall mean of 4.217 and a standard deviation of 0.764. The interpersonal adaptation factors that had the
highest impact on academic achievement among the secondary school students were Participation of
students in group discussion and a strong stand against peer influence with a mean score of 4.67 each and
standard deviations of 0.49 and 0.89 respectively.
An interview was used to gather more in depth qualitative data on the impact of interpersonal adaptation
on academic achievement among boarding secondary school students from the schools’ Deputy
Principals. The respondents had varied views indicating both positive and negative impact of
interpersonal adaptation on academic achievement. The deputy principals were of the opinion that
students who related well with teachers accepted corrections, had less indiscipline issues and were more
able to concentrate on studies thereby creating a conducive learning environment. The students who got
along with other students were also perceived as being active in group discussions and co-curricular
activities thus leading to excellent academic achievement.
Table 2: School counsellors’ views on impact of interpersonal adaptation on academic achievement
Interpersonal Adaptation and Academic Achievement Statements N Mean Std Deviation
Students who relate well with their colleagues achieves better
academically
12 4.50 .52
Students who are friendly with to their parents performs well academically 12 4.17 .83
Students who get along well with others have a better academic
achievement
12 4.00 1.04
The commitment observed by students in teachers makes them to do well
academically
12 4.33 .89
Those students who have strong stand against peer influence do well
academically
12 4.67 .89
Students who are friendly with teachers performs well academically 12 4.50 .90
Students who chose to respect other students opinion performs well
academically
12 3.58 1.31
Students competence to choose friends wisely performs well academically 12 4.33 .89
Participation of students in group discussion exposes them to better
academic achievement
12 4.67 .49
Involvement in co curricula activities has positive impact on students'
academic achievement
12 3.83 .94
Students who relate with their school leaders/prefect have a positive
academic achievement
12 4.17 .58
Students freely of student with others has a positive influence on their
academic achievement
12 4.17 .94
Students relationship with relatives enhances their academic achievement 12 3.75 1.42
Students who have regular consultation with their G/C master better
academically
12 4.17 .58
Students ability to relate well with the school management boost their
academic achievement
12 4.42 .52
Overall mean 12 4.217 .764
Valid N (listwise) 12

Proceedings of the Third International Research Conference held on 26th to 28th October, 2016 198
Deputy Principals blamed the negative impact of interpersonal adaptation on academic achievement
among secondary school students on negative peer influence. Students who were easily influenced into
social ills such as drug abuse, gangs, sexual perversion, strikes and destruction of property tended to be in
good interpersonal relationships within those groups. The interpersonal adaptation also caused some
students to waste time and resources in non academic activities such as gossiping and telling stories
leading to low academic achievement, cheating in examinations and dropping out of school.
Comparison of Impact of Interpersonal Adaptation of Boys and Girls on Academic Achievement
To compare variability between boys and girls with regard to the impact of interpersonal adaptation on
academic achievement in boarding secondary schools, t-test statistic was computed. The findings were
represented in Table 3.
Table 3: Comparison of impact of interpersonal adaptation on academic achievement t-test results
School N Mean SD t-value p-value
Interpersonal
relationship
Boys
Girls
180
180
3.88
3.87
0.59
0.60
0.07 * 0.71
*Denotes significant at α=0.05
According to information in Table 3, the mean for boys (3.88) and girls (3.87) on impact of interpersonal
adaptation on academic achievement was almost equal with standard deviations of the 0.59 and 0.60
respectively. The computed p-value (0.71) was greater than the theoretical p< 0.05. The obtained t-value
(t= 0.07, p > 0.71) was indicative of no significant difference in the impact of interpersonal adaptation on
academic achievement between boys and girls in boarding secondary schools in Meru County.
RESULTS AND DISCUSSION
This study found a high impact of interpersonal adaptation on academic achievement among secondary
school students. Students who related well with teachers were perceived as being positive in accepting
corrections and therefore achieving high academic grades. In agreement with this finding, Osterman
(2000) observes that when students perceive their teachers as supportive, disruptive behavior decreases
and students’ perception of successful interactions with teachers increases. As a result, this teacher
student relationship provides an essential foundation for school management which is important for high
students’ academic achievement (Wetnzel, 1997). Donna (2009) ascertains that free interaction among
members provides support and comfort in resolving difficulties and alternatives behaviour is learned.
When students interact well with the significant others they are bound to create conducive environments
that will result to high levels of academic achievement.
Data analysis results revealed a high impact of student parent interpersonal adaptation and academic
performance. Those students who related well with their parents tended to achieve well academically.
According to Charles (2002), home environment has a significant influence on a child’s academic
achievement. This is because there is a positive correlation between a Childs’ attitude towards academic
and the parents’ attitude towards the same. Therefore students who had good interpersonal adaptation
were expected to achieve better academically. Similarly, students who participated in class and group
discussions were associated with high academic achievement. This finding is in line with Willing (2001)
which maintains that participation in classroom activities where students work together and help each
other results to high academic achievement.
The deputy principals were of the opinion that interpersonal adaptation may lead to time wastage and
negative peer influence generating vices such as drug abuse, gossiping and sexual perversion among
others culminating in dismal academic achievement. Charles (2002) observed that most psychosocial
adjustment challenges occur as students attempt unsuccessfully to meet a universal psychosocial need of
belongingness. Students want to feel secure, welcome and valued; and to a large extent their behaviour
influences how well those needs are met in the classroom. Those students with psychosocial adjustment
challenges at times talk without permission, call each other sarcastic names and laugh when they should
not. According to Donna (2009) students who continually break the school rules like talking in class

Proceedings of the Third International Research Conference held on 26th to 28th October, 2016 199
without permission or getting into fights need to be seated away from others who might get influenced by
them. This may remedy negative peer influence occasioned by interpersonal adaptation as indicated by
deputy principals. There being no gender differences in the impact of interpersonal adaptation on
academic achievement, measures taken to enhance interpersonal adaptations that positively contribute to
academic achievement may need to be similar for both boys and girls in secondary schools.
RECOMMENDATIONS
Based on the findings of this study, the following recommendations were made:
i. School counsellors need to design intervention strategies that would enable students to live in
harmony with colleague students, teachers, school staff, the school administrators, parents, relatives
and the society members.
ii. School administrators may consider strengthening activities such as sports, communal work, religious
societies, clubs, entertainment and pseudo families that encourage peaceful coexistence among
students in boarding secondary schools.
iii. The life skills syllabus may need to be revised in order to integrate more contemporary issues relating
to interpersonal adaptation.
iv. There is need for the Ministry of Education to develop awareness programs to educate and sensitize
the public about the importance of enhancing interpersonal adaptation among secondary school
students as a strategy of improving academic achievement.
REFERENCES
Charles, C.M. (2002). Building Classroom Discipline. Allyn and Bacon. USA
Donna, R. (2009). Does and donts of behaviour mgt. London: Continuum International Publishers.
Goods,T.L., and Weinstein,R. (1986). Schools make a Difference: Evidence, Criticisms, and new
directions. American Pychologists.
Government of Kenya, (2005). Kenya Education Sector Support Programme 2005-2010: Delivering
Quality Education and Training to all Kenyans. Nairobi: Government Printer.
Lockesh, K. (1984). Methodology of Educational Research. New Delhi,Vani Educational books
Osterman, K.F., (2000). Students need for Belonging in School Community. Review of Educational
Research 70:323-367.
Shengchao, Y. and Hannum, E. (2007). Food for thought: poverty, family nutritional environment and
children’s educational performance in rural China. Retrieved on 8th November 2011 from Http;//
repository.upenn.educ/cgi/veewcontent.cgi?
Vice-Chancellor Committee Report. (2000). Causes of Disturbances/Riots in Public Universities. Nairobi.
Jomo Kenyatta Foundations.
Wango, M.G. and Mungai,E.K. (2007). Guidance and Counseling Handbook for Teachers. Nairobi:
Uzima Publishers.
Weissberg, J. and Myriks, C. 2007. Resolving conflicts creativity in community psychology and schools:
A prosocial behaviour and academic achievement. Chicago: Behavioral Research Associations.
Wentzel, K. R. (1997). Student Motivation in Middle School: The Role of Perceived Pedagogical Caring.
Journal of Educational Psychology, 89, 411-419
Willing, C (2001). Introduction to Qualitative Research in Psychology. Adventures in theory and Method.
Philadephia: Open University Press ******
PHILOSOPHICAL FOUNDATIONS OF KISWAHILI COMPOSITION WRITING
Njagi, Z.1 and Odundo, P.A.2
1Department of Education, Kenya Methodist University, P. O. Box 267-60200, Meru; 2University of Nairobi, P. O. Box 30197-00100, Nairobi
ABSTRACT
The philosophical underpinnings of composition writing can be traced to Edgar Allan Poe artistic works
of poetry that dominated American poetry in the 19th century and Walt Whitman 20
th century poetry in
Europe. Similar to a poem that does not deliver excitement to the audience a composition should equally

Proceedings of the Third International Research Conference held on 26th to 28th October, 2016 200
balance between the success with the audience and the critical taste. A further reflection on four theories
of philosophy of compositions gives an insight to this philosophical foundation: the expressive theory,
which places emphasis on the writer; the mimetic theory, which emphasizes correspondence with reality;
the rhetorical theory, which focuses on the effect to the reader and lastly the formalist theory which
emphasizes traits internal to the work. More emphasis has been put on five characteristics of a
philosophical paper, which depicts philosophical argumentation thus qualifying Kiswahili composition
writing to be philosophical. In support of this, composition is not a manifest of either accident or
intuition; it is work that proceeds step by step to its completion, with the precision and rigid consequence
of a mathematical problem.
Keywords: Philosophizing, Philosophy of composition, Argumentation, Philosophical analysis, Subject
matter, Educational dimensions
INTRODUCTION The term Philosophy stems from two Greek words: Philos (love) and Sophos (wisdom). Thus
etymologically, philosophy means the love or the pursuit of wisdom (Njoroge and Bennaars, 1986). To
get appropriate philosophical loci for Kiswahili composition writing, it is imperative to gain an insight in
the debate of philosophy of composition as envisaged by seasoned artists and subsequently merge their
thinking with the thinking in technical philosophy.
The Philosophy of Composition
The philosophical underpinnings of composition writing can be traced to Edgar Allan Poe (1845) artistic
works of poetry that dominated American poetry in the 19th century and Walt Whitman 20
th century
poetry in Europe. Similar to a poem that does not deliver excitement to the audience a composition
should equally balance between the success with the audience and the critical taste (Bucur 2009). Poe
pointed out that an improperly brief essay degenerates into mere epigrammatism. This ought to be evaded
in composition writing. In the philosophy Poe (1845) allude that a composition can be read as a
document of American thinking either as pragmatic, empirical approach to writing or as a technical
product. This is what paved way for the unity between creativity in writing and peoples culture. To
gain more understanding of Kiswahili composition writing in these philosophical dimensions we ought
to further to reflect on Abram’s (1953) four theories of philosophy of compositions as explained by
Fulkerson (1979). First, is the expressive theory which places emphasis on the writer. Second, is mimetic
theory, which emphasizes correspondence with reality. The third is the rhetorical theory which focuses
on effect to the reader, and lastly the formalist theory which emphasizes traits internal to the work.
It can be argued that composition writing can be classified as philosophical papers due to its address of
the five characteristics (Portmore, 2001; Chudinoff, 2007). First is the purpose of the paper or what
the author sets out to do and why. Secondly, the audience- each paper has an audience- the people who
will find the paper interesting and helpful. The third characteristic has to do with argumentation- the
local bits of reasoning that serve the purpose. In the fourth point, a paper has a narrative or the global
structure into which the arguments are arranged. The fifth characteristic addresses the style or the
manner in which the paper is written. According to Portmore (2001) the exploration of ideas in
composition writing depicts philosophical argumentation thus qualifies to be philosophical.
In furthering this argument Thomas (2014) posits that composition writing is an art that revolves around
evaluation and development of correct reasoning and effective style. Thus concurring with Portmore
(2001) and Rippon (2008) contention that composition ought to be seen as an organized argumentative
writing which reflects correct deductive and inductive reasoning; fallacies; critical appraisal of evidence;
construction of rebuttal and counter-arguments. Bucur (2009) also joins this debate of The Philosophy of
Composition and adds that composition is not a manifest of either accident or intuition it is work
that proceeds step by step to its completion, with the precision and rigid consequence of a mathematical
problem. Though Clark (2009) proposes analytical philosophy as basis for broad understanding of
compositions, this concept will only limit us to the subject matter envisaged by the proponent’s but not
concept of knowledge this study sought to delve in.

Proceedings of the Third International Research Conference held on 26th to 28th October, 2016 201
Philosophical Analysis of Teaching Since this study focused on pedagogical methodologies, it is inescapable to analyze teaching
composition in philosophical terms. While educators view teaching as process of imparting skills and
knowledge (Nasibi, 2003), philosophers look at it in terms of the conceptual connection between
teaching and learning (Noddings, 1998) as postulated by Dewey (1933). According to Dewey (1933)
teaching and learning is conceptualized as the relationship between the ‘seller’ and the ‘buyer’-no one
sells unless someone buys. This implies the two take place simultaneously. However, most philosophers
of 1960s challenged the notion that ‘teaching implies learning’ instead they held a different view.
While teachers intend to effect learning learners on the other hand fail to learn even when the teacher
works hard to teach them (Noddings, 1998). Notably, some of these philosophers wanted to protect
teachers from the unfair attacks that were directed at them in the 1960s.
Later Scheffler and Othanel Smith (1960s) put forward their thesis that teaching does not imply learning
but can be characterized as: intentionality criterion, where the teacher attempts to bring out learning;
reasonableness criterion, where the strategies chosen by the teacher must be “not unreasonably thought
to be likely to achieve the learning aimed at”; and the criterion of manner, implying that what the
teacher does must fall under certain restrictions of manner (Noddings, 1998).
While most philosophers and educators agree with the first criterion; that teaching aims at bringing out
learning, few philosophers like Paul Komisar (1960s) object to this. To him it is some form of
‘intellectual acts’ within the teaching process that provide some form of awareness that bring out
learning. In this context Komisar pointed out that introducing, demonstrating, hypothesizing, appraising
and interpreting are an appropriate context that make learners aware. To this end Dewey agrees that the
only way to increase learning is to augment the quantity and quality of real teaching. He views the
teacher as the guide and director; the teacher steers the boat but the energy that propels it must come
from the learner. This analysis of teaching agrees with the implicit methodologies discussed in this study.
Similar view is shared by Dewey (1933) when he argued that learners ought to be involved at
the level of constructing their own learning objectives. He emphasizes that teachers have even a higher
responsibility to follow up what the learners have learnt as a result of their initial awareness and
consequent investigations (Noddings, 1998). In essence this view stresses teachers’ knowledge of the
entry behaviour of the learner prior to initiating the pedagogical process.
Overview of Technical Philosophy in Composition Writing Form the Greek foundations intimated earlier on philosophy as field of study involves an effort to solve
fundamental problems, to gain a comprehensive view of the universe, and to find answers to the
questions on the origin, nature, and destiny of matter, energy, life, mind, good, and evil (Njoroge and
Bennaars, 1986; Gunga, 2010).Philosophy, like all other studies, aims primarily at knowledge. The
Knowledge it aims at is the kind of knowledge which gives unity and system to the body of the sciences,
and the kind which results from a critical examination of the grounds of our convictions, prejudices, and
beliefs (Archie and Archie, 2004).
Philosophizing on the other hand involves independent thought process and requires skills in
Coherent reasoning (Gunga 2010) or using the power of human reason to solve problems and to resolve
issues in human lives, hence philosophical thinking (Njoroge and Bennaars, 1986).Since the study of
philosophy involves working with concepts rather than facts, the activity of philosophy seeks
understanding rather than knowledge. In other words, emphasis in this course of study is placed on the
reasoning process (Archie L and Archie J.G.2004).
While general philosophy deals with a wide world of philosophy, technical or formal philosophy is an
outgrowth of wide philosophy due to formalization of human activities, westernization and
specialization Njoroge and Bennaars (1986).Technical philosophy is concerned with four distinct areas
generally referred to as the branches of philosophy. These are; logic, epistemology, axiology and
metaphysics Njoroge and Bennaars (1986). Logic is defined as the study of correct reasoning. It
Proceedings of the Third International Research Conference held on 26th to 28th October, 2016 202
therefore studies the structure and principles of arguments. It studies how arguments are constructed
and how fallacies can be detected and avoided thus minimizing misunderstanding and meaningless
arguments. In this aspect, deductive reasoning helps to infer conclusions from general premises
while inductive reasoning helps to infer conclusion from particular instances Njoroge and Bennaars
(1986). Epistemology reflects on the study of knowledge. While scientists describe their observation
about human knowledge in a factual manner, philosophers go beyond mere facts. In this regard
philosophers reflect on the nature of knowledge thus raising epistemological questions about knowledge,
which goes beyond observable facts (Njoroge and Bennaars,1986).
Axiology on its part is the philosophical study of values. Axiology is broad with branches that deal with
different set of values. The first is ethical or moral philosophy, which reflects on the origin and nature of
moral values. It attempts to gain an insight and distinguish what is right and what is wrong. The second
branch is aesthetics, which is the philosophical study of artistic values and meaning of beauty. In
another context, axiology is concerned with social, cultural and political values thus social philosophy,
political philosophy and philosophy of culture (Njoroge and Bennaars, 1986).
The fourth branch of technical philosophy is metaphysics, which deals with what goes beyond the study
of nature. Metaphysics, therefore deals with questions that are concerned with what lies after or beyond
the physical world of sense of experience (the realm of supra-sensible). Metaphysics has four sub-
branches namely; cosmology, theodicy, ontology and rational psychology. Cosmology is the study of
universe or cosmos. Theodicy is a development of cosmology and is the rational investigation of
supernatural. That is of religious concepts and beliefs. The philosophical study of ‘being’ which tries to
explain the commonness of all things, living and non-living is referred to as ontology. Lastly, is the
rational or philosophical psychology also known as ‘philosophy of mind’. Its focal point is the
awareness that we perform certain activities such as perceiving, imagining, remembering, feeling,
understanding and willing, which are attributed to the ‘mind’ as opposed to the body.
Subject Matter and Philosophical Foundations Dewey (1933) defined subject matter in terms of the material used in resolving a problem in a given
situation. This is in form of facts that are observed, recalled, read, and talked about or ideas suggested in
course of or development of a situation having a purpose (Noddings, 1998). To Dewey, subject matter
should be presented in a way that makes it purposeful to students in working through problematic
situations. Each subject should be included in the curriculum not to be presented as a body of
unconnected facts to be rote learned but as a way of explaining human activity, enlarging social
connections, or solving social problems. Philosophy of education on its part entails philosophical
analyzes and clarification of concepts and questions central to education (Njoroge and Bennaars, 1986;
Gunga, 2010). Philosophy of education draws from ancient philosophers, including Socrates, Plato,
Aristotle, Rousseau, Pestalozzi, Herbart, Froebel and Dewey (Noddings, 1998).
Socrates (469-399BC) and his ‘Socratic method’ taught by engaging learners in dialogue. He would
start by posing deceptively simple questions that would prompt deep thinking, a process referred to as
destructive cross-examination (elenchus). This analysis would continue to satisfaction of both the teacher
and the learner. Quite characteristic was his dominance of the dialogue thus the teacher led
questioning. In giving information as implied by the explicit method of question and answer. In doing
this, the Socratic Method fulfils the critical function of technical philosophy. This function encourages
honesty of thought which protects man from fanaticism and hypocrisy, intolerance and dogmatism as
well as slogans and ideologies. Hence it liberates man from narrow-mindedness.
Plato (427-347 BC) on the other hand was an ardent disciple of Socrates thus his views mirrored those of
Socrates especially on quick fire-dialogues, conversational in style (Craig, 2002). He believed that
student as should be educated according to their capacities hence education for workers and artisans, of
guardians (soldiers) and of rulers. Thus the ‘functionalist’ model of education designed to produce
competent adults for the needs of the state. Arguably, the components of Plato’s’ education view have
remained at the heart of liberal education for years. Literature, history, mathematics and philosophy still
Proceedings of the Third International Research Conference held on 26th to 28th October, 2016 203
form part of the curriculum. To this end Kiswahili composition writing, which is embedded in creativity
espoused by literature finds its root in this philosophical foundation of Plato.
Like Plato, Aristotle (384 – 322 BC) believed that people should be educated for their appropriate
place in life. As people perform tasks and fill particular functions, they develop (or fail to develop)
excellences peculiar to the tasks and functions. In education, Aristotle established a model of moral
education where learners should be trained in morally appropriate modes of conduct. The
community should inculcate to children values and immerse them in supervised activities designed to
develop relevant virtues. His character education model gained prominence in the nineteenth and early
part of the twentieth century. We can argue that creativity in writing as envisaged by Noam Chomsky
(1955) is deeply rooted in this philosophical background (Gotzsche, 2009).
Jean-Jacques Rousseau (1712-1778) ideas arose in the Christian era and middle ages (Noddings, 1998).
His philosophy of ‘freedom’ viewed man as born free and good, and could remain that way in some
ideal state of nature. According to Rousseau the corrupt man is a result of accommodating needs of other
people we live with. Thus education should seek to preserve the natural goodness and induce a positive
sense of civic responsibility. He believed that children are born good and teachers should preserve this
goodness while facilitating growth of the various competencies required for adult life. A facet of
Rousseau philosophy can be seen to be compatible with the twentieth century ideas of psychologist and
educators like Alexander Sutherland Neil(1960s), Jean Piaget (1960s), Maria Montessori (1907) and
Kolb’s (1984) experiential learning. Notably, Piaget theory and Kolb’s experiential learning have been
explicitly linked to Kiswahili composition writing in this study.
Johann Heinrich Pestalozzi (1746-1827) also had a great influence on philosophy of education.
Pestalozzi followed and refined Rousseau ideas. He believed that a lesson should end with a moral
point. He created ‘object lesson’ approach to build on John Locke ideas. This is where a lesson
begins by exhibiting an object then inviting students to describe it. From this philosophy, we justifiably
say that set induction as explained by Nasibi (2003) was founded.
Johann Friedrich Herbart (1776-1841) too built on Rousseau ideas about senses and their critical
function in education. To him the mind functions in terms of presentations called “apperceptive mass”- a
collection of previous experiences that could be called into play to understand a new percept or idea.
To him teaching methods should be designed to match the way minds work and teachers must prepare
learner for new material by bringing to consciousness relevant experiences in learner’s’ apperceptive
mass. According to (Noddings, 1998) this is the forerunner to Jean Piaget’s (1960) cognitive structure.
His four-step lesson found place in what the followers made into five-step lesson: preparation,
presentation, comparison and abstraction, generalization and application. These elements are valid in
todays’ lessons as espoused by Nasibi (2003). In concurrence Musau and Chacha (2001) as well as
Njogu and Nganje (2006) validate same steps in teaching Kiswahili composition writing.
Friedrich Froebel (1782-1852), a third philosopher influenced by Rousseau is regarded as the father of
kindergarten (Noddings, 1998). He equated the kindergarten to a garden in which children, like flowers,
unfold and grow. This reflects Rousseau’s inherent goodness in children. We have already indicated the
compatibility of Rousseau’s philosophy with the twentieth century ideas of psychologist and educators
like Jean Paget’s (1960s) cognitive learning, Maria Montessori (1907)philosophy which led to
constructivist approach and Kolb’s (1984) experiential learning.
Educational Dimensions and Kiswahili Composition Writing It would be hard to ground Kiswahili composition writing to philosophical underpinnings without
looking at education in the multi-dimensional approach envisaged by philosophers. The multi-
dimensional approach identifies four dimensions that are traced back to R.S Peters (1966). In his
book Ethics and Education (1966), Peters arrived at three criteria for analyzing education (Njoroge
and Bennaars, 1986). One, education must involve the transmission of what is worthwhile, valuable or
desirable, thus the desirability condition. Two, education must involve knowledge and understanding or

Proceedings of the Third International Research Conference held on 26th to 28th October, 2016 204
the knowledge condition. Lastly, education rules out certain procedures of transmission that lack
willingness and voluntariness on part of the learner- the procedural condition. The four dimensions are;
cognitive, normative, creative and dialogical dimensions, respectively (Njoroge and Bennaars, 1986;
Sifuna et al., 2006).
Cognitive dimension finds its roots in concept formation, operational and formal thinking as viewed by
educational psychologists. In this regard cognitive learning is as a result of close link with cognition or
knowing thus the basis for cognitive dimension (Sifuna et al. 2006).While cognitive learning is a
process or a task, knowing is the outcome of learning. Njoroge and Bennaars (1986) stress that cognitive
dimension must be understood in terms of knowing rather than of learning. Since ideally education
involves knowledge and understanding and not just learning, then there is a close link between education
and knowledge as envisaged by the cognitive dimension. From this argument, it is right to conclude that
learning achievement in the course of learning Kiswahili composition writing is fundamental. It is the
close connection between education and knowledge as envisaged by cognitive dimension of education.
The philosophical study of knowledge is known as epistemology, which is one of the main
branches of technical philosophy (Bradley and Swartz, 1988; Craig, 2002; Sifuna, Chege and Oanda;
2006). In analyzing the concept of knowledge three criteria or conditions need to be met. One condition
is the belief condition where knowledge is viewed as a matter of belief or conviction while the second is
the truth condition, which refers to the actual truth of what one asserts or looks at. According to the
first condition to know implies having a ‘true belief’ that it is actually true. But to know that it is true
belief requires the third condition; grounds condition. This is concerned with the grounds or reasons for
knowing something. Thus for someone to claim to know something and to have true belief, then one
must have sufficient grounds to verify or justify the claim (Njoroge and Bennaars, 1986;Sifuna, Chege
and Oanda; 2006).Since the study of knowledge in technical philosophy falls under epistemology, then
Kiswahili composition writing can be arguably said to be grounded in the cognitive dimension.
The normative dimension is the socialization aspect of education. Socialization is the process of learning
or training in which an individual is conditioned or moulded into a respectable member of the society
(Njoroge and Bennaars, 1986). The normative character of education is an ideal to be pursued. It also
refers to the norms or standards recommended in education, which in turn provide general guidelines for
educational theory and practice (Sifuna, Chege and Oanda; 2006). The normative dimension is therefore
the foundation for educational goals. Given that philosophical goals of educational are translated into
curriculum instructional objectives as argued by Munyoki (2012) then we conclusively say that
Kiswahili composition writing is firmly grounded in the normative dimension of education and
subsequently axiology branch of technical philosophy, which deals with normative matters.
The creative dimension on the other hand views education as growth. The idea of natural growth is
explained in three ways; first physical growth in which man exhibits his cultural being. Secondly,
natural growth is seen in terms of developing in accordance with the laws of nature. Thus a child is
not only allowed to grow physically but also mentally, morally, emotionally and socially. The third
explanation follows progressivists concern with child-centered education (Njoroge and Bennaars, 1986;
Sifuna, Chege and Oanda; 2006). Learning therefore occurs in the course of experiences of inquiry, of
activity based on the needs and interests of the child. Creativity should be encouraged as a way of self-
expression method of learning (Gunga, 2010). In this context therefore, education is seen as a creative
experience which is open-ended. The fundamental principle is that children have an inherent impulse to
create. This is one of the guiding principles of creativity in the art composition writing alluded by
Gotzsche (2009). Lastly, the idea of natural growth suggests variation and diversity. This implies
catering for individual differences catering for individual needs, interests or shortcomings highlighted by
Nasibi (2003). The creative dimension reinforced progressivists idea that right or appropriate methods as
envisaged by Odundo and Gunga (2013) can lead learners to discover content for themselves.
The dimension also views the world in two sets of explanations. The world of nature and the world of
culture. The world of nature is the natural world one is born and confronted with an already existing

Proceedings of the Third International Research Conference held on 26th to 28th October, 2016 205
world. One has no choice but to accept it if one wants to be part of it. The second view is the world of
culture which explains man as a conscious being (Njoroge and Bennaars, 1986). Man is a subject
who acts upon the natural world and creates a new world, a world that is typically human- the
world of culture. Man’s consciousness can in three levels; empirical level or pre-reflective level, which
creates awareness through senses, the intellectual level in which ones forms concepts and the rational
level where judgements are made and reasoning taking place (Njoroge and Bennaars 1986;Sifuna, Chege
and Oanda; 2006). Since creative dimension emphasizes on liberating education composition writing
cannot be divorced from this since it engages learners in exploring ideas in the real world and through
creativity addresses them in writing (Gotzsche, 2009).
The last dimension is the dialogical dimension which bridges the gap between individualization and
socialization concepts of education (Njoroge and Bennaars, 1986). To establish the inter-relationship
between man, society and education two models are postulated to explain the dialogical dimension. First
is the traditional model in which man organized social life by establishing law and order. But the law
and order was not natural thus it varied from society to society and from culture to culture. Secondly,
is the bureaucratic model which distinguishes closed (traditional) and open (modern) societies. In the
modern society, man has become an integral part of the bureaucratic structure in which individuals are
aware of many alternatives and beliefs that are no longer held to be sacred or absolute. The traditional
model viewed education as to be transmitted through generations through accumulation of wisdom and
knowledge of society. Bureaucratic model inevitably points at formal education through schooling
within defined bureaucratic context (Njoroge and Bennaars, 1986; Sifuna, Chege and Oanda; 2006). The
dialogical dimension therefore opposes authoritarian education where the teacher is the master while the
leaner the slave or servant who must willingly obey the master (Njoroge and Bennaars, 1986).
Education is therefore inter-subjective process, which involves communication, encounter, participation
and dialogue as advocated by Paul Freire (1968). Dialogue requires two people to speak to each other
on equal terms. In education this equality points to mutual respect as the basis for dialogue. In this study
this dialogue is firmly founded in the implicit methodologies of teaching Kiswahili composition writing.
REFERENCES
Archie L. and Archie J.G. (2004). Reading for Philosophical Inquiry: A Brief Introduction to
Philosophical Thinking. ver. 0.21; An Open Source Reader GNU Free Documentation License
(http://gnu.org/copyleft) OR DocBook Open Repository (http://docbook.openforge.net)
Bart, M. (2009) Philosophy of Teaching Statements: Examples and Tips on How to Write a Teaching
Philosophy Statement. www.FacultyFocus.com
Bem, D.J. (1965). An experimental analysis of self persuasion. Journal of experimental social
Psychology, Vol 1 p. 199.
Bradley, R. and Swartz, N. (1979). Possible worlds: An introduction to logic and its Philosophy.
Indianapolis, Hackett publishing Company, Inc.
Bucur, R. (2009). The philosophy of composition Revisited, or why does modern poetry Begin in the
USA. Bulletin of the Transilvania University of Braşov Vol. 2 (51) - 2009 Series IV: Philology
and Cultural Studies pp 25-28.
Canfield, J.V (2005) Philosophy of meaning and value in the twentieth century. London; Routledge.
Carter, M; Miller, C .R. and Penrose, A.M. (1998). Effective composition instruction: What does the
research show? Publication Series, Number 3. Center for Communication in science, technology,
and management. North Carolina State University.
Chapman, S and Routledge, C (2009) Eds. Key Ideas in Linguistics and the Philosophy of Language.
Edinburgh University Press.
Chudnoff E, (2007). A guide to philosophical writing. Harvard writing project.
www.fas.harvard.edu/~wricntr Barker center 019; 617-495- 1655
Clark, B. 2009. ‘Analytic philosophy’ in Chapman, S. and Routledge, C. 2009. Eds. Key ideas in
linguistics and the philosophy of language. Edinburgh; Edinburgh University Press, p. 4-10.
Clark, I.L (2003). Concepts in composition: Theory and practice in the teaching of writing. Mahwah;
Lawrence Erlbaum Associates, Publishers.
Craig, E (2002). Philosophy: A Very Short Introduction. Oxford; Oxford University Press.

Proceedings of the Third International Research Conference held on 26th to 28th October, 2016 206
Davies, B (1993).An Introduction to the Philosophy of Religion. Oxford; Oxford University Press
Fulkerson, R. (1979).Four Philosophies of Composition. College composition and Communication,
Vol.30 No 4 pp 343 -348. Accessible through http://www.jstor.org/stable/356707
Gotzsche, H. (2009) ‘Creativity’ in Chapman, S. and Routledge, C. (2009) Eds. Key ideas in linguistics
and the philosophy of language. Edinburgh: Edinburgh University Press Ltd. Pp 43-44.
Gunga, S. O (2010).Philosophy of education. Module for African Virtual University accessed through
(http://creativecommons.org/licenses/by/2.5/
Hicks, S.(2009) Introduction to Philosophy. Department of Philosophy Center for Ethics and
Entrepreneurship Rockford College Rockford, Illinois
Komisar, B. P. (1966). Conceptual Analysis of Teaching’ High School Journal 50 pp 14-21.
Komisar, B. and C. Macmillan. (1967). Psychological Concepts in Education, Chicago: Rand McNally.
Munyoki M.J (2012). Integrating philosophy of education and the goals of Education in education
practice at Kenyan high Schools. Doctor of Education Thesis. UNISA.
Musau, P.M. and Chacha, L.M. (2001). Mbinu za kisasa za kufundisha Kiswahili kwa walimu wa
shule za msingi, upili na vyuo. Nairobi: KLB.
Nasibi, M.W. 2003. Instructional Methods: Teaching Across the Curriculum. Nairobi: Strongwall Africa.
Njogu, K. and Nganje, D. 2006. Kiswahili kwa vyuo vya ualimu. Nairobi: Jomo Kenyatta Foundation.
Njoroge, R. J and Bennaars, G.A. (1986). Philosophy of education in Africa: an Introductory text for
students of education. Nairobi; Transafrica.
Noddings.N (1998). Philosophy of education; Stanford University; Colorado; Westview Press Inc.
Oldham, G. R., and Cummings, A. (1996). Participant creativity: Personal and contextual factors at work.
Academy of Management Journal, 39(3),
Peters, R. S (1967). Ed. The concept of education. London; Routledge and Kegan Paul.
Poe, E.A (2008). The Philosophy of Composition. 8 May 2008.Wikisource. 2 May 2009.
<http://en.wikisource.org/w/index.php?title=The_Philosophy_of_Compositionandprint
able=yes>.9 Poulet, Georges. Review of Edgar Allan Poe (1845)
Portmore, D. 2006. Tips on writing a philosophy paper. Creative commons 607-634.
Sifuna, D, Chege, F.N. and Oanda, I.O. (2006). Themes in the study of the foundations of education.
Nairobi; Jomo Kenyatta Foundation
Thomas B (2014). Critical thinking and composition. Section 6 (22561) course syllabus. ******
THE INTERFACE BETWEEN COOPERATIVE EDUCATION AND SUSTAINABLE
LEARNING: LESSONS FROM BEST UNIVERSITY PRACTICES
Wandera, M.
Cooperative University College of Kenya, Faculty of Commerce
Email: [email protected]
ABSTRACT
The cooperative movement in Kenya has a membership of over 8 million and has mobilized over Sh. 230
billion. It has also employed over 500,000 people besides providing opportunities for self-employment.
This study determined the innovation in corporate social responsibility as used in cooperative education.
It used legitimacy theory with main surveys from Baden Wurtternberg Cooperative State University and
Johnson and Wales University in the USA. Evidence of Technical University of Catalonia (UPC) on
enhancing sustainability in higher education is also given. It used case survey as the methodology. It
recommends inclusion in the curriculum of sustainability techniques as done in the Baden Wurtternberg
Cooperative State University, Ravensburg, Istanbul Bilgi among others. Further studies should consider
how sustainability is linked to sustainable development education and cooperative education.
Keywords: Curriculum Innovation, Sustainable Development Education
INTRODUCTION AND BACKGROUND
A cooperative is a business voluntarily owned and controlled by its member patrons and operated for
them and by them on a non-profit or cost basis/ it is owned by people who sue it. It is also organized and

Proceedings of the Third International Research Conference held on 26th to 28th October, 2016 207
incorporated to engage in economic activities with certain ideals of democracy, socio-consciousness and
human relations included (Ouma, 1989, Reinhard, Osburg and Townsend, 2010). Globally, the
cooperative business and values have been emphasized over time. In 1966, International Labour
Organization (ILO); rules 127, stressed on why cooperatives are established and developed as; improving
the economic, social and cultural aspirations of the people with limited resources and opportunities as
encouraging their spirit of initiatives. Similarly, increasing personal and national capital resources by the
encouragement of thrift, by eliminating usury and by the sound use of credit. There is also contributing to
the economy an increased measure of democratic control of economic activity and of equitable
distribution of surplus. An increasing national income, export revenues and employment by a fuller
utilization of resources for instance in the implementation of systems of agrarian reform and of land
settlement aimed in the development of modern industries preferably scattered, processing local raw
materials besides improving the social conditions and supplementing social services in such fields as
housing and were appropriate health, education and communications; as well as helping to raise the level
of general and technical knowledge of their members (ILO, 1997).
In the 1980s and 1990s, developing countries with need to transfer economies from being state-directed to
being market oriented, had the various problems characterized mainly prior to the advent of adjustment
programms; severe balance of payments difficulties, budget deficits, acute debt servicing crisis, flight of
capital, falling private investment, stagflation that is, a combination of increasing inflation and stagnant
growth as well as increasing reliance on state controls. This situation necessitated then a developmental
approach aimed at integrating developing economies into the rapidly globalizing international
marketplace. However, key concerns for discussion has been cooperatives with their special character and
mission that include a strong commitment to fairness and community responsibility; should they function
in the marketplace as other business organizations do, or do they have a special role to play? (Ibid).
Statement of the Problem
The International Cooperative Alliance (ICA) survey in 2009/2010 financial year, had identified the
Kenyan cooperative sector as the best with the highest resource mobilization in Africa and seventh (7th)
globally. Further, the savings and cooperatives (Saccos) sub-sector had also witnessed rapid growth in the
years at the rate of 25% per annum with a mobilization of Ksh.180 billion and an asset base of Ksh.200
billion. The Sacco sub-sector mobilization represented 31% of the national savings. This meant that
Saccos among other cooperatives perform a key role in the mobilization of financial resources and a
major player in the realization of the national vision 2030 (Saccostar, 2010). In the same way, early
December 2009, during the 9th ICA inter-ministerial conference in Nairobi it was emphasized that
strategies for year 2005 – 2009; on research, regional integration, HIV/AIDs, strengthening national
structure, information and communication technology, mobilization of human, social and financial
resources for sustainable human and economic development as well as contributing to poverty reduction
need strengthening (Saccistar, 2009).
Similarly, International Monetary Fund (IMF) in 2007 survey on cooperatives had pointed out that 63%
Kenyans livelihood depended directly or indirectly from cooperative based enterprise (Ibid). In the Kenya
Vision 2030, there is need to achieve sustainability goals, enhanced from Millennium Goals (MDGs),
which are to be achieved through creation of employment, generation of income, settlement of people and
wealth creation. Further, there is, international cooperation day which has existed since 1923, is observed
on the first Saturday of July (Ouma, 1989). Recently, also the United Nations General Assembly declared
year 2012 as the international year of cooperatives. However, the Kenyan government through the
cooperative movement has also purposed to enhance sustainable economic growth by focusing on
achievement of desired outcomes through strengthening of the movement; by improving cooperative
extension, service delivery, cooperate governance, access to markets and marketing efficiency among
others. Recently in Kenya, to enhance sustainability in cooperatives, there has been an establishment of
the Ethics Commission for the Co-operative Societies (ECCOS) to address governance matters. However,
issues still in the lifelong learning is the extend of the practices of sustainability in the institutions of
higher learning as it is often argued; one way to educate the business and the society about sustainability
issues is through the level of sustainability awareness mainly environmental is higher in developed

Proceedings of the Third International Research Conference held on 26th to 28th October, 2016 208
countries compared to developing economies like Malaysia (Amran and Siti-Nabiha, 2009); which in
essence Kenyan can emulate from.
Objectives of the Study
This study is therefore designed with objective of examining the extend of cooperative education,
sustainability learning and the interface in the universities and its applicability to situations at hand in the
institutions of higher education.
Justification of the Study
The study is motivated by the following benefits of CSR in organizations:
i. There is an enhanced brand image and reputation. A strong reputation in environmental and
social responsibility can help an organization build this trust.
ii. In some organizations, there is increased sales and customer loyalty. Consumers will want good
and safe products, also want to know if it was produced in a socially and environmentally
responsible way. Doing best by doing good, the nation may receive operating income from the
loyalties.
iii. There is also increased productivity and quality. CSR helps organizations improve their learning
management and activities.
iv. It helps organizations improve working conditions and labour practices among their suppliers
who often experience a decrease in merchandise, that is, defective or can’t be.
v. There is reduced regulatory oversight. Organizations can be committed to CSR by complying
with and going beyond legislation. The more lenient governments and regulators may be with the
organization. Reducing risk and increased risk management is another matter of concern.
vi. The more the organization is committed to CSR, the less they are exposing themselves to
business risk.
vii. Organizations also keep up with competitors especially the educational platform is say in
regulations and legislation and others are driven by self-regulation
Theoretical Framework
Legitimacy theory These theory leans on the insights of the system oriented view of a society as a whole. It is assumed in the
system-oriented view that an entity is influenced by or has been influenced over the society in which it
operates (Deegan, 2002 Gray et al, 1995, 1996). Therefore it is their social, political and economic
framework, within which human life takes place from the perspective of the theory of political.
Economic, Gray et al, 1996:47). The theory implies that society, politics and economic issues cannot be
investigated meaningfully without considering the political, social and institutional frameworks in which
economic activities take place. An essential feature takes place. An essential feature of political economy
theory is to reorganize power conflicts that exist with the society and various groups within society.
Legitimacy is then accomplished if society perceives the organization to be operating in accordance with
the prevailing norms and values. However, legitimacy is a dynamic concept (Lindblom, 1993) as the in
question can change over time and overtime clients might occur that adversely affected the reputation of
the organization, its legitimacy and perhaps even its existence. It means breaches of the social contact are
perceived to lead to a perception by society that an organization is not legitimate.
In addition, it is said if the society does not consider the organization legitimate, then legitimacy gap
exists, and the organization can use different strategies to bridge the gap. The actions taken in such a
situation will depend on the management’s perception of the threats to legitimacy which can be the
media, hence the importance of an issue to the public, and thus the level of pressure placed on
corporations to remain legitimate or to regain legitimacy is of an issue in the Media (Ibid).Legitimacy is
also a resource that an organization can influence or manipulate. However, organizations that are
multinational, or desire to be need to consider their reputation in the entire county in question and indeed
worldwide. If a legitimacy gap exists this card has irreversible economic effects on the corporation, for
instance in the form of strikes and subsequent loss of customers and revenues. It also means that

Proceedings of the Third International Research Conference held on 26th to 28th October, 2016 209
understating the role of different stakeholders can be seen as an important issues in maintaining the
organization legitimacy and the right to existence, understood as the precondition for the organizations
long-term success which depends on disclosures in its press releases, annual report, interim reports for the
period under study as these documents are considered to represent official and carefully considered
corporate talk, if the organization in question is a public organization with a high criteria for publicity.
Passive and active theories of socialisation in education
The passive theory of socialization view the socialize as a conservative recipient of society’s accumulated
knowledge. The process of socialization is seen as one through which society realizes and creates itself in
the individual. These theories create the impression of the socialization process being conservative, with
the same body of knowledge being transmitted from generation. The structural functionalist perspectives
discussed in chapter twenty-four fall in this category, with their emphasis in maintenance of social
harmony, and individual subordination to social structure.(Sifuna and Waiyaki, 2006). In addition an
American sociologist, Talcott Parsons, argued that through the process of socialization, individuals come
to internalize social objects. Besides, he asserts individual learn to perform predetermined social roles in
order to preserve society’s common culture. The passive theories portrays society as an all-pervasive
entity with a different existence from those of its members .By some mechanism, society controls and
moulds human beings as if they don’t have conscious to react to what is presented to them. People are
always over socialized by society; - that is entirely influenced by forces beyond their control (Ibid). In
addition active theories of socialization accord individuals a role in deciding what they learn and how
they come to accept it. Human beings, right from infancy do not just respond or conform to social values.
They participate in creating those values. It is through the active interaction of the socialize and the
socializer that social change is possible that culture also changes. Again the active theories are rooted in
the conflict and interpretative; symbolic interaction perspectives (Ibid).
Design of the Study
The design for this study has involved case survey and this is when the research is feasible, the right way
to approach the problem and ethically appropriate to carry out the research. (Sapsford, 2011). The
population involves case survey of European, Asian and American reported Universities.
FINDINGS AND DISCUSSION
Cooperatives in Kenya
In Kenya, cooperatives organized by Africans were not founded until after 1930s. The first Co-Operative
Society’s Ordinance (Act) was passed in 1931 and replaced in 1932. This was also later replaced by
another one in 1945, which was passed after an investigation by the colonial government. (ICA, 1980).
Further, socio-economic transformation of 1963 through the National Development objectives, especially
1964-1970, emphasizing “greater welfare for all its citizens”; and the sessional paper No.10 of 1965 on
African socialism and its application to planning in Kenya, besides the national Development Plans 1 and
2 especially, the Second National Development Plan 1970-74, enhanced the cooperative movement better.
Besides, Kenya National Federation of Cooperatives which was registered as early as 1964 and the
Cooperative Bank of Kenya, that was established in 1965, under the Cooperative Societies Act,
thoughtfully operations started in 1968 and licenced in 1978, under the Banking Act for mobilizing 6
enhanced the corporate movement and related activities in Kenya (Ouma, 1989). Cooperative education
and training in Kenya; policies and strategies have targeted; education for members, education to
committee members, education for employees also education for the public (RoK, 2000).
Cooperatives and Cooperative Education
By 1980 the International Cooperative Alliance (ICA) meeting in Moscow, had noted that, co-operatives
had become a global movement with over 500 million making it the largest socio-economic movement in
the world. The ICA meetings dates back to 1895 and initial meetings were in London mainly for historical
reasons, concentration and convenience of location (ICA, 1980). Furthermore, the origin of cooperation
may date back to the middle ages. However, evidence of written cooperation is by the community
cooperatives in Greece, Asia and many other parts of the world. In Europe, the new thinking or age of

Proceedings of the Third International Research Conference held on 26th to 28th October, 2016 210
Enlightenment or reason, where knowledge came through experience, was extended by philosopher John
Locke 1632-1704; later by Robert Owen during the industrial revolution. However, the period of trial and
error period; 19th and 20
th century especially by Rockdale Equitable pioneers in 1844 was the climax
though they were consumer cooperatives and weavers initially. Christian socialists in England in 1840s
and early 1850s were also another category of cooperation (Ibid).
Growth of Cooperation
Early cooperatives were fire insurance in London and Paris by 1530 as well as in Philadelphia in USA by
1752. Later own dairy farming by 1810 in Goshen. In the UK workers’ cooperatives establishment for
industries dates back to 1873 just like community cooperation in Scotland do date back to 1498.
Similarly in Argentina, housing and consumers’ dates back to 1905 while in France, Germany,
Netherlands and Japan had an early elaborate banking system also in cooperatives. Buses and related
transport cooperatives have been in Israel, Canada, Poland for many years. Similarly, school cooperatives
have existed in Philippines, France and Poland. The Scandinavia countries on the other hand, have had far
the largest share of the market in most products with over 90 percent in the same (Ibid). Furthermore
globally, by early 1960s, Finland, Sweden and Israel were leading with the population belonging to
cooperatives. Recently, the United Nations through the 64th session in 2009 approved year 2012 as the
international year of cooperatives. In addition, global cooperation has been enhanced by: International
Cooperative Alliance (ICA), World Council of Credit Unions (WOCCU), African Confederation of
Cooperative Savings and Credit Association(ACCOSCA) and United Nation recognition and
International Co-operatives day (Ushirika day); instituted by the international co-operatives Alliance as an
annual festival at which cooperatives everywhere could recall the ideals and principles of the movement,
show their loyalty to it and express their international solidarity and publicly demonstrate its power,
achievements and promises for the future. Ever since 1923, the day was observed on the first Saturday in
July or first Saturday in November in case of those organizations which cannot celebrate in July.
Is cooperation a capitalist or socialist idea? This question was answered by Hungarian cooperator,
Alexander Karolyi (1831-1906) who said in 1904; “cooperation is the middle way between capitalism and
socialism-between the extreme amount of economic freedom that is demanded by capitalism and extreme
amount of legislation and limits of freedom that is the result of socialism”. The 1930 ICA congress in
Vienna established a special committee to enquire into the whole system of principles to apply on
cooperatives and in 1934 it was a big debate in London conference, but it was until 1937 in Paris that a
satisfactory statement was adopted. Later, debates also followed in 1960s, 1966, 1976 and 1995 where the
current principles were updated.
Relevance of Cooperative Education
Cooperative education simply means working together and it is as old as the human family and exists
whether the human family is found. Every human community is a co-operative education and training.
There is traditional form of co-operative and also the modern form of co-operation, principles of Co-
operation related to early England; Rochdale principles of Cooperation that began 1833, 1835 and fully
1844. They were; open membership, democratic administration, limited late of interest, disposal of
surplus, education and cooperation with other cooperation. Similarly, ICA began looking into the
principles from 1930 Vienna Conference, 1934, London debate, 1937 Paris conference, statement of
adoption, 1964 Vienna conference on main principles of co-operation, 1966 Vienna conference, 1976 ILO
conference (the later Maurine Combain)
Cooperative Learning Methods
They involve both pedagogy and andragogy like; student teams achievement divisions, team -games-
tournament, team assisted individualism, cooperative integrated reading and composition, learning
together, group investigation and jigsaw (Slavin, 1990 cited in Gwarida, 1993).
Further in 1995, ICA gave the following principles of cooperation; voluntary and open membership,
democrative member control, member economic participation, autonomy and independence, education,
training and information, cooperation among cooperatives and concern for the community.

Proceedings of the Third International Research Conference held on 26th to 28th October, 2016 211
Importance of Cooperative Learning
The main merits of cooperative learning; interpersonal relationships and acceptance of differences,
accuracy of perspective taking, creativity, self-esteem, as well as cooperative learning that facilitates
teaching meaningful content (Gwarida, 1993).
Outcomes of Cooperative Learning
Adapted from Johnson and Johnson, 1989
Sustainability and Sustainable Learning
Models and influences of sustainability learning; Mossel (1999) cited in Belt and Morse (2003) has
involved system approach emphasizing existence, effectiveness, freedom of action, security, adaptability,
co-existence and psychological needs. In the United Kingdom, the model was focused on resources and
waste, pollution, biodiversity, local needs, basic needs, satisfying work, health, access, living without
fear, empowerment as well as culture and aesthetics. The guy and Kibert model of sustainability as been
applied in the USA and the criteria is on community involvement, linkages, availability and timely
service, stability and reliability, understability, responsibleness, policy relevance, representative,
flexibility as well as proactiveness)Bell and Morse, 2003). Similarly, in all these, the emphasis is on
lifelong learning and the learning and the learning society which has four pillars; learning to do, learning
to know, learning to be and learning to live together (Ibid)
Conceptual Framework
Therefore in sustainable learning education teaching and training, the emphasis is as below:

Proceedings of the Third International Research Conference held on 26th to 28th October, 2016 212
Source: Author (2015)
Global Cases of Cooperative Education and Sustainable Learning
The case of Baden–Wurttemberg, Germany and John Wales University, USA Sustainable learning has involved corporate social responsibility (CSR) on stake holders on researches on
corporate citizenship, social activities and engagement, coping with the demands of the society through
projects, students’ employment contracts with companies, incorporating CSR in the curriculum, that is,
business, engineering and social work. Furthermore, students have employment contracts with companies,
there is also cooperation in research project on sustainability especially in CSR between the university
and John wales University, USA on corporate citizenship, social activities engagement as well as tackling
rising demands of the society.
Cases in sustainability in higher education
In the United Kingdom – environmental programmes is done at middle-sex University, similarly at Tongji
University, China – resource saving strategies to develop conservation awareness. In addition at the
Technical University of catatonia (UPC), Spain; there are sustainability programmes (ECD), on
environmental focus, universities social role, orientation towards the future, thematic priorities (building
construction, energy and climate change, integrated water management, technology’s responsibility to
society, regional planning, mobility and logistics, materials cycles and waste management in urban areas.
In Malaysia there is the University Technologi Mara Sarawak, Malaysia – Asia Pacific centre of
excellence for sustainability, public participation in community services in selected villages, CSR
research, environmental literacy among students and teachers. In addition in Turkey there is Bilgi Istanbul
university, Turkey – it has fourteen (14) research centres on CSR; the Social, Economic, Political
Research Centre, Centre For Migration Research, Intellectual Property Law Research Centre, Human
Rights Research Centre, Centre for Civil Society Studies, NGO Training Research Centre, Centre for
Environment, Energy and Sustainability Studies including the children and the youth.
Still at Bilgi, other centres include; Green electricity project, wind energy, ethics committee, wasted paper
recycling and donating them, academic research in human related areas, UN centered initiatives; UNGC,
RBEME, UNDP collaboration on social and entrepreneurship among others. In Universiti technologi
Mara Sarawale, Malaysia which is Asia Pacific Centre for Excellence for Sustainability Public
participation; there is cooperation in community service in selected villages and CSR research on
Environmental literacy among students and lecturers of Malaysian universities in seven(7) core areas;
research, committee, community service consultancy work as shown below.
Education
Formal Non-formal / informal
Teaching and training
Learning
(Life long learning; sustainability learning)
Learning to do
Learning to know
Learning to be
Learning to live together

Proceedings of the Third International Research Conference held on 26th to 28th October, 2016 213
Table 1: Mean score for environmental literacy terms
Environmental terms / concepts
Mean score
2010
Mean score
2009
Eco-Management and Audit Scheme (EMAS) 2.34 1.2
Corporate Social Responsibility (CSR) 4.20 2.8
Carbon Offset/carbon Neurality 2.91 2.5
Carbon footprint 2.83 1.6
Life Cycle Assessment 2.97 1.9
Climate change 3.83 3.2
Greenhouse Gas Emission 3.54 3.1
Sustainable business 3.63 2.3
Environmental accounting 3.09 1.7
Environmental audit 2.89 1.6
Eco-label 2.71 2.2
Environmental Management System (EMS) 2.69 1.6
Emission trading 2.49 2.0
Eco-friendly 3.57 2.9
Triple bottom-line 2.49 1.2
Global warning 3.94
Waste management 3.74
Energy 3.69
Biodiversity 3.57
Kyoto protocol 2.80
Scale in this study (2010): No knowledge-1; poor knowledge-3; Good knwoeldge-4; Excellent
knowledge-5. Scale in Johanndottir’s study (2009): Five –point Likert scales, where 1 indicates ‘very
little’ and 5 indicates ‘very good’ knowledge of the terms. The Cronbach Alpha coefficients for
environmental literacy and environmental attitude were found to be reliable as shown in table 2.
Further, an analysis of the above gives the following;
Table 2: Cronbach alpha for environmental literacy and environmental attitude
Variables Number of items Cronbach
Environmental literacy 20 0.917
Awareness of environmental initiatives 13 0.935
Environmental intention to act 10 0.944
Based on the data above, the coefficients for environmental literacy, level of awareness of environmental
initiatives and intention to act are more than 0.9, indicating their validity and reliability (Ibid).
CONCLUSION
There exists cooperation in education and training from the cases. This is evident like Istanbul Bilgi, with
the increased competition in higher education, the criteria on which institutions judged are changing.
While what goes into judging a higher education institution might continue to change and evolve, the
building blocks of success in any competitive environment remain constant such as developing a positive
reputation and differentiating itself from the competition. Setting a corporate social responsibility
strategy, and implementing the actions is one powerful way of achieving this goal. Most universities tend
to focus only on teaching social responsibility in terms of corporate social responsibility initiatives and do
not go beyond this by attempting to improve their communities through cooperating with them and other
stakeholders. Yet in order to compete in the changing education industry and also to fulfill their, mission
in a world in perpetual transformation, higher education institutions must recognize that their own actions
should reflect the values and norms which they claim to embody. This means deepening their
commitment to CSR at the operational level as well as the academic level, mostly by curricular activities.
This will not only be beneficial to the institution itself but also will be beneficial to the society in general.

Proceedings of the Third International Research Conference held on 26th to 28th October, 2016 214
As a self-financed foundation institution with no governmental contribution and 11,000 registered
students and over 15,000 alumni, Bilgi is one of the outstanding universities of Turkey. And as indicated
in the case, Bilgi can be stated as a success story in implementing CSR strategy and getting positive
results from it. Obviously this success doesn't come by chance as it is earned. One of the findings of this
study reveals that the internalization of the corporate social responsibility actions is an important matter in
the success of gaining a good reputation and strong competitive advantage. In Bilgi case, this
internalization starts with its mission and is set in its core business. Active centers, devoted academics,
UN centered activities, rich curriculum developments comes eventually since the institution's values and
activities motivate the staff. The motivation and willingness of the staff is another key in success since the
actions can't come to life without the voluntary participation of the staff members. Another important
finding of the study is the role of management's involvement and willingness in supporting and
implementing social responsibility actions. In general management's involvement and interest is an
important signal to faculty, staff, students, alumni, and other stakeholders that the institution's citizenship
engagement is an operational priority.
Therefore, in order to compete in changing education industry, institutions should embrace sustainability
techniques in values and norms in their academic and also in the curriculum. This is also happening at
Monash University, Pretoria, Kwazulu and most South African universities.
RECOMMENDATIONS
It is recommended that higher education institutions involve fully in their organizations the sustainability
towards the faculty, the staff in all areas, the students, alumni and other stakeholders for the development
of the institutions citizenship engagement in a competitive environment. This is cooperative learning and
sustainable learning involving all stakeholders However, Further research should be on the best model to
apply to the relevant universities in cooperative learning and sustainable living, so as to have benefits
measured among the staff, the students as well as the communities which is a matter of concern and its
linkage to sustainable development education.
REFERENCES
Bell, S. and Morse, S. (2003). Measuring Sustainability, Learning from Doing. London, Earthscan.
Chelule, F.K.(2009). Modern facilitation and Training Methodology. A guide to Best Practices in Africa.
Eldoret. Zapy Chancery Publication.
Corina, J., Rsmie, O., Tamoi, J. and Nero, M. (2012). Environmental Literacy and Attitudes among
Malaysian Business educators. Emerald Group Publishing Limited.
FAO (1994). Reorienting the cooperative structure in selected eastern European countries. Summary of
case studies. Rome Food and Agriculture Organization of the United Nations.
Folke, D. (1989). Organization Development in Cooperatives. Structures and process. A regional
perspective. Moshika.
Gwarida, R.C. (1993). The Practice of Teaching. Harare, the College Press.
Gwarida, T.C. (1985). Socialisation and Education. An Introduction. Harare, The College Press.
ICA (1980). Co-operatives in the year 2000. A paper prepared for the 27th Congress of the International
Cooperatives Alliance Moscow, October 1980.
ILO (2000). Cooperatives in Africa: from reform to Reconstruction. Report on a workshop held in
Ezulwini, Swaziland, August 3rd
1999. ILO Geneva.
Johnson, S.X.V. and Johnson, H. (1991). Learning Together and Alone: Cooperative, Competition and
Individualization, 3rd
edition, Englewood Cliffs, NJ. Prentice Hall.
Johnsonsdottier, L. (2009). Environmental literacy of Business Students. University of Iceland Reykjavik,
Iceland.
Karin, R., Thomas, O.Rosemary, T. (2010). Introducing Corporative Social Responsibility as Component
in Cooperative Education: results from a Student research Project in Germany and the United
States supported by Intel Corporation. Asia-Pacific Journal of Cooperative Education. 2010,
11(1), 1-12.
Kombo, D.K. (2006). Sociology of Education; Nairobi, Kenyatta University Press.

Proceedings of the Third International Research Conference held on 26th to 28th October, 2016 215
Nathans and Taylor, N. (2003). Linking Co-operative Education and Education for Sustainability. A New
Direction for Co-operative Education. Asia-Pacific journal of Co-operative Education 4(1)1-8.
Ouma, J.S. (1989). Development in Kenya through Co-operatives. Nairobi, Shirikon Publishers.
ReinHard, Osburg, R. and Townsend, R. (2010). Introducing Corporate Social Responsibility as
Component Project in Germany and the United States supported by Intel Corporation. Asia-
pacific Journal of Cooperative Education, 2010 11(1), 1-12.
Republic of Kenya. (2009). Handbook of National Reporting Indicators 2008- 2012. Nairobi. Ministry of
State for Planning, National Development and Vision 2030.
RoK. (2000). Summary of the Cooperative Policy of Kenya on Co-operatives in a Liberalized Economic
Environment. Nairobi ILO-Danida Co-operative Development Programme.
Saccostar. (2010). Issue 10, December, Nairobi. Kenya Union of Savings and Credit Co-operatives
Limited.
Saccostar (2010). Issue 11, March. Nairobi. Kenya Union of Savings and Credit Cooperatives Limited.
Sapsford (2011). Survey Studies. London. Prentice Hall.
Schaars, M.A. (1980). Cooperatives, Principles and Practices. Madison. Cooperative Extension programs.
University of Wisconsin-Madison.
Sifuna and Waiyaki, (2006) Themes in the study of the foundation of education. Nairobi, Jomo Kenyatta
foundation. ******
EFFECT OF COMPUTER ASSISTED TEACHING STRATEGY ON STUDETNS’
ACHIEVESMENT IN AGRICULTURE IN SECONDARY SCHOOLS IN KENYA
Muchiri, J.M.1, Barchok, H.K.1 and Kathuri N.J.2
1Faculty of Education, Chuka University, P. O. Box 109 – 60400, Chuka 2Faculty of Education, Kenya Methodist University, P. O. 267 – 60200, Meru
ABSTRACT
The importance of Computer Assisted Teaching (CAT) has increased in schools and Kenya is no
exception. CAT is a method that uses computers in a learning media and strengthens student’s motivation
and educational processes. Little or no information is known about the impact of the strategy in teaching
agriculture and consequently on students’ achievement. The purpose of the present study was to
investigate the effect of Computer Assisted Teaching (CAT) strategy on students’ achievement in
agriculture. The study employed Solomon Four-Quasi-experimental design. The study was conducted in
eight county secondary schools in Tharaka Nithi County, Kenya. Stratified random sampling technique
was used in selecting sample schools. A sample of 327 Form One students participated in the study. The
research instrument was Agriculture Achievement Test (AAT) with a reliability coefficient of 0.91.
Descriptive statistics (means and percentages) and inferential statistic (ANOVA) were used for data
analysis. The findings of the study indicated that CAT strategy improved achievement in agriculture. The
study concluded that CAT is an effective strategy in improving achievement in agriculture and therefore
agriculture teachers should incorporate CAT strategy in their teaching.
Keywords: Achievement, Agriculture subject, Conventional Teaching
INTRODUCTION Achievement is a measure of quality and quantity of success one has in the mastering of knowledge, skills
or understanding. Academic achievement is designated by test and examination scores or marks assigned
by subject teacher (Adediwura and Tayo, 2007). According to Lewin, Wasanga, Wanderi and Somerset
(2011), academic achievement of students at secondary level, is not only a pointer of effectiveness of
schools but also a determinant of the well being of youth in particular and the nation in general. Hence
improving students’ academic achievement in agriculture is necessary for promoting economic growth in
Kenya. Performance of students in agriculture is an indicator of effective teaching in the subject.
The Kenya National Examination Council (KNEC), examines agriculture at KCSE level through three
Papers, Paper 1, Paper 2 and Paper 3. Paper 1 is a theory paper that covers general agriculture, crop
production, agricultural economics, and soil and water conservation. It has three sections, A, B and C.

Proceedings of the Third International Research Conference held on 26th to 28th October, 2016 216
The paper is scored out of 90 marks. Paper 2 is also a theory paper that covers livestock production, farm
machinery, farm structures and farm tools and equipment. It has three sections A, B, and C and it is
scored out of 90 marks. Paper 3 is a project paper with two project questions, project A and project B.
One of the projects is on animal production and the other on crop production. Candidates select and carry
out only one of the two projects and the paper is scored out of 100 marks (KIE, 2006).The three papers
test the candidates’ competence in understanding the agricultural principles, concepts and practices as
stipulated in the syllabus (KIE, 2006). The general performance of agriculture is indicated by the overall
performance of candidates in the three papers. Performance in agriculture has been below 50% for the
years 2008-2013. For the year 2013, the overall percentage mean score in agriculture was 34%.
One of the factors that affect students’ achievement is the teaching strategy adopted by the teacher (Mills,
1991). Hence for successful teaching and learning agriculture, use of appropriate teaching strategy is
necessary. Most of the teaching strategies practiced by agriculture teachers are expository and facts
oriented assigning learners a passive role (Kathuri, 1990; Ngesa 2006). Teachers usually act as dispensers
of knowledge while learners listen and make notes. Teaching methods are changing with a tendency of
being learner-centred with less focus on the teacher (Lang, Arthur and Herbet, 1995). In the modern
teaching environment, the learner is the main focus and is supposed to be responsible for his knowledge.
Information communication technology tools such as computers are being integrated in teaching as a way
of making learning more learner-centred.
Computer Assisted Teaching (CAT) is one of the terms that are used to refer to the use of computers in
the teaching and learning process. Learners are actively involved in the learning process and this
improves learning. Learners identify key principles for themselves rather than simply accepting the
teacher’s explanation (Anita, 2008). Students build knowledge and understanding from interaction with
the computer. Use of computers in teaching has been shown to produce positive results in teaching
difficult topics (Tanui, Kiboss and Nassiuma, 2008). Studies have shown that use of computers improves
students’ achievement in various subjects (Ahiatrogah, Madjoub and Bervel, 2013; Serin, 2011).
Computers are being used to enhance effective delivery and learning concepts in various subjects. Despite
the effectiveness of computers in improving achievement, research on this area in relation to secondary
school agriculture is limited. It is against this background that this study investigated the effect of CAT
strategy on students’ achievement in agriculture in secondary schools in Kenya.
Study Objective The overall objective of the study was to determine the effect of computer assisted teaching (CAT)
strategy on students’ achievement in agriculture. The specific objective was to determine whether there is
a difference in achievement in agriculture between students exposed to CAT strategy and those exposed
to Conventional Teaching (CT) strategy.
METHODS AND MATERIALS
Research Design
The study employed quasi-experimental research design and in particular Solomon Four Group design.
Quasi-experimental design uses natural assembled groups such as classes in research. The design allows
the researcher to randomly select a sample from the population without the random assignment of
individual cases to comparison groups. Quasi-experimental design was found appropriate for the present
study because the research participants (students) were not randomly assigned to experimental and control
groups and the researcher worked with the existing intact classes. Secondary school classes once
constituted exist as intact groups. According to Shuttleworth (2009), the design allows the researcher to
exert complete control over the variables and to check the influence of pretest on the results. The design
controls major threats to internal validity except those associated with interactions of maturity and
history, selection and maturation and selection and instrumentation (Cook and Campbell, 1979). Random
assignment of schools to experimental and control groups controlled selection and maturation. To control
interaction between selection and instrumentation, the conditions under which the instruments were
administered were kept similar across the schools. Solomon Four-Group design is as follows:

Proceedings of the Third International Research Conference held on 26th to 28th October, 2016 217
Group I (E1) O1 X O2
Group II (C1) O3 O4
Group III (E2) X O5
Group IV (C2) O6
Where: O1 and O3 are pretests; O2, O4, O5 and O6 are posttests; X is the treatment.
Group I was the experimental group (E1) which received the pretest (O1), the treatment (X) and the
posttest (O2). Group II was the control group (C1) which received a pretest (O3), no treatment and the
posttest (O4). Group III was another experimental group (E2) which received treatment (X) and the
posttest (O5) but did not receive the pretest. Group IV was another control (C2) that received the posttest
(O6) only. Group 1 and III were exposed to CAT strategy. Group II and Group IV were taught agriculture
using the conventional teaching strategy.
Data Collection and Analysis
The study target the 1,779, 876 secondary school students in Kenya. The study was carried out in Tharaka
Nithi County, Kenya. The county has a total of 136 secondary schools comprising of 2 national, 14 extra-
county, 29 county and 91 sub-county secondary schools. County secondary schools that had well
equipped computer laboratories participated in the study. The accessible population was the 8,140 form
one students in secondary schools in the county. Form ones were selected because the topic on Livestock
Production I (Common livestock breeds) is taught at this level (KIE, 2006). Stratified random sampling
technique was used to select participating schools. A total of eight schools consisting of four girls’ and
four boys’ secondary schools formed the sample for the study. A total of 163 boys and 164 girls
participated in the study. Simple random sampling technique was used to select a particular stream for
data analysis in cases where there was more than one stream in a participating school. However, for
schools in the experimental groups, treatment was administered to all the streams.
The research instrument used for the study was Agriculture Achievement Test (AAT). The AAT was
constructed from what the students had learnt during the study period. The researcher developed the AAT
using the objectives of the topic being taught (MoE, 2012). Livestock production I (Common livestock
breeds) formed the topic for the study. Livestock breeds studied included, cattle (exotic and indigenous),
sheep, goats, rabbits, poultry and camels. The agriculture achievement test included short answer and
structured questions covering knowledge, comprehension, application and analysis levels in the cognitive
domain. The test had 17 items with a maximum score of 50 marks. To ascertain the reliability of the
AAT, a pilot study was carried out in the neighbouring Embu County. K-R 21 formula was used to
estimate the reliability of AAT. A reliability coefficient of 0.7 and above was accepted. The AAT yielded
a coefficient of 0.91 which was considered suitable for the study.
The researcher trained form one agriculture teachers in the experimental groups for one day on the use of
CAT strategy in teaching. Teachers in the experimental groups taught agriculture by use CAT strategy
while their counterparts in the control groups taught agriculture by use of Conventional Teaching (CT)
strategy. The topic of instruction was Livestock Production I (Common livestock breeds). All the
teachers in the sampled schools used a common implementation schedule which was prepared by the
researcher. Before commencement of the study, agriculture achievement test was administered to groups I
and II as a pretest. This was followed by a three weeks intervention of the CAT strategy for groups I and
III. After the intervention, AAT was administered to all the groups. Students’ pretest and posttest results
were scored to generate data for analysis using descriptive and inferential statistics.
RESULTS AND DISCUSSIONS
The study sought to determine whether there is a difference in achievement in agriculture between
students exposed to computer assisted teaching strategy and those exposed to conventional teaching
strategy. In order to assess the students’ knowledge in agriculture prior to the treatment, an analysis of the
students pretest scores in AAT was carried out. The mean and standard deviation of pretest scores on
AAT for experimental group E1 and control group C1 are presented in Table 1.

Proceedings of the Third International Research Conference held on 26th to 28th October, 2016 218
Table 1. Students’ Pretest Mean Scores on AAT
Group N Mean Standard Deviation
E1 82 7.27 2.33
C1 83 6.98 2.19
Results in Table 1 show that mean scores for experimental group E1 and that for the control group C1 for
the pretest were 7.27 and 6.98, respectively out of a maximum score of 50 marks. The mean scores for the
two groups were low. This can be attributed to the fact that testing was done before teaching the topic
under study. Scores obtained from the students showed that students had prior knowledge on some
aspects of the topic. An independent t-test was performed to determine whether there was any significant
difference in the mean scores of the two groups. Results are presented in Table 2.
Table 2. The t-test of Pretest Mean Scores on AAT
t df Sig. (2-tailed)
Equal Variances Assumed 0.830 163 0.408
Equal variances not assumed 0.830 162.121 0.408
Results in Table 2 show no significant difference in the two mean scores, t(163) = .408, P>0.05. The
p(.408) is greater than 0.05, so the difference is not significant. This implies that the level of achievement
prior to the administration of computer assisted teaching strategy for the experimental and control groups
were similar. The experimental and control groups were similar before administration of the treatment
and therefore, suitable for the study.
To determine the mean score gain after the intervention, a comparison was made on students’
improvement from pretest to posttest. Table 3 presents the mean scores and mean gain obtained by
students in experimental group E1 and control C1 in AAT. Results in Table 3 show the posttest mean
scores for E1 and C1 as 31.23 and 22.16, respectively. Pretest mean scores were 7.27 and 6.98 for
experimental and control groups, respectively. Results presented in Table 3 show that the experimental
group E1 had a mean gain score of 23.96, and the control group C1 had a mean gain score of 15.18. The
experimental group that was taught agriculture using computers had a higher mean score gain than the
control group which was taught agriculture by use of CT strategy. This suggests that students gain more
when taught agriculture using computers than by use of CT strategy. Results of the present study are
consistent with the report of Kulik and Kulik (1987) on the review of studies on computer based
instructions. On average, Computer Based Instruction (CBI) assisted students in raising their achievement
by 10 to 18% points compared to conventional methods.
Table 3. Mean score gain by students in AAT
Group N Posttest Mean Score Pretest Mean Score Mean Gain
E1 82 31.23 7.27 23.96
C1 83 22.16 6.98 15.18
To find out the effect of exposure to CAT strategy on students achievement in agriculture, an analysis of
student posttest mean scores was carried out. Table 4 presents the posttest mean scores on AAT for the
four groups involved in the study.
Table 4. Posttest Mean Scores on AAT
Type of group N Mean Standard Deviation
E1 82 31.23 7.91
C1 83 22.16 4.43
E2 81 31.28 5.53
C2 81 20.68 4.66
Total 327 26.33 7.60

Proceedings of the Third International Research Conference held on 26th to 28th October, 2016 219
Results in Table 4 show that the highest mean scores were obtained by experimental groups E1 and E2,
which had mean scores of 31.23 and 31.28, respectively out of a maximum of 50 points. Control groups
C1 and C2 had mean scores of 22.16 and 20.68, respectively. The experimental groups E1 and E2 which
were exposed to computer assisted teaching strategy had higher mean scores compared to control groups
that were taught agriculture with conventional teaching strategy.
To test for mean difference in posttest AAT, Analysis of Covariance (ANCOVA) was performed with
KCPE marks as covariate. Analysis of Covariance was preferred for this study because it allows
comparing one variable in two or more groups taking into account variability in other variables called
covariates. In the present study ANCOVA allowed for comparison of AAT mean scores in the groups and
at the same time correcting variability in KCPE marks which were used as a measure of students’ entry
behaviour. This was deemed necessary to ensure that any significant difference in the mean scores was as
a result of the intervention and not because of the ability of the students in terms of their entry behaviour.
Results are depicted in Table 5.
Table 5. Analysis of covariance of the posttest mean scores with KCPE as Covariate
Source
Type III Sum
of Squares df Mean Square F Sig.
Corrected Model 8384.460a 4 2096.115 64.542 0.000
Intercept 199.040 1 199.040 6.129 0.014
KCPE 394.157 1 394.157 12.137 0.001
GROUP 5113.300 3 1704.433 52.482 0.000
Error 10457.528 322 32.477
Total 245493.000 327
Corrected Total 18841.988 326 aR Squared = 0.445 (Adjusted R Squared = 0.438)
The ANCOVA results in Table 5 show that there were significant differences existing on posttest mean
scores among the groups, F(3,322) = 52.482, P<0.05. The p(0.000) is less than 0.05, so the difference is
significant. The difference can be attributed to the treatment effect. An examination of results in Table 4
show that experimental groups E1 and E2 had the highest mean scores of 31.23 and 31.28, respectively.
Control groups C1 and C2 had the lowest mean scores of 22.16 and 20.68, respectively. This implies that
the treatment was effective in groups E1 and E2. It can therefore, be inferred that the higher posttest mean
scores of the experimental groups was due to the use of CAT strategy. This, therefore, led to the rejection
of null hypothesis, which stated that there is no statistically significant difference in achievement in
agriculture between students exposed to CAT strategy and those exposed to CT strategy.
Findings of the present study are consistent with those of Kiboss, Ndirangu and Wekesa (2004), on the
effectiveness of Computer-mediated simulations in school biology on students’ learning outcomes.
Results from the study indicated that the mean differences between the experimental and control groups
were statistically significant in favour of the experimental group. Kiboss (2000) also reported similar
findings on the study of teacher/pupil perspectives on computer-augmented physics lessons on a
measurement in Kenyan secondary schools. The study revealed that Computer Based Instruction (CBI)
had positive influence on the pupils’ classroom interaction patterns which consequently led to an
improvement in achievement.
Findings of the present study agree with findings of Serin (2011) on effects of computer based instruction
on the achievement and problem solving skills of science and technology students in Turkey. Findings of
the study indicated a statistically significant increase in the achievement and problem solving skills of the
students in the experimental group that received computer based science and technology instruction.
Ahiatrogah, Madjoub and Bervel (2013) also reported similar findings after comparing the effects of
computer assisted instruction on the achievement of junior high school students in pre-technical skills in
Nigeria after exposing them to Computer Assisted Instruction (CAI) and traditional methods of
instruction. Findings of the study showed that the CAI group performed better than the group that was

Proceedings of the Third International Research Conference held on 26th to 28th October, 2016 220
exposed to traditional methods of instruction. Findings of the present study also echoed findings of
Ugwuadu and Joda (2013) on the effectiveness of CBI on academic performance of pre-degree students in
Nigeria. The study showed that students taught biology with CBI performed better than those taught with
conventional teaching strategy. Other studies comparing traditional instruction and computer assisted
instruction have shown a significant difference in academic achievement of the two groups in favour of
computer assisted group (McSweeney, 2003; Olusi, 2008).
CONCLUSION AND RECOMMENDATION Results of the study indicated that CAT strategy is beneficial in improving academic scores. Use of CAT
strategy as a supplement to conventional instruction produces higher academic achievement than the use
of conventional CT alone due to the fact that students learn instructional content faster with CAT strategy
and retain what they have learnt better with CAT strategy than with conventional strategy alone. Use of
computers gave the students the chance to use several senses during the learning process and this
consequently improved learning. Agriculture teachers should be encouraged to incorporate CAT strategy
in their teaching as a way of enhancing the teaching of agriculture, and consequently improve
performance in agriculture.
REFERENCES
Adediwura, A. A. and Tayo, T. (2007). Perceptions of teacher Knowledge, Attitude and Teaching Skills
as Predictor of Academic Performance in Nigerian Secondary schools. Educational Research and
Review, 2(7):165-171.
Ahiatrogah, P., Madjoub, M. and Bervel, B. (2013). Effects of computer assisted instruction on the
achievement of students in pre-technical skills. Academic J. Interdisciplinary Studies, 2(1):77-86.
Anita, W. (2004). Educational Psychology (9th ed.). United States of America: Ohio State University.
Cook ,T. D. and Campbell, D. T. (1979). Quasi-experiment: Design and Analysis Issues for Field
Settings. New York: Rand McNally.
Kathuri, N. J. (1990). A Study of the New Agricultural Education Curriculum in Secondary Schools of
Kenya. Unpublished Ph.D Dissertation, University of Illinois, urbana-champaign: Illinois.
Kenya Institute of Education. 2006. Secondary Education, Agriculture Teachers Handbook. Nairobi: KIE.
Kiboss, J. K. (2000). Teacher/Pupil Perspectives on Measurement in Kenyan Secondary Schools.
Journal of Information Technology for Teacher Education, 9, 199 – 218.
Kiboss, J. K., Ndirangu M. and Wekesa E.W (2004). Effectiveness of a Computer- Mediated Simulations
Program in School Biology on Pupil’s Learning Outcomes in Cell Theory. Journal of Science
Education and Technology, 13 (2), 207 – 213.
Kulik, A. J. and Kulik C. C. (1987). Review of Recent Research Literature on Computer-Based
Instruction. Contemporary Educational Psychology, 12:222-230.
Lang, H. R., Arthur, M. and Herbert J. (1995). Teaching: Strategies and Methods for Student-Centered
Instruction. Ontario: Harcourt Brace Company.
Lewin, K. M., Wasanga, P., Wanderi, E. and Somerset, A. (2011). Participation and Performance in
Education in Sub-Saharan Africa with Special Reference to Kenya. Create Pathways to Access.
Research Monograph no. 74: University of Sussex.
McSweeney, L. (2003). Assessing the math online tool: A progressive report. Mathematics and Computer
Education, 37(3):348-357.
Mills, H. 1991. Teaching and training: A handbook for instructors (3rd
ed.). London: Macmillan
Publishers.
Ministry of Education, (2012). Secondary Agriculture: Book One. Nairobi: Kenya Literature Bureau.
Ngesa F. U (2006). Demand Profiles and Supply Responses for Agricultural Education and Training at
Post Primary Education Level: Case study of Kenya. Unpublished report prepared for the World
Agroforestry Centre (ICRAF), Nairobi, Kenya.
Olusi, F. I. (2008). Using computers to solve mathematics by junior secondary school students in Edo
State Nigeria. College Students Journal, 42(3), 748-755.
Serin, O. (2011). The Effect of Computer-Based Instruction and Problem Solving Skills of the Science
and Technology Students. The Turkish Online Journal of Educational Technology, 10:183-201.

Proceedings of the Third International Research Conference held on 26th to 28th October, 2016 221
Shuttleworth, M. (2009). Solomon Four-Group Design. Retrieved on 11th March 2011 from
http://www.experiment-resources.com/solomon-Four group-design.htm
Tanui, E. K., Kiboss, J. and Nassiuma, D. (2008). The Effect of CBI on the Students’ Achievement and
Motivation in Secondary School Business Education. Journal of Education and Human
Resources, 5, 14-25.
Ugwuadu, O. R. and Joda F. M. (2013). Effectiveness of Computer-Based Instruction on Academic
Performance of Pre-degree Students in Biology. Public Policy Administration Research,
3(12):104-109. ******
THE DOUBLE EDGED ROLE OF INDIGENOUS LANGUAGES IN NATIONAL
DEVELOPMENT: A CASE OF THE LOWER PRIMARY CLASSROOM IN KENYAN
SCHOOLS
Njeri, B.1, Rutere, A.M.2 and Yieke, F.2
1Murang’a University College, Kenya
2Laikipia University, Kenya
Tel: +254 (0) 722 214 677, Email: [email protected]
ABSTRACT
Language plays a crucial role in the education outcomes of a country. The study has addressed the issue
of language choice and development in a multilingual state to enable learners be advantaged both locally
and internationally. Despite choice of mother tongue and English as medium of instruction in lower
primary and from upper primary classes respectively, low literacy level is evident as 1 out 6 children
could not read an English word (Uwezo, 2014). Further, learners’ poor command of the English language
is evident in poor performance in national exams. Some stakeholders attribute this to use of indigenous
languages in school despite their importance in language development. Consequently, there is need to
interrogate the place of local languages during instruction at the lower primary level. Purposive sampling
techniques were used to select schools where learners used Kiswahili – their indigenous language - as a
medium of instruction. Data collection was through observation during English lesson and interviews.
The study found that circumstances necessitated the use of Kiswahili language by teachers though they
are often discouraged; secondly, the use of Kiswahili enhanced English vocabulary learning as learners
performed well on words explained in Kiswahili; and finally, teachers lacked guidance on when and how
to use Kiswahili resulting to ungrammatical sentences. Thus if indigenous languag,es are well developed,
code-switching maybe used to enhance mastery of English language for better results. All stakeholders
ought to be sensitized on the importance of both indigenous and international languages in learning.
Keywords: Code-Switching, Vocabulary, Language choice, Outcomes
INTRODUCTION
Development has been defined differently depending on the focus of discussion. Traditional economic
theory view development as an increase in per capita income while the human development theorist
emphasize the improvement of the well-being of a people. What is not in contention in all these views is
the central role that education plays in the general improvements of peoples’ lives. It is for this reason that
Kenya’s Vision 2030 singles out education as the vehicle that will drive Kenya into becoming a middle-
economy. Indeed in line with Sustainable Development Goal 4 (SDG 4) all countries are expected to
ensure inclusive and equitable quality education and promote lifelong learning by the year 2030.
One of the key targets in SDG 4 is to ensure that by 2030, all girls and boys have an access to complete
free, equitable and quality primary and secondary education leading to relevant and effective learning
outcomes. A similar target is to be found in Kenya’s National Education Sector Support Program (NESSP
(2013-2018) that seeks to improve the quality of education and training so that Kenya’s measureable
learning outcomes in literacy, numeracy, scientific and communication skills are in the upper quartile on
recognized international standardized tests by 2017. Some of the identified benefits of improved learning
outcomes include amongst others, an economically empowered society that is able to make the right
decisions and claim their rights as well as have positive attitudes and values. This can be realized if
education is relevant and is able to meet the needs of society. A fundamental concern of any relevant

Proceedings of the Third International Research Conference held on 26th to 28th October, 2016 222
education system must therefore be the choice of language of instruction especially in a multilingual
society such as Kenya. This is more so at the entry level – in this case the lower primary school – where
the foundation for education is laid. This raises the question of how best primary education would be
provided so that learners are equipped for the different roles in the society.
Language Choice in Education
The debate on which language should be used for instruction in primary schools is an indication that
language choice is critical in education. In support of this, Trudell 2015 observes that language choice is
central to any development regardless of the approach given. In view of this, the language that is chosen
as medium of instruction is important in Kenya. Baker 2011:209-210 proposes a bilingual education
because of several reasons:
(i) To assimilate individual or groups into mainstream society
(ii) To socialize people for full participation in the community;
(iii) To unify a multilingual society; bring unity to multi-ethnic, multi-tribal, or multi-national
linguistic diversity state;
(iv) To enable people to communicate with the outside world;
(v) To provide language skills which are marketable for obtaining employment and status;
(vi) To deepen understanding of language and culture;
(vii) To preserve ethnic and religious identity;
(viii) To reconcile and mediate between different linguistics and political communities.
In view of this, learners should be provided with opportunities to access both indigenous and international
languages. Despite the existence of Kenyan language policy on the medium of instruction where
indigenous languages are used in lower primary and English in all other levels, studies have shown that
pupils are not able to read books in their level that are written in English. (Trudell 2015; Uwezo 2014).
Since learning should not be memorization but application of new knowledge, it is important that the
language of instruction be one that the leaners can easily understand. Such process makes the concepts to
be simple and relevant to learners’ experiences when a learner speaks. This gives our indigenous
languages a central position in our education. Despite this critical role, the question of how developed our
indigenous languages are towards preparing our learners to be global citizens still arises.
It therefore, becomes necessary that learners are facilitated to acquire international languages so as not to
lose out on some opportunities later in life. English is one of the world major languages that has spread
globally with over 1.5 billion speakers (Crystal, 2012). Its use is a positive characterization of
globalization. In Kenya -a former British colony – the important role played by English language cannot
be underscored as those who master it reap many academic, social and professional benefits (Ngugi,
2012). English is also a medium of instruction from class four in primary level to the highest level except
when teaching other languages. While English language enables learners to acquire knowledge that would
make them global citizen, it is only possible if the learners have mastered it as a language of instruction
(Trudell, 2015). There is need therefore to find out how English proficiency can effectively be achieved.
Studies have shown that the role of indigenous languages in second language development cannot be
ignored. UNICEF (2003:77) states that “pupils learn better in their own mother tongue as a prelude to and
complement of bilingual education approaches”. This was in support of a report by UNESCO that had
proposed development of a lingua franca in classroom which was not to substitute mother tongue unless
pupils could use it before going to school. This gives our indigenous languages a double edged role in
education: to provide a foundation for education and as a bridge to acquisition of the second language. It
was the interest of this study to find out how teachers used indigenous languages as a medium of
instruction in addition to helping learners learn English language. Since language can facilitate the
achievement of national goals in Kenya it is important to find out how teachers use indigenous languages
to develop second language. This study attempted to answer the following questions: a) what was the role
of first language during English lesson? (b) To what extent did use of Kiswahili influence learners’
performance on vocabulary learning during English lesson? (c) What challenges did the teachers face
when using Kiswahili during English lessons?

Proceedings of the Third International Research Conference held on 26th to 28th October, 2016 223
Theoretical Framework
This study was based on Baker and Westrup’s 2000 presentation, practice and production (PPP)
Framework. Baker and Westrup suggest that in a lesson there are three main phases: presentation phase,
practice phase and production phase. Presentation phase being the first phase, the teacher introduced the
new language items that pupils needed to learn. When presenting new words, the teachers demonstrated
three things clearly: how the word sounds; what the word meant and how and when a word was used. The
teacher modified his or her language in order to make pupils understand the meaning of new words or
make the input comprehensible (Krashen, 2003). Further, the teacher used the new words in obvious
context for pupils to understand meaning of new words. The teacher engages learners in activities geared
towards understanding the word structure and the meaning. The current study observed areas where a
teacher would shift from English to other languages in order to explain or illustrate words.
During the second step: the practice phase pupils would be engaged in plenty of activities that helped
them practise new words. The teachers engaged pupils in different learning strategies. The teachers used
different learning activities that would help pupils process the input. The activities include: listening,
repeating, writing and reading the new sentence where the new words had been used. The pupils practised
individually, in pairs, groups or as a whole class. Baker and Westrup proposes use of strategies and tactics
to make conversation appropriate and meaningful. For example, finding topics of conversation that can be
mutually understood, speaking at a slow pace, repeating important phrases, stressing the key words in a
sentence which eventually would help the pupil in processing new input. It is at this stage that the teacher
corrects sentence construction, use of language and pronunciation. This stage is called controlled practice
phase. It uses repetition techniques that are used in direct method such as drilling. The pupils are given
different activities which will allow them to use the language they have learned in a freer situation. Areas
where the teacher or learner used altered their language were observed to find out if it influenced learning
in any way.
In the production phase the pupils were engaged in activities which allow free language production. They
may have to do some of the activities when they leave the classroom, for example, writing a composition
or attempting questions individually from textbooks or from the blackboard. In a classroom situation, the
pupils may be engaged in communicative activities in pairs or as a group. The pupils were expected to use
the words that they learned before. The researcher used the learners’ written exercises to find out the
number of words the pupils were able to correctly use during the exercise after the teacher had altered the
language when explaining.
The PPP framework was relevant as the teachers introduced the words, explained the meaning and
allowed learners to use words in different learning activities. The study used the learning activities to
asses learners understanding on words whose meaning was explained in Kiswahili. Specifically, the
production phase activities provided a teacher with the correct feedback on whether learners had
understood what they were being taught.
Research Methodology
The study used a quantitative approach to correlate the indigenous language with second language
development for better classroom outcomes. Wimmer and Joseph (2006) notes that the design attempts to
describe a current condition in any given area of study. A descriptive design describes behaviour of a
particular group or individuals. According to Kombo (2006), descriptive design reports things the way
they are at that particular time.
Purposive sampling was used in selecting 3 out of the 25 public primary schools in Ruiru Sub County.
This enabled the researcher to include relevant categories of schools in the region. Gay (1981) argues that
in a descriptive study 10% of the accessible population is enough sample. 3 schools were more than ten
percent making the sample enough for the current study. In cases of schools with more than one stream,
random sampling was done.

Proceedings of the Third International Research Conference held on 26th to 28th October, 2016 224
Three out of the 9 lessons which were observed were during vocabulary lessons. The 3 lessons enabled
the researcher to develop a checklist for words that were explained in L1. After the lesson, exercise books
for pupil who answered questions which related to vocabulary taught were photocopied for the study. A
total of 40 exercise books were sampled for analysis. The estimated total number of learners in a class
was 30 therefore, 40 books were more than a third of total population from the three classes. The data was
used by the researcher to find out how many words the learners got correctly after code-switching was
used by the teacher. Studies indicate that classroom assessment may be used to assess learners’
development in English four skills and effectiveness of a teaching (Nunan 2003; Steadman 1998; Byon
2005.)This led to an evaluation of how learners performed on words explained in Kiswahili language
during an English lesson. Furthermore, a total of nine teachers from the sampled schools were
interviewed. Three of whom had been observed during the lesson and the other six were lower primary
teachers. The three teachers were preferred for clarification of observations made during data collection.
RESULTS
The teachers were aware of the language policy in Kenya that requires them to use the language of the
catchment or Kiswahili in mixed ethnic areas. The classes consisted of learners from different ethnic
backgrounds. Consequently, the teachers used Kiswahili as the medium of instruction. The teachers were
positive on code-switching despite ‘instructions’ that required them not to use any other language during
English lesson. Teachers indicated that some words were easily explained in Kiswahili than in English.
Despite the head teachers insisting on the use of English language in school, the teachers translanguaged.
This is consistent with Lin (2005) observation that code-switching is a localized usage of language.
Teachers were observed to use different forms of code-switching which include: Synonyms, questions
and reiteration. Synonyms -translation of words into Kiswahili by teachers for learners- explained the
meaning of a word for example the meaning of the word accept is given as ‘kuitikia’. Questions were
used by teachers to find out whether the learners had understood a topic or establish how much learners
knew before introducing a new topic. Reiteration was used by both teachers and learners especially when
a teacher wanted something understood, words of the previous speaker would be repeated orally.
Teachers used Kiswahili language during English lesson for the following functions:
1. Elicit information
2. Explaining/Informing
3. Correcting learners
4. Allowing learners to participate in the lesson
5. Explaining complex procedure
6. Offering clues to learners
7. Nominating the next speaker
Learners’ performance on words explained in Kiswahili This study used three English lessons in all lower classes levels. Following are results on learners’
performance in every question in the three lessons.
Lesson I: Class one
Table 1. Performance on code-switched words
Word Frequency %
Fish 6 67
Rice 5 56
Food 5 56
Mother 5 56
Want /have 6 67
Table 6 67
The observation made from the above table is that at least over fifty percent of the learners were able to
answer correctly. The issue may be that the learners were expected to have understood the passage to
avoid the mixing. For example learners use the word food together with the verb eating but in this case

Proceedings of the Third International Research Conference held on 26th to 28th October, 2016 225
the correct answer was fish and rice. It shows that the learners understood the word but were required to
answer some question as guided by the passage. The study found out that 6 learners out of 9 were able to
score over 50% and 4 scored everything. Only 3 out of 9 had less than 50%.
Figure 1: Learners’ performance on code-switched words
Lesson II: Class two
A total of 15 learners were sampled and the five questions marked. Table 3 shows how learners
performed in each question. Although the class was made up of slow learners or those who had come late,
most of the learners were able to use the words correctly in the sentences. It was observed that in all
questions, more than 12 learners out of 15 got the questions correctly. It is only question 3 that had low
score with 10 learners getting it right while 5 did not get it correctly.
Table 2. Performance on words explained in Kiswahili
The questions The no. of learners scoring correctly. %
1 13 87
2 13 87
3 10 67
4 13 87
5 14 93
Figure 2. Showing how learners performed on every question
Lesson III: Class three
In lesson 3 a total of 16 learners’ exercise books were randomly picked for marking. The results are
presented in Table 3 below. The learners were able to answer most of the questions correctly at 100%.
The least performed question was question 6 with 10 learners out of 16 being able to get the correct
answers.

Proceedings of the Third International Research Conference held on 26th to 28th October, 2016 226
Table 3. Learners’ performance on words explained in Kiswahili
Question No. Frequency (No. of learners who scored correctly) %
1 15 93
2 13 81
3 16 100
4 12 75
5 14 87
6 10 62
Figure 3. Showing learners performance on every question
DISCUSSION
Debate on whether indigenous language has positive or negative impact during English language learning
has been there for a long time. It is for this reason that this study sought to establish the veracity of this
argument. Observation during English language lessons and interviews from the teachers indicated that
code-switching was used by teachers to improve learners understanding of the content taught. Teachers
used different forms of code-switching in the study but synonyms, reiteration and questions were
identified as the major ones. Synonyms were used by teachers to explain the meaning of a word. Ndung’u
(2003) has identified use of synonyms as one of the instructional methods. The use of synonyms is
supported by Ellis (1994), Parker and Chaudron (1987) who said that teachers try to make their input
comprehensible by modifying their language so as to communicate with learners that are very proficient
in their second language. By making the input comprehensible through modification facilities, a natural
development of second language was achieved. The teachers either gave one synonym or used several
words to explain the same word. Gumperz (1992) points out that a teacher may repeat a word in a
different code either literary or in a modified form. Such repetition allows the teacher to provide multiple
aspects of a word. In so doing, the teachers were able to clarify or emphasize a message.
Questions were the other forms code-switching observed during the lesson. This happened mainly at the
beginning of an exchange. The teacher would ask questions about the content of discussion which the
teacher already knew. Celik (2008) argues that teachers should know their learner language level as well
as their language abilities. The feedback from the question enabled a teacher to evaluate learners’
understanding of the word and plan effectively.
Pupils were main users of reiteration. They would repeat words said by previous speaker. Gumperz
(1982) observes that Speakers participating in a given conversation may often code-switch from the
language they were using to the language used by a previous speaker. This was observed when a teacher
explained something in Kiswahili and then posed to learners a question that required them to repeat what
the teacher had said or their fellow learner. The pupils were observed to be comfortable to repeat what the
teacher or fellow pupil had said in Kiswahili. By quoting, the teacher gets to know if the learners had got

Proceedings of the Third International Research Conference held on 26th to 28th October, 2016 227
the answer correctly. It further, allowed learners to repeat the correct answer. Repetition is a widely used
practice that leads to a learner internalizing the concept that was being taught (Swain et al, 2013).
Fairclough (1989) posit that discourse allow a critical analysis of language at a social level and the impact
it has on relationships. The implication being that any information in the dialogue has possible effects or
functions. Since Wei (2000) identifies code-switching as a discourse strategy to achieve certain
interactions at specific points during conversation it was necessary to establish its impact. The study
found out that the code-switched utterances whether a question, statement or a reiteration had implication
on the learning process. The different functions were elicitation, nomination, offering clues, passing
information, correcting learners or allowing them to participate in class discussion.
The teacher initiated discourse in Kiswahili to elicit knowledge about the content being discussed. A
direct question was used most of the time in order to find out what the learners knew about item of
discussion in order for the teacher to build his or her discussion. Cole (1998) suggests that use of the
learners’ previous L1 knowledge increase L2 understanding. The main aim of elicitation is to gather
information from the learners on the subject of discussion. On the same note the information given by
learners enabled the teacher to know when the use of L1 would be beneficial (Celik, 2008). Similarly
teachers used the feedback from the learners to assess their teaching method. After pupils failed to answer
elicitation question the teachers provided additional information in Kiswahili. Sinclair and Coulthard
(1992) suggest that teachers may use statements, questions, commands or moodless items to offer clues to
the learners. During the lesson teachers used Kiswahili to paraphrase question and sentences
Nevertheless, if the learners were not able to give the correct answer, explanation was done using
Kiswahili language. Although, the learners were hesitant to use Kiswahili, they occasionally gave the
synonym of an English word in Kiswahili. Cook (2001) points out that code-switching is an important
tool that can be used to give an explanation. The teacher may use L1 to give a translation of a word or a
synonym and even contextualize the word. For instance, the teacher first gave a synonym of the word
‘respect’ to be ‘kuheshimiana’ then contextualized the word by providing the learner with situation that
will reflect that they respect someone. Therefore, code-switching helps learning to be effective as learners
are able to understand faster when a teacher translates.
Since not all answers from the learners were correct a teacher would correct learners using L1. The
teacher would clarify a point especially when learners had failed to give the correct answer. in one of
observed cases the teacher asked learners the meaning of the word greet. The learners gave incidence of
when they greet people instead of the meaning of the word to greet. The teacher used Kiswahili to tell
them it was not an example of a situation where that word is used but its meaning. Eventually, the teacher
gave the correct meaning of word ‘to greet’ as ‘kusaliamia’.
However, it was observed that the learners’ failure to give the correct response may not have been
necessarily because of lack of information. Sometimes the complexity of language used in instructions
may have resulted to wrong answers given by learners. Consequently, teachers were observed to code-
switch to help learners explain complex instructions. This concurs with, Mwangi et al (2009) who
observes that first language may be used when instruction of a particular activity has used language that is
beyond pupils understanding and the teacher wants the activity done. This was observed in most classes
where teachers discussed instructions with learners. In one instance, learner read the instruction and then
the teacher used Kiswahili words to find out whether the pupils had understood the instructions. The
instructions were later translated to Kiswahili. It is only after the learners had understood the instruction
that the teacher allowed the learners to continue with the activity orally.
The use of L1 by the teacher encouraged learners to participate in class discussion. Creases and
blackledge (2010) argues that code-switching helps in establishing relationships which increases
inclusion, participation and less formal relationship between participants which helps the teacher convey
ideas with ease. In classroom discourse the teachers adjusted their language to match that of the pupils.
Adjustments may call to simplification or reformulation on the part of the expert which was mostly done

Proceedings of the Third International Research Conference held on 26th to 28th October, 2016 228
by the teachers. By doing so, the teachers reduce learners burden and help in Mwangi et al (2009) encases
where a learner can best express himself or herself in L1. This concurs with Nthiga’s (2003) findings that
the teachers would occasionally adjust their language during the teaching. The adjustment made learners
to participate more in a lesson especially when they understand meaning of words.
Teachers used Kiswahili to pick learners who could answer their question especially those who remained
quiet. The switch was used to direct the message to a particular person and exclude others. The attention
of the person being invited to participate was drawn. Nthiga (2003) argues that nomination gives a learner
an opportunity to contribute to classroom discourse. Teachers used L1 to nominate pupils who were quiet
may be because language barrier. In doing so all learners have equal opportunity to participate in a lesson.
The learners performed well in words where Kiswahili language was used during the discussion which is
an indication that code-switching helped in vocabulary learning. This is because code-switching increased
cognitive processing of word in learners’ mind as observed by Lin (2013). Further, the results confirmed
Cook (2001) argument that grammar and vocabulary can be facilitated by code-switching. Such
arguments and observations explain why teachers altered their languages during English lessons.
Code-switching is an effective teaching method. However, the use of indigenous language to develop
English language for effective learning outcomes faced a number of challenges. Despite Kiswahili
language being developed and used in mixed ethnic environments, it remained a challenge to learners
whose first language was an indigenous language. The study also observed that teachers are not aware of
how they can use code-switching as a learning tool. Consequently, the teachers in some cases were
observed to construct sentences that were are not grammatically correct. This reflected speakers lack an
understanding of the grammar structure of the two languages. The teachers had not received adequate
training on how the process can be effectively used for positive result in their institutions of training.
Finally, the misconception that code-switching is used by speakers with low frequency of words has led
to code-switching being viewed as a weakness. On the contrary, code-switching reflect an intellectual
advantage as speakers moves from one language to another in their conversation.
CONCLUSION AND RECOMMENDATIONS
Education should be made all inclusive by development of indigenous languages in terms of sounds,
dictionary and textbooks for use by both teachers and learners. This will help eliminate the construction
of sentences that are not grammatically correct. The teachers should not only be encouraged to use
indigenous language as medium of instruction but also as lingua franca during the English lesson.
However, use of indigenous languages should be limited to when a need arises to allow use of English.
Teachers’ training colleges should train the teachers on how to translanguage from an indigenous
language to English language without affecting development of both languages. This may only happen if
teachers are familiar with both the similarities and differences of languages being used. Similar
grammatical patterns should be used while structural patterns that are different are avoided unless pupils
are exposed for a given reason. Equitable and quality education with positive learning outcomes is
achievable if all indigenous languages are well developed for the dual roles in the national development.
REFERENCES
Baker, C. (2011). Foundations of Bilingual Education and Bilingualism. New York: Multilingual Matters
Baker, J and Westrup, H. (2000). The English language teachers’ handbook. London: VSO
Brown, D. (2004). Language assessment: Principles and classroom practices. Amazon: Longhorn
publishers
Byon, A. (2005) Classroom assessment tools and students’ affective stances: KFL classroom settings.
Language and Education 19(3): 173–93.
Celik, S. (2008). Opening the door: An examination of Mother tongue use in Foreign Language
Classroom.Hacettepe University Journal of Education 34, 75-85
Cole, S. (1998). The Use of L1 in communicative English classrooms. The Language Teacher, 22(12).
Retrieved July 15, 2016, from http://www.jalt-publications.org/tlt/files/98/dec/cole.html Cook, V.
(1999). Going beyond the native speaker in language teaching. TESOL Quarterly,
Cook, V. (2001). Using the first language in classroom. A Canadian language review 57(3): 403-423

Proceedings of the Third International Research Conference held on 26th to 28th October, 2016 229
Crease, A and Blackledge, A. (2013). Code-switching in Bilingual Classroom: A pedagogical for learning
and teaching. The Modern Language Journal 94(1): 103-115
Cystal, D. (2003) English as a global Language. Cambridge: Cambridge University.
Ellis, R. (2012). Linguistic Universals and Second language education. In the study second language
acquisition (pp 557-638) Oxford: Oxford university press
Fairclough, M. (1989). Language and power. London: Longhorn Publishers.
Gay, R. (1981) Educational research: Competences for analysis and application. London: Charcles E.
Mairill publishing company
Gumperz, J. J. (1982). Discourse Strategies - Studies in interactional sociolinguistics. Cambridge:
Cambridge University Press
Krashen,S.(2003) Explanation in Language acquisition and use. Portsmouth ,NH: Pergamon
Kombo, D. (2006). Research Methods. Nairobi: Kenyatta University, Institute of Open Learning.
Lin, A. (2013). Classroom code-switching. Three decades of Research. Applied Linguistics Review
4(1):195-218
Trudell, B. (2015). Language Education and development in Africa. Proceedings of Conferences on Local
Languages in Education and Development in Limuru (pp. 22-44)
Mwangi, P., Kinyanjui, M., Gecaga, C., Indangasi, H. and Mukunga, M. (2009). Distinction English For
Primary Teacher Education Y1 and 2.Nairobi: Kenya Literature bureau.
Ndung’u, R. (2003). The use of synonyms by second learners in English in Kenyan Schools: Patterns,
lexical Strategies and Pedagogical implication
Ngugi, B. (2012). Language used in development of Learners’ English vocabulary in Kenyan secondary
Schools.
Nthiga, P. (2003) Patterns and functions of code-switching in pre-primary classroom discourse in selected
Schools in Kasarani
Nunan, D. (1992). Research methods in language learning. Cambridge: Cambridge University. 48.
Parker, K., and Chaudron, C. (1987). The effects of linguistic simplifications and elaborative
modifications on L2 comprehension. University of Hawaii Working papers in ESL, 6: 107-133
Sinclair, J. and Coulthard, M. (1975). Toward an Analysis of Discourse: The English used by Teachers
and Pupils. Oxford University Press.
Stedman, M. (1998). Using Classroom assessment to change both teaching and learning. View issue TOC
volume 1998, issue 7 PP. 25-35
Swain, M., Bygate, M and Skehan, P. (2013).Researching Pedagogical tasks: Second language, teaching
and testing. Routeledge Taylor andFrancis Group: New York.
United Nations Development Group. 2003. Indicators for monitoring the Millennium Development
Goals: Definitions, rationale, concepts and sources. New York: united Nations
UNESCO, (2003). Education in a Multilingual World: Education Position Paper. Paris.
[http://unesdoc.unesco.org/images/0012/001297/129728e.pdf], (accessed 15 October, 2013).
Uwezo, (2014). Are our Children Learning? Literacy and Numeracy in Kenya 2014. Nairobi: Twaweza
East Africa.
Wimmer, R. and Joseph, D (2006).Mass media research: An Introduction. Canada: Thompson
Wordsworth. 22.
Wei, L (2000).The bilingualism Reader. London: Roughtledge. ******
PSYCHOSOCIOECONOMIC CHALLENGES OF STUDENT MOTHERHOOD AND COPING
MECHANISMS: A MULTIPLE CASE STUDY OF TWO STUDENT MOTHERS IN KENYAN
UNIVERSITIES
Oundo, M.B. and Murithi, G.G.
Chuka University, Students’ Welfare Department, P. O. Box 109-60400, Chuka, Kenya
Email: [email protected] or [email protected] Tel: 0715 318 344, 0733 240 012
ABSTRACT
University Education requires resources in terms of finances, physical facilities, time, commitment, peer
educators and mentorship to ensure academic excellence and professionalism. Besides pursuit of
academic and career goals, undergraduate students tend to explore intimate relationships some of which

Proceedings of the Third International Research Conference held on 26th to 28th October, 2016 230
result into student motherhood. However, balancing motherhood obligations and University Education
demands can be a daunting task especially for undergraduate student mothers who have loaded academic
programmes. This paper examined the psychosocioeconomic challenges of student motherhood and
coping mechanisms. The research employed a multiple case study design. Detailed case information was
obtained from two student mothers in Kenyan Universities. The participants were purposively identified
from University Counselling Offices’ client booking dairies. Self-administered interview and observation
forms were used to collect data. The findings indicated that student mothers were ill prepared for
demands of motherhood, experienced burnout from the burden of childcare, lacked adequate support from
husbands and family members, felt socially neglected by friends, were left out during academic tours,
spent much money on hospital bills and had to pay more rent for lack of relevant hostels. To cope with
these challenges, student mothers skipped lectures owing to childcare responsibilities, preplanned
activities to ensure mandatory tasks were carried out, relied on friends and well-wishers for childcare in
order to attend tests and examinations, deferred studies, lived on tight budgets, sought financial support
from “sponsors”, solicited funds from friends and family members, redefined social boundaries and
secured counselling services. Stakeholders disseminate pertinent information regarding student
motherhood to all University students, hostel owners to provide services as well as facilities that are
sensitive to student mothers and University Student Welfare Departments to initiate student mothers’
social support groups.
Keywords: Student motherhood, Resources, University Education
INTRODUCTION
Affirmative action has facilitated increased enrollment of female students at institutions of higher learning
in Kenya. Apart from academic and career pursuits, undergraduate students seek social relationships that
may lead to marriage and probable student motherhood. However, most undergraduate student mothers
face an overwhelming task of balancing motherhood obligations and University Education academic
demands (Forster and Offei-Ansah, 2012). Owing to emanating challenges, there is a possibility of
undergraduate student mothers not maximizing academic as well as career potentials compared to male
students and female colleagues without motherhood obligations. This is because student mothers tend to
have less time to focus on academic work and to seek apprenticeship opportunities to grow their
professional career prowess. Manieson and Mawusi (2015) assert that students’ academic excellence can
be acquired when the students are free from additional roles and only focus on academic work.
A study by Kumar and Bhukar (2013) comparing stress levels and coping strategies of college students
suggests that female students experience more stress than male students. In this regard, student mothers
may experience additional stress due to extended responsibilities. In addition, student mothers face
financial constraints and blame this on childbearing (Manieson and Mawusi, 2015). A research study on
financial behaviour and problems among University students alluded students’ financial constraints on
spending for pleasure, unmanageable debts and financial skills deficits (Jariah, Husniyah, Laily, and
Britt, 2004). Alsop, Gonzalez-Arnal and Kilkey (2008) cited child care role, interrupted sleep and
inadequate time to be the most challenging aspects of student motherhood. Lynch (2008) found out that
student mothers lacked affordable childcare, had access to limited financial support and tended to switch
to part time study mode after child birth.
Forster and Offei-Ansah (2012) indicated that students with family obligations coped by working to raise
money to meet basic needs and giving priority to family chores at the expense of academic achievement.
Regarding financial challenges, University students needed financial knowledge and skills in areas such
as budgeting, savings, investments, wise spending, credit management, insurance protection and how to
increase personal income (Jariah et al., 2004). Manieson and Mawusi (2015) purport that married women
in tertiary institutions engaged in group discussions to catch up with missed lectures and asked husbands
or relatives to step in and take care of domestic chores in order for them to make time for academic work.
It is important to understand the challenges faced by undergraduate student mothers in Kenyan
Universities and strategies employed in coping. This understanding is meant to form a foundation upon
which stakeholders and well wishers can build intervention strategies to enhance learning environments

Proceedings of the Third International Research Conference held on 26th to 28th October, 2016 231
for undergraduate student mothers towards academic excellence and timely completion of the graduate
studies. To fill this gap, this study investigated the psycchosocioeconomic challenges and coping
mechanisms of student mothers in Kenyan universities.
Objectives of the Study
1. To determine psychosocioeconomic challenges of student motherhood.
2. To determine the coping mechanisms used by student mothers.
METHODOLOGY
This study adapted a multiple case study design in which several cases are studied at the same time as part
of a single study (Fraenkel, Wallen and Hyun, 2012). This allows for in depth study of pertinent issues
that affect a particular group of individuals. Two cases of student mothers were purposively selected from
University Counselling Offices’ client booking dairies. The participants were informed about the purpose
of the research and consent to participate and cooperate in the study obtained. Self administered interview
guides and observation check lists were used as data collection instruments. The participants’ places of
residence at the Universities were visited to enhance data collection via the observation forms. To
minimize researcher’s bias and maximize credibility during data collection and report writing, the data
were collected using two formats that is, through interviews and observation check lists, for triangulation
purposes. The two researchers also worked as a team and cross checked their observations for
discrepancies. Objective report writing was enhanced through conducting several visits and interview
sessions to ensure consistency over time regarding reported and observed data. Member checking which
constitutes asking the participants to review the accuracy of the research report was also done. In addition,
the researchers were sensitive about personal attitudes and expectations about the study objectives and
made effort to remain objective during data collection, interpretation and report writing.
RESULTS AND DISCUSSION
The findings were organized according to the cases, case background information and the objectives of
the study. Confidentiality was maintained by concealing the identifying information of the participants
and the Universities involved. Case A and Case B were used in place of the participants’ names. Prose
narration intercepted with participants’ quotations was adapted for report writing.
Case A
The following findings relate to the first undergraduate student mother who participated in the study.
Background Information
Case A was 23 years old and in her second year of study pursuing a Bachelors Degree of Education
(Arts). The student mother lived with a four months old baby in a self contained bedsitter meant to
accommodate two students. This residential arrangement required payment of rent equivalent to that paid
by two students sharing the room. The father of the baby who was a fourth year student pursuing a
Bachelor of Commerce Degree in a different University denied responsibility. Case A is the first born
among three children raised by a single mother whose job involved running errands and other casual tasks
in a learning institution.
Psychosocioeconomic Challenges
The respondent was asked to cite expectations that were disappointed with respect to motherhood. This
question was designed to measure the participant’s preparedness for the responsibility of caring for the
baby while pursuing academic work. Case A revealed that she expected the father of the baby to accept
responsibility and support in child rearing. “When I told him about the pregnancy, he said that he cannot
accept responsibility because he was in a stable relationship leading to marriage with another lady. Due
to lack of support at the University, I had to defer my studies to give birth to my baby while at home.”
Probed on how she intended to raise the baby as a single parent, the participant thought that her mother
would be persuaded to help in the child rearing role. “My mother took care of my first born boy whom I
delivered while in form three because she did not want my studies to be interrupted. This way I was able

Proceedings of the Third International Research Conference held on 26th to 28th October, 2016 232
to complete my secondary school education and obtained university entry points in the Kenya Certificate
of Secondary Education examinations. So, based on how my mother had encouraged and supported me
during the last trimester of my second pregnancy, I thought she would take care of my second baby as
well. However, my mother was not in a position to stay with my baby girl at home because of her busy
schedules and inability to afford baby care services. Now I just have to do with what is at my disposal.”
In response to an item on challenges of student motherhood, Case A mentioned non availability of child
care services around the University and lack of support from friends and neighbours. “There are no child
care services in this area which makes it difficult for me to attend lectures since there is no one to leave
the baby with. My friends do not visit like they did before I got the baby. I must call them to bring me
notes and updates about CATS and assignments. Neighbours are also too busy to hold the baby for me to
attend to tests and examinations.”
Inadequate financial endowment featured as a core challenge that lead to poor nutrition, unmanageable
debts, disputes, begging and emotional distress. “Lack of enough money for the baby’s demands causes
me to skip meals and do without other basics such as detergent and gas for cooking. Desperate situations
force me to borrow without the intention of paying back which results into disputes and emotional
distress. In some circumstances I beg from neighbours, friends and significant others.” These results are
in line with the findings of Manieson and Mawusi (2015) who suggested that student mothers blame
financial constraints on childbearing. The results support findings by Jariah, Husniyah, Laily and Britt
(2004) alluding students’ financial constraints on unmanageable debts and financial skills deficits.
The participant also noted that the baby girl was difficult to sooth, a situation that demanded a lot of the
much needed time and sleep. “My baby cries most of the time particularly at night. She disturbs even
neighbours who show concern over the frequency of the cries. Sometimes it is distressing when am not
able to comfort her. Many times I feel sleepy and fatigued.” Case A recounted a moment when she could
not join friends on an academic trip because children were not allowed on the University bus for such
occasions. She had to remain behind even though she would have loved to go. “I felt disappointed when I
was ready to join my colleagues for an academic trip but the facilitator informed me that babies were not
allowed on such trips. I could not choose the trip over my baby. So I had to stay behind with the baby.”
This is in agreement with the findings of Forster and Offei-Ansah (2012) suggesting that student mothers
gave priority to family chores at the expense of academic achievement.
The observation checklist revealed that Case A hardly had foodstuff in the house beside maize floor and
she was always alone in the room with her baby girl who frequently cried during the researchers’ visits.
On the study table, there were notebooks that belonged to course mates meaning that Case A missed out
on lectures and therefore had to write lecture notes from friends’ notebooks. This finding is reflected by
Manieson and Mawusi (2015) who suggested that student mothers discussed academic work with friends
to catch up on missed lectures. There was also occasional medicine on the table reflecting a visit to the
hospital or the chemist due to ill health. Generally, the room was clean and well organized. It was also
noted that in one occasion, Case A asked for assistance in terms of food and fuel from a researcher. This
was an indication that the participant borrowed or begged for help during hard times.
Coping Mechanisms
Case A was required to indicate how she coped with the challenges of student motherhood. She
mentioned that helplessness caused her to seek counselling services from the Students’ Welfare
Department in the University. The counselling sessions helped her to balance between academic work and
the motherhood roles. Some financial assistance was also granted from the kitty for needy students while
the mother was contacted and persuaded to improve on the economic support towards her daughter. Since
Case A felt rejected by friends, counselling helped her put the situation into the right perspective. “I had
to set new social boundaries and tone down my expectations from friends.” This confirms what Manieson
and Mawusi (2015) noted that student mothers set social boundaries that limit the time spent with friends
in favour of childcare roles. Case A narrated of once leaving her baby in the room asleep in order to take a

Proceedings of the Third International Research Conference held on 26th to 28th October, 2016 233
test since she lacked someone who could stay with the baby at that time. However, she ensured that the
door was not locked in case of any eventuality.
Most of the time Case A stayed with the baby thus missing out on many lectures as a way of balancing
academics and motherhood roles. To catch up with lost lecture hours, the participant regularly wrote
lecture notes from friends and read them whenever she had an opportunity. When the friends came to pick
up the notebooks, Case A could consult on complex concepts as well as schedules for tests and
assignments. “Being updated was important because this helped me to plan ahead and set priorities
right.” In addition, wishful thinking and faith in God helped the participant to deal with guilt, regrets and
negative thoughts. “When I feel guilt for not providing enough for my daughter and stretching my
mother’s budget, I just hope that one day life will improve. I imagine of a time when I will have a job and
will not have to borrow or beg for survival. Faith in God’s love and goodness helps me to overcome
regrets and negative thoughts such as wishing I was never born or thinking of giving up my baby to a
children’s’ home ”
Case B
These findings represent information from the second undergraduate student mother study participant.
Background Information
Case B was 20 years old and in her first year of study taking Computer Science. The student mother lived
with two and a half months old twins and a caretaker. The participant lived in a one bed roomed self
contained house. She is an orphan who was brought up in a rural setup by grandparents. She was the only
child to her parents who passed away while she was still in primary school.
Psychosocioeconomic Challenges
Case B was required to indicate any expectations she had about motherhood that were not met. She cited
inadequate financial support from her husband and relatives. “I expected that my husband who is a farmer
would support me and the twins fully. Contrary, my husband and his relatives wanted me to stay at home
and bring up the twins.” The birth of twins also came as a surprise to the participant and posed a
challenge of bringing up two babies and studying simultaneously. “Twins are difficult to raise especially
when one is least prepared for the task. For example, one of the twins cries a lot causing the other twin to
wake up and begin crying as well particularly at night. We have spent many sleepless nights due to
interruptions from the twins and sometimes we take turns to sleep.” Similar to these findings, Alsop,
Gonzalez-Arnal and Kilkey (2008) cited child care role, interrupted sleep and inadequate time to be the
most challenging aspects of student motherhood. The participant also expressed disappointment about a
low turn up for a fundraise function she had organized to help solicit money towards her University fees
and other expenses. This was attributed to her pregnancy as at that time. “Students joining University in
my home area do organize fundraising functions for University fees. Most people I had invited to my
function failed to turn up because I was expectant. The few who came made meager contributions.
However, the amount so raised helped me to settle down and commence my studies.”
In relation to challenges of student motherhood, Case B cited limited time for academic work. “I am not
able to concentrate on my studies at home unless the twins are asleep. I worry a lot especially when the
twins are sick, and in need of constant observation. This occurs at the expense of my academic work.”
These results agree with prier findings that most undergraduate student mothers face an overwhelming
task of balancing motherhood obligations and University Education academic demands (Forster and
Offei-Ansah, 2012). The participant mentioned frequent visits to the dispensary and hospital admissions
for the twins as consuming a lot of her money. “I have spent a lot of money in terms of hospital bills since
the twins are sickly. On average, we visit the hospital once or twice a week.” Feeding the twins was
another challenge especially when the student mother could not produce enough milk for both babies.
“Sometimes am not able to exclusively breastfeed the twins. Supplementing breast milk with commercially
made milk means spending money that is not readily available.” There was also concern about
overdependence on the grandparents for University fees and other expenses. “My grandparents have

Proceedings of the Third International Research Conference held on 26th to 28th October, 2016 234
struggled to bring me up and I wouldn’t want to stretch their budget further. Being able to fund my
education and other expenses gives me a sense of independence and respect for my grandparents.”
Information obtained by use of observation checklist confirmed data collected through the interviews. It
was observed that Case B had enough food in the house and seemed to have friends paying her visits. She
lived in a one bed roomed self contained house which espoused some level of privacy. The twins were
generally calm but when one cried the other would join in making it difficult to quiet them. The student
mother seemed preoccupied with the babies and giving instructions to the caretaker expressing more
concern for the wellbeing of the twins. It was also observed that the house was clean and tidy.
Coping Mechanisms
Case B employed a caretaker to assist in the baby care obligations because it would have been
overwhelming for her to care for the twins singlehandedly. “The caretaker is of great help to me because
am able to attend lectures, complete the assignments and take tests comfortably.” The participant tried not
to think about the situation at her husband’s home as a way of relieving distress. “My husband never
made it to the University and feared that furthering my education would cause an imbalance in our
relationship. This was the reason why they wanted me to stay at home and take care of the twins like
‘good’ women did; a position that I opposed. It bothers me when I think about it mainly because of the
connection between us through the twins. I hate to think that one day we shall live together again given
the harsh treatment and contempt for my University education.” This was the reason for the participant
seeking counselling services at the University offices. To finance her education and take care of the twins,
Case B relied on a wealthy businessman who had shown concern during her fundraising function. “A
businessman from home promised to assist in paying my University fees but with time he started taking
care of the upkeep as well. I feel it is better to remain in this relationship instead of giving up my studies
or burdening my grandparents with financial demands. After all, other students are doing the same to
survive.” Conquering with this findings, Forster and Offei-Ansah (2012) purported that students with
family obligations faced financial difficulties and coped by working to raise money to meet basic needs.
Case B consults with grandparents through the mobile telephone whenever the twins are sick to mitigate
the anxiety. “When the twins are sick, I become afraid but talking to my grandparents helps me to cope
because they tell me what to do.”
RECOMMENDATIONS
The following recommendations were made based on the findings of the study:
1. Stakeholders need to disseminate pertinent information regarding student motherhood to all
University students. This will help potential student mothers to prepare and adjust accordingly. The
female students will also be empowered to make rational choices about motherhood.
2. Hostel owners may consider providing services as well as facilities that are sensitive to student
mothers’ needs. Affordable spacious rooms with appropriate furniture to accommodate the student
mother, the child and the child’s caretaker are necessary. Baby care services may also be availed for
student mothers who cannot afford fulltime caretakers. This will allow such student mothers to attend
lecturers and sit for examinations without compromising the child’s safety.
3. The University Students’ Welfare Departments need to initiate and facilitate student mothers’ social
support groups. These will serve as avenues to ventilate emotional distress and learn through sharing
of experiences among the student mothers.
4. Insurance companies need to encourage student mothers to take medical policies to alleviate
unexpected and hefty inpatient and outpatient medical expenses especially among children.
REFERENCES
Alsop, R.; Gonzalez-Arnal, S. and Kilkey, M. (2008). The Widening Participation Agenda: The Marginal
Place of Care. Gender and Education. 20(6): 623–637.
Bhukar, J. P. and Kumar, S. (2013). Stress Level and Coping Strategies of College Students. Journal of
Physical Education and Sports Management. 4(1): 5-11.

Proceedings of the Third International Research Conference held on 26th to 28th October, 2016 235
Forster, P. and Offei-Ansah, C. (2012). Family Roles and Coping Strategies of Female Students in
Ghanaian Public Universities. International Journal of Academic Research in Business and Social
Sciences. 2(5): 191-205
Fraenkel, J. R.; Wallen, N. E. and Hyun, H. H. (2012). How to Design and Evaluate Research in
Education. Eighth Edition. New York: McGraw Hill.
Jariah, M.; Husniyah, A. R.; Laily, P. and Britt, S. (2004). Financial Behaviour and Problems Among
University Students: Need for Financial Education. Journal of Personal Finance. 3(1): 81-96.
Lynch, K. D. (2008). Gender Roles and the American Academe: A Case Study of Graduate Student
Mothers’, Gender and Education. 20(6): 585-605.
Manieson, P.A. and Mawusi, E. 2015. Issues and Challenges Confronting Married Women in Tertiary
Institutions. International Journal of Education, Learning and Development. 3(9): 19-27 ******
LINKING INCLUSIVE EDUCATION WITH SUSTAINABLE DEVELOPMENT GOALS AND
TRANSFORMATION OF LIVES: A CASE OF KAKAMEGA COUNTY KENYA
Nanyama, E.M., Bota, K.N. and Aurah. C.
Masinde Muliro University of Science and Technology, Kenya
Correspondence: [email protected]
ABSTRACT
Education is one of the roadmap to ensure implementation of SDGs and the Kenyan Vision 2030. Goal 4
of SDGs ensures inclusive and equitable quality of education, and promote lifelong learning opportunities
for all. In respect to the goal the education system in Kenya has undergone considerable changes since the
introduction of Universal Free Primary Education in 2003 and free secondary education in 2008 as a way
of implementing inclusive education. The Ministry of Education also has a special needs education policy
that is intended to improve the quality and access to education for children with special needs. Despite
this Kenyan government commitment to inclusive education in its quest to provide basic education to all
school going age children, the access and retention rates of learners said to have special educational needs
in schools is still very low compared to other African countries. It was due to this trend that the researcher
was set to establish teachers’ attitude regarding inclusive education in public inclusive primary schools in
Kakamega County. The research employed a descriptive survey research design using interview guides to
get data from 22 class teachers in public inclusive primary schools. Findings indicated that many teachers
lack a repertoire of learning and teaching strategies appropriate for addressing barriers to learning and
providing individualized approaches in the classrooms. Some teachers were positive about teaching
children said to have SEN but lacked the infrastructure of support and guidance and some expressed that
the concept of inclusive education is not to be enabling. The study recommends all primary school
teachers to have more training in the area of special education to help them develop strategies which are
responsive to the identified learning difficulties of learners with disabilities.
Keywords: Disabilities, development, Inclusive education, Transformation of life
INTRODUCTION
Inclusion in the context of education is the practice, in which students with special educational needs
spend most or all of their time with non-disabled students. UNESCO (2001) developed a policy of
inclusion for the disabled into the system of education by stating the following: Inclusive education starts
from the belief that the right to education is a basic human right and the foundation for a more just
society. Inclusive education takes the Education for All (EFA) agenda forward by finding ways of
enabling schools to serve all children in their communities as part of an inclusive education system.
Inclusive education is concerned with all learners, with a focus on those who have traditionally been
excluded from educational opportunities such as learners with special needs and disabilities, children
from ethnic and linguistic minorities. Inclusion is about the child’s right to participate and the school’s
duty to accept the child and to reject the use of special schools or classrooms to separate students with
disabilities from students without disabilities. A premium is placed upon full participation by students
with disabilities and upon respect for their social, civil, and educational rights. Inclusive schools no longer

Proceedings of the Third International Research Conference held on 26th to 28th October, 2016 236
distinguish between "general education" and "special education" programs; instead, the school is
restructured so that all students learn together (UNESCO, 2006). All students can learn and benefit from
education and schools should adapt to the needs of students, rather than students adapting to the needs of
the school. Individual differences between students are a source of richness and diversity and not a
problem. The diversity of needs and pace of development of students are addressed through wide and
flexible responses so long as those responses do not include removing a student with a disability from a
general education classroom. (Wanzare, 2002).
In Kenya, paradigm shift to inclusive education was initiated through a number of key documents
including: sessional papers, circulars, reports and different task forces working towards specific aspects in
education. The first document was universal free primary education by the ruling party by then KANU
Manifesto (1963), followed by the Education Act (1968) – Cap 211 (revised in 1980) which stated that
nobody would be refused admission or excluded from school on the any grounds (MoE, 2009, p.15). That
was the first time inclusive education policy was mentioned in Kenyan schools. More reports and
commissions were included in education but this study will only mention those related to inclusive
education. Among them were; the Kenya Education Commission commonly known as Ominde-
Commission (Republic of Kenya, 1964).The Commission resulted in Sessional Paper No. 5 of 1965
which expressed education as an economic venture rather than a social service creating equal economic
opportunities for all citizens (Republic of Kenya, 1965b). However, this was considered as segregating
those who may be unable to work due to disabilities. Then another committees++, the Committee on Care
and Rehabilitation of the Disabled, Ngala Mwendwa (1964) was formed. The Ngala Mwenda committee
resulted in the formulation of Sessional Paper No.5 of 1968 whose recommendations were implemented
in the early 1980s’ when the government started to pay increased attention in the field of SNE. The first
draft of SNE policy was recommended. Later the National Committee on Educational Objectives and
Policies (NCEOP), the Gachathi Report (1976), focused on co-ordination of early intervention and
assessment of children said to have SEN, creation of public awareness on causes of disabilities in order to
promote prevention measures and research on the nature and extent of ‘handicaps’ for provision for these
children. This is still an issue to date. That is why the research seeks to establish effectiveness in
implementing inclusive education policy on learners’ academic achievements.
Later, a number of commissions of inquiry into the Education System in Kenya, such as Koech
Commission Report recommendations were accepted. The Koech Commission led to the setting up of the
Kochung Report (2003). The Kochung Report (2003) was set to examine the challenges individuals with
SEN face. This report led to the launching of the SNE draft policy and eventual launch of the SNE policy
in 2009.The recommendations provided by the Gachathi Report in 1976 set good grounds and pace for
SNE where parents and other people would understand the issue of disability; this still stands as an issue
to be dealt with to date. This research established teachers’ perception of inclusive education policy.
The Kenya Special Needs Education (SNE) Policy Framework has 15 objectives (MoE, 2009). The SNE
policy objectives that are in line with this study are; inclusive education and Capacity building and
development. The inclusive education objective aims at increasing enrolment and promoting values which
enhance access to education and retention of learners with special needs and disabilities in all learning
institutions. The capacity building and development objective is to facilitate provision of effective and
efficient professional and support services to learners with special needs and disabilities in institutions of
learning or training (Kenya SNE Policy, MoE, 2009 p10). The stakeholders in this inclusive policy are
given as the Minister and Permanent Secretary Ministry of Education Science and Technology (MoEST)
representatives from; Non-Governmental Organizations’, faith and community-based organizations’,
private sector service providers, members of parliament and union representatives (Kenya SNE Policy,
MoE, 2009 p.10 and KESSP, 2005). Kenya Institute of Special Education officials, head teachers and
teachers and parents are not mentioned. That is why the researcher is interested in teachers’ perceptions of
inclusive education policy. Teachers are major translators of inclusive policy into practice in schools.
The Government is committed to provision of inclusive education to all children. It emphasizes inclusive
education with particular focus to marginalized groups, especially children with special needs and

Proceedings of the Third International Research Conference held on 26th to 28th October, 2016 237
disabilities. For instance, the Kenyan government has put policies and provisions in place to guide
through the implementation of inclusive education. However, the extent to which whether this program of
inclusivity has borne results, is still a bone of contention. The teacher training has been identified as one
of the key factors in the Promotion of inclusive education (Mwangi, 2013).
The MoE reports indicates that teachers have been trained to adequately assist learners with SEN. The
training has either been through pre-service or in-service training where teachers achieve degrees,
diplomas and certificates qualifications in either general education or both general and special education
from various learning institutions such as Kenyatta, Nairobi, Moi, Maseno and Methodist universities
(MoE, 2008). Further, Kenya Institute of Special Education (KISE) offers training in special education to
practicing teachers (Wango, 2011). However, the access and retention rates of learners with SEN in
public inclusive primary schools is still very low compared to other African countries. The situation is
alarming in Kakamega County where some learners with SEN cannot access and participate in free
inclusive primary education. Through the researcher’s own experience as a primary school teacher in
Kakamega County, it is observed that many learners with SEN drop out of school or experience learned
helplessness in schools annually.
Reports indicate that despite the Free Primary Education (FPE) to enhance inclusive education, there is an
increase in primary school dropout rates (MoEST, 2012). The MoEST (2015) report also indicates that
the enrolment of disabled learners at lower classes is usually 1.5 % that of the entire school enrolment.
However, more than ½ % of the disabled learners do not sit for Kenya Certificate of Primary Education
(KCPE) or if they sit KCPE their scores are always below average. Records at the Kakamega County
Assessment and Resource Centre (EARC) show that a very small number of learners with disabilities
have been assessed and placed in inclusive primary schools yet they are never retained in schools to
complete the primary education cycle. The purpose of this study was to assess the perception of teachers
regarding inclusive education on learners’ academic achievements in public inclusive primary schools in
Kakamega County, Kenya.
METHODOLOGY
The study will employed a descriptive survey research design. Data was collected by interviewing
respondents to get information about people’s attitudes, opinions, and habits concerning inclusive
education. Descriptive survey design is an efficient method for collecting data regarding characteristics of
the population and current practices, conditions and needs. It is used to explain or explore existing status
of two or more variables at a given point in time (Mugenda and Mugenda, 2003). It was on this basis that
the design was adopted to examine the effectiveness in implementing inclusive education policy on
learners’ academic achievement in Kakamega County, Kenya. Guided by survey design, the study
gathered facts, knowledge, opinions and judgment from teachers, deputy head teachers, pupils and
education officer, on how they view and implement inclusive education in regard to learners’ academic
achievement in Public primary schools. The study was conducted in primary schools of Kakamega
County. The County is made up of 12 sub-Counties namely Mumias, Matungu, Kakamega Central,
Navakholo, Khwisero, Butere, Kakamega North, Kakamega South, Kakamega East, Likuyani, Lugari and
Matete. The region is located between 1’ 15’ North and 0’3’ West longitude and to the East 35’12’ East
longitude (ROK, 2003). The total area of the County is about 3,244.9 SQ KM2 (ROK, 2003). This area is
about 1.4% of the total area of Kenya. The county has a population of 1,660,651 people as per the 2009
population census (ROK, 2010). This presents 11.23%, of the total Kenyan population. The average
population density is 515 persons per km2. The population growth has fluctuated between 3.4 in 1969 and
0.3 in 2014 (Rok, 2015). Unfortunately 57% of the population live below the poverty line. The study
employed questionnaires, focus group discussion, interview schedule and document analysis guide to
collect data. Focused group discussion collected information from learners said to have special needs in
inclusive public primary schools. This instrument consisted of closed and open items. The FGD had seven
pupils from class seven who were involved in the discussion collectively. The discussion was guided
among participating members with the researcher who acted as a facilitator. The teacher’s interview
comprised of researcher made 10 items cutting across the study objectives

Proceedings of the Third International Research Conference held on 26th to 28th October, 2016 238
RESULTS AND DISCUSSION
Some teachers revealed that with adequate resources and facilities, learners with disabilities are very
talented and some of them perform extremely well even with the limited resources.Inclusive education
therefore creates a competitive environment favorable for learning to take place, it enables learners to
appreciate each other’s shortcomings as well as talents and they use that opportunity to learn from each
other. This confers to co-operative teaching and learning which has been found to be effective in
improving the time students spend on learning tasks, minimizes classroom behaviour problems, and
improves academic and reading performance and learning rate (Meijer, 2004).
Findings indicated that many of them lack a repertoire of learning and teaching strategies appropriate for
addressing barriers to learning and providing individualized approaches in the classrooms. Some teachers
were positive about teaching children said to have SEN but lacked the infrastructure of support and
guidance and some expressed that the concept of inclusive education is not enabling. The finding concur
with Ferguson (2008) who asserted that attitudes are closely linked to teachers’ strategies for coping with
challenges in their daily professional lives. Research from different countries show how several factors
contribute to the effectiveness of special education in inclusive settings. Some of these factors range from
the nature of the disability (Hodkinson, 2009; Corbett, 2001; Moses, 2000, Scruggs and Mastropieri,
1996), children’s behaviour (OFSTED (UK), 2004) and extreme behavioural difficulties (MacBeath and
Galton, 2007). Avramidis and Norwich (2002) highlight that teacher’s favour the inclusion of children
with mild physical and sensory impairments rather than those with learning difficulties, severe disabilities
and autistic spectrum disorder.
From interviews most of the teachers again seemed against inclusive education not because they don’t
want disabled children to get education, but because of the nature of work involved. According to them,
inclusive environment require adequate resources in terms of playing materials, teaching and learning
materials and even classrooms that are designed to accommodate leaners with disabilities. Some teachers
made an opinion that their workload be reduced for them to be effectively engaged with learners with
disabilities. This was earlier observed that the effectiveness in implementing inclusive education may be
at risk if regular classroom teachers hold negative perceptions toward the inclusion of students with
disabilities (Van Reusen et al., 2001). Negative perceptions of inclusive education may become obstacles,
as general education teachers attempt to include students with disabilitie (Baker- Kroczynski, 2002). This
study also agrees to the one done by KENPRO (2010), apart from teachers’ negative beliefs about
inclusion and concern for their professional competency to practice inclusive education, the issue of
resources affected the both teachers those trained in special education and those with regular training.
Resource issues included the physical such as inaccessible classrooms to learners in a wheel chair,
overcrowded classrooms; materials such as Braille and large prints and toilet facilities.
The study also revealed that few learners discriminate their colleagues who are disabled. This situation is
noted through playing, sitting positions in class, leaving and in any company as well as in group work
discussion. However, with some teachers being observant and educative, they address the issue through
guidance and counselling sessions. From literature reviewed it was established that teachers are perceived
to be integral to the implementation of inclusive education (Haskell, 2000). Research communicates the
view that teachers are the key to the success of inclusionary programs (Cant, 1994), as they are viewed as
linchpins in the process of including students with disabilities into regular classes (Stewart, 1983; Whiting
and Young, 1995). Other studies acknowledge that inclusive education can only be successful if teachers
are part of the team driving this process (Long, 2001). The deputy head teachers gave their responses by
responding to 7 items related to this study. Their finding are as follows (Table 1).
From the table it is clearly indicated that the respondents advocate for inclusive education since it
promotes socialization among learners. The finding was also confirmed earlier that activity learning,
different seating arrangements and mixed ability groups, group work based on interests, friendships, trust,
strengths and support (Florian and Linklater, 2010). The respondents also concurred with teachers who
echoed that inclusive education policy has increased enrolement in the school however the learners with
disabilities never complete the primary education cycle.

Proceedings of the Third International Research Conference held on 26th to 28th October, 2016 239
Table 1: Responses by the deputy head teachers
STATEMENT SA A U D SD
Inclusive educaion promotes socialization among learners 6 2 0 0 0
Inclusive education policy has increased enrolement in the school 8 0 0 0 0
Techers of learners with special needs should have secial training 8 0 0 0 0
Learners with special needs transit from lower primary through class
eight
0 1 0 6 1
Learners said to have special needs improve in their academic
ahievements
0 2 0 2 4
Teachers in inclusive schools support children said to have special
needs in classes to meet their learning needs
2 3 0 3 0
Learners said to have special needs should have their own special
schools an teachers
0 0 0 4 4
CONCLUSION
Inclusive education promotes equality among learners. Learners in inclusive environment appreciate each
other’s ability. Furthermore, inclusive environment promotes socialization, one’s self esteem, confidence
and sense of belonging particularly to learners with disability. However, for inclusive education to be
effective and attain SDG, there is need for the government to ensure that human resources and facilities
necessary for the program are adequate to support inclusive education
RECOMMENDATIONS
Following the above findings the study makes the following recommendations:
(i) The study recommends all primary school teachers to have more training in the area of special
education to help them develop strategies which are responsive to the identified learning difficulties
of learners with disabilities.
(ii) There is need for the government, school management and other stakeholders to invent ways in which
they can provide resources to cater for the inclusive practices.
(iii) Teachers being main implementers of effective inclusive education, there is need for the government
include special education training in teachers training colleges and facilitate teachers to go for in-
service trainings to improve their skills, and increase their knowledge of inclusivity. Furthermore, it
will boost teachers’ morale, teaching strategies in providing quality services. In-Service training is
also important to enable teachers to adapt to the dynamic disabilities among learners.
REFERENCES
Agbenyega, J. (2006). Examining Teachers’ Concerns and Attitudes to Inclusive Education in Ghana.
Avramidis, E. and Norwich, B. (2002) 'Teachers' attitude towards integration/inclusion: a review of the
literature', European Journal of Special Needs Education 17(2):129-147
Bowe, F. (2005). Making Inclusion Work. Merrill Education/Prentice Hall.
Florian, L. and Linklater, H, (2010): ‘Preparing teachers for inclusive education: using inclusive
education: using inclusive pedagogy to enhance teaching and learning for all’, Cambridge Journal
of Education, 40(4):369-386.
Florian, L. and Rouse, M. (2009). 'The inclusive practice project in Scotland: Teacher education for
inclusive education' Teaching and Teacher Education 25:594-601
Hastings. R.P. and Oakford, S. (2003). Student teachers' attitudes toward the inclusion of with special
needs. Educational Psychology, 23:87-95
Kavale, K.A. (2002). Mainstreaming to full inclusion: From orthogenesis to pathogenesis of an idea.
International Journal of Disability, Development, and Education, 49:201-214.
KENPRO (2010). Challenges Facing Inclusive Education in Regular Primary Schools in Kenya.
KENPRO. Online Papers Portal. Available online at www.kenpro.org/papers.
Praisner, C. L. (2003). Attitudes of elementary school principals toward the inclusion of students with
disabilities. Exceptional Children, 69:135-145.
United Nations (2000). The United Nations Millennium Develop Goals [Online] Available at
www.undp.org/evaluation/documents/thematic/rbm/rbm_evaluation.pdf (Accessed 9.9.2010)

Proceedings of the Third International Research Conference held on 26th to 28th October, 2016 240
United Nations Children's Fund (UNICEF, 2006) 'Extent and effect of sex tourism and sexual exploitation
of children on the Kenyan coast' [Online] Available at
www.ecpat.org.uk/sites/default/files/kenya05.pdf (Accessible on 10 January 20 11).
United Nations Development Programme (UNDP, 2006) 'Kenya National Human Development report'.
[Online]. See http://www.hdr.undp.org/en/reports/national/africa/kenya/name,3451,en.html
United Nations Educational, Scientific and Cultural Organisation (UNESCO) (1994) The Salamanca
statement and framework for action on special needs education. Paris: UNESCO [online]
available athttp://www.unesco.org/education/pdf/salama_e.pdf (Accessed on 17 May 2009)
United Nations Educational, Scientific and Cultural Organization (UNESCO, 2001): 'The Open file on
inclusive education', Paris, UNESCO [online] available at
http//www.ibe.unesco.org/fileadmin/user.../CONFINTED_48-3_English.pdf (Accessed 10.6.12)
United Nations Educational, Scientific and Cultural Organization (UNESCO, 1994): 'Final Report: World
conference on special needs educations: Access and quality': Paris: UNESCO [Online] Available:
http://www.unesdoc.unesco.org/images/0011/001107/110753eo.pdf (Accessed on 19 July 2009).
United Nations Educational, Scientific and Cultural Organization (UNESCO 2008): 'The EFA global
monitoring report: Education for all by 2015. Will we make it? Paris: UNESCO.[Online]
Available at unesdoc.unesco.org/images/0015/001547/154743e.pdf (Accessed on 20 July 2009)
United Nations Educational, Scientific, and Cultural Organisation (UNESCO, 2006) UN Conventions on
the rights of persons with disabilities.[Online] Available at
http://www.unesco.org/new/en/...and.../access-for-people-with disabilities (Accessed: 2.4.2011)
United Nations Environment, Scientific Cultural Organisation (UNESCO, 1994) 'The Salamanca
Statement and Framework for Action on Special Needs Education: World Conference on Special
Needs: Access and Quality', Salamanca, Spain 7-4 June 1994: UNESCO [Online] Available
Unterhalter, E. (2012) 'Inequality, capabilities and poverty in four African countries: girls' voice,
schooling, and strategies for institutional change'. Cambridge J. Education, 42(3):307-325.
Vaughn, S., and Linan-Thompson, S. (2003). What is special about special education for students with
learning disabilities? The Journal of Special Education, 37(3):140–147.
Wamae, I. M. G. and Kang'ethe-Kamau, W. R. (2004) 'The concept of inclusive education: teacher
training and acquisition of English language in the hearing impaired', British Journal of Special
Education, 31(1):33-39.
Wamocho, I.F. Karugu, K.G. and Nwoye, A. (2008) ‘Development of a guidance programme for students
with special educational needs in Kenya: a study on personal orientation’, British Journal of
Special Education, 35(4):222-229
World Bank (2003). Annual review of development effectiveness: The effectiveness of bank support for
policy reform, Wa. DC http://Worldbank.org/wbsite/external/extdec (Accessed: 20.10.2011)
World Bank (2011). World Bank Group Education Strategy 2020 ‘Learning for all investing in pupils
knowledge and skills to promote development [Online] Available at
http://www.go.worldbank.org/DTQZ9EKJWO (Accessed on 10 March 2013). ******
IMPLEMENTATION STATUS OF KENYA’S LANGUAGE IN EDUCATION POLICY: A CASE
STUDY OF SELECTED PRIMARY SCHOOLS IN CHUKA DIVISION, MERU SOUTH
DISTRICT, KENYA
Mbaka, N.W.1*, Peter, C.A.2 and Karuri, M.N.3
Chuka University, P. O. Box 109-60400, Chuka, Kenya
*Corresponding author: [email protected], Phone No: 0727 227664
ABSTRACT
Language-in-education policies in many developing countries are constantly an issue of discussion in
scholarly circles. At various times in Kenya’s history commissions have been set to make
recommendations on the issue of the language in education policy. The use of mother tongue languages
has not been resolved even today thus the need for continuous research in this area. This paper looks at
the implementation of the language-in- education policy in lower primary in Chuka Division, Meru-South
District, Kenya. The paper evaluates the teachers’ awareness of the language policy and actual

Proceedings of the Third International Research Conference held on 26th to 28th October, 2016 241
implementation in the classroom. It also analyses the problems that teachers experience in implementing
the policy and gives the teacher’s recommendations in case the language policy were to be restructured.
The paper establishes that teachers are aware of the policy but they do not always implement it in the
classroom. The findings in this paper are of great benefit to all stakeholders in the ministry of education in
Kenya and contribute to scholarly literature in the field of language planning and policy.
Keywords: Policy Implementation, Language of Instruction, Mother Tongue, Language Planning,
Language Policy
INTRODUCTION
The important role that language plays in the acts of learning and teaching is recognized by education
systems all over the world. According to Oller (1979), being able to use a language or even a particular
variety of a language seems to be a prerequisite for anything that education attempts to accomplish and
without language there can be no curriculum. Teachers should be aware of non-verbal aspects of thinking
but most of the thinking in the classroom situation involves linguistic structures. Neustupny (1968) points
out that developing countries face unique language problems. Having inherited legacies of colonialism,
they wish to develop language policies which more accurately reflect the present-day political realities
behind the uses of English and the indigenous languages in their countries. One of the major issues which
a language planning approach may help to clarify is that of choice of language in multilingual societies, of
which languages should be used for instruction and when, and whether they should be taught as subjects
or used as ‘carriers’ for content subjects such as Science and History.
Kenya’s LiEP has been revised a number of times since 1895 when Kenya became a British Protectorate.
Mbaabu (1992) states that “Kenya has not put the whole language policy issue on the public agenda for a
broad policy formulation adoption and implementation,” (Mbaabu 1992:182). In what many scholars see
as a language dilemma (Gorman (1970), Mbaabu (1992), Bogonko (1992) and Muthwii (2002), Kenya
has adopted what appears to be a multi-focal approach which does not allow emphasis on any specific
language. English, Kiswahili and mother tongue (MT) are all used in education in varying degrees. The
current LiEP is based on the recommendations by the Gachathi Report (1976). The report recommends
that in lower primary English or Kiswahili should be used as Language of Instruction (LOI) in urban
schools and MT in rural schools. English is recommended as LOI in all schools in upper primary.
Although the LiEP in Kenya has been in force since 1976, there has not been any formally recognized
evaluation in order to investigate its relevance and applicability at the classroom level. This study sought
to investigate the implementation status of the LiEP in selected primary schools.
The study was guided by the following objectives:
1. To ascertain whether teachers were aware of the language-in-education policy
2. To investigate the extent to which what is recommended in the language-in- education policy is what
is implemented in the classroom.
3. To describe the problems that teachers experience in implementing the policy.
4. To find out teachers’ recommendations on restructuring of the language-in-education policy.
LITERATURE REVIEW
According to Rubin (1973) and Haugen (1983), the process of implementation involves activities of
government agencies, institutions and writers in adopting and using the selected and codified form.
Activities such as the production of newspapers, textbooks, books and other publications as well as the
use of the language for mass communication are part of the implementation process.
Since the colonial era, the language policy in Kenya has been characterized by dilemmas and
contradictions. Though the missionaries advocated for the use of MT in lower primary education as LOI,
they were divided on the role of Kiswahili. The Beecher Report (1949) finally restricted Kiswahili only to
areas where it is spoken as a first language. The NPA programme in the 1950’s which emphasized
discovery in activity methods of learning operated in favour of English to the disadvantage of Kiswahili
and other local languages. The trend has been the same after independence. The Ominde Commission
(1964) assigned MT no role and its recommendations on Kiswahili were not implemented. The

Proceedings of the Third International Research Conference held on 26th to 28th October, 2016 242
recommendations of the Gachathi report (1976) went unimplemented until 1984 when Kenya adopted the
8-4-4 education system (Mackay Report, 1981).
In a report compiled by Muthwii (2002), a team of researchers carried out a study which investigated the
views and perceptions of parents, teachers and pupils on the LiEP and usage issues. The study was
explanatory in nature and followed a case-Study approach. The sample comprised forty selected schools
from both rural and urban settings in Kenya and Uganda. Data was collected using interview schedules.
It was found out that although the policy statement in both countries may seem plausible in theory, in
practice it is inundated with many problems. In Kenya, there has been no serious attempt by the
government to sensitize teachers, parents and pupils as to the wisdom and benefits of the language policy
in education. As a result, many teachers did not follow the policy but acted according to the dictates of the
prevailing pressures exerted on them from parents and the examination system in the country. Some
parents and even pupils were found to be opposed to some of the well-intended clauses in the policy
statement such as the clause that recommends the use of MT in rural areas. The parents were of the
opinion that there is no need for their children to be instructed in MT because it does not help them to
grasp concepts fast in their schooling. Muthwii’s study (2002) helped to identify possible positions and
views on the language policy and highlighted related issues. Being exploratory in nature, the selected
sample of schools and respondents did not completely and accurately accommodate the divergent
perceptions and views on language policy and use in the whole of the region represented.
Mbaabu’s (1992) study aimed to analyze Kenya’s language policy as stipulated in government documents
and commission reports with a view to explaining why Kenya was not developing Kiswahili. It adopted a
historical approach and draws upon historical, descriptive, analytical and statistical data. Its findings were
that the official promotion of several languages results in the underdevelopment of Kiswahili. The major
strength of this study is that it has compiled in one volume the history of Kenya’s language policy since
1930. This had not been done before. However, its historical approach means it can be incorporated into
other studies in summarized form. The present study has greatly benefited from Mbaabu’s study.
One of the objectives of McNab’s Study (1989), was to analyze key points in the process of language
policy implementation in the education system in Ethiopia. The other objective was to develop a model of
education language planning and use it as a framework. The developed framework would then be used in
the study and revised on the basis of its appropriateness for such an analysis. This was a national case
study. The method of data collection was in depth semi-structured interviews with people working in key
areas in education. Questionnaires were also used for Teacher Training Institutes and for staff in a
pedagogical centre. The Study was carried out over a period of two years.
McNab developed a theoretical Model of Education Language Planning in a multilingual context. This
was done by combining two models; Haugen’s Revised Model (1983) and Warwick’s Transactional
Model of Planning and Implementation (as cited in McNab, 1989). This combination allowed for the
depiction of both cohesion and tension in a politically sensitive area of social planning. The model is a
valuable contribution to research. It is the model that will be used in the present study. It is also a good
resource material on how language policy implementation can be evaluated on a national scale. The major
dilemma in the education system in Kenya is whether rural schools should continue using MT while
many academies use English right from P1. The other dilemma is whether Kiswahili should replace MT
as LOI in lower primary (Fawcett, 1970). There is also need to find out whether teachers implement the
policy at the classroom level given the multilingual context they work in. The findings of this Study could
be useful in resolving these issues.
Theoretical Framework
This research was guided by the theoretical model of educational language planning in a multilingual
context developed by McNab (1989).
Assent/Dissent

Proceedings of the Third International Research Conference held on 26th to 28th October, 2016 243
IMPLEMENTATION
Figure 1: A Theoretical model of education language planning in a multilingual context: Source:
McNab (1989:189)
The model incorporates the planning environment in language planning. This environment is divided into
the sociopolitical context and the organizational context. The sociopolitical context is the interlocking
network of cultures and social groupings in the multilingual society and the formative historical
experience of the country. The types of language varieties in the community are an important factor here.
Kenya is made up of many heterogeneous communities and this situation must be taken care of in
language planning. The organizational context consists of arrangements for language planning and
education, and key factors in the education language planning process. The actors in this setting are the
decision makers, planners, administrators and experts in the fields of education and linguistics.
Language policy planning is influenced by both sociopolitical context and organizational context. The
sociopolitical context influences policy directly through the correlations between language and socio-
economic class, between language and political power and between language and decision making. In
general, socio-political complexity correlates with the complexity of the communication system which
individuals/pupils must acquire. Implementation is influenced directly by the socio-political and
organizational contexts. It is sub divided into two main parts, that is, corpus planning and educational
spread. Corpus planning refers to the development of languages designated by the government as media
of instruction or as school subjects. It includes the development of curriculum, materials and books. The
task of the educationists is to incorporate the new language norms into the classroom practice and into the
body of spoken discourse by means of teacher training. It should also be incorporated into the body of
written discourse by development of instructional materials.
Evaluation is sub-divided into evaluations which are purposively initiated by the organisation involved in
education language planning (formal evaluations) and informal judgments which are made by policy
makers, implementers and the target groups of language plans. The aim of this Study was to make a
formal evaluation of Kenya’s language-in-policy on teacher’s awareness of the language policy,
EVALUATI
ON Educational
spread:
- Text writing
- Teacher training
- Mass media
- Pedagogical
centres
Corpus planning:
- Orthography
- Lexicography
- Terminology
Informal
Formal
(educational)
- Textbooks
- Radio
- Classroom
teaching
Socio-political
context
Policy development
- Language policy history
- Identification of
problems
- Task allocation
Organizational
context
P
L
A
N
N
I
N
G
E
N
V
I
R
O
N
M
E
N
T
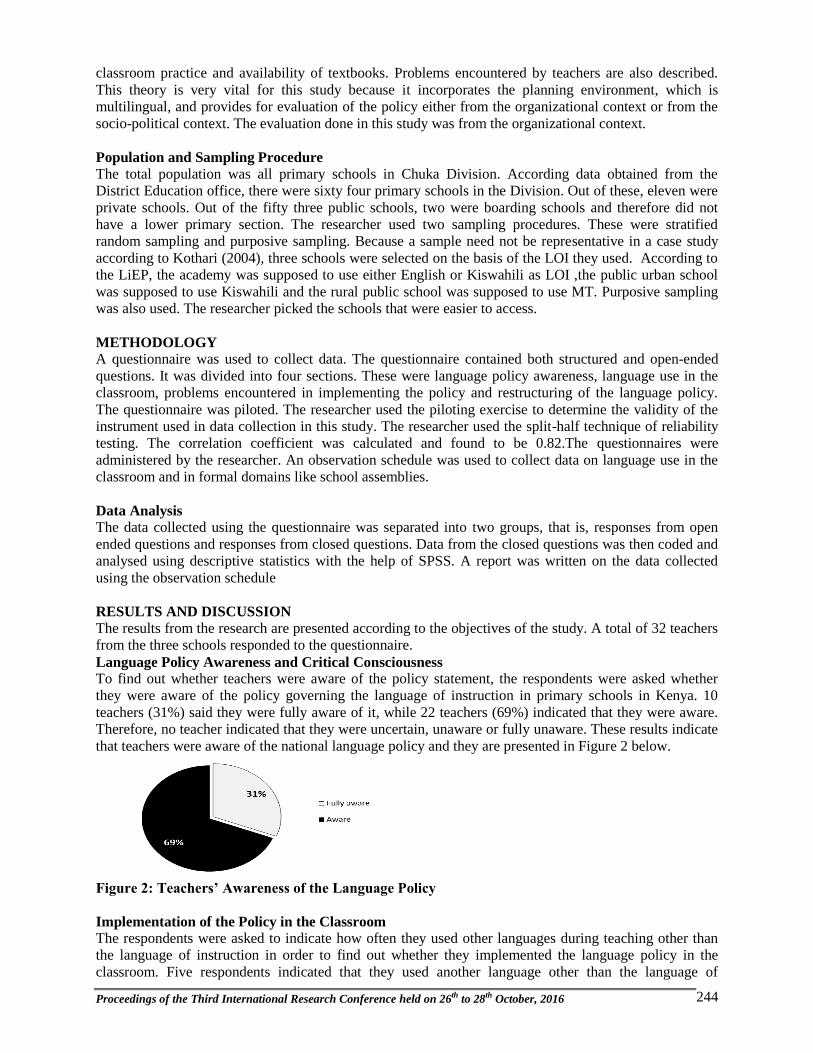
Proceedings of the Third International Research Conference held on 26th to 28th October, 2016 244
classroom practice and availability of textbooks. Problems encountered by teachers are also described.
This theory is very vital for this study because it incorporates the planning environment, which is
multilingual, and provides for evaluation of the policy either from the organizational context or from the
socio-political context. The evaluation done in this study was from the organizational context.
Population and Sampling Procedure
The total population was all primary schools in Chuka Division. According data obtained from the
District Education office, there were sixty four primary schools in the Division. Out of these, eleven were
private schools. Out of the fifty three public schools, two were boarding schools and therefore did not
have a lower primary section. The researcher used two sampling procedures. These were stratified
random sampling and purposive sampling. Because a sample need not be representative in a case study
according to Kothari (2004), three schools were selected on the basis of the LOI they used. According to
the LiEP, the academy was supposed to use either English or Kiswahili as LOI ,the public urban school
was supposed to use Kiswahili and the rural public school was supposed to use MT. Purposive sampling
was also used. The researcher picked the schools that were easier to access.
METHODOLOGY
A questionnaire was used to collect data. The questionnaire contained both structured and open-ended
questions. It was divided into four sections. These were language policy awareness, language use in the
classroom, problems encountered in implementing the policy and restructuring of the language policy.
The questionnaire was piloted. The researcher used the piloting exercise to determine the validity of the
instrument used in data collection in this study. The researcher used the split-half technique of reliability
testing. The correlation coefficient was calculated and found to be 0.82.The questionnaires were
administered by the researcher. An observation schedule was used to collect data on language use in the
classroom and in formal domains like school assemblies.
Data Analysis
The data collected using the questionnaire was separated into two groups, that is, responses from open
ended questions and responses from closed questions. Data from the closed questions was then coded and
analysed using descriptive statistics with the help of SPSS. A report was written on the data collected
using the observation schedule
RESULTS AND DISCUSSION
The results from the research are presented according to the objectives of the study. A total of 32 teachers
from the three schools responded to the questionnaire.
Language Policy Awareness and Critical Consciousness
To find out whether teachers were aware of the policy statement, the respondents were asked whether
they were aware of the policy governing the language of instruction in primary schools in Kenya. 10
teachers (31%) said they were fully aware of it, while 22 teachers (69%) indicated that they were aware.
Therefore, no teacher indicated that they were uncertain, unaware or fully unaware. These results indicate
that teachers were aware of the national language policy and they are presented in Figure 2 below.
Figure 2: Teachers’ Awareness of the Language Policy
Implementation of the Policy in the Classroom
The respondents were asked to indicate how often they used other languages during teaching other than
the language of instruction in order to find out whether they implemented the language policy in the
classroom. Five respondents indicated that they used another language other than the language of

Proceedings of the Third International Research Conference held on 26th to 28th October, 2016 245
instruction very often, eight respondents said that they did so often, 13 respondents said that they use it
rarely and two respondents said that they did so very rarely and four respondents said that they did not use
another language at all. Therefore only 12% of the respondents did not use another language other than
the language of instruction. According to these results, majority of the teachers used another language
other than the LOI. These results are presented in Figure 3.
.
Figure 3: Use of Another Language Other than the LOI
Problems in Implementation
On the issue of whether pupils encounter language problems in lower primary, 31 teachers (97%)
indicated that pupils encounter language problems while one teacher (3%) indicated that they do not.
Table 1 shows this information in summarized form. On the issue of how they solve language problems in
the classroom, 16 respondents (50%) indicated that they solved the problems by mixing languages. Two
respondents (6%) indicated that they developed their own materials, 14 respondents (44%) indicated that
they solved the problems by translating and interpreting and no respondent solved the language problems
by using English (Figure).
Table 1: Responses on whether pupils encounter language problems in the classroom
School Section Response Frequency Percentage %
Lower Primary
Yes 31 97%
No 1 3%
Upper primary
Yes 25 78%
No 7 22%
Figure 4: How teachers solve language problems
Restructuring of the Language Policy
The respondents were asked to indicate whether they would want the language policy to be restructured
On this, two respondents (6%) said that the language policy needs to be restructured very much, 10
respondents (31%) said much, four respondents (13%) said they were not sure, 13 respondents (41%) said
it needs a little restructuring and three respondents (9%) said that it does not need any restructuring. These
results indicate that the majority of teachers were of the opinion that the language policy should be
restructured. Table 2 summarizes this information.

Proceedings of the Third International Research Conference held on 26th to 28th October, 2016 246
Table 2: Responses on the restructuring of the language policy
Response Frequency Percentage %
Very much
Much
Not sure
A little
Not at all
2
10
4
13
3
6%
31%
13%
41%
9 %
The respondents were asked to indicate what they would prefer as a language policy there would be need
to change it. 28 respondents (88%) preferred a language policy where Kiswahili was LOI from Std 1 – 3
and English as LOI from Std 4-8. One respondent also indicated that the text books for lower primary
should be written in Kiswahili. One respondent (3%) preferred English as LOI from Std 1-8 in all primary
schools. Two respondents (6%) indicated that they would prefer MT as LOI from Std 1-3 and English as
LOI from Std 4-8 in all primary schools. One respondent (3%) preferred English as LOI from pre-school
to Std 8 in all primary schools. Most teachers preferred a language policy where the LOI was Kiswahili in
lower primary and English in upper primary. Table 3 summarizes this information.
Table 3: Responses on language policy preference
Response Frequency Percentage %
Kiswahili as LOI from Std 1-8 in all primary schools 1 3%
Kiswahili as LOI from Std 1-3, English as LOI from
Std 4-8 in all primary schools
28 88%
English as LOI from Std 1-8 in all primary schools 1 3%
MT as LOI From Std 1-3 and English as LOI from td
4-8 in all primary schools
2 6%
MT as LOI from Std 1-3 and Kiswahili as LOI from
Std 4-8 in all primary schools
0 0
CONCLUSION
The results indicate that the policy implementation at the classroom level is a failure, as a result of
assumptions made at the stage of policy development. There is no mention of coordinating, monitoring
and evaluation agencies to oversee implementation, there are no books, new innovations and other
materials in MT and teachers get no training for teaching in MT. The current practices are mainly
inherited from the colonial period. Lack of a clear-cut, well formulated policy in both status planning and
corpus planning has led to poor implementation of the language policy. An analysis shows that its
objectives are not clearly stated. A conducive environment has not been created by the policy makers.
Such an environment requires that the structure, spelling and vocabulary of the languages designated as
LOIs are modified to conform to the demands made on their functions. Without such steps being taken,
there can be no successful implementation. English enjoys a prestigious position in the Kenyan education
system. It has also received good corpus planning. The status of Kiswahili in education in Kenya in recent
years has greatly improved. Despite being designated as LOIs, MTs have received poor corpus planning.
Teachers portrayed a negative attitude towards them and majority of them felt that MT should not be used
in education at all. The language problems that the teachers experience are as a result of shortcomings in
the development of the policy. The findings agree with those of Muthwii (2002) and Musau (2004).
Kenya’s language policy has failed to promote use of MTs despite the fact that they have been assigned a
role as LOI in rural areas and in lower primary in urban areas. The current language policy is suitable
because it has put into consideration ideological social-economic and educational issues into its
formulation. However, its implementation has been hampered by lack of clarity, lack of texts, lack of
political good-will, lack of uniformity, lack of an evaluation and monitoring agency and lack of
consistency. From the descriptions of classroom interaction between teachers and students, the conclusion
is that in lower primary, teachers use more than one language most of the time. They mix two or
sometimes three languages depending on the type of school. This is code mixing. The results obtained
from observation were in agreement with the results obtained through the questionnaire.

Proceedings of the Third International Research Conference held on 26th to 28th October, 2016 247
RECOMMENDATIONS
The following recommendations based on the findings of this research:
(i) There is need to restructure Kenya’s language policy. However, this should not be done without first
doing nationwide consultations and extensive research.
(ii) This study evaluated the language policy from organizational context. There is need for further
research to evaluate the acceptability of the language policy from the sociopolitical context.
(iii) According to the findings of this research, teachers suggested that they preferred a policy which
recommended the use of Kiswahili as LOI in lower primary in all primary schools. This is also one of
the issues that further research can help verify.
(iv) The use of code mixing in the classroom needs to be addressed in the formulation of the language
policy. So far, the Ministry of Education has no policy on code mixing and code switching.
(v) In the formulation of a new language policy, there is need to come up with a distinctive body
responsible for monitoring and evaluating the implementation of the language policy. Lack of a
monitoring and evaluation agency has been a major short coming in formulation of language policy.
REFERENCES Bogonko, S.N. (1992). Reflections on Education in East Africa. Nairobi: Oxford University Press.
Fawcett, R. P. (1970). The Medium of Education in Education in the Lower Primary School in Africa
with Special Reference to Kenya. In: T. P. Gorman (Ed.). Language in Education in Eastern
Africa. Nairobi: Oxford University Press (p. 51-69).
Gorman, T.P. (1970). Implications of Multilingualism in Eastern Africa. In T.P. Gorman (ed.), Language
in Education in Eastern Africa. Nairobi: Oxford University Press (pp. 1-12).
Haugen, E. (1983). The Implementation of Corpus Planning: Theory and Practice. In: Juan Cobarrubias
and Joshua A. Fishman (eds.), Progress in Language Planning. The Hague: Mouton (p. 269-287).
Kothari, C. (2004). Research Methodology: Methods & Techniques: New Delhi: New Age International.
Mbaabu, I. (1992). The Impact of Language Policy on the Development of Kiswahili from 1930-1990.
Unpublished Thesis: Howard University.
McNab, C. (1989). Language Policy and Practice: Implementation Dilemmas in Ethiopian Education.
Stockholm: Institute of International Education, University of Stockholm.
Muthwii, M.J. (2002). Language Policy and Practice in Kenya and Uganda. Nairobi: Phoenix Publishers.
Neustupny, J.V. 1968. Some general aspects of language problems and language policy in developing
societies. In: Joshua A. Fishman, Charles A. Ferguson and Jyotinda Das Gupta (eds.), Language
Problems of Developing Nations. New York: John Wiley and Sons (p. 285-308).
Oller, J.W. (1979). Language Tests at School. London: Longman Group. Republic of Kenya, (1949)
Beecher Report. Nairobi: Government Printer.
Republic of Kenya. 1964. Kenya Education Report Part I (Ominde Report). Nairobi: Government Printer.
Republic of Kenya, (1976). Kenya Education Commission (Gachathi) Report. Nairobi: Gov’t Printer.
Republic of Kenya, (1984). Second University in Kenya: Report of Presidential Working Party (Mackay
Report). Nairobi: Government Printer.
Rubin, J. (1973). Language planning: discussion of some current issues. In: J. Rubin and R. Shuy (Eds.).
Language Planning: Current Issues & Research. Wa: Georgetown University Press. (p. 1-11). ******
ENHANCEMENT OF QUALITY EDUCATION AND HEALTH FOR SUSTAINABLE
DEVELOPMENT
Kaniaru, S.K., Njiru, L.M. and Thinguri, R.W.
Mount Kenya University, P. O. Box 342-01000, Thika-Kenya
Telephone: 0724574175; Email: [email protected]
ABSTRACT
Quality Education and health are paramount to human life. Quality education provides vital knowledge
and skills fundamental for sustainable development. Education and health ensures human survival. The
difference between developed and underdeveloped countries may be traced from the quality of education
and health services provided to the citizens. Quality education is enhanced through progressive review of

Proceedings of the Third International Research Conference held on 26th to 28th October, 2016 248
curriculum to suit individual development and human resource requirement. A suitable curriculum to
enhance quality education should focus on current issues, technological advancement and socio-
economic needs of a country. Additionally, healthy human beings are better able to apply the knowledge
and skills acquired from quality education for sustainable development. Quality education is holistic and
relevant. Enhancement of both quality education and health lead to sustainable development.
Keywords: Quality education, Health, Curriculum, Knowledge and skills
INTRODUCTION Quality education has many dimensions that includes healthy learners, safe and protective environment,
relevant curricula, child centered teaching and outcomes which encompass knowledge skills and attitudes.
Adams (1998) viewed quality education as based on an institution’s or program's reputation, the extent to
which schooling has influenced change in student knowledge, attitudes, values, and behavior, or a
complete theory or ideology of acquisition and application of learning. Therefore quality education
include but not limited to safe and protective schooling environment. Disaster preparedness is essential
for safe and protective schooling environment. Disasters affect economic status, organizational, structural
and spiritual way of people and destroy the way they exist (Paton and Johnston, 2001).
According to International Strategy for Disaster Response (ISDR, 2002), disaster is defined as major or
serious disruption affecting the society or community either environmental or economic status,
displacement of human being and material loses that overwhelm the affected community to control or
prevent using their resources. Disaster can also be defined as events that affect the economic status,
organizational, structural and spiritual way of people and destroy the way they exist Paton and Johnston
(2001). Disaster can be caused by natural factors or artificial factors. Disasters like floods, tsunamis,
earthquakes and storms are examples of natural disasters due to lack of human interference. Disaster
management or preparedness refers to as advanced measures to prevent and curb the impact of disaster by
giving warnings and removal of people from affected areas (ISDR, 2002). Many disasters in Africa are
caused by adverse weathers, floods and droughts but fewer are caused by volcanoes and earthquake
(Adimola, 1999). According to South African School Safety Act (1996) schools especially public schools
should ensure and enhance robust measures to curb and prevents disasters in their learning institution.
There is need to conduct assessment whether the pupils are aware of risks and disasters handling when
they strike their schools. Following UN ISDR (2006-2007), when there is occurrence of a disaster the
school going children are the most vulnerable population affected by disasters. Moreover, after the
occurrence of a disaster in school they claim children and teachers life and schools are brought down and
affect the learning process. In order to reduce risks in schools there is need of two priorities utilizations in
schools being the education on disasters and also the school safety into the school curriculum. Ozmen
(2006) argues that there is need of introduction of disaster management in the curriculum education that
will play an important role in reducing risks and disasters.
Statement of the Problem Quality education and health can be enhanced through disaster risk preparedness in public primary
schools in Kenya. Quality education and health are often disrupted by regular occurrence of disaster.
Schools incur huge losses when hazards strike spontaneously. Surprisingly, a disaster can strike any place
where it is least expected. Disaster in a school may lead to loss of life, destruction of infrastructures and
disruption of quality education. The level of disaster risk preparedness at public primary schools in Kenya
is yet to be fully established despite having disaster risk reduction policy at the ministerial level. Few
teachers if any are trained in handling disasters emergencies yet schools are expected to be the safest
place for children who are vulnerable to risks. It is not known how adequate public primary schools in
Kenya are prepared to handle disasters risks if they occurred as means of enhancement of quality
education and health for sustainable development.
Purpose of the Study
This study was enhancement of quality education and health for sustainable development through disaster
risk preparedness at public primary schools in Mathira East Sub County.

Proceedings of the Third International Research Conference held on 26th to 28th October, 2016 249
Objectives of the Study 1. To assess the level of disaster risk preparedness in enhancement of quality education and health for
sustainable development.
2. To establish the types of disaster risk preparedness practices conducted in public primary schools for
quality education and health for sustainable development in Mathira East Sub County.
Independent Variable Intervening Variable Dependent Variable
Disaster
management
Preparedness
Level of
disaster
management
preparedness
Disaster
management
preparedness
practices
Enhancement of
quality education
and health for
sustainable
development
Disaster risk
reduction
policy
Figure 1: Conceptual Framework, Source: researcher
The conceptual framework for disaster management preparedness to enhance school safety is displayed as
in figure1above. The conceptual framework is comprised of independent variable which is broken into
level of disaster management and disaster management preparedness practices. These interact with the
intervening variable which is disaster reduction policy in schools. The independent variable interacts with
intervening variable to influence the dependent variable which is the enhancement of quality education
and health for sustainable development.
LITERATURE REVIEW
The Level of Schools Disaster Management Preparedness for Enhancement of Quality Education
and Health for Sustainable Development
According to ISDR, (2005), the main objective of millennium goal two is to ensure that schools employs
robust plans to curb disasters at schools and maintain normal learning even after disaster occurs. UNISDR
(2008), suggests that when disaster occurs, it affects children where many of them never come back to
school whereas many of these disasters can be mitigated through proper planning, environmental and
physical protection measures and good response preparedness. According to Shaluf (2007), natural
disasters with early warnings and disaster preparedness can be minimized and reduce the impacts of
disasters through effective and good disaster management. UNESCO (2010), said that disaster
preparedness is very important aspect to disaster management as it reduces the adverse impacts. Disasters
and disaster risk preparedness should be viewed as positive ongoing process. Therefore, disaster
management attributes our anticipation of hazardous challenge by use of set policies and administrative
mechanisms that are put in place to curb disasters.
International Finance Corporation (2010) urges every educational institution to have disaster management
mechanisms regardless of the school size or geographical location. However, it is not easy to prepare for
every event that might happen but caution and preparedness is very vital for disaster management. Twig
(2004) said that the aim of disaster management is to ensure that people are aware of disasters and they
are able to cope with the risks occurrence; and the victims get adequate assistance to withstand the
disaster effects. The aim of preparedness and mitigation is to minimize exposure of human being to
hazards coming from disasters with the help of upgraded engineering, effective use of land management,
public education and emergencies exercises Briton (1986).
Disaster Risk Preparedness Practices for Enhancement of Quality Education and Health for
Sustainable Development
According to national Disaster Management of South Africa Act (2002), there is need to have national
centers that they include schools to create awareness among the communities about disaster management

Proceedings of the Third International Research Conference held on 26th to 28th October, 2016 250
and how to cope with adverse hazardous effects. Nevertheless, schools should be seen as central centers
for disaster management learning institutions. NDMF (2005), for good disaster management for risk
reduction education must be introduced in order to create awareness among the communities. Therefore,
education will play an important role in curbing disasters hence reducing risks among the communities
for most people will be abundantly armed with the disaster management skills. Wisner (2006) urges that
education involves both informal and formal that transmits skills to the communities to educate them on
how to mitigate risks and on how to cope with the impacts of disasters that cannot be prevented. The
author maintains that informal and formal skills are elements that guide actions and understanding among
communities. The International Federation of Red Cross and Red Crescent Societies (2005) stated that
when knowledge and skills are put into context, it is very meaningful and it leads to actions. Wisdom is
an important aspect that manages skills and knowledge; hence it leads to state of action or inaction by the
communities. Action is what the people do rather than sticking on plans and commitments. Disasters can
be reduced if people are adequately informed and educated on how to manage, be resilient and prevent
disasters (UNISDR, 2006).
RESEARCH METHODOLOGY The study adopted the mixed methodology with a survey method. The study involved 52 Mathira East sub
county primary school teachers. A sample of four teachers from every school who were randomly
selected was used. The respondents were required to respond to items in a questionnaire. The
questionnaire was the main tool of collecting data. The researchers administered the questionnaire to the
respondents. Data was analyzed through descriptive statistics where percentages were used to compare
different responses.
RESEARCH FINDINGS
Table 1. Number of respondents
Male Female Total
Number according to Gender 10 42 52
Percentage 19% 81% 100%
The study interviewed 52 teachers from Mathira East Sub County. The respondents were 10, 19% male
and 42, 81% female, randomly selected. The respondents were from both urban and rural public primary
schools respectively. There was strong indication that public primary schools in Mathira Sub County are
dominated by female teachers.
Table 2. Teachers trained on handling disaster risks emergencies
Trained Untrained Total
Male 6 4 10
Female 11 31 42
Total 17 35 52
Percentage 33% 67% 100%
The study sought for the number of teachers trained in handling disaster emergencies 17, 33% of the
teachers the number of teachers trained in handling disaster emergencies 17, 33% of the teachers were
trained while 35, 67% were not trained. Six male teachers and 11 female teachers were trained.
Table 3. Disaster policy in the school
Types of teachers’ school Have disaster policy Do not have disaster policy Total
Rural teachers 12 22 34
Urban teachers 6 10 16
Total 18 34 52
Percentage 35% 65% 100%
The study asked the respondents if there was a workable disaster reduction policy or guidelines in their
respective schools. They agreed that 18, 35% of the schools had a disaster reduction policy put in place.

Proceedings of the Third International Research Conference held on 26th to 28th October, 2016 251
The data indicated that public primary schools in the Sub County are yet to implement disaster reduction
measures to decrease chances of pupil exposure to risk vulnerability.
Table 4. First aid in the schools
Teachers Trained in Providing First Aid Number of Schools With First Aid Kit
Number Percentage Number Percentage
Agree 32 62% 19 36%
Disagree 20 38% 33 64%
Total 52 100% 52 100%
As part of school safety requirements, the study sought to identify if teachers could handle first aid cases
at school level with 32, 64% agreeing that they were trained. The number of schools with First Aid Kits
was low with 19, 36%. The study established that the school management in public primary schools level
is not keen at providing necessary basic requirements to administer First Aid. It is ironical to have a large
number of teachers trained in administering First Aid without the right tools for the job 42, 84% agreed
schools were connected to piped water while. However, most pupils used untreated water as indicated at
35 (67%) of teachers. Few schools treated water before allowing learners to use it as 17, 33% of the
respondent confirmed that 44, 85% of the teachers confirmed that pupils did not clean hands after visiting
toilet. Additionally, 31, 60% of the teachers interviewed responded that pupils’ toilets were not regularly
cleaned with antiseptics.
Table 5. Availability of piped water and treatment
Piped water available Water treated before use
Agree 42 84% 17 33%
Disagree 10 16% 35 67%
Total 52 10% 52% 100%
Table 6. Washing hands with soap after visiting toilets
Wash hands after visiting toilets Toilets cleaned with antiseptic
Agree 8 15% 21 40%
Disagree 44 85% 31 60%
Total 52 100% 52 100%
RESULTS AND DISCUSSION
Safety in schools is paramount requirement. A school is concentration human beings with the aim of
disseminating and acquisition of skills and knowledge and attitude. A lot of time of teachers and children
is spent in schools every day. Pupils consider schools as a second home away from home should ensure
that there is security, psychological care and security. A total of 35, 67% of the teachers interviewed
confirmed that they were not trained in handling disaster emergencies. This means that teachers did not
know how to react if their respective schools were faced by a real disaster. Moreover, 34, 65% of the
teachers who respondent disagreed that schools had a disaster reduction policy or guidelines. This is an
indication that in many public primary schools important issues such as school safety are not emphasized.
19, 36% of the teachers interviewed agreed that schools had first aid kits or fire extinguishers. It is
worrying as the study established that although a big number of teachers 32, 62% were trained in handling
first aid cases, they could not attended to those cases effectively as 33, 64% of the schools lacked first aid
kits. Additionally, the same schools without first aid kits, also lacked fire extinguishers as confirmed by
33, 64% of the respondents.
The study established that only 17, 33% of the schools treated water against germs before pupils drunk it.
35, 67% disagreed that water for drinking in the schools was treated before use. Furthermore, 44, 85% of
the respondents’ disagreed that pupils in their schools washed hands with soaps after visiting toilets.
Surprisingly, 31, 60% of the teachers confirmed that pupils’ toilets were not regularly cleaned. Those two
factors could lead to serious contagious diseases that could to disaster. The respondents agreed they were
minor emergencies such food poisoning, injuries during games and athletics and during lesson breaks.

Proceedings of the Third International Research Conference held on 26th to 28th October, 2016 252
The teachers also disagreed that they were aware of any disaster response unit in the Sub County.
Financially the respondents were never involved in any disaster simulation or drills and were not aware of
procedures during major disasters such as fire explosions. It is evident that the level disaster preparedness
at public primary schools is quite low. Additionally, the measures put in place for disaster risk reduction
in the Sub County schools is wanting. The schools’ administration disaster risk reduction management
preparedness is in doubt. This was revealed by the high member of respondent 33, 64% who disagreed
having basic fire extinguishers or first aid requirements in the schools they worked in. Basic hygiene
among school going children with the Sub County was not adhered to 44, 85% of the teachers denying
that pupils washed their hands before eating or after visiting the toilets. Such an alarming revelation lead
to this fundamental question, “How safe are public primary schools in Kenya’’
CONCLUSIONS AND RECOMMENDATIONS
School management should not only focus on the pupils’ academic outcome but also enhance children
survival requirements in school. Furthermore, a network of disaster early warning and emergency
response unit should be established in all Sub Counties. The study established that 41, 79% of the schools
lacked any reliable means of transport to health centers should a disaster emerge. Additionally, most
teachers confirmed that they had not witnessed any emergency drill or simulation in preparation for
disaster. These short falls require an immediate correction. An elaborate means of transport and official
communication channel needs to be put in place. Teachers should also be trained on how to evacuate
pupils in case a disaster should occur.
Finally, the government through the ministry of education should induct the disaster management and risk
mitigation in the school curriculum that will enhance awareness and the way to fight and minimizes risks.
The government should train school management on disaster risk reduction procedures. The teachers
should also be trained on disaster management basic requirement for handling emergencies, while all
schools in Kenya should have a disaster risk reduction policy.
REFERENCES
Arson control forum, 2006. Surveys of School Fires, Research bulletin Number 10
Ben Wisner, Piers Blaikie, Terry Cannon and Ian Davis, 2004. At Risk
ISDR, 2006.Thematic cluster on knowledge and education [Online]. Retrieved from:
http://www.unisdr.org [20th February 2009]
UN/ISDR Terminology on Disaster Risk Reduction, 2009. [Online] Retrieved from:
http://www.unisdr.org/eng/terminology/terminology-2009-eng.html[25th May 2009]
United Nations, 2005.World Population trends. [Online] Retrieved from:
http://www.un.org/esa/population/unpop.htm [28 May 2009]
Adimola, A. 1999.Natural disasters of the world around us. Malawi: Heinemann Publishers.
Afedzie R, and McEntire, D.A. 2010. Rethinking Disasters by Design, Disaster Prevention and
Management, 19 (1): 48-58.
Fothergill, A. and Peek, A.L. 2004. Poverty and Disasters in the United States: A Review of Recent
Sociological Findings, Natural Hazards, 32: 89-110.
McEntire, A.D. 2005. Why Vulnerability matters, exploring the merit of an inclusive disaster reduction
concept, Disaster Prevention and Management, 14 (2): 206-222.
Ozmen, F. 2006. The level of preparedness of the schools for disasters from the aspect of the school
principals, Disaster Prevention and Management 15 (3): 383-395.
Shaluf, I. M. 2007. An overview of disasters, Disaster Prevention and Management, 16 (5):687-703.
South Africa. 2005. National Disaster Management Framework of 2005. Pretoria: Government Printers.
Twig, J. 2004.Good Practice Review. Disaster Risk Reduction: Mitigation and preparedness in
development and emergency programming- Humanitarian Practice Network. ODI UK.
UNESCO. 2007. Natural Disaster Preparedness and Education for Sustainable Development. [Online]
Retrieved from: http://www2.unescobkk.org [2011, July11].
UNICEF. 2009. Education in Emergencies Training Participants Workshop. ] Retrieved from: http://
www.unicef.org [2010, July 15].

Proceedings of the Third International Research Conference held on 26th to 28th October, 2016 253
United Nations. 2008. Disaster Preparedness for Effective Response: Guidance and Indicator Package for
Implementing Priority Five of the Hyogo Framework. New York and Geneva
******
TRADITIONAL HERBS USED TO CURE MENINGITIS AND SUSTAINABLE HEALTH
AMONG THE ABAGUSII
(SHORT COMMUNICATION)
Okebiro, G.N., Nyakundi, I.N. and Nyakundi, E.G. Faculties of Arts and social Sciences and Education and Human Resource management, Kisii University-Kitale campus.
Email: [email protected]
ABSTRACT
The traditional drugs were effective in treating diseases like meningitis among the Abagusii. The
Abagusii specialist/medicine men mixed the roots from different indigenous plants (Omanyateti,
Ekenagwa ekiogarori, omonyankene, omonyababi) and boiled to make a concoction swallowed to cure a
multiple diseases in human anatomy or body. That is why such diseases like meningitis were unheard off
in the ancient Abagusii Society in Gusiiland. The problem is nowadays, the doctors, or nurses do not
identify the symptoms of meningitis in the early stage, instead they treat the patient on malaria drugs to
realise later the patient was suffering from meningitis on un revisable state. The objectives are to
reinforce the traditional drugs to treat meningitis among the Abagusii and the rest of the other ethnic
tribes and to investigate why the doctors are unable to detect the patients suffering from meningitis in the
early stage. The research adopts interview method through survey design. The result is many patients lose
lives due to negligence of doctors treating different diseases instead of meningitis. It is concluded that the
symptoms of meningitis are similar like those of malaria and therefore, doctors’ contradict on treating
malaria instead of meningitis. Therefore, it is recommended doctors to be careful in identifying the
patients suffering from meningitis or patients to use the traditional herbs for sustainable human health.
Keywords: Meningitis, Sustainable health, Vocational and Technical Education
INTRODUCTION
Geographical Location of Gusiiland and Abagusii People
Abagusii occupy an area round Lake Victoria region, formerly Nyanza province, which is characterized
by a high degree of physical diversity (Ominde, 1963), Gusiiland.The currently covers two counties
which comprise of Nyamira and Kisii. The area extends over approximately 800 square miles with a
mean altitude of 1,950m feet above sea level. Gusiiland, according to Ominde (1963) is the most fertile
and agriculturally productive region in the whole of Nyanza province. Gusiiland is well served by several
permanent rivers and streams which adequately drain the waters into the area into Lake Victoria, which
include Gucha, Sondo and Mogonga. Structurally Gusiiland is hilly with several ridges especially in the
East. The plateau bounded on south west by vinyo escarpment, a great cliff which rises to 300 m feet
above plains of Kamagambo and its foot, and breached by the gorge of the Guja. To the north-west, the
plateau is bounded by Manga escarpment. From here the Gusiiland falls down in a succession of terraces
to Kendu Bay, on the southern shores of Nyanza Gulf, a distance of some twenty three
kilometres(Ominde,1963).The ridges are separated by deep flat bottomed valleys occasionally choked by
swamps, streams and rivers, fed by more than 800mm of rainfall annually. Gusiiland has a cool highland
equatorial climate.
In gusiiland, the practice and theory of traditional medicine has been practised in many communities in
African continent for many years and will still be widely used to cure diseases which persisted modern
medicine manufactured from industries. The only difference with the traditional medicine was done on
simple techniques, boiling of roots, or drying and making ass from the leaves from specific medicinal
plants. According to Kokwaro (2009), it is true that the people, together with their animals, from time to
time became sick or were injured under their existing environmental conditions before the arrival of the
early European explores and missionaries. For many years Abagusii have developed a store of empirical
information concerning the therapeutic value of local or traditional plants. Thus the art of native medicine

Proceedings of the Third International Research Conference held on 26th to 28th October, 2016 254
has been practiced in East Africa for many years and is still being widely used even today (Kokwaro,
2009). The traditional drugs were effective in treating diseases like meningitis among the Abagusii.
The Abagusii specialist/medicine men mixed the roots from different indigenous plants (Omanyateti,
Ekenagwa ekiogarori, omonyankene, omonyamababi) and boiled to make a concoction swallowed to cure
a multiple diseases in human anatomy or body. That is why such diseases like meningitis were unheard
off in the ancient Abagusii society in Gusiiland. The only limitations of the indigenous of medicine is
that, the knowledge of medicinal plants is normally passed orally from generation to the next. But a lot of
valuable information or knowledge can be lost or distorted whenever a medicine man or medicine woman
died without revealing the knowledge to another, a common phenomenon in Abagusii society because of
fear of being call witchcraft or fear of being excommicated from the church. The other limitation is that
the content in the traditional medicine is not determined and concentration of the traditional medicine.
Meaning of Meningitis
Meningitis is an inflammation of the meninges due to infection by viruses, bachetaria or fungi. Meninges
are three connective tissue membranes that line the skull and vertebral canal and enclose the brain and
spinal cord. Thus, meningitis causes severe headache, fever, loss of appetite, intolerance to light
(photophobia) and sound (phonobobia), rigidity of muscles, especially those in the neck and in severe
cases convulsions, vomiting, and delium leading to death. The most important causes of bacterial
meningitis are: haemophilus influenza (especially in young children); two strains of Neisseria meningitis
(the meningococcus), B and C; and streptococcus preunomia (Ekeuuno). The bacterial meningitis is
treated with antibiotics administered soon after diagnosis. Viral meningitis does not respond to drugs but
has a relatively benign prognosis (Oxford Medical Dictionary, 2010).
Statement of the Problem
Doctors or nurses do not identify the symptoms of meningitis in the early stage; instead they treat the
patient using malaria drugs, but later discover meningitis at un-revisable/unchangeable state.
Objectives of the Study
The objectives are to reinforce the traditional drugs to treat meningitis among the Abagusii and the rest of
the other ethnic tribes and to investigate why the doctors are unable to detect the patients suffering from
meningitis in the early stage.
METHODOLOGY
The research adopted interview method and survey design.
KEY FINDINGS
Many patients lose lives due to negligence of doctors treating different diseases instead of meningitis.
This is due to similar symptoms of meningitis and malaria such as those diagnosed in the older children
and adults. Despite the fact that different organisms are capable of producing meningitis, common signs
and symptoms are shared by all children and adults. Infants and very young children, many of the
characteristic signs and symptoms may not be present and may be non-specific. Therefore, diagnosis can
be very difficult for children and even adults and that is why the Abagusii treated the patients of such
common signs and symptoms with the traditional medicine/herbs.
According to Hickey (1986), common symptoms of meningitis in young children include fever, refusal to
eat, vomiting, diarrhoea, listlessness, a shrill cry and bulging fontanels. In the old children and adults, the
following symptoms are noted: Headache, Fever, Deterioration in the level of consciousness, Signs of
meningeal irritation, Generalised convulsions, Increased intracranial pressure, Cranial nerve dysfunction,
Endocrine disorders, and Hypersensitivity. There are complications related to the type of causative
organization and the severity of the illness. The post-meningitis sequel includes visual impairments, optic
neuritis, deafness, personality change, headache, seizure activity, paralysis, hydrocephalus, pneumonia
and endocarditis.

Proceedings of the Third International Research Conference held on 26th to 28th October, 2016 255
CONCLUSION
Symptoms of meningitis are similar like those of malaria, making doctors’ confuse with treating malaria
instead of meningitis. The bacteria causing meningitis reach the meninges through the bloodstream or
extension from cranial structures such as para-nasal sinuses or the ear. The bacteria can also enter through
penetrating head wounds and skull fractures (Hickey, 1986). Viral meningitis is known as acute benign
lymphocytic meningitis and acute aseptic meningitis. Any number of viruses, such as mumps
(Chinkununu) can cause symptoms that correspond to those of meningitis caused by bacteria and other
organisms. Viral meningitis occurs sporadically or in small epidemics and all age groups is susceptible.
The treatment of viral meningitis is symptomatic and supportive. No drug therapy is effective against the
virus. Complete recovery is possible, although some paralysis and arachnoiditis have been noted and
reported (Hickey, 1986). The traditional drug is prepared from the boiled roots of the key five medicinal
plants (Omanyateti, Ekenagwa ekiogarori, Omonyankene, Omonyamababi, Omotembe) kept in enyongo
and the patient is given a reasonable quantity thrice a day to swallow.
RECOMMENDATION
1. Since the signs and symptoms of meningitis are similar to those of malaria, it is recommended doctors
to be careful in identifying/diagnoses the patients suffering from meningitis in the early stage and
patients to use the traditional herbs for sustainable human health.
2. Knowledge on traditional medicine be preserved and used to cure diseases because it is effective, but
becoming extinct because of non-handing over from one generation to another.
3. Universities in Kenya should establish Faculty of Traditional Medicine to teach students African
traditional medicine.
REFERENCES
Hickey, J.V. (1986).The clinical Practice of Neurological and Neurosurgical nursing, 2nd
ed. Lippincott
company, East Washington.
Kokwaro, J.O. (2009). Medicinal plants in East Africa. 3rd
ed. University of Nairobi press,Nairobi.
Ominde, S.H. (1963). “Land and population in Western Districts of Nyanza province”. A Ph.D. thesis.
University of London. p. 18. ******
RELATIONSHIP BETWEEN TEACHERS’ TEACHING METHOD EFFICACY IN HIV/AIDS
EDUCATION AND STUDENTS’ KNOWLEDGE AND ATTITUDE TOWARDS SEXUAL
BEHAVIOUR IN SECONDARY SCHOOLS IN COAST REGION, KENYA
Thuo, D.N., Nyaga, V.K., Bururia, D.N. and Barchok, H.K. Chuka University, P. O. Box 109-60400, Chuka, Kenya
Corresponding Author: [email protected]; Tel. No. 0722572595
ABSTRACT
The HIV and AIDS are challenges that may hinder the achievement of Millennium Development Goals
by 2030. It has been argued that a lot can be done to curb the spread of HIV and AIDS through education.
The purpose of the study was to determine the relationship between teachers’ teaching method efficacy in
HIV/AIDS education and students’ knowledge and attitude towards sexual behaviour in secondary
schools in the Coast Region of Kenya. The study used descriptive survey research design. Proportional,
purposive and random sampling methods were used to choose the participants. The samples comprised
421 respondents of which 33 were teachers and 388 students in 13 secondary schools. Questionnaires and
interview schedule were used to collect the data. Reliability coefficients of the instruments were 0.8 for
both teachers and students. The statistics that were used to analyse data were frequencies, percentage and
Chi-squire statistics. The hypotheses testing was done at α = 0.05 level of significance. The data collected
in this study was analysed using Statistical Package for Social Sciences computer programme version
20.0. The result showed that, there was no relationship between teachers’ teaching method efficacy in
HIV/AIDS education and students’ knowledge and attitude towards sexual behaviour in secondary
schools in the Coast Region of Kenya. The study also revealed that majority of teachers’ had low self-
efficacy in methods used when teaching HIV/AIDS education, students’ knowledge was high but Form 4

Proceedings of the Third International Research Conference held on 26th to 28th October, 2016 256
students had negative attitude towards sexual behaviour. The study recommends that teachers be trained
on methods used to teach HIV/AIDS education and students in secondary schools be assisted to develop
positive attitude towards sexual behaviour
Keywords: Students’ Self-efficacy, Students’ Attitudes, Life Skills
INTRODUCTION
The government of Kenya in response to Dakar agreement and rapid spread of HIV infection and
stigmatization of people living positively with HIV introduced compulsory HIV/AIDS education in all
levels of education (GoK and UNICEF Kenya Country Office Study, 2000; UNAIDS, 2001; GoK, 2012).
Teachers in service were also given in-service course on HIV/AIDS education and life skills. Those in
colleges were also taught about HIV and AIDS in preparation to teach HIV education once through with
their college education (GoK and UNICEF Kenya Country Office Study, 2000; GoK, 2012; Kelly, 2013).
It was therefore expected that teachers were capable of teaching HIV/AIDS education and life skills in
secondary schools located in Kenya.
In some countries, life skills education and HIV/AIDS education was reported to have succeeded in
reducing incidence of risky sexual behaviour among students (Chinsembu, Siziya, Muula and Rudatsikira,
2004; Selim and El-Shereef, 2010). Henderson, Wight, Raab, Abraham, Buston, and Scott (2002)
reported that the percentage of students engaging in sexual intercourse in East Scotland reduced after
introduction of life skills and sex education in schools. Most of these students in the study reported using
condoms at first and most recent sex intercourse. However, risky sexual behaviour despite introduction of
sex education and life skill education in schools was also reported by other researchers (WHO, 2007;
Fawole, Ogunkan and Adegoke, 2011; Mongkuo, Mushi, and Rollinda, 2010). According to Mayock and
Byrne (2005), a high percentage of the youth were sexually active in Dublin and Ireland cities despite the
fact that students were taught life skills in schools. The researchers did not explain why some students
continued with risky sexual behaviour even when they were taught sex education and life skills education.
Thuo et al. (2016a, and 2016b) showed that there were relationships between teachers’ knowledge
efficacy, teachers’ motivation towards teaching HIV/AIDS education; and students’ knowledge and
attitude towards sexual behaviour respectively. Oginga, Muola, and Mwania (2014) study established that
teachers’ attitudes towards teaching HIV/AIDS education negatively influenced the teaching of
HIV/AIDS education in primary schools in Kenya. Training of primary school teachers on HIV/AIDS
education was also identified to be poor among teachers training colleges (Onyango, 2009). Weiler and
Cassandra (2012) reported that teachers graduating from University in Ghana were not taking up the call
to respond to the social problem of HIV/AIDS in the classroom despite their knowledge, willingness and
confidence being high. There are many other factors that affect how HIV/AIDS education is taught that
include teachers teaching method that require further investigation.
The method used to facilitate active involvement in teaching life skills and HIV/AIDS education includes
working in small groups and pairs, brainstorming, role play, games and debates (WHO, 1997). According
to Saeed and Congman (2012), teachers’ selection of methodology was directly influenced by examinations
and that learners’ communicative competence was consequently affected by the teachers’ selection of
methodology. Teachers’ teaching methodology has been positively associated with students’ learning
activities in other studies (Nabeels , 2001; Ndegwa, Wangechi, Makohaa, Kjungu, Nyongesa, Nkonge,
Osawa, Osaki, and Muthwii, 2002; Mulongo, 2013). This research investigated the relationship between
the level of teachers’ efficacy in methods used in teaching HIV/AIDS education and students’ knowledge
and attitude towards sexual behaviour in secondary schools in the Coast Region of Kenya.
Statement of the Problem The HIV and AIDS pandemic have negative socio-economic implications to students and society in
general. The HIV and AIDS has perpetuated high levels of poverty, prevalence of health problems,
discrimination, low level of education and high school dropout rate in Coast Region of Kenya The present
study was designed to investigate the relationship between teachers’ teaching method efficacy in
Proceedings of the Third International Research Conference held on 26th to 28th October, 2016 257
HIV/AIDS education and students’ knowledge and attitude towards sexual behaviour in secondary
schools in the Coast Region of Kenya.
Objective of the Study
The objective of the study was to investigate the relationship between the level of teachers’ self-efficacy
in method used when teaching HIV/AIDS education and students’ knowledge and attitudes towards
sexual behaviour in secondary schools in the Coast Region of Kenya.
Hypotheses
The following null hypotheses were tested at α = 0.05 level of significance.
H01: There is no significant relationship between level of teachers’ self-efficacy in teaching method used
when teaching HIV/AIDS education and students’ knowledge on sexual behaviour in secondary schools
in the Coast Region of Kenya.
H02: There is no significant relationship between level of teachers’ self-efficacy in teaching method used
when teaching HIV/AIDS education and students’ attitudes towards sexual behaviour in secondary
schools in the Coast Region of Kenya.
METHODOLOGY
The study adopted a descriptive survey research design. The target population composed of 112026
respondents in 362 public secondary schools in Coast Region, Kenya. The sample comprised 421
respondents of which 33 were teachers and 388 students in 13 public secondary schools. The selection of
schools was done using simple random sampling methods while participants were selected using
purposive, propositional and simple random sampling methods. Data was collected using questionnaires
and interview. The pilot study was carried out in three schools in Kilifi County within the Coast Region,
Kenya. The test re-test method was used during the pilot study to obtain data that was used to compute
correlation coefficient. Teachers’ questionnaire and students’ questionnaire yielded a reliability
coefficient of 0.8 each. The research tools were developed and validated before their use with help from
other members from the Department of Education. The researcher obtained letter from Chuka University
that was used to obtain permission to carry out the study from National Commission for Science,
Technology and Innovation. The data was analyzed using frequencies, percentages and Chi-square
statistics. The data in the study was analysed using statistical package for social sciences (SPSS)
computer programme version 20.
RESULTS The study was set to investigate the relationship between teachers’ level of self-efficacy in method used
when teaching HIV/AIDS education and students’ knowledge and attitudes towards sexual behaviour in
secondary schools in the Coast Region of Kenya. The data analysis generated the following results:
Teachers’ Teaching Methods and Students’ Knowledge on sexual behaviour
The researcher first established teachers’ self-efficacy in methods used when teaching HIV/AIDS
education and students’ knowledge on sexual behaviour. Table 1 shows a summary of teachers’
responses. Results in Table 1 showed that 72% of teachers had high self-efficacy in storytelling as a
method of teaching HIV/AIDS education. The results in the Table further showed that 72% of teachers
did not use demonstrations methods when teaching HIV/AIDS education and/or life skills. According to
GoK and UNICEF Kenya Country Office Study (2000), promoting the correct and consistent use of
condoms should have been introduced in teaching of HIV/AIDS education. Table 2 shows the summary
of students’ level of knowledge on sexual behaviour.
Information captured in Table 2 showed that 45.6 % of Form 1 students and 36.9% of Form 4 students
indicated that condoms do not protect people from getting infected with HIV. Majority (86%) of Form 1
students indicated that insect bites can transmit HIV compared to 11.8% of Form 4 students. In order to
test the stated hypothesis, the collected data was analysed using the descriptive statistics. The results are
summarised in Figure 1.

Proceedings of the Third International Research Conference held on 26th to 28th October, 2016 258
Table 1. Teachers’ Self-Efficacy in Method used in Teaching HIV/AIDS Education
Teacher’ Self-efficacy, n=25
Statements High Low
F % F %
Storytelling 18 72 7 28
Games 6 24 19 76
Case study 11 44 14 56
Songs/ dances 9 36 16 64
Brainstorming sessions 18 72 7 28
Poems 13 72 7 28
Skits 6 24 19 76
Demonstrations using model 7 28 18 72
Lecture methods 8 32 17 62
Giving assignments 12 48 13 52
Table 2. Summary of Students’ Level of Knowledge on Sexual Behaviour
Form 1
n = 193
Form 4
n = 195
Statements High Low High Low
F % F % F % F %
HIV only infect people 142 73.6 51 26.4 137 70.3 58 29.7
All people who are HIV positive got it
through sexual intercourse
171
88.6
22
11.4
176
90.3
19
9.7
A person can’t get HIV and AIDS by
sharing clothes, utensils with an
infected person
136
70.5
57
29.5
142
72.8
53
27.2
A person can get HIV through bites
from insects such as mosquitoes, lice,
bedbug
27
14
166
86
172
88.2
23
11.8
People who are HIV positive are always
sickly
119
61.7
74
38.3
114
58.5
81
41.5
Condoms do not protect against
infection with HIV during sexual
intercourse
105
54.4
88
45.6
123
63.1
72
36.9
Knowing your HIV status can reduce
the risk of HIV infection
134
69.4
59
30.6
158
81
37
19
Abstaining from sexual intercourse is
the only method of reducing HIV
infection
85
44
108
56
89
45.6
106
54.4
Being faithful to one sexual partner
can’t reduce the rate of HIV infection
110
57
83
43
122
62.6
73
37.4
Petroleum jelly is a good lubricant for
condoms
117
60.6
76
39.4
114
58.9
81
41.1
Results of the analysis presented in Figure 1 showed that 40% of teachers had a high level of self-efficacy
in methods used when teaching HIV/AIDS education, 88.7% of Form 1 students and 90.3% of Form 4
students had high knowledge on sexual behaviour. In order to test the stated hypothesis, Chi-square test
was done and the results are shown in Table 3. Results presented in Table 3 revealed that there was no
significant relationship between teachers’ level of self-efficacy in teaching methods used when teaching
HIV/AIDS education and students knowledge on sexual behaviour (df 1, P >.05). The Null hypothesis
was therefore accepted.

Proceedings of the Third International Research Conference held on 26th to 28th October, 2016 259
Figure 1. Teacher self-efficacy in teaching methods and students’ knowledge of sexual behaviour
Table 3. Chi-square test between teachers self-efficacy in teaching methods and students’ knowledge
Self-efficacy Form 1 students Form 4 students’
Chi-square 1.000 121.290 123.205
df 1 1 1
Asymp. Sig. 0.317 0.000 0.000
Teachers’ Teaching Methods and Students’ Attitudes towards sexual behaviour
The researcher first established students’ attitude towards sexual behaviour (Table 4).
Table 4. Students’ Attitude towards Sexual Behaviour Form One, = 193 Form Four, n = 195
Statements positive negative positive negative
F % F % F % F %
I feel that abstinence from sexual intercourse is
possible in present time
119 61.7
74 38.3
103 53
92 47
I feel that students should be encouraged to have only
one sexual partner
144 74.6
49 25.4
69 35
126 65
I feel that peers (friends) influence is not important
when it comes to engagement in sexual intercourse
69 35.8
124 64.2
84 43
111 57
I feel that cheating sexually is normal these days 50 25.9 143 74.1 32 16 163 84
I feel that it is easy for a person to have only one
sexual partner throughout his/her life
106 54.9
87 45.1
90 46
105 54
I feel that it is okay having more than one sexual
partner as long as you are faithful to them
130 67.4
63 32.6
45 23
150 77
I feel that sexual intercourse where condom is
involved is no sex
117 60.6
76 39.4
84 43
111 57
I feel that married people should also be encouraged
to use condoms when having sexual intercourse
59 30.6
134 69.4
41 21
154 79
I would use or ask my partner to use a condom when
having sexual intercourse
100 51.8
93 48.2
92 47
104 53
It is my feeling that all people regardless of whether
they are sexually active or not should go for VCT
133 68.9
60 31.1
149 76
46 24
It is my feeling that people who know their HIV
status suffer more than those who don’t know
116 60.1
77 39.9
76 39
119 61
It is my feeling that information about people who
are HIV positive is likely to leak from VCT centres
76 39.4
117 60.6
106 54
89 46
The results in Table 4 indicated that 64.2% of Form 1 and 57% of Form 4 students believed that peer
influence played an important role when students engaged in sexual intercourse, 45.1 % of Form 1
students and 54% of Form 4 students felt that it was not easy for a person to have only one sexual partner
throughout his/her life. The findings in this study were consistent with findings of Chinsembu et al.
(2004) which indicated that a high percentage of adolescents reported having had sexual intercourse and a
significant percentage reported having had sexual intercourse with more than one sexual partner in
Namibia. Nath (2009) also found out that condom awareness was fairly high but condom usage was low

Proceedings of the Third International Research Conference held on 26th to 28th October, 2016 260
among the youth in India and the youth appeared to hold negative attitudes towards HIV testing. In order
to test the stated hypothesis, the analysis was done by the help of descriptive statistics and Chi-square test.
The results are shown in Figure 2 and Table 5.
Figure 2 revealed that 40% of teachers had a high level of self-efficacy in methods used when teaching
HIV/AIDS education compared to 42.1% of Form 4 students who had a positive attitude towards sexual
behaviour. However, 62.2% of Form 1 students had a positive attitude towards sexual behaviour which
was higher than that of Form 4 students. The Chi-square test results are presented in Table 5.
The results in Table 5 showed that there was no significant relationship between teachers’ self-efficacy in
teaching methods used when teaching HIV/AIDS education and students’ attitudes towards sexual
behaviour (df1, P>0.05). The stated Null hypothesis was accepted. The researcher also carried out an
interview with the HoDs in Guidance and Counselling to shed more light on teaching methods used by
teachers’ to teach HIV/AIDS education and life skills in secondary schools. The descriptions of some of
HoDs responses are given in Excerpt 1.
Fig. 2. Teachers’ self-efficacy in teaching methods and students’ attitude towards sexual behaviour
Table 5 Chi-square test between Teachers’ Self-Efficacy in Teaching Methods and Students’
Attitude towards Sexual Behaviour
Teachers’ Self-efficacy Form 1 students’
attitude
Form 4 students’
attitude
Chi-square 1.960 11.446 1.486
df 1.00 1.000 1.000
Asymp. Sig. 0.162 0.001 0.026
Excerpt 1.
Researcher: Do you monitor how HIV/AIDS education and life skills are taught in the school?
HoD 1: Responses;
The teaching of HIV/AIDS can only be monitored by academic HoDs in which
HIV/AIDS has been integrated.
It is difficult to monitor how teachers teach life skills because I also have my teaching
subjects and my workload is heavy.
Researcher: Who then is responsible for making sure that teachers attend to life skills lesson?
HoD 1: That is the work of the Deputy Principal who has few lessons to teach per week.
Researcher: Do you have a record of work for life skills to show what teachers have taught?
HoD 1: I introduced one but no teacher except me has ever filled what they teach.
HoD 2: Responses to the first question;
Teachers are professionals and I believe they do not require monitoring on what they
have been trained to do.
Response to second question;
Proceedings of the Third International Research Conference held on 26th to 28th October, 2016 261
Teachers are supposed to create time to teach life skills since it is not time tabled and
they keep saying they will do so.
HoD 3: Responses to the first question;
The HoD academics checks on what has been taught in other subjects while I make a
follow up on teachers who teach life skills.
HoD boarding makes sure life skills assigned to house patrons are attended and those
teachers who do not attend answer to the principal.
Response to the second question;
Records are not necessary because teachers address issues raised by students.
The results of the interview showed that; there was no proper monitoring of how life skills was taught in
schools and teachers did not follow the syllabus when teaching life skills. The interview further revealed
that 44.4% of the schools did not have any trained teacher in Guidance and Counselling or in HIV/AIDS
education or life skills and 22.3% of HoDs did not know if the school had any teacher trained in
counseling or HIV/AIDS education or life skills. None of the HOD interviewed was aware of teaching
methods used by teachers who teach HIV/AIDS education and life skills education.
CONCLUSION AND RECOMMENDATION The findings showed that there was no relationship between teachers’ self-efficacy in methods used when
teaching HIV/AIDS education and students’ knowledge and attitude towards sexual behaviour. However,
teaching method used by teachers when teaching HIV/AIDS education in this study was one of the
characteristics of teachers’ general self-efficacy in teaching HIV/AIDS education. Skills are important
aspect of self-efficacy and interaction with the other factors can be important in contributing to overall
teachers’ self-efficacy in teaching HIV/AIDS education in secondary schools (Bandura, 1994; Schunk,
1991). Teachers’ therefore need to improve on teaching methods used when teaching HIV/AIDS
education and life skills education in order to change students’ attitude towards sexual behaviour.
REFERENCES
Bandura, A. (1994). Self-efficacy. In: V. S. Ramachaudran (Ed.), Encyclopaedia of Human Behaviour.
New York: Academic Press.
Chinsembu, K. C., Siziya S., Muula A, S., and Rudatsikira, E (2004) Prevalence and Social Correlates of
Sexual Intercourse among School Going Adolescents in Namibia. Journal of Social Aspect of
HIV/AIDS; 5 (3) September, 2008. 127-135.
Fawole, A. O., Ogunkan D. V., and Adegoke, G. S. (2011). Sexual Behaviour and Perception of
HIV/AIDS in Nigeria. Tertiary Institutions: University of Ilorin, a Case Study, Global Journal of
Human Social Science, 11(1) 64-72.
GoK (2012). A Policy Framework for Education: Aligning Education and Training to the Constitution of
Kenya (2010) and Kenya Vision 2030 and beyond. Nairobi: Government Press.
GoK and UNICEF Kenya Country Office Study (2000). The Impact of HIV/AIDS on Education in
Kenya, and the Potential for Using Education the Widest Sense for the Prevention and Control of
HIV/AIDS. Final Report; November
Henderson, M., Wight, D., Raab, G., Abraham, C., Buston, K., Hart.G, and Scott, S. (2002) Heterosexual
Risk Behaviour Among Young Teenagers in Scotland. Journal of Adolescence, (25) 483-494.
Kelly, M., J. (2013). Module 1.2: The HIV/AIDS Challenge to Education. UNESCO/ International
Institute for Educational Planning.
Mayock, P., and Byrne, T. (2005). A Study of Sexual Health Issues, Attitudes and Behaviours: The Views
of Early School Leavers, Dublin; Crisis Pregnancy Agency No 8.
Mongkuo, M. Y., Mushi, R. J. and Rollinda, T. (2010). Perception of HIV/AIDS and Socio-Cognitive
Determinants of Safe Sex Practices among College Students Attending a Historically Black
College and University in the United States of America, J. AIDS and HIV Research, 2(3):32-47.
Mulongo, G. (2013). Effect of Active Learning Teaching Methodology on Learner Participation; Journal
of Education and Practice: 4(4):157-168.
Nath, A. (2009). HIV/AIDS and Indian Youth- a reveiw of the Literature (1980-2009). Journal of Social
Aspect of HIV/AIDS; 6(1):1-7.

Proceedings of the Third International Research Conference held on 26th to 28th October, 2016 262
Nabeel, T. (2001). Teachers’ Efficacy as Predictor of Self-efficacy Among Students in Pakistan.
International Peer Reviewed Journal: Vol. 1 May 2011 ISSN 22438327.
Ndegwa, D., Wangechi, L., Makohaa, A., Kjungu, M., Nyongesa J., Nkonge, C., Osawa, N., Osaki, Y.,
and Muthwii, S. (2002). Knowledge, attitude and practices towards HIV/AIDS among Teachers
and Students in Nairobi Province of Kenya. J Natl Inst. Public Health, 51(1) 56-59.
Oginga, E., A., Muola, J., M. and Mwania J., M. (2014). The Factors Influencing the Teaching of
HIV/AIDS Education in Public Primary Schools in Kisumu East District, Kenya. International
Journal of Education and Research, 2(1):1-14.
Onyango, M., O. (2009). Exploring the Preparation of Teachers to Teach about HIV/AIDS in Kenya.
Educate~ Special Issue, December 2009, 37-47.
Saeed, A. and Congman, R. (2012). Examination Washback Effect: Syllabus, teaching methodology and
the learners’ communicative competence. Journal of Education and Practice, 3(15):173-183.
Schunk, D. (1991). Self-Efficacy and Academic Motivation; Educational Psychologist, 26, 207-231.
Selim, E., M., A. and El-Shereef, E. (2010). Perceptions of Secondary Technical schools students in
Assiut, Upper Egypt, About AIDS: Effect of an Educational Intervention. Journal of Family and
Community Medicine: 17(1) 3-10.
Thuo, D. N., Nyaga, V. K., Bururia, D. N., and Barchok, H. K. (2016a). Relationship between teachers’
knowledge efficacy in HIV/AIDS and students’ knowledge and attitude towards sexual behaviour
in secondary schools in Coast Region, Kenya. Inter. J. Educ. Res. Vol. 4 No. 1, p. 219.
Thuo, D. N., Nyaga, V. K., Bururia, D. N., and Barchok, H. K (2016b). Relationship between teachers’
motivation teaching HIV/ADS education and students’ knowledge and attitude towards sexual
behaviour in secondary schools in Coast Region, Kenya. J. Edu. Pract., Vol. 7, No. 1, p. 63
UNAIDS (2001). Report on Global HIV/AIDS Epidemic. June 2000 Geneva: UNAIDS.
Weiler, J. M., and Cassandra, J. M. W. (2012). Addressing HIV/AIDS Education: A Look at Teacher
Preparedness in Ghana. Journal of International Social Studies,2 (1)14-25.
WHO (1997). Life Skills Education for Children and Adolescents in Schools. Switzerland; WHO press. ******
PERCEPTIONS OF CATHOLIC CHURCH ON TETANUS VACCINE TO WOMEN IN KENYA
Rufo, B.M.
Chuka University, P. O. Box 109-60400, Chuka Email: [email protected], 0706772060.
ABSTRACT
Government of Kenya has been focusing on a mass tetanus vaccination campaign for past years. This
targeted women between 14 and 49 years with an aim of protecting babies from neonatal tetanus, a case
of pregnant mothers. Before the March and October 2014 mass tetanus vaccination campaign, the
Catholic Church raised concerns about the safety of the vaccine that was being used. Therefore, this study
was about the perceptions of Catholic Church on tetanus vaccine to women in Kenya. The objectives of
the study were to analyze the reasons as to why Catholic Church in Kenya reject tetanus vaccine,
determine the impacts associated with tetanus vaccination to women and society at large, determine
bodies and institutions that support and contribute to the vaccination program and finally to access the
Kenyan government response concerning the views brought by the Catholic Church on tetanus
vaccination to women. Most of data was collected from secondary source. The findings showed the main
reason for Catholic Church rejecting the vaccination is because it was a population control scheme by the
government, the vaccine was also viewed as important since it prevents neonatal tetanus in newborns, the
main bodies and institutions that supported the programme included the WHO, UNICEF and Ministry of
health. Finally, the government responded to this issue by forming a joint committee of experts to jointly
test the vaccines. More public awareness was needed and should be done in case there is a such
programme in future; key stakeholders from religious groups, private and public sectors need to be
incorporated in decision making process and the government could have used a different provider for
vaccines until the investigation got resolved.
Keywords: Tetanus, vaccine, women, Catholic Church, WHO and Kenya.

Proceedings of the Third International Research Conference held on 26th to 28th October, 2016 263
INTRODUCTION
Tetanus is a serious diseases caused by bacteria called Clostridium tetani. The disease causes painful
tightening of the muscles usually all over the body. Several vaccines are used to prevent tetanus among
children, adolescents, and adults including DTaP, Tdap, DT, and Td. Most cases occur in people who
were never vaccinated against the condition or didn't complete the entire vaccination schedule (Nutman et
al., 2004). People who inject illegal drugs are also at an increased risk. The tetanus vaccine was
developed in 1927 and became available in the United States in the 1940s. Its use resulted in a 95%
decrease in the rate of tetanus. It is on the World Health Organization's List of Essential Medicines, the
most important medications needed in a basic health system (Hurwitz, and Morgenstern, 2000).
According to IDRC reports, January 1993 tetanus vaccine works by convincing a woman’s body that a11
is unchanged when, in fact, an egg has been fertilized. After conception occurs, a woman produces a
hormone called human chorionic gonadotropin (HCG) that helps to prepare the uterus for pregnancy. The
prototype vaccine, made from HCG coupled to a biochemical carrier, neutralizes HCG by stimulating
antibodies against the hormone. Without HCG, the embryo can’t anchor in the uterus, making pregnancy
impossible. The biochemical makes the HCG immunologically visible to women’s immune system
(Broder et al., 2010). Government of Kenya through the ministry of health has been focusing on a mass
tetanus vaccination campaign for past years. This targeted women between 14 and 49 years with an aim
of protecting babies from neonatal tetanus, a case of pregnant mothers. Before the March and October
2014 mass tetanus vaccination campaign, the Catholic Church raised concerns about the safety of the
vaccine that was being used. This was informed by what had happened in Mexico, Nicaragua and
Philippines where WHO/UNICEF had conducted similar campaigns using tetanus toxoid impregnated
with beta HCG that causes production of antibodies against the natural HCG resulting in permanent
infertility (CDC 2013). In October 2014, reports from the Kenyan Catholic Doctors Association sent
shock waves around the world. They stated that 2-3 million girls and women of childbearing age had been
vaccinated with tetanus vaccinations containing the anti-fertility hormone HCG, rendering them infertile
(Catholic Herald). According to Elder, UNICEF spokesperson, the vaccine's manufacturer is Serum
Institute India, the manufacturer "pre-qualified by WHO to manufacture and supply vaccines." A Kenyan
regulatory body also "ensures registration and quality before use,".
Objectives
1. To analyze the reasons as to why Catholic Church in Kenya reject tetanus vaccine to women.
2. To determine impacts and challenges associated with tetanus vaccination to women and society.
3. To determine bodies and institutions that support and contribute to tetanus vaccination of women.
4. To access the Kenyan government response concerning the views brought by the Catholic Church on
tetanus vaccination to women.
METHODOLOGY
The data was collected from secondary sources from books, magazines, journals, articles both
published and unpublished. The report relies strongly from the Kenya ministry of health
documentaries, Kenyan Catholic Bishop and Kenyan Catholic Doctors Association reports.
RESULTS
Reasons for Rejection
Report by Dr. Ngare a member of the Kenyan Catholic Doctors Association. "The Catholic Church as the
name suggests has a foot print worldwide. When WHO conducted its first purported neonatal tetanus
eradication vaccination campaigns in South America using a fertility regulating vaccine, the population
most affected were Catholics. The Church has a strong institutional memory. In March 2014, we heard of
a neonatal tetanus campaign that was started in October the year before. All major health campaigns are
usually widely advertised and launched with much pomp and color in public. This particular campaign
was very secretive and a majority of Kenyans, including health personnel do not know about it even
today! This is what is causing the confusion when the Church states that the tetanus injection used in the
vaccination campaign is unsafe but the routine vaccine is safe! There was a claim also that the tetanus
immunization program run by WHO and UNICEF was a population control scheme.

Proceedings of the Third International Research Conference held on 26th to 28th October, 2016 264
The evidence Catholic Church gave was that the vaccine had beta-HCG in amounts sufficient to prevent
conception (Kenyan Catholic Bishop Report). They considered tetanus vaccine unnecessarily since no
“tetanus crisis in Kenya” had been declared. There was an argument also that the neonatal tetanus
vaccine, which is normally given to women of reproductive age, was being given to women in five doses,
rather than the usual two or three doses. This according to the Catholic Church leaders was really a plan
to make women sterile hence a way of reducing population (Grabenstein, 2013). They also argued that
there was no way the vaccine was offered mainly to women aged between 14 and 49 years leaving out
girls below 14 years, boys and men and why the tetanus was prioritized over other illnesses affecting
people in Kenya (Vernon, 2003).
Impacts and Challenges of Tetanus Vaccination
According to UNICEF’s Chief of communications for East Africa, the main aim of tetanus vaccination
campaign was to prevent neonatal tetanus in newborns that are the most vulnerable and bear the highest
burden of tetanus diseases. Vaccinating girls and women of child bearing age 14-49 years accords
protection to the women even if they deliver at home in unhygienic conditions (Clements and Griffiths,
2002). Boycotting the vaccination led to death of 550 Kenyan babies in the year 2013 (BBC NEWS
through the Kenya ministry of health) brought conflicts between the Kenyan government through the
ministry of health and also the Kenyan Catholic fraternity. The programme also faced some challenges
which included:
Inadequate access: Prevailing complex humanitarian emergencies, compounded by the lack of physical
access and increased insecurity make it difficult for health workers to reach populations, especially
women and children, with health services, including tetanus toxoid-containing vaccines.
Socio-demographic and cultural barriers for Tetanus vaccines: Women’s status in the society and
local culture play an important role in accessing reproductive health services, which results in a lack of
uptake of tetanus vaccine, as the service is provided through antenatal care and immunization platforms.
In some societies, women’s lack of decision-making power coupled with cultural barriers is hindrances to
availing themselves of maternal health services. The situation is made worse, because of socio-cultural
practices, women often are not allowed to visit health centers or access services if these are provided by
male health workers. Similarly, a study in India shows that poor women and women belonging to lower
castes of society are less likely to receive antenatal care including, tetanus vaccines (Larson, 2014).
Funding constraints: Although Kenya have developed plans to eliminate maternal and neonatal tetanus,
implementation of such plans is often delayed for lack of sufficient, predictable, and timely funding from
external and/or domestic sources (World Health Organization 2008).
Competing Priorities and Political Will MNT cases mostly occur in remote areas that lack vital registration systems or community surveillance,
resulting in cases and deaths not being systematically reported. As tetanus is no communicable, outbreaks
are rare and limited. The ensuing misperception leads to governments and donors giving a low level of
priority to the disease in favour of other visible priorities and diseases.
The AFIX Approach
A Assessment Evaluation of medical records to ascertain the immunization rate
for a defined group
F Feedback Provide reports concerning the outcome. Feedback creates the
awareness necessary for behavior change.
I Incentives Provide opportunities for partnership and collaboration and vary by
provider and stage of progress
X Exchange information Allows access to more experience, share of information between
providers to increase performance
SOURCE: Centers for Disease Control and Prevention Epidemiology and Prevention of Vaccine-
Preventable Diseases, 13th Edition

Proceedings of the Third International Research Conference held on 26th to 28th October, 2016 265
Bodies Supporting Tetanus Vaccination
World Health Organization (WHO), United Nations, and United Nations Children’s Emergency Fund
(UNICEF) sponsored the large-scale tetanus immunization program carried out in Kenya in the year
2014. Ministry of health in Kenya fully supported this exercise and after much criticism from the
Catholic Church, they presented tests conducted at the National Quality Control Laboratory that gave the
vaccine a clean bill of health (Daily Nation, Monday May 16 2016). The supporters and providers of
tetanus vaccination use AFIX Approach as a strategy for effective immunization and its outcome
Government Response
After ensuing public outcry and confusion, Kenya’s government through the Ministry of Health and the
Catholic Church formed a joint committee of experts to jointly test the vaccines. The Catholic Church
resubmitted their nine vials and the ministry had 50 such vials which they acquired as new samples from
the field and central store.
Laboratory Tests and Results A private Kenyan laboratory, AgriQ Kenya was used to test the 59 samples (50 from the Ministry of
Health, and 9 from the Catholic Church) with a method called High Performance Liquid
Chromatography. High Performance Liquid Chromatography separates components of a given mixture
using a pressurized liquid solvent and is commonly used to test hormones, poisons, and pesticides.
Suggested communication approaches for tetanus vaccine hesitant and refusing parents
Vaccine hesitant or delaying parents Refusing parents
Spend adequate time with child and parent
Ask permission to discuss concerns
Carefully elicit concerns and try to address each
one specifically
Accept concerns and try not to minimize or
dismiss them
Use a guiding style
Discuss disease and vaccine risks as well as
vaccine benefits
Communicate risks with words and numbers or
even simple graphics
Support discussions with downloadable
resources
Avoid overwhelming detailed scientific info
Offer another appointment if needed or
attendance at a specialist immunization clinic
Ask permission to discuss
Aim to keep discussion brief but leaving the
door open
Check importance of vaccines and confidence
Don’t dismiss concerns – acknowledge
Don’t overstate vaccine safety
Challenging firmly held philosophical,
religious or scientific beliefs unhelpful
Avoid overt confrontation and scientific ping
pong
Provide links to resources if wanted
Explore receptivity to a tailored schedule to
get them started – explain the risks
Offer another appointment when ready or
attendance at a specialist immunization clinic
Source: Australian Family physician
Of the 59 samples tested, 56 returned clean; the same 3 vials which had tested positive for Beta HCG
previously, returned positive again (Population Research Institute report). Although the presence of Beta
HCG in the three vials was undisputed, officials on both sides were concerned about how the Beta HCG
made its way into neonatal tetanus vaccines (Mathers et al., 2012). After the testing at the Kenyan
laboratory, the director of Medical Services, Nicholas Muragrui endorsed the tetanus programme, saying,
“the immunization campaign in Kenya is safe and the tetanus campaign should continue.” The Chairman
of the Kenya Conference of Catholic Bishops, John Cardinal Njue, issued a statement saying, “the
vaccines used for the mass tetanus vaccination campaigns in March and October 2014 contained some
vials laced with Beta HCG (Ottensmeier et al., 2009). It is worth noting that only the Catholic Church had
collected samples during the actual March and October 2014 tetanus vaccination campaigns. ”The
statement of the Kenya conference of catholic bishops concluded by saying, “We insist that no further
mass tetanus vaccination campaigns should be undertaken in Kenya before the vaccines have been

Proceedings of the Third International Research Conference held on 26th to 28th October, 2016 266
appropriately tested and proven to be safe.” The above statements made the public more confused and go
in dilemma on which route to follow.
CONCLUSION
Progress toward maternal and neonatal tetanus elimination has been the result of a combination of
strategies, both long- and short-term. However, a handful of countries, including countries with acute or
chronic humanitarian crises or with sociocultural barriers, are still to achieve the goal. The international
community has a shared responsibility in helping to achieve and sustain this global goal. With more
countries achieving maternal and neonatal tetanus elimination, efforts to sustain the achievement become
ever more important. Such efforts will not only affect the incidence of MNT, but have the potential to
reduce tetanus in the whole population, as well as other maternal and newborn infections. Despite the
challenges and criticism faced by the Kenyan government, it has played a key role in ensuring wellbeing
of both the child and mother across the nation.
RECOMMENDATIONS
1. More public awareness including health education was needed
2. There was a need to incorporate key stakeholders from religious groups, private and public sectors
3. Considering that three of the vials were confirmed by two labs to contain a sterilizing agent in the
supposedly simple neonatal tetanus shot, Kenya could have used a different provider for vaccines
until the investigation get resolved.
4. Quality assurance mechanisms on public health should be applied at all times.
REFERENCES
Basinga, P., Gertler, P. J., Binagwaho, A., Soucat, A. L., Sturdy, J., and Vermeersch, C. M. (2011). Effect
on maternal and child health services in Rwanda of payment to primary health-care providers for
performance: an impact evaluation. The Lancet, 377(9775), 1421-1428.
Burton, A., Monasch, R., Lautenbach, B., Gacic-Dobo, M., Neill, M., Karimov, R., and Birmingham, M.
(2009). WHO and UNICEF estimates of national infant immunization coverage: methods and
processes. Bulletin of the World Health Organization, 87(7), 535-541.
Castagnini, L., Healy, C., Rench, M., Wootton, S., Munoz, F., and Baker, C. 2012. Impact of maternal
postpartum tetanus and diphtheria toxoids and a cellular pertussis immunization on infant
pertussis infection. Clinical infectious diseases, 54(1):78-84.
Centers for Disease Control and Prevention. (2013). Noninfluenza vaccination coverage among adults-
United States, 2011. MMWR. Morbidity and mortality weekly report, 62(4), 66.
Clements, C. and Griffiths, E. 2002. The global impact of vaccines containing aluminum adjuvants.
Vaccine, 20, S24-S33.
Daniels, N. A., Juarbe, T., Rangel-Lugo, M., Moreno-John, G., and Pérez-Stable, E. J. (2004). Focus
group interviews on racial and ethnic attitudes regarding adult vaccinations. Journal of the
National Medical Association, 96(11):1455.
Englund, J., Anderson, E., Reed, G., Decker, M., Edwards, K., Pichichero, M. and Meade, B. (1995). The
effect of maternal antibody on the serologic response and the incidence of adverse reactions after
primary immunization with a cellular and whole-cell pertussis vaccines combined with diphtheria
and tetanus toxoids. Pediatrics, 96(3):580-584.
Grabenstein, J. D. (2013). What the World's religions teach, applied to vaccines and immune
globulins.Vaccine, 31(16):2011-2023.
Grangette, C., Müller-Alouf, H., Geoffroy, M.C., Goudercourt, D., Turneer, M., and Mercenier, A.
(2002). Protection against tetanus toxin after intragastric administration of two recombinant lactic
acid bacteria: impact of strain viability and in vivo persistence. Vaccine, 20:3304-3309.
Hurwitz, E. L., and Morgenstern, H. (2000). Effects of diphtheria-tetanus-pertussis or tetanus vaccination
on allergies and allergy-related respiratory symptoms among children and adolescents in the
United States. Journal of manipulative and physiological therapeutics, 23(2):81-90.
Larson, H. (2014). Underlying issues are key to dispelling vaccine doubts. World Health Organization
Marketing and Dissemination, GENEVA, 27.

Proceedings of the Third International Research Conference held on 26th to 28th October, 2016 267
Larson, H. J., Cooper, L. Z., Eskola, J., Katz, S. L., and Ratzan, S. (2011). Addressing the vaccine
confidence gap. The Lancet, 378(9790), 526-535.
Lim, S. S., Stein, D. B., Charrow, A., and Murray, C. J. (2008). Tracking progress towards universal
childhood immunization and the impact of global initiatives: a systematic analysis of three-dose
diphtheria, tetanus, and pertussis immunization coverage. The Lancet, 372(9655), 2031-2046.
Liu, L., Johnson, H. L., Cousens, S., Perin, J., Scott, S., Lawn, J. E., and Mathers, C. (2012). Global,
regional, and national causes of child mortality: an updated systematic analysis for 2010 with
time trends since 2000. The Lancet, 379(9832), 2151-2161.
Low, L., Mander, A., McCann, K., Dearnaley, D., Tjelle, T., Mathiesen, I. and Ottensmeier, C. H. (2009).
DNA vaccination with electroporation induces increased antibody responses in patients with
prostate cancer. Human gene therapy, 20(11), 1269-1278.
Nookala, S., Srinivasan, S., Kaliraj, P., Narayanan, R. B., and Nutman, T. B. (2004). Impairment of
tetanus-specific cellular and humoral responses following tetanus vaccination in human lymphatic
filariasis. Infection and immunity, 72(5), 2598-2604.
Schechter, N. L., Zempsky, W. T., Cohen, L. L., McGrath, P. J., McMurtry, C. M., and Bright, N. S.
(2007). Pain reduction during pediatric immunizations: evidence-based review and
recommendations. Pediatrics, 119(5), e1184-e1198.
Talbot, E. A., Brown, K. H., Kirkland, K. B., Baughman, A. L., Halperin, S. A., and Broder, K. R. (2010).
The safety of immunizing with tetanus–diphtheria–acellular pertussis vaccine (Tdap) less than 2
years following previous tetanus vaccination: experience during a mass vaccination campaign of
healthcare personnel during a respiratory illness outbreak. Vaccine, 28(50), 8001-8007.
Vernon, J.G. (2003). Immunisation policy: from compliance to concordance? Br J Gen Pract,
53(490):399-404.
WHO. (2008). WHO vaccine-preventable diseases: monitoring system: 2008 Global Summary.
CANNIBALIZATION OF VACATIONAL AND TECHNICAL EDUCATION THROUGH
CAREER COUNSELLING AT SECONDARY SCHOOL LEVEL
Muriu, S.M. and Gichuhi, D.
Department of Human Resource Development, Karatina University, P. O. Box 1957-10101, Karatina
Email: [email protected], [email protected]; 0722332381
ABSTRACT
Vocational and Technical Education forms a very key foundation in enabling a nation to achieve MDG
and SD. Kenya as a country highly depends on technical skills to achieve The Vision 2030 and
Sustainable Development Goals. This can only happen through proper and realistic career counseling
information provided by the counseling teachers at secondary school level. According to KCSE results
released every year, majority of the candidates score between grade C and D which are the requirement
for entrance at Diploma and Craft level. However, there has been a missing link between the nature of
careers counseling services offered at secondary school level due to expectations that majority will join
trainings at university levels thus ignoring students who are not higher performers. The objective behind
this study was to investigate the challenges faced by students in acquiring technical and vocational
education by establishing the level of career information with the student; the subject choice at secondary
school, establishing the nature of counseling offered and investigating the challenges encountered in
acquiring admissions in vocational and technical training institutes. Various career theories and models
that guide career choices formed foundation for the study. The study assumed a descriptive design where
qualitative and quantitative data was collected through questionnaires and interview. The target
population included form four leavers who scored grades D and C. Findings revealed that most
respondents had no career information on vocational and technical education in Kenya.
Key word: Career Counseling

Proceedings of the Third International Research Conference held on 26th to 28th October, 2016 268
INTRODUCTION
Kenya aspired to be a middle-income country by the year 2030 through the country’s blue print of The
Vision 2030 providing a high quality of life to all its citizens. Included in the Vision is the Social Pillar
which outlines the country’s education that aims at producing a well trained and skilled labour force at all
terminals levels of education that will enable the country achieve its aspirations (UNESCO, 1961: p. 4).
These sectors are; Agriculture, ICT, Manufacturing/Industry, Education and Finance. In manufacturing
the blueprint envisages a newly industrialized country, powered by a high-skilled workforce (GoK, 2005).
To get a skilled manpower envisioned; there has to be world class training and proper and deliberate
guidance. To be industrialized Sifuna (1992) argued that Kenya needs to have a pool of people with
vocational and technical skills to work in various sectors of the economy. There are various challenges
facing provision of technical and vocational education training in Kenya.
Aduda (2003) reckon that to begin with, career teachers have a bias against technical courses because
they believe that they are of low value than professional courses which promise a higher paying job as
well as a higher social status. For example his study revealed that one would rather be a teacher or a tout
than a carpenter or a mechanic. This is against the expectations of the concluded global Millennium
Development Goals (MDG) and the current Sustainable Development Goals (SDG). From the worldwide
perspective, there has been an observed positive relationship between the quality and quantity of human
capital in terms of skills and knowledge and development and growth in the world economies. Past
studies and reports by ILO associate mass knowledge and skills to economic growth and development of
a country. Mbwale (2004) reckon that development of a country depends on the developmental level of its
people. The objective behind the Social Pillar of The Kenya Vision 2030 therefore is to guide the nation
in the investing in the people of Kenya in order to be more productive through pursuance of the right
skills, careers and professions at various levels. The country has made big strides in the education sector
by offering Free Primary Education (FPE) since 2003 and Free Secondary Education (FSE) from 2008
with an aim that those students will ferry the country to attainment of improved quality of life for all
Kenyans. The transition rate has increased from 48.02% in 2009 to 79.41% in 2015.
This paper is a critical review of the effects of the career counseling services offered at the secondary
school level in Kenya. This is because as it has been observed by Aduda (2003) and Government of
Kenya (2005), there has been a great discrepancy between the country’s expectations and aspiration and
the reality on the ground and between the National budgetary allocation on education and the output.
Transition rate from primary level to secondary level has been growing gradually (GoK, 1999). Those
who progress to secondary level, majority end up scoring grade C and below.
The study explored the short comings or biasness introduced by secondary school career counselors or the
counseling services based on the fact that majority of the students do not end up pursuing university
education (Nyarangi, 2011). Good career counseling should be based on facts. This fact notwithstanding,
the main focus of many counselors is concentrated on the higher achievers ignoring the masses yet a very
small percentage end up scoring the minimum university requirements.
As noted during selection of subject at Form Two, the students are required to select between sciences
and art based subjects, school counselor advice the students to choose “easy” and art based subjects at the
expense of sciences especially Physics which is assumed to be difficult for average students. This is done
without considering that the science subjects form the foundation for most vocational and technical
courses area where the bulk of students belong. This results to wrong choices of subjects’ where students
are encouraged to choose boosters subjects which do not prepare them for any future careers based on
their final performance. Career guidance should be balanced or skewed towards the majority who end up
pursuing careers in vocation and technical education where majority of the courses are science based
(Gibson and Mitchell, 2008).
A study by Ayiah-Mensah (2014) noted that technical and vocational education prepares an individual for
self reliance and that this type of educations is among the key essential tools an individual can use to
develop him or herself as well as the community. For a country whose population growth is faster than

Proceedings of the Third International Research Conference held on 26th to 28th October, 2016 269
the economic growth, technical and vocational education should be the interest of end result. This is
because it provides educational training for useful employment in trade, agriculture, industries,
homemaking and business which is the foundation through which economic growth and development is
based (Republic of Kenya, 2014). Basically, technical and vocational training or courses aimed at
strengthening the skills base of an individual for production of goods and services.
Statement of the Problem
The country’s’ human potential can only be unleashed through proper career information provided
through career counseling service in the education process. This can best be done at secondary school
level since the learners are mature enough to understand career world unlike the primary school. In
Kenya, this has been a challenge that has lingered for a long time and has affected students in their career
choice later in life as they leave school without proper guidance. The nature of the counseling offered
concentrate more on the students who are presumed likely to join university ignoring majority of the
students’ population. The problem is even compounded by the fact that most of the Vocational and
Technical Education offers courses that are science based including physics yet most students failed to
select the subject due to biased in career counseling. This paper is an argument against the current career
counseling base on past records.
Study Objective
To establish the impact of career counseling services at Secondary school level in Kenya.
LITERATURE REVIEW
Career guidance and development (CD) is a “continuous lifelong process of developmental experiences
that focuses on seeking, obtaining and processing information about self, occupational and educational
alternatives, life styles and role options” (Sang, Muthaa and Mbugua, 2012). Career guidance can only
flourish in an environment where proper career guidance has laid good foundation during school life. It
can also be explained as the process through which people come to understand themselves as they relate
to the world of work and their role in it.
Career development is where an individual fashions a work identity and prepares accordingly. In the
world, people are what they do, thus career becomes a person’s identity. It is imperative therefore that
when educating young people that our school systems assist and consider the significance of this
responsibility for the youth and their future. The influences and outcomes of career choice and
development are one aspect of socialization as part of a broader process of human development.
Career guidance and counseling in the western world, most notably in the United States (USA), has
developed a comprehensive system of theories and intervention strategies in its more than 100 years of
history. It began in the years of Frank Parson as a trait-factor approach in the early twentieth century and
slowly evolved to become a rather mature discipline today in the twenty-first century with a strong
theoretical and empirical base, with the potential to further develop into a more “global” discipline in the
years ahead. Indeed, vocational and career related issues are salient across different cultures and
nationalities. In an age of economic globalization, all individuals are affected by an array of work related
concerns, some of these concerns are unique to certain cultures, but others are common to many cultural
groups. The search for life purposes and meanings, the journey to actualize oneself through various life
and work related roles, and efforts by nations to deal with problems of employment and unemployment,
are examples of universal issues that seem to affect many individuals from diverse cultures.
Career counseling or career guidance includes a wide variety of professional activities which help people
deal with career-related challenges. The teacher responsible plays a great role in shaping the direction that
young people take. This is because career counselors work with adolescents seeking to explore career
options, experienced professionals contemplating a career change, parents who want to return to the world
of work after taking time to raise a child, or people seeking employment. Career counseling is offered in
various settings, including in groups and individually, in person or by means of digital communication.

Proceedings of the Third International Research Conference held on 26th to 28th October, 2016 270
Holland's Theory Career Choice
This theory premise that in our culture, most people are one of six personality types: Realistic,
Investigative, Artistic, Social, Enterprising, and Conventional. Some refer to these as Holland Codes or
RIASEC. People of the same personality type working together create a work environment that fits their
type. For example, when Artistic persons are together on a job, they create a work environment that
rewards creative thinking and behavior an Artistic environment. There are six basic types of work
environments: Realistic, Investigative, Artistic, Social, Enterprising, Conventional. "Work" includes
doing things to achieve a purpose, like paid and unpaid jobs, volunteering, sports, or hobbies.
People search for environments where they can use their skills and abilities and express their values and
attitudes. For example, Investigative types search for Investigative environments; Artistic types look for
Artistic environments, and so forth. People who choose to work in an environment similar to their
personality type are more likely to be successful and satisfied. For example, Artistic people are more
likely to be successful and satisfied if they choose a job that has an Artistic environment, like choosing to
be a dance teacher in a dancing school an environment "dominated" by Artistic type people where
creative abilities and expression are highly valued.
Figure 1: Personality and Careers
Careers are determined by an interaction between our personality and the environment in John Holland's
Theory of Career Choice. We want jobs with people like us. John Holland's Theory of Career Choice
(RIASEC) maintains that in choosing a career, people prefer jobs where they can be around others who
are like them. They search for environments that will let them use their skills and abilities, and express
their attitudes and values, while taking on enjoyable problems and roles. Behavior is determined by an
interaction between personality and environment.
Parsons' Theory
Frank Parsons developed the idea of matching careers to talents, skills and personality. People perform
best when they are in jobs best suited to their abilities. Frank Parsons is regarded as the founder of the
vocational guidance movement. He developed the talent-matching approach, which was later developed
into the Trait and Factor Theory of Occupational Choice. At the centre of Parsons' theory is the concept of
matching; an accurate understanding of their individual traits (aptitudes, interests, personal abilities), a
knowledge of jobs and the labour market and rational and objective judgment about the relationship
between their individual traits, and the labour market. This three-part theory still governs most current
practice. The trait and factor theory operates under the premise that it is possible to measure both
individual talents and the attributes required in particular jobs. It also assumes that people may be
matched to an occupation that's a good fit. Parsons suggests that when individuals are in jobs best suited
to their abilities they perform best and their productivity is highest.
In his book, 'Choosing a Vocation', Parsons maintains that personal counsel is fundamental to the career
search. In particular, he notes seven stages for a career counselor to work through with clients: Personal
data: create a statement of key facts about the person, remembering to include every fact that has bearing
on the vocational problem. Self-analysis: Self-examination is done in private and under the instruction of
the counselor. Every tendency and interest that might impact on the choice of a life work should be
recorded. The client’s own choice and decision: this may show itself in the first two stages. The counselor
must bear in mind that the choice of vocation should be made by the client, with the counselor acting as

Proceedings of the Third International Research Conference held on 26th to 28th October, 2016 271
guide. Counselors’ analysis: the counselor tests the client’s decision to see if it is in line with the “main
quest”. Outlook on the vocational field: the counselor should be familiar with industrial knowledge such
as lists and classifications of industries and vocations, in addition to locations of training and
apprenticeships. Induction and advice: a broad-minded attitude coupled with logical and clear reasoning is
critical at this stage. General helpfulness: the counselor helps the client to fit into the chosen work, and to
reflect on the decision. Much of Parsons’ work still guides career counseling today, though it is not
without criticism. Matching assumes a degree of stability within the labour market. However, the reality
is that the market’s volatility means individuals must be prepared to change and adapt to their
circumstances. These theories not withstanding career counselors in Kenya are not guided by any theory
but base their counseling on the premise that all secondary school students will end up in universities thus
skewing their information towards that end.
Independent Variables Dependent Variable
Figure 2: Conceptual Framework
Empirical Review
The Ministry of Education highly depends on career counselors to support and guide secondary schools
students with career-related information. Through their expertise in career development and labor
markets, they are expected to put a person's potential, attitudes, qualifications, experience, strengths and
weakness in a broad perspective while also considering their personal hobbies and interests, location, job
market and educational possibilities (Mbwale, 2004). Through their counseling and teaching abilities,
career counselors can additionally support people in gaining a better understanding of what really matters
for them personally, how they can plan their careers autonomously, or help them in making tough
decisions and getting through times of crisis. However, Ayiah-Mensah (2014) noted that most of them
concentrate on the few who perform well academically. This implies that majority of the students are not
exposed to information relevant to their aspirations and potentials (Aduda, 2003). At the subject selection
for example, the assumption is that all will go to university hence select subject without considering
anything. According to policy makers in many countries, career guidance and counseling forms the bases
through which human resource capital can be improved. However due to skewed and bias approach, they
have caused death to many through poor guidance in subjects and career selection
The Gap
One of the major challenges associated with career counseling is encouraging participants to engage in
the process. In Kenyan scenario, career counselors take the whole and assume that the students are
ignorant on the choices. In the UK also, 70% of people under 14 say they have had no careers advice
while 45% of people over 14 have had no or very poor/limited advice. Furthermore, it is recognized that
the giving of career advice is something that is widely spread through a range of formal and informal
roles. In addition to career counselors it is also common for psychologists, teachers, managers, trainers
and Human Resources (HR) specialists to give formal support in career choices. Similarly it is also
common for people to seek informal support from friends and family around their career choices and to
bypass career professionals altogether. Today increasingly people rely on career web portals to seek
advice on resume writing and handling interviews; as also to research on various professions and
companies. It has even become possible to take vocational assessments online.
Career Guidance
Right information
Subject selection
Student’s Potential
Improvement in subject
selection and Vocational and
Technical Education

Proceedings of the Third International Research Conference held on 26th to 28th October, 2016 272
METHODOLOGY
The study was guided by positivist philosophy because it heavily depended on the quantitative data
collected from existing records. The research design was descriptive and tried to get interpretations from
the data that exist from 2009 to 2015 on KCPE and KCSE exams results and the impact to the economy.
Data was summarized in tables and percentages and then presented in figures and chart followed by
discussion and interpretation.
RESULTS AND DISCUSSION
Career counseling takes place at secondary school level. Table 1.1 indicates the trend from 2009 to 2015.
These findings comprises of the number of candidates who successfully transits from primary level of
education to secondary level. The information is also presented in the figure below.
Table 1.2. Transitions from primary to secondary
Year No. sat for KCPE Admitted to F1 %
2009 708,600 340,256 48.02
2010 746,080 360,058 48.26
2011 776,216 416,900 53.71
2012 811,930 489,900 60.34
2013 839,759 521,601 62.11
2014 889,163 566,711 63.74
2015 925,744 735, 094 79.41
Total 5,697,492
0
200000
400000
600000
800000
1000000
2009 2010 2011 2012 2013 2014 2015
708600 746080 776216 811930 839759889163 925744
340256 360058416900
489900 521601566711
735094
No. Sat KCpE Adm to Form 1
Figure 3: Transition from primary to secondary
Table 1.3: No. sat for KCPE and those who missed Form 1 selection
Year No. sat for KCPE Missed F1 %
2009 708,600 368,344 51.98
2010 746,080 386,022 51.74
2011 776,216 359,316 46.29
2012 811,930 322,030 39.66
2013 839,759 318,138 37.99
2014 889,163 322,452 36.26
2015 925,744 190,650 20.59
Total 5,697,492 2,266,952

Proceedings of the Third International Research Conference held on 26th to 28th October, 2016 273
Table 1.3 indicates that the number of candidates with KCPE certificate that has missed form 1 admission
has been declining. This is a very positive direction since it is according to the Government aspirations
and dream for the free primary and secondary school.
Figure 4 above indicates the number of candidates who sat for KCPE and missed form one. It is clear that
the transition rate has been on the increase implying that Free Secondary School is bearing fruits. In the
year 2015, out of 925,744 candidates, only 190,650 missed form One which translate to 79.41%. These
findings depict that majority of the student got access to career counseling services which is offered at
secondary school level.
Table 1.4 indicates the number of candidates who sat for KCPE at primary level and transited to
secondary school. As noted from the figures, transition rate has been increasing over the years where it
has gradually progressed from 48.02 % in 2009 to 79.41% in 2015. These findings implies that in the year
2009, more than half of the students failed to join secondary school which has a very negative impact in
the economy because results to a pool of citizen without skills and training. Within the last seven years
2009 to 2015, a total of 2,266,952 out of 5,697,492 KCPE candidates failed to join secondary school and
either joined Village polytechnics for Vocational and Technical Education, learnt the job on the job or
joined the economy with no specialized skill. This translates to 39.79%. The productivity and quality
from this group is very low due to lack of knowledge and skills therefore hindering the country from
attaining her vision. Most of these candidates had not even been prepared to join Village Polytechnic for
skills development because the career counseling services are concentrated at secondary level.
0
200000
400000
600000
800000
1000000
2009 2010 2011 2012 2013 2014 2015
368344386022359316322030318138322452
190650
No. Sat fro KCPE Missed Form 1
Figure 4: Candidate who sat for KCSE and missed Form 1 admission
KCPE and KCSE Results, 2009-2015
Table 1.2 below indicates the number of candidates who completed KCPE between 2009 and 2015 and
followed through the thereby completing KCSE between 2013 and 2015. Results indicate that in 2009, a
total of 708 600 candidates sat for KCPE out of which 446, 696 completed secondary school with KCSE
in the year 2013. Further analysis of the results indicated that the percentage of those who scored C+ and
above was 17.40% and 27.61% of the KCPE and KCSE total candidature levels respectively. This implies
that 82.60% or 585,304 of candidates although completed secondary school did not qualify with the
minimum C+ to join higher education at university but resulted to furthering their education through
vocational or technical education. It is important to note that the government only sponsors a small
number of those who score C+ and above implying that the number of candidates who pursue vocational
and technical education is higher. This follows for the other years of 2010 and 2011 with slight variations.
With critical review of these findings, it is important to critically analyze the career counseling services
offered to secondary school students. Of interest are the conditions, nature, and general career
information given to students by career counseling teachers at secondary school level. According to

Proceedings of the Third International Research Conference held on 26th to 28th October, 2016 274
reviewed studies by Masinde (2003) and Waudo (2001) Kenya approaches to career guidance is highly
skewed and concentrates on a very small percentage of the population. This is because the education
system is competition based there by concentrating on the areas which produce fast results but kills the
important and long lasting results. Nugent and Jones (2005) reckon that majority of the students and
school leavers are totally ignored on career information or are provided with the wrong information that
does not fit them. This results in high percentage of citizens with no skills and training at higher levels.
It was noted during the release of KCSE 2015 results that only 28.63% of the candidates scored grade C
plus (C+) and above. This implies that 71.37% of the candidates did not qualify to join university thereby
ended up furthering their trainings in Vocational and Technical Education. Though this is the case but
during their four years course the counselors concentrated with the 28.63% perspective and majority of
the students were ignored.
Table 1.4: KCPE and KCSE Results, 2009-2015
Year KCPE KCSE C+ and
above
% of C+ at
KCSE
% C+ at
KCPE
% of C and
below
2009 708,600 446,696 (2013) 123,365 27.61 17.40 82.60
2010 746,080 483,630 (2014) 165,776 34.28 22.21 77.79
2011 776,216 522,870 (2015) 149,717 28.63 19.29 80.71
Total 2,230,896 1,453,196 438, 856 30.20 19.67 80.33
Extracted from KNEC: KCSE Results (2013-2015)
Out of 2,230,896 candidates who sat for KCPE between 2009 and 2011, 438,856 scored a grade of C+
and above which translates to 19.67%. Although the teacher counselors concentrated and aimed at
university trainings, the reality is that 80.33% of the candidates had to pursue further education through
vocational and technical areas. These results are presented in Figure 1.
0
200000
400000
600000
800000
2009 2010 2011
708600 746080 779216
123365 165776 149717
Sat for KCPE C+ abd Above
Figure 5: Performance of C+ and above; KCPE, KCSE
Data available from the Kenya National Examination Council (KNEC) indicate that only 30% of the
candidates attain grade C+ and above in 2013-2015, which is the minimum qualifying grade for
university entry. These are further categorized in overall points of 58 and 60 for girls and boys
respectively. This finally implies that only about 15 % of the candidates at KCSE level are admitted to
pursue courses at university level. Among those admitted very few are admitted to the professions or
careers of their choice as noted by the frequency of changes done by students on admission within and
across universities. This implies that less than 10% of the school leavers end up with professions of their
choice. Of great concern is the number of those who do not make to university UNESCO (2002). These
results notwithstanding, career counseling at secondary school level has been noted to be skewed toward
the minority for the entry level and subject choices.

Proceedings of the Third International Research Conference held on 26th to 28th October, 2016 275
Kenya Institute of Highways and Building Technology (KIHBT) intakes
Kenya Institute of Highways and Building Technology is a Government Training Institution in the
Ministry of Transport and Infrastructure that specializes on trainings in engineering related courses such
as Civil Engineering, Mechanical engineering, Electrical Engineering, Building Construction,
Architecture at Certificate, Diploma and Higher Diploma levels. The graduates are absorbed by the
economy at different levels as technicians and technologists in construction and related fields.
Sat for KCSE2
C+ and Above0
200000
400000
600000
20132014
2015
446696 483630 522870
123365 165776149777
Sat for KCSE2 C+ and Above
Figure 6: Those who sat for KCSE and scored C+ and above
Table 1.5 presents the data collected from the existing records in the institute on number admitted to
pursue the offered technical education at diploma and craft certificate levels between year 2011 and 2015.
This data excluded those candidates who were not admitted where the major cause for failure to be
admitted was poor performance in Mathematics and Sciences. Failure to select physics at secondary
school level was also used as a method to limit admission. The table also presents the subject selection at
secondary school. It emerged that although most of the students ended up pursuing technical education,
they had not laid good foundation in the relevant subjects at secondary school level (Carnoy, 2007).
However, on further scrutinizing records subject choice at secondary level, data revealed that out of 5,090
admitted between 2011 and 2015, only 1,260 students had firm technical foundation laid by the three
science subjects at secondary school (Physics, Biology and Chemistry). This translates to 24.75% of the
candidates admitted. The others (75.25%) had pursued two humanity subjects at secondary school level
with the premise that the subjects could boost their grades and finally enabling them to join higher
training at university level. This depicts clearly that during subject selection which is done at Form 2;
these students were misguided or not given the right information based on their actual potential (Obonyo,
1994). The counselor teachers concentrated on the few who scored C+ and above which resulted to
skewed approach.
Table 1.5. Admissions and subject selection
Year Admitted Those with 3 Sciences at KCSE Level %
2011 867 184 21.22
2012 976 223 22.84
2013 1004 257 25.59
2014 1084 287 26.48
2015 1159 309 26.67
Total 5,090 1,260 24.75
Figure 7 further demonstrates the number of students admitted in the institute and their subject selection
at secondary school level. It is very clear that although the students ended pursuing engineering related

Proceedings of the Third International Research Conference held on 26th to 28th October, 2016 276
courses at diploma and craft certificate levels, they had not prepared at secondary school level through
subject selection. This correlates with findings by Mbale (2004) who argued that high school students
should be provided with right career information.
0
200
400
600
800
1000
1200
1400
2011 2012 2013 2014 2015
Total Admitted 3 Sciences as KCSE
Figure 7: Admission and subject selection
SUMMARY
From the data, findings and discussions presented, it can be summarized and concluded that there is a
challenge in the way information is given to students at secondary school level by career guidance and
counselors. Career information given to the students cannot prepare the kind of citizens that the country
require to enable the country achieve the aspired Vision 2030. Instead of students being supplied with the
right information, they are given the wrong or no information concerning careers.
RECOMMENDATIONS
For the education system to achieve its objectives by preparing the citizens to right careers that will
enable them contribute in the economy there is need to overhaul the students’ career services at secondary
school level. Career counseling should also be totally overhauled and separated from the other forms of
counseling and students guidance be based on their potential and talents. It is also recommended that
career guidance professionals should be engaged by the Ministry of Education to handle the matters of
students’ career choice. Professional from all fields of the economy should be engaged in relaying career
information instead of leaving the whole burden to the counselor teacher and school administration which
concentrate on raising school’s mean grade at the expense of students’ lives.
REFERENCES
Aduda, D. (2003) Technical training Reeling under Neglect. Daily Nation, 2 June 2003, p.11
Carnoy. M., (1977) Education and Employment; A critical Analysis. Paris, UNESCO, P. 7
Gall, M. D., Borg, W. R., and Gall, J. P. (1996). Education research: An introduction. NY: Longman
Gibson R. L, and Mitchell M. (2008). Introduction to Counselling and Guidance. New Jersey: Pearson
Government of Kenya. (1981). Report of the presidential working party on the establishment of the
Second University. Nairobi: Government Printer.
Government of Kenya. (1999). Report of the totally integrated quality education and training, TIQET:
Report of the Commission of Inquiry into the Education System of Kenya. Contributor. Koech, D. K.
Nairobi, Kenya.
Government of Kenya (2005). Kenya Education Sector Support Programme (KESSP) 2005-2010:
Delivering Quality Education and Training to all Kenyans. Nairobi: Government Printer.

Proceedings of the Third International Research Conference held on 26th to 28th October, 2016 277
Masinde M. (2003); Problems Facing Students at Kenya Polytechnic. Unpublished Personal Research.
Mbwale, S.V. 2004. Career choice: a challenge for high school students . Master of Arts (Industrial
Psychology) Thesis. University of Namibia, http://repository.unam.edu.na/handle/11070/1621.
Naim, J. Trait/Factor, Theory. Guidance Practice – Matching Theories. National Guidance Research
Forum. Institute for Employment Research. Available at: www.guidance-research.org.
Nugent F. and Jones K.D. 2005. Introduction to the Profession of Counseling. Upper Saddle River NJ.
Nyarangi, A. E. and Nyaundi, O. (2011); Challenges facing effective implementation of guidance and
counselling programmes in selected institutes of technology in Nyanza Province, Kenya, Egerton
University, Unpublished.
Obonyo. M.M, (1994). Educational and career expectations of form three Yemit at Yemit and Khwisero
mixed schools in Khwisero District. Unpublished MEd Thesis Kenyatta University.
Orenge, E. N. 2011. The status of career guidance and counseling programmes for students in public
secondary schools in Nairobi Province. Kenyatta University, Master’s Degree Thesis.
Parsons, F. 2007. Choosing a Vocation. Boston: Houghton Mifflin. 165 pp. Available at:
www.leonardoevangelista.it.
Republic of Kenya, (2004). Press statement on release of 2013 KCSE Examinations by the Minister of
Education. https://www.standardmedia.co.ke/article/2000105981/kaimenyi-s-speech-on-the-release-
of-2013-kcse-exam-results.
Sang, A., Muthaa, G., and Mbugua, Z. February 2012. Challenges Facing Technical Training in Kenya.
Creative Education, 3(1):109-113.
Sifuna, D. N. (1992). Pre-vocational subjects in primary schools in the 8-4-4-education system in Kenya.
International Journal of Educational Development 12: 133-145.
UNESCO. (1961). Final report, Conference of African States on the Development of Education in Africa.
Addis Ababa, 15-25 May 1961.
UNESCO. 2002. Handbook on Career Counseling, UNESCO7, Place de Fontenoy, 75352, Paris 07SP
Waudo, J. (2001). A study of the Factors Affecting Teachers Implementation of Guidance and Counseling
in Public Primary Schools in Makadara Division. Unpublished Master’s Thesis, University of
Nairobi. *****
INFLUENCE OF RELIGIOUS EDUCATION TEACHING ON CHARACTER DEVELOPMENT
AMONG STUDENTS IN SECONDARY SCHOOLS: A CASE STUDY OF KIRINYAGA
COUNTY, KENYA
Mune, C.W.
Department of Educational Foundations, P. O. Box 83844-00100, Kenyatta University, Kenya Tel.: +254720764200. Email: [email protected]
ABSTRACT
The scenario in which irrational behavior has dominated the character of the Kenyan youth has brought to
contention whether the moral well-being of the youth is on a downward trend suggesting that either the
teaching of moral values through C.R.E is defective or the Kenyan education system as a whole is
defective. The moral character of the Kenyan secondary school student in the wider society has become
an issue of concern in the recent past. Previous research reported that Kenyan students’ moral standing
and general conduct in the wider society reflects lack of acquisition of skills necessary to deal with
challenges in the current society. Little attention has been given to the correlation between the teaching-
learning of CRE and acquisition of requisite skills. It’s against this background that the researcher
investigated the influence of religious education on character development among students. The study
was guided by Kohlberg's theory of moral reasoning which has strong implication to moral education.
Descriptive survey design was used to conduct the research using ten schools, ten CRE teachers and 380
CRE students in the sampled schools. Information was collected by use of questionnaires and interview.
Data was analyzed using frequency distribution tables, percentages, and bar graphs. Findings revealed
that teachers rarely used the elements of skill acquisition in delivery of the content that could enable the
learner make accurate moral decisions. Also, the curriculum and the syllabus guides do not elaborate on
the elements of moral values teachers ought to use during C.R.E content delivery. For CRE teaching to be

Proceedings of the Third International Research Conference held on 26th to 28th October, 2016 278
to be productive to an individual, the syllabus must be organized into a logical whole. This calls for
systematic instruction in an organized system such as a school where youths are taught to think rationally.
Keywords: Defective, Irrational behaviors, Moral values, Moral standing
INTRODUCTION
Relationship between the Teaching of CRE and Character Development
Many students in the current society are entering school without the basic values necessary for life
challenges. Depressing reports of students’ cheating in national examinations, lack of self-discipline
resulting to school unrests, drugs and substance abuse among others and a lackluster approach to
schoolwork are common (Ryan and Bohlin, 1999). There has been a trend in public schools to relinquish
the role of building character, perhaps due to lack of basic moral principles in the subjects taught.
According to Covey (1989), there is a shifting of paradigms from a concern for a person’s personality to a
concern for a person’s character. Today’s young people are living in an exciting time, with an
increasingly diverse and mobile society, new technologies and expanding opportunities. To help ensure
that they are prepared to become the next generation of parents, workers, leaders and citizens who are
morally sound and accountable in their actions, they need well thought out support, guidance and teaching
on good morals. CRE subject needs to be made more learner-centered, to accelerate the learning of moral
skills. The main goal of education is to educate people intellectually and to teach them to be morally
good. Field (1996) noted that character education changed when value clarification, moral dilemma
discussions, and decision-making processes replaced the traditional emphasis on learning right from
wrong and acting right. These programs failed to distinguish between the personal preferences of students
and true moral values. In the society today, Religious Education is considered key in shaping the moral
and spiritual life of learners. In Kenya, the Christian Religious Education (CRE) curriculum is taught in
all schools alongside Muslim and Hindu Religious Education that has been approved by the Ministry of
Education (Education Act, CAP, 211).
One of the stated aims of education in Kenya is to promote social justice and morality by instilling the
right attitude necessary for the training in social obligations and responsibilities among the youth
(Republic of Kenya, 1999). The presupposition has been that the teaching of C.R.E is a critical
component that enables the school going youth to acquire the above. To achieve this, it is necessary that
the nation must ensure that pedagogical practices in education are geared towards realizing this aim.
According to Mcphail (1982), the teaching of morals in school has become a serious concern in the world
due to the increasing evidence of socially and morally irresponsible behavior on the part of the
individuals. There is a moral crisis in the world which makes it clear that schools should not avoid the
responsibility of teaching in the area of moral education Gay (1975. Education is a necessary driver of
morality. Education must be based on moral and spiritual foundations for it to be fruitful and effective.
According to Kombo (2005), Religious Education enables students acquire the desired beliefs, values and
practices of the society which enable them to live in harmony with other members of the society. Harding
(2005) states that Religious Education should facilitate desirable changes in an individual since it
encompasses theoretical, practical, moral, spiritual, human and divine aspects. Teaching religion in
schools encourages children to be responsible and spiritually sound adults. According to Eric (1994)
one’s education cannot be complete without a study of religion and its relationship to the advanced
civilization. Religious education is, therefore, important in any education system. According to Chesaro
(2003), CRE fulfills this by inculcating a positive attitude in the learner about God, self, others and the
environment we live in. This, he notes, helps children to grow into self- disciplined, self- reliant and
integrated citizens. Barret et al (1973) argue that RE contributes to the production of good citizens
through character building and fostering high moral standards. This prepares the learners to take their
rightful place in the society. Ochard (2008) similarly observes that the society does not need an education
that prepares learners only for academic excellence and demonstration of skills. Rather the society needs
an education that makes learners morally equipped for useful and purposeful services to themselves, the
nation and to live in manner required by God. Religious and moral education therefore becomes important
in the secondary school curriculum.

Proceedings of the Third International Research Conference held on 26th to 28th October, 2016 279
Religious Education in Africa could be traced long before the coming of Christian missionaries who
termed Africans as heathens and uncivilized .Mbiti (1969), observed religion as the strongest element in
the traditional background that exerted the greatest influence upon the living and the people concerned.
Religious teachings have been regarded as the vehicle by which moral standards were inculcated in Africa
(Amugune, 2005). Mbiti (1969) further notes that religious education bore the responsibility of
inculcating in each generation those forms of knowledge, values and attitudes which the society needed in
order to prosper. He further observes that religion provides mankind with moral values by which to live.
Chesaro (2003) supports this when he notes that no society can exist without morals and discipline for its
welfare and that of the individual. He observes that it was morals which build relationships between
people and the world around. Therefore, CRE is an effective regulator of the children’s behavior and act
as a channel through which the moral demands of the society are conveyed to the child for it is a strong
instrument in instilling discipline among students.
In Kenya, the role of education in the development of good character and the formation of high moral
standards among the youth through school is a strong educational goal (Oanda, 1995). Indeed, one of the
goals of education has been to promote sound moral and religious values (KIE, 2006). Lantos (2001)
observes that character education is accomplished by teachers and parents striving to be good role models
to the students. Adeyemi (2009) argues that the influence of the teachers and parents on students shape
student behavior in the society. Students often look upon their parents and teachers as role models on
matters of unity, honesty, justice and fairness, responsibility, caring, respect and trustworthiness. The
school authorities also have a role to play in shaping the character of students and especially the
enhancement of unity as a value among the students.
Cox (1983) noted that teachers of religious education should have a religious commitment so as to handle
the diverse materials in the syllabus. This is because religion is still the major source of normative
orientation in the modern society (Tritter and Francis, 1992). In a study by Ziro (2002) on students’
unrests, it was established that a genuine and purposeful commitment to the teaching of religious values
could foster human moral values, which are elements of self- discipline. Events of school unrests and
general indiscipline in secondary schools seem to negate the objectives of teaching CRE in secondary
schools in Kenya. This called for filling a research gap arising from the need to investigate and influence
of religious education in character development to secondary school learners. This study filled the gap by
answering the question: what is the role of CRE in inculcating moral values to students in secondary
schools Kirinyaga County.
Rationale for the Study
Today, there is renewed consensus concerning core values that transcends cultural, political, and religious
boundaries. These core values comprise the basis of modern character education. Respect, compassion,
responsibility, honesty, integrity, and fairness are the building blocks of character education programs that
are emerging across the nation. This new character education movement is based on the belief that the
violent, dishonest, irresponsible, and destructive behavior of today’s youth is the result of the absence of
good character. Character education is more than banners, slogans, and words on the school’s marquee
sign. Reading stories with moral, writing essays on the heroes, reciting slogans, and role-playing are all
fine, but they will not necessarily change a student’s behavior.
Lickona (1992) stated that schools need to do more than concentrate on the cognitive side of character. He
reported that schools need to bring students to the emotional side of character, where they feel and
commit to virtuous behavior, and to the action side of character, where students change inappropriate
behaviors and practice positive moral actions. Wynne argued that many educators have placed too much
emphasis on how students reason about moral issues rather than how they conduct themselves. What and
how students think clearly influences that person’s character; however, the measuring rod of society is not
what or how people think, but how they conduct themselves. A student is judged by whether he or she is
polite, whether he or she tells the truth, whether he or she observes the rules, and whether he or she is
respectful to teachers and fellow students. Wynne (1988) stated that many schools teach character directly
and have developed curricula and set aside class time to focus on issues of character. Although these

Proceedings of the Third International Research Conference held on 26th to 28th October, 2016 280
programs may occasionally be beneficial, he argued that it is far more important that the teachers and
entire school carry out activities designed to build character. Further, he stated that the overall conduct of
the adults and students in the school should reflect a concern for character and that this concern should be
interwoven throughout the school program hence the need to assess the role of Christian religious
education on character development among secondary school learners. In Kenya, the role of education in
the development of good character and the formation of high moral standards among the youth through
school is a strong educational goal (Oanda, 1995). Indeed, one of the goals of education has been to
promote sound moral and religious values (KIE, 2006). According to Chesaro (2003), CRE seeks to fulfill
this by inculcating a positive attitude in the learner about God, self, others and the environment we live in.
This, he notes, helps children to grow into self- disciplined, self- reliant and integrated citizens. Barret et
al (1973) argue that RE contributes to the production of good citizens through character building and
fostering high moral standards. This prepares the learners to take their rightful place in the society.
Ochard (2008) similarly observes that the society does not need an education that prepares learners only
for academic excellence and demonstration of skills. Rather the society needs an education that makes
learners morally equipped for useful and purposeful services to themselves, the nation and to live in
manner required by God. Religious and moral education therefore becomes important in the secondary
school curriculum.
Theoretical Framework
In 1966, Lawrence Kohlberg linked his cognitive-development theory of moral reasoning with the
practice of moral education in schools (Leming, 1993). According to Mulkey (1997), Kohlberg’s theory
was based on six stages of moral reasoning, whereby children could move from their present level of
moral reasoning to the next higher stage through discussion about the behavior chosen in a particular
situation. In the first stage, children are guided by rewards and punishment. As they move to the second
stage, reciprocity becomes prominent and children will do things for others if they get something in
return. At stage three, the child’s behavior is controlled by adult or peer approval. At the fourth stage of
moral reasoning, behavior is based on respect for authority. Moving to the fifth stage, what is right is
determined by the child’s personal values and opinion. Finally, at the highest stage, the child’s conscience
determines what is right and wrong. Here, respect for individual life and human dignity are guiding
principles. Kohlberg theory of moral reasoning applies to this study in that Kohlberg would wish to see
people advance to the highest possible stage of moral thought. According to him, for children to
reorganize their thinking, they must be active. Turiel (1966) found that there was some change when
children listened to adults' moral judgments. The theory suggests that teachers can have a strong influence
on the morality of the learners if they became their moral mentors.
The theory applies to this study since in the teaching-learning of CRE; teachers have a stake in the
transmission of morals. Buchner (1997) argues that teachers ought to be good role models to the learners.
He observes that during adolescence age, learners are in need of role models, and they tend to take on
these models from all professions that are close to them; whether mass media, parents and family or their
teachers. Buchner (1997) adds that no printed or spoken word can teach young minds what they should
be. It is not the books on the shelves but what the teachers are themselves that can teach young minds
what they should be. This means that the subjects teachers teach, the decisions they make and how they
react to classroom situations reveal their moral thoughts, emotions and habits. Thus, according to Buchner
(1997), teachers are the role models to students and hence influence student’s moral development. Thus,
Kumar (2010) appeals to teachers to uphold moral values since they are found to be the catalyst of social
change. However, if the teachers fail to become moral mentors, the learners get mentoring from other
sources and this determines the rule and principles the children will set regarding their morality. Lantos
(2001) observes that character education is accomplished by teachers and parents striving to be good role
models to the students. Adeyemi (2009) argues that the influence of the teachers and parents on students
shape student behavior in the society. Students often look upon their parents and teachers as role models
on matters of unity, honesty, justice and fairness, responsibility, caring, respect and trustworthiness. The
school authorities also have a role to play in shaping the character of students and especially the
enhancement of unity as a value among the students. In this study, teachers of religious education should

Proceedings of the Third International Research Conference held on 26th to 28th October, 2016 281
have a religious commitment so as to handle the diverse materials in the syllabus. This is because religion
is still the major source of normative orientation in the modern society.
LITERATURE REVIEW
Studies on the Teaching of CRE and Moral Development
Student discipline has been a major determinant of not only student retention in schools but a morally
adjusted person in the society, both in the present and future days in life. Literature reviewed showed that
studies have been done in many parts of the world on the importance of CRE in bringing character
change. However, in Kirinyaga County, studies have not been done to establish whether CRE leads to
character change among learners. In an attempt to fill this gap, this study sought to establish the role of
CRE in character development among secondary school students in Kirinyaga County. Other studies have
also looked into the general development and implementation of CRE syllabus in schools, CRE teaching
methodologies as recommended and practiced in different parts of the globe and more so the methods that
are geared towards inculcating or instilling moral skills with the students without specifically looking into
the criteria or relationship between the teaching of CRE and character development.
Lickona (1992) stated that schools need to do more than concentrate on the cognitive side of character. He
reported that schools need to bring students to the emotional side of character, where they feel and
commit to virtuous behavior, and to the action side of character, where students change inappropriate
behaviors and practice positive moral actions. Wynne argued that many educators have placed too much
emphasis on how students reason about moral issues rather than how they conduct themselves. What and
how students think clearly influences that person’s character; however, the measuring rod of society is not
what or how people think, but how they conduct themselves. This study fills this gap of knowledge by
looking into whether the teaching of CRE influences school discipline among secondary school learners.
METHODOLOGY OF THE STUDY
The study used descriptive survey design. Nwadiuro (1997) defines research design as a structure of a
research that defines what to do and how to do it. It involves the structuring of variables in a manner that
enable their relationship to be determined. Kombo (2002) observes that descriptive research design
collects information that describes or answers questions concerning a current situation such as school.
Gay, (1995) asserts that survey design can be used to assess cause and effects of events. According to
Orodho (2005), descriptive survey deals with incidences, distribution and interrelationships of educational
variables. Descriptive survey design entails an in-depth empirical collection of data about a phenomenon.
According to Orodho (2005) and Kothari (2002), this design describes the nature of phenomena,
examines actions as they are or as they happen rather than manipulation of variables. The design helped to
gather data from teachers of C.R.E and form two C.R.E students in secondary schools. The form two
classes were chosen because it is at this level of psycho-social development that making skills to make
accurate moral decisions is perceived to be challenging (Lahey, 1995). The study population comprised of
380 students and 10 C.R.E teachers. The study sampled the C.R.E teachers by simple random sampling
technique. Using the Fischer et al. (1995) method of determining sample size, students were randomly
sampled for the study. The instruments used in the study included: an in-depth interview schedule and
both open and close ended questionnaires which evaluated teacher knowledge and planning to teach
acquisition of moral values in the teaching-learning of CRE in secondary schools. Piloting of the
instruments was done in-order to determine both reliability and validity of the research instruments. The
quantitative data obtained from the graphic observation rating scale and the learner’s test were coded and
analyzed using descriptive statistics like frequency counts and percentages. The information was then
presented in form of frequency distribution tables. The data gathered from the in-depth interviews and
document analysis were transcribed and organized thematically before analyses and interpretation. This
design was found suitable for the study because it enabled the researcher to collect facts and views from
diverse categories of respondents such as students, teachers and heads of institutions. The gathered data
was summarized and interpreted for the purpose of clarification.
RESULTS AND DISCUSSION

Proceedings of the Third International Research Conference held on 26th to 28th October, 2016 282
Research findings revealed that CRE as a subject had a great stake in the moral development of the young
people in secondary schools. Its syllabus content was also rated by heads of discipline, teachers and
students as good in moral development. However, its teaching methodology had watered down its
effectiveness in terms of moral development. Government through the MoE should intensify on
inspection to ensure methods adopted in classes are not just teacher- centered but value oriented. It is also
important for the government to ensure that there are enough trained teacher counselors in all public
schools to supplement CRE moral objectives. Findings also showed that some of the major vices in
schools as violence, sexual harassment, lesbianism, homosexuality, and bullying, pre-marital sex among
others are still persistent. Ninety percent (80%) of the sampled heads of discipline indicated to have dealt
with vices related to sexuality within a period of one year. five (5%) of the heads of discipline observed
that they had even suspended some students on the same vices in an effort to correct the behavior in
schools. These forms of immorality were taking place in schools where CRE was being taught and against
a background of strong religiosity.
It was evident from both the students, teachers and heads of discipline that CRE content was indeed
perceived as a source of moral development for students. Although all the teachers were found to be
academically and professionally competent, they did not appear to use higher value adding methodologies
in imparting moral skills during the CRE lessons. Most of them employed lecture and question and
answer methods at the expense of methodologies that augured well with the teaching of affective skills.
Putting it in different words, CRE content was found to promote moral values by both teachers and
students, however, the teaching methodologies of CRE at the sampled schools were largely teacher-
centered at the expense of the more helpful learner-centered approaches. The diverse methods that CRE
teachers employ during teaching help learners to understand the lesson and practice what they learn. The
teaching methods and techniques take care of individual differences in children. Findings reveal that the
use of affective valuing skills as opposed to over-reliance on cognitive strategies opens up the
possibilities for free choice and critical decision- making abilities on moral habits. The models of valuing
that are used in teaching CRE are important for they capture affective aspects of learning morals. From
the aforementioned results, it can be noted that learners in the sampled schools were not instilled with the
skill of cooperative learning and helping relations for valuing as expected. In the areas where the learners
manifested scanty knowledge of the skill, it appeared there were cases of chance and not a consequence of
planning skilful value instruction by the teachers. Findings also revealed that teachers did not ask learners
thought provoking questions on moral issues with reference to the affective domain objectives. They said
most of the questions they asked centered on the cognitive domains of teaching C.R.E as this is what the
examination demands.
Findings indicated that students’ expression on morality was noted as deprived in most aspects. Results
on their moral expressions were in no doubt a reflective of the fact that teachers in their classroom
interactions with the learners did not inspire in their behavior those characteristics or moral values which
would enable the learner to see those values that may be of importance in their lives and even in the life
thereafter in the society. There was a general feeling from the findings that issues of morality were a
source of concern to both teachers and students’ themselves. Findings also revealed that teachers were
playing several roles in the establishment of morally upright students in the sampled schools. Their
teaching methodologies were also noted to be short of the recommended methods of inculcating skills in
cognitive, affective, psychomotor and social relating domains. Their personalities were not perceived as
commanding great respect from the students. Findings from all respondents also indicated that teachers
were found to have a great input in the way they conducted themselves, far and above what they
presented from the CRE syllabus in classes.
Results obtained from this study indicated that both students and teachers were positive about CRE as a
subject. Students in the sampled Schools appreciated CRE subject both as a vehicle for good moral
development and a vehicle for better grades in examinations. The latter point came out far much stronger
than the former whereas the priority of passing the examination seemed to override the bigger picture of
developing morally stable or holistic persons. Teachers ranked CRE subject selection as motivated by
easiness of the subject in comparison with other subjects. This may be seen as a rather off-side position

Proceedings of the Third International Research Conference held on 26th to 28th October, 2016 283
for the society needs morally upright people. Findings also reveal that where the value model is not used
in a CRE classroom leaning, the affective personality of the learner which will make him/her value self
and others is not developed. Such learners do not realize the value of corporate morality. Self-esteem,
created by the value model, is important to character development because morality begins with valuing
the self (Boss, 2001).
Results obtained from this study revealed that students’ moral development depended heavily on schools
input. There is, therefore, a need for the principals to: ensure that the parents and the communities
surrounding their schools are sensitized on the need for moral education, ensure that teachers are not
promoting examination performance at the expense of gaining important moral skills in CRE lessons and
finally ensure that the reward systems in schools reinforced more often morally upright students. Results
obtained from this study as well as from other similar studies done earlier indicated that teachers’ method
of teaching, their personality and accessibility to learners had an input in their moral development.
Results indicated that parents on the other hand were contributing very minimal moral skills to students
whereby the whole responsibility of taking care of the youths was left out to the teachers. There is,
therefore, a need for parents to understand their role of molding the character of their offspring, not
abandoning their responsibility to teachers. It is also important for parents to understand that home
environment is an important socializing agent of children, and hence make the homes conducive for
children’s moral growth and development. In addition, there is need for parents to understand that they
should not frustrate their children when they do not perform well academically. Instead, they should give
them moral support and follow up their children’s academic progress with the school.
Findings clearly show that a lot should be done in the teaching of moral values to learners. In cases where
a learner is not made to acquire the skills of moral reasoning on religious matters, the learner may only
memorize the C.R.E content without knowing how they affect his/her life as a person living with other
members of human community. Moral reasoning enables the learner to emancipate self from blind
indoctrination that one may be a victim of, if not taught to think critically and morally upright.
CONCLUSIONS AND RECOMMENDATIONS
Teachers should cultivate an atmosphere of trust and act as role models in order to encourage and
motivate students to learn, abstaining from behavior like drunkenness, chain smoking at school and even
extreme relationship between male and female students of the opposite sex. It is also important for
teachers to enhance effective communication systems in schools in order to curb discontentment which
leads to strike. Teachers‟ pedagogical practices should also be geared towards building the learner
competence with regard to acquisition of moral insights, and the need to develop corporate morality. This
may be achieved by encouraging the learner to absorb the spirit of teamwork and being accountable to the
others in school. Parents need to create conducive home environment for the child’s upbringing, moral
development and provide attention required by the children.
There is need for much more concerted effort needs to be employed to help shape the moral fabric in the
society. This is because Today’s young people are living in an exciting time, with an increasingly diverse
and mobile society, new technologies and expanding opportunities. To help ensure that they are prepared
to become the next generation of parents, workers, leaders and citizens who are morally sound and
accountable in their actions, they need well thought out support, guidance and teaching on good morals.
CRE subject needs to be made more learner-centered, to accelerate the learning of moral skills. This calls
for concerted efforts by all stakeholders in the education sector to put in place intervention measures that
are geared towards enhancing students‟ moral development. Key among these measures may include
imparting life skills to students and the sensitization of parents and members of the community on the
importance of moral education for their children which will lead to ensuring that students remain in
school until completion. Education policies should also be enforced, bearing in mind the current and
emerging issues in educational sector. Government through the MoE should intensify on inspection to
ensure methods adopted in classes are not just teacher- centered but value oriented. It is also important for
the government to ensure that there are enough trained teacher counselors in all public schools to

Proceedings of the Third International Research Conference held on 26th to 28th October, 2016 284
supplement CRE moral objectives. CRE should be made compulsory for all students to be exposed to the
Christian values. To make the inculcation of moral values possible in schools, the administration should
ensure that school rules are seriously followed by the learners and strict measures taken against those who
break them. Educators especially quality assurance officers should make visits to the schools to ensure
that teachers use learner-centered methods that can enhance character change. They should also ensure
that teachers use the recommended resources of teaching rather than the commercial revision materials
aimed at passing examinations. CRE teachers should select methods which aim at making teaching
learner- centered and help to bring about positive behavior change (Kenya Institute of Education, KIE,
2006). One of such recommended methods is discussion. According to KIE (2006), this method gives the
learners an opportunity to express their ideas in the topic being taught. This enhances the learner’s
participation and arouses their interest in the lesson.
It may be concluded that the learning experiences provided to the C.R.E studies are less than wholly
worthwhile. It may also mean that that the nature of teaching and methodology in teaching C.R.E has
failed to inculcate the ability to acquire moral values by the learners. Almost all the teachers never
planned or adequately used the right approaches in teaching moral values to learners. In order to bring
forth a morally mature individual, C. R. E must be used to achieve the noble goals of education in Kenya.
Thus a link must be made between C.R.E and the national goals of education, for example, national unity.
This is because the government wants all its citizens to work together in harmony. In Kenya today, there
are people of different nationalities, ethnic groups, different church communities or denominations. The
government wants us all to deepen our realization of what we have in common, rather than the differences
that exist. The C.R.E teacher should foster national unity by showing pupils practical ways of eliminating
any element in their lives, their speech, and behaviour which goes against this goal or philosophy of
national unity.
REFERENCES
Adeyemi, M. B. (2009). Teacher character education across the curriculum and the role of stakeholders at
junior secondary school level in Botswana: University of Botswana, Gaborone, Botswana
Adeyemi, M. B. (1989). Qualities of a social studies teacher, Kenya Journal of Education; Bureau of
Educational Research, Kenyatta University, 4(2).
Amugune, A.A. (2005). Analysis of factors affecting achievement and enrolment in CRE in selected
public secondary schools in Tiriki West Division of Vihiga District. Unpublished M.Ed. Thesis.
Kenyatta University.
Barret, D., Janice, M. B. and McVeiph (1973). Kenya Churches Handbook. Evangel Publishing House.
Kisumu, Kenya.
Buchner, A.A, (1997). The Influence of models in forming moral identity. International Journal of
Educational Research. Vol. 27, No.7.
Chesaro, D.K. (2003). Role of Christian Religious Education in moral development of secondary school
students in Rongai Division, Nakuru District Kenya. Unpublished M.Ed. Thesis, Kenyatta
University, Kenya.
Cox, E. (1983). Problems and possibilities for Religious Education. Great Britain
Gay, R.L. (1976). Educational Research: An introduction. Longman, New York.
Gay, W. (1975). Moral Education. George Allan and Unwin Ltd London.
KIE. (2006). Secondary Religious Education teacher’s handbook. Kenya Institute of Education, Nairobi.
Kothari, C. R. (2002). Research methodology-Methods and techniques. New Age, New Delhi
Kombo, D.K. (2005). Sociology of education. Nairobi, Ad print
Kumar, M. (2010). Teachers' role pivotal in shaping future generations. www.scoopnew.s.in.india.
Lantos, G.P. (2001). How Christian character education can help overcome theft Failure to secular
education. North Easton.
Lickona, T. (1992). Educating for character: How our school can teach respect and responsibility. New
York: Bantam Books.
Mbiti, D.M. (2007). Foundations of educational administration. Nairobi, OUP Publishers.
Mbiti, J.S. (1969). African Religious and Philosophy. Heinman, London.
Mcphail, P. (1982). Social and Moral Education. Oxford, Basil Blackwell.

Proceedings of the Third International Research Conference held on 26th to 28th October, 2016 285
Nwadiuto, N. (1997). Educational research for moderns Scholars. Enugu, Nigeria.
Oanda, I.O. (1995). Perception of secondary schools teachers and students in Kisii District on the role of
Social Education and Ethics in the moral socialization of youths in Kenya. Nairobi, unpublished
thesis Kenyatta University.
Ochard, B. (2008). The Teaching of morals. Union of Educational Professionals. U. K.
Orodho, A. J. (2004). Elements of education and Social Science Research Methods. Nairobi, Kenya.
Republic of Kenya. (1999). Report of the Commission of the Inquiry into the Education Systems of
Kenya. Government Printer, Nairobi.
Ryan, K. and Bohlin, K. (1999). Values, views, or virtues? Education Week on the Web, 18:49-72.
Editorial Projects in Education on the World Wide Web. Retrieved July 27, 2002 from
http://www.edweek.org.
Tritter J. and Taylor F. (1992). An educated change in moral value. Oxford Review of Education.
London.
Wynne, E. (1988). Balancing character development and academics in elementary school. Phi Delta
Kappan, 69:424-426.
Ziro, J.K. (2002). The causes of students’ unrest in Kaloleni secondary schools Kilifi District. Nairobi,
unpublished M.Ed. Thesis Kenyatta University, Kenya. ******
EDUCATIONAL IMPLICATION OF ‘SHENG’ IN THE LEARNING OF KISWAHILI AMONG
SECONDARY SCHOOLS STUDENTS IN KENYA: A CASE STUDY OF KIRINYAGA COUNTY
Mune, C.W.
Department of Educational Foundations, P. O. Box 83844-00100, Kenyatta University, Kenya
Tel.: +254720764200. Email: [email protected]
ABSTRACT
In the recent past Kiswahili has been hit by a wave of ‘Sheng’ speakers who are mostly adolescents and
young adults. Use of Sheng has raised significant linguistic and pedagogical questions associated with the
attainment of Kiswahili proficiency. While some people have advocated the growth of ‘Sheng’ as an
indication of societal growth in Kenya, others, including scholars, researchers and educationists are on the
opinion that the spread of this code impacts negatively on the learners in Kenyan schools and should be
left to hip hop musicians, public transport touts, drug peddlers and school drop outs. In the education
circles, the code is gangster slang, a secret code associated with social misfits, is fluid and not easy to
understand. It interferes with standard Kiswahili and has negative effects on formal education. In Kenya,
language policy has come to mean political pronouncements, government statements, and
recommendations by Educational Commissions which are rarely implemented. The study was guided by
Inter-language theory by Selinker. Study sample consisted of 9 schools, 368 form three students and 40
teachers. Sample populations were obtained through purposive and stratified sampling. Research showed
that the code has interfered with formal language learning inside the classroom since students fail to mark
the boundaries between ‘Sheng’ and standard Kiswahili and thus continue to show incompetence in
writing and speaking. Also, it has interfered with the performance of students in national examinations
especially in sentence constructions. Students regarded sheng as a tool to distinguish themselves from
their parents whom they perceive as living in the past. Findings show that ‘Sheng’ has to do with lack of
clarity in Kenya’s language policy. The paper recommends specific researches on the language situation
in Kenya especially as far as the spread of ‘Sheng’ and its impacts on education are concerned.
Key words: Adolescents, social misfits, Kiswahili proficiency, Formal education, Language policy
INTRODUCTION
Background to the History of Kiswahili in Kenya
Kiswahili is one of the fastest growing African languages. It can claim to be the East and Central African
region’s primary language of wider communication even in the face of a very rich and varied multiplicity
of languages and relentless rivalry from the two topmost, powerful European languages namely English
and French (Chimerah, 1998). Kiswahili is typically a Bantu language (about 40% of its lexicon is Bantu)
which borrowed and continue to borrow words and terminologies from other languages to enrich its

Proceedings of the Third International Research Conference held on 26th to 28th October, 2016 286
lexicon. As a Lingua Franca, the Kiswahili language is the seventh most widely spoken language in the
globe (Mbaabu, 1985; Chimerah, 1998).Kiswahili is also evidently used for news broadcasting from
major broadcasting stations. However, while Kiswahili is making these great strides, it is being faced with
a variety of challenges in its place of origin due to the emergence of language varieties like ‘Sheng’.
Many scholars have made inroads into this linguistic code called Sheng. Mukhebi (1986) has said that
Sheng is a cultural event which is associated with the thoughts and emotions of its speakers who found
that they were incapable of expressing themselves in Standard English. He has not looked at the negative
effects of Sheng in the teaching and learning of Kiswahili in Kenya.
The impact of the language in the teaching of Standard Kiswahili has not been his focus. Rinkanya (2005)
has suggested that there is need to publish books in Sheng; this view has been vehemently opposed by
King’ei and Kobia,(2007) who have actually recommended that there is need to contain the usage of
Sheng and mitigate its negative effects on the national and official languages, which are the media of
formal education and business. Momanyi (2002), in her paper to the journal of Pan African Studies,
recommended specific researches to be done on the language situation in Kenya, especially as far as the
spread of Sheng and its impact on education are concerned. Mbaabu (1996) suggests that one of the
reasons Sheng has grown so fast is because there appears to be no systematic Kiswahili language policy.
The speed at which the Sheng code is getting into the way of Kiswahili and English instruction is so
alarming that the researchers believe that definite measures have to be taken to check this unprecedented
growth to take care of the emergence of Sheng and help avert an otherwise very explosive language
situation in the future.
The teaching and learning of Kiswahili has become extremely complex. Being the national language of
the Republic of Kenya and from 2010 and one of the co-official languages with English, it became
increasingly appropriate to find out educational implication of the use of sheng in the learning of
Kiswahili in secondary schools in Kenya. for a long time now in Kenya, language policy has come to
mean nothing more than political pronouncements, government statements, and recommendations made
by Educational Commissions which are rarely implemented. The decision of Kenya to use Kiswahili as
the national language immediately after independence came as a need to foster human development. This
is because Kiswahili is the language of interethnic communication in Kenya where it bridges the
linguistic gap between communities.
Any country that values the development of its people must incorporate them in all development
processes. This can be realized through a language that they can comprehend and can competently use it
to evaluate themselves and to implement development projects within their area. Kenyans are therefore
lucky to have a language that is spoken and is understood by over 80% of the population. Kiswahili has
been used by politicians to woe votes during political campaigns. Through Kiswahili literary genres
especially lyrics, politicians gain popularity among the masses, hence improving their chances of winning
in an election. Activities such as Civic Education, HIV/AIDS awareness campaigns, Human Rights
advocacy and Constitutional Review process have become successful partly because the majority of
Kenyans share a common language – Kiswahili. Professionals like engineers, agricultural extension
officers, doctors and technicians use Kiswahili mostly to communicate to the public while discharging
their duties. There is, therefore, an urgent need to equip these professionals with Kiswahili
communication skills needed for them to competently discharge their duties.
In this age of globalization, imported technology continues to bombard most of the African countries.
Industrial production, which involves imported technologies, is tied to foreign languages. This means that
the latter dominates industry and commerce. Yet at the grassroots level where the peasant farmer, the
housewife, the kiosk operator, the street vendor or the Jua Kali artisan operates, this official foreign
language is rarely used. Instead, the indigenous languages including Kiswahili are the media through
which this technology is interpreted and applied. It is therefore imperative for our professionals to learn
Kiswahili, to be able to impart the right knowledge and to communicate to the general public. Inconsistent
Kiswahili language policies have continued to prevail in post-independent Kenya. These inconsistencies

Proceedings of the Third International Research Conference held on 26th to 28th October, 2016 287
have accentuated and contributed to negative attitudes towards teaching and learning of Kiswahili in
educational institutions.
‘Sheng’ and its Implication on Education
The standard form in the use of Kiswahili is the way in which it is used in schools, administration,
parliamentary systems and general communication. It also involves the way in which it is used to produce
text books and other teaching materials in schools, and it is this standardized form that the student is
expected to learn in order to communicate with the general public. Recently, Kiswahili has been hit by a
wave of ‘Sheng’ speakers who are mostly pre-adolescents and young adults. The youths developed a
secret code which they wanted to identify themselves with, and a variety of the subculture. ‘Sheng’ is
based primarily on Kiswahili structure. It uses Kiswahili grammar with lexicon drawn from Kiswahili,
English and the various ethnic languages mostly spoken in big towns.
Initially, this mixed code was unstable, random and fluid, but it gradually developed more systematic
patterns of usage at the phonological, morphological and syntactic levels. The word ‘father’ started as
‘fadhee’, later it changed to ‘buda or budaa’ and now it is ‘mbuyu’. According to Githiora (2002), the
word ‘buda’ has its origin in Gujarati and Hindi which means an old man. But in the new coinage
‘mbuyu’, there seems to be no explanation of its origin. The code dominates the discourse of primary and
secondary school children outside their formal classrooms and is widely spoken also by street hawkers,
street children, public service vehicle drivers and conductors and small scale business communities in
market places. Originally a slang which was used by the youth of Nairobi, ‘Sheng’ now is used in the
complex multilingual and multicultural setting of other major towns in Kenya apart from Nairobi.
‘Sheng’ is therefore a reflection of the linguistic complexities that exist in Nairobi and other major towns
like Kisumu, Mombasa, Nakuru and Eldoret. In these big towns, Kiswahili, English and the mother
tongues interact in a complex and unstable manner, giving rise to code switching, random language
mixing and language shift (Abdul-Aziz and Osinde 1997). The youth come from diverse ethnic
communities and devise this slang to enable them communicate among themselves in the subculture they
have created. Local TV and Radio stations have also given space to ‘Sheng’ where specific programs use
this code (Tahidi high, Inspekta Mwala, Machachari, Aunty Boss etc). These broadcasts have a lasting
linguistic effect on school children and the youth since some of them tend to identify with certain
characters in these programs through the use of this code. Most people in Kenya are on the opinion that
this code interferes with standard Kiswahili and hence it has negative effects on formal education. In the
education system, teachers have complained in various forums that the code interferes with formal
language learning inside the classroom. This is because students fail to mark the boundaries between
‘Sheng’ and standard Kiswahili or even English.
It has also been observed by teachers that many students are more fluent with this restricted code than
with the standard Kiswahili. However, Githiora (2002), think that the problems found in classrooms and
blamed upon ‘Sheng’ in fact represent non-linguistic conflicts. These may be as a result of larger social
processes which the teachers and students are part and parcel of, for example, poor education policy.
Even high schools graduates have their communicative competence being very low. Hence, something
goes wrong when these pupils go to high schools and this probably needs to be investigated. Even in
universities where Kiswahili language and literature is offered, the students continue to show
incompetence when it comes to writing and speaking Kiswahili. They are often not capable of switching
from ‘Sheng’ to standard Kiswahili with ease, yet they comfortably switch from ‘Sheng’ to other
languages like their mother tongues. It is true that to some extent, the code has interfered with the poor
performance of students in national examinations. Some manifestations of this code can be seen in their
class work especially in sentence constructions. Still, the social stigmatization associated with this code
makes most people in Kenya feel uneasy about the code. It has more often than not been associated with
touts, drug pushers, hip hop musicians and school drop outs. In the education circles, the code is gangster
slang, a secret code associated with social misfits, is fluid and not easy to understand. Language is useful
as a tool for communication when it is widespread in usage and people, children included, will not bother
to learn a language simply to be patriotic to their extended families. Rather, they would learn a language

Proceedings of the Third International Research Conference held on 26th to 28th October, 2016 288
that is widespread in usage and whose image is attractive to them in a personalized way. This reluctance
to learn or teach or even use mother tongue to the next generation encourages the learning and using of
another language; one that is viewed as more socially prestigious, economically powerful or one that
promises upward mobility and a better future.
Scope of the Study
As Spyropoulos (1987) pointed out, the emergence of ‘Sheng’ may have to do with the lack of clarity in
Kenya’s language policy especially by providing speakers with a code that makes good use of all the
major languages spoken in the country. To some extent this may be true because while Kenya boasts of
having Kiswahili as its national and (now in the draft constitution) official language, there are no
deliberate efforts to make this a reality through policy formulation. In fact, since 1930s, Kiswahili has
undergone no rigorous standardization in the region to cater for the ever growing list of vocabulary and
technical terms as a result of socio-economic and cultural developments. Due to its widespread use,
‘Sheng’ has been in the centre of discourse among scholars and researchers in Kenya. The code has also
caught the attention of the print and electronic media especially in advertisements, official health
warnings on HIV/AIDS, and other commercials. It is also gaining prominence in music and popular youth
culture where popular musicians often blend the various ethnic languages, Kiswahili and English words in
their compositions.
The speed at which the Sheng code is getting into the way of Kiswahili and English instruction is so
alarming that the researchers believe that definite measures have to be taken to check this unprecedented
growth to take care of the emergence of Sheng and help avert an otherwise very explosive language
situation in the future. The teaching and learning of Kiswahili has become extremely complex. Being the
national language of the Republic of Kenya and from 2010 and one of the co-official languages with
English, it became increasingly appropriate to find out educational implication of the use of sheng in the
learning of Kiswahili in secondary schools in Kenya. for a long time now in Kenya, language policy has
come to mean nothing more than political pronouncements, government statements, and
recommendations made by Educational Commissions which are rarely implemented.
The decision of Kenya to use Kiswahili as the national language immediately after independence came as
a need to foster human development. This is because Kiswahili is the language of interethnic
communication in Kenya where it bridges the linguistic gap between communities. Kiswahili has the
oldest uninterrupted history as an African written language compared to other African languages used in
the country. Its written literary history is over a span of almost three centuries. It therefore has a
significant role to play in education for purposes of equipping learners with communicative skills needed
to foster national development.
The ideal role of a language in any society is to be able to serve as many of its speakers as possible.
Kiswahili can adequately perform this role because it is non-ethnic .It also occupies an important place in
the lives of Kenyans and therefore its sociological role and academic importance cannot be overlooked.
An in-depth investigation of the influence of Sheng and related structure on the written work of secondary
school learners has not been done so far. In particular, no effort has been made to establish the role of
Sheng in hindering effective pedagogical process. This study has provided concrete information on
learner behavior, an aspect of high utility to the teacher and educationists in general in the planning of
pedagogical strategy.
This study is significant as it will provide information to understand difficulties experienced by learners
whose linguistic environments are diverse. The findings of this study are expected to provide corrective
feedback to language teaching practice. There is therefore need to find out educational implication of
sheng in the learning of Kiswahili language in secondary school so that appropriate measures can be
incorporated and avoid the use of corrupt language among secondary school learners in Kenya.
Theoretical Framework

Proceedings of the Third International Research Conference held on 26th to 28th October, 2016 289
This study was guided by Inter-language theory as proposed by Selinker (1972). The term inter-language
was elaborated by Selinker (1972) as the separate linguistic system, which is hypothesized from the
observed output of learners’ attempted production of the target language. According to Selinker (1975),
the learners’ language need not correspond with the target language since its evolution manifests
characteristic differences. He observed that this learner language is a dynamic variable and is constantly
changing. In this study, the use of Sheng related structures appears to be consistent with stipulations made
by Corder P. and Selinker L. that focus on the active psycholinguistic processes of inter-language. Dulay
et al (1972) elaborate these processes as the subconscious process, which learners use to organize the
language input according to the rules in order to construct, understand and generate sentences. This is
what Dulay et al (1972) summarizes as the creative construction hypothesis and it was relevant in guiding
the investigation in this study. Kiswahili learners creatively construct meaningful Sheng related structures
in which they communicate while generating new sentences. It was the objective of this study to identify
the underlying morphological processes that underlie the production of Sheng- related morpho-syntactic
structures. The Sheng related structures that learners generate are a product of the social environment and
their creative potential as well as the nature of the linguistic input. According to this theory, the
multilingual environment provides a rich source of linguistic input and the learners creatively organize
this input to generate meaningful sentences according to their needs. In this respect, Krashen (1981)
proposes what he terms as comprehensible input as an important aspect in the interaction process since it
introduces communicative activities in the attainment of language proficiency.
LITERATURE REVIEW
Many studies that have been conducted mention the negative attitudes and stereotypes associated with it.
In Githiora (2002) for example, attitudes towards Sheng oscillated between the positive and the negative
extremes. On the one hand, the Sheng enthusiasts argued that it was an important code for youth
communication because it breaks down ethnic barriers. Sheng opponents, on the other hand disliked its
unintelligibility by adults and its negative interference with school learning. These two extremes are
further explored in Fink (2005) whose work is a global survey of language attitudes, covering the
perceptual processes between Swahili, English, Sheng and mother tongues. She examines the variables
such as age; gender and socio economic background and concludes that young people preferred English
to mother tongues while the reverse was the case for adults. This is evidence of language shift in Kenya.
Githinji (2008) has looked at people’s beliefs about sheng’s structure, its usefulness, functions and the
speakers’ proficiency across age and socio economic status categories. Besides, he has looked ambivalent
attitudes that people have towards language categories and people who speak them. He found out that
when respondents were presented with both positive and negative statements on sheng, negative
statements received higher scores than the positive ones. Surprisingly, the young people who speak Sheng
displayed the most negative attitudes towards it. According to Journo (2009) and Momanyi (2009), Sheng
is the vehicle of literary production. Sheng seems to constitute a space where the complexity and the
fluidity of contemporary urban experiences can be reflected. This fluidity, seen in Sheng’s versatile
incorporation of new words and coinages, reflects the way in which modernity (whether drawn from
Western, or other, more local, influences) is appropriated, modified and blended with revised pre-existing
values (Journo, 2009 and Momanyi, 2009).
It will, therefore, be in order to give this code a special attention as it has its place in the linguistic lay-out
of Kenya (Iraki, 2002). Not only is the Sheng code spoken by the youth but also by hip hop musicians,
public transport touts (manambas), drug peddlers, school dropouts, small scale business community in
market places (Momanyi,2009).These people form the linguistic environment within which the youth,
who form most of the respondents in this study, appear to reside. It emerged due to a lack of a language
policy in Kenya. It does not exist in the same extent and fluidity in Tanzania as it does in Kenya because
Tanzania is unified by the fact that Kiswahili is both an official and national language. If we compare the
lugha ya Mitaani (lyM) in Tanzania with neighboring Sheng in Kenya, we find some similarities: they
share the same function as an urban youth style of speaking, they share the same morph syntactic frame,
i.e. Swahili and the wider linguistic ecology with Swahili and English as major contact languages is
similar. But apart from this, LyM and Sheng differ in two important respects: in the strategies employed

Proceedings of the Third International Research Conference held on 26th to 28th October, 2016 290
for local manipulation and in the public awareness of the phenomenon both at national and international
level. With respect to the national perception of the phenomena as well as to the perception of the
scientific public, Sheng seems to attract more attention so far than LyM. Sheng has also instigated an
intense debate among Kenyans-teachers, pupils, politicians and everybody concerned with the educational
sector- mostly in the paradigm of the falling standards, corruption of language and declining linguistic
abilities of students. And it seems to be more perceived as a threat to linguistic norms than LyM (Swahili
Forum, 13, 2006).Though Githiora (2002) has indicated that this happens outside the classroom setting, it
can now be asserted that this argot has invaded our classrooms hence the need for this study. The negative
effect on school performance in English and Kiswahili, the standard languages in both primary and
secondary school levels has been a thorn in the flesh for the parents and language pedagogists (Samper,
2002; Fink, 2003). Driven by the need to prevent corruption of languages and the endeavor to teach
‘proper’ languages that enhance the learner’s career, this necessitates the need for this study with specific
emphasis on what students, teachers and other educators think and perceive about Sheng as regards the
teaching and learning of Standard Swahili in selected schools in Kirinyaga County.
METHODOLOGY
A descriptive survey research design was adopted. Descriptive survey design is a scientific method which
involves observing and describing the behavior of subjects without influencing them in any way. This
design helps provide answers to the questions of who, what, when, where, and how associated with a
particular research problem. Descriptive survey explains the state of affairs as it exists. Descriptive
studies are not only restricted to fact findings, but may often result in the formulation of important
principles of knowledge and solution to significant problems. Simple random sampling was used to obtain
secondary schools. Purposive sampling was used to select teachers and heads of institutions who
participated in the study. Data collection instruments were observation schedule and questionnaires
administered to teachers and learners. Content validity of the instrument was determined by discussing
the items in the instrument with the supervisors. Data analysis was done basing on descriptive statistical
techniques such as; frequencies, and percentages.
Target Population, Sampling and Sample Size
A purposeful sampling method was used to get a population of 368 learners from nine schools. This
provided a population whose linguistic background is heterogeneous. The sample population was form
three students from nine secondary schools. Opinion about Sheng usage was sought from Kiswahili
language teachers from the respective schools. Form three students were the most appropriate since they
had only a couple of months before they could enter the terminal class where they were expected to show
the level of proficiency attained in Standard Kiswahili after four years of learning it in high school.
FINDINGS
Students regarded sheng as a tool for defining their generation. Its versatility, as Fink (2005) has
observed, results in the view that there are distinctions between generations of Sheng speakers. Samper
(2002) tends to agree that because of the character of its changing trend, the students see it as a tool for
young people to distinguish themselves from their parents whom they perceive as living in the past as
they live in the present. Students, teachers and head teachers who use sheng view themselves positively
while those students and teachers who do not use or condone the use of sheng either keep quiet about it or
appear to be lukewarm in the presence of those who use it. From the attitudes and perceptions of the
sheng code, there are some differences between the indexing of sheng for men and for women. Men tend
to be heavier sheng users than women. Samper (2002) has argued that since Sheng is a source of
interpersonal power for men, women’s comparative avoidance of it indicates their lack of power in the
Kenyan society. As they have viewed it, women testify to the liberating quality of sheng- for a woman,
knowing too much of Sheng may mark her as sexually permissive, while not knowing it will mark her as
rural and backward. In terms of age and gender, it was observed that sheng use varies in place and
situation. This shows that the idiom has become a force to reckon with. As Iraki (2011) has commented,
certain stereotypic projections are bound to come across suppressors of the use of this idiom.

Proceedings of the Third International Research Conference held on 26th to 28th October, 2016 291
Results also showed that only slightly more than half of teachers use Kiswahili only in the process of
teaching while the rest mix the language while teaching. The learner is likely to be affected by this for
they are going to imitate the language of the teacher and will end up not being fluent. Additionally the
writing of Kiswahili will be affected; the learner may end up using other languages like „sheng‟ together
with Kiswahili in the process of writing. When teachers use Kiswahili language during the lesson and
when addressing the learners during assembly, it creates motivation in the learning process. Additionally,
they act as a role model for learners who would want to speak good Kiswahili. More so, it has been
established by research that learners are motivated by their teachers to speak Kiswahili. Motivation is a
very important factor as far as performance is concerned. One of its functions is to energize the behavior
of the organisms and arouse it for action. The energy is supplied in proportion to the amount of energy
output for a task; motives help to sustain interests and behavior (Ingule et al., 1996).
CONCLUSIONS AND RECOMMENDATIONS
There is need to find out the extent at which the code is used; verify its grammar and lay rules of
formation of words; otherwise the impact on standard Swahili is far reaching and dangerous. Kang’ethe,
Iraki (2004) stated that Sheng vocabulary cannot be wished away; it needs to be properly studied and
documented as it continues to expand and spread its wings. The truth alongside this assertion is that the
Sheng vocabulary is not systematized - word formation and coinage continues to get into it in several
ways. There are suggestions that the code should be banned from use. But the solution does not reside in
banning Sheng. Instead the solution is to be located in rigorous language teaching strategies. A mode of
speaking cannot be fought and banned; rather we should perfect the teaching of standard forms so that
pupils can identify boundaries between various forms of language use. Alongside the previous statement,
Iraki (2004) has said that educationalists view Sheng as a threat to purism of English and Kiswahili and
measures should be taken to stem the negative ramifications it is likely to bring to the teaching and
learning of standard Swahili.
Kiswahili Learning needs frequent use of the language, the more involvement in learning activities such
as presentation of topics in public, asking and answering questions, the more the learner learns
(Vygotysky, 1987). When the learner participates in the debate he gets time to practice different
vocabularies, different sentence structures since as he expresses himself he chooses the appropriate
words. Additionally it is during such activities that peer mediation takes place. The learners are able to
learn from each other and correct one another.
The study further established that majority of the learners did not participate in Kiswahili interschool
competitions. Inter school competition involves learners from different schools who gather together for
the purpose of learning. This implies that most schools do not participate in the inter-school quiz. This
affected the learning of Kiswahili since he learners do not exercise what they have been taught. Vygotsky
(1987) states that, mediation is done by the teachers and learners themselves through dialogue and
correcting learners in sentence construction, reading and writing. Minimal use of Kiswahili in
communication at school affected the learning of Kiswahili. If the learner practices by speaking the
language in debate or inter-school competition, he or she will learn the language and vice versa. Schools
should come up with clear and working language policies in order to promote the use of Kiswahili
language. For example, all the teachers, workers and pupils should use Kiswahili when addressing each
other particularly in School.
REFERENCES
Abdul-Aziz M.H. and Osinde. (1997). Sheng and English: Development of Mixed Codes Among the
Urban Youths in Kenya. International Journal of the Sociology of Language. Berlin: Allemagne.
Abdul-Aziz, M. and Osinde (1997). “Sheng and Engsh: Development of Mixed Codes among Urban
Youth in Kenya” International Journal of the Sociology of Languages 125:45-63
Chimerah R. (1995) Kiswahili: Past, Present and Future Horizons. Nairobi: Nairobi University Press.
Dulay A. and Burt M. (1972). Natural Sequences in Child Second Language Acquisition in Language
Learning. Vol. 22: pp235-252.
Fink,T. (2005)Attitudes towards languages in Nairobi. Master’s Thesis, Michigan State University.

Proceedings of the Third International Research Conference held on 26th to 28th October, 2016 292
Githiora C. 2002: Sheng: Peer Language, Swahili dialect or emerging Creole? Journal of African Cultural
Studies London: Routledge.
Githinji, P. (2008).Ambivalent Attitudes: Perception of sheng and its speakers. Ohio University, U.S.A:
Nordic Journal of African Studies 17(2), 113-136.
Ingule, F., Rono, R. and Ndambuki P. (1996). Introduction to Educational Psychology.
Iraki Frederick K. 2010. Language and Political Economy: A historical perspective from Kenya
King’ei, (1992). Language, Culture and Communication: The Kolc of Swahili Taarab Songs in Kenya, I9
(> MW I toward. I toward l Inversily Press
Krashen, S. (1981). The Input Hypothesis, Issues and Implications, Longman: London
Spyropoulos M. (1987). Sheng: Some Preliminary Investigations into a recently emerged Nairobi Street
Language. Journal of the Anthropological Society of Oxford 18 (1). 125-136.
Mbaabu, I. (1996). Language Policy in East Africa: A Dependency Theory Perspective. Erap: Nairobi
Momanyi, Clara 2009. Effects Sheng’ in the Teaching of Kiswahili in Kenyan Schools. Journal of Pan
African Studies Vol. 2 no. 8.
Mukhebi, L. (1986). Is Language and culture Inseparable? Kenya Times, Nairobi. May 28.
Rinkanya, A.N. (2005).Sheng Literature in Kenya: A Revival? In: H.Indangasi andM. Odari (Eds).The
Nairobi Journal of Literature, Number 3.Nairobi: Department of Literature, University of Nairobi.
Selinker L. (1972). Towards an Explanatory Theory of Interlanguage, in Fisiak Jacek, 1981: p229.
Samper, D. (2002). Talking Sheng: The role of a hybrid language in the construction of identity and youth
culture in Nairobi, Kenya.Ph.D Dissertation University of Pennsylvania. ******
CRITICAL ANALYSIS ON HOW TEACHER-RELATED FACTORS AFFECT APPLICATION
OF PROGRESSIVISMS’ LEARNER-CENTERED APPROACHES IN TEACHING AND
LEARNING OF MATHEMATICS: A CASE OF MERU SOUTH SUB-COUNTY, THARAKA
NITHI COUNTY, KENYA.
Mwangi, S.N.
Chuka University, P. O. Box 213-60400, Chuka, Kenya
Email address: [email protected]
ABSTRACT
Learning mathematics` problem-solving skills using learner-centered teaching approach, as emphasized in
the philosophy of progressivism, enhances creativity and problem solving skills to the learners. In
contrast, learning mathematics using teacher-centered approaches have increasingly dire consequences to
the pupils such as poor performance, lack of creativity, poor socialization and lack of problem-solving
skills. This study critically analyzed how teacher-related factors affect application of learner-centered
approaches in teaching and learning of Mathematics. The study employed descriptive survey research
design. The target population comprised of 5,547 subjects consisting of 5,160 pupils and 387 teachers
from 129 public primary schools within Meru South Sub-County, Tharaka Nithi County, Kenya. A
sample size of 378 respondents was obtained using simple random sampling and purposive sampling
techniques. Questionnaires were used to collect data from pupils and mathematics teachers. The results of
the data analysis were presented using bar graphs, frequency tables and charts. The research findings
revealed several learner-related factors such as motivation, attitude, beliefs and myths on mathematics,
which were noted to make pupils participate passively in the learning process. Pupils’ negative attitude
towards mathematics was also noted as a major hindrance to the application of Progressivists’ learner-
centered approaches in teaching and learning of mathematics in Meru South Sub-County. The researcher
anticipates that the findings and recommendations of this study may provide valuable reference for
teachers, curriculum developers and policy makers in education on learner-centered approaches to
enhance teaching of Mathematics.
Keywords: Philosophy of Progressivism, learner-Centered, teaching, learning
INTRODUCTION
Children, because of their individual personalities, require instruction that address several learning
attributes (Holt, 2004). Some characteristics of young children include shorter attention spans, less

Proceedings of the Third International Research Conference held on 26th to 28th October, 2016 293
experience with social interactions and basic skills in the classroom and an inability to understand
lengthy, complicated directions (Holt, 2004). Although children use a variety of skills to learn new
information, younger children have a limited vocabulary; hence, it is important to teach without relying
solely on verbal instructions (Elliot, 1999). Teacher–centered teaching methods such as rote learning,
lecture method and memorization makes the learner to be passive in the learning process and encourages
dogmatism. In learner-centered teaching approaches such as group discussion, learners are encouraged to
cooperate with their classmates and with their teachers.
Progressivism is a philosophy, whose major proponents are John Dewey and William Heard Kilpatrick,
relates children`s growth process with the process of acquiring knowledge (Kilpatrick, 1951). According
to Dewey (1944), philosophy of progressivism suggests ways of teaching and learning through basing
instruction on the needs, interests and developmental stages of the child. It means teaching students the
skills they need in order to learn any subject, instead of focusing on transmitting a particular subject; it
means promoting discovery and self-directed learning by the student through active engagement.
Kilpatrick (1951) summarizes progressivism as ‘child-centered instruction’, ‘discovery learning’ and
‘learning how to learn’.
In United States of America, Radu (2011) observed that through learner-centered methods of learning,
pupils work on their projects enthusiastically for learning to take place, rather than memorization. Before
learner-centered approaches were introduced in the American curriculum as asserted by Radu (2011),
regular classroom students just memorized what they needed to know and was soon forgotten after the
test. In South Africa according to Hayes (2007), progressivism as learner-centered theory with high ideals
of educational revolution that make each and every child to be a successful learner. Thus, proper
implementation of the progressivism theory in some schools, led to good performance in science-related
subjects especially in Mathematics (Hayes, 2007).
Statement of the Problem
Mathematics is the foundation of scientific and technological knowledge that is vital in socio-economic
development of a nation. Despite government’s efforts to enhance the use of learner-centered teaching
and learning approaches, performance in Mathematics at the Kenya Certificate of Primary Education
examination has been declining over the years. In the long run, pupils may miss out on admission to high
schools and due to low achievement in mathematics. The persistent poor performance has been blamed on
several factors that are teacher-related, curriculum-related and learner-related. This study therefore seeks
to assess and provide a critical analysis how teacher-related factors affect application of progressivisms’
learner-centered approaches in teaching and learning of mathematics.
Purpose of the Study
The purpose of this study was to assess and provide a critical analysis how learner-related factors affect
application of progressivists’ learner-centered approaches in teaching and learning of mathematics among
pupils in public primary school in Meru South Sub-County.
Objectives of the Study
The study was guided by the following specific objectives.
(i) To identify learner-related factors that affect application of progressivists’ learner-centered
approaches in teaching and learning of Maths in public primary schools in Meru South Sub-County.
(ii) To critically analyze how the identified learner-related factors affect application of Progressivists’
learner-centered approaches in teaching and learning of Mathematics among pupils in public primary
schools of Meru South Sub-County.
LITERATURE REVIEW
Philosophy of Progressivism
Progressivism is a philosophy that emphasizes on teaching based on the needs, experiences, interests, and
abilities of learners. Progressivists’ emphasis on learning based on the belief that knowledge isn't a thing
that can simply be given by the teacher at the front of the room to students in their desks. Rather,

Proceedings of the Third International Research Conference held on 26th to 28th October, 2016 294
knowledge is constructed by learners through an active, mental process of development; learners are the
builders and creators of meaning and knowledge (Kilpatrick, 1926). Bruffee (1984) noted that through
progressivists’ learner-centered teaching and learning approaches, children learn to identify obstacles that
hinder their learning and then work on solutions to overcome them. It equips the children with skills not
just to take on obstacles in their learning process, but also the obstacles in life. In this way, learners
acquire skill sets that are necessary y to handle different situations in school and life. The progressive
method adopts a unique teaching philosophy centered around projects, analysis of data, understanding
problems and their solutions and answering questions after careful analysis of facts at hand (Biggs, 1995).
This allows children to learn concepts and content without resorting to memorization but by gaining, a
deeper understanding of the content learner-centered approaches namely; Learning by doing,
collaborative learning and problem-solving approach.
Learning by Doing Approach (LDA)
Learning by doing is a teaching and learning approach that has been applied for many years. It has many
proponents, including Plato, Thomas Hobbes, English and Spanish epigrammatists, Karl Marx and Mao
Zedong, cultural anthropologists, Montessori, John B. Watson, and B. F. Skinner. Learning by doing
approach has many forms, including discovery versus instruction, practical experience versus book-
learning, the practice-theory-practice dialectic, and proof upon practice. Laturner (2002) noted that very
few learner-centered teaching methods are used today in public schools that include the learners being
able to actually do what they are being taught. This could be because of the complexity and time it adds to
lesson plans, additional materials required, time allowed for assessments, inexperienced educators or
traditions in the education field. Learning by doing allows a learner to practice and become confident in
their ability to perform. It not only allows the teacher to assess if they are meeting the teaching goals of
the course but also allows the student to be able to do what they have spent their time and possibly money
to learn; so that they can use the skills, they have learned after they have completed the course.
Abercrombie (2000) noted that anyone can have students read from a book, hand out a test and give out
grades, but every teacher cannot complete the tasks being doing all the activities on the chalkboard, let
alone be experts in the field they are experts.
Demonstration Method
Demonstrations involve activities that occur in the classroom as a means of helping learners understand
how a phenomena ‘works’ (Biggs, 1995). This method is more active than lecture method because pupils
get involved and they see in first-hand how the construction or phenomena present itself in the real world.
Kilpatrick (1951) emphasize that after demonstration, the teacher should task the pupils to review key
points in the class. If a significant number of pupils missed or misunderstood any key points, the teacher
may need to repeat the demonstration process. As a follow-up exercise, pupils should apply the concept to
a new situation so they can generalize their learning (Dewey, 1938). For technique demonstrations, it is
often helpful for pupils to watch the teacher coach a student volunteer through a technique. Then the
pupils should perform the technique on their own to consolidate learning.
Demonstrations are usually the teaching and learning technique that involves all of the students in the
class, either working in groups or alone, to solve a problem or puzzle. The benefit of demonstrations is
not only that it increases attention and students are able to see a phenomena unfold, but are also able to
personally manipulate and practice using that phenomena in a first-hand environment (Phillips, 2000).
This is advantageous because students may not truly understand a concept until they have manipulated it
for themselves (Whetten and Clark, 1996). Examples of in-class activities can range from playing games
as exam reviews (Cook and Hazelwood, 2002; Saranson and Banbury, 2004) to in-class journaling (Bolin,
Khramtsova, and Saarnio, 2005).
Collaborative Learning Approach (CTA)
Collaborative teaching approach is a term for a variety of learner-centred teaching methods involving
joint intellectual effort by pupils, or pupils and teachers together. In collaborative learning, Dewey (1944)
recommended for pupils to work in groups of two or more, mutually searching for understanding,
solutions, or meanings, or creating a product. Nurrenbern and Robinson (1997) noted the main limitation

Proceedings of the Third International Research Conference held on 26th to 28th October, 2016 295
of applying collaborative learning approach and group discussions as they are normally conducted is that
there is no individual accountability at all. The result is the familiar situation in which some team
members do the bulk of the work, others contribute little and understand little or nothing about the
project, everyone gets the same grade, and resentment abounds. Adjusting the team project grades for
individual performance goes a long way toward correcting these injustices. In addition, it is good practice
to include some individual testing on every aspect of the project and have the results count toward the
final course grade (Giangreco, 1993). If this is done, hitchhikers who understand either nothing or only
the little they did personally will be penalized and perhaps induced to play a more active role in
subsequent work.
Progressivists advocates forming discussion teams heterogeneous in ability level. The unfairness of
forming a group with only weak students is obvious, but groups with only strong students are equally
undesirable (Golub, 1988). The members of such teams are likely to divide up the homework and
communicate only cursorily with one another, avoiding the interactions that lead to most of the proven
benefits of cooperative learning. In heterogeneous groups, the weaker students gain from seeing how
better students approach problems, and the stronger students gain a deeper understanding of the subject by
teaching it to others (Nurrenbern and Robinson, 1997). Moreover, when graduates go to work in industry
or business, they will be required to work in teams and will have no voice in the team formation, and their
job performance evaluation will depend as much on their ability to work with their teammates as on their
technical skills (Johnson and R.T, 1989). Since that’s what they’ll be doing then, the job of their
instructors is to prepare them for it now.
Teachers’ Related Factors
According to Brown (2010), the greatest factor in teaching process is the teacher. No methods, no
techniques, no gadgets, no devices can guarantee pupils’ success; only the teacher can. Agyeman (1993)
noted that a teacher who does not have both academic and professional teacher qualifications would have
negative influence to his/her subject. A teacher must be enthusiastic about his/her subject and in case
he/she does not consider it as one of the most important thing, pupils may not get inspired (Sharma,
2008). Eshiwani (1983) noted that poor performance is due to teachers’ characteristics such as teaching
experience, certification, training, pupil-teacher ratio, professional commitment and transfer index.
Theoretical Framework
This study was informed by the Progressivism theory whose major proponents are John Dewey and
William Kilpatrick. The progressivism theory states that the learning process starts with self-
appropriation of knowledge, construction of problems and provision of possible solutions by the learners
themselves (Kilpatrick, 1947). The theory is based on philosophical approach referred to as Pragmatism,
which states that an ideology or proposition is true if it works satisfactorily. Kilpatrick (1939) noted that
in order to participate successfully in a progressive environment, classrooms must shift from a passive to
an active role. Progressivism theory emphasizes that learners should synthesize several sources of
information and references in order to draw conclusions and then evaluate them (Dewey, 1938). The
theory advocates for learner-centered teaching approach where students learn through action and
involvment in processes that will get to the end product rather than memorization.
Progressivism theory is relevant to this study since it emphasizes on learner-centered teaching approaches
such as collaborative learning, experimentation, group discussions, demonstration and contextual
learning. The theory has special focus on the learner that allows them to exercise their brain through
problem solving and critical thinking to enhance effective learning. Consequently, learner's brain
develops and hence preparing the learner for real world and many of the everyday setbacks. In teaching
mathematics, progressivisms stress that learner should construct new ideas to help one to have a better
understanding of reality.
RESEARCH METHODOLOGY
This study employed descriptive survey research design. This research design was chosen because it
allows the researcher to study the phenomena without manipulation of the variables. The independent

Proceedings of the Third International Research Conference held on 26th to 28th October, 2016 296
variables in this study were Progressivism`s learner-centered approaches while the dependent variables
were learner-related factors. Two methods of technical philosophy; critical analysis and conceptual
analysis approach were used to reinforce the research design to enhance elaborate description of the
phenomena under study.
Conceptual Analysis Approach
The conceptual analysis approach involves breaking down the main ideas into constituents through the
process of analysis and synthesis. The main aim of conceptual analysis approach is to clarify the language
used as well as analyzing the concepts expressed in it. In order to clarify the concepts such as learner-
centered approaches, teaching and learning, it was necessary to use conceptual analysis approach.
According to Ogola (2011) some of the philosophical problems are as a result of the complexities of the
language since certain concepts may have several uses and hence it may be a fallacy to the users.
Conceptual analysis was used to ensure that whatever was said about the concepts was said clearly in
order to eliminate any possible fallacy.
Critical Analysis Approach
According to Njoroge and Bennaars (1986) the critical analysis approach points to positive evaluation as
it seeks to evaluate and to judge things based on clear and distinct ideas. The approach is characterized by
asking probing questions to establish merits and demerits of an issue, where answer to one question leads
to another question. This approach was used in making rational judgments on how the philosophy of
progressivism has affected mathematics teaching in Primary schools.
RESEARCH FINDINGS AND DISCUSSION
Pupils’ Demographic Characteristics
An item on the pupil’s questionnaire inquired on their gender. Figure 1 illustrates the gender composition
of the pupils’ respondents.
Figure 1. Distribution of Pupils by Gender
A total of 352 pupils took part in the study. According information represented on Figure 1, majority
(56%) of the pupils were males while their female counterparts formed 44% of the pupils sampled. An
item in the pupils’ questionnaires enquired about their age and the findings are illustrated in Table 1.

Proceedings of the Third International Research Conference held on 26th to 28th October, 2016 297
Teachers’ Demographic Characteristics
An item on the teacher’s questionnaire inquired on their gender. Figure 3 illustrates the gender
composition of the teachers sampled.
The total number of mathematics’ teachers who participated in the study was 17 of which the males were
the majority (76%) and the female were minority (24%). The study required mathematics teachers to
provide their age in the questionnaire. The findings are shown in Table 3.
Figure 3. Distribution of Mathematics Teachers by Gender
Table 3. Age Distribution of teachers
Age (Years) Frequency Percentage
20-30 6 35.4
30-40 4 23.5
40-50 4 23.5
50-60 3 17.6
Total 17 100.0
The information in Table 3 shows that 35.4% of the mathematics teachers were within the age bracket of
20 to 30 years while 17.6% of the teachers sampled were within 50 to 60 years. The profession
qualification of the mathematics teachers are presented on Figure 4.

Proceedings of the Third International Research Conference held on 26th to 28th October, 2016 298
Figure 4. Professional Qualification of Mathematics Teachers
The study findings show that 35% of the mathematics teachers sampled were qualified with diploma, 18%
were untrained and those who held bachelors’ degree comprised 18% of the teachers sampled. An item on
the teacher’s questionnaire inquired on the duration served in their current stations and results illustrated
in Table 4.
Table 4. Duration served by mathematic teachers
Duration (Years) Frequency Percentage
0 – 3 7 41.2
4 – 6 5 29.4
7 – 9 3 17.6
10 and above 2 11.8
Total 17 100.0
Based on findings in Table 4, 41.2% of mathematics teachers had served on between 0 to 3 years in their
current station. Those mathematics teachers who had served for 10 years and above in the current station
were the minority (11.8%). In addition, mathematics teachers were required to state their teaching
experience and the findings are illustrated in Table 5.
Table 5. Mathematic teachers’ teaching experience
Duration (Years) Frequency Percentage
Less than 5 years 3 17.6
5 – 10 9 52.9
11 – 15 2 11.9
15 and above 3 17.6
Total 17 100.0
The findings in Table 5 show that 52.9% of the mathematics teachers had teaching experience ranging
between 5 to 10 years. Mathematics teachers whose teaching experience ranged between 11 to 15 years
were minority constituting 11.9% of the teachers sampled. In Progressivism point of view, experienced
teachers are the best in conducting learner-centered approaches since they possess the necessary teaching
skills. It has also been found out there exists a positive relationship between teachers’ experience in
teaching methods and learners’ attitude towards learning of mathematics (SMASSE, 1998).
Teachers’ Related Factors

Proceedings of the Third International Research Conference held on 26th to 28th October, 2016 299
The fourth objective of the study was to critically analyze the teacher-related factors and how they
affected application of Proggressivit’s learner-centered approaches in teaching and learning of
Mathematics. The questionnaire contained open-ended questions that enquired on how the given teacher
related factors namely: teachers’ qualification, experience, preparation, beliefs and attitudes affected
teaching and learning of mathematics among pupils in public primary schools of Meru South Sub-County,
Kenya. The findings are summarized in Table 6.
Table 6. Teachers’ opinion on teachers related factors
Teachers Related Factors Agreed (%) Disagreed (%)
Qualification 100 0
Experience 88.2 11.8
Preparation 88.2 11.8
Beliefs and Attitudes 88.2 11.8
Table 6 summarizes the findings of the teachers’ opinion on those who agreed and disagreed that the
given teacher-related factors affect application of progressivists’ learner-centered approaches in teaching
and learning of mathematics. Several points were noted regarding effects of teachers’ qualification on
teaching and learning of mathematics. It was noted that teachers who had good background in
mathematics were highly motivated when teaching the subject than those who performed poorly.
However, teachers with poor background in mathematics were noted to lower pupils attitude in learning
the subject. On the other hand, teachers with degrees and specialized in mathematics taught with ease than
untrained teachers who lacked enough knowledge on the relevant teaching techniques as compared to
trained teachers and hence they teach based on their own opinion and convinience.
The researcher noted that Meru South Sub-County experienced low teacher to pupils’ ratio which
contributed to hiring of untrained and inexperienced teachers. Teachers’ qualification, experience and
attitude towards mathematics were not considered when hiring the teachers by schools’ board of
management. Smith (1992) refers to mathematics knowledge for teaching as knowledge that is specific to
the profession of teaching and is closely linked to student achievement. In a study carried by Ball (2005),
on the effects of teachers’ knowledge on students’ achievements, the results showed that teachers who
scored higher on mathematics knowledge also produced learners with better grades than their counterparts
who scored low on mathematics knowledge. Ball (2001) argues that mathematics instruction is effective
through the use of reform ideas as well as using strategies which all depend on teachers’ knowledge of
mathematics. Teachers’ knowledge is pivotal in their capacity to provide effective mathematics
instruction and to their ability to influence learners’ attitude.
The study findings shows that 88.2% of the teachers agreed that teachers’ experience affected application
of progressivists’ learner-centred approaches in teaching and learning of mathematics where several
points were mentioned to back the responses: Teachers with more than ten years experience in teaching
mathematics had good mastery of the subject and taught with ease; explanations and activities given in
class by experienced teachers were said to be clear and made pupils to enjoy learning. The respondents
noted that the more experienced a mathematics teacher was, the more easily he /she understood pupils’
learning behaviour and hence chose the most appropriate teaching approach that fit individual leaner.
Experienced mathematics teachers were noted to be motivated especially when conducting practical
lessons and demonstrations since they were aware of the results and hence did not fear for possible
disappointment. In addition, teachers with long time teaching experience were said to have personal
experiences with different teaching approaches and were more likely to choose those that would boost
learners’ understanding.
Philosophy of progressivism states that teacher's role is not only to observe and assess but also to engage
with learners as they complete learning activities while posing questions to them for promotion of their
reasoning. Teachers’ experience in guiding and supervising learners is therefore regarded as a major asset
to their careers. However, the findings in Table 5 show that majority of mathematics teachers in Meru
South Sub-County have short-time experience of between 0-3 years. You (2009) describe experience as a
Proceedings of the Third International Research Conference held on 26th to 28th October, 2016 300
long period of practice for a period of five years or more during when an individual, who is skilled, takes
in developing an activity, or mastering a process. Madsen and Cassidy (2005) claim that experienced
teachers are more critical in their classroom teaching than untrained teachers. Learners find the course
materials given by experienced teachers interesting and meaningful and explanations as well as activities
given in class are clear (Madsen and Cassidy, 2009).
Teachers agreed that teachers’ beliefs and attitudes affected application of progressivists’ learner-centered
approaches in teaching and learning of mathematics and they had severel responses: the ability to solve
mathematics problems is hereditary not learned; men are better in solving mathematics problems that
ladies; the main objective of doing mathematics is getting the answer; the ability to solve mathematics
problems requires good memory; some people have a “math mind” and some do not; there is a magic key
to doing maths. Progressivits hold that teachers’ belief and attitude about mathematics largely shapes the
pedagogy they use hence the response they obtain from their students. Relich (1994) observes that a
positive teachers’ attitude contributes to the formation of pupils’ positive attitudes towards mathematics.
Critical analysis of the responses from mathematics teachers portrayed negative beliefs towards
mathematics which confirmed the source of their pupils’ negative attitude and their low performance in
mathematics. This implies that teachers’ attitude towards the subject produces the same attitude on the
learner. Biggs (1995) shows that classroom strategies used to teach are influenced by teacher attitudes,
which in turn influence pupils’ attitudes. Ernest (2000) noted that teachers who hold more learner-
cantered, socio-constructivist oriented beliefs would translate into their classroom practices greater
enthusiasm towards actively engaging their learners in acquiring mathematical concepts and developing
mathematical thinkers and problem solvers.
On the effects of teachers’ preparation on teaching and learning of mathematics, majority of the teachers
agreed that it affected application of progressivists’ learner-centred approaches in teaching and learning
of mathematics and several points were noted from teachers: teachers preparation through lesson plan
result to effective lesson presentation while taking into concern various learners’ needs; teaching
preparation enable teachers to allocate sufficient time to different topics using the most appropriate
teaching approach; teachers’ preparation and planning make it possible for enough time to be set for
practicals and for learners’ individual learning; teachers’ preparation enable him /her to take into account
variables such as pupils’ ability levels, pupils’ previous experience, and availability of resources before
mathematics lesson. This enables teachers to play their different roles such as setting the stage, guiding,
supervising individual and group work, controlling the class and allocating roles to pupils.
During the teachers’ interview, more teachers’ related factors were observed that affected teaching and
learning of mathematics were noted. Majority of the teachers complained that their income was small and
demotivating despite the high cost of living hence demotivating them. Teachers stated that they were
forced by circumstances to seek for alternative sources of income in order to complement their income,
which lead to absenteesm in schools and low teaching morale. The interviewees mentioned that the
teacher-pupil ratio was declining following introduction of free primary education in 2003 when the
number of pupils has increased at a higher rate than teachers. This compelled teachers to apply teacher-
centered approaches such as lecture method despite their ineffectiveness in teaching mathematics. To
mitigate the impact, school managements opted to hire untrained teachers, who had limited knowledge on
learner-centered teaching and learning approaches, which are the best for learning mathematics.
Further critical analysis of the findings revealed that majority of primary schools mathematics teachers in
Meru South Sub-County lacked motivation, which leads to poor planning and lack of adequate
preparation for their mathematics lesson. Cook and Hazelwood (2002) claimed that teacher preparation is
vital for effective teaching and learning process. Planning is a requirement for any program to succeed as
it is an arrangement or a method for doing something. Since planning is a future intention to act in a
certain way in order to achieve set objective, it is a process of arranging and organizing how to do
something carefully in advance (MoEST, 2001). Inadequate teachers’ preparation was an indication of

Proceedings of the Third International Research Conference held on 26th to 28th October, 2016 301
extensive usage of teacher-centred teaching approaches within the area of study given that learner-centred
approaches demands for thorough preparation prior to the actual lesson.
As advocated in Progressivists’ learner-centered approaches, Kilpatric (1951) said that as one plans for a
group of learners he/she needs to engage in “task-analysis”, which requires the teacher to take the content
that is to be taught; first, identify the desired results from learning of the content; secondly, break the
content into smaller components or sub- tasks that logically build towards the desired results; and finally,
define appropriate teaching approaches for each of the components and specify lesson objectives.
Several teacher-related factors of teachers’ qualification, experience, preparation, beliefs and attitudes
affect application of Proggressivists’ learner-centered approaches in teaching and learning of Maths.
RECOMMENDATIONS
Following the findings, the following recommendations were made:
To avoid mathematics teachers playing central roles, pupils should be taught how to identify the
mathematical operations needed to solve the problem. This should be done through a combination of
keywords, drawing pictures and acting out the problem with manipulative and creative approaches. In
addition, teachers should ensure that pupils always use a combination of methods to arrive at the
correct operation in order to increase their general problem-solving ability, regardless of whether the
problem is at home, at school, or somewhere in between.
To enable the teachers provide individual attention to learners, curriculum planners, developers, and
designers should consider several factors in mathematics syllabus such as every topic to be
accompanied with practical lesson, content to be reduced for quality coverage and class size to be less
than 40 pupils.
REFERENCES
Abercrombie, M. L. (2000). Aims and Techniques of Group Teaching. Surrey, England: Society for
Research into Higher Education.
Antler, J. (1982). Progressive Education and the Scientific Study of the Child: An Analysis of the Bureau
of Educational Experiments. Teachers College Record 550-591.
Ball, D. L. (2003). What Mathematical Knowledge is Needed for Teaching Mathematics? US Department
of Education: Secretary’s Summit on Mathematics.
Biggs, J. (1979). Individual Differences in Study Processes and the Quality of Learning Outcomes.
Higher Education, 381-394.
Biggs, J. (1995). Student Approaches to Learning, Constructivism and Student-Centered Learning:Paper
Presented at the Improving university teaching: Twentieth International Conference 10-13 July.
Hong Kong.: University of Hong Kong.
Bode, B. (1998). Progressive Education at the Crossroads. New York: Newson and Co.
Bolin, A. U., Khramtsova, I. and Saarnio, D. (2005). Using student journals to stimulate authentic
learning: Balancing Bloom’s cognitive and affective domains. Teaching of Psychology,
32(3):154-159.
Bruffee, K. A. (1984). Collaborative Learning and the "Conversation of Mankind". College English,635-
680.
Cook, E. D. and Hazelwood, A. C. (2002). An active learning strategy for the classroom "Who wants to
win some Mini Chips Ahoy?”. Journal of Accounting Education, 20:297–306.
Dewey, J. (1944). Democracy and Education. New York: Free Press.
Dewey, J. (1938). Experience and Nature. New York: Dover Publishers.
Elliot, J. (1999). The Principles of Learner-Centred Education and Teachers’ Construction of Knowledge
Through Practice-Based Inquiry. England: Centre for Applied Research in Education,University
of Anglia.
Felder, R. M. and Brent, R. (1996). Navigating The Bumpy Road to Student–Centered Instruction.
Retrieved February 16, 2015, from College Teaching: http://www.ncsu.edu/felder-
public/Papers/Resist.html

Proceedings of the Third International Research Conference held on 26th to 28th October, 2016 302
Giangreco, M. (1993). Using creative problem solving methods to include students with severe
disabilities in general education classroom activities. Journal of Educational and Psychological
Consultation , 4:113–135.
Hayes, W. (2007). Progressive Education Movement: Is it Still a Factor in Today's Schools? Lanham:
Rowman and Littlefield Education.
Holt, J. (2004). How Children Fail. New York: Pitman.
Johnson, D. and R.T, J. (1989). Cooperation and Competition: Theory and Research. Edina, MN:
Interaction Book Company.
Laturner, R. (2002). Teachers‟ Academic Preparation and Commitment to Teach Math and Science.
Teaching and Teacher Education, 653-663.
Kilpatrick, W. H. (1926). Education for a Changing Civilization. New York: Macmillan.
Kilpatrick, W. H. (1932). Education and Social Crisis: a Proposed Program. NY: Liveright, Inc.
Kilpatrick, W. H. (1936). Remaking the Curriculum. New York: Newson and Company.
Kilpatrick, W. H. (1947). Intercultural Attitudes in the Making: Parents, Youth Leaders, and Teachers at
Work. New York: Harper.
Kilpatrick, W. H. (1949). Modern Education and Better Human Relations. New York: Anti-Defamation
League of B’nai B’rith.
Kilpatrick, W. H. (1949). Modern Education: its Proper Work. New York: John Dewey Society.
Kilpatrick, W. H. (1951). Philosophy of Education. New York: Macmillan.
Ma, L. 1999. Knowing and teaching elementary mathematics: Teachers' understanding of fundamental
mathematics in China and the United States. Mahwah, NJ: Lawrence Erlbaum Associates.
Madsen, K. and Cassidy, J. W. (2009). The effect of focus of attention and teaching experience on
perceptions of teaching effectiveness and students learning. Journal of Research in Mathematics
Education.
Njoroge, R. and Bennaars, G. (1986). Philosophy and Education in Africa. An Introductory Text for
Student of Education. Nairobi: TransAfrica Press.
Nurrenbern, S. C. and Robinson, W. R. (1997). Cooperative Learning. A Bibbliography, 74:623-624.
Ogola, F. O. (2011). A Critique of 'Individual Fulfilment' as a Goal of University Education Among
Undergraduates in Kenya. Nairobi, Kenya: Egerton University Press.
Ormrod, J. (2008). Human learning (5th ed.). Upper Saddle River, NJ: Pearson Prentice Hall.
Phillips, D. (2000). Constructivism in Education: Opinions and Second Opinions on Controversial Issues.
Chicago: University of Chicago Press.
Radu, L. (2011). John Dewey And Progressivism in American Education. Bulletin of the Transilvania
University of Brasov , 4 (53) (2):1-6.
Romberg, T. A. (1984). Classroom Tasks, Instructional Episodes, and Performance in Mathematics.
Proceedings of the 8th International Proceedings of the 8th International, 116-126.
Salau, M. (2000). Options in Sustaining Mathematics as the Language Science and Technology in the
21st Century. Paper Presented at the Annual Conference of Mathematics Association of Nigeria
(MAN).
Sarason, Y. and Banbury, C. (2004). Active learning facilitated by using a game-show format or who
doesn’t want to be a millionaire? Journal of Management Education, 28:509–519.
Whetten, D. A. and Clark, S. C. (1996). An integrated model for teaching management skills. Journal of
Management Education, 20:152–181.
******

Proceedings of the Third International Research Conference held on 26th to 28th October, 2016 303
THE ROLE OF ARTS, HUMANITIES AND SOCIAL SCIENCES IN SUSTAINABLE
DEVELOPMENT
DRAMA AND ORALITY IN KENYA’S RADIO ADVERTISING
Njogu, J.G.
Department of Arts and Humanities, Chuka University, P. O. Box 109-60400, Chuka
ABSTRACT
The relationship between drama, cultural practice and electronic media in Kenya is built around a history
of intricate relationships informed by history, aesthetics and values adored by the African people since
time immemorial. By function, drama has always addressed cultural, historical and emerging themes. For
quite some time now, it has become a very fashionable technique of advertisement production in Kenya,
yet research on drama as a persuasive genre remains scant. This paper examines the relationship between
advertisement drama in radio and indigenous literary practices of the African people. It is based on the
assumption that since the purpose of advertisements is to influence mass buyers, the choice of drama
genre by advertisers imply that it possesses unique persuasive elements that can render for scholarly
analyses. Since radio is a purely oral-acoustic medium just like primary orality, elements of primary oral
cultures serve to enhance the expressiveness of radio-mediated advertisements. The paper begins from
awareness that drama has always been a cultural production in Kenya, and that indigenous literary forms
have always punctuated dramatic experience at every phase of its development both in content and style.
Using a qualitative design, data is in the form of audio recordings of advertisements that use the technique
of drama in radio. These are transcribed, translated and analyzed to arrive at conclusions about the
persuasive strategy of theatre in the radio medium. Walter Ong’s theorizing about transiting from primary
orality to typographical forms will enable us understand the psychodynamics of how audio messages are
crafted to resonate with those who hear them. Ong’s ideas about the notion of ‘imagined audiences’ will
also be used. These ideas enable us examine how advertisers imagine their audiences via virtual
experience. It is expected that aspects of indigenous literary forms will manifest, and that these elements
have rhetorically latent. It is also expected that the language in theatrical ads will be uniquely fashioned to
persuade, and that these adverts will reveal how their consumers understand the world around them.
Keywords: Orality, Drama, Persuasion, Narrative structure
INTRODUCTION
Understanding Kenya’s Dramatic Radioscape
The average person in both Africa and the Western world is bombarded with several adverts of various
kinds each day: billboards, radio blurbs, Television commercials, newspaper and magazine adverts, film
trailers, product placement in films and direct personal contact with marketers among others. Advertising
is a pervasive part of daily living in any consumerist economy. Considering that the objective of any
advert is to grab consumer attention and influence expenditure patterns, and realizing that advertising
costs lots of money, advertisers ordinarily select those strategies they believe will work best. Key among
these in Kenya has been the use dramatized slices of life.
Research has shown that drama conveys messages better than arguments. (Wells, 1988; Leong, 1994).
Whereas lectures and expositions are very good at conveying information, drama evokes references and
previews feelings that the product in question can produce. As Wells notes, the logic associated with
arguments does not always work, because arguments tend to invite counter-and-support-arguments. On its
part, drama establishes verisimilitude, that quality where characters appear plausible and authentic, ans so
it draws the audiences into the commercial by identifying with the characters and the events in it.
In Kenya and Africa at large, drama has been an integral part of cultural and artistic expression since the
early times. Before the coming of literacy to Africa it existed as ritual and play (Mwangi and Chesaina,
2004; Kerr, 1995; De Graft, 1976). Cultural education was transmitted through various creative episodes
dramatized during circumcision ceremonies for boys and girls, enthronement and dethronement of kings,
birth rituals, funerals and children’s imitative plays among other countless ritual activities of the African
cosmology. Colonization brought Western theatrical practices in the continent, mainly to rival the

Proceedings of the Third International Research Conference held on 26th to 28th October, 2016 304
indigenous forms which were associated with paganism and witchcraft (Adelugba and Obafemi, 2004;
Diawara, 1994; Rakodi, 1997; Kehinde, 2004; Nandwa and Bukenya, 1983). However, by the time Kenya
attained independence in 1963 both strands existed side by side. Theatre emerging thereafter was a
hybrid, with borrowing geared towards cultural relevance but in most cases through English expression.
It is also during the colonial period that radio came to Kenya. The Kenya Broadcasting Corporation
(KBC) was launched in 1928 with a view to informing the settler about events back at home and around
the colony. Little is known about radio theatre then since most of the content was prepared outside the
country and only a handful of Africans had analytical competencies to record or comment intellectually
about the new media. This is partly because few could understand English. Even the few who probably
understood the ‘white language’ may not have had professional literary interests (King’ara, 2010; Kerr,
1995; Heath, 1986). Broadcasts in African languages of Kiswahili, Kikamba, Kikuyu, Kinandi, Kiluhya,
Dholuo and Arabic were started much later in 1953. These broadcasts struck quick rapport with African
audiences because of their linguistic familiarity, familiar social stereotypes and indigenous literary motifs
as they commented on the various facets of the social situation (Kerr, 1995). In these broadcasts, theatre
was a major item in programming. KBC changed to Voice of Kenya (VOK) at Independence, and later to
KBC again in 1989 through an act of parliament. This did not change much in terms of programming
content (Ligaga, 2006). It was not until 1982 when the serial Radio Theatre was first produced on KBC
by the late Nzau Kalulu. This was a dramatized serial running for around thirty minutes per episode per
week. The programme was produced in line with the ideals of Theatre for development (TfD) in that it
addressed developmental themes such as patriotism, morality, family planning, education and health. By
this time, KBC was the only radio station operating in Kenya (Ligaga, 2006).
When Kenya became a democracy in 1992 many more radio stations were licensed, freeing the listeners
from the monotony of mainstream KBC and her vernacular subsidiaries. An opportunity arose for
opening up spaces for greater variety of art. Liberal vernacular radio stations came with the licencing of
Kameme FM in 1996 (Nderitu, 2008). Many other vernacular radio stations followed, informed by their
instant popularity with mass listeners. For instance, the dramaturgy Mucii ni Ndoogo and Utuku wa
Mathekania became very popular on Kameme FM. These programmes focused on addressing society
through humour. Since the advent of multi-radioism in Kenya, the national radioscape has expanded
tremendously, and radio has kept close association with masses because of cultural awareness, variety in
entertainment, instant transmission of issues affecting people in the villages, low purchase and
maintenance costs, portability, humour and wide reach. It is possible that today a majority of Kenyans
have access to a vernacular radio station, and that these stations have dramatic content. This popularity
can be contrasted with other media such as magazines, television, video and social media platforms which
combine colour, motion and sound, yet find much less attraction to advertisers compared to radio.
According to President Uhuru Kenyatta’s Hero’s day speech on 20th October, 2015, there were 126 radio
stations in Kenya, and many more were waiting licensing by the Communications Authority of Kenya
(CAK). The popularity of the medium has recently attracted substantial studies (Ligaga, 2006; Odhiambo,
2007; Njogu, 2009; Wa Wanjiru, 2011), all focusing on TfD. On these radio spaces, there has been an
upsurge of dramatized advertisements intended for mass persuasion.
Understanding Kenyan Drama from Oral Traditions
Any modern study of theatre in Africa must visualize in retrospect the pre-literate era when all forms of
communication and entertainment were orally transmitted, before moving on to see how these rich
traditions have influenced any emergent forms. Kerr and Chifunyise (2004) observe that “Any study of
theatre in an African region must stumble against the conceptual boulder of indigenous performing arts
because they form the bedrock of the attitudes and practices on which modern theatre is built” (p. 265).
Additionally, African theatrical histories have all along been defined by inter-relationships between
people in their cultural milieu, aesthetics, social dynamics and technology. Lihamba (2004) notes that
theatre and people in Africa have a great bearing on “inputs brought about by technological
developments, population and social movements from within and outside the African continent, as well as
the creativity, dynamism and ingenuity of the people as they respond to developments and changes

Proceedings of the Third International Research Conference held on 26th to 28th October, 2016 305
individually and collectively” (p.233). Theatre carries along with it rich dialogues informed by both
tradition and emerging issues of all kinds, and can thus be analyzed from divergent points. Unfortunately,
in most accounts of African theatre, analysts give only a passing genureflection to indigenous
performance before passing on to emerging themes. Proper analyses should be guided by awareness of
African indigenous literary cum ritualistic practices. The indigenous form must be seen as a foundation
upon which modern discourses borrow. Orality should not be seen merely in the prism of tradition, but a
form that metamorphoses and catalyses contemporary cultural productions. It should be interrogated to
see how it continues to influence how Kenyans perceive the world today. The idea is not to merely
identify elements of oral tradition and argue for their occurrence in modern persuasion, but to explore the
applications, meanings and themes they relate to in the broader context of commerce and society.
In the analysis of oral products in modern contexts, it is necessary to examine the various ways in which
cultural, historical and contemporary situations intersect. As Gemeda (2012) observes, in attempting to
study contemporary discourse using traditional orality the best approach would be attempting to
understand how the oral form was conceived in the past, and then seek to develop concrete opinions about
that tradition, and thereafter locate representative forms that are of contemporary relevance rather than
examining orality as a purely traditional form, and the modern researcher as merely a literary historian.
It is true that African orality is the raw material upon which subsequent cultural production is built. As
Lindfors (1977) observes, African folklore is no different from the vast uncultivated, unexplored,
undiscovered mystical terrain of Africa, with huge quantities of minerals like gold and diamonds. Our
folklore, by implication, has not, and cannot be exhausted, and all that is required is greater energies to be
directed at its exploration, documentation, application in diverse situations of modern day and enjoyment.
The tendencies to see orality as old ought to be discarded because in reality, orality is ever changing to
adapt to emerging needs. Waugh (2006) notices that instead of seeing orality in terms of specific, fixed
and concrete entities, we should see it as a dynamic process of differentiation.
Understanding the cultural influences on the advertising landscape entails an awareness of a nation’s
cultural contexts. Kenya is an East African country beautifully incised by The Great Rift Valley which
runs from North to South, leaving behind numerous lakes, geysers and other land forms which are habitat
to a variety of wildlife species, including elephants, antelopes, flamingoes and all kinds of flora and
fauna. It is also divided right in the middle by the equator, making it experience excellent weather all year
round. These natural gifts, among others, set the country apart from any other in the world. On her coast
is the Indian Ocean whose coastline is laden with various swamps and East African mangroves. It is home
to Fort Jesus, an ancient landmark that is testament to colonial occupation of East Africa. Western Kenya
is characterized by mountains and several rainforests, including Kakamega and the Mau Forest, the
largest forest complex in East Africa. Lake Victoria, home to the Luo peoples, is Africa’s largest fresh
water lake. Central Kenya is home to Africa’s highest mountain, Mt. Kenya. There is not one region in
Kenya without geographic idiosyncrasies that attract hordes of tourists or film makers each year. Living
around these features are ethnic communities, each with unique cultural beliefs and practices. The nation
is hodgepodge of roughly forty two ethnic, and consequently, cultural entities.
The geographical features littering the landscape have informed performances and their content. The
people living around these features constitute unique ethnic identities and the interaction between them
and their physical environment provides contrasting cultural, spiritual, social and aesthetic elements, and
the emergent discourses can best be understood in these contexts.
Since tradition, oral art in its various genres played conspicuous roles in the lives of people. Stories,
proverbs and songs were not confined to professional performers. It was a free activity. Nandwa and
Bukenya (1983) note that: The spoken word, especially in the form of oral performance, was at the heart
of the African mental, spiritual and social activity…African religious, philosophical, legal and political
concepts and precepts are expressed in it, and it contains the highest forms of creative and artistic
entertainment (p.24).

Proceedings of the Third International Research Conference held on 26th to 28th October, 2016 306
Myths, legends, folktales, songs, epics, proverbs, wise sayings and tongue-twisters were known by heart,
and practiced across the age spectrum. Each of these genres has specific characteristics, specific contexts
and specific audiences. Proverbs for instance, are characterized by terseness, memorability and
invariability, and were an important marker of adult wisdom and experience, the reason they could only
be used by the elder members of society to caution or advise the younger ones. Miruka, (1999) observes
that proverbs were also used in “embellishment to speech” (p. 110).
The modern dramatic form is thus a reflection of the ‘Kenyan myth’ constructed for thousands and
thousands of years that the African people have inhabited their space. Almost every community in Kenya
has a myth about creation and being. Indeed, it is possible that every Kenyan has heard a narrative from
his community. These stories exist because it is a natural characteristic of myth to ‘convey truth’. People
don’t doubt myths. They reinforce communal unity, and create a sense of ethnic uniqueness that no one is
ready to give away. Other than their inherent functionality, each of these genres served to bring people
together. This way, they were mass movers.
Adoption of Orality in Radio Drama
African scholars who took over radio production and programming after independence adopted the
traditional form and transformed it to suit the needs of mass consumption. They realized that a majority of
the people in Africa’s rural areas were not conversant with foreign culture and ideology (Kerr 1995). The
radio of today has merely revisited the oral popular culture to inform and entertain. Bazin (1979) notes
that the modern artist “has at his disposition a treasure, a patrimony from which he selects elements with
which he re-composes a product which is at least partially new” (p. 450). In his view, the history of
creativity involves, to a large degree, a process of production and reproduction.
Radio remains the most dominant medium owing to a number of factors. It has wide penetration in both
public and private lives of the people. It is to be found in homes, public service vehicles popularly known
as Matatus, computers, mobile phones and cars. It is free of charge, and meets the listener at his
convenience. Arens et al (2011) further describes the radio as a medium that “provides entertainment or
news to listeners who are busy doing something else – driving, washing dishes, reading the newspaper or
even studying” (p.395). It is therefore evident that geographical spread, cost-effectiveness and
adaptability to mass audiences naturally makes radio a preferred medium for popular expression
(Diawara, 1994, Kerr 1995).
Theoretical Framework
The paper analyses the workings of ‘cultural theatre’ within ‘advertising’ in the ‘media’, all of which
distinct academic disciplines. For this reason, a multi-faceted theoretical approach is proposed. The key
analytical criteria derive from Walter Jackson Ong’s concepts of orality in Orality and Literacy: The
Technologizing of the Word (1982). In this work, Ong’ draws the distinctions between chirographically
based thought (primary orality) on one hand, and secondary orality and other forms of typographically
based thought on the other. In this paper we examine how the aspects of primary orality he identifies may
be used to understand radio-orality. Secondly, he examines how oratory through electronic media
employs the notions of ‘imagined audiences’.
Ong defines primary orality as “oral cultures untouched by writing” (31). He isolates elements which
describe the nature and workings of primary oral cultures, and which provide insights into how all such
spoken discourse may be understood.
First, he notes that oral discourses are characterized by inbuilt mnemonic devices and formulae. These are
the structures within utterances that enable hearers to recall them with ease. Once words leave the mouth
of the speaker they cannot be recalled, and therefore they require frames of memory built within the
utterances themselves. He says that such mnemonic patterns are reinforced by: heavily rhythmic,
balanced patterns, in repetitions or anti-thesis, in alliterations and assonances, in epithetic and other
formulary expressions, in standard thematic settings, in proverbs which are constantly heard by everyone

Proceedings of the Third International Research Conference held on 26th to 28th October, 2016 307
so that they come to mind readily and which themselves are patterns for retention and readily recall, or in
any other mnemonic form (P.34).
Second, Ong notes that oral expressions are message-centred rather than syntax centred. The utterances
are concerned more with the convenience of their speech rather than the grammatical organization or
correctness of the discourse. The utterance is thus focused more on its purpose and comfort with which
the particular speaker utters it. The expressions are least concerned with their own redundancy. They may
carry a load of epithets and adjectives and other formulaic baggage which literacy rejects as redundancy.
In actual sense the adjectives acquire repetitive referencing.
Further, he says that in primary oral cultures knowledge is conceptualized and verbalized with close
reference to human world. Few statistics or facts are divorced from human or quasi-human activities. Ong
notes that “names of places and persons occur as involved in doings” (p.42). The cultures are not
concerned with preserving knowledge of skills as an abstract, self-subsistent corpus. Speech refers to
what the hearers can perceive and appreciate as their own. There are no abstractions of any kind. Ong
observes that: In practical matters no one operates in formally stated syllogisms. Oral culture does not
deal in such items as geometrical figures, abstract categorization, formally logically reasoning processes,
definitions or even comprehensive descriptions, or articulated self-analysis, all of which derive from
thought itself but from text-formed thought” (p.54).
Ong also explains that oral material is closely tied to the beliefs and practices of the community
producing it. The material is participatory and emphatic rather than being objectively distanced. Its
expression is ‘final’ and ‘true’, the same way myths operate in societies.
Finally, Ong notes that orality situates knowledge within a context of struggle. He observes that “proverbs
and riddles are not used simply to store knowledge but to engage others in verbal and intellectual combat”
(p.43). Such ‘flyting’ is characterized by both attractions and antagonisms. He notes that the other side of
agonistic name-calling or vituperation is the fulsome expression of praise, but such praise goes with the
highly polarized, agonistic, oral world of good and evil, virtue and vice, villains and heroes.
Orality, Intertexts and Imagined Audiences
In “Media and Human Communication” (pp. 171-173), Ong conceives the human mind as a ‘box’ taking
in units of information, encoding them, putting them through a ‘pipeline’ called medium, and on the
extreme end another mind encodes and ‘fits’ the message in his own box. The difference between the
encoded and the decoded messages is the medium which “massages the message” (p. 171). For the
process to be effective the speaker must also put himself in the receiver position because he expects a
feedback. As he speaks, he also listens to his own voice. Ong says that “to speak you have to address
another or others…; what I say depend on what possible responses I might anticipate” (p. 172). The
implication of this in an advertising atmosphere is that as the advertiser tells his story, he has ideas about
possible reactions of his audiences.
In this respect, the speaker must have established some virtual understanding with his listener prior to the
interlocutionary encounter. This could be through shared beliefs, past relationships or by an
understanding negotiated by a third party who brings the interlocutors together. The speaker does not
therefore fictionalize his audience since the social and cultural inter-text has been established. Ong sees
that for oral communication to be effective, some recipient must be present (physically or
psychologically), and that the interlocutors should be aware of the social and cultural contexts in which
they operate. As a person to person encounter, such engagements become performances.
AD#1 The Trickster Motif in Diamond Property Merchants
The ad Diamond Property Merchants is based on a cultural myth about communities in Kenya. Here, the
advertiser uses a cultural stereotype to draw conflict between a Gikuyu, Kenya’s largest ethnic group and
a Maasai, world famous for their varied traditions. The Agikuyu are known as money loving and astute in
business, while the Maasai are stereotyped as rural, unenlightened pastoralists. The advert, drawing from
Proceedings of the Third International Research Conference held on 26th to 28th October, 2016 308
this stereotype, uses a trickster motif and runs on Kameme FM, a Gikuyu vernacular station and therefore
the target audience is mainly Gikuyu.
When the advert opens it occurs that earlier, the Maasai man had sent his Gikuyu friend to get him a girl
to marry. The Maasai enquires if the girl has been found. He asks,
Hello Mzee,
Umenitafutia ile kitu?
(Hello Friend,
Have you found that thing?)
It then occurs that the ‘thing’ has been found with ‘Diamond Property Merchants’, a real estate agency.
The use of ‘thing’ denotes a secret, in that matters sexual are spoken in euphemisms. It also prepares
ground for the Maasai to be fooled. The use of ‘thing’ further serves to create suspense in the audience
because the only thing a Maasai would be looking for is his lost herd.
Curious like the listener, the Maasai wants to know where that kind of girl comes from. This is the turning
point of the drama, and the Gikuyu man answers a question with a question that reveals the ‘girl’. He
asks,
Turaria uhoro wa mutumia kana wa migunda?
Ningi mutumia ona wamuguraari
Ariikaraga rieraini ta hungu?
(Are we talking about a woman or land?
Even when you marry a woman,
Will she be living in the air like a hawk?)
The derogative simile ‘ta hungu’ and the rhetorical question is, to a Gikuyu listener, a mockery of the
pastoralist Maasai who has not discovered the worth of investing in land, and spends all his time looking
for girls. By extension, it is a metaphor for that Gikuyu who has not discovered that he needs to buy
himself a piece of land. It is a mockery of every Gikuyu who spends his money on rent and luxury rather
than buying a plot upon which he can settle a family. This notion promoted by the advertiser reinforces
the idea that investment in land is the vogue for any Gikuyu who wants to get rich quickly.
The setting reflects a contrast between ‘enlightenment’ and ‘idiocy’, represented here by the Gikuyu ad
the Maasai respectively. The Maasai confuses the term ‘Diamond Property Merchants’ with his
presumptive father – in – law. On the other hand, the Gikuyu hold the capitalist ideas that one should not
get a wife before he has put up a house for her. This is reinforced by the ad’s ending that ‘Tununue
shamba, alafu tutafute bibi’ (Let’s first buy land, and later look for a wife).
The trickery exhibited by the Gikuyu is a source of humour and cultural pride in investment wisdom
among Kikuyus. It is understood in the context of gentleman’s agreements done traditionally since there
was no writing or courts of law. The enticement of a girl throws mockery to the Maasai, and a non-
Kikuyu listener wonders whether the Maasai will be interested in the land deal after getting conned by the
allure of a beautiful Kikuyu girl.
The fun of the advert is further reinforced by stories in the minds of the audience about foolish men who
ask other men to help them hook a girl, only for the emissary to have the girl for himself. This, though not
stated in the ad, creates a comic relief for the Kikuyu audience who have within the patrimony of their
folklore or popular music such stories. It could actually mean that the Kikuyu man tricked the Maasai
man with the idea of land so as to have the girl for himself!. The question of a Maasai herder buying land
in the city, which is obviously exorbitant, could be seen as a diversionary strategy from the duplicity of
the Kikuyu man.
The ad utilizes cultural conflict to reflect emerging ways of thought. The Kikuyu man represents
independence, while the Maasai represents dependence. The simile ‘ta hungu’ points to ignorance on the
part of the herdsman on what comes first in life’s priority list.
Proceedings of the Third International Research Conference held on 26th to 28th October, 2016 309
AD#2 The Riddle Strategy in Equity Agent
The advert Equity Agent is meant to exhibit various services rendered by various agents of Equity bank
across the country by use of the riddle technique. Riddles are common in most East African communities.
They mainly involve two parties, with one posing a question and the other applying his reasoning,
intellect and his environmental or cultural awareness to crack the question for an imaginary reward.
Riddles are focused on testing one’s wit, and are the intelligence quotient (IQ) tests of the traditional
child. The riddling session ends up enlightening the person to which they are posed. Modifications to the
traditional riddling schema would be expected as people interact with life each day. For instance, whereas
traditional riddlers used gifts such as popular rivers, trees and animals as rewards, the modern riddle
forms provide gifts of money, happiness, prestigious universities or modern gadgets such as cars and
mobile phone models. Before the introduction of agency banking in Kenya, large queues were popular in
banking halls and ATM machines, especially around end-month. The purpose of the Equity Agent ad is to
enlighten the bank’s customers to embrace the agency concept rather than crowding banking halls.
The advert is informed by the need to inform the bank’s customers that they don’t have to go physically
into the banking hall to perform banking transactions, but can as well utilize the agents closer to them.
The bank is popular for the low segment of the banking population and often the banking halls are
overflowing with people. It is a mass bank and the advertiser reassures the customers that the message is
coming from “Benki uipendayo” (The bank you love). In riddles a question is posed in challenge and the
person to which the question is posed is expected to provide correct answers. If on first attempt he
doesn’t, he’s given another opportunity but if it gets hard to crack the puzzle he surrenders an imaginary
gift to the poser for the response to be revealed.
In this scenario, the poser asks, “Penye Equity Agent Pana?” This loosely translates into “What do you
find where there is an Equity bank agent?” The respondent then enumerates a number of services
available at Equity agents: Account opening, application for ATM services, Deposits and withdrawals, M-
Shwari services and so on. Contrary to expectation, the respondent gets the answer right, ending the
session. The riddling process is shortened to save the advertiser money in radio airtime. The concept of
the advert here is to make the bank customer aware of the services offered by the bank. The advertiser
probably expects the customer to figure himself in the riddling session. Being an old form, the riddle
situates the ad within cultural relevance. It seeks to make the concept of banking indigenous and
‘acceptable’ to those hearing it. The technique can therefore be seen as an attempt to ‘localize’ the
banking concept to the lower cadre of the economic ladder for which Equity bank is anchored.
The riddle, being an ‘old’ and consequently a popular form, situates the advert within cultural relevance.
It attempts to make the idea of agency banking ‘old’ and ‘traditional’ amongst a population that is
skeptical of technology. This way, he hopes that his idea will be acceptable by association. The use of the
riddle also points to attempts at anchoring the idea in rural areas where riddling sessions are common and
well entrenched. It is evident from its content that the ad attempts to allay all fears and suspicion that the
various agents are not recognized by the main banks. There is awareness that rural populations are
susceptible to conmen and counterfeits. The voice affirms that the agents “have been permitted by Equity
bank”. By reiterating that “tuko hapa kukuhudumia” (we are here to serve you), the bank reassures the
people of the Agents’ legitimacy as well as their commitment to alleviate the troubles of queues.
The advertiser is keen not to engage in the riddle at the expense of the message. As soon as the question is
posed, the respondent goes straight into enumerating the services found at Equity bank agents such as
deposits, withdrawals account activation loan applications and money transfers. Similarly, the poser is
quick to confirm that the response given is “correct!” This way, the riddle posed in the beginning serves
as a hook to the ad message.
AD#3 The Ogre in Pegasus
The advert “Pegasus” is built around an ogre story. In traditional ogre stories, the dramatic hero is faced
with a life threatening situation from which he is unable to extricate. The drama is set in the background

Proceedings of the Third International Research Conference held on 26th to 28th October, 2016 310
of a farmer’s home. Sounds of cows mooing and goats bleating can be heard. Here too, the advertiser
chooses the accent of a Maasai man. The man, in his ignorance of agricultural techniques, spells out his
frustrations about various kinds of insects which have invaded his farm, destroying all crops season after
season. The use of a Maasai as a farmer is a contradiction of the cultural stereotype that Maasais are
mainly herdsmen. The magnitude of his disillusionment is reinforced by the incessant scratching of his
head. The advert is set within an agricultural background, and the awareness that Kenya is largely an
agricultural economy is a necessity. The insects are not only a threat to the farm but to the farmer as well.
The insects invade his farm ‘like KDF’, he says. This simile recalls the involvement of the Kenyan
Defence Forces (KDF) in combating the Al-Shabaab terrorists within Somalia at the time of this advert.
In the social scene, the advert carries notions that despite the massive loss of Kenyan troops at the El-
Adde military camp within Somali and the death of a hundred and forty eight students in a terrorist attack
at Garissa University College, and earlier the slaying of several civilians at the Westgate shopping mall in
Nairobi, the KDF are a sting in the vein of terrorists whom it seeks to eliminate from the Horn of Africa.
Reference to the war is a real life reference at the time of the advert, as well as a mnemonic device. The
question of the ad’s morality does not arise here because the KDF is praised rather than demonized for
failing to protect students and civilians during the series of terror attacks. Whether the ad could be
interpreted as a mockery of the army is a question of cautious debate, but it is not explicit in the ad.
Similarly, for this farmer nothing seems to work. It is at this point that his friend emerges to inform him
of a new insecticide called Pegasus.
This advert recalls a sub-text that Kenya is mainly an agricultural economy where vast majorities of the
people depend on farming. The mention of insects that invade farms ‘like KDF’ is bound to attract quick
attention from listeners at such a time when Kenya is at war. It also magnifies the dilemma due to its
association with terrorism, and its effectiveness is largely in the choice of context and genre. Only a few
months before this, CNN had described Kenya as a ‘hotbed of terror’ prior to a visit in Kenya by US
president Barrack Obama in June, 2015. The substance of the ad is the struggle between good and evil.
The insects are analogized to terrorists who need no mercy. It is an urgent call to the farmer to arm and
attack the terrorist causing him pain by use of Pegasus, lest he gets finished.
AD#4 The ‘Direction Giver’ in New Dumu Zas
This advert is based on a stereotype that there are members of some Kenyan communities, especially the
drier areas, who will always mislead every time a traveller asks directions. Traditionally the navigation
technology we find in cars and mobile phones did not exist, and people relied on asking others for
direction. It is held that if you asked a person used to walking long distances for direction they will tell
you ‘it’s just here’ when in actual sense the distance is several miles. There is this myth that if you ask a
Kamba for direction he will tell you ‘Nwa Baa” (It’s just here), only to end up walking a hundred or so
miles. This advert involves two friends. One is interested in visiting the other’s new home. It is clear that
when the owner of the new house is confronted with the question ‘Buda, Kwako ni wapi by the way?’
(Friend, Where is your home by the way?), he’s not ready to reveal. So he quickly gets into giving his
friend cryptic instructions that will make sure his friend does not know the exact coordinates to his new
house. The question is unwelcome, and this is what sets the drama in motion.
The man decides to lie in the directions he gives. So he asks his friend to go down a road, turn left at the
junction, go all the way to the mountain, turn right, and walk up to the garage. When he sees the garage
he should know he has lost direction! The instructions get more comical and confusing, and the traveler
discovers that his friend does not want to reveal the direction to the new house. But since he’s familiar
with the landscape, he figures out that there is a new house that everyone thinks belongs to the Governor,
and upon further inquiry, the owner admits that the house is actually his. It then emerges that when one is
putting up a house he should choose the ‘New Dumu Zas’ iron sheets because they make houses
exquisite, and are durable.
The listener’s awareness of Kenya’s political landscape after the promulgation of the constitution in 2010
is important in understanding the advert. In this constitution, the government adopted a devolved system

Proceedings of the Third International Research Conference held on 26th to 28th October, 2016 311
of governance where resources were devolved to the country through forty seven counties headed by
Governors. The Governors emerged as very powerful personalities, as ‘presidents’ of the county
governments. It is not strange then that a Governor, with all his power and money and situated right in the
middle of rural villages, is the only person who can afford the extravagance of a posh mansion.
The advertiser makes ‘New Dumu Zas’ sheets ‘great’ by comparing his imaginary house to that of a
Governor. Notable still, is the fact that the advert comes at a time when the media is awash with reports
about the spendthrift behavoiur of some Governors. For instance, a few months earlier, it had been
reported that the Governor of Kakamega County had purchased wheelbarrows at over a hundred thousand
shillings each, yet the street value of a wheelbarrow is three thousand Kenyan shillings. Immediately
afterwards, there were reports that the Governor of Meru had bought curtains for county hospitals at
seven million shillings. The news were not taken kindly as many thought the Governors had misplaced
priorities so as to get an opportunity to steal public finances.
The ‘Governor’ is thus used as a symbol of expense in this advert. In a society engulfed by consumerism
and hedonism, expense is a symbol of social status. Whoever owns an expensive house belongs to the
high class. The beauty of the advert is in the realization that the owner has not looted, but has discovered
the secret to class by using ‘New Dumu Zas’ roofing sheets, which gives houses an executive finish.
The conflict in the ad also borders on peer competition, as seen in the owner of the house’s refusal to
identify the location of his new house, probably because he does not want his small trick to be imitated.
The complicated directions and references point to a peri-urban setting, with references to ‘Mama
Mboga’, ‘Garage’ and ‘Governor’. The language is also a mixture of codes, from English to Kiswahili
and Sheng.
The advertiser is aware of the capitalist thinking that each Kenyan should own a house. He is aware that
his audience harbor dreams of owning a home, preferably an expensive villa or an ocean-side mansion.
He also imagines that most people do not know how to give their bricks and mortar a beautiful finish. It is
an indirect attack on those who make beautiful plans but fail to realize that the beauty of a house is in its
roofing. The advertiser hopes that his audience, just like the man asking for directions, would seek to
discover the beauty of ‘New Dumu Zas’.
We find that there is little concern for the grammaticality of utterances, as long as the audience grasps the
message. In fact, it is right to argue that the grammaticality is in ensuring easy access to message by the
listener. The owner tells his friend that when he gets to the corner, he should “nyonga left”. This could be
transcribed as ‘murder left’, and has no meaning to an English speaker. He only means ‘turn left’. The
words are reinforced by emphasis of voice, which gives the advert an amazing aesthetic quality.
His words also point to both action and movement. He says,
Teremka na hii njia,
Uendeeee,
Ukifika kwa ile junction,
Nyonga left.
(Go down this road,
Then goooo
When you get to the junction
Turn left)
From the use of the onomatopoeic words such as ‘uendeee’ the listener can literary visualize movement
down the road. The struggle envisioned by the advertiser adds to the adverts mnemonics and overall
aesthetics. Instead of saying ‘No’ to the request by his friend, the owner of the house decides to take the
challenge and circumlocute in a comical way. This too acts as the attention magnet for this ad. He actually
‘forces’ the message on the ‘traveller’ because at some point, the asker feels that the owner of the house is

Proceedings of the Third International Research Conference held on 26th to 28th October, 2016 312
avoiding giving a direct answer. This is evident in the progression of exclamations to lamentations as the
dialogue moves along.
When the owner begins to give directions, his peer uses the exclamations ‘eh!’ and ‘Ehe’ to show
approval. These turn into ‘Aaai!’ ‘Ai!’ ‘Maaan!’, suggesting the distrust and the insincerity of his host. It
should be noted that on realizing the torment he’s giving his asker, the owner persists with ‘Wee
tulia!’(Be patient), indicating that the answer is intended to torment the asker.
CONCLUSION
This analysis demonstrates a special intercourse between drama and the world of business on one hand,
and the so-called ‘old’ literary form and the emergent and ever evolving on the other. It is evident that
advertisers have on various occasions fallen back to orality for persuasive effect, and that there is little
attention to grammatical correctness at the expense of ‘message’. It emerges that advertisement stories are
anchored on dramatic conflict, and that advertisers use the ‘drama of life’ as people live it, embellishit
with humour, sentimentalization and imagination, and that each of the adverts has culturally-based
attention grabbing and mnemonic devices for rhetorical effect.
REFERENCES
Arens W.F et al (2011) Contemporary Advertising and Integrated marketing communications (13th ed)
New York. McGraw-Hill
Banham, M. (2004) ed. A History of Theatre in Africa. London. CUP.
Carr, A.Z. (1968) ‘Is Business Bluffing Ethical?’ in Harvard Business Review. Vol. 46 (pg. 143-153). Mc
Graw Hill. New York.
Deighton, J.ohn, Daniel R, and Josh M (1989), "Using Drama to Persuade," in Journal for Consumer
Research, 16 (December), 335-343.
Gemeda, E (2012) African Egalitarian Values and Indigenous Genres. LIT Verlag. Ethiopia.
Gikunda, J. (2016) Exile and Refugee Drama in East Africa. Lambert Academic Publishing.
Kamau, M. (2012) “Hello Dear, Are You Lactating?” in Daily Nation, Tuesday, June 26, 2012. (DN2 p.
2)
Kaschula, R (2001) African Oral Literature: Functions in Contemporary Contexts. Cape Town.New
Africa Books.
Kerr, D. (1995) African Popular Theatre. Nairobi. EAEP
Ligaga, D.A (2006) Radio Theatre: The Moral Play and its Mediation of Socio-Cultural Realities in
Kenya. Unpublished Thesis. University of Witwatersrand.
Lindfors, B (1977) Forms of Folklore in Africa: Narratives, Poetic, Gnomic, Dramatic. London.
University of Texas Press.
Mcluhan, M. and Fiore, Q (1967) The Medium is the Massage: An Inventory of Effects. UK. Penguin.
Miruka, O. (1999) Studying Oral Literature. Nairobi. Acacia Publishers.
Nandwa, J. and Austin B. (1983). African Oral Literature for Schools. Nairobi. Longman Kenya Ltd.
Odhiambo, C.J (2012) “From Diffusion to Dialogic space” in Radio in Africa: Publics, Cultures,
Communities. Johannesburg. University of Witwatersrand.
---------- (2007) “Reading FM radio stations in Kenya: Opening a pandoras box” in Cultural Production
and Social Change in KenyaEd. Kimani Njogu and Oluoch Olunya, Art Culture and Society Vol.
1 pp 151-161.
Ogude, J and Nyairo, J (2007) (eds). Urban Legends, Colonial Myths: Popular Culture and Literature in
East Africa. Africa World Press. Eritrea.
Ong, W.J (1982) Orality and Literacy: The Technologizing of the Word. Newyork. Methuen and co.
Tyson, Lois (1999) Critical Theory Today: A User Friendly Guide. London. Garland Publishers.
Vilarino, Marina L.P (1996) “Discourse of Radio Commercials and the Function of Persuasion” in Some
Sundry Wits Gathered Together. 197-204.
Were, W. (2014) “A Traditional Ritual Ceremony known as Edu-drama: A Case Study if Imbalu Ritual
among the Bukusu of Western Kenya”. Unpublished PhD Thesis. Nairobi. Kenyatta University. ******

Proceedings of the Third International Research Conference held on 26th to 28th October, 2016 313
CONCEPTUAL METAPHORS IN KEN WALIBORA’S NOVEL: “KIDAGAA KIMEMWOZEA”
Ntabo, V.O.1 and Kangangi, B.2
Department of Languages, P. O. Box 1957-10101, Karatina University, Kenya
Tel. No.: +254722398115; +254721766454; Email: [email protected]; [email protected]
ABSTRACT
The deficiency of grammar in unearthing literary gist necessitates the borrowing of a Cognitive Linguist’s
lenses for a fuller explication of a text. This motivates the blast-off point in pursuit of meaning where
“backstage cognition” fills a lacuna whose origin is the apparent mismatch between the writer’s
background and the reader’s linguistic resources. Whereas intellectual endeavors unclothing the
correlation between language and cognition cannot be controverted, the diligence paid to the study of
metaphor in literary texts within a cognitive-semantics perspective has hitherto been hemmed in. We,
therefore, analyze the conceptual metaphors in Kidagaa Kimemwozea by the Kenyan novelist Ken
Walibora. The novel reflects a bedeviled state whose unfeeling king abuses power to amass wealth as
sounds of anguish rent the air. Luckily, the protagonist (Amani) conspires with the king’s son to exploit
the father’s weakness for the benefit of common citizens. This chapter establishes, classifies and
annotates the conceptual metaphors using survey descriptive research design within the backup of
Conceptual Metaphor Theory. It utilizes the Great Chain of Being metaphor whose chief objective slots a
place for any phenomenon in a set hierarchical system. Animals, plants, objects and natural things are
stratified source domains richly used to depict the characters in the novel. For a better appreciation of
conceptual metaphors, it is salient to use the spectacles of a cognitive linguist to understand contextual
language against the cultural, historical and geographical backdrop. Conceptual metaphors are conduits of
communication and should be explained using a cognitive linguistics approach. Language is embodied
and situated in a specific environment, making it possible for the meaning of some of the metaphors to
elude the reader.
Keywords: Source domains, Embodied, Cognitive semantics
INTRODUCTION
The paper is based on Cognitive Semantics (CS) which is a branch of Cognitive Linguistics (CL). CL is
an interdisciplinary study into language, the mind and socio-cultural experience (Evans et al, 2007). CS
borrows from the nexus provided in CL among language, the mind and socio-cultural experience by
stating that meanings are represented in peoples’ mind in a configuration that has its unique rules (Croft
and Cruse, 2004). This implies that meaning is a mental activity. Furthermore, CS posits that the meaning
of words and other linguistic units is inseparably related to the hearer’s memory and experience (Evans
and Green, 2006). Thus, meaning is not located in the actual world but in our heads. CL was developed
in protest to the formal approaches to linguistics which treated metaphor, analogy and metonymy as
deviant linguistic phenomena (Palinkas, 2006). Therefore, Fauconnier and Turner (2002) developed a
framework of explaining linguistic concepts like metaphor. The paper seeks to examine the interplay of
the mind, language and socio-cultural experiences to reveal the meaning of the metaphors used in
Kidagaa Kimmwozea by the Kenyan novelist, Ken Walibora.
The term, metaphor originates from the two Latin words: meta which means, across and pherein which
stands for, to transfer (Glucksberg, 2001). According to Lakoff and Johnson (1980), a metaphor is a tool
of understanding and experiencing one kind of thing in terms of another. In other words, a metaphor is a
cross- domain mapping of people’s conceptual system. Kövecses (2002) posits that metaphor has become
a valuable cognitive tool that people cannot do without. Conceptualization of metaphor is best handled in
Cognitive Semantics (CS) since metaphor has proved problematic to handle in generative description of
language ( Palinkas ,2006).This is because metaphor is a mental process (Lakoff and Johnson, 1980)
which relates entities of the world with abstract things. The principle of the GREAT CHAIN OF BEING
metaphor (GCB) by Kövecses (2002) gives a guide in the conceptualization of the metaphors used in
Kidagaa Kimemwozea by Ken Walibora. According to the GCB metaphor, all things in the universe have

Proceedings of the Third International Research Conference held on 26th to 28th October, 2016 314
a naturally planned hierarchy. The chain is thought to be vertically ordered. The apex level is occupied
by GOD, then the UNIVERSE, SOCIETY, HUMAN BEINGS and OBJECTS respectively 1(Kövecses,
2002). In this regard, different things occupy their corresponding places based on their characteristics.
According to Krzeszowski (1997), each level has specific characteristics which can be related to other
levels metaphorically. Lakoff and Turner (1989) hail the GCB metaphor as a useful tool that aids in
conceptualization of general human behavior in terms of well understood non-human characteristics. The
GCB metaphor is useful in comprehending people’s behavior in the society expressed in the literary text
Kidagaa Kimemwozea by Ken Walibora.
Kidagaa Kimemwozea is a Kiswahili literary text by the Kenyan writer Ken Walibora. The novel is set in
an African country that has just gained independence. The novelist employs metaphors to express the
callous nature of the black master who takes the reins of power after the white rulers are evicted. The
feelings of disillusionment by the citizens in this country are also explained using metaphors. The novelist
chooses to explore metaphorical representations of a cruel society in which class distinction and
formation of an equitable society are very elusive.
Ken Walibora highlights the life of a cow boy, Amani who is the protagonist in the text. At the onset of
the text, Amani is in a state of mental distress with feelings that his manuscript might have been published
without his knowledge. Somebody might have impersonated him in his work titled Kidagaa
Kimemwozea. Also, he feels that chances of his success might dwell in Sokomoko, a fertile area initially
occupied by the white settlers. Amani hopes to unravel the mystery of his grandfather’s (Chichiri
Hamadi) death after he had arrived from abroad. This might give him a clue on the reasons for his uncle’s
imprisonment. Amani, therefore, undertakes an epic journey to Sokomoko.
In Sokomoko, Amani was tasked by Mtemi Nasaha Bora, a symbol of a black master who is the leader of
the region, as his cow boy. He undergoes moments of turmoil in Mtemi’s home as he is tortured and
incarcerated by Mtemi Nasaha Bora for crimes not committed. However, Amani does not hold hard
feelings against Mtemi Nasaha Bora as he saves his life that was at the risk of being exterminated by
Gaddafi, Amani’s former colleague inmate. Gaddafi was out to revenge after Mtemi Nasaha Bora had
grabbed his family’s land. Amani later confirms his worst fears that it was indeed Mtemi Nasaha Bora
who had schemed the death of his grandfather and grabbed the family land. Amani works hard to get his
uncle released from prison but does not revenge against his tormenter. The protagonist turns down the
people’s proposal to be the new leader but offers to support the appointed leader to ensure peace in
Sokomoko. Mtemi Nasaha Bora commits suicide out of self-reproach and shame.
Theoretical Framework of the Study
The paper adopted the Conceptual Metaphor Theory (CMT) to analyze the metaphors in the literary text
Kidagaa Kimemwozea by Ken Walibora. The CMT is associated with Lakoff and Johnson (1980) in their
seminal paper Metaphors we Live By. The CMT posits that metaphor is ubiquitous in everyday language
and is a conceptual rather than a linguistic device (Gibbs, 1994). Metaphor is a cross-domain mapping
between the source and target domains. Furthermore, Cameron and Low (1999) posit that metaphor is a
matter of the mind as it refers to mapping of mental concepts. Ahrens (2002) elaborates that the more
concrete or physical domain is referred to as source while the more abstract is target. Meaning of
metaphors is a result of the conceptual mappings. The CMT commonly uses capitalized mnemonic
notation. The target domain is usually stated first and linked to the source domain via the copula or as
(Lakoff and Johnson, 1980). This implies that the “TARGET DOMAIN IS /AS SOURCE DOMAIN.”
For example, MTEMI NASAHA BORA IS A LION (see metaphor 1 in this paper). The principles of the
CMT are, therefore, relevant in the analysis of the conceptual metaphors in Kidagaa Kimemwozea by Ken
Walibora. Also, as pointed out in the introduction of this paper, the GREAT CHAIN OF BEING
1 See Kövecses (2002), Fauconnier and Turner (2002), Lakoff and Johnson (1980) and Grady (1997) for further
study on metaphors.

Proceedings of the Third International Research Conference held on 26th to 28th October, 2016 315
metaphor whose main purpose is to assign a place for all things in the universe in a strict hierarchical
system will be taken into account (Kövecses, 2002).
METHODOLOGY
Qualitative research design which does not produce discrete numerical data (Mugenda and Mugenda,
2003) was adopted in the present study. The study used survey design in particular since the focus was on
collecting conceptual metaphors in Kidagaa Kimemwozea to establish the applicability of the Conceptual
Metaphor Theory (CMT) and the generic GREAT CHAIN OF BEING metaphor. The text under study
was purposively sampled based on the following reasons: first, metaphors have been used to express the
callous nature of the tyrannies in the society highlighted in the text. The state of the citizens who feel that
their future is bleak is also metaphorically expressed.2 Second, Kidagaa Kimemwozea is a compulsory
Kiswahili set text examinable for all secondary students taking the 8-4-4 system of education. Finally, the
text ridicules various issues in society especially the greed of the leaders. The study specifically adopted
content analysis which can broadly refer to methods for studying and retrieving meaningful information
from texts (Weaver, 2009). Content analysis is also described as a research methodology that examines
words or phrases within a wide range of texts (Edman, 2010). The metaphors were tabulated into
conceptual domains of GOD, ANIMAL, PLANT, HUMAN BEING and further classified into
NEGATIVE and POSITIVE labeling.
FINDINGS
The study identifies that GOD, HUMAN, ANIMAL, PLANT and OBJECT metaphors are employed as
source domains in building the metaphors related to characters in Kidagaa Kimemwozea as shown in
Table 4.1 below:
Table 4.1: God, animals, plants and objects metaphors in kidagaa kimemwozea by Ken Walibora
and their metaphor value
NO. Metaphor (Kiswahili) Gloss Metaphor Value The GCB
metaphor
Positive Negative
1 Mtemi Ni Simba Mtemi Is A Lion Negative Animal
2 Lowela Ni Ndege Wa
Kuruka Juu Kwa Juu
Lowela Is A Bird That
Flies
Negative Animal
3 Amani Ni Chui Aliyevaa
Mavazi Ya Kondoo
Amani Is A Leopard In A
Sheep’s Skin
Negative Animal
4 Mtemi Ni Damu Ya
Kunguni
Mtemi Is Bedbug’s Blood Negative Animal
5 Chwechwe Ni Ganda La
Mua
Chwechwe Is A
Sugarcane’s Leftovers
Negative Plant
6 Pombe Ni Mungu Alcohol Is God Negative God
7 Walemavu Ni Masimbi The Disabled Are Rejects Negative Object
8 Walemavu Ni Mashata The Disabled Are Rejects Negative Object
9 Walemavu Ni Sanamu The Disabled Are Statues Negative Object
10 Mtemi Ni Mzigo Wa Moto Mtemi Is A Luggage Of
Fire
Negative Object
11 Madhubuti Si Kisu Kibutu Madhubuti Is Not A Blunt
Knife
Positive Object
2 2 A domain is a “multidimensional structured whole arising naturally from experience” (Lakoff and Johnson, 1980,
p. 85).
5 The Cognitive Metaphor Theory (CMT), the dominant paradigm in metaphor studies, was developed by Lakoff
and Johnson (1980). Other scholars (for example, Lakoff and Turner, 1989; Kövecses, 2002 ) have also contributed
on the CMT.

Proceedings of the Third International Research Conference held on 26th to 28th October, 2016 316
12 Dj Ni Sindano Dj Is A Needle Negative Object
13 Mwafrika Ni Matapishi An African Is Vomit Negative Object
14 Maisha Ni Mshumaa Life Is A Candle Negative Object
15 Ujana Ni Moshi Youth Age Is Smoke Negative Object
16 Ufalme Ni Mvua A Kingdom Is Rain Object
17 Mdomo Ni Karakana Ya
Matusi
The Mouth Is A Workshop
Of Insults
Negative Object
A human being is an animal
Gathigia (2016) observes that human beings are often described as animals because animals are part of
the world. According to Kovesces (2000), people use animal metaphors to express human behavior and
attitudes. Animal metaphors have a cognitive basis (Deigman, 2003) and can be used to reflect the
behavior of the community toward certain animal species, which may vary across the societies in time
and space. The following animal metaphors are used in Kidagaa Kimwmwozea:
1. MTEMI NASAHA BORA NI SIMBA (MTEMI NASAHA BORA IS A LION)
In metaphor (1), Mtemi Nasaha Bora, who is one of the main characters in Kidagaa Kimemwozea is
negatively conceptualized as a lion. A lion is one of the world cats that has the following characteristics.
One, a lion is a symbol of strength which is fierce and courageous, and, for this, it is described as the king
of the jungle ( Dolvenry, 2013). Two, a lion enjoys relaxing and lazing around. It spends between 16-20
hours in day either resting or sleeping. The beast has few sweat glands hence it rests during the day and
becomes more active at night when it is cool (Dolnenry, 2013). Finally, a lion has a terrific night vision
(Bauer, 2003). It hunts more at night than during the day time. The novelist expresses Mtemi Nasaha Bora
as a fierce leader who is greatly feared by his people. Therefore, all people had to fundraise to send his
son, Madhubuti, overseas for further studies since the lion, Mtemi Nasaha Bora had roared. The writer
notes, “Mtemi ni mkubwa. Angurumapo simba mcheza nani? (Mtemi is a leader. Who would play once a
lion has roared?” (Walibora, 2012 p. 40). This means that Mtemi Nasaha Bora is greatly feared by the
citizens of Sokomoko. The metaphor MTEMI IS A LION means that Mtemi is cruel like a lion. A lion is
described as fierce animal that has the audacity to prey on bigger beasts like buffaloes (Dolvenry, 2013).
Mtemi Nasaha Bora preys on his people by grabbing their land therefore starving them off their source of
livelihood. Mtemi Nasaha Bora is also beastly as he physically and sexually harasses the people under
him. He sexually harasses Lowela, a minor making her drop out of school. Besides, cruelly beats up
Amani whom he alleges of having an intimate relationship with his wife. Furthermore, Mtemi Nasaha
Bora is more active at night just like a lion. His wife, Zuhura, complains that he comes home late and has
not been able to cure her sexual urge (Walibora, 2012 p.39).
2. LOWELA NI NDEGE WA KURUKA JUU KWA JUU (LOWELA IS A BIRD THAT FLIES)
Lowela is a school girl whom Mtemi Nasaha Bora sexually exploits. Birds have the ability to migrate to
favourable conditions in search of food (Boyle, 2006). DJ describes Lowela as a bird that flies and lands
on areas that are favourable for her (Walibora, 2012). Indeed, Lowela elopes with Mtemi Nasaha Bora
from home and goes to live in Baraka, a fertile land that Mtemi Nasaha Bora had grabbed. Lowela, who
is in form three when she drops from school, is an adolescent. Adolescence is a stage in human
development characterized with risky behavior which include having unprotected sex which might lead to
pregnancy (Wolff, 2012). The youngsters in adolescence stage are normally active and are comparable
to birds that fly from place to place to explore the world. Thus, Lowela is a bird that ends up being
pregnant and the child she bears is abandoned at Amani’s doorstep where the helpless cow boy picks it,
raises it but it dies after failing to secure health services at Nasaha Bora dispensary (Walibora, 2012).
3. AMANI NI CHUI ALIYEVAA MAVAZI YA KONDOO (AMANI IS A LEOPARD IN A
SHEEP’S SKIN)
A leopard is distinguished by its well-camouflaged fur and opportunistic behavior while a sheep is a
harmless domesticated animal. When a leopard stalks a prey, it keeps a low profile and slowly walks
through the grass or bush until it is close enough to launch an attack ( Dolvenry, 2013). Dolvenry further
posits that a leopard can move through herds of antelopes without unduly disturbing them by flipping its

Proceedings of the Third International Research Conference held on 26th to 28th October, 2016 317
tail over its back to reveal the white underside, a sign that it is not seeking a prey. Amani, a main
character in the text, is negatively conceptualized as a leopard by the People of Sokomoko (Walibora,
2012 p.134). This is after wind reaches them that Mtemi Nasaha Bora had caught Amani red-handed
having sexual intercourse with his wife, Zuhura. The metaphor means that Amani is a hypocrite like a
leopard that can camouflage based on its spotty fur. The citizens of Sokomoko assume that Amani is a
dangerous person who keeps a low profile after spotting his prey and only launches an attack when an
opportunity presents itself. It, however, turns out that it was only an allegation. Mtemi had acted without
investigating the matter. What happened is that Amani had been called into Mtemi Nasaha Bora’s
bedroom by Zuhura to help her evict a rat when Mtemi Nasaha Bora arrived. The people of Sokomoko
later realize that Amani is not leopard but a peaceful person. They request him to be their new leader but
he declines.
4. MTEMI NASAHA BORA NI DAMU YA KUNGUNI (MTEMI NASAHA BORA IS A
BEDBUG’S BLOOD)
Metaphor (3) has a negative connotation that highlights Mtemi Nasaha Bora’s exploitative nature. Bed
bugs are small, oval, brownish insects that live on the blood of humans or animals (Reis, 2000). Mtemi
Nasaha Bora indeed exploits the poor citizens of Sokomoko by grabbing their land and dipping deep into
their pockets to get his son abroad for overseas studies.
A human being is a plant
Plants can be used to conceptualize phenomena (Kleparski, 2008). According to the GREAT CHAIN OF
BEING metaphor, when human beings are compared with plants, they are devalued (López, 2009).
Chwechwe Makwechwe, a character in the text who is a famous soccer player, notes that“NIMEKUWA
GANDA LA MUA (I AM NOW A LEFTOVER OF SUGARCANE)” (Walibora, 2012 p.
151).Chwechwe Makwechwe, a talented foot ball player, feels devalued after bringing glory to his
country by playing football. After being injured, he lives in dilapidated conditions at a slum in the city.
The Metaphor means that Chwechwe Makwechwe has not been cared for by his country especially after
being injured while playing for the nation.
An object is a “God”
God is the creator of all things as highlighted in the Holy Book of Genesis 1:1-31. God is the Almighty
who is to be revered and worshipped by all His creatures. However, in the Holy Bible, there are examples
of people who worshipped idols as gods and they faced the wrath of God. For example, the Israelites who
had been saved from Egypt crafted a Gold Bull-Calf as a god and worshipped it (Exodus 32: 1-35). God
cursed them after this act and sent a disease that attacked them. Similarly, Metaphor (6), POMBE NI
MUNGU (ALCOHOL IS GOD) is used to bring out a negative connotation which refers to Mr. Majisifu,
a character in the text who is a teacher, whose life is a shrouded with pain and suffering. For him,
ALCOHOL IS HIS GOD. Thus, like the Israelites, it is evident he is a cursed man as his children are
disabled and his wife stubborn.
A human being is an object
López (2009) posits that comparing people to non-living things invokes feelings of love and detest
depending on the object. It is vital to take into account the generic GREAT CHAIN OF BEING metaphor
(Kovesces, 2002) to comprehend the metaphors in the category of A HUMAN BEING IS AN OBJECT.
The metaphors listed below (7- 13) fall in the category of inanimate members. It is the lowest level in the
GREAT CHAIN OF BEING metaphor connotation. The metaphors which describe A HUMAN BEING
AS AN OBJECT are discussed below:
7. WALEMAVU NI MASIMBI (THE DISABLED ARE REJECTS)
8. WALEMAVU NI MASHATA (THE DISABLED ARE REJECTS)
9. WALEMAVU NI SANAMU (THE DISABLED ARE STATUES)
Mr Majisifu conceptualizes his children as REJECTS (Walibora, 2012 p. 31). masimbi and mashata are
Kiswahili words for leftovers which are rejected in the preparation of a local brew called busaa among
Proceedings of the Third International Research Conference held on 26th to 28th October, 2016 318
the kisii people. Busaa, a traditional brew fermented from maize and millet. Masimbi and mashata is what
is sieved away as rejects when the brew is ready for consumption. Mr. Majisifu negatively refers to his
disabled children as REJECTS since he does not appreciate them. He blames his wife, Dora for bearing
REJECTS which is an indication how Mr. Majisifu discriminates against the disabled people in society.
10. MTEMI NI MZIGO WA MOTO (MTEMI IS A LUGGAGE OF FIRE)
Zuhura, Mtemi’s wife, conceptualizes her husband, Mtemi Nasaha Bora, as “MZIGO WA MOTO (A
LUGGAGE OF FIRE)” (Walibora, 2012 p.39). Luggage of all types has a common characteristic of
possessing some weight depending on their form. Fire is also known to have heat. If a luggage is put on
fire, it will be destroyed. Zuhura uses metaphor (11) to negatively describe her husband’s unwillingness
to make love with her. This implies that Mtemi Nasaha Bora is indeed a luggage who has the ability to
satisfy his wife’s sexual urge but appears unwilling thus destroyed by fire.
11. MADHUBUTI SI KISU KIBUTU (MADHUBUTI IS NOT A BLUNT KNIFE)
Zuhura appreciatively talks about her son as “MADHBUTI SI KISU KUBUTU (MADHUBUTI IS NOT A
BLUNT KNIFE)” (Walibora, 2012 p.39). A knife is a cutlery which is basically used to cut items
especially foodstuffs in the kitchen. A sharp knife is preferred because it makes work easy as cutting is
done without using much effort. One would require a lot of effort to effectively use a blunt knife. The
metaphor (12) is used to highlight a positive connotation where a mother (Zuhura), is proud of her son,
Madhubuti who is clever in school. Indeed, Madhubuti is comparable to A SHARP KNIFE which is the
opposite of a BLUNT KNIFE because he is able to realize that Amani is an intelligent person by telling
him, “There is something more than meet the eye in you” (Walibora, 2012 p. 116). Madhubuti was able to
unravel that Amani is an informed, intelligent and wise person who had disguised himself as a naive cow
boy in Mtemi Nasaha Bora’s compound. Madhubuti thus incorporates Amani in his plans to redeem
Sokomoko from ill-governance perpetrated by his father, Mtemi Nasaha Bora.
12. DJ NI SINDANO (DJ IS A NEEDLE)
A needle is a thin and sharp metal often used to sew clothes or to administer intravenous and
intramuscular drugs by health practitioners. Needles are often used with precaution as they can cause
bodily harm or transmit infections such as HIV (Ham, 1992). DJ is negatively conceptualized as a needle.
DJ is a character in the text who directs Amani to Mtemi Nasaha Bora’s home for employment. The
writer gives a vivid description of DJ as a malnourished boy who is very slender comparable to a needle
(Walibora p.6). First, the metaphor implies that indeed DJ is malnoushed as he is forced to work as a cow
boy in a tender age to tend for his life. Second, the metaphor can be used to portray a positive attribute in
DJ who is brilliant as brilliance is comparable to being sharp like a needle (Ham, 1992). For his wit, he
realizes that the health services at Nasaha Bora dispensary are inadequate and cleverly escapes to his
uncle who is a traditional medicine man for traditional health attention. Not even his friend Amani gets to
know about it (Walibora, 2012 p. 112).
13. MWAFRIKA NI MATAPISHI (AN AFRICAN IS VOMIT)
Colonial period in Kenya is marked with a dark history (Dunn, 2003). The imperialism and the iron fist
hand the European used to rule Kenyans left many citizens not only mourning the loss of their loved ones
but also with feelings of disillusionment (Smart, 2011). The Europeans brought their conceptions of
social organization into the colonial situation which they then imposed on Africans. The colonizers ruined
the economic dependence of the Kenyans by alienating their land and preying on the Kenyan labour to
enrich themselves (Dunn, 2013). That is why Balozi, a master of ceremony at a function to commemorate
the country’s independence narrates the dark colonialism period the people of Sokomoko faced. He says
“Mwafrika alionwa kama matapishi (an African was treated as vomit)” (Walibora, 2012 p.67). This
means that Africans suffered under the white man’s rule. Their land was alienated and young Africans
were drafted to fight in the white man’s war that the Africans knew nothing about. Prominent Kenyan
leaders like Harry Thuku who agitated for independence were placed into a jail cell in Nairobi on 16th
March, 1922 (Smart, 2011). The police opened fire on the demonstrators who were agitating for the
release of Harry Thuku killing many of them. Indeed, Africans were treated as vomit which is usually an
irritating and smelly substance emitted from our bodies through the mouth in cases of sickness or

Proceedings of the Third International Research Conference held on 26th to 28th October, 2016 319
digestive discomforts. Talebinejad and Dastjerdi (2005) posit that in accordance with the GREAT CHAIN
OF BEING metaphor, humans stand above animals. Therefore, whenever humans or part of human body
are compared to animals and objects, they are degraded and devalued. Thus, the following metaphors
which compare with humans or part of the human body and objects are discussed below:
14 MAISHA NI MSHUMAA (LIFE IS A CANDLE)
15. UJANA NI MOSHI (YOUTH AGE IS SMOKE))
16. UFALME NI MVUA (A KINGDOM IS RAIN)
17. MDOMO NI KARAKANA YA MATUSI (THE MOUTH IS A WORKSHOP OF INSULTS)
Metaphor (14) is negatively used to conceptualize the brevity of human life. The average life expectancy
for human beings is 78.8 years (Xu, 2016). A lit candle is comparable to the brief life span of human
beings since it melts and diminishes in a short time. Human life is thought to be brief unlike animals like
tortoises that last for more years. In mourning Uhuru, (a child that was abandoned at Amani’s doorstep)
Amani says “ Maisha ni mshumaa usiokuwa na mkesha (life is a candle that does not last)” (Walibora p.
78). The child dies as Amani is unable to secure health services at Nasaha Bora dispensary prompting
Amani to compare the child’s life with a candle. In the Holy Bible, King Solomon in the book of
Ecclesiastes 12: 1-3 notes that people should serve the Lord actively in their youthful days before those
dismal days and years come when one will say, “I don’t enjoy life.” King Solomon implies it is at
youthful days that people are most active but the period does not last long because soon a person grows
weak in old age and cannot engage in the activities of their youthful days. Thus, in metaphor (15), Mtemi
Nasaha Bora conceptualizes youthful days as smoke by claiming that, “UJANA NI MOSHI (YOUTH
AGE IS SMOKE)” (Walibora, 2012 p.92).
The metaphor is used to express a negative connotation about Mtemi’s self-assessment. Mtemi fears that
he is about to die as he is no longer a youth. The fears come to pass as he later commits suicide after a
self-reproach of his exploitative life. Metaphor (16) UFALME NI MVUA (A KINGDOM IS RAIN) is
used by Amani to conceptualize Mtemi Nasaha Bora’s kingdom. Rain does not normally fall for long.
Amani implies that a leader’s tenure in office does not last an eternity. The metaphor is used to negatively
highlight Mtemi Nasaha Bora’s poor leadership styles. His greed is evident as he concentrates in
amassing wealth illegally. Ultimately, he has to commit suicide after realizing how bad a leader he was
and with this, his kingdom comes to a halt suddenly. Metaphor (17) is used to conceptualize the abusive
nature of Mr. Majisifu who is a teacher. The mouth is a very important part of the human body. Apart
from eating, it is also used in the production of human sound. Dora, Mr. Majisifu’s wife complains that,
“MDOMO WAKE KARAKANA YA MATUSI (HIS MOUTH IS A WORKSHOP OF INSULTS)”
(Walibora, 2012 p.44). Dora is disgusted by her husband’s abusive nature. Mr. Majisifu alleges her of
being a cursed woman since she only bears disabled children. Metaphor (12) is therefore negatively used
to highlight the plight of women and the disabled in society.
CONCLUSIONS In view of the findings and discussion above, this study concludes in the following ways: first, almost all
animal, plant, object and God metaphors employed in the novel Kidagaa Kimemwozea present a negative
evaluation of the human characters highlighted. Second, conceptual metaphors are vital ways of
communicating and should be explained using Cognitive Semantics approach. Third, language is both
embodied and situated in a specific environment, making it possible for the meaning of some of the
metaphors to elude the reader. Finally, the generic GREAT CHAIN OF BEING metaphor is key to
understanding the God, animal, plant and object metaphors used in the text.
RECOMMENDATIONS
This study recommends that language researchers should use the Conceptual Metaphor Theory (CMT)
and the generic GREAT CHAIN OF BEING metaphor to understand the world around us. Also, more
studies should be undertaken on metaphor use in literary texts to reveal how the God, animal, plant and
object metaphors used can provide an opportunity to understand the critical issues raised by the writers.

Proceedings of the Third International Research Conference held on 26th to 28th October, 2016 320
REFERENCES Ahrens, K. (2002). When love is not digested: Underlying reasons for source to target domain pairings in
the contemporary theory of metaphor. Proceedings of the First Cognitive Linguistics Conference
(pp. 273-302). Cheng-Chi University, China.
Bauer, H. (2003). Lion conservation in East and Central Africa. Netherlands: Leiden University Press.
Cameron, L., and Low, G. (1999). Metaphor. Language Teaching, 32, 77-96.
Croft, W., and Cruse, D. A. (2004). Cognitive linguistics. Cambridge: Cambridge University Press.
Dolvenry, S. (2013). African Lion (panther Leo) Behaviour, Monitoring, and Survival in Human
Dominated Landscape. (PHD Dissertation),University of Wincousin-Madison.
Dunn, D. (2003). Imaging Congo: International Relations of Identity. New York: Palgrave Macmillan.
Edman, H. (2010). Twittering to the top. A content analysis of corporate tweets to measure organization-
public relationships. (Unpublished MA Thesis), Louisiana State University.
Evans, V. (2007). Towards a cognitive compositional semantics. In U. Magnusson, H. Kardela and A.
Glaz (Eds.), Further insights in semantics and lexicography (p. 11–42). Poland: University Marie
Curie University Press.
Evans, V. and Green, M. 2006. Cognitive semantics: An introduction. Edinburg: Edinburg Uni. Press.
Fauconnier, G., and Turner, M. (2002). The way we think: Conceptual blending and the mind’s hidden
complexities. New York: Basic Books.
Gathigia, M. G. (2016). Metaphoric analysis of Murimi Wa Kahalf’s pop song “Ino ni momo.”
Proceedings of 2nd
international research conference (pp. 499-504). Chuka University, Kenya.
Gibbs, R.W. (1994). The poetics of mind: Figurative thought, language, and understanding. New York:
Cambridge University Press.
Glucksberg, S. (2001). Understanding figurative language. From metaphor to idiom, Oxford: Oxford
University Press.
Ham, R. M. (1992). The health belief model and needle recapping: a replication. (MA Thesis). Grand
Valley State University
Kövecses, Z. (2000). Metaphor and emotion: Language, culture and the body in human feeling.
Cambridge: Cambridge University Press.
Krzeszowski, T. P. (1997). Angels and devils in Hell: Elements of axiology in semantics. Warszawa:
Wydawnictwo Energeia.
Lakoff, G., and Johnson, M. (1980). Metaphors we live by. Chicago: University of Chicago Press.
Lakoff, G., and Turner, M. (1989). More than cool reason. A field guide to poetic metaphor. Chicago:
University of Chicago Press.
López, I. (2009). Of women, bitches, chickens and vixens: animal metaphors for women in English and
Spanish. Cultura, Lenguaje y Representación/Culture, Language and Representation, 7(7):77-100.
Mugenda, A., and Mugenda, O. (2003). Research methods: quantitative and qualitative
approaches. Nairobi: Acts Press.
Palinkas, I. (2006). Development of senses argumentum. Kossuth Egyetemi Kiado, Derecen, 2:191-197.
Reis, M.D. (2000). An Evaluation of Bed Bug (Cimex Lecturius L.) Host, Location and Aggregation
Behaviour. (MSC thesis), Virginia Polytechnic Institute and State University.
Smart, D. (2011). Narrating colonial realities: discourse, difference and the East African Standard in
colonial Kenya, 1922-1954. (MA Thesis). Western Washington Universities.
Talebinejad, M. and Dastjerdi, H. (2005). A cross-cultural study of animal metaphors: When owls are not
wise! Metaphor and Symbol, 20:133-150.
Xu, J. et al., (2016). Deaths: Final data for 2013. National vital statistics reports, 64(2):2-4.
Walibora, K. (2012). Kidagaa Kimemwoeae. Nairobi: Spotlight Publishers (EA) Limited.
Weaver, A.D. (2009). Exemplication in Newspaper: A Content Analysis and Case Studies. (M.Sc.
Unpublished Thesis), Ohio University.
Wolff, M. (2012). Adolescent decision making and risk behaviour: A Neurobiological approach. (PHD
dissertation), University of Nebraska ******

Proceedings of the Third International Research Conference held on 26th to 28th October, 2016 321
THIS IS ME: THE KENYAN POLITICAL AUTOBIOGRAPHY AS A QUEST FOR
SALVAGING THE SELF
Mutie, S., Rutere, A.M. and Goro, N.K.
Department of Literary and Communication Studies, Laikipia University, P. O. Box 1100-20300, Laikipia, Kenya
ABSTRACT
The seemingly failure of the first independent African leaders to put an end to poverty, illiteracy
and disease, and thus to open the gates to all-round development in their countries has elicited a
flurry of scholarly debate. This paper is a continuation of this debate. It aims to account – in yet
another way, for the stubborn reality of largely unfulfilled aspirations of the anti-colonial struggle
in Africa, and Kenya in particular; to explain from a possible new perspective Kenya’s deficient
post-independence. Particularly it examines Oginga Odinga’s Not Yet Uhuru (1966), Bildad
Kaggia’s Bildad Kaggia: Roots of Freedom 1921-1963 (1975), Raila Odinga’s, The Flame of
Freedom (2013) and joseph Murumbi’s Path Not Taken (2015) to show how, in this literature, they
employ specific literary strategies to absolve themselves of all the postcolonial blame, in the
process portraying themselves as defenders of nationhood, democracy, and as forces against
negative ethnicity. The paper argues that, in this self-refashioning, these leaders advance the very
same escapism employed by the founding fathers. Focusing their attention on concealing their
ambition-deformed personalities behind the masks of the positive self-identities they construct, the
opportunity for genuine leadership and genuine service to nation-building is largely lost.
Keywords: Identities, Postcolonial, Nationhood, Ethnicity, Democracy, Nation
INTRODUCTION
The “Self” is rather a contested term in the current critical and theoretical space. The concept of self has
been understood as always being in a state of flux (Hall, 2001). To put it differently, the self that is
unitary, linear, fully comprehensible, one dimensional is an illusion. The idea of self has always
captivated a prime position in literary creations. Literary works are often completely devoted to the
unraveling of the labyrinths of the self. Testimonies, memoirs, diaries and confessions generally deal with
this central concept of the self. However, this paper will argue that the literary genre which perceives as
its principal task the writing of the self is autobiography. The advent of the twentieth century saw the
dawn of an era, which presented the fertile ground for autobiographical writings (Smith and Watson,
2001; Weintraub, 1972). Autobiography is a genre that tries to capture such complex, complicated and
elusive phenomena called life and self. Its patterns change, its formal qualities change, the contours and
textures change from one life to another, from one self to the other.
It is, as Misch (1950) noted:
Autobiography is unlike any other form of literary composition. Its boundaries are more fluid and
less definable in relation to form. It is a representation of life that is committed to no definite
form. It abounds in fresh initiatives, drawn from actual life. It adopts the different forms with
which different periods provide the individual for self-revelation and portrayal (2).
However, attempts have been made to define the genre, to describe the common threads to be found in the
genre called autobiography. Autobiography usually denotes the story of one’s life written by oneself
(Lejeune, 1989). Lejeune identifies four elements constitutive of autobiography: prose as the medium,
real life as the subject matter, author as narrator and retrospective as the point of view. The
autobiographies of Mahatma Gandhi (The Story of My Experiments with Truth, 1927), Jawaharlal Nehru
(An Autobiography, 1936), and Kwame Nkrumah (Ghana: The Autobiography of Kwame Nkrumah,
1957) formed a new dawn in autobiographical writing by public figures, more specifically, political
leaders in the third world societies. These autobiographies went beyond a sub genre of history and
attempted to introspect and reflect on personal dilemmas and crises. They take to an explication of “the
self” in their autobiographies and portray a self that is knowledgeable. In this regard, the autobiographies
can be thought of as the attempt to forge a national self.

Proceedings of the Third International Research Conference held on 26th to 28th October, 2016 322
The history of autobiography has almost always pointed to the elusive fallacy that most autobiographies
are a docket of men who belong to the public sphere and enjoying a prime status in society. This tradition
neglects the autobiographies of the downtrodden. The determinants of class, race and gender are excluded
from the record of autobiography. The autobiographies of the marginalized have been silenced in the
historical process; their narratives have been sucked into the metanarratives of the state. This paper will
recover the lost tradition of the nationalist leader’s autobiographies, leaders who reigned but never ruled.
The autobiographies of the leaders who reigned but never ruled, just like the gay and lesbian
autobiographies, autobiographies of the disabled, autobiographies of geisha and sex workers,
autobiographies of ethnic minorities and so on attain complex magnitudes; for, they question not only
political hegemony, heterosexual, patriarchal, normative regimes but also bring an alternative sense of the
self and identity, worldview and perspective into existence (Pascal, 1960; Olney, 1980; Gusdorf, 1980,
Freeman, 1993). Analysis of works like these necessarily makes autobiographical criticism
transdisciplinary. Marginalised groups reside in a negative relationship to power. The degree and kind of
power and powerlessness may differ, but they do inhabit structures of power. An interrogation of the
spaces that the subaltern autobiographies inhabit enables one to see the effect of power on subaltern
subjects and the element of resistance written into them. This makes the subaltern autobiography not
merely a literary act but a political act.
Subaltern autobiography is synonymous with survival literature and is narrative of resistance. The state of
subordination of a community/group entails that its identity is conditioned by the dominant
community/group. In this context, Jaramogi Oginga Odinga’s (Jaramogi), Bildad Kaggia’s (Kaggia),
Raila Odinga’s (Odinga) and Joseph Murumbi’s (Murumbi) autobiographies are subaltern political
autobiographies and are narratives of resistance. Janice Morgan argues, “to be marginalized to a dominant
culture is also to have had little or no say in the construction of one’s socially acknowledged identity”
(Perkins, 2000: 44). What Valerie Smith speaks about the African-American autobiography becomes
pertinent to all those who occupy subaltern position and attempt to construct a narrative of the self:
Simply to write the story of his or her own life represent[s] an assault’ on the line of reasoning
that assumes and perpetuates the construct that African Americans do not live…as fully
imaginative, significant, intellectual, and complex lives as the dominant American community,
‘since to make oneself the subject of a narrative presumes both the worth of that self and its
interest for a reader. (qtd in Danahay,1991:67).
Auguring our argument on the conceptualization above, this paper argues that the autobiographies of
Jeramogi, Kaggia, Odinga and Murumbi are autobiographers who “re-write” selfhood, in their description
of their lives and the life of their community. Hence the act of writing autobiography by these leaders
becomes a measure of resistance against oppression and hegemony. It is an act imbued with political
connotations. These autobiographies thus call for more complex and equipped critical and reading
strategies. They are not mere explications of the self, but intricate platforms of political performance.
Autobiography as a genre has an important place in subaltern ideology as it proves that there are many
versions of reality:
Autobiography now has the potential to be the text of the oppressed, the culturally displaced,
forging a right to speak both for and beyond the individual. People in positions of powerlessness
– women, black people - have more than begun to insert themselves into the culture via
autobiography via the assertion of the personal voice… . (Swindells, 1995: 7)
Autobiography is thus a platform for the exploration and explication of the self. The subjects of subaltern
autobiographical narratives speak from marginal locations. Subjectivity of subaltern autobiography is
constructed in the encounter between power and powerlessness, domination and subjugation. The leaders
who reigned but never ruled have been relegated to the margin, being treated as “the other” by the
political rulers. There has always been a political line drawn between “we” the rulers and “they” the
leaders who reigned but never ruled. This demarcating line not only divides people into two categories
but also implies a hierarchy. Their “self” often remain effaced or defaced.

Proceedings of the Third International Research Conference held on 26th to 28th October, 2016 323
Resistance in the Kenyan Political Subaltern Autobiographies
Resistance is a term that is largely associated with Edward Said in his groundbreaking work, Orientalism
(1978). In this paper we argue that the autobiographies of Jeramogi, Kaggia, Odinga and Murumbi are
texts that are involved in political resistance, reconstructing the Kenya’s political past, and in a way
sanitizing the political image of the writer. Orientalism is mainly interested in showing the existence of
political ideology that governs and uses orientalism to rule and impose hegemony over the orient.
“Hegemony” as referred to by Said is pertinent in this study. Said shows how orientalism distributes
assumptions and prejudices about the orient to the western audience, without a corresponding challenge
from the “Other” (209; 324). It also demonstrates that every agency involved in the production of
orientalism is guilty, either by association, or by themselves is central in the making and sustaining of
imperialism. Judging from this, Said felt it was warranted to claim “Orientalism is fundamentally a
political doctrine willed over the Orient because the Orient was weaker than the West” (204). Jaramogi,
Kaggia, Odinga and Murumbi are thus weak, and we argue, thus, they write to reject this position.
As we are going to show in the course of this paper, the writers explored here assert an independent or
“an oppositional critical consciousness” (Said, 1978: 326-7). The aspect of “oppositional consciousness”
was identified by Ashcroft and Ahluwalia (1999) as a strategy of resistance. Wan-Ahmad (2010) contends
that it is a strategy of “writing back” to the orientalists by exposing their political connection disguised
under the academic pretension of pure knowledge. In writing their autobiographies, therefore, Jeramogi,
Kaggia, Odinga and Murumbi subvert what is commonly regarded as oriental muteness that has led to
more oppression of the orient in this power relationship. For this reason, the potential for resistance is
present when “the history that resisted its ideological as well as political encroachments” is brought into
life. In short, it requires the revival of repressed or resistant history that can mount challenges to
hegemonic structures such as orientalism (Said, 1985: 93-94). This means that studying the
autobiographies of Jeramogi, Kaggia, Odinga and Murumbi, as documents of political resistance and
providing an alternative history is very important, especially so, when Kenya is undergoing various
political cultural, social, and economic changes.
The Politics of Betrayal: Not Yet Uhuru and The Flame of Freedom
In their autobiographies, Jeramogi and Odinga are involved in constructing a single narrative: that Kenya
as a country has been betrayed since 1963. ). As we read through Not Yet Uhuru and The Flame of
Freedom, we learn the clarion call that Kenya as a nation has undergone four political miscarriages. The
first miscarriage happened in 1963, independence and the first republic, 1992, the second republic and the
reinstatement of pluralism, the exit of Moi and the Narc dream of 2002 and the new constitutional
dispensation of 2010. Michael Wainaina argues that all babies die at birth the political class entrusted to
midwife the process of the birth of modern Kenyan state is too invested in the primitive tribal state to give
the new, modern Kenya a chance for survival (2016: 12).
The four missed chances have, therefore, not been by default but by design. The political class midwifing
the process has deliberately strangled the baby to protect the status quo. They have consistently
squandered the opportunities for renewal. In most cases politicians are given the job of midwifing the
modern state because people think that they are statesmen and not just regular politicians. These leaders
are so heavily and hopelessly invested in politics of ethnicity, impunity and mediocrity for them to
midwife a modern Kenya. In their autobiographies, Jeramogi and his son, Odinga present themselves as
leaders whom Kenya should regret for not having. In their texts, they are the statesmen per excellence.
In his autobiography, Not Yet Uhuru, Jeramogi comes out from the pages of his autobiography as an
unrepentant patriot at heart, a pan-africanist, a staunch anti-white domination in Kenya’s pre-
independence politics, a genius, a father, a writer, and a leader whom would regret for not having (Nyairo,
2015). Reading through the text it becomes clear that Jeramogi seems to be fighting what he takes to be a
misrepresentation by many a modern scholar. In this authoritative, sometimes brutal autobiography, the
author re-writes the Kenyan history; the history oftentimes meticulously contorted to suite British
Imperial propaganda; the history that is guilty of vilifying saints, and exalting villains; the history whose
dying embers must be rekindled (Odinga, 1). Not Yet Uhuru recounts that although many of his British-

Proceedings of the Third International Research Conference held on 26th to 28th October, 2016 324
Sponsored early scholars (through the several church missions) succumbed to the allure of the colonial
staggering material wealth, prestige, and promises of overnight riches, Jaramogi remained steadfast in his
resolve. It highlights his contribution to the welfare of the Kenyan scholars by sourcing for scholarship
opportunities, and selling the plight of Kenyans.
In the text, it is recorded, when James Gichuru (in alliance with Mboya, Moi, Ngala, through KANU)
joined forces with the self-proclaimed settler minority led by Blundel and the company, it was Jaramogi
who remained unmoved with Kenya African National Union, especially with respect to KANU’s
demands of ‘Kenyatta na Uhuru.’ It was Jaramogi who, through endless petitions, conferences in London,
trips overseas, public speeches, engineered the release of the Kapenguria Six. These assertions make
Jeramogi stand out. The assertions aim to counter the misrepresentations of the Kenyan past by the
mainstream state-sanctioned narrative. In this regard, Jeramogi’s autobiography serves the function of self
clarification and self justification (Gusdorf, 1980; Freeman, 1993).
As it appears from the text, Jeramogi amplifies what he has done to the Kenyan state, the roles he has
played and the sacrifices he supposedly done for the Kenyan nation. For the sake of Kenyans, and
Kenya's unity, Jaramogi ignored countless attempts made by KADU technocrats (on behalf of their
Imperial Masters) to wage a rift between him and Kenyatta once the latter would assume office, first as
Prime Minister in 1963, then later as President in 1964. And when he couldn’t take it anymore, like a
gentleman, Jaramogi left KANU without causing a scene (Ogot, 1996: 198; Odinga, 1967: 29). The text
profiles Jeramogi as a nationalist leader who has always been consistent patriotism. His personal interests
only came after the interests of the nation.
This profiling points an accusing finger to the other leaders, especially the then President, Jomo Kenyatta,
who, as the author seems to suggest, was a self seeking oligarchic capitalist and a budding dictator
(Muigai, 2004). That he had to part ways with Kenyatta (a fellow Kenya African Union member since the
early 1920s, a mentor that he had cordially welcomed in Nyanza years prior to the State of Emergency in
1952, a friend whom he had consulted about Kenya’s readiness for independence), as he portrays in the
text, was by no means a product of selfishness, but rather a clear sign that he was not going to throw out
of the window his patriotism.
Not Yet Uhuru, therefore, is a portrayal of Jaramogi’s frustration with Kenyatta’s turn-about that had
turned fellow Kapenguria Convicts such as Bildad Kaggia into his foes. Kenyatta, like KADU Political
Stooges, had betrayed the people, and there was no way Jaramogi was going to be a part of such grand
betrayal. The formation of Kenya Peoples Union (KPU) and his resigning from the Government are
narrated here to highlight his patriotism. The same argument can be raised in regard to Raila Odinga,
Jeramogi’s son.
The Flame of Freedom chronicles the remarkable journey of one of Africa’s leading politicians and
statesmen. Raila Odinga’s life-story mirrors the triumphs and tragedies of Kenya’s struggle to entrench
multi-party democracy and the rule of law into the fabric of the State. The book is a testament to his
courage, determination and sacrifice in the cause of peace, development and public service. It is a bold
call to action for all African leaders.
Odinga’s autobiography takes an in-depth look of how he has struggled to end corruption and bring
freedom. It reveals the life journey of Odinga (His family and political life) and gives an account of how
he Odinga suffered while inside the government. In his autobiography, Odinga paints an image of how
PNU used every means to frustrate and humiliate him and his coalition party ODM. Odinga reveals of
how the ODM ministers were undermined by PNU associates. The autobiography also indicates how
PNU machines used propaganda to politically kill him. It mostly talks about Odinga’s time in the
coalition government with Mwai Kibaki and the betrayals he has undergone all through to bring him
down. The Flame of Freedom also gives a history of Odinga’s challenges since the death of his father and
how he managed to overcome the challenges. It gives a slight hint of his role in the 1982 coup.

Proceedings of the Third International Research Conference held on 26th to 28th October, 2016 325
Odinga’s autobiography (re)brands him as the intellectual custodian of Kenya’s pro-democracy struggles,
and the founding father of democracy. The photographs he selects, the stories he tells, the way he tells
them and the stories that he does not tell, seem to establish Odinga as the authority on the making of
Kenya. Odinga’s story gives clear justification for the constitutional changes that this country finally
made. The text portrays how Odinga stands tall against terror of a dictatorship where sycophancy, fear
and silence reigned supreme. It is an examination of “the government’s long vendetta against the
Odingas” (Nyairo, 2015). Successive governments have successifully isolated the Odinga’s from power.
As one reads through the text the refrain tumeonewa lingers in the background.
Undoubtly, this is a story of courage and determination but in the end, it fills one with an overwhelming
sense of pity. The humiliation that Odinga has suffered is partly in the brutality of detention, so he gives
very few details of his second and third stints therein. Understandably, there is an even more harrowing
pain. You hear it in the number of times Odinga reports, “[they] attacked Jaramogi”. As one reads through
the text, the weight of his father’s unfulfilled dreams is evidently on Odinga’s shoulders. The two
autobiographies are, without doubt, classic examples of subaltern political autobiographies. They
deconstruct history, subvert common knowledge and vilify the main stream state narrative.
The Politics of Conscience: Kaggia and Murumbi, the Unsung Heroes?
In this section of the paper, we interrogate the autobiographies of Kaggia and Murumbi. In these
autobiographies one motif runs through the texts: politics of conscience. The texts profile these leaders as
the heroes whom we did not acknowledge enough. After independence Kaggia established himself as a
militant, fiery nationalist who wanted to serve the poor and landless people (Ogot, 1996). Because of this
he fell out irreconcilably with Jomo Kenyatta. Kaggia also served as a minister in the Kenyatta cabinet;
his denunciations of corruption marked him out as a member of KANU's radical tendency. When
Kenyatta and Mboya combined to purge the KANU left, he was one of their victims, with Kenyatta
making the trip to Kandara to campaign against him. He joined Odinga’s KPU, but eventually retired
from active politics in 1974, after failing to recapture his seat. His autobiography was published in 1975
and it is a compilation the reflections of a disillusioned leader. The politics of conscience permeate the
text. Leaders in independent Kenya had a direct responsibility of addressing the problem of the import-
oriented economy, reversing it to an export-oriented economy. Most of what was produced in Kenya
during the colonial period benefited the Empire (Maloba, 1996: 23). The task of the uhuru government
was therefore to formulate policies that would ensure that the citizens of Kenya benefited from the
economy of their country. The achievement of independence brought vital political decisions under the
control of the indigenous elite, who have shaped much of post-independent Kenya (Ogot, 1996: 98).
Africanisation, in particular, was one of the most emotive political slogans in the tumult before
independence and Kenyatta’s promise to the people. It will be recalled that before independence, large-
scale agriculture, industry and commerce were dominated by non-Kenyans. Europeans controlled
agriculture and industry, while commerce and trade were dominated by Asians (Osolo, 1968: 184). Thus,
after independence, one of the most pressing problems was to break the foreigners’ dominance of the
Kenyan economy and transfer it to Kenyans. In addition, due to the fact that the land issue had been at the
root of most of Kenya’s political troubles, it was necessary to find solutions to it in the interest of stability
and growth in the post-independence era. The issue of land was the most sensitive item in the nationalist
agenda. After independence, the Kenya African National Union (KANU) government had to tackle the
land issue by resettling the landless on land previously owned by Europeans. This, according to Kaggia,
1975: 5) did not happen and it started erecting walls between him and Kenyatta.
Kaggia profiles a nationalist leader of a firm stand, a protector of the masses and a socialist. From the
impression created in the foregoing, Kaggia expected that after Kenya achieved independence, those land
tracts that had been taken by the European and Asian settlers would be returned to their rightful owners
(Mazrui, 1970: 3). However, to Kaggia’s surprise, no one received his land back as Kenyatta demanded
that whoever wanted his land back must first of all pay for it. The rule was simple: no money, no land.
Thus the possession of money was mandatory for land restoration and acquisition.

Proceedings of the Third International Research Conference held on 26th to 28th October, 2016 326
Kenyatta ridiculed and disgraced Kaggia by publicly saying:
Kaggia, we were together with Paul Ngei jailed, if you go to Ngei’s farm, he has planted a lot of
coffee and other crops. What have you done to yourself? If you go to Kubai’s, he has a big house
and a nice shamba. Kaggia, what have you done for yourself? We were together with Kung’u
Karumba in jail, now he is running his own buses. What have you done for yourself? (Mazrui,
1965: 23).
Just like Kaggia’s, Murumbi’s autobiography explores different periods of his life — early years,
emerging nationalist, independence, after politics and others. Joseph Murumbi served as Kenya’s vice-
president for less than a year; but without reading his life story, one cannot know the pivotal role he
played over the decades to help bring about independence. A Path Not Taken: The story of Joseph
Murumbi tells the story of one man whose integrity, honesty, intellect and selfless service to the Kenyan
people was stellar and indisputable. It’s also an important historical text which reflects Murumbi’s vision
and foresight since he started work on it in the 1970s, more than a decade after he had left public service
and around the time he was selling his Muthaiga home and priceless collections of pan-African art, books
and various other cultural accoutrements to the government.
From the autobiography, we learn that Joseph Zuzarte Murumbi was Kenya’s second vice-president from
May to Dec., 1966. He served as Kenya’s first foreign minister for four years, opening every Kenyan
embassy in Africa. He campaigned zealously for Kenya’s Independence and was one of Africa’s greatest
private art collector. Reading through Murumbi’s autobiography, one gets a feeling that what he is saying
as regards leadership was that if he had stuck onto leadership, as vice president until Kenyatta’s death and
become president, Kenya may have turned out as a completely different country — with less corruption
and tribalism. Instead, Murumbi chose another path — and resigned from government, disappointed with
what he saw “Couldn’t stomach the corruption” (67).
Although Murumbi had the utmost respect for Kenyatta, he was disappointed by the politics of the day.
After the assassination of his mentor and freedom fighter Pio Gama Pinto in 1965, Murumbi quit.
Murumbi wrote about the “Kiambu Mafia” and politics becoming increasingly tribal. He entered politics
to address the injustices of the colonial regime and in the text he rails against both the colonial
government and the the new African government.
He writes:
Power never interested me. I felt that I was in the struggle for Independence; when I was invited
to become a minister, I thought there was a contribution I could make… I did that even when
Kenyatta was arrested, the central committee of the KAU (Kenya African Union) was arrested…
anybody who had any love for his country, without any promptings at all, should have come
forward at that time to help. I didn’t know what I was letting myself in for, I didn’t even think of
that… I converted all my energies towards helping in the colonial affairs, not only in relation to
Kenya but other countries… I didn’t go to Gatundu as other ministers did to say, ‘Mzee you must
make me a minister… I’ve never looked at politics from a tribalistic angle… I looked in a much
broader perspective, that I have a duty to do for my country. (Murumbi, 2015: 98).
This reflection helps us in understanding the kind of a selfless leader that the autobiography constructs in
respect to the author, Murumbi.
CONCLUSION
This paper has clearly shown that there is a consensus among the autobiographers interrogated here that
they feel misrepresented by previous and subsequent writings, by friends and critics alike. These
autobiographies seem to follow the same creed that people have failed to unravel the real person behind
Jeramogi, Kaggia, Odinga and Murumbi. These autobiographies are therefore narratives of resistance. In
them, these leaders refuse the misrepresentations of their lives and construct images of who they think
they are. This desire to self-explication seems to be the central goal of penning the Kenyan subaltern
political autobiographies. As we have succinctly shown in this paper, the writers explored here assert an

Proceedings of the Third International Research Conference held on 26th to 28th October, 2016 327
independent and “an oppositional critical consciousness” as a strategy of resistance. They write back to
the mainstream narrative, deconstructing it, subverting it and constructing, for themselves identities that
are consistent to to what the masses need in an ideal leader. They present themselves as the best
alternatives of the leadership. They are the most wise, consistent, intuitive, ideologically wealthy and
incorruptible. In writing their autobiographies, therefore, Jeramogi, Kaggia, Odinga and Murumbi subvert
what is commonly regarded as oriental muteness that has led to more oppression of the orient in this
power relationship. For this reason, the potential for resistance is present when “the history that resisted
its ideological as well as political encroachments” is brought into life. In short, it requires the revival of
repressed or resistant history that can mount challenges to hegemonic structures such as orientalism (Said,
1985: 93-94). This means that studying the autobiographies of Jeramogi, Kaggia, Odinga and Murumbi,
as documents of political resistance and providing an alternative history is very important, especially so,
when Kenya is undergoing various political cultural, social, and economic changes.
REFERENCES
Ashcroft, B. and Ahluwalia, P. (1999). Edward Said. London: Routledge.
Freeman, M. (1993). Rewriting the Self: Life Histories and Memory. New York: Routledge.
Gusdorf, G. (1980). “Conditions and Limits of Autobiography.” J. Olney (ed.) Autobiography: Essays
Theoretical and Critical. Princeton: Princeton UP, pp. 28–48.
Kaggia, B. (1975). Roots of Freedom. Nairobi: East African Publishing House.
Lejeune, P. (1988). On Autobiography. Minneapolis: U of Minnesota P.
Mazrui, A. (1970). “The Monarchical Tendency in Africa Political Culture.” In Marion E. and Nawell M.,
Governing in Black Africa. Englewood Cliffs, NJ: Prentice Hall, pp. 1-24.
Misch, G. (1950). A History of Autobiography in Antiquity. Vol. I. London: Routledge and Kegan Paul.
Muigai, G. (2004). “Jomo Kenyatta and the Rise of the Ethno-Nationalist State of Kenya.” In: Berman,
B., Eyo D. and Kymlicka, W. (eds) Ethnicity and Democracy in Africa. London: James Currey,
pp. 201-217.
Murumbi, J. (2015). The Path Not Taken.Limuru: Franciscan Kolbe Press.
Nkrumah, N. 1957. Ghana: The Autobiography of Kwame Nkrumah. NY : Thomas Nelson and Sons.
Odinga, O. (1967). Not Yet Uhuru. London: Heinemann.
Odinga, R. (2013). The Flame of Freedom. Nairobi: Mountain Top Publishers and Worldreader.
Ogot, B. (1996). “The Construction of a National Culture.” In Ogot, B. and Ochieng’, W. (eds)
Decolonization and Independence in Kenya 1940-1993. London: James Currey, pp. 214-238.
Olney, J. ed. (1980). Autobiography. Essays Theoretical and Critical. Princeton: Princeton UP.
Pascal, R. (1960). Design and Truth in Autobiography. London: Routledge and Kegan Paul.
Said, E. (1978) Orientalism. London: Routledge and Kegan Paul.
Said, E. (1985) “Orientalism Reconsidered”. Cultural Critique, 1: 89-107.
Smith, S. and Watson J. eds. (2001). Reading Autobiography: A Guide for Interpreting Life Narratives.
Minneapolis: U of Minnesota P.
Wainaina, M. (2016). “Dr.Ndii, Marriage Hardly Problematizes the Making of the Kenyan Nation, Try
Childbirth.” Saturday Nation, April 2nd
, p. 12
Weintraub, K. (1982). The Value of the Individual: Self and Circumstance in Autobiography. Chicago:
Chicago UP. ******
CONSONANT SUBSTITUTION IN GICHUKA LOANWORDS
Mbaka, N.W.1, Muriungi, P.K.2 and Muriungi, C.K.3
Chuka University, P. O. Box 109, Chuka-60400
E-mail: [email protected], Telephone: 0727227664
ABSTRACT
Lexical borrowing is one of the major ways in which a language enlarges its vocabulary. Languages
borrow out of need to refer to new items which the language through contact with other language as a
result of trade and colonialism (in the case of African languages). The lexical changes that have occurred
in Gichuka as a result of its contact with other languages have not been investigated. This paper is an

Proceedings of the Third International Research Conference held on 26th to 28th October, 2016 328
analysis of lexical items that Gichuka (Class E.20: Ethnologue, 2009) has borrowed from English and
Kiswahili. The paper analyses the process of consonant substitution using Government Phonology
Theory. This is a process where a consonant in the donor language is replaced with another consonant in
the receptor language. In Government Phonology Theory, the substitution occurs because of the licensing
constraints present in Gichuka which determine the possible combinations in the language. The
consonants that are not found in Gichuka are replaced with those found in Gichuka under Gichuka
licensing constraints.
Keywords: Government phonology theory, Licensing constraints, Lexical borrowing, Linguistics
INTRODUCTION
The theory of Government Phonology (GP), was founded by (Kaye, Lowenstamm and Vergnaud, 1985;
1990; Kaye, 1990b) and expounded on by Charette (1991). It originated in the early 1980s and is based on
the notion that all languages necessarily follow a small set of universal principles along with a series of
parameters delimiting the nature of linguistic variation from one system to another (Cyran, 1995).
Elements present in PE’s (originally phonemes) are monovalent and can be shared in the locality in which
they occur by spreading. GP also proposes that each language has got licensing constraints that operate in
the language allowing certain combinations and not allowing others.
Government Phonology (GP) is a theory that is also based on constraints. It replaces the rule component
with a group of universal principles common to all linguistic systems in the world along with a series of
parameters delimiting the nature of linguistic variation from one language system to another. It is a highly
constrained theory in its view of phonological structure and different from optimality theory in its use of
parameters and principles. In GP, the derivation of licensing constraints is language specific based on
phonological processes in a language. It proposes a spreading analysis which is superior to a re-write rule.
It is also closer to phonological reality because the elements that make up a phonological expression can
spread and in this way the theory explains phonological processes in way that is a natural and close to
reality than any other theory (Cyran, 1995).
In Government Phonology (GP) Theory, there are three recognized constituents: Onset (O), Nucleaus (N)
and Rhyme (R). The three constituents attach on tier called P0
which dominates a tier of timing slots
called a skeleton as shown in 1.
(1)
In (1) we see the three constituents in GP, (Onset, Nucleus, Rhyme) the constituent tier and the skeletal
tier. The rhyme element will not be used in the Gichuka language because Gichuka has a non-branching
structure. The representation will be in ON pairs. The smallest interpretable units that combine to form
sound segments or phonological expressions (PE’s) in GP are elements.
Elements in Government Phonology Theory
The smallest interpretable units that combine to form sound segments or (PE’s) are referred to as elements
in GP. PE’s are the cognitive and melodic units that can be manipulated and which attach to the skeleton.
In GP, elements combine to create PE’s. The elements have been undergoing modification and differ
according to the version of GP being used. A total of nine elements (A I U R H L N h Ɂ) can be employed
for representing the sound segments of a language (Kula, 2002). The characteristics attributed to elements
given below are derived from Harris (1994) and Kula (2002).
A –‘low’ in vowels /present in uvulas and pharyngeals in consonants
I –‘front, high’ in vowels/ Palatality in consonants
U –‘round, back’ in vowels/ Labiality in consonants
O R O R PO (Constituent)
N N
x x x x Skeletal tier

Proceedings of the Third International Research Conference held on 26th to 28th October, 2016 329
R – coronality in consonants
H – stiff vocal words, aspiration, and voicelessness
L – slack vocal cords, voicing
N– nasality in both consonants and vowels
h – noise or aperiodic energy or release/ present in all released obstruents
ʔ – stop or edge/present in all oral and nasal stops and laterals
Segments are made up of one single element as in the case of [I] or are created through ‘fusion’ of two or
more elements to give a compound segment. The phonological expression /t/, is made up of the
phonological elements (ʔ, H, R) while /m/ is made up of [N, U]. The three basic elements ‘A’ ‘U’ and ‘I’
correspond to the corner vowels [a], [u], and [i] respectively. ‘A’ and ‘I’ can be fused. The combination
takes the form of asymmetric (unequal) relations in which one of the elements acts as the head and other
as operator (non-head) in the compound that will be formed. ‘If elements are combined with each other to
form compound expressions one element is usually predominant; it is called the head of the expression,’
(Brockhaus and Ingleby, 1997:4). There is a maximum of one head. The non-heads are referred to as
operators. This means that the element assumes a non-head position in a phonological expression.
Operators that occur together in the same expression are referred to as co-operators. An expression may
contain zero or more operators (Kaye, 1996). In a simplex expression, the lone element can be the head
(Harris, 1995).When ‘A’ is operator and ‘I’ is the head (A.I), the resultant vowel is [e]. On the other hand,
when the relations are reversed (I.A), we get [ᴂ]. The same applies to the combination of ‘A’ and ‘U’
where we get an open [ᴐ] (U.A) or a close [o] (A.U) depending on the combination. Elements which are
heads in an expression are underlined.
Elements spread from one PE to another and this spreading (sharing of elements) is the main explanation
for phonological processes in GP. The spreading analysis will be used in the explanation for consonant
substitution and vowel substitution in the analysis of loanwords in chapter five and six. Since the
elements combine in GP, the issue of how they combine and how some become heads and others become
dependents in a PE needs further clarification.
Element Geometry Geometry regulates the manner in which elements may combine. The complexity condition requires a
governing head to be at least as complex as the governee it governs ; the governing head should contain at
least as many elements as the governee. For example, given the respective representations of [ t ] and [ r ]
in terms of elements are [Ɂ H R ] and [R ] respectively, [t ] will always govern [ r ] but [ r ] may not
govern [t] because it is less complex (Cyran,1995). In this regard, the issue of how phonological process
access more than one element at the same time arises. This makes it necessary to perceive of some
geometric organisation of elements. The element geometry developed in Kula (2002) will be adopted in
this study and is shown in Figure 1.
In Figure 1, the diagram showing element geometry, the segment (PE) is divided into two gestures: the
categorial gesture and the locational gesture. The categorial gesture is further divided into three sub-
gestures: the tone sub-gesture, the stricture sub-gesture, and the phonation sub-gesture. On a par, the
locational gesture is also divided into two sub-gestures: primary location and secondary location sub-
gestures. These gestures and sub-gestures stand in a fixed head-dependent relation to each other. The
categorial gesture is head of the locational gesture. Within the categorial gesture, stricture is the head of
the other two sub-gestures and in the locational sub-gesture, primary location is head of secondary
location (Kula, 2002).
The categorial gesture is chosen as the head of the whole segment because stricture distinctions generally
determine distribution of segments in syllabic organization. The stricture sub-gesture contains features
that express different levels of stricture such as stricture, non-absolute stricture, unimpeded outflow of air
and some interruption in unimpeded outflow of air. Within the categorial gesture, the representation of the
tone sub-gesture as forming the outer shell of the categorial gestures characterises its supra-segmental
nature. The phonation sub-gesture expresses glottal stricture, glottal opening, oral voice and nasal voice.

Proceedings of the Third International Research Conference held on 26th to 28th October, 2016 330
The locational sub-gesture defines both consonantal and vocalic place articulations. The same place
feature is found in the primary and in the secondary sub-gestures with the difference that secondary place
occurs with some primary place specification (Kula, 2002).
Figure 1: Element Geometry. Adapted from ‘The Phonology of Verbal Derivation in Bemba’ by N. Kula,
2002, p. 3
Given the representation in Figure 1, any elemental composition with a stricture element has that element
as head and this defines the class of the segment as a stop (ʔ) or fricative (h) or vowel (A I U). If a
stricture element is specified and the phonation element (L) is added, (L) is interpreted as voice. In
contrast, if no stricture feature is specified and (L) is specified in phonation, it acts as head and has the
interpretation of nasality, depending on whether it is head or dependent. This gets rid of a specific
element for nasality (). Voice, which cannot be the head of any segment, will be represented by an (L)
element in the operator position. Verality is represented by lack of a place element.
Element Geometry in Gichuka, Kiswahili and English
Following the discussion on element geometry in GP in section 4.2.4, in the three languages, the place of
articulation will be represented by the elements ( I) for palatals, (R) for coronals and (U) for labials in the
primary location sub-gesture. (A) Will not play a role because there are no laryngeals and pharyngeals in
the languages. Verality will be represented by a lack of place element following the geometry. The stop
versus non-stop will be captured by (ʔ) in stops and (h) in fricatives in the stricture sub-gesture. Voice
will be represented by an (L) element in the operator position in non-nasals. Voicing will be treated as the
unmarked case with no voice specification while voiceless segments will contain (H). When the element
(L) assumes head position, it represents nasality in nasal segments and since voicing is by default a
characteristic in nasal segments, nasality will imply voiceness. Nasality and voice is captured by an (L)
element. (L) Occupies the phonation sub-gesture in the geometry presented in Figure 5, which when it is
dependent on stricture, contributes voicing When it is head, with some dependent in the location sub-
gesture, it contributes nasality. Prenasalized stops will be treated as stops. Glides will have the same
representation as the vowels / I / and / U/ and will only be differentiated by their position in the
constituent structure. The consonantal system of Gichuka and Kiswahili and English is therefore derived
from the interaction of eight elements [ʔ L R h I U H A). This element geometry will be used to come up
with licensing constraints (LC’s) in Gichuka and also to represent the consonant inventories in the three
languages.
Gichuka Consonantal Inventory in Government Phonology
The derived consonants are in square brackets. Derived consonants are the variants and allophones in a
language which occur in specified phonological environments. Only lexical consonants are used in the
Primary
sub-gesture
A I U R
Segment
Categorial gesture Locational gesture
Tone sub-gesture
L H
Stricture
sub-gesture
A I U Ɂ h
Phonatio sub-gesture
L H Ɂ
Secondary
sub-gesture I U

Proceedings of the Third International Research Conference held on 26th to 28th October, 2016 331
derivation of LC’s. The NC’s (in Gichuka and Kiswahili) are included. Simplex expressions are headed.
Co-operators are elements that can occur together in a PE. Operators are elements that are not heads in a
PE. The derived consonants and the LC’s for English and Kiswahili have not been included. The
explanation for this is that the loanword will be subjected to Gichuka LC’s and the LC’s for Kiswahili
and English have no role to play in the analysis of data. In all the PE’s, the leftmost element is head.
Stops b (ʔ.H U) t (ʔ H R) d (ʔ R) c (ʔ. H I)
Ɉ (ʔ I) k (ʔ H) g (ʔ.)
Fricatives β (h. U.) ð (h. I.) ɣ (h. H) [ ʃ (h. H. I)] s [(h H R.)] [ç (h. I)
Affricates [ʧ (ʔ.H. I.)] [ʤ (h. I.]
Nasals m (L .U) n (L R) ɲ (L I) ŋ (L.) nd (ʔ. L. R ) mb (ʔ. L.U)
ng (ʔ L) nj (ʔ L I )
Voiceless Nasals nð ( h L H I) nc (ʔ. L H I). nt (ʔ.L H R) nk (ʔ. L.H)
Liquid r (R) l [R]
Glides w (U) j (I)
Gichuka Licensing Constraints
i. ʔ must be head
ii. h must be head
iii. L is head in the absence of ʔ and h
iv. ʔ can licence H.U.R I.L
v. h can licence H I U L
vi. L ( as head ) can licence U.R I.H
vii. H and U can be co-operators
viii. H and R can be co-operators
ix. L H and I can be co-operators
x. L H and R can be co-operators
xi. L and U can be co-operators
xii. I and R cannot be co-operators
xiii. No head may licence more than three operators
Constraints (i), (ii) and (iii) define the major categories of segments namely stops, fricatives and nasals.
The constraints in (iv-vi) define the dependents that the major categories (heads) can licence. The
constraints in (vii-x) capture the fact that each segment has one place of articulation and lack of a place is
interpreted as Verality. Constraint (xii) restricts the size of any expression. It is difficult to tell whether
the LC’s are similar to any other language and there is need for further research in this area.
English Consonant Inventory in GP
Stops p (ʔ. H. U.) b (ʔ. U) k (ʔ. H) g (ʔ.) t (ʔ. H .R) d (ʔ. U)
Fricatives s (h. H. R.) ʃ (h. H. I.) v (h. U) f (h. .H. U) z (h R) θ (h H R) ð (h
R) h (h H)
Affricatives ʧ (ʔ H I) ʤ (ʔ I)
Nasals m (L U) n (L R) ŋ(L)
Glides w (U) j (I)
Liquids l (R) r (R)
Kiswahili Consonant Inventory in GP Kiswahili phonemes have been taken from Kiswahili Dictionary, (Said, 2013).
Stops p (ʔ. H U) b (ʔ U.) k (ʔ H) g (ʔ.) t (ʔ. H R) d (ʔ R)
Ɉ (ʔ. I.)

Proceedings of the Third International Research Conference held on 26th to 28th October, 2016 332
Fricatives s (h. H R.) ʃ (h. H. I) v (h. U.) f (h. H U) z (h R) (h. H. R) ð (h. R.) h
(h.. H) x (h.) ɚ (h. H)
Affricatives ʧ (ʔ. H I.)
Nasals m (L. U) n (L. R) ɲ (L. I) ŋ (L) mb (ʔ. L. U) nd (ʔ. L. R) mz (h. L. R)
nj (ʔ. L.I) ng (ʔ. L.) mv (h. L. U)
nz (h. L. R) mm (L. U) m ð (h L R) md (ʔ L R) mg (ʔ. L) mj (ʔ L I.U) ml (L R U.)
mr (L R U)
Voiceless nasals mh (L. H. U) mf (h. H.L. U) mk (ʔ. H.U ) mh ( L. H. U ) mp (ʔ. H. U ) ms (
h. H L R. ) mt (ʔ. H. L.R) nʧ (ʔ L H.I).
Glides w (U) y (I)
Liquids l (R.) r (R.)
English Loanwords
The process of consonant substitution will be explained using the licencing constraints (LC’s) that were
derived from the consonant inventories of Gichuka and English in section 5. A comparison between the
inventories reveals that stops, fricatives and affricates are heads in the three languages.
When a language borrows a lexical item, the ‘head’ in the donor language is sometimes replaced with
another head in the receptor language. This is referred to as element switching. The substitution is enabled
by the similarity of operators that are in each head. For example, the PE / p / has the elements (ʔ. H. U).
The PE is not found in Gichuka consonant inventory. In borrowed lexical items, where this PE is found in
a loanword, it is replaced with / β /. In Gichuka this PE has the elements (h.H U). In this case the headship
is switched from a stop to a fricative. The new head is then subjected to the LC’s in the receptor language
to determine its dependents.
Dependents are the elements that can combine with the head; the elements that the head can license; also
referred to as operators in GP terms. LC’s are language specific combinations that place restrictions on
what elements can be heads and what elements they can combine with in a PE. The LC on the maximum
number of elements that can occur in a PE applies in all cases and will therefore not be included in the
analysis except in cased where it is applicable.The consonant substitutions are provided below.
(3) Substitution of / l / for / r/
Input Output Gloss
a. /klinik/ /kirineki/ Clinic
b. /lɔri/ / ĩrori Lorry
c. /bil/ /mbiro/ Bill
Input Output
The substitution in (3) is the spreading (sharing) of element (R). In the inventory both PE’s are
represented with the coronal element (R) implying that they are the same in element composition thus one
is substituted for another.
(4)The PE’s /p, f, v, b / are substituted with the PE / β
Output Input Gloss
a./paip/ /moβaiβo/ Pipe
b./fʒ:talaiza(r)/ / βataraica/ Fertilizer
c./draivar(r)/ /dereβa/ Driver
d./kʌbad/ / kaβondi / Cupboard
The elements in the PE’s in 4 (a-d) are indicated below. The underlined element is head and all simplex
expressions are headed.
l r
R R

Proceedings of the Third International Research Conference held on 26th to 28th October, 2016 333
Input English Output- Gichuka
The following Gichuka LC’s explain the substitution in 4 (a-d)
i. h or Ɂ must be head (h is head in / β /).
ii. h can licence HUlL (H and U present in the above PE’s).
iii. H and U can be cooperators.
iv. (h licences H and U to form / β / (h .H. U).
In (4) the only switching of heads is between / b / and / p / which have (Ɂ) as head while / β / has (h) as
head. This switching is possible because the operator labial element (U) is found in both / b / and / p /.The
spreading of the labial element enables the switching of heads to take place.
(5)The PE’s / ʧ, s, ʃ, z / are substituted with /c/
Input Output Gloss
a. / blaʊz / / mburaoci / Blouse
b. / ʧɔ:k / / cɔka / Chalk
c. /sku:l / / cukuru / School
d.
/ ʃʊga(r) /
/ cukari /
Sugar
The elements in the PE’s involved in (5) are indicated below. The underlined element is head
Input Output
The following Gichuka LC’s explain the substitution in 5 (a-d)
i. h or Ɂ must be head (h is head in / c /).
ii. h can licence HUIL (HRI present in the above PE’s).
iii. H and I can be cooperators.
iv. H and R can be coperators.
v. (h licences H and I to form /c / (h. H. I). (R) is not licensed because only voiceless nasal clusters
can license more than two operators.
In (5), there is switching of heads from a stop element (Ɂ) to a fricative (h). The two element have the
same operators (H I) which enable the switching to take place. The coronal element (R) is then suppressed
because only nasal clusters can license three operators, thus ruling out (iv).
A key feature in the substitution of consonants is merging, one consonant in Gichuka is used to replace
more than one consonant in loanwords borrowed from English. According to Mwihaki (2005), this occurs
because of the number of approximate consonants present in the borrowing language is fewer. In GP, this
is a result of the combinatory possibilities in a language which are contained in the LC’s of each language
/β/
h
H
U
c
h
H
I
/f/ /b/ /v/ /p/
h Ɂ h Ɂ
H U U H
U U
ʧ s ʃ z
Ɂ h h h
H R H R
I I

Proceedings of the Third International Research Conference held on 26th to 28th October, 2016 334
(6)The Substitution of /k/ with /ɣ /
Input Output Gloss
a. /sɔks/ /sɔɣici/ socks
Input Output
The substitution in 6 (a) is possible because the borrowed word is subjected to the following Gichuka
LC’s:
i. h or Ɂ must be head (h is head in / ɣ / )
ii. h can licence HUIL (H present in the PE’s)
iii. (h licences H only because the two elements are velars with no place specification according to
the element geometry discussed in section 4.6 to form / ɣ / (h.H)
(7)The Substitution of PE / ʤ / for PE / Ɉ /
Input Output Gloss
a. / ʤ enereita(r)/ / Ɉɛnɛreta/ Generator
The elements involved in the substitution are:
Input Output
The substitutions in (7) is possible because the borrowed word is subjected to the following Gichuka
LC’s:
i. h or Ɂ must be head (Ɂ is head in/Ɉ/)
ii. Ɂ can licence HURIL (I present in the above PE’s)
iii. Ɂ licences I to allow the substitution to take place to / Ɉ / (h I)
Spreading of the palatal element (I) enables the switching of heads from a stop (Ɂ) to a fricative (h).
Kiswahili Loanwords
The replacement of a consonant with another consonant is the commonest process in adapting Kiswahili
loanwords into Gichuka. The first substitution is illustrated in (8).
(8) The substitution of / p, f, v, b / with / β /
Input Output Gloss
a. / pilipili / / βiriβiri / Pepper
b. / kibuyu / / keβojo / Plastic container
c. / kufuli / / kuβuri / Padlock
d. / mwavuli / mwaβure / Umbrella
The elements involved in the substitutions in (8) are illustrated in (9). The head element is underlined.
(9) Input Output
/ʤ/ /Ɉ/
Ɂ h
I I
k ɣ
Ɂ h
H
/β/
h
H
U
/p/ /b/ /f/ /v /
Ɂ Ɂ h h
H U H U
U U

Proceedings of the Third International Research Conference held on 26th to 28th October, 2016 335
The Gichuka LC’s explaining the substitution in (9) are as follows:
(i) h or Ɂ must be head (h is head in / β / )
(ii) h can license HUIL (h licences H and U)
(iii) H and U can be cooperators
(iv) h licences H and U to form / β / [ h H U]
For / b / and / p / in (9), there is switching of heads from a stop to a fricative. The elements in the PE’s (H
and U) in the PE’s / b / and / p / can be licensed by (h). Also, in some cases, consonant substitution is
motivated by nominalisation. In 9 (b) the prefix (ke-) is a singular prefix for class 7 nouns which form
their plural with (i- )and in (d) the prefix (mwa-) is a singular prefix for class 3 nouns. The second
consonant substitution is illustrated in (10).
(10)Substitution of / Ɉ, ʃ ʧ / with / c /
Input Output Gloss
a. /kiɈikɔ/ /geciko/ Spoon
b. /mʃipi/ /mociβi/ Belt
c. / ʧumvi/ /cumbe/ Salt
The elements involved in the substitutions in (10) are illustrated in (11). The head element is underlined.
(11)
Input Output
The substitution in (11) is enabled by the following Gichuka LC’s
(i) Either Ɂ or h can be head (h is head in / c / )
(ii) h can license HUIL (h licenses H and I)
(iii) H and I can be co-operators
(iv) No head may license more than three operators thus we have /c/ [h. H. I]
In (11) the element / Ɂ / which denotes a stop is switched to a fricative in the case of / ʧ / and / Ɉ /. All the
PE’s have the same operators (H I). This enables the switching of heads to take place.
(12) Substitution of/ k/ for /g/
This is a process which involves many lexical items but only two will be sampled.
Input Output Gloss
a. / kitungu:/ /getongoro / Onion
b. / Kijikɔ / /geciko / Spoon
The elements involved in the substitutions in (12) are illustrated below. The stop element (Ɂ) is head
Input Output
k
g
Ɂ Ɂ
H
c
/ h
H
I
ʧ
/
/
/
/
ʃ
/
/
Ɂ
h
H
H
I I
Ɉ
/
/
Ɂ
H
I

Proceedings of the Third International Research Conference held on 26th to 28th October, 2016 336
Substitution of /k/ for /g/ is a spreading of features, enabled by following the following Gichuka LC’s.
i. Ɂ must be head
ii. Ɂ can license the HUIL (Ɂ licenses nothing to form the simplex element / g / [Ɂ.].
The substitution occurs because the two PE’s are velar stops with no place specification according to the
element geometry. The substitution of / k / with / g / is also accompanied by the substitution of / i / with /
e /. The prefix (ge-) is a morphological marker for class 7 and 8 nominal classes whose plural prefix
marker is (e-). Similarly, the (ki-) prefix in the Kiswahili words is also a morphological marker for a
nominal class 7 nouns.
(13) Substitution of PE / s / with / ð /
This is also a common substitution strategy in the adaptation of Kiswahili loanwords into Gichuka. Three
examples have been sampled in 8(a-c)
Input Output Gloss
a. /stima/ / ðitima/ Electricity
b. /saa/ / ða:/ Time/clock
c. /samaki/ / ðamaki/ Fish
The elements involved in the substitutions in (13) are illustrated below. The topmost element is head
The substitution 13 (a- c) is enabled by following the following Gichuka LC’s.
(i) h must be head
(ii) h can license HUIL (h licences I)
(iii) I may not be co-operator with R
(iv) H licenses I to form / ð / [h I]
SUMMARY
Consonant substitution in Gichuka loanwords (borrowed from English and Kiswahili) has been explained
as the spreading of elements under Gichuka licensing constraints. In the process of substitution, there is
switching of heads which is enabled by the spreading of the place element present in the phonological
expressions involved. In English loanwords, / r / is substituted for / l /, /p, f, v, b / are substituted with the
/ β /, / ʧ, s, ʃ, z / are substituted with /c/, /k/ with /ɣ / and / ʤ / with / Ɉ /. In Kiswahili loanwords, / p, f, v, b
/ are substituted with / β /, / Ɉ, ʃ ʧ / with / c /, k/ with /g/and / s / with / ð /.
REFERENCES
Charette, M. (1991). License to Govern. Phonology 7:233 – 253.
Cyran, E. (1995). Resonance Elements in Phonology: A Study in Munster Irish. Eolium: Lublin.
Harris, J. (1994). English Sound Structure. Oxford: Blackwell.
Harris. J. (1995). The Elements of Phonological Representation. In Durand, J. And Katamba, F. (Eds.).
Frontiers of Phonology: Atoms Structures, Derivations 34 – 79
Kaye, J. D. (1990b). ‘Coda’ Licensing. Phonology 7:301 – 330
Kaye, J. D. (1996). The Acquisition of Phonology. Ms. School of Oriental and African Studies,
University of London.
/s/ /ð/
h h
H I
R

Proceedings of the Third International Research Conference held on 26th to 28th October, 2016 337
Kaye, J. D. (1992b) On the interaction of theories of Lexical Phonology and Theories of Phonological
Phenomena. In: W. U. Dressler, H. C. Luschutzky and J. R. Rennison. (eds.) phonologica1988:
Proceedings of the 6th International Phonology Meeting. Cambridge: Cambridge University Press,
141-155.
Kaye, J. D., Lowenstamm, J. and Vergnaud, J. (1985). The Internal Structure of Phonological Elements.
A Theory of harm and Government. Phonology Yearbook 2:305 – 328.
Kaye, J.D., Lowenstamm, J. and Vergnaud, J. (1990). Constituent Structure and Government in
Phonology. Phonology 7: 193-231.
Kula, N. C. (2002). The Phonology of Verbal Derivation in Bemba. The Netherlands: LOT Publishers.
Mwihaki, A. N. (2005). Merging in Gikuyu Loanwords. Poznan Studies in Contemporary Linguistics 40,
pp. 157-168. School of English, Adam Mickiewiecz University, Poznan, Poland. ******
THE FAMILY GOVERNMENT AND SUSTAINABLE FAMILY SYSTEMS ON CHRISTIAN
PRINCIPLES FOR SUSTAINABLE DEVELOPMENT
Okebiro,G.N., Shatora, E., Nyakeya, I., Gesare, E., Okebiro, H., Mogere, C., Mouko, P. and Kerubo, A.
Kisii University, Eldoret Campus. Email: [email protected]
ABSTRACT
The family is an important unit of organization for social development in the community. The family is
created through marriage and marriage is done through the campaigns done by family members of
procreation (father, mother, brothers, sisters and relatives). They shortlist the viable ladies through the list
given by the boy to marry. The selection is done on viable candidate and election is done through
Christian principles and confirmed through the Christian wedding. Once the wedding is done the husband
and wife form the family government system immediately. The problem nowadays, the family
government set on the Christianity principles fail because the husband and wife and children do not
follow Ten Commandments of God. The objective of the study is to analyze and evaluate the roles played
by the husband, wife and children which form family government. The paper adopts the observational and
biblical analytical method. The key results are, most of the family government fails because the husband,
wife or children do not play their roles in the family according to Christian principles which cement the
family government. It is concluded most family governments fail and need to revise the biblical teachings
in reference to family government. It is recommended, families to follow the Christian principles as set in
the Ten Commandments.
Keywords: Family, Government, Sustainable family, Christian principles.
INTRODUCTION The family is an important unit of organization for social development in the community. Philosophically
there are three forms of families: First, spiritual form of family where christens are ordained to work for
God and preached the word of God, including, fathers, brothers and sisters and so on; the second is
psychological form of family who are focused to God; the third is physical form of family where a
woman unite with a man and become one(1+1=1 NOT 2).This was type of family which was analyzed in
the study for the sustainable development goals. The family is created through marriage and marriage is
done through the campaigns done by family members of procreation (father, mother, brothers, sisters and
relatives of the person to marry and to be married).They shortlist the viable ladies through the list given
by the boy to marry. The selection is done on viable candidate and election is done through Christian
principles and confirmed through the Christian wedding. Once the wedding is done the husband and wife
form the family government system immediately.
How the family began on Biblical contextual framework (Genesis 2:18-25)
God created male and female. This account particularly amplifies the “and female” part of the statement
and shows how woman was created. Three observations can be elaborated on the passage that will help us
to understand how family began as follows:
(a) The need for woman (vv.18-20) woman is absolutely essential in God’s plan. It was God who
observed “it is not good that man should be alone” (v.18) and determined to make a “helper” for Adam.

Proceedings of the Third International Research Conference held on 26th to 28th October, 2016 338
Woman’s role in the will of God was to be a “helper” who was suitable to man in every particular mental,
spiritual, emotional, social and physical need.
(b)The provision of a woman for man (vv21-24) God caused Adam to go to sleep and God removed one
of his “ribs”. Exactly what God removed is not known, but it was adequate for his purpose. He “made”
(lit built) a woman [v.22] whom Adam recognized as being his equal, “bone of my bones and flesh of my
flesh”. This resulted in what has become to be known as Universal law of marriage (v.24) in which it can
be seen that: (I) Responsibility for marriage is on the man’s shoulders-he is to “leave his father and
mother” (ii) Responsibility for keeping the union together is on the man’s shoulders: he is to “be joined
to” his wife, and (iii) Union is indissoluble: “they shall become one flesh”.
(c) The state of the first man and woman (v.25) from the beginning the man and woman were “naked” in
each other’s presence and “were not ashamed” there is no shame in nudity when it occurs within the right
context-the marital union. This passages clearly teaches that: 1. Sex was God’s idea and is not sinful; 2.
Sex came before the fall, and if the fall had never taken place there still would be sexual relations between
a man and a wife; 3. Propagation of species is one but not the exclusive purpose for sex. The bible gives
two other reasons for sex as follows :(i) To promote love between the husband and wife (Hebrews 13/4).
(ii) To prevent fornication-unlawful satisfaction of the God given sexual desire (1 Corinthians 7/2).
The family is a basic component in the human community. Therefore the family is a community of love
in the service of life. In the family government, a family is a community of love since its establishment
through Christian principles. The main purpose of the family government once it is established is the
personal fulfillment of its members comprising of the husband and wife, children and any others living as
part of the family. A family is formed through a process two steps which entails the first step marriage
and second step of sexual intercourse for the purpose of procreation. The family’s main aim is to fulfill
personal needs of its members and the means for achieving this aim is a communal life, which provides a
suitable environment for producing of children and upbringing. The communal life of the family includes
the provision of food, clothing and shelter, the basic education, play and recreation, protection from
danger or risks, protection of health, its religious atmosphere, and care of the older members of the family
who may not be able to work enough to provide for all their own needs (SharkeyandWelch, 1987).
In the first step marriage starts with the establishment of relationships, both between the husband and
wife, and between the family of the husband and wife, and between the family of the husband and the
family of the wife (Sharkey and Welch, 1987), which is referred to as in the ‘Tree’ of family setup as the
first root leading to attitude, anthropological, sociological and physical foundations and set up in the
community. Marriage means the agreement of a man and a woman to establish a permanent community
of life for mutual comfort and support and for the production and bringing up of children. Marriage is by
agreement between a man and a woman which depends on the understanding what is involved and free
consent of the two partners to take each other. In all communities in the world, marriage or the union of
the two receives recognition in some form or the other mostly accompanied by some form of ceremony,
religious or traditional or legal requirement that it be registered in some form. Therefore, marriage is
honourable as the word declares (Hebrews 13; 4). The two in the marriage are complimentary, in that
each makes the other complete. Therefore; it [marriage] is expected by all to be permanent. The
permanence in marriage is necessary for security, for the husband and wife and for children. Once the
marriage is over, the family is established and the family government starts. The term government is
defined from the term to govern-which means to rule, to control, or to administer. Therefore, the family
cannot exist without authority, so it must have a head, which in a normal family will be the father.
Usually in a family both wife and husband will have authority over the children. In this sense it will
depend on which style of leadership in the government formed by the husband and wife whether
democratic, dictatorship/authoritarian/autocratic, consultative or Laissez-faire.there are ten Laws of
marriage as never follows: one, we should not have any other person to take the space of your spouse.
Two, you should not have any extra love, touch, kiss or hug other than your spouse.third,you should not
carelessly or shamelessly humiliate your spouse in public or in front of other people. Fourth, remember
and keep the important or significant days of spouse especially births days. Fifth, honour the parents of

Proceedings of the Third International Research Conference held on 26th to 28th October, 2016 339
spouse and you should not talk ill of them always. Sixth, you should not kill the spirit of your spouse
spirit in discussion to be angry, criticize, insult, condemn or abuse. Seventh, you should not have extra
marital affairs idea either by persuasion, admire or touch or kiss. Eight, you should never take anything
your spouse have before he/she gives you. Nine, you should not cheat your spouse or try to cheat. Ten,
you should not talk negatively against your spouse.
The second step is sexuality/intercourse. Once the marriage is over the family of two, husband and wife
must have sexual intercourse, which is referred to as in the ‘Tree’ of family setup as the second root
leading to emotion, spiritual, psychological and economical foundations and set up in the community. The
New Testament declares that sex is good in reaffirmation of Old Testament teachings. The sexual activity
should be restricted to the husband and wife within the bonds of Christian marriage (Matthew 19; 4-
6).The two are united in that to marry is to agree to cooperate in repetitive cycles of sexual relationships
(Ephesians 5; 22, 1 peter 3; 1, 1 Corinthians 7; 2-4). In Sexual fulfillment God created woman to be the
mirror image of man. One plus one equals to one not two thus one is incomplete without the other,
physically and psychologically, but together they become one unity (Genesis 2:24-25; Matthew 19:5-6).
According to Brock (1977), That is why epistles teach that marriage is honourable and sexual activity
between a Christian husband and wife is an act of worship that the Lord has blessed (Hebrews 13:4).
Sexual intercourse leads to two significant extremes of; one, procreation and two, non- procreation. In the
latter, non- procreation is a situation where sex is played and there is no gift of children. Also sex is not
intended to be used as a convenience. Abstinence should only be practiced as spiritual fast and when both
parties have agreed for a limited time (1 Corinthians 7; 5-6).The former extreme, procreation is a
situation where sex is played and the family is blessed with the gift of children. Nowhere in the bible god
restrict sexual fulfillment to procreation. Likewise the word does not point out that children are a blessing
and should be received as God’s gift to parents (Genesis 1; 26-28; psalms 127,128).The significant
caution in the bible is that the number of children should be planned within the ability of the parents to
provide for the intellectual, spiritual and physical welfare of their family (1 Timothy 5; 8).
Statement of the Problem
The problem nowadays, there are conflicts in family government set on the Christianity principles fail
because the husband and wife and children do not follow Ten Commandments of God and do not play
their roles in the family government on Christian principles. It is against this background that the research
was done to unearth the findings.
Objective of the Study
The objective of the study is to analyze and evaluate the roles played by the husband, wife and children
which form family government.
METHODOLOGY
The paper adopts the observational and biblical analytical method. Observation is a data gathering device
that entails visual perception and recording of what is occurring in a given situation (Kathuri and Pals,
1993). The research will adopt a combination of both descriptive and exploratory survey design to
establish the roles of the husband, wife and children and its implications the family government and the
society. Kombo and Tromp (2006), noted, concerning descriptive design, that such studies are not only
restricted to fact finding, but may often result in the formulation of important principles of knowledge and
providing solutions to significant problems. Exploratory studies are discovering investigations that are
suitable when researches are searching for new insights to problems and want to measure phenomena in a
new light. Research that use exploratory studies must be prepared to modify their research directions in
case new data and insights arise; hence this type of research is flexible and adjustable.
Key Findings
The key results are, most of the family government fails because the husband, wife or children do not play
their roles and have conflicts in the family according to Christian principles which cement the family
government. The causes of conflicts are adultery, fornication and alcoholism. In families governments are

Proceedings of the Third International Research Conference held on 26th to 28th October, 2016 340
found in human societies, whatever the prevailing religion or ideology and because of the universally of
the family to be a human community ordained by God. The ordained family government is established
through marriage. The purposes of family after marriage are the fulfillment of the husband and wife as
persons and production and bringing up of the children. Normally in a family both wife and husband will
have authority over the children and the treatment of each other (Husband and wife). In this sense it will
depend on which style of leadership/authority in the family government formed by the husband and wife
whether democratic, dictatorship/authoritarian/autocratic, consultative or Laissez-faire. These types of
family leadership and management are discussed and the findings are given as follows:
(i) Authoritarian/dictatorial/autocratic leadership- This is negative in the sense that it thrives by
unleashing terror and instilling fear in the family members through use of punishments, canning,
suspensions and expulsion to coerce wife and children into obedience. This kind of authority hands rules
and policies, orders and instructions are to be followed by force to all family members. Consultations are
rarely made or none. These are handed from the wife (mother) to the children. Children have no power to
make decisions. The father as the head and the mother as assistant head are only expected to implement
decisions by themselves and children to follow. It is assumed the head of the family knows what is good
for everybody and the members of the family as a whole.
(ii) Consultative leadership- This style of leadership or authority in the family members promotes
individual thinking and initiative. It requires broad-based contribution of opinions and ideas from all
members of the family (father, mother and children) when seeking to introduce change or innovation and
development in the family. Several ideas and opinions are given before [possibly] consulting an expert
opinion on the matter and then the final decision is made.
(iii) Laissez-faire- This ‘let alone’ or ‘leave alone’ style of leadership or authority leaves the children to
do whatever they want at their own time and convenience. The father and mother have no control and
they are head and assistant in name only. The leadership in the family is weak, insufficient and
irresponsible that decisions are made by chance. In this kind of leadership or authority in the family leads
to children perform poorly in schools and perhaps drop from schools. They get involved in drug abuse
and other social crimes.
(iv)Democratic or enabling leadership- In this style, the leader participatory decision-making and there
is absence of consensus on opinion, the decisions of the majority are accepted in the family. Each family
member is regarded as equal to the other and opinions of every member are respected and considered in
the process of decision making in the family. Therefore, decision-making process is slow process, though
once decisions are arrived at, they are more binding, lasting and unifying. It involves active and evenly
spread participation family members in the processes of decision-making and all children, wife and
husband and all are empowered.
DISCUSSION AND CONCLUSION
It is concluded that for the family government to be stable, each member in the family should play their
according to Christian principles through God’s guides guidance. The members in the family government
comprise of husband and wife and children. When the children are born in the family government, the
husband is the father and the wife is the mother of the children respectively. There are three essentials for
a Christian home as follows: Moses told the people of Israeli what a home is about and set three
components which must be true if the home is rightly related to God: There must be a revelation of God
(6;4)-God revealed three things about himself as follows: (I) his eternality (Jehovah; Hebrew YHWH, the
eternal) [ii] his plurality (Elohim, Hebrew plural of God, there are three persons in Godhead). (iii) His
unity- “one Lord” – three persons of the Godhead constitute one God: each is essential. (a) There must be
response to God’s revelation (6.5)-the response is to be total response of love with all one’s being, heart,
soul and mind. (b) There must be threefold responsibility (6;69) this threefold responsibility acts as a
check upon the proper response.

Proceedings of the Third International Research Conference held on 26th to 28th October, 2016 341
If the earthly father responds to God with love he will be fulfilling his threefold responsibility. If he fails
in any particular, confession of sin is necessary because he does not love God with all his heart, soul and
mind. The threefold responsibity is: (I) to have God’s truth given his heart [6;6] there must be heart
reality not mere external conformity or ceremony (ii) To have God’s truth govern his home-this is
evidenced by the fact that the father teaches truths of God’s revelation to his children by both formal
[teach diligently] and informal [talk to them]instruction. (iii) To have God’s truth govern his habits and
conduct personally, privately and publicly.
In summary, the home is to be a divine school in which the father is to be the teacher under Christ. The
home therefore must have the father, mother and children each plays a role for the success of the family
government as follows:
The Role of the Husband/Father in the Family Government on Christian Principles
The role of the husband/father -1 Corinthians 11/3 –but I would let you know that the head of every man
is Christ and the head of a woman is the man and the head of Christ is God. The husband is the head of
the family should not Drink-proverbs 31/4 should not drink or be a drunkard-it is not for kings O
Lennuel, it is not for kings to drink wine, nor princes strong drink. For a drunkard and glutton shall come
to poverty and drowsiness shall clothe it man with rags(Proverbs 23/21).Husbands should love their
wives-Husbands love your wives, even as Christ also loved the church and gave himself for it. (Ephesians
5/25).So ought men to love their wives as their own bodies. He that loved his wife loved himself. For no
man ever yet hated his own flesh, but nourished and cherished it, even as the Lord the church. Likewise
husbands, live with your wives in an understanding way, showing honour to the woman as a weaker
vessel, since they are heirs with you of grace of life, so that your prayers may not be hindered(1 Peter
3/7).Husbands love your wives and do not be harsh with them(Colossians 3/19).In the modern family
some of the husbands in the family government do not love their wives instead they kill them, which is
contrary to the biblical teaching and Christian principles.
Role of the Head of the Family
The husband should be the Provider-But if any provide not for his own and especially for those of his
own houses, he had denied the faith and is worse than an infidel (1 Timothy 5/8). Disciplinarian-father the
discipline masters of the family government. And let the fathers provoke not your children to wrath but
bring them up in the nature and admonition of the Lord (Ephesians 6/4). The director of the children-Job
directed his children/sons when days of the feast had run their course, Job would sent and consecrate the
children and rise early and offer burnt offerings according to the number of them, for Job said “if may be
that my children have sinned, and cursed God in their hearts’ Thus Job did continually (Job 1/5). Traner-
Train a child in the way he should go and when he is old he will not depart from it (Proverbs 22:6).
He commands the children- “For I have chosen him, that he may command his children and his household
after him to keep the way of the Lord by doing righteousness and justice, so that the Lord may bring to
Abraham what he has promised him”(Genesis 18/18-19). Who is the good wife? (1) honour and respect
her husband always everywhere (2) keeps herself smart and clean outwards, aims being fit in outfit(1
peter 3/1-2;Ecclesisticus 7/29. (3) a good wife communicate with her husband all matters in all aspects by
her husband(4)cares for her husband’s welfare, food, clothes, emotions (5) lives within her budget. avoids
debts, she is an economist. (6) cares for her mouth ,she knows where, when, how to talk. (7) spares time
with her husband. she knows the husband’s needs and wants his company always (8) tries to understand
her husband as a man. Examples in the biblical context in the family government of Good husbands
includes: Elkanah-On the day when Elkanah sacrificed, he would give portions to Peninnah his wife and
to all her sons and daughters. But to Hannah, he gave a double portion, because he loved her though the
Lord had closed her womb (1 Samuel 1:4-5). Bad husbands includes-Now king Solomon loved foreign
women along with the daughters of pharaoh; Moabite, Ammonites, Edomites, Sidonians, and Hittites
women, from the nations concerning which the Lord had said to the people Israel “you shall not enter into
marriage with them, nether shall they with you, for surely they will turn away your heart after their gods”,
Solomon clung to these in love.

Proceedings of the Third International Research Conference held on 26th to 28th October, 2016 342
Role of Woman in the Family Government
Women should not make life to be bitter to the parents- like Judith daughter of Beeri the Hittite and
Basemath the daughter of Elon, the wives of Esau-they made life bitter for Isaac and Rebecca (Genesis
26/3).Should be a Helper to the husband (Genesis 2/18).A woman encircles a man (Jeremiah 31/22).
Woman should have reverent behaviours as older women likewise are to be reverent in behaviour, not
slanderers or slaves to much wine. Should train the young women-They are to teach what is good and so
train the young women to love their husbands and children, to be self controlled, pure, and working at
home, kind and submissive to their own husbands, that the word of God may not be reviled(Titus 2:3-
4).Woman should be Excellent wife- who can find? She is far more precious than jewels (Proverbs
31/10).The heart of the husband trusts in her and he will have no lack of gain. And this will lead to
successive family government and development in the family.
Characteristics and behaviours of good wives(Proverbs 31:12-27)(i)She does the husband good and no
harm, all the days of her life; nowadays, women harm their husbands by chopping off/cutting their genital
organs. (ii) She seeks wool and flax, and flax and works with willing hands; and some like their hands to
work and bring everything for her and makes her dependent in the husband (iii) She is like ships of
merchant; she brings her food from afar; (iv) She rises while it is yet night and provides food for her
household and portions for her maidens; some modern women sleep till afternoon and entrusts the work
to the maid (v) She considers a field and buys it; with the fruit of her hands she plants a vineyard; modern
women do not like buying assets especially land because they believe it is the work of the husband, even
do not have homestead garden for horticultural crops such as onions, vegetables, tomatoes and so on
(vi) She dresses herself with strength and makes her arms strong; nowadays women dress half naked and
provoke men who are not their husbands. (vii) Opens her hands to the poor and reaches out her hands to
the needy; (viii) She makes bed covering for her; her clothing is fine Linen and purple; (ix) her husband is
known in the gates, when he sits among elders of the land; (x) she makes linen garments and sells them,
and supplies sashes for the merchants. (xi) she opens her mouth with wisdom, and on her tongue is the
law of kindness; nowadays modern women argue with men in forums (xi) she watches over the ways of
her household, and does not eat the bread of idleness; some modern women do not care about their
households (xii) her children rise up and call her blessed, her husband also praises her.
In conclusion, the charm of a woman is deceitful and beauty is vain, but a woman who fears the Lord, she
shall be praised. “Like mother like daughter” women are the mother’s daughter loathing husband and
children and they are the sisters of your sisters who loathed their husbands and children” (Ezekiel 16/44-
45). Who is the good wife? (1) honour and respect her husband always everywhere(2)keeps herself smart
and clean outwards, aims being fit in outfit(1 peter 3/1-2;Ecclesisticus 7/29.(3) a good wife communicate
with her husband all matters in all aspects by her husband(4)cares for her husband’s welfare, food,
clothes, emotions(5)lives within her budget. avoids debts, she is an economist.(6)cares for her mouth ,she
knows where, when, how to talk. (7) spares time with her husband. she knows the husband’s needs and
wants his company always (8)tries to understand her husband as a man.
Biblical examples of good wives are, Elizabeth the wife of Zachariah. They were both righteous before
God, walking in all the commandments and ordinances of the Lord blameless. Abigail the wife of
Nabal.she was a woman of good understanding and beautiful appearance, but the man was harsh and evil
in his doings. There are examples of Bad and good women in Biblical context. Bad women includes:
Sapphira the wife of Annias.
They lied when they sold a possession and kept part of the proceeds, his wife also being aware of it, and
brought certain part and laid it at the apostles’ feet(Acts 5:1-2). The wife of job said “Do you still hold to
your integrity? Curse God and die!”(Job 2:9). Good women includes: Sarah obeyed Abraham, calling him
lord, whose daughters you are if you do good and are not afraid with any terror(1 Peter 3:6). Elizabeth the
wife of Zachariah-they were both righteous before God,waliking in all the commandments and ordinances
of the Lord blameless.

Proceedings of the Third International Research Conference held on 26th to 28th October, 2016 343
Role of Children in the Family Government
A child is a person born in the family by the father and mother and forms the arm of the family
government. Therefore, children should be Obedient-children should obey their parents in the Lord for
this is right. Should Honour their parents-children honour your father and mother, which is the first
commandment with promise “that it may be well with you and you may live long on the earth”. Should
Respect the old people-“you shall rise before the grey headed and honour the presence of an old man and
fear your God”(Leviticus 19/13). Should Listen carefully-listen to your father who begot you, and do not
despise your mother when she old (Proverbs 23:22). Children should Be truthful-buy the truth and do not
sell it, also wisdom and instruction and understanding (Proverbs 23:23) in this context, there are children
who do contrary to the parent’s wishes and make the family government fall.
Children should not rob their father and mother-because whoever who robs his father or his mother, and
says “it is no transgression”, is the same companion to a destroyer (Proverbs 28:24). Should not steal- let
him who stole steal no longer, but rather let him labour that he may have something to give him who has
need (Ephesians 5:28). Should not lie-let no corrupt communication proceed out of your mouth but what
is good for necessary edification, that it may impart grace to the hearers (Ephesians 5:29). Should Follow
the instruction of the parents-my son, hear the instruction of your father and do not forsake the law of
your mother. Should not take/drink wine-do not mix wine bibbers or with gluttonous eaters of meat
(Proverbs 23:20). Glory to God-when drinking and eating do to the glory to God-therefore, whether you
eat or drink, or whatever you do, do all to the glory of God (1 Corinthians 10:31). Do not mock the
parents-the eye that mocks his father, and scorns obedience, to his mother, the ravens of the valley will
pick it out and the young eagles will eat it(Proverbs 30:17).”For God commanded, saying “Honour your
father and mother” and he who curses father or mother, let him be put to death”.
RECOMMENDATION It is recommended, families to follow the Christian principles as set in the Ten Commandments. It is
recommended in the family government, a family is a community of ‘love’ through Christian principles.
In the family government contextual framework, the term ‘love’ has several meanings. It can be applied
to sexual love, between wife and husband, but not children in the family. It can also apply to the natural
affection which members of the family feel towards one another, their loyalty to one another, admiration
for their better qualities, or improvement of family standards. It can further mean where a person desires
and seeks the highest good for another person. In the democratic or harmonious or peaceful family
government, this love will exist between each member and every other member.
Loving God adequately is essential if we are going to love each other effectively in the family
government: Loving has four significant components of heart, soul, mind and strength. Loving with Heart
in the family government-love God with the “heart” means that part of intelligence that has to do with
knowledge, understanding and knowing what the word says in the Bible, but also what it means in
everyday life. When family members Loves God with heart, they use the bible as a basis for planning
their daily lives. His word doctrine is the basis of teaching the truth (John 16:13)-letting God’s word is the
core of shared values brings harmony into marriage. Secondly, the scripture is a reproof-this refers to
preventive information given to keep Christian family from falling into error or temptation and causes
failure of the family government. When the couple (father and mother) desire God’s will with all their
hearts, they will be open to the leadership of the Holy Spirit to bring the word to their remembrance and
help them to avoid mistakes or sins in the family government. The word is applied in the family
government for correction-the heart that loves God, points out the errors of people’s ways. Even if it is an
intentional or unintentional wrong, the applying of the word of God to the heart, of the Christian husband
or wife brings a quick apology and restoring of relationships in the family government and lead to
sustainable family and development (Ephesians 4:25-27).Knowing the word of God-opens the hearts of
the family members to the instruction of the Lord. It makes family members open to the new things, he
wants to teach them their love grows for him and for another’s husband and wife who share a love of God
based on his word and a love for each other that allows his love to mature, are well on their way to
knowing final joy and happiness in marriage.

Proceedings of the Third International Research Conference held on 26th to 28th October, 2016 344
Loving God with the Soul in the Family Government –loving God with the soul involves the will,
affection, desire and the whole realm of emotions. David said “Unto thee, O Lord, do I lift up my Soul”
and “I delight to do thy will, O my God”(psalms 25:1;40:8).Loving God with all of the heart, stimulates
the motivation of his love to bring happiness into the life of the family in companion.
Loving God with the Mind in the Family Government-when Jesus used the word “mind” he was
speaking of the part of intelligence that involves wisdom. Divine wisdom comes from above (Proverbs
2:6) it is the result of first, revelation and experience. This is true in marriage, when family members learn
to love the Lord with our heart, the family members will be able to take his word and apply it to our daily
lives. Profiting from the mistakes and successors of others, as the Holy Spirit gives us the written record
affords us the opportunity to apply the experience of the past to the challenges of the present. This is the
kind of loving and living that makes the Christian marriage the happiest in the community.
Loving God with the Strength in the Family Government-to love the lord with our energy involves
giving all that we are to him in behavioral demonstration of the love that is developing in our heart; to put
his will first in our time and work. When the family demonstrates their love for Him (God) by practical
involvement in his work, the family finds new ways to love him in service. Paul challenges people to do
all things to the glory of God (1 Corinthians 10:38).The family star in figure 1 illustrates the four
components described heart, soul, mind and strength.
Figure 1. Family star in the family government. Source: Researcher 2016
In the family government, the family star illustrated in figure 1, is very significant to curb problems
emanating from family issues of work and breaking families. The family star has six pillars on which the
family founded and cemented. In the centre of the family star there is hierarchy of GOD. Therefore GOD
is omniscience and knows every family in this world. The family is founded by God through marriage of
man and women who become one by one plus one is equal to one NOT two(1+1=1 Not 2) and form the
family. A family stands on LOVE as the first pillar in the family government, but the word ‘love’ can be
used to mean a number of ways and appears in stages as a person grows in the family. C.S. Lewis, in his
book The four loves, talks about four words, eros-passionate (sexual) love; philia-a feeling of friendship,
loyalty and the desire of companionship; storge-family affection between children and parents, brothers
and sisters and so on; agape-always seeking the highest and best for the other person. All these types of
‘loves’ must be present in marriage relationship. Therefore no husband would molest or beat her wife
because of work for the development of the family.
The second pillar in the family government is UNITY in the family the man and woman are united
through the power of love, nobody understands how people join into marriage, why choose the other and
leave others? If there is unity the family stays in harmony and lead to sustainable development.
The third pillar in the family government is PEACE in the family, because Christians believe that the
family is ordained by God. Their aims are the fulfillment of husband and wife as persons and production
and bringing up of children.

Proceedings of the Third International Research Conference held on 26th to 28th October, 2016 345
The fourth pillar in the family government is the HEART-the man’s or woman’s hearts enters into the
bottom of the heart of the woman or man and join together in the marriage. After marriage they form a
family and man becomes: husband, protector, leader, initiator, outward looking and analytical and also
woman automatically becomes: wife, mother, home-maker, sympathetic, intuitive, in-ward looking,
interested in details.
The fifth pillar in the family government is the BODY-Paul in 1 Corinthians 6/18-20, shows that the body
of a Christian is the temple of the Holy Spirit; when the gift of sex is misused for the purpose not intended
for, the holy place (temple) it becomes impure.
The sixth pillar in the family government is the MIND-in the families is important to put the two minds of
wife and husband to reason together and have a direction in the family.
In the family star there are six perquisites inside the six pillars as follows: LOVE brings inside JOY and
HAPPINESS in the family government. It is important to note that love is an “attitude”, as such it is
controlled by the parasympathetic nervous system which is activated primarily by the brain. Because of
its cognitive relationship, love tolerates time and space and does not clamor for immediate expression, but
sex may be viewed as an “emotion”, which is controlled by sympathetic nervous system, the part handles
the reflexes of survival. Thus sex as an emotion is possessive, compulsive and does not tolerate time and
space. The BODY/SOUL brings sex between husband and wife which brings fulfillment of the natural
desires of each and by agreement. UNITY and STRENGTH leads to the building of stable homestead or
residential house for the family to enjoy the environment as home. The MIND leads to work for the
sustainable family needs and development, because some Christians see work not means of personal
enrichment but a service to God and their fellow men, in the society. PEACE leads to any kind of
development in the family government; it important for all family to strive for peace in the family. The
HEART forms the basis for good children born in the family.
There are two important aspects in the family star which contributes to success and stable family
government. The first aspect is SONGS of praising God for the Gift LIFE and other important gifts and
talents when YOU are ALIVE. The second aspect is PRAYER to God, because it the KEY to YOU need
in this WORLD. This should be done daily by ALL family members in the family government. And
family government shall overcome ALL Conflicts in Jesus NAME.
REFERENCES
Brock,R.T. (1977).The Christ centered family. Gospel publishing House, Springfield, Missouri.
Kathuri, N.J and Pals, D.A. (1993).Introduction to educational Research, Educational Media center
(EMC), Egerton University.
Kombo, D.K andTromp, D.L.A. (2006).Proposal and thesis writing: An introduction, Makuyu, Kenya:
Don Bosco printing Press.
Kothari, C.R. (2009). Research methodology, methods and techniques, 2nd
Revised edition, New Age
International Publications.
The Open Bible (1985).Thomas Nelson Publishers,Inc.New York.
Sharkey B. and Welch F.G. (1979).vModern Christian living, Oxford university press,Nairobi. ******
UTILIZATION OF PROVERBIAL WISDOM IN DEVIL ON THE CROSS
Mugo, J.W., Rutere, A.M. and Telewa, V.K.
Department of Literary and Communication Studies, Laikipia University, P. O. Box 1100-20300, Nyahururu,
Email: [email protected] phone: 0721554755
ABSTRACT
Proverbs are wise sayings that touch on the nerve centre of society in any given context truthfully,
objectively or subjectively. In Africa, Kenyan culture and among the Agikuyu, proverbs are considered as
reliable vehicles for conveying messages effectively to their designated destinations. This paper

Proceedings of the Third International Research Conference held on 26th to 28th October, 2016 346
investigated the usage of proverbial wisdom in Ngugi Wa Thiong’o’s Devil on the Cross. This
postcolonial novel has an imaginary geographical setting: Ilmorog. The novel can serve to set out Ngugi’s
revolutionary tone of disillusionment with the Kenya postcolonial rulers. Wa Thiong’o underscores the
plight of the Ilmorog workers and the peasants. This is perpetrated through connivance between the ruling
African elite and the international capitalists from the business world to thwart any attempt of bringing
meaningful change. Ngugi panders the reader to various proverbs which are artistically chosen to explain
the general feelings of discontent towards dictatorship and culture of impunity which characterize
postcolonial Kenya. The study takes a qualitative approach and is informed by poststructuralist theory.
The situations Ngugi highlights can serve as a microcosm of other African postcolonial states. Data from
the text will be broken to assist quotations, analogies, metaphors and images in the analysis. The findings
will contribute to comprehension and appreciation of roles played by writers in creating awareness and
highlighting issues that affect society to be motivated to have a positive reading culture. They will help
researchers to carry out similar or related scholarship in this or related discipline.
Keywords: Disillusionment, proverbial wisdom, proverbs, revolutionary, utilization
INTRODUCTION
This paper discusses the utilization of proverbial wisdom in Ngũgĩ Wa Thiong’o’s Devil on the Cross.
The novel was first published in Kikuyu Language in 1980 as Caitani Mutharabaini and the English
version is a therefore a translation. The text was first published in English in 1982. Since it was translated
into English, it has had fourteen impressions. This perhaps explains why Ngũgĩ continued to write in
English after even the 1962 Makerere Conference of African writers. During the discussions in the
conference Ngũgĩ had argued in favour of African Languages saying, “Writing in African Languages is a
necessary step towards cultural identity and independence from European exploitation” (Ngũgĩ, 1986:28).
According to Chapman (2003) Ngũgĩ persisted to write in English to sell his creative works. However,
the commercial aspect did not dim Ngũgĩ’s objective to promote cultural identity and freedom from
European exploitation and oppression. He was able to do this by subscribing to Achebe’s ideology of
using the English Language to express his peculiar African experience. In the Language debate, Achebe
said he would use the gift of the English Language and make it “at once universal and able to carry his
peculiar African experience” (Achebe, 1975:53). African encounters can vividly and/succinctly be
communicated by utilization of African oral forms.
African oral forms comprise songs, myths, legends, riddles, narratives and proverbs among others. Ngũgĩ
is deeply steeped in African orality and deftly deploys the African oral forms in his creative writings. In
the literary texts, Ngũgĩ employs oral forms such as riddles, idioms, narratives, songs and proverbs among
others. Nevertheless, the paper addresses only the use and application of proverbial wisdom in Devil on
the Cross. In the novel, Ngũgĩ invents characters who narrate the situation that is encountered in
postcolonial Kenya. Even in the names that he bequeaths to his characters, Ngũgĩ uses proverbial wisdom
which points to the behaviour as well as the role played by the character in the novel. Further, Ngũgĩ’s
characters use proverbs and proverbial songs narrate the postcolonial Kenyan state which serves as a
microcosm for other African postcolonial nations. Although Ngũgĩ draws the proverbs he uses for
construction of the novel from the Gĩkũyũ repertoire the paper provides equivalent proverbs in Gĩkũyũ
which are used to communicate the same message. This is based on the characteristic nature of proverbs
where meaning is contextual and flexible as well as multiple.
Using proverbs and proverbial names and proverbial songs, Ngũgĩ creates awareness in the oppressed and
exploited workers and peasants in Ilmorog. Conscious of their deprived condition, the workers, peasants
and even women are disillusioned with their postcolonial administrators who they find to be worse than
their erstwhile white predecessors. This marginalized group earns and agitates for change as evidenced in
the proverb, “Change seeds for the gourd contain more than one kind” (Barra, 2010:9; Ngugi, 2014:11).
The Ilmorogans wanted change and meaningful change at that where they would be free to enjoy the
fruits of independence in their own country and in their own right. As such, they are ready to fight any
oppressive force that comes between them and their independence. This force rears its ugly head through
capitalism whose perpetrators are the ruling postcolonial ruling African elite and the international
capitalists from the business world. By employing dialogue, the oppressed and exploited masses

Proceedings of the Third International Research Conference held on 26th to 28th October, 2016 347
endeavour to express their disillusionment with the ruling regime. Unfortunately, their efforts to reclaim
their lost space which they had enjoyed before colonization were thwarted by further severe oppression
and exploitation. When dialogue fails, the masses resort to a revolution as evidenced in the eradication of
social oppressive forces. This culminates in the shooting of the Rich Old Man from Ngorika at the close
of the novel.
Theoretical framework
The paper utilizes Poststructuralist literary theory in the analysis. This theory was advanced in the 1960s
by Jacques Derrida and Michel Foucault to demystify and contrast structuralism. This is necessitated by
the fact that proverbs are contextual in nature. Poststructuralists argue that “meaning is multiple, flexible,
dislocated, fragmented, unstable, decentralized and scattered along the chain of signifiers” (Selden,
1989:87). According to Kabira and Mutahi (1988:37) “proverbs are culturally and contextually bound.”
Thus the meaning of a proverb resides in the culture from which it is constructed as well as the context in
which it appears. Consequently, one proverb enjoys multiple meanings if and when it is applied in
different situations. In the novel Devil on the Cross, Ngũgĩ’s characters make use of the same proverb
repeatedly to communicate varying message in differing contexts. Further, the flexibility and
fragmentation of the proverbs is displayed by use of various words in the expression of the same idea as
exemplified in the following proverb; ‘the fart of a rich man has no smell’ (Ngugi, 2014:60). The same
idea is repeated in the proverb ‘the wound of a rich man never produces pus’ (p.63). Besides, proverbs are
socially constructed through negotiations and dialogue after a consensus. These characteristics of
proverbs justify the suitability of Poststructuralism in their discussion.
METHODOLOGY
The study is carried out using the interpretivist paradigm. This approach focuses on the meaning
attributed to attitudes, relationships and occurrences. Interpretivist method assumes that social phenomena
are constructs that are negotiated and widely shared. According to Guba and Lincoln (1994) meanings are
sought within contexts because people construct meanings and associate their own subjective and inter-
subjective meanings as they interact with the world around them. This can be realized by identifying and
analyzing the proverbs in Devil on the Cross. Further, the interpretivist procedure works on the premise
that meanings are not fixed or closed systems. Instead “meanings are negotiated and constructed within
certain contexts in the process of the researcher’s engagement with the texts or documents (Silverman,
2008:112). Thus, the identified proverbs are interpreted and their meanings sought within the contexts in
which they occur. In the analysis of data, equivalent proverbs to those in the text are provided in other
languages where possible.
Proverbs in Devil on the Cross
Proverbs as a genre are short forms that do not occur by themselves but are found within other genres
such as songs, narratives, myths, legends and novels among others. The proverbs under study are found
within the novel Devil on the Cross. In this all references made to the primary text are made using only
the page numbers. The publication used is the fourteenth impression of 2014. “The forest of the heart is
never cleared of all its trees. The secrets of the home are not for the ears of strangers.” (p.1).These two
proverbs share the same message and are used by the Gicaandi Player who declares himself ‘the Prophet
of Justice’. [Ngũgĩ has invented the Prophet of Justice who through monologue utters these proverbs as he
narrates his role]. The Prophet of Justice feels the weight of the information that he has about the nation
but is bound by his conscience not to reveal it. He thus employs the proverbs as a justification not to
relieve himself of the burden that weighs so heavily on his heart. The proverbs are equivalent to the
Kikuyu sayings gatitu ka ngoro gatiunagwo and kagutui ka mucii gatihakagwo ageni [The grove of the
heart is not laid bare and oilskin of the home is not for applying on strangers respectively] . These
proverbs are normally used with the message that family or home affairs are not for public consumption
and the insiders should guard them faithfully.
Consequently, the Prophet of Justice does not consider revealing what he knows about Waringa to her
mother not because it is top secret but simply because she is a woman. The Kikuyu society like many
other African communities is patriarchal and does not consider women as able-bodied beings with a

Proceedings of the Third International Research Conference held on 26th to 28th October, 2016 348
capacity to endure sad news or keep secrets as embodied in the proverb mucii na mundu muka akenaga
akua. The English version of the aforementioned proverb is ‘he who steals in the company of a woman
will lie in fear till she dies’ “for a woman cannot keep a secret” (Barra, 2010:85). Kikuyu women are also
known for their intensive love for children and perhaps the narrator is apprehensive that Waringa’s
mother may break down on learning of the ills that have befallen her daughter.
Pondering on the implicature of telling Warĩĩnga’s mother what he knew about her child’s situation, the
Prophet of Justice asks himself rhetorical questions repeatedly in a monologue. “Who am I- the mouth
that ate itself? Is it not said that an antelope hates less the one who sees it than the shouts to alert others of
its presence?” (p.2). These proverbs are used in the novel as a precaution aimed at urging the narrator to
desist from speaking his mind. In addition, they also remind him that should he consent to speak, then he
should be ready for the outcome which may bring suffering. According to Khasandi, Wakoko, Mugo,
Mahero and Ndegwa (2013:46) “an old man sitting on a stool sees farther than a boy on top of a tree.”
Being an elder and a seer, the Gicaandi Player can fathom the repercussions of communing with a woman
and is reluctant to involve himself. These two proverbs have their genesis in two Kikuyu fables.
The first deals with the proverb ‘the mouth that ate itself’. The fable behind this proverb purports that
once upon a time; the mouth got jealous of stomach’s prosperity and convened a meeting for the other
visible members of the body. Mouth praised the members for the indispensable services that they render
to stomach feeding her while stomach does nothing other than grow ‘fatter and fatter’. The members
comprising mouth, hands and legs went on strike. The brain however, participated neither in the debate
nor in the strike but kept her cool. The legs refused to go in search of food, the hands refused to bring the
food while the mouth refused to chew anything. Within a few days, the mouth started stinking, the legs
were too weak to go anywhere while hands were unable to do anything. Meanwhile, the stomach though
grumbling lay still. Brain that was still sober brought the other members to their senses and they realized
the importance of working together. Consequently, mouth realized that whatever evil she committed, she
did it unto herself, thus the saying; the mouth that ate itself. The proverb means that whatever we say, we
should be ready to face the consequences no matter how bizarre. In addition, mouth is used symbolically
and metaphorically to warn, admonish as well as discourage people who rejoice at causing disharmony in
the community.
According to Ndambuki (2010:149) “metaphors are often used by the speakers in an attempt to get a grip
of new events that are motivated by their personal experience as members of a cultural group.” As a
member of the Kikuyu cultural group and by extension an African the Prophet of Justice also employs the
metaphor of ‘mouth’ pedagogically for people to emphasize the significance of teamwork and to show
that no member of a given community is more important than others. The word eat as used in the proverb
is also emblematic as the action of eating is naturally perceived as taking place in the mouth in which case
there must be something that is being eaten. Thus eating as used in the proverb under discussion is
construed to mean causing self-harm. It is normally used to comment about incitement which rather than
benefit anybody may result to the detriment of all including the inciter. A good example is the rampant
burning of secondary schools premises in July and part of August 2016. The students who were planning
and conducting the burning overlooked the fact that after lynching the schools’ property it is their parents
that would be called upon to rebuild them and not the school administration. For this reason, some
students have to forgo some privileges to save for the damage charges. The Prophet of Justice is taking
precaution before he releases the story that the masses in the person of Waringa’s mother wants to hear.
The second proverb is-‘the antelope hates less the one who sees it than the one who shouts to alert others
of its presence’. Among the Agikuyu it is said that a long time ago, women used to own property and hold
important positions in the community. Indeed, the Kikuyu was matriarchal societies until one of the most
renowned female leaders became so full of herself that she forgot the traditional expectation of her. She
violated the constitution as stipulated in the unwritten code of the Agikuyu penal code. She danced the
‘kibata’ (kibata is a Kikuyu male dance that women should not indulge in) naked, an act that was
considered abominable: indeed, it is equivalent to unmasking an ancestral spirit (Achebe, 1958). The act
was the last straw that broke the camel’s back, for before that, during meetings she had reduced men’s

Proceedings of the Third International Research Conference held on 26th to 28th October, 2016 349
backs into her chair [she never sat on a chair but on a man’s back during meetings. The woman was no
other but Wangũ Wa Makeri: the Kikuyu legend]. Her irresponsible behaviour angered the men so much
that they could condone her no more.
The men came together for they held the belief that unity is strength. United in their decision, they agreed
that they had to tame the woman. To do so however, they had to disarm her by making her physically
weak. Their weapon lay in their manhood which they resolved to utilize and make all their wives pregnant
at the same time. When that was done and the women were almost delivering, the men staged their coup.
In their condition, the women had no choice but to concede defeat. It is said that in the commotion the
goats that belonged to the women fled into the wilderness. Those goats are the antelopes. It is further
insinuated that since the commotion that erupted when the men overthrew women, the latter are
continually looking for their lost goats which ran into the forest. According to the Agikuyu narrative,
whenever an antelope is espied, there are always shouts of ‘kau! Kau...’ [That! That…] to alert the
women, boys and men go after the antelopes to redeem them for their desperate mothers and wives. Since
the antelopes are too fast for the males, they desperately resort to using bows and arrows and kill the
game for food. The proverb implies that the one who alerts others of the presence of the antelope
occasions its death for if they do not know about it then it will be safe. The proverb thus means that as
long as people remain silent about the social evils perpetrated by the postcolonial elite, then the rulers and
bourgeoisies will be safe. Similarly, the exploitation and oppression will proceed and it will be assumed
that all is well.
Next is the proverb; the voice of the people is the voice of God (p.2). This proverb is repeated on pages
60 and 62. Ngugi uses these proverbs through the narrator to justify why the Gicaandi Player had to tell
the story of the child that Waringa’s mother loved so much. This proverb has the same implication as the
proverb that says that ‘service to humanity is service to God. By consenting to man’s wish the Gicaandi
Player is obeying the will of God and thus doing his moral duty. The people sought the prophecy from the
Prophet of Justice through Waringa’s mother when she goes to the Prophet and said, “Gicaandi Player,
tell me the story of the child that I loved so dearly. Cast light upon all that happened, so that each may
pass judgment only when he knows the whole truth. Gĩcaandĩ player, reveal all that is hidden” (p.1). The
Gicaandi Player meditates on the request for seven days [the number for completeness in religion] and
gets an epiphany –after a vision- that the prophecy is not his alone. He cries out loudly: “I accept! I
accept..!I have accepted. I have accepted. The voice of the people is the voice of God. That is why I have
accepted. That is why I have accepted” (p.2). The repetitions emphasize the narrator’s level of the
struggle and fear that he underwent in the vision. He was threatened and admonished severely. Based on
the trepidation, The Gicaandi Player summons the people and tells them the story of Jacinta Waringa so
that they may make informed choices when passing judgment on Warĩĩnga.
Next are the proverbs ‘to bathe is to strip off of all the clothes’ and to swim is to plunge into the river
(p.3). These proverbs are used by the narrator to point out his readiness to reveal the truth. He also wants
to enlighten his imaginary audience that when one starts an activity, they should be ready to accomplish
and not back out when the going gets tough. He urges them to join him and participate as he beckons,
“Come, Come my friend, Come and let us reason together….Come and let us reason about Jacinta
Waringa before you pass judgment on our children….(p.3). In this context Jacinta Waringa is used as a
metonym for the youth. Ngugi advises that before somebody accuses another person it is necessary to
make investigations so as to make an informed choice. Research is therefore an essential step in life. The
proverb can be utilised to comment on situations where people like judging others without taking time to
understand what provoked their undesirable actions. Further reference can be made to the parable of the
prodigal son in the Bible (Luke 15:11-32) whose brother dismisses summarily as being unworthy of his
father’s compassion. The elder brother failed to seek understanding of his brother’s motivation and
inclination to come back home and his father’s motive for the celebration and condemned both of them
unjustly. Through the proverb, Ngũgĩ discourages his readers from making a sweeping condemnation or
commendation before finding out the motive or intention which makes somebody behave the way they
do. The proverbs are used to comment on situations where people face indecision. They are thus urged to
decide and commit themselves. In the novel, the Ilmorogans are warned against making judgment on the

Proceedings of the Third International Research Conference held on 26th to 28th October, 2016 350
youth who have gone to the city to look for greener pastures before they have understood the ordeals that
have compelled them to leave the village for the city. The above proverbs are followed by ‘misfortune is
faster than the swiftest spirit’ and ‘one trouble spawns another’ (p.4). [The latter proverb is equivalent to
the English proverb which says; ‘calamities do not come singly’]. In the novel, these two proverbs are
used to express the speed at which Warĩĩnga’s problems erupted-they followed each other in quick
succession as the narrator puts them saying:
“Misfortune is swifter than the swiftest spirit, and one trouble spawns another. On Friday
morning Warĩĩnga was dismissed from her job for rejecting advances of Boss Kĩhara….That
evening Warĩĩnga was abandoned by her sweetheart, John Kĩmwana after he had accused her of
being Boss Kĩhara’s mistress. On Saturday morning Warĩĩnga was visited by her landlord….who
said that he was increasing rent. She refused to pay….Warĩĩnga’s things were thrown out of the
room, door was locked with a new padlock” (4).
Warĩĩnga’s woes are as a result of the emergence of the capitalist postcolonial elite whose greed is
unequalled by their erstwhile colonial masters. Boss Kĩhara’s sexual demands on Warĩĩnga points to the
level of moral decadence in postcolonial Kenya and by extension, other post colonies. Indeed, Warĩĩnga
suffers because she had once fallen victim of the vice in the hands of the Rich Old Man from Ngorika. As
the proverb goes ‘once beaten twice shy or wanaruona nĩwe anarũmenya [he who has been through
something knows its repercussions] Warĩĩnga would never indulge in such actions with a married man as
this would be like giving to the hyena twice or gũcokia kaara harĩa karũmĩirwo. The English translation
of the aforementioned proverb is-to return the finger where it was bitten. Warĩĩnga already understood the
appetizing language used by tycoons to woo their prey whom they ditch after devouring. She did not wish
to succumb to their whimsical promises of wings to fly but in essence the wings turn into enslaving
chains. [From her relationship with the Rich Old Man from Ngorika Warĩĩnga ‘harvested’ a baby and had
to temporarily abandon her formal education at Nakuru Day Secondary School] (p.142). The pregnancy
devastated her so much that she contemplated abortion then suicide (p.148-154) but none of these
succeeded and she bore Wambũi out of wedlock. Boss Kĩhara’s attitude towards Warĩĩnga also point at
religious hypocrisy since Boss Kĩhara is an important member of the Church of Heaven (p.18). The two-
the Rich Old Man from Ngorika and Boss Kĩhara- preach water but drink wine for both are prominent
members of Christian churches who are usually regarded as opinion leaders and shapers.
The following proverbs-‘that which is black will never be white’ (p.5) is used in reference to Warĩĩnga’s
contribution towards her problems. Further, the proverb lampoons Warĩĩnga at attempts to be white
through the application of artificial skin-lightening creams. The proverb is also sarcastic of Warĩĩnga
concept of beauty and her futile efforts at actualizing it by looking like a European. Being an African
lady, she had forgotten the adage that ‘aping others cost the frog its buttocks’ (p.6). The cosmetics she
used distorted her natural beauty and as an impact, left her face with ugly ‘light and dark spots like a
guinea fowl’ (ibid). The imagery of frog is used analogically to comment on people who like copying
others. Naturally, such characters lack initiative and self-direction and only do things because others are
doing them without first bothering to know why they are doing them. The noun frog is used in place of
human beings to render the proverb anonymity and absolve the user of any dire consequences should
anyone complain. This is because “proverbs are anonymous in authorship, representing a collective
wisdom of human wisdom” (Kirmani and Kirmani, 2002:23). Consequently, the user of the proverb by
using the metaphor frog is able to admonish or warn against aping and also get out of the difficult
situation of possible victimization without embarrassment.
The words black and white as used in the first proverb are used metonymically to represent Africans and
Europeans respectively. The proverb is used to lampoon people who dwell on the face value of
something little knowing that all that glitters is not gold. Indeed, it warns people not to judge a book by its
cover but to open and read it and it is only then that they will be able to covet it or even commend or
condemn it. Likewise not all that is white is good as some may cause afflictions and enduring effects like
the ugly spots on Warĩĩnga’s once beautiful visage. This serves as advice to those who are not contented
with their Africanness that no amount of cosmetics will make them Europeans since race and colour are
not skin- deep but ontologically occurring. Perhaps the motivation to change skin colour is motivated by

Proceedings of the Third International Research Conference held on 26th to 28th October, 2016 351
the superior position that the White colonizers held but the Africans overlooked the fact that not all
Europeans held high office: some were even in the forest fighting the Mau Mau while their masters
administered the colony. Thus instead of dwelling on trivial issues like physical appearance people should
work hard to achieve superior status for “beauty is not food” (p.27).
The imagery of food in the aforementioned proverb is used to symbolize a basic necessity in life. Without
food all living things let alone human beings cannot survive. By using the analogy of food and
comparing it with beauty, Ngũgĩ downplays the significance of beauty as well as exposing its futility. The
proverb about beauty not being food is used to comment on the dangers of concentrating on trivialities
such as physical beauty which cannot satisfy essential human needs. Instead of wasting time with such
petty issues, people should devote their efforts to attaining prosperity. In addition, the same ideology is
articulated in the Ethiopian proverb that states; “If you marry a beautiful woman you marry trouble”
(Finnegan, 2012:391). The English equivalent of the above mentioned proverb is ‘beauty will buy no
beef’ while the Kiswahili version is ‘uzuri wa mke ni tabia’ i.e. the beauty of a woman is her behaviour.
The philosophy behind these proverbs is that those who are wise will seek the hidden worth of something
before indulging fully in it lest they be courting trouble. The proverb is also used to warn and castigate
spendthrift behaviour and encourage people to be responsible. The proverb is also used to comment on
men who judge women by their appearance and boast acquaintance with the most beautiful forgetting that
beauty is a construct and not a universal concept. Furthermore, it only lies in the eyes of the beholder.
The proverb is also used pedagogically to inform, women who conceive themselves as beautiful that they
have nothing to boast about for they cannot depend on their beauty for livelihood. The males are further
reminded that ‘mke ni nguo’ but ‘nguo si mke’ (p.249) thus they should not covet other people’s wives
but simply provide theirs with the objects of their desire. After all beauty is like itching that is temporal
and fades with time. Likewise, the beauty we see today may not be there tomorrow if proper care is not
taken to maintain it. However, physical pulchritude is not all that worthless for the same culture [Gĩkũyũ]
has a proverb that says; ‘nobody is satisfied with just one glance at a beauty’ (p.250). The word ‘satisfied’
shows that the Agĩkũyũ value and esteem beauty and that is why they would spend time admiring
beautiful women artifacts. According to Stewart (1997) proverbs offer insight into a people’s
philosophical thought, epistemology and world-view. Further, Kabira and Mutahi (1988:37) posit that
“Proverbs summarise a cultural context even or an experience and that they are used to warn, advise,
educate, inform and make clarifications.” Hence for the Gĩkũyũ people to come up with a proverb
philosophizing about beauty, they must have looked intrinsically at the merits and demerits ensuing from
different world-views and their cultural ramifications. Thus to summarise the concept of ‘beauty’ they
(Agĩkũyũ) came up with the contradicting proverbs that: Beauty is not food, nobody is satisfied with just
one glance at a beauty and that beauty is itching. In the last proverb, Gĩkũyũ warns and informs and
clarifies the people that beauty like itching can neither be avoided nor concealed. However, it is [beauty]
not a permanent situation and those who consider themselves ugly have nothing to worry about just as
those who consider themselves beautiful have nothing to brag of.
Next to the proverbs on beauty, is one whose ideology is change. Since proverbs are culture markers
(Soneye, 2003) the proverbs use the objects found within the cultural environment in which they are
constructed. Such objects are like gourd and seeds in the proverb, ‘Change seeds for the gourd contain
seeds more than one kind’. Another proverb about change which is used together with the
aforementioned one is; ‘Change steps, for the song has more than one rhythm’. These proverbs have been
used repeatedly on pages: 11, 48, 76,108 and 122, respectively. For Agĩkũyũ people song and dance are
synonymous and are therefore applied alternatively. In addition, the two proverbs also share the message
of change with the proverbs: ‘He who used to dance can now only watch’ while ‘he who used to jump
over the stream can now only wade through it’ (p. 60 and76). However the idea of change is used in
juxtaposition in the two sets in that in the former, change is a requirement while in the latter change is
inevitable and undesirable since it is seen as incapacitating.
The first duo points at change that is occasioned by the poor leaving conditions which are from the scars
left by the colonization process. Once the colonial masters left the empires, the Kenyans and by extension

Proceedings of the Third International Research Conference held on 26th to 28th October, 2016 352
postcolonial African nations are left to rule themselves but they have neither the resources nor the
knowhow to administer themselves. The African resources such as land were raped by their fleeing
colonial masters who now posed as landlords as seen in the White Highlands where some Kenyans live
like squatters in their own country. This kind of scenario calls for change and that is what Kenyans
through the Mau Mau had fought for. Indeed among the three enemies they fought was poverty: They
were fighting to eradicate poverty, ignorance and disease but after the struggle, only a few of the Africans
achieved these goals. These were the ruling elites and to the majority comprising workers and peasants,
this was only a dream that existed in their imaginations. It is then that they came up with the idea of
agitating for change and meaningful change at that. That is when they realized that although they
[Africans] had fought capitalists on one side, their fellow Africans who replaced the colonial masters
were worse oppressors as well as exploiters than the departing masters. The peasants and workers then
team up and campaign for change to fight the capitalist regime for they too want to enjoy the fruits of
independence and urge each other to change for even the gourd though one does not contain seeds of one
kind. Some bring forth calabashes, others medium gourds used for drawing water or putting gruel, others
mature while others abort. Hence the analogy of the seeds and steps requiring change serve as an eye
opener for the masses.
The second duo serves to warn that no condition is permanent e.g. youth as one is young only once. As a
result, when old age creeps in youth fades away and with it energy also diminishes. As such, one is unable
to partake of the activities they used to do with ease. In essence, for those undertakings, they will
nostalgically only watch from afar or outside the ring as others do it. Consequently, this gives rise to the
sayings that; he who used to dance can only watch and he who used to jump over the river can now only
wade through it. Both jumping and dancing are activities that require agility and energy which are general
attributes of youth. The proverbs are therefore to comment on people who waste their time [youth] and
energy with trivial things that do not promise a comfortable life in old age. Rather such people are
advised that: ‘Today is tomorrow’s treasure’ and that ‘tomorrow is the harvest of what we plant today’
(p.11). This being the case therefore, as people advance in age, they should not waste time lamenting and
reminiscing of what they used to do for nobody ever gained from ‘moaning and groaning’(ibid). The
solution lays in changing ways as the narrator advises saying, “Change seeds, for the gourd contains more
than one kind of seed! Change steps, for the song has more than one rhythm!” (p.11).
Further advice is offered in the song that castigates the corrupt and selfish capitalist postcolonial
administrator. Creating consciousness is also done through songs comprising proverbs and attacking
capitalism as pointed out in the song:
That which pecks never pecks for another.
That which pinches never pinches for another.
That which journeys never journeys for another
Where is the seeker who seeks for another? (p.10).
The song contains four proverbs that criticize capitalism and awaken the masses consciousness that each
should mind their own welfare for none is perturbed by their deplorable conditions. They are reminded
that no one works for another, pinches for another, journeys or even seeks for another. Similarly, when
one endeavours to do something; they only do that to satisfy their selfish motives. They are further
reminded that the wise can also be taught wisdom (ibid) for nobody has a monopoly of knowledge. This
calls for dialogue as the narrator eulogizes Gĩkũyũ for saying that ‘talking is the way to loving’ and that
‘today is tomorrow’s treasury’ for ‘tomorrow is the harvest of what we plant today (ibid). These proverbs
are used to warn, educate and inform those that purport to know everything and tend to ignore advice
especially if it comes from people who are not regarded highly in the community. Such people are poor,
hold unenviable or low positions in society or the youth. Among Agĩkũyũ age is highly revered as
stipulated in the Gĩkũyũ proverb ‘harĩ mũthuri hatĩitagwo maaĩ [in the presence of an elder, water is not
poured] (Njogu, 2004:189). The proverbs also admonish those who brag of being of more consequences
than others and also inform them that everyone is important in their own light for no one can live solely
by themselves. The ‘haves’ need the ‘have nots ‘and the reverse is true as embodied in the proverbs a “a
single finger cannot kill a louse” and a single log cannot make fire last through the night” (p.48). This

Proceedings of the Third International Research Conference held on 26th to 28th October, 2016 353
shows the importance of team work as stipulated in the proverb “many hands can lift a weight, however
heavy” (p.48 and 63).
The next proverb under discussion is stated as a reminder as is evident in its intonation as quoted “Be on
your guard from now on Kareendi. Don’t forget that ‘men have stings, vicious and corrosive, the poison
of which never leaves their victims” (p.13). According to Rutere and Samjumi (2011) “proverbs are
gentle words that contain wisdom of generations” ((p.3). The gentleness conceals the gravity of the matter
in question and makes the unbearable bearable. Consequently, serious issues such as sex involvement and
pregnancy out of wedlock can be discussed by daughter and mother without embarrassment on either
party. The proverb is used by parents in offering advice to their daughters to warn them to be wary of men
for any illicit relationship with them [men] leaves everlasting scars.
This in the case of Kareendi [an invented name to symbolize a beautiful vulnerable young girl], an
unexpected baby is born who turns into a burden for the girls relations or guardians. The proverb is also
used to comment on girls who enjoy keeping company with older men perhaps because they feel that the
elderly are better endowed than young men and want to get their money in exchange for their bodies.
Such girls are castigated and reminded that they should desist from such relationships. The proverb is
stated analogically using the analogy of sting and Kareendi which leaves room for ignorant girls to retort
that they are not implicated because neither their names nor those of their sugar-daddies are mentioned.
Such females are oftentimes answered with the proverb that ‘no one repents on account of another’s sins’
or ‘there is no one who regrets the going as much as the returning’ (p.13). This is because when one is
returning, they have already experienced the phenomenon in question and may be suffered the
consequences as well. The main idea behind these two proverbs is that ‘experience is the best teacher’.
Besides, he who has drunk from a calabash can gauge its size. He who has seen once knows thereafter.
However, one does not have to burn a finger in order to know how it feels to get burnt. These proverbs
are equivalent in their themes to the Kiswahili saying that ‘majuto ni mjukuu’ and the English proverb
‘once beaten twice shy’.
After leaving her child with her parents the proverbial Kareendi goes back to school and since she has
learnt her lesson from experience, she makes more effort in her studies and vows not to fall victim of men
again. Her benefactors dig deep into their pockets and drain the family saving [the stick put in reserve in
case they should meet a rat unexpectedly (p13)] to keep her in school and equip her with professional
education. However, now Kareendi is wiser as she knows that ‘to be smiled at is not to be loved’ [ibid]
and she rejects any advances of the prospective employers as she seeks a secretarial job after completing a
course in typing and shorthand. This becomes very frustrating as all the male employers seem to be
reading from the same script and appear to have composed a chorus to sing to young female job seekers.
The anthem of these tycoons is normally that of sexual exploitation as they sweet talk their prey using
proverbial wisdom coaxing:
“Sister Kareendi, the case of a fool takes a long time. Sister Kareendi, every court session
opens with feasting. Sister Kareendi, no man licks an empty hand. Take care of me, and I will
take care of you. Modern problems are resolved with the aid of thighs. He who wishes to
sleep is the one who is anxious to make the bed” (p.14)
The dialogue-cum monologue is aimed at inducting Kareendi to the epistemology of modern society
whose slogan is a ‘give and take’. The community in question is capitalistic and immoral where no one
cares for social values but rather what the person can get to satiate his selfish needs. This is done through
a stream of proverbs in order to cushion the speaker from any blame as whatever he says is contained in
the proverbial wisdom of the ancestors. According to Mundumulla (1995:18) a “proverb is a short saying
in common use expressing a well-known truth or common fact ascertained by experience or observation.”
Hence by using the proverbs in relation to ‘Sister Kareendi’ and perhaps handing down to her what he
himself endured to be where he is., the speaker is only perpetuating an already implemented policy In a
nutshell, the proverbs are used to expose the likes of Warĩĩnga to the corrupt postcolonial situation where
to get a job one’s morals are compromised. When Warĩĩnga rejects the advances made on her by the
prospective employers, she finds herself out in the streets jobless until she comes to Boss Kĩhara who
Proceedings of the Third International Research Conference held on 26th to 28th October, 2016 354
gives her a job without sexual demands. She considers him a godsend until he reveals his true colours.
Her rejection earns her a sack.
The other proverb that is discussed in this paper is one that is stated in juxtaposition in a conversation
between Warĩĩnga and the Rich Old Man from Ngorika. This takes place when Gatuĩria [the Rich Old
Man’s son and Warĩĩnga’s fiancé] takes her to his home to make formal their engagement and as it
happens, the father is the one to be the first to receive the bride to be. The Rich Old Man takes the
opportunity to win Warĩĩnga back when he recognizes her and his greed of long ago is rekindled.
Unfortunately for him, she is no longer the naïve Nakuru Day Secondary School girl she was and boldly
answers him alluding to the Gĩkũyũ philosophy, “I am not as stupid as you think. Gĩkũyũ said that ‘to
hate a cow is to hate its hide. And now I say to you: to love a cow is to love its calf’” (p.259).
In the two proverbs, the young Warĩĩnga displays cultural conversance. She attributes the first proverb to
a third party by using the acceptable intonation of Gĩkũyũ proverbs when she quips: “Gĩkũyũ said that to
hate a cow is to hate its hide” (p.259). The desubjectivisation (Mineke, 1991) bequeaths the proverb
authority and neutrality as Gĩkũyũ is highly respected as the founding father of Agĩkũyũ people and to the
dictates is law. By citing the proverb therefore, Warĩĩnga shares the proverbial wisdom of her ancestors as
a true faithful daughter of Gĩkũyũ and Mũmbi and the Rich Old Man from Ngorika is astonished as well
as challenged by her maturity over time especially when he remembers Jacinta Warĩĩnga as the ‘naïve
sweet girl from Nakuru Day Secondary School’ who had once played the hunted and him the hunter
ending up in his chains of rearing Wambũi as a single mother.
Further, Jacinta Warĩĩnga demonstrates her independence from the chains of the ilk of the Rich Old Man
from Ngorika and Boss Kĩhara by creating a proverb of her own to suit the meaning she wishes to
appropriate to it. Rutere and Kirigia (2013) observe that “knowledge of proverbs demonstrates linguistic
prowess and wisdom” (p.35). Their observation is in communion with the famous Gĩkũyũ saying which
states; ciunagwo rũkomo kĩmenyi akamenya ikiunwo kĩrigo akarigo ikiunwo (we speak in proverbs,
those who are wise will understand and those who are not will not understand). Using two proverbs in
quick succession Warĩĩnga not only shows her linguistic prowess and wisdom but also her creative
ability. Out of the existing repository of Gĩkũyũ proverbial wisdom, she is able to come up with her own
composition in the second proverb as; ‘to love a cow is to love its calf’. This sounds like ‘playful
blasphemy’ (Oyelade, 1999) since the proverb is a corruption of the existing proverb which talks about
hate whereas she speaks of love in hers. However, during their conversation, the Rich Old Man is so
drunk with power that he does not acknowledge the progressive change in Warĩĩnga’s intellect, exposure
and independence but keeps on rambling to her of his exploits as before. He even boasts of his close
acquaintance with Europe as he promises Warĩĩnga heaven and juxtaposes what is western with what is
Kenyan. He attaches so much importance to what is European and denigrates what is African as he tells
Jacinta Warĩĩnga, “I’d like you to take off this cloth and these necklaces and earrings made of dry maize
stalks and put on clothes and jewellery made in Europe” (ibid). The privileging artifacts from Europe over
those from Kenya indicate that although Kenya is an independent nation his mind is still colonized
[actually suffering from the worst state of colonization] (Ngũgĩ, 1986).
The Rich Old Man is so immersed in his self-induced trance he does not notice Warĩĩnga’s change of
countenance and disgust in her voice and when she inquired whether she could ask a question; he
interprets that as an indicator of her attentiveness to his significantly wise soothing words. This is
depicted in his answer using a well-known Gĩkũyũ proverb; “Certainly. No one is persecuted for asking
questions” (p.260). Naturally, this proverb is used to encourage people to ask any question to which they
seek genuine answers to questions that are difficult to them and whose answers they don’t know. In this
case however, Warĩĩnga asks questions contemptuously knowing pretty well that Gatuĩria father will not
be at ease and would not like what she will ask. Further, she feels that he will not answer the questions
truthfully after the way he had threatened her if she would not consent to his desire. In his ignorance, he
mistakes her anger for fear and acceptance to his impulsive demands. Blinded by his pride and meditating
he does not detect the contempt in Warĩĩnga’s speech as she makes scathing remarks reminding him of his
wickedness rather he takes this as praise for his conquest and interrupts;’ I knew you would agree…”

Proceedings of the Third International Research Conference held on 26th to 28th October, 2016 355
(p.261). Consequently, he does not suspect that Warĩĩnga is capable of defending and when she
commanded him to look at her his words froze when he saw the pistol and unlike Warĩĩnga who had an
option of abortion or giving birth after he impregnated her he had no choice but to die. Warĩĩnga shot him
dead and fled without looking back. She did not care to be caught and rot in jail but was satisfied that by
killing the Rich Old Man from Ngorika, she had freed many other vulnerable people whose lives would
otherwise have been ruined by the likes of the Boss Kĩhara and the Old Man from Ngorika. Warĩĩnga’s
action can be read as an eradication of social oppression that thwart people driven progress and suppress
their dreams. It is the freeing of women from male exploitation and other marginalized groups by their
rulers and employer.
CONCLUSION
The paper has demonstrated that proverbial wisdom is a necessary aspect in the construction of African
Literature. Further, Ngũgĩ has used proverbs to stimulate social, political and economic liberation in Devil
on the Cross. Although proverbs as a genre is studied in Oral Literature, its significance and contribution
to written literature is indispensable Further, the study realizes that proverbs are liberating devices utilised
by both the old and the young to pass importance messages in a more gentle manner thus rendering the
unbearable bearable. Besides, proverbs enable the user to negotiate sensitive matters without losing face
as well as bearing responsibilities for their utterances in case their ideas do not work. The study further
finds that proverbs are a means of passing knowledge and values in an appealing appropriate way. Hence,
communities should preserve their proverbs as they are valuable not only in orality but also in literacy.
Since proverbs are value laden social aspects, more studies should be carried on them.
REFERENCES
Achebe C. (1975) “The African Writer and the English Language” In: Morning yet on a Creation Day.
London: Heinemann.
Barra, G. (2010) 1000 Kikuyu Proverbs (3rd
ed.). Nairobi: Kenya Literature Bureau.
Finnegan, R. (2012) Research in African literature, Volume 40 No 3 fall 2012.
Kabira, M.and Mutahi, K. (1988) The Oral Artist. Nairobi: East African Publishers.
Khasandi, V., Wakoko, M., Mugo, J., Mahero.and Ndegwa. (2013) “What an old man can see while
sitting down a young man cannot see while standing”: Utilizing senior citizens to achieve peace”
The International Journal of Research in Social Sciences. June 2013, Vol 2 No.2.
Kirmani, M.; Kirmani, S. 2002. Oral literature of the Asian in E. Africa”. Nairobi: E. African Publishers.
Mudumulla,J.S. 2005 Proverbs and Sayings: Theory and Practice. Dar-es-salaam: Institute of Kiswahili
Research.
Ndambuki, J. (2010) Discursive Representation of Women’s Interests in Makueni District-
Kenya.Unpublished PhD Thesis: University of Witwatersrand:
Ngugi, T. (2014) Devil on the Cross (14th ed.). Nairobi: East African Educational Publishers.
____, 1986. Decolonizing the mind: The politics of language in African Literature London: James Currey.
Njogu, K. (2004) Reading Poetry as Dialogue. Nairobi: Jomo Kenyatta Foundation.
Oyelade A. (1999) “Post proverbials in yoruba culture; A playful blasphemy”. Research in African
Literature. 30(1):74-82.
Rutere, A. M and Kirigia, E. (2013) “Conversational songs of meru men: The hidden proverbial wisdom
in the performer’s pragmatic rivalry”. Journal of Social Sciences, Education and Humanities
1(1):26-46).
Samjumi, Z.N. and Rutere, A.M. (2011) Classification and Functionality of Hausa and Meru Proverbs:
Retention/ Utilization of Proverbial Wisdom in Literary Construction of Religious Instruction.
Lagos: Gazubu Press.
Schipper, M. 1991. Source of all evil: African proverbs & sayings on women. London: Allisons & Bubby.
Selden, R. (1989) A reader’s guide to contemporary literary theory. London: Harvester Wheatsheaf.
Silverman, D. (2008) Doing Qualitative Research: A Practical Handbook. London: Sage Publications.
Soneye, T. 2003. English Language as a Culture Transmitter: The African Experience. Occasional Paper.
Stewart, J. (1997) Proverbs and Wisdom. London: Carlo Publishers. ******

Proceedings of the Third International Research Conference held on 26th to 28th October, 2016 356
STRATEGIES USED FOR PERSUASION IN KIMUTHAMBI
Ireri, H.K., Muriungi, P.K., Waita, Z.N. and Muriungi, C.K.
Chuka University, P. O. Box 109-60400, Chuka, Kenya, Tel.: 0721 67 27 47. Email: [email protected]
ABSTRACT
Persuasion is inherent in everyday communication and is very important in relationships, leadership,
peace building and success in virtually every area of livelihood. This study’s main goal is to provide an
analysis of persuasion in Kimuthambi. The objective of the study is to identify and discuss strategies used
for persuasion in Kimuthambi. The study is guided by the relevance theory by Sperber and Wilson. It
utilizes both qualitative and quantitative research designs and is carried out in Muthambi Division,
Tharaka-Nithi County, Kenya. The population includes all Kimuthambi communicative events. The
researcher purposively sampled 10 real life communicative events conducted in Kimuthambi. Data was
collected using a guiding card and an observation schedule. A voice recorder was used to capture
conversations from the selected communicative events, which were transcribed onto a guiding card. The
observation schedule was used to record the contextual information. The transcribed utterances were 136.
Guided by the communicative principle of relevance, the researcher identifies and discusses 84 utterances
used for persuasion in Kimuthambi. Persuasion in Kimuthambi is mainly through logical appeals,
emotional appeals and sensationalism. This study adds to existing knowledge on strategies of persuasion
in various languages and enriches knowledge on the tenets of the relevance theory. It also enhances the
analysis of Kimuthambi as a language variety and thus contributes to cross linguistic studies.
Keywords: Relevance, Utterances, Communicative Events
INTRODUCTION
Persuasion is an act or process of presenting arguments to move, motivate, or change your audience
(Covino and Jolliffe, 1995). Persuasion is a very important aspect in communication and it is required in
every community’s communicative events to achieve particular ends. Persuasion also has bearing on
cohesion and integration among individuals, communities and nations. Language is a strong tool for
persuasion. Studies have been carried out on persuasion in various languages of the world but
Kimuthambi has not been studied on this perspective. Every linguistic variety is unique and culture
dependent and therefore warrants a holistic analysis. Given the central role of persuasion in society, this
study provides an analysis of the strategies used for persuasion in Kimuthambi and thus contributes to
cross linguistic studies in persuasion.
Various studies on the strategies of persuasion have been undertaken. Rank (1988) does a pragmatic
analysis of persuasion strategies in advertising and courtrooms; Hardin (2001) examines persuasive
discourse in Spanish language advertising while Chakorn (2006) makes a comparative analysis of
persuasion strategies in letters of request written in English by Thai speakers and by native English
speakers in the Thai business context. Tang (2009) analyzes persuading speech act and Lingzhi (2010)
investigates persuasion strategies commonly used by Chinese from the perspective of pragmatics. Hardin
(2001), Tang (2009) and Chakorn (2006) find that the use of logical appeals and emotional appeals are the
most effective strategies of persuasion. This agrees with Stiff and Mongeau (2003) who discuss ‘The
three Pillars of Persuasion’, ethos, pathos and logos as put forward by Aristotle. This research sets up the
strategies used for persuasion in Kimuthambi which is a different cultural set up from the studies
mentioned above, in order to investigate the universality of persuasive strategies.
Previous studies on Kimuthambi include Ireri (2011) who establishes that there are several
misinterpretations in English-Kimuthambi Church sermons and that the verb and the verb phrase are the
most frequently misinterpreted categories, and Mutegi (2012) who discovers that majority of Kimuthambi
forktales portray women negatively. Studies done on the sister language varieties are mainly in the areas
of syntax and socialinguistics. Muriungi (2008) establishes that the ordering of the affixes in the extended
projection of the verb phrase in Kitharaka and the ordering of modifiers in the extended projection of the
noun phrase fall under the same generalization while Mwembu (2012) investigates how loan words from
Kiswahili and English are nativised in Kitharaka language and discovers that Kitharaka accommodates

Proceedings of the Third International Research Conference held on 26th to 28th October, 2016 357
neologisms through phonological processes to modify itself. Kindiki (2008) shows that; in an on-going
Kiitharaka discourse, any new information that is added has some contextual effect in a particular context
Mutegi (2014) establishes that the strategies of Gichuka wh formation include full wh movement, partial,
intermediate and wh in situ while Ndwiga (2008) examines the empty categories in the syntax of Gichuka
and puts government-binding theory to task in order to test its explanatory potential as a theory of human
language. Mbaka (2013) finds out that Gichuka conforms to the framework of the universal grammar
while Kinyua (2010) investigates how the universality of Chomsky’s universal grammar model applies on
the Kimwimbi verb group. None of the studies on sister languages looks at the strategies of persuasion
hence the need to carry out this study. The main objective of this study is therefore to identify and discuss
strategies used for persuasion in Kimuthambi.
Theoretical Framework
This study is guided by the relevance theory according to Sperber and Wilson (2002). They posit that “An
utterance makes manifest a variety of assumptions the hearer attends to as many of these as seem relevant
to him” (p.96). The hearer mostly infers (deduces) the speaker’s meaning by considering what is and what
isn’t relevant to the conversation. Guided by the communicative principle of relevance, a speaker may be
able to produce a stimulus which attracts the audience attention, to prompt the retrieval of certain
contextual assumptions and to point them towards an intended conclusion, the researcher was able to
identify the expressions that Kimuthambi speakers use to persuade their targets. This is because speakers
are able to predict and manipulate their audience’s mental states assured that the audience will tend pick
the most relevant stimuli in their environment and process them so as to maximise their relevance.
Population, Sampling Procedure and Sample Size
The population for this study includes all communicative events conducted in Kimuthambi. The study
adopted purposive sampling technique to arrive at real life communicative events conducted in
Kimuthambi that will be used in the analysis. The researcher limited the study to 10 real life
communicative events and recorded the entire conversations that involved 14 speakers. These included:
marriage negotiations, family meetings, chiefs barazas, political meetings, farmers consultative meetings,
land buying processes and church meetings. The events generated sufficient data for the study. Though
the researcher had collected data from more communicative events, analysis beyond this would have been
repetitive. Kothari (2004) posits that under non-probability sampling, the researcher purposively chooses
particular units for constituting a sample on the basis that the sample will be representative of the whole
Data Collection
Data was collected using a digital audio recorder and an observation schedule. The recorder captured
conversations in Kimuthambi in the selected communicative events and the observation schedule was
used to record the contextual information. The contextual information was used to determine which
utterances were used for persuasion.
Methods of Data Analysis
This study utilizes both qualitative and quantitative methods in data analysis. The researcher transcribed
all the utterances from the data collected via a voice recorder onto a guiding card. Guided by Elizabeth,
Imogen, and Melanie (2013) suggestions on strategies used to persuade, the researcher picked all the
utterances from the transcribed utterances that had the suggested characteristics. Guided by the
communicative principle of relevance (Sperber and Wilson 2002) the researcher constructed a hypothesis
about the speaker’s meaning which satisfied the presumption of relevance conveyed by the Kimuthambi
utterances. This aided in determining and discussing utterances are used for persuasion.
Strategies Used for Persuasion in Kimuthambi
There are many strategies used for persuasion in different languages. The utterances in the
communicative events that were studied are analyzed following Elizabeth etal. (2003) and using the
relevance theory by Sperber and Wilson (2002) to establish the strategies used in Kimuthambi.

Proceedings of the Third International Research Conference held on 26th to 28th October, 2016 358
Communicative Event 1 (C1)
Communicative event one (C1), is a funds drive towards the purchase of church land. The current church
hall is on public land and the church leadership has invited many guests including the county governor
and the member of county assembly (MCA). This communicative event involved many utterances meant
to persuade the hearers to give towards the project or to support the invited political leaders. The purpose
of the persuasive discourse depended on the speaker. Consider C1. 7 and C1. 8.
C1.7 Uka urutire Ngai kiria ubangite.
Come and give to God what you have set aside.
C1. 8 Gwi antu bakunyaga tutuni tunini beterete benyenkwa.
There are people who give little by little awaiting pleas.
Utterance C1.7 is a logical appeal (a strategy that provides facts and evidence) that appears like just an
assertion to encourage the congregants to give, but within it persuasion is embedded. The speaker (The
master of ceremony) who is an Elder in that church shares a presupposition pool with the congregants.
This presupposition is the habit by most people to subdivide what they intend to give so that they give it
in bits. This has been inferred from the speakers earlier and latter utterances. Utterance C1. 8 (another
logical appeal) further clarifies the purpose of C1. 7: to persuade the congregants to decide what they
want to give and do it at once. Sperber and Wilsons’s (2002) Relevance theory argues that the speaker can
send certain signals aware that the hearer will optimize relevance to make the right interpretation. The
speaker in making utterances C1.7 and C1. 8, was aware that the hearers will make reference to previous
tedious fundraisings, where they take too long trying to coerce members to give; thus convince them with
these utterances to decide and give all at once. Consider C1. 9 to C1.12.
C1. 9 Waruta wira wa Ngai umenye nourathimirwe.
When you serve God you will be blessed.
C1.10 Bamwe bagatura bakionaga antu bebarathime!
Some will just be witnessing the blessings of others
C1. 11 Kana kabukwenda tutura kamugundani gaka?
Or you want us to stay on this small piece of land?
C1. 12 Tutikwenda aibu
We don’t want to shame
Utterance C1. 9 utilize logical appeal to persuade the congregants to give towards the church project. It
invokes the shared knowledge among the congregants, that those who give will be blessed, to persuade
them to give their best. C1.10 is an emotional appeal that is meant to invoke a positive response though it
is presented negatively. The utterance is intended to emotionally provoke the congregants to give their
best so that they can avoid the consequence of not buying their own piece of land (being chased away
from the public land on which the church stood). C1. 11 use sensationalism through a rhetoric question to
provoke the minds of the audience. The rationale behind it is to drive the audience to give so that they can
avoid the consequences anticipated by this utterance. Utterance C1. 12 is an emotional appeal continues
with the same tone; presenting the consequences of not giving, in an emotional way, to persuade
congregants to actually give as much as possible. Consider C1. 16 to C1.19.
C1. 16 Ndiambiria na kubucokeria nkatho ni gututhura twi atongoria benu
Let me begin by thanking you for electing us to be your leaders
C1. 17 Bamwe benu nibanegenete ni barabara, stima na buria antu batikwandikwa
Some of you have been complaining concerning poor roads, lack of electricity and
unemployment.
C1. 18 Tigani ndiburieni? Barabara ino yathondekwa kwina mbura
I want to ask? Can this road be repaired during the rainy season?
C1. 19 Burienda twitura mithanga na kagoto ikinathi na ruuji?
You want us to deliver sand and ballast then they get swept away by rain water?

Proceedings of the Third International Research Conference held on 26th to 28th October, 2016 359
Utterance C1. 16 uses praise to position the hearer to agree with the speaker. The interlocutor has changed
from the master of ceremony (a church elder), to an MCA who was a guest in this function. This
interlocutor seeks identity with the people by praising them in an endevour to persuade them in his later
remarks. He is aware of the complaints they have against the local leadership as evidenced in utterance
C1. 17. In this utterance (C1.17), the speaker uses an assertive to show that he is aware of their concerns.
This awareness is geared towards convincing them to remain patient until their issues are addressed.
C1. 18 is the use of logical appeal through a rhetorical question that attempts to explain why the roads are
not done as yet. Its purpose is to persuade them to remain patient aware that their concerns will be looked
into at the most appropriate time, for their own good. C1. 19 is the use of sensationalism through a
rhetoric question that sensationally aims at persuading the people that doing the roads during the rainy
season would not have been a good idea. The roads would soon be destroyed by rain water. Let’s look at
C1. 20 to C1. 22.
C1. 20 Eterani gutenie tukinathondeka njira ino ibwe buru.
Please wait for the rains to subside then we repair this road properly.
C1. 21 Mwena wa stima butikamake
Concerning electricity, do not worry
C1. 22 Ndimunenkere transformer inya na imwe ni yenu
I have been allocated four transformers, and one is yours
Utterance C1. 20 is a logical appeal that gives the reason that necessitates the waiting. The political leader
then moves on to address the concern on lack of electricity. He urges the people not to worry in utterance
C1. 21 using another logical appeal and goes on to give evidence through yet another logical appeal to
show that the electrification of that area was on course through utterance C1.22. This shows that logical
appeals: the giving of evidence serves a great role in persuasion in Kimuthambi. Now consider C1. 23
and C1.24.
C1. 23 Bamwe bariuga ntikwandikithia antu ba guku county
Some are claiming that I am not recommending people from this area for employment by the
county government.
C1. 24 Mbirani onabwi. Kethwa muntu atina maratathi ri, akandikwatia
Tell me. How can we employ people without proper qualifications?
In utterance C1. 23 the MCA using the exclusion stratey claims that only ‘some’ people are complaining.
Though many people could have complained, the speaker decides to exclude the ‘bad ones’ in an
endevour to show that the majorities are not complaining and thus they are satisfied with his leadership.
Utterance C1. 24 is a logical appeal structured rhetorically to provoke the minds of the people so that they
are persuaded that the ‘small’ group is misguided. Finally in communicative event one lets focus on
C1.26 , C1. 27 and C1.31.
C1.26 Twikaraga ndi, tukagaira ward jionthe; indi ngacoka ngeta MCA wenu nkamwongera kanyamu
We allocate money to all wards but later I call your MCA and give him something more
C1.27 Watho wa mbiti uugite atia?
What does the law of the hyena state?
C1. 31 Riu 2017 bukaraitha wira wakwa bukinarutha buria kubaterie
In 2017, you will evaluate my performance and act accordingly
Some of the utterances by the governor are indirectly trying to persuade the audience to believe that he
loves them and thus they should reciprocate by loving him, supporting him and vote him in the next
general election. He uses logical appeals in utterances C1.26 and C1.27 to explain how he favors them
and to justify why he does so. In utterance C1.31 the governor uses a logical appeal to explicitly declare
his ultimate goal: To convince the people to elect him in the forth-coming general election.

Proceedings of the Third International Research Conference held on 26th to 28th October, 2016 360
Communicative event two (C 2)
Communicative event two (C2) is a meeting convened by an assistant chief to address the many cases of
people taking loans that they couldn’t repay. He is the only speaker in this event and the main purpose is
to persuade the audience to be very cautious when they are borrowing loans from financial institutions.
This meeting was necesiated by cases of many people in that locality being auctioned for failing to repay
their loans. Consider utterances C2.2, C2.3, C2.5 and C.2 6.
C2. 2 Muntu arithi gikundini agakoba mbeca njingi aiji ati atiremwa kuria
niagukama.
Someone goes to a group, takes a loan banking on milk money
C2.3 Aremwa kuria akathi gikundini kingi ageukia mbeca kenda aria gikundini kiria kiambere
When he/she is unable to repay, s/he takes money from another group to repay the first loan
C2. 5 Muntu uu atiomorerwa nyomba?
Won’t this person’s property get auctioned?
C2. 6 Rui antu betu menyerani butikaririeni twana bukirira
Oh! My people take care so that you don’t make your children cry as you cry
The main speaker in communicative event 2 was an assistant chief, who had set out to convince members
of his area not to borrow irresponsibly. In utterance C2. 2, he uses an attack to demean such behavior. In
utterance C2.3 he uses logical appeal to present the state of affairs among many members in his area then
in utterances C2.5 and C2. 6 he utilizes sensationalism to depict the consequences of borrowing
indiscriminately.
After using attack and sensationalism, the speaker turns to emotional appeals in utterances C2.7 and C.2
8, pleading with the people to stop that kind of ‘play’ and be content within their life standards. Utterance
C2.9 uses sarcasm since ironically It appears to encourage the behavior that the speaker has been
condemning. In this context it is actually meant to reinforce the demerits of borrowing without proper
plans thus persuade people to desist from the risky behavior.
C2. 7 Tiganani na ichecho ino rui.
Please stop this habbit.
C2. 8 O muntu nieganirwe ni kiria enakio rui.
Let everyone be content with what they have.
C2. 9 Tiga baria bagutonga batonge.
Let those determined to get rich alone.
Communicative Event 3 (C3)
Communicative event 3 was basically a bonding session; the bride’s parents had visited the groom’s
people. Most utterances were basically for emphasis because much persuasion had been done during the
negotiations at the bride’s home. Some utterances though implicitly had the intention of persuading. Let’s
look at C3. 8 to C3.10.
C3. 8 Untu uria wa bata muno ni gikeno kia jiana ino
The most important thing is the joy of these children
C3. 9 Tugerieni muno tubauthirie mauntu
Let’s try as much as we can to lighten their burden
C3. 10 Na bakirathimwa, onatwi tutitigirirwa
And we will partake of their blessing too.
Utterance C3. 8 uses generalization to persuade all not be overbearing on the bride and the bride groom as
they prepare for their wedding. Utterance C3. 9 is an emotional appeal that continues to convince the
hearers to make it easy for the ones marrying. Utterance C3. 10 is a sensational statement meant to
reinforce the intention embedded in Utterances C3 8 and C3.9. These utterances are well understood by
the hearers because all share the same presuppositions. The utterances are said in the context where a

Proceedings of the Third International Research Conference held on 26th to 28th October, 2016 361
couple that is seeking the parents and society’s blessings before they wed is really troubled with many
demands. The hearers are able to decode this information by inferring from the prevailing situation.
Communicative Event 4 (C4)
In communicative event four (C 4) the principal is attempting to persuade parents to embrace the idea of
beginning a boarding wing in a school that had been day. Most parents and other stake holders express
their displeasure with that direction because the day school was basically begun to help children from
humble backgrounds to acquire education. The introduction of a boarding wing could mean that the day is
being phased out yet many parents may not afford the school fees charged in boarding schools. Consider
C4.1 and C4.3.
C4. 1 Ajiari betu gwi gauntu tukwenda kubwereca
There is something we want to explain to you, our parents.
C4. 3 Antongoria na atiririri cukuru batirimana, bareciririe bambiririe rwang’i rwa
kulala (manegene kuma gi antu)
When leadears and stakeholders met, they proposed that we start a boarding wing (grumbling).
The principal uses utterance C4. 1 as a set induction to prepare the parents for the serious matter he
intended to introduce through the strategy of inclusion; showing them that they belong together ‘Our
parents’. Utterance C4.3 quotes authority (That the decision was done by eminent people: leaders) to
validate the information being delivered. The context (grumbling from the parents), that shows
discontentment inform the persuasion that follows. Consequently the principal continues trying to
persuade his audience as shown in C4.4 to C4.7.
C4.4 Mpani kanya ndibwerese kaora antu betu
Please allow me to explain step by step our people
C4.5 Ka mbere kwina twana twinge tukuthomera guku na tumaga kuraja muno
Firstly there are students that commute from very far
C4.6 Baingi bariraririrua guku nturani
Many are spending in the villages
C4.7 Butikwona ni kaaba tubaruthire antu a kurara?
Don’t you think we need to accommodate them?
In utterance C4.4 the speaker emotionally appeals to his audience to listen to what he has to say. This
emotional appeal is not overt in the words but from the tone and facial expression (from observation) due
to the negative feedback the speaker was getting from the audience. In utterance C4. 5 the speaker uses
logical appeal to persuade the hearers; he begins by enumerating the reasons for the boarding wing.
Utterance C.4 6 uses sensationalism with the aim of provoking parents and other education stakeholders.
The principal uses this statement to show that the school has attracted many students beyond the locality
and because the school does provide accommodation, they are accommodated by some well wishers in
the villages. This is sensational and is meant to show the audience the sense in having a boarding wing.
The utterance leads to the conclusion- utterance C4.7, a logical appeal through a rhetoric question, that
was meant to lead the audience into even deeper thought about the whole issue. The audience most
probably must supply the answer that the speaker intends if they maximize the contextual features. The
speaker will therefore have persuaded the audience. Let’s see how the principal continues in his
persuasive agenda in C4.8 and C4.9.
C4.8 Untu ungi ni wa ugitiri.
Then we have the issue of insecurity.
C4.9 Kwi mwana atirimanine na amba aukite cukuru rukiri.
One student encountered thieves as he came to school.
Utterance C4.8 is a logical appeal that introduces another reason that necessitates a boarding wing. This
sounds logical and the audience would most likely get moved to agree with the speaker especially because
insecurity was on the rise during the time of this communicative act both in the country (Kenya) and in

Proceedings of the Third International Research Conference held on 26th to 28th October, 2016 362
the locality (Muthambi). Utterance C4.9 sensationally presents a case at hand and this gives the principal
an upper hand in persuading the stake holders. By this time the protests (through murmuring) that were
evident at the beginning of the presentation had subsided and were replaced by frequent nods and
agreement responses. He gives the parents an assurance that the day session will not be affected using
C4.10 and C4.11.
C4.10 Rwangi rwa kwinukaga rutithira. Tigani kumaka
Worry not we will not do away with the day section.
C4. 11 O murutwa akathomera kuria akenda
Students will choose the form they prefer.
Utterance C4.10 is a logical appeal that aimed at assuring the parents and other stakeholders that the
introduction of the boarding wing does not mean that the day wing will be closed. The utterance was
necessary because the speaker was aware of many fears the parents had regarding the introduction of the
boarding wing. Utterance C4.11 uses logical appeal too to extend the message communicated in C4. 10
by showing that it is possible for the two wings to operate simultaneously and that parents and students
will have the privilege of deciding which one they prefer.
Communicative Event 5 (C5)
Communicative event five (C5) was a meeting of dairy farmers. The dairy officials had called for a
meeting to explain the reason for very low payout rate. The farmers were so discouraged by the
performance of their officials that some were talking of leaving that dairy for better ones. The first
speaker, that is the farmers’ spokes person’s utterances were mainly meant to emphasize the agreed upon
position- to put to task the dairy officials on the reasons for low pay out rate. The speaker did not need to
persuade the farmers for the low payout was obvious and the farmers were already charged. From the
context it was clear that they had other meetings, without the dairy officials. Probably it is in these
meetings that much persuasion was needed to charge the members.
It is the utterances of the second speaker, a dairy official that consist of attempts to persuade. The dairy
official had to work hard to convince the members that things would get better while giving credible
reasons for the current state of affairs. Consider C5. 8 to C5. 11.
C5. 8 Antu betu tumanitie kuraja muno.
My people, we have come along way.
C5. 9 Gatutigeni Kuriganirwa na mpwi.
Let’s not forget quickly.
C5. 10 Twambiririe dairy ino guti na ingi guku kunthe!
We began this dairy as a pace setter in this region
C5.11 Ni uma kurari na kathina indi nitugukathiria.
There has been a problem but we are addressing it
In utterance C5. 8 the speaker uses inclusive language to show that he is part of the group. He emotionally
appeals to the audience not to forget their past in utterance C5. 9. This is in an endevour to persuade the
audience to change their minds. Utterance C5. 10 uses a logical appeal to show the background of the
dairy thus make the audience link up with the history of the dairy hence promote ownership. The dairy
official used Utterance C5. 11, which is a contention (a strategy where a speaker appears to agree with the
hearers on some facts) to agree with the dairy farmers that there is a problem. Through this agreement the
speaker hoped that the succeeding utterances will be accepted and that his ground will have softened to
enable him persuade the audience. Subsequently in C5.12 and C5.13 he uses logical appeals by providing
reasons for the low pay out rate.
C5. 12 Nitwetikaniririe tugure mashini nene na ngari ya gukamata iria. Tibu?
We had agreed to buy coolants and a vehicle to ferry milk. Isn’t it?
C5.13 Into iu nijio iratumire mbeca inyia
That cost affected the pay rate

Proceedings of the Third International Research Conference held on 26th to 28th October, 2016 363
The speaker, in C5.12 and C5.13 explains using past interactions with the audience to bring them to the
realization of the possible decline of the payout rate. The speaker invokes the presupposition pool to bring
the audience to realization that they had spent lots of money to do several other things. Lets now consider
the strategies the speaker use in C5.14 and C5.15.
C5. 14 Riu niturikitie kuria buru
We have settled the payments in total
C5. 15 Tueni mieri iiri yonka aki bwoneni
Please give use only two months and you will note the difference
Utterance C.5.14 uses a logical appeal to assure the farmers that things will change. This assurance is
based on the reason that all the cost has been paid. Utterance C5.15 uses a logical appeal by asking for
some time to rectify the problem. The logic is that –given more time (two months) the pay out rate will
have improved. The speaker then changes strategy in C5.16 to C5.18.
C5. 16 Kana uria akwenda kuthi gikundini kingi athi.
Or if someone wants to try another group, we let them.
C5. 17 Buria akona gutiwe akera.
The consequences such a person will get will be serious
C5. 18 Tiga tumanirieni tukurie gikundi gietu.
Lets encourage one another and grow our group.
Utterances C5.16 and C5.17 use sensationalism to try to persuade the hearers. This is a stringent strategy,
a kind of last resort and the speaker seems as if he does not care; that whoever would want to leave the
dairy to do so. The speaker actually cares and the implicit message is that no one should go elsewhere for
those places are not safe. Utterance C5. 17 uses sensationalism to show that no other dairy is as good and
so the members who would leave that one would regret. The speaker concludes with an emotional appeal
to the members to stick with the group so that they can grow it together in utterance C518.
Communicative Event 6 (C.6)
Communicative event six (C. 6) involved two groups negotiating; the bridegrooms side are asking to be
allowed to proceed and plan the wedding while the brides side insist that more money for bride price
should be added before that happens. This is the second meeting after thorough negotiations during the
first meeting. The two groups are being represented by spokespersons, as follows.
C6.1 Twauka butwitikiria twendelea na uiki, Kiria tutiretete tukareta twarikia uiki
We’ve come to request that you allow us continue planning the wedding, then we will bring what
remains, after the wedding.
C6.2 Tutiumba gwitikiria butiretere kiria kibatie niuntu mwiriga ni wiji na niu ukarekeria mwari.
We can’t just allow without a nod from the clan because it is the one that releases the bride
Speaker A (grooms spokesman) in utterance C6. 1, uses logical appeal to persuade the brides people to
allow the couple to begin planning their wedding without the full amount they were asking for. Speaker B
(brides’s spokes woman) insists that the amount asked must be surrendered before wedding preparations
begin. The utterance C6.2 also uses logical appeal; and claims that some amounts are determined by the
clan and so they cannot be changed. The conversation takes aonther turn in utterances C6.3 and C6.4 as
follows.
C6.3 Iukiani kiria twaruta na gikeno bukimenyagirira aana baba batikambirie uturu
wao na mathina.
Please accept what we have gladly, being careful so that these children do not begin their lives
badly.
C6.4 Tika tukurega, bwaruta ngiri mirongo ithandatu na tutinenkerete aka nombi.
Ongerani ikinye Igana.

Proceedings of the Third International Research Conference held on 26th to 28th October, 2016 364
We are not refusing. You have only given sixty thousands shillings. Make it at least one hundred
so that we can afford to give women something.
In utterance C6.3 the groom’s speaker applies sensationalism to try and persuade the bride’s side to cede
ground and make it easier for the couple. The speaker uses the contextual informational known to all the
participants- that when a newlywed couple spends a lot of money during negotiations and wedding
preparations, they are bound to suffer financially as they begin life. In utterance C6.4 the bride’s spokes
person uses logical appeal to diffuse the sensational remarks by speaker A; clearly showing that what the
groom’s spokesperson is talking about cannot apply in that situation. His utterance is aimed at persuading
the grooms people to add more money so that all the parties involved in their negotiations can be
appeased. Let us look at C6.5, C6.6and C6, 8.
C6. 5 Iu itioneka, ntibuenia, nonga uiki utire.
That isn’t possible, unless we postpone the wedding.
C6.6 Tigani kwaria ugu, tibu antu baragia ugu. Bukongera jiigana?
That’s not how to approach issues, how much will you add?
C6.8 Ari, kinyiani kibau, kibau gionka onakaba tukongera tukagaira antu.
Make it twenty, twenty only. We can even help you for the sake of others.
Speaker A in utterance C6.5 utilizes sensationalism to persuade the bride’s people. By declaring that it is
not possible to get such money; and that the wedding cannot be if the brides people continue with their
demands, the grooms’ people use the greatest effort to persuade or even destroy the negotiations.
Utterance C6.6 uses logical appeal to show that this utterance actually worked and the hearers began to
cede ground. Sensationalism therefore strongly breaks through the persuasive discourse by speaker A.
Speaker B. in utterance C6.6 discourages speaker A from using such an approach but offers a solution to
the stalemate. After the speaker A in utterance C6.7 (See appendix viii) insisted that they will only add
ten thousands, speaker B uses an emotional appeal to persuade them to add twenty thousands in utterance
C6.8 . They even promise to assist because of appeasing the clan. This is a face saving strategy which
pragmatically is supposed to show that the people in group B are not that bad and that they were only
executing a cultural practice. Concession is finally arrived at in utterance C6. 9. (See appendix viii).
Communicative Event 7 (C7)
Communicative event seven is a meeting of extended family members, convened by one of them for the
purpose of persuading them to begin raising funds for a member of the family who has been very sick for
long. I will refer to the speaker as the convener of the meeting.
C7.2 Nitukwenda tumurutire gantu kanini kamutethererie.
Let us contribute something small that will help him.
C7. 3 Mbeca jiongwa ikinyite ngiri Magana manana.
The bill adds up to eight hundred thousand.
Utterance C7.2 is a logical appeal to persuade the hearers to give some money to aid in clearing the
medical bill. Utterance C7. 3 is another logical appeal that provides the actual figure as prove that the bill
is too much and so one person or a single family cannot handle it. This should lead the members to infer
that they need to give a hand as the speaker continues to substantiate further in C7.5 and C7.6.
C7.5 Antu betu gatutethieni umwe wa jietu riu ena thina.
Our people lets help one of us in this time of need.
C7.6 Gutiwe utigwatwa ni thina teno.
Anyone of us can get into such a situation.
Utterance C7.5 is a logical appeal to the hearers to assist one of their own. Utterance C7.6 then uses
sensationalism to appeal to the emotions of the hearers in an endevour to persuade them to aid a
colleague. The speaker continues with this strateg in utterances C7.7 to C7.10.

Proceedings of the Third International Research Conference held on 26th to 28th October, 2016 365
C7.7 Kana ingi muntu agwatwa ni untu akebanga ?
Do we leave individuals to struggle alone?
C7.8 Mauntu mama guti muntu matigwata.
These things can affect any one.
C7.9 Omundi ni niu, ru nigweu.
If I am affected today, remember tomorrow is your turn.
C7.10 Omuntu arute akimenyaga untu uu ni munene
Let’s give aware that this is a big task
The speaker who is the convener of this meeting utilizes sensationalism extensively. Utterances C7.7,
C7.8 and C.7 9 are all sensational. Sickness is dreaded by people in all societies and hearers in this
context are no exception. The speaker takes advantage of the fact that serious sicknesses are dreaded and
sensationally using rhetorical questions sometimes like in utterance C7.7 to persuade the hearers to give.
Indeed it was observed that the members gave ‘emotionally’ after these utterances. This shows that in
some contexts especially those dealing with sicknesses, deaths and burials this style may be very
effective.The speaker therefore used utterance C7.10 to demonstrate the magnitude of the problem at hand
so that he could persuade the audience to give.
Communicative Event 8 (C8)
Communicative event eight (C8) is a meeting between the local community and water project officials.
Their main aim is to convince the local people to participate actively in the implementation of the water
project. From the contextual information in this meeting, it is clear that some people are lax on the project
while others are totally opposed to it to the extent of barring the water pipes from passing through their
land. After some emphasis on the need for this project, the chair begins to persuade members to get
involved with the work using C8.3 and C8.4.
C8.3 Ikiirani ruji ruru muno, niuntu rukabutethia.
Support this project and you will benefit.
C8.4 Twetana kwinja mitaro ukani. Uria akenja akaruta tubeca tunini ruji
rukinywiwa
When we ask people to help in digging trenches please come and you will be
reducing your final fee before you can benefit.
Utterances C8.3 and C8. 4 are logical appeals to the people to get involved with the project. The speaker
provides the reason as to why the project needs support. The offer, that those who participate will pay
less, given in utterance C8.4 is very effective because from other utterances (Context) it was something
that had been happening. Hence a strong tool for persuasion. Consider C8.5 and C8.6.
C8.5 Ndigwa ona kwibo batikwenda ruji rwitukira kwao. Tamaka?
Imagine some are opposed to the pipes passing on their lands.
C8.6 Tonga muntu emurogi?
Unless one is a witch.
Utterance C8.5 is a direct attack on some people who could either be at the meeting or not. The speaker
excludes them and attacks them very sensationally in utterance C8.6. This utterance uses sensationalism
to persuade people not to tolerate such behavior. Such people may or may not be in the meeting and even
if someone was in such a meeting they would save face and pretend to denounce such behavior. The
statement could also be aimed at persuading those at the meeting to prevail upon those opposed to the
project and did not attend the meeting. Finally on C8 lets look at C8.7 to C8.9.
C8.7 Ka ruji rukuria mugunda uriku?
How much land will the water pipes occupy?
C8. 8 Gwanca ona rwinjagirwa ndi muno. Gutibu rukugiria kurutha.
Actually the pipes are placed quite deep and they can’t deny you any space.
C8.9 Ringithwa ni nkoro bai nomenye ruji ni mwoyo.
Think again and know that water is life.

Proceedings of the Third International Research Conference held on 26th to 28th October, 2016 366
Utterance C8.7 uses a logical appeal through a rhetorical question to provoke members into seeing the
folly of those who are opposed to water pipes passing through their land then Utterance C8.8 aslo uses a
logical appeal by give a credible reason as to why such an act is unjustifiable. Finally the speaker
emotionally appeals to the audience and the entire community to support the project fully; since water is
very important in life in utterance C8.9.
Communicative Event 9 (C9)
Communicative event nine is a haggling process between a buyer and a seller. The buyer hopes to buy a
piece of land as cheaply as possible while the seller does all he can to sell the piece as much as possible.
They negotiate at the site and with them are witnesses who do not talk. After the speaker emphatically
states the facts about the land, the buyer begins to bargain aggressively.
C9.5 Mugunda ti muthuku indi milioni ni nyingi muno, iukia ngiri Magana
mathandatu.
The land is not bad but a million is too much. Take six hundred thousands.
C9.6 Aiii, tibu migunda ikuma ugu, gokwenda kumbinyiria atia
Ooh no! Thats not the cost of land presently unless you want to under pay.
The buyer uses logical appeal in utterance C9.5 to persuade the seller to charge him less for the piece. He
uses the reason that a million is too much. The seller also uses logical appeal in utterance C9.6 to dispel
the buyers claim and insists that the deal is fine. Consider C9.7 to C9.9.
C9.7 Ndutarutira bai tiga kumiria oaria wambiririe, gotukumenya twibamwe.
Adjust downwards knowing that we are one people.
C9.8 Ruta Magana manana turikanie indi na utikarie kairi.
Make it eight hundred then and don’t bargain further.
C9.9 Kandute mugwanja bai na nkoro imwe.
Let me pay seven hundred sincerely.
The buyer uses the strategy of inclusivity in utterance C9.7 to show how close relational wise he is to the
seller to convince him to sell at that low price. This convinces the seller to lower the price by two hundred
thousand shillings but uses an emotional appeal to the buyer in utterance C9.8 not to negotiate further.
The buyer does not heed to this appeal and in utterance C9.9 he uses another emotional appeal so that the
price can drop by one hundred shillings, which seems to frustrate the seller in C9.10.
C9.10 Gweu riu kobangite kundiria, Nkurengerete Magana mairi ririkana
It seems you are not mindful of my welfare. I have already reduced two hundred thousands.
C9. 11 Muriwa ni mwene atithiraga
You will not run broke by supporting your people
In utterance C9.10 the seller uses a sensational statement to stop the buyer from further haggling. The
buyer uses a logical appeal through a proverb in utterance C9.11, to dilute the effect of the sensational
utterance by the speaker and it works. The seller accepts the buyers proposal in utterance C9.12.
Communicative Event 10 (C10)
Communicative event ten is a wedding planning committee. The members of the committee had pledged
to give various amounts of money at the beginning of the committee’s sestings but very few have honored
their promises. The wedding day is at hand and the monies fall below the target by far. The chair of the
committee uses this speech to persuade members to expedite their giving. Lets look at C10.2 and C.10.3.
C10.2 Rui antu betu twiumieni turutaruteni mbeca ino.
Kindly our people, let us try and give more please.
C10. 3 Kana kabutikwenda antu baba bagurana?
Or don’t you want these people to marry?

Proceedings of the Third International Research Conference held on 26th to 28th October, 2016 367
Utterance C10.2 is an emotional appeal to the committee members to give their pledges as fast as
possible. In utterance C10 .3 the speaker gets sensational in an attempt to persuade the committee
members to expedite the process. Consider C10.4 and C10.5.
C10.4 Onatwi gatwatethirwe, tigani tutethenagieni bai.
We were helped too, let us keep helping each other.
C10.5 Kana ingi tubere beukie runi baturugire uiiki bacoke kuthina
Do we ask them to get a loan, to finance the wedding, and then they are left to suffer?
Utterance C10.4 is an emotional appeal while C10.5 is a sensational utterance that takes the committee
members, most of whom are married, to their own wedding planning meetings. The audience is aware of
the planning process and the financial constraints that the couple involved may go through during this
process. The speaker then moves to suggest a solution in C10.6 and C10.7.
C10.6 Tukendelea ugu tutikinyia mbeca itutethia
If we continue giving at this rate, we can’t help the situation
C10.7 Gatugeni omuntu auke na kiria etwirire mucemanioni uu ungi. Tibu?
Lets agree to bring with us the amount we pledged ourselves in the following meeting
The speaker finally uses two utterances, C10.6 and C10.7 to logically appeal to the members to honor
their pledges. Utterance C10.6 does it by giving the consequence of not giving while C10.7 by declaring
the way forward to solve the stalemate. Table 2 shows the summary of the strategies used for persuasion
in Kimuthambi.
Table 2 Summary of the Strategies used for Persuasion in Kimuthambi
Technique Frequency Percentage
Logical appeal 38 45.24
Sensationalism 19 22.62
Emotional Appeal 14 16.67
Inclusive Language 3 3.57
Exclusion /Attack 3 3.57
Assertion 2 2.38
Authority 1 1.19
Generalization 1 1.19
Praise 1 1.19
Contention 1 1.19
Sarcasm 1 1.19
Total 84 100
From the ten communicative events captured for the purposes of this study, one hundred and thirty six
utterances were identified and transcribed. These utterances had various techniques, as suggested by
Melanie (2002) which are employed in persuasion. Using the relevance theory by Sperber and Wilson
(2002) the researcher identified eight four (84) utterances used for persuasion.
From the data collected, it is clear that persuasion in Kimuthambi is mainly through logical appeals. This
is a strategy that involves the use of facts and evidence to support a line of thought. The speakers used
logical appeals in thirty eight (38) out of the eighty four (84) utterances used for persuasion. This
accounted for (45.24 %) of the total utterances that were used for persuasion in Kimuthambi. This means
that the speakers had to reason with the audience, provide evidence and support their points of view
rationally. Utterances that used logical appeals usually followed those that stated various facts. For
example, in utterance C1.20 below the speaker who is the MCA, trys to reason with the audience. He tells
them that the reason the county government had not repaired the roads was due to the heavy rains that
were pounding the area. This meant that the leaders were concerned about the condition of the roads only
that the circumstances,to repaire the road, were not favorable.

Proceedings of the Third International Research Conference held on 26th to 28th October, 2016 368
C1.20 Eterani gutenie tukinathondeka njira ino ibwe buru.
Please wait for the rains to subside then we repair this road properly.
The second main way that persuasion is achieved in Kimuthambi is through sensationalism. This is a
strategy in which the speaker blows up or exaggerates an issue to arouse the extreme emotions of panic or
anger in the hearer. For example ‘our hospitals have become deadly health hazards’ referring to a hospital
that is dirty and overcrowded. The speakers used sensationalism in nineteen (19) out of the eighty four
(84) utterances that were used for persuasion. This accounted for 22.62 % of the total utterances used for
persuasion. Sensationalism was used mostly as a last resort. That is when persuading the target became
difficult the speakers would employ sensational utterances –and it worked. In utterance C6.5 for example
speaker A uses sensationalism to persuade the hearers to cede ground. After much negotiation without
much success he said that the groom to be could not afford more money and that the only viable option
was the postponement of the wedding. That made speaker B soften his stance. (Refer to utterance C6.6 in
appendix viii).
C6.5 Iu itioneka, ntibuenia, nonga uiki utire.
That isn’t possible, unless we postpone the wedding
The third main way in which persuasion is achieved in Kimuthambi is through emotional appeals.
Emotional appeas play on the emotionas of the hearer such as fears, insecurities and desires. They
manipulate the listener to take notice of issues by triggering an emotional response. The speakers used
emotional appeals in fourteen out of the eighty four utterances used for persuasion in Kimuthambi. This
accounted for 16.67% of all the utterances used for persuasion. Emotional appeals were done mostly after
logical appeals and before sensationalism. When emotional appeals worked the speakers would not go on
to sensationalism. Emotional appeals were more in communicative events that the speaker needed to get
the audience into feeling for someone or towards something for instance in cases like raising money to
sort a medical bill like in utterance C7.7. In this utterance the speaker through a question wants the
listeners to place themselves in the victim’s situation.
C7.7 Kana ingi muntu agwatwa ni untu akebanga ?
Do we leave individuals to struggle alone?
Other ways through which speakers sought to persuade their hearers in the utterances collected were use
of: inclusive language (3 utterances 3.57%), assertions (2 utterances 2.38%), authority, generalization,
praise, contention and sarcasm each 1 utterance accounting for 1.19 %.
As seen in this discussion, persuasion in Kimuthambi is mainly achieved through the use of logical
appeals, sensationalism and emotional appeals. It is rarely achieved through the use of inclusive language,
assertions, generalization, and contention among other strategies suggested by scholars in the field of
persuasion. This study establishes that persuasion in Kimuthambi usually begins with the use of logical
appeals. If persuasion is achieved then no further strategies are employed and if not the speaker would
follow the logical appeals with emotional appeals. If persuasion is not achieved the speaker would finally
use sensational utterances and these would work most of the time. The hierarchy of persuasion in
Kimuthambi can therefore be postulated as follows: logical appeals – emotional appeals – sensationalism.
SUMMARY
Persuasion is inherent in every day communication in Kimuthambi and it involves several strategies. The
strategies vary due to context and other cultural phenomena, hence the impetus for this study.
Communicative events in Kimuthambi involve many utterances used for persuasion. Out of a total of one
hundred thirty six (136) utterances collected from the communicative events, eighty four (84) are used for
persuasion which account for (61.76 %). Firstly, persuasion in Kimuthambi is achieved mainly through
the use of logical appeals. Logical appeals are utilized in thirty eight (38) out of the eighty four (84)
Utterances which accounts for (45.24%). Secondly persuasion in Kimuthambi is achieved through
sensationalism. The speakers used sensationalism in nineteen (19) out of the eight four (84) utterances
that were used for persuasion which stands at (22.62%). Thirdly persuasion in Kimuthambi is achieved
through the use of emotional appeals. The speakers used emotional appeals in fourteen (14) out of eighty

Proceedings of the Third International Research Conference held on 26th to 28th October, 2016 369
four (84) utterances, accounting for 16.67 %. The hierarchy of persuasion in Kimuthambi is established
as: the use of logical appeals followed by emotional appeals then sensational utterances.
CONCLUSION
Persuasion in Kimuthambi is mainly through logical appeals, sensationalism and emotional appeals.
SUGGESTION FOR FURTHER STUDIES
Persuasion is dependent on culture and culture is highly embedded in a language. This study recommends
studies that compare persuasive strategies between languages of different cultures.
REFERENCES
Chakorn, O. 2006. Persuasive and politeness strategies in cross-cultural letters of requesting the Thai
business context. Journal of Asian Pacific Communication. Asian Business Discourse, 16 (1).
Covino, W. A., and Jolliffe, D. A. (1995). Rhetoric: Concepts, definitions, boundaries.
Boston, MA: Allyn and Bacon.
Elizabeth, E., Imogen, B., Melanie, N. (2013) VCE Year 12 English Skills. London: CUP.
Tang, X. (2009). Investigating pragmatic transfer in persuasion strategies used by native and non-native
speakers of English. International Journal of Language Learning and Applied Linguistics. 9 (1),
92-105.
Gqwede, E. (2005). A Pragmatic Analysisis of Persuassion in Isixossa. (Unpublished M.A Thesis).
University of Stellenbosch
Hardin, K. (2001). Pragmatics of Persuasive Discourse in Spanish Television Advertising. SIL
International and the University of Texas at Arlington: Dallas.
Hornby, A., Cowie, A. and Lewis, J. (2005). Oxford Advanced Learners Dictionary of Current English.
London: Oxford University Press.
Ireri, H. (2011). Misinterpretations in English-Kimuthambi Church Sermons: A Case of Pentecostal
Churches in Muthambi Division. (Unpublished M.A Thesis). Chuka University: Chuka.
Kindiki, S. (2008). Pragmatic Funtions of Attitude Markers in Kiitharaka. (Unpublished M.A thesis).
University of Kwazulu-Natal. Durban.
Kinyua, A. (2010). A descriptive Analysis of the Verb Group in the Kimwimbi Dialect of Kimeru
Language, Eastern Kenya. (Unpublished M.A. Thesis) Chuka University, Kenya.
Kothari, C. (2004). Research Methodology; New Delhi: New Age International Publishers.
Lingzh, Z. (2010). Study of pragmatic transfer in persuasion strategies by Chinese Learners of English.
The South East Asian Journal of English Language Studies. (2), 93-114.
Mbaka, H. (2013). The Phrase Structure of Gichuka Lnguage. (Unpublished M.A Thesis), Chuka
University, Chuka
Mugenda A. and Mugenda O (2003) Research Methods: Quantititive and Qualitative Approaches.
Nairobi: ACTS press.
Muriungi, P. (2005).Phrasal Movement inside Bantu Verbs: Deriving Affix Scope and Order in
Kitharaka. (Unpublished Ph.D. Thesis). University of Tromso, Norway.
Mutegi, A. (2012). Taswira ya Mwanamke Katika Ngano za Wamuthambi (Unpublished M.A Thesis).
Chuka University, Chuka-Kenya
Mutegi, M (2014). Strategies of Wh-question formation in Gichuka. (Unpublished M.A. Thesis). Chuka
University, Kenya.
Mwembu, K. (2012). Uasilishaji wa Maneno ya Kigeni katika Lahaja ya Kitharaka. (Unpublished M.A
Thesis). Chuka University, Chuka-Kenya
Ndwiga, S. (2008). A Syntactic Examination of Empty Categories in the Syntax of Gichuka.
(Unpublished M.A thesis). University of Nairobi
Sperber, D., and Wilson. D. (2002) Relevance: Comminucation and Cognition. Oxford. Blackwell.
Stiff, B and Mongeau, P. (2003). Persuasive Communication, 2nd ed. New York: Guilford Press. ******

Proceedings of the Third International Research Conference held on 26th to 28th October, 2016 370
A LINGUISTIC-STYLISTICS ANALYSIS OF FRANCIS IMBUGA’S BETRAYAL IN THE CITY
Miriti, E.K.1, Gathigia, M.G.2, Munene, G.W.2 and Gicuku, M.W.1
1Department of Education, Embu University College, P. O. Box 6-60100, Embu, Kenya
Tel.: +2547288513759. Email: [email protected] 2Department of Languages, Karatina University, P. O. Box 1957-10101, Karatina, Kenya
ABSTRACT
A linguistic-stylistics analysis involves a synthesis that examines how language has been used in the
realization of a particular subject matter. However, little attention has been given to linguistic-stylistics
analysis and particularly in reference to the study of African literature. This study examines a linguistic-
stylistics analysis of Francis Imbuga’s play, Betrayal in the City, a text replete with cultural, interpersonal
and political betrayals. The Halliday’s Systemic Functional Approach which postulates that the functional
nature of language is reflected in its internal structure, especially in its semantic and syntactic
organisation is employed in this study. Content analysis is used to identify the linguistic-stylistics features
in the play. The study discusses, inter alia, the lexical, grammatical and context categories employed in
the play. Linguistic-stylistics works as a bridge between cultural, literary and linguistic studies. The study
recommends a linguistic-stylistic analysis of texts to understand the functional nature of language.
Keywords: Betrayals, Systemic Functional Approach
INTRODUCTION
The term stylistics comes from the word style. The word style is etymologically derived from the Latin
word stylus which means a pointed object used for writing (Crystal and Davy, 1969). Leech and Short
(2007, p.31) look at the term “style” in various dimensions: First, style is “the way in which language is
used in a given context, by a given person, for a given purpose, and so on” (Leech and Short, 2007, p.9)
and style is “the linguistic characteristics of a particular text” (Leech and Short, 2007, p. 11). Leech and
Short (1981, p.27) also look at style in relation to the Saussuren distinction between langue (that is, the
code of system of rules common to speakers of language) and parole (the particular uses of this system by
speakers or writers in particular circumstance). That is, style pertains to parole; the property of “selection
from a total linguistic repertoire” (Leech and Short 1981, p. 11). Moreover, style is defined in terms of
domain of language use (for example, what choices are made by a particular author, in a particular text).
Stylistics is traditionally regarded as a field of study where the “methods of selecting and implementing
linguistics, extra-linguistics or artistic expressions, means and devices in the process of communication
are studied” (Missikova, 2003, p.15). Stylistics is the study of the relation between linguistic form and
literary function and cannot be reduced to mere mechanical objectivity, whereby we expect linguistics to
provide an objective, mechanical technique of stylistic analysis (Leech and Short, 1981). Stylistics was
born of a reaction to the subjectivity and imprecision of literary studies (Fish, 1981). According to Leech
and Short (1981), style and stylistics include the “basic vocabulary of literary ethics (metaphor, figurative
words, antithesis, irony and rhythm) which cannot be explained without recourse to linguistic notion”
(p.27). According to Crystal and Davy (1969, p. 10), the aim of stylistics is to analyze language habits
with the main purpose of identifying those features which are restricted to certain kinds of social context;
to explain why such features have been used and to classify these features into categories based upon a
view of their function in the social context.
Linguistics being “the academic discipline which studies language scientifically” (Crystal and Davy,
1969, p.10) has everything to do with language usage and its applicability. Linguistic stylistics and
literary stylistics are two separate and at the same time interconnected branches of language usage in
stylistics.3 However, literary stylistics and linguistic stylistics have different emphases and different
methods of operation (Nnadi, 2010). The term linguistic stylistics was coined by Donald Freeman in
1968, apparently to put to rest the verbal feud between literary critics and linguists (Freeman, 1990,
3 Literary stylistics is synonymous to literary stylistics in a way. The purpose of literary stylistics is to explain the
individual message of the writer in terms which makes its importance clear to others (Leech & Short, 1981).

Proceedings of the Third International Research Conference held on 26th to 28th October, 2016 371
p.120). Linguistic stylistics, on the one hand, is a study that relies heavily on the rules guiding the
operation of the language in the explication of a literary text (Leech and Short, 1981). Enkvist (1973)
refers to linguistic stylistics as stylolinguistics. Stylolinguistics, Enkvist (1973) argues, differs from l
criticism, “where brilliant intuitions and elegant, often metaphoric, verbalizations of subjective responses
are at a premium” (p.92). According to Carter and Simpson (1982), linguistic stylistics is where
“practitioners attempt to derive from the study of style and language a refinement of models for the
analysis of language and thus contribute to the development of linguistic theory” (p.4). Linguistic
stylistics, therefore, studies the devices in languages (such as rhetorical figures and syntactical patterns)
that are considered to produce expressive or literary style. On the other hand, according to Carter and
Simpson (1982), literary stylistics is concerned with providing:
[t]he basis for fuller understanding, appreciation and interpretation of avowedly literary and
author-centered texts. The general impulse will be to draw eclectically on linguistic insights and
to use them in the service of what is generally claimed to be fuller interpretation of language
effects than is possible without the benefit of linguistics (p.7).
In other words, literary stylistics, implicitly or explicitly, has the goal of explaining the relation between
language and artistic function. Linguistic stylistics is, therefore, different from literary criticism in that
while literary criticism rests solely on the subjective interpretation of texts, linguistic stylistics
concentrates on the linguistic frameworks operative in the text.
Specifically, stylistics analysis seeks to account for the interpretative effects of a text through a close
study of its linguistic detail, such as syntactic structuring, semantic deviation, deixis, modality, et cetra
often working through inferred interpretative cohesion of foregrounded features. Carter and Simpson
(1982) argue that stylistics analysis should be concerned with occupying “the territory beyond the level of
the sentence or the single conversational exchange” and with examining “those broader contextual
properties of texts which affect their description and interpretation” (p.14). Therefore, a stylistics analysis
is concerned with the examination of the grammar, lexis, semantics as well as phonological properties
and discursive devices in a text. In the analysis of a text, there is need to have a sound understanding of
language, its nature and function. Any text consists of various elements such as content, theme, point of
view, tone, plot, characterization and other literary ideas but without language, these elements would not
be what they are. In other words, they are realized through the medium of language. This is why the
linguistic stylistics analysis of the play Betrayal in the City by Professor Francis Davis Imbuga is a viable
study in order to determine the linguistic properties, structures and patterns inherent in the text.
The Synopsis of the Betrayal in the City by Francis Imbuga
The play, Betrayal in the City, is set in a fictional African country named Kafira in the post-independence
era (Kafira is an anagram of Africa, a Kiswahili version of the word Africa). The play paints a picture of
an independent African state, Kafira, characterized by decay in morals, greed for power, corruption,
nepotism, favouritism, brutality and the violation of human rights under the repressive dictatorship of the
Boss. In order to preserve power, Kafira’s government appoints cronies and relatives into powerful
positions in the government. This sees Tumbo, Mulili, Kabito and Nicodemo occupy powerful positions.
The play opens with Doga and Nina lamenting as they mourn their dead son, Adika, who is murdered
brutally during a university students’ demonstration for trying to question whether the government is on
right track for hiring foreign nationals. Doga and Nina wish to perform a ritual for their dead son, but this
is hampered by directions from the government brought by Mulili (the Boss' distant cousin who is
illiterate but acts like he is the genius) and Jere who claim that the shaving ceremony should not go on in
the interest of peace. However, Doga and Nina are adamant. Later, Jere has a change of heart and allows
the shaving ceremony to go on but is arrested for doing it. Mosese, a university don, ends up in prison
after condemning the government for killing Adika. He is put into prison over false drug-related charges.
Mosese and Jere suffer the pain of the government’s betrayal. Jusper, the only remaining son, is
imprisoned for killing Chagaga, the policeman who shot dead Adika.

Proceedings of the Third International Research Conference held on 26th to 28th October, 2016 372
Tumbo, a senior government officer in Kafira and the man in charge of the entertainment programme,
picks on Jusper to script a play to entertain a visiting Head of State to Kafira. Mosese agrees to take part
in the play in exchange for the freedom of political prisoners. Jusper takes the chance to seek revenge. He
scripts a play entitled the Betrayal in the City, a play that highlights the injustices of post-independence at
a time when democracy and honest leadership is crucial to the development of a nation. The rehearsal for
the play becomes a real confrontation arrived at effortlessly by Jusper, Mosese and Jere taking everyone
by surprise. Jusper devises a clever plan to topple Boss’ government in a bloodless coup. It is Jusper’s
plan that finally sets Kafira free.
Theoretical Framework
The Systemic Functional Grammar or Linguistics (SFL) is adopted as a theoretical framework in this
study. The SFL is an approach to language that was developed largely by the British linguist Michael
Alexander Kirkwood Halliday and his followers during the 1960s in the United Kingdom, and later in
Australia (O’Donnell, 2011). While the SFL was largely developed by Halliday, it built on previous work
of Bronislaw Malinowski (a polish anthropologist who did most of his works based in England) and John
Rupert Firth (a British linguist who established linguistics as a discipline in Britain). In 1969, Simon Dik
called Halliday’s grammar approach “Functional Grammar”, a phrase Halliday considered unfair since
the phrase is a generic term that covered a wide range of grammars at that time. Consequently, Halliday
coined the name “Systemic Functional Grammar” for his approach.
The SFL operates from the premise that language structure is integrally related to social function and
context .That is, great importance is placed on the function of language, such as what language is used
for, rather than what language structure is all about and the manner by which it is composed (Matthiessen
and Halliday, 1997). The SFL is more interested in the manner by which language is utilized in “social
settings so as to attain a specific target” (O’Donnell, 2011, p. 2). The SFL provides an exhaustive and
semantically sensitive taxonomic and functional approach to style. For example, any text can be viewed
as having three important facets / metafunctions of language: ideational function (the meta-function
concerned with grammatical resources for construing our experience of the world around and inside us),
inter-personal function (the meta-function concerned with the interaction between speaker and addressee)
and textual function (the meta-function concerned with the creation of text).
The SFL is also seen as a linguistic consequence of the interaction of the aspects of context (socio-
semantic variables) which Halliday calls field (topics and actions which language expresses), tenor
(language users, their relationships and their purposes) and mode (the channel in which communication
takes place, be it speaking, writing or any combination of the two). Halliday’s systemic functional
approach is of the opinion that style is functionally motivated by a writer’s choice of language in use.
Therefore, this study intends to apply the Systemic Functional Theory to analyze language as an integral
part of Imbuga’s play Betrayal in the City.
METHODOLOGY
This study adopted the qualitative research design since the data collected was non - numerical. Purposive
sampling was employed to select Imbuga’s play Betrayal in the City because of its relevance in
addressing salient thematic concerns like greed for power, corruption, nepotism, favouritism, brutality and
the violation of human rights. Leech and Short’s (1981) analytical checklist was used to analyze stylistic
features into four categories: the lexical, grammatical, figures of speech, and context and cohesion.
Specifically, Leech and Short break the categories as follows: Lexical categories (general, nouns,
adjectives, verbs and adverbs); grammatical category (sentence types, sentence complexity, clause
types, clause structure, noun phrases, verb phrases, other phrase types, word classes, and any general
types of grammatical construction used to special effect); figures of speech (grammatical and lexical
schemes, phonological schemes, tropes); and context and cohesion (ways in which one part of a text is
linked to another) and whether the writer addresses the reader directly, or through the words or thoughts
of some other character).

Proceedings of the Third International Research Conference held on 26th to 28th October, 2016 373
Context, for example, is classified as one of the central concerns because it is integral to the overall
process of making meaning. Context, according to Matthiessen and Halliday (1997) is linked to a number
of contexts which include: the context of culture and the context of situation (register). Specifically,
Halliday models the context of situation in terms of three important strands: Field (which gives us an
indication of the topic or what is being talked about); tenor (which gives us an indication of who is / are
involved in the communication and the relationships between them); and mode (which gives us an
indication of what part the language is playing in the interaction and what form it takes (written or
spoken) (Matthiessen and Halliday, 1997). This study, therefore, attempts to unfold the language used in
situational contexts to create meaning. Leech and Short (1981) posit that every stylistic analysis involves
selecting some features and ignoring others. Stylistic analysis, therefore, is a highly selective exercise
which may involve one feature or more features (pp.69-79). Francis Imbuga’s play the Betrayal in the
City is subjected to such linguistic frames with a view to exposing the stylistic effects of these in
conveying the message in the play. Azuike (1992) observes that different stylisticians devise their own
methods of analysis; hence, there may be many procedures of analysis.
RESEARCH FINDINGS
Lexical Categories
Use of nouns in texts
Noun Proper Nouns:
Mulili, Jere, Kafira University, Adika, Justice, Jupiter, Nicodemus, Boss, Mosese,
Askari, Tumbo, Jusper Wendo, B. A Kafira
Abstract Nouns:
Sad, justice, peace, truth, strange, attention, pretence, mercy, hope, unity,
humanity, future, madness, jobless, generation, entertainment, achievement,
toughness, even, confidence, competition, explanation, termination, lateness,
objection, visit, progress, responsibity, contribution, consequences, wisdom,
alcoholism, faith, temper, darkness,
Compound Nouns:
Standby, heartless, well-wishers, sub-chief, scapegoats, newspapers, manpower,
landlord, chairman, tree-climber
Proper nouns used in the text help the reader learn the names of characters, some names are used
allegorically like Boss, Tumbo – indicate greed and corrupt. Abstract nouns and common nouns are used
to bring out the message and emotions (e.g.) hope, disillusionment, pretence, termination and lateness.
Jusper, Chagaga if jusper killed ‘Chagaga’ then he is not mad. We lack a name for his illness….days have
changed ‘Kalekas’ son. These proper nouns are used to highlight the character of Jusper and enhance
them of change. ‘Days have changed Kaleka’s son. The Noun Excellency is used to refer to Boss.
Use of adverbs in text
Adverbs Accidentally, bitterly, cautiously, Largely, slowly, ghostly, nervously, Angrily,
completely, personally, loudly, simply, differently, seriously, virtually
Adverbs are used to modify verbs, adjectives and other adverbs. The express attitudes and manner in
which an action is done. Adverbs such as accidentally, bitterly, cautiously, ghostly, angrily are expressing
attitudes. They are used to enhance the main message in the text.
Use of verbs in text
Verbs Cancel ,wake ,tell, seems, justified, discussing, understand, comes, guard,
organizing, commanding, hear, listen, allowing, agree, remember, move, spoil,
entertain, finished, hides, speaking, betraying, jumping, imagine, locking,
complaining, scrapped, recommended, count, driving, appointed, incite, shut
died, heard, shouted

Proceedings of the Third International Research Conference held on 26th to 28th October, 2016 374
There are many verbs that are describing bad/negative ideas like, died, kill, shouted, betraying, cancel,
commanding used to bring out societal evils and oppression...
Use of adjectives text
Adjectives Spoilt, quite, new, long, younger, empty, surest, easiest, little, a kind, necessary,
true, good, quicker, dangerous, entire, strong, research station, guilty, big
cowards
Adjectives used in the text are so many to make ideas vivid. Some are used together like Big, coward.
These adjectives have been used together to bring out Mulili's illiteracy as he abuses Jere e.g. “Big
coward. Jere, you a woman.” ‘dead’ one – Also brings out Mulili's character. It is a non-gradable
adjective used among others. The adjectives are very many in the text because they have been used to
describe the characters.
Grammatical categories Here we concentrated with the syntactic categories used in the play. Francis Imbuga has used a variety of
sentences in the play betrayal in the City. These include: Simple sentences, Compound sentences,
Complex sentences. Compound complex sentences.
Simple sentences
For hour and hours you shook with greave. Pg 2.
He is our only hope.
Do you know how to call it?
Tea with milk.
Nonsense. _ _ _
Progressive layers of humanity.
It prevents an epidermic of breaking points am Mosese wa Tonga. Pg 23.
I am grand to meet you. Pg 24.
Me too. Pg 24.
I know. Pg 24.
Only vaguely. Pg 24.
Short sentences are important to make work simple. They also enhance clarity in the play. In the play
Betrayal in the City simple sentences, have an impact in meaning, because they make the event seen real
for example. Simple sentences also enhance the atmosphere the author intends to create. For example;
Doga says, “It was both strange and frightening”. This refers to the time when Jusper was addressing the
grave of Adika. Short sentences enhance logical progression which cannot be achieved using longer
sentences. Simple sentences have also been used in the play to bring out humour. Humour is important
because it makes the atmosphere light amidst tension. The leader is made to smile in the process of trying
to understand the serious issues being addressed. Simple sentences also indicate the clear cut decision that
some characters make. This makes it easy to even understand their traits. For instance. Mosese comes out
as a stubborn or firm character.
Compound sentences The author has used compound sentences in the play. Compound sentences are made up when
independent and ideas of equal importance are put in a single sentence. Compound sentences in the play
Betrayal in the City, by Francis Imbuga, bring out emotions of characters. E.g. on pg 4 Doga says,’People
fled in all directions, but my son’s lonely body! Lay in the middle of the street”. Here, Doga is sad for the
death of his son Adika. Jusper is bitter after the death of his brother. Francis Imbuga used a compound
sentence on page 4 to communicate what Jusper has in mind after killing Chagaga. I will go and
recommend a government coffin with many handles so that everybody will help lower him into the grave.
Tension reigns high on page 7. There is use of a compound sentence that enhances creation of atmosphere
in the book when Jusper behaves as if he is addressing Adika on his grave. Doga says it was both strange
and frightening. Compound sentences are also playing a descriptive role for example on page 11, Jere

Proceedings of the Third International Research Conference held on 26th to 28th October, 2016 375
says that Jusper went dressed in white shirt and confessed, “Beat his chest in front of all the people and
said that he had done it.”On page 13, Jere’s attitude towards Mulili is brought out using a compound
sentence, “I know your boss’s cousin but still you disgust me.
The events at the grave side, makes Jere to realize the sufferings that his people are going through. He
notes, “I looked into that old woman’s eye and I saw the futility of calling ourselves the citizens of Kafira.
On page 14 Jere says, “No I don’t but I will go on”. This shows that Jere has already made the decision to
allow the shaving ceremony go on whether Mulili was for or against the idea. On page 19, askari admits
that he is doing what he is doing because of the prevailing circumstances. “Many prisoners say that to me,
but it is because they don’t understand Kafira.
When Nicodemo was sent to plant opium in Mosese’s car, Mosese changed his name. “Nicodemo was my
name but I dropped it the following day”. He says, “I had heard similar stories, but I never thought it
would ever happen to me”. On page 13, we learnt to what extent the inhumanity meted out on citizens has
affected Jusper. He tells Regina, “You and your brother are the only people I have but Mosese is in, that
leaves you – you alone – to build or destroy me. On page 39 a compound sentence is used to bring out
Jasper’s feelings about the current system of leadership. He says 0nly a spoilt child, but the worst thing
you can do to the truth is clothe it in lies. On pg 41, Tumbo’s position is expressed using a compound
sentence. E.g.”There are opportunities but they don’t come on a plate. On page 58, scene II opens with a
compound sentence. “The boss said, “Grey hair signifies wisdom but it is a sad reminder”. Here, boss
feels that he should not be getting old.
Complex sentences The play Wright has also used complex sentences. These sentences are as a result of joining independent
and dependent clauses .Complex sentences are important for emphasis. On page 12, Jere tells Doga about
Jusper, “At first, people ran away from him, as if he suffered from some horrible infectious disease. This
statement draws our attention to the degree of damage that death of Adika had done to Jusper. A complex
sentence on page 15 indicates Jere’s change of mind regarding the leadership system. “I refuse to kneel
down for theoretical progress page.
On page 18, in the cells, Jere tells Askari that they work like meteorological department who “advice
people to spread their blankets out, then unexpected rain falls from the seemingly clear sky. This
enhances the theme of uncertainty. On page 27, the play Wright shows how prisoners are treated by
Askari. They should not question anything. Askari tells Jere, “Unless you are careful, I will recommend
that you be shifted to the other cell. In Kafira, one need be alert because one may never know when
something bad will happen to him. This is brought out on page 32 where Jusper says, “I only wanted to
see what you would do if it happened to you”. He is talking to Regina.
Compound complex sentences These are sentences that result from joining clauses using both coordinating and subordinating
conjunctions. On page 32 the author, has indicated through Jusper, the uncertainty that people live in.
“They come quietly when you are least expecting them and before you realize it, they have pounced on
you like hungry leopards”. Regina leaves a cautious life. She warns Jusper that it does help to be loud
mouthed. On page 34 she says, “if your brother had kept his mouth shut, he would be with us now, and if
my brother had also kept quiet, he would not be wasting away in a dungeon. Mulili is not qualified to be
in the committee mandated with preparing for the visit of the Head of State. Boss has put him there for his
own reasons. On page 58 we learn of these reasons when Boss says, “I put you in the committee for
obvious reasons and I expect you to report directly to me if something should seem to be going wrong.
Mulili’s constructions bring out his illiteracy. When talking, we realize a lot of changes in word order
which affect both the meaning and the grammaticality of the structures. On page 58, he says, “that the
final.” Here, the structure seems incomplete because of an omission error. Auxiliary ‘is’, is missing. Some
of his statements have employed the wrong form of words e.g. tenses and plurals. On page 8, he says,
“tell him what I does with stubborn old mens”. In this example there is an aspect of morphology in
‘mens’. Suffix ‘s’ should not be there. On page 9 he says, “we wants no any more bloody bloodshed….

Proceedings of the Third International Research Conference held on 26th to 28th October, 2016 376
Just who you wants to murder next.” In this quotation, “we wants” is incorrect. The final ‘s’ in ‘wants’
should not be there. In the last part, “just who you wants to murder next,” there is omission of ‘do’
between ‘who’ and ‘you’. Again the ‘s’ in wants should be deleted.
Context Context refers to the situation in which something happens and that helps you to understand it Halliday
( 1971) suggests three socio-semantic variables that are related to context that determines the register
used by writers or speakers: field (Domain), Tenor and mode (medium). In our analysis we are interested
in the meaning of linguistic expression in context and in relation to who says what , when , where , how,
to, whom and why .
Field (Domain)
Refers to the subject matter of the discourse; it refers to the social setting and the purpose of the
interaction. It involves the setting in which communication takes place .The register used is determined
by these factors. For instance register used in- law , politics , religion was and personal relations. At
the grave side after the burial of Adika as the old couple goes through the mourning period and
preparations for the shaving ceremony. For instance words like Graveside Prison, Students riots,
Laments, Lonely grave, Ghost Justice, A curse, Murderers etc.The register is used here communicates the
ideology of the author and captures the mood of disillusionment that the old couple might be feeling for
the brutal murder of their son. This too sets the pace for the other series of betrayals in the book .
Tenor
Tenor refers to the participants and their relationships. The tenor of one’s language for example how
politely or formally one speaks changes according to Who you are talking to or writing to, example the
language used to talk to friends and that used to talk to strangers differs significantly e.g.
Regina verses Mulili
Mulili verses Tumbo and vise versa
Askari verse Jere
The social situation you find yourself in for instance a student whose mother is a teacher
addresses the mother differently in school and also differently at home .When Mulili is alone with Regina
they talk as friends and intimately so but in the presence of Tumbo , he is suspicious and both talk to each
other as a cousins. When the two –Regina and Jusper – are alone, one cannot miss out on noticing how
close they feel to each other, they have only each other to rely upon. To them, everybody else is out there
and an imminent threat. The disquietness and the resentment that Jusper feels is brought out in the way he
speaks to Tumbo, bringing out the the kind of relationship that exists between them- the subordinate
position of Jusper to Tumbo- and by extension it brings out the general feeling of the common citizenly
being left out in sharing of the national cake:
Tumbo : No please, allow me to ………….er …..er………………
Mr Wendo, Can you drive?
Jusper: I never dreamt of that
Tumbo: come off it. A Jaguar is the easiest car to drive;…….you see, the years are………
Jusper : What are gears? Send me I will walk
Tumbo: oh, great! (………………………..him money.) I take white cap and you?
Jusper : Any beer will do we students can’t afford to discriminate.
Jere’s defiance to an oppressive system is brought out in the way he answers the Askari :
Askari to Jere:
Don’t cut me, short, you do the listening, I talk
Here, tea with milk, yet you don’t even belong to my tribe you need a tall relative to get anything
these days and because you think I am a Junior officer, you can feed on your saliva .
What was that noise fighting again? you senseless invite you were in the do you know I have
seen people being for less serious offences ?
Next time you cause trouble here, you won’t know when I claim on you
Correct! Now don’t you ask any other foolish questions. I am here to see that you ask no
questions.

Proceedings of the Third International Research Conference held on 26th to 28th October, 2016 377
Askari to Mosese :
What do you think you’re doing showing us you back?
Mosese: I have no front
Askari: You are not fit to be living above the ground you are not mole! And just in case you
don’t know. I have once killed a man in this very cell.
Jere and Mosese share a heartbeat .They are victims of an unjust system of government. It is clear in the
deep things that the two share. Jere cannot hide his defiance and contempt for a system that is unjust and
oppressive! He sarcastically replies,
Congratulations! How did you manage?
Jere : What did they charge you with? Weeping in public?
Mosese : No. Being in possession of an illegal drug one kilogram of ……Nicodemus was my
name too, but I dropped it the following day.
Jere : I would have done the same .You been in for the last one year, haven’t you?
Mosese : Yes. How did you know?
It is clear from the way Jere and Mosese talk that both are victims of the oppressive system of the
government of Kafira. The patronizing and dictatorial nature of the government /leadership in Kafira is
clear from the way Askari addresses Jere, also Boss in reference to the student demonstrations. He
says:
Now, listen to that they have no right to chant about it; and if they do, the results will always be
the same. What do you think you gained by that demonstration........completely nothing! A dead
student leader and a senior lecturer in prison……because they shouted against the appointments,
five of which were my own personal appointments, I deliberately sent in an order for three
hundred more expatriate personnel, just to put them in their place.
Regina addresses Jusper differently, when Tumbo arrives. Jusper would wish to conceal his identity for
security reasons. Whereas initially they talk at the level of boy friend and girl friend, but when Tumbo
enters they talk like close relations.
Jusper: My cousin takes tusker.
Regina: I don’t. Get me a soft drink. You know which.
Regina: Jusper!
Jusper: Madam!
Regina: The gown!
Jusper: No, I can’t take it off…
Regina: (Hard on mouth) You! That mouth of yours will be your undoing. Mr. Tumbo, please
don’t take him seriously. He’s only a spoilt child.
Regina tells Jusper to shut that mouth before someone finds a cause to shut it for him. This variance in
register helps to take Tumbo in easily, and ends up trusting Jasper with playwriting task without ever a
hint of suspicion. To him he is just doing a favour to a close relation of his friend Regina.
Mode
This refers to channel or medium of communication that is whether spoken, written to signed The play
write uses the play dialogue to present his ideas. The channels is therefore the written medium although it
is conversational, evidenced by Short choppy clippy sentences Contractions Informal Sayings and that
are characteristics of spoken languages and Less unfamiliar terms for instance, Mosese vs. Jere:
You came with books?
Only one book.
A novel?
No.
A play
Jusper vs. Regina:
Jusper!
Madam.
The gown!
He has?

Proceedings of the Third International Research Conference held on 26th to 28th October, 2016 378
He has.
The fact the mode of communication is conversational allows for such clippy choppy statements. This
would have been totally different had medium of rendition been written parse.
CONCLUSION
This paper achieves the major aim of the study which is to look into the linguistic aspects in the play and
their relevance to the meaning intended by the author. In the lexical category proper nouns have been
used to help the reader learn the name of the characters and some names have been used allegorically to
enhance themes like corruption and greed. So many adjectives have also used to make ideas vivid and
also describe the characters. Adverbs also enhance the main message of the text. The author has used
various types of sentences in the play. These include simple sentences, compound sentences, complex
sentences and compound complex. All these are playing various roles. Simple sentences enhance clarity.
Longer sentences combine ideas in a single utterance. The context plays an integral role in the nature of
participants and their relationships with each other, which has a bearing on the thematic concerns raised
by the author.
RECOMMENDATIONS This study is not an exhaustive one. It recommends that more linguistic stylistic analyses could be done
with major focus on the play genre.
Future research could also focus on other areas of linguistic stylistic analysis such as the lexico-semantic
analysis of this particular play.
Focus could also be directed on phono-graphological analysis of poems, areas that are of concern to
linguistic stylistic analysis.
REFERENCES
Ayeomoni, N. (2003). “The Role of Stylistics in Literary Studies”. In Oyeleye, L. and Olateju, M. (eds.)
Readings in Language and Literature. Ile-Ife: OAU Press Ltd.
Azuike, M.N. (1992). ‘Style: Theories and Practical Application.’ In Language Science Vol. 14 109
– 127.
Carter, R. (1982). (ed),Language and Literature: An Introductory Reader in Stylistics. London: Unwin
Hyman.
Crystal, D and Davy, D. (1969). Investigating English Style. London: Longman.
Enkvist, N.E. (1973). Linguistic Stylistics. The Hague: Mouton Press.
Fish, S.E. (1981). ‘What is Stylistics and Why are they Saying such Terrible Things about it?’In Essa in
Modern Stylistics. D.C. Freeman, ed. London: Methuen.
Freeman, D. C. (ed) (1970). Linguistics and Literary Style. New York: Holt Rinehart and Winston.
Halliday, M. A. K. (1971). “Linguistic Function and Literary Style: An Inquiry into the Language
of William Golding’s The Inheritors”, in S Chatman. New York: Oxford
University Press.
Leech, G. and Short, M. (1981). Style in Fiction: An Introduction to English Fictional Prose, New York:
Longman Group Ltd.
Leech, G. and Short, M. (2007). Style in Fiction: A Linguistic Introduction to English Fictional Prose
2Nd
ed .Harlow: Pearson Education Limited.
Matthiessen,C., and Halliday, M. (1997). Systemic Functional Grammar: A first step into the theory.
London: Penguin
Missikova, G. (2003) Linguistic Stylistics. Nitra: Univerzita Konstantina Filozofa.
Nnadi, C. I. (2010). A linguistic stylistic analysis of Chukwuemeka Ike’s Novels. university of Jos
Nigeria.
O’Donnell, M. (2011) UAM Corpus Tool, Version 2.7. Università Autonoma, Madrid.
95/ 103 ******

Proceedings of the Third International Research Conference held on 26th to 28th October, 2016 379
LOCATING SUSTAINABLE DEVELOPMENT IN AFRICA: DISCOURSES ON EKEGUSII
AND LUBUKUSU PROVERBS IN KENYA
Opande, N.I. and Barasa, M. Kisii University, P. O. Box 408-40200, Kisii, Kenya,
Correspondence: [email protected], +254 721 523 009; and [email protected], +254 722 606 101.
ABSTRACT
This paper seeks to explore the pertinence of cultural knowledge as an indispensable tool for sustainable
development and the attainment of the millennium goals. The formally schooled populace is seen to lay a
lot of emphasis on information technology and globalization as they ignore and neglect culture and
informal education; this has resulted to a total mismatch in the cultural and socio-economic orientation of
the citizenry consequently leading to loss of identification of self and the inability to effectively focus on
the attainment of sustainable development and the millennium goals. The study analysed the EkeGusii
and LuBukusu teaching on self-reliance and development; investigated the extent to which cultural
knowledge is a useful tool in presenting the development agenda and pursuance of the sustainable
development goals, and discussed the success of integration of cultural knowledge and modern
information technology and innovation in attaining the millennium development goals. Ethnography was
used to sample and analyse from EkeGusii and LuBukusu a total of thirty proverbs that emphasise on the
value of hard work and sustainability. The data was analysed basing on the tenets of the Cultural Literacy
theory and Critical Discourse Analysis. Emphasis of cultural knowledge among Africans was realised to
be a vital component in propelling self-reliance, realisation of sustainable development and achievement
of the millennium goals. It concluded that there is need to integrate indigenous knowledge with
information technology and modern knowledge to enable faster realisation of self-reliance, sustainable
development and the achievement of the millennium goals.
Keywords: Culture, Cultural Knowledge, Socio-economic
INTRODUCTION
As the world is works towards sustainable development, it has persistently advocated for modern
education which is largely formal. Such persistence has however overlooked and ignored the role of
informal education and the value of culture in pushing the development agenda. The problem with such
advocacies is that most people especially in Africa have been left in a balance and are not able to actively
participate in developmental activities. Hirsch (1987:12) presents a rationale that "The civic importance
of cultural literacy lies in the fact that true enfranchisement depends upon knowledge, knowledge upon
literacy, and literacy upon cultural literacy". This paper argues that it is this cultural literacy that will
enhance development. This again is in line with Hirsch (1987) who postulates that cultural homogeneity
is absolutely necessary for the development and expansion of the economy. Culture is a fundamental
component of our wellbeing and is the paramount factor in providing the sense of who we are.
Culture is an indispensable element in every society. Although it occurs that in our modern society culture
occupies a disregarded index in human development, the truth is that cultural factors have a great impact
in a peoples’ behaviour, their values, lifestyles and their orientation towards sustainable development.
Ademowo and Balogun, (2014) posit that if culture is unquestionably very instrumental in development.
They further argue that language carries culture and that the two are inseparable. According to Sapir
(1963) language does not exist independent of culture; it is part of culture as well as a vehicle for the
expression of culture. Sapir (1963); Ayer (1969); Wallnock, (1969); Engholm (1994); and Ogunsiji
(2001) concur language is utilitarian in the achievement of development. Proverbs being a metaphorical
use of language and in essence language cannot in any way be overlooked in discourses of development.
Wallnork (1969:12) enumerates the uses of language as being used for phatic communion i.e as a social
regulator, an instrument of action, convey order and information, to influence people, to enable self-
expression, and embody and enable thought. This being the case, it is evident that development can never
be experienced in any human society if such a society lacks effective, explorative use of and development
of its language. Although language is an important tool in fostering development, we agree with Ogunsiji
(2001:165-189) that no other language can effectively displace one’s mother tongue. Ones mother tongue

Proceedings of the Third International Research Conference held on 26th to 28th October, 2016 380
is their signature and a means of defining themselves. As much as lingua franca is important it cannot
fully replace ones mother tongue in their defining of self. This study argues that one’s mother tongue and
especially the proverbs in such mother tongues can and will play an undisputable function in crusading
for the sustainable development agenda. In any case it is an all true fact that countries like China have had
her development culture driven through their language-Chinese, and have been able to attain development
feat with the deliberate and concerted help of developing her indigenous culture, tradition and language.
Wilhelm, (1963) asserts that, culture function as a catalyst for development in these distinct ways: first,
as a means of creating order, second, as an instrument of the achievement of social integration, third, to
make events in human experience intelligible and significant and as a regulator of change. This assertion
is also held by Ademowo and Balogun (2014) who postulate that culture and language are so intertwined
in such a way that the death of language automatically marks the death of a culture that such language
carried. Culture is a prismatic paradigm for development, with the exclusive manner in which the
indigenous language are being played down for the exclusivist employment of foreign languages, culture
and value system, it is appropriate to conclude that there is a need for a radical revival of the indigenous
language and its strong metaphorical uses which include proverbs, which are supposedly endowed with
the survival instinct and value of the people.
This is in line with the assertion held by Olubunmi (2010:16) that, proverbs essentially emphasized the
values of good conduct, respect for elders, warning and advice, cordiality and cooperation for peaceful
co-existence which are hallmark of ingredient for development. It is the background that forms the basis
of this paper’s argument that we can never succeed in ardently pushing for sustainable development
without fully engaging language and using it, especially its metaphorical form, as an instrument in the
advocacy for development.
The Nature and Value of Proverbs
Proverbs are the simple truths of life that contain the ethical, moral values of a society (Taylor, 2003).
Aside the aesthetic and figurative value in proverbs, it presents a graphic statement that expresses a truth
of experience. Yusuf (1997:120) asserts that, the truth presented in the proverbs is not logical, a priori or
intuitive truth but it is often an empirical fact based upon and derived from the people’s experience of life,
human relationship and interaction with the world of nature. Some scholars define traditional proverbs the
prismatic verbal expression of the essence of folk culture’’ (Nicolaisen, 1994; Shimkin and Sanjuan,
1953; Taylor, 1981; Oladeji, 1988 and Yusuf, 1996). Proverbs have also been defined as pithy, traditional
statements used to further some social end (Seitel, 1981; Egbemogbe, 1980; Meider, 1989).
According to (Adeyemi, 2005), proverbs are a very powerful and effective instrument for the transmission
of culture, philosophy, social morality and values and the sensibility of the people. Proverbs are also seen
as models of compressed or forceful language that make people behave according to norms and morals of
the land (Ademowo and Balogun, 2014). As is held by Fasiku, (2006:25), it is true that proverbs evolved
with the growth and development of the society. Proverbs reflect diverse aspects of a people’s culture
encapsulate the worldview of a people they serve as a means of arousing, defining, manifesting and
establishing the expectations, aspirations and consciousness of a people. Proverbs serve as a linguistic
confirmation of the totality of a people’s worldview and the epistemic cognition of this worldview.
Theoretical Framework
One of the theories that this study was based on is the Cultural Literacy Theory (CLT) which was
propagated by E.D. Hirsch. Hirsch roots his claims on the schema theory which lays a picture of how
people organize the amount of background knowledge which they accumulate about the world. CLT
postulates that for one to be regarded as culturally literate they have to possess the ability to understand
and participate fluently in a given culture. They have to know a given culture’s signs and symbols,
including its language, particular dialectic, stories, entertainment, idioms, idiosyncrasies, and so on. CLT
holds that children of a given culture typically become culturally literate there via the process of
enculturation which seems to occur naturally, being intertwined with education, play, family
relationships, etc. According to CLT, Literacy of a given culture seems to arise over time with consistent

Proceedings of the Third International Research Conference held on 26th to 28th October, 2016 381
exposure to and participation in that culture, especially certain key cultural strongholds like business,
story, arts, education, history, religion, and family (Hiebert, 1991)
According to this theory people are able to understand development and fully participate in development
activities depending on the background knowledge they are oriented in and profess. Further, CLT holds
that we can only crusade for development efficiently when we understand the cultures people live in. We
can understand their culture by understanding their language and especially their proverbs. CLT posits
that modern industrial nations depend upon the development of homogeneous national cultures. This
being the case therefore this paper argues that developing nations also need to hold firm to their cultures
as a means of fostering development. As is held by the proponents of CLT, education has fallen victim to
romantic formalism and misguided pluralism, which has led to a diluted school curriculum and
consequent cultural fragmentation. This has incapacitated the achievement of desired development.
Cultural literacy, as advanced by its major proponents, is a particular view of the construction and
generation of knowledge, the role of culture in that process, and the role of education in modern industrial
society. In spite of references to research on reading, cultural literacy is not an intellectual ability akin to
reading literacy. Cultural Awareness is the foundation of communication and it involves the ability of
standing back from ourselves and becoming aware of our cultural values, beliefs and perceptions. Why do
we do things in that way? How do we see the world? Why do we react in that particular way? Only when
this is done can sustainable development be fully realised. The study also uses tenets of the Critical
Discourse Analysis Theory (CDA) to critically examine the proverbs as a semiotic system of signification
grounded within an African social cultural milieu
METHODOLOGY
To collect the relevant data for the study interviews were used. A total of thirty four (34) proverbs
EkeGusii and LuBukusu proverbs were collected and analysed. Particularly, the proverbs whose subject
matter is centred on development-related themes such as hard work, the importance of acquiring skills,
etc were collected and analysed. Interview was carried out with selected community elders who were
recommended by the local community on the bases of their deep knowledge of the socio-cultural context
and oral tradition of the society. Furthermore, most of the interviews held with the key informants were
recorded using tape-recorder. Likewise, proverbs were also collected via document analysis.
RESULTS AND DISCUSSION
This study found out that proverbs in EkeGusii and LuBukusu languages are essential as a means for
enhancing sustainable development. They accomplished important roles that are development geared.
Proverbs as Social Regulators and an Instrument for Achievement Social Integration This study found out that proverbs if used properly can regulate members of the society and can enhance
social integration. This is evident in the following examples:
1. Eeri tiyana kwana marara EkeGusii. (A bull does not bellow while lying down)
2. Eyisakulila ebocha –Bukusu (The hen that scratches the ground finds something to eat)
The discursive import of proverbs 1 and 2 is that everyone who wants to succeed in something must stand
and take up the task. Development can never be attained until members of the society rise to the occasion
of working for it.
3. Genda ase getinge omere otari kenyambi EkeGusii proverb (Go to your marriage home, grow well,
don’t be a weed)
4. Omukhasi omukara embako yewefwe. Bukusu. (A lazy woman says: “If only I had a hoe from my
home”).
This proverb discursively implies that the AbaGusii and Bukusu value industry and harmony. Young
ladies are advised that as they get to their marriage homes they should be industrious in order to
sustainably develop themselves.
5. Baba tarera mogondo na nguru ngesera ibu EkeGusii proverb. (Let mother not dig alone when her
strength (children) are warming themselves at the fireplace).

Proceedings of the Third International Research Conference held on 26th to 28th October, 2016 382
6. Umusoleli omulayi ekofia ya rarawe. LuBukusu (A good boy is the honour of the father).
The proverbs caution young people against laziness. The proverbs aim at building their social
responsibility and to enable them live well in their societies. Young people are encouraged to help their
parents in carrying out different chores and works. It is therefore clear that the AbaGusii encourage each
member of the society regardless of their age to work hence building in them development consciousness.
7. Entakana ebe nguru tenakwerera, ebe nguru buna nyeke EkeGusii proverb (An orphan should have
strength like a seedling he should not sit there sympathizing with himself or herself).
8. Endubi eyo muleme ekhila owafwa. Bukusu Proverb. (The basket of a lame person is better than a dead
person).
9. Etari na kemincha etirerie keene EkeGusii proverb. (Let the tailless cow play with its stump
/disability is not inability)
10. Mogani kia omwabo okwa motaka EkeGusii proverb. (One who depends on his kinsman dies
poor).
11. Getiro nke mogondo, ko moserengeti ore eero EkeGusii proverb (He that encounters a hill at the
farm, leads a conversation in the living room)
12. Nisio omukhasi afuna sosislia mumulembe tawe. Bukusu proverb (What a woman has earned, you
will not eat it in peace.).
13. Mogisangi Siberia ong’e toa monto okobayabaya EkeGusii proverb (Sip and pass it to, me my age
mate. Don’t give the lazy one who wanders aimlessly)
Proverb 7, 8 and 9 emphasise on the importance of each member of the society participating in
development activities. The orphans and those enabled differently should work hard in order to develop
the society. It was believed that disability was not inability. They were encouraged to have constructive
thinking on how they would positively contribute to the development of their societies.
In proverb 9, lazy people in the society are mocked. The AbaGusii and Bukusu are seen as people who
value hard work and as depicted in this proverb the lazy people are disregarded and never allowed to
participate in enjoying what other members of the society have worked for. This is also evident as evinced
in proverb 10, 11 and 12. More so, dependency and laziness are highly discouraged among the AbaGusii
and Bukusu societies. The discursive implication of proverbs 7-13 is that laziness is a vice and therefore,
it should be discouraged. Each member of the society is encouraged to participate fully in the
development of the society.
Proverbs as Instruments for Spurring Action
14. Bosaga mborura, enchara mbobe ekorura genda mogondo EkeGusii proverb
(The morning cold bites, but hunger bites harder so go to work)
15. Kiage kiaora, moremi ogokonga mogondo EkeGusii proverb. (A yawning (empty) granary is a
farmer doing nothing but just starving at the farm.)
16. Enjofu yabwayiaya sekhusia musanga. Bukusu Proverb (A woman who prostitutes around never
brings up a family).
17. Siomutakha sibola bamwata. Bukusu proverb. (That which belongs to a mean person gets spoilt
and is thrown away).
These proverbs are intended at spurring members of the society to action. The proverbs caution people
against laziness and selfishness. Instead, hard work and sharing is encouraged.
Proverbs as Creators of Order and Conveyers of Information
17. Mosomba n’onguru EkeGusii proverb. (A servant is one that has strength)
18. Omusani wa lebe khulia- Bukusu proverb. (A strong young man is one who feeds well).
19. Omwana wesecha kamani mukhumbo. Bukusu Proverb. (A man is recognized by the strength in his
hands).
20. Enula yama bwana. Bukusu proverb. (A good end starts from a good beginning).
The discursive implication of proverbs is that strength and good health are a precursor to sustainable
development.

Proceedings of the Third International Research Conference held on 26th to 28th October, 2016 383
Proverbs as Instruments for Influencing People and as Regulators of Change
21. Chinguru n’amakonde akoria EkeGusii proverb. (Strength is eaten by worms)
22. Nanda kambilwa akona khumwanda kwenjoli. Bukusu proverb. (The one who did not listen regretted
later).
These proverbs aim at influencing peoples’ behaviour in a manner that would enhance development of a
society. People with undesirable mannerisms are being influenced to have a paradigm shift in their
behaviour in order to contribute positively to developmental activities in the society. People are also
encouraged to seek for knowledge from other people.
Proverbs as Means of Embodying and Enabling Thought.
23. Otari kerenga chimbero nchiarare koora kiige kia mwana EkeGusii proverb. (He who has no goal
is like a small child trying to do work only adults can do).
24. Omwana wesecha sikoloncho silinda ekunda. Bukusu proverb (A man is the custodian of the land).
It was believed that setting of goals would enable people to work hard and hence be prosperous.
Especially men were charged with the responsibility of planning for the future of the society. Those
without goals were regarded as children and were therefore treated with disrespect.
Proverbs as Elements Enhancing Character Soundness/Uprightness to Personal and Social
Development 25. Chiakumeire Moraa O’Kiage, akama ng’ombe akama na mbori EkeGusii proverb. (Fame has
come to Moraa, daughter of Kiage, who milks both cows and goats).
26. Namunyu kalia owamkisa Bukusu proverb. (The hyena ate the one who hid him)
Proverb 25 signals acquisition of status. People earn fame and social status through their hard work.
Members of the society were therefore encouraged to work and avoid shortcuts to riches. The discursive
import of proverb 26 is that people should refrain from behaviours that are undesirable such as greed and
corruption. This is because such vices are retrogressive and drag development efforts.
27. Ona gesire tana koborwa nko EkeGusii proverb (One who has an axe never lacks firewood)
28. Ore na gesero tana koborwa boraro EkeGusii proverb (Whoever has a sleeping hide will never
lack a place to sleep).
29. Nare komenya ndore bigori chiyana (chinsingo) nchiborwa moenori otari mosunte EkeGusii
proverb. (If I live longer I could be an advisor, so that people cannot lack enlightenment)
30. Mukenda mbola kola ebunyolo. Bukusu proverb. (The one who walked slowly reached Luo land)
It was believed among the AbaGusii that Knowledge and skills were extremely vital in enhancing
sustainable development. Knowledge and skills were seen as axes that would enable one get firewood
hence be able to cook their food. The importance of knowledge and skills are likened to sleeping hides in
proverb 28. Sustainable development can only be achieved when people have the necessary skills.
Further, the aged were supposed to educate the young on ways of developing themselves and their
societies at large (see proverb 29). However, in order for the young to learn the necessary skills for
development, patience is a requirement 9 Proverb 30). Note that Bukusu land and Luo land are worlds
apart. Therefore patience is required for anyone to walk from either of the region to the other.
Proverbs as a Means for Advocating for Investment and Innovation
31. Ngende emo yaibora igana EkeGusii proverb. (One bean gives birth to a hundred beans)
32. Nosia bonuke mboanda bogokuma EkeGusii proverb. (It is alright to grind refined flour, but what
will matter is how full it will make our stomachs)
33. Otamba tamba okhafwa. Bukusu proverb. (The poor do not die easily)
34. Olia sikekhe okhasimbwa. Bukusu proverb. (Eat little so that you do not overfeed)
The importance of investing and being innovative is emphasised. Investment is the only guarantee for a
better tomorrow. Based on this, people should not encourage poverty by thinking that they would die
soon and thus there is no future for them (proverb 33). More so, people should avoid wastage of resources
(proverb 34) for sustainable development.

Proceedings of the Third International Research Conference held on 26th to 28th October, 2016 384
CONCLUSION
Africa’s inability to wholesomely embrace western education and culture and the enforcement of western
values on the African people has immensely contributed to rendering Africa’s developmental quest a
futile exercise. This is because there is no continent that can develop without its cultural values. Africa
therefore urgently needs to rejuvenate its cultural elements that would enhance development, if it has
desires for not being regarded as a dark continent. This study concludes that proverbs inculcate social
values that are essential for people centred sustainable development and that enable and drive
development. The study advocates that our culture should be taught to our people and that we should
always strive to make culture work for the purpose of development. There is great need for us to invest in
conserving our culture and especially our proverbs as they are effective factors that enhance sustainable
development. Furthermore, this study concludes that we should endeavour to practically integrate culture
into the international development policies if sustainable development has to be attained. It recommends
that advocacies of sustainable development should entrench the pedagogical aspects of proverbs in the
day-today activities of young and old Africans as a means to fostering self driven sustainable
development in our societies.
ACKNOWLEDGMENTS
We are grateful to the following for supplying us with an insight in to the proverbs used in this paper and
also the proverbs in their native forms and the cultural meanings. i) Mr. Raymond Makhanu Barasa Elder,
Bukusu Ethnic group, Kimalewa Location, Bungoma County, Kenya. ii) Ms. Flora Gweyani Obagum
Woman Elder, Bukusu Ethnic Group, Namawanga village, Bungoma County. iii) Ms. Teresia Nyakerairo
Nyabwobi, Woman Elder, Gusii Ethnic group, Nyamusi Village, Nyamira County. iv) Mr. Christopher
Okemwa Elder, Gusii Ethnic Group, Kisii County, v) Josephine Kerubo, Women Elder, Gusii Ethnic
Group, Nyosia Village
REFERENCES
Adeyemi Johnson Ademowo and Noah Opeyemi Balogun, (2014). Antropologija 14, sv. 2
Ayer, A. J. 1969. Language, Truth and Logic. London: Heinemann.
Ayo, Ogunsiji. 2001. Utilitarian Dimension of Language in Nigeria, In: Herbert Igboanusi (ed.) Language
Attitude and Language Conflict in West Africa. Enicrownfit Publishers.
Egblewogbe, Eustace Yawo. 1980. The Structure and Functions of Proverbs in African Societies. Social
Education 44(6): 516-518.
Gbenga, Fasiku. 2006. Yoruba Proverbs, Names and National Consciousness. Journal of Pan African
Studies 1(4): 50-63.
Hiebert, H. Elfrieda. 1991. (ed.) Literacy for a Diverse Society: Perspectives, Practices, and Policies. New
York: Teachers College Press,
Hirsch, E. D., Jr. 1987. Cultural literacy: What every American needs to know. New York: Houghton-
Mifflin.
Meider, Wolfang. 1989. American Proverb. As study of Texts and Context. New York. Peter Lang
Nicolaisen, WFH. 1994. The Proverbial Scot. Proverbium ii: 197-206 Obasanjo, O. 1993. Keynote
Address at conference of The Leadership Forum, Nairobi, Kenya: March 10-12.
Oladeji, Niyi. 1998. Proverbs as Language Sign-Posts in Yoruba Pragmatic Ethics. Second Order: An
African Journal of Philosophy 1(2): 45-52.
Olubunmi A. Idowu. 2010. An Ethno-methodology of Selected Yoruba Proverbs. International Journal of
Arts and Science. 3(10): 43-231.
Sapir, Edward. 1963. An Introduction to the Study of Speech. London. Repeat Hart. Dans.
Shimkin D.P. and Sanjuan Pedro. 1953. “Culture and World View: A method of Analysis Applied to
Rural Russia. In American Anthropologist, 55, no. 3: 329-348. American Anthropological
Association.
Taylor, Acher. 2003. The Proverb, Proverbs and their Lessons; In Wolfang Meider (ed.) Supplement
Series of Proverbium 13. Vermont: University of Vermont.
Wallnock, J. 1969. Language and Linguistics. London: Heinemann. ******

Proceedings of the Third International Research Conference held on 26th to 28th October, 2016 385
CLASSROOM DISCOURSE IN A MULTILINGUAL CONTEXT: THE CASE OF SELECTED
PRIMARY SCHOOLS IN CHUKA DIVISION, THARAKA-NITHI COUNTY, KENYA
Mbaka, N.W.
Chuka University, P. O. Box 109-60400, Chuka
E-mail: [email protected], Tel.: 0727227664
ABSTRACT
The sociolinguistic situation in Kenya is triglossic in nature (Schmied, 2012) English is at the top of the
rank as the official language. Kiswahili has been in the middle as the co-official and national language. It
is also used as the country’s lingua franca. The indigenous languages are at the base of the hierarchy. In
such a multilingual setting, code-mixing and code-switching are inevitable. It has not been established
how teachers in lower primary utilise the repertoire of languages at their disposal: thus the need for this
study. This paper evaluated whether the language-in-education policy is implemented in the classroom. It
was a case study carried out in Chuka Division, Tharaka-Nithi County, Kenya. Data was collected using
participant observation. The paper establishes that teachers mainly use code-mixing in the classroom and
also in official domains. The findings contribute to scholarly literature in Sociolinguistics and should
benefit curriculum developers.
Keywords: Language of Instruction (LOI), mother tongue (MT), Policy Implementation, Language–in–
Education Policy, Code-switching, Code-mixing.
INTRODUCTION
English has been Kenya’s official language since independence. In the language in education policy
(LiEP) English is not only one of the most important subjects in the curriculum but it is the medium of
instruction from upper primary to university level. In some urban schools, it is used as a medium of
instruction from lower primary. English has received positive status and good corpus planning in Kenya.
Its place in the education system has always been clear. It is highly regarded by a large portion of the
Kenyan populace. Kenyans see a lot of advantages in knowing English. Its advantages include access to
the large body of knowledge found in English and the opportunities for employment that it presents.
Others include communication with a wider population, significant role in higher education, national
appeal and richness as a modern language and as a motivating force in education (Muthwii, 2002).
As Kenya’s national language, Kiswahili plays an integrative and unifying role among Kenyans. In urban
areas it is spoken as a first language in some families. It is taught as a compulsory and examinable subject
at both primary and secondary levels. It is taught as a subject in all local Universities It is used as a lingua
franca in the country, facilitating communication among the different ethnic groups (Chimera, 1998).
When the new constitution was promulgated on 27th August 2010, Kiswahili was given a new status as an
official language in the national language policy statement. It shares this function with English and still
remains the country’s national language.
Whiteley (1974) writes that there are over 30 distinct languages and dialect clusters spoken in Kenya.
They can be roughly divided into four groups: Bantu, Nilotic and Para-Nilotic, Cushitic and languages
from the Indian sub- continent. This abstract is based on the 1989 census. This is a fact that has
significantly affected policies regarding the use of MTs as media of instruction. According to Paul (2009)
there are about 69 indigenous languages in Kenya. Apart from Kiswahili, about 16 of these languages are
used as languages of instruction in lower primary (Musau, 2004). According to the LiEP, they are
supposed to be used as LOI in lower primary school in areas that are not urban. It is expected that people
in a catchment area where a common language is spoken can use it as an LOI.
Kenya’s language policy has been documented in various education commissions and reports and in the
KANU statement issued in 1974 (Gorman, 1974). The current language policy is based on the
recommendations by the Gachathi Report (1976) as they were adopted by the Mackay Commission
(1981). The report recommends that in lower primary English or Kiswahili should be used as Language of
Instruction (LOI) in urban schools and MT in rural schools. English is recommended as LOI in all schools
Proceedings of the Third International Research Conference held on 26th to 28th October, 2016 386
in upper primary. Given the sociolinguistic situation mentioned above, this study sought to investigate
whether teachers implement the policy in actual classroom teaching.
This study was guided by the following specific objectives: To identify features of teacher- pupil
discourse in a multilingual classroom context; To evaluate the implementation of the Language -in-
Education Policy in lower primary schools in Chuka division
LITERATURE REVIEW
The review of literature gives and shows the place of mother tongue, English and Kiswahili in the
education system in Kenya.
Mother Tongue in Education in Kenya
According to Gorman (1970), during the period when Kenya was a British protectorate (1895-1920), the
obligation to provide educational facilities was assumed almost entirely by missionary orders. The United
Missionary Conference (1909), the Phelps –Strokes Commission (1924) and “The Memorandum on the
place of the vernacular in Native Education” (1927), all recommended the use of MT as the first medium
of instruction for the first four years of school life.
The support for the use of MT continued under colonial rule. The inter-territorial language committee
(1930) and the Beecher Report (1949) all recommended the use of MT in early education. This changed
in the 1950’s and 60’s when according to Sifuna (1980), there was a growing dissatisfaction in Kenya
about the poor performance of African and Asian children in national examinations. This led to the
educational revolution referred to as the New Primary Approach (NPA) which led to the introduction of
English as LOI from standard one (P1).
After Kenya became independent, the Minister for Education appointed a commission under the
chairmanship of S.H. Ominde (1964). The recommendations of this commission entrenched the use of
English as LOI from PI. The commission assigned MT no role. This changed when Gachathi Report
(1976) recommended the use of MT in the first three years of education. These recommendations of 1976
were reinforced by the Koech Report (1999).
The goodwill towards the use of MT in education in Kenya is in line with UNESCO’s declaration whose
report was published in 1953 (Bamgbose, 1976). The UNESCO report recommended that pupils should
begin their schooling through the medium of mother tongue and that the use of mother tongue should be
extended to as late a stage in education as possible. This was re-echoed in 1972 in a UNESCO conference
which went further to state that teaching at least initial literacy in mother tongue is advisable even in
situations where the scanty number of speakers appears not to warrant the large scale production of
educational materials.
There is worldwide support for the use of mother tongue in the early years of education. There are
psychological and pedagogical reasons for this support. Brown (1976) notes that mother tongue
acquisition begins early in life. Its importance in the development of the child’s intellect and other aspects
of his personality in early education must be profound. The slightest disturbance of this vital role by a
second language may produce lasting and unhappy effects. This can hamper a child’s intellectual
development. Sudden exposure to a second language can cause blockage in the Study development of
concept formation. This can produce emotional and psychological insecurity.
The use of MT ensures that an all-round education is provided to pupils whereby language, culture and
education are intertwined. The indigenous languages of a people should be an important major source of
material for educating children to identify with their roots and respect their heritage. Mother tongue is
also important because it is the language used in early childhood for informal education (Bambgose,
1976). As children observe the techniques and skills as well as the habits of their elders and parents,
systematic instruction in the local language is given. Stories, songs, myths, legends and dancing spread

Proceedings of the Third International Research Conference held on 26th to 28th October, 2016 387
instruction. All are combined to stimulate children’s emotions, quicken their perception and guide them as
they explore, exploit and interpret their natural environment.
The use of MT has been hampered by a myriad of problems. These include lack of materials, and trained
teachers (Gorman, 1974). The other problem in using mother tongue is that there is also a contradiction
between the policy of encouraging MT as LOI and the reality as the child progresses through the
education system where English completely dominates over other languages (Muthwii, 2002). Many of
them lack standardized orthographies and adequate literacy materials for use in the language classroom
(Muthwii and Kioko, 2004). A negative attitude towards these languages is another major hindrance to
the implementation of linguistic justice (Musau, 2004).The genesis of this negative attitude was during
the colonial period and it has been perpetuated through the language in education policies adopted after
independence that did not recognize and promote all languages. In many schools, there is a school rule
that forbids students to speak their mother tongues. Even after school people believe that complex
academic issues cannot be transmitted using indigenous languages (Muthwii and Kioko, 2004).
MT fulfils certain basic referential functions which no foreign language can effectively approximate.
These are communicative, expressive, unifying and participatory functions (Okonkwo, 1978). Despite
these advantages, Bogonko (1992) and Mbaabu (1992) state the impracticability of using MT beyond
elementary education. They note that there would be obvious difficulties of co-ordination, it would
jeopardize national unity, it would promote tribalism and there would be difficulties of communication
amongst heterogeneous groups.
The use of MT in education has been hampered by poor corpus planning so that it is difficult to use it
even in the elementary level of education. The macro-implementation decisions mentioned in 2.1 have
been lacking as far as MT is concerned thus hindering full implementation of the language policy. Lately,
MT has received positive support from the theatre (Mutunga, Daily Nation, 30). There has also been an
increase in radio broadcasts in vernacular languages – an indication that Kenyans value these languages.
Kiswahili in Education in Kenya
According to Palome (1967), Kiswahili is a language of Bantu origin. Kiswahili sources place the origin
of the language earlier than 500 A.D. (Mazrui, 1995; Chimerah, 1998). The bulk of evidence would seem
to suggest that the language remained overwhelmingly a coastal phenomenon until two hundred years
ago. It was not until Seyyid Said Bin Sultan established full residence in Zanzibar in 1832 and
consolidated the Al Busaidy Sultanate on the Islands that trade with the interior of the continent
developed more substantially. The momentum of this trade was also a momentum of Kiswahili spread.
Mbaabu (1992), notes that Kiswahili is now an international language. It is the national language of
Kenya. It is also the national and official language of Tanzania and the second official language in
Uganda. It is spoken in other African countries such as Zaire, Rwanda, Burundi, Zambia, Mozambique,
Somalia and Seychelles. As Kenya’s national language, Kiswahili is the language of inter-ethnic
communication used by Kenyans irrespective of their educational background. The entry of Kiswahili
into the mainstream of formal education in East Africa (E.A.), on any significant scale, did not come until
European countries colonized this region, and missionaries infiltrated African societies. According to
Gorman (1974), some of the larger missionary orders established stations along the coast. Among their
members were a number of noted scholars of Kiswahili. Such missionaries as Bishop Steere, the
Reverend Krapf and Father Sacleux made a systematic Study of the language and enthusiastically
advocated its use for purposes of missionary activity. The colonial language policy in East Africa was in
favour of Kiswahili. The directors of Education in East and Central Africa met in Dar-es-salaam in 1929
and recommended the establishment of an inter-territorial language committee whose concern was to be
Kiswahili language research and standardization of orthographies. The committee was formed in 1930.
Soon after, government officials, educationists and missionaries accorded Kiswahili total support
(Mbaabu, 1992). The formation of the committee gave Kiswahili a firm base which enabled it to survive
the change of policy after the Second World War.

Proceedings of the Third International Research Conference held on 26th to 28th October, 2016 388
In the period between 1945 and 1963, there was less support for Kiswahili (Mbaabu, 1992). The colonial
government noted the unifying role that Kiswahili played among East African Soldiers. As a result, the
Beecher Report (1942) recommended that emphasis be placed on the teaching of vernacular and English
takes the place of Kiswahili as the colony’s lingua franca (Gorman, 1974). This was supported by the
Departmental Reports of 1950 and 1951 (Sifuna, 1975). The result was that Kiswahili was used less
widely as the medium of instruction in lower classes except in areas where it was a vernacular. Kiswahili
continued as a second language in secondary school but it was non-examinable (Mbaabu, 1992).
The various education commissions set up after independence have shaped the language policy. The
Ominde Commission (1964), recommended that Kiswahili be taught as a compulsory subject, the training
of Kiswahili teachers during school holidays and the establishment of the Department of Kiswahili at
University of Nairobi. Since Kiswahili was not examinable, time allocated to it was used to teach other
subjects. The other two recommendations were not implemented.
The Gachathi Report (1976) recommended that Kiswahili be introduced as an examinable subject and be
made compulsory in standard three or when English starts being used as a medium of instruction. These
recommendations were implemented together with the 8-4-4 system of education recommended by the
Mackay Report (1981). The Mackay Report also recommended that Kiswahili be made a compulsory
subject in the second university. Following the implementation of the Mackay report, Kiswahili became a
compulsory subject in both primary and secondary levels. It was also examinable at both levels. This gave
Kiswahili a big boost. In Kenyatta University, the number of students studying Kiswahili increased from
6 in 1976, to 420 in 1988 (Mbaabu, 1992). In the university and tertiary institutions intake, Kiswahili can
substitute English in cases where a student has done better in Kiswahili than in English. It was accorded
the extra function of co-official language in addition to its earlier function as a national language in the
new Kenyan constitution.
Welime (1970) mentions some of the problems that teachers of Kiswahili faced soon after independence.
These were lack of teachers, lack of motivation among students, lack of a well thought out syllabus and
shortage of suitable textbooks especially at the secondary level of education. Lack of full implementation
of the language policy at various times has negatively affected the use of Kiswahili in Education in
Kenya. Mbaabu (1992) and Bogonko (1992) recommend the use of Kiswahili other than MT in education
in Kenya. The worry about whether Kiswahili has the vocabulary to be used as a medium of instruction
especially in higher levels of education should not bother educationists. Kiswahili can develop vocabulary
in all areas as has already been done in mathematics and science in Tanzania.
English in Education in Kenya
According to Gorman (1974), on the whole, the missionaries supported the use of the vernacular medium
in the early stages of education and then the introduction of the English medium from upper primary.
Although some of the missionaries supported the use of Kiswahili and recognized it as an East African
Lingua Franca, there are those who saw the spirit of Islamization in it and avoided it all together. During
the colonial era, the government was run on the basis of racial segregation. This was reflected even in the
education system. Only English was used in schools meant for Whites. Asian schools used an appropriate
Indian language in lower primary and MT or Kiswahili was used in African schools in elementary
schooling. According to Sifuna (1975), there was poor performance by African and Asian children in
examinations in 1957. The Ministry of Education created a special centre as an offshoot of the
Inspectorate to investigate and experiment on the matter. This led to the introduction of the English
medium in Asian schools in 1957 and was later extended to African schools in 1961. This was done under
the NPA programme.
After independence, the NPA was given impetus by the Ominde Commission (1964) which
recommended the use of English medium right from P1 citing various reasons for doing so. For close to
two decades, English remained the privileged medium of instruction throughout the education system.
The inclusion of Kiswahili as a compulsory and examinable subject took place as a result of the
implementation of recommendations by the Mackay Report (1981). The Koech Report (1999) did not

Proceedings of the Third International Research Conference held on 26th to 28th October, 2016 389
bring in anything new as far as the language policy is concerned. In the implementation of the language
policy, English has received positive status and good corpus planning. Its place in the education system
has always been clear. It is highly regarded by a large portion of Kenyan populace.
Theoretical Framework
The theoretical framework that guided this study was the Game Theory as proposed by Laitin (1992).He
relies on comparative analysis and the techniques of the game theory to speculate on Africa’s future and
also makes recommendations to language planners. His speculation is that most countries in Africa will
not undergo language rationalization but will end up with a 3+_ one language outcome. This outcome
‘will be realized in African countries that are linguistically heterogeneous yet have a basis for an
indigenous lingua franca , promotes some African vernaculars, accepts societal multilingualism , relies
selectively on colonial languages and legitimizes the inventiveness and communicative value of pidgins
and creoles, all in the framework of a coherent program’( Laitin, 1992 :164).The language situation in
Kenya fits into the 3+_ one language outcome because as noted above , Kenyans are multilingual and use
three languages at once especially in urban areas and among the educated. There is use of sheng among
the youth.Laitin’s predictions are shown in the matrix
The Education Game in Kenya
Government Policy
Kenyan people seek
for their children
Kiswahili and
English
English and
Vernaculars
English only
Kiswahili only
English immersion 4.4(A) 4.4(A) 4.7(A) 4.0(A)
Kiswahili immersion 2.5.5(C) 0.0 0.0 2.95(C)
Vernaculars with
English as LWC
4.4(A) 7.5(A,B) 4.4(A) 4.0(A)
Laitin postulated three goals in descending order for Kenyan parents:
A (4 points) Social mobility for their children into elite domains is made possible. (This was a short-term
assessment based on what was then the value of English.)
B (3 points) their own culture is promoted by government, and fellow citizens take advantage of it.
C (2 points) if national values are promoted, and fellow citizens take advantage of it.
In the game, the people’s second choice, Kiswahili immersion is dominated by both the first and third
choices, so it is eliminated from consideration. If that is eliminated, the government’s fourth choice,
Kiswahili only is dominated by the first three choices. The people have a dominant strategy: to choose
‘vernaculars, with English as a language of wider communication.
Population and Sample
The total population was all primary schools in Chuka Division. According data obtained from the DEO’s
office, there were sixty four primary schools in the Division. Out of these, eleven were private schools.
Out of the fifty three public schools, two were boarding schools and therefore did not have a lower
primary section. The researcher used two sampling procedures. These were stratified random sampling
and purposive sampling. According to Orodho (2004), stratified random sampling is appropriate if the
population, from which the sample is drawn, does not constitute a homogenous group. Because a sample
need not be representative in a case study according to Kothari (2004), three schools were selected on the
basis of the LOI they used .Purposive sampling was also used. The researcher picked the schools that
were easier to access. The schools were:-
1. Njeru Junior Academy Private Mixed Day School (English medium)
2. Chuka Township – Public Town School (Kiswahili medium)
3. Kirege Primary School – Public Rural School (MT medium)
METHODOLOGY
An observation schedule was used to collect data. The schedule specified situations that would be
observed. These were the language used by the teacher to instruct pupils in the classroom and outside the

Proceedings of the Third International Research Conference held on 26th to 28th October, 2016 390
classroom in formal domains such as P.E. lessons and assemblies. Also to be observed was the language
used by students outside the classroom. After seeking permission from the office of the president through
the Ministry of Education, the researcher visited the schools to familiarize herself with the school
management. The researcher spent a day in each school observing the language behavior as specified in
the observation schedule. The data presented in this paper is the one collected through observation.
DATA ANALYSIS
The data collected using the observation schedule was summarized and a report written. This is the report
that will be presented in this paper. Results showed that teachers mainly use code mixing in classroom
discourse.
RESULTS
In Njeru Junior Academy, both the Teacher on Duty (TOD) and the headteacher used a mixture of
Kiswahili and English during the morning assembly. Sometimes what was said in Kiswahili was a
translation of what had been said in English. TOD’s (Teacher on Duty) address:“Wacha tuwapigie
makofi… Let us have a Bible reading… Semeni vifungo vya Bibilia”. While addressing the students
during the morning assembly, the TOD used English and Kiswahili alternately. First he asked the pupils
to clap for the others using Kiswahili, the he called those who the students who did the Bible reading to so
in English and then translated this into Kiswahili. The communication strategies that the TOD used are
code-mixing (Kiswahili and English) and translation (from English to Kiswahili). The headteacher’s
address was as follows: “This is the fourth week of the term.1 Ukifika mapema ufanye kazi.
2 And now
tomorrow nataka tushindane tuone ni nani atafika akiwa wa kwanza.3 We will find out who will get here
first.4 Tutaona ni nani atafanya makelele.
5 Those are the two things that I will emphasize this morning
6.”
In his morning assembly address, the hedteacher used a mixture of English and Kiswahili in the sentence
units. There is also use of translation in sentence 2 and 3.
During the mathematics lesson in Std 1, the teacher used a mixture of Kiswahili and English. This mixing
would be in one phrase such as “addition of nini” and “utachora mayai three.” Sometimes the teacher
used translation to communicate to the students. This is through such statements as “What am I going to
do with my six? Nitafanya nini na six yangu.” At times the teacher asked a question in English and the
pupils gave the answer in a mixture of Kiswahili and English, for example:
Teacher (T): What am I going to do?
Pupils (Ps): Utachora mayai three- alafu ukate moja.
There were also instances where the teacher asked a question in Kiswahili and the pupils answered in
Kiswahili mixed with English, for example:
T: Tufanye namna gani?
Ps: Utachora mayai eight ukate mayai five
Other times, the teacher communicated in English and the pupils answered in English. For example:
T: You count for me
Ps: one, two, three, four, five, six, seven, eight.
During the Kiswahili lesson in Std 2, the teacher used Kiswahili to communicate to the students. She
insisted that the students speak correct Kiswahili. However, the pupils would mix Kiswahili and English
as in the expression: “Teacher we write mia moja arubaini na tatu?” The pupils used English expressions
such as “Excuse me.”
In Chuka Township Primary School, the language used by the TOD and the headteacher to address
students during the morning assembly was a mixture of Kiswahili and English. An example to illustrate
this is: “Let me remind all of you wiki ijayo itakuwa tarehe ngapi? Eleventh on Monday, you must all be
in this attire. Kila mtu awe na yake. We shall clean our classes today at four. I am expecting each and
everyone to have water ready. Clear? Ujitayarishe. When cleaning starts. Be in your place.” Sometimes
the mixing of Kiswahili and English was a result of translation. An example used by the TOD is:
“Wanaskauti wakiendelea na kujitayarisha, nitasoma neno la Bwana. I am going to read the word of the
Lord from the Bible.”
Proceedings of the Third International Research Conference held on 26th to 28th October, 2016 391
The teachers mixed English and Kiswahili to communicate to students in class. This mixing varied from
using two different languages in the same sentence to using two languages in different sentences. For
example, the Std 1 teacher used the following expressions to address the pupils before commencing the
lesson. “Ebu sema today is Friday… sema yesterday was Thursday… sema tomorrow will be Saturday.”
This was also observed in the Std 2 class. An example from this observation is “Hatuendelei na English.
Keep those books away. Alafu nataka utoe maths exercise book. Mugambi nasema uweke hiyo kitabu.
Utamaliza break.” This mixing occurred even in words such as “tunacarry”.
Another observation was that the teachers used English even during the Kiswahili lesson for certain
words. An example of this can be illustrated using speech from the Std 1 teacher. “Nataka uandike date
zikiwa kwa mistari...Kitabu yako iko na ile mwalimu anaita margin...Blackboard yangu haina mistari
lakini kitabu yako iko na mistari. Sasa andika kwa mistari. Umeandika date?...Acha space…Unaenda
kutafuta pencil...Endeni break…Wewe hauna uniform leo…Kazi yote mtu aanze na date na subject.” The
pupils used similar language. E.g., “Ndiyo teacher…Apana, hakuwa assembly.”
The researcher also observed that in Std 2 during the mathematics lesson, the teacher mixed Kiswahili
with English. This was also the case in Std 4 mathematics lesson. An example of this is “Hatutaandika
thirteen...Tutaandika three tubebe moja tulete hiyo ingine the other side of tens.”
It was observed that the teachers used English and Kiswahili interchangeably. For example:
T: Alafu itakuwa five plus two.
What is the answer?
Ps: Seven
T: Kuna kitu tutabeba hapo
Ps: No
T: What is the answer?
Ps: Seventy three.
In Kirege Primary School, during the morning assembly the students were addressed using a mixture of
Kiswahili, English and MT (Gichuka).This is a language that is spoken by the Chuka People and is listed
as one of the Kenya’s indigenous languages as language No. 12 in Ethnologue (2009).
The Headteacher’s speech is a good example of this: “Teachers should be happy but they are not.
Waalimu hawafurahishwi na vitu zote mnafanya. Some of you are trading. We are not very happy with
you. Wengine wenu wanatoka darasani wanaenda chooni. Some of you. They know themselves.
Tukienda darasani hawataingia. Wibingire kioroni wikarage kuu. Tutigukuringiriria uthome ringi.
Wale wanafunzi tulienda nao Kiereni walinihaibisha. Walikuja bila viatu. Kaguru”. The researcher was
able to observe language use in Std 1, 2, 3 and 4 classes. In this school it was common for the teachers to
use English mixed with Kiswahili while the students used MT mixed with English. An example of this
from the Fine Art lesson went on as follows:
T: I am going to model mine and then you are going to make a model of a human being.
P: Tauma bo mone model
T: Nini mbaya- songea, songea
P: Tiganani namau. Haya kamundu!
T: Hii ni mfano wa mtu. Group yourselves into groups of five watano.
(The teacher distributed “soil” to the students).
T: Hiyo tosha
P: Baba bari na antu six.
This was also observed in the Std 4 and Std 2 Social Studies lessons. In the Std 4 lesson, the pupils used
MT to communicate to one another while they communicated to the teacher in English and the teacher
communicated to them in English. The teacher in Std 2 social science class mixed English and Kiswahili.
For example, “leaves ina include gani…leaves unasiita nini…, mtaendelea afterwards…” The pupils also
mixed Kiswahili and English as in:. “…ya avocado… ya beans... ya maize...”

Proceedings of the Third International Research Conference held on 26th to 28th October, 2016 392
Translation was also used often. For example “Group yourselves into groups of five…. Watano.” There
was also mixing of languages which occurred as a continuation of communication where one part is said
in English and the other part in Kiswahili for example, “as for today tutafika hapo… huendi out ngoja
until break time.” The pupils too used a similar communication technique for example “Mwalimu uyu
niachora na pencil…Mwalimu ino ni ya green…” where they mixed MT and English.
During the P.E. lesson, the teacher used Kiswahili to communicate to the pupils but certain words
remained in English such as “Dismiss… jog on the spot… frog walk.” In the social studies lesson in Std
2, similar trend was observed where the teacher used Kiswahili but referred to “leaves” in English
throughout. The researcher observed that the pupils in this school were at home using MT. The school
rule prohibiting them from using MT was not adhered to by both teachers and students.
The code mixing strategies identified from the classroom discourse were English and Kiswahili,
Kiswahili and Gichuka, English and Gichuka. The English and Kiswahili strategy was the commonest
and dominated classroom interactions in the two urban schools in the study sample. The strategies
involving use of MT and either Kiswahili or English was common in the rural school. This shows that
MT is still the language in which pupils from rural areas carry out their conversations. This should be
supported and encouraged.
The analysis of the data above shows that the main mode of communication in the classroom is mixing
languages. Code mixing takes various forms. In Njeru Junior Academy, teachers mixed Kiswahili and
English. In Chuka Township teachers teach in Kiswahili and English and once in a while used MT. In
Kirege Primary School, teachers mixed Kiswahili with English and MT but pupils were using a lot of MT
mixed with a little Kiswahili and English.
DISCUSSION
The main objective of this study was to evaluate the implementation status of the language policy. It was
found out that teachers mainly use code mixing in classroom instruction. Code mixing is the deliberate
mixing of two languages without an associated topic change. Conversants use two languages together to
an extent that they can change from one language to another in the course of a single utterance
(Wardhaugh, 2010). It is a common phenomenon in multilingual societies. Wardhaugh notes that
conversational code mixing is not just a haphazard mixing of two languages brought about by laziness or
ignorance or some combination of these. Rather, it requires conversants to have sophisticated knowledge
of both languages and to be accurately aware of community norms. It is a source of pride in bilingual and
multilingual communities. Code switching is a conversational strategy used to establish, cross or destroy
group boundaries. It is also used to create, evoke or change interpersonal relations with their rights and
obligations. It is a shift from one language to another and this shift lasts for a longer period than in a code
mixing. Code mixing may also give way to situational code-switching at any one time.
Mc Arthur (1988) mentions four major of code mixing though in his work he does not differentiate code-
mixing from code-switching. These are tag switching, intra-sentential switching, intersential and
intraword switching. Examples of these are found in the classroom discourse in the data that was
collected.. Tag switching is where tags and certain set phrases in one language are inserted into an
utterance otherwise in another. For example ‘Ebu sema Today is Friday ,sema yesterday was Thursday’.
Intra-sentential switching refers to switches that occur within a clause or sentence boundary. ‘Tulikuwa
tunaangalia addition’ (we were looking at addition) Intersential switching is where a change occurs at a
clause or sentence boundary, for example ‘kuna jina ingine tuliipatia, who can remember’ (there is
another name we gave it, who can remember?). In intra word switching, a change occurs within a word
boundary, for example tunacarry (we are carrying). In this study, respondents said they mixed languages
to make the students understand what was being taught.
The above phenomenon is designated as code-mixing other than code switching. Code switching is a
prolonged shift from one language to another while code-mixing is the use of two languages in words,
phrases and sentences in correct grammatical constructions inspite of the mixing. Code–mixing requires
high proficiency in the two languages while code-switching does not (Wardhaugh , 2010).

Proceedings of the Third International Research Conference held on 26th to 28th October, 2016 393
The question is whether code mixing and code switching should be allowed as a form of classroom
interaction. Kembo-Sure (2004) advocates the one of code switching in schools. This is because it is
being used by educated and celebrated writers. He sees no reason why it should not be treated as normal
in official communication of all descriptions, including examinations.
SUMMARY
From the data, it was clear that teachers mainly communicated to pupils using code-mixing. Teachers did
not implement the policy but utilized the languages that were in their multilingual context to
communicate to the students in the classroom.
CONCLUSION
The results of this research indicate that at the classroom level, teachers do not implement the policy.
They use a mixture of the three languages available from their repertoire of languages. Laitin’s (1992)
predictions That African countries will not become monolingual but are likely to continue to use three or
more languages is true in the Kenyan situation. However, his predictions that Kiswahili is likely to lose
out in the Game was wrong. Kiswahili has received acceptance among Kenyans since it made a
compulsory and examinable school subject (McKay Report, 1981) and it is now a co-official language in
the new constitution.
RECOMMENDATIONS
Based on the findings of this study, there is need to restructure Kenya’s language policy. In the
restructuring, the objectives should be made very clear. However, this should not be done without first
doing nationwide consultations and extensive research in the areas mentioned below. The theoretical
framework that informed this research predicted that rationalization is unlikely to occur in Kenyan
language situation. The use of two or three languages depending on the repertoire that the conversant has
at their disposal is an indicator that all the three languages will continue to be used in the classroom
.Further research should also be carried out in other parts of the country to verify the findings of this
research. The use of mother tongues in education has been hampered by lack of materials in most
languages since the pre-independence period. This can be attributed to lack of funds but also lack of will -
power on the part of the government to enforce the policy. There is need for the materials to be provided
if MTs will be used as LOIs in lower primary in future. Teachers suggested that they preferred a policy
which recommended the use of Kiswahili as LOI in all primary schools. This is also one of the issues that
further research can help verify.
REFERENCES
Bamgbose, A. (1976). Mother Tongue Education: The West African Experience. UNESCO: Hodder and
Stoughton.
Bogonko, S.N. (1992). Reflections on Education in East Africa. Nairobi: Oxford University Press.
Brown D.M. (1976). Mother Tongue to English. Cambridge: Cambridge University Press.
Chimerah, R. (1998). Kiswahili Past Present and Future Horizons. Nairobi: Nairobi University Press.
Mouton (pp. 107-118).
Gorman, T.P. (1970). Implications of Multilingualism in Eastern Africa. In T.P. Gorman (ed.), Language
in Education in Eastern Africa. Nairobi: Oxford University Press (pp. 1-12).
Gorman, T.P. (1974). The Development of Language Policy in Kenya with Particularem Reference to the
Education System. In W. H. Whitely (ed). Language in Kenya. Nairobi:Oxford University
Press(pp.481-545).
Kembo- Sure, S. (20004). Establishing a National Standard and English Language Curriculum Change in
Kenya. In M. J. Mutwii and Angelina Kioko (Eds.). New Language Bearings in Africa- A
Fresh Quest,Clevedon: Multilingual Matters(pp . 101-115).
Kothari, C.R. (2004). Research Methodology: Methods and Techniques: New Delhi: New Age
International.
Laitin, D.D. (1992). Language Repertoires and State Construction in Africa. Cambridge: Cambridge
University Press.

Proceedings of the Third International Research Conference held on 26th to 28th October, 2016 394
Mazrui, A. A. (1995). The Political Sociology of the English Language. The Hague: Mouton.
Mc Arthur, T. (1988). Concise Oxford Companion to English Use, Retrieved January 19TH
2010, from
http:www.highbeam.com/doc 11036-codemixing.html.
Mbaabu, I. (1992). The Impact of Language Policy on the Development of Kiswahili from 1930 -1990.
Unpublished Thesis: Howard University.
Muthwii, M.J. and Kioko, A.N. (2001). The Demands of a Changing Society; English in Education in
Kenya Today. In Language, Culture and Curriculum; Vol. 14.
Muthwii, M.J. and Kioko A.N. (2004). The Demands of a Changing Society; English in Education in
Kenya Today. In Language, Culture and Curriculum Vol 14(3)
Mutunga, K. (2007), May 5). Vernacular Theatre Now Takes the Centre Stage. The Daily Nation, Nation
Media Group (pp 30).
Musau, N. P. (2004). Linguistic Human Rights in Africa. Challenges and Prospects for Indigenous
Languages in Kenya. In Margaret M. and Angelina K. (Eds.). New Language Bearings in Africa:
A Fresh Quest (pp. 59 -68).
Orodho, J.A. (2004). Techniques of Writing Research Proposal and Report in Education and Social
Sciences. Nairobi: Masola
Okoknkwo,C. 1978).Language in Education- An African Case. Ann Arbor. University Microfilm
International.
Palome, E. (1967). Swahili Language Handbook. Washington. Centre for Applied Linguistics.
Paul, M.L. (2009). Ethnologue: Languages of the world, sixteenth edition. Dallas, Tex: SIL International.
Online Version: Http://www.ethnologue.com/.
Republic of Kenya, (1964). Kenya Education Commission Report Part 1 (Ominde Report). Nairobi:
Government Printer.
Republic of Kenya, (1976). Kenya Education Commission Report, (Gachathi Report).Nairobi:
Government Printer.
Republic of Kenya, (1981). Second University in Kenya: Report of Presidential Working Party, (Mackay
Report). Nairobi: Government Printer.
Republic of Kenya, (1949) Beecher Report. Nairobi: Government Printer.
Republic of Kenya, (1999). Totally Integrated Quality Education and Training, (Koech Report). Nairobi:
Government Printer.
Republic of Kenya, (2010). The New Constitution. Nairobi: Government Printer.
Sifuna, D.N. (1980). Short Essays in Education in Kenya. Nairobi: Kenya Literature Bureau.
Sifuna, D.N. (1975). Revolution in Primary Education. The New Approach in Kenya. Nairobi: East
Africa Literature Bureau.
Schmied, J. (2012) Standards of. English in East Africa.In Hickey, R. Standards of English. Cambridge:
Cambridge University Press.
UNESCO. (1953).The Use of Vernacular languages in Education. Paris, UNESCO PRESS.
Wardhaugh, R. (2010). An Introduction to Sociolinguistics (6th edn). Massachusetts: Blackwell
Publishers.
Welime, J.D. (1970). Some Problems of Teaching Swahili at Advanced Level. In Kenya in T.P. Gorman
(ed.) Language in Education in Eastern Africa. Nairobi: Oxford University Press (pp. 139-143).
Whiteley, W.H. (1974). The Classification and Distribution of Kenya’s African Languages. In W.H.
Whiteley (ed.) Language in Kenya Nairobi: Oxford University Press (pp. 13-64). ******
UNDERSTANDING HISTORY FOR HUMAN DEVELOPMENT
Kavulavu, L. Department of Humanities, Karatina University, P. O. Box 1957-10101, Karatina
Email: [email protected], Mob: +25427841089
ABSTRACT History has been misunderstood to mean the past. However, past present and future are related. As we try
to establish ourselves to feel at home, our past makes our present and so the future. Forces of history
produces a given society and as human being we should not abuse history nor use it to interfere with other

Proceedings of the Third International Research Conference held on 26th to 28th October, 2016 395
people freedom and nation building as it will bring suffering. History is thus about using our memory to
building our institution so that the society can become productive and meaningful. If we don’t memorize
our past we could be in a real trouble to forget who we are. The significance of the past for us today
involves selection and choice in which our contemporary concern can have a reasonable role. To
understand how and why we live as we do, we cannot avoid appealing to the past to explain how and why
we got to be this way. It is not the past alone that plays this crucial role in shaping our identities nor less
important is the act of remembering the past. In this paper, therefore, the author will pay more attention
on why history is a living memory and that by killing or forgetting our past we lose our way as we
navigate our way into an unknown future. So how do we reconnect with the past? The author think we
should tell stories about it. Method for this study involved data collection from secondary sources.
Keywords: History, Memory, Past
INTRODUCTION
The word history refers both to what actually happened in the past and to the representation of that past in
the work of historians. As individual we draw on our experience in all sort of different ways as a means of
affirming our identity, as a clue to our potential as the basis of our impression for others and as some
indication of the possibilities that lies ahead. Our memories servers as both a data bank and a means of
making sense of an unfolding life stories. But historical awareness is not the same thing as social
memory. How the past is known and how it is applied to present need are open to widely varying
approaches. But it would be a mistake to suppose that social memory is the preserve of small scale, pre-
literate societies. In fact the term itself highlights a universal need: if the individual cannot exist without
memory, neither can society, nor that goes for large-scale technologically advanced societies too. All
societies look to their collective memories for consolation or inspiration, and literate societies are in
principle no different. But written account (such as schools history books or popular evocation of the
World Wars) films and television performs the same function. Social memory continues to be an essential
means of sustaining a politically active identity. Its success is judged by how effectively it contributes to
collective cohesion, and how widely it is shared by members of the group. Sometimes social memory is
based on consensus and inclusion and this is often the function of explicitly national narratives (John
Tosh, 1984, pg 3).
Why the Past Matters
Most people take for granted and devote little time to studying or thinking about “how much the past does
indeed matter to us” or thinking about it, in fact the past is responsible for everything we are. It is the core
of our humanity. To understand how and why we live as we do, we can not avoid appealing to the past to
explain how and why we got to be this way. It is not the past alone that plays this crucial role in shaping
our identities. No less important is the act of remembering the past. If the past is the place from which we
have come, then memory and history are the tools we use for recollecting the pace, so that we can know
who and where we are. Thus the memory and history is a wealth of human meanings thereby turns into
the kind of place we choose to call home (William Cronon, 2000 pg 4). The past is non-existence and the
physical and mental elements of past events can only be constructed in imagination by the operation of
the historians mind upon what he takes to be evidence for the past therefore his picture of it “imaginary”
in every detail. Moreover, the picture which is history cannot come as near to the past as the photograph
likeness is drawn from unorganized and mostly incomplete features haphazardly surviving. Collingwood
who demonstrated that the historians picture of the past is imaginary, also insisted that history is a form of
knowledge autonomous self-justifying and at least as worth of respect as a means of truth as art, science
or philosophy (Vivienne Little, 1983). The perception of objects in the present world depends upon a
function which can be best described if only metaphorically as “image –making” which enables
recognition of what we see, hear, taste as of a particular kind.
What makes a nation or a people is much of what they share in common to mark their collective identity,
is an intricate set of remembrances that tie the present to the past. Much of growing up has to do with the
expansion of our capacity to remember which evolves steadily as we age. All of our experience of growth
and transformation flows from this most basic insight of memory: if we remembered nothing, we would
never know change, for it is only by referring backward to the seemingly fixed signposts of the past that

Proceedings of the Third International Research Conference held on 26th to 28th October, 2016 396
we can know how far we have journeyed in space and time in our migration from past to present. Our
awareness of the past gives us our ability to analyze the two crucial states, we think of as “before and
after”. The experience of change leads us to think of our past not as a random collection of people, place,
objects and experience, but as a series of events that form meaningful sequences. The past is thus a vast
collection of stories.
What we learn as we grow onto adulthood is that memory is our most important tool for telling stories
and that stories in turn are our most important tool for telling ourselves what we want over our lives to
mean stories about the past transform the inhuman universe into a human world of moral meaning. It is
the setting down stories that transform it into history and translate it into a frame of reference that people
in the future can understand and with it they can empathize, if we can learn how we ourselves are
connected to a world that would otherwise be lost to us (through stories about our past). Scholarly and
practitioners of peace-building as well as publics of war-torn societies increasingly agree that some kind
of formal accounting of the past is essential to achieve lasting “self-enforcing” peace in war torn states.
When victims and their families are allowed to tell their suffering and story it serves as a therapeutic
purpose for an entire country and imparting to the citizenry a sense of dignity and an empowerment that
could help them move beyond the pain of the past (David Mendeloff: 2004. In addition, it assures
justices, promotes social and psychological healing, fosters reconciliation and deters future crimes all of
which help consolidate peace in war torn societies.
History as a Living Memory
For the past to come fully alive we need to plant each of our family tree in the larger forest of history, the
better to see, its true context. The past already lives a memory and history is a historic building or
landscape, a museum full of past objects indeed a whole library’s worth of books and documents. They
are all vivid reminders of the world out of which we came from. For those who do not already share this
love, on the other hand, they are inert, dead objects. By killing or forgetting our past we loose ourselves
as we navigate our way into an unknown future. So how do we reconnect with our past? The answer the
author think is that we need to tell stories about it. William Cronon has argued that’ Every historical story
can be divided into one or just two types:
i) The first can be labeled a “presentist” story since it tells how we got to where we are today
because its job is to explain how the past led up to the present
ii) The second can be labeled with the phrase “the past is a foreign country” since its job is to remind
us that the past and its people had their own reasons for being and only incidentally produced
the world we now inhabit.
What serves the past is the stories we tell about it. It is our stories that take dead objects and boring
documents and make them live again. That is why we need not just building but also books, not just
archives but also historical structures, not just museum but also stories since history at the most basic
level is the act of making the past live again in the present. History has unity and continuity the present
need the past to explore it and the local history must be read as part of the local history. Historical study
has for its end to let the community see itself in the light of the past, to give it new thoughts and feelings,
new aspiration and energies. The past matters because private, public memory are crucial to all that make
us human. In remembering the past we remember ourselves. We therefore need history to be taught in
schools and the need to preserve and documenting our stories.
History and Narrative
Narration is thought to posses an inevitably fictional element. It is thought that the work of the narrative
historian is said to be more like that of the imaginative writer. Thus the upshot assertion that historical
narration is to be assessed in large measures in terms of the kind of criterion of truth that is appropriate to
literary work (Noel Carrol, 1990, pg 135). According to Hayden White lives are lived and stories are told.
Narratives are thus a form of representation, and it is true that historians do not go about finding their
representations as one might find a lost picture, a lost photo, which is made (invented). Similarly,
narratives are a form of representation and in that sense, they are invented, but, that does not preclude
their capacity to provide accurate information. Narrative can provide accurate knowledge about the past

Proceedings of the Third International Research Conference held on 26th to 28th October, 2016 397
in terms of the kinds of features they track, namely, the ingredients of courses of events which include;
background conditions, causes and effects as well as social context, the logic of situations, practical
deliberate and ensuing actions. Since the past is not storied, historical narratives are constructions,
constructions that gives a sequence of events such as one might find noted in historical chronicle or annal
meaning. Historical narratives, in this regard are thus said to constitute meaning (Noel Carrol, 1990, pg
137-138).
CONCLUSION
Telling the truth about history calls for an amiable approach to studying the past as laid out in a narratives
and helps anchor our democratic version of history that includes minorities, the under classes and women
(Bonnie G Smith, 1995) Do individual or masses have free will in history? According to many
philosophers and historian masses are left alone thus can’t be engaged to change because of their fatalism,
belief thus the need of getting certain individual among the masses who have positive idea and coordinate
the masses towards a better society. Because of ignorance masses are extremely poor. Masses are
therefore representation of a countries spirit, culture. They also represent history from bellow which
brings revolution. The silent majority, marginalized poor who have a voice when given a chance they can
make change. Thus, the need for them to be given an opportunity to tell stories about it to understand
why we live as we do.
REFERENCES
Bonnie G. Smith. (1995). Whose Truth, Whose History. Journal of History of ideas Vol.56.No.4.
University of Pennsylvania Press, Assessed 21/10/2015 from http://www.jstor.org/stable/270997.
David Mendeloff. (2004). Truth-seeking, truth telling and post conflict peace building: Curb the
enthusiasm? Journal of International Studies Review, Vol.6, No.3, Assessed 21-10-2015, from
http://www.jstor.org/stable/3699695
John Tosh. (1984). The pursuit of history. England: Pearson Educational Limited.
Noel Carroll. (1990). “Interpretation History and Narrative. Source; Journal of The Monist, Vol.73,No.2,.
Hegeler Institute, Assessed 19/03/2016 from http://www.jstor.org/stable/27903178 Assessed
19/03/2016
William Cronon. (2000). Why the past matters. The Wisconsin Magazine of History, Vol.84.No. 1.from
http://www.jstor.org/stable 4636883
Vivienne Little. (1983).What is Historical Imagination. Journal of Historical Association No.36, from
http;//www.jstor.org/stable/43254801?seq=1andacid=pdf-reference#references_tab_contents ******
PSYCHOSOCIAL CHALLENGES TO SUSTAINABLE DEVELOPMENT IN EMBU,
THARAKA-NITHI AND MERU COUNTIES: PSYCHOSOCIAL ISSUES REPORTED
BETWEEN JUNE, 2015 AND JUNE 2016
Manono, G. and Mwiti, K.
Faculty of Arts and Humanities, Chuka University, P. O. Box 109-60400, Chuka
ABSTRACT
The sustainable development goals (SDGs), which are defined in the 2030 Agenda for Sustainable
Development, offer an opportunity to achieve the commitments on the prevention of most harmful
psychosocial issues facing humanity in the twenty first century. This paper seeks to identify and analyze
the psychosocial challenges that can hinder the attainment of sustainable development in Embu, Tharaka-
Nithi and Meru Counties. Objectives that guide the study seeks to establish the causes of psychosocial
issues reported in the three Counties, their trends, the nature/type of issues reported, their
prevalence/frequency of occurrence per County and per month, relevant policies in place, their impacts to
development and recommended mitigation measures. The study uses archival research method whereby
data is collected from already existing records from two national dailies of Daily Nation and Standard
newspapers for the period from June 2015 to June 2016. Psychosocial issues reported from the three
Counties will are systematically recorded using written document analysis worksheet tool where issues
are listed as per newspaper, date and County. Each of the reported psychosocial issues is analyzed as per

Proceedings of the Third International Research Conference held on 26th to 28th October, 2016 398
thematic area. The trends in terms of types of psychosocial issues reported and frequency of occurrence is
identified and analyzed per month and County. Discussion of findings relates the theoretical explanations
in literature to the psychosocial challenges reported in the three Counties. It is anticipated that the
findings will be of interest to the County Governments of the said Counties and inform policy and County
development planning. Conclusions are drawn and recommendations made based on the findings.
Keywords: psychosocial, psychosocial factors, psychosocial stressor, community development,
sustainable development, County Government
INTRODUCTION
Background Information
Sustainable development is crucial to prosperity of future generations. According to Elliot (2006),
sustainable development has been a principal policy goal for countries and major institutions of the world
including the United Nations, World Bank and the World Trade Organization for several years. This is
confirmation of how understanding of the global challenge of sustainable development has moved on to
encompass the complex interdependencies of environmental, social and economic development. Kenya,
along with other nations in the world, has pledged to implement the seventeen sustainable development
goals in the next fifteen years. In the country’s 2030 vision the achievement of the sustainable
development goals is incorporated. This underlies the seriousness with which the country takes the
achievement of the SDGs. Since the promulgation of the new constitution 2010, Kenya has a devolved
system of governance. The developed units of government are expected to help implement the country’s
Vision 2030 and the SDGs. The three counties of Embu, Tharaka Nithi and Meru are some of the
devolved units in Kenya. The three counties have a number of common features including socio-cultural
practices, geographical (they border Mt. Kenya), economic activities, political and language.
Definitions of Terms
Sustainable development. This refers to development that meets the needs of the present without
compromising the ability of future generations to meet their own needs. (World Commission on
Environment and Development, 1987). Psychosocial. This relates to both the mind and interaction with
other people (Cambridge University Press 2009). Thus psychosocial refers to how an individual’s
thoughts, feelings and behavior are affected by interaction with others. As applied to this study all those
aspects that affect people’s thoughts, feelings and behavior were considered as significant and were
recorded as part of the data.
Psychosocial factors; according to the APA (2015), these are social, cultural, and environmental
phenomena and influences that affect mental health and behavior. These influences include social
situations, relationships, and pressures, such as competition for education, health care, and other social
resources; rapid technological change; work deadlines; and changes in social roles and status (e.g., of
women and minority groups). People’s mental health and behavior is affected by the social, cultural and
environmental settings in which they live. For the purpose of this study psychosocial factors were broadly
categorized as social, cultural and environmental. Each broad category was
Objectives of the Study
General objective: To identify and analyze the psychosocial challenges influencing the attainment of
sustainable development in Embu, Tharaka Nithi and Meru Counties of Kenya.
Specific Objectives
(i) To establish trends in psychosocial issues reported in Embu, Tharaka Nithi and Meru Counties.
(ii) To establish the type of psychosocial issues reported in Embu, Tharaka Nithi and Meru Counties.
(iii) To establish rank and prevalence/frequency of occurrence in Embu, Tharaka-Nithi and Meru Counties
(iv) To establish the link between theoretical explanation and reported issues
Justification
The study aims at identifying key challenges to the attainment of sustainable development in the three
Counties. It is anticipated that these finding will inform the design of strategies to mitigate against these

Proceedings of the Third International Research Conference held on 26th to 28th October, 2016 399
challenges and create awareness among the public regarding their role in the attainment of sustainable
development goals. The results are expected to contribute to the university in the development of the local
communities within which the institution is located through research, advocacy and partnership with
relevant stakeholders.
LITERATURE REVIEW
Elliot (2006) observes that future development worldwide will be centered on resources. This is because
all forms of economic and social activity make demands on the resource base: as raw materials such as
soil and water within agricultural production, as sources of inputs and energy into industrial production or
in the construction and maintenance of human settlements and urban lifestyles. To attain sustainable
development efforts must be exerted to surmount challenges that include; Inequalities in access to
resources, Poverty, Health problems resulting from environmental factors, which range from the
biological environment (such as water pollution) to the chemical environment (such as air pollution) to
the built environment (including road traffic accidents).
In 2015, at a summit on Sustainable Development Goals, heads of states pledged to accelerate efforts to
implement 17 goals and 169 activities in the next 15 years. This is out of realization that the very survival
of billions of the world’s citizens, many of whom reside in developing countries is at stake. The
challenges to achieving the goals include; depletion of natural resources, adverse impacts of
environmental degradation, and climate change, putting the survival of many societies, and of the
biological support systems of the planet in danger extinction (Transforming Our World: The 2030 Agenda
for Sustainable Development, 11 August 2015 ).
Achieving Sustainable Development Goals in Kenya
Kenya is a signatory to the Heads of states declaration on Sustainable Development goals 2015. She has
committed herself to the implementation of the 17 goals and 169 activities outlined in the declaration for
the next 15 years. The country’s Vision 2030 encompasses the implementation of the SDG goals and
activities. Of particular relevance to this study are the implementation of goals 3, 5 and 6. Goal 3 focuses
on ensuring healthy lives and promoting well-being for all at all ages and the activities to be carried
include; (3.4) that targets by 2030, to reduce by one third premature mortality from non-communicable
diseases through prevention and treatment and promote mental health and well-being. (3.5) that aims to
strengthen the prevention and treatment of substance abuse, including narcotic drug abuse and harmful
use of alcohol. (3.6) that targets by 2020, to halve the number of global deaths and injuries from road
traffic accidents. (3.8) aims to achieve universal health coverage, including financial risk protection,
access to quality essential health-care services and access to safe, effective, quality and affordable
essential medicines and vaccines for all.
Goal 5 focuses on ending all forms of discrimination against all women and girls everywhere. The
activities to be implemented include; (5.2) to eliminate all forms of violence against all women and girls
in the public and private spheres, including trafficking and sexual and other types of exploitation. (5.3)
this targets to eliminate all harmful practices, such as child, early and forced marriage and FGM.
Goal 6 focuses on ensuring the availability and sustainable management of water and sanitation for all.
The activities to implement this goal include; (6.1) that targets by 2030, to achieve universal and equitable
access to safe and affordable drinking water for all. (6.2) Aims by 2030, to achieve access to adequate and
equitable sanitation and hygiene for all and end open defecation, paying special attention to the needs of
women and girls and those in vulnerable situations. (6.3) targets by 2030, to improve water quality by
reducing pollution, eliminating dumping and minimizing release of hazardous chemicals and materials,
halving the proportion of untreated wastewater and substantially increasing recycling and safe reuse
globally. (6.5) aims by 2030, to implement integrated water resources management at all levels, including
through transboundary cooperation as appropriate (6.6) targets by 2020, to protect and restore water-
related ecosystems, including mountains, forests, wetlands, rivers, aquifers and lakes (Transforming Our
World: The 2030 Agenda for Sustainable Development, 11 August 2015).

Proceedings of the Third International Research Conference held on 26th to 28th October, 2016 400
Health, Demographic and Economic Indicators for Embu, Tharaka Nithi and Meru Counties
KDHS 2014 report indicated that the percentage of children under 5 who are stunted, or too short for age
in Kenya as being 26%. Embu County had the percentage of children under 5 who were stunted at 26%
to 35%, Tharaka Nithi county 26% to 35%, and Meru County, 15% to 25%. According to the Kenya
County fact sheets (2013), Embu county had a poverty gap index of 14.2 and was ranked 20th in Kenya.
Population per nurse stood at 7,374 compared to the national ratio of 8,580 per nurse. Population per
doctor was 103,242 compared to the national figure of 253, 046 per doctor. Tharaka Nithi county had a
poverty gap of 12.0 and was ranked 15th in Kenya. Population per nurse stood at 7,773 compared to the
national ratio of 8,580 per nurse. Population per doctor was 365,330 compared to the national figure of
253, 046 per doctor. Meru county had a poverty gap of 6.2 and was ranked 3rd
in Kenya. Population per
nurse stood at 9,227 compared to the national ratio of 8,580 per nurse. Population per doctor was 79,782
compared to the national figure of 253, 046 per doctor. The indicators above show the three counties as
being nearly at the same level. It also reveals that nationally they are not doing so well on the indicators
above.
Psychosocial Factors and Community Well Being
Studies by community psychologists indicate a correlation between community settings and the
psychosocial issues prevalent in that community. Research has shown how an individual’s immediate
neighborhood influences psychological outcome and the regulation of behaviors within that setting
(Maton, 1986). Neighborhood influences have been studied in relation to adolescent academic
achievement (Brooks-Gunn, Duncan, Klebanov, and Sealand, 1993; Gonzales, Cauce, Friedman, and
Mason, 1996), adolescent drug use and other problem behaviors (Allison et al., 1999), and fear of crime
(Perkins and Taylor, 1996; Riger, LeBailly, and Gordon, 1981). Researchers have also linked people’s
sense of community to community development,( Maton 2002).
Sense of community refers to the relationship between the individual and the social structure as well as
participation in community affairs (Sarason, 1974, McMillan and Chavis, 1986; Newbrough and Chavis,
1986a, 1986b). Studies show that individual’s participation in the community development is influenced
by their perception of the environment, one's social relations, and one's perceived control and
empowerment within the community (Maton 2002). The community development process is rooted
within the context of the physical and social environment of the community. Individuals’ participation in
the community development process is key to sustainable development.
Perception of the environment involves judgments about the environment (e.g., perceived qualities of the
environment, satisfaction with the environment, problems in the environment). Judgments are made about
the degree to which the environment or a specific aspect of the environment is positive or negative to the
individual. If it is viewed negatively, it can lead to stress and/or arousal (Baum, Singer, and Baum, 1981;
Wandersman, Andrews, Riddle, and Fancett, 1983). There are substantive relationships between the
qualities of the physical environment, the social environment (e.g., social interaction and sense of
belonging), and residential satisfaction (e.g., Rohe, 1985; Taylor, 1982; Weidemann and Anderson,
1985). Negative signs in the environment (e.g., incivilities such as litter, abandoned cars, or gangs on the
street) can lead to fear of crime, lower property values, and social withdrawal (Ahlbrandt and
Cunningham, 1979; Lewis and Salem, 1981; Perkins, Florin, Rich, Wandersman, and Chavis, 1990;
Skogan and Maxfield, 1981; Taylor, 1988). A sense of community or social cohesion has been found to
moderate negative environmental factors such as crowding (Aiello andBaum, 1979; Freedman, 1975).
Stress-buffering is a concept that asserts that key psychological moderator variables for example,
perceived social support, coping ability, protect high life stress individuals from the negative effects of
stress, while having significantly smaller or no impact on low life stress individuals (Maton 2002).
Community settings can serve the purpose of offering a stress buffer for individual community members.
For instance an individual who has just lost a job that they really needed can be said to be experiencing
high life stress and therefore in more need of a stress buffer compared to an individual that has just gotten
a job they really need. Settings that facilitate higher levels of social support, adaptive coping skills, and
meaningful roles may be expected to better protect members from deleterious effects of stress than
Proceedings of the Third International Research Conference held on 26th to 28th October, 2016 401
settings lacking these capabilities. Social support may be experienced directly, through relationships with
friends or acquaintances in the setting, or indirectly, through a general sense that the setting has a high
sense of cohesiveness and that support is generally available.
Environmental Factors in Community Well-Being
Negative effects of environmental degradation have been document in several parts of the world. In China
studies have revealed various challenges to sustainable development leading to the “Death Villages”. The
term “Death village” is used to describe China’s many villages that have unusually high rates of illness or
mortality caused by severe environmental pollution. It is shown that the number of these villages has
been increasing steadily in recent decades, thus compromising the benefits of the country’s extraordinary
economic boom that have been achieved since the 1970s (Zheng and Cao, 2011).
At the moment, China is believed to have hundreds death villages based on media reports since 2001, and
these villages are scattered throughout the country. Media reports suggest that these villages share a
single common feature: proximity to polluting enterprises, such as chemical plants, paper mills, and
refineries. Because these enterprises have made no effort to detoxify their outputs, their adverse impacts
on humans, livestock, plants, and the environment are increasing continuously; worse still, their toxins
often accumulate in the food chain or persist in nature.
Almost two-thirds of China’s major rivers are seriously polluted, and about 86% of urban rivers are
seriously degraded as a direct result of accidents that release toxic materials, as well as due to inadequate
waste treatment capacity (Zheng and Cao, 2011). The cost of environmental damage to the Chinese
economy is estimated at U.S.$240 billion. This money has been spent on environmental conservation and
remediation since 2003 (The Statistical Communique on the National Environment, 2009).
Human-Wildlife Conflicts and Community Wellbeing
According to White and Ward (2010), human–wildlife conflicts are increasing throughout the world,
mainly due to a combination of factors such as human population growth, increased pressure on land and
natural resources and climate change. They suggest that differences in objectives among various
stakeholders in regard to the benefits of wildlife may exacerbate human-wildlife conflicts. This is
especially where the wildlife in question is a resource that can be exploited for economic or cultural
benefit, or where the conservation of wildlife is at odds with human population growth or development
pressure. They propose an interdisciplinary approach to human–wildlife conflict situations by integrating
knowledge and understanding across the natural and social sciences.
Research on human wildlife conflicts have indicated various challenges that are experienced by persons
residing near wildlife inhabited areas. For instance, in Tanzania over 71% of local people surveyed in a
study reported having had problems with wildlife. Of those local people who reported having problems
with wildlife, majority experienced crop damage, while others reported the killing of livestock. Large and
small animals caused varied damage with small animals causing more damage than big ones. Local
people were generally less effective in controlling small-bodied species than large-bodied species (White
and Ward, 2010). In the literature on sustainable development substantial focus has been placed on areas
such as environmental degradation, economic, political and social issues. There is need for more
information the psychosocial issues and their influence in attaining sustainable development. This study
purposes to identify the psychosocial issues prevalent in the three counties of Embu, Tharaka Nithi and
Meru and explore their relationship to sustainable development.
METHODOLOGY
This was a descriptive study that used archival research method to collect information. Data was gathered
through newspaper document analysis from two major Kenyan National dailies, the Standard and the
Daily Nation newspapers for the period between June 2015 to June 2016. Daily reports relating to the
counties of Embu, Tharaka Nithi and Meru were examined and those that met the criteria of psychosocial
issues were recorded as per the newspaper, date, month and county.

Proceedings of the Third International Research Conference held on 26th to 28th October, 2016 402
Criterion for Inclusion of Issues
Psychosocial issues were categorized into three main areas of social, cultural and environmental. Each of
the main areas was further categorized as follows: Social issues included; Crime, land disputes, Gender
based violence, Welfare for the Elderly, Youth and Child, people with disability, accidents, health and
sanitation. Cultural issues included; beliefs and lifestyle. Environmental issues included; Environmental
degradation, conservation, disaster management and human-wildlife conflict.
Data Analysis
Each of the areas of the psychosocial areas of concern will be analyzed through written document analysis
worksheet tool. Psychosocial issues reported from the three counties in the two national dailies of Daily
Nation and Standard newspapers were listed down as per newspaper, day, month and county. The issues
were categorized as per the type and frequency of reportage. Trends in terms of type of issues were
analyzed as per frequency of reportage ranging from lowest to highest. Trends were also further analyzed
as per month and county in relation to frequency from lowest to highest.
RESULTS AND DISCUSSION
Figure 1: Crime per county
Figure 2: Total crimes reported
Meru49%
Tharaka Nithi30%
Embu21%
Total Crimes per County Figure 3: Total crimes per county

Proceedings of the Third International Research Conference held on 26th to 28th October, 2016 403
02468
10121416 Meru
Tharaka Nithi
Embu
Figure 4: Total crime trends
From figure 1, 2, 3 and 4 above, the rate of crimes reported is highest in Meru compared to the other two
Counties. The county reported a total of 86 crimes, followed by Tharaka Nithi County with 53 and Embu
County reported a total of 37 crimes. Among the most rampant crimes were drug and substance abuse,
theft and robbery as well as murder. Alcohol (illicit brew) was the most reported substance abuse across
the three counties. The rates of crime tended to be high between the months of June to November across
the three Counties. War against crime is relevant to realization of SDG No. 11 which promotes cities and
human settlements that are inclusive, safe, resilient and sustainable. Any threat to achievement of safety is
a threat to achievement of sustainable development.
Figure 5: Land disputes per county
Meru50%
Thara Nithi31%
Embu19%
Total Land Disputes per County Figure 6: Total land disputes per county
From Figure 5 and 6 above, most land disputes reported during the period happened in Meru. There were
equal numbers of both inter-communal and intra-communal land disputes in Meru County. Most of inter-
communal land disputes reported involved border conflicts. Common among the disputes were the Meru-
Isiolo border conflicts as well as Meru-Tharaka Nithi border conflicts. Most intra-communal disputes
reported involved family land disputes among its members and/or neighbors as well as those involving
community institutions. This is not in line with SDG No. 16 which advocates for building of peaceful and
inclusive societies for sustainable development. Peace is paramount to sustainable development.

Proceedings of the Third International Research Conference held on 26th to 28th October, 2016 404
Figure 7: Gender bases violence (GBV) per county
From Figure 7 above, there were more cases of Gender Based Violence (GBV) reported in Meru County
than in the other two counties. The County reported almost half of the total cases reported. FGM was
highest in Tharaka Nithi County. Female circumcision or female genital mutilation as it is commonly
known is forced upon young teenage girls. It is not voluntary, but a cultural 'norm'. Once a girl has
undergone FGM, she is regarded as an adult and can enter into early marriage. That causes the high
school dropout rates for girls. Rape cases reported in Embu and Meru Counties were high compared to
those reported in Tharaka Nithi County. Most victims of rape were young girls assaulted by their senior
family members, teachers and other members of the community.
Early marriages were reported in Meru especially at Mbeere and Tigania regions where “circumcised
girls” were expected to be married off as deemed eligible. Cases of intimate partner assault tended to
remain high across the three Counties. Most gender based violence was reported between June and
December, the same period that most of the other crimes were committed as per Fig 4 above. Most of
violent cases directed towards intimate partner, wife or husband included battering, stabbing and
chopping off private parts. GBV is a big undoing to achievement of SDG No. 5 which promotes
achievement of gender equality and empowerment of all women and girls.
Figure 8: Elderly, youth and child welfare
Figure 8 above illustrates that there were more cases of child, youth and elderly empowerment initiates
reported than those of neglect of the same categories of people. Some of the empowerment activities
reported targeting children include supporting them with school bursaries, issuance of shoes, health
awareness and nutritional support from both the Government and NGOs. The youths were targeted with
campaigns against drug and substance abuse as well as economic empowerment activities such as training

Proceedings of the Third International Research Conference held on 26th to 28th October, 2016 405
on entrepreneurship and issuance of soft loans for businesses. The reports on the elderly were on support
through the cash transfer program and shelter initiatives. There however few cases of child neglect and
abandonment across the counties. In several cases, children were not supported to access education. In
Meru County for instance, cases of boys dropping out of school to engage in miraa harvesting and other
forms of child labor featured most.
Figure 9: People living with disabilities
Figure 9 above shows more cases of empowerment for people living with disabilities were reported than
cases of neglect and abuse. There were reports of issuance of wheel chairs for lame, free medical camps
for various people challenges in different ways, among others. However, cases of structures that are
unfriendly to the disabled and varied forms of discriminations were reported across the three counties.
Figure 10: Health and sanitation issues per county
From the diagram above, nutritional issues were least reported during the period. Those few reports that
seemed to address nutritional issues were targeted on issuance of food rations to sections of County
residents and especially poor households and the elderly. There were no sustainable mechanisms reported
as put in place to address key possible malnutrition issues. There were various reports on health facilities
and infrastructure. Most of them focused on equipping the health care facilities as well as construction of
new ones. Reports on the main access roads to these facilities were also covered. During the same period,
reports on health awareness were more from Meru County than the other two Counties. Campaigns
against pollution were noted, awareness on cancer screening was largely created for both men and women
including free testing for the same through mobile clinics, campaign on household sanitation through
construction of pit latrines and other waste management, among others. Incidences of disease outbreak
especially cholera were reported. Unhygienic food hawking was also banned in several parts of the three
Counties. Traffic accidents remained high in Meru County. These accidents involved motor vehicles and
motorcyclists. Health is critical to achievement of sustainable development as outlined in goal number
three of sustainable development goals. The goal seeks to ensure healthy lives and promote well-being for
all at all ages.

Proceedings of the Third International Research Conference held on 26th to 28th October, 2016 406
Figure 11: Culture and lifestyle per county
From the figure above, it is evident that reports on herders versus farmers were most reported in Meru
County than the other two Counties. There reports were on conflicting lifestyle patterns between the two
groups. This was common especially at the Isiolo-Meru border where herders from Isiolo came grazing
on their neighbors’ crops especially during the dry seasons of July to September. There were also reports
on girls graduating through an alternative rite of passage in an attempt to fight FGM. Incidents were
reported in Meru where boys had been initiated by unqualified expert. Beliefs on health remained the
greatest obstacle to access to healthcare. In Embu, some residents of a religious sect declined vaccination
for their children citing reliance on divine healing.
Figure 12: Environmental concerns per county
Environmental conservation is important to achievement of sustainable development goal number 15
which advocates for protection, restoration and promotion of sustainable use of terrestrial ecosystems,
sustainable management of forests, combat desertification, halt and reverse land degradation and halt
biodiversity loss. In line with this, several environmental concerns were reported. Sand harvesting along
the river banks were said to interfere with aquatic life and led to drying up of several rivers in Embu and
Tharaka Nithi Counties. Illegal logging tended to be happening across the three Counties prompting
desertification. Cases of forest fires were mainly reported in Tharaka Nithi with residents being urged not
to set fires near forests. Lobbying for environmental conservation was largely done in Meru County
especially by NGOs that advocated for tree planting among other initiatives.

Proceedings of the Third International Research Conference held on 26th to 28th October, 2016 407
Across the three Counties, there were reports early disaster preparedness mechanisms in place. This was
especially so for the possible Elnino rains and flood prone areas. These reports were captured between
September and December. This is around the rainy season in the said Counties. These points to the
Counties inability to prepare for disasters in advance and only prepare during or when they are just about
to happen. There were minimal cases of forest fires reported, with most cases of fires reported at homes
and institutions such as schools. Some of those fires were accidental while others were cases or arson due
to students strike or general carelessness.
Figure 14: Wildlife-human conflict
Human-wildlife conflicts were reported as being rampart in Meru and Tharaka Nithi Counties. Cases of
animals invading local farms were on the rise. In Meru, residents bordering Mt. Kenya forest spent
several sleepless nights chasing huge and small animals away from their farms. Among the most
notorious were elephants. They invaded peoples’ home and destroyed crops and other properties. In
several incidences, these animals cause injuries to individuals in the process of confrontations. Residents
urged their respective County governments to elect an electric fence round the forest without much
success. Residents were faced with a dilemma between protecting the wildlife and their properties.
REFERENCES
Ministry of Environmental Protection. (2009). The Statistical Communique on the National Environment;
State Environmental Protection Agency: Beijing.
Elliott, J., A. (2006). An Introduction to Sustainable Development. 3rd
ed. Routledge. Milton Park,
Abingdon.
Kenya: County Fact Sheets (June 2013). Second Edition. Collection Revenue Allocation.
Kenya National Bureau of Statistics (KNBS) and ICF International. 2014. Kenya Demographic and
Health Survey2014. Calverton, Maryland: KNBS and ICF International.
Figure 13: Disaster management issues per County

Proceedings of the Third International Research Conference held on 26th to 28th October, 2016 408
Maton, K.I (2002). Community Settings as Buffers of Life Stress? Highly Supportive Churches,
Mutual Help Groups and Senior Centers. A Quarter Century of Community Psychology: Readings from
the American Journal of Community Psychology, edited by Tracey A. Revenson et al. Kluwer
Academic Plenum Publishers, New York.
Gonzales, N. A. Cauce, A. M., Friedman, R. 1., and Mason, C. A. (1996). Family, peer, and
neighborhood influences on academic achievement among African-American adolescents: One-
year prospective effects. American Journal (~f Community Psychology, 24,365-387.
Brooks-Gunn, L., Duncan, G. L., Klebanov, P. K., and Sealand, N. (1993). Do neighborhoods influence
child and adolescent development? American Journal of Sociology, 99, 353-395. Allison, K. w.,
Crawford, I., Leone, P. E., Trickett, E., Perez-Febles, A., Burton, L. M., and
LeBlanc, R. (1999). Adolescent substance use: Preliminary examinations of school and neighborhood
context. American Journal of Community Psychology, 27,111-141.
Perkins, D. D., Florin, P., Rich, R. C, Wandersman,A., and Chavis, D. M. (1990) . Participation and the
social and physical environment of residential blocks: Crime and community context.
American Journal of Community Psychology, 18, 83-115.
Sarason, S. B.(1974).The psychological sense of community: Prospects for a community psychology. San
Francisco: Jossey-Bass.
Ahlbrandt, R. S., Jr. and Brophy, P. C. (1975). Neighborhood revitalization: Theory and practice.
Lexington, MA: Lexington Books.
Baum, A., Singer, 1. E., and Baum, C. S. (1981). Stress and the environment. Journal of Social Issues,
37:4-35.
Chavis, D. M., Hogge, 1. H., McMillan, D. w., and Wandersman, A. (1986). Sense of community through
Brunswik's lens: A first look. Journal of Community Psychology, 14,24-40.
Newbrough, 1. R and Chavis, D. M. (Eds.). (1986a). Psychological Sense of Community, I: Theory and
concepts. Journal of Community Psychology, 14( 1).
Newbrough,1. R and Chavis, D. M. (Eds.). (1986b). Psychological Sense of community, II: Research and
applications. Journal of Community Psychology, 14(4).
Perkins, D. D., Florin, P., Rich, R. C, Wandersman, A., and Chavis, D. M. (1990). Participation and the
social and physical environment of residential blocks: Crime and community context. American
Journal of Community Psychology, 18,83-116.
Rohe, W. M. (1985). Urban planning and mental health. In A. Wandersman and R. Hess (Eds.), Beyond
the individual: Environmental approaches and prevention. New York: Haworth.
Sarason, S. B. (1974). The psychological sense of community: Prospects for a community
psychology.San Francisco: Jossey-Bass. ******
SOCIAL MEDIA FOR SUSTAINABLE DEVELOPMENT: A FRAMEWORK FOR SUCCESS IN
COUNTY GOVERNANCE
Otieno, C.O.
Faculty of Information Sciences and Technology, Kisii University
Correspondence: [email protected], Mobile: 0723 024 057
ABSTRACT
The promulgation of the Constitution of Kenya in 2010 ushered in a raft of reforms key among them
devolution. The major tenet of devolution is citizen participation in governance; decision-making and
implementation factors, functions, responsibilities and resources have been transferred to 47 county
governments across Kenya. Since its inception, devolution has faced a myriad of challenges. One of these
challenge is that of communication; involving citizens in the decision making process. For devolution to
be sustainable, a communication strategy has to be adopted that allows for the citizen and county
government to interact in an environment free of the bureaucratic red-tape that characterized governments
prior to devolution. Social media enables new approach to county governance that allows stakeholders
across board to engage in consensus building and implementation process. This paper explores a
framework through which social media can impact on devolution for sustainable development through
citizen participation. Specifically, this paper sought to; determine the factors that have influenced the

Proceedings of the Third International Research Conference held on 26th to 28th October, 2016 409
adoption of social media to enhance citizen participation, find out if social media are indeed useful tools
for sustainable development and how they can be harnessed to live up to their full potential. The paper
applied mixed methodologies and key informant interview was the Principal Information Officer of
Migori County, and survey of residents. Despite remarkable efforts in the use of social media to
communicate, county governments have failed to fully harness them to guarantee sustainable
development. County governments are urged to initiate a social media strategy to enhance dialogue with
their stakeholders, create interesting and engaging content as well as monitor and evaluate the
performance of these social media strategies.
Keywords: Social Media, Government, Sustainable Development, Devolution
INTRODUCTION
Communication is at the heart of every institution. For any institution to succeed in achieving its
objectives, it must communicate effectively with its stakeholders. Governmental institutions the world
over have embraced communication with their citizens and stakeholders. Traditionally, this
communication has been one-way, leaving no room for the recipient to participate. These traditional
modes of communication include newspapers, radio and television (Mishaal and Abu-Shanab, 2015). The
one-way model of communication resulted into a breakdown of communication between the government,
its citizens and stakeholders as it did not allow for citizen participation. In Kenya, the promulgation of the
2010 constitution introduced devolution that allowed for citizen participation in governance. Additionally,
the County Governments Act 2012 provided a framework for citizen participation that is based upon the
principle of timely access of information, data, documents and other relevant or related to policy
formulation and implementation. The platforms for citizen participation established by county
governments since the inception of devolution include; information communication and technology based
platforms; town hall meetings; budget preparation and validation fora; noticeboards that announce
importance information of public interest; establishment of citizen fora at county and decentralized units.
More so, public communication has been based on the principle of integration of communication in all
development activities and the establishment of a county media that creates awareness on devolution and
governance; promote citizens’ understanding for purposes of peace and national cohesion; as well as
undertake advocacy on core development issues such as agriculture, education, health, security,
economics, sustainable environment among others.
This means that advocacy on the 17 Sustainable Development Goals (SDGs) and the 169 indicators lie
squarely on the lap of devolved units that must come up with a communications framework and clear
pathways that will ensure the implementation of the SDGs is successful at the county level. Currently,
most county communication frameworks include established mechanisms to facilitate public
communication and access to information in the form of media with the widest public outreach in the
county, which may include television stations; information communication technology centers; websites;
community radio stations; public meetings; and traditional media. Additionally, county governments have
adopted social media as a new tool that enables a fresh approach that allows stakeholders across board to
engage in consensus building and implementation process. These social media tools, especially Facebook
offer particular utility to a government that wants to embrace citizen participation. Unlike traditional
media campaigns, social media provides novel opportunities for counties to embed and interject
sustainable development messages into the daily conversations of county residents.
When the right communication strategy is employed, it will enable people to understand important factors
of their physical, social and economic environment and how they link together so that issues of
sustainable development can be addressed effectively. Sustainable development as proposed by the
Brundtland Commission is “development that meets the needs of the present without compromising the
ability of future generations to meet their own needs” (United Nations General Assembly, 1987). Though
this definition is brief, subsequent paragraphs of the report are clear on environment and development. On
development for instance, the report states that human needs are basic and essential; that economic
growth – but also equity to share resources with the poor – is required to sustain them, and that equity is
encouraged by effective citizen participation (Kates, Parris, and Leiserowitz, 2005). Since citizen
participation is at the core of devolution, county governments stand a better chance of effecting
Proceedings of the Third International Research Conference held on 26th to 28th October, 2016 410
sustainable development. County governments are organized into sectoral ministries and departments
including, health, environment, natural resources and disaster management, agriculture, livestock,
fisheries and water development, trade, tourism and cooperatives, roads, transport, public works and
energy among other departments. For sustainable development to take root in counties, these sectoral
departments need to work together and involve citizens through communication.
Through employing social media, a government can improve its sustainable development
communications significantly. Governments can leverage social media for effective communication by
employing the Five Es; engagement, education, efficiency, elevation and entertainment (Maria, 2012). By
using social media, the county government engages citizens on issues of sustainable development in a
multi-way model that will lead to a better understanding of the issues being raised. Residents can also be
educated on the importance of conserving the environment and adopting best practices that will promote
sustainable development. The government can promote events and highlight its achievements thus
empowering the citizenry with information regarding sustainable development. Social media is efficient.
Governments incur little cost when using social media to spread messages and inform many people thus
saving money that can be used elsewhere.
Social media elevates a citizen’s needs to the fore where governments can see and respond to them.
Governments can use social media to promote entertainment activities within their areas of jurisdiction.
These entertainment activities can include– a county’s Agricultural Show where the county government
can educate citizens on sustainable development. Bertot, Jaeger, Munson, and Glaisyer (2010) agree that
indeed social media can offer a government immense opportunities as far as sustainable development
communications is concerned. They list the opportunities as follows; Democratic participation and
engagement, using social media technologies to engage the public in government fostering participatory
dialogue and providing a voice in discussions of policy development and implementation; Co-production,
in which governments and the public jointly develop, design, and deliver government services to improve
service quality, delivery, and responsiveness; Crowdsourcing solutions and innovations, seeking
innovation through public knowledge and talent to develop innovative solutions to largescale societal
issues.
LITERATURE REVIEW
Brief Overview of Social Media
As a term, “social media” is believed to have been used for the first time in 1997, when the then AOL
executive Ted Leonsis proposed that organizations needed to provide their stakeholders with “social
media, places where they can be entertained, communicate, and participate in a social environment”
(Bercovici, 2010). According to Boyd and Ellison (2007), SixDegrees.com which is believed to be the
first publicly popular Social Networking Site (SNS) that let users create online personal profiles and lists
of friends was launched in the same year. In 2000, social media received a great boost with the
‘witnessing of many social networking sites springing up’ (Hudson, 2010). This was a major boost to the
interaction of individuals and organizations that share common interest in music, education, movies, and
friendship based on social networking. Junco, Heibergert and Loken (2011) found that around this time,
other social networking sites were also launched. They included; Fotolog, Sky Blog and Friendster
launched in 2001; MySpace, LinkedIn, LastFM, Tribe.Net, Hi5, and others created in 2003. In 2004,
popular names like Facebook, Dogster and Mixi emerged.
The term “social media” refers to a group of internet based applications that have been built on the
ideological and technological foundations of Web 2.0 that allow creation and exchange of User Generated
Content (Mishaal and Abu-Shanab, 2015). They include Facebook, Twitter, blogs, Google plus, wikis and
YouTube, all of which are based on Web 2.0 technology. Web 2.0 technologies are characterized by
interactivity, user generated content and multi-directional communication flows. They mark a shift from a
“one-way conversation” model to a “two-way conversation” model where users participate as both
creators and consumers of content (Hudson, 2010).

Proceedings of the Third International Research Conference held on 26th to 28th October, 2016 411
These salient features of social media have revolutionized government communication. As defined by
Pasquier (2012), government communication refers to all the activities of public sector institutions and
organizations that are aimed at conveying and sharing information, primarily for the purpose of
presenting and explaining government decisions and actions, promoting the legitimacy of these
interventions, defending recognized values and helping to maintain social bonds. It was not until after the
2008 U.S. Presidential elections that governments began embracing social media as a tool for
communication. In that election, President Obama utilized social media in a way never witnessed before.
Many people even believe that was the major factor that contributed to his win (Qualman, 2011). This
proved that indeed, social media tools are not only powerful, but influential as well. It encouraged the
federal government to utilize these tools to strengthen its relationship with the public. A short while after,
the U.S. General Services Administration (GSA) set up the Office of New Media to utilize social media
on a national level (U.S. National Archives and Records Administration, 2009). In 2009, the agency
signed terms of agreement with multiple social networking sites and opened up regional offices in the U.S
that used social media to communicate with local communities and stakeholders (Guida, 2011).
After the 2008 U.S. Presidential elections, social media grew to become a must have for any vibrant
government communication strategy. The social media tools improve interactivity between a government
and the public and they reach populations that do not consume traditional media as frequently as others
(Bertot, Jaeger, Munson and Glaisyer, 2010). This new technology allows officials in governments to
build relationships with key stakeholders, in this case the citizens it represents. The relationship-building
potential of social media is especially valuable to public relations professionals in government institutions
since building relationships is at the core of public relationships (Ledingham, 2003). In addition, social
media also enhances a government’s ability to interact with and engage citizens as well as to meet their
expectations for transparency. Government officials now have more tools at their disposal to engage and
communicate with the public than ever before. A recent survey showed that two-thirds of online adults
use social media platforms (Smith, 2011). Also, 40 per cent of Internet users go online for data about
government operations, and social media users are more tied to civic groups (Raine, 2011).
The importance of government communications in engaging the public remains a critical element to
building relationships with citizens and addressing the public interest. Previously, government
communication was characterized by a one-way communication between a government and its
stakeholders. Dixon (2010) also concurs that historically, governments have relied on this one-way
communication model which is just the dissemination of information to the public. This one-way
communication model often hindered effective government communication. Added with the bureaucratic
layers that characterize government institutions, governments could not communicate with their citizens
in an engaging, collaborative forum. But with the incorporation of social media in government
communication strategies, the bureaucratic thinking in governments has been modified thus paving way
for the government to incorporate a two-way communication model.
Social Media Usage by Migori County Government
Social media exists in different forms. Mayfield (2008) for instance categorize social media into social
networks, blogs, wikis, podcasts, forums, content communities and micro-blogging. Kaplan and Haenlein
(2010) split social media into three levels. The first level consists of collaborative projects such as
Wikipedia. The second level consists of content communities like YouTube and Facebook that enable
users to share multimedia content and lastly online games and social worlds which can create virtual
worlds that imitate all dimensions of face-to-face interactions. Though these social media tools vary
dramatically in their purposes and approaches, they share an emphasis on enabling users to communicate,
interact, edit, and share content in a social environment (Porter, 2008; Tepper, 2003). Migori County
Government has a Facebook Fan Page called Migori County Government, created with the sole aim of
engaging with the public in a direct manner as well as making government communication more open.
The page has 3,000 followers.
With an online community of 1 billion users worldwide, Facebook is the leading global social media
platform. The same applies locally. Kenya has 5.2 million monthly Facebook users spending six hours

Proceedings of the Third International Research Conference held on 26th to 28th October, 2016 412
and 38 minutes daily on the internet, according to the head of Facebook for Africa Nunu Ntshingila
(Wainainah, 2016). This huge number of the Kenyan community participating on the Facebook platform
gives county governments in Kenya the opportunity to interact effectively with and inform citizens
without adding additional expenses to already strained government budgets. Strecker (2001) avers that the
sites’ features have been changing since its inception to not only accommodate the growing number of
users but also adapting its features to serve different interests. In 2004, only Ivy League college students
could join until it opened to the public in 2006, where individuals were able to create their profiles.
Organizations however could only create groups but this changed in 2007 when Facebook added the Fan
Page model that allowed organizations to create a Fan Page with the same look and feel as a Facebook
profile and to generate content that would post into a Fan’s newsfeed. Fan Pages provide organizations
with an opportunity to interact with Facebook members by; prompting members to join a Fan Page by
choosing to click “like” and demonstrate their affinity for an organization by becoming a member of
“Fan” of the specific Fan Page; Encouraging organizations to share information such as news stories,
updates, meeting announcements, event invitations, website links, photos and videos by posting these
items to the Fan Page. These types of information are called “posts”; allowing Fans to comment or ask a
question responding to a post on a Fan Page; allowing Fans to “like” a post on a Fan Page by clicking the
like button on each post and; allowing Fans to share Fan Page content with their personal Facebook
communities (Strecker, 2001).
Social Media Challenges
Marc Hudson of the Public Health Agency of Canada identified the following challenges communicators
face in implementing a social media strategy (Hudson, 2010). First, government agencies are slow in
adapting to change. This is mainly brought about by the bureaucratic layers of government and by the
time they adapt and implement strategies for new media, user behaviors have already evolved, and the
public mood has shifted to a new thing. Second, multiple layers of policies and processes governing
information flow in governments impairs rapid responses to public mood or individual information needs
or requests. When a resident raises an issue, he/she expects a response in hours or days on the maximum
and not weeks or months. If this information they seek delays, they will look for it elsewhere.
Need for the Study
Social media offer opportunities for governments and citizens, who have the ability to communicate with
each other through an extra communication channel. As a result, governments can reach citizens that they
would not have reached through traditional media; governments can also communicate with citizens more
directly and they can be more transparent about their activities. Governments can also build strong
relationships with citizens and they can easily monitor the state of affairs on social media an act on this.
Despite these benefits that social media can offer when it comes to educating citizens on issues of
sustainable development, challenges still remain. One of these challenges is the lack of a proper social
media strategy that can ensure sustainable development succeeds hence the need for this study. This
study will be significant for government employees using social media for official government
communication purposes and also for the same employees when they are using social media
personally when their government affiliation is identified, known or presumed. Government
organizations will also use the research findings to measure and improve their performances. It
will contribute to a better understanding of the role of social media in promoting issues of
sustainable development at the county level. This, in turn, will offer insights to the formulation
of effective social media strategies to county government information officers. The study will
also be scientifically significant since there is a paucity of research in Kenya in the field of social
media and sustainable development. It will be enriching to researchers and academic institutions.
Media scholars will benefit from these findings and add to the general body of social media and
sustainable development research.
Research Objectives
Building on the previous works mentioned above, the research was designed to examine the impact of
social media on ensuring the success of sustainable development at the county level. Specific objectives

Proceedings of the Third International Research Conference held on 26th to 28th October, 2016 413
of this paper are to; determine the factors that have influenced the adoption of social media to enhance
citizen participation, find out if social media are indeed useful tools for sustainable development and how
they can be harnessed to live up to their full potential.
METHODOLOGY
Being a case study of Migori County government, the county government offices was the main research
site as it administrative center of Migori County. Additionally, the county government headquarters has
the largest population of staff and also accommodate the Communications Office which primarily
discharges government communications functions that were of interest to this study.
Migori County is one of the forty-seven counties in Kenya. It is situated in the South-Western part of
Kenya. It borders Homa Bay County to the North, Kisii and Narok Counties to the East and the Republic
of Tanzania to the South. It also borders Lake Victoria to the West. The county is located between latitude
0o 24’ South and 0
o 40’South and Longitude 34
o East and 34
o 50’East. The total population of Migori
County according to the 2009 population census was 917,170 comprising of 444,357 males and 472,814
females or 48.6% male and 51.4% female. The population is youthful, with 49% are children aged below
15 years while 78% is aged below 30 years. (Migori County Integrated Development Programme, 2013).
In order to understand how Migori County government uses social media to communicate with its key
clients, a key informant interview was conducted with the Communications Director who is responsible
for the management of Migori County’s corporate social media accounts. Data was also collected through
a survey of 80 residents from Migori Town center. Study sample was arrived at by selecting 20
individuals from each of the 4 outlying areas adjacent to Migori Town (Oruba, Total, Banana and Apida).
The study used convenient sampling. Target areas for the sampling were chosen conveniently within the
environs of Migori Town. To ensure comprehensive data validity the subjects were randomly selected
from each area or zone, making them 80 in total. Random sampling was done with care taken to ensure
that 50 percent were males and another 50 percent females for gender parity.
Written questionnaires were distributed to the Communications Director and Online Reporters from the
Communications Department. These Online Reporters are charged with the responsibility of managing
websites and social media accounts of the county government. Thus, they are reliable professionals who
have firsthand knowledge and experience with developing social media frameworks that can ensure the
county government succeeds in mobilizing residents to achieve sustainable development goals. The
feedback presented from the respondents’ questionnaires were analyzed and interpreted with the help of
Statistical Package for Social Sciences (SPSS) software. Findings were subjected to descriptive analysis
RESULTS AND DISCUSSION
Background Information of Research Respondents
The research focused on Migori County residents and key informants from the county government’s
communication department who are authorities in the area of social media. The sample was made up of
80 respondents ranging from 21 to 51 years old. A total of 80 questionnaires were distributed. Of these,
70 were returned putting the response rate at 90%. Out of the 70 respondents, 50% were males and
another 50% females for gender parity. The distribution of respondents according to age was as follows;
42.5% were between 21-30 years, 30% were aged between 31-40 years, 17.5% were aged between 41-50
years while 10% were aged over 51 years. The researcher also wanted to know if the respondents had a
social media account. Out of the respondents sampled, 97.8% of them owned social media accounts while
the remaining 2.2% did not own any.
Widely used Social Media Tools In this section the researcher sought to establish the most widely used social media tools by Migori County
residents and why they chose that particular social media tool. When asked to mark the social media tools
they use, 62 respondents (89%) said they use Facebook, 6 respondents (9%) used Twitter while the least used
social media tool were the blogs with 2 respondents (2%) acknowledging using it. When asked why they use
that particular social media tool, many attributed their preference to ease of use and the fact that most of their
friends and organizations are on it. County governments with strong presence on Facebook communicate

Proceedings of the Third International Research Conference held on 26th to 28th October, 2016 414
with the majority of their citizens on matters of sustainable development as compared to those without a
strong presence on Facebook. As the most popular social media tool, Facebook should be utilized by counties
to advocate issues of sustainable development.
How Respondents Frequently Posted Statuses on Facebook
The researcher attempted to find out how often the respondent posted a status on Facebook and the
following observations were made: 5% have never, 13.3% of them indicated that they post on Facebook
monthly, 15% indicated fortnightly, 25.8% indicated that they post on daily basis ,40.8% of them post on
weekly basis.
Table 1: Displays information on how often respondents post status on Facebook
Period Frequency Percentage
Daily 20 28.6
Once a Week 32 45.6
Fortnightly 9 12.8
Monthly 8 11.4
Never 1 1.4
Total 70 100
From the table above it can be gleaned that Facebook is still a popular communication channel since
majority of residents samples use it either daily or on a weekly basis. It is therefore important for county
governments to aggressively engage stakeholders on Facebook frequently in order to promote issues of
sustainable development.
How Often the Respondents Visit Migori County Government’s Facebook Fan Page
Table 2: Describes how often respondents visit Migori County Government’s Facebook Fanpage
Period Frequency Percentage
Daily 36 51.4
Once a Week 20 28.6
Fortnightly 7 10
Monthly 5 7.1
Never 2 2.9
Total 70 100
The researcher wanted to find out how often the respondents visit Migori County government’s Facebook
Fan Page. The following observations were made: 3% do not visit Migori County government’s Facebook
Fan Page, 51% visited on a daily basis, 29% visited once a week, 10% fortnightly and 7% once a month.
The findings indicate that majority of residents visit the Facebook Fan Page several times a day proving
that the sites are helpful. The onus is on the county government to make maximum use of its Facebook
Fan Page to encourage communication with its citizens on a regular basis. The county government’s
social media team should also promote the Facebook Fan Page using Facebook Ads to ensure it reaches a
wider audience. This will translate into success in the government’s efforts to engage the public on issues
of sustainable development.
From the pie chart above 40% of those who participated in the study indicated that they encounter
challenges while communicating with Migori County government through Facebook while the remaining
60% have never encountered any challenges. Those who faced challenges while communicating with
Migori County government on Facebook bemoaned the lack of immediate feedback from the county
government’s social media administrators. They said the county government took a long time to respond
to their queries. Others also said that slow internet connections impeded their communication with the
county government on social media.

Proceedings of the Third International Research Conference held on 26th to 28th October, 2016 415
Whether the respondents face any challenge while communicating with the county on Facebook
60%
40%
Challenges while communicating with the county
Yes No
Pie Chart 1.0 Displays information on whether the respondents had any challenge communicating
with the county government on Facebook
Factors That Have Influenced the Adoption of Social Media by Migori County Government
The researcher conducted a 30-minute key informant interview with the Communications Director of
Migori County government. The responsibility of the Communications Director is to initiate and develop
Migori County government’s social media communications initiatives. For this reason, he has first-hand
knowledge and experience with the use of social media. The interview was done with the possibility of
follow up emails on issues that needed further clarifications. This study reveals that Migori County
government viewed social media as a progressive communications technology and a way to connect with
residents who were already using social media to communicate. The study also revealed that Migori
County government mainly used Facebook as its social media channel of communication. However, the
county still maintained other social media channels including Twitter and blogs.
During the interview, the Director said that the Communications Department of Migori County
government was very strategic in the way it packaged information for various social media audiences and
that this always guaranteed immediate success in the county’s communications efforts:
“We normally simplify and package our information depending on our target audience. For
example, information on county government projects launched by the governor in different wards
across the county attracts a lot of shares and interaction on our social media platforms by Migori
County residents both living in the county and abroad.” (Research data, 2016)
Migori County government uses social media tools alongside other communication modes like radio,
television, newspapers, websites, newsletters, notice boards and brochures. This presented a win-win
situation as those who did not get information from the aforementioned channels still get the same
information from social media sites. On whether the county government measured and evaluated their
social media activities, the communications director said there was no such thing. This has prevented the
county government from coming up with a successful social media framework that will ensure success of
informing residents on sustainable development. Burson-Masteller (2012) opines that organizations must
monitor their own social media presence to ensure a consistent brand message and to measure the impact
of their social media engagement. Migori County for instance should use the free social media monitoring
tools available online such as; TweetReach, Hootsuite, Socialmention, TweetDeck among others.
The Communications Director said that Migori County government adopted social media because it
enabled the county government to access a wider audience:
“Facebook, being the widely used social media tool, allows us (Migori County government) to
reach a wider audience thus improving the accessibility of government communication. It allows
us to post on different topics that are relevant to the audience, topics such as sustainable
development and to get immediate audience feedback and input on the same. It is also cheap, thus
saving the county government funds that would have been used to book space in traditional media
like radio, television and newspapers.” (Research data, 2016)

Proceedings of the Third International Research Conference held on 26th to 28th October, 2016 416
The Director also agreed that once in a while, the social media team carries out sustainable development
education by updating the official Migori County government Facebook Fan Page with messages that
create awareness, provide county residents with knowledge on sustainable development. The
Communications Director acknowledged the importance of such information in not only changing the
attitude of residents but also motivate them to actively participate in sustainable development activities.
“Mostly we post news items regarding issues and problems of sustainable development like
proper waste management, sustainable agricultural practices, planting of trees among others.”
(Research data, 2016)
The interview also revealed that in as much as the county government strives to educate the residents on
matters of sustainable development, the online reporters charged with updating the official government
social media pages do not comply with the Communication Director’s policy. The Communications
Director indicated this as one of the challenges he faces while trying to adopt a communications strategy
that will ensure the success of sustainable development. Findings from the interview revealed that most of
the time the online reporters don’t consult him before posting on Facebook. Consequently, the content
that they post is not aligned towards embedding sustainable development messages into the daily
conversations of county residents. In the unlikely event that they consult the Communications Director,
the online reporters are not consistent with posting sustainable development messages on Facebook.
Consequently, the attention of the residents in not captured and sustained on issues of sustainable
development. Additionally, most officials in the county government do not understand the power of social
media and as such see no need of funding the director to run sustainable development campaigns on
social media.
Harnessing Social Media for Sustainable Development
Table 3: Opinions of the respondents regarding whether social media is an effective tool for
promoting sustainable development
Opinion Frequency Percentage
Strongly Agree 31 44.3
Agree 27 38.5
Not Sure 6 8.6
Disagree 4 5.7
Strongly Disagree 2 2.9
Total 70 100
From the table above, it is evident that most of the respondents were of the opinion that social media
especially Facebook is proving to be useful in sensitizing residents on sustainable development. An
overwhelming majority of 44.3% of the respondents strongly agree while a paltry 2.9% strongly disagree
with the statement that social media can be useful in promoting sustainable development.
CONCLUSION AND RECOMMENDATIONS
Based on the research findings, observations, and respondents’ standpoints, some suggestions and
recommendations are made. It goes without saying that social media is a great platform if governments
are to achieve success as far as promoting sustainable development at the county level is concerned. They
improve reach and promote messages, they can rapidly capture the public mood, sentiment and
knowledge about sustainable development issues and more importantly, social media tools offer an
inexpensive way for county governments to carry out sustainable development messages. But as county
governments are embracing social media to communicate with their citizens on issues of sustainable
development, it is important for them to identify the specific social media tools commonly used by their
citizens and stakeholders as well as factors that influence the adoption of these technologies. Once a
social media tool, say Facebook has been adopted, it is also important for the communications staff to
have a social media strategy in mind before using the medium. If county governments adopt a blind, non-
strategic use of social media, they will fail to embed and interject sustainable development messages into
the daily conversations of county residents. The CPEM and E (Content, Promotion, Engagement,

Proceedings of the Third International Research Conference held on 26th to 28th October, 2016 417
Measuring and Evaluation) strategy is recommended as one that will promote sustainable development
through social media at the county level.
Content: Social media management teams at the county level need to package content, which in this
case are sustainable development messages in an appealing way so that when its posted on Facebook,
it leaves a lasting impression. The content should not only be text based but should also include short
videos and creatively designed infographics that appeal to the audience.
Promotion: In order for any meaningful change to occur, the sustainable development messages
should reach a wider audience. Counties therefore need to promote their Facebook Fan Pages to reach
many people. This can be done by utilizing Facebook ads. For as little as Ksh.300/= a Facebook post
can be promoted to reach about 7,800 people.
Engagement: The major strength of Facebook is that it provides a platform for the sender and the
receive engage in a two-way communication model. Social media managers at the county level
therefore need to utilize this by engaging the audience by not only listening, but also responding to
questions raised by the citizens about sustainable development on Facebook.
Measuring and Evaluation: The communications departments at county levels need to invest in social
media measuring tools to measure the impact of their social media engagement. Free online
measuring tools available include HootSuite, SocialMention and Tweetdeck among others. This
should be done regularly, preferably every week. Once this is done, the county social media teams
will be able to take stock of the sustainable development messages they post on Facebook.
Consequently, they will be able to either improve the existing strategy or come up with a new social
media strategy depending on the results.
There is need to conduct a social media training workshop involving all the county government
employees (both senior and junior) that will educate them on the importance of embracing social
media as an important tool for communication. This will change their perception of social media and
enable the senior county officers to avail funds for running social media campaigns.
REFERENCES
Bercovici, J. (2010, December 9). Who coined “social media”? Web pioneers compete for credit.
Retrieved from HYPERLINK "http://blogs.forbes.com/jeffbercovici/2010/12/09/who-coined-
%20social-media-web-pioneers-compete-for-credit/"
http://blogs.forbes.com/jeffbercovici/2010/12/09/who-coined- social-media-web-pioneers-
compete-for-credit/
Bertot, J. C., Jaeger, P. T., Munson, S., and Glaisyer, T. (2010). Engaging the public in open
government: The policy and government application of social media technology for government
transparency. IEEE Computer, 43(11), 53–59.
Bertot, J. J. (2010). Social Media Technology and Government Transparency. IEEC Computer Society,
50-62.
Dixon, B. (2010). Towards e-government 2.0: An assessment of where e-government 2.0 is and where it
is headed. Public Administration and Management, 15, 418-454.
Edosomwan, S., Prakasan, S. K., Kouame, D., Watson, J., and Seymour, T. (2011). The History of Social
Media and its Impact on Business. The Journal of Applied Management and Entrepreneurship ,
16 (3), 2.
Guida, M. (2011). The Utilization of Social Media: A Case Study of the U.S. General Services
Administration Experience. Georgia: Dissertations, Theses and Capstone Projects.
Hudson, M. (2010, June 17). Web 2.0 and Social Media; Lessons Learned Retrieved from IPAC:
http://www.google.ca/#hl=enandq=hudson+social+media+lessons+learned+pptandaq=fandaqi
=andaql=andoq=andgs_rfai=andfp=e152ff60f580dc26.
Junco, R., Heiberger, G., and Loken, E. (2011). HYPERLINK
"http://reyjunco.com/wordpress/pdf/JuncoHeibergerLokenTwitterEngagementGrades.pdf" \t
"_blank" The effect of Twitter on college student engagement and grades . Journal of Computer
Assisted Learning, 27(2), 119-132. doi:10.1111/j.1365-2729.2010.00387.x
Kates, R., Parris, T. M., and Leiserowitz, A. A. (2005). What is sustainable development? goals,
indicators, values, and practice. Environment: Science and Policy for Sustainable Development,
47(3), 8-21.

Proceedings of the Third International Research Conference held on 26th to 28th October, 2016 418
Ledingham, J.A. (2003). Explicating relationship management as a general theory of public relations.
Journal of Public Relations Research, 15. 181-198.
Maria, J. M. (2012, August 23). Government Technology. Retrieved from CIOs Flock to Social Media;
Why maintaining a social media presence is important, and how it benefits governments and
citizens.: http://www.govtech.com/pcio/CIOs-Flock-to-Social-Media.html
Mishaal, D. A., and Abu-Shanab, E. (2015). The Effect of Using Social Media in Governments:
Framework of Communication Success. The 7th International Conference on Information and
Technology (pp. 357-364). Jordan: ICIT .
Pasquier, M. (2012). Government Communication. Encyclopedic Dictionary of Public Administration , 1-
3.
Porter, J. (2008). Designing for the Social Web. Thousand Oaks, CA: New Riders Press.
Qualman, E. (2011). Socialnomics: How Social Media Transforms the Way we Live and do Business.
Hoboken, NJ: John Wiley and Sons, Inc.
Raine, L. (2011). Social media and civic life. Retrieved from
http://www.pewinterest.org/Presentations/2011/Oct/NASGO.aspx
Smith,A. (2011). Why Americans use social media. Retrieved from
http://www.pewinternet.org/Reports/2011/why-Americans-use-social-media.aspx
Strecker, A. (2001). Flocking to Facebook: How local governments can build engagement. Carolina:
UNC Chapel Hill.
Tepper, M. (2003). The rise of social software. NetWorker, 7(3), 18–23.
U.S. National Archives and Records Administration. 2009. Office of the Federal Register. Memorandum
for the heads of executive departments and agencies: Transparency and
open government. Federal Register 74(15): 4685.
United Nations General Assembly. (1987). Report of the world commission on environment and
development: Our common future. Oslo, Norway: United Nations General Assembly,
Development and International Co-operation: Environment.
Wainainah, D. (2016, April 15). Kenyans spending six hours on Facebook everyday – survey.
Nairobinews. Retrieved from http://nairobinews.nation.co.ke/life/kenyans-spending-six-hours-
facebook-every-day-study/ ******
A COGNITIVE BLENDING ANALYSIS OF IDIOMS IN NTV’S SEGMENT: “BULL’S EYE”
Ogal, G.O. and Karuri, T.M.
Department of Languages, P. O. Box 1957-10101, Karatina University, Kenya Tel.: +254713907287; Email: [email protected]
ABSTRACT
The choreography of certain language data requires analysis beyond the boundaries of conventional
provisions is the blast-off point in the studies investigating the correlation between cognition and
language. However, delimited attention has hitherto been paid to the unlocking of blended idioms within
the Cognitive Integration Perspective in the Kenyan locale. In this chapter, therefore, we analyze the
processes of perception and meaning of blended idioms vis-à-vis the canonized forms in Bull’s Eye aired
every Friday on NTV. The program is a hilarious satire summarizing weekly socio-political unfolding in a
manner exhibiting a rarity of linguistic expression. In order to unlock both literal and figurative meanings,
it is salient to explicate the mechanisms by which local context affects the process of idiom construction
within the postulates of Cognitive Integration Theory (CIT) whose premise penetrates minds thus forming
networks of mental spaces exploring human information integration. Using conventional content
analysis, the chapter identifies, classifies and attempts a conceptual interpretation of new knowledge
based on metaphorical mappings to illustrate the emergent structures. The general finding of the chapter is
that a striking feature of human communication is to create new meanings using blending which improves
figurative competencies. The chapter, therefore, recommends that for a better understanding of blended
idiomatic expressions and other phraseological items, one should consider contexts expressed in
language. We, therefore, conclude that idioms achieve creativity and novelty and should be explained

Proceedings of the Third International Research Conference held on 26th to 28th October, 2016 419
using a cognitive linguistics approach. Further, blended idioms, when subjected to inadequacies of
grammar alone, robs one of the ability to appreciate new interpretations.
Keywords: Idiom, blending, Cognitive Integration, Mental spaces, Bull’s Eye
INTRODUCTION
The Nexus between Language and Cognition The occurrence of certain experiences in communication beckons linguistic intervention which ultimately
unearths perceptual orientation of the world around us in spontaneous and unconscious ways. Manifold
linguistic phenomena require lenses over and above the basic branches of language in their interpretation
(Fauconnier and Turner, 2002). The desire to break away and form an autonomous branch of linguistics
going beyond the yardstick of fundamental branches of language (phonology, semantics, pragmatics,
morphology and syntax) begot the concept “Cognitive Linguistics” which maturated a perceptual
apparatus defining the nexus between language and thought (Johnson and Lakoff, 2002). Verifiably,
Cognitive Linguistics dates to scores of years in scholarship taking momentum in 1970’s (Fillmore,
1975). Henceforth, intellectual efforts have considered Cognitive Linguistics a field that illuminates
minds to retrieve mental processes and images as motivated by neural functions which are the basis for
linguistic expression. Along these lines, Coulson and Oakley (2005) postulate that language is primarily a
matter of thought and action and that the explication of any abstract concept leans on the background of
the utterance. The utility of Cognitive Linguistics was verified in the study of abstract imagery such as
analogy, idiomatic expressions, metaphor, metonymy and counterfactual reasoning, all of which Formal
Linguistics cannot unwrap for lack of principles of operation.
The nexus between the mind and socio-cultural setting falls within Cognitive Linguistics which is an
appliance exploited to make sense of experiences in contexts where provisions of grammar are not up to
scratch (Evans, Bergen and Zinken, 2007). In a dry run to unmask the term cognitive4, Evans and Green
(2006) penetrate the human mind and outline an imaginative process in which language gives way to
well-ordered thought processes. They add that human interaction with the environment coins new
expressions that have to rely on sensory experiences and contextual information for decoding, a reality
that neatly ascertains the relationship between language and cognition.
The place of Modified Idiomatic Expressions in Communication
Idioms, the burden of this paper, have been associated with metaphors, a truism, which places it within
the domains of cognition. Gibbs (1980) defines an idiom as the kind of language used by particular people
at a particular time or place and adds that idioms are composed of words whose meaning is different from
individual elements. Commenting on the rampancy of idiomatic expressions in speech, Cacciarai and
Tabosi (2014) observe that a striking feature of human communication is to create new meanings using
either canonized forms of idioms or modified (blended) forms to improve figurative competencies. As
supported by De Caro (2009), the creative use of idiomatic expressions achieves novel meanings and
indirect reference to situations that conventional language may discuss with varied degrees of limitation.
Etymologically, the word “idiom” is derived from the Greek word “idioma” which means “a peculiar
phraseology of a people” (Bollas, 1989). He adds that it is against the background of the cultural
orientation that we can comprehend the use of and idiom because it does not appeal to every reader.
In the present study, idiom blending forms a fertile area to probe as it operates within the domains of
cognitive linguistics which evokes our conceptual system and domains of experience to make sense of the
world around us. In the study of Idioms of freedom in Kenya, Nyairo and Ogude (2005) underscore that
peculiarity in meaning of idioms evoke universal acceptability and an attempt to restructure the
4 The analysis of language as applied in descriptive and theoretical frameworks heavily relies on Cognitive
Linguistics, a framework prescribed by many scholars as a new arrival that unravels meaning where formal branches
of linguistics have dismally failed (Geeraerts, 2006). In this model, abstract concepts are considered a process of
cognition of ideas. He adds that previous studies on applicability of Cognitive Linguistics in investigating abstruse
concepts have not attained much assiduity among scholars. Thus, a coherent answer would be attained by immersing
one’s self in studious endeavors to unpack meaning using this apparatus.

Proceedings of the Third International Research Conference held on 26th to 28th October, 2016 420
choreography of the canonized forms leads to novel meanings that can be interpreted against
geographical, political, social and economic backdrops. Ogola (2006) observed that a popular culture has
arisen where speakers and writers blend idiomatic expressions to create novel impressions against cultural
understanding.
Rationale of the Study
There is an apparent scanty formally documented empirical research on the role of Cognitive Linguistics
in unwrapping meaning of non-phraseological elements of language especially idiom blending where
grammatical functions cannot explain constructional operations. By way of example, Gathigia (2014),
undertaking a Cognitive Linguistic Analysis of metaphors of love in Gĩkũyũ, posits that provisions of
grammar are deficient in unpacking meaning of metaphors, a concept applicable to idioms which are non-
phraseological elements. This corroborates Zhang’s (2009) observation that there is limited research on
the role of Cognitive Linguistics in revealing modified forms of canonized expressions. He underscores
that rigorous efforts should concentrate on this area. The first motivation in this study is the sparsity
Cognitive Linguistics in the unearthing meaning of modified forms of non-phraseological items.
Secondly, our impetus to scrutinize idioms was due to a number of factors. To begin with, in the words of
Simpson and Mendis’ (2003, p.1), there is an observation that “the notion of idiom conjures up language
that is thought to be entertaining, engaging, charming, colorful and memorable”. This translates into a
large number of audience that will appreciate utterances having idioms that are either pure or modified as
such are avenues for achieving communicative brilliance. This is evident in the televised segment “Bull’s
Eye”, a hilarious satire summarizing weekly socio-political unfolding in a manner exhibiting a rarity of
linguistic expression thus drawing millions of views (Nyabuga et. al, 2013). Thus, television programs
often have an allurement to the viewers who are attracted to the brilliancy of language. Additionally,
idiomatic expressions, whether pure or modified, are not only linguistic features but vital handiwork of
varied cognition dependent on contexts (Coulson and Oakley, 2005). This makes them perform deeper
discourse functions than superficial lenses can appreciate. Against this background, the skilful use of
idioms may be pervasive as the viewers concentrate on the sarcasm yet ignoring the internal processes
underlying the non-phraseological items and their effects.
Consequently, this research was motivated by the fact that blended idiomatic expressions in speech or
writing are often very pervasive. Steinel and Hulstijn (2007) contend that the brilliancy in certain
communications sweep audiences to such a great degree that they do not even realize that some linguistic
features have been modified in order to create novel meanings and interpretations. Finally, our motivation
to use CIT5 to study idiom blending in Bull’s Eye is housed in Coulson and Oakley’s (2005)
contemplation that contemporary researchers on idiom blending should “give more serious consideration
to the precise nature of the role of contextual information in background cognition.” Along these lines of
thought, we chew over Idiom blending in NTV’s Segment Bull’s Eye.
Theoretical Framework
The present study is guided by Fauconnier and Turner’s (2002) Conceptual Integration Theory which was
later modified by Coulson and Oakley in 2005. This appliance is a conduit for investigating the vital
relations underlying cognitive operations of both phraseological and non-phraseological features of
language. This theory is also called Blending Theory (BT) and it seeps into our minds and establishes
connections “between our understanding of language and the way we comprehend human thought and
activity in general” (Delibegović 2007). This theory found its departure point in the seminal work of
Facounnier (1997) entitled Mappings in thought and language. Cognitive Integration Theory constructs
5 Conceptual Blending Theory is an apparatus that adopts a more scientific approach to account abstract notions in
language in terms of mental spaces which give rise to novel inferences motivated by contextual orientation.
Delibegović (2007) notes that blending falls under Cognitive Semantics which comes in handy to decode heavily
coded meanings so that speakers avoid hyper literal reasoning by creating spaces that are not grounded on the
superficial structures of the messages.

Proceedings of the Third International Research Conference held on 26th to 28th October, 2016 421
mental spaces that unfold the internal choreography and meaning of linguistic and non- linguistic features
above hyper-literal thinking.
In this apparatus, there is a construction of cognitive domains that are connected through Conceptual
Integration Networks. Coulson and Oakley (2000) propose that the network consists of four intertwined
spaces: input spaces, a generic space, the blended space and the emergent structure. The
interconnectedness of the mental spaces in various contexts gives rise to the novel meaning (Delibegović,
2007). In the process of modifying or blending canonized forms, the theory proposes three processes:
composition, completion and elaboration” all of which are the tenets of the theory. With these three
tenets, the theory gives an insight into our mind to provide local understanding. The connective threads of
the theory include cognitive blending networks, blending processes, optimality principles and Vital
Relations which help in the elaboration of meaning. The modification or blending of an idiom occurs in
such a way that certain relations as identity, time, space, cause-effect, uniqueness, part/whole,
representation, similarity, analogy, disanalogy, category, intentionality and role are maintained between
the original and blended form (Delibegović, 2007). The vital relations refer to mental spaces that form a
connection in the inner and outer space using the solid lines. Optimality Principles on the other hand, are
descriptions that further clarify or elaborate “the relations within the conceptual integration network”
(Gibbs, 2000). The spaces can be diagrammatically presented as shown below.
Figure 1. Blended space (Fauconnier and Turner, 2002)
In order to analyze a blending occurrence, the theory goes through a number of stages: the hypothetical
blend is introduced, followed by description of the conceptual structure in the spaces; as such, mappings
are established between the elements in the input spaces; finally, the structure of the blended space is
described depending on which aspects originate from the input spaces. The emergent structure which
sustains reasoning arises from contextual accommodation of one domain applied to different domains
(Coulson and Oakly, 2000). After the description, there is completion which occurs when information in
the long term memory is matched with the blend, a process which spreads activation of Semantic
networks. Lastly, Facuconnier and Turner (2002, p.44) explain that elaboration involves preserving the
links in the input spaces so that connections can pop out automatically to yield novel comprehension.
RESEARCH METHODOLOGY
This study adopted a qualitative research design. This is a precursory system explaining how things are by
informing the reader of phenomena as experienced by investigators and interpreted in relevant contexts
(Bryman, 2006). It used descriptive survey design since it focused on collection of blended idioms in
NTV’s Segment Bull’s Eye aired Mohammed Juma every Friday. Bull’s Eye was purposively sampled
due to the following reasons; to begin with, satirical program employs blended idiomatic expressions in

Proceedings of the Third International Research Conference held on 26th to 28th October, 2016 422
very subtle ways that meaning often eludes the viewers who only concentrate on the humorous sections;
political occurrences sway many viewers as these form a good way to summarize the happenings at the
end of the week (Nyabuga et al. 2012). Fifteen episodes of Bull’s Eye were purposively sampled. Content
analysis, a component of qualitative research paradigm proposed by (Creswell, 2012) guided the analysis
of idioms because the researchers are conversant with the English idiomatic expressions. The justification
to use content analysis was based on the fact that it is highly analytical and describes varied approaches
including but not limited to impressionistic, intuitive, and interpretive analyses. As echoed by Rosengren
(1981), any thorough undertaking and strict textual analysis requires content analysis for complete
immersion into the text. Further, content analysis was premised on the fact that it does not deal with
haphazard extraction of content to make meaning but rather a deeper analysis involving relational themes
(Patton, 2002). Finally, scores of researchers find content analysis as a flexible method for analyzing text
data (Patton, 2002). Thus, the researchers watched the episodes and presented findings as guided by CIT.
FINDINGS AND DISCUSSIONS
Having purposively sampled fifteen Bull’s Eye episodes, the researchers identified 10 blended idiomatic
expressions with different types of modification. The reason for including such a limited data is because
certain expressions were not properly represented and the connections were therefore unclear, making the
researchers unable to account for them. The summary of the data is as presented in the table below.
Because diagrammatic representations would consume much space, the researchers chose to illustrate just
five blends as the rest would take a similar structure.
Table 1: Blended idioms in sampled episodes
Canonized idiom Blended form Category of blend
Love triangle Slap ( boxing) triangle substitution
Go bananas Go popcorns substitution
Take to task Take to the movies substitution
Washing dirty linen in public Dirtying washing linen in school Permutation and substitution
Cup of tea Hot cups of kofi Addition
Burn bridges Burn mattresses substitution
All work and no play makes
jack a dull boy
All work and no swim and massage
makes MCAs dull boys and girls
Addition and substitution
New sheriff in town New jogoo in town substitution
Play cards right Play many cats Addition and substitution
Suffer the same fate Share the same gizzard Substitution
Love triangle (Boxing triangle)
This blended idiom has undergone substitution of the words boxing and slap for love. In the episode
where politicians’ tempers have flared and they are going for each other’s jugulars, the canonized idiom
(love triangle) which means “two people vying for the affection of a third” is modified to accommodate
the Kenyan context in which politicians, depending on their inclination, gang up against each other and
physically go for their throats. Since there is no one to one mapping between love and slap or boxing, the
Vital Relation in this blend can be considered as that of dysanalogy. The blend is closely integrated and
manipulated as a single unit. The diagrammatic representation using mental spaces is as shown below.
Go bananas-Go popcorn This substituted idiomatic expression was collected from an episode entitled “Week of Political
Discovery” in which members of the Senate went mad after a senator was infuriated after certain
members were allegedly bribed to de-emphasize a case requiring financial accountability. In this case
when everyone goes bananas (mad), others are said to have gone popcorns. The vital relation between
bananas and popcorns is that of category because both are foodstuffs. However, considering the nature of
popcorns and how its alleviation of hunger is short-lived, it would be imperative to borrow the political
happenings in which certain hot tempers do not take eternity to calm down. The banana republic is
compared to popcorn republic. The mental spaces can account for this as shown below.

Proceedings of the Third International Research Conference held on 26th to 28th October, 2016 423
Figure 2: Conceptual integration network for slap triangle / boxing triangle
Take to task -take to the movies
Figure 3 Conceptual integration network for take to task (take to the movies)
GENERIC SPACE
INPUT SPACE 1
Love triangle
BLENDED SPACE
Slap /boxing triangle
INPUT SPACE 2
Our knowledge of
politicians’ flaring
tempers and going
for the jugulars
GENERIC
SPACE
INPUT
SPACE 1
BLENDED
SPACE
INPUT
2
The political explosions/ pressure makes
a number of personalities pop out and
cause insurrection in the house or
political arena. However, their fury is
short-lived as we see them reconnecting
later in certain functions.
Go bananas
Go popcorns
GENERIC
SPACE
Take to
the
movies
Take to
task The entertainment oozing
from serious political
grilling and the lapses in
reports given to the public.

Proceedings of the Third International Research Conference held on 26th to 28th October, 2016 424
The canonical form “take to task” means to berate or make somebody accountable for their actions.
Blended in this form, the idiom take to the movies ignores the tensed atmosphere as a movie is an
occasion or relaxation. In the input space 1, we have take to task while in space 2, we have take to the
movies. Using the background of political cases in Kenya evoking little concern from the affected parties,
the episode likens the indifference to that of a movie viewer who does all in utmost relaxation and in full
cognizant of the fact that the episodes in a movie are purely fictitious and only meant for merriment. As
discussed by Zang (2009) , the most likely Vital Relation connecting spaces 1 and 2 would be that of
intentionality where one’s actions are motivated by desire, fear, memory and hope among others. Political
grilling is therefore a moment of relaxation because members come out entertained by the culprits. The
mappings would be as shown.
Cup of tea (hotter cups of kofi)
This idiomatic expression that has undergone addition was collected from the episode “Confusion on the
Dance Floor” featuring a woman giving a man serious blows. Against the background of being thwacked
by Kenyan women-especially those from Nyeri (whom the commentator cites), the idiom acquires the
new meaning. Tea and coffee are related by category. The Vital Relation is therefore that of Category.
However, the commentator must have used the word kofi* (a Kiswahili word for slap) which is a
homophone of the word coffee. Citing instances like the Kidero’s slap and Nyeri beatings, the reader
settles for Kofi instead of coffee. The blended meaning will therefore mean a woman’s wrath in
disciplining men in Kenya. The diagram is therefore as represented b
Figure 4. Conceptual integration network for Cup of tea (hotter cups of kofi)
Play cards (I have many cats to play)
This idiom was collected from the episode “A new Jogoo in Town” in which even the title itself is a
substituted idiomatic expression. Originally, the idiom play cards right means to behave in a manner that
is likely to make you succeed. However, the blended idiom which involves both addition and substitution
occurs in an environment of political violence in the assembly where people are fighting for
accountability of financial resources. Considering the nature of a cat and a card, the Vital Relation in this
process would be that of similarity in behavior. Politicians would therefore be portrayed as those with
nine lives just like cats which shove, push, manipulate and sweat out in the name of accountability yet
they just pursue their filthy lucre. The meaning of the blend therefore comes out as illustrated below.
BLENDED SPACE
Hotter cups of kofi*
The
stimulation of tea and
coffee
GENERIC SPACE
INPUT SPACE 2
INPUT SPACE 3
The wrath of Kenyan
women
INPUT SPACE 1
Cup of tea

Proceedings of the Third International Research Conference held on 26th to 28th October, 2016 425
Figure 5. Conceptual integration network for play cards right (many cats to play)
CONCLUSION
This research has established that there are certain principles governing the modification of idiomatic
expressions. It can be argued that certain canonical forms of idioms form the frames of thought and assist
in the structuring of mental spaces that lead to novel meanings or interpretations. The chapter therefore
concludes that a general feature of human nature is to create new meanings using blending which leads to
figurative competencies. We therefore recommend that because idioms are non-phrase logical elements,
their meanings should be explained using the postulates of Cognitive linguistic Approach. Lastly, the
inadequacies of grammar rob a reader of the ability to appreciate blended information, a condition that
necessitates the borrowing of a cognitive linguist’s lenses.
REFERENCES
Bollas, C. (1989). The Shadow of the Object: Psychoanalysis of the Unthought Known. Columbia
University Press.
Bryman, A. (2006). Integrating quantitative and qualitative research: How is it done? Qualitative
Research, 6 (1):97-113.
Cacciari, C. and Tabossi, P. (2014). Idioms: Processing, structure, and interpretation. Psychology Press.
Coulson, S. and Oakley, T. 2000. Cognitive Linguistics, 11(3-4). Special Issue: Conceptual Blending.
Coulson, S., and Oakley, T. (2005). Blending and coded meaning: Literal and figurative meaning in
cognitive semantics. Journal of Pragmatics, 37(10), 1510-1536.
De Caro, E. E. R. (2009). The advantages and importance of learning and using idioms in
English. Cuadernos de Lingüística Hispánica, (14), 121-136.
Džanić, N. D. (2007). Conceptual Integration Theory–the key for unlocking the internal cognitive
choreography of idiom modification. Jezikoslovlje, 8(2), 169-191.
Evans, V.; Green, M. 2006. Cognitive linguistics: Introduction. Lawrence Erlbaum Associates Publishers.
Evans, V., Bergen, B. K., and Zinken, J. (2007). The Cognitive Linguistics Enterprise: An Overview. The
Cognitive Linguistics Reader. Equinox Publishing, London.
Fauconnier, G. (1997). Mappings in thought and language. Cambridge University Press.
Fillmore, C. J. (1975, September). An alternative to checklist theories of meaning. In Annual Meeting of
the Berkeley Linguistics Society (Vol. 1, pp. 123-131).
The pushing, shoving,
manipulating d and sweating of
cats
INPUT 1
Play cards right
Many cats to play
The infamy of politicians

Proceedings of the Third International Research Conference held on 26th to 28th October, 2016 426
Gathigia, M. G. (2014). Metaphors of love in Gikũyũ: conceptual mappings, vital relations and image
schemas (Doctoral dissertation, Kenyatta University).
Geeraerts, D. (2006). Cognitive linguistics: Basic readings (Vol. 34). Walter de Gruyter.
Gibbs, R. W. (1980). Spilling the Beans on Understanding and memory for idioms in conversation.
Memory and Cognition, 8(2), 149-156.
Johnson, M., and Lakoff, G. (2002). Why cognitive linguistics requires embodied realism. Cognitive
linguistics, 13(3):245-264.
Juma, E. (2007, November 2). Bull’s Eye: Kenya Political Satire CTV 021107. Retrieved from
https://www.youtube.com/watch?v=Lo1r3AZ8hDk
Juma, E. (2016, July 17). Bull’s Eye: Confusion on the Political Dance Floor. Retrieved from
https://www.youtube.com/watch?v=2eVN8Ax0EAc
Juma, E. (2016, July 29). Bull’s Eye: Nkaissery not Letting Ole Lenku to "Tarmac in Peace". Retrieved
from https://www.youtube.com/watch?v=FOCMrQ-gitE
Juma, E. (2016, June 10). Bull’s Eye : Supremacy Race Brings out the Best and Worst in Politicians.
Retrieved from https://www.youtube.com/watch?v=KQpFZ0UpqRk
Juma, E. (2016, June 17). Bull’s Eye: Week of Political Discovery. Retrieved from
https://www.youtube.com/watch?v=SdzTAwvvzQc
Juma, E. (2016, Oct 7). Bull’s Eye: Little man Versus Desk Officer. Retrieved from
https://www.youtube.com/watch?v=8DtrqX46FfQ
Juma, E. (2016, September 30). Bull’s Eye: The New ‘Jogoo’ in Town. Retrieved from
https://www.youtube.com/watch?v=QypgUfjC50o
Nyabuga, G., Booker, N., Dragomir, M., Thompson, M., Jamaï, A., Chan, Y. Y., and Tambini, D. (2013).
Mapping digital media: Kenya. Open Society Foundations (internet source: http://www.
opensocietyfoundations. org/sites/default/files/mapping-digitalmedia-kenya 20130321. pdf).
Nyairo, J., and Ogude, J. (2005). Popular music, popular politics: Unbwogable and the Idioms of
Freedom in Kenyan Popular Music. African Affairs, 104(415):225-249.
Ogola, G. (2006). The Idiom of Age in a Popular Kenyan Newspaper serial. Africa, 76(04):569- 589.
Patton, M. (2002). Qualitative Evaluation and Research Methods. Newbury Park: Sage Publications.
Rosengren, K. E. (1981). Advances in Scandinavia content analysis: An introduction. In: K. E. Rosengren
(Ed.), Advances in content analysis (pp. 9-19). Beverly Hills, CA: Sage.
Simpson, R., and Mendis, D. (2003). A corpus-based Study of Idioms in Academic speech. TESOL
quarterly, 419-441.
Steinel and Hulstijn (2007) Second language idiom learning in a paired-associate paradigm: Effects of
Direction of learning, direction of testing, idiom image ability, and idiom transparency. Studies in
second language Studies in Second Language Acquisition, 29(03), 449-484.
Turner, M., and Fauconnier, G. (2002). The Way we Think. Conceptual Blending and the Mind’ Hidden
Complexities. EUA: Basic Books.
Zhang, L. (2009). The Effect of Etymological Elaboration on L2 idiom acquisition and retention in an
online environment (WebCT). ******
A HISTORY OF SOCIAL EXCLUSION AND POVERTY OF THE THAGICHU OF IGEMBE
SUB-COUNTY, MERU COUNTY, KENYA, FROM 1907 TO 1962
Kithinji, C.M.
Department of Arts and Humanities, Chuka University, P. O. Box 109-60400, Chuka, Kenya
Tel.: +254 724 855 999, Email: kithinjimc@gmail
ABSTRACT
This study is on social exclusion and poverty of the Thagichu from the colonial epoch of the years1907 to
1962. Kenyan Government strategies towards alleviation of social exclusion and poverty between 2013
1nd 2015 are also explored. The study was guided by the theories of Underdevelopment, Materialistic
Conception of History and Social Darwinism. It employed the descriptive research design. Data was
collected from oral, archival and secondary sources. A total of 50 persons were purposively sampled and
interviewed and corroborated with data from archival and secondary sources. The Thagichu were socially

Proceedings of the Third International Research Conference held on 26th to 28th October, 2016 427
excluded by the colonial Government. Exclusion was noted in inadequate infrastructure like roads,
schools, hospitals and lack of access to social services like banks compared to other areas of Meru
County. The study established that the government has come up with strategies that could help tackle
social exclusion and poverty of the Thagichu, including building educational facilities, provision of free
primary and day secondary education, adult and continuing education, non-formal education and
provision of educational funds through the constituency development fund and Affirmative Action Social
Development Fund, establishment of road networks, land adjudication, NGOs, formal employment,
Health facilities, urban centre and electricity. This study has contributed to the Thagichu historiography.
Keywords: Social Exclusion, Poverty, Thagichu
INTRODUCTION
This paper discusses social exclusion and poverty of the Thagichu of Igembe Sub - County, Meru County
in Kenya from 1907 to 1962. the Thagichu are a group of people inhabiting the Lord, section of Igembe
South Sub County of Meru County. Originally this group lived among the Tharaka who presently live in
Tharaka Nithi County but in 1907 new colonial boundaries moved them from their original location. The
Thagichu group is currently found in lower Igembe in Meru County (Mwaniki (2005). An account by
Kirimi (2010) states that the Thagichu group that is found in Meru County is believed to have settled in
their present day homeland before the Igembe and Tigania communities. During migration and
settlement of the Eastern Bantus, this group was left behind and settled in lower Igembe as their kinsmen
proceeded to their present day settlements. This is evidenced by the names they use for their villages thus
Kiguma, Mukurimba, Tumutumu, Kianda, Iruma and Kiolu. These names refer to places elsewhere in
Kenya; this implies that the Thagichu have relations with people living in places with similar names as
their villages. In addition this points to a conglomeration of different cultures. For example, Tumutumu
and Kianda in Gikuyu land implying there could be a relation of the Thagichu in Kikuyu land. This study
ascertained that the Thagichu of Igembe South Sub- County settled in their present day homeland directly
from their original homeland Mbwa. (Kirimi, 2010) argues that though they are believed to be part of the
Igembe community, they stand out as a distinct ethnic group and their numbers are less compared to the
other Igembe population. They also live in the marginalised area of Igembe. Their language has extensive
Kamba, Kikuyu and Kiembu borrowings. The area is also generally underdeveloped.
According to Ndenge (2008) overall poverty, also referred to as absolute poverty in Kenya declined from
52.2% in 1997 to about 46.0 % in 2005/6. However, significant variation in poverty still exists among
Kenya’s geo-political areas. During this period, the proportion of people falling below poverty line
improved from 52.2% to 46.6%. In other words slightly less than half of the country’s population was
living below poverty line. Ndenge (2008) also indicates that in Kenya inequality measured using Gini -
Coefficient is at 0.445. The report also indicates that social exclusion in Meru County is at 0.348 while
that of Igembe South is at 0.373. It is also evident that 34 – 44% of Igembe South people are living below
poverty line most of them being in the marginalised Thagichu areas. The overall contribution of the
Thagichu to national poverty is 0.4 to 0.6 %. The number of poor people per square kilometer is 9 – 51. In
terms of poverty reduction rate that of the Thagichu by 2013 stood at – (negative) 23.4% (Ndenge, 2008).
Despite numerous efforts towards poverty alleviation more and more Kenyans are falling below the
poverty line. It is against this background that a historical investigation of social Exclusion and Poverty
among the Thagichu was examined. Government intervention strategies towards poverty alleviation of the
Thagichu have also been explored.
Social Exclusion of the Thagichu between 1907 to 1962
Information in KNA 1907- 1911, 1912, 1913, 1914, 1915, 1916, 1917, 1918, 1919 and 1920 reported that
during this period general development of the Ameru was low. This was caused by frequent draught,
famine and diseases especially cholera. An account given by oral respondents among the Thagichu noted
that this period saw the ban in raiding activities which was especially a source of animals for various
functions for example circumcision, annual festivals and marriage ceremonies. Asked whether raiding
was not detrimental to development, the oral respondents argued that though it was not a good practice,
the ban came after their animals had been driven off by the Maasai and did not get a chance to revenge.
According to reports in KNA/MRU (1907-1920), because of the slow pace of development, the

Proceedings of the Third International Research Conference held on 26th to 28th October, 2016 428
Government of the East African protectorate undertook road construction in order to open up the district
of Meru for easy administration and economic development. Between 1907 and 1911 a road was
constructed over the top of Nyambene range to Maua. This road gave a short route from the Boma to the
trading centre in Igembe. In 1912, the main Meru Embu road was cleared. The Boma to Tharaka road was
also cleared. A new road was cut to Tigania in 1913 and another was in progress to Tharaka. In 1914, the
roads through Nyambene were widened and repaired in view of His Excellency‘s projected visit. The
Tharaka road was completed forty miles from Meru Township. In 1915, the Meru Boma road was slightly
enlarged at the south western corner by clearing of bush. The road through the Swahili and Indian
quarters was widened to 100ft. in 1916; the road from Maua to Antubetwe via Akachiu was completed.
Next was a wagon road from Meru to the Lewa swamp which was improved in 1917. During the same
year the Embu-Meru road was regraded and widened. A new road from Maua to Antunene was made to
connect the trading market centres. A twelve mile Meru – Muthara road was also made. In 1918 essential
road repairs were carried out under difficulties. No re-alignments were made owing to famine. In 1919, a
new road was begun between Maua and Muthara by Mr. S.V. Cook. In 1920 all roads were kept up by the
administration. Funds were supplied by the P.W.D for the Meru -Embu road. All other roads were
maintained by blic labour. It is worth noting that no road construction took place through Thagichu area
despite its economic potential being close to Meru national park.
Between January 1st and December 31
st 1925 Mr. M.R.R. Ridal was in charge of Meru District as District
Commissioner. He was assisted by Mr. A.G. Cornell as assistant District Commissioner between January
1st 1924 and August 31
st 1925. Captain victor McKeag took over up to December, 31
st 1925. The
outstanding feature of the year was the establishment of the Meru Native Council on July 9th 1925 by H.E.
acting Governor. The Local Native Council had European and native representation. The Council had
funds to the extent of Ksh 20651 and passed resolutions which were sanctioned by H.E. in council to
effect the construction a rice hulling and maize gridding mill, the establishment of a creamery for ghee
making and the erection and furnishing of a council house (KNA/MRU, 1924-1925). The council also
passed a resolution to raise £.375 by a levy on a portion of the adult male population for the purpose of
building eight outpatient dispensaries in the District. These dispensaries were built in Meru town,
Mikinduri, Maua, Lare, Muthara, Nkubu Igoji and Tharaka. A survey of the Thagichu area did not show
signs of the above (KNA/MRU, 1924-1925).
According to KNA/MRU/1926, a Meru District Education committee was nominated and the district was
gazetted as a school area under the education ordinance of 1926. The Local Native Council however, did
not nominate native members to the education committee. Seven Mission stations were established in the
district under the denominations of the united Methodist Mission who were given a five acre plot and the
Gitoro Roman Catholic Mission. These were paying rent of KShs.10 per annum for the five acres local
Native Council fund. Trading centres were also established. Six were occupied by 1926 and two centres
were sanctioned. The lists of trading centres in the District by 1926 were as in Table 1:
Table 1. Lists of trading centres in Meru District in 1926
Township No. of plots occupied
Meru 31
Mikinduri 8
Maua 8
Larii 3
Nkubu 1
Muthara 1
Tharaka 0
Kariene 0
Dhaicu 0
Kathauni 4 }These were occupied
Ntiroba 4 }later in the year
Source: KNA/MRU/1926

Proceedings of the Third International Research Conference held on 26th to 28th October, 2016 429
It is important to note that by the time the researcher was conducting research in 2015, the area had one
Market Centre. This according to the researcher is an indication of slow rate of development compared to
the rest of Igembe. A survey conducted by the researcher in Igembe revealed that many areas are well
served with roads and there are many market centres either functioning as Miraa depots or trading centres
for other goods. Examples of these centres are Kimongolo, Njoune, Antubetwe and Kiegoi. The public
roads in the district were Maara-Meru 25 mile road, Moraine River to Meru 18 miles and a reserve road
via Muthara and a reserve road to Tharaka. The officer in charge reported that a road could be
constructed via Kiorimba and Kirima Kieru Thagichu areas save for rocky nature of the land. During the
last five months of 1926, that is from August 1926, attempts were made to bring the people of Tharaka
into the line with progress realized by other ‘tribes’ in four ways. The four ways were re-opening of their
Kiama (Council of elders) which had been in abeyance for some years; the registration of all adult males;
the employment of 200 at Meru during the month of December and the appointment of four tribal
retainers. During the same year, it was hoped that their counterparts, the Thagichu who had remained in
their primitive state would be encouraged to develop but owing to their isolation and infertility of their
soil, it would not be easy for them or the administration to bring out such development
(KNA/MRU/1926). The report went further to state that there was a ready response to suggestions to
improve them by Mr. Booth, the senior agricultural supervisor. But for any effort to be successful,
constant supervision would be necessary and it had not been possible in the past. It was unfortunate that
Mr. Booth, the senior agricultural supervisor had no time to visit the Thagichu (KNA/MRU/1926).
Further exclusion was noted as the area was not opened up as compared to other areas in Meru District.
For example two new reserve roads were built during the latter half of the year. Owing to the rough
terrain and hills at Kiorimba (Area occupied by the Thagichu), one road followed the right bank of
Thangatha River from the Garbatula road. This road connected with the Tharaka road and Grand falls
camp. The other road followed the old track through Katheri up to Kithirune within a quarter of a mile to
the forest. It ran up to Iraru River to connect Igoji and point in the Maara River. During the same period
agriculture demonstration centres were started at Meru, Igoji, Katheri and Mikinduri (KNA/MRU/1926).
This leaves the researcher with no doubt that the Thagichu were intentionally left out of the development
agenda by the colonial government in Kenya.The situation remained the same until 1940 when Mr. H.E.
Lambert became District Commissioner. This was the period of the Second World War. The report given
by the Colonial government in (KNA/MRU/1940) shows how the various Meru sub-ethnic groups
pledged their royalty to the crown. Early in the year, the Njuri decided to present a number of bulls to the
government as a token of royalty and to assist in the war effort. Meru sub-group contributed bulls as
shown in Table 2:
Table 2. Ameru contribution of bulls towards World War 1 effort
Area Number of Bulls Percentage (%)
Meru - 256 11.85%
Mikinduri - 186 8.6%
Tigania - 172 8.0%
Igoji - 213 9.9%
Tharaka - 169 7.82%
Maua - 200 9.25%
Nkubu - 183 8.5%
Muthara - 230 10.6%
Thaicu - 0 0%
Mwimbi - 189 8.75%
Muthambi - 160 7.4%
Source: (KNA/MRU/1940)
The researcher got interested to understand why the Thagichu never contributed to the war effort. The
oral respondents claimed that since the government had sidelined them as far as social, political and
economic development was concerned, then there was no point in assisting. The oral respondents added
that their failure to support in the war effort led to further social exclusion. For example, in the same

Proceedings of the Third International Research Conference held on 26th to 28th October, 2016 430
period, there were changes in the judicial system. The Agambi (spokes men) were to be drawn from all
the Ameru sub-ethnic groups - councils of elders. Their council of elders (Kiama gia Nkomango)
however was not requested to give any of their members. They therefore remained unrepresented until
1951. From this discussion the deduction of the researcher was that lack of royalty towards the colonial
government by the Thagichu led to further exclusion of the Thagichu and consequently poverty.
During the same period many traditional Meru practices were banned by the religious groups such as the
Catholic Missionaries. For instance, father Boken instructed the teachers of the catholic schools that
Catholics are not permitted to enter the Njuri religion, if a Catholic Christian enters a Njuri religion, he is
to be excommunicated; if a pupil in a Catholic School enters the Njuri religion, he is expelled from school
and if he lives in a Mission plot he must be removed from there at once; that every member is hereby
authorized to drive out and keep out of School anybody who enters the Njuri. Other African practices
were also banned such as witchcraft and anybody found practicing witchcraft would be deposed if in
leadership positions KNA/MRU/1940 Chief M’Itimitu of Njea location was in charge of Igembe and
Daicho areas. He was discovered in practices favouring of those of the old witchcraft society known as
the Athi. Investigations showed that in fact he had taken a leading part in resuscitating the Society in a
small area near his home. He was deposed on 30th June, 1940 (KNA/MRU/1940).
The conduct of affairs was then in the hands of the leading Mugambi (Matugu and a headman M’Itobi
who was later gazzeted chief as from 1st July 1940 (KNA/MRU/1940). The researcher concluded that the
deviant behavior of the Thagichu could have partly contributed to social exclusion by the Colonial
government. During the same year a KNA/MRU/1940 report indicated that the Colonial government
undertook to recondition hills and especially those of Tigania and Igembe. The Thagichu Kiorimba area
was also in the plan. The particulars of land labeling of shambas and planting of various varieties of live
wash tops were as shown in Table 3:
Table 3. Shambas labelled and planted with wash tops in Meru in 1940
Area Shambas Labelled Shambas Planted Acreage
Tigania 1257 1232 525½
Igembe 97 92 20
Thagichu 0 0 0
Source: (KNA/MRU/1940)
The officer in charge of aeroculture reported that the leveling of Thagichu Kiorimba area would require
heavier machinery than they had. This meant that The Thagichu Kiorimba area was left out of the plan.
KNA/MRU/1940 also reported that as far as health care was concerned by 1940 dispensaries had been
built in following areas – Isiolo, Kaongo, Nkubu, Kanyakine, Chuka, Kirindini, Magumoni, Muthara,
Miathene, Mikinduri, Lare, Athi, Mitunguu and Tharaka. A number of trade centre’s and markets were
also established in the following areas; Mutuati, Lare, Maua, Mikinduri, Kianjai, Kangeta, Gakoromone,
Nkubu, Kaongo, Burindaja, Marimankari, Chuka, Mariani, Itugururu, Magutuni, Mitunguu, Githongo and
Kiirua. In 1937 V.LM McKeag was the District Commissioner of Meru (KNA/MRU/1937). He initiated
several development projects in the area. For example, he established public hospitals at Maua and
Chogoria run by the Scotland Mission. Townships and trade centres were established in Igoji, Mutunguu,
Nkubu, Chuka, Tharaka and Marimankari, among others. Markets were established at Lare, Maua,
Mikinduri, Kianjai, Kangeta, Meru Boma, Nkubu, Igoji, Kanyakine, Kaongo, Chiakariga, Mweria,
Marimankari, Chuka, Mariani, Itugururu (KNA/MRU/1937). A report by 20/10/1937 indicated that
several areas were well served with roads but the Thagichu/Igembe section of necessity remained closed
for the rest of the year but from the point of view of both tourist traffic and export of produce should be
opened at the first opportunity (KNA/MRU/1937). There was a policy to improve agriculture. Owing to
drought, cotton was suggested as a crop for the Lower Igembe Thagichu area. R. Oats, a European
marketing officer citied harsh climatic conditions as a hindrance for crop production in the area
(KNA/MR/1937).

Proceedings of the Third International Research Conference held on 26th to 28th October, 2016 431
According to KNA/MR/1938, Colonial Government annual report of 1932 by Mr. Hopkins, 1933 and
1934 by Mr. Lambert and the 1938 report by Mr. Hopkins suggested that the Colonial Government found
it difficult to implement its policies among societies that were deeply entrenched in traditional beliefs and
practices. They noted that the Thagichu people were handicapped by their belief in witchcraft. This
information was further supported by oral respondents who stated that any occurrence was seen as being
caused by their supernatural beings. They therefore saw the coming of foreigners in their land as a
punishment by angered spirits. That is why according to eighty year old Samuel Njuki, the Thagichu
could not entertain the Whiteman in their land. According to DC/ MRU/1944, despite the war
atmosphere, the Meru region was earning a lot from exports. The colonial Government feared that this
could lead to economic independence of the Ameru. A letter written by H. E Lambert read like this: It
would be interesting to know what the Meru derive from:
a) Exports out of their country of various products
b) Exports of labour, that is, imports of wages that they did not have in pre Government days.
Is this saying about 100,000 dollars in a good year and would all this be spent on new wants that they did
not have before? That is, does this new factor of trade in the world outside the reserve have any effect on
the numbers of stock? If the money earnings of the Ameru from production and labour are spent on
imported livestock then the acquisition of wealth can only be another word for overstocking but I imagine
this is not so and that money earnings and new wants roughly balance so that if the old slaughter system
were applied in full stock, numbers would be kept static. If so it follows that to fine a man cash is ; a) to
prevent him from satisfying new wants which we have taught him to have and b) to reduce his purchasing
power by the amount of the fine whereas the forfeit of an ox for slaughter would not do either of these
things. My point is that the native keeps his money and his cattle for two separate purposes. His cattle are
more closely bound up with his membership of the community and when he offends against the
community he should to the “community chest” from his cattle stakes and not from his money stakes
which he represents his wherewithal to better himself. In 1944, according to Bernard M’ Rioba there was
serious destocking in the Meru region. According to all accounts though the destocking policy was a
district wide policy the Thagichu area was more affected. Information in KNA/DC/MRU/1944 recorded
the destocking as shown on Table 4:
Table 4. Number of animals curled to curb rate of foreign exchange earnings in 1944
Area Number of Animals Percentage (%)
Meru 230 8.95
Chogoria 198 7.7
Mikinduri 160 6.2
Tigania 102 4.0
Igoji 204 7.9
Tharaka 196 7.6
Maua 200 7.8
Nkubu 156 6.1
Muthara 240 9.34
Thaicu 396 15.4
Kariene 108 4.2
Mwimbi 200 7.8
Muthambi 180 7.0
Source: KNA/ DC /MRU /1944
In 1945, Mr. C.M. Johnston took over as District Commissioner. The D.O. was P.E. Walters from 1/1/46
– 8/5/46 and for the rest of the year H.C.F Wilks became D.O. Their main concern was the opening up of
the Meru areas. They therefore came up with policies in transport and communication several roads were
constructed. Mr. F.J. Bolding was in charge of this during the year. In spite of the exceptionally heavy
rains during the month of October which resulted in Landslides on the Embu-Meru and Meru-Kianjai
roads, as well as two wash-ways, many permanent culverts were installed. The Meru-Chogoria upper
roads were reopened to traffic after Mutonga and Iraru bridges had been rebuilt. A bridge on the Ura

Proceedings of the Third International Research Conference held on 26th to 28th October, 2016 432
River in Maua-Mikinduri road and a new cutting on the main Meru – Nanyuki road was made to do away
with an awkward corner at Gunga lake. Though there was a plan to connect the environs of Maua to the
town, the Thagichu area proved too rocky for any meaningful road constructor (KNA/MRU/1946).
A 1950 report in KNA/MRU/1950 indicated that there was an epidemic of typhoid in the Thaicu area
which resulted in several deaths. The epidemic was made worse due to the absence of a health centre
nearby. The oral respondents indicated that typhoid was not the only problem experienced this year.
They had a rat attack. They narrated how the rats would eat all their food and even carry babies. The
researcher here concluded that the typhoid and cholera could have been caused by sharing food with rats.
As reported earlier, the Thaicu were deep-rooted in witchcraft. The rat menace according to oral
respondents was finished by a diviner as mentioned earlier.
A KNA/MRU/1952 report indicated that in 1952, relations of the Meru and Embu remained cordial.
There were signs of dissatisfaction with the infiltration of so many Akamba in the Lower areas of Tharaka
and Thaicu. As stated earlier, the Thaicu are bilingual and a common language spoken there is Kikamba.
This probably explains why the Thaicu language has a lot of Kamba borrowing. In an earlier report in
KNA/MRU/1951, Tom Mbotela visited the Igembe/Thagichu area to espouse the cause of a number of
Machakos Wakamba in the area. It was alleged that these people were being forcibly evicted but in fact
no action had been taken apart from prosecutions for nonpayment of poll tax and disobedience of orders
for soil conservation but it was evident that the Thagichu of this area wished to be rid of them. The
Kamba in the question also appeared to be strengthening their claim to remain in the area by flouting the
Local Indigenous authority. A large number remained and occupy the area known as Kiguma in
Thagichu according to oral respondents. This information is supported by Parsons (2012) who notes that
the peoples of colonial Kenya had options of deciding how to identify themselves. For example parsons
noted that when Kikuyu migrants settled in the Meru reserves, the first larger group did so legally by
choosing to become Meru. This was the case of the Kamba who settled in Thagichu. According to oral
history, the failure by the colonial government to protect the Thagichu land from occupation by other
communities meant that the area was segregated. This was especially because the Kikuyu who settled in
other parts of Meru such as Timau area were ordered to vacate that land by the same government.
In agriculture, it was noted that the Tharaka and Thagichu areas of Igembe performed poorly. These
areas for years reaped no crops. Despite the harsh climatic conditions, these areas were not considered for
production by irrigation. The government instead built good roads to Kathita below Makandune to open
up the area for irrigation (KNA/MRU/1952). Public health hospitals were also inequitably distributed.
For example the Consolata Catholic Mission hospital was built at Nkubu, in Imenti South Sub- County.
Though it was noted by Dr. Avery Jones and Mr. Furlong that there was a bacteria disease (spirillum) in
Igembe, no efforts towards establishment of a health Centre in Lower Igembe Thagichu area was made.
KNA/MRU/1957 – 1962 reported that after four years emergency conditions with its restrictions and
attendants’ hardships, the Meru people settled down in 1957 to a year of economic prosperity unequaled
in the recorded history of the ‘tribe’. The progressive relation of restrictions led to the satisfaction of the
people as a whole, whose main desire was a resumption of normal peaceful conditions in the district. The
D.C. noted that in terms of wealth and education, Meru District is a land of contrast. That from North to
South, the eastern half of the district is inhabited by a relatively poor and backward people whilst those in
the fertile land and Coffee rich Western region enjoy a prosperity equal to that found anywhere in Central
Province. Efforts to raise the standard of living and education of the eastern half of the population
continued in 1957 not only for the sake of eradicating an undesirable state of affairs but in order to reward
a people whose royalty during the emergency had been of high order. The people of Igembe were
reported to have remained royal throughout the difficult days of the emergency and a large number were
Meru Guards. (KNA/MRU/1957). However Oathing between 1952 and 1954 was reported among a
section of Igembe subdivision in 1956. This was in Njia. Further oathing ceremonies took place in April,
August and December of 1957 in Thagichu area adjacent to Maua. Proposed plans for extension of a
settlement Scheme in this area was therefore rejected.

Proceedings of the Third International Research Conference held on 26th to 28th October, 2016 433
Land consolidation and opening up of areas for settlement was popular during this period. The Meru D.C.
in 1957 J.A. Cumber initiated the opening of airfields in Kiirua, Mitunguu, Itukururu and Liliamba.
Improvements in farming methods were noted in Kiirua, Naari and Kimbo (KNA/MRU/1957). A soil
conservation programme was launched in Meru. Low percentage of land was however, conserved in
Tharaka, Tigania and Igembe/Thagichu area with the latter having the Lowest as shown in table 5. As
discussed earlier lack of royalty and support for the colonial government made the Thagichu to suffer
social exclusion. This according to the researcher was even worse at a time like the 1952 emergency
period in Kenya when the colonial government was engaged in war with the Mau Mau resistance
movement.
Table 5. Land under conservation in Meru in 1957
DIVISION LOCATION PERCENTAGE CONSERVED
Nyambene Igembe/Thagichu 33 35
Nyambene Tigania 56 60
North Imenti Miiriga Mieru 7 75
North Imenti Abothuguci 88 90
South Imenti Nkuene 93 93
South Imenti Igoji 92 93
South Imenti Tharaka 43 43
Nithi Mwimbi/ Muthambi 84 86
Nithi Karigani 84 85
Nithi Magumoni 79 79
Source: KNA/MRU/1957
Other developments included soil conservation which was to be achieved through grazing control.
Despite the problem of Water, grazing control was not imposed in the northern zone in eradication of
animal diseases like Trypanosomiasis in the Eastern half of the district. In distribution of schools J.A.
Cumber (D C) noted that with the exception of Igembe/Thagichu area and Tharaka, Schools were spread
evenly throughout the district. During the same year; 1957 the colonial government realised the problems
that were facing the colony and protectorate of Kenya. According to GOK (1957) the colonial
government aimed at expanding Kenya’s economy and developing the country’s production. The plan
covered economic and social development including; agriculture, education, medical services, housing,
industrial and commercial expansion, closer administration in the African areas, roads, aerodromes,
buildings, community development and forestry.
Government Intervention Strategies towards Alleviation of Social Exclusion and Poverty in the
Thagichu Area After the 2013 general elections in Kenya the County Government of Meru, was established. The Meru
County government came up with the first Meru County Government integrated Development plan 2013
– 2017 (Meru County Government, 2013). The first item in the plan was establishing the Human
Development Index (HDI) in the County. This was measured using Human Development Indicators such
as life expectancy, years of schooling, access to water and the general standards of living in the region.
The HDI mean score for Meru region was 0.5622 compared to Nairobi’s 0.6533 and the national score is
0.505. The HDI for Meru region ranks above the national score meaning that Meru region contributes
positively towards the overall national score. When research was conducted among the Thagichu in
2016, the oldest respondent’s age was estimated at 105 years and generally the area had elderly people
making the research to conclude that life expectancy is high. When research was being conducted, the
researcher noted that some Miraa farms were being irrigated and oral respondents confirmed that a water
project had been started in the area by Ripples International, an NGO aimed at empowering women,
children and the youth.
The colonial and post colonial government had made enormous efforts in improving infrastructure such as
road networks, financial institutions, education facilities, health facilities, markets and housing in Meru.
By 2013, Meru County was well served with roads with the most famous tarmac road being the Embu-

Proceedings of the Third International Research Conference held on 26th to 28th October, 2016 434
Meru-Maua road. By the time this research was being conducted, plans were underway to construct the
Maua – Kimongolo –Thagichu road. This information was given by oral respondents and confirmed by
the sub-county Development officer. As stated in the location of the study, the Thagichu area borders
Meru National park. Development of this road will mean that the park can be accessed through the
Thagichu area. This will also boost the economy of the Thagichu as tourists pass through their land in
transit to the park. The oral respondents appeared enthusiastic arguing that they will be able to revive their
traditional industries. It was the view of the researcher that Kenya’s devolution as required by the
constitution of Kenya (2010) could be a recipe for emancipating the Thagichu from social exclusion.
According to Nyanjom (2011), Kenya’s constitution 2010 declares equity to be an underlying principle of
governance in the country.
The County has a high agricultural potential which has attracted various commercial banks and other
financial institutions. The number of commercial banks by 2013 was sixteen, eight microfinance
institutions, four village banks and a number of Sacco’s. The Thagichu area from observation and also
from the oral respondents has no financial institutions. Oral respondents also had no idea whether any
institutions were to be established. When the researcher inquired on where they bank their money, one
oral interviewees was quick in responding that they cannot travel to Maua Town to bank their money
because money is needed any time and one may not get it when in need. They all agreed that money is
kept safely in their houses. This led the interviewer to conclude that the Thagichu are living in the past
and they have not embraced change.
The Meru county government has established several education institutions like schools, polytechnics,
colleges and universities. There are 972 Early Childhood Development Centres (ECD), 647 primary
schools and 192 constituency development funds have enabled the construction of various mixed day
secondary schools. The Thagichu area has benefited from this as there is Kindani Day Secondary school
according to the respondents and from observation. The Sub-County education office also confirmed that
plans are underway to construct another day school in the Thagichu area. (Meru County Integrated
Development Plan, 2013-2017). This according to the researcher is a step towards inclusion of the
Thagichu in development by the Meru County Government.
Land ownership still remains an issue as the area has no title deeds. A report from the sub-county land
adjudication office indicated that the government is committed to ensuring that title deeds are issued to all
land owners. This is on realizing that the residents are not investing fully in their land because of the fear
that adjudication could place them in different areas, as mentioned earlier. The adjudication office in the
County indicated that land adjudication is in the process. The oral respondents also confirmed that the
process has started and they could very soon get title deeds for their lands, which could be an end to the
worries of displacement. Such kind of adjudication could probably improve the Thagichu’s standard of
living since they would till their land and build permanent houses without worrying about displacement.
The major steps that have been taken by the current government towards social inclusion according to
oral respondents is the presence of non-governmental organizations in the area. One such NGO is the
JICA which has initiated water project in the area though the project is yet to be completed. The Sub-
county Development officer also reported that the Ripples international has encouraged formation of self
help groups in the area. Such a community self help group is Kiguma Tujiinue self help group. These
community self help groups have been legally registered and are very useful in that they have been able to
get some water to the area and improve welfare of members through merry go rounds and financial aid by
the NGOs. Youth groups are also being organized due to the introduction of the Youth Enterprise
Development Fund according to one of the Young respondents Mary Mukwairu.
The importance of salaried employment cannot be underscored. According to Forstater (2001)
unemployment has its costs; first, it has tremendous social and economic benefits to both the unemployed
and society as a whole, second it harms individuals, families, neighborhood villages and communities.
Forstater also discusses the three aspects of employment thus the income aspect, where employment
provides income security for the employed; the production aspect, where employment results in increased
production of goods and services and the recognition aspect where the employed person is engaged in a
Proceedings of the Third International Research Conference held on 26th to 28th October, 2016 435
worthwhile activity. Forstater (2001) adds that when members of a community are employed at
productive jobs, the person employed has income and recognition and the community gets better and
more goods and services. In addition there are not only the initial benefits of job and income security and
more and better public and community services, but also numerous indirect benefits thus the economic
and social multipliers on the economic side, the initial job and income growth associated with
employment translates into increased spending and rising incomes throughout the community. The
social multipliers concern the benefits to individuals, families, neighborhoods and communities of
decreased crime, drugs and family disruption and increased and strengthened security, education, health
care for the infirm and the elderly and environmental protection.
In the 2013, the Government of Kenya realized the importance of job creation. According to All Africa
Global media (2014), the Government prioritized infrastructure development to spur growth and job
creation in all sections of Kenya’s economy. A national employment policy was developed. The
Ministry of labour, social and security services cited youth unemployment as a risk factor in the Country
whose causal factor was the slow pace of growth of the Country’s economy (GOK, 2013). As a result
policies and programmes for employment creation were developed among them infrastructural
development. County governments were consequently required to create employment opportunities and
come up with policies that were all inclusive. The county governments were encouraged to employ those
who qualify especially women, Minority groups and persons with disability. In 2013, guided by this
policy, the Meru County Government employed one assistant chief from the Thagichu area and one
teacher has also been absorbed by the government. This means that the problem of social exclusion of the
Thagichu may soon come to an end according to the researcher.
The central Government of Kenya realized that Health and nutrition plays a key role in development
through ensuring a healthy population. Disease prevention and health promotion ensures a healthy
environment for the public. This should be of high quality, affordable and accessible to the general
population countrywide. This has been achieved as the oral respondents from Thagichu contended that
health services are now getting closer to them. A dispensary was built and completed in August 2014 at
Kilili market known as Kilili Dispensary. The researcher interviewed a health worker who reported that
for the purposes of disease prevention, there is a door to door campaign as well as staging mobile clinics
in the area for disease treatment. The most common diseases according to the health worker are malaria
which has forced the county government to distribute free mosquito nets because of its high prevalence,
occasional cholera outbreaks resulting from poor sanitation, skin diseases, intestinal worms, and
respiratory diseases. The health worker concluded by saying that HIV/AIDS has also found its way in the
Thagichu area with serious consequences as the people are attributing it to witchcraft thereby failing to
seek medical attention (GOK, 2013). The researcher observes that such attitudes show that more
sensitization is needed in the Thagichu area to liberate them from such outdated beliefs so that they can
catch up with modern health practices to avoid spread of diseases. Probably more health centres are
crucial for such sensitization to take effect.
It is important to note that, growth of urban centres is a good indicator of economic and social
development. To the County Government of Meru, establishment of urban centres could enhance trade
and thus raise the standards of living for those living in such areas. The number of market centres in Meru
is rising and currently there are forty nine market centres in Meru County. The sub-county Development
officer for Igembe south sub county reported that money has been set aside to develop a market centre at
the Thagichu area at Ntherone and plans are underway to improve the existing Kilili market Centre. The
oral respondents appeared pleased with this as they will have markets to sell their farm produce. This
according to the researcher is a big step towards inclusion.
Education is often used as a vehicle for economic development. That is why according to the policy
framework for education (2012), the government launched the Free Primary Education (FPE) and Free
Day Secondary Education (FDSE) in Kenya though reports indicate that there are still some pockets
within Kenyan Communities which have remained unreached for a host of reasons, including economic,
cultural, social, geographical environmental and political. More than fifty years after Kenya’s

Proceedings of the Third International Research Conference held on 26th to 28th October, 2016 436
independence illiteracy still remains a problem in Kenya. That is why the Government of Kenya realizes
the important role played by adult and continuing Education (ACE) and Non-formal education (NFE) as a
vehicle for transformation and empowerment of individuals. ACE and NFE offers opportunities for those
outside the formal school system to benefit from education (GoK, 2012). For this reason these
programmes are in place in several areas including the Thagichu where the researcher recorded that there
are 5 Primary Schools offering Free Primary Education in Thagichu area. According to oral respondents,
since the introduction of Free Primary education, the enrolment in the schools has gone up. The oral
respondents also contended that Adult and continuing Education is on going in the area. Specifically they
have a Centre at Kiguma Ciiri, one of the seven villages of the Thagichu.
The Government of Kenya and specifically the Meru County Government is encouraging its residents to
construct more permanent houses. This is in the wake of many natural calamities like whirlwind which
blows and carries the roofing materials. This information was given by the sub-chief of the Thagichu
area. Since the government cannot construct houses for individuals in the area, they have started by
constructing permanent school structures. This according to the researcher is an indication that the
Government is coming up with all inclusive policies for the whole County.
A minority or a marginalized community is taken to mean a traditional community that, out of a need or
desire to preserve its unique culture and identity from assimilation, has remained outside the integrated
social economic life of Kenya as a whole or an indigenous community that has retained and maintained a
traditional lifestyle and livelihood based on the hunter or gatherer economy, or pastoral persons and
communities whether they are a nomadic or a settled community that because of its relative geographic
isolation has experienced only, marginal participation in the integrated social and economic life of Kenya
as a whole. The same clause defines a marginalized group as a group of people who, because of laws or
practices before, on, or after the effective date, were or are disadvantaged by discrimination (The
constitution of Kenya, 2010).
The Thagichu community in Igembe Sub-County which is found in Meru County fits in the definition
provided in the constitution of Kenya 2010 as the community has been socially excluded from the rest of
Igembe and Meru Community from 1907 to 2012 and are also a minority in Meru given their small
numbers as described by Kirimi (2010) and also by GoK (2009) in chapter one. Their ethnic identity
where the researcher found that they are not Igembe though living with them also makes them fit in this
definition. From the oral interviews the researcher concluded that the Thagichu are a small ‘tribe’ living
within a big ‘tribe’, that is Meru, making it fit within the definition of the minority.
The constitution of Kenya 2010 provides that the state should put in place affirmative action programmes
designed to ensure that minorities and marginalized groups participate and are represented in governance
and other spheres of life; are provided special opportunities in education and economic fields, are
provided special opportunities for access to education, develop their cultural values, languages and
practices and have reasonable access to water, health services and infrastructure (Article 56 of the
constitution of Kenya, 2010).
The constitution further establishes an equalization fund which is intended to provide basic services
including water, roads, health facilities and electricity to marginalized areas to the extent of the extent
necessary to the quality of those services in those areas to the level generally enjoyed by the rest of the
nation, so far as possible. (Article 204 of the constitution of Kenya, 2010). Other strategies of inclusion
are: - provision of electricity especially rural electrification meant to uplift the living standards of people
living in the rural areas.
Electricity is the backbone of socio-economic development in any country and is associated with the
provision of numerous services to people which directly enhances their quality of life. Kenya has, keeping
these needs in mind, established the Rural Electrification authority (REA) under Section 66 of the Energy
Act 2006 (No. 12 of 2006) with a vision to provide clean and green electricity to all rural areas in the
Country. Since its inception a decade ago, it has spearheaded electricity connections to 22 percent of

Proceedings of the Third International Research Conference held on 26th to 28th October, 2016 437
households and public facilities. The electricity connections have further been speeded up by the
presidential decree on reduction of the cost of electricity connection from 35,000 to 15,000 from
27/5/2015. When research was being conducted among the Thagichu, a few households had benefited
from this decree and had electricity. The oral respondents praised the government for the presence of
electricity in their area. (Climate Energy, 2013).
One of the greatest achievements Perhaps of the government of Kenya towards poverty alleviation is the
introduction of the constituency Development fund which was created by the Constituencies
Development Fund Act of 2003 with the primary objective of addressing poverty at the grassroots level
by dedicating 2.5% of the government ordinary revenue to grassroots development and the reduction of
poverty. The fund is managed by the Constituencies Development Fund Board (CDFB). In January 2013,
the CDF Act of 2003 was repealed and replaced with the CDF Act of 2013 that is aligned to the
constitution of Kenya 2010 (www.cdf.go.ke/al). In the Thagichu area, oral respondents noted that CDF
has funded the construction of Kilili Day Secondary School. The students who were interviewed from the
area also confirmed that they are funded by the CDF to pay fees though they said the funding was
minimal, that is 3000 Ksh per funding. They however conceded that there is fairness in fund allocation in
the all county making the researcher conclude that the Thagichu are being included in the Meru County
Government development plan especially in education.
The Affirmative Action social Development fund which was enacted through the legal Notice No.24 of
the Public Finance Management Act of 2012 and published on 13th February, 2015 is another equalizer
fund by the government of Kenya that has benefited the Thagichu community. This fund was established
with the Primary objective of empowering Affirmative Action groups and in particular out of School
Youth, Orphans, Children of Child headed families and special needs children through bursaries and
scholarships to access education opportunities (Kenya constitution, 2010). At the time research was being
conducted some youth had received bursaries from this fund. This information was obtained from the
oral respondents and also sub-county education office.
CONCLUSION The study established that the arrival of Europeans in the land was met with conflicts from the elders and
warriors. From an examination of social exclusion and poverty of the Thagichu, the study concluded that
the Thagichu have been socially excluded by the colonial government from 1907- 1962, socially,
politically, and economically.
Government intervention strategies towards alleviation of social exclusion and poverty include the
improved effort in provision of education by building more educational facilities, provision of free
primary and day secondary education, adult and continuing education and non-formal education and
provision of educational funds through the constituency development fund.
The study also established that the government has made enormous efforts in improving infrastructure in
the area such as road networks for example the Maua-Kimongolo-Thagichu road. Other areas are land
adjudication which is in progress, presence of NGOs like JICA and Ripples International which are
encouraging formation and funding of self help groups in the study area. Absorption of the Thagichu
members in government service was also noted as there is a sub-chief in the area and a TSC teacher.
Health facilities have also been provided for example Kilili dispensary and growth of an urban centre in
the same area. Construction of more permanent houses is also encouraged and efforts toward s this area
also noted. Provision of electricity is in progress and a few homesteads have electricity in Thagichu area.
Youths are getting organized into groups and are benefiting from the Affirmative Action Social
Development Fund.
REFERENCES Ayieko, Z.O. (2011) Rural Electrification Authority. Nairobi: Government Printers.
Bell, J. (1993) Doing your Research Project. Maidenhead, Philadelphia: Open University.
Bresnaham, M. K. et al (2002) Attitudinal and Affective Response towards Accented English. Languge

Proceedings of the Third International Research Conference held on 26th to 28th October, 2016 438
and Communication. London: John Wiley
Brockerhoft, M. (1991). Rural To Urban Migration and Child Survival in West Africa: An Analysis
Using The DHS. Michigan: Brown University.
Borg, W.; Gall M.1989. Education Research: An Introduction. 4th ed. New York: Longman Publishers.
Cohen, G. A. (2000) Karl Marx’S Theory of History; A Defence. Princeton: Oxford.
Cohen, L. and L. Manion. (1980). Research Methods in Education. 3rd ed. London: Routledge.
Collingwood, R. G. (1964). The Idea of History. Oxford: Oxford University Press.
Fadiman, J. A. (1993).When we Began. There Were Witchmen; An Oral History From Mount Kenya.
Berkeley: University of California Press.
Frankfort- Nachmias, C. and Nachmias (1996) Research Methods in Social Sciences. New York : Replika
Press Ltd.
Frazer, H, and Marlier, E. (2007)Tackling Child Poverty and Promoting The Social Inclusion Of Children
In The European Union; Social Inclusion Policy And Practice. London: Routledge.
Gijsbers, G. H., and Vrooman, C. (2007). Explaining Social Exclusion: A Theoretical Model Tested In
The Netherlands. Netherlands: The Netherlands Institute for social Research.
GoK. (1957) Colony and Protectorate of Kenya: Sessional Paper No. 77 of 1956/57. The Development
Programme of 1956/60. Nairobi: Government Printers.
GoK. (1963). Sessional Paper No. 1 of 1963/70 On Finance And Planning. Nairobi: Government Printers,
1963. Print.
GoK. (1965). African Socialism And Its Application To Planning In Kenya. Nairobi: Government
Printers.
GoK. (1975). Sessional Paper No. 4 of 1975 on Economic Prospects and Policies. Nairobi: Government
Printers.
GoK. (1979). Meru District Development Plan 1979 - 1983. Nairobi: Government Printers.
GoK. (1979). Meru District Development Plan 1979 - 2001. Nairobi: Government Printers.
GoK. (1980). Sessional Paper No. 4 of 1980 on Economic Prospects and Policies. Nairobi: Government
Printers.
GoK. (1981).Sessional Paper No. 4 of 1981 on the National Food Policy. Nairobi: Government Printers.
GoK. (1986). Sessional Paper No. 1 of 1986 on Economic Management For Renewed Growth. Nairobi:
Government Printers.
GoK. (1992). Sessional Paper No. 2 of 1992 on Small Enterprise and Jua Kali Development in Kenya.
Nairobi: Government Printers.
GoK. (1999).National poverty Eradication plan: 1999-2015. Nairobi: Government Printers.
GoK. (2005). Sessional Paper No. 2 of 2005 on Development of Micro and Small Enterprises for Wealth
and Employment Creation for Employment Creation. Nairobi: Government Printers.
GoK. (2008). Igembe District Development Plan. Nairobi: Government Printers.
GoK. (2009). Kenya Population and Housing Census. Nairobi: Government Printers.
GoK. (2010). The constitution of kenya 2010. Nairobi: Government Printers
GoK. ( 2013). Meru county Government Integrated Development Plan. Nairobi: Government Printers.
GoK. 2012). Policy Framework for Education. Nairobi: Government Printers.
GoK. (2013). National Energy and Climate Strategy. Nairobi: Government Printers.
Gordon et al. (2003). Child Poverty in the Developing World. Bristol: The Policy Press.
Gray, D. E. (2004). Doing Research in the Real World. London: Routledge
Hodgson, G.M. (2004). Social Darwinism in Anglophone Academic Journals: A Contribution to the
History of the Term. Oxford: Blackwell Publishing House. http: //scientificethics. Suite
101.com/article.cfm/ethics-in-social-science http: //en.m.w. Linguistic discrimination
Ikiara, G. K. and Tostensen A. (1995). The Patience of the Poor. Michelsen Institute.
Israel, M. and Hay, I. (2006). Research Ethics for Social Scientists. London : Sage Publications.
ILO. (1996). Report on Labour Migration. UK
JICA. (2006). Participatory Approach to Sustainable Village Development (PASVID)In Sub-Saharan
Africa. Nairobi: Japan International Co-operation Agency (JICA)
Kamerman, S. and Alfred J.K. (2005). Beyond Child Poverty: The Social Exclusion of Children.
Columbia University.
Karlinger, F. (1975). Foundations of behavioral research; Education and Psychology. NY: OUP.
Proceedings of the Third International Research Conference held on 26th to 28th October, 2016 439
Kathuri, N.J. and Pals D.A. 1993. Introduction to Educational Research. Njoro. Egerton University.
Kay, H. (1948). Karl Marx Life Magazine 1948: 66.
Kirimi, J. (2010). The Ameru. University of Nairobi. Unpublished Research Project
KNA. (1925). Meru District Record Book. Unpublished Manuscript
KNBS. (2008). Constituency Report on Wellbeing in Kenya. Nairobi: Government Printers.
Kothari, C. (1985). Research Methodology; Methods and Techniques. New Delhi: Eastern Ltd.
Lee, R. L. (1966). Social Science and the Ignoble Savage. Cambridge: Cambridge University Press.
Leedy, P. D. (1974). Practical Research, Planning and Design. New York: Macmillan Publishers.
Levitas, R. (2006). The concept and Measurement of Social Exclusion. Bristol: policy Press.
Mariara, J. K. (2007). Poverty and Policy in Kenya. Nairobi: University of Nairobi Press.
Mazrui, A. A., and Wondji. (1999). General History of Africa; Vol VIII; Africa Since 1935. Oxford
James Currey Ltd.
Mbiti, J.S. (1998) African Religions and Philosophy, Nairobi: East African Educational Publishers.
Mugenda, O. M., and Mugenda A. G. (1999). Research Methods in Education Qualitative and
Quantitative Research, Nairobi: Acts Press.
Mwaniki, H. S. K. (2005). Chuka Historical Texts. Nairobi: Kenya Literature Bureau.
Mwaniki, H. S. K. (1985). Embu Historical Texts. Nairobi: Kenya Literature Bureau.
Nyanjom, O. (2011) Devolution in Kenya’s New Constitution. Nairobi: Society for International
Development.
Orodho, J.A. (2005). Techniques and Methods of Writing Research Proposals and Reports. Nairobi:
Masola Publishers.
Osso, W. Y. and Onen, D. (2005). A General Guide to Writing Research Proposals and Reports. Nairobi:
Jomo Kenyatta Foundation.
Oucho, J. O. (1996). Urban Migrants and Rural Development in Kenya, Nairobi: Nairobi University
Press.
Palma, G. (2015). A Formal Theory of Underdevelopment or a Methodology for the Analysis of Concrete
Situations of Underdevelopment, New York: Routledge.
Parsons, T. (2012). Being Kikuyu in Meru: Challenging the Tribal Geography of Colonial Kenya.
Cambridge: Cambridge University Press.
Paul, A. B. (1957).The Political Economy of Growth, Oxford: Routledge.
Peter, S. (2008) Economic and Labour Relations Review. Centre for Applied Economic Research.
Pierson, J. (2002). Tackling Social Exclusion, Oxford: Routledge
Rodney, W. (1972). How Europe Underdeveloped Africa, London: Overture Publications.
Tunstall, R. et. al. (2013) The Links between Housing and Poverty: An Evidence Review. UK: JRF.ORG
Sideman,S.N. (2001). The Ties that Divide: Ethnic politics foreign Policy and International/Conflict.
Columbia: Columbia university press.
Schiller, R. B. (1980).The Economics of Poverty and Discrimination Prentice Hall: Eaglewood Cliffs.
http://scintificethics.org. International Committee on Scientific Ethics and Accountability
Silver, H. (2007). The Process of Social Exclusion: The Dynamics of an Evolving World. Chronic
Poverty Research Centre.
Singleton, R. B. (1993). Approaches to Social Research. Oxford: Oxford University Press.
Standard Newspaper. (2013) Pastoralist Development Network of Kenya.
Wafula, W. (2001). Politics of Nationalism in Kenya. A Case Study of the Bukusu of Western Kenya
1500 to1963. Kenyatta University.
Wallerstein, I. M. (2015). The Modern World Systems Vol. 1: Capitalist Agriculture and the Origins of
European World Economy in the 16Th Century. London: Academic Press.
Webster, C. (2002). Poor Transitions: Social Exclusion and Young Adults. New York: Routledge.
World Bank. (1974). Population Policies and Economic Development. Baltimore and London: John
Hopkins University Press.
World Bank. (2000). Can Africa Claim the 21St Century? Nairobi: Njigua Books.
Wrigley, E. A. (2004). Poverty, Progress and Population. Cambridge: Cambridge University Press.
Young, I. M. (2000). Five Faces of Oppression. New York: Routledge ******

Proceedings of the Third International Research Conference held on 26th to 28th October, 2016 440
HATE SPEECH IN THE CREATION OF SOCIO-POLITICAL DOMINANCE IN KENYAN
PARLIAMENTARY DEBATES
Peter, C.A.1*, Muriungi, P.K.2 and Mukuthuria, M.3
Chuka University, P. O. Box 109-60400, Chuka, Kenya
*Correspondence: [email protected]
ABSTRACT
Speech can vary in meaning and implication. It is generally intended to be communicative but it can
sometimes fail to do so. Speech can become something more than a vehicle for the communication of
propositional knowledge. Speakers can manipulate language to evoke the emotions of recipients, hence
becoming “damaging speech” as opposed to speech that does not evoke negative emotions. What is said
or written can have devastating effects on an individual and the society at large. There are aspects of text
that should be incorporated for it to be considered acceptable. The objective of the study was: To identify
and discuss hate speech as a linguistic strategy used by parliamentarians in the creation of socio-political
dominance. The study also analysed language used in debates in the national assembly by identifying hate
speech as a linguistic strategy. Descriptive research design was used. Sample texts were studied using
Foucauldian Discourse Analysis theory. This theory looked at how the society is moulded by language
that shows various power relationships. Qualitative data was collected using a guiding card to identify
utterances that had the potential of being classified as hate speech. The study identified language that
created dominance and discussed hate speech as a strategy used in the utterances. It analyses hate speech
in the debates as captured in the Hansard. The research found that hate speech was used by speakers to
create dominance in the debates.
Keywords: Hate speech, Ideology, Political Dominance, Discourse Strategies.
INTRODUCTION Language is a group of ideas that are arranged in a way of thinking which can be in textual form or verbal
communication (Lupton, 1992). It is a powerful tool that can be manipulated by the writer or the speaker
to suit his need. It can be used to hide meanings or distort facts (Brock- Utne and Garbo, 2009). Language
is integral to the construction of categories that show identity and differences, (Foucault, 1972). An
important characteristic of language is that it is not merely concerned with written language but also with
spoken language. The latter gets more emphasis, Manipulation of discourse is much more pronounced in
speech than in other forms of language. (Palmer, 2004). An utterance shows the situation, event and act in
which it is performed, (Hymes, 1972). A speech situation is an instance of communication that has, as a
prerequisite, a speaker, an utterance and a hearer who interprets the utterance. On the other hand, a speech
act is an utterance that has a performative function in language and communication. Such functions
include promising, ordering, greeting, warning, inviting and congratulating. Speech has the advantage of
instant effect on the listener and hate can easily be spread using this code.
Hate speech attacks a person or group on many aspects of life including on the basis of race, religion,
gender and sexual orientation. It is also speech that inflicts emotional damage and contains inflammatory
comments meant to arouse anger in other individuals to cause severe social dislocation and damage. Hate
speech can take an explicit or implicit form. This can be done by using utterances that are directly hateful
or where the speaker uses indirect ways of spreading hatred. Parliament is a privileged house and the
members enjoy immunity and protection against many actions, including utterances in the course of a
member’s legislative duties. In Kenya the Members of Parliament enjoy these privileges. With the repeal
of Article 2A of the old Constitution and the promulgation of the new Constitution of Kenya in the year
2010, this freedom became evident (Habwe, 2010).
The parliamentarians enjoy this especially in the precincts of the National Assembly. This liberty
provides a conducive environment for hate speech to thrive. This was a major contributor to the spread of
animosity that led to the post-election violence between 2007 and 2008 in Kenya (Okwengu, 2010;
KNCHR, 2007). Since people’s lives revolve around their ethnic groups, politicians have been quick to
retreat into their tribal cocoons in times of problems. This study will look at the discourse characteristics
of hate speech in the Kenyan Parliamentary proceedings as recorded in the Hansard. It is the verbatim

Proceedings of the Third International Research Conference held on 26th to 28th October, 2016 441
record of proceedings in the National Assembly. Hansard is a publication named after Thomas Curson
Hansard, an early printer of the Parliamentary proceedings.
The study looked at extracts from Parliamentary debates conducted in Kenya between 1992 and 2010.
This was a period of many reforms in the country which included the repeal of Section 2A (of the second
constitution after the country got its independence) that changed Kenya from a de jure one party state and
introduced multi-party system in the politics of the nation. This brought about freedom of speech. The
study analysed the speeches used during debates in the Kenyan National Assembly between 1992 and
2010. This is a period when MPs enjoyed great political freedom in expressing their views. The research
identified and discussed hate speech in the Hansard.
LITERATURE REVIEW
Ideology
An ideology is a set of beliefs which individuals or groups base their actions. A certain ethical set of
ideals of a social group that explains how society should work. Political ideologies are concerned with
many different aspects of society including power allocation. Ideologies are frameworks for organizing
the social cognitions that are shared by members of a group. In a discourse, participants engage each other
as individual or groups. In such situations, there can be domination by one group and resistance to this by
the other (van Dijk, 2005). Players especially in a political discourse will tend to portray themselves as
upright and good while placing the others in negative light. Ideology refers to how language accrues
socio- political meaning (Kroskrity, 2000). It organizes and enables all cultural beliefs and practices as
well as the power relations that emerge. Ideology emerges from social actors’ habitual practice. It refers
to shared representation of people in a social setting (van Dijk, 2010).
Social and political aspects are regulated by ideology (Jorgensen and Philips, 2002). Ideology in this
sense brings about identity formation which contributes to socio- political dominance. This is cemented
gradually and if this ideology is spread to cover broader areas and is shared by more people it becomes a
belief (van Dijk, 1995). Ideology played out in Kenyan parliament during debates as MPs reorganized
themselves into cells that identified who belonged to which party or group. It brought about the
categorization of MPs, causing identity creation. The activities that each group participated in were
directed by the ideology that they ascribed to. This affected their views and how they related with group
members and others from opposing sides.
Ideology can be either positive or negative (van Dijk, 2005). This usually depends on who is making the
observation and what the individual’s perspective is. Language in parliament during debate is political
and in Kenya after the repeal of section 2A, there was government and opposition side. The members’
discuss issues based on which side of the divide they belong. This political discourse almost always
places government and opposition on antagonistic fronts. The government would strive to defend its stand
on an issue while opposition would strive to criticize and question government in an attempt to play the
oversight role and speak for the neglected people. Ideology affects the structure of language such as
speech presentation (van Dijk, 1995). A member of parliament from either side would have his personal
view influence the way their team members argue on an issue in the August house. It is through the
discussions in parliament that the groups’ ideology is brought out.
Discourse Strategies
Discourse is an institutionalized way of speaking that determines not only what we say and how we say it,
but also what we do not say (Yasemin, 2010). Discourse signals are used in making interactions, control
unbalanced use of politeness strategies, speech procedures, use of proverbs, evaluative accounts and
explicit declarations of power and dominant informational structure amongst others (Uchenna, 2012).
These should be studied in order to expose the hidden agenda and ideological bias, (Ilie, 2010c). In so
doing one can examine different interpersonal positioning, rules and practices in parliamentary discourse.
Politicians are sustained by persuasive or manipulative use of language. Specific discourse forms can be
resolved into a play of pre- significations as opposed to overgeneralising form of analysis (Hook, 2005).

Proceedings of the Third International Research Conference held on 26th to 28th October, 2016 442
In the present study, investigations focused on how the speakers used such manipulative language that
was actualised in discourse elements such as hate speech and (de) legitimisation.
Concept of Hate Speech
It is argued that there is no universally accepted definition of hate speech, (Hamm, 1994). But according
to The Collins English Dictionary (10th edition, 2009), hate speech is a speech that attacks a person or
group on the basis of race, religion, gender or sexual orientation. It is a speech disparaging a racial, sexual
or ethnic group or a member of such a group. Hate speech is further defined as speech that inflicts
emotional damage and contains inflammatory comments meant to incite other individuals to cause severe
social dislocation and damage (Becker et al., 2000). Hate speech is any propaganda of war and advocacy
of national, racial or religious hatred (ICCPR, 1966). According to the Council of Europe’s Community
of Ministers, hate speech covers all forms of expressions which spread, incite promote or justify racial
hatred, xenophobia and other forms of hatred based on intolerance. Hate speech is that utterance that is
designed to promote hatred on the basis of race, religion, ethnicity or national origin (Rosenfeld, 2003).
For the purpose of the proposed research; hate speech will be defined as any utterance that attacks a
person or group of people on the basis of race, religion, gender or sexual orientation. It should be
examined in the following terms; the purpose pursued by the speaker, the content of the expression and
the context in which the expression is given. It is important to look at the expression and see whether the
speaker’s intention is to show racist, tribal or superiority ideas, or to give information to the public. In
content, there should be a distinction between statements of facts and value judgment when examining the
utterance. The context in which an utterance is made, should address the social status of the speaker, the
potential impact of the speech and the status of the targeted person.
Purpose of Speech
It is important to identify the subject of a speech so as to understand it. Every communication must have a
topic that it is addressing. Communication should have a purpose as a significant feature and the subject
which it is addressing (Mudd and Sillars, 1986). Linguistic discourse is divided into theme and goal. The
former is the subject or idea the speaker wants to convey to the audience. This is usually the speaker’s
message. The goal is the purpose, what the speaker wants to achieve by conveying the idea. This is
important because during debates in Parliament, a speaker may want to say something but the way he puts
it can express his intended goal which may be, to spread hate.
The choice of a speech subject is never the speaker’s alone. The audience needs must play a part in
subject selection. The debates in parliament involve some occasion; this brings the members together in a
session with a speaker and an audience. The occasion will determine what the speaker intends to pass
across to the listeners. The hate speaker wants to give the audience ideas which are organized and
supported. In return the speaker expects some reaction from the audience. Speech can be used to
persuade, entertain and inform. In all, spoken words, which are the interest of this study, are used.
Spoken and Written Discourse
Human beings are linguistic beings and need language in their everyday communication so that they can
understand themselves and their immediate environment and the rest of the world (Murray, 2011).
Communication can involve the use of words. The words used in communication, whether spoken or
written can be interpreted in many ways. They are powerful tools that can injure or cure (Baez, 2002;
Obiakor et al., 2007). Spoken language has the effect of immediacy. One can read the paralinguistic
features that the speaker uses and these can help them gauge what the speaker means. The written text
lacks this. It is possible to read and re-read a text to get a clearer message. At the same time, ‘function’
words have the least possibility of being manipulated to distort or clarify meaning by a speaker. These
words carry the least lexical information. They are words whose main role is to make the speech
grammatical. It is very easy for the writer or speaker to consciously control them. Content words carry the
meaning in a sentence. Therefore these words can be manipulated into hate speech instead of serving their
primary purpose which is, to communicate.

Proceedings of the Third International Research Conference held on 26th to 28th October, 2016 443
Environment for Hate Speech
In the 1980s and before, divisions in terms of ethnicity were not given a lot of prominence and the mass
media such as newspapers and radio broadcasts, never mentioned tribal affiliation (Hirsch, 2013). But this
trend shifted in the 1990s. The communities that used to live in relatively peaceful environments turned
against each other. There arose discrimination on the basis of tribe, religion and sexual orientation. This
has led to hate speech which continues to spread (Murray, 2011). Hate speech has taken new forms and
avenues. These include the Internet, the media and even the entertainment industry where we have song,
drama and dance which can be coined to express hatred. It is arguable that technological advancement has
boosted the proliferation of hate speech because, unlike in the past when hate speech had incidents such
as verbal and physical attacks on minority groups, hate speech has taken new platforms; the Facebook,
twitter, YouTube and blogs among others. Further, the National Assembly is also a likely avenue for hate
speech owing to the privileges accorded to Members of Parliament. In order for hate speech to flourish,
there must be a source and an audience, or a hate speaker and a hate listener, (Murray, 2011).
This concept of hate speech targets people or groups that a speaker considers to be inferior based on the
earlier mentioned characteristics. It is a form of discrimination where one needs to look at communication
action and validity claims. The latter represents; the claim to truth, to rightness of norms and values and to
the speaker’s sincerity. These are seen in hate speech as the claim to inequality (in the objective world),
the claim to the rightness of discrimination against groups and the claim of a sincere hater towards the
targeted group, (Gelber, 2002).
Hate speech occurs in many forms such as text messages, radio broadcasts, leaflets and speeches and can
have various effects on the listeners (Hirsch, 2013). In parliament, hate speech can be identified in
speeches during the debates in the house. It is believed that hate speech played a major role in the
eruption of violence during political campaigns and elections of 1992, 1997 and 2007 in Kenya (Bayne,
2008; EU 2008, IREC 2008: KNCHR 2007). For this reason, there is need to study hate speech before,
during and after elections, and to scrutinize the leaders’ use of language. Do they use language that brings
reconciliation or language that stokes violence? This study intends to look at the language used by leaders
in a formal setup and then study the content of their debates.
Identification of Hate Speech
It is not easy to identify hate speech (Weber, 2009.) Hate speech can be concealed in statements which,
on the surface, may appear to be plain and harmless (Weber, 2009 and Yasemin, 2010). A speaker may
quote certain words used elsewhere or make use of metaphors that the listener has to decipher. Hate
speech can be identified to be any careless or intentionally hurtful statements. Thus, any speech that
criticizes another person’s race, religion, gender, ethnicity, appearance, class, physical or mental
capabilities or sexual preference can be identified as hate speech (Dershowitz, 1992). Hate speech is
epithets, ethnic slurs, insulting language, name calling, derogatory references, inciteful speech, language
that marginalizes, language that denigrates- criticizes unfairly or insults, use of dehumanizing language
such as referring to persons as weeds, spots and animals (Hirsch, 2013). The researcher will use these to
guide in developing a card which will assist in identification of hate speech in the extracts from
parliamentary proceedings.
Freedom of Expression
Freedom of expression is a state of being allowed to say what you want to say. This includes the rights to
express oneself the way they feel. The right should be enjoyed so long as they do not infringe on the
rights of others and are not malicious, false and seditious (Harrower, 2007). The first amendment
prohibits government officials from suppressing speech. It is not clear where the line is between hate
speech and freedom of expression (Volkova, Silvestri, and Lopez, 2001). People often manipulate the
freedom of speech to suit their interests and in the process inflict damage or hurt other people with their
words. Hate speech holds important functional values that form the basis of common law which protects
society (Cowan, Resendez, Marshal and Quist, 2002). Free speech on the other hand, gives an
opportunity for candid discussions. It is also an instrument that has contributed to development and
advancement of minority groups by allowing open discussions on issues. Free speech affects different

Proceedings of the Third International Research Conference held on 26th to 28th October, 2016 444
people in varied ways. For example, anti-gay language is seen by the gay as hateful while advocating gay
lifestyles is also seen by Christians as being hateful (Dershowitz, 1992.) Information about contraception
would be considered as hate speech by some people, whose faith discourages the use of contraceptives as
a family planning method. In all these expressions, new ideas are spread and alternative viewpoints are
raised through free speech (Cowan et al, 2002). Prohibition of hate speech is a limitation of freedom of
expression. Freedom of speech should be enjoyed by all, but it can be limited to a point when it is
necessary to protect other values such as human dignity (Stakic, 2011). According to Mill (1989),
governments have no right to prescribe opinions and to determine what the citizens are allowed to hear.
People have a right to do whatever they want as long as it does not infringe on the rights of others.
Freedom of expression carries special duties and responsibilities; respect of the rights and reputations of
others, the protection of national security or public order, health and morals (ICCPR, 1966).
Individual freedom should be inco-operating protection from oppressive popular opinion referred to as
tyranny of the majority and the government authority. Speech should be accorded special protection from
government regulation because expressions and thoughts should be viewed on the same platform. It
should be private and not regulated (Riley, 1998).
Hate Speech and Parliament Proceedings
Parliament has popularly elected leaders who have legitimately been chosen by the people through a
democratic process. When such leaders speak, they make their electorate accept the discourse that they
use and it influences the latter’s actions. This can give way to wicked cultural insultive remarks that could
damage and frighten certain groups of people (Hirsch, 2013). Parliamentary debates have a more
immediate and powerful effect on the listeners. Although the speeches made in parliament are directly
meant for a specific audience, it is nevertheless clear that all transactions and discussions in the house are
made by representatives of the people. Their utterances are said on behalf of the people. On many
occasions some speeches in the National Assembly have not augured well with the public. Hate speech
has been known to lead to social rage and hatred in political rallies and on media talk shows. Arguably,
such feelings could be transferred to other people.
A speech such as the following on discrimination can cause a lot of animosity:
… sometimes, during Jomo Kenyatta’s time, we had those problems. Worse ones were yet to
be experienced during the Moi regime and, of course, the worst came early this year. That is
because of one tribe discriminating against the others. (Hansard, 2008: 1653).
This statement is bound to elicit negative feelings against the one tribe that appears to be favoured and
there is a likelihood that the members of the other tribes could gang up against the one tribe.
Hate speech can arise from falsehoods, flawed argumentation, divisive language and dehumanizing
metaphors that are directed towards specific vulnerable groups (O’Grady, 2009). This is evident in some
of the debates in parliament. In some instances the hate in the speeches is not even concealed. The hate
speaker does so openly and does not use other aspects of linguistics such as implicature. In the following
extract, a member of parliament is pointing an accusing finger at the government’s recruitment
procedures. The member intends to arouse some perception, that there is favouritism involved and
members of a certain region are given the rosy ministries and positions. This could easily lead to
despondency and disdain towards the region where the president comes from, by the members from other
regions which feel left out.
A casual glance at the government records shows disparities. Look at the office of the President’s staffing.
People from one particular region took charge of very good ministries, very powerful ministries,
parastatals and departments. Ministries which are heavily funded are given to people from one particular
region (Hansard, 2007: 3831). Parliament proceedings are productive forces in a conflict. During question
time, the members have an opportunity to ask for clarification, make claims and allegations over what has
been said by either a member or even a non-member of the house. Members of Parliament enjoy the
privilege to express themselves freely and sometimes without weighing the words they use. More often
than not the members go overboard in their contributions. They use language that may have greater

Proceedings of the Third International Research Conference held on 26th to 28th October, 2016 445
ramifications than the intended information. The debates, being verbal, have a more immediate and
powerful impact on the listeners as compared to written discourse. This is because the listener can react
on the spot to what has been said.
Prior to the 2008 US elections, it was noted that there was political discourse that was laced with hate
speech which begun to resemble the situation in Kenya during the 2007/2008 campaigns and election
period. This hate speech targeted President Obama negatively. There was use of puns and word plays like
‘Osama/ Obama/ Nobama (Hirsch, 2013). Obama is the president of the United States; Osama was the
leader of the terrorist group called Al-Qaeda. This may be seen to mean that the president and Osama
have a similar characteristic, which is why they follow it with Nobama. The last word is used to mean that
there is no Obama, that is, he should not be elected. The whites used these words to campaign against
Obama. The placing of such words together in a sort of rhyme is tantamount to spreading hate. Hate
speech may not always be presented in an obvious way. It can be hidden or implied. We can see the
morphological implication in the words formed. By changing or replacing one unit in the morpheme we
change the word and its meaning hence contributing to negativity in what we are saying.
The Power in Language
The context of what is said matters because the same thing said in different contexts can be either
acceptable or not. Freedom of speech should be approached as a value detached and independent from the
actual content of speech (Chomsky, 1980). Expressions such as ‘kumbavu’- a foolish person and ‘mavi
ya kuku’- chicken excrement, used by the former president of Kenya, honourable Mwai Kibaki, come out
as a touch of humour but if someone else said them, they would be considered abusive and would elicit
negative feelings and reactions. This is because they are actually words of insolence. Politicians, and
other people who have the opportunity of speaking to a big audience, can take advantage to express their
personal attitudes. Language at this instance can be manipulated easily at the whims of the speaker.
Divisive language, deixis, looks at word choice and how rhetorical effects are used to appeal to listeners.
Deixis in linguistics refers to words or phrases that require contextual information so that the listener can
grasp denotational meaning or understand it. In a statement, there is need to study deictic terms that need
contextual information such as time, speaker and listener, location and third party. Deictic words point at
specific persons, places, situations, values ideology and group (Lyons, 1977).
The power of particular utterances is in the context in which they are spoken. A harmless statement in the
midst of tension can cause violence and hatred that would otherwise not be experienced during peaceful
times (Hirsch, 2013). Inflammatory speech during the election campaign period was responsible for the
violence that followed the 2007 election in Kenya (Odinga, 2013). Speeches can be used to indoctrinate
the masses to take certain positions (Hirsch, 2013). In such instances language can be used to give
dehumanizing images to meet this purpose. If language is used in this way, it should be a pointer to an
imminent eruption of violence caused by speech.
Political Dominance
Power is not just a negative concept of coercion or repression but it can be a productive and positive force
(Gaventa, 2003). A group with more power is considered as the dominant one and it may control others in
specific situation or domains. Since action is controlled by the mind, the dominant group strives to
influence other people and this gives them power over the dominated group (Essed, 1991). Group based
dominance is produced and maintained through discrimination at various levels which is integrated and
co-ordinated by legitimizing ideology (Pratto, Sidanius and Levin, 2006).
Nyewusira and Nweke (2012) expose that transactional nature of party politics affect democratic
governance at local government level where there arose a system of support of policymaking opposed to
rules, ethics and views of democratic governance. Overt statements of power and dominant interpretive
frameworks are aspects of discursive signals used by elders to mark interactional power (Uchenna, 2012).
This compares with implicit explanation used by speakers in parliament to respond to questions. This
aspect of discursive formation is discussed under mode. Dominance can be conveyed by non-verbal cues

Proceedings of the Third International Research Conference held on 26th to 28th October, 2016 446
such as body language (Amos, 2013). People knowingly develop and use this as a technique to exert
control over others. MPs use this aspect consciously to achieve their desired goals. Dominance is also
created through other discourse elements; streotypes, implicature, hate speech, verbosity and
presupposition. There has been a ‘linguistic turn’ (Stibbe, 2001) where there is a social principle that
looks at how language is given a dominant role in social aspects (Fairclough, 1992). Politics is a game of
power and dominance. It is argued that power is a force that circulates in a web of social interactions
between individuals who exercise as well as undergo power. Foucault (1980: 98) says:
Power is employed and exercised through a net-like organisation. Not only do individuals do
circulate through its thread, they are always in the position of simultaneously undergoing and
exercising this power. They are not only its inert or consenting target; they are always also the
elements of articulation. Thus, individuals are the vehicles of power, not its point of application.
It is the argument of this thesis that members of parliament see themselves truly as the elements just
aforementioned; elements of power. They always want to be felt not only by the people they serve, but
also by their fellow parliamentarians. That is why; therefore, they will use all that it takes for that
dominance to be felt. This includes the language they use on the floor of the house. It is this language that
this thesis sought to analyse. The Language that parliamentarians use during debates may, at times, be
considered ‘unparliamentary’.
According to West Minister system such language includes, among others, hate speech, profanity,
dishonesty and the like (Pilkinton, 1999). Legislators are however protected from persecution and legal
actions because they enjoy parliamentary immunity. On legal proceedings against a member of
parliament, chapter 8 of the Constitution of Kenya states:
No civil or criminal proceedings shall be constituted against a member for words spoken before,
or written in a report to, the assembly or a committee, or by reason of any other matter, brought
by him therein by petition, bill, resolution, motion or otherwise.
By studying parliamentary discourse, it is hoped that the various strategies used by members of
parliament would be revealed to the general populace since, in the house, members are not always
objective in their contributions. Rather, they tend to incline toward the position taken by their side of the
divide; There are always opposing sides even when the members debate legislative propositions (Bayley,
2004). This study focuses on the language used in Kenyan parliamentary debates to create socio- political
dominance. While studying parliamentary debates, the role of context in the discourse is undisputable.
Though parliaments are bound by strict rules of operation (mentioned earlier), the role of the context of
culture and history is indisputable (Bayley, 2004.) The Kenyan Parliamentary discourse has intrigues that
stretch into the early history of this country. On the eve of Independence in 1963, there emerged two
strong contending sides among the politicians who were in the frontline of taking the helm of leadership
from the colonial masters; Kenya African Union (KANU) and Kenya African Democratic Union
(KADU). The alignment has polarised Kenya since the formative stages of the nation and its effects have
hounded the country with undesirable outcomes, including the Post-Election Violence (PEV) which
rocked the country after the 2007 General Elections. This is argued out in the progression of this thesis.
In June 1982 Kenya was officially declared a One Party State. There followed a dark period in the history
of Kenya; a period that many Kenyans would rather forget; a period of unfathomable oppression. Not
even politicians were spared. None would dare express their opinion. That was an era that saw many
underground political activities and movements. A lot of political dissent was expressed clandestinely.
There were many detentions without trial. The parliamentary debates of these years were full of court
poetry; language was used with an intention of praising and pleasing the government that was in place.
The then State party was commonly referred to as ‘Baba na Mama’ (father and mother). Every word
uttered revolved around the goodness of the party. The situation suddenly changed toward the end of
1991. The clamour for the repeal of this section bore fruit. In 1992, Kenya saw the repeal of section 2A
that ended the one party rule in the country and saw the beginning of multi-partiism. Multi-partiism
ushered in a new era of unprecedented freedoms in Kenya. This is evident in all spheres of life leave
alone parliament; members could speak out their mind without fear of being detained the moment the

Proceedings of the Third International Research Conference held on 26th to 28th October, 2016 447
stepped out of the precincts of the august house. The current study sought to find out how
parliamentarians used language in their supremacy war for political dominance.
Parliamentary language should be courteous, good tempered, and use moderate among other qualities.
Language that does not have such qualities is considered un-parliamentary. It uses offensive, provocative
or threatening approaches. Personal attack, insults and obscene language or words are not allowed. In
Belgium as well as Ireland, a member is allowed to say what he or she wishes because they consider it
necessary as a democratic state. They have absolute freedom of speech when in parliament. The Canadian
members enjoy freedom of expression but certain words and phrases are prohibited. Members avoid using
such words to describe others (MP) because they are un-parliamentary (Flynn, 2007). Un-parliamentary
language is prohibited in Hong Kong and India. The Indian parliament discourages the use of certain
words and phrases and has gone further by publishing a book of words that are un-parliamentary.
Similarly the New Zealand parliament has a list of words and phrases that are seen as unbecoming and
insultive. Ugandan parliament members are given an opportunity to explain a speech that could have been
misunderstood, to exonerate his or her character and conduct if it has been maligned (Kiwanuka, 2012).
In the neighbouring country, Tanzania, Parliament proceeding is conducted in Swahili and members are
expected to conduct themselves with dignity and moderation (Wekuja, 2004).
As hinted already, dominance is a term associated with authority, control and command actions and it
may be exhibited in an optimistic or harmful way, depending on the intention of the speaker and the
purpose for which the dominance is displayed. In politics, dominance is a battle of supremacy by the real
or imaginary opposing side. This can be conveyed through prominence, positioning and determination to
dominate interactions. The parliamentary procedure of having only one member on the floor at a
particular time is not only a show of superiority but also physical dominance. The MP, towers over the
seated colleagues. Dominance is thus perceived in positioning of the member’s physique (Amos, 2013.)
Foucauldian Discourse Analysis (FDA)
Foucauldian Discourse Analysis (FDA) theory informed the study. FDA is patterned way of thinking
which can be identified in textual and verbal communications and be located in wider social structure
(Lupton, 1992). Parliaments are different in terms of culture, historical development and power relations
and it is these variations that influence the way language is used in the parliament (Jakaza, 2013); so,
using different theoretical frameworks on different data gives important insights on parliamentary
discourse. FDA is a method of Critical Discourse Analysis (CDA) that is applied to texts. A CDA is
usually based on power; which is social power of groups or institutions. There is power if individuals are
able to control the actions and thinking of others. The assumption is that those who are powerful have
privileged access to scarce resources such as knowledge and information (Lukes, 1986; Wrong, 1979).
FDA can be used where the text has been assessed and confirmed to represent the required contents.
Widdowson (2004) characterises CDA as: “… type of discourse analytical research that primarily studies
the way social power abuse, dominance and inequality are enacted, reproduce and resisted by text and the
social and political context.” Discourse is language; that is, its structure, functions and patterns in use.
This study employed Foucauldian Discourse Analysis, a form of CDA, as espoused by Michel Foucault.
It finds its roots from the critical theory of language which views language as a social phenomenon. This
theory has not been used to analyse parliamentary debates in Kenya. FDA is a critical concept often used
in politically oriented studies. It is preferred by scholars who are looking for a system that tries to explain
the political implications of discourse (Batstone, 1995). During debates in parliament, language is used to
create identities and also to manipulate the listeners. FDA is an analytical approach that studies primarily
the way social power abuse, dominance, and inequality are enacted, reproduced and resisted by text and
talk in the social and political context (van Dijk, 2003). The present study examined how language was
used to create dominance through coercion and other strategies.
METHODOLOGY The study used a qualitative research design. This was appropriate in the study of human behaviour
because it uncovers deeper understanding of such behavior (Lincoln and Guba, 1985). This method

Proceedings of the Third International Research Conference held on 26th to 28th October, 2016 448
allowed the researcher to gather the required information. The methodology helps a researcher to collect
data in the form of words (Miles and Huberman, 1994). The target population for the study was the
speeches made by the parliamentarians between 1992 and 2010 in the National Assembly. The research
investigated the kind of language the MPs used during debates in parliament that created socio – political
identities and dominance.
Data Collection Procedure
Data was collected from extracts of parliamentary debates in Kenya. This information was from the
Hansard. Relevant excerpts were identified using a guiding card. Hate speech as a strategy of dominance
creation was examined.
RESULTS AND DISCUSSION
The research problem was that politically elected leaders use the immunity that they enjoy to manipulate
language to create dominance. Members of Parliament used explicit and implicit forms of hate speech to
coerce others to support, embrace or reject some people and to incite others against the establishment.
Using language in this way created socio- political dominance. The findings of this study are presented
alongside the three research questions. In their endeavour to create social political dominance the
members of parliament in Kenya used hate speech as pragmatic strategies. There were many instances
where MPs used inflammatory statements that were offensive and provocative.
During debates, some of the speeches made had the ability of inflicting emotional damage and also
contained inflammatory comments meant to incite other individuals. Hate speech was evident in the
forms of expressions used by the speakers. Such speech spread animosity and incited the listeners. The
following are excerpts in which such language was used to exhibit socio- political dominance.
Utterance 1
Mr. Temporary Deputy Speaker, Sir, look at the situation obtaining at the Kenya Ports Authority (KPA).
There is a Managing Director who did a commendable job there – Mr. Brown Ondego. He was removed
and replaced with another docile one, merely because there was pressure coming from that region we are
not recognising ability and capability! (Hansard: 12th
September 2007).
This utterance was on the motion on imbalance in the distribution of public resources. The following is
the classification of the utterance from the guiding card.. Elements of Hate Speech Present/ not present
1. Speech that solicits disdain against a person/ group because of their ethnicity.
2. Speech that encourages ethnicity.
3. Incitement to hatred against a group of persons defined in terms of race, ethnicity,
national origin, gender and religion.
4. Use of cultural stereotypes.
5. Any form of expression regarded as offensive to racial, ethnic and religious groups.
6. Speech that promotes discrimination on the basis of tribe, colour, ethnic group,
religious group.
7. Use of abusive, negative and insulting language.
8. Ridiculing of another person on basis of ethnicity, race or religious belief.
9. Use of threatening, abusive words or behaviour to stir ethnic hatred
The utterance here refers to the leadership of KPA. It is on the apparent wrong choice of the
leadership of the corporation. There is a tribal and regional element to it. There is the use of
dimunitive language that shows bias against people from a certain region. The idea of incompetence
comes up. There was a wrong choice based on “our” person. The topic here is the speech that solicits
disdain against the group from certain regions because of their ethnicity. The speaker is inciting the
others against a group. This utterance emboldens ethnicity.

Proceedings of the Third International Research Conference held on 26th to 28th October, 2016 449
Utterance 2
Mr. Temporary Deputy Speaker, Sir, look at the situation obtaining at the Kenya airports Authority
(KAA). Eng. Mwongera, who actually fits in the job of being the managing Director of KAA-, I would
imagine- is the Chairman of that Corporation! A former priest is the Managing Director. It is those kinds
of scenarios that we would want to see corrected. (Hansard: 12th
September 2007)
The utterance was a debate on the motion on distribution of public resources. Categories:
Elements of Hate Speech Present/ not present
1. Speech that encourages religious/ group violence.
2. Incitement to hatred against a group of persons defined in terms of race,
ethnicity, national origin, gender, religion and sexual orientation.
3. Any form of expression regarded as offensive to racial, ethnic and
religious groups.
4. Speech that promotes discrimination on the basis of tribe, colour, ethnic
group, religious group.
The speaker in the utterance strives to draw everyone’s attention to the irregular ways that government
distributes employment opportunities. Those in power use the position of authority to give jobs to their
relatives and friends who may be unqualified for the positions. The speaker uses this opportunity to incite
others to rise against these acts. In doing this, he uses language that is abusive, derogative and hateful. He
belittles the calling of priesthood. The speaker takes advantage of the chance to delegitimize the
government since he is in the opposition.
Utterance 3
Mr. Maore:… So when the language is used that we all share the responsibility of bringing down the
economy, I say no!... Today what has been happening for the last several years is that very many people
are getting rich from the DOD after supplying air.
Mr An’gwenyi:…Is the honourable member from some part of Meru in order…” (Hansard: 12th
September 2007).
The utterance was a debate on the rampant spread of corruption in the government. Categories:
Elements of Hate Speech Present/not present
1. Speech that solicits disdain against a person/ group because of their ethnicity.
2. Speech that encourages ethnicity.
3. Incitement to hatred against a group of persons defined in terms of race,
ethnicity, national origin, gender, religion and sexual orientation.
4. Use of cultural stereotypes.
5. Any form of expression regarded as offensive to racial, ethnic and religious
groups.
6. Speech that promotes discrimination on the basis of tribe, colour, ethnic group,
religious group.
7. Use of abusive, negative and insulting language.
8. Ridiculing of another person on basis of ethnicity, race or religious belief.
9. Use of threatening, abusive words or behaviour towards a group to stir up
ethnic hatred.
In utterance, the speech has words of loathing for some group. One speaker uses offensive and
provocative language. The discourse conveys to the front the awareness of regionalism, the speaker
strives to undermine the Meru people by presenting Meruland as an area where that does not create
interest and so people do not aspire to go there.
The utterance was an appreciation of the presidential address. The speech has words of hate for some
group. One speaker uses offensive and provocative language. The discourse brings to the fore the

Proceedings of the Third International Research Conference held on 26th to 28th October, 2016 450
awareness of regionalism, the speaker strives to undermine the Meru people by presenting Meruland as an
area that is not interesting and inspiring. This is a dimunitive reference to the area. This is further captured
in his statement: Mr. Speaker, Sir… member from some part of Meru in order…The freedom that
parliamentarians enjoy provides a conducive environment for hate speech to thrive and largely
contributed to mobilizing people to spread animosity that led to the post-election violence between 2007
and 2008 in Kenya (Okwengu, 2010; KNCHR, 2007). In the utterance, the speaker uses such speech
when he refers: In the statement… from some part of Meru… the speaker appears to look down upon the
Meru region. This is a speech disparaging among other things, ethnic groups or a member of such a
group. The speaker advances his dominance by using hate speech (Friedman, 2011). This can be related
to who uses hate speech to derive cheap laugh by degrading an entire group of people in the following
example:
Question: How was the Grand Canyon formed?
Answer: A Jew lost a nickel in a crack.
The speaker in this utterance also degrades Meru area and by extension its people. Whereas Friedman
(2011) pokes fun at the Jews, the speaker in this utterance is forthright and refers to the region as if it is
not of importance. Such a statement is a way of displaying the speaker’s socio- political dominance.
Utterance 4
Mr. Ojode: …What I was saying is that heavily funded Ministries are given to people from a particular
region. That disparity is what we want to rationalise. …Ministry of Education alone, which has over 30
core functions, is headed by people from one particular region… It is worse, when the same Government
is employing people who have attained the mandatory retirement age of 55 years. It is so absurd and so
bad, yet the country is full of graduates from various regions…(Hansard: 12th
September 2007).
The utterance was a debate on the public outcry on the nepotism that continued to thrive in the
government. It was categorized as follows:
Elements of Hate Speech Present/ not
present
1. Speech that solicits disdain against a person/ group because of their ethnicity.
2. Speech that encourages ethnicity.
3. Incitement to hatred against a group of persons defined in terms of race, ethnicity,
national origin, gender, religion and sexual orientation.
4. Use of cultural stereotypes.
5. Any form of expression regarded as offensive to racial, ethnic and religious groups
6. Speech that promotes discrimination on the basis of tribe, colour, ethnic group,
religious group.
7. Use of abusive, negative and insulting language.
8. Ridiculing of another person on basis of ethnicity, race or religious belief.
9. Use of threatening, abusive words or behaviour towards a group to stir ethnic hatred
In the utterance, the language used by members of parliament during debates is a discursive act of
discrimination that encourages inequalities (Gelber, 2002). In the speech, the speaker from the opposition
side decries the manner in which the government is favouring people from certain communities. It uses its
powers to create socio-political dominance. The speech contains expressions of hatred for some group.
One speaker uses inciting and provocative language. The speech brings to the fore the idea of
regionalism. It implies that the Mount Kenya region is favoured by those in power, to the disadvantage of
the rest. This is hate speech, as the speaker strives to provoke the people from the areas that have not been
favoured to rise up against those who have benefitted from these employments. From the guiding card,
the speaker fulfils the reference to number 1: “Speech that solicits disdain against a person/ group and
encourages negative ethnicity and regional misunderstandings”.

Proceedings of the Third International Research Conference held on 26th to 28th October, 2016 451
Utterance 5
Mr. Ojode:… I wanted to appeal to the Government to take strategic steps, without victimising
anybody… there was some skewed manner in which employment was done in that department….Look at
the office of the President’s staffing. People from one particular region took charge of very good…which
are heavily funded are given to people from one particular region…(Hansard: 12th
September 2007)
The utterance was also a discussion on favourism and nepotism in employment. Categories:
Elements of Hate Speech Present/ not
present
1. Speech that solicits disdain against a person/ group because of their ethnicity.
2. Speech that encourages ethnicity.
3. Incitement to hatred against a group of persons defined in terms of race, ethnicity,
national origin, gender, religion and sexual orientation.
4. Use of cultural stereotypes.
5. Any form of expression regarded as offensive to racial, ethnic and religious groups.
6. Speech that promotes discrimination on the basis of tribe, colour, ethnic group, religious
group.
7. Use of abusive, negative and insulting language.
8. Ridiculing of another person on basis of ethnicity, race or religious belief.
9. Use of threatening, abusive words or behaviour towards a group to stir ethnic hatred
Hate speech is evident in the utterance. The utterance solicits social disdain against a group, this
encourages negative ethnicity. The speech has the potential to stir up ethnic hatred. In context, there
should be a distinction between statements of facts and value judgment when examining the utterance.
The context in which an utterance is made, should address the social status of the speaker, the potential
impact of the speech and the status of the targeted person. These circumstances influence listeners. This
utterance shows how hate can be used in speech to stir up negative ethnicity. This has led to hate speech
which continues to spread (Murray, 2011).
Language that exhibits socio- political dominance, targets people or groups that a speaker considers as
being inferior. It is a form of discrimination where one needs to look at communication action and
validity claims. The latter represents: the claim to truth, to rightness of norms and values and to the
speaker’s sincerity (Gelber, 2002). These may be present in MPs language or may not be there especially
if the language used is meant to coerce or manipulate the listeners.
SUMMARY The paper presents the backdrop of the study which is premised on the following research objective; to
identify and discuss hate speech as a linguistic strategy used by parliamentarians in the creation of socio-
political dominance. There is a detailed literature review regarding the study in which the following areas
have been discussed; Ideology, concept of hate speech, purpose of speech, spoken and written discourse,
environment for hate speech, identification of hate speech, freedom of expression, hate speech and
parliamentary proceedings, the power in language, political dominance, discourse analysis and
Foucauldian discourse analysis
CONCLUSION This study set to examine how parliamentarians used hate speech during parliamentary debates to create
socio-political dominance. Between 1992 and 2010, the Kenyan Parliament turned very vibrant as
members freely enjoyed the freedom of expression especially after the repeal of the section 2A of the then
Kenyan Constitution. It was evident that the ideology that the members ascribed to had a great impact on
the kind of language they used during debates. They sometimes went overboard to create socio-political
dominance. Evidently, the government and the opposition were always on an antagonistic stance in their
response to the questions. The members’ contributions were mainly geared towards power control over
the weaker side. The MPs change their ideology depending on whether they are in government or

Proceedings of the Third International Research Conference held on 26th to 28th October, 2016 452
parliament at the given time. Consequently, the contributions in parliament are more inclined towards
dominance rather than focus on the matter at hand.
REFERENCES Amos, J.A. (2013). Body language and hierarchy or dominance.
Baez, R. (2002). Affirmative Action, Hate Speech and Tenure. New York: Routledge Falmer.
Batstone, R. (1995). Grammar in discourse: Attitude and deniability. In: G. Cook and B. Seidlhofer
(eds.). Principle and practice in applied linguistics. P. 197-213. Oxford: OUP
Bayley, P. (2004). The whys and wherefores of analysing parliamentary discourse. In
Bayley, P. (Ed). Cross- Cultural Perspectives on Parliamentary Discourse. P. 1- 44. Amsterdam. John
Benjamins Publishing Company.
Bayne, S. (2008). Post Election Violence in Kenya: An Assessment for UK Government. London: DFID
Kenya – UK Government.
Becker, P. J., Byers, B. and Jipson, A. (2000). ‘The Contentious American Debate:The First Amendment
and Internet-based Hate Speech.’ In International Review of Law Computers and
Technology.Vol.14 No. 1: Cyber-crimes, Cyber speech and Cyber liberties.
Brock-Utne, B., and Garbo, G. (2009). Language and Power: Implications of Language for Peace and
Development. Dar es Salaam, Tanzania: Mkuki na Nyota Publishers Ltd.
Chomsky, N. (1980).Some Elementary Comments on the Right of Freedom of Expression. Preface to
Fourisson, R. Memoire en defense. Paris
Cowan, G., Resendez, M., Marshal, E. and Quist, R.(2002). ‘Hate Speech and Constitutional Protection:
Priming Values of Equality and Freedom.’In Journal of Social Issues. Vol 58- issue 2, page 247-
263. .
Dershowitz, A. M. (1992). “What is Hate Speech.” Boston: The Bryan Times.
Essed, P.J.M. (1991). Understanding everyday racism: An interdisciplinary theory. Newbury Park, CA:
Sage.
EU, Election Observation Mission, (2008). Kenya: Final Report General Elections 27 December.
European Union.
Fairclough, N. (1992). Discourse and social change. Cambridge: Polity Press.
Flynn, C. (2007). Debating tutorial. Ireland: Ardfinnan CO. Tipperray.
Foucault, M. (1972). The Archaeology of Knowledge and the Discourse on Language. London:
Routledge.
Foucault, M. (1980). Power/ knowledge: Selected interviews and other writings (1972-1977). Colin
Gordon (ed) New York (NY): Pantheon Books.
Friedman, T. (2011). Language: Origin of hate, “why Thomas friedman hates Israel” New York: Newt
Mitt.
Gaventa, J. (2003). Power after Lukes: A review of the literature. Brighton: Institute of Development
Studies.
Gelber, K. (2002). Speaking Back: The Free Speech Verses Hate Speech Debate. New York. John
Benjamin Publishing Company.
Habwe, J. H. (2010). ‘Dialogue Drama in Kenyan Political Speeches and PragmaticImplications.’ In:
Nordic Journal of African Studies 19(3): 165-180.
Hamm, M.S. (1994). ‘Hate Crime: International Perspectives on Causes and Control Cincinnati, OH’. In
Academy of Criminal Justice Sciences: Anderson Publications.
Hansard Publications (2007). Parliamentary Records. Nairobi: Government Printer.
Harrower, T. 2007. Inside Reporting: A Practical Guide to the Craft of Journalism. NY: McGrawHill.
Hirsch, S. (2013). Putting Hate Speech in Context: Observations of Speech, Power and Violence in
Kenya. “Speech, Power and Violence: Hate Speech and the Political Crisis in Kenya. George
Mason University.
Hook, D. (2005). Genealogy, discourse effective history: Foucault and the work of critique. Qualitative
Research in Psychology. 2(1):3-31.
Hymes, D.H. (1972) “On Communicative Competence” In Pride, J. and Holmes, J. Sociolinguistics.
Harmondsworth: Penguin.

Proceedings of the Third International Research Conference held on 26th to 28th October, 2016 453
IIie, C. (2010 c). Introduction: European parliaments under scrutiny: Discourse strategies and interaction
practices. In IIie, C. (ed) PP 1-28.
Independent Review Commission (2008). Report of the Independent Review Commission on the General
Elections Held in Kenya on 27 December 2007. Nairobi. International Covenant on Civil and
Political Rights. (1966), GA Res 2200A(XXI).
Jakaza, E. (2013). Appraisal and evaluation in zimbabwean parliamentary discourse and its representation
in newspaper articles. Unpblished Ph.D: Stellenbosch University.
Jorgensen, M. and Phillips L. (2002). Discourse analysis as theory and method. London: Sage.
Kenya National Commission on Human Rights (2007). ‘Still Behaving Badly’: Second Periodic Report of
the Election- Monitoring Project. Nairobi. Kenya National Commission on Human Rights.
Kiwanuka, W. 2012. Parliamentary debate in Uganda. Uganda: Office of Clerk, Ugandan Parliament.
Kroskrity, P. (2000). Regimes of language Ideologies, Polities and Identities. Santa Fe, NM: School of
American Research Press.
Lincoln, S.Y. and Guba, E.G. (1985). Naturalistic Inquiry. Newbury Park, London: Sage Publications.
Lukes, S. (1986). Power. Oxford: Blackwell.
Lupton, D. (1992). ‘Discourse Analysis: A New Methodology for Understanding theIdeologies of Health
and Illness’. Australian Journal of Public Health 16: 145-150.
Lyons, J. (1977). Semantics. London: Cambridge University Press.
Miles, M.B. and Huberman, M. A. (1994). Qualitative Data Analysis. London: Sage Publication.
Mill, J. S. (1989). On Liberty and Other Writings. Cambridge: Cambridge University Press.
Mudd, C. and Sillars, M.O. (1986). Speech: Content and Communication (5th Ed.) New York. Harper and
Row Publishers.
Murray, R. (2011). Do Words Harm? The Perceptions and Attitudes of African College Students to Hate
Speech. Unpublished Ph.D. Dissertation. Capella University: ProQuest LLC.
National Cohesion and Integration Commission (2011).Guidelines for Monitoring Hate Speech. NCIC.
Nairobi: Pamoja.
National Cohesion and Integration Commission (2008). National Cohesion and Integration Act. NCIC,
Nairobi: Pamoja.
Nyewusira, V. and Nweke, K. (2012). Party politics and democratic governance in Nigerian local
government administration: The case of Rivers State (1999- 2010). Nigeria: River State
University of Education.
Obiakor, F.E., Smith, D. J. and Sapp, M. (2007). Understanding the Power of Words in Multicultural
Education: Multicultural Perspectives, 2:36-42.
Odinga, C. (2013). Use of New Media During the Kenyan Elections: MA Thesis.Uppsala University:
Department of Information and Media.
O’Grady. C. (2009). Hate Speech, Media Activism and the First Amendment.Putting a Spotlight on
Dehumanising Language. New York.
Okwengu, N. M. (2010). The Role of Government and Media Conflict in War: A Case of the Kenyan
2007/2008 Election Violence. A Thesis submitted in Partial fulfillment of the MSc. Development
Studies. Lund University.
Palmer, F.R. (2004). Semantics (2nd
Ed), U.K. Cambridge University Press.
Pilkington, C. (1999). The politics today companion to the British Constitution. London:
Pratto, F., Sidanius, J. and Levin, S. 2006. Social dominance theory and the dynamics of intergroup
relations: Taking stock and looking forward. European Review of Social Psychology, 17:271-
320.
Riley, J. (1998). Mills on Liberty. London: Routledge.
Rosenfeld, M. (2003). Hate speech in Constitutional Jurisprudence: A Comparative Analysis in, The
Inaugural Conference of Floersheimer Center for Constituitional Democracy.Fundamentals
Equalities and the Challenge to Tolerance in Post – 9/11 Environment. 24 CARDOZO Law
Review 1523.
Stakic, I. (2011). Homophobia and Hate Speech in Serbian Public Discourse: How Nationalist Myths and
Stereotypes Influence Prejudices Against the LGBT Minority. M.A. thesis in Human Rights
Practice. Roehampton University. U.K.

Proceedings of the Third International Research Conference held on 26th to 28th October, 2016 454
Stibbe, A. (2001). Language, power and the social construction of animals. Society and Animals. 9:2:145-
161.
Uchenna, C. A. (2012). Power manifestation and manipulations in interactive discourses: Evidence from
Ezikeoba elders’ council. In: Research on Humanities and Social Sciences. 2:10. Nigeria:
University of Nigeria, Nsukka.
van Dijk, T.A. (1995). Esoteric discourse analysis. In Discourse and society. 6: 5-6.
Van Dijk, T.A. ( 2003) “Critical Discourse Analysis”. Chapter 18 In Deborah Schiffin, Deborah Tennen
and Heidi E. Hamilton (eds). The Handbook of Discourse Analysis,Wiley-Blackwell: p. 352 -
371.
van Dijk, T.A. 2005. Contextual knowledge management in discourse roduction: A CDA perspective. In:
Wodak, R. and Chilton, P. (Eds.). A New Agenda in (Critical) Discourse Analysis: Theory
Methodology and Interdisciplinarity, p. 71-100. Amsterdam: John Benjamins.
van Dijk, T.A.(2010). Political identities in parliamentary debates. In Llie, C. (Ed), European Parliaments
Under Scrutiny: Discourse Strategies and Interaction Practices. P. 29 – 56. Amsterdam: John
Benjamins.
Volkova, N, Silvestri, M. and Lopez, S. (2001) Hate Speech and the Media. Council of Europe
Publishing.
Weber, A. (2009). Manual on Hate Speech. France: Council of Europe Publishing.
Wekuja, I. and Greenhill, R. (2004). Turning off the taps: Donor conditionality and water privatisation in
Dar es Salaam, Tanzania. London: Action Aid International.
Widdowson, H. G. (2004). Text, context, pretext: Critical issues in discourse analysis. Malden: Blackwell
Publishing Company.
Wrong, D. H. (1979). Power. Its form, bases and use. Oxford: Blackwell.
Yasemin, I. (2010). The Concept of Hate Crimes, Hate Speech and Combating Hate Crimes. Second
Conference Paper Ankara- Turkey.
Appendix 1: Guiding Card
Utterance:
Elements of Hate Speech Present/ not
present
1. Speech that solicits disdain against a person/ group because of their ethnicity.
2. Speech that encourages ethnicity.
3. Speech that contains expressions of hatred for some group in circumstances that are
likely to provoke violence.
4. Speech that infers superiority and inferiority to parallel groups.
5. Speech that encourages religious/ group violence.
6. Speech that states that another person is a lesser human.
7. Incitement to hatred against a group of persons defined in terms of race, ethnicity,
national origin, gender, religion and sexual orientation.
8. Speech that states/ implies that the other person is not human e.g. calling them
‘weeds’
9. Use of cultural stereotypes.
10. Any form of expression regarded as offensive to racial, ethnic and religious groups.
11. Use of inciting and or provocative language.
12. Speech that encourages the audience into some negative violence.
13. Speech that promotes discrimination on the basis of tribe, colour, ethnic group,
religious group.
14. Use of abusive, negative and insulting language.
15. Speech that advocates violent acts against a specific group
16. Use of stories that profile people and communities negatively.
17. Use of imagery, poems, metaphor and proverbs which could stir ethnic hatred.
18. Ridiculing of another person on basis of ethnicity, race or religious belief.
19. Speech that creates a climate of hate or prejudice which may in turn foster the

Proceedings of the Third International Research Conference held on 26th to 28th October, 2016 455
commission of hate crimes.
20. Use of alarming language.
21. Use of language that attacks a person/ group
22. Speech that attacks a person’s gender/ sexual orientation.
23. Speech that inflicts emotional damage.
24. Speech that incites a person to cause damage.
25. Speech that causes violence to be meted against others.
26. Distributing, showing a play or visual images that would cause ethnic hatred.
27. Speech that arouses individuals to cause social dislocation.
28. Providing/producing or directing a programme that would stir ethnic animosity.
29. Utterances that contain inflammatory comments.
30. Use of threatening, abusive words or behaviour towards a group to stir ethnic hatred.
31. Publishing or distributing written materials that would cause ethnic hatred.
Source: NCIA, NCIC, police training manual on the enforcement of the law on hate speech and the
definitions of hate speech by Becker, Byres and Jipson (2000); Rosenfeld (2003); ICCPR (1966). ******
INFLUENCE OF INDIGENOUS PEACE BUILDING STRATEGY IN THE MANAGEMENT OF
INTERETHNIC CONFLICTS FOR SUSTAINABLE DEVELOPMENT IN BUNGOMA
COUNTY, KENYA
Chebai, J.M.
Department of Arts and Humanities, Chuka University, P. O. Box 109-60400, Chuka, Kenya
Email [email protected]
ABSTRACT
This study examined the efficacy of indigenous peace building strategies in the reconstruction of damaged
inter-ethnic relationship between the Bukusu and Sabaot. It evaluated the role of elders in interethnic
conflict management. The study is anchored on the backgrounds that inter-ethnic conflicts in the area
under review and beyond is recurrent, widespread, ravaging humanity exemplified in countries like
Bosnia, Cambodia, El Salvador, Mozambique, Namibia, Sudan, Nicaragua and Rwanda yet in equal
measure or more anti-conflict mechanisms have been engaged by various actors to cultivate peaceful co-
existence. The Bukusu-Sabaot conflict acquired prominence as early as 1963 and has kept recurring in
different magnitudes. In 1992, it gained momentum causing deaths, massively uprooted and displaced
population to camps of internally displaced persons while other victims crossed over the border and
sought refuge in neighbouring countries Uganda and Tanzania. Worse still, the state of normalcy is yet to
be achieved. The study assessed the effectiveness of indigenous peace building strategy in the
management of interethnic conflict in Bungoma County. The study was informed by Social Constructivist
theory. In order to address specific issues envisaged in the study objective both historical and descriptive
research designs were used. Data collection instrument entailed interviews, including in-depth interviews,
focus group discussion and documentary analysis. The researcher sampled population randomly,
determining sample size based on 384 respondents as representative of 100000 in the population. Of
necessity, the researcher purposively interviewed public leaders, traditionally recognized leaders, NGO
officials and internally displaced persons (IDPs). Secondary data was used to compliment primary data.
The data was corded and analyzed using qualitative techniques. The study established that ethnicity,
political rivalry, prejudice, resource competition, mismanagement of electioneering process and weak
judiciary were key elements in understanding Bukusu-Sabaot conflict, peace building and development.
The study will assist policy makers in crafting a cohesive Kenyan society; equip national policy on
conflict resolution and peace building and form a benchmark upon which other research can be founded.
Keywords: Peace building, Strategy, Management, Ethnicity, Development
INTRODUCTION
Despite the effort made by elders to limit ethnic hostility in Bungoma County through peace building its
results has been mixed. Globally inter-communal conflicts grew overtime to include developed countries

Proceedings of the Third International Research Conference held on 26th to 28th October, 2016 456
such that the ethnic violence once used as a gauge to distinguish developing from developed nations or
society was reversed. Indeed, from 1980’s ethnic hostility had touched all continents. In Europe, UK has
recorded race riots while US has reports of reverse discrimination (Sandra, 2003). Kenya’s ethnic
equation disapproved the assumption that, a nation whose populace consisted of many ethnic groups
rarely lapsed into ethnic conflict. Though endowed with many ethnic communities, Kenya is coupled with
equal measure of ethnic strife and conflicts. Starting at independence in 1963, Kenya’s two major
political parties divided Kenyans into two major political blocks of majority community political party
Kenya African National Union (KANU) and Kenya African Democratic Union (KADU) minority
community party. Interestingly, though the Bukusu and Sabaot fell amongst minority community, the
party arrangement did not insulate inter-ethnic hostility between the two as was evident during the
electioneering process of 1963. The advent of multi-party politics in 1990 widened inter-ethnic linkages
which resulted into increased friction and violence between neighbouring but ideologically different
communities including the Bukusu and Sabaot. By 2013, the conflicts in Bungoma County were
estimated to have uprooted 5000 households, displaced more than 30000 people and had an estimated
budget of Ksh 8.4million (IDP’s Bungoma County Proposed and Estimated Budget April 28,2013). In
essence therefore, efficacy of indigenous peacebuilding efforts in the face of recurrence Bukusu- Sabaot
conflict has to be interrogated determining challenges in its implementation.
Statement of the Problem The occurrence of ethnic conflicts in Africa, Asia, Europe and America underscore not only the
continental nature of conflicts (Sandra, 2003) but also the global peace building initiaves in the
management of ethnic related instability. The puzzle to the global community, which is also reflected in
individual nation states like Kenya and to County government, is the escalation of conflicts in the face of
indigenous peace building initiatives. According to Carnergie Commission on Preventing Deadly Conflict
Final Report 1997, comparatively the 20th Century recorded the highest violence and loss of life. Of
critical importance was that, 47% of the violent military conflicts were ethnic and 32% though did not
involve violence they had major ethnic dimension (Nazli, 1983). Whilst this was happening, scholarly
interrogation remained scanty (Trei, 2002).
Conflicts between the Bukusu and Sabaot in Bungoma County have recurred at different intervals since
pre-colonial period and in varying magnitude alongside peace building initiatives. The violence has often
resulted to loss of life, displacement of the populace, and redirected the path of economic growth to
quelling of conflict. The situation was worse in 1992 following demands for multiparty political system in
Kenya which apparently put the Bukusu and Sabaot communities sharply against each other. Efforts by
the elders, state and non-state machinery to cultivate constructive interaction in the region has been going
on for decades but internally displaced persons are not yet fully resettled. By 2013, Bungoma County was
estimated to have 30000 displaced persons with an estimated budget of over Ksh.8 million (IDP’s
Bungoma County Proposed and Estimated Budget April 28, 2013).
So far there is scanty scholarly interrogation addressing in particular the Bukusu-Sabaot conflict in the
context of influence of indigenous peace building on Kenya’s sustainable development. Most studies for
example, Khamala (2009) looks at gender dimensions of ethnic identities and conflicts in Kenya, the case
of Bukusu and Sabaot, Wanjala (2013) looks at trauma interventions methods and healing among the
Sabaot community during the (2006-2008) intra-violence in Mt. Elgon Kenya and Kamoet (2010), looks
at the land question and intra-ethnic conflict in squatter enclaves of Mt. Elgon region but in all this works
the influence of indigenous peace building strategy is off focus. It is thus important to interrogate the
recurrence of Bukusu- Sabaot conflicts in the face of inter- communal and socio – cultural bonding of the
two communities. It is important to unearth the challenges of implementing indigenous measures of peace
building.
Objective of the Study
The study examined the challenges of implementing indigenous measures of peace building in order to
spur sustainable development in Bungoma County Kenya.

Proceedings of the Third International Research Conference held on 26th to 28th October, 2016 457
Research Question
What were the challenges of implementing indigenous measures of peace building in order to spur
sustainable development in Bungoma County Kenya.
Justification of the Study
The findings of this study not only fills the knowledge gap but enriches Ministry of Internal Security the
NGOs, FBOs and CBOs on the influence of indigenous peace building strategy to quell violence and
contribute to sustainable development.
Theoretical Framework
Social Constructivism theory is the lens through which the research was visualized. To them ethnicity is
manufactured rather than innate. Ethnic identity consists of inborn and social traits by extension a
coalesce of some primordial and instrumentalist attributes Sandra (2003). These traits include appearance,
place of birth, language, ancestral myths, subjective beliefs, political power of group, economics and
religion (Nagel, 1986).
RESEARCH METHODOLOGY
Research Design and Study Area
In order to address specific issues underscored in each study objective, the researcher applied historical
and descriptive research designs. The study was conducted in Bungoma County in Kenya. The County
covers 2206.9 km2 with total population of 1,375,063 consisting of about 172, 377 Sabaot and
about1202686 Bukusu Census of (KNBS 2009). The area was chosen because for many years it has
witnessed recurrence of conflict and peace building initiatives by the elders, state and non state agents
since pre- and post-colonial Kenya.
Target Population
The target population of study was 30571 from the nine sub-counties of Bungoma County.
Sampling Techniques
The researcher applied probability and non-probability sampling design. Stratified random sampling was
used to accomplish probability sampling while Purposive, cluster and Snowball was used to achieve non-
probability. Population was clustered into Sub-counties. Stratified random sampling was used to divide
population into homogenous sub-groups the Sabaot, Bukusu and other minority groups and then a simple
random sample in each subgroup was undertaken. Sample distribution was based on, sample size of 384
as representative of 100000 in the population in a descriptive research Ogula (1998).
Since the target population was 30571 therefore a sample population of 117 was appropriate.
Proportionately, out of the 117 respondents the Bukusu, Sabaot and others (consisting of the minority
groups, Teso, Kikuyu other Luhya communities) were 77%, 13% and 10% respectively in line with their
numerical strength in the population as was reflected in 2009 census. Snowballing was used to reach
special interest groups in eight Sub-Counties namely, respected elders of over 75 years, ex militant
groups, chiefs, NGO’s, FBO’s, government officials, women and youths.
Data Collection
Both primary and secondary were consulted. Semi-structured interviews were used to ensure reliable, in-
depth, systematic, comprehensive and quantifiable information was acquired (Kombo and Tromp, 2006).
Focus Group Discussion
Focus Group Discussion involved discussions of distinct homogenous groups of 6-8 persons from the
Bukusu, Sabaot including youths and women separately.
Documentary Analysis The researcher read and analysed public, private and personal documents.

Proceedings of the Third International Research Conference held on 26th to 28th October, 2016 458
Validity of Instruments
Expert judgment by supervisors improved validity of instrument Borg and Gall (1996).
Reliability;-
Piloting was done to pre-test research instruments Baker (1994) Basavanthappa (1998)
Data Analysis and Interpretation
The following procedures were applied in data analysis; Studying the notes collected, organization by
looking for cross-cutting trends, checking emergent patterns, corroborate, verify and network various
parts. Data collected from the interview, Focus Group Discussion was analysed using descriptive and
inferential statistics.
FINDINGS AND DISCUSSIONS
Indigenous Peacebuilding Strategies among the Bukusu and Sabaot
According to the Holy Bible conflict within humanity is as old as human race, having started in the
Garden of Eden (Holy Bible Gen 3). What has been dynamic is severity resulting from continued
technological improvement in the weapons used against man for extermination of man and the means of
reconciliation thereof. It is from this premise that pre-colonial Bukusu-Sabaot had developed their own
indigenous or community based institutions and mechanisms of ensuring peaceful coexistence by
extension thus an indication that conflict between the two was not new but as old as the two communities
coexisted (Makila, 1992). This is further evident in the elaborate nature of traditionally accepted peace
keeping or peace building accepted by both sides despite them having different elders and background,
Kakai (2000) Makila (1990). With emergence of nation state and non-state institutions, they became
players in unending conflict and reconciliation of the Bukusu and Sabaot.
Indigenous peace processes among the Bukusu-Sabaot was broad based including peace keeping and
peace building. The main actors in Bukusu-Sabaot peace building were elders and divine intervention.
Key to its success depended on the law breakers’ fear of the wrath of other community members and also
the culprit’s fear and their families of the evil that would befall them if they failed to abide by the
community norms and practices, National Steering Committee on Peace building and Conflict
Management (NSC acc. 5/4/2016). The invisible members among the Bukusu and Sabaot especially the
ancestors were highly regarded as more powerful than living (Rop, 2016), such was also the basis of
divine discernment and punishment of the culprits in the physical world by Supreme Being. To achieve
such level of the community’s norms, involved more than training but divination as well. Mungachi
conflict of the Bukusu and Sabaot brought forth this features. This was where the Bukusu while enroot to
visit their kin the Bakisu in what became Uganda were attacked by the Sabaot and killed Ambuchi (O. I),
this incident triggered what came to be known as Chonge conflict.
The Bukusu warriors acted on anger overlooked their prophet’s advice against fighting the Sabaots at
time because the prophetic signs were in their disfavor. They instead attacked the Sabaot but many were
killed (Tengeye O.I). The Sabaots prophecy on the other hand worked in their favour. The Sabaot prophet
Chonge aware that the Bukusu would retaliate performed the setaniki ritual which involved slaughtering
the animal, mix with herbal medicine and gave it to the warriors. Some medicine was put on the path that
the Bukusu were likely to use as they retaliated. The herb was to confuse the Bukusu not to attack from
the south and therefore became an easy prey to the Sabaot. Indeed prophet Chonge succeeded, misled the
Bukusu warriors, who played into the hands of the Sabaot and were killed in large numbers as their agony
was underscored in the statement that their blood filled the Kabukoya stream and to this date the Bukusu
do not drink water from this stream. Ambuchi (O.I Sept. 2016).
In all, however, the following are lessons that came to the fore regarding Bukusu-Sabaot conflict, the
divination of the conflict between the two was evidence to the long period within which the two had
conflicted and reconciled. The prophets were catalysts to the conflict, either supported immediate or long
term intervention based on their divine interpretation hence supernatural intervention in the physical
world. Refusal to abide by prophetic advice was blamed for Bukusu’s piecemeal performance while

Proceedings of the Third International Research Conference held on 26th to 28th October, 2016 459
Sabaot success was pegged to their adherence to the prophet’s advice. Prophetic involvement was
consequential in the psychological preparation of the warriors to go to war.
Tobacco was used for ceasefire and peace keeping among the Bukusu and Sabaot (Ambae O.I). This was
used at a time when as the war raged and effects grew elders from of either side could throw tobacco to
the other seeking peace Ambuchi (O.I, Sept 15, 2016). Immediately the warring groups’ smelled tobacco,
it signified a call to ceasefire and elders of the two would meet and negotiate peace Ambuchi (O.I Sept
2016). Shuttle diplomacy was engaged. Soito a Kony for example shuttled between Tachoni, Iyaya, the
Bukusu leaders Wandabwa, Kukali and Kikai, Kakai(2000), Ambuchi (O.I Sept 2016). Iyaya, Wandabwa
and Kukali warmly received the diplomat Soito and sealed an agreement. Iyaya slaughtering a cow for
Soito and they ate a dog, a form agreement that involved the warring Bukusu and Sabaot elders cutting a
puppy into two halves, the Sabaot took the head as the Bukusu took the hind, swearing never to fight as
they speared the Silulu plant Ambuchi (O.I Sept. 2016). At Kikai, though the agreement was successfully
arrived at between the diplomat Soito and his host Kikai but as the two parties celebrated the successful
agreement, they disagreed and a fight ensued where Soito and almost all his men except one were killed.
The survivor escaped and reported the incident to his kin the Sabaot triggering conflict between the
Bukusu and Sabaot Kakai (2000).
In essence thus, the Bukusu and Sabaot had a clearly developed peace keeping and peace building
procedures which though befitted their co-existence as independent and interdependent communities,
Masakhalia (Nov 2011) but not without challenges as it happened between Soito and Kikai which showed
lack of structure to guide celebrations after reconciliation. The first major challenge to Bukusu-Sabaot
indigenous peace building strategy emerged with the advent of colonialism and the creation of a new
structured centre of power situated above the traditional Bukusu-Sabaot eldership. Additionally the
colonialists instituted the divide and rule policy which put communities at cross-purpose which became a
fertile ground for the disintegration of traditional society, Masakhalia (Nov 2011). This was fueled when
colonialists appointed African collaborators as chiefs while others came from non-royal background.
In what became Bungoma County for example the first colonial chief Murunga, was a collaborator. As
early as 1908 and 1909 he forced the Sabaot and Bukusu to work on the road construction and as porters.
This forced both the Bukusu and Sabaot to flee colonial rule to different places, Kakai (2000). As some
moved to the mountain others went to squat on European farms in Trans Nzoia, while some Sabaots hid
in the caves Kakai (2000). As Bukusu and Sabaot ran away Murunga complicated indigenous eldership
by encouraging the Abakhayo, Abawanga and Teso to settle around Kimilil Kakai (2000). This
compromised indigenous leadership in that the new entrants came from different cultural backgrounds
from that of the Bukusu and Sabaot, for example unlike in their new area of settlement the Abakhayo and
Teso did not undergo physical male circumcision. Similarly, as the Sabaot escaped, their farms were
taken over by the Bukusu an indication that the cultural norms that ensured safety and respect for each
other’s property was fading http://www.mountainvoices.org/k-th-conflictsasp.
Though the Bukusu, Sabaot and the Abatachoni united and successfully resisted Murunga and his
assistant Walucho 1930, the unity was temporal as was realized in subsequent events. In 1948 for
example, the Bok elders also complained against a Bukusu chief Jeremiah Kukubo of knowingly
addressed public meetings in Bukusu language which the Bok did not understand and that he favoured the
Bukusu in the issuance of business licenses (Kakai, 2000). Other factors that emerged and challenged
successful implementation of indigenous peace building strategies included religion. The colonial
missionaries condemned African beliefs, practices and even culture as ungodly, Tugume (2015), Mbae
(O.I SEPT.2016) yet this were the foundations upon which indigenous eldership was founded. The fact
that Bukusu-Sabaot indigenous peace keeping and building strategies entailed rituals like cutting a puppy
into two, spearing the Silulu plant by respected elders and use of herbal medicine and tobacco it remained
condemned, Ambuchi (O.I 16). In essence as people became Christians, indigenous knowledge faded and
so was the indigenous authority.

Proceedings of the Third International Research Conference held on 26th to 28th October, 2016 460
This was similarly true, that even the shared cultural underpinnings between the Bukusu and Sabaot
inherent in shared cultural background of circumcision rites gradually became inconsequential. The
traditional family bonding which accompanied the inter-communal marriages and dowry payment
degenerated Tengeye (O.I). This traditional linkage declined over time, to the extent that initially a
Bukusu girl who married to a Sabaot would undergo clitoridectomy without causing Bukusu Sabaout
hostility but by 1990, it became offensive and was regarded as forced circumcision. Kakai (2000),
Tengeye (O.I). This further weakened the inter-communal unity. Since nature hates vacuum the void that
was created by the weakening indigenous peace keeping and peace building between the Bukusu and
Sabaot paved way for new eldership from mission educated elite.
Emergence of New Eldership among Bukusu and Sabaot
Biased racially based colonial administration against the Africans, land alienation, forced labour, heavy
taxation alongside colonial education outwitted the pre-colonial elder role and paved way for the new
elders armed with education to deal with expanded needs of Africans’ welfare for example in education,
health, agriculture, European forced labor, racially based heavy taxation and self determination of African
people. The Bukusu educated elite for example reacted by forming Kitosh Education Society MacArthur
(2016) later renamed Bukusu Union. Other Bukusu associations included North Kitosh Farmers
Association. Among the Sabaot was Sabaot Union and Tachoni Union for the Tachoni (Kakai, 2000).
Evidence for the working of new eldership among the Bukusu for example was noticed when in 1940 the
Bukusu union worked with African District Council (Kakai 2000). In the same year the Bukusu union
advocated for their own district which was realized 16 years later, with the creation of Elgon Nyansa
District hived from North Nyansa District (Kakai, 2000).
As the names suggests, the new eldership was ethnic inclined and consequently encouraged and enhanced
ethnic loyalties, Korwa(1998) that came to full fruition in the political parties that emerged thereafter.
Among the Bukusu new elite elder was represented by Masinde Muliro. He founded Elgon Nyanza
District Congress (ENDC), Kakai (2000) which sponsored him to contest in 1957. In 1959, Muliro
formed Kenya National Party which later changed its name to Kenya African Peoples Party (KAPP). As
independence struggles in Kenya beckoned Muliro’s KAPP joined other mission new elites for example
Moi’s Kalenjin Peoples Alliance, John Keen’s Maasai United Front and Ronald Ngala’s Coastal Peoples
Union and Somali National Association who in June 1960 formed Kenya African Democratic Union,
KADU. Though, the Sabaot of Mt. Elgon belonged to the Kalenjin Community at that time led by Moi, in
1963 they rejected Moi’s Kalenjin Alliance and by extension KADU because of Muliro’s association with
Moi. Instead Sabaot new elite Daniel Moss formed West Kalenjin Congress in 1962 Ogot and Ochieng
(1995). In 1963 they voted with KANU.
After independence in 1963, Kenyatta having used the Kikuyu of Central Kenya as spring board to power
he became obliged to reward them hence his leadership was overshadowed by his kin as reflected in his
government appointments, more than a half of provincial commissioners were held by his close
confidants from central Kenya, this was the same with government parastatal heads and statutory boards
(Makozewe, 2016). After Moi came to power in 1978, he rewarded the Kalenjin whom he had used as
spring board to acquire power. It was largely from this background that the advent of multipartism
degenerated into ethnic contest between the Bukusu and Sabaot in Bungoma County. Though Masinde
Muliro, Wamalwa Kijana fronted Mulitpartism but their communities were vilified by the Sabaots as
being against the sitting president Moi and His Kalenjins who included Sabaot hence fueling Bukusu
Sabaot conflict of 1990’s. It follows that the glimpses of multiparty democracy introduced towards the
end of 1950s led to the degeneration of Kenya into ethnic hegemony each led by a new educated elite
with self and community interest but little, if any, national interest. Among the Gikuyu was Kenyatta,
Odinga for the Luo, Muliro for the Bukusu, Moi for the Kalenjin, John keen for the Maasai.
Unfortunately the new eldership, was not armed by the pre-colonial traditional wisdom pegged on cultural
norms, nor was they trained to accommodate democratic principles in multi-ethnic society hence the
escalation of conflict in Kenya specifically between the Bukusu and Sabaot till today.

Proceedings of the Third International Research Conference held on 26th to 28th October, 2016 461
Indeginious Peace Building Strategies in Post Colonial Kenya
Though indigenous peace building continued in the post-colonial Kenya, other players had to come on
board in order to meet the expanded social, economic and political challenges of the independent
government. The central government for example established Provincial administration structures from
the grass root, the village elders, assistant chiefs, chiefs, district officers, district commissioners and
provincial commissioners with various committees at each level hence strongly ate into indigenous peace
building initiatives (NSC). The boundaries created by independent Kenya largely housed varying groups
within the same district like Bungoma further fueling competition between Bukusu and Sabaot. This was
particularly pronounced where one community was minority like the sabaot and majority Bukusu and
inherent challenges of sharing the ever scarce national resources between minority-majority communities
(Jacques and Oded, 2013). The point of contention in Bungoma was land and unequal representation
between Bukusu and Sabaot at various committees including the County Council and Parliament. Since
independence the Sabaot have always had one Member of Parliament.
In Bungoma, independent government hived of Sabaot’s Mount Elgon administrative units from the
larger Bungoma unfortunately the demarcation was done along ethnic lines between the Bukusu and
Sabaot (UNDP AMANI PAPERS www.undp.org/content/dam/Kenya/docs/peacebuilding/Amani-Papers-
mt-Elgon.Cs5-1). At one stage the two communities shared Elgon Nyanza District, then Bungoma district
where the Sabaot had their clear cut Sub-location, later the Sub- location was elevated to location,
division, a sub-district and then district in 1993. Today it is a Sub-county and a constituency within
Bungoma County. Such arrangement put the two communities on intense competition hence a war path
which politicians exploited for selfish political expediency compromising indigenous peace building
arrangements. The geographical dividing line between the Bukusu and Sabaot has often been used as
battle front. The continued erosion of indigenous peace building inherent in traditional eldership led to
emergence of a new crop of elders consisting the then existing interest groups, politicians, provincial
administration, the church, women ,the youths, the NGO’S and the traditional elders. The new eldership
was effective in conflict response and quelling inter-communal animosity (NSC).Today peace committees
in Bungoma County are arranged from the village to the county reflecting the interest groups but largely
lacking clear demarcation of roles (NSC).
CONCLUSION AND RECOMMENDATION
Colonial and post-colonial government’s socio-political and economic structures worked at cross purpose
with indigenous peace building strategy. Traditional pillars of peace building based on eldership, cultural
norms, intermarriages and trade were clipped by the Colonial and Post-colonial governance, but failed to
heal Bukusu-Sabaot intergroup hostility. As a result skewed resource allocation, ethnic fear of survival ,
skewed justice system which permitted impunity and misuse of ethnicity as a mobilizing factor for
political power, emergence of new educated elites whose survival was largely pegged on ethnicity, that
charecterized independent Kenya polarized the country along ethnic lines and by extension compromised
indigenous peace building strategy. Largely however indigenous elder role never died but faded to the
extent that it could not work in isolation of the government machinery that is government officials,
judiciary nor with other interested parties the church and the new class of elders including the politicians
and NGO’s. Hence the study recommends that inclusive eldership training involving the new face of
eldership, the traditional elders, the new educated elders, church and government machinery. Introduction
of National Integration course underway in Chuka University to underscore continuity and discontinuity
of indigenous peace building by comparing pre-colonial, colonial and post-colonial and fill-up the
missing link for Kenya’s sustainable development to take effect on firm foundation.
REFERENCES
Ogot, B.A and Ochien’g W.R (1995) History of Kalenjin Peoples of the Rift Valley Region
Borg, W.R and Gall N.D (1996) Journal of Gerontology; Psychological Sciences, 59B (4), 168-176
Freeman, M. (1998). “Theories of Ethnicity, Tribalism and Nationalism” in Chistine K. (ed.). Ethnic
Conflict, Tribal Politics; A Global Perspective Curzon Press Great Britain.
Horowitz, D.L. 1955. Ethnic Groups in Conflict Berkeley, C.A University of California Press
Horwitz, D. 2000. Ethnic Group in Conflict Second Edition University Of California Press Ltd, London.

Proceedings of the Third International Research Conference held on 26th to 28th October, 2016 462
Geertz, C. (1963) ‘Primordial Sentiments and Civil Politic in The New York States’; in Old Societies and
New States, edited by C, Geertz, New York in Free Press of a Glencoe.
Gabi Greva Saijiki For Kenya and Tropical Regions http://Kenyasaijiki.blogspot.co.ke/2005/02/bukusu-
culture.html acc. 8/09/2016
Gerard, P., (2008) Democracy and Power Africa and Democracy
http://www.opendemocracy.net/article/democracy?kenya-behind.the
Hauss, G. C (2001) International Conflict Resolution York Road- London.
Herbert, J.G. 'Ethnic Invention and Acculturation, A Bumpy Line Approach' In Rechard, C
Monk (1996) Taking Sides-Clashing Views, On Controversial Views. Dushkin Publishing Group/Brown
and Benchmark Publishers Guilford.
Holy Bible, Genesis 3:1-24
Kakai, P. (2000) History Of Inter-Ethnic Relation in Bungoma, Mt Elgon and Trans-Nzoia Districts, 857-
199.History Kenyatta University
Khamala, G. (2009) Gender Dimension of Ethnic Identities and Conflicts in Kenya: The Case of Bukusu
and Sabaot. M.A Thesis Kenyatta University, Kenya
Kimogoti, S.N Intergrated Post-Conflict Management Strategies and Sustainable Peace in Trans-Nzoia
County, Kenya M.A Thesis Masinde Muliro University of Science Techology Kakamega. Kenya.
Kombo, D.K and Delno, L.A (2006) Proposal and Thesis Writing. Nairobi; Paulines Publications Africa.
Korwa G. A (1998) Ethnicity and Ethnic Kings: The Enduring Dual Constraint In Kenya’s Multiethnic
Democratic, Electoral Experiment in Journal of Third World Spectrum
www.founders.howard.edu/spectrum/1998vn2Adar.htm acc.18/5/2016
MacArthur, j (2016) Cartography and the Political imagination (Mapping in Colonial Kenya) Ohio
University Press.
Makila, F.E (1982) An Outline History of Babukusu of Western Kenya
Masakhalia, A.E (2011) Focus On Tribalism in Kenya https://www.opendemocracy.net/alan-e-
masakhalia/focus-on-tribalism-in-kenya
Nagel, J. (1986) The ‘Political Construction of Ethnicity’, in Competitive Ethnic Relations, edited by J.
Nagel.New York: Academic Press.Inc
Nazli, C. (UNFPA) (2008). Insight into solving The Problem of Overpopulation the Overwhelming Issue
of Our Time, Policy Development Studies No 8. Population and Conflict, New Dimension of
Population Dynamics http://www.population-security.org/unfa-84.htm. acc. 30/01/011.
NSC National Steering Committee on Peace Building and Conflict Management Secretariat Ministry of
Provincial Administration and Internal Security Report, Published Courtesy of GOK?UNDP
Ogula, A.P (1998) A Handbook On Educational Research. Nairobi; New Kemit
Ombuchi, Ben (O.I Sept. 2016)
Osae, S. (O.I Sept 2016)\
Rop, K (2016) ‘Extra Judicial Methods: African Traditional Religious Leadership Strategy for Peace-
Making and Security’ in Journal 0f Social Sciences Research Vol.2 No.3
Sandra, F.J (2003) Nationalism and Political Identity MPG Book Ltd, Bodmin, Conwall.
Tengeye N. (O.I April 2016)
Tugume, L. H (2015) ‘Attitude of Christian Missionaries towards African Traditional Religious Beliefs in
East Africa During the British Colonial Rule’ in Journal of History and Culture Vol. 7, No. 10
Wanjala, N.T. (2013) Trauma Intervention Methods and Healing Among the Sabaot Community During
the 2006-2008 Violence in Mt. Elgon, Kenya, Ph.D. Thesis MMUST. Kenya.
PROLIFERATION OF NEW CHRISTIAN RELIGIOUS MOVEMENTS IN MERU TOWN
Mwongera, P.K., Nkonge, D., and Bururia, D.N. Chuka University, P. O. Box 109-60400, Chuka, Kenya
Email: [email protected]
ABSTRACT
This study was meant to investigate the factors leading to the rapid proliferation of new Christian
religious movements (NCRMs) in Meru Town in Meru County. This was in consideration that NCRMs
have continued to proliferate in the town albeit existence of mission founded churches. The overall

Proceedings of the Third International Research Conference held on 26th to 28th October, 2016 463
question was ‘What causes their upsurge in an area that has well established churches?’ The study
investigated the socio-political, psycho-religious and economic aspects that lead to the proliferation of the
MCRMs in Meru town as well as their impact. It was informed by the Rational Choice Theory developed
by Rodney Stark and William Sims Bainbridge in 1987 which emphasize that religious systems are
viewed as compensators and human beings are rational actors who make their best choices, calculating
cost and benefits. Thus the NCRMs possibly act as compensators compensating for physical lack and the
frustrated goals and the members are viewed as rational actors making choices to join NCRMs in view
that their wants will be satisfied. It employed descriptive survey research design. Using purposive and
simple random sampling technique, 340 respondents were sampled from a population of 4590 in 24
NCRMS in Meru town. The main findings were pastors’ claims of responding to God’s call, schism due
to leadership wrangles, economic reasons and others lead to the proliferation of NCRMS in Meru.
Keywords: Meru town, Religious movements, New Christian Religious Movements, Proliferation,
Church, followers.
INTRODUCTION
New Christian Religious Movements (NCRMs) in our society today are rapidly proliferating, a
phenomenon that is exemplified by their predominance in the world as noted by Baker (1999).
Christianity began in the first century as a Jewish Messianic movement in Israel within a community that
practiced Judaism as its religion (Anderson, 2004). Soon it proliferated in areas around the
Mediterranean, it went to Europe and then became the official religion of the Roman Empire after which
it spread to the rest of Europe, Asia, and Africa and to all parts of other continents (Molloy, 2013). From
the very early stage in the development of Christianity, schisms began. It is observed by Barrett (1968)
that divisions have been a rhythm in the church history such that Saint Paul identified four warring parties
in the church in Corinth namely; Apollos,’ Peter’s , Paul’s, and Jesus’ party in the first century and by the
fourth century there were about eighty enumerated varieties (Moore, 2006). Baur (1990) cites more
examples of continued schisms. For example, in AD 312 Christianity was divided into two; the Eastern
and the Western churches and in AD 1054 a great schism occurred. The Western churches were divided
into the Roman Catholic Church and Eastern Orthodox Church.
In the sixteenth century another major division occurred during the Reformation where the Roman
Catholic Church was divided into Protestantism and Catholicism (Moore, 2006). As the wave of
Protestantism grew in Europe, different protestant groups emerged such as Lutheranism, Calvinism,
Church of England, the Anabaptists and others continued coming up (Anderson, 1984). These movements
did not only divide but also proliferated because of the missionary nature of Christians. The protestant
denominations further were introduced by the European Christian missionaries in Africa in the nineteenth
century and spread to many parts of the continent but were not spared from the wave of dissidence
(Nthamburi, 1991). As the denominations quickly spread in Africa they were counteracted by the
founding of the African Indigenous/instituted Churches (AICs) in 1920s which attracted many followers
who felt uncomfortable in the Missionary Churches due to their desire for political self expression and
missionaries’ neglect to acknowledge the African culture (Mugambi, 2010). This scenario therefore
presented a doubled outlook of Christianity in Africa with missionary denominations on one hand and
AICs on the other.This phenomenon of Christianity in Africa did not last long before a Revival
Movement was introduced from England which seriously influenced the shape of the Church. Nkonge
and Gechiko (2014) argue that the East African Revival Movement prepared the foundation for personal
initiatives of evangelists like Dr. Billy Graham and T.L. Osborn who held rallies throughout East Africa
in 1960s spreading Pentecostalism. Mugambi (2010) informs that Pentecostalism was introduced in
Kenya by Billy Graham from America in 1968. From within Pentecostalism movement, charismatic
preachers emerged opening up their own churches. They brought a new wave of Pentecostalism which
consequently gave birth to this new form of Christianity (NCRMs) in the twenty first century which is
rapidly proliferating in Africa. Therefore, NCRMs were studied due to their significance particularly with
reference to Christianity in Africa. As asserted by Barrett (1968), the high quality of Christian faith found
in much of the NCRMs in Africa demands that the rapid proliferation be given full weight in studies.

Proceedings of the Third International Research Conference held on 26th to 28th October, 2016 464
The NCRMs began to appear in Kenya between 1980s and 1990s where they found a rich soil in which to
grow and flourish (Shorter and Njiru, 2001). They flourished as a result of being introduced in an already
prepared ground by Pentecostalism which had a wave that touched the spiritual lives of the people from
1960s (Nkonge, 2013). Currently, there are a number of them in towns, cities and market places with
some of their branches encroaching even in the villages.
Meru Town being one of the towns in Kenya has not been left out. According to the report by Kithinji
(2014) who is the organizing secretary of the group that brings all pastors from different Christian
movements together in Meru, there are a total of 469 churches in Meru County and among them 109
churches are in Meru Town with 24 churches being NCRMs. He informs that the NCRMs are being born
in Meru Town now and then. Baur (1990) denotes, that the fragmentation and subsequent proliferation of
NCRMs fosters a big problem to Christianity and seems like it is unending process. This therefore raises
an urgent concern because there are already established mainline churches in this area. The reasons as to
why the NCRMs start and flourish in such an area already dominated by other churches necessitated this
study so as to investigate the reasons behind their proliferation.
Statement of the Problem
Meru Town is an area dominated by many denominations, especially the mainline churches, yet NCRMS
continue to flourish in the area. This raises a concern that needs to be investigated through a systematic
study such as this.
Objectives of the Study
The following objectives guided the study:
i. To investigate the socio-political factors that lead to proliferation of NCRMs in Meru Town.
ii. To find out the psycho-religious factors that lead to proliferation of NCRMs in Meru Town.
iii. To investigate the economic aspects that cause the proliferation of NCRMs in Meru Town
iv. To investigate the impact of NCRMs in Meru Town.
LITERATURE REVIEW
Understanding New Christian Religious Movements
Initially the NCRMs were referred to, using different terms such as cults and sects but these terms were
found to have derogatory and pejorative connotations hence the adaptation of neutral terms like new
religions, new religious movements, alternative religions or fridge religions (Nyaudi, 2004). The phrase
NCRMs is often used in professional literature, although scholars argue that it has deficiencies. The term
‘Christian’ is used in NCRMs because members are bound by the biblical principles and claim to be
believers and followers of the teachings of Jesus Christ (Gichaga et al., 2009). NCRMs are started by
individuals who have left other Christian denominations or when the entire movement break from the
existing churches (Nyaudi, 2004). The NCRMs in African qualify to be referred to as ‘new’ because they
have been introduced to people who are already Christian followers or in areas that have well established
churches. In this study NCRMs qualified to be referred to as new for they have come up recently in the
area and after a short time they stand out to be visible and prominent.
New Christian Religious Movements in Africa
The rising and proliferation of NCRMs in Africa is a new phenomenon that has been experienced since
1970s and escalated by early 1980s (Shorter and Njiru 2001). Nyaudi (2004) observes that their
phenomenon in Africa is difficult to understand because there are multiple factors that contribute to their
occurrence although he denotes that they are best viewed as a form of religious transformation. Baur
(2009) claims that they are best comparable to the African Indigenous Churches that emerged since 1920s
in Africa. It is important to note that initially, Africa was widely dominated by the category of
Christianity that was brought by the missionaries in the nineteenth century ( Nthamburi, 1982), and this
kind of Christianity was soon challenged by the Africans who established their own churches otherwise
referred to as African Indigenous Churches (AICs). Gifford (2001) argues that the AICs began by
denouncing the mainline churches as not being Christian and therefore, they formed their own churches.
This aspect is observed in the NCRMs in our society today by Shorter and Njiru (2001) who argue that

Proceedings of the Third International Research Conference held on 26th to 28th October, 2016 465
these movements dissociate themselves with the existing churches where some use names like ministries
and movements instead of church. However not all movements in Meru town have derogatory
connotation about the term church. Some call themselves a ‘church’ while others use names like
Ministries, Christian centre, fellowship or mission.
Theoretical Framework
This study was informed by the Rational Choice theory (RCT) developed by Rodney Stark and William
Sims Bainbridge in 1987 in an attempt to explain factors leading to the proliferation of the NCRMs and
their impacts in Meru Town, Meru County. According to Stark and Bainbridge, religious systems are
viewed as “compensators” and human beings as ‘rational actors making their best choices, calculating
cost and benefits. This theory highlights four models of formation of new religious movements;
i) The psychopathological model show that religions come up during a period of severe stress in the life
of a founder who suffers from psychological problems and resolve them through the founding of the
religion. The development of religion is for them a form of self therapy or self medication.
ii) The entrepreneurial model reveals that founders of religion act like entrepreneurs developing new
products (religions) to sell to their new consumers that is, to convert people to. According to this
model most founders of new religions already have experience in several religious groups before they
began their own. They fake ideas from pre- existing religions and try to improve on them to
popularize themselves.
iii) Social model shows that religions are founded by means of social implosions. Members of the
religious groups spend less and less time with people outside each other within it. The level of
affection and emotion bonding between members outside the group diminish. According to this
model when implosion take place the group will naturally develop a new theology and rituals to
accompany it.
iv) The normal revelation model shows that religions are founded when the founder interprets ordinary
natural phenomena as supernatural; ascribing his or her creativity in inventing the religion to that of
the deity.
Therefore, this study used this theory to find out whether the NCRMs are proliferating to compensate for
frustrations and lack; spiritual, physical, social, psychological and economical that either the founders or
the members experience. They investigated whether the founders of NCRMs act as rational actors who
open up new movements to satisfy their wants and whether they developed the NCRMs as a form of self
therapy to be cured of their frustrations and psychological stress that they encountered. In addition the
study used these views to investigate whether the movements were established as an act of
entrepreneurship where the founders converted people to and whether they borrowed their ideas to
improve on them to make them more popular and whether their popularity was enhanced by their ability
to claim to have more power capable of solving people’s problems and providing answers to the
powerless and the exploited. It was to find out whether through their advancement they develop new
theology and rituals to accompany their practices.
The theory was employed to establish whether the numerical increase in the NCRMs in Meru is as a result
of members making rational choices to join the movements hoping to be cured of their frustrated goals in
life, diseases, financial problems, family issues and joblessness. It investigated whether the NCRMs had
proper invented packages that ensured that members like them and keep on following them to have their
practical human needs that are not being met in the society satisfied and hence help them cope with new
problems and to act as a catalyst for religious change. The views acted as lens to cast light on the reasons
that leads to people joining NCRMs and reasons why there is the proliferation of NCRMs in Meru Town.
METHODOLOGY
The study employed the descriptive survey research design. Meru Town is the Headquarters of Meru
County with a population of 240,900 according to the 2009 population census. The Town region covers
areas including Kaaga, Gitoro, and Kambakia to the North of Meru town, Kinoru, Giantune, Kiamiriru
and Irinda to the West, Gakoromone to the East and Gitimbine to the South. The target population was
4590 members in 24 NCRMs in Meru Town (Kithinji 2014). The researchers purposively sampled the

Proceedings of the Third International Research Conference held on 26th to 28th October, 2016 466
movements and picked members randomly so as to collect the required information with respect to the
objectives of the study. Kathuri and Pals (1993) and Fisher et al. (1983), recommend that from a
population of 4590, a sample size of 354 respondents feasible. From the 24 NCRMs in Meru Town, a
sample size of 340 respondents was randomly selected including 314 members and 20 pastors and 20
movements lay leaders. 314 members and 20 pastors were to fill questionnaires, while 20 movements lay
leaders were to be interviewed orally. 14 respondents (church members) did not return their
questionnaires, and thus the researchers worked with a figure of 340. There was also observation method
employed where the researchers visited six movements: Jesus House of Praise, Kambakia Christian
Centre, Arise and Shine, Jesus Exaltation Centre, Word Healing Ministry, Compassion Church of Christ
and Word of Faith Ministry purposively selected to obtain information about the actual activities done.
RESULTS
Background Characteristics of the Respondents
The number of respondents who participated in this study was 340 (95.5%) as 14 (4.5%) did not return
their questionnaires or they declined to be interviewed. The study revealed that females 254(74.7%) are
more than males 86 (25.3%) which indicated gender disparity in the churches. The aspect of women being
the majority in the church is expounded by Simmons and Walter (1998) who denote that women are
naturally more subservient than men. They therefore easily get enticed to join the movements. Shorter and
Njiru (2001) on the other hand denote two aspects that make NCRMs be overly patronized by women.
They claim that these movements promise success, prosperity, power, healing, and ideas which women
often need and therefore they get attracted to them easily. They claim that women are most commonly
disadvantaged unlike men and so women find these movements appearing as compensation to their
disadvantaged position in the society.
The study also revealed that the population of the young people aged between 15 and 25 years
101(29.7%) was lower than the population of people above 25 years 239 (70.3%). This aspect is observed
by Mathai (2014) and she attributes it to the fact that most of the young people within this age (15-
25years) are either in boarding schools, colleges or busy developing their careers. That is why most of the
time they will not be present in the churches a trend that neither the parents nor the church leaders have
control about. It is therefore evident in this membership sample that most of church attendants are adults.
The researchers also sought to find out the names and duration of operation of the movements. Among the
twenty four churches sampled, 20 (83%) leaders of the movements allowed the researchers to carry out
the research in their movement while 4 (17%) churches declined. This is because they feared the kind of
study being done and were suspicious of any exposure of their movements following the debates in Kenya
touching the upcoming churches. The table below 4 shows the names of movements, the approximate
number of population, duration of operation and the sample size for this study.
The data revealed that most of the movements are given names that points to their vision and mission.
Those that major on healing have names like life Restoration Ministry, God’s Favour Miracles Ministry
and Word Healing Ministry, those that major on evangelism have equally familiar names to it like Gospel
Outreach Ministry, Christian Mission Fellowship, Neno Evangelism and Arise and Shine Ministry. There
some founders as well who have based the name of their movements to an aspect in the bible like the
Burning Bush ministry, Word of Faith, New Birth Covenant Church and the Compassion Church of
Christ. Those that are prophetically oriented are given names like revelation church. In a nutshell all the
names that are given to all the movements have been individually coined by the founders. This deviates
from the historical trend of planting churches in Africa by the missionaries who named their churches by
the missionary group that they represented; like the Methodist churches, Catholics churches, Anglican
churches and the Presbyterian churches just to give an example. Out of all the names given by these
movements, only 6 (30%), that are known by the name church. All others are referred to as ministries.
This confirms the argument of Shorter and Njiru (2001) that the upcoming NCRMs hesitate from being
referred to as churches to distinguish them from the already existing churches in a bid to look unique and
depict originality.

Proceedings of the Third International Research Conference held on 26th to 28th October, 2016 467
Table 1: Sampled movements, their member population, sample size and duration of operation
Name of the movement Approximate
number of
population
Number of members
who acted as
respondents
Duration of
operation
in years
1.Gospel Outreach Ministry 275 25 6
2.Revelation Church 45 5 1
3.Christian Foundation Fellowship 90 12 4
4.New Birth Covenant Church 25 8 1
5.Christian Mission Fellowship 135 20 2
6.Great Gospel Evangelistic Mission 130 14 3
7.Christian Worshippers Church 60 10 2
8.Christian Celebration Gospel Church 85 10 1
9.Burning Bush ministry 90 10 3
10.Sanctuary of Worship Ministries 80 10 2
11.Gods favour miracles ministry 20 5 1
12.Jesus House of Praise 685 70 4
13.Life Restoration Ministry 95 12 2
14.Neno Evangelism Ministry 90 10 2
15.Word of Faith Ministry 90 10 2
16.World Healing Evangelistic Ministry 300 40 4
17.Kambakia Christian Centre 130 12 15
18.Compassion Church Of Christ 300 30 2
19.Word Healing Ministry 200 20 2
20.Arise and Shine Ministry 70 7 1
Total 2995 340
The data reveals that most movements are of recent origin yet they have attracted members. About 13
(65%) were founded between 1-2 years whereas 7 (35%) were founded in a period above three years. It is
also observed that even those of recent origin have attracted a large following of members.
Founding and Proliferation of NCRMs
The researchers inquired if the pastors were the original founders of the movements. 19 (95%) confirmed
that they were the founders and only 1 (5%) who was attached to the branch by the founder of the main
mother church. This affirmed that movements are being founded by individual personalities. When asked
how they began, 2 (10%) responded that they began it all alone, 16 (80%) said they began it with their
family members while 2 (10%) said they began with their friends. These results shows that majority of
these movements are started by the founders with their family members after which other members join.
This shows that majority 16(80%) of NCRMs are family churches and these family members are the ones
who have the greatest affiliation to them. In addition, 20 pastors responded that their movements were
began in rented buildings or tents and only 6 had settled in a place of their own by the time of this study.
When asked why they started their movements, 5 (25%) pastors said that they were compelled by their
desire to spread the gospel of Christ to the people. 4 (20%) pastors confessed that they had broken away
from their previous churches as a result of leadership wrangles which forced them out and ended up
starting their own movements. 11 (55%) admitted that their reasons were multiple in that they were called
by God to preach the gospel of Christ in an autonomous set up and cannot deny the fact that being pastors
is what they do for their living and therefore it is their source of employment although not the main
reason for opening up their movements. Therefore majority of the pastors are opening up churches after
what they refer to as the call by God to preach the gospel. Asked what they did before they became
pastors, 18 (90%) responded that they were self employed whereby they involved in occupations like
farming, small scale businesses and casuals. 2 (10%) confirmed that they were government employees, a
role they double tasked with continuing to be pastors even after opening their movements.

Proceedings of the Third International Research Conference held on 26th to 28th October, 2016 468
These results reveal that a large percentage of the pastors did not have secure jobs a factor that could be a
driving force to start up movements. Shorter and Njiru (2001) confirm that a number of pastors are self
ordained after having faced difficulties of harsh economic times and unemployment; they have ended up
in founding movements that are fast rewarding.
The level of education for pastors was sought. The results revealed that 4 (20%) had acquired a KCPE
certificate, 8 (40%) had a KCSE certificate, 6 (30%) had a diploma certificate 1 (5%) a degree and 1 (5%)
masters degree certificate. This indicated that many of respondent pastors had low education level and
they could not compete favourably in modern society where high level of education is being recognised.
The researchers sought to know whether the Pastors had any other work besides being pastors. 3 (15%)
said they operate small businesses. 4 (20%) do farming 2 (10%) are government employed and 11 (55%)
are full time pastors. This shows that majority of Pastors have no other engagement apart from their work
as pastors. 9 (45%) have other engagement to add up to their ministerial work. According to Kinoti O.I
(2016), the Pastors ought to be in the fore front to set an example to their members on matters of hard
work and entrepreneurship. He is for the opinion that the clergy ought to be more innovative and do extra
work besides working as pastors. Therefore the pastors should rethink about the activities they can engage
in to improve their economic life.
The researchers also investigated the churches that the pastors and members of NCRMs attended before
they joined NCRMs. The findings revealed that majority of members joining NCRMs come from other
churches. More members had left the Catholic Church 128 (40%) as compared to the Protestant 112
(35%), the Pentecostal churches 40 (12.5%) and non church goers 40 (12.5%). When asked when they left
their previous church, 176 (55%) affirmed that they left less than one year ago while 144 (45%) said they
left more than one year ago. However these results reveal that members are leaving other Churches to join
NCRMs and a greater percentage moved in less than one year ago which means that the act of moving is
still on. However 40(12.5%) which is a relatively small percentage had joined the movements as first
generation lot meaning that they were not in any other church before. This is an indicator that NCRMs in
a way, they are carrying out the work of evangelism and leading to conversion of new believers to Christ.
The researchers also sought to investigate what made the NCRMs unique as compared to the previous
churches attended by the members and movement leaders that in turn attracted them. The responses are
analysed in the figure below.

Proceedings of the Third International Research Conference held on 26th to 28th October, 2016 469
The respondents highlighted that to a great extent the movements’ offers solution on healing (70.3%),
they address members needs (75%) and offer good leadership (69%). To a very great extent they promise
prosperity (72.2%), promise miracles (69%), offer lively worship and singing (87.5%), have lively
preaching (70.3%) and have good pastoral care (72.2%). When asked if they are now satisfied 315
(98.4%) said yes they are while only 5 (1.6%) said they are not. These responses provide a basis for
understanding this phenomenon of rampant mushrooming of NCRMs. They have the ability to embrace
modernity which is appealing to most people in the present generation and also satisfy the spiritual needs
of their members. The other churches in Kenya need to rethink more on their methods of evangelization
so that they can address the needs of their followers and maintain their relevance in the society today.
Socio-Political Factors that Lead to Proliferation of NCRMs
The researchers inquired from the respondents the kind of social functions that were found in their
movements. Majority (98.4%) responded that their movements held religious functions/gatherings. Burial
ceremonies (97.5%) and visit to the less fortunate (94.4%) also had high percentages which means that
many members concur that they are the most recurrent activities that are found in their movements. Other
functions carried out are wedding ceremonies (70%), funds drive (76.6%) and seminars, workshops and
trainings (66.8%). New born ceremonies had the least frequency (48.8%) which means, even though it is
found in some of the movements, it is not very common.
The respondents were asked whether they were attracted to the movements by the social functions and
activities offered, 299 (93.4%) said yes while 21 (6.6%) said no, indicating that majority were drawn by
these cerebrations. The movement pastors also confirmed by 20 (100%) that the social activities carried
out have great impact in drawing new members to them. However when pastors were asked whether they
ever witnessed members being dissatisfied with how social activities are done, Majority 15 (75%) attested
to the fact that some members had left their movement when their social needs were not met. 5 (25%) said
that there are no members who had left due to their unmet social needs. However when the social
activities and all functions are well planned and carried out, they become helpful and make members feel
at home when relating with the brethren in their movements.
The researchers enquired from members of NCRMs whether the movement were founded as a result of
leadership wrangles in the previous church attended by the pastor. The results were as follows; 160 (50%)
responded yes, 96 (30%) said no, while 64 (20%) said they had no opinion. This revealed an aspect of
breakaway as the majority of respondents affirmed that their movements founders had differed in
leadership before getting away to form their own. These findings are inconsistent with the responses of
movement founders whose responses indicated that only 4 (20%) had attested to this fact. The findings
are clear that leadership differences have played a role in starting of NCRMs.
The researchers sought to establish whether there were members who had left the movement to form their
own. 6 (30%) said yes while 14 (70%) said no. Those who said yes were asked how many members had
formed their church and in their responses only a small number of churches 6 (30%) had experienced the
moving out of members with an intention of forming their own. However any element of moving out is
significant to this study because it is crucial in understanding whether the emerging pastors could have
come from NCRMs. The researchers inquired from the six pastors who had members leaving to form a
church whether they opened a brand of their kind. Only 1 (17%) said yes while the rest 5 (83%) said they
formed independent movements. This means that eleven movement have been formed emanating from
one county. If this is at a rate of one year, from one county headquarter and we have forty seven then by
the end of one year there will be 517 NCRMs and by five years time they will be 2585 movements. This
would record a high rate of proliferation. When pastors were asked why they had left their movements,
majority 8(40%) of the Pastors responded that they had left their former movement in quest for
leadership. 7 (35%) had left due to personal differences and only 5(25%) had desired to be independent.
This revealed that leadership was an issue behind the founding of NCRMs.
The researchers sought to find out from the members whether they were satisfied with the leadership
provided in their movements. 256 (85%) responded that they were not satisfied while 44 (15%) said they

Proceedings of the Third International Research Conference held on 26th to 28th October, 2016 470
were satisfied. This implies that the majority of the members are not satisfied with the leadership provide
in NCRMs. Bundi (2016) one of the respondents who said he was not satisfied argued that the Movement
founders rarely did they involve their followers in matters of leadership. Like the argument of Gitonga
(2011), the founders are the managers who are not accountable to anyone else. The researchers sought to
find out from the members of NCRMs whether there was any political influence that led to starting up of
NCRMs. Nobody said yes, 260 (81.2%) said no, 60 (18.8%) responded they were not aware. Majority of
the respondents felt that NCRMs were not founded for political reasons.
Psycho-Religious Factors that Lead to Proliferation of NCRMs
The researchers asked the pastors whether there are members who joined their movements due to psycho-
religious reasons.
Majority responded that they strongly agree (70%) that members join their movements due to psycho
religious reasons. 15% said that they agree, 10% responded that they partially agree while only 5% said
they don’t agree. According to Stark and Bainbridge (1987) opening of NCRMs is curative to the
thoughts and lives of the founders from difficult moments of life experienced. This means that the
followers of NCRMs are pious to them as they offer a remedy to their problems. They act as therapy to
their issues in life.
The researchers sought to find out whether movements were started in obedience to the call to preach the
gospel. 214 (66.9%) responded that they strongly agree, 69 (21.4%) said that they agree, 25 (7.8%) said
they partially agree and 12 (3.9%) responded that they do not agree. According to these responses
majority of the respondents (66.9%) are in agreement that their movement founders started their
movements so as to preach the gospel of Jesus Christ that brings physical, emotional and spiritual healing.
Kiogora O.I (2016) of Jesus House of Praise claims that the preachers in the NCRMs are instruments of
God to revive the gospel of Christ that has since been either watered or taken for granted in this
generation. She unveiled with due respect and without sounding critical to any church that before the
coming of Revival Movements and Pentecostal Charismatic preachers, many churches especially the
mainstream church had turned to routine worship centres. They had failed to impart on the lives of people
in this generation where so many problems that require church address existed. She therefore claims that
Jesus Christ came in through NCRMs to rekindle the fire of the Holy Spirit and continue his work on
earth as he expects it to be done. Therefore according to her proliferation of NCRMs is inevitable.
According to Anderson (2004), the mainstream churches had relaxed in their duty and they were being
woken up by the upsurge of NCRMs. The church is to blame for whatever is happening to it today.
Economic Factors that Lead to Proliferation of NCRMs
The researchers asked members whether being a pastor is both a vocation and an occupation. 52 (16.2%)
said that they strongly agree, 225 (70.3%) said they agree while 16 (5%) said they partially agree and 27
(8.5%) said they do not agree. Majority are for the opinion that Pastors’ role is a calling and as well it is a

Proceedings of the Third International Research Conference held on 26th to 28th October, 2016 471
form of employment. Jane Ntinyari a member of Burning Bush Ministries asserted that it is next to
impossible to get any one today who will volunteer as a pastor or even a preacher. In the guise of a call
there is a kind reward in form of appreciation, fare, fuel and lunch. Those who are full Pastors are heavily
paid by their Congregations. Shorter and Njiru (2001), Nkonge and Maina (2014) and Nyaudi (2004)
inform that most of the NCRMs founders live very expensive lives, with big mansions or high cost rental
houses and sleek cars. This is a confirmation that besides ministerial work a pastor would in addition be
equated to any other employee in the society.
The pastors were asked if they have members who are not employed. 20 (100%) confirmed that some of
them are jobless. An important question to ask is whether joblessness was a force attracting members to
NCRMs? This was confirmed in an observation done on 19th of July in Word Healing Evangelistic
Ministry a movement founded by Prophet Olembo and has a large congregation of about 350 consistent
followers. The researchers saw very many people who were called to be prayed for so that they can get a
job or promotion. At a closet meeting some were requested to see the prophet for a word of prophecy that
was revealed to the prophet concerning what they should do to acquire jobs and promotion. Therefore,
unemployment is a great need that would make the jobless to join NCRMs where they are promised
prayers that can help them acquire a job.
When asked if there are members who left their movements and opened up churches to seek for
employment, none said yes while 20 (100%) said no. 6 (30%) agree that members left their movements to
form their own for other reason like leadership wrangles, personality differences and spiritual maturity
and desire for independence but for it to be a form of employment was not known to them. However,
Shorter and Njiru (2001), Nkonge and Maina (2014) and Nyaudi (2004) attribute the high rate of
unemployment and underemployment to opening up of movements. They describe it as a booming
business. This was confirmed from the members’ responses. They were asked whether they were aware of
members who had left their movement to start their own as a source of employment or income. 133 (42%)
responded yes, 103 (32%) said no, and only 84 (26%) responded that they were not aware. Majority of the
NCRMs members were for the opinion that there are those NCRMs founders who start their movement to
earn in come from it.
Both the members and the pastors were asked how the financial needs of the pastor are met. The
following ways were identified.
These responses show that the movement pastors are paid from the contributions made by their members.
Majority (99%) responded that the financial needs of pastors are catered for with the contributions made
in the form of tithes and offerings. 30% respondents said that there are special giving sessions that are
organised to cater for their pastors salary. Only 1% responds were not aware how the financial needs of
their pastors were met. The benefits of meeting ones needs would therefore make jobless people to start
their own movement so that they earn their living (Mwongera 2013).

Proceedings of the Third International Research Conference held on 26th to 28th October, 2016 472
The pastors were asked whether there are economic empowerment programs for their members so that
everyone can be in a position to meet the movement requirements. 9 (45%) said yes while 11 (55%) said
no. This indicated that majority of the movements did not have ways of curving unemployment and
financial hardship of their members. The findings earlier had shown that all movements 20 (100%) have
jobless members yet some of these movements had not come up with ways of assisting them.
Paradoxically none of the members is exempted from movements’ contributions. An article posted on
Sunday Nation on 31st, August 2008 reveals that movement followers are so obliged to make
contributions to an extent of acquiring bank and society loans to ‘plant seed’ for bumper harvest. The
NCRMs can learn from a strategy employed in Kambakia Christian Centre to empower the ladies in the
movement. As informed by Gaceri O.I (2016), ladies in the movement are organised in groups of ten
members where they do table banking every Sunday. The ministry has also established a SACCO where
these ladies are required to make their savings and they can access loans at a fair interest rate. She further
informed that the movement leadership was planning to extend the strategy to all members and call it
kingdom banking so as to empower all of them. When such empowerment measures are put in place then
the NCRMs members would be in a position to meet their needs and consequently be able to make
movements contributions
The Impact of NCRMs in Meru Town
Pastors were asked whether their movements had any impact in the society. 20 (100%) said they had
impacted in the society in a great way. The most recurrent point raised was that the movements had
achieved in preaching Christ (90%) in the localities they were in. Some confessed that some members
who joined their movements had not been in any other church before. Other areas of impact identified
were support of education (55%), empowerment of women (35%), support of youth ministry (45%) and
helping the needy (85%) in the society. Although the women are the majority in NCRMs (Table 2), there
is minimal support (35%) given to them so as to be empowered. Also movement contribution to the
ministry of men was left silent in all movements. To find out how NCRMs impacted on men did not come
up clearly in these findings. As proposed by Mathai (2012) in her Thesis, serious systematic research
regarding men and faith as well as address to men issues need to be done as a matter of urgency.
The pastors were asked if they were doing anything to address the social evils in the society. 19 (95%)
said yes. 1 (5%) said no. The current most common evils identified include corruption (90%), land
grabbing and embezzlement of public funds (60%), rape (30%), homosexuality (65%) and abortion
(95%). Corruption and abortion were the most recurrent evils addressed. Irresponsible sexual behaviours
like rape (30%) and homosexuality (65%) were also addressed in various movements. Pastors condemn
such acts when they identify them and educate their congregation about the dangers of such evils in the
society. They teach the effects of such evils that will not only affect the society but also the working of
the movements. 1 (5%) that said they had not done anything much gave their excuse of having opened
their movements in a recent date and therefore they were still on their formation stage.
When asked whether there is any effect of coming up of NCRMs on Christianity, all the pastors 20
(100%) responded that it enhanced the spread of the gospel. As many as the movements, the more the
chances are, of many people being reached with the gospel. The pastors therefore praised the move of
opening many movements. However, Kinoti (2016) castigated the element of competition among the
Movements that implicated negatively on Christianity. He therefore advocate for modesty preaching,
opening and expansion of movements. He puts a reminder to all pastors that they preach one Christ for
one reason; to draw as many to Christ so as to inherit the kingdom of God. He says they are all doing the
same thing though in a different place.
Nkonge and Muguna (2014) state that the NCRMs negatively affect the mainline churches by drawing
members from them and leading to the decline of membership. This in turn affected the mission of the
churches involved. This study also established this effect where majority of those members in NCRMs
had come from other churches particularly the mainline churches depriving them of the membership.

Proceedings of the Third International Research Conference held on 26th to 28th October, 2016 473
CONCLUSION AND RECOMMENDATIONS The movements are uniquely founded. They are given unique names and started in simple structures.
They are either a result of individual formation or breakaway from other movements. Majority of the
founders have low education and many of their members come from the already existing churches,
particularly the mainline churches.
From the findings the following recommendations are made:
(i) To curb actions of rogue movement founders the government should continue and intensify the
agenda of putting checks and controls to all churches.
(ii) The Christian church organisation body should be formed to govern all matters of the church with
all churches inclusive.
(iii) The body should also facilitate formation of ecumenical activities and religious dialogue between
NCRMs and older churches so as to deal with any pejorative connotation that may hinder
Christian unity.
(iv) The churches should rethink their mission to deal with the problem of members hopping from one
church to another an aspect that may cause frustration and confusion to the believers.
(v) A research should be carried out on leadership styles in NCRMs to be able to understand them
and curb the monopoly of leadership that engineers breakaways of the churches.
(vi) Pastor appraisal mechanism that will monitor their performance to be developed.
(vii) Pastors to create job opportunities and any other empowerment program for their members.
(viii) To curtail the problem of being led astray especially the young people, the government education
system should allow Christian religious education be made compulsory in primary and secondary
schools and a core unit on comparative religions to be taught in institutions of higher learning.
REFERENCES
Anderson, K. (1984). Church History and Theology. Nairobi: PBTE
Anderson, A. (2001). African Reformation: African Initiated Christianity in the Tentwienth Century.
Eritrea: African World Press.
Anderson, A. (2004). An Introduction to Pentecostalism: Global Charismatic Christianity.Cambridge:
CambridgeUniversity Press.
Arinze, F (1991). The Challenge of the Sects: New Religious Movement: A Pastoral Approach. Available
In Cesnur.org/2004/arinze-en.htm. Retrieved on April, 16th 2014.
Barker, E. and Margit W. (1999). New Religions and New Religiosity. (eds). Denmark: AargusUniversity
Press.
Barret, D.B. (1968). Schism and Renewal in Africa: An Analysis of Six Thousand Contemporary
Religious Movements. Nairobi: OxfordUniversity Press.
Baur, J. (1990). The Catholic Church in Kenya: A Contenary History. Nairobi: St. Pauls Publication-
Africa.
Brockway, A. R., and Rajashekar, J. P. (1987). New Religious Movement and the Churches. Geneva:
W.C.C Publications.
Cox, H. G., (1996). Fire from Heaven:The Rise of Pentecostal Spirituality and the Reshaping of Religion
in the 21st Century. USA: Reading Massachusetts.
Davis, E. (1990). Truth under Attack. England: Evangelical Press.
Fishers. A., Laing. J. and Stoeckel. J. (1983). Handbook for family planning Operations Research. New
York: New York Population Council.
Gichaga, S., Kerre, R., Mwaura, P., Mambo, J. and Kioko, J. (2009). Secondary Christian Religious
Education Students Book Four. Nairobi: Kenya Literature Bureau.
Gifford, P. (2001). African Christianity: Its Public Role. London: Hurst and Company.
Gitonga, N. (2011). Commercialization of the Gospel in Africa with Particular Reference to Kenya:
Critique. International journal of Professional Practice. 2(2),104-109.
Kathuri and Pals (1993). Introduction to Education Research. Njoro: Education Media Centre.
Kenya Population and housing census 2009. www.kenya.information.guide.com/kenya.p retrieved on
May 1st, 2015
Kithinji, J. (2014). Report for Monthly Meru Pastors Forum meeting (June, 2014), (Unpublished).

Proceedings of the Third International Research Conference held on 26th to 28th October, 2016 474
Mathai, L.M. (2014). Church Initiated Programsand HIV/AIDS Mitigation in Chuka Division, Meru
South Subcounty, Kenya. Chuka University. Kenya. (Unpublished Work)
Molloy, M. (2013). Experiencing the World’s Religions: Traditional Challenge and Change.New York:
McGraw Hill.
Moore, R. (2006). Voices of Christianity: A Global Introduction. New York: Mc Graw Hill.
Mugambi, J.N.K. (2010).Christian Mission and Social Transformation: A Kenyan Perspective. Nairobi:
NCCK.
Mwongera, J. 2013. A Case study of Jesus House of Praise Movement in Meru Town (Unpublished).
Nkonge, D.K. and Gechiko, B. (2014). Charismatic Pentecostal Churches in Kenya: Growth, Culture and
Orality. International Journal of Humanities, Social Sciences and Education. 1(3), 27-33.
Retrieved on May 1st, 2015
Nkonge, D.K. and Maina, M.W. (2014). Causes of New Charismatic Movements in Kenya. European
Centre for Research Training and Development. UK. 2(2) www.ea-journals.org. Retrieved on
May 1st, 2015
Nkonge, D.K. and Muguna, S.K. (2014). The Challenge of Church Hopping in Kenya: Factors Leading to
Migration of Church Members from the Methodist Church in Kenya. Global Journal of Arts and
Humanities and Social Sciences. 2(9):13- 21. R etrieved on May 1st 2015
Nthamburi, Z.J. (1982). A History of the Methodist Church in Kenya. Nairobi: Uzima Press limited.
Nthamburi, Z.J. (1991). The African Church at the Crossroad: Strategy for the Indigenization. Nairobi:
Uzima Press limited.
Nyaudi, N.H. (2004). Introduction to the Study of Religion. Kenya: Zapf Chancery Publishers.
Parsitau, S.D. and Mwaura, N.P. (2010).God in the City: Pentecostalism as an urban Phenomenon in
Kenya. The Truth Magazine, October, 2nd
2010.
Saliba, J.A. (2003). Understanding New Religious Movements.( 2nd ed). Walnut Creek, Lanham: Alta
Mira Press.
Shorter, A. and Njiru, N. 2001. New religious movements in Africa. Nairobi: Pauline Publications Africa.
Simmons, G. and Walter, T. (1998). Sport the Men: The Relation of Faith and Gender. Journal of
Sociology. 49(4) Retrieved on May 1st 2015
Stark, R. and Bainbridge, W. S. (1987). A Theory in Religion. New York: Rutgers University Press.
Turner, H. W.( 1985). New Mission Task: Worldwide and Waiting. Missiology 13(1): 5-21.
Wanga, J. and Ondieki, E. (2015). Is Church Feeding or Fleecing the Flock. Sunday Nation, March 15,
2015.
Wilson, B. (2004). Impact of New Religious Movements.New York: Rose of Sharon Press.
Wolfe, J. (2006). Evangelicals and Pentecostals: Indegenizing a Global Gospel in John Wolfe (ed). Global
Religious Movement in Regional Context. Ashgate: The Open University Press.
ANALYSES OF KIMERU WORD FORMATION PROCESSES IN THREE FRATERNITY
GROUPS IN MERU SPEECH COMMUNITY
Mikwa, J.K.
Part-time Lecturer, Kenya
ABSTRACT
The aim of the study was to investigate Kimeru word formation processes in three fraternity groups in
Meru linguistic community. Sample was drawn from core, central and interloper speakers of the Meru
speech community comprising firstly; youth, the UN, defines 'youth', as those persons between the ages of
15 and 24 years. In Africa youth refers to persons aged between 15 years and 35 years and were the ones
studied in this study. Secondly; middle age,middle age is the period of age beyond young adulthood but
before the onset of old age. This study defined middle age as years between 40 years and 55 years.
Finally; elders or old age, most Britons define old age as starting at 59 years. The present study defined
old age as years between 55 years and above. The respondents were selected using the judgmental
sampling procedure. Linguistic theory was used to study the data. The findings of the study were elicited
using tape recorded interviews on Kimeru word formation processes. The data for the study was

Proceedings of the Third International Research Conference held on 26th to 28th October, 2016 475
represented both qualitatively and quantitatively. The findings of the study show the knowledge of
Kimeru words formation processes varied according to the degree to which the respondents live their
livesin Kimeru Language.
Keywords: Central speakers, Core speakers, Fraternity groups, Interloper speakers
INTRODUCTION
Word formation processes refer to the ways in which new words come into being in a language. The basic
processes by which new terms are created in a language include: firstly, derivation which refers to a
process by which words to which new affixes or morphemes are added to create new lexemes or words by
either, modifying significantly the meaning of the base to which they are attached without necessarily
changing the grammatical categories or by bringing about a shift in the grammatical class of a base as
well as possible change in meaning or by causing a shift in the grammatical subclass of a word without
moving it into a new word-class. Secondly, inflection which means the process that changes the form of
the word by adding bound grammatical morphemes. These morphemes do not change the syntactic
category of the original word. These morphemes are referred to as inflectional morphemes. They mark a
grammatical meaning and not a lexical meaning. They are also syntactically conditioned. Thirdly,
compounding which means joining of two separate words to produce a single form. Fourthly, Conversion
which changes the function of a word as for example, when a noun comes to be used as a verb (without
any reduction). Other labels for this common process are category change and functional shift.
Fifthly,reduplication which is a process where by an affix is realized by phonological material borrowed
from the base. Finally, clipping which refers to the element of reduction which is noticeable when a word
of more than one syllable is reduced to a shorter form often in casual speech. This paper presents a
portion of research by Mikwa (2016) that examined An Analysis of Kimeru Word Formation Processes in
three Fraternity groups in Meru Speech Community
Statement of the Problem
Most of the current linguistic form is in the former colonial languages e.g. English,
Portuguese,German,Frenceetc. This means African languages of necessity need to be described so as to
have their linguistic form. This is important as it will help to give African languages more status so as to
preserve them together with African culture. This is necessary as it is the language that carries culture and
culture is the entire body of values by which people perceive themselves and their own place in the world.
Objectives of the Study
This paper is based on first and second objectives ofthe study which were first toidentify Kimeru
language word formation processes and second tocorrelate the knowledge of Kimeru word formation
processes and the speakers’ spoken codes in Meru speech community.
Theoretical Framework
Linguistic theory was used to study the data. The proponent of the linguistic theory is Chomsky who
argues that the central goal of linguistic theory is to determine what it is people know if they know a
particular language. Chomsky observes that knowing a language is not simply a matter of being able to
manipulate a long list of sentences that have been memorized. Rather, knowing a language involves
having the ability to produce and understand a vast and indeed unlimited number of utterances of that
language that one may never have heard or produced before. In other words, creativity (also called
productivity or open – endedness) is an aspect of linguistic knowledge that is of paramount importance.
Linguistic creativity is for the most part rule-governed. For instance, speakers of English know that it is
possible to indicate that there is more than one entity referred to by a noun and that the standard way of
doing this is to add– ‘s ‘at the end of a noun. Given the noun book, we know that if there is more than
one of these objects we refer to them as books. Linguistic theory was appropriate for the study as the
study sought to find out the knowledge of speakers on Kimeru word formation processes in Meru speech
community. It is very significant to examine whether speakers are productive in the use of words (which
are the building blocks of a language) their meaning and usage in the languages that they speak.

Proceedings of the Third International Research Conference held on 26th to 28th October, 2016 476
MATERIALS AND METHODS
Judgemental sampling method was used to select respondent for the study. It underlying principle
involves identifying in advance the ‘type’ of speakers to be studied and then seeking a quota of speakers
who fit the specified categories as Milroy (1987:26) observes. (cfMuthuri, 2000). A total number of three
contact people were used each from the three pre- specified social network groups. The identified subjects
introduced the researcher to the members of their fraternity groups. Therefore, the researcher was able to
get three informants per each fraternity group who were interviewed by way of word list discussion topics
which were tape recorded to elicit data for the study. Milroy (1987:26) notes that sociolinguistics samples
that are very large amount to unnecessarily large data and necessitate much time in analysis, but may not
yield different results (cfKebeya 1997, Muthwii 1994 and Trudgill 1974), Mikwa (2008) also observes
that it is no longer necessary to work with large samples for studies in speech communication because
sampling procedures have improved greatly. Thus, data was got from three pre-specified social network
groups in Meru. Each group had three members therefore the total population was nine informants. The
data consisted of tape recorded spontaneous speech using the language linguistic theory technique.
The data collected was sorted out into fraternity groups using the process of data reduction and
interpretation as per the word list discussion topics provided. Then the data for each discussion word list
topic was represented in a table alongside the fraternity groups. The information on word formation per
fraternity groups were expressed in percentages. The tables and figures were used to express the scores of
word formation knowledge per fraternity group using histograms.
Data Presentation
Introduction
Data was presented in extracts from transcribed texts. The word formation knowledge that varied
according to Pre-specified fraternity groups were identified and a statistical evaluation method was used
to analyse them showing the variability of this knowledge across the fraternity groups. Therefore, the
study adopted quantitative and qualitative approaches to data analysis. The analysis of scores obtained
from the variation of the knowledge of word formation across fraternity groups generated numerical data
which called for quantitative analysis. Every knowledge of word formation affix item that varied as per
the fraternity groups depending on the word lists topics of discussion was assigned one point and the
total points for every group of informants was converted into percentages and the informants were
stratified using these percentages. The percentages were found by dividing 100% by the total number of
affix items per word list discussion topic and multiplying the answer by the affix items scored by the
respective social network groups. This translates in mathematical representation thus:
100
Total number of affix items per word list discussion topic
Where there was no variation a score of zero was awarded
Analysis of Data as Per the Discussion Topics
The informants were given affixes word lists discussion topics namely: Kimeru prefixes and suffixes
where they were expected to give the meaning of every one of them and form a word using every one of
them. The spontaneous speech of the informants was tape recorded during the interview sessions. The
knowledge of word formation varied across fraternity groups as illustrated in example 1 below:
1. prefix word list discussion topic
i) Table 1.1. Prefixgu [ gu] means (to i . e. to infinitive) word list
verb meaning prefix meaning Output word meaning
Tema[tema] Cut Gu[gu] to Gutema[gutema] To cut
Kinya[kiɲa] Reach Gu[gu] to Gukinya[gukinya] To reach
Kena[kena] Glad Gu[gu] to Gukena[gukena] To be glad
Cooka[Co:ka] Return Gu[gu] to Gucooka[guco:ka] To go back/return
Cetha[seʚa] Play Gu[gu] to Gucetha[guseʚa] To play
X affix items scored by
The respective social fraternity groups

Proceedings of the Third International Research Conference held on 26th to 28th October, 2016 477
ii) Table 1.2. Prefix ku [ku] means ( to infinitive) word list
verb meaning prefix meaning Output word meaning
Thoma[ʚoma] Read Ku[ku] to Kuthoma[kuʚoma] To read
Uria[uria] Ask Ku[Ku] to Kuuria[ku:ria] To ask
Menya[meɲa] Know Ku[ku] to Kumenya[kumeɲa] To know
Andika[andika] Write Ku[ku] to Kuandika[kuandika] To write
Mena[mena] Despise Ku[Ku] to Kumena[kumena] To despise
iii) Table 1.3. Prefix a[a] means (he or she) word list
verb meaning prefix meaning Tense
marker
Output word meaning
Kinya[kiɲa] Reach a[a] She/he ra[ra]past
tense
a-ra-kinya[a-ra-
kiɲa]
She/he arrived
Ina[ina] sing a[a] He/she Ka[ka]future
tense
a-ra-ina[a-ra-ina] He/she sang
ʚoma[ʚoma] Read a[a] He/she ra[ra]past
tense
akathoma[akaʚoma] He/she will
read
Cooka[co:ka] Return a[a] She/he ka[ka] future
tense
a-racooka[araso:ka] HE/she
returned
Ongera[oɳera] Add a[a] She/he Ka[ka]future
tense
a-ka-
ongera[akaoɳera]
He/she will
add
iv) Table 1.4. Prefix ba[ba] means (they) word list
verb meaning prefix meaning Tense
marker
Output word meaning
Theka[ʚeka] Laugh ba[ba] they ra[ra]past
tense
ba-ra-theka[ba-ra-
theka]
They laughed
Thoma[ʚoma] Read ba[ba] they Ka[ka]future
tense
ba-ka-
thoma[bakaʚoma]
They will
read
Thura[ʚora] Annoy ba[ba] they ka[ka]future
tense
Ba-ka-
thura[bakaʚura]
They will
become
annoyed
Andika[andika] Write ba[ba] they ka[ka] future
tense
Ba-ka-
andika[bakandika]
They will
write
Matuka[matuka] Run ba[ba] They ra[ra]past
tense
ba-ra-
matuka[baramatuka]
They ran
v) Table 1.5. Prefix u[u] means (the doer or addresse) word list
verb meaning prefix meaning Tense
marker
Output word meaning
Taa[taa] Throw U[U] Doer/subject ka[ka]
future tense
Uka-taa[ukata] You will
throw
Ina[ina] Sing U[u] Doer/subject Ka[ka]future
tense
U-ka-ina[ukaina] You will sing
Andika[andika] Write U[u] subject ka[ka]future
tense
U-ka-
andika[ukandika]
You will write
Guru[guru] Buy U[u] subject ka[ka]
future
tense
U-ka-
gura[ukagura]
You will write
Gwithia[gwiʚia] Do U[u] subject ka[ka]future
tense
U-ka-
gwithia[ukagwiʚia]
You will do

Proceedings of the Third International Research Conference held on 26th to 28th October, 2016 478
vi) Table 1.6. Prefix gi [gi] augmentative word list
verb meaning Prefix meaning Output word meaning
Tara[tara] Count Gi[gi] Augmentative Gitara[gitara] Nest
Tuma[tuma] Send Gi[gi] Augmentative Gituma[gituma] Noise
Kwa[kwa] Somebody’s
place
Gi[gi] Augmentative Gikwa[gikwa] Yam
Tonga[to:ɳa] Touch Gi[gi] Augmentative Gitonga[gitonga] A rich
person
Tanda[tanda] Spread Gi[gi] Augmentative Gitanda[gitanda] A bed
vii) Table 1.7. ki[ki] Augmentative word list
verb meaning Prefix meaning Output word meaning
Rima[rima] Cultivate Ki[ki] Augmentative Kirima[kirima] Mountain
Ara[ara] Spread Bed Ki[Ki] Augmentative Kiara[kiara] Compost pit
Banga[baɳa] Arrange Ki[Ki] Augmentative Kibanga[kibaɳa] panga
Uria[uria] Ask Ki[ki] Augmentative Kiuria[kiuria] Question
Gwa[gwa] Fall Ki[ki] Augmentative Kigwa[kigwa] Sugarcane
viii) Table 1.8. ka [ka] diminutive word list noun meaning Prefix meaning Output word meaning
Mburi[mburi] Goat Ka[ka] Diminutive Kamburi[kamburi] Small goat
Njira[njira] Road Ka[Ka] Diminutive Kanjira[kanjira] Small road
Muti[muti] Tree ka[ka] Diminutive Kamuti[kamuti] Small tree
Nyumba[nyumba] House Ka[ka] Diminutive Kanyumba[kanyumba] Small house
Mbakuri[mbakuri] Bow Ka[ka] Diminutive Kambakuri[kabakuri] Small bow
The three fraternity groups scored the scores captured on the table below on the prefix word list
discussion topic ix
ix) Table 1.9. Prefixes word lists scores across fraternity groups
Fraternity Group Items scored Variance Variance percentage
A1 4/8 4 50
A2 6/8 2 25
A3 8/8 0 0
There was no variance in A3 fraternity group. These members live their lives in Kimeru language and are
good at it .The other fraternity groups who are bilinguals and multi-linguals are not quite good in Kimeru
as compared to A3 fraternity group.
2) Suffixes word list discussion topic
i) Table 2.1. Suffixer[er]- (it has the meaning of propositional function) word list prefix meaning verb meaning suffix Meaning
propositional
function
Object
marker
meaning Output
word
meaning
Gu[gu] to Cuuria
[su:ria]
Hang Er[er] Up/for a[a] Him/her Gucuureria
[gusu:reria]
To hang
up
for
Ku[ku] to Rita
[rita]
Take out Er[er] out a[a] Him/her Kurutera
[kurutera]
To take
out for,To
work for
Ku[ku] to Romba
[romba]
pray Er[er] for a[a] them Kurombeera
[kurombera]
To pray
for
Ku[ku] to Reta[reta] Bring Er[er] for a[a] Him/her Kuretera
[kuretera]
To bring
for
Ku[ku] to Gera[gera] throw Er[er] for a[a] Him/her Kugerera
[kugerera]
To throw
for

Proceedings of the Third International Research Conference held on 26th to 28th October, 2016 479
ii) Table 2.2. Suffix ek[ek]–(with passive function or with the meaning of the english suffix –able)
word list prefix meaning verb meaning suffix Meaning
Object
marker
meaning Output
word
meaning
It[it] Be Tika[tika] Pour Ek[ek] passive a[a] it Itek-a [iteka] Be poured
away
Gu[gu] To kundika
[kundika]
Tie Ek[ek] passive a[a] it Gukundika
[gukundika]
To tie a
knot
kwe[kwe] somethin
g
Enda[enda]
Love Ek[ek] Able a[a] it Kwendeka
[kwendeka]
Something
lovable
kwe[kwe] that elewa[elewa] Understan
d
Ek[ek] Able a[a] it Kweleeka
[kweleka]
That is
understood
it[it] to itikia[itikia] Believe Ek[ek] passive a[a] you itekia
[itekia]
To believe
iii) Table 1.3. Suffix or [or] (signifies the opposite of what is expressed by the stem to which it is
added) word list stem meaning suffix meaning Object
marker
meaning Output
word
meaning
anda[anda] plant or[or] Gives
opposite
meaning
a[a] you Andora[andora]
uproot
inga[iɳa] close or[or] Gives
opposite
meaning
a[a] you Iing’ora
[iɳora]
Open
oga[oga] Tie or[or]
Gives
opposite
meaning
a[a] you ogora
[ogora]
untie
kuundika[kuandika] Tie a knot Or[or]
Gives
opposite
meaning
a[a] you kuundora
[ku:ndora]
Untie a knot
Cuulia[cuilia] Hang up or[or] Gives
opposite
meaning
a[a] you cuuroreria
[cu:roreria]
To take down
for /of
something
hanging up
iv) Table 1.4. Suffix ok [ok] (passive or reflective of) word list stem meaning suffix Meaning Object
marker
meaning Output
word
meaning
Kuundika [kundika] Tie ok[ok] passive a[a] reflexive Ku:ndoka[ku:ndoka] untie
iiɳa[i:ɳa] close ok[ok] passive a[a] reflexive Iingoka
[i:ɳoka]
Open
Ga[ga] Somebody
something
ok[ok]
passive a[a] reflexive Garoka
[igaroka]
Be changeable
(in bad sense)
Ga[ga] Somebody
/something
Ok[ok]
passive a[a] reflexive Garokia
[garokia]
Turn round
The three fraternity groups scored the scores captured on the table below on the suffixes word lists
discussion topic
v) Table 2.5. Suffixes word lists scores across fraternity groups
Fraternity Group Items scored Variance Variance percentage
A1 2/4 2 50
A2 ¾ 1 25
A3 4/4 0 0
There was no variance in A3 fraternity group. These members live their lives in Kimeru language and are
good at it .The other fraternity groups who are bilinguals and multi-linguals are not quite good in Kimeru
as compared to A3 fraternity group.

Proceedings of the Third International Research Conference held on 26th to 28th October, 2016 480
CONCLUSION
The knowledge of Kimeru word formation processes in the study depended on the degree to which the
respondent lived their lives in it with those who entirely lived their lives in it scoring high scores. This is
true for other languages because both performance and competence of an individual in a language
depends on how an individual uses the language. People tend to forget languages that they once knew
when they stop speaking them regularly.
ACKNOWLEDGEMENTS
The author would like to express gratitude to ChukaUniversity for the opportunity to share the findings of
this study with the audience.
REFERENCES
Anderson S. (1992). A-morphous morphology. CUP. Cambridge:
Aronoff M. (1993). "Morphology by itself"., MA: MIT Press Cambridge.
Bauer L. (2003). Introducing linguistic morphology (2nd Ed.). Georgetown University Press Washington,
D.C.:
Bauer L. (2004). A glossary of morphology. Georgetown UP. Washington, D.C
Beard L. (1995). Lexeme-morpheme base morphology. State University of New York Press. Albania
Bloomfield L. (1933) Language,; Holt. Rinehart and Winston New York
Bubenik V. (1999). An introduction to the study of morphology. LINCON course books in linguistics, 07.
Muenchen: LINCOM Europa.
Guthril M.(1967) The classifications of bantu languages, London international African institute Dawsons
of pall mall
Hardling E and Riley P. (1986) The bilingual family, A Handbook For Parents, Cambridge University
Press Cambridge
Haspelmath M. (2002). Understanding morphology. Arnold (co-published by Oxford University Press).
London:
Katamba F. (1993). Morphology. modern linguistics series.: St. Martin's Press.New York

HARNESSING AFFIRMATIVE ACTION AND GENDER EQUITY FOR SUSTAINABLE
DEVELOPMENT
EFFECTS OF FEMALE GENITAL MUTILATION ON THE GIRL CHILD’S SOCIAL LIFE
AMONG THE AMERU COMMUNITY OF KENYA
Kinyua, S.M.
Department of Education, Chuka University, P. O. Box 109-60400, Chuka, Kenya Email: [email protected], Tel.: 0712 426 047
ABSTRACT
Since the ban of Female Genital Mutilation (FGM) in Kenya, the Ameru community continues the
practice in spite of the associated stigma and adverse effects on the initiates. Basically, FGM involves the
partial removal, total removal or alteration of girls’ or women’s genitalia which in effect disorients the
initiates’ social lives in terms of marriage; relationships; social interactions; personal advancement and
denial of essential rights such as education. To this end, this study determined the effects of FGM on the
girl child’s social life among the Ameru community of Kenya. The study adapted the descriptive survey
research design on a sample size of 481 respondents comprising of 408 initiated girls, 48 health workers,
3 social workers and 30 Focus Group Discussion members selected by use of snow ball sampling and
purposive sampling techniques. Data were collected using questionnaires, interview schedules and Focus
Group Discussion schedules. The data were analyzed using Statistical Package for Social Sciences
version 17.0. Descriptive statistics including means, frequencies, percentages and standard deviations
were used to analyze the data. The findings indicated that FGM hindered the initiated girls from
exploiting their full potential and competencies due to social withdrawal, limited interactions and lack of
involvement in many career opportunities occasioned by early marriages. Thus, it was recommended that
the government, nongovernmental organizations as well as other stakeholders should advocate for
community activities that foster an enabling environment for collective social change towards FGM social
convention shift and contribute to an improvement of wellbeing of initiated girls and women in the
Ameru community.
Keywords: Female Genital Mutilation, Girl Child, Social wellbeing
INTRODUCTION
The traditional feminine roles in most societies exemplified by house chores, child rearing, nurturing and
homemakers tend to moderate women’s aspirations and options for self-actualization. Therefore, the
manner in which an adolescent girl is socialized into womanhood shapes their future life in terms of
attitudes, motivation, interests, ambitions, fears and achievements. For instance, African American
women discuss with their daughters the truths about sexual knowledge while building on self-esteem as
well as spiritual and cultural values in pursuit of developing strong women (Shambley-Ebron, Dole and
Karikari, 2014). Thus, the African American girls are likely to develop into strong willed independent
women who uphold both spiritual and cultural values related to womanhood within the African American
social context. Essentially, Erickson’s theory on stages of psychosocial development among women
emphasizes that girls be socialized into developing a hardy personality, forming identity as an achiever,
building skills in self-esteem, developing strategies for financial as well as emotional competence and
finally acquiring satisfaction in work and love life (Huitt, 2008). However, development of such qualities
and competencies in girls reared within traditional feminine norms dominated societies may require
facilitation by mentors and a secure social support system.
Generally, influence of the mass media, peer pressure, societal stereotypes, parenting styles, religious
expectations and the education system is paramount on a girl child’s social life. Therefore, girls who are
left on their own to negotiate life into womanhood through trial and error module get baffled by the many
distractors due to lack of proper guidance, role modelling and a clear vision for the future (Waitley,
1996). Fortunately, in response to the neglected girl child’s predicament, alternative initiation
programmes by religious communities and nongovernmental organizations have been organized to assist
girls through the journey to womanhood. These programmes serve to inculcate general knowledge, life
skills and social values among the female initiates in order to generate responsible female adults.
However, the Ameru community of Kenya continues to practice FGM as a rite of passage from childhood

Proceedings of the Third International Research Conference 26th to 28th October, 2016 482
to womanhood in an attempt to prepare the girl child for adult roles of a wife and mother. The practice
was deemed to control female sexual behaviour, change attitude from childhood to adulthood and prepare
initiates for adult roles (Chebet, 2009). Nevertheless, FGM involved irrevocable consequences such as
ulceration of the genital region, alteration of sexual responses, vows made by initiates’ blood to continue
the practice else invoke a curse of one’s family, painful coitus, urine retention and psychological trauma
(Cheserem, 2010). Thus, this study sought to explore the effects of FGM on the girl child’s social life
with respect to marriage, relationships, competence in social interaction, personal advancement and rights
violation among the Ameru community of Kenya.
Objective of the Study
The main objective of this study was to determine the effects of FGM on the girl child’s social life among
Ameru community of Kenya.
METHODOLOGY
This study adapted the descriptive survey research design on a target population of 137,044
respondents.A sample comprising of 408 girls who had undergone FGM were selected using snow ball
sampling technique while 48 health workers, 3 social workers and 30 Focus Group Discussion members
were purposively selected for the study. The desired data were collected using questionnaires, interview
schedules and Focus Group Discussion schedules. Qualitative data were coded and entered into the
computer for analysis using Statistical Package for Social Sciences version 17.0 while qualitative data
from interviews and focus group discussion were grouped into main themes and then analyzed according
to the study objective. Descriptive statistics including frequencies, percentages, means, and standard
deviation as well as themes and excerpts were used to analyze the data. The study findings were presented
on tables and as prose narrations.
RESULTS
This section presents the results of the study and it is divided into two subsections; the demographic
characteristics of the respondents and effects of FGM on the girl child’s social life.
Demographic Characteristics of the Respondents
The demographic characteristics of the respondents were determined in order to provide an overview of
the nature of the study respondents. The demographic analysis of the initiated girls was done based on
age, residence settings, level of education as well as religious affiliations. The number of initiated girls
who participated in the study was 407 of whom 41 girls were aged between 14 years and 19 years, 244
girls between 20 years and 24 years while 122 girls were aged between 25 years and 30 years. Regarding
the residence settings, 90.7% of the initiated girls lived in rural areas as opposed to only 9.3% who
resided in urban centers. This observation reflects the general trend where FGM is widely practiced
among the rural population (Kanake, 2001). This may be attributed to the fact that most remote rural areas
are less exposed to formal government services and administrators who fight against the FGM practice.
Besides, DOM-CPJC (2008) suggests that the Ameru girl’s rural home is the main place where FGM is
carried out. With respect to religious affiliation, majority of the initiated girls constituting 51.8% were
Protestants; 42.3% were Catholics and 2.7% were Muslims. The high percentage of the Christians that is
Protestants and Catholics may be attributed to the contribution of the early church missionaries to social
development projects such as building of schools, hospitals and churches in most parts of the Ameru
community (DOM-CJPC, 2008). Nevertheless, the small percentage comprising 2.7% of girls affiliated to
Muslim religion is perhaps a reflection of the presence of Muslim faithfulls among the Ameru people.
The number of health workers involved in the study was 46 whose distribution by gender was almost
proportional with female health workers constituting 54.3% among 45.7% male health workers. This
distribution trend is common in Kenyan health sector where the majority of the medical staff are female.
These findings may be attributed to the traditional perception that provision of medical services is a
females’ occupation. The age distribution of the health workers indicated that 54.3% of the respondents
were between ages 25 years and 34 years; 21.7% were between ages 35 years and 34 years while17.4%
were at least 45 years. Regarding work experience, a large proportion constituting 32.6% of the

Proceedings of the Third International Research Conference 26th to 28th October, 2016 483
respondents had an experience of between 5 years and 10 years; 26.1% of the health workers had work
experience of at least 15 years while 28.3% had worked for less than 5 years.
There were three female social workers involved in the study each from Igembe South District, Tharaka
District and Meru South District. Two of the social workerswere above 45 years of age while the third
one was aged between 35 years and 44 years.It may be inferred that the social workers wereenergetic and
mature enough to handle community activities efficiently and also hadadequate community service
experiences on FGM issues necessary for this study. All the social workers had college or university
education meaning that these respondents were professionally competent to determine the effects of FGM
on girl child’s social life among the Ameru community in Kenya.
Effects of FGM on the Girl Child’s Social Life
This section provides insight into the views of the various respondents on the effects of FGM on the girl
child’s social life in the areas of marriage and relationships; competence in social interactions; personal
advancement and rights violation.
4.2.1 Initiated Girls’ Opinions about Effects of FGM on the Girl Child’s Social Life
The initiated girls’ opinions about the effects of FGM on a girl child’s social lifewere analyzed by
determining the mean and the standard deviation of 20 items on a 5 point Likert Scale where Strongly
Disagree = 1, Disagree = 2, Undecided = 3, Agree = 4, Strongly Agree = 5. The informationon Table 1
represents the data analysis results.
Table 1: Initiated Girls’ Opinions on Effects of FGM on the Girl Child’s Social life
FGM and Marriage and Relationships N M SD
FGM may make me suffer from marital conflict and divorce later in life. 407 3.3563 1.26076
I fear marriage because of having undergone FGM practice. 407 3.1057 1.23222
Practice of FGM contribute to a severely depressed self-image as a wife 407 3.6634 1.6696
Lack of FGM means a girl is isolated and may not find a husband 407 3.7740 1.34201
Overall Mean and Standard Deviation on marriage and relationships 3.4748 0.77809
FGM and Competence in Social Interaction N M SD
With FGM practice I feel isolated and discriminated 407 2.5577 1.26568
Having undergone FGM I feel like a criminal 407 2.8403 1.45424
I feel inadequate to hold responsibilities in the society because of FGM 407 2.2260 1.48158
FGM has made me experience community rejection 407 2.5356 1.27232
I feel shy in relating freely with others due to FGM 407 3.3735 1.30104
FGM has made me an outcast of modern religion 407 3.3587 1.36243
I conflicts with family members due to my FGM status 407 3.3120 1.15900
I engage in sexual promiscuity as a result of FGM practice 407 1.5184 1.31832
Lack of FGM brings shame and stigmatization upon the girl-child 407 3.5430 1.5430
Without FGM am not a fully recognized community member 407 3.6192 1.47221
FGM has led to severely disabling social complications for a normal life 407 3.2015 1.2015
Overall Mean and Standard Deviation on competence in social interaction 3.0078 0.61677
FGM and Personal Advancement N M SD
FGM has limited my progress in education and training 407 3.5111 1.32213
Forced FGM has denied me a chance to pursue my career 407 3.9386 1.16967
Overall Mean and Standard Deviation on personal advancement 3.7248 0.96959
FGM and Rights Violation N M SD
Forced FGM practice has denied me the right to life and human dignity 407 4.1622 1.05897
Being coerced into FGM has denied me right to privacy 407 4.2359 1.00412
Having been forced to undergo FGM has denied me right to protection and
freedom from discrimination
407 3.9853 1.17225
Overall Mean and Standard Deviation on rights violation Mean 4.1278 0.88071
Key: M – Mean SD – Standard Deviation N – Number of respondents

Proceedings of the Third International Research Conference 26th to 28th October, 2016 484
The overall mean and standard deviation of initiated girls’ opinions about the effects of FGM on marriage
and relationships was 3.4748 with SD of 0.77809, out of the maximum mean score of 5 points. This
suggests that the girls were of the opinion that FGM practice moderately affected their marriage and
relationships. This view contradicted the cultural expectation that FGM prepares girls for marriage. The
lowest item mean was 3.1057 with SD of 1.23222 implying that the girls were fairly undecided on
whether fear of marriage was as a result of FGM experience or not. At the time of this study, majority of
the girls were young, between 14 – 30 years, and had not been married as yet hence, knowing little of
what a marriage relationship entailed. The highest item mean was 3.7740 with SD of 1.34201 suggesting
that most of the girls agreed that in the Ameru community, lack of FGM meant a girl was isolated and
could get difficulties in finding a husband. Perhaps this opinion was based on what they have been
culturally made to believe in relation to cultural norms.
The overall mean score obtained from the initiated girls’ opinions on the effects of FGM on the girl
child’s competence in social interactions was 3.0078 with SD of 0.61677 out of the maximum mean score
of 5 points. This reveals that most of the girls were undecided on whether or not FGM experience affected
their competence in social interaction. This view may be attributed to the cultural perception that FGM
was supposed to minimize social interaction in an attempt to avoid over indulging which could later lead
to sexual attraction with the aim of reducing sexual promiscuity. The lowest response item mean was
1.5184 with SD of 1.31832 revealing that the girls disagreed that engagement in sexual promiscuity is as
a result of FGM practice, because FGM is culturally meant to reduce sexual promiscuity.The highest
response item mean was 3.6192 with SD of 1.4722 suggesting that avoidance of FGM meant that one was
not a full and recognized member of the community. This is strengthened by the Kiswahili saying
“Asiyena mila ni mtumwa” (one without his/her culture is a slave). In real terms, among the Ameru
compliance to FGM is largely a social tradition and pressures are exerted to all to conform and follow
others in perpetuating the practice. The overall mean from the analysis of initiated girls’ opinions about
the effect of FGM on the girl child’s personal advancement was 3.7248 with SD of 0.96959 out of a
maximum mean score of 5 points. This suggests that the girls’ personal advancement was moderately
affected by the FGM practice perhaps because no concerted effort was made to empower these girls to
improve on their educational prospects as a way of effectively competing academically and professionally
on the same level as uncircumcised girls and the boys.
The overall mean on the initiated girl’s opinions about the effects of FGM on the girl child’s rights
violation was 4.1278 with SD of 0.88071 out of the maximum mean score of 5 points. This suggests that
initiated girls’ rights were highly violated as a result of going through FGM process. The highest mean on
the response items was 4.2359 with SD of 1.00412 indicating that the right to privacy was denied possibly
because the girls’ genitals were mutilated publicly without consent. The high mean on this response item
also indicates that most girls were coerced into the FGM process.
Health Workers’Opinions about Effects of FGM on the Girl Child’s Social Life The health workers’ opinions about the effects of FGM on a girl child’s social lifewere analyzed by
determining the mean and the standard deviation of 20 items on a 5 point Likert Scale where Strongly
Disagree = 1, Disagree = 2, Undecided = 3, Agree = 4, Strongly Agree = 5. The informationon Table 2
represents the data analysis results.
The overall mean on the health workers opinionsabout effects of FGM on marriage and relationship
experienced by the initiated girls was 3.5054 with SD of 0.88739 out of the maximum mean score of 5
points. This suggests that FGM may impact on girls’ marriages and relationships. The lowest item mean
was 3.1522 with SD of 1.22868 suggesting that the health workers were fairly undecided as to whether
the FGM led to marital conflicts and divorce later in life probably because marriage break-ups were not
associated with the FGM process. The highest item mean was 4.1087 with SD of 1.26891positing that
uninitiated Ameru girls risked being socially isolated and having difficulties finding a husband. This
finding may have been based on the fact that FGM as a traditional practice and belief system was
intended for cultural identity and graduation of a girl into womanhood in preparation for marriage in the
Ameru community.

Proceedings of the Third International Research Conference 26th to 28th October, 2016 485
Table 2: Health Workers’Opinionson Effects of FGM on the Girl Child’s Social Life
FGM and Marriage and Relationships N M SD
FGM leads to marital conflict and divorce later in life 46 3.1522 1.22868
FGM leads to fear of marriage among the girls involved 46 3.2391 1.15825
FGM contributes to severely depressed self-image as a wife 46 3.5870 1.29230
Lack of FGM means a girl is isolated and may not find a husband 46 4.1087 1.26891
Overall Mean and Standard Deviation on marriage and relationships 3.5054 0.88739
FGM and Competence is Social Relations N M SD
Girls who have undergone FGM are isolated discriminated 46 3.1739 1.33840
The practice of FGM make a girl to be a criminal 46 2.2391 1.21445
FGM initiates are inadequate to hold responsibilities in the society 46 1.8261 .94996
FGM leads to the girls experiencing community rejection 46 2.6084 1.29062
FGM practice leads to the girls experiencing sexual promiscuity 46 3.5870 1.6573
Girls who have undergone FGM are shy in relating freely with others 46 3.2609 1.32388
FGM makes a girl-child to be an outcast of modern religion 46 3.0870 1.31362
FGM practice is a source of conflict between a girl and family
members
46 2.7174 1.32771
FGM brings shame and stigmatization upon the girl-child 46 3.9565 1.29883
Lack of FGM means a girl is not a fully recognized community
member
46 4.1522 1.21046
FGM causes severely disabling social complication to a girl’s normal
life
46 3.6522 1.26872
Overall Mean and Standard Deviation on competence in social
interaction 3.1206 0.68489
FGM and Personal Advancement N M SD
FGM limits girl’s progress in education 46 3.8261 1.19823
Forced FGM has denied girls a chance to pursue their career 46 4.2609 .97604
Overall Mean and Standard Deviation on personal advancement 4.0435 0.85522
FGM and Rights Violation N M SD
Forced FGM denies girls the right to life and dignity of human person 46 4.1622 0.05897
Girls coerced into FGM are denied their right to privacy 46 4.4783 .91261
Girls coerced to undergo FGM are denied their right to protection and
freedom from discrimination
46 4.2391 1.01510
Overall Mean and Standard Deviation on rights violation 4.3986 0.74906
Key: M – Mean SD – Standard Deviation N – Number of respondents
The overall mean on the health workers opinions about effects of FGM on social interaction experienced
by the girls was 3.1206 with SD of 0.68489 out of a maximum mean score of 5 points. This suggests that
the health workers were fairly undecided whether FGM practice was a source of incompetence in social
interactions among the girls possibly because other numerous factors such as level of education, age,
developmental milestones and social exposure may have contributed to the same problem. The lowest
item mean was 1.8261 with SD of 0.94996 indicating that the health workers disagreed with the fact that
girls who had undergone FGM were inadequate to hold responsibilities in the society. The highest item
mean was 4.1522 with SD of 1.21046 suggesting that avoidance of FGM meant a girl was not fully
recognized as a member of the Ameru community.
The health workers views on effects of FGM on personal advancement experienced by initiated girlswas
4.0435 with SD of 0.85522 out of a maximum mean score of 5 points. These responses reveal that the
girls’ personal advancement was stalled after undergoing the FGM process. The health workers blamed
this on attitudinal changes that the girls acquired during the FGM seclusion sessions making them reject
formal education perceiving themselves as adults and schools as institutions for “children”.
The overall mean on the health workers views about effects of FGM on violation of rights experienced by
the initiated girls was 4.3986 with SD of 0.74906 out of a maximum mean score of 5 points. This means

Proceedings of the Third International Research Conference 26th to 28th October, 2016 486
that the rights of the girls were highly violated as a result of FGM practice. The health workers purported
that the initiated girls’ right to life was violated especially when the girls die as a result of FGM
complications such as excessive bleeding and infections. The right to privacy and human dignity was
interfered with since FGM process involved public exposure and disfiguring of the genital’s anatomy.
Social Workers’ Views about Effects of FGM on the Girl Child’s Social Life
Finding from interviews conducted with the social workers revealed that FGM was practiced by the
Ameru community to maintain customs and traditions; control women sexuality; due to the social
pressure to keep to social norms; to enhance cleanliness since uncircumcised women were seen as
unclean and thus not allowed to grind uji, handle food and water; and for the beauty of the female external
genitals since the African perception was that women with unmutilated genitals were ugly, dirty and
bulky. Other reasons for FGM practice among the Ameru were reported as: health purposes because some
members of the community argued that if the clitoris was not excised then it may damage the baby to
death during child birth; to preserve virginity among girls; to confer respect to the girls; for economic
gains because excised girls fetched more bride wealth to the family; to prepare for marriage where
excised girls were said to make better wives; to gain social honour for the girl’s family; religious purposes
especially for the Muslims to be “clean”; and to achieve pride and identity. A particular participant noted
that, “Some village male elders demand that women and girls needed to be cut to be taught a lesson
because if left uncut, they would grow horns and no longer respected their men-folk particularly their
husbands. FGM practice is therefore seen at best as an antidote for returning women and girls to their
roots and also as a punitive measure to keep them in checks”.
The social workers listed social effects of FGM experienced by the initiated girls as: being always
isolated particularly in school and church to avoid interaction with uncircumcised girls; initiated girls
regarding themselves as grown-ups and becoming so ignorant leading to isolation as well as engagement
in sexual relationships so early with adult men; and rejection by the uncut girls resulting into experiencing
shame and low self-esteem.
Regarding the initiated girls’ rights violation, the social workers sighted the right to protection and
Freedom from discrimination; right to privacy and family life; right to life and dignity of the Human
person; right to peace and common Heritage of mankind and right to sound health and physical integrity.
A certain participant retorted, “Their right to privacy is violated when their genitals are mutilated with or
without their consent. Also their right to personal freedom is violated because the girls have a right to
remain untampered with and be left alone. The FGM practice deprives these Ameru girls of their rights to
sound and physical well-being which also reduces their level of skills and education. The right to life gets
violated when the initiated girls die due to too much bleeding after the FGM process. At the same time,
these Ameru girls get deprived of their right to work opportunities and participation in development due
to lack of education, after dropping out of school”.
The social workers highlighted a few of the legislations against FGM practice including:the constitution
of Kenya, 2001:51 which states, “No person shall be subjected to any torture or human degrading
punishment or other treatment”; article 231 of the Kenya Penal Code Act Cap 63 (1970:86) which states
that: “Any person who, with intend to maim, disfigure or disable any person is guilty of a felony and is
liable to imprisonment for life, with or without corporal punishment” the children’s Act (2001) enacted by
parliament outlawing FGM whose section 14 states, “No persons shall subject a child to female
circumcision, early marriage or other cultural rites, customs or traditional practices that are likely to
negatively affect the child’s life, health, social welfare, dignity or physical and psychological
development” and “Any connection of FGM related offences carries penalties of 12 months imprisonment
or fine of Ksh. 50,000 or both. The connection here includes a person who takes or forces the girl to be
circumcised, the circumciser and those involved in the ceremonies”.
The social workers also elaborated their role in curbing the FGM practice. This role was twofold: holding
sensitization seminars and workshops which were generally ignored by majority of the residents and
advocating for the Alternative Rite of Passage whose effectiveness was weakened due to the fact that it
focused more on girls in schools and main stream churches instead of reaching out to the most vulnerable

Proceedings of the Third International Research Conference 26th to 28th October, 2016 487
girls in the remote areas. However, those families and girls who had embraced education, economic
progress and Christianity shunned FGM amidst severe rejection from the general traditional Ameru
community members.
Focus Group Discussion about Effects of FGM on the Girl Child’s Social Life
Focus group discussions were held in the three districts each involving 10 opinion leaders from the
communities including village elders, chiefs, church representatives and mothers. The findings indicated
that after the FGM experience, initiated girls alienated themselves from the uninitiated peers who were
perceived as children. This led to formation of small cliques of initiated girls who relied on each other’s
limited knowledge and exposure for emotional, social, personal and psychological support. As a result,
the clique members regarded themselves as adults and focused more on emotional and social relations
with older men leading to early marriages. This meant lost educational and related career opportunities for
these girls. This scenario is summed up in the following excerpt, “I have witnessed that immediately after
the practice, the Ameru girls perceive themselves as old enough to engage in sexual intercourse quite
often, thus resulting into premarital pregnancy, early enforced marriages and finally school dropouts.
This later leads these girls suffering a lot of shame and shyness”. Unfortunately, early marriages never
offered any solace for the initiated girls who had to daily struggle with unsatisfying sexual relations,
painful coitus, endless house chores, marital conflicts and bringing up children under restrained financial
resources. Ultimately, these initiated girls felt isolated, dejected, ashamed, lonely and withdrawn from
general social interactions.
Particularly, the initiated girls who continued with education found it difficult to freely interact with
fellow students and teachers at school. This is exemplified by the following remarks from one of the
participant, “After the FGM practice, these Ameru girls become ‘Big-Headed’ and are unable to mix
freely with the teachers and peers at school”. In addition, another participant reflected, “I remember
talking to some girls who had undergone FGM who confessed of experiencing a lowered dignity as a
result of their FGM status. They further explained that they never felt like mixing freely with their peers,
who had not gone through the FGM practice”. It was also discovered that this socialization gap extended
outside the educational institutions and continued widening up into adulthood. Thus, FGM practice
caused impaired competence in social interactions among initiated Ameru girls who became isolated and
withdrawn into an internal world of loneliness.
The focus group discussion members also deliberated on issues pertaining personal advancement among
the initiated Ameru girls. Participants agreed that most initiated Ameru girls suffered educational, social,
economic and spiritual draw backs mainly because of their inability to socially interact in society. The
lack of educational and economic empowerment was regarded as the main reason for majority of the
initiated girls languishing in poverty and low social status. Essentially, those initiated girls who were able
to achieveabove average educational, social, economic and professional status were reported as lacking in
confidence to execute the powers espoused on them by these status generally due to FGM related anxiety
and embarrassment.
Regarding rights violation, the focus group discussions revealed that FGM practice denied an initiated
Ameru girl the freedom of natural sexual expression; personal dignity, peace and privacy; opportunities
for happy marriages; right to physical, social and psychological health; as well as how it feels like to be a
complete woman. There is a participant who noted, “Although mothers often support the FGM practice
because without it their daughters would not get married, it also leads to marital conflicts. This is because
vaginal sexual intercourse becomes precluded resulting to problematic sexual expressions which are a
source of these marriage relationship conflicts”. Many girls were also reported as having been indirectly
denied the opportunities to study and advance due to persistent anxiety emanating from their FGM status.
Basically, the initiated woman lived the rest of their lives wondering how it would have been like if they
never encountered the FGM perpetrators, an experience that cannot be reversed.
DISCUSSION
The findings of this study revealed that FGM had a moderate effect on the girl child’s social life with
respect to marriage, relationships, competence in social interaction and personal advancement. However,

Proceedings of the Third International Research Conference 26th to 28th October, 2016 488
most respondents agreed that FGM violated the rights of Ameru girls but most Ameru girls opted for
FGM because this made it easier for them to get a husband and be accepted in the community. In line
with this finding, young (2007) purports that a woman’s social status and eligibility for marriage in
societies that practice FGM is positively associated with FGM encounter. In support, Abusharaf (2001)
asserts that failure to conform to FGM practice leads to difficulties in finding a husband, shame,
stigmatization, as well as loss of social position, honour and protection, resulting in the girl’s family being
socially excluded from the community. Boyle (2005) reports that unless a girl’s clitoris is removed, the
girl will not have matured to a woman or a full member of asociety in which FGM is a norm. Chege
(1993) asserts that failure to conform to the FGM tradition brings shame and stigmatization upon the
entire family and prevents girls from becoming full and recognized members of the community.
However, according to the study findings, the honour and ease of marriage accorded to the initiated girls
was confounded by estranged social relations, marital conflicts, school dropout, self-stigma, isolation,
loneliness and regret. In relation to this finding, Otieno (2011) explains that many Kuria men prefer
marrying the uninitiated Luo or Luhya women who are perceived to be more enthusiastic about sex
compared to the initiated Kuria women. In this regard, FGM is purported to negatively affect a woman’s
sexual response with the effect of causing marital and relational conflicts. In addition, the initiated girls
were reported as having difficulties interacting with the uninitiated peers and teachers at school. This
problem may be attributed to the change in attitude perpetuated by the FGM process which causes the
initiates to regard themselves as adults who are ready for marriage and child rearing thus viewing school
as institutions for children (Chebet, 2009). As a result, the initiated girls focus more on sexual relations
with older men eventually opting out of school in favour of marriage (Mwaniki, 1985).
Generally, a lack of competence in social interactions especially at school may be blamed in part for the
inability by initiated Ameru girls to advance academically. Consequently, the initiated girls’ inability to
complete school and their academic under achievement as well as early marriages culminated in
economic adversity among the initiated Ameru girls who struggled to raise families with meager
resources (Ondieki, 2010). In retrospect, although most initiated girls felt that FGM did not affect uptake
of responsibilities in society, the focus group discussions pointed out that initiated women lacked
confidence in executing such responsibilities. According to Rushwan (2000) internalized shame and
embarrassment may result in anxiety and inferiority complex especially in social situations. Such anxiety
and complexes may lead to deficits in self confidence among the initiated girls who take up leadership
positions in society.
The findings indicated that the rights of the initiated Ameru girls were violated with regard to life,
privacy, protection and freedom from discrimination. In line with these sentiments, Ondieki (2010)
explains that FGM was identified as a basic human right violation and a life-long threat to women and
girls. Specifically, those Ameru girls who died due to FGM complications were denied the right to life
and protection from harm, which are fundamental rights for all human beings (Sohn, 1982). In addition,
FGM among the Ameru was conducted openly within homesteads; a practice that invaded the initiates
right to privacy. Eventually, rumors spread and sooner than later the entire village was aware of those
girls who were initiated and how each braved through the entire process. As a result, the initiated girls lost
their privacy and had to contend with emanating feelings of embarrassment and low self esteem based on
how they braved the initiation process.
RECOMMENDATIONS
(i) The government, non-governmental organizations as well as other stakeholders should advocate for
community activities that foster an enabling environment for collective social change towards FGM
social convention shift and contribute to an improvement in the wellbeing of initiated girls and
women in the Ameru community.
(ii) Those initiated girls who dropped out of school due to early marriage should be encouraged to join
the adult classes in order to complete the basic secondary school education and possibly pursue
careers of choice at colleges or university.

Proceedings of the Third International Research Conference 26th to 28th October, 2016 489
(iii) Counselling programmes targeting initiated girls should be started in schools to assist the girls to cope
and interact freely with the uninitiated colleagues and teachers so as to curb school dropout and
enhance academic excellence.
(iv) Marriages involving initiated girls should have mentors, whose obligation is to offer guidance,
direction and support in times of sexual difficulties, emotional turmoil and social differences.
(v) There is need for reproductive health education among the Ameru community in order to counter the
misconceptions or superstitions underlying FGM in relation to child birth, sexual relations,
promiscuity and the woman’s physical health.
REFERENCES
Abusharaf, R.M. (2001). Virtuous Cuts: Female Genital Circumcision in an African Ontology.
Differences. 12(1): 112 – 140.
Boyle, H.E. (2005). Female Genital Cutting. Cultural Conflict in the Global Community. Baltimore and
London: The John Hopkins University Press.
Chebet, S. K. (2009). Dynamics of Traditional Practices: The Case of Tumndo Ne Leel: A Comin of Age
Concept among the Kalenjin Community of Kenya. Retrieved on 28th June 2014 from
http://www.international.iupui.edu/kenya
Chege, J. N. (1993). The Politics of Gender and Fertility Regulation in Kenya: A Case Study of the
Igembe. Unpublished Ph.D Thesis. Lacanster University.
Cheserem, S. (2010). Female Genital Mutilation in Kenya – A Literature Review. Retrieved on 24th May
2014 from http://theseus17-kk.lib.helsinki.fi
Huitt, W. (2008). Socioemotional Development. Educational Psychology Interactive. Valdosta,GA:
Valdosta State University
Mwaniki, D. A. (1985). History of Circumcision in Mount Kenya Zone. Unpublished PhD Thesis.
Department of History, Kenyatta University.
Ondieki, A. C. (2010). The Persistence of FGM and its Impact on Women’s Access to Education and
Empowerment:A study of Kuria District, Nyanza Province – Kenya.Unpublished Thesis, Maseno
University.
Otieno, E. (2011, March 11). Unkind Cuts Ensure a Cycle of Poverty. Unlike the Neighbouring Luo, The
Kuria Circumcise Girls. Daily Nation Newspaper.p.8.
Rushwan, H. (2000). Female Circumcision in the Sudan. Prevalence, Complications Attitudes and
Changes. Faculty of Medicine, University of Khartoum Sudan.
Shamble-Ebron D.; Dole, D. andKarikari, A. 2014. Cultural preparation for womanhood in urban african
american girls: Growing Strong Women. Journal of Transcultural Nursing. 6(2):56-61
Sohn, L. (1982). “Protection of Individuals” 32 American Law Review.
Waitley, D. (1996). The New Dynamics of Goal Setting: Flextactics for a Fast Changing Future. New
York: William Morrow and Company.
Young, P. H. (2007). “Social Norms”. Mimeo: Oxford University. ******
KENYA’S PROVERB IN LUBUKUSU AND EKEGUSII LANGUAGES: EMPOWERING OR
DISEMPOWERING FOR WOMEN AND GIRLS
Barasa, M.N. and Opande, I.N.
Kisii University: [email protected], Tel.: 0722 606 101
ABSTRACT
Research about the Kenyan women has primarily been conducted from socio-demographic perspectives.
Such approaches, while important, are not exhaustive. Thus exploring socio-linguistic perspectives are
important to fully understand the place and role of women in the society. Given that proverbs have the
function of legitimizing certain role patterns and preventing those patterns from possibly being
questioned, this study set out to investigate how Lubukusu and EkeGusii proverbs can empower or
disempower women and girls and its impact on the achievement of Millennium Development (MDG)
number three: gender equality. Language defines the position of women and in turn, encapsulates a
society’s thoughts, beliefs and values. The fact that proverbs are part of people’s popular culture which
includes language, it is important to know how these proverbs construct women and girls.

Proceedings of the Third International Research Conference 26th to 28th October, 2016 490
Specifically, the paper examines how proverbs portray women, and effect on gender identity, how the
meanings in the proverbs empower or disempower women and girls and the implications of proverb
messages to achievement of MDGs. Using ethnography, a total of 30 proverbs were collected from five
respondents aged between 60 and 75 years. The proverbs were analysed using the framework for
language dominance by Lakoff, Zimmerman and feminist theories of the Radicals and Critical Discourse
Analysis by Norman Fairclough. The findings indicated women are portrayed as inferior, worthless and
weak are constructed in specific roles as domestic worker, wives and caretaker. Consequently, they are
marginalized, discriminated in issues of decision making, participation, resource distribution and policy
formulation due to the prejudice. Such discriminative proverbs slow the achievement of development
goals. To realize the MDGs, there is need to eliminate or re-conceptualize some of the proverbs which
reinforces gender parity also reform the language to suit the needs of the society.
Keywords: Proverbs, Empowerment, Lubukusu, EkeGusii, MDGs, CDA
INTRODUCTION
During revolutions and periods of social change, the rights and freedoms of the disadvantaged become
particularly critical issues. Women’s rights are also placed high on the global agenda because women are
still fighting for their rights- socially, politically and economically. Women who are excluded from
decision-making within families, communities, and nations are often the very targets of development
programs designed to improve their lives (FIDA, 2006). It is a general concern throughout the world as to
how nations can address the issue of gender inequalities which challenges the achievement of Millennium
Development Goal number three. Debates have been carried out and questions have been posed about the
role of education in promoting gender equality and empowerment of women and girls. Education alone
cannot answer the questions since there are other contributing factors beyond its control such cultural
aspects. Language is one of the major factor since it lacks gender balance. Proverbs are one of language
component which perpetuate gender inequality
Women constitute the majority (51%) of the population in Kenya according to the Statistics Kenya
October 2001 Census and 80 % of who live in rural areas (FIDA, 2006). Women’s responsibilities
include being mothers, wives and home administrators. In these roles, they undertake all domestic duties
including cooking, feeding the family members, keeping the home tidy and above all, childbearing. They
are also responsible for the education of their children, which resonates with Malcolm X’s pithy saying:
‘If you educate a woman, you educate a nation, if you educate a man, you educate an individual’. The
crucial role that women play in their families is summed up in the words: ‘Behind every successful man
there is a woman’. Kolawole (1997:63) cites a similar proverb in Zimbabwe: ‘Musha mukadzi’, which
loosely translated means ‘Behind the successful family there is a woman’ Women constitute half the
world’s population, perform nearly two-thirds of its work hours, receive one-tenth of the world’s income
and own less than one-hundreth of the world’s property.
Language is used to produce and reproduce cultural experiences. As a social and cultural phenomenon, it
is used to communicate about every aspect of cultural experience in a society. This means that language
expresses, embodies and symbolizes cultural reality. As one element of oral literature, proverbs are also
used to channel gender ideology in the society. In Africa, proverbs about men and women have long been
reproduced irrespective of the potential sociological, political, psychological and economic effects which
their utterances cause to the recipients. Further, the cultural representation of women in the many
societies indicated the harmful effects of the meaning of some proverbs. Additionally, in most African
societies, folklore has been a source of propagating gendered ideologies and women have been so
represented as taking secondary roles in society. As such women who are excluded from decision-
making within families, communities, and nations are often the very targets of development programs
designed to improve their lives. Little attention has been paid to the role of proverbs in creating,
sustaining or promoting gender disparities in the society. Previous works on African proverbs tended to
interpret even proverbs about womanhood within their generalized import than within their sexist and
thus ideological import. This study investigates how Lubukusu and EkeGusii proverbs can empower or
disempower women and girls and the impact on the Millennium Development Goals. Africa is a continent
known for its rich oral arts. Proverbs are the most widely and commonly used in the continent’s long-
standing tradition of oral arts. Among such oral arts, the African proverbs have been facilitating the

Proceedings of the Third International Research Conference 26th to 28th October, 2016 491
transmission of knowledge and conventions from generation to generation. However, before proceeding
further, the following is a brief exposition of the culture and background of the Bukusu and Gusii. This
provides an understanding of the role of a Bukusu woman in society. Such understanding will help
explain why women are portrayed so in the Bukusu and Gusii proverbs.
The Bukusu are one of the seventeen sub-nations, or more, that comprise the Baluyia cluster of the
Bantu groups of the East African region (Wasike, 2013). The other Baluyia sub- tribes are: Baragoli,
Batiriki, Bakabaras, Batachoni, Banyore, Bakhayo, Bamarachi, Banyala, Basamia, Babesukha,
Babedakho, Bakisa, Barechea, Batsotso, Bawanga, and Bamarama. Bukusu inhabit parts of Bungoma
district in Western Kenya and parts of Trans-Nzoia District of Rift Valley province. In addition
there are also a number of Bukusu clans in the African. The Abagusii are a Bantu-speaking people
numbering close to 1.9 million and they are the sixth most populous community in Kenya (UNESCO in
Webb and Kembo-Sure 2000). They are settled in the fertile highlands of Kisii, Guucha and Nyamira
districts of Nyanza Province. Nilotic -speaking peoples i.e. Luo, Kipsigis and Maasai surround them.
Proverbs on women are known to be harsh and critical. They are often cited to highlight a negative
quality and to criticise women. Certain proverbs express a deep misogyny. Proverb repertoire of any
language possesses a few that speak ill of women. Using a sample of 100 proverbs, Jayawardena (2014)
examined the representation of women in Sinhala and French proverbs. Specifically, the study addressed
the questions of how are women represented in proverbs in these two cultures, which aspects of their lives
are highlighted, and the differences and the similarities seen in the French and Sinhala proverbs. The
sample proverbs were translated into English in order to facilitate the study. The study findings indicated
that women and family is a theme found in both Sinhala and French proverbs. Moreover, women’s role as
mother and her love and affection towards the children are discussed and much appreciated, especially in
Sinhalese. Certain proverbs look at the relationship between men and women. Often, in these proverbs,
the superiority of men over women is noted. Further similarities were seen in reference to and
comparisons with various animals primarily to stress on character flaws. Additionally, the choice of
animals was not the same in these two languages. In Sinhalese, certain proverbs associate superstition
with women. Comments on qualities such as fidelity, intelligence, and chastity, create a portrait of a
woman that was inferior, weak and mediocre. It is even possible to state that some are quite sexist in their
criticism of women. Several examples also show that women are capable of creating an evil impact on
others. The comparative study brings to light the differences and also the similarities seen in the
representation of proverbs of the two cultures. Further, the study concluded that despite the cultural
differences and the geographical distance, proverbs in these two languages create an overwhelmingly
negative impression of women.
Concerning the position of women in the Bukusu society, Nangendo (1994:129) notes that, “in the Bukusu
society, for instance, when one meets a man and a woman one states that omundu nende omukhasi (“a
person and a woman”). When a man dies, it is stated that “omundu has died” while for a woman,
“omukhasi has died”. The person-hood of a woman is not acknowledged in and of itself without invoking
her gender (Nangendo 1994). That a woman is not omundu is socially accepted in society which reflects
the patriarchal nature of the Bukusu society. The ritual articulates a model of gender relations which is
firmly based on male dominance. As Wagner, (1970:86) observes, “among the abaluhya of Western
province, only men can own land, just as only men can own cattle.” Further, a study by Wasike (2013)
and consequently Maelo (2014) established The Bukusu Nation as a Gendered Site. Using the Khuswala
kumuse (funeral oratory) as a source of data, the study confirmed that the ritual defines the Bukusu nation
through gender. The study further established that the khuswala kumuse ritual takes on a masculine
image in the sense that men occupy central space within the ritual. For example, the ritual is performed by
men for men. Women are pushed to the periphery. Deceased women cannot be performed for neither can
women perform for men (Maelo, 2014). Bukusu funeral oratory genre (otherwise referred to khuswala
kumuse in Lubukusu language) is a cultural discourse that is shaped by masculine nuances and gender
power relations. Khuswala kumuse (sometimes referred to as khusena kumuse), translated as ‘stepping in
the arena’, is a special ritual that is performed to celebrate venerable and successful male elders, from
clans that enjoy respect from other clans for their leadership qualities, upon their death (Wasike, 2013).

Proceedings of the Third International Research Conference 26th to 28th October, 2016 492
Based on this, therefore, women’s participation in the nation building is quite limited. Yet women play an
important role among the Babukusu. They are homemakers, they play an important role in economic
production and socialize the young in the community thus act as repository of value in this patriarchal
society (Maelo, 2014). They are an important catalyst of economic social-cultural change in the society.
This is so because gender relations in any society are the power relations and closely linked to relations of
production. Nangendo (1994:155-156) asserts, “Women played, and still play, a variety of religious
(ritual, ceremonial) roles among the Babukusu. They were shamans, priestesses, mediums, diviners, and
diviners of ritual regalia”. It is a fact that as long as women are pushed to the periphery of social
economic and political progress, the country’s development will remain stifled (Nangendo, 1994). On the
other hand, the active participation of women will result into betterment of social-cultural and
technological take off. In a similar way, Khamala (2009) study on the interaction between gender and
ethnicity in constructing ethnic identities and ethnic conflicts between the Bukusu and the Sabaot
communities revealed that respondents trace their identity through men either husband or the father, and
as such women do not bestow ethnic identity. Further, the study established that among the Bukusu and
the Sabaot communities, political, power, property ownership, property acquisition. Economic roles and
external relations with other identities remain a preserve of men.
A study by Otiso (2016) examined the cultural values and wisdom that are transmitted through EkeGusii
proverbs. Proverbs construct gender besides aligning the gender roles of men and women (Otiso,
2016). Gender construction and gender roles are intertwined since a person’s sex presents the ground for
gendering and assignment of the gender roles. Further, Otiso (2016) established that men and women
knew the societal expectations that were laid out for them and worked towards meeting them. A few
examples of proverbs that present gendering in Ekegusii are presented are for instance, Eero n’
eyabagaka (The sitting room is for men). The proverb asserts that eero (the sitting room) is a preserve of
abagaka (adult men). This is a room that is usually reserved to entertain important guests and it also
serves as the dining room. These functions ensure that it is usually furnished with comfortable chairs. As
such it is also used for holding important meetings such as negotiations or solving conflicts. Since it is not
a taboo for women and young males to sit in the sitting room, the social context reveals that the
designation of the room for men is symbolic. The proverb hints at the roles that men take part in, which
include being the decision makers in the family and taking part in family and clan negotiations. The roles
of men which are implied in the proverb show that women and young males are excluded from certain
roles (Otiso, 2016). Language has also been used to advance subordinate positions for women and girls. A
study examining the linguistic portrayal of the Gusii women (Choti, 1998) concluded that both Ekegusii
usage and form illustrate a gender hierarchy in which Gusii men and women were portrayed as the
privileged and the subjugated categories respectively. In addition, using EkeGusii proverbs, Okindo
(1995) investigated sexism and concluded that Ekegusii proverbs undermine women in general terms. For
instance, achievements are always appended to men and women and girls are restricted to functions such
as housekeeping and home making. Biased portrayal serve to subvert the Gusii girls’ way of thinking and
as a consequence, restrict the choices available for girls, especially in the public domain (Yieke, 2001).
The African oral traditions portray women in general as foolish, weak, jealous, evil, unfaithful,
dependent, frivolous and seductive (Hussein, 2005). The other image of women in African oral traditions
is a symbol of warmth and all-nourishing goodness. The oral traditions cultivate also men’s prerogatives
to the allegiance and subservience of women, and legitimize men to exercise their power over women to
sustain the latter’s subordination and marginality (Hussein, 2004; Oha, 1998). The following stereotypes
of female characteristics and capacities among the Nandi of Kenya show this reality. As reported by
Oboler about two decades ago, among the Nandi, men are believed to be more intelligent than women.
Women are thought particularly to be incapable of foresight and to lack the ability to make and carry
through sensible and realistic plans. For this reason, it is generally agreed that husbands should administer
the family estate and wives for the most part concur with their husbands’ plans. It is commonly claimed
that if a woman tried to manage property she would very likely make a mess of it (Oboler, 1985).
In Africa, gender ideology figures large in proverbs. In order to better understand the gender ideology
loaded in proverbs (and for that matter language in general), it is imperative to ground it within the post-
modern view of language as bearer of the matrix of privilege and domination. The overtly simplistic view

Proceedings of the Third International Research Conference 26th to 28th October, 2016 493
that language is just a means of communication is challenged by the Post-modern thinkers (Giroux,
1997). Language is “constitutive as well as reflective of our place in the political, socioeconomic, racial
and sexual configurations of our existence” (Cohen, 1993: 1). Thus in a gendered society, language is
used to express how groups should behave, and relate to the external world and to each other. Once they
have entered into relationship of dominance and subordination, the social groups make distinctions among
themselves “through forms of signification” (McLaren, 1997: 528). Language offers opportunity to
construct stereotypes of self and others. Dominant groups use their languages to facilitate their oppression
of and aggression or prejudice against those they dominate (Goke-Pariola, 1993; Nwagbara, 2000).
The review of literature generally shows that, in patriarchal societies, language is openly used to
disparage women (Cameron, 1994; Sapiro, 1994; Sen and Grown, 1987). According to Sen and Grown
(1987), proverbs and other nuances of oral literature have been predominantly used by males to denigrate
women’s physical, mental and social weaknesses. While it is true that groups that hold the secondary
position in a society predictably suffer from linguistic disparagement imposed by the other groups that
hold a relatively better position (Leith, 1987), studies have shown that sexist proverbs are not used
exclusively to denigrate women (Mbiti, 1988; Oha, 1998). It is, therefore, naive to rate a proverb about
womanhood as disparaging just by looking at its surface meaning.
Theoretical Backgrounds
The frequent reference to masculinity as a discourse of power in this study is largely informed by Michel
Foucault’s definition of “discourse as a system of representation” and exposition of power. Indeed as
Foucault argues, discourse in our current context is understood as “a group of statements which provides
a language for talking about; a way of representing the knowledge about a particular topic at a particular
historical moment” (Foucault, 1979; 1977; Hall, 2004: 72). He further posits that all discourse seeks to
attain power in order to control and manipulate it for the maintenance of cultural and ideological gains
(1979:94; 1977). From Foucault’s standpoint it is argued, in this study, that power is not the ‘privilege’ of
a dominant group (men) who exercise it upon the dominated (women). Rather it is a product of the
“divisions, inequalities and disequilibriums which occur in human relationships” (1979:94) and a
“discourse about the production of knowledge through language. since all social practices entail meaning
and meanings shape and influence what we do” (Hall, 1992: 291).
This study also adopted the framework for language dominance by Lakoff, Zimmerman and feminist
theories of the Radicals. They are in agreement that language patterns are interpreted as manifestation of
patriarchal social order and it institutionalizes the male dominance over women. Different words and
proverbs describe men and women in a different way though they refer to same behaviour eg growing ball
under skirt for a woman who shows interest in power position while no equivalent is there for men people
just praise them (Zimmerman, 1975). It is the same in proverbs; they function as instruction manuals for
warning young women/girls, of powerful assertiveness but encourage the same in men and boys. Proverbs
mirrors society expectations of different sexes such, also used by men to exercise their physical power
while describe women’s mental and social weakness (Lakoff, 1975). Further, proverbs portray society in
men’s perspective. Few proverbs describe women in desirable and favourable manner. Patriarchy creates
an ideology which defines men as natural owners of intellect, think rationally and have power to rule.
Women regarded naturally as submissive, passive and willing to be led. Language is openly used to
discriminate, oppress and subordinate women. This may hinder realization of meeting development al
goals since there is resistance.
The study also adopted the Feminist Critical Discourse Analysis (FCDA) approach. Society is saddled
with many social problems including dominance and power abuse. These are enacted and reproduced in
discourse in ways that may not always be obvious (see Fairclough, 1992; Fairclough and Wodak, 1997;
Van Dijk, 2001). Lazar (2007: 141), for instance, argues from a Feminist Critical Discourse Analytical
(FCDA) perspective that ‘issues of gender, power, and ideology have become increasingly more complex
and subtle’ in present times. It can be argued that proverbs, by their nature, present more complex and
subtle understandings. That is, by their opaque and sometimes ambiguous meanings, proverbs often hide
their intended meanings, thereby making their ideological underpinnings subtle, but quite pervasive.
Proverbs can therefore serve to sustain (hierarchically) gendered social arrangements, in which the

Proceedings of the Third International Research Conference 26th to 28th October, 2016 494
woman is disadvantaged, and these may be presented in very subtle ways. The work of FCDA is to
critique such unequal gender relations. It is in this light that we find it a useful analytical approach for this
study. FCDA may be considered as a subset of Critical Discourse Analysis (CDA) because, in simple
terms, FCDA is doing CDA from a feminist perspective. We shall therefore briefly outline some major
tenets of CDA which are also the building blocks for FCDA.
In critiquing gender inequalities, which FCDA seeks to do, two concepts that are useful for consideration
in patriarchal societies are hegemonic masculinity and femininity. Patriarchal societies are noted for
promoting male rule and female subordination, i.e. the domination of men over women. Men are seen as
authority figures who hold the power, and this is seen as legitimate or largely inherent (Connell, 1987,
1995). Deeply entrenched in patriarchal societies are notions of hegemonic masculinity and femininity.
According to Connell (1995), hegemonic masculinity is: the configuration of gender practice which
embodies the currently accepted answer to the problem of the legitimacy of patriarchy, which guarantees
(or is taken to guarantee) the dominant position of men and the subordination of women.
METHODOLOGY
Two instruments were employed to collect data for the study. These two folkloric data collecting tools
were interview and document analysis. By these two tools 150 proverbs were collected. Interview was
carried out with selected community elders who were recommended by the local community on the bases
of their deep knowledge of the socio-cultural context and oral tradition of the society. Furthermore, most
of the interviews held with the key informants were recorded using tape-recorder. In the past, there was a
tendency to examine African proverbs that talk exclusively about womanhood to understand the role and
position of women in Africa (Mbiti, 1988). In this study, proverbs about manhood were included for a
better analysis of the relationship between the sexes.
The study followed qualitative approaches in its analysis of proverbs. Information is analyzed in a
descriptive manner since it captures peoples experiences (Cresswel, 1998). During data analysis, the
researcher wrote up the notes and transcriptions of recorded materials following the data collection
process. Then, in order to attain the specified research objectives, the collected data were organized based
on the purpose of the study suitable for analysis and discussion. In part, this study adopted Hussein (2005)
method of data analysis. Any study on African proverbs should start from the complex cultural, social and
psychological factors that influence the production and consumption of the proverbs (Hussein (2005). For
example, the Bukusu proverb, “ Olia sikekhe okhasimbwa”- Eat little so that you don’t overfeed- may be
used to warn or inform a person who is greedy. This is an instantial meaning of the proverb. The same
proverb could be used to socialize people in general so that they would know how to carry themselves
around food. This means that the domain of discourse affects the meaning of a proverb.
As stated by other researchers (Paltridge, 1994; Tyler, 1994), the structural simplicity of a text (proverb)
may not guarantee increased comprehensibility. The comprehension of the proverb should take into
account the historical and cultural contexts within which they were structured. For example, to
comprehend the meaning of the Bukusu proverb, “Etiba seulila chichana” one should have background
knowledge of Bukusu culture about the meaning alluded to the proverb. One has to search for the
interconnectedness between language and culture. These extra textual factors may include context of
situation, discourse and the semiotic occurrence of the proverb. Since a single proverb can have divergent
meanings used under varied circumstances, it is difficult to sharply distribute individual proverbs across
distinct themes. Thus in this study, content analysis and hermeneutics as data analysis methods were used.
Hermeneutic interpretative orientation is a philosophy of human understanding and interpretation of a text
(Guba, and Lincoln, 1994)). The interpretative orientation used entails that texts reveal their significance
not on the surface of images and representation but in the complex ways that produce, transform and
shape meaning structure. Three things were considered: Interpreting the general meaning embedded
within proverbs, explaining the social contexts through which the proverb is used and its underlying
meaning and analysing the implication of the proverb. Since the participants were interviewed in
Lubukusu and EkeGusii languages, the transcribed interviews were translated in to English. The next step
was reading the transcripts and field notes so as to clutch the themes and patterns of the data.

Proceedings of the Third International Research Conference 26th to 28th October, 2016 495
The ethnographic technique of cultural domain analysis, which considers text as an indicator of human
experience (Tesch, 1990) was used to guide the thematic analysis of the proverbs. Each proverb was
characterized as a unit of analysis that could have one or more associated themes. After an initial review
of all 150 proverbs, a subset of female-related themes were manually extracted from the larger collection
by the researcher, using a filter of female-related keywords such as woman, child, work, lady, girl, birth,
mother, marry, family, maternal, and derivatives thereof (e.g., hen, cow, womanhood, mother*, etc.) for
both literal and manifest proverb translations. A total sample of 38 proverbs were thus analysed. After a
thorough reading of the raw data, and the transcripts of the field notes, the researcher categorized or
coded the data in to manageable and meaningful sets of themes.
FINDINGS AND DISCUSSION
A. Proverbs that Portray Women as Inferior, Worthless and Weak
1. Omwimbi sakeleka enungo tawe. (A short one does not measure the firewood store). Bukusu
2. Omwimbi akhila omulisi. (A short one is better than the one who cries). Bukusu
3. Lunyasi lulala nelurura khunju sesulula tawe. (A house does not leak because of a blade of grass that
has been removed).Bukusu
4. Obea mao okhabea rarao tawe. (Cheat your mother and not your father).-Bukusu
5. Ekhasi setilanga khwitakho tawe. (A first cousin does not inherit another first cousin’s wife.) Bukusu.
6. Omukhasi sakambila omusecha ta. (A wife does not reprimand/advice a husband). Bukusu
7. Okhwibulilanga akhulanga omukhasi. Bukusu (He who sires children for you will call you a woman).
8. Onabaiseke bange nkerandi kiambere botaka botakoera-Gusii (He who has many daughters is a gourd
of milk that will never go dry).
9. Ngongo machaywa imbamura etabwati – Gusii (For a region to be disrespected, then it is because of
lack of boys or men).
10. Tangori monyuomi nkogogochwa, otaserie monto ntare ntorobi –Gusii (I wish I marry a husband who
will not see small mistakes to make me go back to my home to get a reconciliation goat).
Interpretation
In proverbs 1 and 2, women are portrayed as short which is an image that indicates lack of intellect. This
portrayal confirms Hussein (2005) assertion that in most African societies, women are perceived as
foolish by their male counterparts. Among virtues intelligence is not a quality sought after in a woman in
Bukusu society. They are also portrayed as childish due to their crying nature. In proverb 3, women are
correlated to a blade of grass, an image which shows that they are worthless. The house in this case
correlates with the image of the man. The import of this proverb also reveals the practice of polygamy.
Proverb 4 shows the high place of men and the low place for women as indicated by the fact that children
should cheat their mothers and not fathers. In proverb 5, women are portrayed as objects open for
inheritance whenever they are widowed. This view is in line with Khamala (2009) and Oboler (1995)
studies which indicated that identity in most African societies is traced to male lineage and as such
property is managed by men. In proverb 6, women are considered inferior and weak to men and thus
cannot be the head of families but can only bring wealth to the family when they get married (Proverb 8).
The discursive implication of proverb 8 is that women are perceived as mere objects of creating wealth
for men. The import of proverb 7 is that women are viewed from the perspective of child-bearers which is
a secondary role in the society. The discursive use of proverb 9 is to openly discriminate against women
as weak and worthless because they cannot take charge of the security and image of the community. For
this reason a man who is barren is looked down upon as a woman in the sense that manhood is measured
by the ability to sire children. In proverb 10, Women are constructed as children who always commit
foolish mistakes and are likely to be punished by their husbands for such mistakes. These results also
confirm Maelo (2014) findings that women in Bukusu society occupy inferior position.
Implications to MDGs
In Bukusu and Gusii societies, some proverbs are used to discursively initiate men to suppress and control
women. It is viewed that becoming careless towards women and allowing them some sort of freedom is
hurtful. Hence, the proverbs above have assumed that every activity of a woman is fully under control of
her husband. Men are described as hosts and shields of women. Moreover, the proverbs instruct husbands
not to fear their wives, for if they do, they may not get full services from them. The society teaches such

Proceedings of the Third International Research Conference 26th to 28th October, 2016 496
proverbs to young children in the Bukusu and Gusii society without questioning or considering the silent
message or impact it causes both to boys/girls. The young people internalize them and bring about the
stereotypes. This may kill the spirit of young/ women girls who may wish to engage in challenging tasks
such as purchase of property, own property, consult and negotiate with husbands on family issues.
Consequently, women will construct their femininity on inferiority basis. This may impact negatively on
the achievement of gender parity in the society. Such proverbs should be abandoned because they
brainwash women and girls. The women are thus marginalized in the issues of decision making based on
the stereotypes portrayed in the proverbs. People blame women for lack of authority and being indecisive
instead of looking at structures which have been put in place that nurture and perpetuate the perceived
weak behaviour in women.
Women in Specific Roles:
B. The proverbs refer to women as domestic workers, wives and caregivers
11. Okhakhulelela akhupa bukumba-Bukusu (The one who does not take care of your children will make
you barren).
12. Omokungu siomiasiomia ng’ai akomanya bwarugeirwe gose mboke gose mbwa mwana? Gusii. (How
will a wife /woman who roams from place to place know where the ugali2 has been cooked and
whether it is just a little meant for the child?)
13. Mao owowasio sakhusinga wanoka ta. (Another person’s mother cannot wash you clean). Bukusu
14. Omwana sanuna lituru lia mawe omukekhe maawe omwene nasilio tawe. (A child does not breastfeed
from a step mother if its mother is still alive.)- Bukusu.
15. Owonia owe likonjo okhaonia owenjala. (Help a man who is hurt after war but not the one who is
lazy). Bukusu.
16. Omusani wa lebe khulia. (A strong young man is one who feeds well).
17. Okoibora nokuya gwakorete omokungu monyaka ntin’gana-Gusii (Giving birth is good because it
made the despised wife/woman to be a queen
18. Totogia moiseke kieni, motogie mwana – Gusii. (Never praise a girl for her beauty, but rather for
giving birth).
19. Basacha mbaniberani, ko’ nabakungu mbaiborerani. Gusii ( Men help fellow men in creating wealth
as women help fellow women in begetting children.)
20. Mokungu ngekori, tokomanya buya bwaye otaraikaransa nse (EkeGusii Proverb).A woman is like
one’s bottom; you will not know its importance until when you sit down.
Interpretation
In both Bukusu and Gusii societies, during ceremonies such as marriage, initiation, counselling, solving
conflicts, women and girls are taught the role that a wife is expected to do in caring and securing the
marriage. Women have been inculcated into the role of being mothers. The term omokungu, in EkeGusii,
which refers to a wife/woman, is derived from the verb gokunga, which means to take care of
whereas the term ‘monyaka’ in EkeGusii literally translates to a person of loose morals, but it can also
refer to anyone who is not respected in the society (Otiso, 2016). A good wife is therefore known by her
ability to give birth, bring up her family and take good care of the husband (see proverb 11, 12, 15, 17,
and18). Additionally, women are not of any value but for use by men “when they are sitting’ in other
words they are there to provide comfort to men and boys (proverb 19). This is an indication that women
are tools by which men use to realise their desires and goals. The primary concern of women is therefore
marriage. Another role that presents the woman in a negative manner is that of the stepmother. More so, a
similar import is illustrated in proverb 13 and 14 criticise her miserliness and evil nature. However, the
same proverb reveals the contrary. As such women are portrayed as evil creatures who cannot tolerate
other women’s children. This perception of women is in tandem with Jayawardena (2014) study findings
which showed that generally proverbs created a negative image of women. During times of wars, it was
men who went out to fight and not women. For this reason, proverb 15 indicates that the role of women
was purely nursing: nursing children, husbands and those injured during wars. Lastly, proverb 16 shows
that the role of women and girls is to cook food for the men and boys in the society. These findings are in
agreement with Connel (1995) view of hegemonic masculinity which guarantees the dominant position of
men and the subordination of women.

Proceedings of the Third International Research Conference 26th to 28th October, 2016 497
Implications to MDGs
Society justifies inequalities by finding defects in the victim rather than looking at contributing factors.eg
social and economic. Consequently, women and girls bring about the stereotypes by believing that they
are evil and useless. The women are thus a subordinated group which has resigned to their secondary role
as mothers and care givers. They have thus been nurtured as dependents and therefore not empowered. In
the society, patriarchy, defines the secondary role of women whose very existence depends on marriage,
producing children and caring for the husband. This portrays a state of male dominance over women. This
being the case, girls will not see the reason of getting educated to take up challenging tasks because they
already believe that their destiny as women is mothering, nursing and child bearing. Such proverbs inspire
men to subdue women and so should be abandoned.
C. Proverbs that Oppresses and Marginalize Women
21. Okhayiya khubalebe nga namulekhwa tawe. Bukusu (Do not wander about among the relatives like a
widow).
22. Namulekhwa ndikhola endie? Bukusu. (Being a helpless widow, what shall I do?)
23. Eyapa nabulobe elipa nabukelema. Bukusu. (The cane that beat the send away wife will also beat the
incoming).
24. Omukhasi nakhulobile akhuamba liloko. Bukusu (When a woman dislikes you she accuses you of
witchcraft). Bukusu
25. Nisio okisa omusecha wowo olisilia ne chimbeba. Bukusu (Whatever you hide away from your
husband you will share with rats).
26. Omwana wesecha sikolonjo silinda ekunda.Bukusu (A man is he custodian of the land).
27. Omusoleli omulayi ekofia ya rarawe. Bukusu (A boy’s good conduct earns his father respect and
praise).
28. Embwa ebukulanga khochochomala kwa mawe. Bukusu (A puppy/dog squats like its mother).
29. Etagweti engina ekegwa ese gose ngina koro ya nse. Gusii (If it does not take after the mother or the
father, it will take after the grandmother).
30. Esese eaberi n’yarusetie entwoni Bogere. Gusii. (A female dog made the male dog come all the way
from Luo land
31. Omokungu omuya mbokano botingire. Gusii. (A good woman is a well-tuned lyre.
32. Abakungu abaya nyakomogani mbari getaa ki’amarura amasangi nguranguera. Gusii. (Good women
do not speak foul words, neither are they found in adultery).
Interpretation
In the Bukusu society, namulekhwa is a noun which literary means “the one who has been left by the
husband i.e a widow.” It is therefore pejoratively used and such women are usually discriminated against
in the Bukusu society on grounds that they are widowed and therefore they cannot even cook ugali for
another woman’s husband nor sit at the fire stones in another woman’s kitchen. The import in proverbs
21 and 22 is that a husbandless woman is a helpless free woman exploited by any man in the society. The
implication is that men are the sole providers of the families and without them, women become useless
and even lose respect from fellow women and men. This view confirms Nangendo (1994) position that a
woman is a nonentity, a viewpoint which is socially accepted in the Bukusu society. Domestic violence
and polygamy are also evidenced in proverb 21 where husbands batter their wives, send them away from
their matrimonial homes and marry other wives who are also not spared from the beating. A real man is
supposed to have more than one wife. Men control women through battering and polygamy, a situation
already observed by KDHS (2014) that forty five (45 %) of women experience physical violence.
A Lubukusu proverb that makes comparison between the men and the women and the boys and the girls
points out the attributes each must have. For a man /boy it is the hat (ekofia) (see proverb 27) which
means “intelligence and skills” required for preparation for leadership and inheritance (sikolonjo silinda
ekunda) (see proverb 26), an apparent contrast in the qualities expected from women and girls (see
Khamala 2009; and Oboler, 1995); evil (proverb 24), selfish and untrustworthy (proverb 25) and
prostitutes (proverb 28, 29, 30). The act of a woman sharing food with rats indicate shows how women
are held in low esteem in the society. They are paupers without men. In the Bukusu and Gusii culture,
‘liloko’ (also witchcraft) is a superstitious concept though believed by many. Therefore, when a woman a

Proceedings of the Third International Research Conference 26th to 28th October, 2016 498
husband divorces a wife, the wife will bewitch him so that he does not marry another woman or even sire
children with the second wife. These results are similar to Maelo (2014) study findings which revealed
the secondary position that women hold in society. In proverb 31, a woman is likened to a lyre, an image
presents the marginalisation that women suffer in the Gusii society. They are seen as a means for
fulfilling men’s joy and making them comfortable; Women’s joy is of no importance to men. This
proverb is further complemented by proverb 32 which emphasises a well-groomed woman. Women
should not speak foul words nor are they allowed to commit adultery. For men however, this is not
emphasised, an indication that either they are responsible or are not bound by such societal rules.
Implications to MDGs
The proverbs reveal hegemonic masculinity which encourages control and oppression of women.
Consequently, the socialization processes reflect men as superior and entitled to unjust behaviour and
victimize women. These proverbs promote differential power relations between men and women and
encourage polygamy. Such proverbs also deny women rights over their own health issues in this era of
HIV/AIDS. Therefore, Women’s’ dignity is compromised with the use of these proverbs. In this case,
Millennium goal three of Gender equality cannot be achieved in this situation. If schools and society
teach these proverbs children will grow up as perpetrators of issues of inequalities since education is a
lifelong experience.
D. Proverbs that Silence Women
33. Owaleka owamurera eyumba ne bakeni. Bukusu. (The wife who despised her husband was stranded
with visitors).
34. Kamani komweya balebe. Bukusu (The strength of a bride/newly married wife is her kinsfolk).
35. Chimoni chomweya sechibona ta. Bukusu. (A bride’s eyes pretend not to have seen).
36. Omukhasi sakambila omusecha ta. Bukusu. (A wife does not reprimand/advice a husband).
37. Riomana ria ‘mokungu tiriana koirwa ‘tureti. Gusii. (A woman’s misdemeanour is never presented
before the elders.
38. Otagoita mokungu nkenoro atagese Gusii. (He who does not beat his wife will reap contempt).
Interpretation Women are cautioned against ignoring and being rude to their husbands. They do so only at their own
peril. Women cannot succeed in any endeavour they undertake without the blessings of men (see proverb
33). Proverb 34 and 35 construct women as the suppressed group which should pretend to be dumb and
deaf. The society expects a woman to be patient and submissive even in times of problems. Language is
used to warn women and girls of powerful assertiveness as illustrated in proverb 36 where women take
the secondary role of listeners and not participators in talks (Zimmerman, 1975; Lakoff, 1995). Women
are also constructed as children and are therefore supposed to be controlled by men (see Proverb 37). A
man would be regarded useless if he reported his wife’s misbehaviour to elders and for this reason men
were supposed to discipline their wives on their own using whatever means they themselves deemed
appropriate (proverb 38). Through fear, women are silenced in the society. This construction of women
confirms Connel (1995) view of hegemonic masculinity. In all these proverbs, the indication is that
proverbs are used to denigrate women’s physical, mental and social weaknesses (Grown, 1987). This is
also in agreement with the findings of FIDA (2006) that women face discrimination with respect to social
and financial right.
Implications to MDGs
Men and boys will interpret theses proverbs for their own advantage and so exercise dominance over
women and girls in the society. Such proverbs also perpetuate passiveness in women. This brings unequal
empowerment between men/boys and women /girls. The speaking skills of women are suppressed and
this could explain why in Bukusu and Gusii societies and Kenya at large, women parliamentarians are
very few.
CONCLUSION
This paper reveals that dominance and power abuse is reproduced in discourse (Fairclough, 1992;
Fairclough and Wodak, 1997, van Dijk, 2001). Consequently, in patriarchal societies, language is openly

Proceedings of the Third International Research Conference 26th to 28th October, 2016 499
used to disparage women (Cameron, 1994; Sapiro, 1994). The analysis of Lubukusu and Gusii proverbs
has revealed gender gaps in issues of women in the use of proverbs. Since women hold secondary
position in society, they suffer from linguistic disparagement imposed by men who dominate them (Leith,
1987). In both the two societies women are invisible and lack empowerment. Discriminative proverbs will
slow the achievement of development goals. It has to be noted that socialization, particularly, language
use, plays an important role. Such issues of gender parity should be addressed at all levels of leadership.
This can only be achieved only if discrimination, oppression, subornation, invisibility and
dependence of women to men are addressed. The society should endeavour to change the socialisation
process and by doing so, bring about change of the mind-set. The paper thus recommends that there is
need to eliminate or re-conceptualize some of the proverbs which reinforce gender parity and also reform
the language to suit need of the society.
ACKNOWLEDGMENTS
We are grateful to the following for supplying us with an insight in to the proverbs used in this paper and
also the proverbs in their native forms and the cultural meanings. i) Mr. Raymond Makhanu Barasa Elder,
Bukusu Ethnic group, Kimalewa Location, Bungoma County, Kenya, ii) Ms. Flora Gweyani Obagu,
Woman Elder, Bukusu Ethnic Group, Namawanga village, Bungoma County, iii) Ms. Teresia Nyakerairo
Nyabwobi, Woman Elder, Gusii Ethnic group, Nyamusi Village, Nyamira County, iv) Mr. Christopher
Okemwa, Elder, Gusii Ethnic Group, Kisii County, v) Josephine Kerubo, Women Elder, Gusii Ethnic
Group, Nyosia Village
REFERENCES
Cameron, D. 1994b. Problems of sexist and non-sexist language. In (J. Sunderland, ed.) Exploring
Gender: Questions and Implications for English Language Education, pp. 26-33. Prentice-Hall,
New York.
Choti, J.N. (1998) Language and Hierarchy: The Linguistic Portrayal of the Gusii Woman.Unpublished
Masters Thesis, Egerton University, Njoro.
Cohen, S.D. 1993. Women and Discourse in the Fiction of Marguerite Duras. The Macmillan Press,
Hampshire and London.
Connell R.W. 1987. Gender and Power: Society, the Person and Sexual Politics. Cambridge: Polity Press.
Connell, R.W. (1995) Masculinities. Cambridge: Polity Press.
Fairclough, N and Wodak, R. (1997) Critical discourse analysis. In: Van Dijk TA (ed.) Discourse Studies:
A Multidisciplinary Introduction. London: SAGE, pp. 258–284.
Federation of Women Lawyers (FIDA) Report of a Baseline Survey on the Level of Awareness and
Impact of CEDAW ON Rural Women in Kenya. Nairobi. 2006.
Foucault, M. (1979). History of Sexuality. Vol. 1 Trans. by Robert Hurley. London: Lane.
Foucault, M. (1977). Discipline and Punish. London: Travistock.
Giroux, H.A. 1997. Pedagogy and the Politics of Hope: Theory, Culture and Schooling.Westview Press,
Oxford.
Goke-Pariola, A. 1993. Language and symbolic power: Bourdieu and the legacy of Euro- American
colonialism in an African society. Language and Communication, 13(3): 219-234.
Guba, E.G. and Lincoln, Y.S. 1994 Competing paradigms sin qualitative research, in Handbook of
Qualitative Research, Denzin, N. and Lincoln, Y.S. (eds.) (Sage Publications, CA) p. 105-17.
Hall, S. (2004) “Foucault: Power, Knowledge and Discourse”, in Taylor and Simyon Yates (Eds)
Discourse, Theory and Practice: A reader. London: Sage Publications. 98- 121
Hall, S. (1992). “The west and the rest” in initials needed Hall, S. et al (eds.)Formulations of Modernity.
Cambridge: Polity Press. pp 122- 143
Hussein, W. (2005). The Social and Ethno-Cultural Construction of Masculinity and Femininity in
African Proverbs. African Study Monographs, 26(2): 59-87,
Hussein, J.W. 2004. A cultural representation of women in the Oromo society. African Study
Monographs, 25(3): 103-147.
Jayawardena H. (2014). Representation of women in Sinhala and French Proverbs. International Research
Sessions, Vol. 18
Khamala, G. (2009). Gender Dimension of Ethnic Identities and Conflicts in Kenya: The Case of Bukusu
and Saboat Communities. Unpublished Masters Thesis. Kenyatta University.

Proceedings of the Third International Research Conference 26th to 28th October, 2016 500
Kolawole, M.E. 1997. Womanism and African consciousness. Trenton: Africa. World Press Inc.
Maelo, M. (2014). The Manifestation of Nationalism in Bukusu Funeral Oratory. International Journal of
Education Research. Vol. 2 (11): 333-343.
Mbiti, J. 1988. The role of women in African traditional religion. Cahiers des Religions Africaines, 22:
69-82.
Nangendo, S. M. (1994). “Daughters of Clay, Women of the Farm; Women, Agricultural Economic
Development and Ceramic Production in Bungoma District, Western Province in Kenya”.
Unpublished PhD thesis, Bryn Mawr College.
Nwagbara, A.U. 2000. Women and the dialectic of war: A comparative study of portrayal of women in
the Nigerian civil war fiction: A collection of papers from CODESRIA Gender Institute 1997. In
(F. Oyekanmi, ed.) Men, Women and Violence, pp. 125-152. CODES- RIA, Dakar.
Lakoff, R. (1975). Language and Women’s Place. New York: Harper and Row.
McLaren, P. 1997. Multiculturalism and the postmodern critique: Toward a pedagogy of resistance and
transformation. In (A.H. Halsey, H. Lauder, P. Brown and A.S. Wells, eds.) Education, Culture,
Economy, and Society, pp. 520-540. Oxford University Press, Ox- ford.
Lazar MM (2007) Feminist critical discourse analysis: Articulating a feminist discourse praxis. Critical
Discourse Studies 4(2): 141–164.
Leith, D. 1987. The vocabulary of power, rank and status. In (B.M. Mayor and K. Pugh, eds.) Language,
Communication and Education, pp. 147-152. Croom Helm, London and Syd- ney.
Oboler, R.S. 1985. Women, Power, and Economic Change: The Nandi of Kenya. Stanford University
Press, Stanford.
Oha, O. 1998. The semantics of female devaluation in Igbo proverbs. African Study Mono- graphs, 19
(2): 87-102.
Okindo, A (1995) Sura ya Mwanamke katika Methali za Ekegusii: Unpublished Masters Thesis: Egerton
University Njoro.
Otiso, Z. (2016). Examining the Indigenous wisdom in EkeGusii Proverbs. The University of Nairobi
Journal of Language and Linguistics Vol 5: 116-129.
Paltridge, B. 1994. Genre analysis and the identification of textual boundaries. Applied Lin- guistics, 15
(3): 288-299.
Sapiro, V. 1994. Women in American Society: An Introduction to Women’s Studies (3rded.).Mayfield
Publishing, London.
Sen, G. and C. Grown. 1987. Development, Crises and Alternative Views: Third World Women
Perspectives. Earthscan Publications, London.
Tesch, R. (1990). Qualitative Research: Analysis Types and Software Tools. Bristol, PA: Falmer Press.
Tyler, A. 1994. The role of syntactic structure in discourse structure: Signalling logical and prominence
relations. Applied Linguistics, 15 (3): 243-262.
Van Dijk TA (2001) Critical discourse analysis. In: Tannen D, Schiffrin D and Hamilton H (eds)
Handbook of Discourse Analysis. Oxford: Blackwell, pp. 352–371.
Wagner, G. (1970). The Bantu of Western Kenya, Vol. 1, London: Oxford University Press.
Wasike, J. C. (2013). Gender Relations in Manguliechi’s Babukusu After-Burial Oratory Performance
(Khuswala Kumuse). Unpublished PhD Dissertation. Witwatersrand University. Johannesburg.
Webb, V. and Kembo-Sure 2000. African Voices: An Introduction the Languages and Lin- guistics of
Africa. Oxford University Press – Southern Africa. Cape Town.
Yieke, F. (2001) “Gender as a Social Cultural Construct”. A Sociolinguistic Perspective.Journal of
Cultural Studies Vol. 3, No.2, 2001.
Zimmerman, Don/West, Candice: "Sex Roles, Interruptions and Silences in Conversations". In: Thorne,
Barrie/Henley, Nancy (eds.) (1975): Language and Sex: Difference and Dominance. Rowley;
MA: 105-129. Sex Roles, Interruptions and Silences in Conversations". In: Thorne,
Barrie/Henley, Nancy (eds.) (1975): Language and Sex: Difference and Dominance. Rowley;
MA: 105-129. ******
Proceedings of the Third International Research Conference 26th to 28th October, 2016 501
EFFECTS OF IMPRISONMENT ON INTERPERSONAL RELATIONSHIPS AMONG FEMALE
INMATES IN SELECTED PRISONS IN KENYA
Kamoyo, J.M. and Mburugu, B.M.
Department of Education, Chuka University, P. O. Box 109-60400, Chuka, Kenya Corresponding Author: [email protected], Tel.: 0725539168
ABSTRACT
This study explored the relationship between imprisonment and interpersonal relationship among female
inmates in selected prisons in Kenya. The study employed a descriptive survey research design. A total of
295 respondents formed the survey sample. The sample comprised of 291 female inmates’ and 4 prison
staff. Simple random sampling and purposive sampling methods were used to select the respondents. The
study utilized questionnaires, interview schedules and an observation guide as instruments for data
collection. Piloting was conducted in one selected prison to enable the researcher to improve on the
reliability and validity of the research instruments. The reliability of the research instruments was
estimated using Cronbach Alpha Coefficient. The instruments yielded a reliability coefficient of 0.857
which was considered appropriate for the study. Descriptive and inferential statistics were used for data
analysis. The study established that there was a statistically significant relationship between imprisonment
and interpersonal relationship among female inmates in Kenyan prisons.
Keywords: Imprisonment, Interpersonal Relationships, Female Inmates
INTRODUCTION Interpersonal relationship is the ability to create good relationships between a person and others through
interaction. Contact with other human beings is so important that when a person is deprived of it for long
durations, depression may set in, self-doubt could surface and one may find it difficult to manage even the
basics of daily life. Large prison populations mean that prisoners are in constant contact with one another,
making privacy rare and interpersonal contact unavoidable. Researchers have demonstrated that such
environments are prone to more frequent interpersonal conflicts, aggression, and even violence (Gaes,
1985; Lawrence and Andrews, 2004). However, it is important to acknowledge that inmates’ personal
relationships and interactions with others are complex and are not always negative. While fights and other
conflicts do occur in prisons, these are not the only social contacts among inmates.
Some inmates have reported positive interactions with peers, staff and significant others (Propper, 1989).
Although more positive relationships may also influence inmates’ prison experiences, the link between
inmates’ friendships or positive social experiences and imprisonment are rarely studied. In order for the
prison authorities to conceptualize the interaction processes in prisons; administrators need to understand
the entire context in which inmates interact. This points to the significance of understanding how social
interactions, both positive and negative, may influence inmates’ behaviour. Therefore, it is essential to
study inmates’ interpersonal interactions with one another, staff, family members and friends during
visitation and how these interactions influence inmates’ behaviour.
In contrast to numerous studies of male inmates’ social relationships, researchers have scarcely examined
female inmates’ close interpersonal relationships. Since prisons were not established with female inmates
in mind, little attention has been given to these institutions in terms of how imprisonment affects the
female inmates interactions with peers, staff and significant others. Incarcerated women are reported to
participate in positive relationships, such as supportive homosexual and false family relationships
(Giallombardo, 1966; Severance, 2005).
Scholars have argued that female inmates’ interpersonal relationships may be changing and that ignoring
the change is an important omission. Thus, there is need for future researchers to examine female
inmates’ interpersonal relationships in the context of prison environment (Greer, 2000). In spite of
numerous reforms initiated by the Kenyan government in the country’s prisons, the level of interaction
among inmates, family members, friends and significant others has been hindered by the unfriendly
prison environment and the location of most of the female prisons. This study investigated the effects of
imprisonment on interpersonal relationships among female inmates in selected Kenyan prisons.

Proceedings of the Third International Research Conference 26th to 28th October, 2016 502
Objectives
The objective of this study was to examine the effects of imprisonment on interpersonal relationships
among female inmates in selected Kenyan prisons.
METHODOLOGY
The study employed the descriptive survey research design. A sample of 291 female inmates and 4 prison
wardens from 4 selected prisons participated in the study. The selection of the prisons and inmates who
participated in the study was done using simple random sampling. The inmates were distributed among
the 4 selected prisons using proportionate sampling. The prison wardens were purposefully selected. The
total number of study participants was 295. Data from the sampled subjects was collected by use of
questionnaires, interview guides and observation schedules. The questionnaires were used to collect data
from the respondents. The rationale of using questionnaires is due to the large numbers of inmates. The
Interview schedules were used to gather in depth information from the prison wardens.
Observation schedules were used to supplement the information gathered from the respondents through
questionnaire and interview guides. A pilot study was conducted in one prison with similar characteristics
but not included in the study prisons. The data was used to compute the reliability of the instruments
using Cronbach’s Alpha Coefficient. The items were considered reliable if they yielded a reliability
coefficient of 0.07 and above. In this study the reliability coefficient was 0.857. Quantitative data was
coded, entered into the computer and analyzed by use of inferential and descriptive statistics with the aid
of the Statistical Package for Social Sciences (SPSS) version 19.0. Qualitative analysis was done by
determining patterns and trends from the information gathered through interviews and observation
methods. Eventually, the data analysis results were represented on tables and by prose narrations.
RESULTS
The study was set to test whether there were significant differences between imprisonment and depression
among female inmates in selected prisons in Kenya. Information was obtained from 291 female inmates
and 4 prison wardens and the data analysis generated the following results:
Demographic Characteristics of the Respondents
Majority of the inmates comprising 46.4% were below 30 years old while 45.6% were aged between 31
years and 50 years. A large proportion of the female inmates constituting 48.4% were single, 30% were
married, 9.2% were widowed while 12.4% were divorced. Most of the female inmates (54.8%) had
between 1 to 3 children, 34.8% had 4 or more children while 10.4% were childfree. Regarding the female
inmates’ highest level of education, 55% had primary school education certificates, 29.3% had secondary
school education certificates, 3.2% had bachelor’s degree, 2% had attended college while 10.4% had
never attended school.
Majority of the inmates 44.8% had served less than one year in prison, 20.4% had served between 1 and 2
years, 16.4% had served between 3 and 5 years, 11.2% between 6 and 10 years while 7.2% had served for
more than 10 years. Information was sought about the female inmates’ religious affiliation and the data
analysis results indicated that 54.8% were Protestants, 37.34% were Catholics while 10.4% were
Muslims. Majority of the prison wardens comprising 75% were female while 25% were male with 50%
being in the age bracket 30 years to 45 years. Regarding the work experience, 50% of the wardens had
worked for a range of 1 year to 10 years and the rest had a work experience of more than 10 years.
Majority of the prison wardens (75%) were in the rank of an inspector while 25% were in the rank of a
corporal. Most (50%) of the prison wardens were Protestants, 25% were Catholics and 25% belonged to
the Muslim faithful.
Effects of Imprisonment on Interpersonal Relationships among Female Inmates
To determine whether the effects of imprisonment on interpersonal relationships among female inmates
were significant, Chi Square test was conducted on 10 test items rated on a 5 level likert scale where 5 =
Strongly Disagree, 4 = Disagree, 3 = Undecided, 2 = Agree and 1 = Strongly Agree. The results of data
analysis were represented on Table 1 below.

Proceedings of the Third International Research Conference 26th to 28th October, 2016 503
Table 1: Chi Square test on effects of imprisonment on interpersonal relationships among female
inmates
Statements on Interpersonal Relationships
Chi-Square Df
Asymp.
Sig.
My friends treat me with suspicion since imprisonment 39.480a 4 .000
My family members became distant since imprisonment 55.520a 4 .000
I do not trust my fellow prisoners 60.040a 4 .000
Prison staff are not friendly 43.080a 4 .000
I have no friends in prison 50.920a 4 .000
Prison rules and regulations are socially restricting 81.080a 4 .000
I am never happy while in prison 121.640a 4 .000
I hardly make friends in prison 56.040a 4 .000
I am often uninterested in the feelings of others since
imprisonment 32.920a 4 .000
I like staying alone in prison 53.280a 4 .000
Effects of imprisonment on interpersonal relationships
among female inmates 91.392b 37 .000
As indicated on Table 1, the P-Value (0.000) was less than the set Alpha Value of 0.05 for all the test
items. As a result, the null hypothesis was rejected meaning that imprisonment had a statistically
significant effect on interpersonal relationships among female inmates in selected prisons in Kenya.
Therefore, it was necessary to determine the trends of these effects. In this case, mean perceptions of the
respondents and the Standard Deviations were computed. A mean analysis between 1 and 2.5 indicated
low interpersonal relationship, between 2.5 and 3.5 indicated modest interpersonal relationship and 3.5 to
5 indicated high interpersonal relationship. Results of data analysis were represented on Table 2 below.
Table 2: Mean perceptions and standard deviations on effects of imprisonment on interpersonal
relationships among female inmates
Statements on Interpersonal Relationships N Mean Std. Deviation
My friends treat me with suspicion since imprisonment 250 2.89 1.503
My family members became distant since imprisonment 250 2.90 1.477
I do not trust my fellow prisoners 250 2.61 1.390
Prison staff are not friendly 250 2.85 1.557
I have no friends in prison 250 3.29 1.422
Prison rules and regulations are socially restricting 250 2.52 1.468
I am never happy while in prison 250 2.19 1.357
I hardly make friends in prison 250 2.98 1.529
I am often uninterested in the feelings of others since
imprisonment 250 2.87 1.529
I like staying alone in prison 250 3.27 1.561
Effects of imprisonment on interpersonal relationship 250 2.8368 .90559
Valid N (listwise) 250
Key: M-Mean SD- Standard Deviation N- Number of Respondents
As indicated on Table 2, imprisonment had moderate effects on interpersonal relationships among female
inmates in selected prisons in Kenya with an overall mean of 2.8368 and a Standard Deviation of .90559.
The test item with the lowest mean score of 2.19 and a Standard Deviation of 1.357 indicated that female
inmates were never happy in prison. In spite of the unhappy state of the female inmates while in prison,

Proceedings of the Third International Research Conference 26th to 28th October, 2016 504
majority of the female inmates attested to having friends in prison and not inclined to staying alone while
in prison. This concern was indicated by the test item with the highest mean score of 3.29 and a Standard
Deviation of 1.422 and the next highest mean score of 3.27 and a Standard Deviation of 1.561
respectively. Emanating from these results, it may be inferred that the female inmates had an innate desire
for friendly interpersonal relationships and interactions.
Responses from the in-depth prison warden interviews allowed for exploration of what friendship meant
for female inmates and how the female inmates helped and interacted with each other in prison. The
findings indicated that female inmates who maintained strong family ties were able to withstand
challenges in prison. Interaction with family members was possible through weekly or monthly visits by
the family members, communication through mobile phones provided by the prison or by writing letters.
The prison wardens attributed lack of visits from family members for some female inmates to long
distances from home. In addition, the female inmates who were not visited tended to feel lonely and
rejected by family members and friends.
The prison wardens also perceived those female inmates who had left children under the care of relatives
and friends as most affected in interpersonal relationships. This category of female inmates tended to
withdraw from social interactions into deep thoughts that seemed disturbing. Female inmates who had
served a long duration in prison were perceived by prison wardens as being more cooperative during
communal work compared to those who had served a shorter duration in prison. This was credited to
familiarity and the ease of keeping the prison rules and regulations acquired through experience.
Generally, effective interpersonal relationships among female inmates reflected a feeling of strength
derived from the resultant social support, affection and cooperation. Data generated through observation
method indicated that female inmates interacted freely among themselves and with the prison staff.
Activities that facilitated such interactions were noted and included cooking, tailoring, sporting, feeding
children, studies, religious fellowships and communal work. Most female inmates were observed as being
friendly both to visitors and prison staff.
DISCUSSION
The study findings indicated that imprisonment had a moderate effect on interpersonal relationships
among female inmates in selected Kenyan prisons. The female inmates preferred having friends and
interacting instead of staying alone. This was an indication of innate desire for intimate interpersonal
relationships. These results are in line Hart (1995) who demonstrated that strong social support among
female inmates was related to inmates’ mental well-being since social support or friendship in prison
helped them to avoid conflict. In support of these findings, Timbre (2013) pointed out that a wide variety
of inmates found comfort and support in personal relationships.
In retrospect, Trammell (2009) noted that confinement in prison may be a more difficult experience for
women than men because women are more likely to find the social isolation insufferable. The prison
wardens observed that female inmates who had not served for a long time in prison had difficulties in
adhering to prison rules and regulations. This sentiment was echoed by Hampton (2012) who asserted that
women do not as readily become part of the inmate subculture and do not adhere as rigidly to an inmate
code. However, in this study a positive relationship was observed between the length of stay in prison and
female inmates’ adherence to inmate subculture and code of conduct. This was reflected in the prison
wardens’ view that female inmates who had served a long duration in prison were more cooperative
during communal work compared to those who had served a shorter duration in prison. The prison
wardens credited this to familiarity and the ease of keeping the prison rules and regulations gained
through experience.
Results of this study revealed that female inmates who had left children under the care of relatives and
friends were more likely to be negatively affected in their interpersonal interactions. Previous research
has demonstrated that mothers consider isolation and separation from children to be the hardest aspects of
imprisonment (Dodgeand Pogrebin, 2001). Boudin (1998) notes that incarcerated women feel enormous
grief about time lost with their children. Others have found that women prisoners’ primary concern is on
the effects of separation and incarceration on their children’s live and psychological development (Cooper

Proceedings of the Third International Research Conference 26th to 28th October, 2016 505
and Berwick, 2001). Nevertheless, the study findings indicated that female inmates who maintained
strong family ties were able to withstand difficulties in prison an aspect that reflected a feeling of strength
among the inmates since they were able to experience social support, cooperation and affection among
themselves and staff. Female inmates in selected prisons in Kenya interacted freely in prison activities
which included cooking, tailoring, sporting, feeding children, studies and communal work. This may be
attributed to prison reforms initiated by the Government of Kenya. Contrary to these findings, McCain et
al., (1980), Gaes (1985) as well as Lawrence and Andrews (2004) suggest that large prison populations
where inmates are in constant contact with each other making privacy rare are conducive to more frequent
interpersonal conflict, aggression, and even violence. Although female inmates interacted freely in prison,
majority of the inmates were never happy within the prison environment. This potential gap in the body of
knowledge may be explored through further research.
RECOMMENDATIONS
Based on the study findings, there was need for enhancement of female inmates’ interpersonal
relationships which were moderately affected by imprisonment. This may be achieved by increasing
visitation schedules and opening other channels through which inmates may interact with their children
and loved ones without compromising security. The prison environment could also be modified to allow
for more social support groups and home like environment where female inmates may nurture a sense of
belongingness especially those serving long sentences.
REFERENCES
Bennett, L. (1978). Counseling in Correctional Environment. New York.
Boundin, K. (1998). Lessons from Mothers Program in Prison: A Psychological
Dodge, M. andPogrebin, M (2001). Collateral costs of imprisonment for women complications of
reintegration. The Prison Journal 81(1):42-5-4
Gaes, G.G. (1985). The Effects of Overcrowding in prison. Crime and Justice, 6:95-146.
Giallombordo, R. (1966). Society of Women. A Study of a Women’s Prison. New York: John Wiley
andSons, Inc.
Greer, K.R. (2000). The Changing Nature of Interpersonal Relationships in Women’s Prison. The Prison
Journal, 80(4):442-468
Hampton, E, (2012). Coping with imprisonment: Exploring bullying, safety and social supportwithin
prison setting, Published PhD Thesis, University of Barmingham. Edgbaston, Birmingham
Hart, C.B. (1995). Gender differences in social support among inmates. Womenand Criminal Justice,
6(2):67-88.
Lawrence, C., and Andrews, K. (2004).The influence of Perceived Prison Crowding on Male Inmates’
perception of Aggressive Events. Aggressive Behavior, 30:273-283.
McCain, G., Cox, V.C., and Paulus, P.B. (1980). The Effect of Prison Crowding on Inmates Behavior,
U.S. Department of Justice: National Institute of Justice, Washington D.C.
Propper, A.M. (1989). Love, Marriage and Father-Son Relationships among Male Prisoners. The Prison
Journal 69:57-63.
Severance, T.A. (2005). You Know Who You Can Go To: Cooperation and Exchange Between
Incarcerated Women. The Prison Journal 85(3):343-367.
Trammell, R. (2009). Relational Violence in Women’s Prison. How Women Describe Interpersonal
Violence and Gender. Women and Criminal Justice, 19(4):267-285. ******
THE ROLE OF WOMEN RETIREES IN RURAL DEVELOPMENT IN KENYA
Waweru, I.W. and Njugiri, J.N.
Jomo Kenyatta University of Agriculture and Technology, P. O. Box 6200-00200, Nairobi
Correspondence: 0723 988517, [email protected]
ABSTRACT
Africa development process is continuously mutilated, truncated, disrupted, distorted and inhabited by
unsuitable policies as retirement, retrenchment, redundancy declaration policies, demobilization of
manpower and the intervention of foreign imposed structural adjustment policies. With their expertise and

Proceedings of the Third International Research Conference 26th to 28th October, 2016 506
skills in various disciplines, retirees can be targeted to enhance development in their communities. They
can be advisors, teachers, and mentors in programs, such as local associations, crime prevention, and
parents association. With the introduction of Nyumba Kumi Concept the National Government requested
the police retirees to register so as to be involved in security watch in the country, a practice in the right
direction and the focus of this paper. When women are economically and socially empowered, they
become a powerful force for change. In rural areas, women play a key role in running households and
contributing to agricultural production. Women retirees are empowered, have skills, expertise and can be
involved in mentoring at organizational as well as society levels. They can participate actively in
formulation and implementation of development policies in rural areas. With retirement, the retirees adopt
new roles which either match their expertise or in a different field altogether. With abrupt demobilization
and forced retirement, skilled manpower is literally pushed to the wall in terms of being forced to come
up with new ways of re-harnessing their accumulated skills in projects which in some situations do not
correspond to their line of expertise. In the midst of all these, this paper will examine the role played by
women retirees in rural development and how they could be a potential source for future growth in the
devolved system of governance.
Keywords: Retirement, Skilled manpower, Demobilization, Devolved system
INTRODUCTION
From April 1 2009, the civil service normal retirement age increased to age 60 years from 55 years. This
implies that employees of the civil service legitimately have additional 5 years of work if they do not opt
for early retirement (as early as 50 years) but before the age 60 years. A few occupational schemes such
Universities, Government Research and Organisations revised their retirement ages to the high of 70
years. With retirement, the retirees adopt new roles which either correspond to their expertise or in a
different field altogether. According to Nyasani (2010), with abrupt demobilisation and forced retirement,
skilled manpower is literally pushed to the wall in terms of being forced to excogitate new ways of re-
harnessing their accumulated skills in projects which neither correspond to their line of expertise nor to
the corporate spirit already shortened prematurely.
With their expertise and skills in various disciplines, retirees can be targeted to enhance development in
their communities. Retirees can be advisors, teachers, and mentors in programs, such as local
associations, crime prevention programs, and parents and teachers association. Recently, the Ministry of
Internal security requested the police retirees to register so as to be involved in security watch in the
country “the Nyumba Kumi initiative” a practice that is in our view a step in the right direction. However,
a study of older persons carried out in Mutumwa village of Kisii central, Kisii County by Chitere (2011),
established that the highest level of formal education attained by the rural old was the primary level,
specifically up to 65% of respondents had formal education up to primary level up to primary level, and
21% were illiterate while 10% had benefitted from informal adult education.
The implication here is that majority of the rural older persons, during their active life could only qualify
for unskilled labour. In this era, it can be understood why they chose to remain in the rural areas where
they solely rely on subsistence farming as society simply does not enable the involvement of their
technical skills to match the demands of modernisation. This paper will therefore examine secondary data
pertaining to the role played by retiree women in rural development and assess how they could be a
potential source for future growth in the devolved system of governance.
The Concept of Retirement
For the purpose of this paper, women retirees are those who previously worked in formal employment
and have left either on voluntary basis at the age of 50 years or as a matter of policy at the age of 60
years. Therefore in this paper, they will be considered as older persons compared to those who are 49
years and below hence belonging to the aging populations.
Retirement is defined broadly as the departure event in an individual’s life course from a phase of the
occupational life cycle (Atchley, 1993, 1996) cited in Encyclopedia of the Life Course and Human
Development. Traditionally, retirement has been viewed as a period of well-earned rest following a
lifetime of productive employment. Retirement itself is associated with growing old and ageing is

Proceedings of the Third International Research Conference 26th to 28th October, 2016 507
frequently portrayed in a negative way, often because of factors associated with retirement such as low
income, loss of status and poor health (Mein, 1998).
According to Achley (1993) cited in Brannick (2004), retirement is a six-phase process:
Phase 1: Pre-retirement It occurs prior to the actual retirement experience. During this phase, a person usually begins mentally to
prepare exiting from employment and planning how to actively engage upon retirement.
Phase 2: Retirement
This phase occurs when the person is no longer participating in paid employment. A person in this phase
usually takes one of three possible paths. Path one is referred to as the “honeymoon” path. This is where a
person who has been working starts feeling and acts as if s/he is on leave indefinitely. Those in this
category tend to be engaged in things which they may not have done while working for instance travelling
to various places. Path two is called the “immediate retirement routine” path. Individuals on this path
appear to easily establish comfortable, yet busy schedules soon after retirement. Path three is the “rest and
relaxation” where people who have had very busy careers with limited time to themselves often choose to
do very little in their early retirement years but later increase their activity levels.
Phase 3: Disenchantment
Adjustment from a daily busy schedule to retirement can be a challenge to some people. According to
Nyasani (2010) some who retire can experience bitterness not only with themselves but also with
authority. Other feels disillusioned and even disappointed with life and especially to those who did not
have good plans at pre – retirement phase.
Phase 4: Reorientation
This is where those who have retired starts evaluating their retirement experience so as to make it more
fulfilling. They do this by becoming more involved in the community, taking up a new hobby, or
relocating to a more affordable setting. This is the area of interest of this paper.
Phase 5: Retirement Routine
Having rewarding retirement routine which is sustainable is the ultimate goal of retirement. There are
those retirees who are able to attain this soon after retirement while other takes longer time. The
preparation in pre – retirement phase is very crucial since it is a key determining factor in this phase. For
instance there are those who invest more in their pension plan, others start businesses way before
retirement and other seek professional advice on how to invest their pension benefits. This phase is the
focus of this paper as it is echoed in the Vision 2030, that there is need of ‘harnessing retired high cadre
talent’ recognizing that ‘retirees are capable of making a contribution to our development.
Phase 6: Termination of Retirement
As one gets older in age, the retirement role eventually becomes less relevant since the person may no
longer be in control of most of the retirement activities. This may be as a result of illness, disability and
even old age. At this point a lot of care is mainly from family members and the person concentrates more
on his/her immediate needs.
Theoretical Framework: Structural-Change theory and Endogenous Growth Model
According to Todaro and Smith (2010), structural-change theory focuses on the mechanism by which
underdeveloped economies transform domestic economic structures from a heavy emphasis on traditional
subsistence agriculture to a more modern, urbanized, and industrially diverse manufacturing and service
economy. Lewis introduces the basic model which sees the underdeveloped economy consisting of two
sectors: A traditional, overpopulated rural subsistence sector characterized by zero marginal labour
productivity hence classifying this as surplus labor that can be withdrawn from the agricultural sector
without any loss of output and a high-productivity modern urban industrial sector into which labor from
the subsistence sector is gradually transferred.

Proceedings of the Third International Research Conference 26th to 28th October, 2016 508
According to Lewis, the primary focus of the model is on both the process of labor transfer and the
growth of output and employment in the modern sector. Both labor transfer and modern-sector
employment growth are brought about by output expansion in that sector (Todaro and Smith, 2010).
The Lewis model is criticized for assuming that surplus labor exists in rural areas while there is full
employment in the urban areas. In many Third World countries, there is substantial unemployment in
urban areas but little general surplus labor in rural locations especially in agricultural related economies.
In his model Lewis never considered that at some point the retired labour force in urban areas in most
cases goes back to the rural areas hence the reversal of his model. The retired labour force therefore
increases the surplus in rural areas if we go by the Lewis model. Does this category of labour force which
has gained skills from employment in urban areas or other sectors of economy have any contribution
towards the development of the rural areas? This will be the guiding question in this paper.
The Harrod-Domar growth model can also be used to explain the challenges faced by rural women.
According to this model, in order to grow, economies must save and invest a certain proportion of GDP.
The more they can save and invest, the faster they can grow. Rural women are faced by a host of
challenges like lack of access to credit that inhibit them from investing and therefore hampering economic
growth. In addition to investment, two other components of economic growth are labour force growth and
technological progress. In this regard, if the retired women can be positively engaged in employment,
they would constitute an immense source of labour force that would ultimately translate into economic
growth in rural areas.
Endogenous growth model as advanced by Romer (1994) is also important in explaining some of the
measures that the women retirees use in order to contribute to the economic development of the rural
areas. Endogenous theory which emerged in 1980s emphasis that economic growth is an endogenous
outcome of economic system not as a result of forces that impinge from outside. According to Romer,
endogenous model tries to uncover the private and public sector choices that cause the rate of growth of
residual to vary across the country. This theory is applicable through the use of skills gained by women
retirees in urban areas in order to develop rural areas. This model is also applicable through the use of
micro finance institutions which have instilled the culture of savings and investments.
Since early 1980s, there have been emergent of indigenous banking through micro finance institutions
such as Kenya Women Finance Trust (KWFT), Kenya Rural Enterprise Programme (K- REP), Faulu
Kenya, Small and Micro – enterprise programme (SMEP), Equity Bank among others which have given
Kenyan women a chance for savings and investments. As a result, women have access to financial
services enabling them to become economic agents of change by increasing their income and
productivity, access to markets and information and decision making power. This is what Romer
Endogenous theory refers to as technological spillovers in the process of industrialization.
METHODOLOGY
The paper reviewed secondary data from development related materials, various studies and reports,
various, the Constitution of Kenya 2010 and use of structural change theory and endogenous growth
model as the main theoretical framework.
RESULTS AND DISCUSSION
When women are economically and socially empowered, they become an effective force for change. In
rural areas of the developing world, women play a key role in running households and making major
contributions to agricultural production. Women retirees can be said to be empowered, have the skills, the
expertise and can be involved in mentoring at organizational as well as societal levels.
Review on the Role of Women Retirees In Development
According to Chitere and Mutiso (2011), it is a well-documented fact that women play a crucial role in
the development of any society. Statistics available further indicate that women constitute nearly two –
thirds of the rural population. Studies by authors like Boserup (1970), Sall (2000) and others in Chitere
(2011) demonstrate that women are the majority of the small-scale farmers in the rural areas. They are

Proceedings of the Third International Research Conference 26th to 28th October, 2016 509
also the custodians of family life. In Kenya, women have a long tradition of participation in community
development and national development. It should be noted that during colonial days, women were
encouraged and also mobilised their energies for community development (Ibid). The Vision 2030,
priorities on human resource acknowledges the need for a broad and effective social security system
while also ‘harnessing retired high cadre talent’ by recognizing that ‘retirees are capable of making a
contribution to our development’.
According to Nzomo (2011), a key objective of the majority of women that engage in politics is not only
to gain power but also to use the leadership position to advance and /or provide desired services or goods
to the constituent group that they purport to represent. The Kenyan Constitution that was promulgated in
August 2010 also entrenches the two-third gender rule that has increasingly improved the engagement of
more women in the hitherto male dominated spheres.
During the ten years of the Women’s Decade (1975-1985), the Kenya government had adopted a Woman
in Development (WID) policy position and created and/or promoted national machineries to develop and
coordinate programmes for women. Hence, it could be argued that Kenya was merely complying with the
1975 United Nations resolutions that demanded of all member states to make changes and introduce
policies and programs geared towards accelerated advancement of women, by creating specific national
machineries to serve women and by strengthening existing organizations.
In the post 1975 era, the Kenyan official development policy position changed from one that was
completely gender blind to one that at least acknowledged that women are an important element in the
development process and should be integrated in that process (Nzomo, 2011). Women’s role in
development should therefore be understood within this context of changing development approaches. In
Kenya today, there is encouragement for women to actively enter politics in order to entrench themselves
in the decision making process evidenced by the emergency of women’s lobby groups to engage the
established traditions (Chitere, 2011). Women who have previously worked in urban areas have also
engaged themselves in politics after retirement. They have earned and gained skills in various fields hence
feel they can contribute towards the development of rural areas.
Studies reveal that retirees have positive economic impacts on the communities where they choose to
relocate. According to Skelly (2004) cited in Das and Daniel (2007), the benefits of in-migrating retirees
into a community include stimulated growth in the health services, housing, banking, restaurants and
entertainment sectors. Specifically, sectors that benefit from in-migration of retirees include real estate
(residential and commercial), finance (banks, insurance, stocks, financial planners, and accountants),
healthcare (professionals and facilities), recreation and entertainment, hospitality (lodging and
restaurants), retail (durables and non-durables), utilities, and tourism (visiting and permanent tourists).
Concurrently, this leads to an increase in property and sales taxes that enables local governments to spend
on improving local services.
Studies by researchers by Bookman (1973) et al revealed that women have always been major actors in
development activities in rural Kenya evidenced by their domination in the agricultural sector in most
rural areas; a fact that is well acknowledged in the national development plans. Further, a study conducted
by Yahya et al. (2008) on Retirees’ skills and involvement in society for national development in
Malaysia shows that retirees can be advisors, teachers, and mentors in programs, such as state
associations, crime prevention programs, and parents and teachers association. These are some of the
areas that retired women can be involved in to boost rural development.
Day and Barlett (2000) cited in Vollet et al. (2005) in a study of 34 Texas counties, show that counties
that were more retiree-oriented had experienced more economic growth. Such growth had brought jobs
and new firms to local economies. According to the study, the greatest impact of retirees appeared to be
on growth in the financial and real estate sectors. This scenario is also reflected in rural Kenya whereby
the retirees construct rental houses as part of their retirement plan.

Proceedings of the Third International Research Conference 26th to 28th October, 2016 510
According to Vollet, et al. (2005), retirees’ expenditures represent an “injection” of funds into the local
economy. These funds are used by recipients to purchase other goods and services, to pay wages to
employees and to pay taxes to federal, state and local governments. This entire process has multiplier
effect whereby a shilling of direct consumption is circulated through the rural economy repeatedly,
ultimately yielding more shillings of total production and consumption. The study also indicated that
estimations based on employment and income multipliers showed that every retiree creates on average 0.5
jobs. Tosun et al. (2005), study on Retirees and Economic Development in West Virginia shows that
retirees are becoming increasingly important for state and local economies and revenue systems. While
retirees pose both challenges and opportunities for governments, they have been increasingly targeted as a
group to enhance economic development in communities.
A study conducted in 2008, on government retirees in Malaysia highlighted several contributions that can
be made by the government retirees in attaining the national development. The first type of contribution is
through the retirees’ involvement in associations. The results of this study revealed that 85.5 per cent of
the retirees were actively involved by holding various important positions in many associations. The other
finding was that retirees are actively involved in social services with 52.3 percent of the respondents
involved in social services, namely counseling, advisory services, care service, charity organization, and
voluntary work (Yahya et al., 2008).
This study therefore shows that retirees are aware of their responsibility in nation building by
participating in social activities by utilizing their skills. This kind of scenario is not different from the
women retirees in Kenya who are involved in self-help groups, starting businesses in rural areas including
real estate, private schools, private health clinics, agribusiness while others get reemployed in their areas
of specialization like nursing. The older women in rural areas are also very instrumental in the
implementation of peace and reconciliation projects.
Peace and development always go hand in hand since there can be no development without peace. For
instance in 2012, the chairman of National Cohesion and Integration Commission (NCIC), noted that
women cannot be left out of any peace initiatives since they bear the brunt of conflict in any country
(Kenyan Woman, September 2012). According to Tosun et al. (2005), the economic impact produced by
retirees is substantial but the size of the impact depends considerably on the income level of the migrating
retiree. Higher income retirees would bring considerably higher economic and tax revenue impact
compared to lower income retirees. This in itself is a reversal of Lewis two stage model and a support for
the call of the first president of Kenya’s “rudimashambani initiative” It is evident from the above analysis
of various scholars that more involvement of retired women will result in accelerated economic rural
development and also have the added advantage of boosting their self esteem and encouraging younger
people to settle there.
CONCLUSION
It is apparent that role of retiree women takes the input-output model as a conceptual framework to
examine the multiplier effects of role played by women retirees leading to rural development (various
sectors of the economy). Input-output analysis is one of a set of related methods which show how the
parts of a system are affected by a change in one part of that system. Input-output analysis specifically
shows how industries are linked together through supplying inputs for the output of an economy.
After retirement, the women retirees who move back to rural areas and brings with them (Input) such
skills, experience, money (pension fund) and they transform this through engaging themselves in the
different economic activities such as farming, businesses, investment in real estate. As a result output is
realized which leads among other things accelerated rural economic growth, increased revenue base for
the government through the accrued tax, less economic burden on the government and family support for
the elderly improved self-esteem for the working women and a sense of belonging among many other
benefits that will be obtained as a result of engaging retired women in rural programmes.
Rural women are key agents of development. They play a catalytic role towards achievement of
transformational economic, environmental and social changes required for sustainable development. They

Proceedings of the Third International Research Conference 26th to 28th October, 2016 511
can also participate actively in the formulation and implementation of development policies in rural areas.
According to Vollet (2005), it is important for policy makers to increase the attractiveness of the rural
areas, and also take concrete actions to optimize the economic benefits of the presence of retirees. Local
leaders should also think of positive ways of attracting and maintaining new retirees, albeit the fact that
retirees often arrive voluntarily without any local official intervention. With devolution, it is possible for
the new County Governments to develop friendly policies and amenities which are lacking in rural areas
which will serve as a source of attraction to the women retirees hence providing an enabling environment
for women who may be having negative attitudes towards retiring in a rural area. This will ultimately
translate into accelerated economic development in rural areas.
On the basis of the aforesaid, this paper also seeks for a reversal of Lewis two-stage model (Todaro and
Smith, 2013). Lewis argues that development can only occur when the rural surplus labour is effectively
transferred from rural (where labour can be withdrawn without any effect on output) to urban areas where
they will be absorbed in the newly converted industrial and service oriented industries. Only when this
process is complete will there be any meaningful development. This paper argues that there is surplus
labour in the urban areas of women retirees with crucial skills and a wealth of experience that can be
tapped and transferred to the rural areas and effectively absorbed using the current devolved system
structures and emerging opportunities. By so doing Kenya will by extension be applying the endogenous
approach of achieving development by tapping on local potential instead of relying on foreign aid as the
accrued income earned from such engagements will be saved and invested resulting in capital expansion
and increased job opportunities. If this can be effectively done, this can ultimately translate into
accelerated economic growth and rural development.
REFERENCES
Brannick. P, (undated). Should you stay or should you go? Managing Partner Retirement Effectively
Chitere, O. and Mutiso, R. 2011. Working with Rural Communities (2nd
ed), Nairobi: KLB.
Das, D and Daniel, V. (2007). Is attracting Retirees a Sustainable Rural Economic Development Policy?
A paper presented to Southern Agricultural Economics Association Annual MeetingsMobile,
Alabama, February 4-7, 2007
Economic Commission of Africa, (2011). The Africa Gender and Development Index: Promoting Gender
Equality in Africa
Fin–Ed Centre, (2012). The impact of cultural factors on women’s retirement income, Massey University.
Kenya National Commission for Human Rights (2009). Growing old in Kenya: Making it a positive
Experience
Mein, G. (1998). Paradigms of Retirement. The Importance of Health and Aging in the White Hall 11
Stay University of London
Mulwa, F. (2010). Demystifying participatory community Development; Nairobi: Paulines
Ngcuka, Phumzile, M. (2013). International Day of Rural women.
Nyasani, M. (2010). Philosophy of Development: An African Perspective: Nairobi: Consolata Institute of
Philosophy.
Nzomo, M. (2011). Women in Political Leadersship in Kenya: Access, Agenda setting and Accountability
Nzomo, M. (undated). Beyond the Women’s Decade: Women’s Political Participation in Kenya.
Romer, P. (1994). The origins of Endogenous Growth, Journal of Economics Perspectives, 8(1).
Todaro, M. and Smith, S. 2011. Economic Development (11th
ed.). England: Pearson education Ltd
Tosun, M et al Retirees and economic Development in West Virginia
Sdorow, M. L. (1993). Psychology (2nd
edn). London; Brown and Benchmark
UN Women (2014), World Survey on the Role of Women in Development: Gender Equality and
Sustainable Development
Vollet, D. et al (2005), Impact of Retirees on Rural Development: Some Observations from South France,
The Journal of Regional Analysis and Policy
Yahya, K. et al (2008). Retirees Skills and Involvement In society for National Development, Universiti
Utara Malaysia http://www.sjsu.edu/faculty/watkins/inputoutput.htm - retrieved on 26/11/2014 ******

Proceedings of the Third International Research Conference 26th to 28th October, 2016 512
ENHANCING GENDER EQUALITY AS AN AFFIRMATIVE ACTION SUSTAINABLE
DEVELOPMENT
Gichohi, H.M.F.
Department of Development Studies, Jomo Kenyatta University of Science and Technology, P. O. Box 62000-00200, Nairobi; Correspondence: [email protected], Tel 0728218215
ABSTRACT
Affirmative action has been used internationally as a means to address gender and other imbalances in
access to education, health, employment and politics. While it has improved the male and female ratios in
primary education, it has been less effective for improving women's representation in political and public
life. Gender equity is important for human development. This paper explored how gender inequality has
hindered the full participation of women especially in key decision making levels and therefore affecting
the progress towards achieving sustainable development. It argues that affirmative action can improve
gender equity and indeed sustainable human development. In Kenya, there remains gross inequality
between men and women in almost all areas of human life but especially at the political arena. Such
gender inequalities are not just damaging to the interests of women but also to people’s livelihood
strategies as a whole and sustainable development. Sustainable development being that which meets the
needs of the present without compromising the ability of future generations to meet their own needs,
gives a synopses of the needs of both women and men. The paper makes the case for enhancing
affirmative action on grounds of attainment of broad developmental goal towards sustainability and traces
gender history, achievements, limitations and continuing challenges, providing lessons from more
successful cases of affirmative action in countries in the region. It gives recommendations to enhance
affirmative action for gender equity for sustainable development.
Keywords: Affirmative action, gender equity, sustainable development
INTRODUCTION
In the year 2000, the United Nations while setting the Millennium Development decided and agreed that
Goal No. 3 be to commit United Nation members to promote gender equality and empowerment of
women as effective ways to combat poverty, hunger and disease and to stimulate development that is
truly sustainable (UN, 2000). This brought about gender mainstreaming in the sectors of development
such as education and other social and political institutions. By the end of 2015, gender inequality was
still a major concern and in order to strive towards sustainable development, the Stainable Development
Goals were set with goal number 5 being to adopt and strengthen sound policies and enforceable
legislation for the promotion of gender equality and the empowerment of all women and girls at all levels
(UNGlobal, 2016), many targets relate to opportunities, empowerment and enhancing capabilities.
Targets related to universal primary and secondary education, literacy and numeracy; ensuring women’s
full and effective participation and equal opportunities for leadership at all levels of decision-making in
political, economic and public life; ensuring responsive, inclusive, participatory and representative
decision-making; universal access to sexual and reproductive health and reproductive rights; full and
productive employment and decent work; and increase in skills for employment and entrepreneurship.
Realizing gender equality and the empowerment of women and girls will make a crucial contribution to
progress across all the Goals and targets. The achievement of full human potential and of sustainable
development is not possible if one half of humanity continues to be denied its full human rights and
opportunities (UN, 2015). Women and girls must enjoy equal access to quality education, economic
resources and political participation as well as equal opportunities with men and boys for employment,
leadership and decision-making at all levels.
The United Nations committed to work for a significant increase in investments to close the gender gap
and strengthen support for institutions in relation to gender equality and the empowerment of women at
the global, regional and national levels. All forms of discrimination and violence against women and girls
will be eliminated, including through the engagement of men and boys. (UNWomen, 2014) The
systematic mainstreaming of a gender perspective in the implementation of the Agenda is crucial.

Proceedings of the Third International Research Conference 26th to 28th October, 2016 513
Gender Concept
Gender is defined as a social construct that ascribes different qualities and rights to women and men
regardless of individual competence or desires. This often means that women globally perform the bulk of
work without pay in the home while men receive these services yet are regarded both as family providers
and as family heads – with all this entails in terms of obligations, rights and power (Philips, 2005).
Gender and gender power are reflected at all levels of society, where women are often responsible for
health and social care provision-both at home and at work – while men are able to use their greater share
of leisure time to pursue careers/work and to participate in decision-making at all levels of public life.
Gender is seen as personal traits and position in society connected with being a male or female.
Gender is different from sex because sex refers strictly to the biological makeup of a male or a female.
Clearly boys and girls have different biology, but that does not necessarily mean that biology creates
personality. However, women and girls are socialized to be caring and dependants, while men and boys
are socialized to be strong and culturally expected to be leaders, providers, givers of security and problem
solvers. According to (Kamau, 2012), however, men who lack physical strength may experience low
self-esteem and result in violence against women to prove to self that they are men enough. Such men are
particularly threatened by women who seek leadership and thus violate such women in order to
disempower them.
While most people are born either male or female, they are taught appropriate norms and behaviours –
including how they should interact with others of the same or opposite sex within households,
communities and work places. When individuals or groups do not “fit” established gender norms they
often face stigma, discriminatory practices or social exclusion – all of which adversely affect health. It is
important to be sensitive to different identities that do not necessarily fit into binary male or female sex
categories. Gender norms, roles and relations influence people’s susceptibility to different health
conditions and diseases and affect their enjoyment of good mental, physical health and wellbeing.
(UNDP, Resource Guide: Gender in Water Management, 2009) They have a bearing on people’s access
to and uptake of health services and on the health outcomes they experience throughout the life-course.
Theoretical Developments of Gender
Interest in women in Development dates back to the 1970s and has since largely been formulated within
the WID/WAD/GAD framework. The first of these approaches, Women in Development (WID), emerged
among Northern (predominantly American) aid workers and was particularly popularised by the first UN
Decade for Women (1975–1985) (Moser, 1993). Significantly influenced by liberal feminist ideals,
Women and Development (WAD) approach appeared to adopt a more critical stance on the relationship
between women and development. Drawing attention to the economic work performed by women in both
the formal/public arena and informal/private spheres, Women and Development advocates argued that
development discourse failed to acknowledge not only women’s perspectives but, equally crucially, the
perspective of developing world countries, (Merlily Porter, 1999) also asserts that poverty, inequality and
violence against women continue to affect women’s lives all over the world and social justice becomes a
challenge. As such, the approach was more appreciative of diversity among women.
By the 1980s there was an increasing shift in focus from women to gender in order to include the relations
between men and women and to the social construction of femininities and masculinities, all of which
were summarized by the Gender and Development philosophy, according to (Moser, 1993). This gender
approach was welcomed on the grounds that its diverse ideals would be incorporated into development
thought and practice. Characterised by a more radical agenda, the Gender and Development philosophy
critiqued the development process itself while trying to address the basis of inequalities between men and
women and thus transform gender roles and relations so as to empower women.
Gender and development by empowering women thus enabled them the capacity or the capability to
participate in development issues that concerned them. However, despite close to 30 years of a focus on
women, through above mentioned approaches, women still constitute the majority of the dispossessed and
the vulnerable in the world yet according to (Goetz, 2003), gender holds the promise of redistributing the
power inherent in gender relations. The exclusive focus on women has an additional ideological

Proceedings of the Third International Research Conference 26th to 28th October, 2016 514
foundation, particularly among both national and international policy makers who are unwilling to get
involved in the dilemma of gender relations. Goetz argues that there is a lack of political will which
ignores the problem of deep institutionalization of gender differences and male privileges in the public
sphere. The post-Beijing situation seems to reflect mixed reactions. Fundamentally, however, states seem
to be restricted to a minimalist agenda as far as women are concerned. This is according to (Ahikire,
2007) because states more often than not will go with initiatives that do not undermine the deep-seated
male privilege.
Kenya has responded in gender inclusion by enacting Cap 97 a clause (b) in the Constitution (2010)
which states forty-seven women will be elected by the registered voters of the counties, each county
constituting a single member constituency. Though this development has only taken place during the 11th
parliament, it has enabled more women than in the past get to high positions of decision making
institutions such as parliament and in county governments and this according to (Nzomo, 2012) would de-
masculine the deeply embedded institutional male political culture and replace it with a more democratic
culture and translate into influencing policy and programmatic actions that would be responsive to the
needs of poor women in the allocation of national budgets. However, still more women need to be elected
and appointed to decision making position in order to represent the majority of women who constitute the
larger proportion of the country population.
What is Development?
Development is the process of improving the quality of all life of human beings and capabilities by
raising people’s level of living, self-esteem and freedom (Tondaro, 2015). From this definition, one can
simplysay as a fact that development is about positive change or progress that brings quality of life in
which all humans beings are included in the process. Therefore, for development to be said to have
happened, major changes have to be seen to have happened which include but not exhaustive: social
structure, attitudes and national institutions as well as the acceleration of economic growth, the reduction
of inequality and the eradication of poverty.
According to (Tondaro, 2015), “Development in its essence must represent the whole gamut of change by
which an entire social system turned to the diverse basic needs and evolving aspirations of individuals and
social groups within that system, moves away from a condition of life widely perceived as unsatisfactory
towards a situation or condition of life regarded as materially and spiritually better”. This then means that
development is not just about economic growth but must bring about change in the human life in the
following three aspects: seen to reduce poverty, inequality and unemployment
Sen (1999) went further and included another indicator of development that is freedom in “Development
as Freedom”, he states that what people can positively achieve is influenced by economic opportunities,
political liberties, social powers and the enabling conditions of good health, basic education and the
encouragement and cultivation of initiatives. The institutional arrangements of these opportunities are
also influenced by the exercise of people’s freedom through the liberty to participate in social choice and
in making decisions that impel the progress of these opportunities. Therefore, this freedom or liberty is
progressive and not static but have to be cultivated and exercised.
Sustainable Development
The Brundtland Report of 1987 defines sustainable development as both an objective and a method. It is
defined as “development that meets the needs of the present without jeopardizing the ability of future
generations to meet their needs.” This clearly expresses what is fair and how it is imperative to act in a
responsible manner so that the fundamental needs of all can be met today, throughout the world and far
into the future. Sustainable development and the fight against poverty may thus be viewed as two sides of
the same coin, where sustainable development has both a ‘horizontal’ dimension – addressing solidarity
and poverty reduction today throughout the world and a ‘vertical’ dimension in the form of solidarity with
future generations.
According to the United Nations World Commission on Environment and Development (1987),
development is sustainable if it “meets the needs of the present without compromising the ability of future

Proceedings of the Third International Research Conference 26th to 28th October, 2016 515
generations to meet their own needs.” So, sustainable development is about equity, equality of
opportunities for well-being. Meaning that in order to develop, there should be balance in the interests of
different groups of people, within the same generation and among generations, and done simultaneously
in three major interrelated areas – economic, social, and environmental, World Bank (2014). Sustainable
development is economic, social and environmental that ensures human well-being and dignity,
ecological integrity, gender equality and social justice, now and in future. Tondaro (2015) points out that
sustainable development has to be a pattern of development that permits future generations to live at least
as well as the current generation, generally requiring at least a minimum of environmental protection.
Sustainable development recognizes that growth must be both inclusive and environmentally sound to
reduce poverty and build shared prosperity for today’s population and to continue to meet the needs of
future generations. It is efficient with resources and carefully planned to deliver both immediate and long-
term benefits for people, planet, and prosperity. Sustainable development cannot be achieved without
including all humanity in the planning process.
The three pillars of sustainable development – economic growth, environmental stewardship, and social
inclusion – carry across all sectors of development, from cities facing rapid urbanization to agriculture,
infrastructure, energy development and use, water availability, and transportation. Cities are embracing
low-carbon growth and public transportation. Farmers are picking up the practices of climate-smart
agriculture. Countries are recognizing the value of their natural resources, and industries are realizing how
much they can save through energy and supply chain efficiency (UNGlobal, 2016)
Gender Equality Gender equality aims to ensure that everyone gets the same things in order to enjoy full, healthy lives. In
the present context refers to a state of affairs in which women and men enjoy the same opportunities in all
walks of life. It also means having a gender perspective in decision making of all kinds and that woman’s
interests are given the same consideration as men’s in terms of rights and the allocation of resources.
Gender equality and empowerment of women as well as the active participation of women in political,
economic, social and cultural life should be promoted in order for women to be able to fully exercise their
human rights towards sustainable human development. Gender perspectives have to be mainstreamed in
all-inclusive policies.
Women’s ‘agendas’, like men’s, differ in many respects, depending on age, wealth and other factors. It
may be assumed here, however, that men share certain collective interests in their role as males,
irrespective of political and other preferences. As members of the same biological sex, all men are
assumed to have an interest in ensuring that their health is secured by means of improved care and
research on male diseases (such as prostate cancer). A further assumption is that men share a common
interest regarding the rights, services and resources they have access to as a result of their social gender –
such as care and help in the home, for instance, via mothers, wives/partners and daughters etc – and
inexpensive health care as well as care for elderly people, normally provided for by women.
Equity
This involves trying to understand and give people what they need to enjoy full, healthy lives also implies
representation as well as access to resources. Equity of access to decision-making and the basic
necessities of urban life are fundamental to good urban governance. Yet there are countless ways in which
income or social status affects people’s ability to participate in town life and access its resources. Even
when resources are available, public expenditure may be under allocated in gender terms.
For example, economic restructuring often impacts heavily on women, as cutbacks are concentrated on
health and social services, which support their domestic and caring roles (Moser, 1998). Women’s rights
to representation, as well as to basic services and other urban resources, cannot be denied if sustainable
development is desired, and there should be measures to ensure that gender equity is achieved and that the
benefits from development programmes and services are equally distributed and accessed by all,
regardless of gender. This should be monitored regularly towards sustainable development.

Proceedings of the Third International Research Conference 26th to 28th October, 2016 516
Role of Gender in Sustainable Development
The role of gender in sustainable development needs to take greater note of the role women play on
grounds of equity because women bear an unbalanced share poverty and also on the grounds of growth
because they play a vital role in productive activities, and in maintaining their families and households. It
is not enough to just provide resources and formulate development objectives with women in mind.
According to (Ingham, 1995), what is needed is a gender-sensitive culture, which involves changing
traditional perceptions of women and in particular rejecting cultural arguments for the subordination of
women. Linking gender equality with sustainable development is important for several reasons. It is a
moral and ethical imperative, according to (UNations, 2014). Efforts to achieve a just and sustainable
future cannot ignore the rights, dignity and capabilities of half the world’s population.
To be effective, policy actions for sustainability must redress the disproportionate impact on women and
girls of economic, social and environmental shocks and stresses. A way forward is to scrutinize programs
and policies through a gender lens, to challenge gender discrimination and to implement and deliberately
promote and enhance gender equal measures through gender mainstreaming by purposeful consideration
of gender in all stages of program and policy planning, implementation and evaluation, with a view to
incorporate the impacts of gender at all levels of decision making. Gender mentoring programmes need to
be put in place to ensure that gender equity and inclusion is monitored and evaluated yearly.
Background to Affirmative Action
Affirmative action is a set of measures adopted by governments and public and private institutions such as
political parties, educational establishments, corporations and companies to address a history of systemic
discrimination and exclusion of particular social groups or to encourage the efforts of particular social
groups in the interests of certain development goals. Affirmative action means taking a deliberate move to
reforming or eliminating past and present discrimination using a set of public policies and initiatives
designed to help on the basis of colour, creed, geographical location, race, origin and gender among
others (WilDAF, 2010).
Furthermore, (Ingham, 1995) proposes a commitment to people-centered development that requires
purposeful efforts to weaken the hold of such perceptions and to bring about more enlightened social
attitudes to women. This is because affirmative action takes into account under-representation and
insignificant occupation of positions by the minority in the society with the aim of offering equal
opportunity to all people. According to (Dzodzi, 2009), affirmative action is expected to improve
development indicators by reducing inequalities and facilitating the contribution of particular social
groups to development. It therefore relates to both the productive and distributive aspects of development.
While affirmative action may or may not arise from the agitation of disadvantaged social groups and
advocates, the state and its institutions are central to its design and implementation. Without public policy
in support of affirmative action, it cannot be adopted wholly and implemented.
Affirmative Action in Kenya
Debates on strong affirmative action in Kenya have been there for years. For example, Affirmative Action
Bill 2007 on 50 automatic seats for women in the 10th Parliament, met with strong opposition from the
general public. When it was subjected to opinion polling at the national level, where the pollsters had
asked the respondents of their thought on whether women deserved the 50 special seats in Parliament as
proposed in the Kenyan Constitutional (Amendment) Bill 2007.
In 2006, Hon. Mwai Kibaki declared the government’s commitment to implementation of an affirmative
action in recruitment and promotion of women in the public sector to create equity in employment of men
and women as well as promotion to senior positions where 30% of all job vacancies were to be reserved
for women (GOK, 2010). A survey done by the Ministry of Gender in 2009, while monitoring the 30%
affirmative action indicated that employment and promotion of women in the public service is tilted in
favour of men and that though some ministries had made efforts to employ and promote more women,
gender parity is still far from realization (GOK, 2010). Figures for recruitment of men and women
indicated 31.1% women, while men were at 67.9% of the workforce as at 31st December, 2009.

Proceedings of the Third International Research Conference 26th to 28th October, 2016 517
The affirmative action policy has been entrenched in the Kenyan Constitution. The Constitution of Kenya
chapter seven, article 81 (b) states, ― not more than two thirds of the members of elective public bodies
shall come from the same gender‖. This inclusion, as impressive and welcoming as it may be, seems to
negate one basic tenet of judicial justification; justice as fairness, and thus fails sensitiveness test. The
clause triggered a demand from the Kenya Women Parliamentary Association (KEWOPA) to set aside 80
seats in Parliament for women in the 11th parliament. This according to KEWOPA was to raise the
number of women parliamentarians, and to increase their contribution and influence on Parliamentary
business and ensure increased attention to issues affecting women. The questions many scholars are
struggling with are: do women deserve those positions because they are women? Or, because they are
capable? Or because they are left behind?
There seems to be too much interest taken in the welfare of the girl child in the current Kenyan society.
For example, The Kenya Universities and Colleges Central Placement Service (KUCCPS) always has
lower cut off grades for girls than boys. The cut-off grade for girls in the last intake (2014) was B- of 58
points and B of 60 points for boys, regardless of the environment where the candidates studied and sat for
the exams. However, there is still gender inequality in the top level decision-making level despite the fact
that on11th December 2012, the Supreme Court of Kenya delivered a majority decision that the
realization of the two-thirds gender principle under Article 81 (b) is progressive.
In its ruling, the Supreme Court directed that Parliament is under an obligation to have a framework on
realization of the two-third Gender rule by 27th August 2015. This remains a bill and the debate for and
against continues because as recent as 27th April, 2016, MPs fell short of the threshold of passing the
Constitution of Kenya Amendment No. 4 Bill of 2015 also known as the ‘Duale Bill.’ Only 195 MPs
voted for the Bill against the 233 MPs required passing it. In effect, 38 MPs refused to support the bill
despite being present. It is for that reason that National Assembly Speaker Justin Muturi ordered a fresh
voting after 199 legislators supported it, while 28 opposed (Assembly, 30th April 2015).
Why is a Gender-Sensitive Approach to Sustainable Development Needed? Sustainable development cannot be achieved without a more equitable distribution of resources today and
tomorrow: prevailing inequalities are deeply gendered as mentioned earlier. It is therefore important to
understanding this and act upon it is a key condition to achieving sustainable development (UNECE,
2012) asserts that taking women’s needs, concerns and their knowledge and skills into account will ensure
a better understanding of the dynamics in society which create and perpetuate gender inequality and
enable policymakers and other agents of change, including employers and civil society organizations, to
develop appropriate policy responses and actions. Equal participation in decision-making and a balanced
involvement of both men and women in implementation will ensure that they take equal responsibility for
today’s and future generations.
Some African countries have affirmed that gender equality is achievable by having women participation
in public decision making areas. Rwanda is leading with 56% women representation in parliament and is
also leading globally. The rest of the countries in that have achieved 30% women representation which is
the threshold are South Africa at 45%, Angola at 37.3%, Mozambique 34.8%, Uganda 30.7%, Burundi
30.5% and Tanzania 30.4% (UNDP, 2011). However, women in Kenya have not done well in
competitive politics since independence owing to social-cultural factors such as patriarchy, lack of
adequate resources needed to garner support of the electorate, gendered power relations and roles,
election violence and the fact that democracy, leadership and elective politics have traditionally
considered women and other marginalized groups to be part of the political leadership (Kabira and Mbote,
2015). In the 11th parliament, the number of women though being the highest decision making level
remains below constitutional required minimum at 19% (AMWIK, 2015).
CONCLUSION
Though Kenya has made an attempt towards attaining the development goals, the exclusion of women
from leadership and decision-making processes has led to inequality and skewed policies, increasing
women’s marginalization, poverty and insecurity. Women’s participation in leadership and decision
making in the social, economic and political spheres is crucial in ensuring good governance and
Proceedings of the Third International Research Conference 26th to 28th October, 2016 518
accountability. Socio-cultural impediments against women’s leadership, including pastoralist
communities, must be removed for all to participate equally in the development process.
Legitimate governance requires that affirmative action is taken to ensure representation of women in
governance at all levels. Decentralized governance and traditional leadership structures must be
responsive to women’s needs and concerns and include women as actors in decision–making.
Comprehensive support and mentoring women into political leadership and strengthening of
accountability of political structures to women constituencies must be enhanced so that women can
effectively influence policies through political systems, while national election systems and mechanisms
must be made more conducive to the participation of women in local, county and national governance and
leadership. Quality of governance must be audited by measuring the representation of women in decision
making in civil society, government and the private sector.
Sustainable development requires strong institutions underpinned by the rule of law (Oyugi, 2016).
Whatever challenges an economy might be facing, be it the need to overcome market failures,
strategizing/negotiating its relationship to the global neoliberal economy, attracting foreign capital,
maximizing state-interventionism.
Achieving gender equality and realizing the human rights, dignity and capabilities of diverse groups of
women and the marginalized is a central requirement of a just and sustainable world (UNWomen, World
survey on role of wome in development "Gender Equality and Sustainable Development, 2014). Kenya
need to implement the gazetted bill on two-third Gender Rules Law (Supplement No 52, 2015), so that
women can be equally represented in top level of decision making considering that parliament is the
highest institution where all should be equally represented so that no one is left behind as we all strive
towards sustainable development
REFERENCES
AMWIK, A. O. (2015). 86 and Counting: Women Leaders in Kenya's 11th Parliament. Nairobi: Heinrich
Boll Stiftung; East and Horn of Africa.
Ahikire, J. (2007). Gender Training and the Politics of Mainstreaming in Post-Beijing Uganda in M.
Mukhopadhyay and Wong "Revisiting Gender Training: The Making and Remaking of Gender
Knowledge. A Global Sourcebook. Amsterdam: KIT.
Assembly, K.N. (30th April 2015). Parliamentary Debates. Nairobi: Kenya National Assembly.
Dzodzi, T. (2009). Affirmative Action and the Prospects for Gender Equality in Ghanian Politics. Accra:
Abantu Women in Broadcasting and Friedrich Albert Stiftung.
Goetz, A. (2003). Women's Political Effectiveness: A Conceptual Framework. Zed Books.
GOK. (2010). 1st Bi-Annual Report on Implementation of 30% Affirmative Action on Employment and
Recruitment of Women in the Public Service. Nairobi: Government Printers.
Ingham, B. (1995). Economics and Development. Cambridge: McGraw-Hill Book Company.
Kabira, W., and Mbote, P.K. (2015). Gender Issues in Electorak Politics in Kenya: The Unrealized
Constitutional Promise. Balancing the Scales of Electoral Justice - Resolving Disputes from the
2013 Elections in Kenya and the Emerging Jurisprudence, 177 - .
Kamau, N. (2012, December). Gender, Masculinities and femininities and thie connection with sex and
gender-based violence. Violence and Women Participation in Electoral Processes: Challenges and
Prospects for the 2013 Elections in Kenya.
Merlily Porter, E.R. (1999). Feminists Doing Development: A Practical Critique.
Moser, C. (1993). Gender Planning and Development: Theory, Practice and Training. London: Routledge.
Nzomo, M. (2012). Gender Dimension of Representational Politics in Kenya: The Gender Quota and
Beyond. Nairobi: African Researcg Resource Forums (ARRF).
Oyugi, E. (2016). Merely Tinkering Status Quo will not Do. Nairobi: Social Development Network
(SODNET).
Philips, S.P. (2005). Defiing and Measuring Gender: A social determinant of health whose time has come.
International Journal for Equity in Health, 4-11.
Sen, A. (1999). Development as Freedom. New York: Knopf Publishers.

Proceedings of the Third International Research Conference 26th to 28th October, 2016 519
Supplement No 52, K.G. (2015). Two-Third Gender Rule Lawys (Amendment) Bill, 2015. Nairobi:
Government Printers.
Tondaro, S. (2015). Economic Development, 12th Edition. Harlow: Pearson Education Limited.
UN. (2014). Gender Equality and Sustainable Development. New York: United Nations.
UNations. (2014). Gender Equality and Sustainable Development: The World Survey on the Role of
Women in Development. New York: UN Women.
UNDP. (2009). Resource Guide: Gender in Water Management. New York: UNDP.
UNDP. (2011). Washington: United Nations Development Program.
UNECE. (2012). Empowering Women for Sustainable Development. Geneva: United Nations.
UNGlobal. (2016). Sustainable Development. New York: Department of Economic and Social Affairs.
UNWomen. (2014). The World Survey on the Role of Women in Development - "Gender Equality and
Sustainable Development". New York: United Nations.
UNWomen. (2014). World survey on role of wome in development "Gender Equality and Sustainable
Development. New York: United Nations.
WilDAF, G. (2010). Analysis of Affirmative Action Policy for Women's Participation. ******

Proceedings of the Third International Research Conference 26th to 28th October, 2016 520
Journal of Environmental Sustainability Advancement Research
J. Env. Sust. Adv. Res., ISSN: 2409-966X
Wants you to advertise
what you are doing in all spheres of research.
For about KES 2,000 (US$ 20), you can show the world what you are discovering in agricultural,
biological, business, educational, health, social and physical, scientific, technological and innovative
basic and applied research investigations, among others.
Sent a striking photograph of your work and a cover story to the address below plus the payment. The
photograph will grace one of the issues of JESAR.
Editor-in-Chief,
Journal of Environmental Sustainability Advancement Research,
C/O Chuka University,
Division of Academic, Research & Student Affairs,
P. O. Box 109-60400, Chuka, Kenya
Telephone: +254(0)20-2310512, +254-020-2021721
Email: [email protected]
Website: www.chuka.ac.ke
ANNOUNCEMENTS OR ADVERTS
The Fourth International Research Conference will be held in Chuka University from 25th to 27
th October,
2017. Manuscripts submission is ongoing to: [email protected]
Proceedings of the 3rd
International Research Conference are available in downloadable pdf format at:
www.chuka.ac.ke
The Third Volume of JESAR is in press. Submission of manuscripts for consideration of publishing in
JESAR is continuous. Therefore, hurry up and submit yours.

Proceedings of the Third International Research Conference 26th to 28th October, 2016 521
Journal of Environmental Sustainability Advancement Research J. Env. Sust. Adv. Res., ISSN: 2409-966X
OVERVIEW
The Journal of Environmental Sustainability Advancement
Research (JESAR) is published by Chuka University, Division of
Academic, Research & Student Affairs, P. O. Box 109-60400,
Chuka, Kenya, Telephone numbers: +254(0)20-2310512, +254-
020-2021721, Email: [email protected], Website:
www.chuka.ac.ke
The Journal of Environmental Sustainability Advancement
Research (JESAR) is a refereed periodical published in December
of each year. It is founded on the premise that the environment
encompasses all aspects that impact living things. The Journal
accepts a wide range of original environmental sustainability
studies papers derived from agricultural, biological, business,
educational, health, social and physical scientific, technological
and innovative basic and applied research works for publication to
impact society and humanity progressively for posterity.
Journal of Environmental Sustainability Advancement Research
(JESAR) shall be incorporated into the international network of
scientific journals and abstracted in Current Contents, Agricola,
Biosis, as well as other databases. Thus papers published in
JESAR shall be integrated into the world body of scientific and
artistic literature.
Initially submitted manuscripts should be emailed to:
[email protected], attention of Editor-in-Chief, Journal
of Environmental Sustainability Advancement Research, C/O
Chuka University, Division of Academic, Research & Student
Affairs, P. O. Box 109-60400, Chuka, Kenya. The cover letter
should include the corresponding author's full address,
telephone/fax numbers, and email address. Once received a
manuscript number will be emailed to the corresponding author.
Once the manuscript is accepted for publication, the corrected
draft should be emailed as one electronic file with the text, tables,
and figures. The final corrected manuscript should be submitted as
an e-mail attachment: [email protected], attention of
Editor-in-Chief, Journal of Environmental Sustainability
Advancement Research, C/O Chuka University, Division of
Academic, Research & Student Affairs, P. O. Box 109-60400,
Chuka, Kenya.
SUBSCRIPTION
Destination Institution Individual
Kenya K.Sh. 1,000 (US$10) K.Sh. 0,500 (US$05)
Africa K.Sh. 1,500 (US$15) K.Sh. 1,000 (US$10)
Rest of World K.Sh. 2,000 (US$20) K.Sh. 1,500 (US$15) All agents 5% discount on 25 and above copies
The payments should be sent to Chuka University in favour of the
Journal of Environmental Sustainability Advancement Research,
C/O, Chuka University, Division of Academic, Research &
Student Affairs, P. O. Box 109-60400, Chuka, Kenya, Telephone
numbers: +254(0)20-2310512, +254-020-2021721, Email:
[email protected], Website: www.chuka.ac.ke
EDITORIAL BOARD:
Chief Editor
Prof. Dorcas K. Isutsa, Ph.D., C/O Chuka University, P.
O. Box 109-60400, Chuka-Kenya
Managing Editor
C/O Division of Academic, Research & Student Affairs,
Chuka University, P. O. Box 109-60400, Chuka-Kenya
Associate Editors The following shall be some of the associate editors:
Shelmith W. Munyiri, Ph.D.
Charles O. Ombaka, Ph.D.
Colomba K. Muriungi, Ph.D.
Joyline M. Muchiri, Ph.D.
Moses M. Muraya, Ph.D.
Nelson O. Jagero, Ph.D.
Stephen K. Wambugu, Ph.D.
Lemmy M. Muriuki, Ph.D.
Production Manager
C/O Chuka University, P. O. Box 109-60400, Chuka-
Kenya
Advisory Board
Prof. Ekwamu Adipala, Ruforum, Makerere University,
P. O. Box 7062, Kampala, Uganda
Prof. Alexander I. Kahi, Egerton University, P. O. Box
536-20115, Egerton, Kenya
Prof. Anne Nangulu, Moi University, P. O. Box 3900-
30100, Eldoret, Kenya
Prof. Dorcas K. Isutsa, Chuka University, P. O. Box 109-
60400, Chuka, Kenya
Prof. Erastus N. Njoka, Chuka University, P. O. Box 109-
60400, Chuka, Kenya
Prof. Francis Wachira, ASARECA, P. O. Box 765
Entebbe, Uganda
Prof. Jackin N. Nanua, Pwani University, P. O. Box 195-
80108, Kilifi, Kenya
Prof. Japhet Ntiba Micheni, MALF, P. O. Box 34188-
00100, Nairobi, Kenya
Prof. Paul Okemo, Kenyatta University, P. O Box 43884-
00200, Nairobi, Kenya
Prof. Stanley M. Kagwanja, Chuka University, P. O. Box
109-60400, Chuka, Kenya
Dr. Richard Lesiyampe, MEWNR, P. O. Box 30126-
00100, Nairobi, Kenya
Dr. Stephen N. Mugo, CYMMIT, P. O. Box 1041-00621
Village Market, Nairobi, Kenya
Dr. Wilson Songa, MIED, P. O. Box 30547-00100,
Nairobi, Kenya
Consulting reviewers
Senior scholars within and outside Kenya in various
fields covered shall act as peer reviewers of scholarly
manuscripts submitted to this Journal.


Published by:
Chuka University
Division of Academic, Research and Student Affairs
P. O. Box 109-60400, Chuka, Kenya
Tel.: +254-020-2021721
E-mail: [email protected]; [email protected]
Website: www.chuka.ac.ke
Chuka University is ISO 9001:2008 Certified Inspiring Environmental Sustainability for Better Life