“2ND INTERNATIONAL CONFERENCE ON INNOVATIONS ...
515
Honorary Patronage of MECAHITECH 2010 Conference: Romania Ministry of Economy, Commerce and Business Environment and Romania Ministry of Education, Research, Youth and Sports - National Authority for Scientific Research MECAHITECH 2010 Organizers: National Institute of Research and Development for Mechatronics and Measurement Technique The Technical University Cluj-Napoca – Romania University Polytechnic of Bucharest – Research and Development Centre for Mecatronics - CCDM – Romania “Politehnica” University of Timisoara „Gheorghe Asachi” Technical University of Iasi Valahia University of Targoviste – Romania The General Association of the Engineers in Romania The professional association of the Romanian patronage of precision mechanics, optics and mecatronics – APROMECA Romanian Society of Mecatronics - SROMECA The Romanian Association of Precision Mechanics and Mecatronics from Romania - AMFOR Evaluation & Formation Center - MECATRON EUROP_RO EUropean RObotics Platform Romanian Branch “2 ND INTERNATIONAL CONFERENCE ON INNOVATIONS, RECENT TRENDS AND CHALLENGES IN MECHATRONICS, MECHANICAL ENGINEERING AND NEW HIGH-TECH PRODUCTS DEVELOPMENT” 23-24 September 2010 Bucharest, Romania
-
Upload
khangminh22 -
Category
Documents
-
view
2 -
download
0
Transcript of “2ND INTERNATIONAL CONFERENCE ON INNOVATIONS ...

Honorary Patronage of MECAHITECH 2010 Conference:
Romania Ministry of Economy, Commerce and Business Environment
and
Romania Ministry of Education, Research, Youth and Sports - National Authority for Scientific Research
MECAHITECH 2010 Organizers:
National Institute of Research and
Development for Mechatronics and
Measurement Technique
The Technical University Cluj-Napoca
– Romania
University Polytechnic of Bucharest – Research and
Development Centre for Mecatronics - CCDM – Romania
“Politehnica” University of Timisoara
„Gheorghe Asachi” Technical University of
Iasi
Valahia University of Targoviste – Romania
The General Association of the Engineers in Romania
The professional association of the
Romanian patronage of precision mechanics,
optics and mecatronics – APROMECA
Romanian Society of Mecatronics -
SROMECA
The Romanian Association of Precision Mechanics and Mecatronics from
Romania - AMFOR
Evaluation & Formation Center - MECATRON
EUROP_RO EUropean RObotics Platform Romanian Branch
““22NNDD IINNTTEERRNNAATTIIOONNAALL CCOONNFFEERREENNCCEE OONN
IINNNNOOVVAATTIIOONNSS,, RREECCEENNTT TTRREENNDDSS AANNDD CCHHAALLLLEENNGGEESS
IINN MMEECCHHAATTRROONNIICCSS,, MMEECCHHAANNIICCAALL EENNGGIINNEEEERRIINNGG
AANNDD NNEEWW HHIIGGHH--TTEECCHH PPRROODDUUCCTTSS DDEEVVEELLOOPPMMEENNTT””
23-24 September 2010
Bucharest, Romania

International Conference 2ND International Conference on Innovations, Recent Trends and Challenges
in Mechatronics, Mechanical Engineering and New High-Tech Products Development
MECAHITECH‘10
Bucharest, 23-24 September 2010
2
Honorary Patronage of MECAHITECH 2010 Conference:
Romania Ministry of Economy, Commerce and Business Environment
and
Romania Ministry of Education, Research, Youth and Sports - National Authority for Scientific Research
MECAHITECH 2010 Organizers:
National Institute of Research and Development for
Mechatronics and Measurement Technique
The Technical University Cluj-Napoca – Romania
University Polytechnic of Bucharest – Research
and Development Centre for Mecatronics - CCDM –
Romania
“Politehnica” University of Timisoara
„Gheorghe Asachi” Technical University of Iasi
Valahia University of Targoviste – Romania
The General Association of the Engineers in Romania
The professional association of the Romanian
patronage of precision mechanics, optics and
mecatronics – APROMECA
Romanian Society of Mecatronics - SROMECA
The Romanian Association of Precision Mechanics and
Mecatronics from Romania - AMFOR
Evaluation & Formation Center - MECATRON
EUROP_RO EUropean RObotics Platform Romanian Branch
NATIONAL ORGANIZING COMMITTEE
• Chairman: Ph. D Eng. Professor Gh. Ion Gheorghe • Vicechairman: Dr. Ec. Maria Marian Eng. Ion Vrabioiu Eng. Alexandru Moldovanu Eng. Anton Vieru Ec. Octavia Caruntu • Members: Eng. Iulian Ilie Eng. Ligia Petrescu Fiz. Liliana Badita Eng. Simona Istriteanu Dr. eng. Iulian Munteanu Eng. Cristian Sîrbu Eng. Valentin Gornoavă • Conference Secretary Andreea Popescu

International Conference 2ND International Conference on Innovations, Recent Trends and Challenges
in Mechatronics, Mechanical Engineering and New High-Tech Products Development
MECAHITECH‘10
Bucharest, 23-24 September 2010
3
International Programme Committee
Chairman Ph. D Eng. Professor Gh. Ion Gheorghe (RO)
Members: Ph.D Mario Lima (PT) Associate Prof. Dr. Silvio do Carmo Silva (PT) Ph.D Nuno Octavio Fernandes (PT) Ph.D Eng. Jan Hosek (CZ) Prof. Ph.D Eng. Ismar Alagic (B&H) Prof. Jorge Miranda Dias (PT) Prof. Ph.D Petru Boeriu (NL) B.Eng., M.Eng., M.Sc., Dr. Eng. Hieu Le (UK) Prof. Ph.D. Eng. Petr Novak (CZ) Prof. Ph.D Gencho Minchev (BG) Prof. Dr. Liviu Masalar (BE) Prof. Victor Sontea (MD) Prof. Ph.D Ion Stiharu (CA) Dr. Rajshree Mootanah (UK) Prof. Ph.D., D.Sc. Janusz Narkiewicz (PL) Drd.Eng. Irakli Premti (AL) Dr. Guido Tschulena (DE) Prof. Ph.D Eng. Vajk Istvan (HU) Prof. Ph.D Eng. Ecaterina Andronescu (RO) Prof. Ph.D.Eng. Radu Munteanu (RO) Prof. Ph.D Ion Cucui (RO) Prof. Ph.D.Eng Ion VISA (RO) Prof. Ph.D Eng. Vistrian Maties (RO) Prof. Ph.D.Eng Constantin NiŃu (RO) Prof. Ph.D Eng. MihăiŃă Mihai (RO) Prof. Ph.D Eng. Cornel Marin (RO) Prof. Ph.D Eng. Nicolae Alexandrescu (RO) Prof. Ph.D Eng. Octavian DonŃu (RO) Prof. Ph.D Eng Ioan Talpoş (RO) Prof. Ph.D Eng. Vasile Bratu (RO) Prof. Ph.D Eng. Dumitru Nedelcu (RO) Prof. Ph.D Dan Rotar (RO) Prof. Ph.D Dorin Dehelean (RO) Prof. Ph.D Eng. Mihaela BARITZ (RO) Prof. Ph.D Eng. Viviana Filip (RO) Prof. Ph.D Eng. Cătălin Spulber (RO) Eng. Alexandru Trufas (RO) Prof. Ph.D Eng Gheorghe Manolea (RO) Ph.D Eng. Doru Dumitru Palade (RO) Ph.D Eng. Diana Badea (RO)

International Conference 2ND International Conference on Innovations, Recent Trends and Challenges
in Mechatronics, Mechanical Engineering and New High-Tech Products Development
MECAHITECH‘10
Bucharest, 23-24 September 2010
4
CONTENTS
Paulo Borges , José Machado, Eurico Seabra, Mário Lima
A Formal Approach for Safe Controllers Analysis
9
Besnea Daniel, Baran Nicolae, Costache Adrian
Manufacturing Technology for a New Type of Profiled Rotor Used in the Construction of Rotating Machines
18
Mário Lima, Petr Zabka
Design and Analysis of Conjugate Cam Mechanisms for a Special Weaving Machine Application
28
łânŃu Magdalena, Dan Ursu
Under Nanometer Roughness Measuring Equipment Using Polarization Interferometry (TERSIP project activities carried out under the INNOVATION Programme)
39
João Ferreira, Paulo Rodrigues, Filomena Soares, José Machado
An approach for spasticity quantification based on the stretch reflex threshold
46
B. Miletsky The Intelligent Automatic Acoustic-Emission Control of Pipes over their Hydro Tests
54
Diana Mura Badea, Dumitru Vlad, Constantin Petre, Tudor Dragos Guta
Snow Removal Methods
57
Nuno Carvalho, Sandra Costa, Celina Leão, Filomena Soares, José Machado, Helena Rodrigues
A Network Configuration for Industrial Systems Control
65
M. Mărgăritescu, C. Brişan, N. Alexandrescu, C. RoaŃ, A.M.E. Ivan, V. Văduva
The Workspace of a Double Hexapod Robot 77
Rotar Dan Automatic Headlight Position Control with Microcontroller
83
Stanca Comşa, Adrian Pacioga, Doina Gheorghiu
Micro Systems For Controlled Delivery Of Drugs Solutions In Ophthalmic Treatments
96
Cornel MARIN
Transfer Factor, Mechanical Active and Reactive Power of Vibrations using Burgers Parametric Model in Active Isolation of Structures
102

International Conference 2ND International Conference on Innovations, Recent Trends and Challenges
in Mechatronics, Mechanical Engineering and New High-Tech Products Development
MECAHITECH‘10
Bucharest, 23-24 September 2010
5
Bogdan Manea, Zastulka Ivan, Stanca Comşa, Adrian Pacioga, Doina Gheorghiu
Intraoral X-Ray Imaging Unit In Dentistry 114
Băran Nicolae , Besnea Daniel, Duminică Despina
The Influence of Technical and Constructive Parameters on the Performances of a Rotating Machine with Profiled Rotors
119
Dan Ciobota, Comsa Stanca, Adrian Pacioga, Doina Gheorghiu, Deniz Demirtas
New Technologies For Building Complex Prosthetic Elements From Biocompatible Metals
125
A. Tkachenko Integrated Intelligent Systems of Non-Destructive Testing – Pledge of Quality of Manufacture of Welded Tubes for the Main Pipelines
135
A. Tkachenko
The Intelligent system of Automatic Tracking Behind the Welded Seam at the Ultrasonic Testing of Pipes
146
Jan Hošek, Martin Daněk
Full Metal Micro Gripper Made by Electro Discharge Technique
155
Vlad Vaduva, Diana Mura Badea, Dumitru Vlad, Tudor Dragos Guta, Constrantin Petre
Autonomous Snow Cleaning Robot 163
Mircea Vladescu, Paul Ciprian Patic
Pressure Regulators Performance For Pneumo-Electronic Devices Type’s Supplier Witout Wembranes For Dimensional Measuring
167
A. Tkachenko, V. Kirijakov
The Intelligent Ways of Definition of Type of Defect at the Automated Ultrasonic Testing a Welded Seam
172
Mircea CopoŃ, Ioan Lung, Alexandru Moldovanu
Development of the Multidisciplinary Research Base in the Field of Medical Nanorobotics in Romania
177
Andrioaia Dragos, Rotar Dan
Study on the Creation of a Robotic Manipulator with an Electromagnetic Gripping Device
190
Iulian Vasile, Alexandru Constantinescu
Use of Linear Motors in Complex Mechatronics Systems of Control and Positioning of High Precision
199

International Conference 2ND International Conference on Innovations, Recent Trends and Challenges
in Mechatronics, Mechanical Engineering and New High-Tech Products Development
MECAHITECH‘10
Bucharest, 23-24 September 2010
6
Stefan Vaduva; Gh.Ion Gheorghe
The Technical Impact of the New Generation of Digital Electronic Tachographs According to the European Directives
206
Teodor Daniel Mindru, Ciprian Dumitru Ciofu, Dumitru Nedelcu
Some Aspects Regarding The Simulation Of Injection Process
212
Karolina Macuchova, Josef Zicha, et al.
Use of Flexural Hinges in the Design of Terrestrial Telescope
217
Adriana Carmen Cîrstoiu Surface Roughness Evaluation in Turning
Based on Abbott – Firestone Curve 223
L.C. Hieu , J.V. Sloten, L.T. Hung, L. Khanh, S.Soe, N. Zlatov, L.T.Phuoc, P.D. Trung
Medical Reverse Engineering Applications and Methods
232
Rotar Dan Software for The Minimization of The
Combinational Logic Functions 247
Vlad Vaduva
Potential Fields Method : Theoretical and Experimental Analyze of the Algorithm
253
Rotar Dan
Optical Tracking Method for Mechatronic Systems
257
Sorin Alecsa
The Influence Of Non-Linear Elastic Systems On The Measuring Precision Of Measuring And Control Systems For Moments/Forces In Static Mode
265
P.J.S. Gonçalves, P.M.B. Torres
Extracting Bone Contours in Ultrasound Images: Energetic versus Probabilistic Methods
274
St. Ganatios, O. Dontu , D. Besnea, R. Ciobanu, I. Avarvarei
Integrated Design Solutions - CNC Manufacturing for Complex Products
284
Iosif Samota, Octavian Dontu, Robert Ciobanu, Daniel Besnea, Iulian Avarvarei
Low Intensity Ultrasound Treatment for Acceleration of Bone Fractures Healing
289
C. Delavet, O. Dontu, D. Besnea, I. Avarvarei, R. Ciobanu
Manufacturing Modular Elements for Laser Pumping Cavities
293
Iosif Samota, Octavian Dontu, Daniel Besnea, Robert Ciobanu, Iulian Avarvarei
Treatment of Traumatized Thermal or Chemical Alive Human Tissues in Ultrasonic Field in The Presence of Sterile Endogenous Hydrolisys
302

International Conference 2ND International Conference on Innovations, Recent Trends and Challenges
in Mechatronics, Mechanical Engineering and New High-Tech Products Development
MECAHITECH‘10
Bucharest, 23-24 September 2010
7
Georgios Charalampides, Octavian Dontu, Gheorghe I. Gheorghe, Daniel Besnea, Iulian Avarvarei, Robert Ciobanu, P.Beca
Welding of Active Diamond Elements on Cutting Disks Using CO2 Laser
306
Gheorghe Popan, Anton Vieru, Sorin Munteanu
Trends in Fotovoltaic Cells Nanotechnology 311
Daniel do N. Melo, Leonilde Varela, S. Carmo-Silva
Collaborative Product Development - A Groupware System Based on Service Oriented Architecture
317
Aleš Gregor, Jan Hošek 3D Printing Methods of Biological Materials
used in Tissue Engineering 327
P.J.S. Gonçalves; N.O. Fernandes
RULAmatic – A Semi-Automatic Posture Recognition System for RULA Risk Evaluation Method
337
Irakli Premti Modeling of Smart Structures. Implementation
Of Control Techniques For Smart Structures 345
Despina Duminică, Mihai Avram
Criticality Assessment Using Fuzzy Risk Priority Numbers
349
Ricardo Magalhães, Leonilde R. Varela, S. Carmo-Silva
Web-based Decision Support System for Industrial Operations Management
357
Mihaela Baritz, Diana Cotoros, Ion Balcu
Development of a Posture-sensorial Modeling and Analysis 3D Structure for the Human Bio-system Involved in Motilitate Activities
367
Filipe Rocha, Leonilde R. Varela, S. Carmo-Silva
A Document-oriented Web-based Application for Supporting Collaborative Product Development
377
AluŃei Adrian, Vistrian Mătieş, Tătar Mihai Olimpiu, Scrob Alin
Considerations Regarding Mechatronic Systems for Exploration Tasks
387
Pedro Salgado, Leonilde R. Varela
Cellular Manufacturing with Kanbans Optimization in Bosch Production System
393
Rareş Ciprian Mîndru, Vistrian Mătieş, Adrian Ioan Cosma
Bond Graph based model of the fluidic actuators
411
Mihai Avram, Constantin Bucşan
Pneumatic Distributors - A Study Regarding the Development Trends
417

International Conference 2ND International Conference on Innovations, Recent Trends and Challenges
in Mechatronics, Mechanical Engineering and New High-Tech Products Development
MECAHITECH‘10
Bucharest, 23-24 September 2010
8
Leonilde R. Varela, Telmo Pinto
Comparing Extended Neighborhood Search Techniques Applied to Production Scheduling
425
Mihai Avram, Adrian Miu, Victor Constantin, Constantin Bucşan
The Hardware Structure of a Robotized System Used as a Chess Partner
436
Ioan Adrian Cosma, Vistrian Mătieş, Rareş Ciprian Mîndru
Dynamic Model and Control of Electroactive Polymer Actuators
441
Mihai Avram, Adrian Miu, Victor Constantin, Constantin Bucşan
Working Program for a Chess Playing Robot 447
Cristian Logofatu; Aurel Abalaru; Daniela Cioboata; Danut Stanciu
Computerized System for Controlling Package Encasing in the Food Industry
453
Mihaela Baritz, Todor Ana Viorela
Some Considerations about Pedestrian Biomechanical Behavior Affected by Audio and Visual Stimuli Perception
460
D. N. Olaru, A. Dumitrascu, C. Stamate and Gh. Prisacaru
Influence of Normal Load and Microball Diameter on Rolling Friction Torque in Microsystems
466
Sorea Sorin, Popan Gheorghe, Atanasescu Anca
Nanotechnology and Solar Cells 473
N.O. Fernandes, S. Carmo-Silva
Improving the Delivery Performance of the WLC concept
477
Popan Gheorghe, Chiriac Horia, Gheorghe Marian, Tom Savu, Dan Ursu
Nanotechnological Measuring System 486
Doina Bucur, Mihaela Buzatu, Luminita Dumitru, Alina Iliescu, Sorin Vreja, Mircea - Iulian Nistor, Sorin Kostrakievici
Optoelectronic Dynamic Evaluation Methods of a Subject With a Prosthetic Limb
492
Sorin Kostrakievici, As. Mircea Iulian Nistor, Doina Bucur, Cristian Dobreci
Considerations on Dental Implants Fixation 502
Vlad Cârlescu, Florin Breabăn, Dumitru Olaru, Gheorghe Prisăcaru
A Technique for Dynamic Characterization of Dielectric Elastomers
508
Gh. Ion Gheorghe, P.Beca, A. Vieru, Octavia Căruntu, N. Alexandrescu, C. Marin, L. Cristea, V. Dunca, M. Stoica
The Development of Education for the viability of labour market through the innovative vectors: MECHATRONICS – INTEGRONICS (M&I)
512

International Conference 2ND International Conference on Innovations, Recent Trends and Challenges
in Mechatronics, Mechanical Engineering and New High-Tech Products Development
MECAHITECH‘10
Bucharest, 23-24 September 2010
9
A Formal Approach for Safe Controllers Analysis
Paulo Borges
Mechanical Engineering Department, CT2M / University of Minho Campus of Azurém, 4800-058 Guimarães, Portugal
José Machado Mechanical Engineering Department, CT2M / University of Minho
Campus of Azurém, 4800-058 Guimarães, Portugal [email protected]
Eurico Seabra
Mechanical Engineering Department, CT2M / University of Minho Campus of Azurém, 4800-058 Guimarães, Portugal
Mário Lima Mechanical Engineering Department, CT2M / University of Minho
Campus of Azurém, 4800-058 Guimarães, Portugal [email protected]
ABSTRACT
Formal verification of real-time systems software is a complex and hard task, for several reasons. There are multiple works developed in the domain of formal verification of real-time systems behavior by model-checking, and some software tools were developed for this purpose. One of the most complex problems to be solved in the analysis of real-time controllers is the conversion of controllers programming languages in formal languages, for instance finite timed automata, in order to be used as inputs of the existing model-checkers. If the methodology of programming is well developed and known, this task can be improved in order to improve safety and reliability of the obtained controllers. Moreover, most real-time systems (especially embedded systems that we intend to study) are programmed in C language. This paper aims to establish the methodology of creating C code programs, from SFC specification formalism, taking into account the formal verification of desired properties for the system behavior, using the Model-Checking technique and the model-checker UPPAAL.
Keywords: safe controllers, real-time systems, embedded systems, formal verification, specification formalisms INTRODUCTION
A Real-time embedded real-time system is a system that has specific characteristics for specific applications always associated with temporal goals, reliability, safety, size and complexity of the coordination of tasks. These systems can be classified as critical and non-critical, depending of associated specifications, requirements and applications. The distinction between these two types of systems is made according the result that a failure

International Conference 2ND International Conference on Innovations, Recent Trends and Challenges
in Mechatronics, Mechanical Engineering and New High-Tech Products Development
MECAHITECH‘10
Bucharest, 23-24 September 2010
10
may cause. For instance, some production systems, banking systems are non-critical real time systems. In the case of critical systems, the consequences of a malfunctioning could be, in some cases, devastating for human life or may involve high economic losses. For instance, flight control systems, control systems for nuclear power plants, control of satellites, and others of the same kind, can be considered as critical real-time systems.
These systems are often complex and constantly interact with their environment by receiving input data, processing them in real time and generating outputs. Their behavior is constrained by temporal conditions, sometimes extreme, and they must generate a response in time, previously specified, related with expected or unexpected external behaviors.
Response actions, in real-time embedded systems, follow a programmed sequence of specific activities, with fixed and predetermined periods of time. These periods of time are generally met when the system operates normally without any failures of components. The problem arises when some component fails involving, as consequence, placing the system in safe mode, and can, for instance, in the case of a satellite control, cause the loss of it, due to the delay in response when some unexpected external conditions happen..
According to Stankovic, (1996) [1] "A Real Time System (RTS) is the one in which his correctitude depends not only on the logic of computation, but also the fulfillment of time in delivering results."
According to Shaw (in 2001) [2], a real-time system is composed by two parts: the control system, comprising the man-machine interface, and controlled system. The control system is responsible for responding to environmental stimuli in time. "It is said reactive because its primary task is to respond or react to signals from the environment." For instance, in an automated factory, the control system consists of a computer and man-machine interfaces that manage it and coordinate the activities at the factory. The interfaces are the network communication between the control system and controlled system. Generally, they are sensors, actuators, receivers of radio signals, among others. The controlled system is the environment that interacts with the computer, for instance, assembly lines and its various parts [1]. It is essential that the plant shall conform to the response time.
In industrial automation some systems are really critical and some techniques are used to avoid damages. Among these techniques, the most important are Simulation and Formal Verification.
Formal verification of algorithms has been studied in science in recent years [3] [4], and
it has been applied successfully to analyze, for instance, digital circuits and software [5]. In the context of the software verification, the obvious purpose of verification is to verify that the control system satisfies a given set of requirements. These requirements can be formulated considering the control system, the controlled system or both. Several approaches that use formal verification for designing safe controllers can be found in the literature, see for instance [6] [7] [8] [9].They differ concerning the representation of the system and controller, the properties behavior for the system and computational techniques.
This paper aims to propose a methodology for design of real-time embedded systems that are used in computers on board of satellites.
The main goal is to use analysis techniques, used in industrial automation field, well known and well tested for obtaining safe controllers for aerospace systems. In order to accomplish the main goal of this paper, some sections are related. The next section presents some particularities of aerospace systems. Further, it is presented a comparison between industrial systems and aerospace system, in order to illustrate how useful can be using some

International Conference 2ND International Conference on Innovations, Recent Trends and Challenges
in Mechatronics, Mechanical Engineering and New High-Tech Products Development
MECAHITECH‘10
Bucharest, 23-24 September 2010
11
well structured formalisms (usually used in industrial automation field) to help structuring and obtaining the C program code, usually developed for real-time embedded systems, for aerospace applications. Finally, it is presented, and discussed, a coherent approach to be used for obtaining safe controllers, and further, some conclusions and future work are also presented.
These preliminary studies are presented on the context of a research collaboration project being developed by researchers of CT2M, ALGORITMI and CCTC research centers of University of Minho (Portugal) and the Mechanical Engineering Department of Technological Institute of Aeronautics (Brazil).
SPECIFICITY OF AEROSPACE SYSTEMS
The development of software code for aerospace systems is a hard and complex task that involves a lot of human and financial effort. The reusing of parts of code, for similar applications, is usual and this practice can lead to catastrophic situations because some unexpected events may occur with new applications considering old parts of code.
Several accidents have occurred on satellites due to specification errors or lacks [10]. On June 4, 1996, Ariane 5, on its inaugural flight, crashed 40 seconds after the start of the flight sequence in an altitude of 2700 meters. It was acknowledged in the report that the main cause of the accident was due to complete loss of guidance and attitude information at 37s after starting the engine ignition. The mentioned loss of information was due to specification errors in software development of the inertial reference system. The software had been reused from Ariane 4, and contained parts of code unnecessary for Ariane 5, which were also already unnecessary for Ariane 4.
On April 3, 1999, Titan IV B-32/Centaur TC-14/Milstar-3 was launched from Cape Canaveral [11], whose aim was to put into geostationary orbit. Due to failure in software development the satellite lost attitude control deviating from its orbit by placing an orbit incorrect and unhelpful.
As illustrated above, the software plays an increasingly essential role in aerospace systems. An inadequate development of software may cause catastrophic accidents. The reuse of code in aerospace systems is a reality, a reality which has its advantages and disadvantages. As mentioned above, Ariane 5 has exploded by misspecification in code that had been used in an earlier satellite, with functions that already existed in Ariane 4 but were not required in any of them. Good specifications that include requirements for traceability and reasoning are crucial to the design of complex control systems, especially where part of the code is reused. The specifications must be clear and easily understood by engineers and must allow a fast detection of possible errors or mistakes.
In order to increase the reusability of code, specific information is left out of the specification or, if included, it is identified as aspects in order to change in future applications.
It is also noted that code reusing is possible, only, because most of the satellites often require almost the same functions.
Programming in C
The C programming language, created in the 70s and standardized by ANSI in 1983, is a medium level language, where the code can be low-level and also allows high-level bit manipulation instructions or memory. It is used to program microcontrollers and it is also

International Conference 2ND International Conference on Innovations, Recent Trends and Challenges
in Mechatronics, Mechanical Engineering and New High-Tech Products Development
MECAHITECH‘10
Bucharest, 23-24 September 2010
12
used in most embedded systems. Although very general language, it is a little flexible language [12], with many maintenance problems and without any graphical structure. Beyond these disadvantages, there is another problem not least important, that is the absence of formal verification techniques as well as the lack of specification methods to structure C programs, even if this exist some Model-Checkers that accept C code as input language [13].
The C language, like others, allows deficient structuring of programs, difficulties in reusing of code and a lack of flexibility in programming, so it is necessary to use different formalisms that help obtaining the code for these control systems.
Programming languages are based on sets of algebraic expressions such as those resulting from the combination of problems of combinatorial or sequential nature. But, in industrial automation, it is intended the obtaining of algebraic expressions resulting from the translation of formal models defined when using rigorous and well known formalisms such as, for instance, the SFC [14], statecharts [15] or the Networks Petri [16] among others.
INDUSTRIAL CONTROLLERS VERSUS AEROSPACE CONTROLLERS
The Programmable Logic Controllers (PLCs) are increasingly used in several application areas, especially in critical safety areas.
Like an embedded system, a PLC is programmed with a specific language. Embedded systems and PLCs have some similarity, both are programmable logic controllers, react with the external inputs and generate outputs according an internal program. They are also based on technologies of microprocessors, programmable logic with their limitations, such as limiting the frequency of internal operation. Based on these principles, some authors [17] begin to treat embedded systems like PLCs enjoying the available support tools to industrial automation systems, mainly some used formalisms.
Taking into account aerospace systems, where the controllers’ programming language is C, one of the proposed challenges is the use of mathematical formalisms to support obtaining the C code. The first step is to choose a formalism and then to develop translation techniques from this formalism to C code. With the systematic methodology of translation of a formalism to C code, the reutilization of small parts of code and the organization of the program would be considerably improved.
Some authors [18] tried, before, to use formalisms from the industrial automation field in order to develop some techniques of translation of these formalisms to the C programming language code. The translation that they have developed is from Sequential Function Chart - SFC [14] to the C programming language. This translation is based on mathematical concepts and eliminates some possible human mistakes when compared to doing this translation, without any associated methodology. One of the lacks of this work seems to be not considering the behavior of the controller device where the code is going to be introduced. It is not, only, necessary to translate the formalism, but to consider, too, the behavior of the controller where the code will be implemented.
USED FORMALISM
The task of design of an automation system obeys to different rules and is independent of the used formalism. A possible methodology for designing an automation system is illustrated in Figure 1..

International Conference 2ND International Conference on Innovations, Recent Trends and Challenges
in Mechatronics, Mechanical Engineering and New High-Tech Products Development
MECAHITECH‘10
Bucharest, 23-24 September 2010
13
Figure 1: Phases of the design, implementation and verification of a command system for Industrial Automation A total reflection of needs (production goals, objectives of automation,…) allows a
precise definition of the functional specifications of an automation system. It is possible to make the parallel study of the controller and the physical plant. Each of these studies leads to the existence of the specification, realization, implementation, testing and integration of the system.
The integration of all steps of this study, in a coordinated way, and final testing of the set, allowing the automation system enter in the phase of exploitation.
In an analysis of the existing formalisms for modeling the desired behavior for aerospace systems there are some, more or less used, by their nature: from the finite automata [20], Petri nets [16], SFC [14] Statecharts [15] it is concluded that any of these formalisms can be used in specific specification of the behavior of these systems. The choice of a formalism, in this context, is not important; the most important is to use one of them, in a correct manner. For example, the behaviors that can be modeled by finite automata or Petri nets are the same (if we choose the adequate class of automata), just changing the complexity and comprehensibility of the obtained model. Moreover, the obtained model can be more or less compact. The factor "time", very important in the analysis of real-time systems, can also be considered. The choice will lie with the formalism or formalisms that are better adapted, for instance, for the application of simulation techniques and formal verification, which is intended for obtaining safe controllers.
The finite automata are widely used for modeling and formal verification of safe systems, widely desirable for the software design which is important for any process control. In general, the software is closely connected with the system that must be controlled. Verification of this is done by building an abstract model of the system, and then checked whether it fulfills the desired requirements. Because there are many model-checkers that accept a state model as input, the tasks of verification would be facilitated if a controller is modeled with finite automata, but the major problem of using finite automata is the complexity of models that often are needed to describe more complex behaviors. Thus, the choice must lie in a formalism with a greater capacity for abstraction, which is graphical and easily understood and with an abstraction degree sufficiently close to implementation.

International Conference 2ND International Conference on Innovations, Recent Trends and Challenges
in Mechatronics, Mechanical Engineering and New High-Tech Products Development
MECAHITECH‘10
Bucharest, 23-24 September 2010
14
Given the characteristics listed above, Petri Nets, Statecharts and SFC would be good choices. We believe that SFC formalism may be a slight advantage due to intuitive graphical interpretation and normalization, and it is also possible to consider and model the time [14]. In addition, there are some consolidated works dealing with translation of this formalism to C programming language [17]. Also, some consolidated works of translation of this formalism [21] [22] for the model-checker UPPAAL [23] are available, specially developed and designed for checking real-time systems. Thus, if developed a specification for these systems entirely in SFC and if is subsequently simulated and formally verified with UPPAAL model-checker and, further, if the formalism is systematically translated to C language, we can say that our software is reliable and safe. This exist also the possibility of verifying that software developed in C language, using model-checkers that accept C language as input [17].
SYSTEMATIC METHODOLOGY FOR DESIGNING AEROSPACE SYST EMS
The proposed methodology is divided in two main steps and has, as main goal, to obtain safe C program code from a SFC specification. In the first step (figure 2), some tools and techniques are used in order to assure the quality of the SFC specification and – after being sure that the obtained specification satisfies the intended behaviors for the system - on the second step (figure 3) the goal is to translate (in a systematic way) the safe SFC specification to C code.
Figure 2: Formal verification of specification SFC, considering models of the physical system: step 1 of
the proposed systematic approach for obtaining safe controllers, reliable for aerospace systems

International Conference 2ND International Conference on Innovations, Recent Trends and Challenges
in Mechatronics, Mechanical Engineering and New High-Tech Products Development
MECAHITECH‘10
Bucharest, 23-24 September 2010
15
The first step (Figure 2) consists of the formal verification of the SFC specification considering a model of the specification itself. This model is systematically translated to timed automata [21]. This verification must also consider formal models of satellites behavior and ground station. If there is certain, that safe properties must be verified without a plant model (where plant models are not considered), the Liveness properties, must be verified considering plant models [24].The desired behavior properties must be translated into Timed Computation Tree Logic (TCTL) [25].
Until the specification is correct - through successive use of Model-Checker UPPAAL and using simulation and formal verification techniques - the procedures, illustrated in figure 2, must be followed. The specification must be changed as many times as necessary till obtaining a specification that accomplishes all desired behavior properties for the system, proved by formal verification.
After the specification be correct the second step can occur (Figure 3) where a systematic translation of the specification [17] will origin a C code with high levels of reliability and safety.
Figure 3: Translation systematic specification SFC (formally verified the model-checker UPPAAL) to C
code: Step 2 of the proposed systematic approach for obtaining safe controllers, reliable aerospace systems
Thus, we think that it is possible to obtain high levels of reliability and safety of these
programs. It is certain, however, that a subsequent formal verification of C code, itself, may further increase these levels but, despite the existing work in this area of verification of C code, there are still many difficult tasks related with formal verification of code [26].
The main advantage of doing formal verification on specification and not on the code is the detection of errors or mistakes earlier in the process of design of these controllers. The detection of an error, or mistake, only in the C program can imply high losses of time and, even, to compromise a mission.

International Conference 2ND International Conference on Innovations, Recent Trends and Challenges
in Mechatronics, Mechanical Engineering and New High-Tech Products Development
MECAHITECH‘10
Bucharest, 23-24 September 2010
16
CONCLUSIONS AND FUTURE WORK
In this paper it was presented a systematic approach for the design of safe controllers for aerospace systems. This is an on-going work and this approach seems to be promising.
This paper corresponds to the preliminary studies carried out under a research collaboration between the centers CT2M, ALGORITMI and CCTC of University of Minho, Portugal, and Department of Mechanical Engineering Institute of Aeronautical Technology, Brazil, aiming the development and application of some techniques for obtaining real-time embedded controllers reliable and safe. Results of the application of the presented approach are becoming satisfactory, and these results are not here described or specified. They will be, so, in further publications.
The use of well known formalisms and techniques allow us to obtain good results in order to obtain reliable and safe controllers for this specific application.
REFERENCES
[1] Stankovic, John A. “Real-time and embedded systems”, 28 (1).ACM Computing Surveys. 1996
[2] Shaw, Alan C. “Real-time Systems and Software”, (first edition), New York. 2001
[3] Kurshan, R. “Computer-Aided Verification of Coordinating Processes: The Automata-Theoretic Aproach.” Priceton Univ. Press. 1994
[4] Clarke, E., Grumberg, O., and Peled, D., “Model Checking”. MIT Press. 1999
[5] Clarke, E. and Wing, J. “Formal methods: state of the Artandi future directions”. ACM Comp.Surveys. December 1996;28,4.
[6] Tomlin, C., Mitchell, I., Bayen, A., and Oishi, M. “Computational techniques for the verification of hybrid systems.” Proc. of the IEEE. 2003;91,7.
[7] Havelund, K., Larsen, K., and A-Skou ”Formal verification of a power controller using the real-time model checker UPPAAL2K.” in Proc.5th AMAST Workshop. 1999;277.
[8] Kapinski, J. and Krogh, B. “A new tool for Verifying computer controlled systems. Conf.” on Computer-Aided Control System Design, IEEE 2002;98.
[9] Stursberg, O., Kowalewski, S., Preussig, J., and Treseler, H. “Block-diagram based modeling and analysis of hybrid processes under discrete control.” J. Europ. des Syst.Automatises. 1998;32,9-10.
[10] Leveson, NG. “The role of software in aerospace accidents.” AIAA Journal of Spacecraft and Rockets (in press). 2003.
[11] Pavlovich, JG, “Report of Formal Investigation of the 30 April 1999 Titan IV B / Centaur TC-14/Milstar-3 (B-32) Space Launch Mishap.” U.S. Air Force. 1999
[12] Gupta, G. “Reliable software construction: a logic programming based methodology.” Proced. fith of IEEE International Symposium on High Assurance Systems Engineering,

International Conference 2ND International Conference on Innovations, Recent Trends and Challenges
in Mechatronics, Mechanical Engineering and New High-Tech Products Development
MECAHITECH‘10
Bucharest, 23-24 September 2010
17
IEEE. 2000;140.
[13] Clarke, E., Kroening, D., and Lerda, F. ”A tool for checking ANSI-C programs.” In K. Jensen and A. Podelski, editors, cups, 2004, (vol. 2988 of Lecture Notes in Computer Sc IENCE, pages 168-176).Springer. 2004.
[14] EN 2002 – “European Standard 60 848: GRAFCET specification language for sequential function charts.” 2002.
[15] Harel , D. “Statecharts: A visual formalism for complex systems.Science of Computer Programming.” 1987;231.
[16] Meda-Campaña, ME and Lopez-Mellado E. ”Incremental synthesis of petri net models for identification of discrete event systems.” Proceedings of the 41st IEEE Conference on Decision and Control.. Las Vegas, Nevada USA. December 2002.
[17] Bayo-Puxan, O., Rafecas-Sabaté, J., Gomis-Bellmunt, O., and Berger-Jané, J. “GRAFCET-compiler methodology for C-programmed microcontrollers.” Assembly Automation Emerald Group Publishing Limited. 2008;55.
[18] Clarke, E., Kroening, D., Sharygina, N., and Yorav, K. “Predicate abstraction of ANSI-C programs using SAT.” (FMSD) Formal Methods in System Design,. 2004;25,105.
[19] Lewis, RW. “Programming Industrial Control Systems Using IEC 1131-3.” The Institution of Electrical Engineers. London. Revised edition. 1998;5.
[20] Klein, S. “isttable; fault detection of discrete event systems using an identification approach.” Doctoral Thesis. University of Kaiserslautern, Kaiserslautern. Juny 2005.
[21] Remelhe, MP, Lohmann, S., Stursberg, 0., and Engell, S. “Algorithmic Verification of Logic Controllers Given the Sequential Function Charts.” IEEE International Symposium on Computer Aided Control Systems Design Taipei. Taiwan. 2004.
[22] Stursberg, O., Lohmann, S., and Engell, S. “Improving dependability of logic controllers by algorithmic verification.” IFAC World Congress. Czech Republic. 2005;16,1.
[23] Gourcuff, V. “Verification of a timed multitask system with UPPAAL.” Memory of DEA Lurpa. ENS Cachan from. 2004.
[24] Machado, J., Denis, B. and Lesage, JJ. “A generic approach to build plant models for DES verification purposes.” Proc. of Wodes'2006 - 8 th Workshop on Discrete Event Systems. Ann Arbor, Michigan, USA. July 2006.
[25] Alur, R., Courcoubetis, C. and Dill, DL. “Model-checking in dense real-time.” Information and Computation. 1993;104,1.
[26] Ball, T., Podelski, A. and Rajamani, SK. “Boolean and cartesian abstractions for model checking C programs.” In T. Margara & W. Yi (eds.)LNCS. Springer Berlin Heidelberg. 2001;268.

International Conference 2ND International Conference on Innovations, Recent Trends and Challenges
in Mechatronics, Mechanical Engineering and New High-Tech Products Development
MECAHITECH‘10
Bucharest, 23-24 September 2010
18
Manufacturing Technology for a New Type of Profiled Rotor Used in
the Construction of Rotating Machines
Besnea Daniel, Baran Nicolae, Costache Adrian POLITEHNICA University of Bucharest
Department of Mechanical Engineering and Mechatronics 313, Splaiul Independentei, 060042, Bucharest, Romania E-mail: [email protected]; [email protected]
ABSTRACT
The paper presents a mathematical model that establishes the coordinates (xi, yi) of the outline of a profiled rotor. A software that computes these coordinates is developed for a series of rotor dimensions. Based on these coordinates, the 3D model of the rotor is built using the software package CATIA V5. An appropriate post-processor generates a NC Code program written in ISO language, in order to manufacture the rotor on a vertical CNC center. Finally, the operation sheet regarding the design and manufacturing of the profiled rotor is presented. The demonstration model of the profiled rotor will integrate the construction of a rotating machine that will represent the purpose of a scientific research contract in 2011.
INTRODUCTION
As purpose of a scientific research contract concluded between the National Center for Program Management (CNMP) and the Institute for Conception, Research and Design in the Field of Thermo-Energetic Equipment (ICCPET), the partner “POLITEHNICA” University of Bucharest – Department of Mechanical Engineering and Mechatronics engaged itself to elaborate a technical project for a rotating thermic machine that would generate 10 kW. The thermic machine is in fact a rotating steam motor based on a patent [1]. In the frame of this research project [2], the research team from the Department of Mechanical Engineering and Mechatronics has to solve the following task: “Technical project - experimental model of the steam machine”. The main problem is represented by the construction of the profiled rotor that integrates the machine. The model of a new type of profiled rotor is presented in continuation, as well as the operating sheet corresponding to its manufacturing.
THE COMPUTATION OF THE OUTLINE OF THE PROFILED ROTO R
Figure 1 presents in the horizontal plane the profiled rotor with the following dimensions [2]:
- Rotor radius Rr=80 mm; - Height of the rotating piston: z = 40 mm; - Housing radius: Rc = Rr + z = 80 + 40 = 120 mm; - Distance cavity shaft axle: 40 mm;
- Ratio 33.0120
40 ==cR
z.

International Conference 2ND International Conference on Innovations, Recent Trends and Challenges
in Mechatronics, Mechanical Engineering and New High-Tech Products Development
MECAHITECH‘10
Bucharest, 23-24 September 2010
19
Figure 1 presents a view of the profiled rotor. Both the rotating pistons and the cavities are established by a system of equations corresponding to the following zones:
Zone I: The curvilinear profile of the rotating piston A….B (fig. 2). Zone II: The circular profile of the rotor B….C. Zone III: The concavity profile C…D.
Figure 1. View of a profiled rotor.
The following notations are used in figure 2: ABC – starting points of the calculation; A’B’C’ – endpoints of the calculation.
Figure 2 Computation notations.

International Conference 2ND International Conference on Innovations, Recent Trends and Challenges
in Mechatronics, Mechanical Engineering and New High-Tech Products Development
MECAHITECH‘10
Bucharest, 23-24 September 2010
20
ESTABLISHING THE COORDINATES (x i, y i) OF THE CURVILINEAR PROFILE OF THE PISTON (A →B)
The papers [3] and [4] present the mathematical model used in order to establish the computation relations of the coordinates (xi, yi) of the curvilinear path (AB) of the outline of the rotating piston. Computation software was developed having the following inputs:
Rc=0.12 m; z = 0.04 m; Rr = 0.08 m;
−θ varying from 0° to 46.6° (0 to 0.8116 radians);
2θ = 17.5° (0.3054 radians). The following formulas are applied for computing the coordinates [3] [4]:
;sincos
2coscos
cos2sincos 22 θ
θθ
θθθ
θ⋅
+
−−−⋅
−−= rr
rr
r RR
RR
Rx (1)
;coscos
2coscos
2sin2sincos 22
⋅
+
−−+⋅
−−−= θθ
θθ
θθθ
rr
rr
r RR
RR
Ry (2)
Table 1 presents the coordinates (xi,yi) of the points that generate the curvilinear path A(point 1) → B(point 93), obtained by varying the angle θ with increments of 0.5°.
Table 1. The coordinates of the rotor outline points situated on the path A →B
No. x y No. x y No. x y 1(A) 0.00000 0.12000 42 0.02166 0.09231 83 0.02421 0.07702 2 0.00075 0.11923 43 0.02189 0.09173 84 0.02419 0.07689 3 0.00159 0.11855 44 0.02210 0.09116 85 0.02417 0.07678 4 0.00242 0.11787 45 0.02230 0.09060 86 0.02415 0.07668 5 0.00323 0.11718 46 0.02249 0.09004 87 0.02413 0.07659 6 0.00402 0.11648 47 0.02267 0.08950 88 0.02411 0.07651 7 0.00479 0.11579 48 0.02284 0.08896 89 0.02410 0.07644 8 0.0555 0.11509 49 0.02299 0.08843 90 0.02408 0.07639 9 0.00629 0.11439 50 0.02314 0.08791 91 0.02407 0.07635 10 0.00701 0.11369 51 0.02328 0.08740 92 0.02406 0.07632 11 0.00772 0.11299 52 0.02341 0.08690 93 (B’) 0.02406 0.07630 12 0.00841 0.11229 53 0.02353 0.08642 13 0.00908 0.11158 54 0.02364 0.08594 14 0.00973 0.11088 55 0.02374 0.08547 15 0.01037 0.11018 56 0.02383 0.08501 16 0.01099 0.10947 57 0.02391 0.08456 17 0.01159 0.10877 58 0.02399 0.08413 18 0.01218 0.10807 59 0.02406 0.08370 19 0.01275 0.10737 60 0.02412 0.08329 20 0.01330 0.10667 61 0.02417 0.08289 21 0.01384 0.10597 62 0.02422 0.08249

International Conference 2ND International Conference on Innovations, Recent Trends and Challenges
in Mechatronics, Mechanical Engineering and New High-Tech Products Development
MECAHITECH‘10
Bucharest, 23-24 September 2010
21
No. x y No. x y No. x y 22 0.01436 0.10528 63 0.02426 0.08211 23 0.01487 0.10458 64 0.02429 0.08174 24 0.01536 0.10389 65 0.02432 0.08139 25 0.01583 0.10321 66 0.02435 0.08104 26 0.01629 0.10252 67 0.02436 0.08071 27 0.01673 0.10185 68 0.02438 0.08039 28 0.01716 0.10117 69 0.02439 0.08008 29 0.01757 0.10050 70 0.02439 0.07978 30 0.01797 0.09984 71 0.02439 0.07949 31 0.01835 0.09917 72 0.02439 0.07922 32 0.01872 0.09852 73 0.02438 0.07896 33 0.01908 0.09787 74 0.02437 0.07871 34 0.01942 0.09723 75 0.02436 0.07847 35 0.01974 0.09659 76 0.02435 0.07825 36 0.02006 0.09596 77 0.02433 0.07803 37 0.02036 0.09533 78 0.02431 0.07783 38 0.02064 0.09471 79 0.02429 0.07765 39 0.02092 0.09410 80 0.02427 0.07747 40 0.02118 0.09350 81 0.02425 0.07731 41 0.02143 0.09290 82 0.02423 0.07716
ESTABLISHING THE COORDINATES (x I’yI) OF THE CIRCULAR PATH (B →C)
In order to find the coordinates (xi;yi) that generate the outline of the circular path B →C (fig. 2) of the rotor, computation software was developed having the following inputs:
Rc=0.12 m; z = 0.04 m; Rr = 0.08 m; θ - varying from 17.5° to 72.5° (0.3054 to 1.265 rad ians). The following formulas are applied for computing the coordinates of the profile [3] [4]:
θsin⋅= rRx ;
θcosRy r ⋅= ; As an example, the coordinates of the point 141 were shown in figure 2. x=0/0719 m, y = 0.03507 m ; The coordinates of the points from B (94) to C (150) are presented in table 2.
Table 2. The coordinates of the rotor outline points situated on the path B →C
No. x y No. x y No. x y 94(B’) 0.02406 0.07630 116 0.05035 0.06217 138 0.06997 0.03878
95 0.02472 0.07608 117 0.05142 0.06128 139 0.07064 0.03756 96 0.02605 0.07564 118 0.05248 0.06038 140 0.07128 0.03632 97 0.02736 0.07518 119 0.05353 0.05945 141 0.07190 0.03507 98 0.02867 0.07469 120 0.05456 0.05852 142 0.07250 0.03381

International Conference 2ND International Conference on Innovations, Recent Trends and Challenges
in Mechatronics, Mechanical Engineering and New High-Tech Products Development
MECAHITECH‘10
Bucharest, 23-24 September 2010
22
No. x y No. x y No. x y 99 0.02997 0.07417 121 0.05557 0.05755 143 0.07308 0.03254 100 0.03126 0.07364 122 0.05657 0.05657 144 0.07364 0.03126 101 0.03254 0.07308 123 0.05755 0.05557 145 0.07417 0.02997 102 0.03381 0.07250 124 0.05851 0.05456 146 0.07469 0.02867 103 0.03507 0.07190 125 0.05945 0.05353 147 0.07518 0.02736 104 0.03632 0.07128 126 0.06038 0.05248 148 0.07564 0.02605 105 0.03756 0.07064 127 0.06128 0.05142 149 0.07608 0.02472 106 0.03878 0.06997 128 0.06217 0.05035 150(C’) 0.07630 0.02406 107 0.04000 0.06928 129 0.06304 0.04925 108 0.04120 0.06857 130 0.06389 0.04815 109 0.04239 0.06784 131 0.06472 0.04702 110 0.04357 0.6709 132 0.06553 0.04589 111 0.04474 0.06632 133 0.06632 0.04474 112 0.04589 0.06553 134 0.06709 0.04357 113 0.04702 0.06472 135 0.06784 0.04239 114 0.04815 0.06389 136 0.06857 0.04120 115 0.04925 0.06304 137 0.026928 0.04000
ESTABLISHING THE COORDINATES (x I’yI) OF THE CAVITY PROFILE (PATH C →D)
For these coordinates, a mathematical model was elaborated [3][4] and subsequently computation software was developed having the following inputs:
Rc=0.12 m; z = 0.04 m; Rr = 0.08 m; θ - varying from 0° to 29° (0 to 0.5061 radians). The following formulas are applied for computing the coordinates of the profile [3][4]:
( )[ ]crc RRRx −−⋅⋅⋅−= θθ coscos2 ;
( ) θθ 2cos1cos2 −⋅−⋅⋅= rc RRy ;
The coordinates of the points from C (151) to D (189) are presented in table 3.
Table 3. The coordinates of the rotor outline points situated on the path C →D
No. x y No. x y No. x y 151(C) 0.07635 0.02420 173 0.05204 0.01949 186 0.04044 0.04417
152 0.07417 0.02437 174 0.05063 0.01859 187 0.04019 0.00279 153 0.07203 0.02444 175 0.04929 0.01763 188 0.04005 0.00140 154 0.06993 0.02442 176 0.04804 0.01661 189(D) 0.04000 0.00000 155 0.06787 0.02431 177 0.04688 0.01554 156 0.06587 0.02410 178 0.04580 0.01442 157 0.06392 0.0238 179 0.04481 0.01326 158 0.06203 0.02342 180 0.04390 0.01205 159 0.06020 0.02296 181 0.04309 0.01081

International Conference 2ND International Conference on Innovations, Recent Trends and Challenges
in Mechatronics, Mechanical Engineering and New High-Tech Products Development
MECAHITECH‘10
Bucharest, 23-24 September 2010
23
169 0.05843 0.02241 182 0.04237 0.00953 170 0.05672 0.02179 183 0.04175 0.00822 171 0.05509 0.02109 184 0.04131 0.00689 172 0.05352 0.02032 185 0.04078 0.00554
After establishing the whole set of coordinates, it can be noticed that, in the first quarter
of the xOy plane (fig.2), the resulted outline is ABCD; the path Abcd is constructed symmetrically about the axis Oy (fig.1). Subsequently the whole outline of the rotor is obtained by mirroring the outline DCBAbcd on the Ox axis.
MANUFACTURING TECHNOLOGY OF THE PROFILED ROTOR
The following dimensions are given, according to [2]: Rr = 80 mm; Z = 40 mm; Rc=Rr + z = 120 mm. The CAD design, as well as the CAM manufacturing for the numerically-controlled
machines with 3 to 5 axes, used the software package CATIA V5. This software package features a powerful post-processing engine that covers the whole manufacturing process, starting from the generation of the processing tool path till the NC Code program generation.
Based on the coordinates presented in tables 1, 2 and 3, using the module Sketcher, the item “Point by Using Coordinates” is selected from the Profile toolbar [5]. The points are inserted in the sketch via their Cartesian coordinates, as shown in figure 3.
Figure 3. Defining the outline via Cartesian coordinates and using the Spline application.
The toolset Spline is used for joining the defined points. The Transformation tool, with the help of Symmetry commands, allows the complete definition of the rotor outline (fig.4).

International Conference 2ND International Conference on Innovations, Recent Trends and Challenges
in Mechatronics, Mechanical Engineering and New High-Tech Products Development
MECAHITECH‘10
Bucharest, 23-24 September 2010
24
Figure 4. Definition of the rotor profile.
The Z-axis extruding is achieved using a closed-contour sketched profile (Sketcher). The calling of the command “Pad Definition” allows the extruding in a direction normal to the sketch plane. Another solution is the activation of the option “Mirrored extend” that leads to the extruding of the profile in both directions of the normal, as shown in figure 5.
Figure 5. The three-dimension model of the rotor, created using the Pad option
After the definition of the rotor geometry, the working zone corresponding to the NC manufacturing process is opened in a CAT Product document that will initiate a new operation in the manufacturing process and will add a new entity to the structure Part Operation. The operation parameters can be modified in the dialog box Part Operation, where the type of machine-tool can be chosen (Machine – editor) and the characteristic parameters of the processing machine are specified (numerical control parameters, rotation parameters, parameters corresponding to the tool changing process etc.).
In order to associate a reference axis to the manufacturing system during the operation, the icon “Machine axis” is activated. The “Product” icon is pressed in order to associate an existing product to a certain operation.
International Conference 2ND International Conference on Innovations, Recent Trends and Challenges
in Mechatronics, Mechanical Engineering and New High-Tech Products Development
MECAHITECH‘10
Bucharest, 23-24 September 2010
25
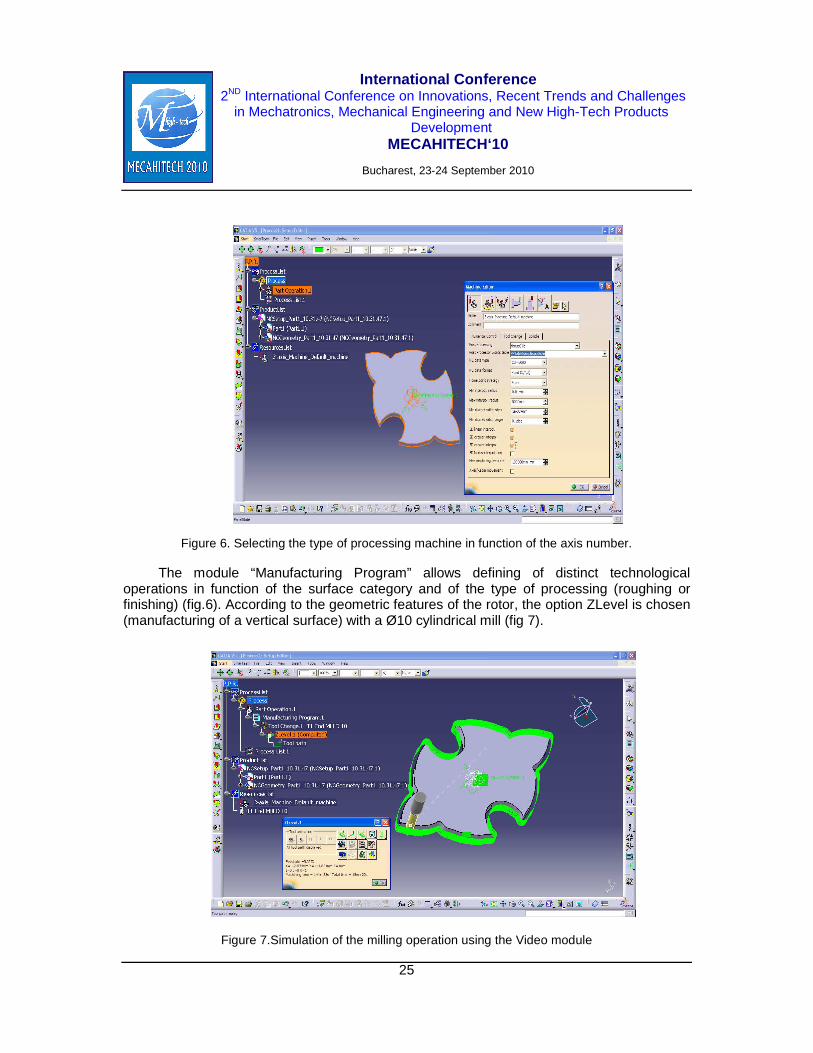
Figure 6. Selecting the type of processing machine in function of the axis number.
The module “Manufacturing Program” allows defining of distinct technological operations in function of the surface category and of the type of processing (roughing or finishing) (fig.6). According to the geometric features of the rotor, the option ZLevel is chosen (manufacturing of a vertical surface) with a Ø10 cylindrical mill (fig 7).
Figure 7.Simulation of the milling operation using the Video module

International Conference 2ND International Conference on Innovations, Recent Trends and Challenges
in Mechatronics, Mechanical Engineering and New High-Tech Products Development
MECAHITECH‘10
Bucharest, 23-24 September 2010
26
Figure 8.Processing tool trajectories, using the Photo module
When the icon “Generate NC Code” is activated, the machine code needed for the
manufacturing process is generated. The active window presented in figure 8 is opened. The document CAT Process is selected from the page IN/OUT. The path of the file that will be generated (Output File) is specified. The item “NC Code” is selected from the menu “Data Type”. The type of the post-processor corresponding to the numerical control manufacturing center (Fanuc 0) is selected from the page “NC Code”(fig.9).
Figure 9. Generation of the NC Code program.

International Conference 2ND International Conference on Innovations, Recent Trends and Challenges
in Mechatronics, Mechanical Engineering and New High-Tech Products Development
MECAHITECH‘10
Bucharest, 23-24 September 2010
27
Example of a program written in NC Code %2000 (rotor) N1 M6T1 N2 G54G90S2000M3 N3 G1G43H#4120Z259F3000. N4 X-12.8343 Y114.851 N5 G43 Z9. H1 N6 G1 Z-1. F300. N7 X-9.7161 Y118.0405 F1000. …………………………………
…………………………………………………. N7016 X-20.6757 Y104.9852 N7017 X-18.4829 Y108.1293 N7018 X-15.7126 Y111.6066 N7019 X-12.8343 Y114.851 N7020 Z-40. N7021 G0 Z1. N7022 M30 %
Figure 10. Axonometric image of the profiled rotors.
REFERENCES
[1] Patent no. 111296 released by The State Office for Inventions and Trademarks OSIM Bucharest, “Steam rotating motor”, authors N. Baran, Gh. Baran.
[2] C.N.M.P. Program 4 – Partnerships in Priority Fields – Firm Cooperation Agreement
concluded with the Institute for Conception, Research and Design in the Field of Thermo-Energetic Equipment “Oskar Von Miller” ICCPET for the achievement of the research project no. 22 – 093/2008 with the title ‘’Small power co-generation plant composed of a biomass steam boiler – thermic steam machine – electric generator”.
[3] N. Baran, A. Motorga, A. Costache, “Computation elements regarding the architecture of a profiled rotor used in the construction of fans” (in Romanian), Rev. Termotehnica, no. 1/2008, ISSN 1222-4057, pp. 59-63
[4] N. Baran, D. Besnea, D. Duminica, A. Aron, “Manufacturing technology of a profiled rotor from the construction of a rotating volumetric pump prototype”, Rev. Mecatronica, nr. 1/2005, pp. 50-54
[5] I.G.Ghionea, Computer Aided Design in CATIA V5.Theretical elements and applications. Bren Publishing Hause, Bucharest, 2007

International Conference 2ND International Conference on Innovations, Recent Trends and Challenges
in Mechatronics, Mechanical Engineering and New High-Tech Products Development
MECAHITECH‘10
Bucharest, 23-24 September 2010
28
Design and Analysis of Conjugate Cam Mechanisms for a Special
Weaving Machine Application
Mário Lima University of Minho
Department of Mechanical Engineering, Guimarães, Portugal [email protected]
Petr Zabka
Technical University of Liberec Liberec, Czech Republic
ABSTRACT
The paper deals with the design of special conjugate cam mechanisms for the Multiweave project whose objective was a weaving machine to produce a multidirectional woven fabric. This is intended for technical applications, such as the reinforcement of composites, requiring better mechanical properties than the ordinary biaxial fabrics. This results from the four sets of interlaced yarns oriented in four different directions at 45 degrees. The proper design of cam mechanisms is usually one of the most important and difficult steps of the machine design. In the case of Multiweave, a reliable actuation, both on the advancement and returning movements is required; therefore the use of conjugate cams was recommended. The work is concerned with the process of designing and manufacturing such cam mechanisms. For this purpose a mathematical program has been created in MATLAB® environment. This solution produces several benefits that are described in the paper. On the basis of the results, a comparison of several common methods used for cam design could be performed in a very small amount of time, therefore allowing an optimization process before the final design of the mechanism. The program is capable of computing single or conjugate cams with oscillating or translating roller followers. It contains equations for 10 different methods. Furthermore it allows inputting an unlimited number of sections (rise, dwell, return) and all calculations are performed with a very high accuracy. At present the program contains 230 equations in total. The final part is then obtained from a CNC machine. The work resulted in a very useful tool that can be applied in other projects involving the design and manufacturing of cam mechanisms.
INTRODUCTION
The Multiweave project has been developed at the University of Minho, Centre for Mechanical and Materials Technologies, in Guimarães, Portugal, funded by the European Commission under the CRAFT programme of the Framework VI. The final goal of the project was to design a weaving machine able to produce multiaxial fabrics [1, 2, 3]. This is an innovative textile structure intended to compensate the usual anisotropic properties of conventional biaxial fabrics which is of great importance for technical applications such as in the reinforcement of composite materials.
While biaxial fabrics interlace two sets of yarns, warps and wefts, the Multiweave fabric, as can be seen in the model of figure 1, is obtained by interlacing 4 sets of yarns,

International Conference 2ND International Conference on Innovations, Recent Trends and Challenges
in Mechatronics, Mechanical Engineering and New High-Tech Products Development
MECAHITECH‘10
Bucharest, 23-24 September 2010
29
warps, wefts and other two sets of bias yarns at +45 and -45 degrees.
Figure 1: The structure of the Multiweave fabric
Fabrics of different fibres were manufactured using the Multiweave
development prototype. Figure 2 represents a sample with polyester 220 tex on the warp and bias and 800 tex carbon on the weft.
Figure 2: Multiweave fabric sample
The last version of the Multiweave development prototype is shown in figure 3. The
concept of the machine contains several essential mechanisms for functions such as the bias yarns feeding with a crisscross insertion, heddle rising and lowering with the warps to form the shed, weft insertion across the open shed, reed beating including a false beating and fabric taking-up. All these functions are provided in the first place by the rotation of the main shaft, which is driven by an electric motor. However, most of these functions cannot be achieved another way but by means of cam mechanisms. Therefore, in a machine such as this, the amount of mechanisms is quite considerable, even if this not yet at an industrial scale. The requirements for synchronism and precision are however the same as in a full scale machine.

International Conference 2ND International Conference on Innovations, Recent Trends and Challenges
in Mechatronics, Mechanical Engineering and New High-Tech Products Development
MECAHITECH‘10
Bucharest, 23-24 September 2010
30
Figure 3: Partial view of the Multiweave development prototype
The early design of the weft insertion mechanism is shown in some detail in figure 4. In
the case of a prototype such as this, the design would have to be changed several times during the development stages. Therefore the main demand was for a quick and low-cost design process. Also it was important to consider requests for single-parts manufacturing. On the other hand, durability was not to be an important requirement due to the limited usage of the machine. In the case of the Multiweave development prototype the expected operating speed was relatively slow which also turned the problem easier.
Figure 4: The weft insertion mechanism
DESIGN STEPS
The design of a cam mechanism is a complex task, usually containing the following steps:
- Definition of the cam type; - Establishment of basic dimensions; - Creation of s-v-a-j diagrams; - Determination of pressure angle diagram; - Construction of cam surface profile; - Dynamic analysis; - Stress analysis.
cam
follower
link
sector
gear
pinion rack

International Conference 2ND International Conference on Innovations, Recent Trends and Challenges
in Mechatronics, Mechanical Engineering and New High-Tech Products Development
MECAHITECH‘10
Bucharest, 23-24 September 2010
31
The first three steps involve inserting input data. Even though some parameters are given by the knowledge of the working requirements of the different systems (e.g. a timing diagram of the machine) each new design requires working out several parameters. In the end, it is up to the designer’s skill how the design will look like. In a conventional design process, a large number of calculations have to be performed in order to obtain the desired shape and kinematic properties of the cam. Many times the obtained results are unacceptable and the whole process must be repeated again with a new approach for the input data.
In the case of the Multiweave weft insertion mechanism, besides the timing diagram, several requests where part of the specifications. One of the basic demands is to ensure a permanent contact between the cam and the follower. The use of a simple cam with spring return is not acceptable in this situation. The reason is that, if for any malfunction the weft needle gets stuck before completing the return movement, a collision with other moving parts is unavoidable causing a possible destruction of the machine, especially at high speeds. A grooved faced cam could be used, but in terms of space saving and precision a conjugate cam offers a better choice. A model of a conjugate cam with oscillating roller follower is shown in figure 5. In the same figure the basic design parameters are highlighted, namely,
Db – Cam base diameter; Dr – Roller diameter; c – Distance from cam axis to follower pivot; l – Follower arms length; β – Follower arms angle; xb ,yb – Coordinates of follower pivot from cam axis;
Figure 5: Conjugate cam geometric model
Anticipating low operating speeds for the development prototype and from the experience of previous designs it was possible to simplify the whole process by not considering the dynamic and stress analysis at this stage.

International Conference 2ND International Conference on Innovations, Recent Trends and Challenges
in Mechatronics, Mechanical Engineering and New High-Tech Products Development
MECAHITECH‘10
Bucharest, 23-24 September 2010
32
THEORETICAL CONSIDERATIONS
The basic step of the cam design is the creation of s-v-a-j diagrams. These diagrams are built on the basis of the timing diagram and describe the kinematics properties of the follower. They are stroke or displacement, s, velocity, v, acceleration, a, and jerk, j. These equations are obtained by successive derivatives of the stroke or displacement equation. They are all expressed in dimensionless relative values independent of the angular velocity of the cam. The equations, for a constant velocity of the cam shaft are,
( )( ) ( )( )tst θδθδδ +== 0 (1)
θd
dsv =
θδ && ⋅= v (2)
θd
dva =
2θδ &&& ⋅= a (3)
θd
daj =
3θδ &&&& ⋅= j (4)
where θ is the angular position of the cam, δ is the angular position of the oscillating follower and t is time. The real kinematics properties can be obtained by multiplying the relative values by the corresponding power of the cam angular velocity.
For the mathematical description of the rising and falling sections various different equations can be used [4, 5]. The most simple and common types of cams are cycloidal, trapezoid, modified trapezoid, modified sine, 345-polynomial and 4567-polynomial. The acceleration curves for each of them are comparatively represented in figure 6, where the cycloidal and modified sine are highlighted.
1.5
1
0.5
0
-0.5
-1
1/2π π 3/2π 2π0-1.5
Cam angle rotation [rad]
Ang
ular
acc
eler
atio
n [r
ad/s
2 ]
Figure 6: Comparison of the acceleration curves for different methods
Modified sine
Cycloidal

International Conference 2ND International Conference on Innovations, Recent Trends and Challenges
in Mechatronics, Mechanical Engineering and New High-Tech Products Development
MECAHITECH‘10
Bucharest, 23-24 September 2010
33
Another comparison of all mentioned methods is shown in figure 7. The first three parameters are the earlier mentioned kinematics properties. The last parameter marked as ø represents the pressure angle. In principal, the lower the value for each parameter, the better. The scale is expressed relatively to the worst method.
Figure 7: Comparison of different methods for v, a, j and ø
From the comparison chart the following conclusions can be drawn: Cycloidal
equations are the most simple to calculate and also provide the lowest jerk. Therefore this method is very often used for simple cams design. Trapezoid equations provide a combination of low jerk and acceleration. Modified trapezoid equations are one of the most complicated to calculate, but they offer the lowest acceleration. Modified sine equations give the lowest velocity and pressure angle. Therefore this method is recommended for slow cams with big loads and was selected for the design. 345 polynomial equations have good dynamic properties with low pressure angle. Finally, 4567 polynomial method is the only one of the presented methods which shows a continuous jerk profile, which could be important to minimise vibrations in high speed cams.
Modified sine equations [4] were used in our application. They are applied in three different intervals, as follows:
βθ81
0 ≥≤
−=βθπ
βθ
4sin0350062.043990085.0hs (5)
−=
βθπ
β4cos143990085.0
hv (6)
=βθπ
β4sin5279571.5 2
ha (7)
0 0,1 0,2 0,3 0,4 0,5 0,6 0,7 0,8 0,9 1
4567 poly.
345 poly.
Mod. sine
Mod. trapezoid
Trapezoid
Cycloidal
vajø

International Conference 2ND International Conference on Innovations, Recent Trends and Challenges
in Mechatronics, Mechanical Engineering and New High-Tech Products Development
MECAHITECH‘10
Bucharest, 23-24 September 2010
34
=
βθπ
β4cos4663577.69 2
hj (8)
βθβ87
81 ≥≤
−−+=63
4cos31505577.043990085.028004957.0
πβθπ
βθ
hs (9)
−+=
634
sin3143990085.0π
βθπ
βh
v (10)
−=63
4cos5279571.5 2
πβθπ
βh
a (11)
−−=
63
4cos1553.23 2
πβθπ
βh
j (12)
βθβ ≥≤87
−−+= 122sin0350062.043990085.0560099150.0βθπ
βθ
hs (13)
−−= 122cos143990085.0
βθπ
βh
v (14)
−= 122sin5279571.5 2 βθπ
βh
a (15)
−= 122cos4663577.69 2 β
θπβh
j (16)
IMPLEMENTATION
On the basis of the mathematical support for the design of cams, a program has been developed in MATLAB®. The program interface is displayed in figure 8.
At present the program is capable of computing single or conjugate cams with oscillating roller followers. It contains equations for 10 different methods. Furthermore it allows inputting an unlimited number of sections (rise, dwell, return) and all calculations are performed with a very high accuracy. At present the program contains 230 equations in total.
As an input the program requires the basic dimensions and the timing diagram. These are the base diameter, the roller diameter, angle of follower arms, length of follower arms and distance from centre of cam to pivot of follower. Then the method to be used is selected. Finally, the required output is decided.
The program is currently able to compute s-v-a-j diagrams, pressure angle, pitch curves (red in figure 8) and cam profile (blue in figure 8). In addition it is possible to carry out an automatic comparison of all methods. After inserting the necessary input data the program can be run and the required output obtained almost immediately.
The data obtained for the cams surfaces is then exported from MATLAB® into an Excel file and then, after some manipulation, into a text file. This file is subsequently modified to the

International Conference 2ND International Conference on Innovations, Recent Trends and Challenges
in Mechatronics, Mechanical Engineering and New High-Tech Products Development
MECAHITECH‘10
Bucharest, 23-24 September 2010
35
required format and loaded into a CAD software as a xyz curve. In the case of Multiweave project SolidWorks® has been used. These curves are then transformed into sketches which are finally used to create the complete 3D design of the cams. This principle easily allows using more than one curve in one part which is needed for the design of conjugate cams. The final CAD file can be then directly used as a source data for the CNC manufacturing.
Figure 8: Program interface in MATLAB® with outputs
Figure 9 represents the 3D virtual design of a pair of conjugate cams whose profile
surfaces are represented in figure 8, having been added a spacer between the two cams and a hole for the shaft where the assembly is mounted. The final part, as obtained from a CNC machine, is represented in figure 10.
Figure 9: Final 3D design of the conjugate cams

International Conference 2ND International Conference on Innovations, Recent Trends and Challenges
in Mechatronics, Mechanical Engineering and New High-Tech Products Development
MECAHITECH‘10
Bucharest, 23-24 September 2010
36
Figure 10: Conjugate cams obtained by CNC
New Design
A second generation prototype for the Multiweave project is now under development. For this machine a new set of cam mechanisms was designed using the program. As an example, the data for the conjugate cams of the new weft insertion mechanism are as follows:
Cam base diameter, Db = 150,56 mm; Roller diameter, Dr = 40 mm; Rising angle, βr = 50º; Return angle, βf = 35º, Begin of return angle, β1 = 57.5º, (corresponding to a dwell = β1- βr = 7.5º); Follower arms length, l = 70 mm; Distance from cam axis to follower pivot, c = 130 mm; Follower radial rising, z = 25 mm Follower angular rising, smax = 0,359312859 rad (corresponding to z = 25 mm). This value of smax was worked out using an appropriate geometric transformation. Follower arms angle, β = 112º (1.954768762 rad). The value worked out for β was in fact 111,43º. For easy manufacturing this angle was
rounded up to 112º, which caused the value of the cam base diameter, Db to be raised from 150 to 150,56 mm;
The data is inserted in the program as a matrix named tgdm, which, in this case, took the following shape: tgdm = [0*deg, 0; (initial position)
50*deg, smax; (rising in 50º) 57.5*deg, smax; (dwell in 7.5º) 92.5*deg, 0]; (return at 92.5º, after 35º rotation of the cam)
The output of the program, when selecting “cam profile” could be immediately obtained, as represented in figure 11.

International Conference 2ND International Conference on Innovations, Recent Trends and Challenges
in Mechatronics, Mechanical Engineering and New High-Tech Products Development
MECAHITECH‘10
Bucharest, 23-24 September 2010
37
Figure 11: Cam profiles and pitch curves as obtained from MATLAB
The complete 3D SolidWorks® design of one of the two conjugate cams of figure 11 is represented in figure 12, after adding several elements such as a large centre hole for reduced mass and 4 fixing holes. There is another hole aligned with the end of the rising angle that is used to precisely match the two conjugate cams relative position when assembling.
Figure 12: New conjugate cams
Finally, one of the cam boxes of the new prototype, with two sets of conjugate cams
can be seen in figure 13, partially immersed in the lubrication oil. Also clearly visible are the swinging followers with two arms and the respective contact rollers.

International Conference 2ND International Conference on Innovations, Recent Trends and Challenges
in Mechatronics, Mechanical Engineering and New High-Tech Products Development
MECAHITECH‘10
Bucharest, 23-24 September 2010
38
Figure 13: New conjugate cams in cam box
CONCLUSIONS
The decision to create a mathematical program in MATLAB® produced several benefits. The most important aspect is a very fast design process. The designer can quickly obtain and compare several different designs, and, on the basis of the analysis of the kinematics characteristics, improve the mechanism. Once the input parameters are decided, the whole design process can be done within a few minutes on the order of a quarter of an hour. The other advantage is the possibility of an easy modification and extension of the program. As an example it is possible to involve calculations of connected mechanisms, including optimization or export the obtained cam shape to any other CAD-CAM software.
The inclusion of the comparison of several different methods is also very helpful. The comparison represented in figure 7 clearly shows strengths and weaknesses of each method. This provides a good base for deciding which method is more appropriate for a particular application.
The program has already been successfully used for the design and manufacture of conjugate cam mechanisms with oscillating roller follower, always with very good results.
REFERENCES
[1] Lima, M., et al. “MULTIWEAVE – Prototype Weaving Machine for Multiaxial Technical Fabrics”, Indian Journal of Fibre & Textile Research, Vol. 34, March 2009, pp 59-63.
[2] Lima, M., et al. “MULTIWEAVE – Multiaxial Weaving: From Concept to Prototype”, AUTEX 2007 International Conference, 7th Annual Textile Conference by Autex, From Emerging Innovations to Global Business, 26-28 June 2007, Tampere, Finland, ISBN 978-952-15-1794-5.
[3] Lima, M., et al. “MULTIWEAVE – Prototype Weaving Machine for Multiaxial Technical Fabrics”, ALTEX 2007, 20-22nd September 2007, Roubaix, France. In ALTEX 2007 Conference proceedings, CD ROM.
[4] Norton, L. R. “Cam Design and Manufacturing Handbook”, Industrial Press, Inc. 2002 New York, ISBN 0-8311-3122-5.
[5] Harold, A. R. “Cams Design, Dynamics and Accuracy”, John Wiley & sons, Inc. 1956, New York.

International Conference 2ND International Conference on Innovations, Recent Trends and Challenges
in Mechatronics, Mechanical Engineering and New High-Tech Products Development
MECAHITECH‘10
Bucharest, 23-24 September 2010
39
Under Nanometer Roughness Measuring Equipment Using
Polarization Interferometry (TERSIP project activities carried out under the IN NOVATION Programme)
łânŃu Magdalena, Dan Ursu
C. PRO OPTICA S. A. Street. George Petrascu 67, Bucharest, Romania
ABSTRACT
The realized equipment it is a differential polarization interferometer of Nomarski type. The device measures the reflected beam phase difference between two points, a process that is followed by the data processing and recording of the surface roughness along the scanning line.
PRESENTATION OF CURRENT SITUATION
Quality requirements are becoming higher in al the areas of modern industry. Surface quality of optical components used in the space research, laser systems development, or in general electro optics is growing.
The need for laser mirrors with low diffusion increases. The substrate for modern
electronic microcircuits requires a surface with very low roughness because surface roughness is a prime factor that may determine the amount of information that can be stored per unit area of tape, or computer disk. Also, the stability of thin layers components and microcircuits depends on substrate they are made. The roughness could significantly reduce the image quality formed by an optical system with optical components with a inadequate roughness. Polarizing components used in various laboratories require also very low roughness.
Therefore becomes increasingly acute the problem of high polished surfaces. The roughness of high polished optical surfaces used today is characterized by
parameters under nanometer order of magnitude. There is a big diversity of roughness assessment methods, using a complex,
sophisticated and expensive equipment. But despite this the roughness characterization is not satisfactory solved , even at the international level, and remains an open subject of interest.
Among the roughness measuring equipments we can mention: mechanical devices (TalyStep), interferential devices (Zygo), atomic force microscopes, X-ray scattering goniometer. Each of the said equipment is suitable for certain types of substrates and has advantages and disadvantages related to measurement technology, the process of measurement, and reproducibility of results. Servicing this equipment requires both highly trained personnel and special conditions of location and use in areas with controlled microclimate; the possibilities of the microclimate influence over the results are real.
Imagination has enabled researchers to design many efficient methods, based on very different principles, some of which ended with marketed devices.

International Conference 2ND International Conference on Innovations, Recent Trends and Challenges
in Mechatronics, Mechanical Engineering and New High-Tech Products Development
MECAHITECH‘10
Bucharest, 23-24 September 2010
40
From the wide variety we mention some examples: - Methods based on geometrical optics or diffraction (differential detection methods of
image contrast, Foucault method, total reflection, etc.) - Methods with mechanical probes (0.1nm RMS) that can damage the surface to be
checked (Talystep 0.1-0.2µm RMS) - Interferential methods: - Mireau interferometer (1.3 µm RMS 20x objective) - Zygo Heterodyne interferometer (2.5 µm) - Atomic force microscope (resolution 0.1nm lateral, vertical resolution 0.01 nm) - Electronic microscopes
Usually, surface roughness parameter is not quantified by measuring mainly due to
lack of means and measurement technologies. Domestic producers are generally reluctant to impose and guarantee measurable value for this important parameter of optical surfaces, preferring to establish standards based on test samples. This situation is also valid for foreign producers, with the exception of large companies that have financial strength to buy sophisticated measuring equipment required.
With the adoption of ISO 10110 family, which regulates the measures and recommends the methods to evaluate key parameters in characterizing optical surfaces, prestigious companies in optical industry, including PRO OPTICA SA, are showing serious interest toward surface roughness measurement of polished surfaces.
Inter laboratory comparative measurements allowed a conclusion that at least with now conventional polishing technologies practiced by Romanian producers of optical components the roughness RMS parameter is about 5 nm.
This is a above the RMS ≤ 2nm considered to be the threshold to high quality optics used in laser optics especially. In the near future this value will became the standard for the optics used in numerous applications.
The upper level of the actual manufacturing technology is situated at the picometer value of the RMS parameter.
It must therefore to develop affordable measuring equipments and related technologies to characterize this parameter of the polished optical surface. Measurement of the roughness technology must be implemented on the manufacturing flow of the optical components instead of the visual assessment of the state of polish for polished surfaces used now. Ensuring precision optical surface roughness measurement will enable technology to achieve process innovation and optimization of optical components polishing process by:
- establishing the basis of a deterministic technological process of material removal rate and duration of processing;
- effective control of the polishing process, which now depends entirely on the skills and qualifications of the operator;
- reducing of the rejections coefficients.
These new methods must be accurate, fast and nondestructive. These are coordinates where are placed our efforts to achieve a roughness
measuring equipment type based on differential polarization microscope that works on the principle of Nomarski differential contrast. We hope to succeed to register a profile of a surface having a RMS parameter of picometer of magnitude.

International Conference 2ND International Conference on Innovations, Recent Trends and Challenges
in Mechatronics, Mechanical Engineering and New High-Tech Products Development
MECAHITECH‘10
Bucharest, 23-24 September 2010
41
THE METHOD PRINCIPLE
The realized equipment it is a differential polarization interferometer - Nomarski type. The device measures the phase difference between the two orthogonal polarized beams reflected by two adjacent points (zones) of the sample. The optical signal is electronic detected, cleaned from noise, amplified, and transformed in computer data. The sequence of data is software processed and the profile of the surface along the scanning line is obtained.
The biggest value of the profile peak to valley could be about 80 nanometers. Initially some calibration operation is putting in correspondence the value of the electronic signal and the height of the profile
The equipment is composed of the following main blocks (figure 1)
Figure 1 The tested equipment - Optical block (1): laser diode (λ= 670nm), collimating system, beam splitter cube, Wollaston polarizing prism on a motorized table, metallographic microscope with infinity tube length and corresponding objectives. - The sample scanning table (2) whose displacement in 0.1µm steps. - Signal acquisition block (3) composed by a electro optical birefringence modulator,
analyzer, diaphragm, silicon photodiode. - Block signal processing (4) lock-in amplifier and the laptop. The vibration isolation, necessary for an accurate measurement, is provided by a
vibration isolation table, ( MIP3-900x600 mm) placed on a concrete block, set on a bed of sand.
Incident beam from the laser diode (linearly polarized) is collimated as parallel beam that crosses a beam splitting cube and falls on the Wollaston prism. The quartz prism (angle θ)

International Conference 2ND International Conference on Innovations, Recent Trends and Challenges
in Mechatronics, Mechanical Engineering and New High-Tech Products Development
MECAHITECH‘10
Bucharest, 23-24 September 2010
42
separates the incident beam into ordinary and extraordinary beams making an angle α . Angle α is given by
( ) ( )θα tgnn oe −= 2 (1)
Optical path difference between these two incident beams is due to the Wollaston prism
δw = 2(ne –n0)TW tg θ=αTw (2)
Where: - Tw is the distance between axis and axis of Wollaston prism beam falling on the prism; - θ- is the angle of the Wollaston prism. Prism is placed in the focus of the polarizing microscope eyepiece. The microscope has a
infinity tube length, a fT = 250 mm tube lens and a 12.5x eyepiece. The two beams are converging (after passing through the microscope) on the sample at
two points separated by a distance "d". d=α⋅ fMicroscop (3) After reflection on the sample the beams pass through the microscope and Wollaston prism recombines them.. These two orthogonal components of output beam have a phase shift )(2 EW ϕϕϕ += (4)
Where (ϕw is the phase introduced by Wollaston prism, ϕE is the phase shift
introduced by the sample, due to its roughness (irregularities).
WW Tαλπϕ 2= and
−−+= )2
()2
(2 d
xhd
xhE λπϕ (5)
where h is the profile surface height intended to be measured. Note that ϕw is a constant.
So one should measure the phase shift ϕ which can furnish the h (x). Sample reflected beams enters again the Wollaston prism, beam splitter cube and
are reflected toward an optical system having a diaphragm in its focal plane. Between this system and the diaphragm is placed an optical modulator with optical axes parallel to those of the Wollaston prism.[25, 24].
This modulator introduces an additional phase shift between the two polarized components of the wave,
ftM πψψ 2sin= (6) where f is frequency of oscillation.

International Conference 2ND International Conference on Innovations, Recent Trends and Challenges
in Mechatronics, Mechanical Engineering and New High-Tech Products Development
MECAHITECH‘10
Bucharest, 23-24 September 2010
43
Near the modulator is placed an analyzer oriented at 450 (about the axes of the modulator) which allows the interference of the two orthogonal components. Interference pattern is detected by a silicon photocell (sensitive to the irradiance received) to get an electric current proportional to the flux that falls on it.
The obtained electric signal is filtered by a lock-in amplifier having as reference signal the modulator driving signal (frequency f) . Signal is:
)sin( WREM RRSS ϕϕϕ ++= +− (7)
where R_ and R + is reflections in points (x -d / 2) and (x + d / 2). Assuming that R+ and R- = 0.
ϕR = 0 Measured signal is S(ϕ) = SM sin ϕ cu SM= A R T I0 (ψm)
Where - A is a constant determined by electronic amplification - R is the reflectivity of the surface ; - T is the overall optical transmission coefficient from the light source to the
photodiode. - I0 is the incident beam intensity ; - ψM is the maximum phase shift introduced by the modulator.
The SM value is determined by the user at the calibration stage, starting from
WW Tλπαϕ 2= and moving to obtain maximum signal SM (i.e. sin ϕ= 1).
After determination of SM constant , ϕ bring near zero (2π mode) by a new translation of the Wollaston prism in a new position corresponding to maximum sensitivity of the device.
Differential profile is determined by sample translational motion using a computer driven table with steps of 0, 1µm
Acquisition loop to obtain the differential profile is: 1. Measuring signal S (x) from synchronous detector 2. Moving the sample 3. Calculation of differential profile ( D (x) ) 4. Timing 5. Return to step1.
Starting from the differential signal the actual profile of the sample is reconstructed using the convolution or integration. SOFTWARE IMPLEMENTATION
The software realized inside the TERSIP project has the following functions:
• Functions to prepare the device: 1. Setting of the communication parameters (with the motorized table carrying the
Wollaston, with the motorized table carrying the sample); 2. Specifying the command; 3. Testing communication with the lock- in amplifier. • Calibration and acquisition functions; 1. Placing the device parameters;

International Conference 2ND International Conference on Innovations, Recent Trends and Challenges
in Mechatronics, Mechanical Engineering and New High-Tech Products Development
MECAHITECH‘10
Bucharest, 23-24 September 2010
44
2. Determination of the noise, temperature variations and environmental influences 3. Achievement of the calibration
• Data acquisition functions The main functions for data acquisition are similar to those for calibration, namely: 1. Introduction of scanning parameters to the object data acquisition (step, step number, number of scans of the same areas, etc.). 2. Confirmation of commissioning of the table, triggering the acquisition of measurement process; 3. Presentation of data, saving them in a text file, presentation graphics. • Data processing functions
1. Primary data processing and line scan profiling; 2. Graphic profile display; 3. Determination and displaying of roughness parameters (Ra, Rq, etc.)
THE METHOD ADVANTAGES
The presented method - is a non contact one; - needs only a compact module which can be simply attach to a commercial
metallographic microscope; - requires no a reference standard; - has a relative simple procedure of use and requires no a special sample preparation;
The main advantage of the used method is the fact that it uses components which are not too expensive.
CONCLUSIONS
Sensitivity achieved with the built equipment allows characterization of high polished surfaces. The developed software made from it an easy to use device.
It provides simultaneous observation of the object field (for a more complex assessment of the surface)
The system should be carefully tested in different measurement situations and with different type of sample materials, not only with glass. BIBLIOGRAPHY
[1] Stedman M, "Limits of surface measurement by optical probes" Prec. SPIE: 1009:1988
[2] Bristow TC, Arackellian K "Surfaces roughness measurements using a Nomarski type Scanning instruments J. Optics Sensors 1987:2:289
[3] G.M. Nomarski "Differential Micro interferometer With Polarized Waves" J. Phys.Radium 16, 9(1955)
[4] G.M. Normarski and A.R. Weill "Application a la Metallographie des Methodes

International Conference 2ND International Conference on Innovations, Recent Trends and Challenges
in Mechatronics, Mechanical Engineering and New High-Tech Products Development
MECAHITECH‘10
Bucharest, 23-24 September 2010
45
Interferentielles Deux Ondes Polarised' Rev. Metall 52, 121, 1955
[5] D.L. Lessor, J.S. Hartmann -Quantitative Surface Topography Determination by Nomarski Reflection Microscopy" J. Opt. Soc. An 69, 357, 1979
[6] Roblin G. "La mesure des déphasages en microscopique par interferometric a modulation De phase" J. Optiques 1977:8:309
[7] Nomarski G. "Sur un méthode de modulation du retard optique" CR Acad. Sci.1973:2763
[8] Desvignes F. "Détection et détecteurs de rayonnements optiques" Masson Paris, 1987
[9] Badoz J. "Sensitive devices to determine the state and degree of polarization of a light bem using a birefringence modulator" J. Optics 1977:8:373
[10] Canit J.C. "New design for a photo elastic modulator" Applied Optics 1983:22:592
[11] Dettwiller L. "Le filtrage interférentiel des fréquences spatiales et son utilisation en traitement d’images et en microscopique interférentielle" J. Optics 1988:19:4
[12] Nomarski G. Brevet francais 10.059.123, 1952
[13] Gylmessi M. "Derivation of surface macro roughness parameters of a random rough surface from an optical interferometric measurement, Applied Optics 1988:27:983
[14] Francon M. "Polarization apparatus for Interference Microscopy and Macroscopy of Isotopic Transparent Objects" J.0.S.A. 1957, vol. 47 no. 6:528
[15] Lang W. "Differential - Interferenzkontrast-Mikroskopie nach Nomarski" Zeiss Informationen 16 (1966) : 114-120; 17(1969):12-16; 18(1970):88-93
[16] Padawer J. "The Nomarski interference contrast microscope an experimental basis of image interpretation" J. Roy microscop Soc. 88 (1968)
[17] Nomarski G. "Application a la 305-349 metallographie des méthodes interférentielles a deux ondes polarisées" Rev. de Métallurgique 52:1955; 121
[18] Torge R: "Das Interferenz - Mikroscop" ZEISS Informationen 14(11966)100
[19] Bennet J.M. "Comparison of techniques for measuring the roughness of optical surfaces" Opt. eng. 1985:24:380
[20] Kohno T. "Practical non contact surface measuring instrument with one nanometer resolution" Precision eng. 1985:7:231
[21] Kimiyuki Mitsui "Development of a high resolution sensor for surface roughness" Opt. eng. 198827:498
[22] Adachi M "Optical precision profilometer using the differential method" Optics letters 1987:12:792
[23] Monin 1, Houdart J. - C.R. Acad. Sci. (Paris) 1968, 267 B, 1078
[24] Nomarski G. , Roblin G. - C.R. Acad. Sci. (Paris) 1969, 269 B, 290
[25] Allen R. D., Brault J. - J. Cell Biology 1963 18,223

International Conference 2ND International Conference on Innovations, Recent Trends and Challenges
in Mechatronics, Mechanical Engineering and New High-Tech Products Development
MECAHITECH‘10
Bucharest, 23-24 September 2010
46
An approach for spasticity quantification based on the stretch
reflex threshold
João Ferreira, Paulo Rodrigues, Filomena Soares Industrial Electronics Department, ALGORITMI / University of Minho
Campus de Azurém, 4800-058 Guimaraes,Portugal [email protected]
José Machado
Mechanical Engineering Department, CT2M / University of Minho Campus de Azurém, 4800-058 Guimaraes,Portugal
ABSTRACT
Spasticity is a common and complex motor disorder that affects more than 12 million persons in the world. There are several studies on spasticity quantification in the literature but there is still a need for measurement improvements. This paper presents the design of a mechatronic device for spasticity quantification, in joint of ankle, elbow and knees. This approach is based on the velocity dependent of the tonic stretch reflexes. The relevant variables, the measurement range and the adequate measurement systems are selected. The data acquisition system, board and software, are also defined and tested in laboratory. Next step consists of the system validation in clinical environment.
INTRODUCTION
Spasticity is a complex motor disorder due to a supra-spinal inhibition, resulting from a hyper-excitability of the stretch reflex (SR) [1]. Spasticity affects more than 12 million persons in the world [2], and is always seen in patient with upper motor neuron dysfunctions such as cerebral vascular accidents, spinal cord injuries, and multiple sclerosis. The mechanism of spasticity is commonly thought of as an exaggerated SR, which is a velocity-dependent increase in the resistance to the passive movement [3]. The SR threshold is significantly reduced in spastic muscles, and this reduction is correlated to the increase in reflex joint torque [4]. Spasticity in conjugation with excessive muscle tone frequently interferes in the voluntary motor function, causing difficulties in daily activities [3]. Some of the common symptoms are: a change in the recruitment of limb´s segments and a severe mal-functioning of the tendons reflex.
The correct quantification of spasticity has been under an extensive study by the scientific community, but there is not yet available a well-accepted standard method for spasticity determination and quantification. The literature presents several methods for spasticity quantification: The Ashworth Scale (AS) and the Ashworth modified version (MAS); Isokinetic device with generator torque; Pendulum Test. None of them is fully accepted, due to various reasons [2], [5], [6]. The AS and the MAS are the common scales in clinical quantifications of spasticity, despite experts agree that both scales may not measure the characteristics that distinguish spasticity from other tonus disorders. Although the scale is useful in determining the amount of resistance felt in the passive displacement of the limbs, it does not quantify the dependence to velocity, which is the feature that differentiates

International Conference 2ND International Conference on Innovations, Recent Trends and Challenges
in Mechatronics, Mechanical Engineering and New High-Tech Products Development
MECAHITECH‘10
Bucharest, 23-24 September 2010
47
spasticity [5]. This scale has a low reproductive rate, a lack of validation in all muscle groups, usually affected by spasticity [1]. The approach of traditional measures is based on the phase and magnitude of the tonic SR and the resistance to passive stretch. Nevertheless, this measure is not correlated to the clinical impression of the spasticity degree, inability to differentiate the mechanical stiffness from the reflective stiffness and the implementation of the device is still complex; also, the measurement does not meet the criteria of the known theory. Hence, there is still a need for a device that meets these requirements [1], [5], [6].
The key issue is to determine which variables are necessary to correctly quantify this disorder. A correct measure to quantify spasticity must follow the physiological mechanisms related to the stand-up position control and the movement in healthy individuals and/or must detect possible deficiencies in any of these mechanisms that lead to motor disorders. For the acceptance of the method, their approach must be in accordance with a standard spasticity definition [5], [6]. The works presented in [7] defined spasticity as: “a motor disorder characterized by a velocity-dependent increase in tonic stretch reflexes (“muscle tonus”) with exaggerated tendon jerk, resulting in hyper excitability of the stretch reflexes, as one of the component of the upper motor neuron syndrome”. This definition is still accepted nowadays; it includes some important aspects: it refers to spasticity as a symptom, as a disorder in the somatic mobility, related to the high tonic component of the SR; it is due to the spinal reflex; it is one of the symptoms of the upper motoneuron syndrome; the tonic stretch is associated to the exaggerated tendon jerks, and reflects the physical component of the SR; the reflex of the tone stretch is the basis of the tonus; it is referred that the excess of the reflex depends on the stretch velocity [8]. This last statement is the key issue for spasticity quantification [2].
This paper presents the study on the design of a mechatronic device for quantification of all levels of spasticity, in joint of ankle, elbow or knees. This approach is based on the velocity dependent increase in the tonic SR, according to the criteria of spasticity definition proposed by Lance [7], to establish the relationship, for clinical evaluation, between all levels of spasticity.
The article is divided in four sections: section one introduces the spasticity concept and the problem formulation; section two presents the proposed approach used for spasticity quantification; section three discusses the obtained results and explains related ongoing works and, finally, section four resumes the conclusions.
PROPOSED APPROACH
The SR is an involuntary contraction elicited by a brief stimulus to muscle receptors. If the arm and muscle are immobilized the result will be a measurable change in the tension of the tendon [4].
The objective of this work is to develop a device for the quantification of all levels of spasticity, which can be accepted by the scientific community. It aims to develop universal device that allows the evaluation for the joint of ankle, knees or elbow. In this approach the method is focused on the velocity dependent increasing in the Tonic SR, according to the criteria of standard definition of Spasticity, proposed by Lance [7]. This definition suggested that the Stretch Reflex Threshold (SRT) depends on the velocity of stretch.
It is determined the angle of biomechanics range and the angular velocity when an increase in electromyography activity occurs, for further data processing, by a program developed especially for this propose. Most of the daily life activity requires joint angles of 45º for ankle, 140º to full flexion to the knee [9] and 120º for elbow [10]. These ranges should

International Conference 2ND International Conference on Innovations, Recent Trends and Challenges
in Mechatronics, Mechanical Engineering and New High-Tech Products Development
MECAHITECH‘10
Bucharest, 23-24 September 2010
48
be considered to ensure the assessment of movement in the whole biomechanical range, recruited in daily life. The study proposed in [2], where are studied patients with stroke, there is detected an increase of activity of the EMG (electromyography) signal in Biceps Brachia, due to stretching the elbow joint, at angular velocities of 51º/s, 161º/s and 430º/s; this demonstrates the dependence of velocity of SR, in muscle affected by spasticity.
To determine the SR Threshold we propose three measurements: EMG signal activity in the muscle; angular velocity of passive muscle stretch and the joint angle position.
Table 1 resumes the parameters and the measuring ranges for the proposed equipment.
Table 1 Variable Measuring Range in the Proposed Approach
Parameters Measuring range angle 180º
electromyography 20-500 Hz Angular velocity 500º/s
Experimental setup
The experimental set-up protocol (Figure 1) consists of the following steps. The patient sits on a chair and the electromyography sensors are fixed on a motor
point of a biceps brachial and the EMG signal at rest (tone) is recorded. To record the biomechanical angle, biomechanical range and compute the angular velocity a goneometer is fixed to the arm of the individual. The axis of rotation of the goneometer is placed in correspondence to the elbow joint. The arm of goneometer is aligned and fixed to the arm and forearm of the patients. The patient is placed in the ideal joint position. The initial angle position and biomechanical range of joint are recorded and constantly monitored, to ensure maximum repeatability and maximal Reflex response of the Biceps Brachial. In each stretch the initial angle joint is checked and only starts a new stretch if this condition is confirmed. The beginning of each stretch only occurs if the EMG signal, in the initial position, corresponds to the signal captured at rest, (the muscle tone).
Fig. 1: Proposed system for spasticity quantification.

International Conference 2ND International Conference on Innovations, Recent Trends and Challenges
in Mechatronics, Mechanical Engineering and New High-Tech Products Development
MECAHITECH‘10
Bucharest, 23-24 September 2010
49
Experimental procedure
In order to determine the dynamic SRT (DSRT), the muscle is stretched manually at different velocities. DSRT is defined as the joint angle and the corresponding velocity value, when the EMG signal amplitude also increases with the velocity, above the threshold corresponding with the EMG signal amplitude at rest. The Tonic SRT (TSRT) represents a specific value of DSRT when velocity equals to zero (at rest). In this approach, the DSRT and the TSRT are expressed in velocity and angular coordinates values. The SRT can be expressed as a specific point in the range of joint angle. Thus the SRT can be related to the body frame of reference.
In Figure 2 the DSRT is plotted on a coordinate system, in two dimensions, angular velocity versus angle. Regression analyses can be used in order to compute TSRT value, by extrapolating the regression line through the points of DSRT. When the regression line crosses the axes corresponding at velocity value equal to zero, it corresponds to the coordinate angle at rest (TSRT).
Fig: 2 Diagram Velocity (º/s) versus angle (º). Adapted from [3].
Figure 3 shows the relation between the range of regulation of TSRT and biomechanical range of the joint [1]. The grey areas to the right of diagonal lines indicate the areas where spastic muscle is active [2], [13] Previous studies with animals and humans suggest that in healthy individuals the range of regulation λ (Figure 3) beyond biomechanical range of joint (θ-, θ+), where θ- is the start position of the passive stretch and θ+ is the end position of stretch. In sick individuals the range of regulation λ lies within the biomechanical range of joint.

International Conference 2ND International Conference on Innovations, Recent Trends and Challenges
in Mechatronics, Mechanical Engineering and New High-Tech Products Development
MECAHITECH‘10
Bucharest, 23-24 September 2010
50
Fig: 3 Relation between range of regulation of STRT and biomechanical range of joint. Adapted from [13].
EMG Signal detection
Electromyography records the electrical activity of muscle, and it is a powerful tool in the analysis of human muscular system. When the muscles are active they produce an electric current generally proportional to muscle activity. EMG studies the muscle function through the interpretation of bioelectric signal produced by the muscle.
To measure the EMG signal, surface or needle electrodes are used, depending on the muscle type, superficial or deep. Passive surface electrodes have no amplification in the electrode; active surface electrodes have a signal preamplification system before being sent to the conditioner, which enable a noise reduction.
In this approach, passive surface Ag/AgCL electrodes are used and they do not cause pain to the patient. SENIAM [11] recommends the use of electrodes Ag/AgCl, together with a conductive gel to reduce signal noise by ensuring a better contact between the electrode and the skin. The signal muscle when measured using surface electrodes has amplitude to 5mV. The frequency range of the EMG signal for the correct analysis is limited to 20Hz and 500Hz, since frequencies below 20Hz tend to fluctuate and to be unstable.
The electrodes have a bipolar configuration, enabling a high rate of common mode rejection, and easily eliminating/reducing signal noise. They should be placed in a 20 mm distance from each other. A surface cleaning gel should also be used in order to reduce the impedance skin/electrode.
The raw EMG signal is detected, amplified and sampled with an analog to digital converser (ADC), after filtering with an anti-aliasing filter. The detection algorithm is implemented in software in LabVIEW Software, Laboratory Virtual Instrument Engineering Workbench, from National Instrument so that the user can monitor the procedure and the results. The EMG signal increase detection is calculated by the method proposed in [12].
Precise detection of on-off timing of human skeletal muscle during movement, based on surface electromyography (sEMG), is an important issue in the analysis of the motor system. The results depend on the chaise of threshold. The goal is to perform signal estimation from noise contaminated EMG signal. The common method for resolving motor-

International Conference 2ND International Conference on Innovations, Recent Trends and Challenges
in Mechatronics, Mechanical Engineering and New High-Tech Products Development
MECAHITECH‘10
Bucharest, 23-24 September 2010
51
related events from EMG signals consists of visual impression by trained observers. The “single-threshold method”, which compares the EMG signal to fixed threshold, is generally unsatisfactory. Double threshold detection method proposed by [12] is better than single-threshold because it yields higher detection probability and higher sensitivity. Double-detection allows the user to adapt the link between false alarm and detection probability with a higher degree of freedom than the single-threshold [13], [14].
Fig.4. Detection results for Vastus Lateralis muscle group; (a) original raw EMG signal; (b) results of proposed
method on-off detection [12]
RESULTS AND DISCUSSION
The more important data for spasticity quantification are, as already indicated, angular velocity, joint angle and electromyography signal activity in the muscle. A precise data acquisition related to these electrical signals can assure us that our developed mechatronic device is working as expected and, also, that is able to allow us to quantify spasticity according the previous presented methods. Figures 5 and 6 show how successful was the data acquisition done with our developed device. Fig. 5 shows the acquisition related with joint angle and angular velocity and Fig. 6 shows the acquisition related with electromyography signal activity in the muscle. The tests were performed simulating a real exam with variable angular velocities, resulting in the EMG signal and angle for every instant of tests.
Fig.5. Angle (left) and velocity (right) grafics

International Conference 2ND International Conference on Innovations, Recent Trends and Challenges
in Mechatronics, Mechanical Engineering and New High-Tech Products Development
MECAHITECH‘10
Bucharest, 23-24 September 2010
52
Fig.6. Original raw EMG signal
Concerning the developed system, presented in this paper, we can assure that it is able to solve the problem of spasticity quantification.
The most important tasks for this device are the correct data acquisition related to angular velocity, joint angle and electromyography signal activity in the muscle.
The device is, still under, development determination of the double threshold detection following the method proposed by [12], and to apply the developed device to measure spasticity in clinic environment. The informal consent is just to be authorized and signed.
CONCLUSIONS AND FUTURE WORK
This paper presents the study and design of a device for spasticity quantification, to be used in joint of ankle, elbow and knees. This approach is based on Lance´s work [7] that states the velocity dependence increase in the TSR. To determine the SRT, three measurements were proposed: EMG signal activity in the muscle; angular velocity of passive muscle stretch and the joint angle position.
The sensor devices were chosen taking into account the system variables and the corresponding measurement range. In particular, the electromyography signal has a measuring range of 20-500 Hz; the angle, 180º; and the angular velocity, 500º/s.
The data acquisition system, board and software, selected are from National Instrument due to its functionalities. The USB interface of the board enables system portability, an important requirement of the proposed device.
The system prototype was validated in laboratorial environment. Next step consists of the implementation, testing and validation of the proposed
mechatronic device in clinical environment, by medical staff, being the informal consent with a public Portuguese hospital about tobe signed.
REFERENCES
[1] Le Carvozin, P., X. Hemot, O. Bartier, G. Carrault, F. Chagneau, P. Callien, H. Allain, P. Rochcongar, “Evaluation of pendulum testing of spasticity” in Annales de la Réadaptation et de Médecine Physiqu, Mars. 2002 , 45, pp. 510-516.
[2] Calota, A., A.G. Feldman, M.F. Levin “Spasticity measurement based on tonic stretch
reflex threshold in stroke using a portable device” In Clinical Neurophysiology. 2008, 119, pp. 2329-2337.

International Conference 2ND International Conference on Innovations, Recent Trends and Challenges
in Mechatronics, Mechanical Engineering and New High-Tech Products Development
MECAHITECH‘10
Bucharest, 23-24 September 2010
53
[3] Chen, J.J, Y.N. Wu, S.C Huang, H.M. Lee and Y.L. Wangs “The Use of a Portable Muscle Tone Measurement Device to Measure the Effects of Botulinum Toxin Type A on Elbow Flexor Spasticity”. Arch Phys Med Rehabil,. Vol. 86, Agu. 2005.
[4] Chardon M., L. Nina, Surech and w.z. Ryner. “A New Method For Reflex Threshold Estimation in Spastic Muscles” Presented at the conference of the IEEE EMBS. Sep. 2009.
[5] Levin, M.F., “On the nature and measurement of spasticity” in Clinical Neurophysiology,
2005. 116; 1754-1755 [6] Bernhard, J L. “Towards a Clinical measurement of Spasticity” In Physiotherapy. 1995
81. [7] Lance, J.W. “Spasticity: Disorder of Motor Control” Chicago, Year Book Medical, 1980,
pp. 485-500.
[8] Decq, P., P. Pilipetti, J.P. Lefaucheur “Evaluation of Spasticity in Adults” Operative Technique in Neurosurgery. 2005, PP. 100-108.
[9] Febiger, L. “Kinesiology and Applied Anatomy (7th ed.)” Guanabara Koogans. A. 1989, PP. 146-170.
[10] Ennis, O., D. C. Miller, P. Kelly,. “Fracture of the adult elbow” in Current Orthopaedics.
2008, 22; pp. 111-131.
[11] Hermens, H. J., B.Freriks, C. Disselhorst-Klug, G. Rau “Development of recommendations for SEMG sensors and sensor placement procedures” In Journal of Electromyography and Kinesiology. 2000, 10; pp. 361–374.
[12] Lanyi, X., A. Adler “An improved method for muscle activation detection during gait”
Canadian Conference of Electrical and Computer Engineering 2004.
[13] Jobin, A. and M.E.Levin. “Regulation of stretch reflex threshold in elbow flexors in children with cerebral palsy: a new measure of spasticity” Developmental Medicine & Child Neurology. 2000, 42; pp. 531-540.
[14] Reaz, M.B.I., M.S.S Hussain and F.Mohd-yasin “Techniques of EMG signal analysis:
detection, processing, classification and aplication” In Biol. Proced. Online. 2006; 8(1):11-35.

International Conference 2ND International Conference on Innovations, Recent Trends and Challenges
in Mechatronics, Mechanical Engineering and New High-Tech Products Development
MECAHITECH‘10
Bucharest, 23-24 September 2010
54
The Intelligent Automatic Acoustic-Emission Control
of Pipes over their Hydro Tests
B. Miletsky - IC NDT Introscop S.A., 20, Mesterul Manole str., Chisinau, R. Moldova, MD-2044; [email protected]
With a view of increase of the warranty of pipes at release from manufacture or after their repair in conditions of repair shops it is expedient to accompany with hydraulic tests of pipes by the acoustic-emission control. High efficiency of process demands automation of processes of submission of a pipe on a site of hydro tests, its filling by water, installation of converters of acoustic emission (АE) on a pipe, raisings of pressure with simultaneous registration, processing of signals АE and distribution of results. Tasks of acoustic-emission control over the given conditions are solved with the help of the specialized system.
Developed system AЭС НКТ includes 7 АE-channels and provides data exchange with managing computer or the controller of a site of hydro tests according to standards 100BaseT. As a rule, 2 extreme converters AE are established outside of a body of a pipe and provide constant acoustic contact. Taking into account, that other AE converters are established on a body of a pipe automatically their acoustic contacts are not constant and depend on many factors. Process of the control is schematically carried out as follows. After receipt of a pipe on a site and its filling by water on system the corresponding signal then there is a process of calibration acts. A variation of acoustic contacts between converters and a body of a pipe are taken into account automatically by the electronic block on generated signals of acoustic emission by extreme converters. Also speed and attenuation of acoustic signals are specified, and presence of acoustic contact on channels is checked. Under certain conditions some channels can be excluded at registration. On the termination of calibration the system gives out a corresponding signal and, at reception of a signal about the beginning of a raising of pressure, passes in a mode of registration and processing of signals АE during earlier established period of time then gives out a signal about the termination of registration and corresponding results. At registration the system constantly accepts and fixes a signal about size of pressure in a pipe. Signals of acoustic emission from extreme converters can be used for interdiction of registration of foreign noise, and also in a location at registration.
At detection of a leak the program automatically passes in a mode of registration of a leak with distribution of the corresponding message to the screen of the monitor and a managing computer.
The system registers and gives out in real time on the display and on a computer of the top level the following messages:
a) A leak in a zone of one of the ends of a pipe; b) A leak between converters on a body of a pipe; c) Active sources AE are not present; d) Dangerous source AE with the indication of coordinates of a source; e) The channel is disabled. In the program of system the following main opportunities on processing the received

International Conference 2ND International Conference on Innovations, Recent Trends and Challenges
in Mechatronics, Mechanical Engineering and New High-Tech Products Development
MECAHITECH‘10
Bucharest, 23-24 September 2010
55
results (after measurements on one pipe) are incorporated: a) Calculation of a spectrum accepted AE signals; b) A filtration of signals; c) The graphic information on parameters of the accepted signals of acoustic emission; d) The analysis of signals on ПБ 03-593-03 (Russian Federations) with the subsequent
distribution of messages on a condition of a pipe. System AЭС НКТ originally made for the control of tubing’s during carrying out of their
hydro tests in conditions of repair shops within the framework of cooperation with CJSC "NTS-LEADER" (Khimki, the Moscow region, Russian Federation), provides the necessary automatic acoustic-emission control, and can be used for the control of wider assortment of pipes.
For the decision of problems of the acoustic-emission control more the broad audience of objects can be used system AEC-USB.
The system can include from 1 up to 32 independent channels who are connected to a computer through trunk USB of 2.0 high speeds.
Figs.1. Variants of execution of the block electronic, preamplifiers and AE converters
Each channel executed as a separate four-layer payment with use of modern element base, provides:
- reception of signals AE, their numbering, digital processing (a filtration, reception of parameters of signals AE) with transfer of the information, including about the form of a high-

International Conference 2ND International Conference on Innovations, Recent Trends and Challenges
in Mechatronics, Mechanical Engineering and New High-Tech Products Development
MECAHITECH‘10
Bucharest, 23-24 September 2010
56
frequency signal, in a computer for an opportunity of the further processing, display and post processing;
- reception, numbering and transfer to a computer of a low-frequency parametrical signal;
- generation of signals for the converter of acoustic emission (AEC) in a mode of radiation for the control of serviceability of a complex, i.e. AEC can work both as the receiver and as a radiator.
The software allows to set the necessary initial data for monitoring procedure, to operate system, to lead its calibration, to process the received information from channels and to display a complex of parameters AE of tests in real time, and also provides an opportunity of the subsequent processing of the information (including the spectral analysis) in a mode of the post-analysis.
REFERENCES:
1.В.И.Иванов, И.Э.Власов Метод акустической эмиссии. Неразрушающий контроль. Том7, М. Машиностроение, 2005. [In Russian].

International Conference 2ND International Conference on Innovations, Recent Trends and Challenges
in Mechatronics, Mechanical Engineering and New High-Tech Products Development
MECAHITECH‘10
Bucharest, 23-24 September 2010
57
Snow Removal Methods
Diana Mura Badea, Dumitru Vlad, Constantin Petre, Tudor Dragos Guta National Institute of Research and Development in Mechatreonics and Measurement Technique
Şos. Pantelimon 6-8, sector 2, Bucharest, ROMANIA
ABSTRACT
Numerous snow-removal methods are currently available, from the most simple and by now classical methods, to methods benefiting from a wide technological input, applying new ideas based on fundamental facts, constructive solutions or innovative materials.
Two large generic snow-removal methods are essentially known: • mechanical methods – methods by which snow is removed from certain spaces
(roadway, sidewalk, public markets, courtyards, etc.) with the aid of mechanical devices;
• chemical methods – methods by which snow is removed by applying a layer of chemicals with a double role on the snow: transforming (melting) into water and preventing the freezing of the water resulted as such.
CHEMICAL SNOW REMOVAL METHODS
It is noticed that, despite the fact that the work methods and several of the mechanical execution elements are found in several types of snow cleaning machines, differences can be made between the methods that are applied, according to the drive of such elements, respectively the travel manner thereof:
• manual • electrical • with internal combustion engines
Considering the manners of operation, the following snow-removal methods can be mentioned, according to the types of elements used in snow removal:
• snow removal by using snow removal blades and storing the snow on the side of the roadway, with various forms and manners of operation;
• snow removal by using collecting and storage mechanisms on the side of the roadway;
• snow removal by collecting and discarding snow outside the useful space; • snow removal by establishing a mixed method resulted by combining one of the first
two methods (snow removal blades or collecting mechanisms) with the method of discarding snow outside the useful space.
Advantages, disadvantages, comments
The mechanical snow-removal methods have a series of advantages :
• the time spent on snow-removal in relation to the cleared quantity/surface is significantly lower than that of the chemical methods, allowing traffic, respectively

International Conference 2ND International Conference on Innovations, Recent Trends and Challenges
in Mechatronics, Mechanical Engineering and New High-Tech Products Development
MECAHITECH‘10
Bucharest, 23-24 September 2010
58
access, to the previously snow-covered sites to be quickly resumed; • the quantity of snow that was removed is larger than with chemical methods; • no preliminary preparation operations/devices are required or no operations/devices
are required to be carried out/activated during the snow removal process; • access to the snow covered surfaces/sites is immediate; • they do not attack/cause chemical damage and in-depth damage to the surfaces that
were cleared of snow. On the other hand, the mechanical methods also have a series of disadvantages :
• the devices that are used have relatively high costs; • the devices that are used for the snow removal of large surfaces/quantities are mostly
driven (both for the travel and for the actual activation) by internal combustion engines with relatively high capacities/powers. This implies the use of relatively high quantities of oil fuel, respectively the insurance of the possibility of a supply with such fuel;
• it is possible that, if the devices are operated negligently, the superficial layer of the snow-removed surface is subject to mechanical damage (scratches, increasing the irregularity of such surfaces, etc.);
• snow removed from the snow covered surfaces must be stored in the immediate vicinity thereof. For the snow-removal of the roadway, this may create afferent problems related to the limitation of access/blocking of certain sites found on the side of the roadway;
• the maintenance of such equipment involves a properly organized service activity during the operating term, respectively adequate spaces for storage and preservation during the term when they are not used.
CHEMICAL SNOW REMOVAL METHODS
Chemical methods imply the deposit of chemical substances in areas subject to snow removal. Such substances result in the melting of the current snow (ice), simultaneously with preventing the freezing of water resulted from the melting of the snow.
The methods can be differentiated according to the very nature of the chemicals that are used:
• depositing solid particles • using liquid solutions
Advantages, disadvantages, comments
Similar to the mechanical methods, chemical methods also have a series of
advantages: • the equipment used is somewhat less expensive • drive engines/powers with such high powers are no longer necessary as in the case
of mechanical equipment; • costs are relatively lower; • generally, the entire procedure is simpler, and the time dedicated to the deposit of the
chemicals layer is lower; • they allow a reduction (up to the elimination) of snow layers, respectively of the snow

International Conference 2ND International Conference on Innovations, Recent Trends and Challenges
in Mechatronics, Mechanical Engineering and New High-Tech Products Development
MECAHITECH‘10
Bucharest, 23-24 September 2010
59
coverage: if the weather forecast predicts the occurrence of massive snow conditions, adequate chemicals can be deposited “in advance” (especially on the roadway), creating immediate snow melting conditions, potentially even the prevention of the creation of a new snow layer;
• the option to combine several types of materials in order to establish a mixed effect, such as snow-removal and an anti-skid effect. Moreover, there are also a series of disadvantages:
• the time required for snow removal is significantly higher. Therefore, the chemical methods cannot be used efficiently for the performance of a fast snow removal process, with immediate impact;
• the quantity of snow that is removed is significantly lower than with the use of mechanical methods;
• additional preparation operations/devices are required (insuring a large quantity of chemicals in trucks/high capacity tanks). Moreover, there is down time required to reload such equipment with chemicals;
• access is more difficult. If the layer of snow is too large, such methods can no longer be taken into consideration;
• high capacity supply bases must be available to insure the need of such substances. This also involves the creation of spaces that are resistant to the potentially corrosive action of the substances that are used, as well as (if applicable) the insurance of increased security conditions;
• the potential ecologic and sanitary impact created by the use of such substances must be carefully studied/predicted, both in terms of the environmental effect, and the effect on the human staff used for the snow removal process and on the population living in the snow-cleared surfaces;
• the effect/risk of damaging the snow-cleared surface, both at a superficial level and in-depth must be carefully analyzed;
• the population must be warned on the potential negative effects of substances on the cars/body/layers of paint (corrosion, superficial or even in-depth attack thereof) for the use of substances such as saline salt/solutions. It is recommended to wash immediately with abundant running water, in order to mitigate such effects.
CHEMICAL METHOD EQUIPMENT Calcium chloride
Calcium chloride went in use in 1940 in order to prevent frost, due to its option of use under very low temperatures – even -30 degrees Celsius – due to its capacity to quickly absorb moisture. Specialists have reached the conclusion that it has characteristics that are superior to those met in other products used in this scope - calcium chloride and magnesium chloride. Applied in low quantities on the first snow falls, it significantly reduces the effort of roadway snow-removal, it leaves no sediments and it is easily cleaned; it does not damage the concrete or asphalt covered surfaces and it mitigates the damage caused to vehicles (as salt has a corrosive effect). Chemical name: Calcium chloride Trade name : Technical grade calcium chloride Presentation
o Calcium chloride solution type 35

International Conference 2ND International Conference on Innovations, Recent Trends and Challenges
in Mechatronics, Mechanical Engineering and New High-Tech Products Development
MECAHITECH‘10
Bucharest, 23-24 September 2010
60
No. Feature M.U. Tolerance conditions 1. Aspect - clear liquid to light opalescent 2. Colour - colourless to yellowish or gray 3. CaCl2 content % min. 30 4. Water insoluble content % max. 0,1 5. Iron content % max. 0,01 6. Alkaline and Mg chlorides
content (as NaCl) % max. 0,5
7. Sulphates content (SO4) - N/A 8. Chlorates content (ClO3) - N/A 9. Acidity - N/A
o Calcium chloride solution type 30, with corrosion i nhibitor No. FEATURE M.U. TOLERANCE
CONDITIONS 1. Aspect - clear liquid to light opalescent 2. Colour - colourless to yellowish or gray 3. CaCl2 content % min. 30 4. Water insoluble content % max. 0,1 5. Iron content % max. 0,01 6. Alkaline and Mg chlorides
content (as NaCl) % max. 0,5
7. Sulphates content (SO4) - N/A 8. Chlorates content (ClO3) - N/A 9. Acidity - N/A 10. 30% solution pH Unit. pH neutral
Uses
• in the chemical industry • in the paper industry • in refrigeration • in the pharmaceutics industry • in constructions as a concrete hardening and setting accelerator • in non-ferrous metallurgy • in the construction and exploitation of highways • as a gas and liquid drying agent • in preventing dust formation on roads, sports courts and in mining • in preventing glazed frost, ice and snow on roads • in the winter transport and storage of minerals • in the food industry, for sugar refining • as a mixture in slime sludges
Packaging • The product is packaged according to the calcium chloride type as such:
o Crushed : in glued polyethylene bags, introduced in sown polyethylene bags, with a 40 kg net mass.
o Burnt : in air-sealed 45 kg mass sheet metal barrels on the generators, with a lid closed by mangling

International Conference 2ND International Conference on Innovations, Recent Trends and Challenges
in Mechatronics, Mechanical Engineering and New High-Tech Products Development
MECAHITECH‘10
Bucharest, 23-24 September 2010
61
o Solution : in RW tanks with a rubber lining or made of stainless steel, in plastic containers with a 60 l capacity
Storage • Burnt and crushed calcium chloride is stored and kept in the original packing (air-
tight), in clean and closed storage units, away from moisture. • Calcium chloride solution is stored and kept in the original packing (air tight) or in
tanks that do not modify their features. Transport
• by covered means of transportation or RW tanks
The chemical de-icing solution will aid the removal of ice, however it may also damage the environment.
Applying the chemical de-icing solution may: - decrease the lifespan of surfaces; - corrode railway tracks; - pollute rivers and lakes by water drainage; - destroy the grounds; - prevent the growth of or kill plants afferent to the de-iced area. Manual snow removal used by applying an abrasive such as wet sand in creating
adherence may keep the roadway protected, without any problems associated to chemical de-icing.
The proper use of chemical de-icing or the replacement thereof with manual and
abrasive removal may minimize the destruction potential, maintaining the safety of the roadway.
Numerous chemical de-icing solutions are technically salts decreasing the water freezing point under 0oC. Salts can destroy plants in two ways:
- On the one hand, by direct contact with the melting equipment containing the chemical de-icing solution or in the salts distributed on the roads.
Snow blown by the wind or discarded by a shovel, containing chemical de-icing solution, near parcels, will increase the probability of pollution.
Direct contact may cause the death of growing plant buds and sprouts. The exposure of plants to salts may cause early blooming symptoms in February or March, spotting, yellowing or drying and dying of the buds.
- On the other hand, by repeated annual applications in the adjacent soil, they can destroy the roots of plants, which are incapable of absorbing water.
The symptoms of plants include wilting even when the soils are muddy. In time, soils can have their structure modified by the extremely high salinity and they
become unavailable for supporting the life of plants. If properly drained, the soils can be moistened abundantly in order to eliminate the excess of salts, however, this does not work with fine textured soils or soils that are insufficiently drained. Other chemical solutions used for de-icing are also indicated below: Clearway F1 – An ecological, fast acting and long lasting de-icing solution
Based on a unique formulation of potassium and corrosion inhibitors, Clearway F1 is an effective de-icer for airport runways, roads and highways. The product meets all ecological and environmental requirements, in compliance with the AMS 1435 A specification.

International Conference 2ND International Conference on Innovations, Recent Trends and Challenges
in Mechatronics, Mechanical Engineering and New High-Tech Products Development
MECAHITECH‘10
Bucharest, 23-24 September 2010
62
When applied with the mechanical facility of airport maintenance departments, Clearway F1 removes snow and ice quickly and efficiently. Clearway F1 melts ice by depressing the freezing point of water. Due to the extremely low freezing point of potassium formate, the solution has a low freezing point. Transport and storage
The Clearway F1 solution delivered by the manufacturer is ready for use and needs no further diluting or concentrating. The product is delivered in tanks with a 1000 or 2000 liter capacity. Clearway F1 is compatible with most materials used in airport storage equipment. It has a moderate corrosive effect on zinc, galvanized materials and soft solders. Clearway 1 and Clearway 3 – An environmentally-friendly de-icing alternative Based on a unique formulation of potassium acetate and corrosion inhibitors, Clearway F1 and Clearway 3 are runway de-icers with environmentally-friendly characteristics. The product meets all requirements, in compliance with the AMS 1435 A specification. Clearway 1 was developed in 1987 and was the first acetate-based runway de-icer to offer an environmentally-friendly alternative to conventional de-icers such as glycol, urea and salt. Clearway 3 was developed by two English consortiums. By increasing viscosity without reducing the friction effect, it achieves extended hold against freezing rain or ice build-up on runway surfaces. This is an advantage to conventional de-icers. Clearway 1 and Clearway 3 are not harmful to users, animals or fish and are fully biodegradable in aqueous systems without causing oxygen depletion problems. Transport and storage
The Clearway 1 and Clearway 3 solutions delivered by the manufacturer are ready for use and need no further diluting or concentrating. The product is delivered in tanks with a 1000 or 2000 liter capacity. Clearway 1 and Clearway 3 are compatible with most materials used in airport storage equipment. They have a moderately corrosive effect on zinc, galvanized materials and soft solders. Tyler Ice Control Solution de-icers
Small compact unit size for ramp work Tank size set between 875…3500 liters (stainless steel or poly) Tank includes 3 sections Product pump capacity of 180 GPM allows for loading and off-loading and transferring of liquid from one compartment to another Convenient pump station location, safe and easy to operate Electrically operated boom shutoff valves. Flow based ground speed control system. Fan equipped exhaust system Stainless steel spray bar system. 18hp Kohler engine.

International Conference 2ND International Conference on Innovations, Recent Trends and Challenges
in Mechatronics, Mechanical Engineering and New High-Tech Products Development
MECAHITECH‘10
Bucharest, 23-24 September 2010
63
Tank size: 1890, 3780, 7560, 9450, 15120, 18 900 liters
Pump mounted in a safe and accessible location
Flow control system
Internal or external shutoff valves
Stainless steel tank
Truck or trailer mounted
Pump flow between 100 and 2200 l/min
Fixed or cab controlled washers
Optional hose reel.
Midsized components make it useful for distributing runway de-snowing solutions
Tank size set between 1750…7000 liters (stainless steel)
Boom sizes of 5.5…15 m, built for the deicing industry
Product pump capacity of 1050 l/min
Convenient pump station location, safe and easy to operate
Electrically operated boom shutoff valves

International Conference 2ND International Conference on Innovations, Recent Trends and Challenges
in Mechatronics, Mechanical Engineering and New High-Tech Products Development
MECAHITECH‘10
Bucharest, 23-24 September 2010
64
Flow control system
Cab controlled boom functions
Hose reels (both manual and electric)
Weather proof electrical cabinet
Select-a-Spray nozzle system
Stainless steel spray bar system
International Conference 2ND International Conference on Innovations, Recent Trends and Challenges
in Mechatronics, Mechanical Engineering and New High-Tech Products Development
MECAHITECH‘10
Bucharest, 23-24 September 2010
65
A Network Configuration for Industrial Systems Cont rol
Nuno Carvalho
Industrial Electronics Department, ALGORITMI / University of Minho Campus of Azurém, 4800-058 Guimarães, Portugal
Sandra Costa Industrial Electronics Department, ALGORITMI / University of Minho
Campus of Azurém, 4800-058 Guimarães, Portugal [email protected]
Celina Leão
Production and Systems Department, ALGORITMI / University of Minho Campus of Azurém, 4800-058 Guimarães, Portugal
Filomena Soares Industrial Electronics Department, ALGORITMI / University of Minho
Campus of Azurém, 4800-058 Guimarães, Portugal [email protected]
José Machado
Mechanical Engineering Department, CT2M / University of Minho Campus of Azurém, 4800-058 Guimarães, Portugal
Helena Rodrigues Information Systems Department / University of Minho
Campus of Azurém, 4800-058 Guimarães, Portugal [email protected]
ABSTRACT
Industrial communication networks and respective software and tools associated to remote control play an important role in today’s manufacturing control systems. Among them, the networks based on Ethernet technology are deploying due to its high-speed communications. The existing of needs, related with industrial applications and educational purposes, makes the study of these networked systems as crucial in Engineering fields related with Automation. This paper presents a platform with industrial and engineering education goals. The platform involves the most recent technologies for networked industrial communications systems and it was developed by teachers and students of four Departments of School of Engineering of University of Minho (Portugal) and with the collaboration of an industrial partner: OMRON. The paper discusses the context of creation of the platform and the main lines of research that were performed, related with communication protocols, tests and web page created for remote access to the platform.
INTRODUCTION
The globalization and the necessity that the companies have to improve their competitiveness has lead to many developments in this field, related with more complex

International Conference 2ND International Conference on Innovations, Recent Trends and Challenges
in Mechatronics, Mechanical Engineering and New High-Tech Products Development
MECAHITECH‘10
Bucharest, 23-24 September 2010
66
industrial networks applications and with more complex communication protocols elaboration, mainly the applications related with remote access to automated manufacturing systems.
Industrial communications have significantly evolved since their appearance in the 1970s. Faster and more reliable communication protocols have been proposed and deployed in industrial applications by [1].
The flexibility of the management and control systems is a key issue for manufacturing processes. For that accomplishment, a fast access to the information allows fast decisions, accordingly to the manufacturing process behavior and, more important, allows the improvement of the manufacturing systems efficiency.
With the development of the industrial networks’ communication capabilities, with the evolution of the industrial communication protocols and the increasing of the exigency level - characteristic of the manufacturing process control - the know-how associated to these realities is becoming crucial on the development and improvement of the competitiveness of the industrial companies.
In this paper it is presented the research project platform WALC (Web Assisted Laboratory for Control Engineering). This research project is being developed by a team from the School of Engineering of University of Minho involving four departments, and an industrial automation company, OMRON. One of WALC project´s goals is to set available different industrial networks and protocols in real-world industrial case-studies didactic kits, remotely available and accessed. This laboratory is available for under and postgraduate students as well as for industrial partners. Summarizing, WALC deals with industrial networks and communication protocols, in order to generate know-how in this field for direct application in some manufacturing companies, partners of University of Minho. This paper shows the work that the team has done and also some perspectives of evolution of future works.
In order to achieve the goals proposed in this paper, next two sections present a discussion about communication protocols with a network configuration proposition for WALC project platform; further there are presented the interface communication and some general ideas about the web page created for remote access to the platform. Finally, there are presented some conclusions and future work. INDUSTRIAL PROTOCOLS: DISCUSSION
This project work aims to provide knowledge and training in the control and automation
in the industrial environment. This knowledge allows to program logic controllers, to acquire concepts and practices in automation involved in an industrial system.
When selecting a communication network, it is necessary to know the application and what are the requirements that will be made to the network.
In this chapter it is intended to resume the characteristics of the protocols and networks existing in the market (Table 1).
Thus, according to the CIM [2] pyramid model, there were chosen a few networks to present in detail, which can be applied at different levels of the pyramid.

International Conference 2ND International Conference on Innovations, Recent Trends and Challenges
in Mechatronics, Mechanical Engineering and New High-Tech Products Development
MECAHITECH‘10
Bucharest, 23-24 September 2010
67
Table 2 Comparative analysis of Industrial communication networks
Network OSI Layers CIM Level Topology Number of
Devices Baudrate
Ethernet TCP/IP
5 Process level to management level
Star, Bus, Ring
255 1Gbps
PROFIBUS
3
Process; I/O Level and Control
Bus 31 12 Mbps
AS-Interface 3 I/O Level Bus 31 167 Kbps DeviceNet 3 I/O Level Tree 64 500 Kbps
These networks were selected considering the main goal of WALC project: • It was selected the network Ethernet-TCP/IP, that can be implemented from the level
of control to the level of management; Profibus with the possibility to be applied from the level of actuators and sensors to the level of process; AS-Interface, with direct application at the lower level at pyramid CIM, e, at last, DeviceNet, that can be applied at the level at the sensors and actuators;
• The use of Profibus allows decreasing the complexity of the control part of these systems. The decreasing of implementation costs and strong skills to allow us detect failure behavior for the system was very important, too;
• The implementation of AS-Interface, has a low cost of implementation, it is easy to assemble, with only a two-conductor wire that connects all devices. Thus, it offers greater flexibility to the system, as a possible expansion of the system;
• The use of DeviceNet, aims to reduce the installation time of process control systems. This type of network is a simple solution, with rapid deployment, reducing the assembly time. This type of network allows a connection of 64 nodes where each may have actuators and modules for input and output coupled to these;
• RS232, has become a widely used protocol in communications and control devices. This communication is a serial communication, made only through 2 devices, where both share the same communication line.;
• Unlike the RS232, RS485 was developed to meet the need for multi point communication, and their format allows connecting up to 32 devices, with a transmitter and a receiver device. This protocol easily converts the standard RS232 to RS485. Thus, it remains compatible with existing devices on the market, given that most computers already have RS232 output.
PROPOSED NETWORK CONFIGURATION
In order to build the WALC platform it is necessary to propose a configuration of networked systems to achieve the main goals of the WALC project presented above. With the support of an industrial automation company, OMRON [3], a network of programmable logic controllers was implemented. This consists of several PLCs with different characteristics and with different communication tools. For the developing of the network, a number of different equipment used in industrial applications was employed. The different equipments utilized were according to the communication type in the network (Figure 1). The implemented network is composed by six parts: (1) Ethernet, (2) DeviceNet, (3) Mechatrolink, (4) Profibus, (5) RS485, and (6) RS232 [4] [5] [6]. These communication tools

International Conference 2ND International Conference on Innovations, Recent Trends and Challenges
in Mechatronics, Mechanical Engineering and New High-Tech Products Development
MECAHITECH‘10
Bucharest, 23-24 September 2010
68
are used for programming and monitoring of programmable logic controllers and industrial systems.
Figure 1 shows the network built for the implementation of the present work project. The different types of communication implemented and used are indicated with different colors [7].
Figure 1: Industrial network proposed for WALC project
The Ethernet network (line 1, figure 1), contains the network attached to two PLCs, to a
control device inputs/outputs and to a vision system. It is the Ethernet network that will take the lead role of the network, creating the remote access to the network, allowing the possibility to program, control and monitoring form any remote point of the industrial place. The DeviceNet communication (line 2, figure 1) allows the data exchange between the control devices, PLCs, security devices and input/output controls). The Mechatrolink communication (line 3, figure 1) is used to control the servomotor. The choice of this type of communication was due to its high performance in terms of speed and high precision movement control. The Profibus (line 4, figure 1), links the inverter and the control device inputs/outputs. The RS485 communication (line 5, figure 1) is, also, represented. It contains two PLCs with various sensors. And finally, there is the RS232 communication network (line 6, figure 1) connecting the main PLC and the GSM modem and, also, containing a touch screen console and a temperature controller device which, in turn, will be connected to PLC CJ1ETH.
The control and monitoring of PLC networks have been growing in the last years, due to their importance in the industrial environment. The management of a network for monitoring and control enables data acquisition in real time, identification of the traffic characteristics, the fault diagnosis and network configuration. The monitoring plays an

International Conference 2ND International Conference on Innovations, Recent Trends and Challenges
in Mechatronics, Mechanical Engineering and New High-Tech Products Development
MECAHITECH‘10
Bucharest, 23-24 September 2010
69
important role in the network management. To monitor and control the network, two protocols developed by [3] were used: the
Host Link [8] and FINS – Factory Interface Network Services [9] protocols. These protocols provide the necessary tool to carry on an effective monitoring and control network. Before using these protocols, it was necessary to know the different memory allocations presented in the CPU of each device (PLCs).
The Central Processor Unit (CPU) memory from OMRON devices is separated into several types, namely:
• CIO (memory area used to interface external Inputs/Outputs;; • W (Work Area), • AR (Auxiliary Area), ; • T (Timer Area); • C (Counter Area); • DR (Data Register); • TK (Task Flag Area); • DM (Data Memory); • HR (Holding Area); • IR (Index Register); • LR (Communication Relays); • EM (Expanded Memory).
INTERFACE FOR COMMUNICATION
The centralization of network information through a single point allows better management of the network. The development of an interface for operating a network gives the user greater production efficiency.
Following this trend, it was developed a user interface for monitoring and control the industrial network based on OMRON equipment (Figure 2). The interface was developed in LabView from National Instruments [10].
Figure 2: Interface front panel

International Conference 2ND International Conference on Innovations, Recent Trends and Challenges
in Mechatronics, Mechanical Engineering and New High-Tech Products Development
MECAHITECH‘10
Bucharest, 23-24 September 2010
70
Figure 2 shows the front panel of the software developed for network management. With this prototype, the user is able to select between two types of protocols: Host Link protocol and the FINS protocol.
Host Link protocol When Host Link button is pressed on the front panel (left down button in Figure 2), the
dialog in Figure 3 is shown. This window contains three buttons with the type of operation mode of the PLC (“Program”, “Monitor” and “RUN”) to be chosen by the user and another button (“Type Mode?") that sends a command request for the operating mode identification; it also contains a group of six buttons with the memory areas that can be accessed with this protocol; the memory areas can only be accessed if the PLC is in operation mode "Monitor", otherwise the buttons are locked.
Figure 3: Interface: Host Link protocol – PLC memory areas
After selecting the PLC monitor mode, the user can choose the type of memory area to
use (CIO, DM, LR, HR, AR and PV, present values). After choosing the memory area to be used, it appears another window (Figure 4). Here, as an example, it was selected the memory area CIO, and the user can choose the node where he/she wants to send the frame; if the command is to read from the PLC, the user enters the position data from where he/she wants to read and finally the number of positions to be read.

International Conference 2ND International Conference on Innovations, Recent Trends and Challenges
in Mechatronics, Mechanical Engineering and New High-Tech Products Development
MECAHITECH‘10
Bucharest, 23-24 September 2010
71
Figure 4: Interface: Host Link protocol – communication frames
The communication can be established through RS232 or RS485 networks. When
frames are sent from a personal computer (PC) through Host Link protocol, a command answer is returned. The transmission frame from the PC is detailed in [11].
FINS protocol
Most new PLC from OMRON comes with the protocol, FINS. This protocol enables to
encapsulate FINS commands via Host Link protocol, suggesting that the FINS protocol is equal to Host Link or one of the protocols is a subset of the other. But FINS protocol defines a new set of commands, beginning the Host Link frame by “FA”. FINS frame length has a maximum receiving capacity of up to 538bytes (269 Words) and sending frames up to 540 bytes (270 Words). Host Link frame length is limit to a maximum of 30 Words.
FINS is a network protocol used by OMRON to send and receive commands via RS232 or Ethernet.
The advantage of this protocol compared to the Host Link is the possibility to send and receive frames of PLC in a sub-network. For example, a PC can be connected to a PLC through a RS232 communication which in turn is also connected to another PLC with the same type of communication, or another type of connection (eg RS485 or Ethernet).
OMRON PLC with Ethernet communication gives the user other advantages not only in programming but also in providing greater flexibility in process control and monitoring. The new OMRON PLCs with an Ethernet access are ready to be accessed with TCP/IP data communication system with the FINS Ethernet protocol. Compared to the conventional serial communication interface, Ethernet increases communication speed both for programming and for monitoring and control with a PLC.
In FINS Ethernet protocol, the FINS frames do not have the same format as in the

International Conference 2ND International Conference on Innovations, Recent Trends and Challenges
in Mechatronics, Mechanical Engineering and New High-Tech Products Development
MECAHITECH‘10
Bucharest, 23-24 September 2010
72
series FINS protocol. The FINS Ethernet enables the user to go directly to the PLC even remotely. In FINS Ethernet frames it is not necessary to include Host Link protocol for sending commands. The protocol will depend on the type of Ethernet communication to use, depends on whether the transmission is done through the data communication Ethernet TCP/IP or Ethernet UDP/IP. The detailed explanation of the frames configuration is presented in [11].
It was developed an interface for communication testing, both sending and receiving commands using FINS Ethernet TCP Protocol (Figure 5). In the case of Figure 5 it is sent a writing command in the PLC memory CIO, which will write four values from a memory location. As shown in the figure the values from one to four (0001 0002 0003 0004) will be written. The response "End Code" indicates that the command sent was successful.
Figure 5: Case-study: FINS protocol – communication frames
The tests performed in laboratory allow the show satisfactory response times and show
that the adopted solution works well. In order to improve the quality of communications, this solution will be simulated and
formally verified using UPPAAL real-time simulator/model-checker.
MAIN IDEAS RELATED WITH REMOTE ACESS
In this section, a detailed description of WALC platform, related with remote access, is presented; in particular the implemented real-world control experiences are explained as well as the Content Management System adopted for Laboratories.
In Control teaching/learning process, WALC allows the user to choose the practical engineering problem and the control type to be implemented. The available real-world problems are (Figure 6):
• DC Motor Control,

International Conference 2ND International Conference on Innovations, Recent Trends and Challenges
in Mechatronics, Mechanical Engineering and New High-Tech Products Development
MECAHITECH‘10
Bucharest, 23-24 September 2010
73
• Temperature Control of a Classroom, • BakSim, • LabSim, • Bar Control.
DC Motor Control and Temperature Control of a Classroom, are remote accessed real-world experiences, where the user can test a digital controller algorithm in motor velocity and in room temperature control. Both interfaces were developed in LabView from National Instruments.
LabSim, Simulation Laboratory, and BakSim, Baker’s yeast Simulation, are virtual experiences. LabSim is a general purpose tool, developed in Java, for Control teaching/learning, with animated and graphical simulations of several types of engineering systems. BakSim is a specific tool, developed in LabView, for baker´s yeast modeling and control studies.
Figure 6: WALC platform interface for Control experiences
DC Motor Control: This is a remote experiment for controlling a DC motor. This work
was part of a final year graduation project of the Industrial Electronics Course at Minho University. It was implemented by an undergraduate student for students use. The experiment is controlled using a PID (Proportional, Integral and Derivative) algorithm programmed in LabView environment. The remote user can test PID digital algorithms and parameters, change reference velocity values and register the motor output velocity profile [12]. The monitoring is performed through graphical profile of motor velocity and a real visualization through a webcam.
Temperature Control of a Classroom: This system is capable of remotely monitoring and control the temperature of a physical space. This work was part of a final year graduation of the Industrial Informatics Course at the Polytechnic Institute of Cávado and Ave. It was developed by an undergraduate student using a LabView custom application with a methodology of on-off control. The local user can use a touch screen display to configure the system set-point temperature and for overall monitoring. For remote access it can be

International Conference 2ND International Conference on Innovations, Recent Trends and Challenges
in Mechatronics, Mechanical Engineering and New High-Tech Products Development
MECAHITECH‘10
Bucharest, 23-24 September 2010
74
used any device supporting LabView environment [13]. The visual access to the experience is performed with a webcam.
BakSim: This virtual experience was developed on a final project work for the Industrial Electronics Engineering undergraduate course. The main goal of BakSim is the development of an application for fermentation processes. BakSIM is an application for virtual control and simulation of a bioreactor for baker’s yeast fermentation, running in open or closed loop mode. It shows the most important system variables: biomass, ethanol, oxygen, glucose and dioxide of carbon. The BakSIM application allows the study of the fermentation process, the application of control laws, as well as the effectiveness of several numerical methods. One more advantage of this experience is its multidisciplinary aspect, as it puts together two areas of knowledge, Process Control and Numerical Methods [14].
LabSim: A learning object is developed through the construction of simulators and contents in Web environment: LabSim. LabSim is a virtual laboratory developed for numerical methods and process control, subjects that at a first view have apparently no relationship. It is a user-centered and dynamic Web site to support the learning activities for university students [15]. For all the available examples, process and control parameters (hysteresis or PID gains) can be changed during simulation test. Specific helping routines with theoretical support on the subject being studied, regarding control as well as numerical integration methods, are also available. The simulation results are presented in graphical form (showing state and control variable) as well as in animated form animated draw of a water level control in a tank.
Bar Control: This practical problem proposed put on evidence the characterization of mechanical properties of materials, namely the deformation measuring at a point on the surface of a flushed bar when subject to a controlled force [16]. The structures are part of our daily lives and the engineer uses a variety of applications that goes from bridges to skyscrapers. A flush bar at one edge is a simple form and example of a structure that can be used to define various parameters of its behavior when subjected to applied forces
The Web environment created includes the following features: • Documentation of the system: a tutorial, a use guide and a system knowledge
evaluation; • Numerical simulation of the process, with partial and final results presentation; • Visualization of real-time system after complete resolution of the problem; • The last two points can be viewed either individually or simultaneously
according to the initial choice made by the student.
CONCLUSIONS
This paper emphasizes the multidisciplinary nature of this project since the developed applications for real world problems in engineering are from different areas.
The WALC platform is not finished. In this moment we have created a network configuration and an interface for communications and also a web page for laboratories with remote control of experiments using diverse communications tools. These goals were achieved, being this platform available online for remote access. For future work, this platform will be tested in real context, analyzing users’ interactions in their assessment of the platform, namely motivation, technical and collaborative skills acquired.
From the theoretical point of view, the response times on communications will be measured and the implemented protocols will be modeled. Using the created models,

International Conference 2ND International Conference on Innovations, Recent Trends and Challenges
in Mechatronics, Mechanical Engineering and New High-Tech Products Development
MECAHITECH‘10
Bucharest, 23-24 September 2010
75
simulation and formal verification techniques and UPPAAL software [17], we will be able to have a precise idea about limitations in communications with the adopted network.
ACKNOWLEDGEMENTS
The authors are grateful to the Portuguese Foundation for Science and Technology (FCT) for funding through the R&D project PTDC/ESC/68069/2006.
REFERENCES
[1] IEC 61784-2 – “Industrial communication networks - Profiles - Part 2: Additional fieldbus profiles for real-time networks based on ISO/IEC 8802-3”.
[2] Zimmermann, H., OSI Reference Model. The ISO Model of Architecture for Open Systems Interconnection, 1980; 28.
[3] OMRON Company, 2010. Available in: http://Omron.pt, (Accessed in August 9th, 2010).
[4] Reynders, D., S. Mackay, E. Wright “Practical Industrial Data Communications – Best practice techniques”, ELSEVIER, 2005.
[5] PROFIBUS International, (2006) PROFINET: Technology and Application, System Description, available at www.profibus.com, Document number: 4.132, Issue April 2006; 132; 4.
[6] Liu, J., Y. Fang, D. Zhang “PROFIBUS-DP and HART Protocol Conversion and the Gateway Development” Second IEEE Conference on Industrial Electronics and Applications. 23-25 in Shangari-la Hotel, Harbin, China, May 2007.
[7] Carvalho, N., S. Rodrigo, C.P. Leão, J. Machado, and F. Soares. “ Platform WALC: design and development of a PLC Network” In Virtual University 2009, December, Bratislava, Slovakia, 2009.
[8] Klinkmann Automation Omrom Host Link Communication Server. Available in: http://www.klinkmann.com/CD/doc/480XXM10.PDF (Accessed in August 9th, 2010).
[9] FINS OMRON on TCP/IP protocol. Available in: http://www.abmicro.pl/appli/pdf_1/aiFinsTCP.pdf (Accessed in August 9th, 2010).
[10] Bitter, R., T. Mohiuddin, and M. Nawrocki “LabView: Advanced Programming Techinques” (2nd ed). EUA: CRC, 2007.
[11] Carvalho, N., C.P. Leão, F.O. Soares, J. Machado “An Interface for industrial network monitoring and control” IFAC – IMS’2010 - 10th IFAC Workshop on Intelligent Manufacturing Systems, July 1-2, Lisbon, Portugal, 2010.

International Conference 2ND International Conference on Innovations, Recent Trends and Challenges
in Mechatronics, Mechanical Engineering and New High-Tech Products Development
MECAHITECH‘10
Bucharest, 23-24 September 2010
76
[12] Silva, V., V. Carvalho, R.M. Vasconcelos, F.O. Soares, "Remote PID Control of a DC Motor", REV07, Porto, Portugal, ISBN 978-389958-278-9, June, 2007.
[13] Silva, M. and V. Carvalho, “Remote System of Temperature Monitoring and Control”, iJOE – Volume 4, Issue 4, November 2008.
[14] Oliveira, H.C., C.P. Leão, F.O. Soares “BakSIM – An application for control, monitoring and simulation of baker’s yeast fermentation process”, in the World Congress on Computer Science, Engineering and Technology Education Proceedings, New Engineering to a New World, 152-156, Edited by C.R. Brito and M.M. Ciampi, Itanhaém, Brazil, ISBN: 85-89120-30-9, March 2006.
[15] Lemos, F., C.P. Leão, F.O. Soares “SimLab: A Virtual Lab for Control Problems. An undergraduate Experience”, in Proceedings of Virtual University, Bratislava, 2008
[16] Teixeira, L., O. Costa, V. Pereira, C.P. Leão, F.O. Soares, M.T. Restivo, F. Chouzal, J. Mendes, J.C Campos, “Laboratórios virtuais: duas aplicações no ensino de engenharia”, Proceedings VII Simpósio Internacional de Informática Educativa (SIIE05), Leiria, Portugal, 2005.
[17] David A., G. Behrmann, K.G. Larsen, W. Yi “A Tool Architecture for the Next Generation of UPPAAL” Technical Report n. 2003-011, Department of Information Technology, Uppsala University, February, 20 pages, 2003.

International Conference 2ND International Conference on Innovations, Recent Trends and Challenges
in Mechatronics, Mechanical Engineering and New High-Tech Products Development
MECAHITECH‘10
Bucharest, 23-24 September 2010
77
The Workspace of a Double Hexapod Robot
M. Mărgăritescu*1, C. Brişan*2, N. Alexandrescu*3, C. RoaŃ*4, A.M.E. Ivan*1, V. Văduva*1
*1National Institute of Research and Development for Mechatronics and Measurement Technique – INCDMTM Şos. Pantelimon 6-8, sector 2, Bucharest, ROMANIA
E-mail: [email protected] *2Technical University of Cluj-Napoca
*3University Politehnica Bucharest *4Electrotechnical Research Institute – ICPE SA, Bucharest
ABSTRACT The double hexapod robot ROBEX consists in two staged hexapod platforms – Stewart Gough platforms - combining in a certain measure the advantages of the robots with parallel kinematics and of the serial robots: high accuracy, high stiffness, fast response and small dimensions, having an extended operating space. Different modelling and construction aspects were described in few previous papers. Some examples of trajectories generated with this positioning system are now presented to illustrate its mobility, as well as the workspaces for one and two hexapods in order to make possible a visual comparison between the two volumes. In order to asset the ROBEX workspace (for one module) it is used an existing model at The Technical University from Cluj-Napoca, robot named PARTNER, having a different kinematic scheme. The equivalence between the two robots, is proven in the last chapter.
INTRODUCTION
The double hexapod robot ROBEX is based on two Stewart-Gough platforms, having specific constructive parameters, an assembling procedure making it modular and having a particular condition imposed in order to reduce the redundancy of the system. The result is a more flexible positioning system. The direct and inverse kinematics of the platform together with new calibration methods were developed by numerous authors, among them being [1] and [2]. The idea of the project ROBEX was to extend the operating space supplied by a single platform. The double structure assumes that both modules have identical configurations, hence the same control parameters. To define the platform position three parameters are used: coordinates x, y, z of the platform centre; to define the orientation of the platform, three independent angles were introduced:
- ψ - the rotation angle around the fixed vertical axis - θ - the tilt angle of the platform around a horizontal axis that rotates itself with angle ψ - φ - the proper rotation angle of the platform around the axis that passes through its
centre and is perpendicular on it. The inverse kinematics relations used for modelling and control are presented in few previous papers [3], [4] and [5].

International Conference 2ND International Conference on Innovations, Recent Trends and Challenges
in Mechatronics, Mechanical Engineering and New High-Tech Products Development
MECAHITECH‘10
Bucharest, 23-24 September 2010
78
MODELLING OF THE DOUBLE HEXAPOD ROBEX
The control and simulation software of the ROBEX was performed in LabVIEW. Their description can be also found in [3], [4] and [5]. The construction of ROBEX is based on linear electrical actuators having 6 µm theoretical resolution. The length of a leg is about 200 mm, with a stroke of 20 mm. From practical considerations, the next solution was preferred: the lower and upper joints are universal joints; between the motor shaft and the upper universal joint a radial bearing is placed. In this case, the six legs represents 18 elements and the mobile platform the 19th, namely n = 19. So, there are:
- 12 universal joint of class 4 - 6 translation joints of class 5 - 6 rotation joints of class 5
The degree of mobility for one hexapod is:
( ) ( ) 61081143030481146565124196 =−=++−=⋅+⋅+⋅−⋅=M (1)
Special designed connecting elements are used for modular assembling (Figure 1); another function of these elements is to assure the co planarity between the centres of the universal joints from the base platform of the upper module and of the universal joints from the mobile platform of the lower module.
The functional model, in a simplified representation, contains:
- the mechanical structure
- the actuating section, including the power supply
- the external controller (a PC or equivalent) and the control software – a LabVIEW application.
The controller generates the positioning algorithms and the motion paths, which are transmitted to the actuating section, based on 12 LM1247-020-01 motors and MCLM 3003/06S motion controllers that carry out the displacement of the mechanical part. The PC is linked to the actuating section by a RS232 serial interface, using a set of controls in ASCII format.
Figure 1: Double hexapod robot ROBEX

International Conference 2ND International Conference on Innovations, Recent Trends and Challenges
in Mechatronics, Mechanical Engineering and New High-Tech Products Development
MECAHITECH‘10
Bucharest, 23-24 September 2010
79
PARAMETRIC MOTION CARRIED OUT BY ROBEX
The utility of this system depends of the complexity of the motion which can be generated by the control module. Linear path is one of the most used motion, for instance in the drilling operation. In Figure 2 is shown the home position and in Figure 3 a frame from the motion on the linear path.
Figure 2: Home position
Figure 3: Motion on the linear path In the general case of a certain curve, the parametric equations corresponding to a

International Conference 2ND International Conference on Innovations, Recent Trends and Challenges
in Mechatronics, Mechanical Engineering and New High-Tech Products Development
MECAHITECH‘10
Bucharest, 23-24 September 2010
80
straight line are replaced with the parametric equation of that curve. The path of the curve is generated in a similar mode. In Figure 4 an elliptical helix is shown.
Figure 4: Elliptical helix generated by ROBEX
ROBEX WORKSPACE
Generation of the workspace depends first of the conditions imposed to the structure: the lengths of the legs and the angular limitations from the universal joints [6]. Based on formulae from the analytical geometry, the second condition was solved knowing in every moment the director parameters of the legs and of the perpendicular straight lines on the planes corresponding to the platforms. Another category of conditions refers to the possibility to attain a certain point through different positions and orientations of the final platform. A control software for pivoting motion around a fixed point was also carried out. With a supplementary condition regarding the orientation of the final platform, particular workspaces were generated, as in Figure 5 for a single hexapod and in Figure 6 for a double hexapod. The two spaces were generated in the same conditions and are represented at the same scale. The difference between the two cases is clear, demonstrating the main advantage of the analyzed structure.
Figure 5: Workspace for one hexapod
Figure 6: Workspace for the double hexapod

International Conference 2ND International Conference on Innovations, Recent Trends and Challenges
in Mechatronics, Mechanical Engineering and New High-Tech Products Development
MECAHITECH‘10
Bucharest, 23-24 September 2010
81
EQUIVALENCE BETWEEN “ROBEX” AND THE “PARTNER” ROBOT USED FOR TESTS In order to practical verify the behaviour of the hexapod (one module) it is used an
existing model at The Technical University Cluj-Napoca, robot named PARTNER (Figure 7). It has a different kinematic scheme, the six linear actuators being placed on vertical fixed elements of variable lengths. The motion is transmitted to the mobile platform by six articulated elements of the same lengths. In the next paragraph the equivalence between the two robots, ROBEX (one module) and PARTNER is proven. The following notations are used (Figure 8):
Figure 7: Robot PARTNER from Technical
University Cluj Napoca used for tests
Figure 8: Equivalence of the ROBEX and
PARTNER robots Li – the length of the leg i belonging to ROBEX qi – the variable length of the vertical segment i belonging to PARTNER l – the length of the articulated elements belonging to PARTNER αi – the angle between the leg i belonging to ROBEX and the vertical axes
This angle can be easily deduced knowing the coordinates of the point Bi:
i
ii
B
BB
z
yxarctan
22 +=α (2)
Applying the Pitagora’s generalised formula in the triangle aiAiBi the next relation is obtained:
iiiii cosLqLql α2222 −+= (3)
Solving this second degree equation in qi, we retain the solution:
iiiii sinLlcosLq αα 222 −−= (4)
The relations (2) şi (4) are used in the modelling software of the PARTNER robot, carried out LabVIEW and similarly with the other programmes presented for ROBEX. The image of the PARTNER robot is shown in Figure 9. Tests concerning the robot workspace are in course.

International Conference 2ND International Conference on Innovations, Recent Trends and Challenges
in Mechatronics, Mechanical Engineering and New High-Tech Products Development
MECAHITECH‘10
Bucharest, 23-24 September 2010
82
Figure 9: Modelling of the PARTNER robot
CONCLUSIONS
In this paper, the double hexapod robot ROBEX, including the control software based on the inverse kinematics equations and the physical model are presented. Using the LabVIEW features, graphical representation of the system motion is shown in an intuitive mode for few representative trajectories, as well as for the workspaces of the simple and double hexapod. A certain advantage for the double hexapod from point of view of the workspace size was put in evidence. Further developments could be imagined using new types of actuators, smaller and more efficiently. This work is financial supported by ANCS/CNMP through the PN 2 research project No. 71- 024 / 2007.
REFERENCES [1] Raghavan, M. “The Stewart platform of General Geometry has 40 Configuration”. Journal
of Mechanical Design, Vol. 115, 1993.
[2] Dietmaier, P. “The Stewart-Gough Platform of General Geometry Can Have 40 Real Postures”. Analysis and Control, 7-16, 1998.
[3] Mărgăritescu, M., Brişan, C., Panaitopol, H., Ivan, A.M.E. "Robots with extended mobility using modular hexapodal structures". The 4th International Conference “ROBOTICS ’08” Braşov, ROMANIA, 13-14 November 2008
[4] Mărgăritescu, M., Moldovanu, Al., RoaŃ, C., Brişan, C. "Aspects Concerning Virtual Models for a Double Hexapodal Platform". The 20th DAAAM World Symposium, Vienna, 2009-11-25/28, Annals of DAAAM for 2009 & Proceedings of 20th DAAAM International Symposium
[5] Mărgăritescu, M., Ivan, A.M.E., Văduva, V. “Linear Motion Performed by a Double Hexapodal Robot”. 1ST International Conference on Innovations, Recent Trends and Challenges in Mechatronics, Mechanical Engineering and New High-Tech Products Development MECAHITECH’09, Bucharest, 8-9 October 2009
[6] Conti, J., Clinton, C., Zhang, G., Wavering, A. “Workspace Variation of a Hexapod Machine Tool”. http://citeseerx.ist.psu.edu

International Conference 2ND International Conference on Innovations, Recent Trends and Challenges
in Mechatronics, Mechanical Engineering and New High-Tech Products Development
MECAHITECH‘10
Bucharest, 23-24 September 2010
83
Automatic Headlight Position Control with Microcont roller
Rotar Dan
“Vasile Alecsandri” University, Calea Marasesti 157, cod: 600115, Bacau, Romania,
[email protected]; [email protected]
ABSTRACT The vehicle lighting system is of particular importance because it provides comfort and safety in road traffic. Correct positioning of the light spot depends on many factors such as, for example, road conditions and the condition of the vehicle. These factors change dynamically, and therefore, it is necessary for the light spot position adjustment to be made continuously, by appropriate methods.
There is research on headlight orientation related to the position of the steering wheel so as to ensure proper lighting when taking a corner. There are also many researches aimed at providing the automatic positioning of the lights depending on the car load and its position in relation to the road. In addition, while the car is moving, its position in relation to the road depends on the acceleration and on any irregularities of the road [1], [2], [3]. This paper presents a solution for the continuous adjustment of the headlights’ position so as to achieve a correct path of the light spot. The automatic control of the headlight position is made with a microcontroller using fuzzy sets.
In order to do this, the relative position of the car in relation to the road is determined using four position inductive sensors mounted on the suspension system of the vehicle wheels. A fuzzy controller created with a microcontroller unit to control servo drives, which establishes the correct position of the headlights, processes this information.
An impulse ordered servo drive determines the position of each headlight. This solution was adopted because the system must cope with sudden changes of input values. In order to establish the control signal, the fuzzy logic was used to simplify the calculation volume performed by the microcontroller, which lead to the possibility of using a mid range microcontroller [4], [5].
The solution was verified in the MATLAB programming environment and was adapted to a programmable chip system developed with the Cypress PSoC3 integrated circuit.
INTRODUCTION
In this paper a solution for correcting the position of car headlights is presenting so that, regardless of the positioning of the vehicle from in relation to the ground, the distance at which the spotlight touches the ground remains constant.
As shown in Figure 1, the point where the spot light touches the ground (road) is the „P". The distance between the vehicle and point „P” is marked with „d" („BP” segment) and this distance depend on several factors. Keeping the distance „d" constant ensures a proper illumination of the road, regardless of the vehicle position from the ground and avoids disturbing the other traffic participants through the random movement of the headlight.

International Conference 2ND International Conference on Innovations, Recent Trends and Challenges
in Mechatronics, Mechanical Engineering and New High-Tech Products Development
MECAHITECH‘10
Bucharest, 23-24 September 2010
84
Each of the four-wheel fenders of the vehicle is fitted with an inductive position transducer type LVDT - Linear Variable Differential Transformer. These position sensors indicate vehicle position from the ground (road). The distance at which the spot light of the vehicle’s headlights touch the ground (the value „d" in Figure 1) depends on the vehicle’s position from the ground. The position of the spotlight from a headlight (on the right or left side) depends primarily on the information provided by inductive transducers position damper on its part. The information provided by the inductive position transducers on the opposite side has little influence.
For example, the headlamp light spot position on the right side shock absorber position will be influenced by the right front and the right rear damper position. The dampers’ position from the left side mainly determines the turning of the right headlight in a perpendicular plane to the direction of movement (perpendicular to the PBA plan - Figure 1) and this does not influence the value of the distance „d”. Because of this, in Figure 1 there is a cinematic diagram corresponding to a beacon of the vehicle, the situation being the same for both devices.
The parameters shown in the Figure 1 have the following meanings: „hb" – the rear
damper/shock position, „hf” - the front damper position, „hmax” - the maximum value reached by the front or rear shock absorber position, „hmin” - the minimum value reached by the front or rear shock absorber position, „LVDTb” – the inductive transducer position rear damper, „LVDTf” - the inductive transducer position of the front shock absorber, „a" - the distance between the wheels on the same face, „d" – the distance at which the spot light touches the ground, „α” - the angle between the spot light and the vertical.
The inductive position transducer (LVDT) measures the relative position of the shock absorber cylinder. The value provided by transducer is used to determine values „hb” or „hf". The distance „d" spot light that touches the ground changes when the „hb" and „hf" values are modified, according to the Eq. (1):
−+⋅=
a
hhtghd bf
f arcsinα (1)
notations of Eq. (1) correspond to notations in Figure (1).
Figure 1: The cinematic scheme of principle of the considered mechanical structure
hf hb
a d
α LVDTb LVDTf
P
hmax
hmin
hmax
hmin
A
B

International Conference 2ND International Conference on Innovations, Recent Trends and Challenges
in Mechatronics, Mechanical Engineering and New High-Tech Products Development
MECAHITECH‘10
Bucharest, 23-24 September 2010
85
Two sizes „hb" and „hf" both change when the car is moving. Figure 2 shows the
dependence on the „hb" and „hf" values of the distance from the ground which spot touches the ground.
The characteristics family shown in the Figure 2 is plotted for different values of rear shock absorber position („hb” value) each curve having as a constant parameter different positions of the front shock absorber („hf” value). Also, in Figure 1 the line marked with the symbol „*" is represented for the situation where:
hb = hf = (max + min) / 2 (2) To illustrate the evolution of the point „P" for the varying parameters of „hf” and „hb”,
figure 3 shows a single variation curve for (Eq. 3): hf = min + (max – min) / 2 (3)
and figure 4 shows the surface of the points „P" at the variations of the „hf” and „hb” parameters.
The analysis of these figures and Eq. (1) conclude that spot light position can be adjusted by changing the „α” angle. The „α” angle is the angle made by the headlamp from the vertical axis. For example, if „hb” < „hf” then point „P" departs from the vehicle (value „d" increases) and restoring point „P" in the original position should decrease the „α” angle. Similarly, if „hb” > „hf” then the „α” angle must increase. The calculating relationship for the „α” angle between the
headlamp and vertical axis, to bring point „P" in the original position, is done using Eq. (4):
75 76 77 78 79 80 81 82 83 84 850
1000
2000
3000
4000
5000
6000
7000The light beam positions depending on the front and back shock
The back shock positions - hb (cm)
The
ligh
t be
am d
ista
nce
- d
(cm
)
Figure 2: The spot light positions family
hf = 85 cm
hf = 75 cm
Figure 3: The spot light position for hf/2
75 76 77 78 79 80 81 82 83 84 851000
1200
1400
1600
1800
2000
2200The curve for the median position of the front shock
The back shock positions - hb (cm)
The
ligh
t be
am d
ista
nce
- d
(cm
)
75
80
85
75
80
850
1000
2000
3000
4000
5000
6000
7000
The front shock position - hf (cm)
The surface of the light beam positions
The back shock position - hb (cm)
The
ligh
t be
am d
ista
nce
- d
(cm
)
Figure 4: 3-D representation of the light spot
position

International Conference 2ND International Conference on Innovations, Recent Trends and Challenges
in Mechatronics, Mechanical Engineering and New High-Tech Products Development
MECAHITECH‘10
Bucharest, 23-24 September 2010
86
−−=
a
hh bfa arcsinαα (4)
where: „α” - the angle to be reached, „αa” – the current angle, „hf” – the current position of the front of the vehicle from the ground, „hb” – the current position of the rear of the vehicle from the ground. The analysis made clear that it is possible to make a correction light beam emitted by the headlights, at the car's change in position from the ground. The correction is done by changing the angle from the vertical of the headlamp according to Eq. (4).
For this, positioning of the headlamp is done through an electromechanical system. This system consists of two parts: a mechanical and electromechanical component. The mechanical part of the headlamp permits the adjustment of the initial position or the subsequent adjustments to change the system parameters. The electromechanical part that does the positioning of the dynamic headlamp has as a key element a servo drive controlled by duration modulated impulses.
The servo drive is controlled by duration modulated impulses changes its position depending on the duration control pulse as shown in Figure 5.
The duration of the control pulse is 1.75 ms that leads to a frequency control signal of 571.43 Hz. The servo drive can rotate with 1800 when control pulse changes its pulse duration from 1.25 ms to 1.75 ms.
A gear reducer moves the headlight. A maximum rotation angle of 15° rotation of the headlamp is thus obtained. Since the duration modulated pulse through an 8 bits word, a resolution of 0.06o for the headlight rotation is obtained.
The command of servo drive is done via the PWM module (Pulse Width Modulation) microcontroller. This relieves the central unit of the effort of the generation of modulated pulse by assigning this task to the microcontroller hardware module.
The car headlight adjustment is done in an open loop based only on the information from the position transducers in vehicle’s shock absorbers. For this reason it is necessary to correct setup of the headlights’ position and a regular check of their position. The control algorithm is relatively simple and it is based on Eq. (2). The headlight’s control system must react quickly because the dynamic adjustment of the position lights in rough road conditions is desired.
To be able to use an 8-bit CPU with relatively poor performances, an adjustment method based on the principles of the fuzzy sets was adopted [6], [7].
As discussed above, a PSoC (Programmable System on Chip) type circuit provided by Cypress was adopted. This circuit’s
advantage is that it allows the configuration of analog and digital circuit modules in the
Figure 5: Servo drive command
1
0 1.25 1.5 1.75 ms 1.25 ms: 0o
1
0 1.25 1.5 1.75 ms 1.5 ms: 90o
1
0 1.25 1.5 1.75 ms 1.75 ms: 180o

International Conference 2ND International Conference on Innovations, Recent Trends and Challenges
in Mechatronics, Mechanical Engineering and New High-Tech Products Development
MECAHITECH‘10
Bucharest, 23-24 September 2010
87
program. The Cypress PSoC3 variant is also equipped with a type 8051 CPU and cutting edge development systems in C language. This way, the number of components is minimized, this resulting in increased performance and system reliability.
Hereinafter, the way in which the fuzzy controller was developed and how the PSoC circuit was configured to obtain the control circuit of the headlight adjustment system is going to be described.
THE FUZZY CONTROLLER
According to Eq. (4), difference „hf” - „hb” has to be used as a control input. But one control input does not provide the operating under fuzzy controller objectives [5].
Following tests and simulations done in MATLAB it was decided to use three control input:
- „hf” for the height above ground of the front of the vehicle;
- „hb” for the height above ground of the back of the vehicle;
- „hf” - „hb” for the difference of the two. For the control of the servo drive, Mamdani type fuzzy controller with
three inputs and one output is used. The structure of this controller is simulated in MATLAB:
name: 'headlight' type: 'mamdani' andMethod: 'min' orMethod: 'max' defuzzMethod: 'centroid' impMethod: 'min' aggMethod: 'max' input: [1x3 struct] output: [1x1 struct] rule: [1x13 struct]
The membership functions for the three
inputs are shown in Figure 6. The membership functions corresponding to the two „hb” and „hf” inputs are Gaussian and the membership functions of the third input „hf” - „hb” type is triangular. Gaussian functions were the preferred instead of the triangular for the first two input functions, as it provides a smaller error output. However, the choice of Gaussian functions results in a higher calculation effort of the Central Unit. For a higher computing
Figure 6: The membership function of input signals
Figure 7: The membership function of output

International Conference 2ND International Conference on Innovations, Recent Trends and Challenges
in Mechatronics, Mechanical Engineering and New High-Tech Products Development
MECAHITECH‘10
Bucharest, 23-24 September 2010
88
speed, triangular functions can be chosen instead of the other ones, at the price of an increase of the error rate. At the end of this chapter a comparison between the two solutions will be presented.
The membership function of the size of output is shown in Figure 7. The function provides one byte with the size of the duration-modulated impulse required for the control of the PWM module of the microcontroller. The direct duration of the PWM impulse is provided here for simplifying matters so as the supplied information to be clear.
Figure 8 presents the area of the output signal depending on the „hb” and „hf” control input.
This surface is generated from the three control input values („hb”, „hf” and „hf”
- „hb”) and thirteen rules of inference machine. The thirteen rules are the following: If (hb is down) and (hf is down) then (impulse is headlight__straight) If (hb is down) and (hf is hf=hb) then (impulse is headlight__down) If (hb is down) and (hf is up) then (impulse is headlight__down) If (hb is hb=hf) and (hf is down) then (impulse is headlight__up) If (hb is hb=hf) and (hf is hf=hb) then (impulse is headlight__straight) If (hb is hb=hf) and (hf is up) then (impulse is headlight__down) If (hb is up) and (hf is down) then (impulse is headlight__up) If (hb is up) and (hf is hf=hb) then (impulse is headlight__up) If (hb is up) and (hf is up) then (impulse is headlight__straight) If (hb is down) and (hf is down) and (hf-hb is bent__over) then (impulse is headlight__up) If (hb is down) and (hf is down) and (hf-hb is bent__back) then (impulse is headlight__down) If (hb is up) and (hf is up) and (hf-hb is bent__over) then (impulse is headlight__up) If (hb is up) and (hf is up) and (hf-hb is bent__back) then (impulse is headlight__down)
In establishing these rules it has been sought the limitation of the number of linguistic values in a rule in order to simplify the evaluation rules. The number of rules can be reduced if one accepts the existence of with a high error rate.
The way in which the fuzzy controller responds to the requirements can be established by applying at the „hb” input of the controller a sinusoidal signal such as the one in Figure 9. For the „hf” input there is a constant value equal to 85 cm. The response of the controller was processed and normalized so as to be compared with the normalized input as well. The result is presented in Figure 10. From this figure it is observed that the obtained response provides a good control of the headlamp position for both small amplitudes and large amplitudes.
Figure 8: The surface of the output value of the fuzzy controller

International Conference 2ND International Conference on Innovations, Recent Trends and Challenges
in Mechatronics, Mechanical Engineering and New High-Tech Products Development
MECAHITECH‘10
Bucharest, 23-24 September 2010
89
Figure 12: The surface of the output of fuzzy controller for the triangular
membership functions
The curves in Figure 10 were determined for Gaussian input functions, and the functions in Figure 11 for the triangular functions. The curves marked with „*" represents the input signal and the curve marked with symbol „o" represents the output signal. From these figures it follows that the use of Gaussian membership functions lead to good results across the range of variation of the input signal. Using triangular membership functions for the input functions limits the input signal range as shown in Figure 10. However, if certain adjustments are made on the discourse set, and rules used in the inference machine, the results can be improved. Figure 12 presents the surface of the output
area size when using triangular membership functions for the control input in comparison with Figure 8.
The conditioning of the input signals, their conversion and processing in order to obtain the control signal for servo drive is achieved by means of a PSoC3 Cypress integrated circuit type. This integrated circuit, configurable through the program contains a type 8051 CPU, analog modules and digital modules that easily enable complex systems. The central unit is programmed in C language and provides a complete set of libraries for moving point calculations. For the control system of automobile’s headlamps, the circuit was configured so as to use more hardware modules in order to increase response rate. The fuzzy controller was developed by programming the central unit 8051. How to make the open loop control circuit will be described hereinafter.
0 20 40 60 80 100 1200
0.1
0.2
0.3
0.4
0.5
0.6
0.7
0.8
0.9
1
0 20 40 60 80 100 1200
0.1
0.2
0.3
0.4
0.5
0.6
0.7
0.8
0.9
1
Figure 10: The result for the Gaussian input
functions Figure 11: The result for the triangular input
functions
0 20 40 60 80 100 12075
76
77
78
79
80
81
82
83
84
85
Figure 9: The test signal

International Conference 2ND International Conference on Innovations, Recent Trends and Challenges
in Mechatronics, Mechanical Engineering and New High-Tech Products Development
MECAHITECH‘10
Bucharest, 23-24 September 2010
90
COMMAND CIRCUIT The hardware structure of control circuit is shown in Figure 13. Integrated circuit pin connections are given in Table 1 [7], [8].
The integrated circuit (IC) connects to the analog input signals provided by the inductive position transducers at the front and rear shock absorbers „FrontPos" and „BackPos. The control signal for the servo drive controlled by duration-modulated pulses is obtained by numerical „Impulse". This servo drive will change the vertical angle of the vehicle headlamp according to the position of the vehicle from the ground.
The system is provided with a compatible RS232 serial connection to be connecting to a computer system or other current Microsystems with which the vehicle is equipped. This connection can be changed into a SPI (Serial Peripheral Interface) connection if necessary. The serial connection uses two-pins: „UART_Rx” for serial receiving and „UART_Tx” for serial emission.
The hardware structure generates three system interrupts: „isr_1”, „isr_2” and „isr_3” (Figure 13).
The „isr_1” interrupt is generated at the end of the DMA (Direct Memory Access) transfer by the „DMA_1" channel data acquired and converted by the „ADC_DelSig_1” analog-digital converter. A series of activities needed to run the system are completed in this
TABLE1 The conexions of CI Alias Name Pin
FrontPos Pin_1 P0(0) BackPos Pin_2 P0(1) Impulse Pin_3 P0(2)
UART_Rx Pin_4 P0(3) UART_Tx Pin_5 P0(4)
Figure 13: The hardware structure of the command system

International Conference 2ND International Conference on Innovations, Recent Trends and Challenges
in Mechatronics, Mechanical Engineering and New High-Tech Products Development
MECAHITECH‘10
Bucharest, 23-24 September 2010
91
interrupt. The data converted by the analog-digital converter is taken from memory and applied to the digital filter „Filter_1”.
In order to reach the next analogue input signal that is converted into a numeric value through the „ADC_DelSig_1” digital analogue converter, the „Amux_1” analogue multiplexer command is initiated. Lastly, the beginning of the analogue-digital conversion of a new analogue value provided by the „Amux_1” analogue multiplexer is initiated. This interrupt has the highest priority in the system.
The „isr_2” interrupt is generated at the end of the DMA transfer by the „DMA_2" channel data filtered by the „Filter_1” digital low-pass filter. In this interrupt, the data is retrieved from memory and applied at the software developed fuzzy controller input.
The „isr_3” interrupt is generated upon the serial reception of a byte on the UART (Universal Asynchronous Receiver Transmitter) interface from another digital system connected to the headlight position control system. In this interrupt the received byte is decoded and according to its significance a certain action is performed by the computer system. This interrupt has the lowest priority in the system.
The Cypress circuit configured hardware structure consists PSoC3 of an analog and a digital component.
The analog component is meant for the acquisition of the inductive position transducers signal mounted on the vehicle’s shock absorbers. There are two analog inputs for each side of the vehicle: the „Pin_1” entry for the „hf” signal and „Pin_2” entry for the „hb" signal. Each of these signals is applied to a programmable gain amplifier PGA, which amplifies the signal and makes the adaptation of the impedance with the measurement circuit. The amplifier „PGA_2” and „PGA_1” output signals are processed by the operational amplifier „Opamp_1" and at its output signal the „hf” – „hb” difference is obtained. This way, at the „Amux_1" analog multiplexer entry the three signals necessary to the fuzzy controller are applied: the amplitude of the damper position, the amplitude of the damper rear position and the difference between the two signals. The command of the „AMux_1" analog multiplexer is made by the program interrupt „isr_1”.
The analog signals are converted by the „ADC_DelSig_1" analog-digital converter into digital signals that are stored in the RAM (Random Access Memory) through the „DMA_1 channel. The numerical data from the RAM are transferred to the low-pass filter „Filter_1" in the „isr_1” interrupt. The filtered data is stored in RAM via the DMA transfer, which uses the „DMA_2” channel. At the end of the DMA transfer, the data is taken from RAM in the „isr_2" interrupt, and applied to the fuzzy controller developed in the program. The digital filter „Filter_1" is the FIR (Finite Impulse Response) type and is configured as a low-pass filter set. This filter was introduced to eliminate stray signals and electrical disturbances transmitted through the mechanical and electrical system. Generally, very rapid changes in the input signal cannot be considered with regard to the inertia of the system. The amplitude characteristic of the digital filter used is shown in Figure 14. The data is applied at the entry of the filter in the „isr_2" interrupt and the filtered data is stored in the RAM by the DMA transfer. This data transfer type is transparent to the main program of the microcontroller and provides a high execution speed.
The value of output signal of the fuzzy controller has the size of 8 bits. This size controls hardware module PWM (Pulse Width Modulation) so as to generate a signal with duty cycle between 70% and 100% for the control servo drive.
In the structure of the integrated circuit the „UART_1” module for the serial communication was also configured. It is used for adjustments of the fuzzy controller, for

International Conference 2ND International Conference on Innovations, Recent Trends and Challenges
in Mechatronics, Mechanical Engineering and New High-Tech Products Development
MECAHITECH‘10
Bucharest, 23-24 September 2010
92
Figure 14. The amplitude characteristic of the filter
modifying or obtaining baseline diagnostic data by connecting to another computer system.
In addition to the hardware structure already presented, the system is programmed to carry out the fuzzy controller. The Cypress PSoC3 circuit has an 8051 CPU type operating at 67MHz clock frequency, and the instruction set includes instructions for multiplication and division, 64KB Flash memory, 8KB of memory SRAM (Static RAM).
These features allow efficient programming of a cutting fuzzy controller. The program structure with which the fuzzy controller was achieved is presented below. PROGRAMMING FUZZY CONTROLLER
The fuzzy controller whose structure was described above represents the main component of the program made for the Cypress PSoC3. The controller operates in an open loop and therefore special attention must be given to the initial values and to the established rules. A series of experiments that allow detailed adjustment of the fuzzy controller were necessary. There is also a number of improvements possible that would improve the system performance. The values that belong to the real world will be referred to from now on as crisp values, and the ones that belong to fuzzy logic as linguistic values.
The fuzzy controller has three main components: - the converting of the crisp input values into fuzzy values (described linguistic values) -
fuzzification; - the inference rule base with which the converting of input linguistic values and of
linguistic of output values is made; - the conversion of output linguistic values into crisp output values - defuzzification.
The fuzzification is achieved based on the membership functions defined for the input and output values. Defuzzification is performed through the centroid method that is based on the method of the area center. The evaluation of the rules requires the logical functions "and" and "or" which use the "MIN” method of the minimum value and the "MAX" method, of the maximum value. Figure 14 plotted the method of evaluation of the rules.

International Conference 2ND International Conference on Innovations, Recent Trends and Challenges
in Mechatronics, Mechanical Engineering and New High-Tech Products Development
MECAHITECH‘10
Bucharest, 23-24 September 2010
93
Figure 15 is the thirteen rules defined for fuzzy controller. Each rule is evaluated and produces a specific output value for size (right column). Last column represent the output size (column "Impulse") is the area that is calculated resulting crisp output size (centroid method).
The software using the tables to generate Gaussian functions and the surface calculations does this process.
The program for the determining of the fuzzy controller is composed of several subroutines:
- the subroutine for crisp values normalization: this subroutine must do the normalization of input variables „hf”, „hb”, „hf-hb” determined at a certain point;
- the subroutine for determining the degree of membership of the normalized variables based on the membership function (fuzzification): determining the degree of membership is done differently for the Gaussian membership function as to the triangular ones. For the Gaussian ones, the search on the basis of the normalized input value of the membership degree in a table is used. Three different tables for the three defined membership functions (identical for the input hf and hb functions) were preferred instead of a single table with generalized values. This was done to increase the execution speed of the program. The calculation of the linguistic value is done directly for the membership functions. The subroutine for the evaluation of the rules based on the minimum and maximum methods: the rules set for the fuzzy controller are as follows: "IF x is A then y is B”. The antecedent "x is A" can contain logic operations such as "AND" and "OR" which are assessed in the program by the minimum and maximum methods. Based on the numerical value of the antecedent,
Figure 15: The evaluation principle of fuzzy controller’s rules

International Conference 2ND International Conference on Innovations, Recent Trends and Challenges
in Mechatronics, Mechanical Engineering and New High-Tech Products Development
MECAHITECH‘10
Bucharest, 23-24 September 2010
94
through the "involvement" operation, the consistent "Y is B" is obtained, which is a fuzzy set. The results obtained for each rule are aggregated. Aggregation is the process through which fuzzy sets representing the outputs of each rule are combined into a single fuzzy set;
- the subroutine for the defuzzification of the output value through the centroid method: for the aggregate fuzzy set of the output size obtained in the previous step, the center of its surface is calculated using this relationship (Eq 5):
where: x is the defuzzified output value, µi(x) is the aggregate membership function, and x is the output value.
The number obtained above determines the value of a byte for the PWN module command. Activities carried out interrupt were not described here because they have been explained above
Figure 16 is a logic schematic of the program.
CONCLUSIONS
This paper presents a solution for the positioning of the spotlight of the vehicle’s headlights when faced with a variable load or on uneven road. Inductive position transducers mounted on the shock absorbers of the vehicle are used in order to determine its position from the ground. The controller used is an open loop fuzzy controller. The driving system is implemented on a programmable integrated circuit chip that leads to the lowering of the cost, and an increase of the system’s reliability.
( )( )∫
∫=dxx
dxxxx
i
i
µµ
* (5)
Normalization of the input variables: h f, hb, hf-hb
Selection of the
Degree of membership function h f, hb
Degree of membership function h f-hb
Evaluation of the rule
i = number of the rules
Storage of the output set shape
i = I - 1
i = 0 ?
Aggregation Defuzzification
Conversion
Impulse width
START
Gaussian membership function
Triangular membership function
STOP
Figura 16: Logic diagram of main program

International Conference 2ND International Conference on Innovations, Recent Trends and Challenges
in Mechatronics, Mechanical Engineering and New High-Tech Products Development
MECAHITECH‘10
Bucharest, 23-24 September 2010
95
The main advantages of the presented system are: high reliability through the reduced number of components, control of the light spot position under the vehicle’s lights change task and in rough road conditions, the increase in traffic safety, easy to use, the possibility of connecting to the electronic system of the vehicle.
The main drawbacks of the system presented are: the control system is made based on information of the damper position, the correction position lights is not done on an inclined road or on a slope, the performances depend, essentially, on the initial values established for the system and the need for periodic adjustments.
The experiments held indicate the fact that the system responds well to fast changes of the input values. There are no swings of the output value even in the case of high disturbances of the environment. The system can be fitted with a software mechanism for disabling the controller and switching to manual mode. REFERENCES [1] Boojoong Yong, Heeyong Kang, Sungmo Yang, „Auto-Leveling of HID Headlamp Using
Preview Control”, KSME International Journal, Vol. 16 No. 11, pp. 1404~ 1411, 2002
[2] Michael Sivak, Brandon Schoettle, Michael J. Flannagan, Takako Minoda, „Optimal strategies for adaptive curve lighting”, Journal of Safety Research 36 (2005) 281 – 288
[3] Aleksanteri Ekrias, Marjukka Eloholma, Liisa Halonen, Xian-Jie Song, Xin Zhang, Yan Wen, „Road lighting and headlights: Luminance measurements and automobile lighting simulations”, Building and Environment 43 (2008) 530–536
[4] Mihai Marin-Perianu , Paul Havinga, “D-FLER: a distributed fuzzy logic engine for rule-based wireless sensor networks”, Proceedings of the 4th international conference on Ubiquitous computing systems, November 25-28, 2007, Tokyo, Japan
[5] Mahdi Hamzeh , Hamid Reza Mahdiani , Ahmad Saghafi , Sied Mehdi Fakhraie, Caro Lucas, “Computationally efficient active rule detection method: Algorithm and architecture, Fuzzy Sets and Systems”, v.160 n.4, p.554-568, February, 2009
[6] Pierre Guillemin, “Fuzzy Logic Applied to Motor Control”, IEEE TRANSACTIONS ON INDUSTRY APPLICATIONS, VOL. 32, NO. 1, JANUARY/FEBRUARY 1996
[7] Alessandra Costa, Alessandro De Gloria, Fabrizio Giudici, Mauro Olivieri, “Fuzzy Logic Microcontroller”, IEEE Computer Society Press Los Alamitos, CA, USA, Volume 17 , Issue 1 (January 1997)
[8] Hamed Peyravi , Abdollah Khoei , Khayrollah Hadidi, “Design of an analog CMOS fuzzy logic controller chip, Fuzzy Sets and Systems”, v.132 n.2, p.245-260, December 2002
[9] S. Royo, M.J. Arranz, J. Arasa, M. Cattoen, T. Bosch, „New cost-effective sensor for the characterization of automotive headlamps by measurements in the near field”, Sensors and Actuators A 132 (2006) 56–62

International Conference 2ND International Conference on Innovations, Recent Trends and Challenges
in Mechatronics, Mechanical Engineering and New High-Tech Products Development
MECAHITECH‘10
Bucharest, 23-24 September 2010
96
Micro Systems For Controlled Delivery Of Drugs Solu tions In
Ophthalmic Treatments
Stanca Comşa, Adrian Pacioga, Doina Gheorghiu National Institute of Research & Development for Mechatronics and Measurement Technique,
6-8 Str. Pantelimon, Bucharest, Romania, [email protected]
ABSTRACT
New treatment and therapy techniques requires administration of aqueous solutions in volumes becoming smaller, sometimes reach even micro litre volumes. Many times these treatments are ambulatory without the possibility to be supervised by medical staff and that is why it was necessary the miniaturization of dosing and monitoring systems for the solutions delivery to the patient. This computerized monitoring reduces patient risks, leading to less medical accidents number. Using precision actuators to drive micro pumps lead to effective control of delivered volume and the decrease of treatment errors.
The object of present paper is to achieve an equipment enable to a precise dosing and administration of regular medication for the treatment in chronic diseases.
INTRODUCTION
To not needed long periods of treatment in hospital for patients, made with high costs of hospitalization, or daily trips to hospital for several times, is needed portables pumps that can provide the desired treatment schedule, with 24 hours daily operating, regular refuelling and independence of six months. There are many diseases that require long time treatment and monitoring. These diseases include glaucoma, which is the third disease which generates irreversible blindness. Disease is due the prolonged exposure to high intraocular pressure which produces damage to retinal nerve fibre and changes the characteristic at the papilla of optic nerve.
By analyzing the constructive solutions for controlled micro dosage and the possibility to use one available solution from the multiple drive systems, command and control of provided flow range and time between two successive treatments, is adopted a form of micro pump which can be attached to the drug solution bottle screw, like the bottle cap.
THE PROPOSED SOLUTION FOR ACHIEVING FUNCTIONAL MODE L
Analyzing the proposed solutions and the possibilities for system realization with available resources, it was adopted the variant with kinematics scheme shown in Figure 1.

International Conference 2ND International Conference on Innovations, Recent Trends and Challenges
in Mechatronics, Mechanical Engineering and New High-Tech Products Development
MECAHITECH‘10
Bucharest, 23-24 September 2010
97
Fig. 1 Kinematic scheme of micro pump
The system is based on achieving the function of dosage by suction-discharge
process of the ophthalmic solution with cylinder-piston unit (2) (Fig. 1) powered by a linear micro-motor, obtaining a volumetric dosing based on displacement (± x) of the driving piston.
To ensure the direction of fluid flow is use oneway direction micro plate valves (3) and (4), which requires no action, the close and open of them is based on pressure / depression created by the piston movement (2) driven by micro-motor.
To prevent a depression inside the drug bottle as solution consumption from reservoir (1), the system was provided with micro valve (6), which allows air absorption from atmosphere.
Before first use, the physician must eliminate air from delivery route using for this purpose maximum displacement of the piston and repeated purging until first drops occur.
After system priming the doctor must set the amount prescribed volume in (µl), moment at which the piston moves to the corresponding set position at which is absorbed the required amount of solution.
At the programmed time from treatment schedule, the system warning the patient with a beep sounds and this must act a command button, which activate the motion the micro linear drive and pushes the plunger which discharge the set dose by plate valve throw the dropper head.
To ensure the effectiveness of treatment and avoid situations where, for various reasons, drops has not reached the patient eye, delivery system should be allowed an additional dose and the event is stored in system memory, so that the doctor can monitories also additional doses.
At the system design were considered the following requirements: - Electric power supply for minimum one month autonomy; - Achieving a precise dosage ordered automatically by pressing a single start button; - Automated data storage of prescribed treatment times; - Reading and displaying stored data on computer monitor using dedicated software; - Reduced weight and size (diameter: max. 40 mm, length max. 120 mm Weight:
Max. 120 gr.).

International Conference 2ND International Conference on Innovations, Recent Trends and Challenges
in Mechatronics, Mechanical Engineering and New High-Tech Products Development
MECAHITECH‘10
Bucharest, 23-24 September 2010
98
SYSTEM DESCRIPTION
The achieved Mini equipment allows implementation of a dosing distribution schedule which permitted administration of drugs solution at prescribes time of treatment during day.
The controlled dosing mini equipment, allows a wide use like portable ambulatory mini equipment variant and as monitoring mini equipment for research and implementation of a new treatment in medical departments.
Fig. 2 Constructive solution for functional model
Constructive solution of the functional model (Fig. 2) consists of the following
mechanical components: 1. Linear micro driver; 2. Micro valve overrunning; 3. Micro syringe for insulin administration with 1 ml volume; 4. Connections with 2 mm section diameter; 5. PVC hose with 1.5 mm section diameter and 0.75 mm wall thickness; 6. Aqueous solution tank.
COMPONENTS DESCRIPTION Micro motor The used Micro motor is a PQ-12 actuator, produced by FIRGELLI TECHNOLOGIES
firm, and is a linear motor with multiple opportunities for command and control the piston position and displacement, based on information received from a precision incorporated

International Conference 2ND International Conference on Innovations, Recent Trends and Challenges
in Mechatronics, Mechanical Engineering and New High-Tech Products Development
MECAHITECH‘10
Bucharest, 23-24 September 2010
99
linear potentiometer. The Changing of movement direction of the rod is made by reversing the polarity of voltage supply.
Actuator has the following advantages: - Relatively small size; - Precise positioning of the rod; - Voltage / low control power; - Equal pushing and pulling forces; - Easy installation.
Technical characteristics: - Displacement range: 90 mm; - Maximum Force: 15 N at 7mm/sec speed; - Maximum speed (no load): 12 mm / sec.; - Maximum current: 250mA; - Voltage: 5V DC; - Operation with closed-loop linear potentiometer; - Potentiometer resistance: 2kΩ; - Weight: 19 gr.; - working Temperature: -10°C, +50°C; - Life time: 100,000 cycles. Micro valve To control the flow direction of fluid the micro pump was provided with one way plate
micro valve. They are constructed of three layers made of two different plastics. Closing element consists of an elastic membrane whose shape ensures quick opening and closing the fluid circuit, even at very small pressure/vacuum.
Micro valve technical characteristics: - Two-way passive valve (actuator does not require); - Valve position: normally closed; - Dimensions: φ2.1 x 0.45mm; - Weight: 2 mgr.; - Response time: very short; - Internal volume: ~ 2 µl; - Maximum working pressure: 10 bar; - Materials in contact with fluid: polyamide (PI) and nitril-butadiene rubber (NBR); - Working temperature: max. 100 °C
Fig. 3 Micro valve elements

International Conference 2ND International Conference on Innovations, Recent Trends and Challenges
in Mechatronics, Mechanical Engineering and New High-Tech Products Development
MECAHITECH‘10
Bucharest, 23-24 September 2010
100
The flow depends of working pressure and increases linearly with increasing pressure and has no danger of reverse flow, very important characteristic, as these flows would introduce errors in delivered solution flow.
Mechanical components of the system Other system components are mechanical parts special design in new conception,
from sterilized plastic materials. The assembly is made by gluing the components, thus insure the necessary seals of route flow solution. The design system has taken into account the minimizing dosing circuit and volumes of delivery solution as priming to be done in a short time and the loss of fluid to be minimal.
At materials choosing was take in account that they must correspond to the international and national standards applicable requirements for medical devices and to be easily processed and to not enter into chemical reaction with the delivered solution.
To avoid any situations that the dropper does not release the solution, because of fluid surface tension, it was designed so that the contact surfaces with the solution drop to be as small as possible (fig.4).
Fig. 4 Dropper Fig. 5 Assemble with the bottle
In order to mount the system on bottles with commercially available ophthalmic
solutions, the thread of the lower lid meets the pitch, shape, number of beginnings and diameter of these (fig.5).
For the functional model, housing was designed with two symmetrical assembled pieces using M2 screw (fig.6). Thus ensure the possibility of quickly mounting or dismounting during experimentation of the proper functioning of the dosing system and to remedy defects.
The system housing The closure of housing
Fig. 6 Solution of system housing After experimentation of the pump function, housing will be made from one piece and
will be glue assembled.

International Conference 2ND International Conference on Innovations, Recent Trends and Challenges
in Mechatronics, Mechanical Engineering and New High-Tech Products Development
MECAHITECH‘10
Bucharest, 23-24 September 2010
101
Characteristics of the achieved system are: - Minimum 30 days period of independent operation; - The range of the delivered solution amount at one pump action: 5-100µl - the programming Step of the amount of delivered solution: 5µl - Possibility of programming time between 2 Ophthalmic Solution delivered: from 1
to 12 hours with 1 hour step time; - Audible warning system and / or vibrating to worn the time for solution delivery; - Audible warning system of ophthalmic solution delivery; - Possibility of memorizing several operating programs; - Possibility of selecting one of the delivery programs; - Possibility to lock the programs management selector; - Possibility of recording date, time and number of pump actuating for at least 30
days;
CONCLUSIONS
Making micro dosing control and monitoring the treatment with ophthalmic solutions make possible the implementation of new or improve treatment for chronic diseases which is a priority for modern medicine in order to diminish risk and increase patient quality of life.
Micro pumps with dose control for ophthalmic solutions delivery, and controllable treatment is nonexistent and their implementation is a pioneer.
Significant effects for using these systems are: - The possibility of large-scale application in medical clinics, - Developing new knowledge in the field - Low cost, for production and for hospitalization, - A research instrument in the field of chronic disease. Since the conception stage of the experimental system model was design for possible
implementation for a wide range of treatments, allowing expansion of its use in an appreciable number of applications.
Based on this equipment can develop a method for statistical analysis of treatment outcomes.
REFERENCES
[1] Cabuz, W. R. Herb, E. I. Cabuz, and S. T. Lu, “The dual diaphragm pump,” in Proc. IEEE
14th Int. Conf. Micro Electro Mechanical Systems;
[2] G. E. Sancoff and M. McWilliams, “Programmable infusion system,”U.S. Patent 5 078 683, Jan. 7, 1992.
[3] G. Herskowitz, “Portable infusion pump,” U.S. Patent 5 554 123, Sept. 10, 1996.
[4] H.A. Stone, A.D. Strook and A. Ajdari, Annual Review of Fluid Mechanics, 2004, pp.36.
[5] M. Wackerle, M. Richter, A. Drost, U. Schaber, Dr. H.-J. Bigus, A bidirectional micro pump for the handling of liquids and gases, Actuator 2004, pp. 216-219
[6] N.-T. Nguyen and X. Huang, “Miniature valveless pumps based on printed circuit board technique,” Sens. Actuators A., vol. 88, pp. 104–111, 2001.

International Conference 2ND International Conference on Innovations, Recent Trends and Challenges
in Mechatronics, Mechanical Engineering and New High-Tech Products Development
MECAHITECH‘10
Bucharest, 23-24 September 2010
102
Transfer Factor, Mechanical Active and Reactive Pow er of
Vibrations using Burgers Parametric Model in Active Isolation of Structures
Cornel Marin
VALAHIA University of Targoviste UNIRII Street 18-20, TARGOVISTE 130024 ROMANIA
Email: [email protected]
ABSTRACT
Dynamic models used in shocks, vibration and seism calculus are based on rheological configuration which are specifically used in isolation system. The BURGERS parametrical model presented in this paper is used for the behavior characterization of some of these special isolation materials. This is a parametrical model regarding the stiffness values of two HOOKE elements (parameter N) and the damping level of two NEWTON elements (parameter M). The present paper gives some numerical results of the simulation of different values of damping and parameters N and M in order to determination of transfer factor, mechanical active and reactive power of vibration using BURGERS isolation model.
INTRODUCTION
In respect to isolation of vibration for mechanical structures with weight m under the action of harmonic perturbation force using the BURGERS isolation element, the mathematical model consists in two serial models: first model VOIGT KELVIN with stiffness k and damping coefficient c and second the MAXWELL element with stiffness Nk and damping coefficient Mc [1], [2], [3].
The calculus transfer factor T belong relative pulsation η will be presented following for different values of parameters ζ, N, and M.
Fig.1. The BURGERS viscous elastic parametrical model
The force transmitted to foundation in the case of with BURGERS isolation element according to figure 1 is the same for all three serial bound elements:
x
Fp = F0 cos ωt
m
u
k
c
Mc Nk
v

International Conference 2ND International Conference on Innovations, Recent Trends and Challenges
in Mechatronics, Mechanical Engineering and New High-Tech Products Development
MECAHITECH‘10
Bucharest, 23-24 September 2010
103
−=−⋅−⋅=⋅+⋅=
)vx(Mc)uv(Nk
)uv(NkucukQ
&&
& (1)
where u is the displacement of the end element VOIGT KELVIN and v is the displacement of the end element HOOKE , as we see in figure 1.
The following differential equations of moves for the body m and differential equations for transmitted forces are written as follows:
=−−−⋅=−⋅−⋅+⋅
=−⋅+
0)vx(Mc)uv(Nk
0)uv(Nkucuk
tcosF)vx(Mcxm 0
&&
&
&&&& ω (2)
The complex expressions of real variables u, v, x are introduced in order to solve the
equations (2) in a complex mode:
⋅+=⋅+=
⋅+=
qivt~;siuw~;yixz~
(3)
The particular complex solutions of the equations (2) are written as follows:
⋅=
⋅=
⋅=
−⋅
−⋅
−⋅
)t(i0
)t(i0
)t(i0
et~t~;ew~w~;ez~z~
γω
θω
ϕω
(4)
Substituting the derivative functions of the particular complex solutions in the equations
(2) we obtain:
=⋅⋅⋅⋅+⋅⋅⋅⋅−⋅⋅−⋅⋅
=⋅⋅+⋅⋅−⋅⋅⋅⋅+⋅⋅
⋅=⋅⋅⋅⋅−⋅⋅⋅⋅+⋅⋅⋅−
−⋅−⋅−⋅−⋅
−⋅−⋅−⋅−⋅
⋅−⋅−⋅−⋅
0et~iMcez~iMcew~Nket~Nk
0ew~Nket~Nkew~ciew~k
eFet~iMcez~iMcez~m
)t(i0
)t(i0
)t(i0
)t(i0
)t(i0
)t(i0
)t(i0
)t(i0
ti0
)t(i0
)t(i0
)t(i0
2
γωϕωθωγω
θωγωθωθω
ωγωϕωϕω
ωω
ω
ωωω
(5)
By solving the system (5) the amplitudes of the particular complex solutions result:
( )
( )
( )
⋅
⋅⋅++⋅⋅⋅⋅+⋅⋅+⋅⋅⋅+⋅−
++⋅⋅⋅+⋅⋅−⋅=
⋅
⋅⋅++⋅⋅⋅⋅+⋅⋅+⋅⋅⋅+⋅−
+⋅⋅⋅+⋅⋅−⋅=
⋅
⋅⋅++⋅⋅⋅⋅+⋅⋅+⋅⋅⋅+⋅−
⋅⋅⋅⋅=
ϕ
γ
θ
ωωωωω
ωω
ωωωωω
ωω
ωωωωω
ω
i
22
22
00
i
22
22
00
i
2200
e
kN
ci
N
11Mmci)cik(Mcim
N
MM1cic
Nk
Mk
Fz~
e
kN
ci
N
11Mmci)cik(Mcim
N
11Mcic
Nk
M
Ft~
e
kN
ci
N
11Mmci)cik(Mcim
MciFw~
(6)

International Conference 2ND International Conference on Innovations, Recent Trends and Challenges
in Mechatronics, Mechanical Engineering and New High-Tech Products Development
MECAHITECH‘10
Bucharest, 23-24 September 2010
104
The particular complex solutions (4) become:
( )
( )
( )
⋅
⋅⋅++⋅⋅⋅⋅+⋅⋅+⋅⋅⋅+⋅−
++⋅⋅⋅+⋅⋅−⋅=
⋅
⋅⋅++⋅⋅⋅⋅+⋅⋅+⋅⋅⋅+⋅−
+⋅⋅⋅+⋅⋅−⋅=
⋅
⋅⋅++⋅⋅⋅⋅+⋅⋅+⋅⋅⋅+⋅−
⋅⋅⋅⋅=
⋅
⋅
⋅
ti
22
22
0
ti
22
22
0
ti
220
e
kN
ci
N
11Mmci)cik(Mcim
N
MM1cic
Nk
Mk
Fz~
e
kN
ci
N
11Mmci)cik(Mcim
N
11Mcic
Nk
M
Ft~
e
kN
ci
N
11Mmci)cik(Mcim
MciFw~
ω
ω
ω
ωωωωω
ωω
ωωωωω
ωω
ωωωωω
ω
(7)
The expression of force transmitted to the foundation in the complex mode is:
( )( )
ti
220 e
kN
ci
N
11Mmci)cik(Mcim
MckicFQ
~
)w~t~(NkQ~
ω
ωωωωω
ωω ⋅⋅
⋅⋅++⋅⋅⋅⋅+⋅⋅+⋅⋅⋅+⋅−
⋅⋅⋅⋅+⋅−⋅=
−⋅=
(8)
By noting:
cr
2
c
c
p
n;
p;
m2
cn;
m
kp ===== ζωη , (9)
the expression (8) becomes: ( ) ti
222220 e
N
MM1Mi2
N
M4M41
2iM2FQ
~ ω
ηζηηζζη
ηζηζ ⋅⋅
++−⋅⋅⋅+
+⋅−−
⋅⋅−⋅⋅⋅= (10)
The transfer factor T is defined as ratio between the amplitude of real force transmitted to foundation and the amplitude of perturbation force:
222
22222
22
0
0
N
MM1M4
N
M4M41
41M2
F
QT
++−⋅⋅+
−⋅+
+⋅⋅==
ηζηζζη
ζηζ (11)
PARTICULAR CASES OF TRANSFER FACTOR
The transfer factor T (11) relation can be particularized in order to obtain the following particular cases [3], [4]: For N→∞ we obtained VOIGT KELVIN - NEWTON particular case:
( ) ( )222222
22
)M1(M4M41
41M2T
+−+⋅+
+⋅=
ηζζη
ζηζ (12)
For M→∞ we obtained VOIGT KELVIN- HOOKE particular case:
( ) ( )222222
22
N4)N1(N
41NT
ηζηη
ζη
−++−
+⋅= (13)

International Conference 2ND International Conference on Innovations, Recent Trends and Challenges
in Mechatronics, Mechanical Engineering and New High-Tech Products Development
MECAHITECH‘10
Bucharest, 23-24 September 2010
105
For N→∞ and M→∞ we obtained VOIGT KELVIN particular case:
( ) ;41
41T
2222
22
ηζη
ηζ
+−
+= (14)
MECHANICAL ACTIVE AND REACTIVE POWER OF VIBATION US ING BURGERS ISOLATION ELEMENT
Mechanical active and reactive power of vibation using burgers isolation element will be determinate with impedance formulas. Scheme oh impedance for BURGERS model is presented in figure 2.
Fig. 2. Scheme oh impedance for BURGERS model
The impedance for BURGERS model can be calculated as following:
( ) ( )( )222
222222
C
mC
NkC
McC
cC
kC
C
McNki)MNNM(ck
)MNNM(ckmMNckicMNkmkMNcZ~
mi
Nk
i
Mc
1
kic
1Z~
Z~1
Z~
1
Z~
Z~
11
Z~
ωωωωωω
ωωω
ω
−⋅−+++++−⋅+−+=
⋅+++
⋅−
=+++
+
=
(15)
Complex instantaneous mechanical power of vibration will be written:
( )( ) ( )
ti220222222
222
inst
ti220
Cinst
eF)MNNM(ckmMNckicMNkmkMNc
McNki)MNNM(ckN~
eFZ~1
F~
z~N~
ω
ω
ωωωωωω ⋅
+++−⋅+−+−⋅−++=
⋅⋅=⋅= ⋅&
(16)
Using expression (9): m
kp;
c
c
p
n;
p;
k
FA
cr
===ζω=η= 00 ,
the complex instantaneous mechanical power of vibration will be:
( )MNNMQ:where
eAFpNMQi2N)N(M4
)NM4(iQ2N~ ti2
00222
22
inst
++=
⋅⋅⋅⋅⋅−⋅++−
−+⋅⋅= ω
ηζηηηζηζηζ
(17)
Instantaneous reactive and active mechanical power of vibration can be defined as
negative half of imaginary part respectivly half of real part of complex instantaneous mechanical power:
kCZ
~
cCZ
~
mCZ
~
tieFF~ ω= 0 Mc
CZ~
z~&

International Conference 2ND International Conference on Innovations, Recent Trends and Challenges
in Mechatronics, Mechanical Engineering and New High-Tech Products Development
MECAHITECH‘10
Bucharest, 23-24 September 2010
106
( ) ( ) ( )( ) ( )
( ) ( ) ( )( ) ( )
⋅⋅−++−
−+−+−=−=
⋅⋅−++−
−−−+−−==
000222222
22222
instreact
000222222
2222
instact
pAFMNQ4N)N(M4
)NM4(N)N(M4MNQQ4
2
1N~
Im2
1N
pAFMNQ4N)N(M4
MNQ)NM4(2N)N(M4Q2
2
1N~
Re2
1N
ηζηηηζ
ηζηηηζηηζηζηηηζ
ηηζζηηηζζη
(18)
Relations (18) can be written also:
( )( )
( )
( )( )
( )
1N
1
M
1Q:where
pAF
1Q4M
)N
1(4
M
1
N
4
M)
N1(41QQ4
2
1N~
Im2
1N
pAF
1Q4M
)N
1(4
1QM
1
N
42
M)
N1(4Q2
2
1N~
Re2
1N
1
0002
122
222
222
12
12
instreact
0002
122
222
12
222
1
instact
++=
⋅⋅
−+
+−
−
+−+−
−=−=
⋅⋅
−+
+−
−
−−
+−
==
ηζηηηζ
ηζηηηζηηζ
ηζηηηζ
ηηζζηηηζζη
(19)
PARTICULAR CASES OF MECHANICAL ACTIVE AND REACTIVE POWER
Instantaneous reactive and active mechanical power of vibration (11) relation can be particularized in order to obtain the following particular cases [3],[4]: For N→∞ we obtained VOIGT KELVIN - NEWTON particular case:
⋅⋅
−
++
+
+−
−
+
+−=
⋅⋅
−
++
+
−
++
+
+=
000222
22
222
react
000222
22
22
act
pAF
11M
14
M4
M4
M
111
M
11
M
14
2
1N
pAF
11M
14
M4
11M
1
M
2
M41
M
12
2
1N
ηζηηζ
ηηζηηζ
ηζηηζ
ηζηηζζη
(20)
For M→∞ we obtained VOIGT KELVIN- HOOKE particular case:
⋅⋅
−
++
−
−+
−
+
+−=
⋅⋅
−
++
−
−
+
−
−
+=
000222
222
22222
react
000222
222
222
2
act
pAF
1N
114)
N1(4
N
4)
N1(41
N
11
N
114
2
1N
pAF
1N
114)
N1(4
1N
11
N
42)
N1(4
N
112
2
1N
ηζηηζ
ηζηηζηηζ
ηζηηζ
ηηζζηηζζη
(21)

International Conference 2ND International Conference on Innovations, Recent Trends and Challenges
in Mechatronics, Mechanical Engineering and New High-Tech Products Development
MECAHITECH‘10
Bucharest, 23-24 September 2010
107
For N→∞ and M→∞ we obtained VOIGT KELVIN particular case:
( )( )
( )
⋅⋅+−
=
⋅⋅+−
−⋅=
0002222
2
act
0002222
2
react
pAF41
N
pAF41
1
2
1N
ζηη
ζηζηη
ηη
(22)
THE SIMULATION OF TRANSFER FACTOR T
The simulation of transfer factor T with pulsation for different values of the damping factor. Figure 3 show the transfer factor ( )ηT for the following damping factors: ζ1=0,1;
ζ2=0,3; ζ3=0,7; ζ4=0,9 and for the following parameters values: N=10 , M=5.
0 0.5 1 1.5 2 2.50
0.5
1
1.5
2
2M ζ1 1 4 ζ12⋅ x
2⋅+⋅
x2
1 4M ζ12⋅+ 4
M
Nζ1
2x2−
2
⋅ 4 ζ12⋅ M x
2− M x2⋅ 1
1
N+
⋅−
2
⋅+
2M ζ2 1 4 ζ22⋅ x
2⋅+⋅
x2
1 4M ζ22⋅+ 4
M
Nζ2
2x2−
2
⋅ 4 ζ22⋅ M x
2− M x2⋅ 1
1
N+
⋅−
2
⋅+
2M ζ3 1 4 ζ32⋅ x
2⋅+⋅
x2
1 4M ζ32⋅+ 4
M
Nζ3
2x2−
2
⋅ 4 ζ32⋅ M x
2− M x2⋅ 1
1
N+
⋅−
2
⋅+
2M ζ4 1 4 ζ42⋅ x
2⋅+⋅
x2
1 4M ζ42⋅+ 4
M
Nζ4
2x2−
2
⋅ 4 ζ42⋅ M x
2− M x2⋅ 1
1
N+
⋅−
2
⋅+
x
Fig.3. The simulation of transfer factor with pulsation for different values of the damping factor
The simulation of transfer factor T with pulsation for different values of N parameter.
Figures 4 show the transfer factor ( )ηT for the following parameters: N1=1; N2=2; N3=10;
N4=100; (M=10) in case of low damping ζ1=0,1.
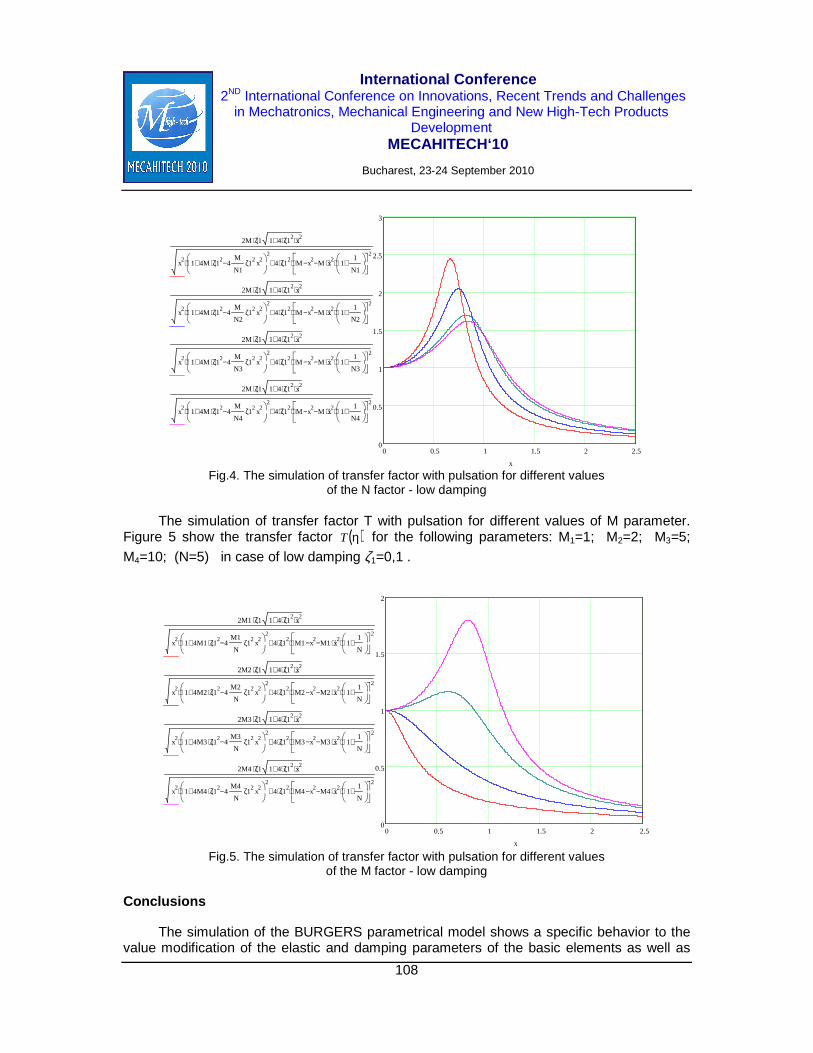
International Conference 2ND International Conference on Innovations, Recent Trends and Challenges
in Mechatronics, Mechanical Engineering and New High-Tech Products Development
MECAHITECH‘10
Bucharest, 23-24 September 2010
108
0 0.5 1 1.5 2 2.50
0.5
1
1.5
2
2M1 ζ1 1 4 ζ12⋅ x
2⋅+⋅
x2
1 4M1 ζ12⋅+ 4
M1
Nζ1
2x2−
2
⋅ 4 ζ12⋅ M1 x
2− M1 x2⋅ 1
1
N+
⋅−
2
⋅+
2M2 ζ1 1 4 ζ12⋅ x
2⋅+⋅
x2
1 4M2 ζ12⋅+ 4
M2
Nζ1
2x2−
2
⋅ 4 ζ12⋅ M2 x
2− M2 x2⋅ 1
1
N+
⋅−
2
⋅+
2M3 ζ1 1 4 ζ12⋅ x
2⋅+⋅
x2
1 4M3 ζ12⋅+ 4
M3
Nζ1
2x2−
2
⋅ 4 ζ12⋅ M3 x
2− M3 x2⋅ 1
1
N+
⋅−
2
⋅+
2M4 ζ1 1 4 ζ12⋅ x
2⋅+⋅
x2
1 4M4 ζ12⋅+ 4
M4
Nζ1
2x2−
2
⋅ 4 ζ12⋅ M4 x
2− M4 x2⋅ 1
1
N+
⋅−
2
⋅+
x
0 0.5 1 1.5 2 2.50
0.5
1
1.5
2
2.5
3
2M ζ1 1 4 ζ12⋅ x
2⋅+⋅
x2
1 4M ζ12⋅+ 4
M
N1ζ1
2x2−
2
⋅ 4 ζ12⋅ M x
2− M x2⋅ 1
1
N1+
⋅−
2
⋅+
2M ζ1 1 4 ζ12⋅ x
2⋅+⋅
x2
1 4M ζ12⋅+ 4
M
N2ζ1
2x2−
2
⋅ 4 ζ12⋅ M x
2− M x2⋅ 1
1
N2+
⋅−
2
⋅+
2M ζ1 1 4 ζ12⋅ x
2⋅+⋅
x2
1 4M ζ12⋅+ 4
M
N3ζ1
2x2−
2
⋅ 4 ζ12⋅ M x
2− M x2⋅ 1
1
N3+
⋅−
2
⋅+
2M ζ1 1 4 ζ12⋅ x
2⋅+⋅
x2
1 4M ζ12⋅+ 4
M
N4ζ1
2x2−
2
⋅ 4 ζ12⋅ M x
2− M x2⋅ 1
1
N4+
⋅−
2
⋅+
x Fig.4. The simulation of transfer factor with pulsation for different values
of the N factor - low damping
The simulation of transfer factor T with pulsation for different values of M parameter. Figure 5 show the transfer factor ( )ηT for the following parameters: M1=1; M2=2; M3=5;
M4=10; (N=5) in case of low damping ζ1=0,1 .
Fig.5. The simulation of transfer factor with pulsation for different values of the M factor - low damping
Conclusions
The simulation of the BURGERS parametrical model shows a specific behavior to the value modification of the elastic and damping parameters of the basic elements as well as

International Conference 2ND International Conference on Innovations, Recent Trends and Challenges
in Mechatronics, Mechanical Engineering and New High-Tech Products Development
MECAHITECH‘10
Bucharest, 23-24 September 2010
109
the relative values modification of elasticity and damping of the VOIGT KELVIN and MAXWELL elements [3]. Therefore the transfer factor of vibration in the resonant area is higher for average level of damping, for lower values of N parameter for weak as well as for strong damping and for higher values of M parameters (fig. 3, 4, 5).
THE SIMULATION OF INSTANTANEOUS REACTIVE AND ACTIVE MECHANICAL POWER OF VIBRATION
The simulation of instantaneous reactive and active mechanical power of vibration with pulsation for different values of the damping factor. Figures 6-7 shows the active-reactive mechanical power for the following damping factors: ζ1=0,1; ζ2=0,3; ζ3=0,7; ζ4=0,9 and for the following parameters values: N=10 , M=5.
The simulation of instantaneous reactive and active mechanical power of vibration with pulsation for different values of the stiffness parameter N. Figures 8-9 shows the active-reactive mechanical power for the following parameters: N1=1; N2=2; N3=10; N4=100; (M=10) in case of low damping ζ=0,3.
The simulation of instantaneous reactive and active mechanical power of vibration with pulsation for different values of the damping parameter M. Figures 10-11shows the active-reactive mechanical power for the following parameters: M1=1; M2=2; M3=5; M4=10; (N=5) in case of low damping ζ=0,3 .
0 1 2 3 4 50.5−
0.1−
0.3
0.7
Nact1 η( )
Nact2 η( )
Nact3 η( )
Nact4 η( )
axaη( )
η Fig. 6. The simulation of active power with pulsation for different values
of the damping factor ζ (ζ1=0,1; ζ2=0,3; ζ3=0,7; ζ4=0,9)

International Conference 2ND International Conference on Innovations, Recent Trends and Challenges
in Mechatronics, Mechanical Engineering and New High-Tech Products Development
MECAHITECH‘10
Bucharest, 23-24 September 2010
110
0 1 2 3 4 50.4−
0
0.4
0.8
Nreact1η( )
Nreact2η( )
Nreact3η( )
Nreact4η( )
axaη( )
η
Fig. 7. The simulation of reactive power with pulsation for different values of the damping factor ζ(ζ1=0,1; ζ2=0,3; ζ3=0,7; ζ4=0,9)
0 1 2 3 4 50.4−
0.4
1.2
2
Nact1 η( )
Nact2 η( )
Nact3 η( )
Nact4 η( )
axa η( )
η
Fig. 8. The simulation of active power with pulsation for different values of the stiffness factor N (N1=1; N2=2; N3=10; N4=100)

International Conference 2ND International Conference on Innovations, Recent Trends and Challenges
in Mechatronics, Mechanical Engineering and New High-Tech Products Development
MECAHITECH‘10
Bucharest, 23-24 September 2010
111
0 1 2 3 4 51.2−
0.5−
0.2
0.9
Nreact1η( )
Nreact2η( )
Nreact3η( )
Nreact4η( )
axaη( )
η
Fig. 9. The simulation of reactive power with pulsation for different values of the stiffness factor N (N1=1; N2=2; N3=10; N4=100)
0 1 2 3 4 50.8−
0.2−
0.4
1
Nact1 η( )
Nact2 η( )
Nact3 η( )
Nact4 η( )
axa η( )
η
Fig. 10. The simulation of active power with pulsation for different values of the damping factor M (M1=1; M2=2; M3=5; M4=10)

International Conference 2ND International Conference on Innovations, Recent Trends and Challenges
in Mechatronics, Mechanical Engineering and New High-Tech Products Development
MECAHITECH‘10
Bucharest, 23-24 September 2010
112
0 1 2 3 4 50.6−
0.1−
0.4
0.9
Nreact1η( )
Nreact2η( )
Nreact3η( )
Nreact4η( )
axa η( )
η
Fig. 11. The simulation of reactive power with pulsation for different values of the damping factor M (M1=1; M2=2; M3=5; M4=10)
0 1 2 3 4 50.5−
0
0.5
1
Nact4 η( )
Nreact4η( )
axa η( )
η
Fig. 12. The simulation of reactive power with pulsation for high values of the stiffness factor (N=100) and damping factor (M=100) and for low damping ζ=0,3.

International Conference 2ND International Conference on Innovations, Recent Trends and Challenges
in Mechatronics, Mechanical Engineering and New High-Tech Products Development
MECAHITECH‘10
Bucharest, 23-24 September 2010
113
CONCLUSIONS:
The simulation of the BURGERS parametrical model shows a specific behavior of actice and reactive power of vibrations to the value modification of the elastic and damping parameters of the basic elements as well as the relative values modification of elasticity and damping of the VOIGT KELVIN and MAXWELL elements [3], [4] Therefore: The active-reactive power of vibration in the resonant area is the same shape with
VOIGT KELVIN shape behavior for higher level of damping parameter ζ , and with MAXWELL shape behavior for lower level of damping parameter ζ (fig. 6-7).
The active power of vibration in the resonant area is positive for each situation, and higher for even smaller values of stiffness parameter N , as well higher for high level of the damping parameter M (fig. 8, 10).
The reactive power of vibration in the resonant area is alternant for each situation, and and higher for even smaller values of stiffness parameter N , as well higher for high level of the damping parameter M (fig. 9, 11).
The shape of active-reactive power of vibration for higher values of stiffness parameter N correspond to VOIGT KELVIN - NEWTON model (fig. 8, 9).
The shape of active-reactive power of vibration for higher values of damping parameter N correspond to VOIGT KELVIN - HOOKE model (fig.10, 11).
The shape of active-reactive power of vibration for higher values of stiffness parameter N and damping parameter N correspond to VOIGT KELVIN model (fig.12)
REFERENCES
[1] Bratu, P. P. VibraŃiile structurilor elastice. Editura Tehnică, Bucureşti, 2000.
[2] Marin, C. VibraŃiile mecanice. Aplicatii. Probleme. Editura BIBLIOTHECA, Targoviste, 2008.
[3] Cornel MARIN, The simulation behavior of burgers viscous-elastic parametrical model used in vibration active isolation – in Modeling and Optimization in the Machine Building Field - MOCM Bacau, ISSN 1224-7480, Nr. 14, Vol II – 2008
[4] Voinea, R., Bratosin, D. Elemente de mecanica mediilor continue. Editura EX PONTO, ConstanŃa, 2000.

International Conference 2ND International Conference on Innovations, Recent Trends and Challenges
in Mechatronics, Mechanical Engineering and New High-Tech Products Development
MECAHITECH‘10
Bucharest, 23-24 September 2010
114
Intraoral X-Ray Imaging Unit In Dentistry
Bogdan Manea1, Zastulka Ivan1, Stanca Comşa2, Adrian Pacioga2, Doina Gheorghiu2
1SC Tehno Electro Medical Company SRL, str. Calusei no.69A, sector 2, Bucharest, Romania 2National Institute of Research & Development for Mechatronics and Measurement Technique,
6-8 Str. Pantelimon, Bucharest, Romania, 1 [email protected]; 2 [email protected]
ABSTRACT
The project aims is research and manufacture of medical devices concern in digital radiological equipment. This area is characterized by a high potential for technological development, both in terms of functional design solutions in continuous innovation and improvement, and manufacturing technology that can be found in the latest materials and processing methods.
Project aim is supported by the requirement since 2009 to use priority only radiological equipment with low irradiation, which has levels accepted in Europe of approx. 10 to 30 times less that the current levels of Romanian radiological existing equipments.
Keywords : radiology; medical device; digital image.
INTRODUCTION
A radiographic image represents the X-ray shadow of patients' internal structures. In
conventional film radiography the radiographic film detects, stores and displays the radiographic information.
For a long time, radiographic film was the most important medium for the acquisition and archival of diagnostic images. In digital radiography X-ray detectors and computers perform the acquisition, archival and display of the radiographic information.
In Western Europe 10 - 20% of the dental practitioners use digital radiographic imaging systems in their dental practice [1, 2].
Although film has been an inexpensive and reliable image receptor in dental radiography for a long time, the advantages of digital dental radiography over film include a lower radiation dose, a swift availability of radiographs, the possibility of image enhancement and no need for film processing chemicals [3]
Many of those advantages are possibilities not found in conventional film-based imaging, which makes the comparison of digital imaging with film-based imaging complicated.
The development of digital radiographic systems is still going on. Especially for solidstate systems this development is going rapidly. THE PROPOSED SOLUTION FOR ACHIEVING FUNCTIONAL MODE L
The equipment is an intraoral X-ray imaging unit which offers safety, reliability, and
greater functionality. It also features a full-swivel revolution in all direction. The tube head

International Conference 2ND International Conference on Innovations, Recent Trends and Challenges
in Mechatronics, Mechanical Engineering and New High-Tech Products Development
MECAHITECH‘10
Bucharest, 23-24 September 2010
115
revolves freely around the sphere, so that practically any position can be achieved, including complete vertical movement.
There are several features including the mechanical flexibilities. Among them: 1. Reduced radiation dosage 2. Compact lightweight components 3. A selection of film or digital sensors 4. No need to reprogram before acquisition when the unit is replaced 5. Ergonomically design and shape for the safety and comfort of patients. 6. Easy- to- use control panel that provides for a straightforward process 7. Automatic correct exposure is defined.
Analyzing the existing solutions and the possibilities for system realization with
available resources, it was design the equipment shown in Figure 1.
Fig. 1 Radiological intraoral equipment TEMCO- DRx-01
The system (Fig. 1) is based on following components: - Cone (1); - X-Ray tube head (2). Concealed in the housing together with the collimator. It
generates X-Ray. - Scissors arm (3 and 4) Extends and provides flexibility of movement so that the
functions of the Dental X-Ray system can be used easily. - Extension arm (5) used to extend the position of equipment for X ray aquisition. - Control panel (6) used to control and manage the device
SYSTEM DESCRIPTION
The arms (3) and (4) (figure 1) increase the device flexibility and can be positioned at
any desire position.

International Conference 2ND International Conference on Innovations, Recent Trends and Challenges
in Mechatronics, Mechanical Engineering and New High-Tech Products Development
MECAHITECH‘10
Bucharest, 23-24 September 2010
116
The extension arm (5) permits to increase the space where the equipment can arrive and facilitate to bring it, by the physician, closely to the patient and also to keep clear the access aria around the dental chair. It allows to radiological device support and positioning of the rotating arms 3 and 4 with radiogenic tube.
During rotary motion, and also in the static position the extension arm system provides rigidity, even in the worst position of the radiogenic tube suport arm at the maximum distance from the connection.
Extension arm allows adjustment of the positioning area of radiogenic tube arm and consequently increases the work space, easier assembly and disassembly in case of service and allow easy access. Also free the space around the patient chair and dental unit and provides the opportunity to serve several work stations in the same room.
Constructive solution of extension arm is presented in Figure 2.
Section X-X
Fig. 2 Constructive solution for extension arm
The extension arm has a telescopic extension which is mounted at one end of wall mounted programmer and on the other end to the scissor arms supporting radiogenic tube.
Telescopic extension consists of the fixed part (1), (figure 2) in which a mobile part (2) is sliding. To achieve a movement, with minimal effort from the operator, of radiogenic tube, the mobile part is equipped with steering wheels on the longitudinal direction (3) and lateral guide rollers (4). The presence of these rollers ensure smooth and effortlessly movement (without shocks), and also rigidity of the entire system at the maximum extension position, so, in this position, the maximum displacement on Y axis is less than 5mm.
Telescopic extension contains rotating bush (5) for scissor arms connection and rotational bush (6) for control panel with programmer connection. Rotation bushes provide the necessary blocking to keep the radiogenic tube in static position decided by the radiologist.
To block mobile trolley to the desired length, telescopic extension has a system for

International Conference 2ND International Conference on Innovations, Recent Trends and Challenges
in Mechatronics, Mechanical Engineering and New High-Tech Products Development
MECAHITECH‘10
Bucharest, 23-24 September 2010
117
manually index. The change of system length is realized manual by taking out the roller indexed (7) from a particular slot with handle (8) and sliding telescopic mobile trolley in the fixed part until the desired position is achieved where the system is blocked under the action of compression spring (9).
The system is designed so that rotational movement to stop when the operator has
positioned radiogenic tube in the desired position. This is provided by rotation jacks who have the possibility to adjust the effort and to adapt to radiogenic tube and scissor arms weight. The necessary Force for moving system in the desired position is small and requires no special effort from the operator.
Mobile trolley is moving in steps, providing telescopic extension length of 400mm, 600mm 700mm and 800mm for the end of scissor arms that connects with telescopic extension. Mobile trolley is blocking to the desired length with no gaping ensuring rigidity needed to system. Removing mobile trolley from indexed position for extension or shrink is made by manually unlocking roller indexed which permit to move to the next position where indexing roller is automatically indexed in the new housing under the action of compression spring.
In the maximum extension position of the scissors type arms with radiogenic tube and extension arm the system stiffness is provide and the vertically displacement of radiogenic tube is maximum 5 mm.
Support allows 180º rotation movements in horizontal plane. External surfaces of the device is protected and treated with standard Pausch powder
in order to increase corrosion resistance. The powder is contained electrical, antistatic and antibacterial properties. It also provides increased mechanical strength and an enhanced grip.
Technical characteristics:
• Input power: AC 110~220V 50/60Hz • Power consumption: 600W @X-Ray exposure • Tube voltage: 65kVp • Tube current: 5mA • Exposure time: 0.05~1.5 sec with time increment of 0.01 sec. • Total weight: 25Kg • Focal spot: 0.8 mm • Inherent filtration: 0.8 mm Al • Added filtration: 1.2 mm Al • Total filtration: 2.0 mm Al • Filament characteristics: 2.9~4.0V (max. filament current) • Anode target angle: 20° • Anode Hu: 6000J • Anode cooling rate: 265W • Input energy at 1 sec: 600W • Tube target material: Tungsten

International Conference 2ND International Conference on Innovations, Recent Trends and Challenges
in Mechatronics, Mechanical Engineering and New High-Tech Products Development
MECAHITECH‘10
Bucharest, 23-24 September 2010
118
CONCLUSIONS
Radiation safety is an important issue in dental radiography. The desired amount of information must be obtained with the smallest possible amount of radiation. The dose reduction obtained by digital radiography as compared with film-based radiography has been emphasized since the introduction of digital imaging in dental radiography in the 1980s. Moreover, the patient dose is determined not only by the amount of radiation per exposure, but also by the number of radiographs taken.
Digital intra-oral radiography is a well-accepted diagnostic tool in dental practice. Making in Romania of these products for medical diagnosis helps to reduce imports
and reduce the level of radiation received by the user. Implementation in fabrication of this equipment will permit proper endowing of
Romanian medical units, economic competitiveness and transformation of research in products with high market demand.
Among the benefits they can provide it can include: • Increased patients protection by using low dose irradiation • Optimizing equipment design in the radiological field using advanced software
for design / modeling / simulation, including the criterion related to the quality / price;
• Create premises for development and extend the range of digital radiological equipment for other applications / areas like: veterinary medicine, orthopaedics, traumatology.
REFERENCES
[1] Berkhout WE, Sanderink GC, Van der Stelt PF. A comparison of digital and film
radiography in Dutch dental practices assessed by questionnaire. Dentomaxillofac Radiol 2002; 31 : 93-9.
[2] Van der Stelt PF. Research utilizing dental electronic record. Joint symposium IADR, AADR and ADEA. San Diego, CA. March 6, 2002.
[3] Parks ET, Williamson GF. Digital radiography: an overview. J Contemp Dent Pract 2002; 3 : 23-39.

International Conference 2ND International Conference on Innovations, Recent Trends and Challenges
in Mechatronics, Mechanical Engineering and New High-Tech Products Development
MECAHITECH‘10
Bucharest, 23-24 September 2010
119
The Influence of Technical and Constructive Paramet ers on the
Performances of a Rotating Machine with Profiled Ro tors
Băran Nicolae , Besnea Daniel, Duminică Despina POLITEHNICA University of Bucharest
Department of Mechanical Engineering and Mechatronics 313, Splaiul Independentei, 060042, Bucharest, Romania
E-mail: [email protected]
ABSTRACT
The paper presents the constructive solution and the functioning principle of a new type of rotating motor that integrates an energy cogeneration plant. Mechanical power developed by the motor and the steam flow rate needed for the driving of the rotating motor are computed. Finally, there are determined the constructive and functional parameters of this type of motor, that represents the purpose of a scientific research contract in 2011.
INTRODUCTION
The National Center for Program Management (C.N.M.P.), in the frame of the Program 4 – Partnership in Priority Fields – concluded a firm cooperation agreement with the Institute for Conception, Research and Design in the Field of Thermo-Energetic Equipment “Oskar Von Miller” ICCPET for the achievement of the research project no. 22 – 093/2008 with the title:
‘’Small power co-generation plant composed of a biomass steam boiler – thermic steam machine – electric generator” [1].
The following institutions are partners in the project: Coordinator: ICCPET, with the head office in Bucharest, 266-268 Calea Rahovei, 5th
district Partner 1: The Institute for Research in Electrotechnics (I.C.P.E.), with the head office
in Bucharest, 313, Splaiul Unirii, 3rd district Partner 2: Siemens Program and System – Engineering, with the head office in Brasov,
Colina Universitatii Street Partner 3: “POLITEHNICA” University of Bucharest (U.P.B.), with the head office in
313, Splaiul Independentei, 6th district, Bucharest Partner 4: S.R.L. Aristocrat, with the head office in Ramnicu Valcea, 25, General
Magheru Str., Valcea County. The main purpose of the project consist in the achievement of a co-generation plant
composed of a boiler that burns the biomass and produces steam. The steam moves a thermic machine that drives a small power electric generator (under 10 kWh); at the output of the thermic machine, the steam releases the heat to industrial consumers.
Thus the co-generation plant produces: - electric energy; - thermic energy (heat delivered as steam). In the frame of this project, “POLITEHNICA” University of Bucharest, by the Mechanical

International Conference 2ND International Conference on Innovations, Recent Trends and Challenges
in Mechatronics, Mechanical Engineering and New High-Tech Products Development
MECAHITECH‘10
Bucharest, 23-24 September 2010
120
Engineering and Mechatronics Department, committed itself to solve the following tasks: Stage I: Technical study regarding technical solutions of small power steam thermic
machines (stage concluded in 2009) Stage II: Technical project and experimental model of a steam machine (stage that will
be concluded in 2011). The steam thermic machine is in fact a patent-based rotating motor [2]; the paper will
highlight the influence of constructive and functional parameters on the theoretical power of the machine and on the flow rate of the thermic agent that moves the machine.
THE CONSTRUCTIVE SOLUTION AND THE FUNCTIONING PRINCIPLE OF A STEAM ROTATING MOTOR
The motor consists of two identical profiled rotors C and D (fig. 1) that rotate with the same speed inside the cylindrical casings C and D. Their synchronous rotation is assured by two gears of the same pitch diameter mounted outside the machine, on the shafts E and F.
Figure 1 presents the functioning principle of the motor; the thermic agent (steam or combustion gases) enter the motor with high pressure and temperature and pushes the rotating pistons 1 and 3’ (fig. 1, a).
After a 90° rotation positions b, c and d from figu re 1 are successively reached. In figure 1 c, the piston 1 opens the pass between the casing and the rotor; air
pressure sharply decreases. In continuation, after a 90° rotation, position presented in figure 1 d is reached and the cycle repeats. The pistons on the inferior rotor (1, 2) mesh with the cavities 1’ and 2’ of the superior rotor; simultaneously, the pistons 3’ and 4’ of the superior rotor mesh with the cavities 3 and 4 on the inferior rotor.
It can be noticed from figure 1 that, unlike the piston steam machines, here the motor torque transmitted to the shaft is maximal: M= F ·arm, where the force arm coincides permanently with the radius from the shaft center to the center of the rotating piston.
Figure 1: The functioning principle of the rotating motor
A, B – cylindrical casings ; C, D – rotors, 1,2,3’, 4’ rotating pistons; 1’, 2’, 3, 4 cavities in which the pistons of the adjacent rotor enter.

International Conference 2ND International Conference on Innovations, Recent Trends and Challenges
in Mechatronics, Mechanical Engineering and New High-Tech Products Development
MECAHITECH‘10
Bucharest, 23-24 September 2010
121
COMPUTATION OF THE MECHANICAL POWER EFFECTIVELY PRO DUCED BY THE ROTATING MOTOR
The power produced by this motor is computed by establishing the motor torque transmitted to the shaft by the rotating pistons.
Due to the fact that the steam permanently pushes with p1 = ct. on each piston (from each rotor), an approximately constant motor torque, equal for both shafts, is obtained.
In fact pressure p1 acts on a side of the piston and pressure px acts on the other side, thus the piston transmits to the shaft a force proportional to (p1 – px). This force is equal to [3], [4].
( ) [N] 1 xppAF −= (1)
A – area of the transversal section of the piston; if we note z – piston height and l – piston length (dimension perpendicular on the plane of the sheet) (fig. 2) it results:
][m 2lzA ⋅= (2)
( ) [N] 1 xpplzF −⋅⋅= (3)
Figure 2: Sketch of a rotor with two pistons:
1 – rotor; 2 – piston; 3 – cavity in which the pistons of the adjacent rotor enter; 4 – cylindrical casing
The motor torque transmitted to the shaft is much larger than the torque transmitted by the slider-crank mechanism and is computed using (4):
αsinrFrFM ⋅=⋅= rr (4)
Because αsin⋅r is the force arm (b) and °= 90α (during the whole rotation), it is considered that the force exerted on the piston is applied in the gravity center of the piston, thus at a distance of rotor axis equal to:
2
zRb r += (5)
where : Rr – rotor radius; z – piston height.

International Conference 2ND International Conference on Innovations, Recent Trends and Challenges
in Mechatronics, Mechanical Engineering and New High-Tech Products Development
MECAHITECH‘10
Bucharest, 23-24 September 2010
122
During the whole rotation, this force is exerted on one or the other of the two rotating pistons of a rotor:
+−⋅=⋅=2
)(1 1
zRppzbFM rx
(6)
+⋅−=2
1)( 1
zRzppM rx
(7)
For a shaft, the theoretical power will be equal to:
602
2)(1 1
nzRppzMP rx π
+−⋅=ω⋅= (8)
ν⋅−
+⋅π= )(2
)1(2 1 xr ppz
RzP (9)
where: n – rotating speed of the machine [rpm]; ν – frequency [s-1].
An identical power at the level of each shaft is obtained for the two rotors, thus the theoretical power of the machine is:
νπ ⋅−
+⋅⋅== )(2
)1(222 1 xrt ppz
RzPP (10)
( )30
)(21 1n
ppzRzP xrt ⋅−+⋅⋅⋅⋅= π (11)
It can be noticed from equation (11) that the power of the machine depends on constructive elements (z, l, Rr) as well as on functional parameters (p1-px, n).
The power of the machine will increase by the following ways: - increase of dimensions z, l, Rr; - increase of the rotating speed (n) and of the pressure difference (p1 - px). For the computation of the theoretical power of the machine, it has to be considered
that an effective power of 10kW was required [1], disposing of a boiler that produced steam with the following parameters:
Pa 1015 51 ⋅=p , C0
1 250t =
The following parameters are chosen for the computation of the theoretical power: - Rotor radius : Rr = 0.08 m; - Height of the rotating piston : z = 0.04 m; - Rotor length : l = 0.04 m; - The ratio between piston height and casing radius (Rc) must be comprised between
certain limits [5] :
423.0<cR
z; in the present case 333.0
120
40==
cR
z, thus the parameters z and Rc were
correctly chosen.

International Conference 2ND International Conference on Innovations, Recent Trends and Challenges
in Mechatronics, Mechanical Engineering and New High-Tech Products Development
MECAHITECH‘10
Bucharest, 23-24 September 2010
123
Pappp x5
1 1013bar 13215 ⋅==−=−=∆ (12)
rpm 750=n
5101330
750)04.008.02(04.004.0 ⋅⋅⋅+⋅⋅⋅⋅= πtP (13)
[W] 656.32=tP .
The effective power will be:
tefef PP ⋅=η .
It is estimated [3], [4] that the effective efficiency of the thermic machines generally situates between 4.0...3.0 ; a value of 314.0=efη is chosen.
kW 10 W253.10656.32314.0 ==⋅=efP (14)
THE COMPUTATION OF THE STEAM FLOW RATE REQUIRED FOR MOTOR DRIVING
The volumetric flow rate of the steam that passes through the machine is equal to:
30)2(
nzRlzV r ⋅+⋅⋅⋅= π& [m3/s] (15)
From (15) it can be noticed that V& increases in the same time with l, z, Rr and n.
hs
mV /m 432.90025112.0
30
750)04.008.02(04.004.0 3
3
==⋅+⋅⋅⋅⋅= π& (16)
The mass flow rate:
Vm && ⋅= ρ [kg/s]
;1ν
ρ = from [6] for p = 15 bar and t = 2500 C it results 1518.0=ν [m3/kg]
587.61518.01 ==ρ kg/m3 (17)
kg/h 600kg/h 595.47kg/s 0.165410.0251126.587 ≈==⋅=m& .
This steam flow rate can be computed using other method: - the steam circulates through the machine with the tangential speed:
85.7)02.008.0(60
7502
260
2 =+⋅⋅=
+⋅⋅=⋅= ππω zR
nRw r m/s (18)
The steam flow section:
0032.0)04.004.0(2 =⋅⋅ m2 (19)

International Conference 2ND International Conference on Innovations, Recent Trends and Challenges
in Mechatronics, Mechanical Engineering and New High-Tech Products Development
MECAHITECH‘10
Bucharest, 23-24 September 2010
124
The steam flow rate:
kg/h 600 kg/h 595.6kg/h 1654.085.70032.0587.6 ≈==⋅⋅=⋅⋅= wAm ρ& (20)
Thus for producing 10 kW the motor must be supplied with steam with the following parameters: p = 15 bar, t = 250° C and a flow of 600 kg/h.
CONCLUSIONS
In order to produce an effective power of 10 kW required by [1], computation allowed to establish two categories of parameters of the thermic machine:
I – Functional parameters : • The parameters of the overheated steam at the motor input are: - pressure p = 15 bar ; - temperature t = 2500 C ; - mass flow rate ; kg/h 600=m& ; • Motor rotation speed : n = 750 rpm ; • Steam pressure at the motor output is of 2 bar and its temperature t = 1500 C II – Geometric parameters
As main geometric dimensions of the rotating motor, we established: - Rotor radius : Rr = 80 mm ; - Height of the rotating piston : z = 40 mm; - Rotor length: l = 40 mm ; - Inner radius of the casing:
1204080 =+=+= zRR rc mm.
REFERENCES
[1] C.N.M.P. Program 4 – Partnerships in Priority Fields – Firm Cooperation Agreement concluded with the Institute for Conception, Research and Design in the Field of Thermo-Energetic Equipment “Oskar Von Miller” ICCPET for the achievement of the research project no. 22 – 093/2008 with the title ‘’Small power co-generation plant composed of a biomass steam boiler – thermic steam machine – electric generator”.
[2] Patent no. 111296 released by The State Office for Inventions and Trademarks OSIM Bucharest, “Steam rotating motor”, authors N. Baran, Gh. Baran.
[3] Baran N. a.o., „Technical thermodynamics. Theory and applications” (in Romanian), MATRIXROM Publishing House, Bucharest, 1998
[4] Baran N., „Rotating thermic machines. Working machines. Force machines” (in Romanian), MATRIXROM Publishing House, Bucharest, 2001
[5] Baran N., Baran Gh., Dontu O., „Correlation between the driving power and the height of the rotating piston at a new type of compressor” (in Romanian), Romanian Review of Chemistry, vol. 55, no. 1/2004, pp. 51-53.
[6] Vukalovici M.P., „Thermodynamic properties of water and steam. Tables and diagrams” (in Romanian), Technical Publishing House, Bucharest, 1967.

International Conference 2ND International Conference on Innovations, Recent Trends and Challenges
in Mechatronics, Mechanical Engineering and New High-Tech Products Development
MECAHITECH‘10
Bucharest, 23-24 September 2010
125
New Technologies For Building Complex Prosthetic El ements From
Biocompatible Metals
Dan Ciobota1, Comsa Stanca1, Adrian Pacioga1, Doina Gheorghiu1, Deniz Demirtas2
1National Institute of Research & Development for Mechatronics and Measurement Technique, 6-8 Str. Pantelimon, Bucharest, Romania,
[email protected] 2EOS - Electro Optical Systems GmbH, Germany
ABSTRACT
This research paper is based on the national project “Studies on complex therapeutic alternatives (including Prosthetics Prototypes) for patients with respiratory disorders during sleep in order to improve quality of life and socio-professional reintegration” financed by National Centre for Programme Management (CNMP) accepted under the acronym of the project: SASPROT and contract number: 61-033/2007. The NIRDMMT-National Institute of Research and Development for Mechatronics and Measurement Technique, Bucharest, Romania develop a mandibular advancement device for the treatment of snoring and sleep apnea. It is a custom-made that snaps firmly and comfortably over the upper and lower teeth. The new technologies based on rapid prototyping techniques allow the high degree of customization for each patient.
Keywords : respiratory disorders during sleep, prosthetic prototypes, rapid prototyping & manufacturing, selective laser sintering, 3D design SELECTIVE LASER SINTERING
Selective laser sintering (SLS) (fig.1) is an additive manufacturing technique that uses
a high power laser (for example, a carbon dioxide laser) to fuse small particles of plastic, metal (Direct Metal Laser Sintering), ceramic, or glass powders into a mass representing a desired 3-dimensional object. The laser selectively fuses powdered material by scanning cross-sections generated from a 3-D digital description of the part (for example from a CAD file or scan data) on the surface of a powder bed. After each cross-section is scanned, the powder bed is lowered by one layer thickness, a new layer of material is applied on top, and the process is repeated until the part is completed.
Compared to other methods of additive manufacturing, SLS can produce parts from a relatively wide range of commercially available powder materials. These include polymers such as nylon, (neat, glass-filled or with other fillers) or polystyrene, metals including steel, titanium, alloy mixtures, and composites and green sand. The physical process can be full melting, partial melting, or liquid-phase sintering. And, depending on the material, up to 100% density can be achieved with material properties comparable to those from conventional manufacturing methods. In many cases large numbers of parts can be packed within the powder bed, allowing very high productivity.

International Conference 2ND International Conference on Innovations, Recent Trends and Challenges
in Mechatronics, Mechanical Engineering and New High-Tech Products Development
MECAHITECH‘10
Bucharest, 23-24 September 2010
126
Fig. 1 Synthetic representation of a SLS system and final product build through selective laser
sintering
SLS is performed by machines called SLS systems. SLS technology is in wide use around the world due to its ability to easily make very complex geometries directly from digital CAD data. While it began as a way to build prototype parts early in the design cycle, it is increasingly being used in limited-run manufacturing to produce end-use parts. One less expected and rapidly growing application of SLS is its use in art. The main use of Rapid Prototyping systems are presented in fig.2.
Fig. 2 Main use of Rapid Prototyping systems SLS was developed and patented by Dr. Carl Deckard at the University of Texas at
Austin in the mid-1980s, under sponsorship of DARPA. A similar process was patented without being commercialized by R.F. Housholder in 1979. DIRECT METAL LASER SINTERING
Direct metal laser sintering (DMLS) is an additive metal fabrication technology
developed by EOS out of Munich, Germany. The process involves use of a 3D CAD model whereby a .stl file is created and sent to the machine’s software. A technician works with this 3D model to properly orient the geometry for part building and adds supports structure as appropriate. Once this ‘build file’ has been completed, it is ‘sliced’ into the layer thickness the machine will build in and downloaded to the DMLS machine allowing the build to begin. The DMLS machine uses a high-powered 200 Watt Yb-fiber optic laser. Inside the build chamber

International Conference 2ND International Conference on Innovations, Recent Trends and Challenges
in Mechatronics, Mechanical Engineering and New High-Tech Products Development
MECAHITECH‘10
Bucharest, 23-24 September 2010
127
area, there is a material dispensing platform and a build platform along with a recoater blade used to move new powder over the build platform. The technology fuses metal powder into a solid part by melting it locally using the focused laser beam (fig.3). Parts are built up additively layer by layer, typically using 20 micron layers. This process allows for highly complex geometries to be created directly from the 3D CAD data, fully automatically, in hours and without any tooling. DMLS is a net-shape process, producing parts with high accuracy and detail resolution, good surface quality and excellent mechanical properties. The controlled dosing mini equipment, allows a wide use like portable ambulatory mini equipment variant and as monitoring mini equipment for research and implementation of a new treatment in medical departments.
Fig. 3 Schematic representation of the three phases of the process: powder→laser sintering →final
part
A number of different materials are available for use with EOSINT M systems, offering a broad range of e-Manufacturing applications. EOS CobaltChrome MP1 is a multi-purpose cobaltchrome-molybdenum-based superalloy powder which has been optimized especially for processing on EOSINT M 270 systems. Other materials are also available for EOSINT M systems, including a special-purpose cobalt-chrome-molybdenum-based superalloy for dental veneering application, and further materials are continuously being developed.
EOS CobaltChrome MP1 for EOSINT M 270 Description, application EOS CobaltChrome MP1 is a fine powder mixture for processing on EOSINT M 270
systems, which produces parts in a cobalt-chrome-molybdenum-based superalloy. This class of superalloy is characterized by having excellent mechanical properties (strength, hardness etc.), corrosion resistance and temperature resistance. Such alloys are commonly used in biomedical applications such as dental and medical implants (note: widely used in Europe but much less so in North America), and also for high-temperature engineering applications such as in aero engines.
The chemistry of EOS CobaltChrome MP1 conforms to the composition UNS R31538 of high carbon CoCrMo alloy. Parts built from this material are nickel-free (<0.1% nickel content), sterilisable and suitable for biomedical prototype applications, and are characterized by a fine, uniform crystal grain structure. They fully meet the requirements of ISO 5832-4 and ASTM F75 for cast CoCrMo implant alloys, as well as the requirements of ISO 5832-12 and ASTM F1537 for wrought CoCrMo implants alloys except remaining

International Conference 2ND International Conference on Innovations, Recent Trends and Challenges
in Mechatronics, Mechanical Engineering and New High-Tech Products Development
MECAHITECH‘10
Bucharest, 23-24 September 2010
128
elongation. The remaining elongation can be increased to fulfil even this standard by high temperature stress relieving or hot isostatic pressing (HIP).
This material is ideal for many part-building applications (DirectPart) such as functional metal prototypes, small series products, individualised products or spare parts. Standard processing parameters use full melting of the entire geometry with 20 µm layer thickness, but it is also possible to use the Skin & Core building style to increase the build speed. Using standard parameters the mechanical properties are fairly uniform in all directions. Parts made from
EOS CobaltChrome MP1 can be machined, spark-eroded, welded, micro shot-peened, polished and coated if required. Unexposed powder can be reused.
Typical applications:
- Prototype biomedical implants, e.g. spinal, knee, hip bone, toe and dental implants (Note: subject to fulfilment of statutory validation requirements where appropriate, e.g. for commercial use as a medical device in most countries)
- Parts requiring high mechanical properties in elevated temperatures (500 - 1000 °C) and with good corrosion resistance, e.g. turbines and other parts for engines, cutting parts, etc.
- Parts having very small features such as thin walls, pins, etc., which require particularly high strength and/or stiffness.
Technical data
General process data - Minimum recommended layer thickness: 20 µm - Typical achievable part accuracy:
o small parts [1]: ± 20 – 50 µm o large parts [2]: ± 50 – 200 µm
- Min. wall thickness [3]: 0.3 mm - Surface roughness (µm):
o as built approx.: Ra 10 µm, Rz 40 - 50 µm o after polishing: Rz up to < 1µm
- Volume rate [4]: o standard parameters (no Skin & Core, full melting, full density, maximum
strength): 1.6 mm³/s o faster Skin & Core parameters (full melting, full density): 3.0 mm³/s
[1] Based on users' experience of dimensional accuracy for typical geometries, e.g. ± 20 µm when parameters can be optimized for a certain class of parts or ± 50 µm when building a new kind of geometry for the first time. [2] For larger parts the accuracy can be improved by post-process stress-relieving at 1150 ºC for 6 hours. [3] Mechanical stability is dependent on geometry (wall height etc.) and application [4] Volume rate is a measure of build speed during laser exposure. The total build speed depends on the average volume rate, the recoating time (related to number of layers) and other factors such as DMLS-Start settings.
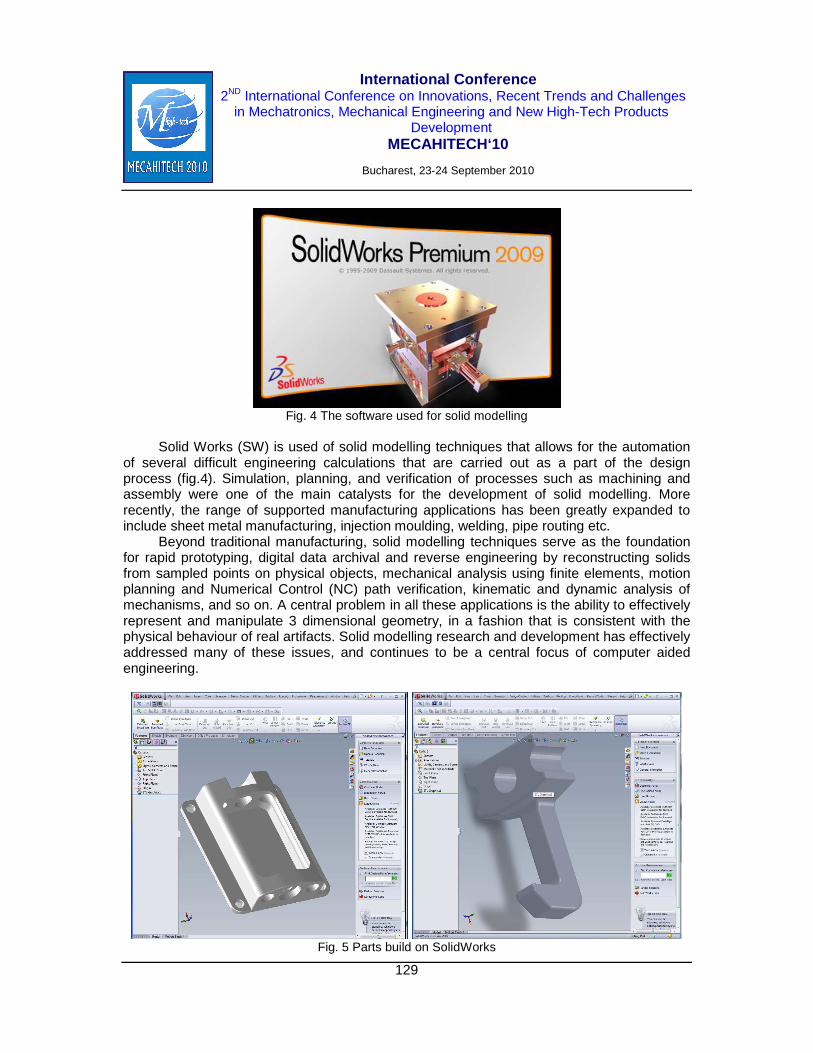
International Conference 2ND International Conference on Innovations, Recent Trends and Challenges
in Mechatronics, Mechanical Engineering and New High-Tech Products Development
MECAHITECH‘10
Bucharest, 23-24 September 2010
129
Fig. 4 The software used for solid modelling
Solid Works (SW) is used of solid modelling techniques that allows for the automation
of several difficult engineering calculations that are carried out as a part of the design process (fig.4). Simulation, planning, and verification of processes such as machining and assembly were one of the main catalysts for the development of solid modelling. More recently, the range of supported manufacturing applications has been greatly expanded to include sheet metal manufacturing, injection moulding, welding, pipe routing etc.
Beyond traditional manufacturing, solid modelling techniques serve as the foundation for rapid prototyping, digital data archival and reverse engineering by reconstructing solids from sampled points on physical objects, mechanical analysis using finite elements, motion planning and Numerical Control (NC) path verification, kinematic and dynamic analysis of mechanisms, and so on. A central problem in all these applications is the ability to effectively represent and manipulate 3 dimensional geometry, in a fashion that is consistent with the physical behaviour of real artifacts. Solid modelling research and development has effectively addressed many of these issues, and continues to be a central focus of computer aided engineering.
Fig. 5 Parts build on SolidWorks

International Conference 2ND International Conference on Innovations, Recent Trends and Challenges
in Mechatronics, Mechanical Engineering and New High-Tech Products Development
MECAHITECH‘10
Bucharest, 23-24 September 2010
130
Building a model in SolidWorks usually starts with a 2D sketch (although 3D sketches are available for power users). The sketch consists of geometry such as points, lines, arcs, conics (except the hyperbola), and splines. Dimensions are added to the sketch to define the size and location of the geometry. Relations are used to define attributes such as tangency, parallelism, perpendicularity, and concentricity. The parametric nature of SolidWorks means that the dimensions and relations drive the geometry, not the other way around. The dimensions in the sketch can be controlled independently, or by relationships to other parameters inside or outside of the sketch. Some elements for mandibular advancement device draw in this program are presented in fig. 5.
SolidWorks pioneered the ability of a user to roll back through the history of the part in order to make changes, add additional features, or change the sequence in which operations are performed. Later feature-based solid modeling software has copied this idea.
In an assembly, the analog to sketch relations are mates. Just as sketch relations define conditions such as tangency, parallelism, and concentricity with respect to sketch geometry, assembly mates define equivalent relations with respect to the individual parts or components, allowing the easy construction of assemblies. SolidWorks also includes additional advanced mating features such as gear and cam follower mates, which allow modeled gear assemblies to accurately reproduce the rotational movement of an actual gear train.
Finally, drawings can be created either from parts or assemblies. Views are automatically generated from the solid model, and notes, dimensions and tolerances can then be easily added to the drawing as needed. The drawing module includes most paper sizes and standards (ANSI, ISO, DIN, GOST, JIS, BSI and GB). SUPPORT GENERATION (SG) MODULE
Support generation is crucial to correctly build your rapid prototypes made with stereo
lithography or metal sintering. Support structures are needed to prevent distortion, to keep everything in place and to easy remove the part from the platform. Magics Support Generation module is a proven solution that allows quick, easy and automated creation and editing of support structures. This software effectively narrows the gap between part design and part production as it transforms the design directly to ready-to-produce data. Reliability, part integrity and ease of removal of support structures – key issues in rapid prototyping – are maximised by Magics Support Generation (fig.6).
Fig. 6 The software used for SG and STL generation/verification

International Conference 2ND International Conference on Innovations, Recent Trends and Challenges
in Mechatronics, Mechanical Engineering and New High-Tech Products Development
MECAHITECH‘10
Bucharest, 23-24 September 2010
131
New features in Magics 12.1 For the SG – Support Generation: - Option to synchronize upper and lower teeth - Full teeth option at the end of a line support The build parts in SW are verified in Magics and ready for send to RP process (fig.7)
Fig. 7 The previous build parts in SW now verified in Magics and sending to RP process
STL STL is the abbreviation of Standard Triangulation Language. The principle of this file-
type is simple. Each surface (an object = collection of surfaces) can be described as a collection of triangles. In the same way, the outside of the Space Shuttle is covered with (square) Heat Shields.
A square can be described with 2 triangles. A cube with 6 x 2= 12 triangles. Curved surfaces need more triangles. When the tolerance of the surface is high, i.e. when the surface should be very smooth, you need more triangles. Conclusion: the more detailed, the heavier files will be. Small STL-files will give rougher descriptions. STL is used especially in rapid prototyping and most of the CAD systems can export STL-files. More and more applications begin to use STL-files. This software is an example of the expansion of the use of STL-files. The software has originally been developed for use in RP-applications. The Tooling Module has made it possible to design Moulds out of the STL-description of an object.
Shells A shell is a collection of triangles that are correctly connected with each other. A shell
can be closed, describing one volume, or it can be open, describing an open surface. A triangle is part of a shell when the direction of rotation of the vectors of two adjacent triangles is opposite.
LAYER PRINCIPLE
Most of the RP machines build an object layer by layer like the pyramids were built
(fig.8).

International Conference 2ND International Conference on Innovations, Recent Trends and Challenges
in Mechatronics, Mechanical Engineering and New High-Tech Products Development
MECAHITECH‘10
Bucharest, 23-24 September 2010
132
Fig. 8 Typical layers build on RP&M machines
Each layer has a certain thickness that is inherent to the material used. In RP
applications you have several layers in 1 mm. Smaller layers allow the user to have smoother surfaces but will also require longer build times. The layer principle results in 2.5 dimensional objects, i.e. in the XY-plane each curve can be drawn but in the Z-direction you will always have an approximation of the curved shape of the object. Material data sheet Physical and chemical properties of parts
- Material composition: Co: 60 - 65 % Cr: 26 - 30 % Mo: 5 - 7 % Si: max. 1.0 % Mn: max. 1.0 % Fe: max. 0.75 % C: max. 0.16 % Ni: max. 0.10 %
- Relative density with standard parameters: Approx. 100 % - Density with standard parameters: 8.3 g/cm³
Final parts on the plate just after finish the RP process are presented in figure 9, and
after their taking from the plate and sanding presented in figure 10.
Fig. 9 Final parts on the plate just after finish the RP process

International Conference 2ND International Conference on Innovations, Recent Trends and Challenges
in Mechatronics, Mechanical Engineering and New High-Tech Products Development
MECAHITECH‘10
Bucharest, 23-24 September 2010
133
Fig. 10 The final parts just after few hours from starting the job
Mechanical properties of the parts realized with this technology are presented in tables
1 and 2.
Table 1 Mechanical properties of parts at 20 °C
Properties As processed High temp.stress
relieved 6 hours at 1150ºC
Ultimate tensile strengh (SR EN ISO 6892-1:2010)
In horizontal direction (XY) 1200 ±150 MPa 1100 ±100 MPa In vertical direction (Z) 1200 ±150 MPa 1100 ±100 MPa
Yield strength (Rp 0.2 %) (SR EN ISO 6892-1:2010)
In horizontal direction (XY) 950 ±100 MPa 600 ±50 MPa In vertical direction (Z) 800 ±100 MPa 600 ±50 MPa
Elongation at break (SR EN ISO 6892-1:2010)
In horizontal direction (XY) Min 8% Min 20% In vertical direction (Z) Min 8% Min 20%
Young’s Modulus (MPIF 10)
In horizontal direction (XY) 190 ±20 MPa 200 ±20 MPa In vertical direction (Z) 190 ±20 MPa 200 ±20 MPa
Fatigue life (ASTM E466:1996) In vertical direction (Z) at 0-440MPa load and 45Hz >10 million cycles
Hardness (DIN EN ISO6508-1) 35-45 HRC
Table 2 Thermal properties of parts Prope rties Value
Coefficient of thermal expansion, as processed:
- over 20-500 ºC 13.6 x 10⁻⁶ m/m ºC - over 20-500 ºC 15.1 x 10⁻⁶ m/m ºC
Thermal conductivity, as processed:
- at 20 ºC 13 W/m ºC - at 300 ºC 18 W/m ºC - at 500 ºC 22 W/m ºC - at 1000 ºC 33 W/m ºC
Maximum operating temperature 1150 ºC Melting range 1350-1430 ºC
The quoted values from the tables refer to the use of these materials with EOSINT
M270 systems according to current specifications (including the latest released process software PSW and any hardware specified for the relevant material) and operating instructions. All values are approximate. Unless otherwise started, the quoted mechanical and physical proprieties refer to standard building parameters and test samples built in horizontal orientation. They depend on the building parameters and strategies used, which

International Conference 2ND International Conference on Innovations, Recent Trends and Challenges
in Mechatronics, Mechanical Engineering and New High-Tech Products Development
MECAHITECH‘10
Bucharest, 23-24 September 2010
134
can be varied by the user according to the application. Measurements of the same proprieties using different test methods (e.g. specimen geometrics) can give different results. CONCLUSION
We were the first Romanian entity which installs DMLS equipment. The team who work on RP&M machine is presented in figure 11.
Since 2007, INCDMTM work to identify product applications and introduce our systems to the manufacturing industry.
With the purchase of the new titanium-based system, INCDMTM stays among the leading suppliers who are willing to explore DMLS (Direct Metal Laser Sintering) and the breakthroughs it holds for innovative companies. How yearly demand for laser-sintering services has increased we expect interest in titanium parts to follow the same strong demand curve.
Fig. 11 The TEAM who work on RP&M machine (EOSINT M 270 Xtended machine)
As new technology and innovative production methodology develop, our company will
become more important in the manufacture of specialized prosthetic components, working to improve quality of life and socio-professional reintegration. Thus, we aim to grow the ERA – European Research Area by following the EU directives for improving the quality of life of EU citizens. REFERENCES
[1] EOS CobaltChrome MP1 - MS / 11-08 - EOS GmbH - Electro Optical Systems –
WWW.eos.info [2] Materialise MAGICS Manual – 12.1 English version – www.materialise.com [3] EOSINT M 270 Xtended – Operation Manual

International Conference 2ND International Conference on Innovations, Recent Trends and Challenges
in Mechatronics, Mechanical Engineering and New High-Tech Products Development
MECAHITECH‘10
Bucharest, 23-24 September 2010
135
Integrated Intelligent Systems of Non-Destructive T esting –
Pledge of Quality of Manufacture of Welded Tubes for the Main Pipelines
A. Tkachenko - IC NDT Introscop S.A.,
20, Mesterul Manole str., Chisinau, R. Moldova, MD-2044; [email protected]
ABSTRACT
The detailed technological structure of operations of manufacture of welded tubes of
the big diameter for the main pipelines is considered. The integrated intelligent methods and systems of technological and delivery stages of non-destructive testing, the tubes built in a line of manufacture of tubes. The structure of the hardware of installation НК361 created on the basis of multichannel flaw detector Introscop-02 and intended for the technological control of a welded seam of a tube, and structure of acoustic and hardware parts of installation НК362 intended for the delivery automated ultrasonic control of regional strips of the ends of tubes are in more details considered. INTRODUCTION
A metallurgical manufacture longitudinal welded tube of the big diameter is provided
with faultless performance of sequence of all technological operations of manufacture. The major place in maintenance of quality of manufacture makes application of set of intelligent methods and systems of non-destructive testing (NDT) which in necessary places of a chain of manufacture as obligatory are built - in technology and provide duly detection of defects in crucial zones of a tube. It first of all a longitudinal welded seam and zone, adjoining to a welded seam, and also the ends of a tube forming a zone of a ring welded seam already during construction of pipelines. INTEGRATED SYSTEMS NDT IN THE LINE OF MANUFACTURE O F TUBES
In technological operations of manufacture of tubes distinguish two stages of control
operations: technological and delivery. At a technological stage interconnecting the following methods NDT: automated ultrasonic testing (AUST) of welded seams, radioscopic testing (RT) of the marked defective sites of a welded seam, manual ultrasonic testing (MUST) of the sites marked AUST, but not confirmed RT, RT the repaired sites of a welded seam, MUST the repaired sites of a welded seam. At a delivery stage the complex of the following methods is used: AUST welded seams, AUST the ends of tubes, RT the ends of welded seams, visual survey and repair of defective sites of tubes, rechecking MUST a welded seam and MUST the ends of tubes. If as a result of indication of defects, a scrap of the end of a tube it is impossible, the tube is rejected, if scrap is possible - the end of a tube is cutting-off, and it comes back to a position of the beginning of the control of the end of a tube. If all elements of a tube are recognized suitable, the tube is translated in a position of magneto-luminescent testing (MLT) of a facet of tubes. In case of successful passage of the given operation, final acceptance is made and on each tube the passport is formed. In case

International Conference 2ND International Conference on Innovations, Recent Trends and Challenges
in Mechatronics, Mechanical Engineering and New High-Tech Products Development
MECAHITECH‘10
Bucharest, 23-24 September 2010
136
of revealing defects of a facet, it is made a piece of the end of a tube, and it comes back to the repeated delivery control of the ends, or is rejected. The block diagram of a technological line of manufacture of tubes of the big diameter is resulted on figs 1. Interconnecting the listed methods of NDT it is submitted by the example of manufacture of welded tubes of the big diameter in JSC "VSW" at which the following systems and the equipment are used.
2. Quality check of shee ts
3. Submission of sheets in manufacture
4. The control of the sizes of sheets
5. Welding technological rods on trailer edges
6. Processing edges of sheets
7. Formation of edges
8. Step-by-step formation
9. Marks of n umber of a tube
10. Hydro having brought down scales from trumpet p reparations
11. Drying preparations
12. Welding a technological seam
13. Welding an internal seam
14. Welding an external seam
15. Cooling a welded seam
1. Warehousing sheets

International Conference 2ND International Conference on Innovations, Recent Trends and Challenges
in Mechatronics, Mechanical Engineering and New High-Tech Products Development
MECAHITECH‘10
Bucharest, 23-24 September 2010
137
Indication of defects
16. The automated ultrasonic testing of welded seams
17. Radioscopic
testing of defective sites
of a welded seam of tubes
19. Repair of seams of
tubes by welding
Indication of defect
Transition to a step 20
There is no indication of defect
RT and MUST
Indication AUST is
confirmed (repair is possible)
Indication AUST is
confirmed (repair is
impossible)
Indication AUST is not confirmed
17. RT the repaired sites of
seams
18. Manual ultrasonic control of the repaired
sites of seams
Rejection
18. MUST the marked
site
Indication AUST
is confirmed
to a step 19
Is accept
ed
20. Preliminary acceptance of tubes
21. Plasma a scrap of rods and the defective ends of tubes
There is no indication of
defect
Transition to step 20
22. Washing an internal surface
Indication AUST is not confirmed

International Conference 2ND International Conference on Innovations, Recent Trends and Challenges
in Mechatronics, Mechanical Engineering and New High-Tech Products Development
MECAHITECH‘10
Bucharest, 23-24 September 2010
138
23. Mechanical calibration of tubes on all length
25. Mechanical tests and definition of a chemical compound in laboratory
25.1 Manufacturing samples 25.2 Tests of tubes
24. Sampling for tests
29. Hydro test of tubes
Rejection
Leak
32. RT the ends of welded seams
30. AUST welded seams
31. AUST the ends of tubes
26. Milling the platen of strengthening of an internal welded seam on the ends of tubes
27. Preliminary cutting the ends of tubes
28. Correction of quality of the ends of tubes
33. Survey and repair of tubes 33.1 MUST a welded seam 33.2 MUST the ends of tubes 33.3 Repair of tubes by grinding circle
Piece of the ends
Removal of strengthening of welded seams on the ends of
tubes
Rejection
Indication of defects – a piece impossible
Indication of defects - a piece is possible
Transition to a step 31

International Conference 2ND International Conference on Innovations, Recent Trends and Challenges
in Mechatronics, Mechanical Engineering and New High-Tech Products Development
MECAHITECH‘10
Bucharest, 23-24 September 2010
139
Figs 1. The block diagram of a technological line of manufacture longitudinal welded tubes of the big diameter for the main pipelines (color marks operations NDT)
Transition to a step 31
34. Machining end faces
Removal of strengthening of welded seams on the ends of
tubes
There are no indications of defects MUST
Indication
Piece of the ends
35. Magneto-luminescent testing of a facet of tubes
The sizes of a facet вальность
36. Final acceptance of tubes
37. Marks of tubes
38. Warehousing tubes
The defective sites which are not deducing a tubes for the minimal length. Stratifications at
end faces of tubes
Piece of the ends
Does not correspond to requirements of the
standard
Rejection
Transition to a step 34
39. Shipment of tubes

International Conference 2ND International Conference on Innovations, Recent Trends and Challenges
in Mechatronics, Mechanical Engineering and New High-Tech Products Development
MECAHITECH‘10
Bucharest, 23-24 September 2010
140
Technological AUST a welded seam in a stream of manufacture of a tube before hydrotests (16 in the block diagram) it is carried out by installations НК360 and НК361, the created experts of the Scientific research institute of NDT (NIINK JSC "INTROSCOP") of Kishinau and Institute of electric welding E.O.Patona of Kiev with participation of laboratory NDT JSC "VSW". General view of installation НК361 for NDT a welded seam is presented on figs. 2. Installations AUST are intended for revealing various defects of longitudinal and cross-section orientation and equipped with the automatic sound and light signal system, paintmarker for a mark of defective sites and sites of deterioration of acoustic contact, laser systems of tracking a welded seam with accuracy ±1 mm.
Figs 2. General view of installation НК361 for NDT a welded seam Detection of defects, data processing of the control, registration of results of calibration
of installation are provided with multi-channel ultrasonic flaw detector Introscop-02 with managing computer complex on the basis of an industrial computer with the advanced structure of an exchange with systems of installation. In multi-channel system the choice and input of zones of the control of metal of a welded seam and zones of quality assurance of acoustic contact is carried out by time strobes - pulses installed at a program level. At the

International Conference 2ND International Conference on Innovations, Recent Trends and Challenges
in Mechatronics, Mechanical Engineering and New High-Tech Products Development
MECAHITECH‘10
Bucharest, 23-24 September 2010
141
control of welded seams of tubes over alignment of sensitivity the equal defects located on different distance from probe, and for exception of the overestimated rejection of tubes in Introscop-02 the system of time adjustment of sensitivity is used. Supervision over process of the control and adjustment, display of results of the control in flaw detector is carried out with the help 19-ти the inch monitor on which screen all necessary signals are distinctly looked through, displayed A-scan and B-scan. B-scan allows estimating work of all multi-channel system (the channel of detection of defect, its position, relative amplitude, presence of acoustic contact). Computer complex flaw detector Introscop-02 allows making processing of the received information on defect by various rejection criteria - amplitude, extent, quantity of defects for the set extent of a welded seam.
Result AUST is the file of defects placed in database flaw detector Introscop-02, and the report of the control (figs. 3) which, if necessary, can be directed on a seal. There is an interface for information interchange with the automated control system of technological processes of shop.
Figs 3. The form of the report of results AUST
For connection with systems of automatics of the equipment of a site structure flaw
detector Introscop-02 includes the block of management which, on availability for service of a

International Conference 2ND International Conference on Innovations, Recent Trends and Challenges
in Mechatronics, Mechanical Engineering and New High-Tech Products Development
MECAHITECH‘10
Bucharest, 23-24 September 2010
142
mechanical part of a complex, accepts signals of management of the beginning of the control, pulses of gauges of moving of a tube concerning acoustic blocks and transfers signals of management to executive mechanisms of installation (about presence of defect, the end of the control, the termination of scanning). The special attention is given to convenience of service of installation by the serviceman and efficiency of adjustment - recustomizing for other diameter of a tube. For this purpose the portable monitor with "mouse" and the keyboard is stipulated, allowing making adjustment, being directly at acoustic blocks of installation. The monitor is established at the adjusted acoustic block and takes management flaw detector on itself.
Adjusting parameters can be remembered and the operator at any moment can establish the necessary adjustment which is stored in memory of a computer. It allows realizing various variants of research of a welded seam. While translating lines of welding of a pipe for other diameter input of new modes flaw detector Introscop-02 occupies no more than minutes.
Sensitivity of system is sufficient for automatic detection of defects of a welded seam, the amplitude echo-signals from which is equal or exceeds echo-signals from artificial reflectors as a rectangular groove in width of 1 mm in the extent of 50 mm and depth of 5 % from thickness of a wall of tubes, a through aperture in a seam in diameter of 1,6 mm, the rectangular groove executed across a seam, depth of 5 % from thickness of a wall of tubes. Time instability of installation on each channel does not exceed 1dB for 8 hours of continuous work.
RT defective sites of a welded seam of tubes (17 in the block diagram) it is carried out by the equipment of firm "YXLON", "SEIFERT" and "АСК-РЕНГЕН". RT sites of welded seams of the pipes having marks of the automated ultrasonic control over presence of defects and sites of seams after repair by welding are exposed. Fixing of results of the control of pipes is made in memory of computer complex RT, with the subsequent record on CD carriers and transfers to archive.
MUST welded seams (18 in the block diagram) it is carried out by installations on the basis of ultrasonic flaw detector УД2-12, УДЦ-201П and СКАРУЧ. Installation of the manual ultrasonic control is intended for check and estimations of deficiency of sites of the welded seams defective by installations AUST, but no validated by installations RT, and also for the control of sites of the seams repaired by removaldistance of defects with the subsequent tea leaves and polishing.
Delivery AUST welded seams and the ends of pipes (30 in the block diagram) it is carried out after hydrotests of tubes by installations of firm Krautkramer SNUP-LO/OFF-L-REP with the automatic sound, light signal system and paintmarker for a mark of defective sites and sites of deterioration of acoustic contact, to registration of the report of the control.
Delivery AUST the ends of tubes (31 in the block diagram) it is carried out by installations НК-362 created experts of NIINK JSC "INTROSCOP" and Institute of electric welding E.O.Patona with participation of laboratory NDT JSC "VSW", intended for revealing defects such as longitudinal cracks and stratifications in the basic metal on all perimeter of trailer sites of tubes, in a technological stream of shop after hydro tests. НК-362 with the automatic sound, light signal system and paint marker for a mark of defective sites and sites of deterioration of acoustic contact, to registration of the report of the control. For the control of pipes it is used four acoustic blocks, on two each end, carrying out scanning of both ends of a tube simultaneously with volume of the control over 150 mm. Each acoustic block will consist of two wide piezoelectric probes, one of which separately - combined, one is used for

International Conference 2ND International Conference on Innovations, Recent Trends and Challenges
in Mechatronics, Mechanical Engineering and New High-Tech Products Development
MECAHITECH‘10
Bucharest, 23-24 September 2010
143
detection of defects such as stratifications, and inclined probe for detection of longitudinal defects. The structure of acoustic system of installation НК362 for the control of trailer sites of a tube is resulted on figs.4, and on figs.5 - fragments of a general view and the acoustic block of installation НК362 in dynamics.
Figs. 4. The circuit of accommodation of ultrasonic probes in the acoustic block of installation НК362 to process AUST of the ends of welded tubes
The tube transport рольгангом moves on a site of the control and keeps within on the
transport cart, which elevating-rotary rollers, lift and turn a tube in a control position a welded seam in zenith. At the command of the operator units AUST of trailer sites move blocks of acoustic converters till the stop moment on signals of gauges of the end of a tube. Acoustic blocks fall on a tube which does one turn. Acoustic systems are completed probes, adjusted on revealing of stratifications and longitudinal defects in trailer strips of a wall of a tube in width of 60 mm. Absence of defects in these zones especially important for maintenance of a qualitative ring welded seam at building of the main pipelines.
At work of installation НК 362 are stipulated:
• Drawing marks of different color on a surface of the tube, determining type and a site of defects, and also sites with unsatisfactory acoustic contact.

International Conference 2ND International Conference on Innovations, Recent Trends and Challenges
in Mechatronics, Mechanical Engineering and New High-Tech Products Development
MECAHITECH‘10
Bucharest, 23-24 September 2010
144
Figs. 5. General view of the acoustic block of installation НК362 in dynamics AUST
in two projections
• Delivery of the report of the control over each tube, including at least number of a tube, amplitude echo-signals the found out defects with the indication of their coordinates, extents, numbers of the channel which is finding out defect;
• Calibration of installation on standard samples of the enterprise - simulators of defects as in static and a dynamic mode at speed of moving on standard samples of the enterprise close by the speed of moving of tubes during the control. Results of calibration also are recorded;
• Registration of B-scan on each channel with an opportunity of viewing or a seal of the information on all or a part of channels on the paper carrier;
• A possibility of transfer of the information on results of the control over system of the automated control system of technological processes of shop by means of local network Ethernet.
At RT the ends of welded seams (32 in the block diagram) trailer sites of welded
seams at length not less than 300 mm are exposed to the control. Sensitivity RT is determined on wire to standards. For definition of scale of the image and a visual estimation the operator of the sizes of defects uses a sample representing a plate from steel by

International Conference 2ND International Conference on Innovations, Recent Trends and Challenges
in Mechatronics, Mechanical Engineering and New High-Tech Products Development
MECAHITECH‘10
Bucharest, 23-24 September 2010
145
thickness of 3-5 mm with apertures in diameters 4±0,1 mm; 3±0,1 mm; 2±0,1 mm; 1±0,1 mm and distances between their centers 10±0,2 mm. Fixing of results of the control of tubes is made in memory of computer complex RT, with the subsequent record on CD carriers and transfers to archive.
MUST welded seams and the ends of tubes on perimeter (33.1 and 33.2 in the block diagram) it is intended for the control of trailer sites of a welded seam over length not less than 250 mm (on both ends of a tube), not tested AUST, and sites of a welded seam with marks AUST, as the control of trailer sites of tubes over perimeter with marks AUST of the ends of tubes.
Magneto-luminescent testing facets of tubes (35 in the block diagram) than 300 mm from both ends of a tube and a facet from both ends of a tube are carried out by equipment УМЛК-10 and МАГНИСКОП КТ/Б on trailer sites of external and internal zones of a welded seam at length not less. Revealed defects - defects such as stratifications, bowls, cracks of any orientation leaving on a surface of an end face of a tube and a welded seam on distance not less than 300 mm from an end face. A used display material – magneto-luminescent suspension. The site of a seam can be polished or cut off before removal of defect and MLT is made repeatedly.
Set of the integrated intelligent methods of non-destructive testing used in a stream of manufacture of welded pipes, to made on more than 30 specifications and standards, and the normative documents regulating application of set of those or other methods NDT at various stages of manufacture of tubes depending on area of their application.
CONCLUSIONS
Integrated intelligent methods and systems of non-destructive testing used in a stream
of manufacture of welded pipes, made on the resulted specifications and standards, promotes high quality maintenance and reliability of erected important economic objects, such as the main pipelines, including underwater, power constructions, etc.
Due to a high level of the organizational - technical measures undertaken on JSC "VSW" Vyksa Russia has allowed to make tubes for such projects as Sakhalin - 1, Sakhalin - 2, the gas main "Nord Stream", etc.

International Conference 2ND International Conference on Innovations, Recent Trends and Challenges
in Mechatronics, Mechanical Engineering and New High-Tech Products Development
MECAHITECH‘10
Bucharest, 23-24 September 2010
146
The Intelligent system of Automatic Tracking
Behind the Welded Seam at the Ultrasonic Testing of Pipes
A. Tkachenko - IC NDT Introscop S.A., 20, Mesterul Manole str., Chisinau, R. Moldova, MD-2044; [email protected]
ABSTRACT
Questions of automatic tracking a welded seam are considered, the way of automatic tracking a welded seam on the acoustic signals received from a zone of a seam and a way of reduction of influence of instability of a corner of input is investigated and offered of ultrasonic fluctuations (USF) in the course of ultrasonic testing (UST) of welded seams of pipes for the main pipelines in a stream of their manufacture are considered, principles of construction intelligent installations of the automated ultrasonic testing (AUST) welded pipes are resulted, described structure and features of acoustic systems and equipment of new installations of the testing.
INTRODUCTION
Results theoretical and experimental researches, microelectronics and computer facilities rapid development was positively reflected in perfection of principles of construction of installations of the AUST of welded pipes in the conditions of their manufacture. On change to bulky analogue systems the new digital technologies, programmed logic matrixes, systems of processing and information display stage by stage take root. Management of work of installations as a part of the automated control systems of technological processes (ACSTP) shops and factories is improved, loading of adjusting parameters, monitoring procedure, formation and delivery of the passport of the testing is programmed. On the same level with circuit and structural perfection principles of construction and adaptation of installations to conditions of the testing and to requirements of norms and standards, creations and introductions of new techniques of the testing develop. Possibility of operative change is realized: Parameters of strobes-impulses, capacities of the generator, rejection criteria depending on position of the acoustic block. Possibility of formation of various types of time adjustment of sensitivity (TAS) and increases of reliability of the control at the expense of statistical processing of signals is received.
Conditions of wide introduction intelligent systems of automatic tracking a welded seam in dynamics of the testing, a rating of a status of acoustic contact are created, opportunities of adaptation new and before the developed ways of increase reliability of results UST, creation of new ways of increase of noise immunity of control devices and automatic adjustment of amplification of channels testing are expanded. TEORETICAL A SUBSTANTIATION OF A WAY OF TRACKING A WELDED SEAM
One of the major conditions of realization of the control of a welded seam automated ultrasonic testing is maintenance of reliable tracking a seam. Provided that the corner of input of ultrasound in metal of a wall of a pipe α = const, work of the

International Conference 2ND International Conference on Innovations, Recent Trends and Challenges
in Mechatronics, Mechanical Engineering and New High-Tech Products Development
MECAHITECH‘10
Bucharest, 23-24 September 2010
147
watching device consists in maintenance at the set level of distance L between the ultrasonic piezoelectric converter (probe) and a seam (0 - point Lo) (figs.1).
Figs.1. Displacement of peak of function Ак (L, α) rather L 0 at change α: Continuous line - nominal position of peak of function,
Dotted and axial - a deviation of peak of function from nominal position.
Cross-section displacement of a seam rather probe in the course of the control lead to a deviation of distance L from parameter Lo, that is there is a difference ∆L= (Lo - L). As a result watching device directs ПЭП towards reduction of the arisen mismatch and directs ∆L→ 0. At ∆L= 0 distance coincidence between a site of metal of a seam and probe installations UST again takes place. By such principle almost all devices of tracking a welded seam work. The set of realizations of systems of tracking a welded seam in the course of the AUST, using various physical principles for measurement and automatic working off of a mismatch ∆L [1 - 3] is known. In these systems influence of instability of a corner of input UST in the controllable product arising under the influence of various factors (detritions holders in which it is established probe, and prisms probe, change of temperature of prism probe, geometrical parameters of a pipe, etc.) is not considered.
On figs.2 are displayed sequence of casual values of function of Ак [n ТZ] and of some the valid average values of estimations mк, amplitudes echo-signals Ак from a distant edge of the platen of strengthening of a seam; ТZ - a clock interval of sounding; n = 1, 2, 3, … ∞ - a serial number of clock interval ТZ.; Тint - a time interval in which calculation of average value mк amplitudes echo-signals is made by Ак; l = 1, 2, 3, … ∞ - a serial number Тint. Besides, ∆ (1)Кm - a difference of the first order of
average values mк amplitudes echo-signals Ак in the next time intervals Тint, and ∆ (2)Km - an increment of a difference of average values mк amplitudes echo-signals
Ак .

International Conference 2ND International Conference on Innovations, Recent Trends and Challenges
in Mechatronics, Mechanical Engineering and New High-Tech Products Development
MECAHITECH‘10
Bucharest, 23-24 September 2010
148
Figs.2. Sequence of the valid and average values of amplitudes of function of Ак [nТZ]
At L ≈ Lo = const corner change α leads to displacement of peak of function of
Ак (L,α) concerning the nominal position designated by a continuous line. New optimum position of peak of function is designated by a dotted or axial line, that is value of parameter Lo does not correspond to a condition of coincidence of peak of function of Ак (L,α) with position of a distant edge of the platen of strengthening of a seam. Hence, the tracking device should move probe on a pipe so that the distant edge of the platen of strengthening of a seam has coincided with new peak of function of Ак (L,α), that is was combined with position OL′ or OL ′′ . Slow displacement of peak of function of Ак (L,α) in one or other party rather Lo leads to occurrence of a positive increment of a difference of the first order ∆ (1)Кm
( )∆ (1)К Кl К l+1m m - m= (1)
That is on an input of the device of tracking there is an operating voltage. For definition of a direction of regulation it is necessary to calculate a difference of the second order
( ) ( ) ( )∆ ∆ ∆(2)К int (1)К int (1)К intm l +2 Т m l +1 Т m l +2 Т= − (2)
and at performance of condition ∆ (1)Кm 0≈ coincidence of peak of function of Ак (L,α)
with metal of a distant edge of the platen of strengthening of a seam takes place. Now optimum distance on perimeter of a pipe from inclined probe to a distant edge of the platen of strengthening of a seam equally 0 - OL′ or 0 - OL ′′ . Thus, the tracking device compensates both casual cross-section displacement of a seam, and change of a corner of input USF α. By results of the spent researches the way of automatic tracking a welded seam with the platen of the strengthening [4], raising reliability of the control of a welded seam is offered at instability of a corner of input USF of fluctuations in a controllable product. The system works as follows. In each clock interval of sounding of welded seam ТZ
measurement of amplitudes of set echo-signals Ак from a distant edge of the platen of strengthening is made. In a certain time interval of control Тint average value of the specified set mк is calculated and on a difference of average values of amplitudes in

International Conference 2ND International Conference on Innovations, Recent Trends and Challenges
in Mechatronics, Mechanical Engineering and New High-Tech Products Development
MECAHITECH‘10
Bucharest, 23-24 September 2010
149
two next time intervals Тint the pressure of a mismatch proportional to a difference of first order∆ (1)Кm and influencing watching system, operating moving probe concerning
a seam is formed. The moving direction is regulated by a difference of second order∆ (2)Кm .
THE BLOCK DIAGRAMED OF INSTALLATION FOR THE CONTROL OF WELDED SEAMS OF PIPES
In the acoustic block of 1 acoustic system of installation НК361 (figs.3) pair probe 0 - 1 sounds a root zone of a seam on longitudinal defects, pair probe 2 - 3 sounds the top zone of
a seam on longitudinal defects. Steams probe 4 - 5, 6 - 7 and 0 - 5 acoustic blocks 2, are included under the scheme "tandem" and adjusted on revealing of longitudinal and volume defects of a welded seam. Pair 4 - 5 - in a zone from the middle to a root part of a welded seam. Pair 6 - 7 - on revealing of defects located in a zone from the middle to the top part of a welded seam.
In the acoustic block of tandem-steam 0 - 5 it is adjusted on revealing of longitudinal and volume defects in the central zone of a welded seam. probe 1, 2, 3, 4 work in immersion a variant on Х - the scheme and supervise a seam on presence of cross-section defects Д1, Д2 - gauges of laser tracking a welded seam (stabilization L - distances between a seam and probe without changes of a corner of input UST α. Fragments of a general view and the acoustic
block of installation НК361 in dynamics are presented on
figs. 4., and its structural scheme - on figs. 5.
Figs.3. Acoustic system of installation НК361

International Conference 2ND International Conference on Innovations, Recent Trends and Challenges
in Mechatronics, Mechanical Engineering and New High-Tech Products Development
MECAHITECH‘10
Bucharest, 23-24 September 2010
150
Figs.4. Fragments of a general view and the
acoustic block of installation НК361 in dynamics
Rigid requirements on change-over time at transition to the control of pipes of other
standard size, and also requirements on reliability of system of the control automated UST have defined architecture of a control system of installations. The control system is realized on the basis of controller "Siemens" and a hand control - from the programmed panel.
On elevating rotary rollers of the transport cart the pipe is guided a welded seam in zenith, and in process of an entrance of the forward end in a zone of the control of pair probe 0 - 1 and 2 - 3 acoustic block BA1, in pairs fall on a pipe, giving of a contact liquid joins. Prior to the beginning of movement of pipe BA1 by means of system with laser gauge D1 is guided symmetrically concerning an axis of a welded seam, value of parameter Lo is entered and the algorithm of tracking a seam taking into account changes of a corner of input USF α joins.
These operating modes are regulated by a design, to equipment rooms and the software of installations
Base assembly unit of the installation providing giving of acoustic blocks on a position of the control, the bearing module of the vertical moving which rigidity of a design provides stability and repeatability of results UST. On the bearing module modules of horizontal moving are mounted. Tracking a seam in the course of the control is carried out by

International Conference 2ND International Conference on Innovations, Recent Trends and Challenges
in Mechatronics, Mechanical Engineering and New High-Tech Products Development
MECAHITECH‘10
Bucharest, 23-24 September 2010
151
Figs.5. Structure of installation НК361 for AUST welded seams of pipes Ø of 508-1420 mm 1 - technological unit AUST; 2 - a case power; 3 - a management case;
4 - multichannel flaw detector Introscop-02; 5 - a control panel with the telemonitor; 6 - testing pipes; 7 - the transport cart.
means of system of laser tracking the platen of strengthening of a welded seam on the basis of the industrial computer.
On modules of horizontal moving acoustic blocks about US are mounted by the heads consisting from corresponding probe and the device of its fastening and orientation. Head everyone US has the pneumatic drive of lifting and the lowering, providing reliable clip to a pipe surface. Besides, on modules of horizontal moving manual drives for distance adjustment between US heads are established at adjustment. Installation is completed by the way gauge, paint markers defects, the device of preliminary wetting. For everyone paint marker the individual external capacity with a paint, being under pressure is used.
MULTICHANNEL US FLAW DETECTOR INTROSCOP-02
Detection of defects, control data processing, registration of results of calibration in the presented installations are provided with multichannel US flaw detector Introscop-02
1200
26
00
3700
2 3900
4500
4
5
900
2000
3
1850 1500
1030
0,00
6
7
1

International Conference 2ND International Conference on Innovations, Recent Trends and Challenges
in Mechatronics, Mechanical Engineering and New High-Tech Products Development
MECAHITECH‘10
Bucharest, 23-24 September 2010
152
(figs.6) with operating computer complex on the basis of the industrial computer with the developed structure of an exchange with installation systems. All equipment is mounted in firm Shcrof case. In multichannel flaw detector the choice and input of zones of the control of metal of a welded seam and zones of quality assurance of acoustic contact (AC) is carried out программно by installed time strobes-impulses. Various variants А-scan are presented on figs.7, 8. At the control of welded seams of pipes with the big thickness of a wall for sensitivity alignment to the equal defects located on different removal from probes, and for an exception of rerejection of pipes in дефектоскопе the system of time adjustment of sensitivity - TAS is used. In each channel the shape of zones TAS setting on two curves TAS on the channel is used. Curves TAS can be formed two types - inclined and the difficult form (figs.8). Inclined curve TAS is formed on two points and such curve TAS a regulator "Inclination" copes. For strengthening change the regulator "Strengthening" which is carrying out change
of the general strengthening of a reception path is used. At use of a regulator "Inclination" straight line position changes the inclination to a horizontal axis that changes sensitivity of a path, increasing it in due course. Such TAS it is convenient to use at work with direct or inclined probes in narrow zones of the
control. Difficult curve TAS is formed by broken line-linear approximation on the points which quantity can be set in advance. The Maximum quantity of points TAS - 20. Management of the form of curve TAS is carried out by means of the manipulator "mouse". It is remarkable that the result of influence is displayed at once on the display screen. Sensitivity change occurs between two points, without mentioning other zones that allows making exact adjustment on samples. Transition from one curve TAS to
Figs.6. Multichannel flaw detector Introscop-02
Figs.7. A kind of the screen multichannel flaw detector Introscop-02 in mode А-scan

International Conference 2ND International Conference on Innovations, Recent Trends and Challenges
in Mechatronics, Mechanical Engineering and New High-Tech Products Development
MECAHITECH‘10
Bucharest, 23-24 September 2010
153
another is carried out by switching of type TAS in an adjustment mode. If it is necessary to generate in the given channel two curves TAS it is necessary for curves to assign number 0 or 1. Further this data can be used at construction of other schemes of the control. The included mode of an electronic magnifier allows to choose a part of development and to stretch it on all screens for increase in resolution of the screen.
The computer
complex flaw detector allows making processing of the received information on defect by various rejection criteria - to amplitude, conditional extent, quantity of defects on the set site of a welded seam. Mode В-scan (figs.9) allows estimating work of all multichannel system visually: the channel of detection of defect, its parameters, relative amplitude, sites of possible loss of acoustic contact.
On figs. 10 photos микрошлифов fragments of a welded seam of a pipe in which by
means of installation НК361 defects are found out are resulted: a dispersing crack in metal of a welded seam (the first figure) and small not boiled thoroughly in an average part of a welded seam of a pipe (the second figure).
Figs.8. A mode of adjustment TAS of the difficult form
Figs.9. Mode В-scan in the course of the control

International Conference 2ND International Conference on Innovations, Recent Trends and Challenges
in Mechatronics, Mechanical Engineering and New High-Tech Products Development
MECAHITECH‘10
Bucharest, 23-24 September 2010
154
At work of installation are provided:
Drawing of marks of different color on a surface of the pipe, defining type and a site of defects, and also sites with infringement AC;
Delivery of the report of the control on each pipe, including pipe number, amplitude echo-signals the found out defects of their co-ordinate, extent, numbers of the channel with defect;
Installation calibration on the standard sample of the enterprise (SSE) - simulators of defects as in static, and a dynamic mode at the speed of moving SSE close by speed of moving of pipes in the course of the control. Results of calibration are recorded;
Registration В-scan on each channel with possibility of viewing, the information seal on the paper carrier on all or a part of channels;
An information transfer possibility about results of the control in system of ACSTP of shop by means of network Ethernet.
CONCLUSIONS
New ways of tracking a welded seam in the course of its testing, the works introduced in algorithm multichannel flaw detector Introscop-02, in aggregate with the modern hi-tech equipment used at creation of installations НК361, allow to provide high reliability automated UST a welded seam of pipes of the big diameter according to requirements of international standards API 5L and DIN EN 10246-15. Revealed in the course of the automated control of a welded seam defects, after recheck by other methods are subject to repair, or lead to fall of a class of a ready pipe.
Introduction of installations НК361 in a line трубосварочного the unit is calculated on maintenance 100 percent UST of the control at release longitudinal welded pipes in diameter 508 - 1420 mm and a wall 7 - 48 mm intended for pipeline highways.
REFERENCES: [1] Крауткремер Й., Крауткремер Г. Ультразвуковой контроль материалов: Справочник.
Перевод с нем. под. ред. проф. В.Н. Волченко.- М.: Металлургия, 1991. [In Russian].
[2] Panhans P ., patent FRG 1473539. The device for tracking the platen of strengthening of a welded seam at not destroying control. From 14.05.1970, Mannesmann A.G.
[3] Тантлевский В.М., Квирикашвили Р.Д., Мурачев Э.С. et al. А.с. СССР 1027599. Устройство для автоматического слежения за сварным швом. Publ. БИ, 1983, 25. [In Russian].
[4] Tcacenco А.А., Naida V., Gavrev V. et al. BREVET de inventie MD 2889 C2 2006.10.31. Peocedeu de ghidare automata a cordoanelor de sudură cu supraînălŃarea sudurii. BOPI, 2005, 10.
Figs.10. Fragments of a welded seam with the defects which have been found out by installation НК-361: "a dispersing crack" and "not boiled thoroughly"
International Conference 2ND International Conference on Innovations, Recent Trends and Challenges
in Mechatronics, Mechanical Engineering and New High-Tech Products Development
MECAHITECH‘10
Bucharest, 23-24 September 2010
155
Full Metal Micro Gripper Made by Electro Discharge Technique
Jan Hošek, Martin Daněk
Department of Instrumentation and Control Engineering/ Division of Precision Mechanics and Optics/Faculty of Mechanical Engineering/ Czech Technical University in Prague,
Technická 4, Praha 6, Czech Republic, [email protected]
ABSTRACT
This paper presents design and manufacturing of a full metal micro gripper made by electro discharge (EDM) technique. Microgripper was designed as a compact flexure structure and it was made by electro-discharge milling of AlMg5 alloy. We used an electro-thermal micro gripper actuation principle. Thermal dilatation of different functional parts of full-metal electroconductive micro gripper structure is controlled by structuring of gripper functional shape by flexure joins and different cross-section of flexure beams. Theoretical model gives its ability to grip objects up to dimension 100 µm at low applied control voltage.
INTRODUCTION
Manipulating with objects at microscale and nanoscale level becomes an important facility for many scientific and technological fields in the last years. Technological progress connected with miniaturizing of electronics enables to design and manufacture different kinds of micro electromechanical (MEM) components including micromanipulators and micro grippers in the last years. Such systems are used for manipulation with fine samples in microscopes, precise operation with biological cells and tissues, positioning of micro and nano structures like whiskers, nanotubes, optical fibers and many other applications.
Till today a number of different kinds of micromanipulators were designed, presented and few of them are commercialized too. These systems differ with used materials, actuation principles and manufacturing processes. The most common original Si electrostatic [1], thermally [2] or piezoelectricaly [3] driven micro gripers design were extended using more different materials especially polymers and metals [4, 5, 6]. New kinds of actuation principles were presented too using shape memory materials [7] and other physical principles [8, 9, 10]. Traditional MEMs production techniques, such as surface micromachining, bulk micromachining, and the LIGA techniques were supplemented with new production techniques such laser machining [11], e-beam lithography [12], wire – electro discharge machining (EDM) [13] or with combination of different physical or chemical deposition techniques [12, 14].
Presented microstructures are usually 2D or 2,5D structures enabling structuring of system shape mainly in 2D plane only. This fact affects functional design of microgrippers, thermoelectrically especially, where distribution of actuating temperature is given by different cross section, leading to different ohmic resistance, of cold and hot arm of actuator. Extending width of cold actuator arm in 2D plane change the stiffness and flexibility of both arms and limits the space for complex microsystem design. There exist techniques to

International Conference 2ND International Conference on Innovations, Recent Trends and Challenges
in Mechatronics, Mechanical Engineering and New High-Tech Products Development
MECAHITECH‘10
Bucharest, 23-24 September 2010
156
manufacture structured microsystems in 3D and we are presenting such system – a microgripper made with sinking or milling electro discharge machining (EDM) technique.
MICROGRIPPER DESIGN
We designed a thermally driven microgripper based on two thermally dilating beams connected with four flexure joints to two moving arms with gripping bits at its ends. Microgripper movement is given by thermal dilating distance difference between anchor and dilating beam. This distance difference is magnified by factor D/d ≈ 10 using leverage effect among flexure joints and gripping bits, as it is shown in the figure 1.
Figure 2: Draw of microgripper design with three wire power supply
We used an AlMg5 alloy sheet as a material for microgripper manufacturing because of its good mechanical properties, electrical conductivity, high thermal expansion coefficient α = 24 . 10-6 K-1 and easy machining with EDM technique. Electrical scheme of microgripper
When an electric voltage is applied on electrodes of this designed microgripper, the input electric current I is split into two parallel branches with same currents:
dR
UIIII ==+=
2221 , (1)

International Conference 2ND International Conference on Innovations, Recent Trends and Challenges
in Mechatronics, Mechanical Engineering and New High-Tech Products Development
MECAHITECH‘10
Bucharest, 23-24 September 2010
157
where I is applied electric current through dilating beam, U is applied voltage and R is dilating beam resistance. This resistance can be computed by equation:
S
lRd
1ρ= , (2)
where ρ is the electrical resistivity of AlMg5 alloy ρ ≈ 2,67.10-8 Ωm, l1 = 1.7 mm is the dilating beam length and S = t2b is the beam cross-sectional area.
We assume no electric current goes through anchor beam in this three wire connection. In the case of two wire connections only we have to assume the electric current goes parallel through as dilating as anchor beam. The anchor beam has variable cross-sectional area of different beam parts so we considered its resistance Ra as a series of resistances, as it is shown in the figure 2:
Figure 2: Electrical scheme of two wire connection of microgripper.
According this scheme we can compute the total resistance of anchor beam as:
∑∫=+++=i
iii
a dllS
RRRRR)(
1)(2 5432 ρ . (3)
If we assume the all applied electric power is exchanging into heat because of beams ohmic resistance, we can express the value of power dissipation by equation:
dd UIP = , aa UIP = , where ad
ad I
R
RI = (4)
and the total power consumption is given by equations:

International Conference 2ND International Conference on Innovations, Recent Trends and Challenges
in Mechatronics, Mechanical Engineering and New High-Tech Products Development
MECAHITECH‘10
Bucharest, 23-24 September 2010
158
cad
ad RRR
RRU
R
UUIP
++
===22
, (5)
in the case of two wire connection and
cd RR
U
R
UUIP
+===
22
, (6)
in the case of three wire connection, where U is the applied voltage and Rc is a current-limiting resistor.
Microgripper dimensions and flexure joints geometry were calculated according the force and momentum balance, as it is depicted in the figure 3:
Figure 3: Sketch of flexure joints structure mechanical balance.
where Ra and Rb are reaction forces in flexure joints A and B, d is the leverage shorter distance and F is the actuating force of dilating beam given by equation:
1
1
l
lESF
∆= , (7)
where E is the Young's modulus, S is the dilating beam cross-section area and ∆l1/l1 represents the dilating beam extension ratio. Momentums Ma and Mb represent deformation momentums of flexure joints A and B given by equations:
ϕaa kM = and ϕbb kM = , (8)
where ϕ is flexure joint turning and ki=a,b are the flexure joints stiffnesses given by equation [15]:

International Conference 2ND International Conference on Innovations, Recent Trends and Challenges
in Mechatronics, Mechanical Engineering and New High-Tech Products Development
MECAHITECH‘10
Bucharest, 23-24 September 2010
159
i
i
iii
t
R
tEbk
2
069,0= , (9)
where ti is the minimal flexure joints thickness, bi is the flexure joints depth and Ri is the flexure joints radius. Thermal actuation of microgripper
Gripper design enables to grip samples within dimension range 0 to 100 µm. This scale gripper tips movement represents extension of dilatation beam up to ∆l1 = 10 µm because of designed a leverage effect factor 10. The corresponding extension temperature difference ∆T of dilating beam can be compute by equation:
1
1
l
lT
α∆
=∆ , (10)
where α is the thermal expansion coefficient. It gives temperature difference 245 °C necessary for full possible gripe. It is well below alloy melting point. For gripping a finite dimension sample a smaller actuating temperature is needed.
Energy balance equation for heat generation and transfer with convection and radiation can be expressed as:
4TAThAt
TVcP p σρ +∆+
∂∂= , (11)
where P is the input electric power, ρ is the density, cp, is the specific heat capacity, V is the dilating beam volume, A is the effective area for heat and radiation loss, h is the convection heat transfer coefficient, σ is the Stefan-Boltzmann constant, T is the temperature of dilating beam and t is the time. Conduction heat exchange was neglected because of small conduction cross section of adjacent flexible joints.
From this equation the minimum input power Pmin = 0.022 W was computed to cover heat leakage at temperature difference 245 °C. A hi gher input power decreases the actuation time, as it is shown in the figure 4. If we assume to use a current-limiting resistor Rc = 2 Ω, the corresponding power supply voltage is in range from 0.22 to 2.5 V.
Figure 4: Chart of microgripper full range actuation time to input power dependence.

International Conference 2ND International Conference on Innovations, Recent Trends and Challenges
in Mechatronics, Mechanical Engineering and New High-Tech Products Development
MECAHITECH‘10
Bucharest, 23-24 September 2010
160
According this thermo-electrical power balance computation the gripper can grip a sample in a wide time range from few seconds up to 0.02 s. A sample release took up to 40 s after the input power off, depending on gripped sample size. Microgripper manufacturing
We used an EDM machine Sodick AP1 L enabling a sinking machining and electro milling for microsystems manufacturing. Electro sinking is faster than electro milling in general, but it needs to prepare a much more complicated electrode design according machining part shape. It would be proper for mass production of microgrippers, but we decided to use an electro milling technique for our testing piece.
The first we milled a 1 mm thick AlMg5 alloy sheet with 2 mm diameter electrode down to desired microgripper thicknesses 0.4 mm of dilating beam and 0.2 mm of the rest part, as it is shown in the figure 5. Then the microgripper contour was electro milled. There are two slots of different width 100 µm and 200 µm, but we decided to make them both with one electrode diameter. Using preliminary testing cuts we have measured necessary spark gap 10 µm and we have prepared a Wolfram milling electrode of 80 µm in diameter and machine microgripper contour using CNC code.
Figure 5: View on 80 µm machining electrode – left and machined microgripper - right.
We have used seven machining cycles with electrode rotation speed 1000 min-1, finalized with finest machining condition: electric discharge peak power 7 mA, electric discharge time 1 µs and main supply voltage 90 V. After each machining cycle the electrode has moved in Z axis and the next machining was performed on clear electrode surface. The whole described microgripper machining process took 26 minutes. Snaps of machined microgripper still fixed to the original machined sheet are shown in the figures 5 and 6.

International Conference 2ND International Conference on Innovations, Recent Trends and Challenges
in Mechatronics, Mechanical Engineering and New High-Tech Products Development
MECAHITECH‘10
Bucharest, 23-24 September 2010
161
Figure 6: A view on machined microgripper.
We performed a machining quality check with a confocal laser microscope Olympus LEXT. It shows good machined surface quality Ra = 1.3, sharp edges better then 5 µm radius and good mechanical stiffness. Electro-mechanical test will be performed soon.
CONCLUSIONS
A full metal electro-thermally driven microgripper was designed and manufactured using EDM milling technique with 3D shape with thickness 0.2 mm and 0.4 mm. It gives possibility to use this technique for manufacturing more complicated 3D microstructures. Designed microgripper has short gripping time constant, but cooling the system to original temperature takes much longer time. Decreasing the cooling time constant will be the goal for the next work.
ACKNOWLEDGEMENT
This research was supported by grants: IAA200760905 and SGS10/051/OHK2/1T/12.
REFERENCES
[1] Chang-Jin Kim, Albert P. Pisano and Richard S. Muller. “Silicon-Processed Overhanging Microgripper.” Journal of Microelectromechanical Systems, Vol. 1, No. 1, 31-36, 1992.
[2] C. S. Pan and Wensyang Hsu. “An Electro-thermally and Laterally Driven Polysilicon Microgripper”, J. Micromech. and Microeng., Vol. 7, 7-13, 1997.
[3] Y. Haddab, N. Chaillet, A. Bourjault. “A Microgripper Using Smart Piezoelectric Actuators.” Proceedings of the 2000 IEEE/RSJ International Conference on Intelligent Robots and Systems. Takamatsu, Japan. November 2000.

International Conference 2ND International Conference on Innovations, Recent Trends and Challenges
in Mechatronics, Mechanical Engineering and New High-Tech Products Development
MECAHITECH‘10
Bucharest, 23-24 September 2010
162
[4] Eniko T. Enikov, Kalin V. Lazarov. “An optically transparent gripper for micro-assembly.” Journal of Micromechatronics, Vol. 2, No. 2, 121–140, 2004.
[5] K. Kim, E. Nilsen, T. Huang, A. Kim, M. Ellis, G. Skidmore, J.-B. Lee. “Metallic microgripper with SU-8 adaptor as end-effectors for heterogeneous micro/nano assembly applications.” Microsystem Technologies Vol. 10, No 10, 683-693. 2004.
[6] R. K. Jain, U. S. Patkar, S. Majumdar. “Micro gripper micromanipulation using IPMCs (ionic polymer metal composites).” Journal of Scientific & Industrial Research Vol. 68, January 2009, 23-28.
[7] Y.Bellouard, R. Clavel, R. Gotthardt, J. -E. Bidaux, T. Sidler. “A New Concept of Monolithic Shape Memory Alloy Micro-Devices used in Micro-Robotics.” Actuator'98- 6th International Conference on New Actuators - Bremen, Germany, June 17-19, 1998.
[8] Yenwen Lu and Chang-Jin “CJ” Kim. “Micro-Finger Articulation by Pneumatic Parylene Balloons.” TRANSDUCERS ’03, The 12th International Conference on Solid State Sensors, Actuators and Microsystems, Boston, June 8-12, 2003.
[9] Jun Su Lee, Stepan Lucyszyn, “Design and pressure analysis for bulk-micromachined electrothermal hydraulic microactuators using a PCM.“ Sensors and Actuators A 133 (2007) 294–300.
[10] Caglar Elbuken, Lin Gui, Carolyn L. Ren, Mustafa Yavuz, Mir Behrad Khamesee. “Design and analysis of a polymeric photo-thermal microactuator.“ Sensors and Actuators A 147 (2008) 292–299.
[11] Leester-Schädel, B. Hoxhold, C. Lesche. “Micro actuators on the basis of thin SMA foils.“ Microsyst Technol (2008) 14:697–704.
[12] Daniel Sang-Won Park, Arun Kumar Nallani, DonKyu Cha, Gil-Sik Lee, Moon J. Kim, George Skidmore, Jeong-Bong Lee, Jeong-Soo Lee. “A sub-micron metallic electrothermal gripper.“ Microsyst Technol (2010) 16:367–373.
[13] Dragan Petrovic, Elias Chatzitheodoridis, Gordana Popovic et. al. “Design of a Mechanical Gripper for Assembly of Microparts.“ Convegno Nazionale AIAS – Alghero (SS), September 12-15 2001.
[14] Nikolas Chronis and Luke P. Lee. “Electrothermally Activated SU-8 Microgripper for Single Cell Manipulation in Solution.“ Journal of Microelectromechanical Systems Vol. 14, No 4, 857 – 863, 2005.
[15] Jiří Maršík. “Pružné klouby ve výpočtu I praxi.“ Jemná mechanika a optika Vol. 52, 7-8, 220-223, 2007.

International Conference 2ND International Conference on Innovations, Recent Trends and Challenges
in Mechatronics, Mechanical Engineering and New High-Tech Products Development
MECAHITECH‘10
Bucharest, 23-24 September 2010
163
Autonomous Snow Cleaning Robot
Vlad Vaduva, Diana Mura Badea, Dumitru Vlad, Tudor Dragos Guta, Constrantin Petre
National Institute of Research and Development in Mechatreonics and Measurement Technique Pantelimon 6-8, sector 2, Bucharest, ROMANIA
ABSTRACT
This paper presents the actual status of snow cleaning robots, the main methods used in this field and architecture for an autonomous robot. As this robot navigates through unforeseeable space the sensoristic part is the most important part of this project. There are presented the sensors needed for moving, searching, control and detection accordingly to the plan action needed.
TYPES OF SNOW CLEANING ROBOTS
In the present time there are well know a multitude of snow cleaning methods, starting from the simple ones and already considered classics to methods that benefit from large technological development and apply new ideas, constructive solutions or innovative materials. There are two main generic families for cleaning the snow
-Mechanical methods – methods in which the snow is removed from certain spaces (streets, sidewalks, public squares) with the help of mechanical machines -Chemical methods – methods in which the snow is removed by applying different types of chemical substances that have a double role: melting down the snow and stopping the water from icing Mechanical methods for cleaning the snow
It can be observed that although the work methods and many of the mechanical execution elements can be found in many types of cleaning snow machines, there can be spotted differences regarding the type of action of this elements and the movement module:
• Manual • Electric • Internal combustion motors
Honda Model HS724TA

International Conference 2ND International Conference on Innovations, Recent Trends and Challenges
in Mechatronics, Mechanical Engineering and New High-Tech Products Development
MECAHITECH‘10
Bucharest, 23-24 September 2010
164
Taking notice of the operating possibilities there can be mentioned the following snow cleaning methods related to the type of the elements used to clean the snow
• Removing the snow by using cleaning razors and discharging the snow on the side of the road with shapes and ways to operate
• Removing the snow by using collecting mechanisms and discharging the snow on the side of the road
• Removing the snow by collecting and throwing it outside the useful space • Removing the snow by combing one of the two first presented methods and removing
the snow outside the useful space Cleaning the snow with mechanical methods presents a series of advantages:
• time needed for removing the snow reported to the quantity/area is much smaller than the chemical method therefore allowing faster resuming of the traffic
• quantity of removed snow is larger than in chemical methods • there are not needed preliminary or during the work preparations for
operations/devices • Access to snow areas/objectives is fast • This method doesn’t attack or chemical degrade the area in which the snow is placed
On the other hand the mechanical method also presents some disadvantages • Tools needed have high prices • Tools needed for removing the snow are actioned mostly by internal combustion
motors which consume petrol fuels • In the case of wrong manipulation of the device, the superficial layer of the area can
be affected mechanically • The snow removed from the street must be discharged in the closed proximity
therefore it can create problems related to limited access/blocking certain objectives on the sidewalk
• Maintenance of this devices requires a well organized space and certain condition during the time there are not used
Chemical methods for snow cleaning A chemical method represents the treatment of snow with certain chemical substance
in the area that needs to be cleared. These substances melt the snow (ice) and keep the water from icing
Methods can different by the nature of the substance that is used • Solid particles • Liquid solutions Similarly to mechanical methods also the chemical ones present a series of advantages • Low prices • There are not needed highly powered action motors • In general all the procedures are simple and the time needed for deploying chemical
substances is low • In the case of snowing forecast, the substances can be deployed before the actual
snowing therefore there are creating a environment in which the snow will melt immediately
• Many substances can be combined for better effects, like for snow melting and skid-proof effect Disadvantages for chemical methods:

International Conference 2ND International Conference on Innovations, Recent Trends and Challenges
in Mechatronics, Mechanical Engineering and New High-Tech Products Development
MECAHITECH‘10
Bucharest, 23-24 September 2010
165
• Time needed for snow melting is high and this method can not be implement for immediate effect
• Snowing quantity that is melt is less compared to the mechanical method • Losing of essential time due to recharging • Access to specified area could be difficult if the layer of snow is large • Ecological impact should be analyzed • The risk of effect/risk of decaying the area should be analyzed • The population should be warned about the possible negative effects
Autonomous cleaning robots
Autonomous robots are robots which can perform desired tasks in unstructured environments without continuous human guidance. Many kinds of robots have some degree of autonomy. Different robots can be autonomous in different ways. A high degree of autonomy is particularly desirable in fields such as space exploration, cleaning floors, mowing lawns, and waste water treatment. A fully autonomous robot has the ability to
• Gain information about the environment. • Work for an extended period without human intervention. • Move either all or part of itself throughout its operating environment without human
assistance. • Avoid situations that are harmful to people, property, or itself unless those are part of
its design specifications. An autonomous robot may also learn or gain new capabilities like adjusting strategies for accomplishing its task(s) or adapting to changing surroundings. Autonomous robots still require regular maintenance, as do other machines Plan acting and sensors for snow cleaning robots
A GPS sensor is placed on the robot allowing it to receive satellite signals. This is
used for orientation so as the robot will know the right path to follow and when it will the path finishes.
Compass sensor provides the direction to North. There are two types of compass sensors: magnetic and gyroscopic
- The magnetic direction sensors measure the Earth magnetic impact and extract the horizontal component to show the direction to North
- The gyroscopic direction sensors is made from a gyroscope who under the influence of gravity and Earth rotation shows real North direction Encoders are mounted on the wheels and it has the purpose to convert the rotation of the wheels in impulses
Work Mode Command Sensors used for the activity
1 Moving of the robot Motor
- direction sensors - GPS - Ballista detector sensors - Moment transducers

International Conference 2ND International Conference on Innovations, Recent Trends and Challenges
in Mechatronics, Mechanical Engineering and New High-Tech Products Development
MECAHITECH‘10
Bucharest, 23-24 September 2010
166
Work Mode Command Sensors used for the activity
2 Searching for snow Motor - direction sensors - temperature sensors - ultrasonic sensors network
3 Gathering snow control
- Motor - device for
gathering snow
- frontal bumpers for snow size detection and density - direction sensors - GPS -ultrasonic sensors network -Temperature sensors for live beings detection
4 Finishing work and returning
Motor
- direction sensors - GPS -weight sensors -sensors for altitude
In case of obstacle/ live person in proximity, the robot could take 3 decisions:
- STOP until the obstacle removes itself off the path (only for living beings)(A) - Obstacle avoidance (B) - Pursuing of another path (C)
In case of obstacle/ live person at a certain distance, the robot could take 3 decisions:
- STOP until the obstacle removes itself off the path (only for living beings)(A) - Keep walking until the obstacle is in proximity - Pursuing of another path (C)
The robot is in permanent contact with the dispatch for permanent knowing of location (for the case of stealing or aggression against) and also provided with a black box in witch all the operations should be stocked.
REFERENCES
[1] Everett H.R ,“Sensors for mobile robots” A.K Peters Ltd,1995
[2] Siegwart, R & Nourbakhsh, I , “Introduction to autonomous robots” ,MIT Press ,2004
[3] Fong, T & Nourbakhsh, I , “ Robotics and autonomous systems” ,Special issue on Socially Interactive Robots,2003
[4] Arkin, R.C , “Motor Schema-Based Mobile Robot Navigation” , The International Journal of Robotics , 1989

International Conference 2ND International Conference on Innovations, Recent Trends and Challenges
in Mechatronics, Mechanical Engineering and New High-Tech Products Development
MECAHITECH‘10
Bucharest, 23-24 September 2010
167
Pressure Regulators Performance For Pneumo-Electron ic Devices
Type’s Supplier Witout Wembranes For Dimensional Me asuring
Mircea Vladescu, Paul Ciprian Patic Valahia University of Targoviste,
18-24, Unirii Boulevard, targoviste, Romania, E-mail: [email protected], [email protected]
ABSTRACT
Performance of a gas pressure reducer or, generally, the performance of a device control are relate to the ability to operate the machine at their defaults parameters. The paper examines, briefly, the factors closely related with functioning capacity and default by performance of the pressure reducing for gases.
INTRODUCTION
In literature the performance of a gas pressure reducer or, in general, the performance of a control device, are relate to the ability to operate the machine at their defaults parameters.
The theoretical part of this problem have enough shortcomings, due to neglect influence, hard to assess without the help of experiments, of some factors involved in ensuring operational capacity reduction gears. The paper analyzed briefly the factors that most publications it considers, rightly, closely linked to ensure capability and hence, the performance of the gas pressure reducing devices.
THE STABILITY REGULATION
Reducing valves for gases must be meeting the insurance requirements of a predetermined precision value for the output pressure, which is the basic condition for which they are designed. Before commencing operation, the reducer must be so arranged that during operation to debit the agent at the required pressure. By adjusting of the gear means to ensure operation for a predetermined amount of output pressure p2, and the value p2pr for a variable input pressure and a predetermined consumption. When in the operating process of the gear, the exit pressure correction is impossible, the question of proper prior adjustments, gains particular importance.
Thus, determining the pR pressure adjustment, which is regulated output pressure at a given input pressure p1,0 and a particular debit Q0, and tuning gear to ensure reproducibility, are two major problems. Because as input the p1 pressure changes continuously during operation of the reducing and the gas consumption value Q0, at the regulation process does not necessarily coincide with the Q value of consumption during operation, then the pressure adjustment value, pR, may do not coincide with the default value, p2,pr, as output pressure.
Then, as the output pressure preset value p2pr, it takes a average value of pressure as

International Conference 2ND International Conference on Innovations, Recent Trends and Challenges
in Mechatronics, Mechanical Engineering and New High-Tech Products Development
MECAHITECH‘10
Bucharest, 23-24 September 2010
168
required output pressure, p2,pr,med, using a variation of input pressure from p1,max to p1,min. In conclusion, it is necessary that the reducer be adjusted so that the average value of the output pressure, during operation, is equal with the default value:
prmedpr pp ,2,,2 = (1)
in which:
∑=
=+++
=n
ii
nmedpr p
nn
pppp
1,2
,22,21,2,,2
1... (2)
where: n – is the number of the pressure measurements p2 as output p2, i – pressure value as output for different values of the p1 pressure as input, distributed uniformly over the whole range ∆p1 = p1, max – p1, min. The difference between the value of the preset output pressure p2,pr and the value of the adjusted value pR one notes with ∆ p, so that:
ppp Rpr ∆+=,2 (3)
If ∆p is determined for a certain class of gear is easier to set the pressure control value
pR who provide the preset pressure p2,pr required. However, as will be seen during the experiments, the value of ∆p affects a number of factors, among which:
- The unbalanced surface of a adjustment element; - The overall stiffness of a mobile system; - The gas debit Q0, which pass through the space between the regulation element
and the rolling gap; - The amount of loss coefficients of rolling gap, at the adjustment process and
during operation. All these factors will determinate the difference of value of ∆p for different gears from
the same design type. The verification of reproducibility can be executed after any adjustment period after adjusting gear. When performing the verification of the supply of reducer gas will run, as in the service (gradual or sudden supply) which should be mentioned in the technical product. To ensure the stability of control pressure pR, the gas flow adjusted the reducer, always be the same and must be sufficient to ensure the removal of the valve away from its seat. The adjusting of gear when the debit is zero or very low, is not allowed, because in the case of the seated valve, or nearly seated, on the output pressure p2 affect actual pressing force on the valve seat (force is needed to ensure the tightness of rolled edge), the quality of the seat surface of valve surface etc.
Thus, the pressure p2 as output when the debit Q vanish, is characterized more the degree of tightness of the valve, than the output pressure value which is installed once with the gear functioning of non-zero flow reducer. When seated valve, if exists a split, then the pressure p2 continues to increase to triggering the safety valve. Such a gear will work quite normal at a high enough gas flow that is away from the valve seat.

International Conference 2ND International Conference on Innovations, Recent Trends and Challenges
in Mechatronics, Mechanical Engineering and New High-Tech Products Development
MECAHITECH‘10
Bucharest, 23-24 September 2010
169
THE STABILITY OF A CHARACTERISTIC CURVES
The pressure stability control pR is not sufficient to ensure a predetermined output pressure p2,pr, for a pressure reducer. As shown in the next expression p2,pr = pR + ∆p, for p2,pr be stable, it is necessary that the size ∆p also be invariable, which means a stable feature of the reducer.
The characteristic curve on the whole service life of the gear must correspond with the original producing company indicated. Stability characteristic of a pressure reducer means that the values obtained on test stand checks conducted under the same conditions but at different time, coincide or observed differences do not exceed a permissible set. Stability characteristic of a gear depends, first, by the perfection of construction of gear, perfection which determines the constant character of friction forces.
Figure 1. Pressure reducer with elastic tube: R1, R2 – Inlet and outlet;
p1, p2 – Input and output pressure. At a variable amount of friction forces, provided that the adjustment screw position
remains unchanged and the temperature and gas pressure at the entry does not change, the output pressure varies from one test to another.
Partial replacement of sliding friction with the rolling one increased the stability of the gear but has a number of disadvantages to be mentioned later. The stability of a gear is influenced by item type sensitive gear using elastic tube as a sensing element (see Figure 1) with great stability, because the elastic tube as otherwise membrane (see Figure 2), does not introduce frictional forces as in the case of piston gear (see Figure 3).
The reduction gears ensuring stability issues were explored in a series of papers published in foreign papers studying the stability criteria depending on the construction parameters and operating conditions of gas pressure reduction gears.
In different researches is used analytical method based on mathematical models for reducing devices and on analysis based on modern theories in the field of automatic adjustment. The determination of the necessary and sufficient conditions for stability of steady reducer requires solving systems of equations that includes both parameters that characterize both flow and heat exchange character in gear and the influence of dry friction forces and lubricants.

International Conference 2ND International Conference on Innovations, Recent Trends and Challenges
in Mechatronics, Mechanical Engineering and New High-Tech Products Development
MECAHITECH‘10
Bucharest, 23-24 September 2010
170
Figure 2. Scheme of pressure reducer with membrane
R1, R2 – Inlet and outlet; p1, p2 – Input and output pressure.
Obtaining of values for the coefficients provided and applied to design a specific gear
can generalize the results because of corresponding experimental work. Lack of knowledge of these coefficients, for a new construction of a gear, preventing the widespread use and reliable design calculations because of substantial errors can occur. The instability problem still remains unresolved, self-oscillations of the systems that include reducing the pressure is a common phenomenon.
Fig. 3. Pressure reducer with piston
R1, R2 – inlet and outlet; p1, p2 – Input and output pressure.
SEAL TIGHTNESS OF THE VALVE
For a safe operation of the reducing valve, must be ensure a perfect sealing of the chamber board K1 with a high pressure, instead to a low pressure in chamber K2, which implies a perfect seal between the valve and its seat. The seal must be verified:
- For the spring gear, during the assembly process before the spring mounting and adjustment during operation when the arc adjusting is not compressed;
- For the gear controlled by pneumatic control, before the pressure supply of the

International Conference 2ND International Conference on Innovations, Recent Trends and Challenges
in Mechatronics, Mechanical Engineering and New High-Tech Products Development
MECAHITECH‘10
Bucharest, 23-24 September 2010
171
control room; - In the case when into the reduce pressure chamber K2 exist a maximum pressure,
for the reversing gear and minimum for the gear with direct stroke. When the gears fitted with reduction consumption is allowed a little gas escape when
the valve is seated, provided that the leakage flow is less than the flow that can pass through the consumer.
CONCLUSION
Project elaboration for a gas pressure reducer can begin only after a profound study of the whole complex of requirements and conditions that the device must meet.
When one opting for a constructive solution for the concrete conditions of exploitation, must be taken into account a number of issues that ultimately will determine the functional characteristics of gear.
For reducing valves that are part of command and control systems with high risk (aerospace, nuclear power) are crucially important in their design has the safe operation
Therefore, development of a construction of a gas pressure reducer may be initiated only after a profound study of the whole complex of requirements and conditions that the device must meet.
Neglect of one parameter can lead to unexpected disturbances for other parameters and functional appearance of unwanted and dangerous behavior.
Analyzing the imposed operating conditions and the deviations imposed of some parameters by the rules developed by CEN (Comité Europeéan de Normalisation), tried using some relationships which characterize the functional effect role that each element, it has over the performance of the machine and with aid of the different tests and checks on the evidence stands, the original implementation of technical solutions can enable the recruitment of all parameters of functional limitations and to avoid the disruption phenomena that affect all the device performance.
REFERENCES
[1] Burkhardt R. and Kizevetter V., Gas pressure Regulators, Moskow, 1962.
[2] Artemov P.V., Gas pressure regulators types, Moskow, 1974.
[3] Egorov V.K., Atomatic regulators theory, Publishing House „Energia”, Moskow, 1967.
[4] Vlădescu M., Research on optimizing the operation of safety valves of the pressure reducers, Jubilee Scientific Session, May 2002, Valahia University of Târgovişte.
[5] Vladescu M., Pressure Regulators, Publishing House „Cartea Universitara”, Bucharest, 2004.
[6] Armstrong-Helouvry, Brian, Stik-Slip Arisnif from Stribek Friction. I.E.E.E. Computer Society Press, Los Alamitos, California, 1990.
[7] General Catalog Pressure Test Equipment, WIKA, Germany, 2002.
[8] Catalog General Soudage Charledave, France, 1985.
[9] “Hydraulics and Pneumatics” 1997-1999, Magazine Collection.
[10] Olhydraulik and Pneumatick” 1998-2000, Magazine Collection.

International Conference 2ND International Conference on Innovations, Recent Trends and Challenges
in Mechatronics, Mechanical Engineering and New High-Tech Products Development
MECAHITECH‘10
Bucharest, 23-24 September 2010
172
The Intelligent Ways of Definition of Type of Defec t
at the Automated Ultrasonic Testing a Welded Seam
A. Tkachenko, V. Kirijakov - IC NDT Introscop S.A., 20, Mesterul Manole str., Chisinau, R. Moldova, MD-2044; [email protected]
ABSTRACT
The theoretical substantiation of an estimation of character of a reflecting surface of defect is resulted. The registered discrete set of casual amplitudes echo-signals is presented in the form of the correlation function having экспоненциальный character of attenuation. Correlation function is transformed to the form of a geometrical progression. On value of factor of attenuation, conditional duration exhibitors and a limit of the sum of a geometrical progression the estimation of character of a reflecting surface of defect that allows to raise reliability in definition of type of the defect revealed in a welded seam at the automated ultrasonic testing (AUST) of welded seams of pipes in a stream of manufacture is carried out. Constructive realization of the tandem-probe is resulted.
INTRODUCTION
The problem of definition of type of defect is considered the prof. V. Shcherbinsky with reference to conditions of the control of welded seams by means of manual flaw detectors [1 ]. The set of real defects is offered for distinguishing in the form of three types: plane, volume and volume-plane.
Cracks concern the plane, not welded in a seam and others. Slag inclusions, single time and porosity zones concern the volume. To volume-plane carry the defects, the reflecting which surface possesses properties
of volume and plane defects (not welded in a seam, dispersing cracks and others). Introduction computerized multichannel flaw detectors in processes of the automated
ultrasonic testing of a welded seam of pipes in a manufacture stream essentially increases possibilities of processing of a registered stream of casual amplitudes echo-signals. In the given work the theoretical analysis is made and the certain intellectual problems directed on definition of type of defect and characters of its reflecting surface are considered.
THE EXPERIMENT SCHEME
The scheme of placing a tandem-probe (TP), the welded seam of a pipe 3 intended for the testing, is represented on figs.1. TP consists of two combined inclined probe (are designated 1, 2), rigidly connected among themselves. The direction of radiation-reception both probe is focused perpendicularly axes of a welded seam. The distance between probe 1 and probe 2 depends on a thickness of a wall of a pipe. All electro-acoustic characteristics both probe should be identical.
The principle of job TP consists in the following. At the moment of time t = 0 both probes radiate under corner α in metal of a wall of a pipe a pulse beam of shift waves of ultrasound. The probing pulse radiated probe 2, after reflection from a smooth site of an

International Conference 2ND International Conference on Innovations, Recent Trends and Challenges
in Mechatronics, Mechanical Engineering and New High-Tech Products Development
MECAHITECH‘10
Bucharest, 23-24 September 2010
173
internal surface of a wall of a pipe and reflection from a surface of plane longitudinal defect (D) appears accepted probe 1.
In the beginning we shall consider a case of revealing of the plane longitudinal defect, reflecting which surface is parallel to an axial plane of a seam. The probing pulse radiated probe 1, after reflection from a surface of defect D and reflection from the same site of an internal surface of a wall of a pipe appears accepted probe 2. Both probe in a mode of reception are focused perpendicularly axes of a beam of the ultrasound reflected from defect D. In it the basic advantage testing a welded seam on a tandem to the circuit will consist.
Figs 1. The circuit of accommodation of the tandem - probe at the testing of a welded seam.
Time from the moment t = 0 till the moment of reception echo-signal probe 1 (we shall
designate t1) and till the moment of reception echo-signal probe 2 (we shall designate t2) is set by length of a way and speed of distribution of waves of ultrasound. On figs.1 it is visible, that both probing pulses pass the identical way designated by points a-b-c-d, i.e. t1= t2.
THE MATHEMATICAL SUBSTANTIATION OF WAYS OF DEFINITI ON SUCH AS DEFECT
At movement of a pipe concerning motionless TP the channel flaw detector accepts set echo-signals from defect of a seam. In a number of consecutive steps of recurrence of a probing pulse of amplitude accepted echo-signal (Аn) change in the casual image that is discrete stochastic function [2] takes place.
Аn = А(n Тp) (1)
where n = 1, 2,3 … nmax, and Тp - the period of recurrence of a probing pulse. Statistical parameters of function (1) are connected to character of a reflecting
surface of defect. Sequence Аn is the limited function as defects have the limited extent.
The mathematical expectation of estimation *m can be calculated under the formula
1
1∑max
*n
max
n
n=m = A
n (2)

International Conference 2ND International Conference on Innovations, Recent Trends and Challenges
in Mechatronics, Mechanical Engineering and New High-Tech Products Development
MECAHITECH‘10
Bucharest, 23-24 September 2010
174
The centrelocuted values of ( 0nA ) we shall calculate under the formula
( )0 *n nA = A - m (3)
On figs 2 the values sequence 0nA is resulted.
Figs 2. The values sequence
0nA .
Dispersion of sequence 0
nA we shall estimate under the formula
22
1
1∑max
* 0n
max
n
n=G = (A )
n (4)
And also an average square-law deviation
2* *G = ± G (5)
At normal distribution of probabilities 0nA , its mathematical expectation of estimation is equal
to zero [3], that is ≈* *-G +G .
In a case, when
0nA ≈ 1, то G*2 ≈ 0 (6)
The condition (6) is fair for the defect having a smooth and equal reflecting surface. In practice more often the condition (6) is not satisfied, hence, it is necessary to define character of a reflecting surface of defect.
Special interest is represented with autocorrelation function
( )1
1 τ
τττ ∑
max n
n
n -* 0 0
n n n+n=max n
R = A A-n
(7)
Where τn – shift of values 0nA on an axis nТp.
The size of displacement nτ ′ at which R*( nτ ) ≈ 0, it is equal to duration of function
(7), that is the current shift Тp represents a line of numbers: 0, 1, 2, 3 … n = nτ ′ . It is
expedient to use values Аn, which are in an interval from ( *m -3G*) до ( *m +3G*) [2]. At movement of defect of a seam concerning motionless TP the surface of defect is
irradiated with set of consecutive pulses of ultrasound and the set consecutive echo-signals

International Conference 2ND International Conference on Innovations, Recent Trends and Challenges
in Mechatronics, Mechanical Engineering and New High-Tech Products Development
MECAHITECH‘10
Bucharest, 23-24 September 2010
175
Аn is accepted. The rough reflecting surface results in easing time connection between values of sequence 0
nA .
Constructive realization TP in real conditions (figs. 3) Vyksa, Russia is introduced in installation НК360 into lines of the control of welded seams of thick-walled pipes of the big diameter on Open Society " VSW ".
Figs. 3. A fragment of the acoustic block of installation НК360 with the tandem-probe
at the testing of a welded seam.
For sequence of values of function (7) the inequality is fair
G∗2> R∗(τn=1)> R∗(τn=2)>…> R∗(τn)> R∗(τn+1)> …> R∗(τn max) (8)
The inequality (8), in effect, marks attenuation of correlation function which in sequence 0nA
considered by us occurs after an exhibitor. For definition of factor of attenuation exhibitors (。) it is enough to calculate value of function (7) at τn = 0, i.e. G∗2 and value at τn min = 1. We shall notice that for function (7) the condition is fair R∗(τn)> 0. It is possible to write down equality
( ) 21τ* * -α
n=R G = e (9)
Function (7) can be written down as
R∗(τn)=2 τn-α*G e (10)

International Conference 2ND International Conference on Innovations, Recent Trends and Challenges
in Mechatronics, Mechanical Engineering and New High-Tech Products Development
MECAHITECH‘10
Bucharest, 23-24 September 2010
176
Factor α is various for reflecting surfaces of various characters. Equal and smooth reflecting surfaces have small values α since the small disorder of values Аn takes place: in everyone new Тp the amplitude echo-signal differs from amplitude echo-signal in previous Тp a little. In this case values of sequence Аn are strongly connected among themselves that is all subsequent values are completely determined previous.
Large valuesαcorrespond to essentially rough reflecting surfaces: in everyone new
Тp new process of reflection of a probing pulse poorly similar to process of reflection in previous Тp takes place. It results in easing time connection of sequence Аn.
Taking into account, that R∗(τn) looks like fading exhibitors (10), we can define duration of autocorrelation function on correlation
( )3 - 5τ τ′ ≈ *n n (11)
Where 1τ α*n = / - a constant of time fading exhibitors in scale Тp..
CONCLUSIONS
1. At moving plane extended defect of a welded seam of a pipe concerning motionless TP in memory of a computer flaw detector the discrete final set of casual amplitudes echo-signals is remembered. The stated theory allows to develop corresponding algorithm of the program for a rating of character of a reflecting surface of defect and to identify the revealed defect from set of plane defects on type.
2. The indissoluble chain пор or slag inclusions on type is extended defect which are important for distinguishing from any plane defect (a longitudinal crack, not welded in a seam and others, etc.). Difference of plane defect from simply extended defect is carried out on value of the calculated parameters of correlation function of the accepted signals.
3. Application of the intellectual mathematical device in definition such as defect essentially raises reliability of the automated ultrasonic testing of welded seams of pipes in a stream of manufacture as a whole. REFERENCES: 1. Щербинский В.Г., Алешин Н.П. Ультразвуковой контроль сварных соединений. М.: изд. МГТУ им. Баумана, 2000. 496 с.[In Russian]. 2. Свешников А.А. Прикладные методы теории случайных функций.- М.: Наука, 1968.- 320с. [In Russian]. 3. Вентцель Е.С. Теория вероятностей.- М.: Наука, 1969.- 576 с. [In Russian].

International Conference 2ND International Conference on Innovations, Recent Trends and Challenges
in Mechatronics, Mechanical Engineering and New High-Tech Products Development
MECAHITECH‘10
Bucharest, 23-24 September 2010
177
Development of the Multidisciplinary Research Base in the Field of
Medical Nanorobotics in Romania
Mircea CopoŃ, Ioan Lung, Alexandru Moldovanu National Institute of Research and Development in Mechatreonics and Measurement Technique
Pantelimon 6-8, sector 2, Bucharest, ROMANIA
WHAT ARE NANOROBOTS?
Nanorobotics is a branch of robotics which refers, on the one hand, to the nanometric movement of certain parts of large or small size robots, nevertheless at millimeter scale, and on the other hand to the fact that, generally speaking, the respective robots have nanometric sizes, respectively less than 1 mm3.
Obviously, robots from the 1st category cannot be actually called nanorobots, while the robots from the second category are beyond any doubt nanorobots. Nanometric movements, or even technological nanometric realizations are part of what is now generally called nanotechnology.
The first logical step is to construct robots from the first category, and on the basis of the accumulated experience in this field to then construct robots from the second category, truly nanometric robots.
Nanorobots are generally regarded as those machines or devices of very small sizes which are capable of performing certain works in places which are inaccessible to humans because of the size of operation. Some authors have made a scholastic, theoretical classification of robots, based solely on the size criterion. In their opinion, the classification is the following:
Robots: with a volume of 1 m3 Minirobots: with a volume of 10-3 m3 = 1 dm3 Microrobots: with a volume of 10-6 m3 = 1 cm3 Nanorobots: with a volume of 10-9 m3 = 1 mm3,
Nevertheless, the engineering practice has shown that humans can construct even smaller-sized structures. Nowadays, structures which normally exceed the sizes of the above minirobots and can travel with nanometric accuracy are being constructed.
Moreover, fixed mechanical structures which are functional from the point of view of the electrical and software components, but also in domestic uses have been built. Their communication interface is presently higher than they actually are. They are the famous chips which are now found in all computers, mobile phones, TV sets, cars, etc. WHAT ARE NANOROBOTS USED IN MEDICINE
According to the previous data, these nanorobots should be mechatronic devices with a certain autonomy, which can be used in Medicine, for diagnosis and treatment purposes.
Obviously, they should be introduced in the human body to perform investigations or the necessary treatment.
Because the means of introducing them in the body are different, the types of nanorobots are also different. These means are:

International Conference 2ND International Conference on Innovations, Recent Trends and Challenges
in Mechatronics, Mechanical Engineering and New High-Tech Products Development
MECAHITECH‘10
Bucharest, 23-24 September 2010
178
-the digestive system; -the respiratory system; -the blood circulating system; -the lymphatic system; -skin, organ, muscle injection, etc.
THE CURRENT INTERNATIONAL CONTEXT At present, not even nanorobots that fall in the volume of 1 mm3 are being produced, but naturally, the plans and researches are much more advanced than production and there are current talks about projects of nanorobots capable of circulating through the capitally blood vessels, or whose sizes are close to that of regular cells and even of a certain bacteria or virus. Here are some examples of nanorobots proposed for medicine by various foreign specialists: SVIDINENCO YURIY Institute for Molecular Manufacturing (IMM) USA
ROCKY RAWSTERN Institute for Molecular Manufactur ing (IMM) USA

International Conference 2ND International Conference on Innovations, Recent Trends and Challenges
in Mechatronics, Mechanical Engineering and New High-Tech Products Development
MECAHITECH‘10
Bucharest, 23-24 September 2010
179
TIM FONSECA Institute for Molecular Manufacturi ng (IMM) USA
FIELDS INVOLVED IN THE RESEARCH OF NANOROBOTS FOR M EDICINE 1.Medicine (sets the needs, the design theme); 2.Mechatronics (tries to achieve the theme proposed by medicine) 3.Physics sets the physical limits, phenomena and laws which can be used for designing and building nanorobots. 4.Chemistry sets the chemical compatibilities between the nanorobot and the environment in which it works, namely the materials which can be used. 5.Communication allow the control of nanorobots. GENERAL DESIGN ISSUES
1. Engineering and technology are domains in which realistic ideas can surface in the physical world. The wildest ideals can be verified and confronted with the reality of the physical world only with the help of engineering and technology.
Engineering and technology are based on the laws of creation, namely on the laws of science, namely the specialists from these fields are prepared to bring to life ideas which can be materialized with the existing technologies at a specific time. They are the ones who can also make certain adjustments to make some ideas feasible, even if not in the form in which they were originally conceived.

International Conference 2ND International Conference on Innovations, Recent Trends and Challenges
in Mechatronics, Mechanical Engineering and New High-Tech Products Development
MECAHITECH‘10
Bucharest, 23-24 September 2010
180
All ideas, even unreal ones, can be verified and confronted with the reality of the physical world with the help of engineering and technology. Undoubtedly, at a certain time in history, only the ideas that used the proper technologies and engineering will be transposed into reality.
2. Nanorobots are merely at the stage of design. However, there are many concerns and achievements in the domain of nanotechnologies and nanostructures. By studying in depth the design issues and developing technologies of operation at nanometric scale, we will come across solutions to help us build these nanorobots. Perhaps they will not look as we imagine them today, perhaps they will not contain the components we imagine today, but we will find solutions to implement these ideas because of the permanent concern there is in this field.
At a molecular scale and, most of all, at an atomic scale, the laws of classical mechanics are obsolete, other laws are applied.
Like any device, or like any being for that matter, the nanorobot is made up of at least the following components:
-body or casing which helps protect everything there is inside and helps perform the movement in the target area.
-proper energy source, or the possibility to be connected to an external source of energy
-proper movement mechanisms -movement and positioning sensors -retaining systems at the place of operation (be careful not to confuse this term with
surgeries, it has a wider scope in the sense that it can be any work, manipulation) -driving systems at the place of operation -internal control system -communication system with the human operator -proper logic and proper software -coordination, control, centralized control system As any other device, or as any being for that matter, the nanorobot is made up of at
least the following components: - body or casing which helps protect everything there is inside and helps perform the
movement in the target area - proper energy source, or the possibility to be connected to an external source of
energy - proper movement mechanisms - movement and positioning sensors - retaining systems at the place of operation (be careful not to confuse this term with
surgeries, it has a wider scope in the sense that it can be any work, manipulation) - driving systems at the place of operation - internal control system -communication system with the human operator -proper logic and proper software -coordination, control, centralized control system
In conclusion, an ideal nanorobot should have the structure of a remote-controlled
submarine, or of a spaceship without a crew, to have at least the main functions of these complex machineries.

International Conference 2ND International Conference on Innovations, Recent Trends and Challenges
in Mechatronics, Mechanical Engineering and New High-Tech Products Development
MECAHITECH‘10
Bucharest, 23-24 September 2010
181
A nanorobot for medical interventions is mainly made up of: - insertion mechanisms where the intervention is made; - movement mechanisms; - power supply sources; - manipulators: with two or three arms; - fastening and apprehension mechanisms; - control systems: - protection and discharge systems from the operating areas. - communication systems with the environment - communication systems with the operator.
GENERAL ISSUES REGARDING THE USE OF NANOROBOTS IN M EDICINE
People must undergo these experiments. There are sufficient disoriented patients in the world who are willing to accept any
experiment, because they lack the proper judgment to understand what the matter with them is.
1. The current evolution of medicine is to a great extent due to the development of engineering and technology which have allowed, on the one hand, a thorough investigation of human bodies as a whole, and specifically of organs, tissues, cells, of secrets hidden in the cellular DNA. On the other hand, these have allowed the systematization of the information collected from medical practice. They will also allow the surface and development of nanostructures which revolutionize the medical technique.
2. Nanotechnology is no longer a fantasy as it was 30 years ago, it is a real fact proven by the development of data communication and techniques which are based on chips (integrated small and very small circuits). These types of cellular-sized chips can now store more information than computers could 20 years ago, which occupied entire rooms. Without nanotechnologies, these chips would not have been possible.
3. Nanorobots are still in the stage of design. There are still many concerns and achievements in the domain of nanotechnologies and nanostructures. There are many applications of nanotechnologies which allow the realization of millimeter- and even nanometrical-sized control and diving systems. In their turn, they can be starting points towards nanometric systems although such projects have been approached. The first achievements will obviously be shy and broad, but the future has many surprises in store. Only the experience gained can help us evolve.
4. Nanorobots used in medicine must be restricted by special conditions and have a special regime because they deal with human health. The skeleton diagram on the basis of which a nanorobot operates is illustrated below:
The doctor inserts the nanorobot in the target area of the patient’s body and he/she permanently monitors the nanorobot’s activity. The nanorobot has a software which allows doctor communication and which enables the nanorobot to make some action decisions within the limits given by the doctor or by the designer.
The nanorobot collects the necessary information

International Conference 2ND International Conference on Innovations, Recent Trends and Challenges
in Mechatronics, Mechanical Engineering and New High-Tech Products Development
MECAHITECH‘10
Bucharest, 23-24 September 2010
182
from the target area and commands the driving elements to act upon the affected tissue or cells from the patient’s body, according to the doctor’s instructions.
A power source is the autonomy of the nanorobot, and the casing ensures the integrity of the nanorobot. THE CURRENT PERFORMANCE OF MECHATRONICS IN THE FIEL D OF MECHANISM
MINIATURIZATION GEAR MECHANISM
To the left - micro-engine 230µm x 304µm (Courtesy CNRI MEMS Exchange). Another type of micro-engine (right), 304µm x 230µm (Courtesy CNRI MEMS Exchange). GENERAL MANUFACTURING ISSUES
In principle there are two important methods of manufacturing, the sculptor’s method and the painter’s method. The sculptor builds by demolishing what is useless, and the painter constructs piece by piece what he/she wants.
The sculptor uses a piece of stone from which he/she gradually removes what is unnecessary, so that only the statue remains of the initial semi-finished product, a statue that existed only in his/her mind. This process is based on mechanical, coarse principles. The sculptor’s technology starts from something large and coarse, unfinished and moves towards something small and finished.
On the contrary, the painter uses another procedure. He starts from an uniform canvas but well-prepared, on which he/she places drop by drop the colors he/she wants and where he/she wants, in order to transpose the work he had in mind.
The painter’s technology starts from something small and delicate moving towards

International Conference 2ND International Conference on Innovations, Recent Trends and Challenges
in Mechatronics, Mechanical Engineering and New High-Tech Products Development
MECAHITECH‘10
Bucharest, 23-24 September 2010
183
something large and finished to the last detail. ISSUES REGARDING THE DEVELOPMENT OF THE MULTIDISCIP LINARY RESEARCH BASE IN THE FIELD OF MEDICAL NANOROBOTICS
The multidisciplinary research base in the field of medical nanorobotics is made of:
medical units, hospitals, polyclinics
research contracts mechatronic research institutes
MATERIAL BASE SPECIFIC EQUIPMENT
SPECIALISTS: Researchers, Doctors, Biologists, Physicians, Chemists, Assistant chemist
SPECIALISTS: Researchers, Engineers, Physicians, Chemists, Technologies, Technicians
MATERIAL BASE SPECIFIC EQUIPMENT
THE TASKS OF MEDICAL UNITS, as BENEFICIARIES of the RESEARCH
IDENTIFYING THE NEEDS OF MEDICINE IN THE FIELD OF MEDICAL NANOROBOTICS
ELABORATING RESEARCH THEMES
TESTING EXPERIMENTAL MODELS
PROPOSALS FOR IMPROVING EXPERIMENTAL MODELS
TESTING PROTOTYPES
PROPOSAL OF IMPROVEMENT OF PROTOTYPES
USING MEDICAL NANOROBOTS IN MEDICAL PRACTICE
TRAINING SPECIALISTS IN THE FIELD OF MEDICAL NANOROBOTIC RESEARCH
FURTHER TRAINING OF SPECIALISTS IN THE FIELD OF MEDICAL NANOROBOTIC RESEARCH
SCHOLARIZATION OF SPECIALISTS WHO WILL ACTUALLY WORK IN THE MEDICAL ACT, in POLYCLINICS, HOSPITALS or SPECIALIZED MEDICAL UNITS

International Conference 2ND International Conference on Innovations, Recent Trends and Challenges
in Mechatronics, Mechanical Engineering and New High-Tech Products Development
MECAHITECH‘10
Bucharest, 23-24 September 2010
184
ETHICAL, MORAL ISSUES AND THE NEED FOR WISDOM
Ethics and morale are historical variables which have changed throughout centuries. They are set according to the minds of the ruling people, who set up and impose certain rules that human society must abide by, but the role of tradition is not irrelevant. Life has shown that society, pressured by other factors, particularly economic factors, has always changed the rules of conduct against the conservatory nature of ethics and morale.
These changes are more visible in the current period, in which every generation has a different set of rules of moral conduct.
An ethical issue that might arise is that there are people who are likely to refuse these interventions in their body, which is similar to their attitude towards transfusions. This is a personal issue and each person is responsible for its own deeds. Nevertheless, this technique will give this variant of intervention with nanorobots.
Another ethical issue is the use of humans as guinea pigs, often without their knowledge or permission, for testing drugs as well as food, vaccines, chemical and biological weapons etc. How else could we explain the fact that strictly specialized institutes that appeared overnight from unknown funding sources, make experiments, in obscure conditions on small groups of patients and volunteers (20-40 persons), on short periods of time of a few years, for different treatments, and on the basis of the conclusions made they introduce on
THE TASKS OF THE MECHATRONIC INSTITUTES AS DESIGNER S AND MANUFACTURERS OF MEDICAL NANOROBOTS
DESIGNING MEDICAL NANOROBOTS
MANUFACTURING EXPERIMENTAL MODELS
SCHOLARIZATION OF SPECIALISTS WHO
PRODUCE NANOROBOTS FOR
MEDICINE
FURTHER TRAINING OF SPECIALISTS IN
THE FIELD OF MEDICAL
NANOROBOTICS
TRAINING SPECIALISTS IN THE FIELD OF MEDICAL NANOROBOTICS
TESTING THE EXPERIMENTAL MODELS
DESIGNING PROTOTYPES OF MEDICAL NANOROBOTS
MAKING PROTOTYPES OF MEDICAL NANOROBOTS
TESTING PROTOTYPES OF MEDICAL NANOROBOTS
PREPARING THE MANUFACTURING BASE OF MEDICAL NANOROBOTS

International Conference 2ND International Conference on Innovations, Recent Trends and Challenges
in Mechatronics, Mechanical Engineering and New High-Tech Products Development
MECAHITECH‘10
Bucharest, 23-24 September 2010
185
the pharmaceutical and medical circuit very expensive drugs manufactured only by large pharmaceutical groups in the detriment of traditional treatments proven for hundreds or thousands of years which are practically within everybody’s reach. Their transience, the fact that they are every time replaced with more reliable and more expensive drugs, and people fall ill and die in the same rhythm or in a more accelerated rhythm, show us how efficient there treatments actually are. EFFICIENCY ISSUES
The issue of efficiency from an economical point of view, as well as from the viewpoint of using the existing resources, is a more and more pungent issue in any field.
Perhaps it is sometimes better to pay for certain studies only to be sure if it is worth investing in a particular field or not.
We all know that after Pasteur saw the first microbes under a microscope, everybody started blaming the microbes for all the possible illnesses. A forceful battle began against microbes, but scientists have not yet been able to fully destroy them, on the contrary they have diversified them. Then, humans discovered viruses and a similar campaign was conducted against them as well, with the same results. Then bacteria were discovered and the campaign repeated itself with the same results.
Here and there, people keep saying that we will never destroy these micro-beings and, what is more, many of them are in symbiosis with the human body, and their disappearance would implicitly lead to the disappearance of human beings.
All viruses and microbes adapt to the environment, all the more so, to evolved beings. Therefore any attempt to destroy viruses or microbes is a losing battle. It only leads to their diversification, which increases their force of adaptation and of survival. Look at medicine’s failure to eradicate flu or any other contagious disease. There are apparent breakthroughs with certain illnesses, but these illnesses have disappeared not because they were defeated by medicine, but because the human living conditions have changed, and because man adapted to a life with viruses and microbes. These have always existed in all known forms of life.
The scientist will always be at least one step behind nature which he will never succeed in subduing. The only result is cohabitation. EFFICIENCY ISSUES • Another issue under discussion is whether or not it is more effective, practically and
economically speaking, to operate on the immune system that protects us from viruses, microbes, diseases, rather than invest in creating technologies and devices meant to cure us of new diseases.
• Will new artificial microbes that scientists want to achieve, respectively nanorobots, generate defense reactions in the human body from the part of the human body as well as from the part of viruses, bacteria and microbes we want them to destroy? The most likely answer is “Yes”.
• Before seriously investing in the construction of nanorobots for medicine, perhaps it is better to conduct a study to see if investments in the disease prevention activity are more profitable than disease curing investments.
• On the other hand, we must find out how much of the progress made in the domain of

International Conference 2ND International Conference on Innovations, Recent Trends and Challenges
in Mechatronics, Mechanical Engineering and New High-Tech Products Development
MECAHITECH‘10
Bucharest, 23-24 September 2010
186
health is a result of the progress of medicine and how much it is a result of the growth of the living standards of the population.
• To correct these studies, they must be conducted by specialists outside the medical or pharmaceutical system.
• Here, we will be confronted with the strong opposition of drug companies which have become international corporations with fabulous profits, of hospitals in which large investments were made and of specialists already trained and accustomed to a certain train of thought. But the result could be a large economy of financial and human resources, and also a better health for the population.
• The fact that doctors themselves are infected with all the illnesses that affect the rest of the population could be an indicator that the present medicine is not on the right path. If they cannot solve their problems, how can we possibly solve ours? On the other hand, it is good to know if there are people who seldom or never go to the doctor and live happily ever after. How do doctors explain these cases?
• As we can see the issue of investing in the design, manufacturing and use of nanorobots in medicine is extremely delicate, and very expensive. This is why it requires a high degree of attention.
• Nevertheless, no matter to what conclusions we will reach regarding the appropriateness of these investments, the research in this field will bring significant results in other domains. This will not reduce our degree of alertness, and to be certain we will raise the following questions:
• Who needs a cane? A person with locomotory problems! • Who needs glasses? A person who has an impaired sight! • Who needs a hearing apparatus? A person with hearing problems! • Of course, the string of questions could go on and on and the conclusion would be
that an impaired person needs some sort of apparatus. If we look closer at ourselves, we see that we all use machines and equipment, so we all are in a way impaired. It is only natural! Man has not reached its maximum evolution possibilities. The brain contains large capacities still not used.
• Another aspect of the medical issue is the fact that the same illness can be cured by various procedures.
• The first variant chosen by people that connect to the environment and perceive it more through its mechanical parts, which can be seen moving, is a mechanical intervention: a massage or even a surgery.
• People who are more subtle, starting from the idea that man is what he eats (and partially they are right) use as treatment, food and/or drugs, plant, fruit extracts, teas, etc.
• The more advanced and subtle are the ones that use acupuncture, magnetotherapy methods, etc.
• The more subtle ones understand that our desires can keep us alive or extend our life and so they look for different pleasures, because we are what we want as well.
• Another category has reached the conclusion that mentally one can solve any problem because we are also what we think. All these procedures work well up to a certain point, irrespective of the illness we have. We also need something else to cure and this is will, and man is to a certain extent what he wants to be. Will makes us follow the chosen treatment, irrespective of the treatment, and to conclude them: to

International Conference 2ND International Conference on Innovations, Recent Trends and Challenges
in Mechatronics, Mechanical Engineering and New High-Tech Products Development
MECAHITECH‘10
Bucharest, 23-24 September 2010
187
healing or to death. • There are also biotherapists, healers (not to mention crooks who are present
everywhere), who work subtly, but after addressing them we become as dependent on them as we become of drugs.
• We observe that of all the available option, man can choose the specialists whom they trust according to the spiritual level. That is why there are all these types of treatments, because they are all necessary.
• Of all these procedures, the coarsest and the mechanical and chemical ones, but they are absolutely necessary in cases of acute crisis or accidents.
• In this wide array of treatment options which sometimes can be used in parallel, the issue at hand is to choose the most effective treatment.
• Now that we have a general view of the possibilities available for solving human medical problems, let us imagine where would the use of nanorobots fit and we will better understand what we have to do or which is the best development direction.
• Obviously, the best solution is the one which operates at the highest level, because a high level can always control a lower level. Then what is the scale of values for all the therapies mentioned?
• Seemingly with the power of the mind we can control our desires. Will is superior to thought.
SOME GENERAL POSSIBLE CONCLUSIONS
1. Human imagination is unlimited, but not all we can imagine is feasible. The limits of human thought is fixed only by each person’s thinking, by the limits that each of use sets for himself/herself. it is a different story how we attain these thoughts or ideas and this depends on the observance of the laws of nature. Poets and artists are the best known dreamers, but often their dreams cannot be transposed in the physical world. The physical world is the only world in which one can check the correctitude of human thought. Engineers, because of their very nature and education, can easily see what is attainable and what is not.
Humans are capable of bringing new ideas in any field of knowledge. But not always these new ideas are true, and take shape in the real world.
Some cannot take shape because not all the conditions for their fulfillment are met, therefore they are realistic, but there are many ideas which cannot take shape because they are completely unreal, they do not meet even the most elementary laws of organization of the matter, respectively they are fantastic ideas, fabrications of an autistic mind.
2. Everything man has created and can create starts from the elements that exist in nature, using the energies that exist in nature. What differs is the way they are combined.
Man did not create and cannot create matter or energy as such, but he succeeded to use some of their shapes and to transform them according to the social needs from different historical periods. Even if some will reply that people have created the atomic, nuclear energy, a concrete analysis will show that these energies existed in nature, so man did not create them only released them from certain structures, or transformed them from one shape to another, preexisting in nature.
3. People can use matter according to the laws of nature. Even if the robot has sensors that sense another close presence, even if they are equipped with extremities or body made of more resistant materials than flesh and capable of exerting forces which exceed the forces of living beings of the same size, even if they are equipped with the most complex computer,

International Conference 2ND International Conference on Innovations, Recent Trends and Challenges
in Mechatronics, Mechanical Engineering and New High-Tech Products Development
MECAHITECH‘10
Bucharest, 23-24 September 2010
188
providing artificial intelligence, even if it can move in different environments, even if it has will power (artificial, that is induced or integrated in a software) this will power will not belong to the robot but to the human being who created it. It will act according to the design and strictly within the limits dictated - if no defects, wear etc. appear, which disturbs or modifies and finally destroys the respective robot. .
4. The current medicine relies to a great extent on the development of engineering and technologies which have allowed, on the one hand, a more thorough investigation of human bodies, organs and tissues, cells, DNA secretes in particular, and on the other hand, have allowed the systematization of the information collected from medical practice. All this progress will also lead to the apparition and development of nanostructures which will revolutionize medical technique.
Medicine can use nanorobots, as it currently uses more and more sophisticated and advanced equipment such as electrical recorders, nuclear magnetic resonance, ultrasound etc. The doctor will introduce the nanorobot in the target domain from the patient’s body and the doctor will permanently monitor the activity of the nanorobot. The nanorobot of the future will have a software that will allow the communication with the doctor and at the same time enabling him to make decisions within the limits given by the doctor or by the designing engineer.
The nanorobot collects the needed information from the target area and according to the doctor’s decision commands the driving elements to intervene on the damaged tissues or cells from the patient’s body.
The field of nanorobotics is very ample and needs an interdisciplinary approach of several domain of knowledge such as: medicine, computing technique, mechatronics, integronics, particle physics, atomic and molecular chemistry, technology, design.
By all means, research studies for the manufacturing of nanorobots for medicine will implicitly lead to the clarification of several medical issues, related to several illnesses, the interaction between humans and its creations up to a cellular level, the compatibility of certain materials with the cellular world, the compatibility of certain materials with microbes, bacteria, viruses, beneficial, healing combinations or even aggravating combinations for various illnesses.
But the field of medicine will not be the only field in which the consequences of these studies will surface. Basic sciences such as: Physics, Chemistry, Biology and Informatics will acquire new knowledge because of these studies.
Nanorobots are a peak of the future nanotechnology. They are attainable only through nanotechnologies. How useful they can be is another issue we hope to clarify at a given time.
If nanotechnologies are useful and will completely change the artificial world created by humans, nanorobots are a world which will actually help us learn something.
5. The most advanced studies from any field are not posted on the INTERNET, they are classified.
6. In Romania, the research in this field is currently confined to documentaries and training specialists. Maybe soon we will be able to import specialized equipment.
REFERENCES: [1] The study “Development of the multidisciplinary research base in the field of medical
nanorobotics in Romania”, conducted by INCDMTM, within the programme CAPACITIES II, based on the contract 199/2008

International Conference 2ND International Conference on Innovations, Recent Trends and Challenges
in Mechatronics, Mechanical Engineering and New High-Tech Products Development
MECAHITECH‘10
Bucharest, 23-24 September 2010
189
[2] General issues regarding the design and manufacturing of nanorobots used in medicine, Authors: from INCDMTM Bucharest,
[3] Accomplishments and perspective in the field of nanorobotics Authors from INCDMTM Bucharest, MECAHITECH 2009, Bucharest, 8-9 october 2009
[4] Manual of technology foresight drafted by the United Nations Industrial Development Organization-UNIDO) and published in Vienna in 2005 Vol 1 and 2
[5] New Dimensions for Manufacturing A UK Strategy for Nanotechnology by Dr. John M. Taylor, President of the Group of Approval of the United Kingdom in the Applications of Nanotechnology Lordului Saintbury, Ministry of Science and Innovation.
[6] Springer Handbook of Nanotechnology, Bhushan Editor
[7] Robert Freitas Jr., Senior Research Fellow, Institute for Molecular Manufacturing, Nanomedicine, Volume I: Basic Capabilities Volume IIA, Volume IIB, Volume III, 1999

International Conference 2ND International Conference on Innovations, Recent Trends and Challenges
in Mechatronics, Mechanical Engineering and New High-Tech Products Development
MECAHITECH‘10
Bucharest, 23-24 September 2010
190
Study on the Creation of a Robotic Manipulator wit h an Electromagnetic Gripping Device
Andrioaia Dragos Rotar Dan Vasile Alecsandri University 600184, Bacau, Romania
[email protected]; [email protected]
ABSTRACT
The paper presents the authors’ approach on the design, the construction and the operation of the mechanical structure, the operation and the control of an anthropomorphic robot with four degrees of freedom + electromagnetic gripping mechanism used in handling metal objects. This robot was designed and tested in the digital electronics laboratory of the "Vasile Alecsandri" University, Bacau.
INTRODUCTION
The paper presents the authors’ approach on the design, the construction and the operation of the mechanical structure, the operation and the control of an anthropomorphic robot with four degrees of freedom + electromagnetic gripping mechanism used in handling metal objects. This robot was designed and tested in the digital electronics laboratory of the "Vasile Alecsandri" University, Bacau.
The movement of the three axes is achieved by three DC servo motors which operate three kinematic joints. The servomotors are controlled by an electric block.
The control system consists of a PC that runs in parallel with a computer system in real time, a type of microcontroller of PIC family, part of the electrical block. The electrical block is connected to a PC via a serial cable. The means of communication of the user with the system is through a graphical interface that allows user input of data acquisition such as the positioning coordinates of the gripping or resistive element, the activated or nonactivated state . According to the user input, the program running on the computer calculates angles that the three servo motors must perform according to the plan. The results will be sent to the PIC type system via computer with a serial transmission.The PIC system converts the data received in the form of binary pulses required by the control of the DC servomotors.
THE ESTABLISHMENT OF THE KINEMATIC STRUCTURE ACCORD ING TO THE WORKSPACE
Generally, moving an object from one position to another, in three-dimensional space, can be achieved by six independent rotational movements. Choosing the kinematic structure of each robotic arm is partly based on the application which will be implemented. In order to project a robotic cell for educational purpose, it has been chosen a Kinematic type structure

International Conference 2ND International Conference on Innovations, Recent Trends and Challenges
in Mechatronics, Mechanical Engineering and New High-Tech Products Development
MECAHITECH‘10
Bucharest, 23-24 September 2010
191
(RRRR), anthropomorphic robot [2]. The robotic arm position is determined by the coordinates: nX nY nZ .
The workspace of the robot is spherical and it is determined by the length of the
elements that are part of it . The robot is composed of three servomotors which execute the rotational motion of the elements that sustain them, and the fourth kinematic joint executes an angle which is tangent to the plan of the element which it operates. The kinematic scheme presenting the construction of the robot arm design is located in Figure 1 [2].
Figure 1: The kinematic scheme of the robot
The variables used to build the manipulating robot in order to obtain the workspace
calculation are: measures of the elements ( 0l , 1l , 2l , 3l ) which are connected by kinematic
joints ( 1A , 1A , 2A , 3A ), angles between the elements ( 1α , 2α , 3α , 4α ) which are supported
by kinematic joints, positions ( 0X 0Y 0Z …… 4X 4Y 4Z ). Depending on the coverage of the
desired workspace, the sizes chosen for the elements were: 0l = 130 mm, 1l = 100 mm, 2l =
130 mm, 3l = 10 mm.
THE DETERMINATION OF THE ANGLES 1α 2α 3α , DEPENDING ON THE COORDINATES OF THE MANIPULATED ELEMENT
The determination of the angles depending on the coordinates of the manipulated
element can be achieved with a method developed by Denavit-Hartenberg, Lee and Siegler [2], [1].

International Conference 2ND International Conference on Innovations, Recent Trends and Challenges
in Mechatronics, Mechanical Engineering and New High-Tech Products Development
MECAHITECH‘10
Bucharest, 23-24 September 2010
192
Figure 2: The decomposed kinematic scheme
Since 0 1A A || 3MA are perpendicular on the plan, one can simplify the system (Figure
2) in the form of '0 3 0l l l− = , resulting that '
0 130 10 120l = − = (Figure 3), which will not affect
the final result (Figure 2) reducing the writing of the equation for a kinematic joint( 3A ). As a
result, one can write as it follows: '3 4X X= , '
3 4Y Y= , '3 4Z Z= .
Figure 3: The decomposed kinematic scheme, simplified
The matrix of the homogeneous transformation A between the three joints will be:
0 1 ' 2 '
3 1 0 1 2 1 2 3 2 3( , )* ( , )* ( , )A R Y R Z R Zα α α= (1)

International Conference 2ND International Conference on Innovations, Recent Trends and Challenges
in Mechatronics, Mechanical Engineering and New High-Tech Products Development
MECAHITECH‘10
Bucharest, 23-24 September 2010
193
1 1 1 1
1 1 1 101 0 1 '
0
cos 0 sin 0 cos 0 sin 0
sin 0 cos 0 sin 0 cos 0( , )
0 1 0 0 1 0 120
0 0 0 1 0 0 0 1
R Yl
α α α αα α α α
α
− − = =
(2)
1
2 2 1 2 2 2 2
2 2 1 2 2 2 21 '2 2
cos sin 0 cos cos sin 0 100cos
sin cos 0 sin sin cos 0 100sin( , )
0 1 1 0 0 1 1 0
0 0 0 1 0 0 0 1
l
lR Z
α α α α α αα α α α α α
α
− − = =
(3)
2
3 3 2 3 3 3 3
3 3 2 3 3 3 32 '3 3
cos sin 0 cos cos sin 0 130cos
sin cos 0 sin sin cos 0 130sin( , )
0 1 1 0 0 1 1 0
0 0 0 1 0 0 0 1
l
lR Z
α α α α α αα α α α α α
α
− − = =
(4)
Furthermore, applying the method used by Denavit-Hartenberg, Lee and Siegler and
replacing '3 4X X= , '
3 4Y Y= , '3 4Z Z= , will determine the values of the three angles: 1α 2α 3α .
1 4 4 4 4[ tan( , ), tan( , )]Arc X Y Arc X Yα π= + (5)
A multiple solution has resulted for 1α , out of which the less difficult solution will be
chosen, as described below:
1 4tan( )Arc Xα = (6)
2 2 2 2 2 2 224 4 4 4
3 2 2 2 2
( 120) 130 100 ( 120) 130 100tan 2 , 1 [ ]
2*130 *100 2*130 *100
Y X Y XArcα − + − − − + − −= ± − (7)
Similar with the determination of 1α , there is a multiple solution for the determination
of the angle 2α . In the end, the easiest solution will be chosen, as described below:
2 2 2
4 43 2 2
( 120) 130 100tan 2[ ]
2*130 *100
Y XArcα − + − −= (8)
2 4 4 3 3tan( , 120) tan 2(130* ,230* )Arc X Y Arc Sin Cosα α α= − − (9)
Out of which, the easiest solution will be chosen :

International Conference 2ND International Conference on Innovations, Recent Trends and Challenges
in Mechatronics, Mechanical Engineering and New High-Tech Products Development
MECAHITECH‘10
Bucharest, 23-24 September 2010
194
2 4 3tan tan 2(130* )Arc Y Arc Sinα α= − (10)
THE COMMAND OF AN ACTIVATION MODULE
The servomotors which have been selected are the GWS-3400 type(Figure 3) and have the characteristics described in the table below:
Table 1: The characteristics of the servomotors Size 35/16,9/32 mm Weight 24,3 degrees Speed 0,19 degrees/sec Torque 3,4 Kg/cm Angle of rotation 180 degrees
Figure 4: Outlook servomotors Figure 5: Servomotor PWM timing diagram
The command of the servomotors is made with a pulse duration of a logical signal between 1-2 ms, proportional to the angle’s value to be executed, also being refreshed every 18 ms. A change in the number of degrees that are intended to be performed by the axis of the servomotor in the duration of the actuating pulse is presented in the relation 13, figure 5:
0,0055n m= ∗ (11) Where: 1≤n≤2 (12) 0≤m ≤180 (13) n = the duration of the appropriate pulse at m degrees m= the value in degrees

International Conference 2ND International Conference on Innovations, Recent Trends and Challenges
in Mechatronics, Mechanical Engineering and New High-Tech Products Development
MECAHITECH‘10
Bucharest, 23-24 September 2010
195
THE PHYSICAL IMPLEMENTATION OF THE ROBOT
The design of the robot complies with the kinematic scheme established in chapter no.2 and it is presented in (Figure 6) [4]:
Figure 6: Manipulating robot THE IMPLEMENTATION OF THE ELECTRIC MODULE
The diagram according to which the electric module was created is presented in Figure 7. As shown in Figure 7, the entire system is composed of the following blocks: interface with the user (the PC), control system (power module), the system which operates the kinematic joints which is represented by the three servomotors, the electromagnetic driving system (gripping device).
Figure 7: The scheme-block of the electrical circuit

International Conference 2ND International Conference on Innovations, Recent Trends and Challenges
in Mechatronics, Mechanical Engineering and New High-Tech Products Development
MECAHITECH‘10
Bucharest, 23-24 September 2010
196
The diagram of the electric module is presented in Figure 8. As it can be observed, it is composed of the following circuits:
- The supply circuit which is supplied with a tension of 8 VDC and, at its turn, the circuit will supply the control and driving circuits with a tension of 5 VDC [6];
- The control circuit which is represented by a microcontroller of the PIC family(PIC16F83) which receives the signal from the PC, interprets it and, afterwards, it controls the driving circuits from the servomotors and from the electromagnet [5];
- The control circuits of the servomotors and of the electromagnet [3]; - The circuit which receives the data to the microcontroller through the serial interface
RS-232 of the PC [5].
Figure 8: The electrical scheme
THE EXECUTION OF THE PROGRAM
In order to activate the robot command, we need to conceive two programs: - The implementation of the interface program with the user(Figure 9) which allows
data acquisition from the user, interprets the data and transmit it through the serial interface of the PC to the control system of PIC type;
- The design of the program running on the microcontroller PIC16F83, program which will be used to retrieve data from the PC, interpreting it and commanding the three servo motors and also commanding the electromagnet which attracts the metallic objects.
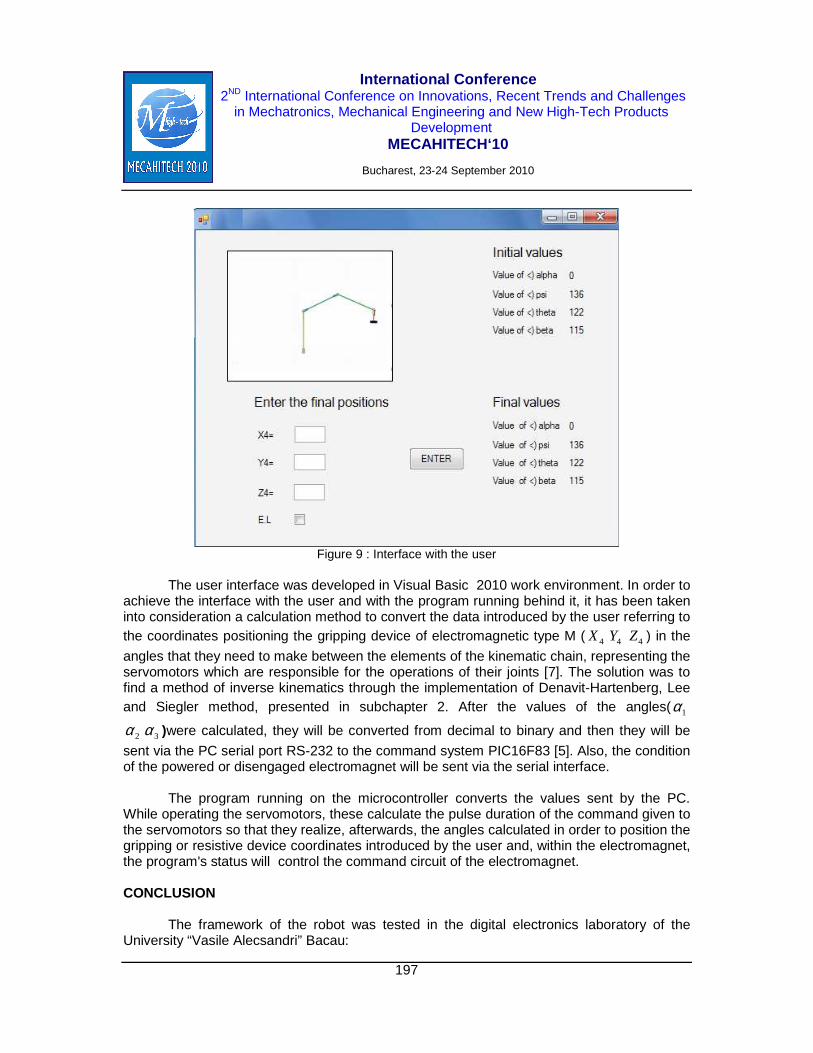
International Conference 2ND International Conference on Innovations, Recent Trends and Challenges
in Mechatronics, Mechanical Engineering and New High-Tech Products Development
MECAHITECH‘10
Bucharest, 23-24 September 2010
197
Figure 9 : Interface with the user
The user interface was developed in Visual Basic 2010 work environment. In order to
achieve the interface with the user and with the program running behind it, it has been taken into consideration a calculation method to convert the data introduced by the user referring to the coordinates positioning the gripping device of electromagnetic type M ( 4X 4Y 4Z ) in the
angles that they need to make between the elements of the kinematic chain, representing the servomotors which are responsible for the operations of their joints [7]. The solution was to find a method of inverse kinematics through the implementation of Denavit-Hartenberg, Lee and Siegler method, presented in subchapter 2. After the values of the angles( 1α
2α 3α )were calculated, they will be converted from decimal to binary and then they will be
sent via the PC serial port RS-232 to the command system PIC16F83 [5]. Also, the condition of the powered or disengaged electromagnet will be sent via the serial interface.
The program running on the microcontroller converts the values sent by the PC. While operating the servomotors, these calculate the pulse duration of the command given to the servomotors so that they realize, afterwards, the angles calculated in order to position the gripping or resistive device coordinates introduced by the user and, within the electromagnet, the program's status will control the command circuit of the electromagnet. CONCLUSION
The framework of the robot was tested in the digital electronics laboratory of the
University “Vasile Alecsandri” Bacau:

International Conference 2ND International Conference on Innovations, Recent Trends and Challenges
in Mechatronics, Mechanical Engineering and New High-Tech Products Development
MECAHITECH‘10
Bucharest, 23-24 September 2010
198
- Angle of the rotation of the element 0l 180 degrees;
- Angle of the rotation of the element 1l 180 degrees;
- Angle of the rotation of the element 2l 180 degrees;
- The maximum incidence of 230 for positioning the load handled; - The maximum incidence for positioning the load handled; - The maximum admitted weight of 300 grams; - The total weight of 300 grams of the robotic arm; - The speed of rotation of the elements 0l , 1l , 3l = 0,5 rot/sec
The space is limited by the fact that the servomotors from the kinematics joints cannot
perform angles greater than 180 degrees. REFERENCES
[1] Stan Gibilisco „Concise Encyclopedia of Robotics”
[2] J. Angeles „Rational Kinematics”
[3] Bolton Addison Wesley „Electronics in products and processes”
[4] Auslander and Kempf Prentice Hall „Mechatronics System Design”
[5] Rotar Dan „Microprocessors”
[6] Rotar Dan „Electronica digitala”
[7] Thearon Willis and Bryan Newsome „Microsoft Visual Basic 2010”

International Conference 2ND International Conference on Innovations, Recent Trends and Challenges
in Mechatronics, Mechanical Engineering and New High-Tech Products Development
MECAHITECH‘10
Bucharest, 23-24 September 2010
199
Use of Linear Motors in Complex Mechatronics System s of Control
and Positioning of High Precision
Iulian Vasile, Alexandru Constantinescu National Institute of Research and Development in Mechatreonics and Measurement Technique
Pantelimon 6-8, sector 2, Bucharest, ROMANIA
Electric driving elements are a distinct category of elements that are used in
mechatronic systems for high precision positioning, dimensional micro and nano-control, part of this category being as well as sevomotors and actuators for the control of the displacement. Due to the extremely broad scope of applicability of these systems, the number and variety of manufacturers and market products they offer are also as generous as that belonging to companies like ALLEN - BRADLEY, ANORAD BODY., Aerotech, Bald, DANAHER MOTION or FANUC - USA BOSCH - REXROTH, SIEMENS, MOELLER, Lenz and EUROTHERM - Germany ABB - Switzerland, Leroy Somer and SCHNEIDER ELECTRIC - UK, YASKAWA, OMRON, Mitsubishi Electric Corp.. and Matsushita Electric Industrial - Japan, etc. All these companies fall into the category of international firms, each with production units in many countries and representatives covering the entire world.
Of all electrical drive components made by these companies we will focus on the electric linear actuators applications, which, thanks to new manufacturing technologies, reached such operating performance so they forced the manufacturing of mechatronic systems where high accuracy positioning is required, and also in dimensional micro and nano-control.
Many companies previously listed as producers of sensors and transducers, guidance elements or electrical driving elements, are simultaneously system integrators, the wide range of products which they have expand cover also dimensional the micro and nano-control. Some companies such as ANORAD Corp., AEROTECH, BALDOR, YASKAWA, DANAHER offer for sale linear motors of high precision, translation and rotation units in simple or complex structures of two or more axes, fully equipped and with operational resolution and accuracy that can reach values of nanometers or even tenth of nanometers.
Thus firm Aerotech manufactures linear actuators such as the LMA series (Fig. 1, 2) acting with linear actuators and noncontact encoders, with resolutions ranging between 1µm and 10nm, displacement speed
Fig.1 Fig. 2

International Conference 2ND International Conference on Innovations, Recent Trends and Challenges
in Mechatronics, Mechanical Engineering and New High-Tech Products Development
MECAHITECH‘10
Bucharest, 23-24 September 2010
200
of max. 5m / s with accelerations that can reach the value of 5g and for lenghts up to 1000 mm, which can be used independently or in complex systems with one or more axes; also we can remember linear tables ALS1000 series (Fig. 3), ALS5000 (Fig. 4), ALS20000 (Fig. 5), or ALS25000 (fig. 6), whose max. loading capacity may be of 135kg,
Fig.3 Fig. 4 Fig. 5 Fig. 6 for a lenght up to 1000 mm, with 1µm positioning accuracy and sub-micron resolution, driven by linear actuators and able to be used in combinations of two or more axes; gazostatic tables ABL1000 series (Fig.7), ABL2000 (Fig. 8) ABL8000 (Fig.9), ABL9000 (Fig.10), whose
Fig. 7 Fig.8 Fig. 9 Fig. 10 travels can reach 1200 mm are also driven by linear actuators, positioning accuracy reaches 0,2 µm, repeatability of 50 nm, for resolution of 2nm or 0.062nm for ABL1000 model; vertical positioning tables ANT4V type ( Fig.11), AVL125 (Fig.12) or AVL1000 (Fig.13) are made for a travel between 2 mm and 25mm, for weights
Fig.11 Fig. 12 Fig. 13 between 4 and 50 kg and resolution which can reach 2 nm and accuracy of 200 nm; complex systems type Gantry series AGS10000 (Fig.14), ABS10000 (Fig.15), AGS1000 (fig.16) and AGS20000 (Fig.17 ) with positioning accuracy of several micrometers, equipped with high precision encoders wich makes them available for resolutions of 1µm up to 5nm ,

International Conference 2ND International Conference on Innovations, Recent Trends and Challenges
in Mechatronics, Mechanical Engineering and New High-Tech Products Development
MECAHITECH‘10
Bucharest, 23-24 September 2010
201
Fig. 14 Fig. 15
Fig. 16 Fig.17 being designed for speeds up to 3 m / s at maximum acceleration of 3g, the permissible load is 15 kg up to 84 kg, and travels up to 1200 mm; all these are used in high-performance applications in the fields of industrial robots, fiber optics and photonics, visualization systems, precision assembling, laser equipment and semiconductors, microelectronics, space technique and many other similar domains. Among the products of the company ANORAD Corp. let us remind the translation units of type LW10 and LW7 (Fig.18), ICON150 (fig.19), Anoride T (Fig.20)
Fig. 18 Fig. 19
Fig. 20 Fig. 21

International Conference 2ND International Conference on Innovations, Recent Trends and Challenges
in Mechatronics, Mechanical Engineering and New High-Tech Products Development
MECAHITECH‘10
Bucharest, 23-24 September 2010
202
or Compact series (Fig.21), whose resolutions reaches, for some models, the value of 4 nm, for better positioning accuracy of 0.5 µm and can be used in more complex configurations of axes; the rotary tables series DDR and GR -XA (Fig.22), are made for accuracy between 0.2 arcsec and 2 arcmin,
Fig. 22
being driven by DC brushless servomotors or with stepper motors and manufactured in various dimensional types; the complex systems series Gantry Hercules (Fig.23), is made for movements in two
Fig. 23
coordinates having travels between 250 mm and 650 mm, being driven by linear actuators with linear encoder which may have resolutions of up to 0.5 µm, maximum load of 20 kg on the moving head; systems consisting of more than two axes such as XY Theta (Fig.24), XYZTheta (Fig.25), or six-axis (Fig.26), with resolutions
Fig. 24 Fig. 25 Fig. 26

International Conference 2ND International Conference on Innovations, Recent Trends and Challenges
in Mechatronics, Mechanical Engineering and New High-Tech Products Development
MECAHITECH‘10
Bucharest, 23-24 September 2010
203
up to 1 nm and speeds exceeding 1 m / s; series of such products may continue, the number of applications developed by this company is high and of an impressive diversity. DANAHER company has in its product list numerous and varied range of mechatronic systems for positioning and dimensional micro and nano-control for most diverse applications. So, the two coordinates gazostatic guided tables (Fig.27) driven by linear motor
Fig. 27 Fig. 28
have 1 nm resolution and accuracy of ± 1µm to 25mm; the rotary tables from Micro-Theta 5 Series (fig.28), with working dimensions of 88 x 54 x 20 mm, has a resolution of 0.4 arcsec and a rotational speed of 360 ° / sec; translation units MAB - 100 (fig.29), with airbearings and driven by linear actuators,
Fig. 29
have resolutions between 1µm and 0.0052 µm, accuracy better of 1µm, the travel being within 100 mm and maximum load capacity of 2.5 kg; XY-Theta positioning systems (fig.30), or the XYZ-Theta (fig.31) can
Fig. 30 Fig. 31

International Conference 2ND International Conference on Innovations, Recent Trends and Challenges
in Mechatronics, Mechanical Engineering and New High-Tech Products Development
MECAHITECH‘10
Bucharest, 23-24 September 2010
204
be delivered for the linear displacement resolution better than 1µm, and better of 1arcsec, for accuracies of less than ± 5µm, respectively under ± 20arcsec; large positioning systems Gantry type (fig.32, 33)
Fig. 32 Fig. 33 generation 6 and 7, or fixed portal type positioning systems (fig.34, 35), are highly complex equipment, some having the movements
Fig. 34 Fig. 35 made with gazostatic guides and linear actuators driven; positioning accuracies and resolutions are of micrometers, as it is the axis travel straightness; a very precise equipment is the Positioning Interferometric System (Fig. 36), which, for control of
Fig. 36

International Conference 2ND International Conference on Innovations, Recent Trends and Challenges
in Mechatronics, Mechanical Engineering and New High-Tech Products Development
MECAHITECH‘10
Bucharest, 23-24 September 2010
205
the linear movements, is equipped with a laser interferometer, positioning accuracies and resolutions are of 0.1 ppm. Introducing this kind of mechatronic products could continue, DANAHER product range is much larger, we presenting some significant dimensional micro and nano-control equipment.
Electric linear actuators have, as said, a wide range of applications, equip a wide range of high precise movement systems for microelectronics, micro and nanotechnology, in the fields of applied physics, biology, medical science and genetics, in aviation and space technologies, etc., areas where is necessary to achieve accuracies values of micro- and even nano-meters. Approach by the romanian specialists to the mechatronic systems domain for dimensional micro- and nano-control, volumetric micro- and nano-positioning is extremely useful in order to maintain contact with the latest achievements in the field worldwide and for developing in our country of such systems with a wide range of application in industry and research.

International Conference 2ND International Conference on Innovations, Recent Trends and Challenges
in Mechatronics, Mechanical Engineering and New High-Tech Products Development
MECAHITECH‘10
Bucharest, 23-24 September 2010
206
The Technical Impact of the New Generation of Digit al Electronic Tachographs According to the European Directives
Stefan Vaduva ; Gh.Ion Gheorghe
National Institute of Research and Development in Mechatreonics and Measurement Technique Pantelimon 6-8, sector 2, Bucharest, ROMANIA
The new generation of digital electronic tachographs for vehicles used for the
transportation of people and goods was the result of a technical necessity caused by the following main factors:
The extraordinary development of the road transportation in the last two decades The higher level of technical performance of vehicles The accuracy of long-term monitoring road transportation parameters The management of the car fleet by transportation companies The higher number of road accidents affecting approx. 1% of the GDP of the
European Union. The main technical requirements (parameters) which will be presented in parallel, if
necessary, compared to the generation of analogue electronic tachographs recording on the diagram, which still exists on vehicles, downloading external data.
The rectangular apparatus ( acc. to Fig. 1)– must be compatible with a speed indicator and a mileage counter and must have the main functions for the measurement of circulation parameters (speed, space, time, monitoring the activities of the car driver and its companion), data storage, digital display and printing the parameters on papers for the traffic control authorities, downloading external information (data) .
Fig.1
With reference to its construction, the apparatus includes: an impulse speed transducer,
an electronic signal processing unit from the speed transducer, a card reader, an internal memory, a real time clock (day time), interfaces for special cards and for external data
Cancel button
Display Enter button
Printer
Driver’s card 1
Navigation Buttons
Activity Selecting Buttons
Driver’s Card 2

International Conference 2ND International Conference on Innovations, Recent Trends and Challenges
in Mechatronics, Mechanical Engineering and New High-Tech Products Development
MECAHITECH‘10
Bucharest, 23-24 September 2010
207
downloading, visual warning device, printer. Special cards (4) enable data downloading for:
Operators of car fleets through the company card designed to protect the data of the transportation company and which can also download the memory of the card drivers’ activities for an optimal management of the car fleet.
Driver’s cards, customized, with the possibility of storing the drivers’ activities for the last 28 working days, remaining in the driver’s possession (the car driver’s card).
The control authorities, during the circulation or parking of vehicles, through the control card, which can download and store the data about the circulation parameters and about the controlled vehicle
Authorized motor service shops: service card protected by a PIN code and used for the calibration of the tachograph.
The cards mentioned must be compatible with all types of digital tachographs produced and issued by competent authorities from the EU member states.
TECHNICAL REQUIREMENTS FOR THE SPEED MEASUREMENT AN D THE INTERNAL MEMORY STORAGE
If more than 1 impulse every 5 seconds is recorded, the vehicle is considered in motion. Otherwise, the vehicle is considered parked.
Measurement range: 0 ÷ 220 km/h Measurement accuracy: ±1 km/h for speeds between 20 and 180 km/h, at a constant
speed under laboratory conditions (compared to ± 3 km/h at analogue electronic tachographs)
Display resolution: 1 km/h Internal memory storage every day, every 1 minute, displaying the date and time with
a 1 km/h resolution.
The technical requirements for the measurement of t he covered space and memory storage
The covered space will be measured only for forward running. Measurement range: 0 .........9.999.999,9 km Measurement accuracy: ± 1% in laboratory conditions Display resolution: 0,1 km Internal memory storage of the covered space every day, every 1 minute with a 1 km
resolution.
Technical requirements for time measurement and mem ory storage
The time measurement is constant, with the display of the date, time and minute. Measurement accuracy: ± 2 sec/day in laboratory conditions compared to ±2 min/day
for analogue electronic tachographs. The possibility of adjustment to the local time with a half an hour incremental (time zone gap) and of constant adjustment of the date and time.
The time measurement should not be affected by a power failure of 12 months,

International Conference 2ND International Conference on Innovations, Recent Trends and Challenges
in Mechatronics, Mechanical Engineering and New High-Tech Products Development
MECAHITECH‘10
Bucharest, 23-24 September 2010
208
compared with analogue electronic tachographs which did not measure time during the power failure.
Memory storage with a 1-minute resolution.
Technical requirements for monitoring the car drive r’s activity and memory storage
The tachographs must be equipped with a keyboard that allows the car driver to manually select the activity by specifying the date and time. If the vehicle is in motion, the driving activity will be automatically selected for the car driver and availability for the companion, irrespective of the manual selection of the car driver. The device must highlight the “crew” driving state when two car-driver cards are inserted or the “safe” driving situation when a single card is inserted. The change of the car driver’s activity must be stored in the memory in 1 minute. An important technical requirement with consequences on the road security is to warn the car driver 15 minutes before and when exceeding the continuous driving time of 4 hours and 30 minutes. The warning period must be of at least 30 seconds. The warning will be audio, visual or simultaneously audio and visual on the device screen or simultaneously audio and visual.
Other important requirements mentioned in the Europ ean Directive The internal memory must have a storage capacity of at least 1 year for the storage
of the following main data: o 6 cycles of insertion, removing the car driver’s card per day, respectively
93.440 per year. The experience shows that there are less daily changes of activity– an average of 90 changes of activity.
o the identification data of the tachograph o the data regarding the introduction and removal of cards by specifying the
date and time o the data regarding the transit parameters (speed, space, time, car driving
activities) o the date and time of the data transfer
Card data storage – car driver : • date and time of the card’s insertion • the distance covered/day and the mileage of the vehicle at the insertion of the
card • the car driver’s activities, changes of activities and transit parameters
This data must be stored for the last 28 days. Monitoring the introduction and removal of cards:
checking the validity of the card (of the card code) removing the card only when the vehicle is stopped if no card is inserted, only the data regarding the car driver’s activity for the
last 8 days can be downloaded. The data download option must be restrictive.
Detection of abnormal events : o expired card o introducing another card when the car driver is driving o power failure from the vehicle accumulator for more than 200 milliseconds

International Conference 2ND International Conference on Innovations, Recent Trends and Challenges
in Mechatronics, Mechanical Engineering and New High-Tech Products Development
MECAHITECH‘10
Bucharest, 23-24 September 2010
209
o incorrect signal (form and altitude) from the transducer (defective transducer) o speeding (exceeding the admitted legal speed on parts of the road which can
be detected according to the destination of the route according to the recording – storage – of the speed of the vehicle and time)
o detecting the maximum and average circulating speed of the vehicle. Printing a document at the request of the competent traffic control (minimum data
from the central - internal memory and from the car driver’s card): time data : day, month, year, hour, minute total duration of the continuous driving activity and distance total duration of the stationing period total duration of the crew’s activity abnormal events
The sizes of the characters on the paper document: at least 2,1 x 1,5 mm The document must allow a special space for handwriting.
Displaying on the device screen : at least 20 characters (minimum character size 5x3,5) to accept Latin characters display: local time, date, the activity of the card driver and of its companion display the continuous driving time and of the break time display a warning for the continuous driving activity
The display must have an access menu and a non-weary light. The screen display must also allow the use of icons. The basic icons symbolize:
the card driver’s card the car driver’s activity equipment : card reader , clock, transducer, printer driving mode (crew, single) abnormalities: deficient transducer , deficient or expired card
Calibration The device must allow the easy adjustment of the numeric constancy W (number of
impulses per kilometer) to the similar constancy of the vehicles on which the it will be mounted, in all the existing ranges (4.000 – 25.000 imp/km). The manufacturer of digital electronic tachographs calibrates the product at a certain constancy value W and, when the device is mounted on the vehicle the constancy must be adjusted to the value thereof (W) calculated for a sample road, which depends, among others, on: the size of the tires, the air pressure of the tires, the transducer’s characteristic, etc. The device is made of materials with stable electrical and magnetic properties, the degree of protection is IP 40, respectively IP 64 for the transducer which is mounted on the gear box and functions at the parameters set in the temperature range
(- 20;+70)C0 , respectively (- 40 ; +135)C0 for the transducer.
The new generation of tachographs is more than 80% different from a constructive and functional point of view from the previous generation of electronic tachographs with analogue display, preserving the basic functions of the tachographs (irrespective of the generation) of measuring and recording the vehicles’ driving parameters (speed, space, time, car driver’s activities) recorded because of the current technical progress (e.g.: a switch from the analogue electronics to digital electronics) adding other additional functions.

International Conference 2ND International Conference on Innovations, Recent Trends and Challenges
in Mechatronics, Mechanical Engineering and New High-Tech Products Development
MECAHITECH‘10
Bucharest, 23-24 September 2010
210
It is remarkable that such a leap was made from recording parameters on the diagram (which encountered measurement difficulties and a relatively high measurement uncertainty compared to the admitted errors) to recording (storage) on the special cards mentioned and in the internal memory of the device with an extension of the time interval to one year (internal memory) compared to max. 7 days for the previous generation and with an easy downloading based on a PC software. The impulse transducer mounted on the gear box is equipped with a “chip” for storing the information about the tachograph used for the last connection, to remove the possibility of unauthorized replacement thereof by other persons than the persons from the service shops approved by the manufacturer (in the specialized literature the term “intelligent” transducer is used). Taking into account the high technical performances of measuring the driving parameters and the totally different monitoring activity, we can see the need of certain universal control equipment for highly accurate tachograph, respectively of specialized equipment that verify the technical requirements of storing data in the internal memory or on the special cards and the downloading of this data.
With respect to the control procedure respectively the homologation of digital electronic tachographs, we distinguish the following controls (trials), aside from the laboratory tests:
Control of the device on the board of vehicles Control of the speed transducer Card control Control of the interoperability (the device and the transducer are two
distinctive elements from the point of view of control). Control the information security of the transducer and of the cards
The control of the device on the board of the vehicle mainly consists of the following trials:
Introduction and removal of cards Measurement of the speed, space, time and driver’s activities (essential
parameters) Automatic switch to the driving activity Manual data insertion Detecting abnormal events (abnormalities) Identification data of sub-groups Mileage data Data regarding the calibration of the W constancy Data download (output) Card recording and storage Display screen Time adjustment Absence of interferences of additional functions (for example the consumption
measurement function)
Control of the speed transducer: Transducer identification data Measurement accuracy, including the sensitivity threshold - the minimum
number of impulses issue when the vehicle is in motion

International Conference 2ND International Conference on Innovations, Recent Trends and Challenges
in Mechatronics, Mechanical Engineering and New High-Tech Products Development
MECAHITECH‘10
Bucharest, 23-24 September 2010
211
Card control – aside from the ones controlled on board of the vehicle, the following additional tests are made:
Normal operation within the limit conditions according to ISO / CEI 10373
Correct downloading of the data stored, after the card was previously loaded with this data, using a special device (not through a tachograph)
For the type homologation of the device, the following must be checked: the
temperature, the humidity, the sinusoidal and random vibrations, shocks , the degree of protection, over-voltage, polarity reversal, short-circuit, electromagnetic compatibility (electrostatic discharge, radio-electric disturbances) according to the CEI and ISO norms.
The control of the interoperability between the transducer and the device mounted on board is recommended but it is not mandatory, if the device was homologated at the same time with the transducer, and in this case the transducer’s homologation is approved.
The implementation of the European Directives in EC member states and states which have signed the European Road Traffic Agreement – AETR includes :
Harmonization of the national law in the field of car, goods and personal road
transportation with the above directive and with the further norms issued by EC The existence of competent authorities in every country issuing compliant specialized
cards in all EC The provision of specialized equipment to competent road traffic authorities and training
the personnel at a nationally-authorized training center. The existence of authorized service shops equipped with the control infrastructure and
qualified personnel The elaboration of methodological norms of controlling digital electronic tachographs and
the existence of metrological laboratories taking into account the fact that the device is metrological which needs to be checked every 2 years
Furthermore, the transportation companies which are interested in an active management of their car fleet need specific equipment and qualified personnel.
Regarding the harmonization of national laws to the European Directives, in France
there is an independence criterion according to which the bodies authorized to install and control the device cannot own (manufacture) control devices and their main activity must not be connected to the road transportation or vehicle trading.
Therefore, it was approved that, starting from 2007, the ECmember states and states which signed the European Road Transportation Agreement – AETR – (Romanian signed the agreement in 1994) accept digital electronic tachographs for new registered vehicles.
Consequently, there is a period of transition in which analogue tachographs with registration on diagram and new generation tachographs will simultaneously operate.
It must also be mentioned that the states outside the EC (for example the US states) accept the use of classical tachographs (including electrical-mechanical ones) without any interdiction, but we assume that in the future we will promote the technical progress imposed by the new generation, which ensures a high degree of security in road traffic.
The constant concern for a higher security in road transportation has led to the implementation of a package of EC measures – in 2009 – of equipping low tonnage vehicles with devices for registering the activity of professional car drivers.

International Conference 2ND International Conference on Innovations, Recent Trends and Challenges
in Mechatronics, Mechanical Engineering and New High-Tech Products Development
MECAHITECH‘10
Bucharest, 23-24 September 2010
212
Some Aspects Regarding The Simulation Of Injection Process
Teodor Daniel Mindru1, Ciprian Dumitru Ciofu2 & Dumitru Nedelcu2
1 SC CADWORKS International SRL, Romania, Tel.: 0040754884478, Email: [email protected],
2 Universitatea Tehnica “Gheorghe Asachi” din Iasi, Bd. Mangeron nr. 59A, 700050 Iasi, Tel.: 0040232217290, Fax: 0040.232.217290,
Email: [email protected],
ABSTRACT
The paper presents the simulation of injection process for obtaining one piece from a polymer material using the specific software. The simulation take into consideration one research plan with two factors and five levels for each of them, as follow: melting temperature of material and mould temperature. Are presented the following results: fill time variation based on injection pressure, flow front temperature and cooling time variation.
INTRODUCTION
The term polymer is derived from the Greek's poly and meros meaning many parts. Some prefer the term macro molecule or large molecule.
There are many ways to measure the importance of a specific discipline. One is to consider its pervasiveness. Polymers serve as the basis of life in the form of nucleic acids, proteins and polysaccharides. They permit replication, energy transformation, transmission of foods within plants and animals, act as essential natural building materials,
Polymers are Involved in all of the major new technologies including synthetic blood and skin; computer chips, CDs, liquid crystals, and circuit boards-information visualization, storage and retrieval; energy ere a lion, storage, and transmissions (portable electrical power, batteries), efficient, light, and low-emission transportation; high temperature superconductors; medicines, targeting and control of drug delivery, and synthetic limbs and other replacement parts; transportation; space craft; solar and nuclear energy; and photonics (optical fibers).
The mono-component injection process has more applications such as in automobile industry, computer industry and in different pieces for household use. Thus, there could be obtained mono-component pieces such as: planes, cylindricals, with surface inscriptions, decorative effects and so on.
Precision injection imposes compliance of some compulsory conditions regarding the adjusting of the processing parameters in a certain order and rigorous control of processing conditions.
Plasticization takes place due to the heat transfer from the cylinder wall of the machine to the plastic material and to the friction heat from the material inside. This heat transfer transforms the grains in melted material. Plasticization is significantly influenced by the cooling time which, if it is reduced, leads to the decreasing of the temperature of the plastic material and if it is increased leads to large variations of the temperature of the plastic material, in relation to the adjusted value [1].
Mould filling is the process step with an important role in the accuracy of the injected

International Conference 2ND International Conference on Innovations, Recent Trends and Challenges
in Mechatronics, Mechanical Engineering and New High-Tech Products Development
MECAHITECH‘10
Bucharest, 23-24 September 2010
213
part. This can influence both the temperature of the melted material and the macro-molecular structure of the part. Through mould filling the plastic material passes from the stationing area of the injection machine to the interior of the mould [3].
Further on, the melted material must be compacted because the thermoplastic materials have a smaller specific volume at the processing temperature than at the environmental temperature. So, compaction implies the introduction of a supplementary quantity of melted material in the mould cavity.
Cooling process needs a relative large time, considering the conductivity of the thermoplastic materials. So, the increase of productivity imposes adoption of measures to decrease cooling time.
Final step of the cooling consists in beginning the opening of the mould, simultaneously with the beginning of the de-molding process.
In figure 1, the geometrical transposing of the physical model for the injected part is presented with gate location.
Fig. 1. The geometrical transposing of the 3D physical model
PREPARING THE SIMULATION PROCESS. RESULTS AND DISCU SSIONS. The injected part must be constructively transposed starting from the physical model.
For numerical representation of the injected part, the following problems must be solved: piece geometric analysis concerning the complexity and the optimal point between injection time and the melting temperature.
In figure 2a it is presented the specific volume vs temperature and in figure 2b it is presented the viscosity of used material. It was used the plastic material Vectra A950, with the following properties: elastic modulus 14500 MPa; Poison ratio 0,359; shear modulus 5340 MPa; melt density 1,4641 g/mm3; solid density 1,6188 g/mm3; thermal conductivity 0,19 W/mK; specific heat 2230 J/KgK.

International Conference 2ND International Conference on Innovations, Recent Trends and Challenges
in Mechatronics, Mechanical Engineering and New High-Tech Products Development
MECAHITECH‘10
Bucharest, 23-24 September 2010
214
Fig. 2a. Specific volume vs. temperature Fig. 2b. Viscosity
There were five simulations whose results are presented in Table 1. Table1. Results of simulations
Temperature [oC] Injection Time
[s]
Injection Pressure
[MPa]
Filling Clamp Force [tons]
Clamp Force Area [cm2]
Cycle Time
[s]
Maximum Wall Shear
Stress [MPa] Mould Melt
90 320
0,41
7,77 1,8
15,36
15,4 0,51 95 310 10.73 2,46 10,4 0,56
100 300 14,3 3,21 15,4 0,63 105 290 19.8 4,36 10,4 0,86 110 280 26,53 5,89 10,4 1,28
In figure 3 it is presented the flow front temperature resulted from the five simulations.
As we can see the front temperature decreases with decreasing mold temperature.
Fig. 3. Flow front temperature

International Conference 2ND International Conference on Innovations, Recent Trends and Challenges
in Mechatronics, Mechanical Engineering and New High-Tech Products Development
MECAHITECH‘10
Bucharest, 23-24 September 2010
215
In figure 4 it is also presented the cooling time variation resulted from the five simulations. As we can see cooling time variation decreases with decreasing melt temperature and higher mold temperatures.
Fig. 4. Cooling time variation
In figure 5 it is also presented the injection pressure resulted from the five simulations. As we can see injection pressure increases with increasing mould temperature.
Fig. 5. Injection pressure

International Conference 2ND International Conference on Innovations, Recent Trends and Challenges
in Mechatronics, Mechanical Engineering and New High-Tech Products Development
MECAHITECH‘10
Bucharest, 23-24 September 2010
216
In figure 6 it is presented the skin orientation.
Fig. 6 Skin Orientation
CONCLUSIONS
The purpose of this simulation is to find out if we can obtain a complex piece of high
precision having an imposed material and modifying the entry details regarding the fabrication process.
The main objective behind the piece injection process consists in obtaining the high precision of the piece and the full filling of the mold. There could be observed filling time is constant, injection pressure varies only along with material and mold temperatures.
The cooling time variation is similar for the five simulations, so we may consider that each input parameter level is optimum to obtain a high quality piece and mould full filling.
We can see cycle time is smaller for simulations 2, 4 and 5 which will lead to and increase production efficiency while having approximately the same precision of parts.
For all five simulations landmark result as accuracy of part is good then the difference between mold and melt temperature is high.
REFERENCES
[1] Fetecău, C., Aspecte reologice la prelucrarea materialelor plastice prin injectare.
Faza de umplere, Review Plastic Materials, Bucharest, 42(4), pp.291-293 (2005). [2] Pillet, M., Introduction aux plans d’experience par la methode Taguchi, Clamency,
(1997). [3] Stan, D., Tulcan, A., Tulcan, L., Iclănzan, T., 2008, Influence Factors on the
Dimensional Accuracy of thePlastic Parts, Review Plastic Materials 45 (1), pp. 119-124 (2008).
[4] Şeres, I., 1996, Injectarea materialelor plastice, Imprimeria de Vest Publisher, Oradea (1996).

International Conference 2ND International Conference on Innovations, Recent Trends and Challenges
in Mechatronics, Mechanical Engineering and New High-Tech Products Development
MECAHITECH‘10
Bucharest, 23-24 September 2010
217
Use of Flexural Hinges in the Design of Terrestrial Telescope
Karolina Macuchova, Josef Zicha, CSc. et al.
Czech Technical University in Prague, Faculty of Mechanical Engineering, Department of Instrumentation and Control Engineering, Division of Precision Mechanics and Optics
Technická 4, Prague, Czech Republic, [email protected], [email protected]
ABSTRACT
In this work, we propose the use of flexural hinges as a solution to be used in a drive unit for leading a telescope. Purpose of an extended study is to design a special transportable terrestrial telescope for observing the eclipse of the Sun and acquiring images of the solar corona. The images are acquired sequentially by seven independent cameras with lenses conjoined to one tube. The lenses are led by the rotating polar axis drive. Accent is placed on these features: precision of the fluent rotation leading at low speeds, easy transportation of the whole system, possibility to quickly change the position of the tube of the telescope, possibility to interfere by subtle pointing moves into the main drive unit and mainly takes in focus the point of high rigidity of the construction. This project brings desired features of the device by using the flexural hinges to assure precision of the drive leading. From the point of a kinetic chain we used custom designed six-ray-joint serially connected to the main worm drive. Precision of this unit is solved by the worm supported in the bearings INA NKIB 5908. The directional precision along with the high rigidity is guaranteed by application of the bearing THK RU 178 (G). Pointing moves or traction are enabled by another two flexural hinges, which, according to the data gained from the incremental rotation device, compensate the remnant inaccuracies of the drive.
INTRODUCTION
Developments of new mathematical methods for image analysis encourage hand-in-hand improvement of the hardware design. Professor RNDr. Miloslav Druckmüller, DrSc. has developed a unique method to visualize the Solar corona. The method is based on tens or hundreds of photos, each taken with a different exposure settings, which are merged together using a special computer algorithm. The result image provides a view of all important structures of the Solar corona such as coronal loops, transients, holes and other. These structures reflect topology of the magnetic field of the Sun.
Total solar eclipses are rare at any particular location on the Earth. The next eclipse can be observed on November 13, 2012. The eclipses duration starts in few seconds to up to seven minutes, during which the images to be processed by the algorithm need to be captured. Based on the state-of-the-art detectors, we are still limited by the dynamic range which does not exceed a half of the dynamic range of the Solar corona. These special requirements grew into an idea to design and manufacture a special portable terrestrial telescope. Scheme of the telescope can be seen on figure 1.

International Conference 2ND International Conference on Innovations, Recent Trends and Challenges
in Mechatronics, Mechanical Engineering and New High-Tech Products Development
MECAHITECH‘10
Bucharest, 23-24 September 2010
218
DESIGN OF THE TELESCOPE
The construction is meant to be Earth based. Currently only the stationary sensors are able to track the Sun within one pixel precision limit. The system has to be robust, yet easily portable to be transported to locations where the eclipse may occur. Since these are all over the world in different climates and environments, the whole construction should be resistant to dust, sand, wind, humidity, temperature and high altitude effects and reliable even under different climatic conditions. High rigidity and precision of the construction is essential.
All the above mentioned requirements were fulfilled by using special precise components with desired features. Flexural hinges are the key components with unique properties. Use of flexural hinges in the construction of the telescopes can be tracked more than several decades back, when they were used for example in the 2-m Zeiss telescope installed in Ondrejov Observatory, Czech Republic. Flexural hinges came up to focus mainly after the expansion of electro-erosive machining. They have high bending flexibility together with high axial stiffness.
In order to ensure the ability to follow track of the objects, the motion has to be in range of ± 26°. We decided to design the device in much more versatile way and implemented the range of ± 35° to be able to track also the Moon.
Figure 3: Simplified view of the telescope (model drawn by: Ing. Lukáš Marek)
Stand
The mount of the telescope compromises design advantages of the English mount with the Horseshoe mount. The frame is made of steel profiles to provide the maximal stiffness which is crucial for the component to inhibit possible vibrations of the whole system. The slope of the stand is realized by four supports coupled with the same number of actuators. Working distance of each actuator is 200 mm. Current slope can be read out directly from the scale on the stand.

International Conference 2ND International Conference on Innovations, Recent Trends and Challenges
in Mechatronics, Mechanical Engineering and New High-Tech Products Development
MECAHITECH‘10
Bucharest, 23-24 September 2010
219
Camera System
The telescope is equipped with seven independent cameras with lenses in carbon fiber composite tubes (position 1 on figure 1). The cameras are used for sequential image capturing while each of the cameras will capture images with different exposure settings.
The lenses are held together by two separate plates with seven milled holes and flexural hinges working as clamp joints. This enables easy adjustment and reassembly of the lenses when necessary, for example for cleaning purposes. The plates are further assembled into a frame mounting (as can be seen on figure 2) which is connected to the drive of the polar axis.
Figure 2: Frame mounting (drawn by: Ing. Ganbold Batbold)
Drive of the polar axis
The ability to track objects precisely is limited by the precision of the polar axis drive. Schema of the drive unit is depicted on figure 3. To compensate for the rotation of the Earth, the velocity of rotation should be 0.00666 revolutions per minute. Such a slow but fluent motion is provided by the Papst BCI 5230 electric motor equipped with the Zeitlauf PGN 50.2 gearbox. The motor is integrated through the membrane coupling to the worm gear with total transfer of i=119:1. The worm gear is mounted in radial needle roller bearing ZKL and in NKIB 5908 INA bearing for the radial-axial direction.
The ability of a quick change of position of the lens-containing frame mounting had to be addressed too. Before commenting the tracking of a celestial body, we have to set the camera system to a preliminary position this is often faster to be done manually. The drive along with the worm gear can be easily lifted using the two pre-stressed foils and reset. The foils are working synchronously as a non-linear guide with zero backlash. The foils are inclined at an angle of 3°, which ens ures their proper tensioning and right thrust on the screw of the worm wheel.

International Conference 2ND International Conference on Innovations, Recent Trends and Challenges
in Mechatronics, Mechanical Engineering and New High-Tech Products Development
MECAHITECH‘10
Bucharest, 23-24 September 2010
220
Figure 3: Schema of the drive (drawn by: Ing. Karolina Macúchová) The motion momentum is transferred from the worm wheel to the RU 178 THK cross
roller bearing through a special and original component called the six-ray-joint. Construction of the joint can be seen on figure 4 – right. The flexural rays (blades) are the key elements that connect the inner and outer ring and provide the functional performance of the flexural hinge. Three even rays are connected together on one part while the remaining three odd rays are mounted to the worm wheel. This joint is applicable only for small angular shift. The rays are flexible at least in the sufficient range ± 3°. The joint is a mechanism free from backlash and works without any friction and has a well-defined rotation axis. Its only disadvantage is the directive force but due to the surplus of torque in the construction, this force has no negative effect.
Figure 4: Cross roller bearing with a flange (left) and six-ray-joint mounted to the worm wheel (right)
(photo credits: Ing. Karolina Macúchová)

International Conference 2ND International Conference on Innovations, Recent Trends and Challenges
in Mechatronics, Mechanical Engineering and New High-Tech Products Development
MECAHITECH‘10
Bucharest, 23-24 September 2010
221
The camera system is mounted to the flange connected to the cross roller bearing (see figure 4 – left). Current position of the camera system is checked using the Renishaw's SIGNUM RESM optical angular encoder (see figure 5). The encoder consists of a ring with a scale and two readheads. The readhead is capable of operation with speed higher then 12,5 m/s which is more than sufficient. The ring has graduation accuracy to ±0.5 arc second and system repeatability to 0.02 arc second. The ring is mounted to the flange together with the tube holder. Signal from the readhead is transmitted by the interface to the controller and further used to determine the actual position to evaluate the necessary feedback signal.
Figure 5: Angular encoder set: (a ring and a readhead) (photo credits: Renishaw)
To achieve reasonable precision of the eclipse tracking, the operator has to be able to
make corrections of the proper position of the system via pointing interference. To compensate the inaccuracies of the drive we designed a correction mechanism (see figure 6). The mechanism is provided by two monolithic flexural hinges – parallelograms driven by a Maxon Motors electromotor coupled with a linear gearbox and a lead screw. The advantage of the Maxon motors is in their small size and weight. The motor will be controlled by a signal from the angular read-out device. The force induced by the motor changes the shape of the flexural hinges which then rotate the outer and inner part of the six-ray-joint. The rotation is then distributed to the frame mounting with lenses.
Figure 6: Scheme of the correction mechanism viewed from the side
(drafted by: Ing. Karolina Macúchová)

International Conference 2ND International Conference on Innovations, Recent Trends and Challenges
in Mechatronics, Mechanical Engineering and New High-Tech Products Development
MECAHITECH‘10
Bucharest, 23-24 September 2010
222
Declination axis unit
The main purpose of the unit is to maintain pointation moves with respect to the declination axis. Pointation moves are realized by a six-ray-joint. The directive force is induced by a differential screw which can be in the future replaced by an electric motor similar to the one used in the correction mechanism of the polar axis. While the declination axis in once per acquisition properly set, the six-ray-joint is firmly fixated by a clamp joint.
CONCLUSION AND ACKNOWLEDGEMENT
The construction team counts several engineers (see references 1, 2, 4,) and many consultants from the Czech Technical University in Prague.
The construction is drafted to the finest details. The only problematic issue we deal with is the lack of funding as no grant or fund is currently assigned to this project. We already succeeded to buy (electric motors, bearings, encoder ring, camera) or manufacture some crucial parts of the assembly (six-ray-joints and other) mainly thanks to the generous help of the company BMD, a.s. (Teplice, Czech republic) and the faculty of Mechanical Engineering of CTU in Prague. Our next goal is to finish the assembly and testing of the system by November 13, 2012, when the next total solar eclipse will occur with the estimated duration of 4 minutes 2 seconds.
REFERENCES
[1] Ganbold B. “Montáž astronomického dalekohledu”, diploma thesis, 2010, in Czech only
[2] Hajn M. “Přehled přesné mechaniky”, SNTL, Prague 1969
[3] Macúchová K. “Pohon hodinové osy astronomického dalekohledu s využitím pružného prvku”, Proceedings of the Konference studentské tvůrčí čnnosti, FS ČVUT 2008, 22 April 2008, Prague, Czech republic
[4] Marek L. “Základní informace o pohonech”, inhouse study, 2007, in Czech only
[5] Maršík J. “Pružné klouby a MKP”, inhouse study, in Czech only
[6] Santos, I. et al "High accuracy flexural hinge development", Proceedings of the 11th European Space Mechanisms and Tribology Symposium, ESMATS 2005, 21-23 September 2005, Lucerne, Switzerland
[7] Svoboda J. “Uložení ešeletové mřížky”, diploma thesis, 2004, in Czech only
[8] Šesták D. “Montáž speciálního dalekohledu pro pozorování slunečních zatmění”, diploma thesis, 2007, in Czech only
[9] Zeiss - Technical documentation and drafts of the 2-m telescope, Obresvatory Ondrejov, Czech republic

International Conference 2ND International Conference on Innovations, Recent Trends and Challenges
in Mechatronics, Mechanical Engineering and New High-Tech Products Development
MECAHITECH‘10
Bucharest, 23-24 September 2010
223
Surface Roughness Evaluation in Turning Based on
Abbott – Firestone Curve
Adriana Carmen Cîrstoiu Materials, Equipments, Installations and Robots Department,
VALAHIA University of Târgovişte, România, E-mail: [email protected]
ABSTRACT
The paper presents experimental determination of the influence of the cutting tool nose
radius on surfaces roughness in case of external turning. A roughness evaluation by its correlation with Abbott-Firestone curve and statistical distribution of the amplitudes of roughness profiles has been undertaken in the frames of this paperwork. KEY WORDS
Surface Roughness, roughness profile, nose radius, Abbott - Firestone curve INTRODUCTION
The measurement of surface state evaluates the defects of surface inevitably
generated during the manufacture of parts. A good knowledge of these defects can take the necessary steps to keep within limits acceptable to the work piece assumes the function for which it was designed in the best economic conditions [1]. The factors that play a major influence on the quality of machined surfaces are: the machining parameters, the geometry of cutting tool, the properties of the material worked, the nature and mode of lubrication, the phenomenon of work hardening and the machining method [2].
In this paper are presented the data on the experimental influence of tool geometry on surface quality machined by turning. It was shown by theoretical and experimental research to the favorable effect of increasing nose radius rε on quality machined surfaces by turning, expressed by the parameters Ra and Rt.
Parameters are numerical values assigned to a surface, the most common being Ra, which averages the peak and valley displacement from a mean line but provides no information about the height of the peaks and valleys or the ability of the material to bear a load (bearing ratio).
A study of bearing area ratio, Tp and the Abbot-Firestone curve (bearing area curve) allows the display of statistical distribution of depths of points on the profile [3].
Bearing area ratio (Tp) is the length of the bearing surface expressed as a percentage of the assessment length L at a depth, or "slice level," below the highest peak [4]. It is useful because it simulates wear at various cutting depths of the surface.
Ra is an important parameter of roughness, but two different surfaces may have similar Ra, but could function differently. It is therefore necessary to analyze other parameters such as Rq, Rsk or Rku [5].

International Conference 2ND International Conference on Innovations, Recent Trends and Challenges
in Mechatronics, Mechanical Engineering and New High-Tech Products Development
MECAHITECH‘10
Bucharest, 23-24 September 2010
224
DESIGN OF THE EXPERIMENT We measure the parameters of surface roughness machined by turning, thanks to a
modified nose radius tool. Experimental investigations were conducted on cylindrical surfaces 20 mm in length and 41 mm in diameter, separated by gorges, as illustrated by Figure 1.
Fig. 1. The configuration and dimension of the machined work piece
The material in cylindrical bar XC18 is a non-alloy steel low carbon (0.16% - 0.22%) C.
The steel also contains: Si (0, 15 - 0.35%), Mn (0.40 to 0.70 %), P ≤ 0.035% S ≤ 0.035%. Experimental investigations were performed on a CNC machine, an NC lathe
Challenger 300. The experiments consisted of processing the four areas, with 20 mm length and initial diameter of 41 mm, with the same cutting parameters, but with different geometry of the cutting plates. Geometry of cutting plates are different because of different nose radius, rε.
The cutting parameters used in processing were: - Cutting speed, vc = 128.74 m / min (corresponding to a speed of 1000 rpm) - feed f = 0.2 mm / rev - depth of cut ap = 1.7 mm. In experiments were used the following carbide cutting plates, manufactured by Sandvik Coromant and chosen by CoroGuide and CoroKey PC programs:
CNMG 120404 MF2 ; rε=0,4 mm CNMG 120408 MF2 ; rε=0,8 mm CNMG 120412 MF2 ; rε=1,2 mm CNMG 120416 MF2 ; rε=1,6 mm -Port-plates - PCLN R 2020 K12.
Measuring parameters of roughness and bearing area ratio was done using a Taylor Hobson (Surtronic 3+) surface profilometer [6]. RESULTS ANALYSIS
Influence of nose radius on surface roughness Correlation between the tool geometry, feed rate f and the surface roughness is
demonstrated by relationships (1) şi (2) [7].

International Conference 2ND International Conference on Innovations, Recent Trends and Challenges
in Mechatronics, Mechanical Engineering and New High-Tech Products Development
MECAHITECH‘10
Bucharest, 23-24 September 2010
225
εr
fRt teor 8
2
≅ [mm], (1)
4
22 f
rrRt teor −−= εε [mm] (2)
The roughness parameter Rt can be calculated with both relationships, but in this paper has used the relationship (1) and the values obtained were noted Rt theor.
For situations where the tool has a radius, one can estimate the value of the parameter Ra as [8]:
εr
fRateor
20321.0≅ [mm] , (3)
where: f is the feed rate in mm / rev; rε is the nose radius in mm; Rt is the maximum peak-to-valley height of the roughness profile; Ra represents the arithmetical mean deviation, the average roughness or deviation of all points from a plane fit to the test part surface, evaluated in accordance with ISO 4287: 2001.
In Table 1 are the theoretical values of roughness parameter Rt, calculated with the relationship (1), very close to those calculated by equation (2), the theoretical values of roughness parameter Ra, obtained using the theoretical model Boothroyd, relationship (3) and experimental values of Rt and Ra.
Comparing the theoretical and experimental values of roughness parameters Ra and Rt, can see that reports values of roughness parameters are very close; the report Rtteor / Rateor is about 4, and the report Rtexp / Raexp is about 5, according to Table 1.
It notes the existence of very small differences between experimental and theoretical values of roughness parameters Ra, so that we can say that the predicted values of the surface parameter Ra were confirmed by experimental values of Ra (table 1). Small differences between experimental and theoretical values of roughness parameter Rt is explained by the possibility of differences in cutting conditions in relation to the theoretical relationships.
Table 1. Theoretical and experimental values of roughness parameters Rt and Ra
for the processed surfaces with different nose radius Nose radius Roughness Parameters/ Report values
rε=0,4 mm (Profile 7)
rε=0,8 mm (Profile 8)
rε=1,2 mm (Profile 9)
rε=1,6 mm (Profile 10)
Rt exp [µm] 10,2 7,56 6,63 4,76 Ra exp [µm] 2,16 1,51 1,16 0,918 Rt exp / Ra exp 4,722 4,344 5,715 5,185 Rt theor [µm] 12,5 6,25 4,166 3,125 Ra theor [µm] 3,21 1,605 1,07 0,80 Rtteor / Rateor 3,894 3,894 3,893 3,906

International Conference 2ND International Conference on Innovations, Recent Trends and Challenges
in Mechatronics, Mechanical Engineering and New High-Tech Products Development
MECAHITECH‘10
Bucharest, 23-24 September 2010
226
Regarding the values of parameters Rt and Ra, we observe that the roughness values decreases, so the surface quality increases when the nose radius increases, as shown in Figure 2.
Fig. 2. Theoretical and experimental values of roughness parameters Rt and Ra
for surfaces machined with different radiuses of tool’s tip
Figures 3, 4, 5 and 6 shows the profiles of surface roughness and the values of roughness parameters for the machined surfaces with the following values for the nose radius, rε: 0,4 mm; 0,8 mm; 1,2 mm and 1,6 mm. The values of roughness parameters for machined surfaces with values rε mentioned above are presented in Table 1. It is noted that the experimentally determined values of roughness parameters decrease when increasing cutting tool nose radius, confirming theoretical research from [9] and experimental research from [10].
Fig. 3. Roughness profile and the parameters of roughness achieved by nose radius rε = 0,4
mm
0
2
4
6
8
10
12
14
0 0.5 1 1.5 2
Nose radius [mm]
Roughness parameters [um]
Ra exp
Rt exp
Ra theor
Rt theor

International Conference 2ND International Conference on Innovations, Recent Trends and Challenges
in Mechatronics, Mechanical Engineering and New High-Tech Products Development
MECAHITECH‘10
Bucharest, 23-24 September 2010
227
Fig. 4. Roughness profile and the parameters of roughness achieved by nose radius rε = 0,8 mm
Fig. 5. Roughness profile and the parameters of roughness achieved by nose radius rε = 1,2 mm
Fig. 6. Roughness profile and the parameters of roughness achieved by nose radius rε = 1,6 mm

International Conference 2ND International Conference on Innovations, Recent Trends and Challenges
in Mechatronics, Mechanical Engineering and New High-Tech Products Development
MECAHITECH‘10
Bucharest, 23-24 September 2010
228
Abbot-Firestone curve and the statistical distribut ion of amplitudes
The Abbott-Firestone bearing curve represents a surface that requires very little depth to obtain a supporting surface. The Abbott-Firestone bearing curves for machined surfaces with nose radius shown in Table 2 are presented in Figures 7, 8, 9 and 10.
Fig. 7. Curve Abbot - Firestone and the statistical distribution of amplitudes for the profile machined with the nose radius rε = 0.4 mm
Fig. 8. Curve Abbot - Firestone and the statistical distribution of amplitudes
for the profile machined with the nose radius rε = 0.8 mm
The bearing ratio curve is generated by plotting a curve at various depths. The slope of this curve can be useful in determining how fast a surface will wear and the dimensional size change likely after wear-in.

International Conference 2ND International Conference on Innovations, Recent Trends and Challenges
in Mechatronics, Mechanical Engineering and New High-Tech Products Development
MECAHITECH‘10
Bucharest, 23-24 September 2010
229
Table 2. Bearing area ratio for the processed surfaces with different nose radius Profile Parameters
Profile 7 (rε=0,4 mm)
Profile 8 (rε=0,8 mm)
Profile 9 (rε=1,2 mm)
Profile 10 (rε=1,6mm)
Cutting depths of the surface [µm]
7,78 5,94 5,26 3,96
Bearing area ratio [%] 60 60 60 60 Rt exp [µm] 10,2 6,56 6,63 4,76 Raexp [µm] 2,16 1,51 1,16 0,918
Fig. 9. Curve Abbot - Firestone and the statistical distribution of amplitudes
for the profile machined with the nose radius rε = 1.2 mm
Fig. 10. Curve Abbot - Firestone and the statistical distribution of amplitudes
for the profile machined with the nose radius rε = 1.6 mm

International Conference 2ND International Conference on Innovations, Recent Trends and Challenges
in Mechatronics, Mechanical Engineering and New High-Tech Products Development
MECAHITECH‘10
Bucharest, 23-24 September 2010
230
Ra is an important parameter of roughness, but two different surfaces may have similar Ra, but could function differently. It is therefore necessary to analyze other parameters such as Rq, Rsk or Rku, defined by relations 4, 5 and 6. The values of these parameters corresponding machined surfaces with different tool noses are indicated by the roughness Surtronic 3 + and listed in Table 3. Table 3. Values of roughness parameters Rq, Rsk and Rku for the machined surfaces with different nose radius
The distribution of amplitudes of roughness profiles can approach a Gaussian
distribution. The parameters we are interested: Root mean square roughness, Rq (µm), the average of the measured height deviation
taken within the evaluation length or area and measured from the mean linear surface:
∫⋅=L
q dxxzL
R0
2 )(1
(4)
Skewness (indicator characterizing the symmetry of the profile), Rsk:
∫⋅⋅=L
q
dxxzLR
Rsk0
33
)(11
(5)
Kurtosis (indicator characterizing the spread of the distribution), Rku:
dxxzLR
RkuL
q
)(11
0
44 ∫⋅⋅= (6)
Skewness is a measure of symmetry of the profile about the mean line. Kurtosis is a measure of the randomness of heights and of the sharpness of a
surface. Skew and kurtosis are central moments of the third and fourth order. They are able to
measure the material ratio on a profile. In particular, the skew shows the degree of symmetry of the profile, while the kurtosis shows the amount of profile points near (narrow profile) or far (flat profile) from the mean.
Amplitude distributions profiles presented in Figs 7, 8, 9 and 10 are close to normal distribution.
Rsk has positive values, leading to an asymmetrical profile, shifted to the right, indicating a sharp profile of a less wear resistant surface. A normal distribution of profile values results in zero skewness.
Rku has values less than 3. A profile with flattened peaks and valleys has smaller Rku values. Amplitude distribution curve is a normal profile for Rku equal to 3, when there are a maximum number of points in the profile around the average line.
Profile Profile7(rε=0,4 mm)
Profile8(rε=0,8 mm)
Profile9(rε=1,2 mm)
Profile10(rε=1,6mm)
Rq [µm] 2,5 1,73 1,37 1,09 Rsk (Sk) 0,468 0,296 0,324 0,613 Rku (Ek) 1,99 1,85 2,12 2,39

International Conference 2ND International Conference on Innovations, Recent Trends and Challenges
in Mechatronics, Mechanical Engineering and New High-Tech Products Development
MECAHITECH‘10
Bucharest, 23-24 September 2010
231
CONCLUSIONS
The curves shown in Figure 1 reveal the dependence of roughness parameters Ra and Rt as a function of nose radius rε. So, if the nose radius increases, the values of roughness parameters decrease, indicating an improvement in surface quality, as indicated by experimental results in Table 1. This can be explained by the changing conditions of plastic deformation in chip formation.
By studying the bearing area ratio and the Abbott-Firestone curve, we notice that as the roughness decreases, the lift (bearing area ratio) increases. If the nose radius increases, to get the same rate of lift, we need a cutting depth of the surface becoming less, as indicated by Table 2. Therefore, improving the quality of the surfaces, turning them with cutting tools with larger nose radii, lead to increased bearing surface, as shown by Figures 7, 8, 9 and 10.
Regarding the statistical distribution of depths, presented in Figures 7, 8, 9 and 10, we can conclude the following:
Rsk has positive values, leading to an asymmetrical profile, shifted to the right, indicating a sharp profile of a less wear resistant surface. Bearing surface should have negative skew. Rku has values between 2 and 3, the amplitude distribution curve profile having no significant deviations from normal distribution. REFERENCES
[1] B. Murzec, F. Muz, Integral model of selection of optimal cutting conditions from different
databases of tool makers. Journal of Materials Processing Technology, vol. 133 1-2 ,2003, pg. 158-165
[2] S. M. Darwish, The impact of tool material and cutting parameters on surface roughness of a nickel- base superalloy. Materials and manufacturing Processes Vol. 12, No. 6, 1997, pg. 10017- 1035
[3] E. J. Abbot, F.A. Firestone Specifying surface quality “Engineering” Mc. Graw Hill Company, New York, 1968
[4] E.C. Teague, F.E. Scire, S.M. Baker & S.W. Jensen, 3-Dimensional stylus profilometry, Wear vol. 83, 1982
[5] E.S. Gadelmavla, M.M. Koura, T.M.A. Maksoud, I.M. Elewa & H.H. Soliman, Roughness parameters, , Journal of Materials Processing Technology, Vol. 123, 2002
[6] Gh.Gheorghe, Tehnica măsurării inteligente, Ed. CEFIN, Bucureşti 2004
[7] E. Diacenko, M.O. Iacobson Calitatea suprafeŃelor la prelucrarea metalelor prin aşchiere (translation from Russian), Ed. Tehnică, Bucureşti, 1954
[8] G. Boothroyd, Fundamentals of Metal Machining and Machine Tools, Dekker, New York, 1989
[9] Şt. Enache, La qualité des surfaces métaliques, Ed. Tehnică, Bucureşti, 1994
[10] Capello E., Residual stresses in turning; Part I: Influence of processes parameters, Journal of Materials Processing Technology, 2004

International Conference 2ND International Conference on Innovations, Recent Trends and Challenges
in Mechatronics, Mechanical Engineering and New High-Tech Products Development
MECAHITECH‘10
Bucharest, 23-24 September 2010
232
Medical Reverse Engineering Applications and Method s
L.C. Hieu1, 2 , J.V. Sloten3, L.T. Hung4, L. Khanh5, S.Soe1, N. Zlatov1
, L.T.Phuoc6 and P.D. Trung1
1 School of Engineering, University of Greenwich, Kent, UK 2 Cardiff School of Engineering, Cardiff University, Wales, UK
3 Division of Biomechanics and Engineering Design, K.U.Leuven, Belgium 4 Department of Information Technology, Hanoi University of Technology, Vietnam
5 Departments of Medical Imaging and Neurosurgery, Central Army Hospital 108, Vietnam 6 Biomedical Engineering Laboratory, University of Bologna, Italy
Postal Address : Dr Le Chi Hieu, School of Engineering, University of Greenwich, Pembroke,
Central Avenue, Chatham Maritime, Kent ME4 4TB, UK. Email: [email protected]
ABSTRACT
Understanding, controlling and manipulation of patient data as well as shape, geometry and structure of the biomedical objects are important for developing Biomedical Engineering (BME) applications. Medical Reverse Engineering (MRE) is aimed to use the Reverse Engineering (RE) technology to reconstruct 3D models of the anatomical structures and biomedical objects for design and manufacturing of medical products as well as BME research and development. This paper presents the state of the art applications and methods about MRE. Different concepts and methodologies are provided to understand fundamentally the MRE processes and workflow. The key MRE applications are presented, including personalised implants for bone reconstruction, dental implants and simulations, surgical tools, medical training, vision science and optometry, orthopedics, ergonomics, orthosis, prosthesis, and tissue engineering. The current challenges as well as the hardware and software for MRE application development and research are discussed. Keywords: Medical reverse engineering, Implant design and manufacture, Biomodelling INTRODUCTION
The digital geometric data is very important for all engineering areas. It can be seen in the form of a certain 2D or 3D format, and not only used for design and manufacturing systems, but also for scientific and technological research and development processes, marketing and business, arts, film industry and televisions. Figure 1 presents the central activity of the digital geometric data in which it involves in many application areas; and the well-known examples and applications include (i) Design and Manufacturing: Computer Aided Design, Computer Aided Manufacturing, Computer Numerical Control & Computer Aided Engineering (CAD/CAM/CNC & CAE), (ii) 3D animation and simulations, (iii) 3D Art, Film and TV, and (iv) Medicine: Medical imaging and surgical planning.
In the area of Design and Manufacturing, 2D/3D digital geometric data, generally called 2D/3D data, is fundamentally an input for most of the state of the art production systems, from CAD/CAM/CNC to Micro & Nano Manufacturing. All the analysis and planning systems for product development and production are based on 2D/3D data, including Computed

International Conference 2ND International Conference on Innovations, Recent Trends and Challenges
in Mechatronics, Mechanical Engineering and New High-Tech Products Development
MECAHITECH‘10
Bucharest, 23-24 September 2010
233
Aided Process Planning (CAPP), Computer Aided Inspection Planning (CAIPP) and Computer Aided Engineering (CAE).
It is clearly seen that the methods and technologies to reconstruct and manipulate 2D/3D data are crucial for many applications. There are two types of engineering, forward engineering (FE) and reverse engineering (RE). The definition of the terms FE and RE are well-documented; it is strongly dependent on the end-use applications and the field of study [1]. Generally, FE is the traditional process of moving from high-level abstractions and logical designs to the physical implementation of a system [2]. For new products or applications where the reference data is not necessary for 2D/3D geometrical modeling, FE principles are commonly used. However, in the cases, where we need to base on the reference data for 2D/3D geometrical modeling processes, or when we need to duplicate the objects for further development, the RE technology are the right option for implementation.
Figure 1: Central activity of the digital geometric data
RE is generally defined as a process of analysing an object or existing system, including hardware and software, to identify its components and their interrelationships, and investigate how it works in order to redesign or produce a copy without access to the design from which it was originally produced [1]. In the area of 3D graphics and geometrical modelling, RE is used for reconstructing 3D models of an object in different geometrical formats from the available physical ones. Based on the end-use applications and technical requirements about data processing and accuracy of 3D models to be reconstructed, practically, RE can be divided into 3 groups: (i) Industrial RE, (ii) Artistic & Architectural RE, and (iii) MRE as presented in Table 1.
Since 1990s, RE has been playing an important role in medical product development and BME research, especially in the areas of design and manufacturing of personalised implants, surgical tools, medical training models, orthosis, prosthetics, and medical devices, where patient data in the form of CT/MRI images and 2D/3D formats are used for surgical planning and as the reference data for medical application development [4-15].
Digital Geometric
Data
Engineering & Technology
Astronomy
Design & Manufacturing
Art – Film - TV
Business Marketing & Advertisement
Architecture
Psychology
Medicine
Basic science
Archeology
Biology

International Conference 2ND International Conference on Innovations, Recent Trends and Challenges
in Mechatronics, Mechanical Engineering and New High-Tech Products Development
MECAHITECH‘10
Bucharest, 23-24 September 2010
234
Table 1: Three RE types based on the end-use applications and technical requirements
RE types Objectives and technical requirements
Industrial RE
Industrial RE is used to reconstruct 3D models of the physical objects for Engineering Design, CAD/CAM/CNC, Product Development, Quality Control and Dimensional Inspection. The typical object size is from 200x200x200 mm to 500x500x500 mm. The accuracy requirement for 3D models is normally high. The typical requirement is from ± 20 to ± 50 microns. In the area of Mold & Tooling as well as micro-manufacturing, the accuracy requirement is up to (1 to 5) microns. For the applications such as the ship building and aeronautic industry, the accuracy requirement is quite flexible, depending on the size of the objects and their functions.
Artistic & Architectural
RE
Artistic & Architectural RE is used for 3D geometrical modelling and control of the objects for artistic and architectural applications. The size of the objects normally varies from 10x10x10 mm to very big ones, including statues, architectural prototypes, houses and buildings. The accuracy requirement is normally low. The outside appearance, including the general shape and forms of the objects, are more concerned than the required accuracy.
Medical RE
When RE is used for medical application development and research, it is called Medical Reverse Engineering (MRE). It is normally involved in using patient data or biomedical objects to reconstruct 3D models of anatomical structures and objects of interest for development of different medical products, applications, and biomedical research. The accuracy requirement for MRE is dependent on the specific applications. For the personalised cranio-maxillofacial implants, biomodels and training models, the accuracy requirement is basically not high compared to Industrial RE, up to hundred(s) of microns. However, for the surgical tools and functional implants such as spine, hip and knee implants, the accuracy requirement is very high.
In this paper, the nature of MRE processes is presented. It provides the fundamental background about MRE as well as the state of the art applications. It is aimed at reviewing the latest development about MRE and presenting the methodologies for developing different medical applications and implementing state of the art BME research. MEDICAL REVERSE ENGINEERING METHODS
The final target of all RE processes is to obtain 3D data representing the geometries of the objects of interest from which different applications are developed. There are two types of end-use data representation that are commonly used, especially in the areas of 3D Geometrical Modelling, Engineering Design and Product Development: (i) Polygons or Triangle Mesh and (ii) Non-Uniform Rational B-Spline (NURBS).
A polygon or triangle mesh includes vertices, edges and faces that define the shape of an object. The faces usually consist of triangles, quadrilaterals or other simple convex polygons. This type of data is the simplest way of representing the geometries of objects, appeared in most of the computer graphic systems; however, it is not an accurate representation of the geometries. NURBS surfaces are the ultimate output of the RE process that we would like to obtain for applications where accuracy requirements are high. NURBS are basically an accurate way to define a free-form curve and surfaces. NURBS are useful for a number of following reasons: (i) offer one common mathematical form for both standard

International Conference 2ND International Conference on Innovations, Recent Trends and Challenges
in Mechatronics, Mechanical Engineering and New High-Tech Products Development
MECAHITECH‘10
Bucharest, 23-24 September 2010
235
analytical shapes and free form shapes; (ii) provide the flexibility to design a large variety of shapes; (iii) reduce the memory consumption when storing shapes; (iv) can be evaluated reasonably fast by numerically stable and accurate algorithms; (v) are invariant under affine as well as perspective transformations; and (vi) are generalizations of non-rational B-splines and non-rational and rational Bézier curves and surfaces [16].
Figure 2: MRE methods – Fundamental processes and information flows
Based on two types of end-use data representation, the fundamental MRE methods are presented as shown in Fig.2, in which the state of the art data processing chains for 3D
Biomedical objects or samples
Data Acquisition (Contact & Non-Contact)
Point Clouds
Data Registrations
Data Filtering
Triangle Mesh Models
Triangle Mesh Optimisation
NURBS – CAD Geometrical Modelling
2D slice Images
Image Segmentation
ROI Growing
2D Profiles - Contours
Phase I
Phase II
Phase III
Biomedical Application Development & Research Phase IV
Patients
Impression casts Physical objects

International Conference 2ND International Conference on Innovations, Recent Trends and Challenges
in Mechatronics, Mechanical Engineering and New High-Tech Products Development
MECAHITECH‘10
Bucharest, 23-24 September 2010
236
geometrical reconstruction of the objects for medical application development and research are emphasised. There are 4 main phases: (i) Phase I - MRE inputs, (ii) Phase II - Data acquisition, (iii) Phase III - Data processing and analysis, and (iv) Phase IV - Biomedical Application Development & Research. PHASE I- MRE INPUTS
There exists an interactive nature of the information processing and implementation steps of MRE. The input for MRE is crucial for data acquisition to develop medical applications and research. It determines not only the techniques and methods for data acquisition, but also data processing and analysis. It controls the required accuracy level from which 3D models are constructed for further medical application development. Depending on the end-use applications, different types of inputs for MRE are selected to meet not only the technical requirements, but also clinical constraints as shown in Fig. 3.
Figure 3: The end-use applications determine MRE inputs
The state of the art end-use applications of MRE include personalised implants for
bone reconstruction, dental implants and simulations, surgical tools, medical training, vision science and optometry, orthopedics, ergonomics, orthosis, prosthesis, and tissue engineering. Table 2 presents the typical MRE’s end-use applications as well as the MRE inputs and related raw data types which are outputted from the data acquisition process. The MRE inputs can be patients or physical objects or impression casts as well as biological and medical samples from which the geometrical information of the object of interest and study is captured and collected for development of medical applications and research. PHASE II- DATA ACQUISITION
There are different techniques for MRE data acquisition. They are classified into two main groups: Contact and Non-contact. Contact methods use sensing devices with mechanical arms, Coordinate Measurement Machines (CMM) and Computer Numerical Control (CNC) machines, to digitise a surface. With non-contact methods, 2D cross-sectional images and point clouds that represent the geometry of an object are captured by projecting energy sources (light, sound or magnetic fields) onto an object; then either the transmitted or the reflected energy is observed. The geometrical data of an object are finally calculated by
End-use Applications
Technical requirements Clinical constraints
MRE Inputs
Biomedical objects or samples
Impression casts
Patients

International Conference 2ND International Conference on Innovations, Recent Trends and Challenges
in Mechatronics, Mechanical Engineering and New High-Tech Products Development
MECAHITECH‘10
Bucharest, 23-24 September 2010
237
using triangulation, time of flight, wave-interference information and image processing algorithms. There is no contact between the RE hardware and an object during the data acquisition process.
Table 2: Typical MRE’s end-use applications, inputs and data type
Applications Examples MRE inputs & Data type
Personalised implants
-Implants for bone reconstructions for patients with skull defects due to traffic accidents or bone tumors
-Implants for cosmetic cranio-maxillofacial surgery
- Patients
- Data type: CT or MRI images
Dental implants & simulation
-Implants: (i) Implants for bone reconstruction of the mandible, (ii) Dental implants for tooth reconstruction and replacement
-Simulation: Simulation of an implant position on 2D & 3D models, identification of the mandibular canal, calculation of the bone density, & surgical planning
- Patients
- Impression casts
- Data type: CT or MRI images, Point clouds
Surgical tools
-Drilling guides for dental and spine surgery
-The jigs to assist the process of removing tumors in bone reconstruction surgery
- Patients
- Impression casts
- Data type: CT or MRI images, Point clouds
Surgical training & simulation
- Medical training models for surgeons and Medical Doctors to enhance surgical skills as well as to learn & practice physical examination, general medical procedures, and clinical skills
- Virtual 3D models for medical simulation, biomedical analysis and study
- Patients
- Biomedical objects
- Impression casts
- Data type: CT or MRI images, Point clouds
Vision science & Optometry
- Development of the contact lens
- Simulation and study of the contact lens and eye shape
- Patients
- Impression casts
- Data type: CT or MRI images, Point clouds
Orthopeadics
- Development of hip and knee implants as well as the surgical tools such as orthopeadic plates, fixation tools and screws
- 3D models for biomedical analysis and study
- Patients
- Biomedical objects
- Impression casts
- Data type: CT or MRI images, Point clouds
Ergonomics, Orthosis & Prosthesis
- Design & manufacturing of personalised orthosis and ergonomic products such as chairs and car seats, shoes, and sport products
- Design & manufacturing of personalised prosthesis
- Patients
- Biomedical objects
- Impression casts
- Data type: CT or MRI images, Point clouds

International Conference 2ND International Conference on Innovations, Recent Trends and Challenges
in Mechatronics, Mechanical Engineering and New High-Tech Products Development
MECAHITECH‘10
Bucharest, 23-24 September 2010
238
Tissue Engineering
- Design & manufacturing of tissue engineering scaffolds
- 3D modeling of bone structures for biomedical analysis and study
- Patients
- Biomedical objects
- Data type: CT or MRI images, Point clouds
Since most of medical applications are involved with complex geometries and shapes
of the anatomical structures or biomedical objects, the contact techniques are less used compared to the non-contact ones for MRE data acquisition. However, for the applications which require a high accuracy, the contact techniques have to be used, such as the ones in which the impression casts of the interested objects are used as the MRE inputs. Table 3 presents the advantages and disadvantages of the contact and non-contact technqiues [1]. Depending on the end-use applications and required accuracy, the relevant data acquisition techniques are selected.
Table 3: Advantages and disadvantages of the contact and non-contact technqiues
Technique Advantages Disadvantages
Contact
(i) High accuracy; (ii) Low-costs; (iii) Ability to measure deep slots and pockets; and (iv) Insensitivity to colour or transparency.
(i) Slow data collection; and
(ii) Distortion of soft objects by the probe.
Non-contact
(i) No physical contact; (ii) Fast digitizing of substantial volumes; (iii) Good accuracy and resolution for common applications; (iv) Ability to detect colours; and(v) Ability to scan highly detailed objects where mechanical touch probes may be too large to accomplish the task
(i) Possible limitations for coloured or transparent or reflective surfaces; and (ii) lower accuracy.
The outputs of the MRE data acquisition process can be two following types: (i) Point clouds, and (ii) 2D slice images. These are then the inputs for the whole MRE data processing steps and further medical application development and research. When the laser and structrured light are used as the projecting enery source, the output of the MRE data acquisition process is in the form of Point Clouds. When CT and MRI techniques are used, the output is in the form of 2D slice images. PHASE III- MRE DATA PROCESSING
Based on two types of raw data outputted from the data acquisition process, including point clouds and 2D slice images, different data processing approaches and workflow are used to obtain the right 3D models of the anatomical structures or objects of interest for medical application development and research as shown in Fig.2. Point clouds as the input for MRE data processing
It is normally required to scan the object in different views in order to capture the entire geometry or the area of interest. Therefore, data registration is needed to combine, align or

International Conference 2ND International Conference on Innovations, Recent Trends and Challenges
in Mechatronics, Mechanical Engineering and New High-Tech Products Development
MECAHITECH‘10
Bucharest, 23-24 September 2010
239
merge the point clouds from multiple scans so that all point clouds in the series are arrange in their proper orientation to on another in a common co-ordinate system.
In addition, a certain amount of error is always introduced into the scan data, and points may be placed in undesirable regions or overlapped. This is because points that have been scanned more than once when scanning complex shapes. Moreover, when the point cloud registration is applied, the aligned scan data normally contains overlapping points. Therefore, data optimisation is then required. In this step, the following common RE operations are used: (i) Noise and point redundancy reduction, and (ii) Sampling points. The sampling function is used to minimize number of points in the point cloud data so that it is easier to work with and make the data well-structured. Finally, the optimised point cloud data is finally triangulated to create 3D triangle mesh or polygon models of the object. 3D triangle mesh models are then optimised, manipulated and controlled or converted into 3D NURBS CAD models to meet the requirements from the end-use applications. Slice images as the input for MRE data processing
For CT/MRI scanners, the images are normally stored in the form of DICOM format. However, with the applications that use MicroCT imaging systems, different data formats such as BMP or PNG can be used, the image resolutions achievable with these micro-CT systems extend into the range of light microscopy, down to one or a few microns [3].
Specialized image processing tools and packages are required to do image processing for 3D data reconstruction of the hard and soft tissues or objects of interest. There are two basic steps for 3D reconstruction from 2D slice images, including (i) Image segmentation, and (ii) Region of Interest (ROI) growing. Segmentation by threshold techniques is used to define ROI that presents the object for 3D reconstruction; it is based on the grey-scale value of image pixels. The object can be defined based on one lower threshold, or based on a lower and a higher threshold [1]. In the former case, the segmentation object will contain all pixels in the images with a value higher than or equal to the threshold value. In the latter case, the pixel value must be in between both threshold values to be part of the segmentation object. The region growing technique provides the capacity to split the segmentation into separate objects; it is useful for the separation of anatomical structures, especially bone and soft tissues.
The outputs of the image segmentation and ROI growing are 3D triangle mesh models or 2D contours of the ROI or anatomical structures. The same with the case of Point Clouds as the input for data processing, 3D triangle mesh models are finally optimised, manipulated and controlled or converted into 3D NURBS CAD models to meet the requirements from the end-use applications.
PHASE IV- BIOMEDICAL APPLICATION DEVELOPMENT & RESE ARCH
The resulting 3D triangle mesh models can be directly used for applications such as Rapid Prototyping, 3D graphics and animations, Surgical Planning, and Structure or Biomechanics Analysis. However, for the applications that require high accuracy for graphic representation or further complex geometrical modeling and design, these triangle mesh models are used as the reference to create CAD entities (points, curves and primitives) and constructing NURBS CAD models which are again used as the reference for medical product development and research in which CAD/CAM/CNC/CAE systems are used.

International Conference 2ND International Conference on Innovations, Recent Trends and Challenges
in Mechatronics, Mechanical Engineering and New High-Tech Products Development
MECAHITECH‘10
Bucharest, 23-24 September 2010
240
RESULTS
More than 75 medical applications and clinical cases have been conducted since 2001 [4-15]. Figures 4 and 5 presents the typical ones, including personalised implants, dental implants and simulations, surgical tools, surgical training and simulation, vision science & optometry, orthopeadics, ergonomics, orthosis, prosthesis and tissue engineering. The following are the brief description about the typical MRE applications that are shown in Fig.4.
Figure 4: Typical MRE applications, including personalised implants, dental implants and simulations, surgical tools, surgical training and simulation, vision science and optometry, orthopedics, ergonomics, orthosis, and tissue engineering.
1 2 3 4
7
5
9
8
13 114
10 11
12
16
6
17 18
15

International Conference 2ND International Conference on Innovations, Recent Trends and Challenges
in Mechatronics, Mechanical Engineering and New High-Tech Products Development
MECAHITECH‘10
Bucharest, 23-24 September 2010
241
• Fig.4 (1-3): 3D CAD models of the head constructed with the use of structured light RE scanner for data acquisition. These 3D NURBS models were used as the reference for development of the custom-made helmet and design of the cradle for MRI scanners.
• Fig.4 (4): 3D NURBS model of the knee which was constructed from CT and MRI data for
Biomechanics analysis and simulation. Figure 5: MRE applications – Typical prototypes and clinical cases. (1-3): Prototypes of the implants and Biomodels for bone reconstruction and orthopedics surgery. (4): The medical training model for keyhole surgery. (5): The standard cranioplasty implants. (6-7): Custom-made orthosis devices developed from 3D models of the elbow and foot. (8): A patient before and after operation with the use of a personalised implant. • Fig.4 (5): 3D NURBS models of the ear casts constructed from Point Clouds which were
collected by laser scanning of the ear casts. These models were then used for design and manufacturing of the hearing aid devices.
• Fig.4 (6): 3D models of the defect skull and a personalised cranioplasty implant [11-15].
The CT images of the patient were used for 3D skull reconstruction. 3D data of the defect skull was used for designing the personalised implant which fits well to the defect window.
(1) (2) (3)
(4) (5)
(6) (7) (8)

International Conference 2ND International Conference on Innovations, Recent Trends and Challenges
in Mechatronics, Mechanical Engineering and New High-Tech Products Development
MECAHITECH‘10
Bucharest, 23-24 September 2010
242
The implant was then prototyped by Rapid Prototyping, from which the mold was made for fabricating the biomaterial implant. Since the implant was fabricated before the operation, and the surgical plan was well prepared; the operation time was remarkably reduced to maximum of 2 hours for the most of the cranioplasty surgery. Figure 5 (8) presents the patient before and after the operation with the use of a personalised cranioplasty implant.
• Fig.4 (7): 3D triangle model of the human heart constructed from CT images. This 3D
model was used for Biomechanics study as well as development of the artificial heart prototype for medical training.
• Fig.4 (8-9): 3D models of the elbow and foots which were constructed from laser scanning
of the impression casts and CT images. These models were used to develop the personalised orthosis devices [5-8]. The orthosis device for the bone fracture treatment and elbow rehabilitation is shown in Fig.4 (9).
• Fig.4 (10): New generation of the chair and car seats with the lumbar supports developed,
optimised and virtually tested based on the 3D models of the human body which were reconstructed from structured light scanning.
• Fig.4 (11): A patient with the bone tumor on the skull was treated by using a single-step
operation based on MRE. 3D models of the skull and bone tumor were reconstructed from CT images. The jig was then designed and used as the guide to remove the tumor. At the same time, the personalised implant was designed and made to fit exactly the defect cavity created after the tumor was removed. In this way, we need only one single-step operation, instead of using two operations in which one operation is used for removing the tumor, and the second operation is conducted after 2 or 4 months from the first one for treatment of the defect cavity.
Figure 4 (11, left) presents 3D models of the skull with a bone tumor and the jig for removing the tumor. The personalised implant was designed to fit well to the defect cavity is shown in Fig. 4 (11, right).
• Fig.4 (12): 3D model of the human head, including both hard and soft tissues, constructed
from CT and MRI images. It is used for testing the medical devices as well as developing the medical training models.
• Fig.4 (13): Surgical training models developed from CT/MRI images. This was a project
funded by European Union: PRIMACORPS, CRAF-99-70074, “Cost effective, realistic surgical trainer for hands-on endoscopic procedures through application of Rapid Prototyping, CAD/CAM technology and a novel material”.
• Fig.4 (14): New generation of contact lens was developed based on analysing 120 eye
shapes of European people. The eye casts were done and used as the MRE input for reconstructing 3D eye shapes based on laser scanning. Mean geometries of the eye groups were computed for designing a new generation of the ellipsoidal contact lens. Menicon, a Japan's first and largest contact lens manufacturer, is planning to manufacture

International Conference 2ND International Conference on Innovations, Recent Trends and Challenges
in Mechatronics, Mechanical Engineering and New High-Tech Products Development
MECAHITECH‘10
Bucharest, 23-24 September 2010
243
4 new types of ellipsoidal contact lens based on the reconstructed data sets of the eye shapes and their mean geometries.
• Fig.4 (15): 3D models of the teeth with the root canal constructed based on the laser
scanning and micro-CT images for developing the tooth prototypes that mimic the real teeth for surgical training.
• Fig.4 (16): 3D model of the trabecular bone structure and its FEA simulation constructed
from micro-CT images. • Fig.4 (17): 3D model of the dental cast and the drilling guide for dental surgery based on
laser scanning. The 3D models of the dental casts can also be used for not only developing the artificial tooth, but also the crown, orthodontic treatment devices, and dental bridges.
• Fig.4 (18): Application of MRE for treatment of Hip Resurfacing Arthroplasty (HRA). 3D
models of the femur are reconstructed from CT data of the patient. They are used for developing the drilling guide and FEA simulation in order to obtain the optimal angle for the implant, from which the fracture of the femur head is reduced, and the length of the implant age is increased [9-10].
DISCUSSION AND CONCLUSION
Related to MRE applications about design and manufacturing of biomodels, personalised implants, surgical tools as well as medical devices [11-15], although the benefits are well recognised, the number of clinical cases is still limited and the technology has not been widely applied for diagnosis and treatment due to difficulties of technology transfer to hospitals. The main reasons that lead to these difficulties are as follows [4]: (i) the complexity of the design, (ii) challenges about multi-disciplinary collaboration & communication, and (iii) high cost of technology and investment.
In order to develop successfully MRE applications, both technical and clinical constraints must be well defined. In addition, the optimal selection of the hardware and software for implementation is also important. There are typically three groups of currently available commercial hardware for MRE applications: (i) Non-contact scanners based on the structured light and laser source, (ii) Medical CT or MRI scanners, and (iii) Specialized instruments, including CMM and micro-CT systems. Depending on the accuracy level required for the applications, and MRE inputs or objects to be based on for data acquisition are determined, and the hardware is optimally selected.
There is no single software that can fulfill and satisfy completely the requirements in data processing and geometrical modelling works [1]. The selection of the software therefore depends on the end-use application, especially the complexity of the geometrical modelling processes and data exchange among the packages. The following are the typical software and tools that are necessary for implementation of MRE applications, including (i) Medical Image Processing (MIP), (ii) Rapid Prototyping (RP), (iii) Finite Element Analysis and simulation (FEA), (iv) Reverse Engineering & Dimensional Inspection, (v) Freeform Modelling, (vi) CAD/CAM, and (v) Dental CAD/CAM.
MIP: These are the packages which are specifically developed for medical image

International Conference 2ND International Conference on Innovations, Recent Trends and Challenges
in Mechatronics, Mechanical Engineering and New High-Tech Products Development
MECAHITECH‘10
Bucharest, 23-24 September 2010
244
processing, including MRI and CT data. Normally, they provide basic tools for image processing such as image segmentation, ROI growing, 3D reconstruction of the anatomical structures. Most of these package provides the common tools for surgical planning, especially the ones for dental surgery. A few packages allow simple geometrical modelling operations for implant design and biomechanics analysis. The most typical commercial MIP packages are MIMICS (Materialise NV), Simpleware (impleware Ltd), 3D-Doctor (Able Software Corp), and Amira (Visage Imaging GmbH). However, if we only need to reconstruct 3D models of the anatomical structures from CT/MRI data for further development, the free and open source MIP packages can be useful; they include: 3D Slicer (Slicer), Julius framework (CAESAR Research Center) and MedINRIA (INRIA Sophia Antipolis).
RP: Most of the RP packages allow basic operations for manipulating the STL files
as well as editing 3D models. The typical RP packages include Magics (Materilise NV) and VisCAM RP (Marcam Engineering GmbH).
RE & Dimensional Inspection: They provide powerful freeform modelling tools,
especially triangle mesh control and manipulations which are not commonly available in RP and CAD packages. The typical RE packages are Rapidform (Rapidform, Inc.), CopyCAD (Delcam), Geomagic studio (Geomagic, Inc.), and Polyworks (InnovMetric Software Inc).
FEA & Simulation: These packages are needed for optimising the design as well as
simulation of the biomedical engineering aspects of the applications. Freeform Modelling: The freeform modeling techniques such as SensAble 3D
modeling systems (SensAble Technologies, Inc) and ZBrush (Pixologic, Inc) can be used for modelling the implant or anatomical structures for simulation or development of the medical training models.
CAD/CAM: Traditional CAD/CAM packages such as ProEngineer (PTC Inc), UG
(Siemens), and SolidWorks (Dassault Systèmes SolidWorks Corp) are based on NURBS CAD modelling. These packages are very powerful for 3D geometrical modelling tasks. Since we normally have to base on the 3D models of the anatomical structures for development of medical applications, CAD/CAM packages are commonly used to implement the final CAD operations of the design tasks. Freeform modelling tools in CAD packages are quite limited; thus, it is difficult for modeling and control the complex shapes such as the implants in the zygomatic bone area.
Dental CAD/CAM: They are the highly specialised packages developed for dental
applications. The typical one is Delcam’s dental CADCAM software which provides a solution for design and manufacturing of high quality dental restoration; and DentCAD is specially developed for the dental design. DentalDesigner and AbutmentDesigner (3Shape A/S) provide efficient tools for full anatomical crowns and bridges modeling, design of removable partials and customised abutments, and sophisticated dental implant bars and bridges.
With the rapid development of both hardware and software, more and more medical
applications are developed based on RE and its related ones. However, most of the MRE applications require high skills of design and geometrical modelling as well as medical image

International Conference 2ND International Conference on Innovations, Recent Trends and Challenges
in Mechatronics, Mechanical Engineering and New High-Tech Products Development
MECAHITECH‘10
Bucharest, 23-24 September 2010
245
processing. In order to be successful, there is a need for a close multi-disciplinary collaboration among professionals from different areas, including design and manufacturing, material sciences, biomedical engineering, and medicine.
Understanding well the data processing and information flows of MRE is crucial for successful development of the end-use applications as well as reducing the investment costs about both hardware and software. The paper presented fundamental concepts and backgrounds about MRE as well as the approaches for development and implementation of MRE applications. Finally, the potentials and benefits of applying the RE technology for medical application development and research are clearly shown with the introduction of the state of the art applications and clinical cases, including personalised implants for bone reconstruction, dental implants and simulations, surgical tools, medical training, vision science and optometry, orthopedics, ergonomics, orthosis, prosthesis, and tissue engineering.
REFERENCES
[1] DT Pham and LC Hieu, “Reverse Engineering Hardware and Software”. Book Entitled: Reverse Engineering: An Industrial Perspective. Springer-Verlag London Ltd - Publishers, 2006.
[2] Vinesh Raja (2006), Introduction to Reverse Engineering. Book Entitled: Reverse Engineering: An Industrial Perspective. Springer-Verlag London Ltd - Publishers, 2006.
[3] Brian D Metscher, MicroCT for comparative morphology: simple staining methods allow high-contrast 3D imaging of diverse non-mineralized animal tissues, BMC Physiology 2009, 9:11.
[4] L.C. Hieu, E. Bohez, J.V. Sloten, L.T. Hung, L. Khanh, N. Zlatov and P.D. Trung (2010), Integrated approaches for personalised cranio-maxillofacial implant design and manufacturing, IFMBE Proceedings, 1st Edition., ISBN: 978-3-642-12019-0, Springer, Vol. 27, 118-121.
[5] S.M. Milusheva, E.Y. Tosheva, L.C. Hieu, L.V. Kouzmanov, N. Zlatov, Y.E. Toshev (2006), Personalised Ankle-Foot Orthoses design based on Reverse Engineering. Proceedings of the 5th Virtual International Conference on Intelligent Production Machines and Systems, D T Pham, E E Eldukhri and A J Soroka (eds), Elsevier (Oxford) (2006).
[6] Liliya Stefanova, Slavyana Milusheva, Nikolay Zlatov, C.H. Le, Redha Taiar Yuli Toshev (2004). Computer modeling of ankle-foot orthosis using CAD model of the human body, Proceedings of International Conference on Bionics, Biomechanics and Mechatronics", 14-16 June 2004, Varna, Bulgaria.
[7] Liliya Stefanova, C.H. Le, Nikolay Zlatov, Redha Taiar , Emilia Tosheva, Yuli Toshev (2004). 3D computer modeling of elbow orthosis using reverse engineering, Proceedings

International Conference 2ND International Conference on Innovations, Recent Trends and Challenges
in Mechatronics, Mechanical Engineering and New High-Tech Products Development
MECAHITECH‘10
Bucharest, 23-24 September 2010
246
of International Conference on Bionics, Biomechanics and Mechatronics, 14-16 June 2004, Varna, Bulgaria.
[8] Y.E. Toshev, L.C.Hieu, L.P. Stefanova, E.Y. Tosheva, N.B. Zlatov, S. Dimov (2005). Reverse engineering and rapid prototyping for new orthotic devices. Proceedings of the 1st Virtual International Conference on Intelligent Production Machines and Systems, D T Pham, E E Eldukhri and A J Soroka (eds), Elsevier (Oxford) (2005).
[9] C.U. Dussa, L.C. Hieu, K. Singhal, J.V. Sloten (2005), Influence of femoral component placement on the load distribution on the neck in surface replacement arthroplasty (2005), European Orthopaedic Research Society (EORS) meeting,15th Annual Meeting, Lisbon, Portugal.
[10] C.U. Dussa, L.C. Hieu, K. Singhal, J.V. Sloten (2005), Influence of femoral component placement on the load distribution on the neck in surface replacement arthroplasty. Proceedings of XXIII SICOT/SIROT Triennial World Congress, 2-9 September 2005 - Istanbul, Turkey.
[11] L.C.Hieu, J.Vander Sloten, E.Bohez , L.Khanh, P.H.Binh, Y.Toshev, N.Zlatov (2005). Medical Rapid Prototyping Applications and Methods, Assembly Automation Journal, Vol.25, No.4., 284-292.
[12] Hieu L.C., Vander Sloten J., Bohez E., Phien H.N., Vatcharaporn E., An P.V., To N.C, Binh P.H. (2004). A cheap technical Solution for Cranioplasty treatments, Technology and Health Care (International Journal of Health Care Engineering), Vol.12. No.3, 281-292.
[13] Hieu L.C., Bohez E., Vander Sloten J., Phien H.N., Vatcharaporn E., Binh P.H., and Oris P. (2003). Design for Medical Rapid Prototyping of Cranioplasty Implants, Rapid Prototyping Journal, Vol.9, No.3, 175-186.
[14] Hieu L.C., Bohez E., Vander Sloten J., Phien H.N., Vatcharaporn E., An P.V., To N.C, Binh P.H., and Oris P., (2002). Design and manufacturing of personalized implants and standardized templates for cranioplasty applications. IEEE Proceedings on Industrial Automations, Bangkok, Thailand, Vol.2: 1025-1030.
[15] Hieu L.C., Bohez E, Vander Sloten J., Oris P, Phien H.N., Vatcharaporn E., and Binh P.H. (2002). Design and manufacturing of cranioplasty implant by 3-axis CNC milling. Technology and Health Care (International Journal of Health Care Engineering), Vol.10, No.5: 413-23.
[16] David F. R. “An introduction to NURBS: with historical perspective”. San Francisco: Morgan Kaufmann Publishers (2001).

International Conference 2ND International Conference on Innovations, Recent Trends and Challenges
in Mechatronics, Mechanical Engineering and New High-Tech Products Development
MECAHITECH‘10
Bucharest, 23-24 September 2010
247
Software for The Minimization of The Combinational Logic
Functions
Rotar Dan “Vasile Alecsandri” University,
Calea Marasesti 157, cod: 600115, Bacau, Romania, [email protected]; [email protected]
ABSTRACT
An important component of the command and control circuit for the mechatronic systems is the logical combinational circuit. For their design, methods of minimization and optimization are often used. These methods also apply to the PLA, ASIC or FPGA circuit design, being widespread in the digital circuit design [1].
The Karnaugh map method and the Quine McCluskey algorithm are classical methods of minimization. Using the Karnaugh tabular method for minimization is time consuming, and if it is done manually, it is not easy to do for more than six variables. When the logic function has more variables, as it happens in most practical situations, the method developed by Quine and McCluskey is more accessible. This method can be easily implemented as a computer program [2].
The development of the software and hardware components of the computer systems allows the simplification of the minimization algorithm if the program has an acceptable execution speed. This paper presents the algorithm and the adequate program for the minimizing of the combinational logic functions up to 20 variables, but the number of variables is only limited by the computer system’s memory. The program is developed in Visual Basic. The algorithm is based on the consecutive clustering of the terms, starting with grouping the terms with a single change of a variable into two terms with a variable of the same rank. Following the grouping, the result will be new terms with one of the variables eliminated. The clustering algorithm ends when variables cannot be grouped any longer. This algorithm is similar to the Quine McCluskey algorithm, but it is more simplified because it eliminates a number of activities required by the Quine McCluskey algorithm. INTRODUCTION
There are two categories of digital circuits: combinational logic circuits that exclusively consist of logical gates and sequential logic circuits that consist of memories, which are components for storing information and logic gates for processing this information. Generally, memories have a standard structure and a well-defined behavior. Because of this, the design of digital circuits, regardless of their type, also implies the design of a combinational logic component from the circuit’s structure.
The designing of combinational logic circuits is commonly called logic synthesis and currently, there are a number of methods devoted to this activity. The design work usually begins with an analysis of the function / functions that must be met by that circuit. At this stage the necessary output values of the logic circuit are determined according to the values

International Conference 2ND International Conference on Innovations, Recent Trends and Challenges
in Mechatronics, Mechanical Engineering and New High-Tech Products Development
MECAHITECH‘10
Bucharest, 23-24 September 2010
248
of the variables’ input values. The result of this analysis takes the form of a truth table of the function.
The synthesis of the combinational logic function often requires a minimizing operation that seeks to reduce the number of components needed to achieve that function. It must be mentioned here that not all currently used methods of synthesis require minimization, but this operation is often very useful. For example, when using a PSoC (Programmable System on Chip) device with a limited number of available gates on the digital chip, the minimizing operation is very useful [3].
Among the traditional minimizing methods used for the combinational functions (also called binary logical function or Boolean functions), the Karnaugh method and the Quine-McCluskey method will be briefly presented [1]. E.W. Veitch first suggested the use of a special form of the Venn diagrams in order to simplify with their help the combinational logic functions. Shortly after, M. Karnaugh also suggests a modified form of the Venn diagrams with the same purpose. The diagrams called the Karnaugh maps resulted in this way. The Karnaugh maps are currently used to represent Boolean functions with a relatively small number of variables. These diagrams are useful for minimizing Boolean functions because they easily allow the detection of identities similar to the type Eq. 1.
xxyx =+
xyxxy =+ (1)
yxyxx +=+ Generally, a Karnaugh map for a Boolean function of n variables is drawn as a
square or a rectangle divided into 2n compartments. Each compartment is reserved for a canonical term of the function, i.e. for one of the 2n n-uples of the function or for the corners of the n-dimensional cube from the geometrical representation of the function.
In this way, a Karnaugh diagram will be represented by a table with m rows and p columns which meet these conditions m x p = 2n and m + p = n. The heads of the table will contain the possible combinations for the function variables written in the Gray code. Putting variables on rows and columns can be done in several ways; the only condition being the correct filling in of the table. When minimizing the function the fact that a Karnaugh diagram is a closed surface and so the top and bottom edges of the table and also the left and right edges are adjacent (are attached) has to be taken into consideration.
The Quine-McCluskey method is an algebraic method for minimizing Boolean functions with a large number of variables, for which the Karnaugh map method is difficult to use. This method, based on the same principles as the Karnaugh map method, is easier to apply for the functions with a large number of variables because the method involves the consecutive building of some tables to determine the minimum form of a function. The algorithm that is lies at the basis of the Quine - McCluskey method can be easily programmed thus allowing the automatic minimization of the large functions.
The method is applied in two steps: 1. the first step determines the prime implicants of the function; 2. the second step determines the essential prime implicants to give coverage of
the function with a minimum cost. A different approach is the ESPRESSO algorithm. This algorithm was developed by
Brayton e.a. at the Berkeley University, California, [4].

International Conference 2ND International Conference on Innovations, Recent Trends and Challenges
in Mechatronics, Mechanical Engineering and New High-Tech Products Development
MECAHITECH‘10
Bucharest, 23-24 September 2010
249
This algorithm works with "cubes" which are the product of the function’s terms that are iteratively determined. This way of working separates this algorithm from the classical ones that are based on the factorization of the function in mini terms. The minimizing result does not lead to an absolute minimum but the obtained results are very close to it and the result does not include redundant terms. Compared with other methods, this method can be done more efficiently on a computer program. Using this algorithm on a computer system leads to a calculation time and a lower memory consumption. The algorithm does not impose restrictions on the number of variables, output functions or on the number of blocks of the combinational logic function that is minimized. Combinational logic functions with dozens of outputs and dozens of variables can be easily calculated using this algorithm.
For the ESPRESSO algorithm, it is necessary to submit the truth table of the function for minimization at the entry point and the minimized function will be obtained at the output. Basically, this algorithm tries to use the product of the terms at as many output functions for the given function. There is though the possibility that each output function to be treated independently. In this way the algorithm can be used effectively in programmable logical matrixes on two levels such as the PLA (Programmable Logic Array) or PAL (Programmable Array Logic).
Given the performances of the EXPRESSO algorithm it is currently used in many applications involving the use of FPGAs (Field Programmable Gate Array) or ASIC (Application Specific Integrated Circuit). BINARY FUNCTION MINIMIZATION SOFTWARE
The minimization program is implemented in Visual Basic programming environment version 5.0. With this program, minimizing the combinational logic functions with up to 20 variables can be done. The number of the binary function’s variables can be increased if the computer system resources allow this. A combinational logic function with 20 variables can have no more than 1,048,576 terms which in most practical cases is sufficient.
The first step is grouping the terms in which a single variable has different values in distinct terms. The variable that changes must be kept at the same rank in the terms that are grouped. The second step is trying to group the already grouped terms. The grouped terms can be grouped again if the following conditions are accomplished: the variables already grouped are at the same rank in both terms and only one variable changes its value in the terms that are grouped. The algorithm ends when terms cannot be groups any longer. The coverage of the binary function is determined on the prime implicants’ table obtained. The coverage represents the essential and non-essential implicants’ selection that can fully describe the function. A sorting of the found coverage is made and they are displayed in the ascending order of the cost.
A simple example of a function with four variables with four terms each will be considered below. This function can be written in the disjunctive normal form as:
f4 = P5 + P7 + P13 + P15 (2)
which can be written in canonical form as:
01230121012301230123 )( xxxxxxxxxxxxxxxxxxxxf +++= (3)

International Conference 2ND International Conference on Innovations, Recent Trends and Challenges
in Mechatronics, Mechanical Engineering and New High-Tech Products Development
MECAHITECH‘10
Bucharest, 23-24 September 2010
250
The initial terms of the function are put in a matrix called in the program "Terms1". In the first step, the terms that can be grouped are placed in the matrix "Terms2". The terms that could not be grouped are placed in a matrix named "End". The terms of the matrix „End” represent the prime implicants of the binary function. For the function in the example, the situation in Figure 1 is presented.
Next, the contents of the matrix „Terms2” are transferred in the matrix "Terms1" and the process is repeated (Figure 2).
After this phase, it appears that the terms cannot be grouped any longer and thus the matrix "Terms2" will be empty, this leading to the completion of the algorithm. The term from the matrix "Terms1", which was not grouped, is transferred to the matrix "Final". The coverage of the function is determined (in our example it is not the case) and the sorting is made. The result of the minimization is found in the matrix "Final" (Figure 3).
Terms1
0101
0111
1101
1111
Terms2
01X1
11X1
End
Figure 1: Step 1. Initial grouping terms
Terms1
01X1
11X1
Terms2
X1X1
End
Figure 2: Grouping terms already grouped
Termeni1
X1X1
Termeni2
Final
X1X1
Figure 3: End algorithm

International Conference 2ND International Conference on Innovations, Recent Trends and Challenges
in Mechatronics, Mechanical Engineering and New High-Tech Products Development
MECAHITECH‘10
Bucharest, 23-24 September 2010
251
When starting, the program displays a main window that allows the user to enter the terms of the binary function and to launch the minimizing operation (Figure 4).
The user must enter at the beginning the number of variables of the Boolean function for minimization. The user receives some information about how the program works and about the maximum number of terms that can be introduced. The introduction of the terms by their index follows after that. The program provides assistance on the input process and on the errors that can occur, by displaying additional windows. The entered terms are also shown in their corresponding binary code for control. After entering all the terms (of the Boolean function) the minimization process starts. The resulted terms are displayed in the result window and on the position of the eliminated variables the symbol "X" is displayed. CONCLUSIONS
The program presented in this paper uses a simplified algorithm Quine-McCluskey. The code developed is optimized for the increase of the execution speed.
The main advantages of this program are the possibility of the rapid determination of the minimized forms and the increase of the designing efficiency of digital circuits configured by the user. The possibility of implementing tests for minimum convenient forms is also
Figure 4: The main window of the minimization software
After two terms are introduced, the button that triggers the minimization action becomes active.
First entering the number of the function variables, then the decimal indexes of terms are introduced.
It displays the current number of the term introduced.
The Index of the introduced term in decimal format.
Binary equivalent of the index term.
The result of the minimization.
Button to change the number of variables or to initialize the program.
Exit program.

International Conference 2ND International Conference on Innovations, Recent Trends and Challenges
in Mechatronics, Mechanical Engineering and New High-Tech Products Development
MECAHITECH‘10
Bucharest, 23-24 September 2010
252
another advantage of the minimization program. Additional terms can be introduced or different configurations can be tried in order to achieve optimum results.
The program's main drawback is the fact that increasing the number of variables of the binary function uses an appropriate amount of memory.
The tests conducted when designing and the obtained results show that this program is a useful tool that increases productivity.
REFERENCES [1] G. De Micheli, "Synthesis and Optimization of Digital Circuits", McGraw-Hill Science
Engineering, 1994
[2] S. Ahmand, R. Mahapatra, “M-trie: an efficient approach to on-chip logic minimization”, Proceedings of the 2004 IEEE/ACM International conference on Computer-aided design, p.428-435, November 07-11, 2004
[3] Erik Brunvand, Steven Nowick, Kenneth Yun, “Practical advances in asynchronous design and in asynchronous/synchronous interfaces”, Proceedings of the 36th ACM/IEEE conference on Design automation, p.104-109, June 21-25, 1999, New Orleans, Louisiana, United States
[4] R.K. Brayton, A. Sangiovanni-Vincentelli, C. McMullen, G. Hachtel, "Logic Minimization Algorithms for VLSI Synthesis", Kluwer Academic Publishers, 1984
[5] Alan Marshall, Polly Siegel, Bill Coates, “Designing an Asynchronous Communications Chip”, IEEE Design & Test, v.11 n.2, p.8-21, April 1994
[6] J. W. J. M. Rotten, M. R. C. M. Berkelaar, C. A. J. van Eijk, M. A. J. Kolsteren, “An efficient divide and conquer algorithm for exact hazard free logic minimization”, Proceedings of the conference on Design, automation and test in Europe, p.749-754, February 23-26, 1998, Le Palais des Congrés de Paris, France
[7] Vigyan Singhal, Carl Pixley, Adnan Aziz, Shaz Qadeer, Robert Brayton, “Sequential optimization in the absence of global reset”, ACM Transactions on Design Automation of Electronic Systems (TODAES), v.8 n.2, p.222-251, April 2003
[8] Wilsin Gosti, Tiziano Villa, Alex Saldanha, Alberto Sangiovanni-Vincentelli, “FSM Encoding for BDD Representations”, International Journal of Applied Mathematics and Computer Science, v.17 n.1, p.113-124, Number 1 / March 2007
[9] Nikhil Saluja, Kanupriya Gulati, Sunil P Khatri, “SAT-based ATPG using multilevel compatible don't-cares”, ACM Transactions on Design Automation of Electronic Systems (TODAES), v.13 n.2, p.1-18, April 2008

International Conference 2ND International Conference on Innovations, Recent Trends and Challenges
in Mechatronics, Mechanical Engineering and New High-Tech Products Development
MECAHITECH‘10
Bucharest, 23-24 September 2010
253
Potential Fields Method : Theoretical and Experimen tal Analyze of
the Algorithm
Vlad Vaduva National Institute of Research and Development in Mechatreonics and Measurement Technique
Pantelimon 6-8, sector 2, Bucharest, ROMANIA [email protected]
ABSTRACT
In this paper is analyzed the potential fields algorithm. The study shows how we have implemented the theoretical method and how we have simulated the results of navigation with obstacles and one target. Also, we tested this method practically by creating an autonomous caterpillar robot and programmed it with this algorithm. We compared the results and we analyzed the areas where the robot presents most of the errors and those where it goes off the simulation normal path.
INTRODUCTION
The movement of a virtual robot in a virtual space has been examined in order for it to obtain the capacity to adapt to peculiar conditions without man’s interference. When talking about a real robot, one can use several strategies to achieve this aim, such as the space mapping strategy, the surface scanning strategy, the strategy of iterative methods and others. For iterative methods, the motion trajectory planning algorithm builds the trajectory standing on a set of spatial positions and the intelligent control system transposes this trajectory in the spatial positions taken by the robot.
With the use of iterative methods, the performances of the robot system can be adjusted to a level that will allow him to adapt to new situations. The adjustment process continues in accordance to the established protocol until the wanted accuracy is obtained. THE POTENTIAL FIELDS METHOD
In Potential fields method, we use vectors to represent behavior (in particular, for the motor diagram of the behavior) and the vector summing operation for combining the vectors that correspond to different behaviors in order to obtain the emergent behavior. A potential field is a picture (field) of vectors, characterized by an amplitude and a direction (a, d). Generally, vectors are used to represent forces of a certain nature. They are drawn as an arrow, whose length represents the amplitude (size) of the force, while the angle represents the direction. A picture of vectors represents a region of space. The objects that can be perceived in a certain region of the space exert a force field (attraction, rejection, etc,) to the surrounding regions. A force field can be considered analogous to a magnetic field or to a gravitational field. The robot can be seen as a particle entering the field that is generated by an object or by the environment. That region can be divided into small squares; a network of points characterized by the

International Conference 2ND International Conference on Innovations, Recent Trends and Challenges
in Mechatronics, Mechanical Engineering and New High-Tech Products Development
MECAHITECH‘10
Bucharest, 23-24 September 2010
254
coordinates (x,y) is being created. Thereby, each element of the picture represents a vector (force) associated with each such point. Such a vector is defined by the movement direction and by the amplitude (or velocity) of the movement in that direction; these are some components a robot would perceive if he were in that position. Since each and every point in space has a corresponding vector, potential fields are continuous PROGRAMMING POTENTIAL FIELDS
The potential fields methodology entails that all behaviors should be implemented as potential fields. The main characteristic states that the mixing up of the behaviors will be possible through vector sum. Generally, upon the robot will operate „forces” generated by multiple behaviors that act in concurrent mode.
In order to navigate in a simple way towards a target, we will consider a robot heading a target (for example, he moves 10 meters in the x direction and then he meets an obstacle).
For representing the movement, we will use: a travel behavior towards the target, whose motor diagram move2goal is represented as an attraction potential field. To detect the proximity to the target, odometer measurements can be used for a obstacle avoidance behavior, whose motor diagram Avoid is represented as a rejection potential field that uses a distance sensor to detect the proximity to the obstacle.
Fig. 1.Diagram representing potential fields implementation EXPERIMENTAL RESULTS
The potential fields’ method was firstly simulated and afterwards implemented on the robot. The target of the robot was positioned at 5 meters from it; three other obstacles were placed along its trajectory. The simulation of the trajectory is similar to the real track of the robot; possible displacements from the ideal trajectory are due to the reduced accuracy of the main board and of the microprocessor that has been used to program the kinematics and the potential fields’ method. Other slightly errors possibilities are the known problems of potential fields method 1. Trap situations due to local minima (cyclic behavior). 2. No passage between closely spaced obstacles. 3. Oscillations in the presence of obstacles. 4. Oscillations in narrow passages. In this case if the intesity of a sum in any point of the path is 0 our robot remains blocked ( local minima problem)

International Conference 2ND International Conference on Innovations, Recent Trends and Challenges
in Mechatronics, Mechanical Engineering and New High-Tech Products Development
MECAHITECH‘10
Bucharest, 23-24 September 2010
255
Fig. 2. The ideal trajectory of the robot
Fig. 3,4. 3D representations of the mathematical model with 3 obstacles
Fig. 5. Real trajectory overlapped the ideal trajectory

International Conference 2ND International Conference on Innovations, Recent Trends and Challenges
in Mechatronics, Mechanical Engineering and New High-Tech Products Development
MECAHITECH‘10
Bucharest, 23-24 September 2010
256
The way the robot navigates in the same condition like in the mathematical model ( 3 obstacles and one target ) is represented with black. CONCLUSION
It can be easily observed that the area where the robot comes near the target and also the area where are influences by the two near obstacle represents the biggest difference.
Most researchers concentrate their efforts on simulation programs of potential fields; they don't seem to be aware of the substantial possibly irresolvable problems that are bound to surface once actual implementation in an experimental system is attempted. Other researchers work with actual mobile robots, but at slow speeds which conceal the disadvantages of the Potential Fields Method. Because of the results of this study, the errors and disadvantages who made the path of the robot off it’s theoretical planned steps we currently test the method called the vector field histogram created by Johann Borenstein and Yoram Koren, a method that theoretically produces less errors, a smooth and non-oscillatory motion.
REFERENCES
[1] Arkin, R.C , “Motor Schema-Based Mobile Robot Navigation” , The International Journal of Robotics , 1989
[2] Everett H.R ,“Sensors for mobile robots” A.K Peters Ltd,1995
[3] Borenstein , J. Koren , Y, "Real-time Obstacle Avoidance for Fast Mobile Robots in Cluttered Environments." The 1990 IEEE International Conference on Robotics and Automation, Cincinnati.
[4] S.K Pradhan ,D.R Parhi ,A.K Panda ,R.K Behera, Potential fields method to navigate several mobile robots,Springer Netherlands,2006

International Conference 2ND International Conference on Innovations, Recent Trends and Challenges
in Mechatronics, Mechanical Engineering and New High-Tech Products Development
MECAHITECH‘10
Bucharest, 23-24 September 2010
257
Optical Tracking Method for Mechatronic Systems
Rotar Dan
“Vasile Alecsandri” University, Calea Marasesti 157, cod: 600115, Bacau, Romania,
[email protected]; [email protected]
ABSTRACT
Determining the position is one of the important requirements of the mechatronic systems. Various types of transducers and different types of solutions are used to determine the position, among which the most advanced are the ones based in the optical principles. The optical systems allow determining the position in more coordinates and have the advantage of a high accuracy in conditions when direct contact is avoided.
This paper presents a few solutions for determining the position by using electronic system usually used at the mouse device.
The main advantages of such a system are the high accuracy (which is steadily growing), determining the position in two coordinates, very low mechanical wear, the low price, digital processing of information. The main disadvantage of such a system is the fact that the sensor requires a perfectly flat surface and a particular type of surface. The solutions currently used are applied for different types of robots that can move on flat surfaces.
This paper presents a solution for the positioning of a stand in which the sensor is positioned on the opposite surface of the active surface. In this way you can ensure the necessary conditions to protect the sensor, and the necessary quality of the surface needed by it. This way, the active surface can be used for different purposes, because the surface is not necessarily flat (e.g. holding devices)
Another solution presented is that of a positioning system for two mechanical hands designed for manipulating pieces on a chessboard. Such a system provides three axis of reference, the sensor being placed on hand tools.
The signal from the optical sensor is taken over by a computer system built with a microcontroller. The micro system provides the signal processing and develops the controls for the actuators. INTRODUCTION
The optical system used for determining the position of the mouse type devices has many advantages in establishing the position in the plane [1] [2]. The provided resolution is high, currently leading to resolutions of 4000 dpi (dots per inch). The optical system for determining the position contains no moving mechanical parts and therefore has a high reliability [3] [4]. Because the signal is transmitted serially, wireless connections (Wireless) can be easily made. The disturbances’ influence on the position transducer is very small. The data are provided in digital format, which allows direct connection to a computer system. The computer system can diagnose and track the status of the position transducer.

International Conference 2ND International Conference on Innovations, Recent Trends and Challenges
in Mechatronics, Mechanical Engineering and New High-Tech Products Development
MECAHITECH‘10
Bucharest, 23-24 September 2010
258
The main disadvantage presented by such a system is that the surface on which the position transducer moves should be flat and have certain features for the best possible results.
Hereinafter, a few solutions for using this type of position transducer will be present [5].
In Figure 1, the position transducer is mounted on the
movable element. This way, on the top surface of the movable element, holding devices or other items can be mounted. The fixed surface is flat and properly processed as for the optical position transducer to function properly. For this version, the fixed surface has to be protected from any contaminants that may reach the movable element, with protective aprons or movable protection casing.
In Figure 2 the optical displacement transducer is mounted on the fixed element. For this solution the lower surface of the movable element has to be properly processed for the optical position transducer to properly function. The upper surface of the movable element must not be flat and on this surface various components can be
mounted (e.g. holding device). The flat surface need not be flat. For this solution, the optical position transducer is better protected from any impurities that may fall on the active surface.
The solutions shown in Figure1 and Figure2 can be applied to a single coordinate movement or a displacement on two coordinates. Also, between the movable element and transducer a pantograph type device can be inserted. This allows for increased/decreased of the amplitude motion with direct impact on the resolution. The addition of a pantograph-type device also allows the mounting of the optical position transducer in a protective area. Based on this idea, hereinafter, a variant of the mechanical hand is presented.
Figure 3 presents the solution of a manipulator that can move in three coordinates. This handler is used to move
movable element
flat surface
optical position transducer
Figure 1: The use of transducer for movable element
movable element
flat surface
optical position transducer
Figure 2: The transducer’s use on fixed element
Figure 3: Pantograph manipulator
x
x y
y z
z
flat surface
movable element
optical position transducer
O
A
B
C
D
P

International Conference 2ND International Conference on Innovations, Recent Trends and Challenges
in Mechatronics, Mechanical Engineering and New High-Tech Products Development
MECAHITECH‘10
Bucharest, 23-24 September 2010
259
chess pieces on the board, but it may have other similar applications. The manipulator shown in Figure 3 is based on the pantograph. In the point P is a
mechanical arm that allows grabbing the pieces on the chessboard. The mechanical arm can move in three axis of reference by operating in two points. On the z-axis, the movement is made between two fixed positions by operating in the O point with the help of a pneumatic device or relay. Thus, on the z axis, the mechanical hand can only have two positions: "high" when the mechanical hand is moving over the chessboard and "low" when the mechanical arm grabs and places a chess piece on the board.
The movement in the xOy plane of the mechanical hand is made by operating point D. The amplitude of the point D motion increases at the P point by the following equation (Eq. (1)):
tconskOD
OP
OA
OBtan=== (1)
where OA, OB, OP, DO are segments defined in Figure 3.
The optical position transducer found in the D point provides the information of the plane position. According to Eq (1) the resolution of the optical position transducer should be relatively high for the positioning accuracy of point P to be good.
The advantage of the solution lies in the separation of the action field position of the mechanical hand from the measurement field.
THE OPERATING PRINCIPLE OF THE OPTICAL POSITION TRA NSDUCER
As it was shown, the optical device for determining the position is actually a mouse type device [6]. Such a device is used due to the optical system already installed, although such a construction is easily achieved. The manufacturer provides the user with all components and all the necessary documentation to make such a device.
The optical system for determining position comprises of two integrated circuits and a minimum number of components. One of the integrated circuits is the optical sensor and the other one is the DSP (Digital Signal Processor). The communication between the two circuits is done by a SPI serial interface (Serial Peripheral Interface). The DSP circuit communicates via a USB interface (Universal Serial Bus) or via a PS/2 (Personal System/2-IBM) with another computer system [7].
The optical sensor is a complex integrated circuit that has several functions. The main function is to capture an image obtained through reflection with the use of an image processor. The light source for obtaining the image is a LED (Light Emitting Diode) or a laser diode. The image processor (which works like a video camera) acquires images with a relatively low resolution and compares them in order to find meaning and the amplitude of the movement. The amplitude of the horizontal and vertical movement is quantified and stored in two registers: “Delta_X” and “Delta-Y”.
Such an image processor can capture a variable number of frames in a second in order to adjust to the movement speed (e.g. the frame rate may vary between 1000 and 6400 fps - frames per second). The distance between lens of the optical system and the surface has to be 2.5 mm. The resolution of such an image processor can reach 1600 cpi

International Conference 2ND International Conference on Innovations, Recent Trends and Challenges
in Mechatronics, Mechanical Engineering and New High-Tech Products Development
MECAHITECH‘10
Bucharest, 23-24 September 2010
260
(counts per inch) indicating the number of increments or decrements performed on the records Delta_X and Delta-Y when the sensor is moving 25.4 mm (1 inch).
The image processor is a programmable device, the company producing providing the appropriate programming software and subsequent updates. The programming of the device is done via a serial SPI interface and the work methods are established through image processor's internal registers. . The main modes are: the reading of the state of the image processor, its configuration, the reading of the data corresponding to the movement and the reading of the acquired image data.
The DSP circuit that connects to the image processor is an 8 bits RISC (Reduced Instruction Set Computing) microcontroller. The main tasks of the DSP circuit are the programming and configuration of the image processor and providing the interface with the computer through the USB interface or PS / 2. The DSP circuit controls the optical image processor and process its displacement information.
Figure 4 presents the schematic diagram of the optical system for measuring displacement. This system is taken from a mouse device and is adapted to the solutions presented in Figures 1-3.
The protocol used for the DSP circuit interface with the computer is what interests the user. The application presented in this article uses the PS/2
interface because this one is easier to connect to a general-purpose microcontroller. The PS / 2 interface is a serial interface which allows the information transfer bit by
bit. It is used for both the command and the control of the optical measuring system and for reading the data supplied by it. The information circulates both ways between the optical measuring system and the computer connected to the PS/2 interface establishing a dialogue
under the PS/2 protocol standard. The physical connection
PS / 2 requires three connections: a data link (Data) which is bi-directional, the information moving on this connection both ways, a bi-directional Clock connection which is the synchronization signal for the data signal and a Ground signal
connection. It follows therefore that the PS / 2 interface is a synchronous, bi-directional serial connection. The clock signal is generated by the data sending device, the receiving device using the clock signal to synchronize the data signal.
Hereinafter, the optical measuring system will be referred to as "device" and the computer system to which it is connected as "host". The PS/2 protocol uses data package of eleven bits with the following structure: one star bit, eight data bits, one bit of parity and one stop bit (Figure 5)
Figure 5: The structure of the data package
Figure 4: The schematic diagram of the optical measuring system
Optical mouse sensor
DSP
LED
PS/2 Connector
Surface
2.5 mm

International Conference 2ND International Conference on Innovations, Recent Trends and Challenges
in Mechatronics, Mechanical Engineering and New High-Tech Products Development
MECAHITECH‘10
Bucharest, 23-24 September 2010
261
Under the application of power or at the activation, the device sends the host two bytes of data. The first byte indicates that the self-testing (AAh) was passed and the second byte is the device ID (00h). After the host receives and verifies this information it sends an initialization byte (Reset) (FFh) and awaits confirmation (FAh). After initialization the device variables: the host to the device transmits the scale factor, the resolution, etc. After each byte sent, the host verifies if the device received it by receiving a confirmation byte (FAH) or by request of a repeat control (FEH). After all the variables have been set, the host sends to the device the request to start recording device movements.
When the device moves, it sends to the host three bytes (Table 1):
Table 1 Bits Sent by Host
Bit 7 Bit 6 Bit 5 Bit 4 Bit 3 Bit 2 Bit 1 Bit 0 Byte 1 Y overflow X overflow Y sign bit X sign bit Always 1 Middle Btn Right Btn Left Btn Byte 2 X Movement Byte 3 Y Movement
The first byte contains information about the direction of movement of the device from
its previous position, about overcoming the value of the byte two and three and about the mouse buttons positions (not used in this application). The two and three bytes provide information on the movement of the device on the x-axis and the y-axis. The values of the two and three bytes are calculated based on the values of Delta_X and Delta-Y registers from the image processor.
In order to be able to use the displacement information provided by the optical measuring system shown in Figure 4 for the control of the mechatronic systems, an electronic circuit provided with a 16F876 Microchip microcontroller was developed.
THE CIRCUIT DIAGRAM OF THE COMPUTER SYSTEM
The optical displacement measuring system is connected through the PS/2 interface to a computer system developed with a microcontroller.
The circuit diagram of the system is shown in Figure 6. This figure, the integrated circuits are represented by: U1, the 7805 5V voltage stabilizer for feed through; U2, the Microchip PIC 16F876 microcontroller, U3, the MAX232 circuit for transmission / reception and U4, the 4050 serial bi-directional buffer circuit. In addition, the circuit contains a keyboard with 12 keys, a LCD (Liquid Crystal Display) display circuit, a J1 PS / 2 connector for connecting to the optical system for determining the position (mouse type device), a J2 DB-9 type nine-pin connector for connecting to the serial interface compatible with the standard RS232, a J3 connector for connecting to the control drives on the X, Y and Z axis, a system initialization button (RESET), a contact for system origin referral (ORIGIN) and a piezoelectric speaker for acoustic signals.
The main circuit, the PIC 16F876 microcontroller, has the following main features (used in this application): a RISC central unit with 35 instructions which are executed in one machine cycle, 8 K Flash memory program words, 368 bytes SRAM (Static Random Access Memory), 256 bytes EEPROM, 22 digital I / O, a USART (Universal Asynchronous Receiver Transmitter sync) serial interface, timer circuits and a cutting edge interruption system. It

International Conference 2ND International Conference on Innovations, Recent Trends and Challenges
in Mechatronics, Mechanical Engineering and New High-Tech Products Development
MECAHITECH‘10
Bucharest, 23-24 September 2010
262
must also be noted that the microcontroller contains a number of additional modules that have not been used in this application and therefore were not mentioned here.
The MAX232 integrated circuit ensures the appropriate voltage levels (±12V) for the
serial communication as the RS232 standard states.
The microcontroller ensures the dialog between the mouse type device and it receives the displacement information provided by the PS / 2 standard. Because the inputs / outputs of the microcontroller are not bi-directional it was necessary to use the U4 buffer circuit to adapt them to the "DATE" and "CLOCK" lines. The "CLOCK" signal, which reaches the microcontroller at the PORTB.7 entrance, causes a disruption. In the interruption routine, the incoming data from the „DATA” line from the optical circuit are synchronously read in order to determine the position.
The keyboard of the micro system allows the entering of the local commands and of the coordinates for the positioning system. The LCD display system consists of a 2x16 character screen that allows the display of local messages with information on the operation and positioning.
The actuators command on each axis is done through the "RL1", "RL2" and "RL3" relays. The control of the relays is done through the “Q1”, “Q2” and “Q3” transistors that are connected to the digital outputs of the microcontroller. Their internal timers of the microcontroller control these outputs so that appropriate positioning commands can be generated.
Figure 6: The circuit diagram of the micro system
EMISSIONRECEPTION
DATA
CLOCK
VI1 VO 3G
ND
2
U17805
C1100n
C2
100uC3
100n
C4
100u
+12V +5V
RA0/AN02
RA1/AN13
RA2/AN2/VREF-4
RA4/T0CKI6
RA5/AN4/SS7
OSC1/CLKIN9
OSC2/CLKOUT10
RC1/T1OSI/CCP2 12
RC2/CCP1 13
RC3/SCK/SCL 14
RB7/PGD 28RB6/PGC 27
RB5 26RB4 25
RB3/PGM 24RB2 23RB1 22
RB0/INT 21
RC7/RX/DT 18RC6/TX/CK 17
RC5/SDO 16RC4/SDI/SDA 15
RA3/AN3/VREF+5
RC0/T1OSO/T1CKI 11
MCLR/Vpp/THV1
U2
PIC16F876
123
456
789
0#
123
A
B
C
D
X1
20MHz
LS1
SPEAKER
162738495
J2
CONN-D9
D7
14D
613
D5
12D
411
D3
10D
29
D1
8D
07
E6
RW
5R
S4
VS
S1
VD
D2
VE
E3
LCD1LM016L
C522p
C6
22p
RV110k
+5V
C7
10u
R110k
RESET
R2
10k
R3
10k
R4
10k
C8
10u
C9
10u
T1IN 11R1OUT 12
T2IN 10R2OUT 9
T1OUT14R1IN13T2OUT7R2IN8
C2+
4
C2-
5
C1+
1
C1-
3
VS+2VS-6
U3
MAX232C1010u
C1110u
3 2
U4:A
74HC4050
54
U4:B
74HC4050
7 6
U4:C
74HC4050
910
U4:D
74HC4050
25
16
4 3
E
J1PS/2
+5V
Q1
BD139
Q2
BD139
R5
1k
R6
1k
RL1RL2D1D2
MO
TO
R C
OM
MA
ND
YX
US
ART
KEYBOARD
PS/2
DISPLAY
Q3
BD139
D3
R7
1k
RL3
123456789
J3
Z
ORIGIN

International Conference 2ND International Conference on Innovations, Recent Trends and Challenges
in Mechatronics, Mechanical Engineering and New High-Tech Products Development
MECAHITECH‘10
Bucharest, 23-24 September 2010
263
The circuit is powered by 12 DC unstabilized V and 5V DC stabilized 5 V by the U1 circuit.
The microcontroller is provided with a program that operates in real time to ensure the proper implementation of the tasks set.
THE MICRO SYSTEM PROGRAM
The micro system with the PIC 16F876 microcontroller is programmed to operate independently or connected to a PC (Personal Computer) through a serial interface. The program was written in MikroBasic.
Hereinafter, the application made for the chess player handlers will be described below, because this application also covers the other ways being the most complex.
The micro system program must fulfill several tasks. Of these, the main tasks are: - to run self-testing and self-diagnosis sub programs at startup and initialization
and to display the information on the LCD device. - to provide command and control optical measuring system; - to provide closed loop control of the positioning system for the x and y axis
and to order the z axis; - to ensure local dialogue with the operator through a command language; - to ensure dialogue with the superior system, the PC computer.
The micro system program has only one main interruption caused by the incoming clock signal from the optical positioning system. In this interruption working with the optical positioning system is ensured. The interruption works as a finite-state machine providing a certain state of the optical positioning system for certain input combinations.
The main combinations are: - boot device - be it at the beginning of the session or when it reaches the origin; - scheduling the parameters for reading the position – is done after initialization or
when changing the resolution; - reading the coordinates – is done at the automatic positioning or in the learning
phase. - the control of the positioning is done by the micro system in three different cases: - when the micro system is working independently, the user enters the coordinates
of the point, after which it performs in closed loop positioning; - when the micro system works connected to a superior system such as a PC, the
coordinates are received from the computer, the micro system ensures the positioning and signals the moment the action is concluded through the serial interface.
- in the learning phase when the micro system is connected to a PC. The positioning is done manually, and the coordinates are sent via the serial interface to the PC through a command from the micro system keyboard.
The position controller programmed for the micro system can calculate simple interpolations to reduce the positioning time. For complex movements, the micro system has to work connected to a superior interface through the serial interface.
In this version, the positioning in the xOy plane is done when the manipulator is on the z-axis in the "up" position. After the positioning, the arm is lowered and its moving in the xOz plane is no longer possible.

International Conference 2ND International Conference on Innovations, Recent Trends and Challenges
in Mechatronics, Mechanical Engineering and New High-Tech Products Development
MECAHITECH‘10
Bucharest, 23-24 September 2010
264
The dialogue with the local operator is similar to that done by the serial interface with the superior system. Due to the limited possibilities offered by the local keyboard of the micro system, the structure of a command line was as a combination of its characters.
The command begins with a "#" character followed by two digits. This way, 100 separate commands are possible, which amply covers the requirements for micro system command. The command itself may not have any operand or may be followed by one or more operands also separated by the character "#". The command termination character is "*". An example of a command string can be: # 07 # 137 # 028 *. The commands entered are shown locally on the LDC. The coordinates’ values are entered in millimeters. The commands sent via the serial interface are ASCII (American Standard Code for Information Interchange) character strings for enabling the use of the common PC communication programs. CONCLUSIONS
This paper presents a positioning system with a mouse type device for a mechatronic system. For using a mouse type device, a 16F876 PIC microcontroller that can be connected to a superior computing system was developed and programmed. The performed experiments lead to the following: the obtained results are very good, the system ensuring the correct positioning and the possibility of training. Thus the system can be taught to perform certain predetermined movements. Another advantage of the system is that the determination of the origin has to be done only at the beginning. The coordinates kept a relatively long time allowing the system to recalibrate only when the movements require passage through the origin. However, the system cannot ensure the proper positioning for precision work. But, the low price and its simplicity of use are still making this system useful for the mechatronic positioning systems. REFERENCES [1] Marcel Tresanchez, Tomàs Pallejà, Mercè Teixidó and Jordi Palacín, “Using the Optical
Mouse Sensor as a Two-Euro Counterfeit Coin Detector”, Sensors 2009, 9, 7083-7096
[2] Ng, T.W. “The optical mouse as a two-dimensional displacement sensor”, Sens. Actuat. A-Phys. 2003, 107, 21-25.
[3] Palacin, J.; Valganon, I.; Pernia, R. “The optical mouse for indoor movable robot odometry measurement”, Sens. Actuat. A-Phys. 2006, 126, 141-147.
[4] Minoni, U.; Signorini, A. “Low-cost optical motion sensor: an experimental characterization”, Sens. Actuat. A-Phys. 2006, 128, 402-408.
[5] Cooney, J.A.; Xu, W.L.; Bright, G. “Visual dead-recknoing for motion control of a mecanum-wheeled movable robot”, Mechatronics 2004, 14, 623-637.
[6] Tresanchez, M.; Pallejà, T.; Teixidó, M.; Palacin, J. “The optical mouse sensor as an incremental rotary encoder”, Sens. Actuat. A-Phys., in press.
[7] Agilent, ADNS-3060 “High-performance Optical Mouse Sensor”, Hewlett-Packard

International Conference 2ND International Conference on Innovations, Recent Trends and Challenges
in Mechatronics, Mechanical Engineering and New High-Tech Products Development
MECAHITECH‘10
Bucharest, 23-24 September 2010
265
The Influence Of Non-Linear Elastic Systems On The Measuring
Precision Of Measuring And Control Systems For Mome nts/Forces In Static Mode
Sorin Alecsa
National Institute of Research and Development in Mechatreonics and Measurement Technique Pantelimon 6-8, sector 2, Bucharest, ROMANIA
INTRODUCTION
It is well known the fact that the majority of measuring and/or control systems have a linear characteristic between the variation of the input measure and the output measure and the variation of the input value is given by the following relation:
Xe = Sa Xi (1) Where: Xe – output measure; Xi – input measure; Sa – sensitivity of the measuring system.
We consider that from the theoretical point of view a measuring system of the torsion measuring / force, made up of 2–4 elastic slide elements that are exposed to deformations under the action of the torsion moment Mt; the conditions of functioning and fixing of the slides is depicted schematically in figure1.
Fig. 1. The functioning scheme: 1-elastic slide elements: 2-4 slides, 2-central axis, 3-supports, 4-
poniters, 5-gradated scale.

International Conference 2ND International Conference on Innovations, Recent Trends and Challenges
in Mechatronics, Mechanical Engineering and New High-Tech Products Development
MECAHITECH‘10
Bucharest, 23-24 September 2010
266
The elastic slide elements are fixed at a head on the central axis (2) and the other head are fixed in the supports (3) that allow the displacement without friction on the longitudinal direction of the slide.
The pointer (4) visualizes the output measure of the system – αa angle. On the gradated scale (5), the αa angle is transformed in moment / force units. In the current work, I will highlight the differences that appear between the characteristic elements of the geometrical elements of the elastic slide in case of great deformations differing from those of the Ist order.
For this case, the „small deformation hypothesis” can no longer be accepted and the exact geometrical shape of the deformed curve that the elastic elements under the action of the efforts must be taken into account as in fig. 2.
Figure 2. The geometrical elements of the exact deformed curves of an elastic slide
Due to the symmetrical distribution of the efforts on the entire system, we will carry
out the analysis of the calculations of the deformations only for one slide. Starting from the equation of the curve, we have:
(2) Where M(x,y) is the bending moment in the x section, V the reaction in point 0, E is
Young’s modulus, I is the moment of area of the beam. We will solve the equation (2) on the 2 intervals of the curve (1–2) as follows: For the interval (0–1) we have
(3)
Mark down: and we have:
(4) We derive the relation (4) by the ds variable, taking into account the fact that
and , then

International Conference 2ND International Conference on Innovations, Recent Trends and Challenges
in Mechatronics, Mechanical Engineering and New High-Tech Products Development
MECAHITECH‘10
Bucharest, 23-24 September 2010
267
(5) We multiply (5) with dθ and by integration then
(6) For x=l1 and θ=α where θ is the angle described by the tangent to the curve in the x
section with the OX axis), and M (l1) =0, so the integration constant will be Finally, we obtain the equation of the curve for the (0–1) interval
(7) For determining the equation of the exact curve on the (1–2) intervals, we proceed similarly and we have:
(8) From the equation of the curve over the two intervals, the following relation results:
(9) The three unknowns of the system are: reaction V, the α angle of inflection in point 1
and the β angle in point 2 where the known Ma angle functions. The first equation of the system results from the condition:
(10) For x=l, θ =β we have
(11) and then,
(12) By introducing (12) in (9) we have
(13) In the calculation of the two rotation angles, we use two geometric conditions of the
resting and the loading manner of the elastic element as it follows: 1) The projection of the deformed curve on the OX axis is constant: l1+l2 = l (14) 2) The projection of the curve on the OY axis y1+y2 =0 (15) If dx = ds · cos θ and dy = ds · sin θ then:
(16)

International Conference 2ND International Conference on Innovations, Recent Trends and Challenges
in Mechatronics, Mechanical Engineering and New High-Tech Products Development
MECAHITECH‘10
Bucharest, 23-24 September 2010
268
(17)
(18)
(19)
(20)
(21) From (21) we have:
(22) By resolving the system made up of transcendent equations (18) and (22), the two
exact values of the α and β are determined. The maximum value of the ymax quota is determined for x=2·l1 by way of the relation (19):
(23) But lm=2 l1 by means of (16) resulting in the following:
(24) In case of linear deformations of the Ist order the theory of small deformations can be
applied: „The deformations of elastic bodies are small when compared to the dimensions of the bodies. This makes that is calculation relations, when it comes to a quadrate or a higher power of a deformation, these to be neglected in comparison with first order values“. Concretely, this translates into the fact that:
(25) In these conditions resulting:
and (26)
and , (27) Applying relations 26 and 27 in 18 and 21, we obtain:
(28)
and (29)

International Conference 2ND International Conference on Innovations, Recent Trends and Challenges
in Mechatronics, Mechanical Engineering and New High-Tech Products Development
MECAHITECH‘10
Bucharest, 23-24 September 2010
269
The notations αL ani βL correspond to the values of the two angles in the case of linear deformations of first order.
By integration on the two intervals, it results:
(30)
and (31)
From 31 results (32)
And from (30), (32) (33) So, the rotation angle βL:
(34) The maximum value ymaxL is calculated with:
(35) And lmL with
(36)
If we use the notation: , we will obtain the following relations:
(37)
(38)
(39)
(40)
(41)
(42)
(43) The strength condition imposed in both linear deformations and in the superior order deformations is:
(44)
For , , it results

International Conference 2ND International Conference on Innovations, Recent Trends and Challenges
in Mechatronics, Mechanical Engineering and New High-Tech Products Development
MECAHITECH‘10
Bucharest, 23-24 September 2010
270
(45) The measure variations ymax, ymaxL; lm, lmL; β, βL are presented in the following diagrams:
Diagram1 – ymax, ymaxL variation
Diagram2 – lm, lmL variation

International Conference 2ND International Conference on Innovations, Recent Trends and Challenges
in Mechatronics, Mechanical Engineering and New High-Tech Products Development
MECAHITECH‘10
Bucharest, 23-24 September 2010
271
Diagram3 – β, βL variation Numeric example We will take into consideration a flexible elastic element with the following dimensions: Thickness a h=0,1 [mm] Width b=6 [mm] Length l=50 [mm] Dimensions L=150 [mm] I=0,5·10-3 [mm4]
E0 – is Young’s modulus of beam material = 2,06 · 105 [N/mm2] Action moment
(46)
where and maximum
(47)
where From the expression of torque:
(48)
We can get the value of the force

International Conference 2ND International Conference on Innovations, Recent Trends and Challenges
in Mechatronics, Mechanical Engineering and New High-Tech Products Development
MECAHITECH‘10
Bucharest, 23-24 September 2010
272
The β,βL, Mt, F depending on the cM parameter are presented in Table 1. Table 1
cM β [degrees] βL [degrees] Mt [N·mm2] F [N] 0.00 0.000 0.000 0.000 0.000 0.25 3.586 3.581 2.264 0.015 0.50 7.176 7.162 4.527 0.030 0.75 10.790 10.743 6.791 0.045 1.00 14.437 14.324 9.055 0.060 1.25 18.129 17.905 11.319 0.075 1.50 21.878 21.486 13.582 0.091 1.75 25.701 25.067 15.846 0.106 2.00 29.615 28.648 18.110 0.121 2.25 33.642 32.229 20.374 0.136 2.50 37.807 35.810 22.637 0.151 2.75 42.144 39.391 24.901 0.166 3.00 46.696 42.972 27.165 0.181 3.25 51.521 46.553 29.429 0.196 3.50 56.707 50.134 31.692 0.211 3.75 62.383 53.715 33.956 0.226 4.00 68.776 57.296 36.220 0.241 4.25 76.337 60.877 38.484 0.257 4.50 86.295 64.458 40.747 0.272
For and
Until attaining maximum tension we obtain the following values of Sa and SaL depending on the cM parameter in Table 2: Table 2
cM Sa SaL
0.00 0.02761 0.02761 0.00 0.000 0.25 0.02765 0.02761 0.14 56.59 0.50 0.02766 0.02761 0.20 113.19 0.75 0.02773 0.02761 0.44 169.78 1.00 0.02783 0.02761 0.79 226.37 1.25 0.02795 0.02761 1.25 282.97 1.50 0.02811 0.02761 1.83 339.56 1.75 0.02831 0.02761 2.53 396.15 2.00 0.02854 0.02761 3.38 452.75

International Conference 2ND International Conference on Innovations, Recent Trends and Challenges
in Mechatronics, Mechanical Engineering and New High-Tech Products Development
MECAHITECH‘10
Bucharest, 23-24 September 2010
273
2.25 0.02882 0.02761 4.39 509.34 2.50 0.02915 0.02761 5.58 565.93 2.75 0.02954 0.02761 6.99 622.53 3.00 0.03000 0.02761 8.67 679.12 3.25 0.03056 0.02761 10.67 735.71 3.50 0.03123 0.02761 13.11 792.31
R – reprezint ă creşterea în procente sensibilit ăŃii sistemului de m ăsură în
condi Ńii neliniare fa Ńă de cea liniar ă. Observation
All measures calculated in case of a linear elastic system are higher than the values determined for linear deformations.
For a difference between Sa and SaL less then max. 1.25%, we can use a graduated linear scale. CONCLUSIONS
- The advantage of using elastic slide consists in: as a simple design, use of a small volume of material in comparison with other elastic elements used for the same purpose, ease of calculation and dimensioning geometric characteristics and a high sensitivity of the measurement systems.
- In case of nonlinear deformations - up to the limit of acceptable tension of elastic
slides – the graduated scale of the measuring system can be calibrated so as to show any amount of torque, thereby increasing measurement interval around 100%.
REFERENCES [1] C. Berbenre, I. Berbente; BEAM AND PLATES WITH LARGE DISPLACEMENT, EDT, Bucharest, Romania, 1997 [2] T. Demian, D.D. Palade, I. Curita; ELASTIC ELEMENTS IN FINE MECHANICS DESIGN INSTRUMENTS, EDT, Bucharest, Romania, 1994. [3] Brian P. Trease, Young-Mo Moon, Sridhar Kota; DESIGN OF LARGE-DISPLACEMENT COMPLIANT JOINTS, Journal of Mechanical Design JULY 2005, Vol. 127 / pg 788-798. [4] Brian T. Edwars, Brian D. Jensen, Larry L. Howell; A PSEUDO-RIGID-BODY MODEL FOR FUNCTIONALLY BINARY PINNED-PINNED SEGMENTS USED IN COMPLIANT MECHANISMS, Proceedings of the 1999 ASME Design Engineering Technical Conferences, September 12-15, 1999, Las Vegas, Nevada.

International Conference 2ND International Conference on Innovations, Recent Trends and Challenges
in Mechatronics, Mechanical Engineering and New High-Tech Products Development
MECAHITECH‘10
Bucharest, 23-24 September 2010
274
Extracting Bone Contours in Ultrasound Images:
Energetic versus Probabilistic Methods
P.J.S. Gonçalves 1,2 P.M.B. Torres 1 1 Polytechnic Institute of Castelo Branco, School of Technology
Av Empresário, 6000-767 Castelo Branco, Portugal, 2 IDMEC-IST, Technical University of Lisbon, Av Rovisco Pais, 1049-001 Lisboa, Portugal
paulo.goncalves, [email protected]
ABSTRACT
This paper compares energetic and probabilistic methods when applied to extract femur bones in adult ultrasound images. Those methods are the active contour models, energetic) and the maximum likelihood estimation approach to parametric deformable models (probabilistic). From the results obtained, the drawbacks and advantages of each method for the application at hand are presented. The paper concludes by presenting the characteristics needed for a precise extraction of the bone contour. The experimental results obtained from a cow femur bone, from which real US images were acquired, demonstrate the validity of the approaches and the comparative study.
INTRODUCTION
In recent years robots are starting to work in the operating room, to help surgeons in surgical procedures. One of the first systems for robotic surgery was the ROBODOC [1] and the most applied is the DaVinci robot, from Intuitive Surgical. The most relevant systems for Medical Robotics are presented in survey papers [2,3]. The use of visual information obtained from medical images is widely used in Computer Aided Orthopedic Surgery (CAOS) [4]. CAOS systems are increasingly available, with several commercial and research systems now well-established [2,3]. These systems assist surgeons in preoperative planning and simulation, from the obtained bone model, and in intraoperative navigation, using tracking systems with fiducial markers attached to the patient bone, and in the robotic execution of the surgical procedure.
From the fiducial markers the position and orientation of the bone, in the intraoperative scenario, relative to the robot frame is obtained in the state-of-the-art systems, e.g., the BrainLab System [5]. Ultrasound images of bones can be used to overcome the bone incisions to attach the fiducial markers in orthopedic surgery, and to extract the position and orientation of the bone for robotic navigation during the surgical procedure. For that the bone contours must be extracted from ultrasound images.
Extracting bone contours from ultrasound images is a very difficult task. For that manual segmentation, and semi-automatic or automatic, image processing algorithms can be applied. Often these methods divide an image into homogeneous sub-regions. Homogeneity can be related to some characteristics, such as color or gray levels. In this paper gray levels will be used.
Manual extraction of contours in medical images requires expert knowledge and is a

International Conference 2ND International Conference on Innovations, Recent Trends and Challenges
in Mechatronics, Mechanical Engineering and New High-Tech Products Development
MECAHITECH‘10
Bucharest, 23-24 September 2010
275
tedious and time-consuming task. In addition, manual contour extraction is influenced by the variability of the human observer, which limits its reliability and reproducibility; it is usually the most often used in medicine. In this paper this approach will not be used because the contour must be obtained in real time.
The semi-automatic segmentation combines manual and automated methods. In these methods the user must set some initial information about the region of interest, to improve the process of automatic segmentation, like the initial position of the contour or the model parameters. Both approaches presented in this paper, active contour models [6] and probabilistic method using maximum likelihood parametric deformable methods [7] are semi-automatic.
In automatic segmentation, the algorithm automatically selects the pixels based on a predetermined set of rules. These methods are usually not very efficient due to the complexity of the images involved. In addition, the low contrast between regions sometimes leads to errors in automatic algorithms, becoming necessary human intervention, so these methods tend to be semi-automatic.
For extracting contours in images of considerable complexity as ultrasound images, two families of methods have been extensively used by the image processing community. Those methods are the energetic (active contour models [6]) and the probabilistic (maximum likelihood estimation approach to parametric deformable models [7]). This paper pretends to compare both when applied to extract femur bones in adult ultrasound images.
Whilst active contour model is a method that was originally designed for local image information around the contour, the maximum likelihood estimation approach to parametric deformable models uses all the image data to compute the observation model, being lees sensitive to image noise. This fact can be very important when dealing with noisy image data like in ultrasound images.
The maximum likelihood estimation approach to parametric deformable models used in this paper, was first presented by Jardim and Figueiredo [7]. The method was used in fetal ultrasound images of the femur and head with success. In fetal ultrasound images the bones can be fully seen in the image. In bone ultrasound images of adults, the posterior boundary of the bone, relative to the probe position, cannot be seen in the image. In this paper the later images will be tackled in order to detect the bone boundaries present in the image.
The paper is organized as follows. First are presented both the active contour models and the maximum likelihood estimation approach to parametric deformable models. Next the experimental apparatus developed for obtaining the ultrasound images is presented. The results of the experimental comparison between the two methods are presented and discussed. The paper ends with some conclusions and insights on future research.
ACTIVE CONTOUR MODELS - SNAKES
The active contour model algorithm, first introduced by Kass et al. [6], represents an object boundary or some other salient image feature as a parametric curve. Usually the features are lines, edges, and terminations. Kass et al. named their algorithm, “Snakes” because the deformable contours resemble snakes as they move.
In snakes, is used the technique of matching a deformable model to an image by means of energy minimization. A snake initialized near the target gets refined iteratively and is attracted towards the salient contour. A snake in the image can be represented:

International Conference 2ND International Conference on Innovations, Recent Trends and Challenges
in Mechatronics, Mechanical Engineering and New High-Tech Products Development
MECAHITECH‘10
Bucharest, 23-24 September 2010
276
))(),(()( sysxsv = (2)
A snake is defined as an energy function:
dssvEsvEsvEE conimagesnake ))(())(())((1
0 int ++= ∫ (3)
Where Eint represents the internal energy of the spline, Eimage denotes the image forces acting on spline and Econ serves as external constraint forces introduced by the user.
The Internal Energy provides a smoothness constraint, defined as:
2
)()()()(
2
)|)(|)(|)(|)((
2
2
22
int
22
int
+
=⇔+
=
sds
vdss
ds
dvs
Esvssvs
E sss
βαβα
(4)
Where α(s) is a measure of the elasticity and β(s) is a measure of the stiffness of the
snake. The first order derivative, makes the spline act like a membrane (“elasticity”) and the second order derivative makes it act like a thin-plane (“rigidity”).
The image energy has three components, Lines, Edges and terminations.
termtermedgeedgelinelineimage EWEWEWE ++= (5)
Where Eline is defined simply by the image function:
),( yxIEline = (6)
If Wline is large positive the spline is attracted to light lines and if is large negative then it is attracted to dark lines.
Edge attracts the snake to large intensity gradients, and as defined by:
2),( yxIEedge ∇−= (7)
Curvature of level lines in a slightly smoothed image is used to detect corners and terminations in an image. Let , the smoothed image, resulting from the convolution of the original image with a smoothing Gaussian filter.
Let , the gradient angle. , unit vector along gradient.
, perpendicular to gradient. Then the curvature of the level contours in C(x,y) can be written:
( ) 2/322
2222 2
/
/
yx
yxxyxxyxyytermterm
CC
CCCCCCCE
nC
nC
nE
+
+−=⇔
∂∂∂∂
=∂∂= ⊥
⊥
θ (8)

International Conference 2ND International Conference on Innovations, Recent Trends and Challenges
in Mechatronics, Mechanical Engineering and New High-Tech Products Development
MECAHITECH‘10
Bucharest, 23-24 September 2010
277
MAXIMUM LIKELIHOOD PARAMETRIC DEFORMABLE MODELS
The method used in this paper, was first presented by Jardim and Figueiredo [4], and is based in a maximum likelihood estimation approach to parametric deformable models. The method is based in:
- the observed data Ζ, i.e., all the image pixels gray levels in the image;
- the probabilistic observation model, e.g., , where θ is a set of parameters that
describe the contour shape. Using the maximum likelihood (ML) criterion, the best estimate of the parameter set,
MLθ , is given by:
( )θθθ
ZpML maxargˆ = (9)
Next, the observation model, i.e., the likelihood function , must be defined. Following [6] a region based model is adopted, that is robust to local artifacts and poor image quality, e.g., ultrasound images. This model assumes that all the pixels in a defined region obey to a given statistical model, i.e., the region is homogeneous. In this paper are defined two regions, the first inside the contour and the second outside the contour. The two regions are separated by the boundary, contour, to detect.
The observed image Ζ (a M×N array of gray levels) is modelled as a random function
of the object’s boundary curve , which is a parametric function of unknown parameters θ. Moreover, Ζ may also depend on some additional observation parameters ϕ, accordingly, our likelihood function should be written as .
The region based model is derived from the two following hypothesis: - Region homogeneity. The conditional probability of the pixel only depends on the
region where the pixels belongs, e.g., inside or outside the contour. All the pixels in a region have the same probability function defined by the parameters or , inside or outside the contour. Thus .
- Conditional independence. Given and the parameters , the image pixels are conditionally independently distributed. This hypothesis simplifies the model and ignores some characteristics of ultrasound images, attenuation and pixel dependence due to speckle.
Thus, the joint probability density function is defined as
( ) ( )( )( ) ( )( )
( )( )( ) ( )( )
∏∏∈∈
=θθ
ϕϕϕθvOji
outjivIji
inji ZpZpZp,
,,
,, (10)
where is the value of the image pixel . and are, respectively, the
inside and outside regions of the contour . ( )( )injiZp ϕ, and ( )( )outjiZp ϕ, are, respectively,

International Conference 2ND International Conference on Innovations, Recent Trends and Challenges
in Mechatronics, Mechanical Engineering and New High-Tech Products Development
MECAHITECH‘10
Bucharest, 23-24 September 2010
278
the pixel marginal probability functions of the inner and outer regions.
Given that ultrasound images follow a Rayleigh distribution, the pixel marginal probability densities have the form
( ) 0for,2
exp2
≥
−= xxx
xpσσ
σ (11)
From the above equation, , the variance of the pixels inside and outside the contour.
From the observed image, Ζ, the observation model parameters, ϕ, and the contour
parameters, θ, must be obtained. For that the maximum likelihood criterion previously defined must be extended, to include all the parameters:
( ) ( ) ϕθϕθϕθ
,logˆ,ˆ maxarg,
Zp= (12)
Where the logarithm function is added, for simplification, not affecting the maximum location. Solving directly the previous equation is computationally very difficult, and as proposed in [6] is set a suboptimal solution given by the two following iterative schemes:
( ) ( )( ) tt Zp ϕθθθ
ˆ,logˆ maxarg1 =+ (13)
( ) ( )( ) ϕθϕϕ
,ˆlogˆ 11 maxarg ++ = tt Zp (14)
Where ( )tθ and ( )tϕ are the estimates of the contour and observation model parameters at iteration t. Note that in the second equation is used the new estimation of the contour parameters to obtain the new observation model parameters.
For implementing the deformable model in order to detect the femur, the contour
parameter vector is defined by three pixels . These pixels define the contour along with the corresponding interpolating spline, the dashed line in Figure 1. The inner
and outside regions of the contour are defined W pixels wide the spline.
Figure 4: Contour parameters, θ.

International Conference 2ND International Conference on Innovations, Recent Trends and Challenges
in Mechatronics, Mechanical Engineering and New High-Tech Products Development
MECAHITECH‘10
Bucharest, 23-24 September 2010
279
The algorithm proposed in [6] to solve for the θ and ϕ parameters, needs as input the initial estimate of the contour parameter , , given inside the contour. The algorithm
gives as output the ( )tθ and ( )tϕ parameters.
RESULTS
Experimental Setup
The ultrasound images were acquired through the experimental apparatus [8,9] shown in Figure 2, which consists of a tub with water (to place the cow femur and its support), a echograph Sonoline Siemens Versa Pro and a PC equipped with a standard video capture (not shown Figure 2).
(a)
(b)
Figure 5: a) Ultrasound equipment and water tub. b) Cow femur bone.
An ultrasound image representative of all those obtained from the cow femur is shown in Figure 3. The probe of 3.5 MHz was placed on the water surface. The image corresponds to the central section of the bone, where can be observed its upper surface, with brighter gray levels and the absence of other bone surfaces, since all the ultrasound is reflected by the upper surface.
Figure 6: Ultrasound image of a bone.

International Conference 2ND International Conference on Innovations, Recent Trends and Challenges
in Mechatronics, Mechanical Engineering and New High-Tech Products Development
MECAHITECH‘10
Bucharest, 23-24 September 2010
280
The two algorithms described previously were implemented in Matlab R2009b. The results were obtained by running the Matlab scripts using a laptop with an Intel Core2 Duo processor running at 2.40GHz, 2GB of RAM, running Windows Vista. Both algorithms achieved the results presented in the next sub-sections in less than twelve seconds. Active Contour Models Results
This sub section presentes the results obtained in the segmentation of bone structures in ultrasound images using snakes. For result comparison, the same image, depicted in Figure 3, was used in the two segmentation methods.
Snakes need to be initialized by the user. Points must be selected around the region of interest, as illustrated in Figures 4-a) and 5-a). The snakes parameter set, presented in Eq. 3 and Eq. 4, must also be set. The success of the algorithm is heavily influenced by the user’s skill in defining the starting points in the image, and also the parameter set. The number of points used should be sufficient to define the shape of the contour and achieve good results in the segmentation.
To compare the sensitivity of the method to initialization, two different initializations are presented. In the experiment presented in Figure 4 are used a small number of points that were initialized far from the contour. The experiment presented in Figure 5 presents a more careful initialization with more points and closer to the contour.
(a)
(b)
Figure 7: Active Contour Model, experience 1. a) Initialization points. b) Final result. In both experiences the algorithm was initialized with elasticity factor α = 0.4 and
stiffness factor β = 0.2. The three components: lines, edges and terminations in the image energy were initialized with Wline= 0.3, Wedge = 0.4 and Wterm = 0.7. The result of the experiment is illustrated in Figures 4-b) and 5-b).
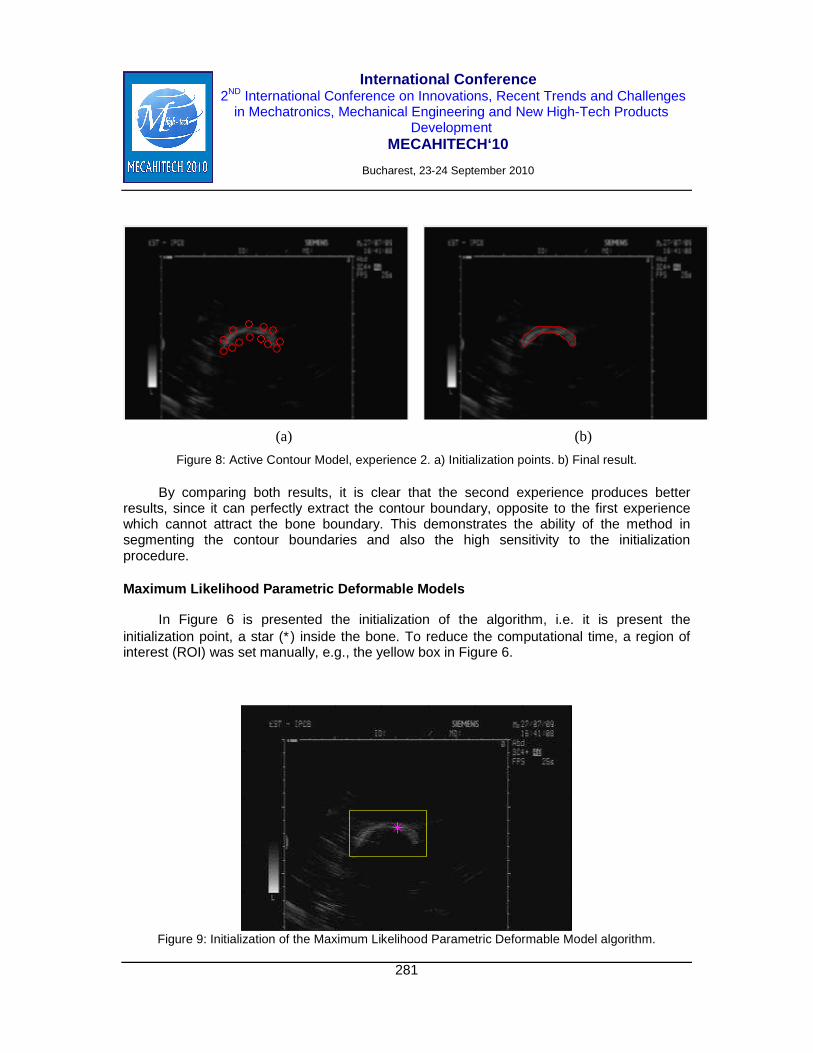
International Conference 2ND International Conference on Innovations, Recent Trends and Challenges
in Mechatronics, Mechanical Engineering and New High-Tech Products Development
MECAHITECH‘10
Bucharest, 23-24 September 2010
281
(a)
(b)
Figure 8: Active Contour Model, experience 2. a) Initialization points. b) Final result. By comparing both results, it is clear that the second experience produces better
results, since it can perfectly extract the contour boundary, opposite to the first experience which cannot attract the bone boundary. This demonstrates the ability of the method in segmenting the contour boundaries and also the high sensitivity to the initialization procedure. Maximum Likelihood Parametric Deformable Models
In Figure 6 is presented the initialization of the algorithm, i.e. it is present the initialization point, a star (∗) inside the bone. To reduce the computational time, a region of interest (ROI) was set manually, e.g., the yellow box in Figure 6.
50
100
150
200
Figure 9: Initialization of the Maximum Likelihood Parametric Deformable Model algorithm.

International Conference 2ND International Conference on Innovations, Recent Trends and Challenges
in Mechatronics, Mechanical Engineering and New High-Tech Products Development
MECAHITECH‘10
Bucharest, 23-24 September 2010
282
Dozens of tests were performed from images obtained from the experimental setup, in several positions of the bone. Among them, in Figure 7, is presented the result of the Maximum Likelihood Parametric Deformable Model algorithm. The algorithm reached the suboptimal solution at iteration number 23, with the following observation model parameters,
and , with a maximum likelihood function value of -18222.506, when starting from -18912.967.
As depicted in the figure, the contour is relatively well estimated, but is not perfectly attached to the boundaries as the active contour model. This is clearly a limitation of the observation model formed only with three points.
50
100
150
200
Figure 10: Result of the Maximum Likelihood Parametric Deformable Model algorithm.
CONCLUSIONS AND FUTURE WORK
This paper presents a study on the extraction of femur bone contours presented in ultrasound images. The methods used are the energetic (active contour models) and the probabilistic (maximum likelihood estimation approach to parametric deformable models). A comparison of both methods was performed when applied to extract femur bones in adult ultrasound images.
The active contour model can attract to the boundaries of the bone more precisely, but with the following drawbacks: the need for manual initialization of all contour points; the need for manual initialization of the model parameters. This method takes into account the local characteristics, i.e., around the contour points, of the image, and is the reason why it is more precise attracting to the contour boundaries.
The maximum likelihood estimation approach to parametric deformable model is not so precise when attracting to the contour boundaries but only needs a point inside the contour as initialization. In this paper was also used a ROI around the contour to extract. No parameters need to be set.
The maximum likelihood estimation approach to parametric deformable model method needs less iterations to converge, but is more computational demanding than the active contour model method because it takes all the pixels in the ROI at each iteration. The active contour model needs a small pixel neighbourhood, e.g. 8×8, around each contour point, at

International Conference 2ND International Conference on Innovations, Recent Trends and Challenges
in Mechatronics, Mechanical Engineering and New High-Tech Products Development
MECAHITECH‘10
Bucharest, 23-24 September 2010
283
each iteration. In conclusion the two methods have its drawbacks and advantages, which have been
highlighted in this paper. Choosing between the two depends on the application and on the precision needed. For the present application, where high precision is needed, the active contour model should be used combined with the probabilistic method, i.e. the probabilistic method can give the initialization to the active contour model. This will be a future topic of research. Extending the observation model of the probabilistic method will also be tackled to achieve better precision.
ACKNOWLEDGEMENTS
The authors would like to thank: Sandra Jardim for providing the matlab implementation code of the Maximum Likelihood Parametric Deformable Model algorithm; the Portuguese Science Foundation, FCT, for the funding to IDMEC through the Associated Laboratory in Energy, Transports, Aeronautics and Space (LAETA); the FCT project: PTDC/EME-CRO/099333/2008.
REFERENCES
[1] Taylor, R.H., H.A. Paul, P. Kazandzides, B.D. Mittelstadt, W. Hanson, J.F. Zuhars, B. Williamson, B.L. Musits, E. Glassman, and W.L. Bargar, "An Image-directed Robotic System for Precise Orthopaedic Surgery." IEEE Transactions on Robotics and Automation, 10(3): p. 261-275,1994.
[2] Taylor, R. & D. Stoianovici. “Medical robotics in computer-integrated surgery”. IEEE Transactions on Robotics and Automation 19 (5), 765–781, 2003
[3] Casals, A., M. Frigola, & J. Amat. “La robtica una valiosa herramienta cirugia“. Revista Iberoamericana de Automatica e Informática Industrial 6 (1), 5–19, 2009
[4] DiGioia III A. M. and Nolte L. P., “The challenges for CAOS: what is the role of CAOS in orthopaedics? “, Computer Aided Surgery, vol. 7, pp. 127 - 128, 2002.
[5] http://www.brainlab.com (consulted at 06-09-2010)
[6] Kass M., Witkin A. and Terzopoulos D.. “Snakes: Active Contour Models”, International Journal of Computer Vision, 1(4), pp. 321-331, 1988.
[7] Jardim S.M.G.V.B. and Figueiredo M.A.T., “Segmentation of Fetal Ultrasound Images”, Ultrasound in Med. & Biol., Vol. 31, No. 2, pp. 243–250, 2005
[8] Gonçalves P.J.S., Carvalho M., Mateus D.F.A., Torres P.M.B., “Registo de Imagens Ecográficas com Modelo 3D de Ossos – aplicação ao fémur”, RISTI - Revista Ibérica de Sistemas e Tecnologias de Informação, Nº 4, pp 43-56, 2009.
[9] Gonçalves P.J.S. and Torres P.M.B., “Registration of Bone Ultrasound Images to CT based 3D Bone Models”, to appear in the 6th International Conference on Technology and Medical Sciences, Porto, Portugal, 21-23 October 2010.

International Conference 2ND International Conference on Innovations, Recent Trends and Challenges
in Mechatronics, Mechanical Engineering and New High-Tech Products Development
MECAHITECH‘10
Bucharest, 23-24 September 2010
284
Integrated Design Solutions- CNC Manufacturing for Complex
Products
St. Ganatios 1, O. Dontu 2, D. Besnea 2, R. Ciobanu 2, I. Avarvarei 2 1 University West Macedonia TEI Kozani - Greece
2 University “Politehnica” Buchaerest, Faculty of Mechanical Engineering and Mechatronics No.313 Splaiul Independentei, Sector 6, Bucharest, Romania
E-mail: [email protected], [email protected]
ABSTRACT
This paper presents a way to design parts with complex geometry and manufacturing techniques on machining centers with at least three numerically controlled axes. Using 3D Wireframe and Surface Design applications, we present steps to follow and conceiving mode, modeling and manufacturing of an injection mold for a plastic bottle emphasizing the constructive and design features.
INTRODUCTION
The need to machine complex surfaces led to the mergence of a new generation of products able to execute parts with 3D geometry and processing techniques on machines with at least three numerically controlled axes. This method was embraced by all manufacturers, in all the fields and at all the levels, starting from prototype to mass production and it’s well adapted to the specific needs of the manufacturing processes.
High technology is based on this type of processing, offering integrated solutions, from the tool path definition, verification and easy update, surface machining to providing solutions easy to learn and use. Surface processing completely covers the design-manufacturing cycle, providing functions for defining operations to be materialized by a machine, defining the processing strategy, processing row-roughing, finishing operations, unprocessed zone detection, or machining in vertical or horizontal planes, such as Zlevel machining, shaping, defining areas of processing, visualization of processing program, documentation generation, offering a freedom of choice for the working methods that suits best the needs of manufacturers.[1]
GENERAL PRESENTATION
NC Manufacturing allows defining and managing NC programs dedicated to parts that
are to be processed, designed in 3D wireframe or solid, using techniques from 2.5 up to 5 axes of processing. Being an unique solution, having a post processor engine that allows the product item to cover all the entire manufacturing process (APT source or CL file) to NC data., offering the following main functions :common platform for 2.5 – 5 axis;, flexible management of fabrication program, graphic interface based on dialog boxes; personalization features by f(x) formula, generation of data to a post processor and instant access to documentation in HTML format. High level of associability of manufacturing

International Conference 2ND International Conference on Innovations, Recent Trends and Challenges
in Mechatronics, Mechanical Engineering and New High-Tech Products Development
MECAHITECH‘10
Bucharest, 23-24 September 2010
285
program assuring the change of the design and fabrication layout starting from the integration of modeling capacity [2][3]. Having the 3D wireframe support application and Surface Design, the steps and designing mode are presented as well as modeling and manufacturing of a injection molds for a 750ml bottle (figure 1), highlighting specific features and functional design.
Fig. 1 The bottle design
Due to required design and functional features for the model (labeling, shape of the
outer walls, rounded corners, ribs), the injection mold was designed to close at a 45˚ (fig 2), offering thus a good finishing for the product, but posing a challenge to design conditions, NC code generation and manufacturing on a 3(4) axis machine.
Fig. 2 Model of the mold, upper half and lower half.

International Conference 2ND International Conference on Innovations, Recent Trends and Challenges
in Mechatronics, Mechanical Engineering and New High-Tech Products Development
MECAHITECH‘10
Bucharest, 23-24 September 2010
286
The part modeled using Wireframe and Surface Design tools saved in Product will represent a model for the next stage, NC Manufacturing, offering specific methods for selecting the operation by opening a window , Part Operation, fig 3, and initializing a new execution in the manufacturing process by adding a new entity. The dialog window allows selection of the operational side of the machine tool type required for the operation (Machine Editor dialog window) fig 4. defining key features and parameters that can be adjusted (machine name, comments, NC parameters, tool change parameters, tool register, rotating table characteristics, etc).
Fig. 3 Selecting Part Operation Fig 4. Machine Editor
Manufacturing Program module allows defining technological operations according to
surface type and machining type (roughing, finishing) by defining following types of operations (drilling, point to point, pocketing, facing, curve following, profile contouring, roughing, sweeping, pencil, ZLevel, contour, spiral milling, isoparametric machining, multi axis helix machining). From insert menu a series of complete operations may be defined, activating Machining Operations, Axial Machining Operations submenu is opened which allows defining the axial operations ( drilling, boring, threading)[4].
Semi-finishing operation or ZLevel specific for horizontal parallel planes, perpendicular to a machine axis and to create these type of operations a series of parameters must be defined : geometry of the manufacturing area, tools, advances values, tools speed, tool path. (fig 5). The dialog window allows user to select the part, machining areas and protection areas . Selecting the Strategy option manufacturing parameters may be specified, such as tool path and depth of milling on a single pass. Using Replay command the tool path may be analyzed, (fig 6), Analyze photo icon offers details regarding possible errors[5][6][7].

International Conference 2ND International Conference on Innovations, Recent Trends and Challenges
in Mechatronics, Mechanical Engineering and New High-Tech Products Development
MECAHITECH‘10
Bucharest, 23-24 September 2010
287
Fig 5 Z Level operation icons, general view
Fig. 6 Tool path simulation
The code associated with the programs is generated by activating Generate NC Code Icon. By opening the active window (fig 7), in IN/OUT page Document CAT Process is selected and file location for the output file is specified.

International Conference 2ND International Conference on Innovations, Recent Trends and Challenges
in Mechatronics, Mechanical Engineering and New High-Tech Products Development
MECAHITECH‘10
Bucharest, 23-24 September 2010
288
Fig. 7 Generating NC code
Fig. 8 The bottle obtain and wall detail
In what concerns the cutting, CAD/CAM designing offers a series of advantages, each element of the manufacturing process is displayed in a hierarchy tree easy to use allowing a full control over simulated machining process. The obtained product , fig 8, proving the viability of integrated solutions.
REFERENCES
[1]I.G.Ghionea, Computer Aided Design in CATIA V5.Theretical elements and applications, Bren Publishing Hause, Bucharest, 2007
[2] D.Besnea, O.Dontu, Tehnologii de fabricatie asistate de calculator pentru executia unor componente mecatronice, Editura Printech Bucuresti, 2008
[3] D.Popescu, L.Popa s.a., Indrumar CATIA V5R8, Editura Aius, Bucuresti, 2004
[4] L. Rece, Ghid si aplicatii informatice de proiectare functionala si tehnologica a formelor pieselor in 3 D, Editura Matrix Rom, Bucuresti, 2005
[5] M.Zapciu, Fabricatia asistata de calculator, Editura POLITEHNICA Press, 2003
[6] M.Popovici, Modelarea virtuala 3D in constructia de masini, Editura Printech, Bucuresti 2005
[7] CATIA V5P3R12, Documentatie de firma, Dassault Systemes

International Conference 2ND International Conference on Innovations, Recent Trends and Challenges
in Mechatronics, Mechanical Engineering and New High-Tech Products Development
MECAHITECH‘10
Bucharest, 23-24 September 2010
289
Low Intensity Ultrasound Treatment for Acceleration of Bone
Fractures Healing
Iosif Samota1, Octavian Dontu2, Robert Ciobanu2, Daniel Besnea2, Iulian Avarvarei2
1 - University TRANSILVANIA Brasov, Faculty of General Medicine, Romania. 2 - University POLITEHNICA Bucharest, Splaiul Independentei, nr. 313,tel. 0213181019, Bucharest, Romania.
ABSTRACT
In this paper will be presented some possibilities of using low intensity ultrasound for post-surgery treatment of bone fractures.
GENERAL CONSIDERATION
The bone is a dynamic structure, subjected to continuous intern an external stress, by gravity force, by muscular contractions and lever mechanisms generate by other bones and joints. All these instant dynamic remodeling as well as the growth and bone healing in these conditions are together with constant modification in electric potential of the respective bone The bone structure depends by its function and all the modifications and all the modification of the function lead to a modification in its structure. A piezoelectric load of the bone represents a signal sufficient for the bone cells to be activated and start forming or absorption of the bone tissue. Continuous change in electromagnetic fields and spatial migration of their poles creates in the bone mass permanent differences of electric potential, attributed to mechanical stress and not to cells life. In a bone there are stress potential and non stress potential.
The requirement to assure methods to diagnose and methods of therapy more complex and efficient, since the apparition of the ultrasound stimulation sistems, made the ultrasounds to be brought in the biologists and medics attention in order to search for ways in which this new tool can be used in development of new medical techniques to replace efficient some conventional techniques or to open new possibilities previously unapproachable.
Low intensity ultrasound pulses are used to reduce the time of simple and complex bone fracture healing. In specialty medicine, there are numerously methods to stimulate bone fracture recovery, but the ultrasound therapy has as a result an increase in the growth rate of the intracellular calcium, leading thus to a bone faster bone regeneration compared to other methods. This method is specially benefic in the reduction of inflammations that makes bone fracture healing more complex in the early stages of recovery, because low intensity ultrasound pulses have a sterilization effect of treated area[1,2].
Ultrasounds therapy is recommended to accelerate bone fracture healing at mature individuals, and in kids case this therapy must be performed under strict monitoring of a specialist medic.
TREATMENT PROCEDURE
Low intensity ultrasound pulses used in postsurgery bone fracture treatment are

International Conference 2ND International Conference on Innovations, Recent Trends and Challenges
in Mechatronics, Mechanical Engineering and New High-Tech Products Development
MECAHITECH‘10
Bucharest, 23-24 September 2010
290
emitted by a non-invasive device, portable, equipped with a ultrasonic probe. The probe is place in the fractures area with a belt which allows to be stable during treatment. Before fixing the probe in the affected area that is to be submitted do ultrasonic therapy, is covered with a gel that assures the transmitting continuity of the ultrasonic signal between the probe and the traumatized treated are of the patient(acoustic coupling).
Propagation velocities of longitudinal ultrasonic waves in various biological environments have very close values to some acoustic impedances (Table 1), except bone and tissue interface areas such as bone tissue - muscle, skull - brain, where other phenomena occur [1, 6].
Table1
Biological environment
Speed of propagation
[m/s]
Acoustic impedance
x 106 [Kg/m2s]
Blood 1547 1.64
Muscle 1567 1.63
Collagen 1680 1.68
Soft tissue 1550 1.55
Brain 1514 1.56
Compact bone 3550 6.9 The system delivers acoustic radiation in form ultrasonic impulses of low intensity
(sinusoidal value), according to programmed specifications, the intensity is considerable lower than in case of conventional ultrasonic equipments used to treat soft tissues [1,2,6](table 2).
Table 2
Output parameter Low intensity ultrasound
Conventional ultrasound unit
Effective radiating area (cm2) 3.88 5
Beam non-uniformity ratio 2.16 8
Frequency (MHz) 1.5 0.75-3
Pulse period (µs) 200 2000
Interval period (µs) 800 8000
Duty cycle 20 20 Spatial-averaged temporal-
averaged intensity (mW/cm2)
30 100-3000
Spatial-peak temporal-averaged intensity
(mW/cm2) 65 24000

International Conference 2ND International Conference on Innovations, Recent Trends and Challenges
in Mechatronics, Mechanical Engineering and New High-Tech Products Development
MECAHITECH‘10
Bucharest, 23-24 September 2010
291
Due to low operating frequencies of ultrasound system used for treatment of various types of bone fractures, the probe can be maintained in a fixed position, eliminating the need to be constantly moved by an operator as is required for conventional ultrasound treatment to avoid increasing tissue temperature.
In the evolution of a fracture are three phases: inflammatory phase, repairing phase and remodeling phase. Research [1,2,9] have shown that ultrasound works primarily on the first two phases of healing, „micromovements theory” is widely accepted in the present: without macroscopic movement mechanical stress accelerate fracture healing. Proinflammatory effects of ultrasound therapy accelerates the onset of inflammatory phase, rapidly filling with exudate fluid the interstitial environment. Ultrasonic treatment generate adhesion of leukocytes with endothelial cells. During fracture repair, this process facilitates migration of leukocytes from blood compartment to the traumatized area, facilitating the elimination of cell impurities and pathogen agents from lesion level. They stimulate the release of fibroblast growth factors through macrophages [5,10], so is encouraged the proliferation of fibroblasts, facilitating collagen synthesis and angiogenesis.
With patient consent was applied a low intensity ultrasound treatment of a postoperative femoral neck fracture. There was a very good bone accession to the denture and a hard fixation of this in a much shorter time than for a normal recovery of such fracture.
Fig. 1a Fig. 1b
Depending on the particularities of each patient and lesion characteristics, it will
establish the low intensity ultrasonic wave parameters and duration of treatment sessions which is between 20-30 minutes per day.

International Conference 2ND International Conference on Innovations, Recent Trends and Challenges
in Mechatronics, Mechanical Engineering and New High-Tech Products Development
MECAHITECH‘10
Bucharest, 23-24 September 2010
292
CONCLUSIONS
Experimental researches have revealed that ultrasound therapy can be an helpful effective treatment to stimulate faster healing, without negative effects for the patient.
In addition, ultrasound treatment facilitates recovery of bone tissue, improves vascularization necessary for differentiation of bone cells, prevents infection, and through 'internal tissue massage "ensure the physical conditions necessary to stimulate bone formation. The callus produced by pulsed ultrasound stimulation is superior qualitative, fact demonstrated by histomorphometric research performed[3.5, 8]. Experimental research has demonstrated that all tissues under the action of ultrasound during fracture treatment, skin, tendons, striated muscle showed no histoarhitecture changes[8].
REFERENCES
[1] I. Samota – Tehnici de stimulare a osteogenezei, Revista de Ortopedie si Traumatologie Bucuresti, 2001, vol.11, nr. 1-2, p 23-30
[2] O. Dontu, V. Trandafir – Unele aspecte privind comportarea hidrolizatelor de colagen în câmp ultrasonor, Revista Română de Mecanică Fină şi Optică, nr. 9 – 1996, pg. 905-907.
[3] Altland O.D., Dalecki D., Suchkova V.N., Francis C.W., Low-intensity ultrasound increases endothelial cell nitric oxide synthase activity and nitric oxide synthesis. J Thromb Haemost. 2004; 2(4):637-43.
[4] Chi Keung Zeung, Ziu Fat Ng, Pulsed ultrasound treatment accelerated the repair of Achilles tendon rupture in rats, Journal of Orthopaedic Research, 2005;24(2):193-201.
[5] Heybeli N, Yesildag A, Oyar O, Gulsoy UK, Tekinsoy MA, Mumcu EF. Diagnostic ultrasound treatment increases the bone fracture-healing rate in an internally fixed rat femoral osteotomy model. J Ultrasound Med 2002;21(12):1357-63.
[6] Lennert, D.J. : Nonthermal effects of therapeutic ultrasound: The frequency hypothesis, Journal of Athletic Training, 2002; 37 (3): 293-299.
[7] Sai Chuen Fu, Mphil, Wai Ting Shun, Low intensity pulsed ultrasound on tendon healing, The American Journal of Sport Medicine, 2008; 36: 1742-49.
[8] Căruntu I.D. Morfometrie computerizată microscopică în histologie şi histopatologie, ed. Gr. T. Popa –U.M.F. Iaşi, 2003.
[9] Rodriguez O, Monreal R. Low-intensity pulsed ultrasound therapy for the acceleration of bone fracture repair. Anais do Congresso Brasileiro de Engenharia Biomédica 2000;650-655.
[10] Takazama T, Suzuki N., Ikeda N., Low intensity pulsed ultrasound stimulates osteogenic differentiation in ROS 17-2.8 cells, Life Sci. 2007;13, 80 (10):965-71.

International Conference 2ND International Conference on Innovations, Recent Trends and Challenges
in Mechatronics, Mechanical Engineering and New High-Tech Products Development
MECAHITECH‘10
Bucharest, 23-24 September 2010
293
Manufacturing Modular Elements for Laser Pumping Ca vities
C. Delavet 1 , O. Dontu2, D. Besnea2, I. Avarvarei2, R. Ciobanu2
1 Ecole Nationale Supérieure d’Arts et Métiers d’Aix en Provence, France 2 Politehnica University Buchares, Faculty of mechanical engeeniring and mechatronics, Splaiul Independentei nr
313, sector 6, Bucuresti, Romania
E-mail: [email protected]
ABSTRACT This paper present a modality to manufacture using CNC machines a modular optical pumping cavity used in laser installations with solid state gain medium .
INTRODUCTION
It is a known fact that solid state lasers have a modest efficiency in converting electric energy in beam energy[1,2].
In order to realize a high efficiency optical pumping of the laser gain medium, the optical pumping lamp and the gain medium must be coupled in a optical pumping cavity, which forms an optical enclosed system that concentrates optical energy from the lamp in the bar of laser gain medium.
The configuration of such a pumping cavity is determined by the type of the lamp and the type of the laser gain medium, by the relative position of those two elements and by the condition imposed by working parameters, energy transfer efficiency and the performances that the laser need to accomplish. Optical pumping cavity must accomplish beside a good coupling between the laser bar and the lamp, a good distribution of pumping energy along the laser rod, this requirement having the most importance in the uniformity, divergence, optical distortion and the level of energy that the laser emits.
An optical pumping cavity must assure, at the same time, a good cooling for the active medium and pumping lamp, as the cooling conditions have an influence over the emission process, affecting the pulse repetition rate, as well as the peak power of the pulse and the life time of the laser.
In an optical pumping cavity light energy is concentrated on the active medium rod far from the ideal conditions. This, correlated with a low efficiency in converting electricity in optical energy, and taking into account the incomplete usage of the emitted light by the laser rod (6-14%) and the losses inside the pumping cavity (30-70%) these are the elements that determine the low efficiency of laser generators with solid gain medium. (0.1-5%). [1]
Because every laser rod and optical pumping cavity has it’s own particularities, energy distribution may be determined by using diagrams or with some approximations. []
The efficiency of electrical energy transfer to the laser rod in a optical pumping cavity may be approximated using the following relation :
η=ηge.ηop.ηe (1)
ηge – geometrical transfer efficiency of the pumping cavity which represents the fraction of
light that gets to the laser rod directly or after it was reflected in the walls of the cavity and it

International Conference 2ND International Conference on Innovations, Recent Trends and Challenges
in Mechatronics, Mechanical Engineering and New High-Tech Products Development
MECAHITECH‘10
Bucharest, 23-24 September 2010
294
depends largely by the geometrical configuration of the optical pumping cavity’s active surfaces;
ηe – Energy efficiency which depends on the conversion mode of electrical energy into light energy, used for optical pumping of the laser gain medium;
ηop – optical efficiency of the pumping cavity which takes into account all the losses in the pumping system caused especially by the transmittance and reflection phenomenon. This parameter might be expressed as follows:
ηop =Rw(1-Rb)(1-Rl)(1-S) (2)
where: Rw – coefficient indicating the reflection degree of the walls for frequency bands in which
the optical pumping is performed Rb – represents reflection loses on the surface of the laser rod or on the glass tubes
used for cooling the laser rod, Rl – represents the loses by absorption in the tubes used for cooling the lamp S – represents the ratio of unreflective surface of the pumping cavity and all the surface
of the pumping cavity, factor that evaluates the loses caused by the constructive and technologic particularities of the pumping cavity.
Researches have shown that a high efficiency of the pumping is achieved in cylindrical optical pumping cavities with elliptical cross section (Fig.1.) in which the pumping lamp is placed in one focus of the ellipse and the laser rod is placed in the other focus, thus an uniform distribution of energy is obtained across the cross section of the rod. The ends of the pumping cavity are enclosed by high reflective plane surfaces.
Fig. 1. Elliptical optical pumping cavity
In this type of pumping cavity, due to the elliptical cross section, all the rays that go from
a point of the lamp are converted in parallel rays in the laser rod, every line corresponding to the rays that leave the source are tilted under the same angle from the main axis and at different angles from the transversal plane, important is not just the image forming in the common optical sense but the radiant energy transfer to the laser rod.

International Conference 2ND International Conference on Innovations, Recent Trends and Challenges
in Mechatronics, Mechanical Engineering and New High-Tech Products Development
MECAHITECH‘10
Bucharest, 23-24 September 2010
295
TECHNICAL PROBLEMS
Manufacturing those pumping cavities is relatively difficult but as well as expansive, not because of the geometrical form as the problems issued by the realization of the reflective coating inside the ellipse.
Fig. 2. Pumping cavity of a Nd:YAG laser in “classical” construction
The process suitable for obtaining this high reflective surface is by reflective material deposition after thermal evaporation and condensing metal vapors in vacuum. This process implies material evaporation by electron beam bombardment or using a high power laser inside a vacuum chamber and condensing the metal vapors on the active surface of the pumping cavity, the result is a high reflective surface with homogenous covering and a good resistance in time in variable temperature conditions. Nevertheless, metal covering by these process are best performed on small surfaces.
Experimental researches and rapports of constructive companies and service companies show that the most frequent defects that appears on pumping cavities are caused by exfoliation, degrading, spots on certain areas or scratches. Solving these defects is performed by replacing the whole pumping cavity, operation that requires time, it is costly and laser installation can’t be use for a prolonged period of time.
To solve this problem we conceived a modular pumping cavity. This solution presents a series of economic advantages: reduced production costs, reduced immobilization period of the installation. There are also technological advantages as the manufacturing a smaller module is easier rather than manufacturing a whole pumping cavity. The biggest advantage of them all is that when a surface defect is spotted in a certain area only the defect module is replaced not the all pumping cavity.[1,2,3,4].
PROPOSED SOLUTION
To solve this problem we conceived a modular system, in which the pumping cavity is formed from a number of modules with elliptical inner cross section. These modules have orifices and centering faces in order to assemble and align them easy and precisely. Modules have small sizes which allows them to have the inner elliptical groove carved easily

International Conference 2ND International Conference on Innovations, Recent Trends and Challenges
in Mechatronics, Mechanical Engineering and New High-Tech Products Development
MECAHITECH‘10
Bucharest, 23-24 September 2010
296
and also the reflective coating is easier to obtain. More over, when a defect is spotted such as scratches, exfoliations, spots, a single module is replaced. Thus the maintenance costs are reduced, the pumping cavity is not replaced and the time when the laser installation is unused drops.
Starting from a classical elliptical pumping cavity we designed a modular pumping cavity with the same geometrical parameters. The modules have a height of 50mm and an outer diameter of 42mm.
Fig. 3. Module of pumping cavity
Modules are designed with a sitting face on the optical bench of the laser installation and
with two orifices used to place and fix the modules using fixture studs. To allow the modules to be aligned a centering rim was designed on the outline of each end face.
Fig. 4 detail in section on the fitting mode of the modules
MANUFACTURING PROCESS After designing, in order to see if the module is feasible we used CATIA V5 designing
program to simulate the machining process necessary to manufacture this module. CATIA offers a strong NC Manufacturing module (fig.5) to define and organize numeric
command programs dedicated to manufacture parts with geometry represented in 3D models of wire-frame type. Also, the manufacturing module has a post-processing engine which allows to cover all the fabrication process, from trajectory generation of the processing tool to obtaining the NC Code.
The fabrication process for the pumping cavity module that includes following processing steps: facing, inner milling, boring, outline milling, centering, drilling,. In order to simulate the

International Conference 2ND International Conference on Innovations, Recent Trends and Challenges
in Mechatronics, Mechanical Engineering and New High-Tech Products Development
MECAHITECH‘10
Bucharest, 23-24 September 2010
297
fabrication process Part Operation must be defined and the working parameters(specific to the type of the used machine) , as well as adjacent parameters such as Post Processor words table, NC data type, NC data format, Tools catalog, Radius compensation, Spindle.
Manufacturing program module offers the possibility to define technological operations on different types of surfaces and according to the type of machining (roughing and finishing). From the main menu, Facing command is activated and by selecting the machining surface, the machining mode may be selected (inward helical, Back and forth and one way) as well as the axial number of levels. Choosing the tool for Facing operation may be done by selecting the icon that allows defining the geometrical dimension for the tool. [5,6,7,8,9].
Fig 5.a Defining the geometrical parameters of the operation
Fig 5.b. Defining the tool
Fig. 5.c defining and simulating the tool trajectory

International Conference 2ND International Conference on Innovations, Recent Trends and Challenges
in Mechatronics, Mechanical Engineering and New High-Tech Products Development
MECAHITECH‘10
Bucharest, 23-24 September 2010
298
Inner maching, roughing and finishing, of the pumping module is perofrmed by activating the Zlevel comand, (fig. 8), that provides the settings for vertical machining by using two types of tools defined by tool change operation. Selecting the part’s surface that that has to be machined the tool trajectory is defined and may be simulated.
Fig 6.a Selecting active surfaces that need to be machined
Fig. 6.b Roughing simulation
Fig. 6.c Roughing operation
Drilling the fixing holes is defined by drilling command, first is used a spot drilling
operation and, after defining the hole geometry, the drilling tool is selected and the opereation is completely defined.

International Conference 2ND International Conference on Innovations, Recent Trends and Challenges
in Mechatronics, Mechanical Engineering and New High-Tech Products Development
MECAHITECH‘10
Bucharest, 23-24 September 2010
299
Fig. 7.a Drilling simulation
Fig. 7.b. Drilling operation
Fig. 8.a Finishing simulation
Fig.8.b Finishing operation

International Conference 2ND International Conference on Innovations, Recent Trends and Challenges
in Mechatronics, Mechanical Engineering and New High-Tech Products Development
MECAHITECH‘10
Bucharest, 23-24 September 2010
300
Programm gneration in machine gode is performed activating Generate NC code command, by opening the active window from fig.10. In the IN/OUT page, Document CAT process is selected and the path of the resulting file is specified. NC Code option from NC Data Type menu(NC Code, APT, CLF) is selected and in the page the type of the NC Code processor is selected acordingly to the one installed on the CNC machine.
Fig. 9. NC Code generation
An example of NC Code program specific to FANUC comand system is shown below:
%:4000 (cavitate) M6T5 G54G90 S5000 M3 G1G43 H#4120 Z100.F3000 X94.8775 Y-239.8275 Z9.8235 G1 Z-.1765 F2000. Y-240.8675 F400. .......................................... ........................................ X143.8953 Y-6.0422 X143.9275 Y-6.12 Z6. F1000. M5 G0 Z200. M30 % RESULTS
After machining the designed modules we obtained a set of four similar pumping cavity modules. The modules were assembled to form the pumping cavity, thus verifying the viability of our solution.
Fig. 10. FANUC front panel

International Conference 2ND International Conference on Innovations, Recent Trends and Challenges
in Mechatronics, Mechanical Engineering and New High-Tech Products Development
MECAHITECH‘10
Bucharest, 23-24 September 2010
301
Assembling the modules proved to be easy, the modules fitting together precisely due to aligning rim that was generously dimensioned to a depth of 3mm, more over, when tightening the fixing studs, the modules haven’t move from their axis
Fig. 10. Assembling mode for the modules in order to form a pumping cavity.
CONCLUSIONS
The advantages of using modules to form pumping cavities are both economical and technological. Because processing inner surfaces to make them high reflective is possible only by thermal evaporation and vacuum condensation (and not by electrolytic deposition, the surfaces obtained in this process may exfoliate within hours of functioning) the variant of using modules simplifies and keeps the fabrication costs low and more over, for users is easier and cheaper to change a small deteriorated module rather than the whole pumping cavity.
REFERENCES
[1] O. Dontu, Tehnologii de prelucrare cu laser, Editura Tehnica, Bucuresti, 1985
[2] I. Popescu, Fizica si ingineria laserelor, Editura Tehnica, Bucuresti, 2000
[3] W. Steen, Laser material processing, Springer, London,1998
[4] E. Kannatey-Asibu jr., Principles of Laser Materials Processing, Wiley, New Jersey, 2009
[5] G. Ghionea, Proietarea asistata in CATIA V5, elemente teoretice si aplicatii, Editura Bren, Bucuresti, 2007
[6] 6.G. Ghionea, CATIA V5 Module de proiectare asistata cu aplicatii in constructia de masini, Editura Bren, Bucuresti, 2004
[7] D. Popescu, Indrumar CAD CATIA V5R8, Editura Aries, Craiova, 2004
[8] G. Charalampides, Gh. Gheorghe, Design and execution of mechatronics parts by using CNC centers, Romanian Review Precision Mechanics Optics&Mechatronics, nr33/2008
[9] D.Besnea, O.Dontu, s.a. Tehnologii de fabricatie asistate de calculator pentru executia unor componente mecatronice, Editura PRINTECH, Bucuresti, 2008.

International Conference 2ND International Conference on Innovations, Recent Trends and Challenges
in Mechatronics, Mechanical Engineering and New High-Tech Products Development
MECAHITECH‘10
Bucharest, 23-24 September 2010
302
Treatment of Traumatized Thermal or Chemical Alive Human
Tissues in Ultrasonic Field in The Presence of Ster ile Endogenous Hydrolisys
Iosif Samota1, Octavian Dontu2, Daniel Besnea2, Robert Ciobanu2, Iulian Avarvarei2
1 - University TRANSILVANIA Brasov, Faculty of General Medicine, Romania. 2 - University POLITEHNICA Bucharest, Splaiul Independentei, nr. 313, 0213181019, Bucharest, Romania.
ABSTRACT In this paper there are presented the physical – chemical processes that take place at the interaction between the human derm traumatized as results of burnings and sterile endogenous hydrolisys during the application of a nonconventional treatment with ultrasound of derm burns.
INTRODUCTION Starting from the phenomena and effects of ultrasonic waves in living human tissue, by
regulating and directing these waves properly in the presence of sterile preparations of collagen, a new process of treatment and recovery with ultrasound was completed which enables faster healing of living human tissue traumatized from burns caused by heat sources or very aggressive chemicals.
GENERAL CONSIDERATIONS
It is known that ultrasonic energy propagates differently in different environments
depending on the compressibility, density and nature of that environment, the ambient temperature having a lesser influence.
A calculation of the propagation velocity of ultrasound in biological environments can be done with the Willard relationship [4]:
2)(0245.0 ttVV mmt −−= [m/s] where:
- Vt is the speed of propagation at a given temperature t; - Vm - maximum speed of propagation in that environment at a temperature tm.
Propagation velocities of longitudinal ultrasonic waves in various biological
environments have very close values to some acoustic impedances (Table 1), except bone and tissue interface areas such as bone tissue - muscle, skull - brain, where other phenomena occur [1, 6].

International Conference 2ND International Conference on Innovations, Recent Trends and Challenges
in Mechatronics, Mechanical Engineering and New High-Tech Products Development
MECAHITECH‘10
Bucharest, 23-24 September 2010
303
The energy of ultrasound waves while propagating through a biologically living medium diminishes gradually due to absorption and diffusion in that environment, and because of the environmental homogeneity of the route structure.
Table1
Biological environment
Speed of propagation
[m/s]
Acoustic impedance
x 106 [Kg/m2s]
Blood 1547 1.64 Muscle 1567 1.63
Collagen 1680 1.68 Soft tissue 1550 1.55
Brain 1514 1.56 Compact bone 3550 6.9
The ultrasonic wave energy attenuation coefficient depends on absorption - α of that
environment, the frequency of the ultrasound having a major influence, see Table 2.
Table 2
Biological environment
Frequency MHz
Absorption coefficient
α [cm-1]
Half rate d1/2[cm]
Adipose tissue 0.8 0.05 6.9
0.9 0.09 7.7
Muscle 0.8 0.19 2.4
0.9 0.26 2.7
Blood 0.9 0.035 20
1 0.02 35
Bone 0.8 1.5 0.22
0.9 3.1 0.28 The ultrasonic energy absorbed by tissue for a certain frequency can provide
information on properties and crossed environmental characteristics, for example, for muscle tissue, the absorption coefficient changes in relation to the position of muscle fibers compared to the direction of propagation of ultrasonic waves [1.4].
At the interface of tissues with different densities, areas where propagation velocities are different, the ultrasonic energy field undergoes changes after refractive or absorption phenomena, phenomena which are subject to all laws in classical optics. It follows, therefore, for efficient ultrasound energy use for therapeutic purposes, that the angle of incidence of waves on the surface of the treated environment must be chosen so

International Conference 2ND International Conference on Innovations, Recent Trends and Challenges
in Mechatronics, Mechanical Engineering and New High-Tech Products Development
MECAHITECH‘10
Bucharest, 23-24 September 2010
304
that reflectivity is smallest and acoustic coupling with the treated biological environment be as good as possible, as air should be eliminated because the air interface - tissue has about 95% reflectivity and the effectiveness of the treatment is almost null.
Table 3 features the characteristic impedance, reflection coefficient and transmission coefficient for air - adipose tissue and adipose tissue - muscle [1, 4].
Table 3 Interface Characteristic
impedance Reflection coefficient
Transmission coefficient
Transmission %
Air / adipose tissue 6.9 •10-4/1.36 0.98 0.02 2%
Adipose tissue / muscle
1.36/1.63 8.1 •10-3 0.99 99%
Experimental research showed that ultrasonic action on various organs of the human
body is a very complex phenomenon, poorly studied and understood. In the research undertaken only the effects of particular products on the dermis, the area where several physical processes - chemical, mechanical, thermal, biological - overlap and which are interdependent have been taken into account, with the observation that functional parameters of the ultrasound production device designed and built specifically for these applications are set so that the penetration depth of ultrasound waves in traumatized tissue is very small.
Sometimes wrongly, physical-chemical effects produced by ultrasound are associated with ultrasonic cavitation phenomena, but it should be taken into consideration that these phenomena usually occur in liquid - viscous environments - and only for ultrasonic wave intensities above 1.6 W/cm2 ,values at which injuries in affected living tissue are inflicted, which of course are not achieved in medical applications.
As is known ultrasound of a certain intensity, frequency and greater duration of action have an emphasized bio-negative effect over bacilli, certain bacteria, staphylococci and viruses that can ultimately be fatal, manifested by a sharp decrease in the virus pathogenesis or even their complete destruction [1.6].
Experiments performed with the achieved ultrasound generating device [1,2,3] showed that properly adjusting the parameters of ultrasonic waves, the frequency of oscillation power, size, vibration amplitude and duration of action, an increase diffusion capacity of any medicinal substances, moisturizers will occur in human tissue treated up to tissue level, so it will occur also for collagen hydrolysates with which the surface of the injured dermis is covered; also a local change in pH can be made towards an alkaline area or even a normalization of pH in some inflammatory processes, situations frequently encountered in injured dermis and can be directed to promote and accelerate healing.
Since collagen is a sclera-protein containing glicocol, proline and oxiproline and is found under the form of fibers of connective tissue in the dermis and tendons, in the presence of ultrasound it maintains the native spiral structure of the original protein, a property with which we hold an advantage in experiments and applications estimated on the basis of ultrasound [1,2,3].
Given the characteristics and features of injured living human tissue (especially those with severe burns) which are also infected with burned scrap fabric (from the victims’ clothes), charred skin or other impurities, application of ultrasound has a sterilization - disinfection role, as a number of microbes are destroyed and other sources of infestation

International Conference 2ND International Conference on Innovations, Recent Trends and Challenges
in Mechatronics, Mechanical Engineering and New High-Tech Products Development
MECAHITECH‘10
Bucharest, 23-24 September 2010
305
attenuated. At the same time as ultrasounds act on the sterile collagen gel with which the burnt traumatized area is covered, a surface tissue penetration up to the unaffected living tissue is performed, a process that will promote a faster healing-recovery of affected-traumatized tissue, the layer of collagen ensuring at the same time protection of injured tissues that are no longer in direct contact with the ambient atmosphere, decreasing the risk of further infestations.
CONCLUSIONS
The results of applying the new method of treatment to more patients with burns (who have agreed to experiment this new treatment on reduced areas) showed that the effect of combined action of ultrasound in the presence of sterile hydrolyzed collagen films treated on traumatized tissue is a much faster healing for burned tissue (about half the time of healing through classic means) and no appearance of nodules characteristic to burned tissue treated by classical procedures and the coloring of the dermis healed - rebuilt is no longer altered, being very close to that of an un traumatized dermis [1.2 ].
These results encourage us to improve specialized ultrasound device production (which is also subject to a patent filed), to continue addressing experiments and other more difficult cases to determine the precise treatment procedures based on typical and atypical cases encountered in edical practice.
REFERENCES
[1] O. Dontu, V. Trandafir – Unele aspecte privind comportarea hidrolizatelor de colagen în câmp ultrasonor, Revista Română de Mecanică Fină şi Optică, nr. 9 – 1996, pg. 905-907.
[2] Samota
[3] O. Dontu - ConsideraŃii privind utilizarea ultrasunetelor la amorsarea şi intensificarea unor reacŃii şi procese fizico – chimice, Revista Română de Mecanică Fină si Optică, nr. 6 – 1996 pg.900-905.
[4] Irina Deleanu,V. Ciolacu - Transdermal Pathways of drugs in sonophoresis, abstract book of 5th Meeting of European Society of Sonochemitry Cambridge, July, 1996, U.K., pg. 7-11.
[5] Vasilescu V., s.a. - Ultrasunetele în medicina şi biologie – Ed. Medicală, Bucureşti, 1984.
[6] Altland O.D., Dalecki D., Suchkova V.N., Francis C.W., Low-intensity ultrasound increases endothelial cell nitric oxide synthase activity and nitric oxide synthesis. J Thromb Haemost. 2004; 2(4):637-43.

International Conference 2ND International Conference on Innovations, Recent Trends and Challenges
in Mechatronics, Mechanical Engineering and New High-Tech Products Development
MECAHITECH‘10
Bucharest, 23-24 September 2010
306
Welding of Active Diamond Elements on Cutting Disks Using CO2
Laser
Georgios Charalampides1, Octavian Dontu2, Gheorghe I. Gheorghe3, Daniel Besnea2, Iulian Avarvarei2, Robert Ciobanu2,
1 – President TEI Univ. West Macedonia Kozani-Greece 2 - University “Politehnica” of Bucharest, Dept. of Mechatronics, 313, Spl. Independentei, 77206, Bucharest,
Romania (corresponding author to provide phone: (4021) 4029139; fax: (4021)-4029139; 3 – National Institute for Research & Development in Precision Mechanics, Bucharest.
ABSTRACT
In this paper there are presented the results of welding experiments using a CO2 laser of active diamond elements on the body of cutting tools used to cut hard materials in construction field (marble, concrete, granite). Key words: laser welding, diamond segment
INTRODUCTION
Starting from the necessity of cutting of hard materials used in construction industry (granite, marble, different types of concrete, reinforced concrete) as well from the new EU regulations regarding user protection (whom in most cases are persons with modest training), new requirements were set to manufacture diamond disks. [1,5,6].
These disks used in intense working regimes (peripheral speeds up to 30-50m/s, variable cutting depths and sometimes mechanical shocks) requirements for these tools were set, especially concerning the strength of diamond elements joint. The solution that we turn to was CO2 laser welding, continuous wave at λ = 10.6 µm, which offers the following advantages:
- achieve high quality welding in areas difficult to reach - allows welding metallic materials with different fusion spots: stainless steel, titan,
nitinol, platinum, - high speed of welding 10...40[mm/s]; - high strength welding for all the welded elements with good repeatability;
The tools used with synthetic diamond granules fixed in a metallic matrix of composite
materials with a complex composition. Positioning active elements on the tools body for welding must assure the complex geometry of the cutting tool and at the same time to have a high mechanical strength for different working regimes [5,6].
In what concerns the construction, cutting disks have a support- the steel disk, profiled with teeth with a specified geometry well specified on witch diamond elements [2,3,7], fig. 1. must be welded with standardized elements from table 1.
P.Beca3

International Conference 2ND International Conference on Innovations, Recent Trends and Challenges
in Mechatronics, Mechanical Engineering and New High-Tech Products Development
MECAHITECH‘10
Bucharest, 23-24 September 2010
307
Fig. 1 – Tool support configuration
Table 1. Standard dimension for disks
D/L L X X1 T T1 R 200 – 800
40 ±0,30 ±0,25 ±0,05 ±0,25 ±0,10 ±0,5
900 – 3000 24
±0,30 ±0,25 ±0,05 ±0,25 ±0,10 ±0,5
Table 2. materials used in manufacturing support disks
Steel typel Improvement Treatments Annealing Hardening Tempering Hardness T(0C) Hardness T(0C) T(0C) HRC W 2235 680 - 710 250HB 800 – 830
Oil cooling 180 – 300 Air cooling
63 - 45
W 1750 680 - 710 217HB 800 – 810 Oil cooling
200 – 300 Air cooling
60 - 40
Active elements of the tool are segments, fig. 2, with a composite structure made of [4,5] :
- a matrix of metallic alloy, Co (65%), W2C (18%), Si (7,5%), B(1,5%); - synthetic diamond granules reinforcement;
Fig 2. – Segment configuration\

International Conference 2ND International Conference on Innovations, Recent Trends and Challenges
in Mechatronics, Mechanical Engineering and New High-Tech Products Development
MECAHITECH‘10
Bucharest, 23-24 September 2010
308
Table 3. Dimensions of the diamond segments Disk
Diameter (D)
Number of segments
(n)
R L T T1 x x 1
D/2
5 7 8 10 12
200 - 800 12-46 40 1,7/2,0...5,5/6,5 1,2-4,5 x x - - - On order 900-3000 64 - 160 24 6,5/7,5...14,5 5-12 - - x x x
Welding these elements at the outskirt of the disk was performed using a CO2 laser
installation [8,9,10] continuous wave (CW), with protection gas – argon. The most important characteristics of the laser installation are:
- peak power 1800÷2100 [W] - power density 100÷105 [ Wcm-2] - wave length 10,6·[µm ] - traveling speed: 0,7-1,0 [m/s] - focalized spot size; φ 2.5-4 [mm] In figure 3, there is a detail of the disk’s tooth.
Fig. 3. Disk detail – welding area – tooth
The metallographic analysis of the welding area between the diamond segment and the
support disk was performed on probes, fig. 4.
\ Fig. 4, Stereo micro structural aspect of the investigated probe (10X)
It is visible that the resulted welding area has a good quality; the small number of small
pores doesn’t affect the assembling quality. The metallographic structure of the welding, fig.5, cross section shows the heat affected area close to the weld is minimum, as well as some discontinuities and pores 10-575 µm that don’t affect the joint quality. In the microscopic analysis (fig.5) after a short chemical attack it is evidenced the base mass of inhomogeneous components of superior banita, troositc and residual austenite, and in the

International Conference 2ND International Conference on Innovations, Recent Trends and Challenges
in Mechatronics, Mechanical Engineering and New High-Tech Products Development
MECAHITECH‘10
Bucharest, 23-24 September 2010
309
weld it can be observed insular areas, with needle shape, formed out of inter metallic compounds. The areas are of considerable dimensions 100-300 µm, uniform displayed in the tooth matrix.
a. microstructural aspect of the base material b. Micro structural aspect of the weld and base material
c. micro structural aspect of a compound from the addition material with evidence of the
polygonal particle – detail
Fig. 5. Microstructure aspect of the interface between the weld and the base material after chemical attack with natal 2% for short time in the presence of the additional material (x-50).
In the welding area, after a chemical attack for a longer period of time, an heterogeneous solid solution, with dendrites segregation, is observed, fact evidenced by the detail image from figure 6.b, and also, in the weld area it is shown a macro pore type discontinuity (fig. 6.c)
.a (X-50) b (X-250) c (X-500)
Fig. 6. Micro structural aspect of the weld chemical attacked with 2% natal

International Conference 2ND International Conference on Innovations, Recent Trends and Challenges
in Mechatronics, Mechanical Engineering and New High-Tech Products Development
MECAHITECH‘10
Bucharest, 23-24 September 2010
310
CONCLUSIONS The study, metallographic analysis and tests to which the welding were submitted on
the batches of analyzed disks it allows to appreciate that these assemblies performed on laser welding correspond in all the aspects, being the only technological process which allows manufacturing diamante coated tools for cutting, highly used in geology and geodesy. By comparison to another methods of welding assembly of the diamond coated segments on the tool body, for example brazing, the proposed process has a better quality, it is not pollutant, it may be considered a “clean” process in accordance to all the environmental standards.
REFERENCES
[1] Gh. I. Gheorghe, P. Beca, s.a., Dezvoltarea unui sistem tehnologic de realizare prin sudare laser a discurilor diamantate de taiere, International Conference “INDUSTRIAL APPLICATIONS OF LASERS”- INDLAS 2007- BRAN, Romania , 23-25 mai 2007. [2] V. Drăgănescu, V.G.Velculescu- „Prelucrări termice cu laseri”, Ed. Didactică, Bucureşti, 1986
[3] W.M.Stern – „Laser material Processing”, Spinger Verlog, New York,1991
[4] A.R. Rosental – Pre-stressing Disc-Shaped Tools by Laser”, Industrial Diamond Review, Nr.5/1992.
[5] S.T.Palauchik - „Sawing reinfoced concrete with diamond blades” – General Electric, Specialty Materials Department – Wortbington Ohio (SMD – 54 – 1880)
[6] Elio Morelli – „New laser welding machine for diamond tool manufacture”, Industrial Diamond Review,Nr.582/1999.
[7] O.Dontu, Sudarea cu laser a unor oteluri inoxidabile utilizate la instalatii de proces din industria chimica, Revista de Chimie, vol.56, nr.3/2005.
[8] G.Adziev, T.Adyiev, A.Sedmak – Mechanical Engineering Faculty, Belgrad, Serbia & Montenegro - “ Influence of the weldstrength mis- match on HAZ cracked specimens fracture” - “Buletinul Institutului National de Cercetare- Dezvoltare in Sudura si Incercari de Materiale Timisoara” /nr.1/2007.
[9] Sz. Bella, A.Bernath, J. Dobransky – Budapest University of Technology and Economics- “TIG, laser beam and resistance projection microwelding” - “Buletinul Institutului National de Cercetare- Dezvoltare in Sudura si Incercari de Materiale Timisoara” nr.1.2007. [10] Dezvoltarea unei facilitati nationale de cercetare si aplicatii tehnologice de prelucrare termica cu fascicul laser, Contract CEEX 1/2005.

International Conference 2ND International Conference on Innovations, Recent Trends and Challenges
in Mechatronics, Mechanical Engineering and New High-Tech Products Development
MECAHITECH‘10
Bucharest, 23-24 September 2010
311
Trends in Fotovoltaic Cells Nanotechnology
Gheorghe Popan, Anton Vieru, Iulian Sorin Munteanu
National Institute Of Research And Development For Mecatronics And Measurement Technique – INCDMTM Bucharest
ABSTRACT
This work describes several methods of increasing efficiency and cost reduction of the photovoltaic elements, based on the latest scientific research, like: using thin metal films and organic substances in the construction of photovoltaic elements, improving efficiency photovoltaic cells by changing the surface nano-morphology, implementation techniques of the aerospace industry to manufacture photovoltaic cells. The work also emphasizes on new innovative trends in use of new sources of solar energy.
INTRODUCTION
Various techniques to improve the efficiency of silicon solar cells is included such as solar concentrators, improving the efficiency of dirty silicon, surface polarization, and multiband technology. Polymer and plastic solar cell technology is also discussed as is the generation of hydrogen from solar cells. These include: organic dye sensitized solar materials, silicon nanorods for solar cells, silicon ink solar technology, electron carrier multiplication in nanocrystals, the use of nanoscale structures for solar absorption and collection, quantum dot solar technology, and carbon nanotube technology in solar energy. Thin film solar cell technology is discussed including CIS/CIGS films, inorganic film, amorphous silicon film, and flexible substrates.
NEED TO USE SOLAR ENERGY
The sun offers much more energy than what we could consume. In order to cover the world-wide requirements of electric power with the fotovoltaic is sufficient only 1,5% of the European continent.
The sun offers good energy and more than we need. Also in times of "energetic hunger" like these, the energy that the sun continuously irradiates on the earth is equal to 10.000 times the worldwide energetic requirements.
Between all the energetic sources available to us, the sun represents the more long-lasting energetic source by far, with a life expectation of billions of years.
In central Europe the sun is an energy source on which trust can be made. In order to cover worldwide energetic requirements, by using photovoltaics a surface area of 145000 Km2 would be a sufficient. This corresponds to a square having 380 km sides.

International Conference 2ND International Conference on Innovations, Recent Trends and Challenges
in Mechatronics, Mechanical Engineering and New High-Tech Products Development
MECAHITECH‘10
Bucharest, 23-24 September 2010
312
METHODS OF INCREASING EFFICIENCY AND COST REDUCTION OF THE PHOTOVOLTAIC ELEMENTS
Using thin metal films and organic substances in th e construction of photovoltaic elements
Because of optical microcavity effects, using thin nonpatterned metal films instead of indium tin oxide in organic solar cells can result in similar efficiencies. Large-area transparent conductors are essential in many important applications, such as thin-film solar cells, traditional LCDs, and organic LEDs (OLEDs). The widely used transparent conducting oxides (TCOs), such as indium tin oxide (ITO), are typically deposited using plasma sputtering or sol-gel methods. There is a natural tradeoff between transparency and conductivity, with the best films exceeding 90% transparency in the visible part of the spectrum at sheet resistances below 15Ω/square. This level of performance is suitable for thin-film solar-cell applications, where a sparse metal grid can be added to the TCO film as an auxiliary conductor to minimize ohmic losses during charge collection.
However, TCOs typically exhibit a combination of shortcomings (e.g., brittleness, expensive source materials, processing problems, or availability of suitable flexible substrates).
They are particularly problematic in reel-to-reel processing of thin-film, flexible devices because they are susceptible to cracking, which raises the film's electrical resistance and makes it permeable to oxygen and moisture that accelerate device degradation. An acute need exists for transparent conductors that are fundamentally different from TCOs in their mechanical, processing, and cost characteristics.
Figure 1. Metal-organic-metal photovoltaic (PV) cells with thin nonpatterned metal films achieve the same power-conversion efficiency as those with conventional indium tin oxide (ITO) electrodes. hν:
Light energy. [1]
The search for TCO replacements for organic photovoltaic (OPV) devices has focused on carbon nanotubes, graphene, highly conductive polymers, and metallic microgrids combined with conducting polymers. But few of these approaches have yielded devices that perform as well as those using ITO, and fewer can be scaled up cost-effectively.
Instead, we considered using a very thin, unpatterned metal film. Metals are malleable and can be deposited relatively cheaply and rapidly onto continuously spooled substrate. In organic optoelectronics, thin metal films have been investigated as stand-alone transparent electrodes and in conjunction with conducting oxides. Generally, the transparency of a metal film drops exponentially with increasing thickness, while the sheet resistance rises rapidly. This tradeoff between transparency and electrical conductivity limits the range of feasible metal thicknesses to 10–20nm. At the low extreme, it can be difficult to maintain film
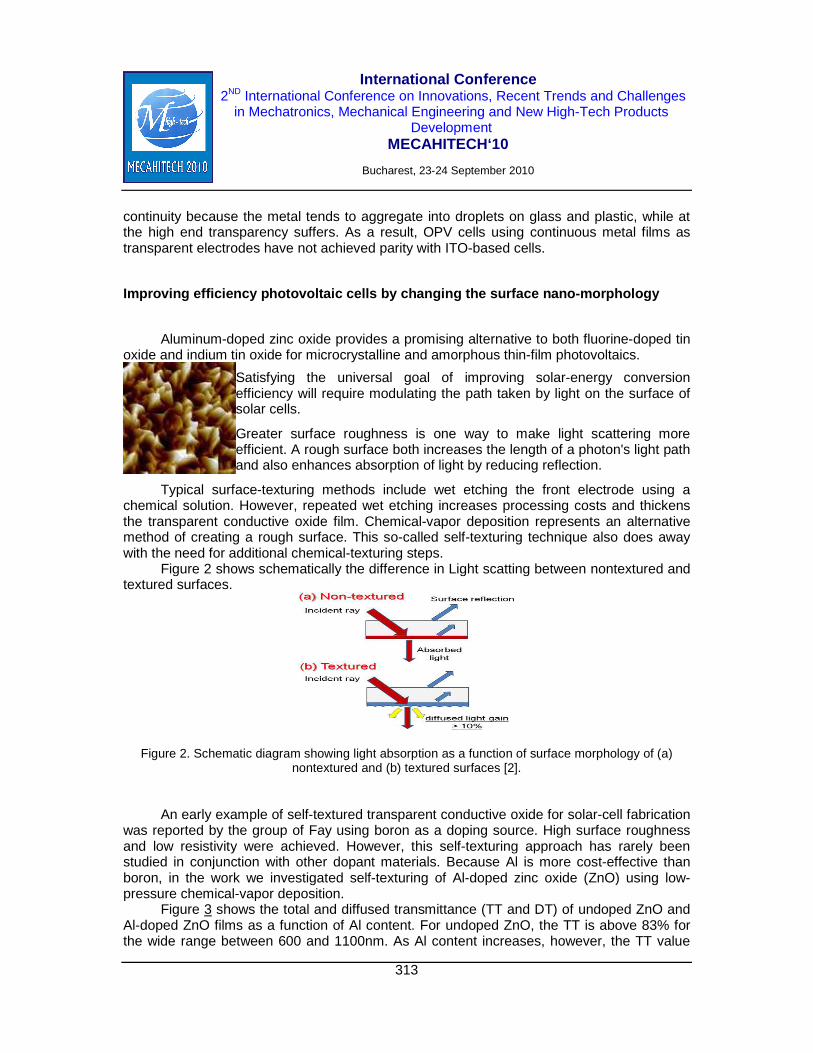
International Conference 2ND International Conference on Innovations, Recent Trends and Challenges
in Mechatronics, Mechanical Engineering and New High-Tech Products Development
MECAHITECH‘10
Bucharest, 23-24 September 2010
313
continuity because the metal tends to aggregate into droplets on glass and plastic, while at the high end transparency suffers. As a result, OPV cells using continuous metal films as transparent electrodes have not achieved parity with ITO-based cells.
Improving efficiency photovoltaic cells by changing the surface nano-morphology
Aluminum-doped zinc oxide provides a promising alternative to both fluorine-doped tin oxide and indium tin oxide for microcrystalline and amorphous thin-film photovoltaics.
Satisfying the universal goal of improving solar-energy conversion efficiency will require modulating the path taken by light on the surface of solar cells.
Greater surface roughness is one way to make light scattering more efficient. A rough surface both increases the length of a photon's light path and also enhances absorption of light by reducing reflection.
Typical surface-texturing methods include wet etching the front electrode using a chemical solution. However, repeated wet etching increases processing costs and thickens the transparent conductive oxide film. Chemical-vapor deposition represents an alternative method of creating a rough surface. This so-called self-texturing technique also does away with the need for additional chemical-texturing steps.
Figure 2 shows schematically the difference in Light scatting between nontextured and textured surfaces.
Figure 2. Schematic diagram showing light absorption as a function of surface morphology of (a) nontextured and (b) textured surfaces [2].
An early example of self-textured transparent conductive oxide for solar-cell fabrication was reported by the group of Fay using boron as a doping source. High surface roughness and low resistivity were achieved. However, this self-texturing approach has rarely been studied in conjunction with other dopant materials. Because Al is more cost-effective than boron, in the work we investigated self-texturing of Al-doped zinc oxide (ZnO) using low-pressure chemical-vapor deposition.
Figure 3 shows the total and diffused transmittance (TT and DT) of undoped ZnO and Al-doped ZnO films as a function of Al content. For undoped ZnO, the TT is above 83% for the wide range between 600 and 1100nm. As Al content increases, however, the TT value

International Conference 2ND International Conference on Innovations, Recent Trends and Challenges
in Mechatronics, Mechanical Engineering and New High-Tech Products Development
MECAHITECH‘10
Bucharest, 23-24 September 2010
314
reduces to 73% at 600nm. TT values in the wavelength range from 600 to 1100nm are similar, indicating that Al-doped ZnO transmits light uniformly in the visible and IR range for solar-cell applications. In particular, the introduction of trimethylaluminum doping is very effective in raising the DT value to 29% at 600nm (see Figure 3).
The haze factor, defined as the DT/TT ratio, quantifies the light-scattering capability in air of a ZnO thin film. The calculated maximum haze factor was 43% at a wavelength of 600nm for an Al content of 43mTorr. This result is 2.5 times higher than the haze factor of undoped ZnO and 2.8 times higher than for mass-produced fluorine-doped tin oxide.
Figure 3. Total- and diffused-transmittance spectroscopy of Al-doped ZnO films as a function of Al
content. (a) 0 wt%, (b) 5 wt%, (c) 7 wt%, and (d) 8 wt%.
The Yonsei University Institute of TMS (Telecommunications, Multimedia, State-of-charge) Information Technology, a Brain Korea have achieved a self-textured Al-doped ZnO surface without chemical etching. The surface roughness of the resulting films proved to be a function of Al content.They obtained a maximum roughness of 82.1nm at an Al content of 7wt%.
Based on the surface optical characteristics, we calculated a haze factor of Al-doped ZnO as large as 43% at a wavelength of 600nm.
These findings indicate that Al-doped ZnO has a higher light-scattering capacity than fluorine-doped tin oxide, which makes it a plausible alternative in the mass production of transparent conductive oxide for use in solar cells. In the future we will focus on preparing Al-ZnO films with low resistivity and testing their practical application in solar cells. Implementation techniques of the aerospace industry to manufacture photovoltaic cells
Lens arrays couple sunlight into a common slab waveguide to create large, inexpensive optics for solar photovoltaics.
Silicon-based photovoltaics (PVs) convert less than 20% of incident sunlight into electrical energy, yet account for almost all solar-power generation. High-efficiency solar cells developed for the space industry have demonstrated more than 41% conversion efficiency by layering multiple semiconductor junctions that capture large portions of the solar spectrum. Fabrication and material costs limit these cells to only a few square centimeters,

International Conference 2ND International Conference on Innovations, Recent Trends and Challenges
in Mechatronics, Mechanical Engineering and New High-Tech Products Development
MECAHITECH‘10
Bucharest, 23-24 September 2010
315
making them impractical for flat-panel installations. Concentrator photovoltaics (CPV) incorporate large-area optics that collect and deposit energy onto small, efficient solar cells with the promise of reducing electricity-generation costs compared to silicon-based PVs.
Optics for solar concentration typically consist of lenses or mirrors focusing onto secondary elements that eliminate intensity variations at the PV cell. A common approach places dozens of lenses into a shared tracking platform, each focusing onto independent secondary optics and solar cells. The large quantity of components increases mounting, alignment, and electrical-connection costs. Our proposed concentrator design replaces discrete optics with a 2D lens array and a common slab waveguide. Sunlight collected by the array focuses onto localized mirrors positioned to reflect light at angles that exceed the critical angle for total internal reflection and, therefore, couple into the waveguide. Coupled light is homogenized as it propagates towards the exit aperture at the slab edge(s) (see Figure 4). The PV cell and heatsink mount directly to the output edge. The coupling mirrors are fabricated using simple lithography techniques that make the design compatible with large-scale manufacturing, including roll processing.
Figure 4. Micro-optic concentrators combine a lens array and slab waveguide. At each focus, 120°
mirrored prisms couple light into the waveguide (inset). PV: Photovoltaic. [3]
The amount of focusing provided by solar concentrators is defined by the geometric-concentration ratio, which describes the ratio of input to output apertures. Optical efficiency is the fraction of light reaching the PV cell. It accounts for surface reflections, material absorption, and losses associated with propagation within the waveguide.
The micro-optic concentrator uses 120°-apex prisms placed at each focus that symmetrically reflect and couple sunlight into the waveguide.
Since the thickness remains uniform, guided light may strike a subsequent coupler and reflect out of the system as loss. The geometric-concentration ratio becomes the waveguide length divided by twice its thickness, with no dependence on width. The lens and acceptance angle determine the size of each coupling prism as well as impact losses within the waveguide. Propagation losses scale with waveguide length, leading to a tradeoff between geometric-concentration ratio and optical efficiency. TRENDS IN USE OF NEW SOURCES OF SOLAR ENERGY
It seeks the implementation of solar cells: - Component materials used in exterior cladding of buildings; - Achieving external windows of buildings;

International Conference 2ND International Conference on Innovations, Recent Trends and Challenges
in Mechatronics, Mechanical Engineering and New High-Tech Products Development
MECAHITECH‘10
Bucharest, 23-24 September 2010
316
- Make clothing items and accessories for solar cells; - Making the surface of solar cell roof tiles; - Implementation of solar cells personal items (sunglasses, bags, backpacks, caps) - Using solar cell component materials for the realization of streets, sidewalks and highways
The idea of asphalt for solar power isn’t particularly new – the concept was first conceived a decade ago, although its only been fully realized in the last couple of years. In 2007, a Dutch engineering company began siphoning the heat from asphalt to heat several homes and offices, as well as an aircraft hanger. The system used a network of plastic pipes through which the asphalt heated the cold water and channeled it into underground containers where it was kept hot until needed.
More recently, researchers at Worcester Polytechnic Institute (WPI) have conducted tests using actual pieces of asphalt as well as computer models. The scientists found that hot water created by an asphalt energy system could be used to generate electricity by being passed through a thermoelectric generator. Heated asphalt can also heat buildings by the method of passing the water through pipes under the asphalt – just as the Dutch team had discovered.
Asphalt has several advantages as a source of solar power. It’s a huge infrastructure that is already in place – in the United States for example, there are an estimated four million miles of asphalt road surface.
In general, asphalt is removed and the roads are resurfaced every decade or so; this would provide the opportunity to put in the necessary equipment with minimal expense.
Asphalt also retains its heat after the sun has gone down – giving it an advantage over solar panels. Removing the heat from asphalt can actually lower the temperature of the road surface too – making towns and cities cooler during hot weather. And unlike solar panels, which are all too visible, virtually all the asphalt collection equipment would be hidden under the ground.
Intriguing though these findings are, don’t expect to see the widespread use of asphalt solar power any time soon. It may be many years before a network of pipes under the roads is able to provide energy – but at least it’s a step in the right direction.
REFERENCES
[1] Max Shtein – Thin metal films as simple transparent conductors 28 December 2009, SPIE Newsroom. DOI: 10.1117/2.1200912.1848
[2] Doyoung Kim and Hyungjun Kim – Self-textured transparent conductive oxide film improves efficiency of solar cells February 2010, SPIE Newsroom. DOI: 10.1117/2.1201002.002596
[3] Jason H. Karp and Joseph E. Ford – A micro-optic solar concentrator 26 April 2010, SPIE Newsroom. DOI: 10.1117/2.1201004.002673
[4] Prachi Patel-Predd – Efficient Thin-Film Solar Cells Thursday, December 04, 2008
[5] Jason H. Karp, Joseph E. Ford – Trends in Solar Cells and Photovoltaic Technology (2004 - 2012), University of California at San Diego La Jolla, CA (updated September 2008)

International Conference 2ND International Conference on Innovations, Recent Trends and Challenges
in Mechatronics, Mechanical Engineering and New High-Tech Products Development
MECAHITECH‘10
Bucharest, 23-24 September 2010
317
Collaborative Product Development - A Groupware Sys tem Based
on Service Oriented Architecture
Daniel do N. Melo(1), Leonilde Varela(2), S. Carmo-Silva(2) (1) Amazonian CERTI Institute, (2) Department of Production and Systems, University of Minho
(1) Manaus, Amazon, Brazil, (2) 4710-057 Gualtar Campus, Portugal [email protected], leonilde, [email protected]
ABSTRACT
Product Development (PD) can be enhanced through web-based collaboration of working teams. This collaboration enables professionals to work simultaneously on a same project, e.g. the development of a new product. Collaborative PD requires networking resources, and applications needed by collaborating teams in the design and management of product development projects. Using this collaborative approach to PD can bring benefits on cost and speed of development, and also on ideas, all important factors contributing for increased competitiveness of companies and industrial regions worldwide. This is an important objective of the Industrial District of Manaus, Brazil, where the results of the research work reported in this paper are intended to be firstly applied. This work explores two dimensions of the web based PD problem, namely the PD collaboration platform and the PD tasks and information management dimensions. An investigation was carried out into groupware applications and technology and also into tools for managing product development projects. This led to the proposal of a model of a collaborative system for new product development based on both the Service Oriented Architecture and the SCRUM project management framework. This paper describes the specification of software and hardware requirements for the proposed model and the collaborative tools to be used.
INTRODUCTION
Product development can benefit from internet based collaborative environments. These favour interaction between PD stakeholders worldwide and ideas generation. Such environment can also enhance the product development cycle and achieve levels of speed and quality of product innovation never possible before.
Having into account that product innovation is nowadays probably the major factor of success of companies, investment on the development of suitable collaborative environments for improving new product development process and shortening its cycle is bound to be worthwhile. This work gives a contribution to this area. It proposes a groupware model for a collaborative product development (CPD) system, base on web services and the SCRUM project management tool and methodology [1]. The aims are to help to structure, improve and speed up the whole PD process, from start to end, in the sector of electronics consumer goods and related software. For this, in addition to the communication enhancement, web services and updated information on every PD task or version can be made readily available and accessible to PD stakeholders by this CPD system.
The CPD is based on a PD management structure organized into five phases. These

International Conference 2ND International Conference on Innovations, Recent Trends and Challenges
in Mechatronics, Mechanical Engineering and New High-Tech Products Development
MECAHITECH‘10
Bucharest, 23-24 September 2010
318
are borrowed from PMBOK [2] published by the Project Management Institute, which describes the nature of the processes of project management in terms of integration between processes, the interactions within them and the objectives they serve. These processes are aggregated into five groups, defined as groups of processes of project management: 1) Initiation processes; 2) Planning processes; 3) Process implementation; 4) Process monitoring and control; and 5) Closing Process.
Thus, the groupware model of the CPD system includes functionalities that follow these process groups of the PD cycle.
In addition to this introduction the paper is organized as follows: First a simplified view of the framework for collaborative work through the web is presented. Then the nature and kind of components for constructing the web based CPD system are described. Before the conclusion we present first a simple view of the system architecture and then a brief description its functional features. The conclusion puts in perspective objectives, achievements and the intended use of the CPD system in the Industrial Manaus District (PIM) of Brazil, and refers the planned near future work
THE WEB APPROACH TO COLLABORATIVE WORK
The term groupware was introduced in 1978 by Johnson and Lenz, as referred in [3], and defined as software components that help professionals in a local-area network to organize their activities to support the implementation of group activities. With the evolution of computer communications and Internet, the concept of groupware evolved. Nowadays, it is identified with collaborative networks and Computer Supported Cooperative Work (CSCW). This is a domain of computer science that studies the use of groupware technology. According to Rama [4] the term collaborative networks are networks based on web technology aimed at increasing the productivity of human resources and running group activities, local or remotely.
Web service technology is used in order to provide tangible benefits to users in the network, allowing them to access and perform their work efficient and quickly through the Internet.
Web services are software applications’ components that can be accessed over the Internet for reuse in other applications or to easy interoperability between different application and platforms allowing easy exchange of data between them. As defined by W3C (World Wide Web Consortium) [5] web services are essentially based on the following standard open source tools or technologies:
• XML (Extensible Markup Language); • SOAP (Simple Object Access Protocol); • UDDI (Universal Description, Discovery and Integration); • WSDL (Web Services Description Language).
Using open standards provides the web service Interoperability between solutions from different vendors, allowing companies to establish partnerships and working groups to collaborate in a more flexible and dynamic way. Moreover, web services enable to combine two ubiquitous technologies: XML, the language of universal data description, and the HTTP transport protocol most widely used by web browsers and servers. These are important features for collaborative environments.
Due to the importance of using web services for CPD the proposed collaborative

International Conference 2ND International Conference on Innovations, Recent Trends and Challenges
in Mechatronics, Mechanical Engineering and New High-Tech Products Development
MECAHITECH‘10
Bucharest, 23-24 September 2010
319
system explores the Service Oriented Architecture (SOA) technology [6]. Web service specifications are completely independent of programming language,
operating system and hardware. This independence facilitates the use of web services on the Internet, through easy access by users and easy release by web service providers.
Figure 1 illustrates a typical web service structure, describing its main functionalities, represented through stages occurring between the web service publication and its utilization by the user. In this cycle a few tasks need to be carried out for a web service to be used: 1 – the web service provider publishes the service in a universal registry, i.e. the UDDI; 2 – (2a and 2b) the user looks for, requests and obtains information about the service and service access; 3 – (3a and 3b) After access request and authorization the service is provided and used.
Figure 1: Web Service structure (Adapted from Luo et al. [9]).
According to Papazoglau [7] Service Oriented Computing (SOC) is a paradigm that
uses web services as main elements for developing applications, including groupware applications. The author lists the following main characteristics and advantages of SOC:
• Support the development of rapid and low cost distributed applications, enabling massive interoperability;
• Represent platform-independent entities that can be described, published and flexibly integrated with other systems;
• Carry out simple tasks, such as elementary data request um to complex ones, namely, related to highly hierarchical business processes;
• Provide information distribution across independent platforms. To favour the implementation of groupware requirements, Huhns [8] considers some
additional requirements: • Neutral features concerning technology used, i.e., the access and communication should be based on open standards, such as, protocols, descriptors and discovery mechanisms;
• Weak coupling, i.e., the systems should operate independently. Considering that coupling can occur at different levels, it is important that: only the interfaces provided by the service are used in the services engine, and registration and discovery mechanism decouples the use of the service location, using a transport protocol independent of the platform. Moreover, coupling by the style of invocation can be

International Conference 2ND International Conference on Innovations, Recent Trends and Challenges
in Mechatronics, Mechanical Engineering and New High-Tech Products Development
MECAHITECH‘10
Bucharest, 23-24 September 2010
320
controlled by the use of asynchronous messages; • Transparent location, by defining the location of a service through a repository accessible to multiple clients, independently of their location;
• Ability of service composition for the formation of another service; • Ubiquity of services. Enabling services’ access through the Internet anywhere and anytime, worldwide.
The characteristics described above are required for performing collaborative work through web services in secure and agile environments, also enabling effective communication between different data bases, contributing to better PD processes. In this context, Luo [9], reports a web service technology based application of SOC, widely used under the scope of collaborative work. The wide spread use of web services through SOC is due to their capability for enabling integration of heterogeneous and distributed applications over the Internet.
The SOA is a distributed computing paradigm that enables an integrated use of distributed data bases, which are under control by different proprietary domains [10]. Moreover, the use of SOA enables to reuse existing software components and promotes the interaction between different actors involved in the product development process, belonging to different organizations [11].
SOA [12] is an architecture oriented to business applications that include specific individual processes,. In this context, through the implementation of SOA it is possible to define an architecture that enables integration of different web service systems’ components in a flexible an agile way [13].
The choice of SCRUM tool and methodology was based on its suitability for project management agility and for speeding-up the CPD process. This methodology has been intensively used for PD, particularly in the management of software development projects.
COLLABORATIVE PRODUCT DEVELOPMENT SYSTEM COMPONENTS
In terms of implementation, the CPD system is based on the following key requirements:
• Open source software components: related to selected operating system, programming language and database structure that implements the best solution based on open source technology;
• Hardware components: infrastructure for the capture, transmission and distribution of information;
• Collaborative tools: tools, systems or software applications to be integrated into the collaborative system;
• User Interface: graphical interface through which the users are able to access the contents available on the collaborative software.
An important component of the groupware model of the CPD environment is its collaborative system’s user interface. The usability of this interface is expressed in terms of the way information can be stored, how easily and appropriately it can be accessed and shared, in order to enable a good CPD system.
A few tools were selected and briefly described. They are considered a coherent and complementary set of tools suitable for integration within the proposed architecture. This is mainly because interoperability among these tools is guaranteed, at a high level. A great

International Conference 2ND International Conference on Innovations, Recent Trends and Challenges
in Mechatronics, Mechanical Engineering and New High-Tech Products Development
MECAHITECH‘10
Bucharest, 23-24 September 2010
321
contribution for this interoperability is the standard and open source nature of most of the tools and software.
Open source software
Code reuse is a common practice in software development, especially when using programming languages that are already designed for enabling it, as occurs with JAVA programming. This allows faster system development. Moreover, frequently software components already tested are freely available and used. Thus, the CPD system is developed from open source software components that, among other pieces, incorporate:
• An open source operating system, preferably stable and incorporation constantly updated packages;
• An open source web server, which include authentication modules, and several important features for developing collaborative systems, such as, https and tls. This components must be stable, and incorporate constantly updated packages for Windows and Linux environments;
• A default operating system for Mail Servers, although, not always preventing from the existence of other mail servers;
• A programming language for developing the core of the system, GUI (Graphical User Interface), integration with collaboration tools and other software components. Such programming linguages typically may include combinations of the following: PHP (Hypertext Preprocessor), Java, Javascript, CSS (Cascading Style Sheets) and XML.
The implementation of the proposed groupware collaborative system adopts the following software components and development tools:
• Linux operating system, which may be chosen from Debian, Ubuntu, Suse or Red Hat, among others;
• Apache Web Server; • Development of the core of the system by using PHP programming language; • Development of the system’s GUI, by using Javascript and CSS; • Development of middleware components, by using XML programming language. This
middleware layer includes some important components which are important for the communication between the collaborative system itself and the client software SAGLI [14].
Collaborative tools
The focus of the proposed collaborative system is on providing features and functionalities for improving new product development processes and management. Therefore, open source collaborative tools for project management were studied for incorporating in the CPD system. Among the tools studied, dotProject [15] uses a set of features and characteristics that make it suitable for aiding project management within collaborative environments. In the CPD system the version of this tool developed in PHP is integrated with two other tools, namely Eventum tool [16], which registers and manages the testing functions of software and hardware development. Another tool is Subversion, which produces versions of documents and source codes [17].
These tools will be customized to improve their usability in the context of the CPD

International Conference 2ND International Conference on Innovations, Recent Trends and Challenges
in Mechatronics, Mechanical Engineering and New High-Tech Products Development
MECAHITECH‘10
Bucharest, 23-24 September 2010
322
system as a whole. For enhancing the CPD process and meeting the regulations of the Manaus District,
where the collaborative system is initially to be applied, the development of the following additional components are scheduled:
• eSCRUM: a software component for information parameterization, namely: schedule, milestones and dates, which enables to perform the automatic project management based on the SCRUM methodology;
• eSAGLI: a software component software (middleware) responsible for the transferring of data from the collaborative system to SAGLI through XML. This feature is necessary for implementing the Law of Computing Developed in Manaus, Brazil.
Hardware components
In terms of hardware we consider two important components: the physical environment, including equipment and the data link component needed for processing and storing data, as well as for implementing data security features throughout the collaborative system.
In order to provide Internet access to the services available, through the collaborative system, a server with storage and processing capacities is required. This enhances efficiency and speed of running the services accessed.
Figure 2 represents the minimum infrastructure components required for the operation of the collaborative model system. In this configuration the collaborative system is embedded in a server, which is accessed through the Internet by some user and corresponding validating data.
Figure 2: Infrastructure for collaborative model system. Regarding the security aspect of information contained in the collaborative system, we
identified the following software technologies necessary to implement: • HTTPS (Hypertext Transfer Protocol Secure): an application that aims to ensure
security for data transmissions over the Internet; • SSL (Secure Sockets Layer): a layer to implement privacy and reliability between two
application programs that communicate with each other. It runs through various application programs and platforms, based on different operating systems, and enables to establish a process of negotiation and job functions for mutual authentication, as well as data encryption and integrity checking for secure transactions establishment between applications on the Internet.
ARCHITECTURE OF THE COLLABORATIVE SYSTEM
The proposed collaborative system is based on SOA, as previously referred, and the
Internet
Users Collaborative
System Server
Firewall Router

International Conference 2ND International Conference on Innovations, Recent Trends and Challenges
in Mechatronics, Mechanical Engineering and New High-Tech Products Development
MECAHITECH‘10
Bucharest, 23-24 September 2010
323
access to services is performed through the Enterprise Service Bus (ESB). Therefore, each service performs its functions and provides, through the bus, data and information to be used by other services. In this system the JBossESB [18] implementation is also used.
The use of different programming languages between modules can cause a major impact on the integration of the proposed system with other applications. Thus, the implementation of ESB allows all services offered by the collaborative system to be accessed through a common language. Moreover, this makes each service independent, which is also an important feature in this context of a collaborative system.
Figure 3 gives a simple view of the main architecture of the proposed collaborative system. The system that uses ESB is called eSCRUM and uses XML to communicate between system components. An important aspect of this is that the system remains open to possible improvements and insertions of new components with new features for the collaborative system. The eSCRUM enables a language-independence development of the system by providing communication between diverse languages such as PHP, XML, SQL, and HTTP. Additionally, this component will automatically collect information from the collaborative tools, such as dotProject, eventum and Subversion, showing it through a user interface.
The collaborative system's database management application uses the same standards as defined in the ESB reference.
According to Thomas [19], the services are offered by service providers, which provide a distributed computing infrastructure, enabling application integration within and outside of a Internet domain. Client of these services can also be applications that are or not in the field. Thus, there are components in the proposed system’s architecture for clients and service providers.
Figure 3: A synthetic view of the CPD system’s architecture.
FUNCTIONAL FEATURES OF THE CPD ENVIRONMENT The use of the CPD system, including services provided, require the user to performe a
number of tasks related with the functional features of the system. These include: • Authentication password: to create a password for the user, through which the
collaborative system can be accessed; • Registration of a company or institution: it allows the integration of cadastral data of
the company through a predetermined form; • Registration of project team: enables integration of data from its users that compose
a team through a pre-defined form; • Registration of the project: it allows the integration of cadastral data of the company

International Conference 2ND International Conference on Innovations, Recent Trends and Challenges
in Mechatronics, Mechanical Engineering and New High-Tech Products Development
MECAHITECH‘10
Bucharest, 23-24 September 2010
324
through a predetermined form; • Visualization of projects: the planned projects activities. After the user loges in into
the collaborative network, it will enable information about its status in the projects involved, and their activities at that time;
• Configuration of the communication system: allows registering the dates of the project deliverables, types and dates of meetings, with their frequency and duration, among other relevant information, based on the SCRUM methodology. Through this project management features some important functionalities can be made available in an automatic way through several different kind of alerts and generation of graphs and distinct indicators. These eSCRUM components enable: • Integration with the open source tool dotProject; • Integration with the open source tool Eventum; • Integration with the open source tool Subversion; • Integration with the client application SAGLI, through a component called eSAGLI.
Figure 4 below shows an use-case diagram [20] for illustrating the main features of collaborative system.
Figure 4: User case of collaborative system.
CONCLUSION
One important objective of the Industrial District of Manaus (PIM), Brazil, is to increase
the quality and the rate of new product development projects as a means of improving economical and social sustainability and increase competitiveness of the industrial sector of

International Conference 2ND International Conference on Innovations, Recent Trends and Challenges
in Mechatronics, Mechanical Engineering and New High-Tech Products Development
MECAHITECH‘10
Bucharest, 23-24 September 2010
325
the Amazon region. We are essentially talking about a strategy anchored on product innovation
Product innovation, being nowadays a major factor of success to companies, requires agility and an environment to promote creativity, ideas and improve the management and the speed of execution of new product development projects.
The opportunities put forward by the information and communication technologies together with the tools favouring collaborative work are discussed and explored in this paper as a means to contribute for the PIM stated strategy and objective. Thus, a study was carried out for creation of a collaborative environment for new product development towards improving and speeding management and the whole product development cycle.
This study puts together web and web based project management tools to arrive to what we call a groupware based Collaborative Product Development system. Web services, are used and organized in a Service Oriented Architecture. The components for management of project as a whole and their activities are based on the SCRUM methodology and web tools such as eSCRUM and eSAGALI. This is a tool necessary for, during project management, handling and integrating of data in specific databases, e.g. government and company databases.
Time, costs and development cycle of new PD projects are expected to be greatly reduced through the use of the collaborative system being designed.
At the moment the system is in advanced state of development and it is expected in the near future to test it with one or a few product development projects.
REFERENCES
[1] Scrum Tools - ScrumWorks Pro & ScrumWorks Basic. Available at: <http://danube.com/scrumworks>. Accessed 05/10/2010. [2] Project Management Institute, Inc, 2001, “Um Guia do Conjunto de Conhecimentos em Gerenciamento de Projetos”, 3Ed., PMI, ISBN: 1-930699-74-3. [3] Coleman, D. D., 1992, “Groupware”, Morgan Kaufmann Publishers, Inc.[4] Rama, J., Bishop, J., 2006, “Survey and comparison of CSCW Groupware applications”, SAICSIT. [5] Web of Services. Available at: <http://www.w3.org/standards/webofservices/>. Accessed 05/19/2010. [6] Erl, T., 2004, “Service-oriented architecture: a field guide to integrating XML and web services”, Prentice Hall PTR, ISBN 0-13-142898-5 [7] Papazoglou, M. P., Schabram, D., Leymann, F., 2007, “Service-oriented Computing: State of the Art and Reserch Challenges”, In IEEE Computer Society. [8] Huhns, M. N., Singh, M. P., 2005, “Service-oriented computing: key concepts and principles”, In IEEE Internet Computing. [9] Luo, M., 2004, “Patterns: Service-Oriented Architecture and Web Services”, IBM

International Conference 2ND International Conference on Innovations, Recent Trends and Challenges
in Mechatronics, Mechanical Engineering and New High-Tech Products Development
MECAHITECH‘10
Bucharest, 23-24 September 2010
326
International Technical Support Organization. [10] Gold-Bernstein, B.; SO, G., 2006, “Integration and SOA - Concepts, Technologies, and Best Practices”, webMethods, Inc. [11] Feuerlicht, G., 2006, “Enterprise SOA: What are the benefits and challenges?”, International Conference Systems Integration, Prague, Czech Republic, Proceedings. [12] IBM Software Group, 2005, "Standards for success:IBM commitment to SOA and standards for the insurance industry", IBM Whitepaper. Disponível em: <http://www-03.ibm.com/industries/financialservices/doc/content/bin/fss_insurance_standards.pdf>. Accessed 06/16/2010. [13] Dudley, C., Rieu, L., Smithson, M., 2007, “WebSphere Service Registry and Repository Handbook”, First Edition. Ed. IBM RedBooks. [14] SAGLI. Available at: < http://www.suframa.gov.br/sagli/arquivos/guia_utilizacao.pdf>. Accessed 08/09/2010. [15] Welcome to dotProject. Available at: <http://www.dotproject.net/>. Accessed 05/10/2010. [16] Eventum. Available at: < http://dev.mysql.com/downloads/other/eventum/>. Accessed 05/10/2010. [17] Subversion. Available at: <http://subversion.apache.org/>. Accessed 05/10/2010. [18] JBoss ESB - Reliable SOA infrastructure. Available at: <http://www.jboss.org/jbossesb>. Accessed 06/08/2010. [19] Thomas, E., 2005, “Service-Oriented Architeture – Concepts, Technology and Design”, Prentice Hall, 1 edition. [20] Martin F., Kendall S., 2000, “UML Distilled”, Addison-Wesley.

International Conference 2ND International Conference on Innovations, Recent Trends and Challenges
in Mechatronics, Mechanical Engineering and New High-Tech Products Development
MECAHITECH‘10
Bucharest, 23-24 September 2010
327
3D Printing Methods of Biological Materials used in Tissue
Engineering
Aleš Gregor, Jan Hošek. Czech Technical University in Prague,
Technicka 4, 166 07 Prague 6 Czech Republic,
[email protected] [email protected]
ABSTRACT
Fibrin is the basic physiological biopolymer responsible for hemostasis and because of its biodegradability properties is now widely used in tissue engineering for the formation of biological structures called scaffolds. New tissue with desired shape and properties arises by an implementation of suitable stem cells and control of their growth within the scaffold. Fibrin can be obtained in the laboratory by mixing two commercially available biological proteins components, fibrinogen and thrombin. It is assumed, that in the near future this principle will be used in many fields of medicine where replacement or restoration of any type of tissue is required. Current global research in this area seeks to develop the principle of formation of these structures using 3D printing, especially based on inkjet printing technology. This article describes experiments that were performed to clarify, whether micro-droplet dispenser Ultimus 2400 can be used for the production of fibrin structures. The first part gives technical information about a special micro-positioning apparatus, which was designed to grab dispensing nozzles. Further are provided results of experiments that were conducted to determine the behavior and properties of individual injected doses in relation to time, pressure, angle and distance of injection. Mixing properties of fibrin components and ability of deposition one drop on another were also examined to create demanded shapes of structure. All results should be the basis for further development of automated production of fibrin structures using mentioned dispersion technology. Keywords: biological microstructures, biofabrication, fibrin scaffold, 3D printing, ink-jet printing, layer by layer printing, dispenser Ultimus 2400.
INTRODUCTION
The primary objective of tissue engineering is regeneration or replacement of tissues or organs which are damaged by disease, injury or congenital anomalies. At present, the scientific discipline use for the repair of damaged tissues and organs, artificial scaffolds supporting structures. These are used for attachment of appropriate cells and control their growth. During cell growth occur simultaneously gradual biodegradation of protein structure and final product is a new tissue with desired shape and properties. Especially in recent years, scientific resources and publications refer to the research of these structures both in biological terms in vitro as well as to technological development, using several approaches of biofabrication. However, it is a long-term of experiments that have not still achieved adequate

International Conference 2ND International Conference on Innovations, Recent Trends and Challenges
in Mechatronics, Mechanical Engineering and New High-Tech Products Development
MECAHITECH‘10
Bucharest, 23-24 September 2010
328
results which could be applicable during coming years in clinical practice [2][3][4][5][6]. Inkjet bioprinting is one of the most exciting and elegant biofabrication technologies. Dr. Thomas Boland from Clemson University, South Carolina, and his followers have shown both a high level of control on cell dispensing as well as remarkable viability and certain functionality of printed cell patterns using different cell types [1][7][8][9]. There are also certain promising results for bioprinting 3D tissue constructs using inkjet bioprinting [10][11]. However, the issue of cell density and demonstration of authentic functional and structural 3D tissue organization continue to be an unsolved problem. Several groups around the world are actively working on improvement of inkjet bioprinting technology.
Our approach to solving the 3D printing of biological structures should be using of the dispenser Ultimus 2400 (Fig. 1), where the only impellent force which force out injected medium from the nozzle is air pressure.
Figure 11: dispenser Ultimus 2415, source: http://www.efd-inc.com
Current research still faces to problems, because the inkjet printing process is harsh,
with very high temperatures (in excess of 300°C) an d shear force (so high that is difficult to measure it), generated in the nozzle. Most cells, especially delicate ones like neurons, are compromised during this process. In addition, because the tip of the inkjet nozzle is not much bigger than a cell body (20–30µm), cells can clog the tip[12].
Crucial advantage of Ultimus technology is therefore the assumption, that the air pressure has no negative effect on the biological properties of the materials and cells. In addition, the device itself is so sophisticated that injection properties can be edited in wide range of options without any technological intervention into the device. This fact is indisputable advantage over the use of ink-jet printing heads. Our currently research is therefore focused on the use of mentioned dispenser.
MATERIALS AND METHODS
As an essential material for creating scaffolds was used Fibrin gel. Biomaterials made up of Fibrin can attach many biological surfaces with high adhesion. Its biocompatibility
Basic Technical Parameters of the Device Pressure range: 0 – 1.1 bar Dosing frequency: 0.0001 to 999.9999 s Smallest inner diameter of the nozzle: 0.15 mm The device also has a reverse function of the nozzle creating a vacuum that provides greater accuracy of dosage, the excessive amount of dose is sucked back into the nozzle The device allows usage of the two injection nozzles simultaneously.

International Conference 2ND International Conference on Innovations, Recent Trends and Challenges
in Mechatronics, Mechanical Engineering and New High-Tech Products Development
MECAHITECH‘10
Bucharest, 23-24 September 2010
329
comes from being not toxic, allergenic or inflammatory [12][13]. Fibrin scaffold is an important element in tissue engineering approaches as a scaffold material. It is advantageous opposed to synthetic polymers and collagen gels when cost, inflammation, immune response, toxicity and cell adhesion are concerned. Fibrin consists of the blood proteins Fibrinogen and Thrombin which participate in blood clotting [14]. Fibrinogen is usually obtained from porcine, bovine or human blood. For our experiments was used Fibrinogen extracted from porcine blood. Thrombin is extracted from the liver. Solidification speed of Fibrin gel depends on the concentration and amount of thrombin. For low solidification is used usually in a concentration 4IU(International Unit) and for quick up to 500IU. In our case was used 4IU. Mixed ratio of both Fibrinogen and Thrombin components was 1:1.
More detailed instructions for preparation of 2ml of Fibrin gel are listed in the scheme below:
List of items used for preparation of 2ml of Fibrin gel:
• Porcine Fibrinogen 75mg • Thrombine 4IU • CaCl2 – 4,4 mg/ml • Aprotinin 3000KIU 1ml
Before experiments some properties of Fibrin gel and its components were empirically measured. Since Fibrin is a substance which after mixing of both components leads to longer-term physiological processes, the change of its weight and hence density during its solidification was expected. The following measurements demonstrate that the assumption was correct. Five samples of 200µl volume were blended and then their weight was measured. Table 1 – weight of sample in relation to time
Time - t (min) 0 10 15 20
1. sample – weight (kg) 0,000199 0,000194 0,000189 0,000185
2. sample – weight (kg) 0,000199 0,000193 0,000187 0,000182
3. sample – weight (kg) 0,000199 0,000194 0,00019 0,000185
4. sample – weight (kg) 0,000199 0,000195 0,00019 0,000186
5. sample – weight (kg) 0,000199 0,000194 0,00019 0,000185
Note: mixed fibrin gel has homogeneous properties
Fibrinogen Powder
Thrombin 4IU
75mg of Fibrinogen powder is dissolved in 1 ml of Aprotinin 3000 KIU
Thrombin is dissolved in 1 ml of CaCl2
2 ml of Fibrin gel

International Conference 2ND International Conference on Innovations, Recent Trends and Challenges
in Mechatronics, Mechanical Engineering and New High-Tech Products Development
MECAHITECH‘10
Bucharest, 23-24 September 2010
330
Density was calculated from measured values of weight in different time. Table 2 – density of sample in relation to time
Time t (min) 0 10 15 20
1. sample – density (kg/ m3) 993,5 969 945 924
2. sample – density (kg/ m3) 997 964 936,5 910
3. sample – density (kg/ m3) 994,5 971,5 947,5 925,5
4. sample – density (kg/ m3) 997 972,5 951,5 927,5
5. sample – density (kg/m3) 993 969,5 948,5 925
Average density (kg/ m3) 995 969,3 945,8 922,4
Futhermore was measured density of each component separately: Table 3 – density of components
Component Density (kg/m 3)
75mg of Fibrinogen dissolved in 1 ml of Aprotinin 3000 KIU 1040
Thrombin dissolved in 1 ml of CaCl2 1002
In the first phase it was necessary to determine the behavior and properties of
individual injected doses in relation to time, pressure, angle and distance of injection. Further, the ability of mixing components deposition one drop to another in connection with the above parameters was examined to create demanded shapes of structure. For this purpose was created special apparatus.
The apparatus (Fig. 2) consists of a precise manual positioning mechanism for
movement in XYZ axes. Accuracy of movement in all three axes is ensured by micrometer heads (1) with range of motion in the length of 25 mm and positioning accuracy of 10µm. Product also enables attachment of two nozzles (2) at an angle of 45° (angle of nozzle recommended by manufacturer to ensure best results of dose deposition). Each of the nozzles provides injecting of one component - Fibrinogen or Thrombin.

International Conference 2ND International Conference on Innovations, Recent Trends and Challenges
in Mechatronics, Mechanical Engineering and New High-Tech Products Development
MECAHITECH‘10
Bucharest, 23-24 September 2010
331
Figure 2: Special apparatus for nozzle attachment.
As mentioned earlier, depositing of specific dose is influenced by several factors.
Therefore was necessary to find their appropriate combination. The main parameters that can be set on the dispenser are pressure applied during deposition of the dose, dose time and vacuum. Other parameters relating to the geometric positioning of nozzles are the angle of nozzles, the distance from the impact area and the distance between tips of nozzles. Distance between tips of nozzles depends on distance of the impact area, where must be ensured that injected dose from both nozzle is targeted to the same point.
Because of such a large number of parameters it was necessary to eliminate several of
them by some logical assumptions. The first was fixed angle between the nozzle and impact area is 45°. During manual dosing using only one no zzle is precise dosing achieved by holding the nozzle at an angle of 45°, while the bo ttom edge of the tip touches the surface of the impact area. Overcome the adhesion forces to separate drop from the nozzle is accomplished by lifting of the nozzle. In this experiment, due to fixed attachment of the nozzle and planned dosage one layer to another, this method seemed complicated. Assumption was therefore to set an appropriate fixed distance in relation to setting a sufficiently high pressure and vacuum simultaneously to achieve the lowest volume of dose and also achieve its separation from the nozzle before reaching the surface. Elimination of an additional factor is based on the assumption that the smaller dose, the less weight and therefore it leads to lower ability for self-overcoming adhesion forces for separation from the nozzle. For this reason, therefore, pressure was set fixed at its maximum value of 1.1bar.
After elimination of some factors only three factors remain. To achieve the required
dose was therefore necessary to find a suitable combination of: • Time of dose,
1
2

International Conference 2ND International Conference on Innovations, Recent Trends and Challenges
in Mechatronics, Mechanical Engineering and New High-Tech Products Development
MECAHITECH‘10
Bucharest, 23-24 September 2010
332
• Value of vacuum, • Distance of the nozzle from the impact area.
Due to the symmetry dosage of both components for searching of suitable
parameters only one nozzle was used. Dosing was deposited on a glass plate.
RESULTS
Experiments were performed first with water and then with Fibrin components. In the first phase of the experiment with water vacuum effect was not used. From zero time while the maximum pressure was applied the time was gradually increasing – increase step was 0.0001 sec. At the value of 0.0004 sec. at the tip of the nozzle appeared spherical shape of drop, but due to adhesion forces was not able to detach it-self and fall on impact area.
The nozzle was therefore shifted towards to impact area to find height where drop touches the surface while pressure is applied. Appropriate height was found at 120µm. The nozzle was therefore shifted to a distance of 150µm from the surface to ensure some free area for separation of the drop from the nozzle. Under these conditions was necessary to search vacuum value that would "cut off the tail" of flying droplet, which normally remains attached by adhesion forces at the nozzle tip. Thus when the pressure is released, drop is sucked back to the nozzle. Setting an appropriate value of vacuum, when is drop forced out on the impact area, was found in the range of 3 - 3.5 in H2O. Chart below shows the dependence of diameter of individual drop on time of dose (vacuum was set to 3.5).
Figure 3: Chart shows that increase of diameter in dependence to increase of time of dose has linear
behavior.
When these values were searched, experiment could be extended on the use of both jets at once. The ideal distance between the nozzles to ensure the impact of two doses at one point was calculated according to the scheme below.

International Conference 2ND International Conference on Innovations, Recent Trends and Challenges
in Mechatronics, Mechanical Engineering and New High-Tech Products Development
MECAHITECH‘10
Bucharest, 23-24 September 2010
333
Figure 4: Scheme of nozzle position. Distance from impact area is 0.15mm, outer diameter of the nozzle is 0.3mm (inner diameter is 0.15mm), distance between nozzles is 0.5mm and angle of the
nozzle is 45°. By repeated experiments was found that the application of pressure leads to
balanced dose within one point with two nozzles. Based diameter of one mixed drop was ranging from 600 to 700µm. For creating line deposition of one drop besides another was chosen displacement 350µm, to ensure the fusion of individual droplets Fig. 5.
Figure 5: Scheme of deposited drops
Under the same conditions as during experiments with water were performed experiments with Fibrin gel. First, each component was applied separately and the searchicng of optimal dosing was performed the same way as in the case of water sample. Based on these experiments it was found that the properties of individual doses have the same parameters as water. Followed by experiments in which both components were injected together. There was observed mixing of both components and velocity of solidification of dose in time. Finally was created a 3D scaffold of dimensions 7x7x3 (x,y,z)mm3 created from 3860 connected individual drops of fibrin. Solidification:
As properly stiff state was considered when a drop did not flow down of glass during its tilt and remained stuck on the glass. Thus time of solidification was determined at 50-60s from deposition respectively from mixing of drops.
Scaffold:
As shown in the Fig.6, the final product is about 1mm less on both sides of the base then was planed at the beginning of experiment. Part of the solution during solidification
350µm 600-700µm

International Conference 2ND International Conference on Innovations, Recent Trends and Challenges
in Mechatronics, Mechanical Engineering and New High-Tech Products Development
MECAHITECH‘10
Bucharest, 23-24 September 2010
334
flows away or evaporates and therefore the volume of final product is smaller. Also change of density in time should be calculated. Individual scaffold layer was formed by lines of merging drops. Lines of another layer crossed lines of the previous layer. Before deposition of next each layer was necessary to wait for a sufficient solidification of the previous layer to ensure the sufficient adhesion of upper layer on the bottom layer. If the bottom layer was not sufficiently stiff, this would lead to diffluence of both layers in axes x, y. Despite of the excellent adhesion of Fibrin small outflow of the solution occurred during its solidification. It was difficult to determine exact height of each single dose or layer. Moreover, it is clear that height of each dose can be different in tens of microns then another, because of its diffluence or due to irregular shape of surface of previous layer. Difference of lifting of the nozzle for applying the next layer was therefore set at 120µm. If there was not visible new drop deposited on the surface at level below, then distance of nozzle was adjusted.
a) b) Figure 6: Printed scaffold in real, a) 14 layers – 7x7x1.5mm, b) 30 layers – 6x6x3mm Summary of searched “ideal” parameters and values are shown in the following table. Table 4 – Dose parameters summary
Pressure (bar)
Vacuum (in H2O)
Dose Time
(s)
Impact Area
Distance (µm)
Distance between Nozzles
(µm)
Diameter of Drop
Base (µm)
Displacement (µm)
1.1 3.0-3.5 0.0004 0.150 500 600-700 350
CONCLUSION
We performed a fibrin scaffold manufacturing using an Ultimus 2415. Specifically was tested method of layer by layer printing. The results show promising possibility of using this technology, which is simulating the method of inkjet printing, although there are still many issues that will need to be investigated further. One of the main problems is unstable behavior of Fibrinogen component during the experiment. It was found that this component gradually partially solidifies in time of 15-20 minutes and clogs the nozzle. Therefore it was necessary to replace the nozzle with new amount of Fibrinogen during printing. Spontaneous

International Conference 2ND International Conference on Innovations, Recent Trends and Challenges
in Mechatronics, Mechanical Engineering and New High-Tech Products Development
MECAHITECH‘10
Bucharest, 23-24 September 2010
335
solidification of Fibrinogen can be partially prevented by mixing. On the other hand, it is not appropriate to shake with this component because it seems to support process of solidification. It is obvious, that each shock wave of pressure applied to the container of the nozzle causes a shaking of content. It is therefore possible that this accelerates the spontaneous solidification of Fibrinogen. This problem will continue to be studied. However, technological properties of Ultimus offer interesting possibilities for further development of scaffold formation. Especially if we take into account the possibility of adjusting the nozzle. Normal commercial available jets in the inkjet printers have a diameter about 30µm. The smallest nozzle, commercially produced for Ultimus, has an internal diameter 100µm. For instance, if we reduce the internal diameter of the nozzle to 50µm we would achieve better accuracy closer to inkjet printing. Moreover, it would be also possible to prevent clogging jets in the event of implementation of cells directly into the printed solution, because, as mentioned earlier, some of cells are too large to easily go through the normal commercial inkjet nozzle.
Further research will be generally focused on more precise and stable formation of
scaffold and on other ways of layer by layer depositing. For instance, interesting seems to be way, when each drop is not merged with another at the same time but deposited beside in close touch after partial solidification(to prevent their complete merge) of the first drop. Thus can be drops of second layer deposited in to a gap between three drops at level below. This way can be formed a “pyramid” of connected “balls” of drops or other similar shape of structure. All kind of formation will be investigated under microscope to find best way how to build the scaffold structure which would be homogenous and suitable for cells implementation. Next phase of research will be dedicated to the implementation of stem cells. It is now expected implementation of cells directly into the printed solution. Another method may be based on the simultaneous injection of a solution containing cells between each two layers.
ACKNOWLEDGEMENT
This research was supported by grant: SGS10/051/OHK2/1T/12.
REFERENCES
[1] V. Mironov, T. Trusk, V Kasyanov, S. Little, R. Swaja and R. Markwald “Biofabrication: a 21st century manufacturing paradigm” Biofabrication 1 200
[2] P.A Janmey., J.P Winer., J.W Weisel, “Fibrin Gels and Their Clinical and Bioengineering Applications.” Institute for Medicine and Engineering, University of Pennsylvani, USA, 2008
[3] E., Sachlos, J.T. Czernuszka. “Making Tissue Engineering Scaffolds Work Review on The Application of Solid Freeform Fabrication Technology to The Production of Tissue Engineering Scaffolds” Department of Materials, University of Oxford, Parks Road, Oxford, OX1 3PH, UK

International Conference 2ND International Conference on Innovations, Recent Trends and Challenges
in Mechatronics, Mechanical Engineering and New High-Tech Products Development
MECAHITECH‘10
Bucharest, 23-24 September 2010
336
[4] Xu T “Viability and electrophysiology of neural cellstructures generated by the inkjet printing method.” Biomaterials 27 3580–8. 2006
[5] R.Landers, H.John, R. Mülhaupt. “Scaffolds for tissue engineering applications fabricated by 3D Plotting.” Freiburger Materialforschungszentrum and Institut für makromolekulare Chemie of the Albert-Ludwigs-Universität, Freiburg, Germany, Envision Technologies, Marl, Germany
[6] Norrotte C., Marga F.S., Niklason L.E., Forgacs G., Scaffold – free vascular tissue engineering using bioprinting, Biomaterials.30, s 5910-5917 2009
[7] T. Boland, T. Xu, B. Damon and X. Cui 2006 “Application ofinkjet printing to tissue engineering” Biotechnol. J. 1 910–7 2006
[8] H. Yamazoe and T. Tanabe. “Cell micropatterning on an albumin-based substrate using an inkjet printing technique.” J. Biomed. Mater. Res. A DOI:10.1002/jbm.a.32312 2009
[9] M. Nakamura et al. “Biocompatible inkjet printing technique for designed seeding of individual living cells.” Tissue Eng. 11 1658–66 2005
[10] Y.Nishiyama et al.“Development of a three-dimensional bioprinter: construction of cell supporting structures using hydrogel and state-of-the-art inkjet technology” J. Biomech.Eng. 131 035001. 2009
[11] G.S. WITHERS.“New ways to print living cells promise breakthroughs for engineering complex tissues in vitro.“ Department of Biology, Whitman College, 345 Boyer Ave., Walla Walla, WA 99362, U.S.A. 2006
[12] Ye Q, Zünd G, Benedikt P, et al. (May 2000). "Fibrin gel as a three dimensional matrix in cardiovascular tissue engineering". European Journal of Cardio-thoracic Surgery 17 (5): 587–91.
[13] Bensaïd W, Triffitt JT, Blanchat C, Oudina K, Sedel L, Petite H (June 2003). "A biodegradable fibrin scaffold for mesenchymal stem cell transplantation". Biomaterials 24 (14): 2497–502.
[14] T.A. Ahmed, E.V. Dare, M. Hincke. "Fibrin: a versatile scaffold for tissue engineering applications". Tissue Engineering. Part B, Reviews 14 (2): 199–215. 2008.
[15] X. Cui, D. Dean, Z. M. Ruggeri, T. Boland. “Cell damage evaluation of thermal inkjet printed Chinese hamster ovary cells”. Biotechnology and Bioengineering, Volume 106, Issue 6, pages 963–969, 2010
[16] http://www.efd-inc.com

International Conference 2ND International Conference on Innovations, Recent Trends and Challenges
in Mechatronics, Mechanical Engineering and New High-Tech Products Development
MECAHITECH‘10
Bucharest, 23-24 September 2010
337
RULAmatic – A Semi-Automatic Posture Recognition Sy stem for
RULA Risk Evaluation Method
P.J.S. Gonçalves 1,2 ; N.O. Fernandes 1,3 1 Polytechnic Institute of Castelo Branco, School of Technology
Av Empresário, 6000-767 Castelo Branco, Portugal, 2 IDMEC-IST, Technical University of Lisbon, [email protected]
3 CITEP, University of Minho, [email protected]
ABSTRACT
In this paper we propose a semi-automatic posture recognition system to collect data and to evaluate human posture risk based on the RULA (rapid upper limb assessment) method. A time-based approach is adopted to collect posture samples. RULA scores are then computed for these posture samples. Two synchronized video cameras were used to capture the images of the worker performing its job from two different viewpoints: frontal and lateral. The semi-automatic posture recognition outputs several features of the RULA method to calculate the scores. To compute the features from the captured images of the human body two stages are needed: manual feature selection and automatic feature measuring. In the first stage, manual feature selection, the user selects, from the captured frames, the parts of the human body to measure. The second stage automatically computes, from the relative positions of the parts of the human body, the angles needed to the RULA method. An experimental example is provided for the upper arm position.
INTRODUCTION
Cumulative trauma disorders (CTD) or work-related musculoskeletal disorders constitute an important occupational problem with rising costs of wage compensation and medical expenses, reduced productivity, and lower quality of life [1].
Postural analysis can be a powerful technique for assessing work activities [2]. There have been several research techniques proposed in the literature to assess work activities and the job risk level, e.g. OWAS (Ovako Working posture Analysis System) [3], RULA (rapid upper limb assessment) [4], [5], REBA (Rapid Entire Body Assessment) [2]; LUBA (loading on the upper body assessment) [6] and [7].
RULA is a validated method that assesses biomechanical and postural loading on the upper limbs. The method takes various body postures combined with force and repetition estimates to calculate several scores for the upper arm, hand/wrist, trunk and lower extremity. Combining these scores, a final RULA score is obtained quantifying the potential risk due to physical loading on the operator. An action list is then generated which indicates the level of intervention required to reduce the risk factors. Several applications of RULA in practical situations have been described in the literature, e.g. [8], [9], [10] between others.
It is a common practice in posture risk evaluations to use a pre-defined posture categorization system for the relative positions of the segmented parts of the human body [11] and the analyst only needs to decide on which category a joint angle is. However, this approach tends to be time consuming to be useful in the analysis of complex tasks,

International Conference 2ND International Conference on Innovations, Recent Trends and Challenges
in Mechatronics, Mechanical Engineering and New High-Tech Products Development
MECAHITECH‘10
Bucharest, 23-24 September 2010
338
particularly if these tasks are dynamic or varied and the work cycle is long. In this case the analyst usually takes an assessment at periodic time intervals. Another limitation, accordingly to [11], is the classification bias that may occur if the analyst has some advanced knowledge about the working or health condition of the worker observed. For example the posture may be placed in the higher risk posture category if the analyst knows the work condition is poor.
In order to overcome these limitations we propose a computerised semi-automatic posture recognition system called RULAmatic, which uses two synchronized cameras to capture the images of the worker performing its job from different angles. A time-based approach is adopted to collect posture samples at random time intervals and the RULA scores are then computed for these posture samples.
The remainder of the paper is organized as follows. The next sections present the RULA procedure adopted in the proposed automatic posture recognition system and detail the semi-automatic measuring system. Next the experimental results obtained from the developed system are presented. Concluding remarks and directions for future research work are put forward in the final section of the paper.
THE RULA PROCEDURE ADOPTED IN THE RULAMATIC SYSTEM
To perform a RULA assessment observations are made by taking posture samples at random time intervals during the work cycle. For each posture sample the position of the upper arm, lower arm and wrist are assessed and a posture score A is obtained. This is done by, first assessing the ranges of movement in the associated table (e.g. use Table1 for locate the upper arm position) and by multiplying the corresponding risk index by the posture frequency observed. To locate the rage of movements and corresponding risk indexes for the lower arm position, wrist position and wrist twist an identical procedure is used, see [4]. Posture score A is then obtained from Table A, in appendix, using the previous obtained risk indexes for the upper arm, lower arm, wrist and wrist twist, see also Figure 1. This Figure describes the general methodology for assessing the risk of upper limb disorders.
Table 3 Posture category and risk level.
Posture category: upper arm position Risk index Upper arm flexion/ extension
Upper arm extension 0º to -20º 1
Upper arm flexion 0º to 20º 1
Upper arm extension > -20º 2
Upper arm flexion 20º to 45º 2
Upper arm flexion 45º to 90º 3
Upper arm flexion > 90º 4
Adjust
If the shoulder is raised +1
If upper arm is abducted +1
If arm is supported -1

International Conference 2ND International Conference on Innovations, Recent Trends and Challenges
in Mechatronics, Mechanical Engineering and New High-Tech Products Development
MECAHITECH‘10
Bucharest, 23-24 September 2010
339
Figure 12: RULA methodology for assessing the risk of upper limb disorders.
In the same way the position of the neck, trunk and legs are then assessed to obtain a posture score B from Table B in appendix. This gives an initial estimate of the potential risk of the task.
Force and frequency are also taken into account and must be introduced by the analyst. This allows modifying the initial estimate to take into account the effects of the loadings imposed. Having incorporated the values of these two factors these are now summed as indicated in Figure 1 to obtain posture scores C and D. From these two scores, a final score is obtained using Table C in appendix.
Based on the RULA final score, four action levels are suggested by McAtamney and Corlett [4], which give an estimation of the potential risk of musculoskeletal symptoms arise and indicate the level of intervention required to reduce that risk. The greater the score, the higher the risk:
• Score 1 or 2: acceptable posture; • Score 3 or 4: further investigation and changes may be needed; • Score 5 or 6: investigation and changes are required soon; • Score 7: investigation and changes are required immediately.

International Conference 2ND International Conference on Innovations, Recent Trends and Challenges
in Mechatronics, Mechanical Engineering and New High-Tech Products Development
MECAHITECH‘10
Bucharest, 23-24 September 2010
340
SEMI-AUTOMATIC POSTURE RECOGNITION SYSTEM
Feature Selection and Measuring
This section details how the semi-automatic posture recognition system establishes risk indexes for body segments, based on the range of movement. An example is provided for upper arm position.
Accordingly to Table 1, establishing the risk index for the upper arm position involve identifying three basic features from the acquired images, namely: the degree of extension/ flexion of the upper arm; upper arm abduction and the shoulder position. Information about the arm support is considered to be introduced by the user, i.e. the analyst.
This section presents the algorithms used to select and measure the above features. Posture samples are obtained using two synchronized video cameras located at fixed positions around the worker. These cameras are used to capture images of the worker from two different viewpoints: frontal and lateral.
The degree of extension/flexion of the upper arm is measured, in the lateral view, from the angle between the line segment representing the upper arm and the line segment perpendicular to the ground floor, i.e., the vertical line. The first line segment is identified by the user when selecting two points in the capture image. These points must be selected in the acromion (shoulder bone) and the epicondyle (elbow bone). When placing both cameras in a plane parallel to the ground floor, the second line segment is immediately defined by each one of the columns of the image matrix. The angle is measured in the intersection between the two previous defined line segments, e.g., the two corresponding vectors u
r and
vr
, using the well-known definition:
⋅⋅= −
vu
vue rr
rr1cosθ (15)
According to Table 1, the relation between the feature eθ and extension/flexion is:
positive a values eθ means that the upper arm is in flexion; and negative values of eθ means
that the upper arm is in extension. Then the algorithm is follows: if º20−<eθ then risk index
is 1; else if º20º20 ≤≤− eθ then risk index is 1; else if º45º20 ≤< eθ then risk index is 2;
else if º90º45 ≤< eθ then risk index is 3; else if º90>eθ then risk index is 4.
The upper arm abduction is measured, in the frontal view, from the angle between the line segment representing the upper arm and the line segment perpendicular to the ground floor. The procedure is precisely the same as for the extension/flexion feature, giving the feature aθ . According to Table 1, if º0>aθ then the risk index is 1; else the risk index is 0.
The shoulders relative position is measured, in the frontal view, from the angle between the line between the two shoulders and the horizontal (neutral position). The first line segment is identified by the user when selecting two points in the capture image. Points must be placed in the acromion bones. When placing both cameras in a plane parallel to the ground floor, the second line segment is immediately defined by each one of the lines of the image matrix. The angle is measured in the intersection between the two previous defined
line segments, e.g., the two corresponding vectors sr
and hr
, using the well-known definition:

International Conference 2ND International Conference on Innovations, Recent Trends and Challenges
in Mechatronics, Mechanical Engineering and New High-Tech Products Development
MECAHITECH‘10
Bucharest, 23-24 September 2010
341
⋅⋅= −
hs
hss rr
rr1cosθ (16)
According to Table 1, if º0>sθ then the risk index is 1, else the risk index is 0.
Experimental Results
This section reports the experimental results obtained for the upper arm position of an office worker. In Figures 2, 3 and 4 the office worker is shown from two camera angles at a randomly pre-selected video frame: front position (camera 1) and lateral position (camera 2). The software used for feature measuring was MatLab2009b, where a graphic user interface (GUI) was developed, allowing the interaction with the user (analyst), to define the feature points and to visualize the results.
Figure 2 illustrates the measurement the upper arm extension/ flexion angle eθ .
Since º39+≈eθ , the upper arm is in flexion and the associated risk factor is +2. Figure 3
shows the situation where the upper arm abduction angle aθ is determined. Since º27≈aθ ,
the adjustment is +1. Figure 4 shows the shoulders relative position by measuring the angle
sθ between the line of the shoulders and the horizontal (neutral position of the shoulders).
Since º11≈sθ , the adjustment is +1.
Applying the above algorithms requires that the user introduces two points in the captured frames. These are related with the acromion position and/or the epicondyle. This is the main source of error in the measurement process, since the exact position of the points in the captured frames cannot be exactly identified, which might be hidden by, for example, the cloth. So the points introduced by the user in the captured frames must be seen as an approximation to the exact position. However, this has minor implication for assessing risk indexes, since Table 1 is based on ranges of movements.
Figure 13: Upper arm extension/flexion.

International Conference 2ND International Conference on Innovations, Recent Trends and Challenges
in Mechatronics, Mechanical Engineering and New High-Tech Products Development
MECAHITECH‘10
Bucharest, 23-24 September 2010
342
Figure 14: Upper arm abduction.
Figure 15: Shoulders relative position.
CONCLUSIONS AND FUTURE WORK
In this study, an automatic posture recognition system, base on the RULA method, is proposed. The system fulfils the need of providing a method for screening a large number of operators quickly and minimizing the classification bias that may be introduced by analysts. A time-based approach was adapted to collect posture samples, using two synchronized video cameras, providing detailed information on the distribution of the different postures studied.
measure. This procedure can be seen as time consuming.
The proposed semi-automatic posture recognition system was applied with success for accessing the risk indexes of the upper arm position. The method requires that the analyst introduces in the captured frames reference points for the parts of the human body to measure.
Future research work should be focused in decreasing the intervention of user by avoiding the manual introduction of the reference points in order to apply the system in real time.

International Conference 2ND International Conference on Innovations, Recent Trends and Challenges
in Mechatronics, Mechanical Engineering and New High-Tech Products Development
MECAHITECH‘10
Bucharest, 23-24 September 2010
343
REFERENCES
[1] Kee, D., Karwowski, W. “A Comparison of Three Observational Techniques for Assessing Postural Loads in Industry.” International Journal of Occupational Safety and Ergonomics 2007; 13 (1), 3–14.
[2] Hignet, S., McAtamney “Rapid Entire Body Assessment (REBA).” Applied Ergonomics 2000; 31, 201-205.
[3] Karhu, O., Kansi, P., Kuorinka, I. Correcting working postures in industry: a practical method for analysis. Applied Ergonomics 1977; 8, 199-201.
[4] McAtamney, L., Corlett, E.N. “RULA: a survey method for the investigation of work-related upper limb disorders.” Applied Ergonomics 1993; 24 (2), 91- 99.
[5] Seth, V., Weston, R., Freivalds, A. “Development of a cumulative trauma disorder risk assessment model for the upper extremities” International Journal of Industrial Ergonomics 1999; 23(4), 281-291.
[6] Kee, D., Karwowski, W. “LUBA: an assessment technique for postural loading on the upper body based on joint motion discomfort and maximum holding time.” Applied Ergonomics 2000; 32, 357-366.
[7] Chung, M.K., Lee, I.S., Kee, D., Kim, S.H. “A postural workload evaluation system based on a macro-postural classification”. Human Factors and Ergonomics in Manufacturing.” 2002; 12, 267–277.
[8] Oates, S., Evaizs, G., Hedge, A. “An Anthropometric and Postural Risk Assessment of Children's School Computer Work Environments.” Computers in the Schools 1998; 14 (3/4).
[9] Massaccesi, M., Pagnottaa, A., Soccettia, A., Masalib, M., Masieroc, C., Greco F. “Investigation of work-related disorders in truck drivers using RULA method,” Applied Ergonomics 2003; 34 (4), 303-307
[10] Lee, E.C., Rafiq, A., Merrell, R., Ackerman, R., Dennerlein. J.T. “Ergonomics and human factors in endoscopic surgery: a comparison of manual vs telerobotic simulation systems.” Surgical Endoscopy 2005; 19, 1064-1070.
[11] Bao, S., Howarda N., Spielholza, P., Silversteina, B. “Two posture analysis approaches and their application in a modified Rapid Upper Limb Assessment evaluation Ergonomics.” 2007; 50 (12), 2118–2136

International Conference 2ND International Conference on Innovations, Recent Trends and Challenges
in Mechatronics, Mechanical Engineering and New High-Tech Products Development
MECAHITECH‘10
Bucharest, 23-24 September 2010
344
APPENDIX
Table A Upper limb posture score (adapted from [4]).
upper arm lower arm
Wrist position 1 2 3 4
Wrist twist Wrist twist Wrist twist Wrist twist 1 2 1 2 1 2 1 2
1 1 1 2 2 2 2 3 3 3 2 2 2 2 2 3 3 3 3 3 2 3 3 3 3 3 4 4
2 1 2 3 3 3 3 4 4 4 2 3 3 3 3 3 4 4 4 3 3 4 4 4 4 4 5 5
3 1 3 3 4 4 4 4 5 5 2 3 4 4 4 4 4 5 5 3 4 4 4 4 4 5 5 5
4 1 4 4 4 4 4 5 5 5 2 4 4 4 4 4 5 5 5 3 4 4 4 5 5 5 6 6
5 1 5 5 5 5 5 6 6 7 2 5 6 6 6 6 7 7 7 3 6 6 6 7 7 7 7 8
6 1 7 7 7 7 7 8 8 9 2 8 8 8 8 8 9 9 9 3 9 9 9 9 9 9 9 9
Table B Neck, trunk and legs posture score (adapted from [4]).
Neck
Trunk position 1 2 3 4 5 6
Legs Legs Legs Legs Legs Legs 1 2 1 1 1 2 2 2 1 2 1 2
1 1 3 2 3 3 4 5 5 6 6 7 7 2 2 3 2 3 4 5 5 5 6 7 7 7 3 3 3 3 4 4 5 5 6 6 7 7 7 4 5 5 5 6 6 7 7 7 7 7 8 8 5 7 7 7 7 7 7 7 8 8 8 8 8 6 8 8 8 8 8 8 8 9 9 9 9 9
Table C Final score table (adapted from [4]). Score D (neck, trunk, legs)
Score C (upper limb)
1 2 3 4 5 6 7+ 1 1 2 3 3 4 5 5 2 2 2 3 4 4 5 5 3 3 3 3 4 4 5 6 4 3 3 3 4 5 6 6 5 4 4 4 5 6 7 7 6 4 4 5 6 6 7 7 7 5 5 6 6 7 7 7
8+ 5 5 6 7 7 7 7

International Conference 2ND International Conference on Innovations, Recent Trends and Challenges
in Mechatronics, Mechanical Engineering and New High-Tech Products Development
MECAHITECH‘10
Bucharest, 23-24 September 2010
345
Modeling of Smart Structures.
Implementation Of Control Techniques For Smart Stru ctures
Irakli Premti UFO University, Faculty of Applied Sciences,
Tirana, Albania [email protected]
Rapid advances have been made in recent years in the development of sensor-based
technologies, which greatly expand the range and effectiveness of this application to civil, mechanical, and aerospace engineering systems. This paper attempts to overview the research conducted in recent years and the state-of-the-art. Key research topics are presented, and future strategic directions are suggested.
Smart materials and smart structures, often called as the intelligent structures, form a new rapidly growing interdisciplinary technology in the modern day world, embracing the fields of materials, structures, mechatronics, sensor-actuator systems, information and signal processing, electronics, mathematics, control. They are basically distributed parameter systems.
Commonly encountered smart materials and structures can be categorized into three different levels: (i) single-phase materials, (ii) composite materials, and (iii) smart structures. Many ferroic materials and those with one or more large anomalies associated with phase-transition phenomena belong to the first category. Functional composites are generally designed to use nonfunctional materials to enhance functional materials or to combine several functional materials to make a multifunctional composite. The third category is an integration of sensors, actuators, and a control system that mimics the biological body in performing many desirable functions, such as synchronization with environmental changes, self-repair of damages, etc. These three levels cover the general definition of smart materials and structures.
Some natural materials are born to be ‘‘smart,’’ such as piezoelectric, electrostrictive ,ect. but they are far from satisfying the diversified needs of smart structures. Most natural materials also have limited amplitude in response and must be operated in a limited temperature range. One could, however, use chemical and mechanical engineering to create ‘‘smarter’’ materials and to tailor their properties for a particular smart structure design.
Here is an example of one the major sensors being investigated for smart structure application. A shape memory alloy (SMA) is able to memorize and recover its original shape, after deformed by heating over its transformation temperature. During this transformation, large forces or large deformations can be generated which can be used for actuation. Nitinol (Nickel - Titanium Alloy) is the most commonly used SMA. Nitinol is capable of recovering up to 8% strain, or generating around 500 MPa stress if constrained during recovery, and, if strains are kept below 2%, Nitinol based actuators can survive millions of cycles. The drawbacks of SMA based actuators are comparatively slow response time. This problem is inherent since these alloys rely on heating and cooling for their actuation. Therefore SMAs are not suitable for high-frequency control, but for low frequency and quasi-static response control. SMAs have been used in a wide variety of applications. Two quite successful applications are SMA-made eyeglass frame and the antenna of mobile phone. The advantage of using SMA is that after severe deformation, SMA can still fully return its original

International Conference 2ND International Conference on Innovations, Recent Trends and Challenges
in Mechatronics, Mechanical Engineering and New High-Tech Products Development
MECAHITECH‘10
Bucharest, 23-24 September 2010
346
shape. SMAs have been used in vibration dampers and isolators due to SMAs' high internal friction. For example, SMA wires have been used as passive energy dissipater to increase the hysteresis damping in structure under earthquake. The more advanced applications are in robotics (artificial hand/arm), passive/active control system (buckling control), smart/adaptive structures (vibration control), and composite structures (shape control). Due to its excellent bio-compatibility, Nitinol has also been used in medical instruments (vascular stents and filters). An active endoscope using Nitinol coil spring has been designed and tested. Use of SMA's is a growing field with various staff actively involved in their development and applications.
A common feature in majority of the structures is the active vibration control problem, which has to be dealt with as it would lead to the degradation of the structural performance, if left uncontrolled. A modest attempt is made to reduce the structural vibrations in smart cantilever beam using various control strategies.
Smart structures are an integration of sensors, actuators, and a control system. Apart from the use of better functional materials as sensors and actuators, an important part of a ‘‘smarter’’ structure is to develop an optimized control algorithm that could guide the actuators to perform required functions after sensing changes.
Much of the research work done in the area of smart structures so far, is mainly concentrated in the modeling and control techniques, static and dynamic analysis which make use of state feedback, output feedback principles, linear quadratic regulator, optimal control, etc. Since most of these types of control techniques need all the system states for feedback, which may not be available for measurement, they may suffer from the problem of real time implementation and some times need a state observer for control purposes.
Use of proper modeling techniques help to capture the multi-functional nature of smart materials, when they are surface blinded or embedded on composite structures. To design a good controller for a process, a good process model is often required. A controller designed on the basis of a good process model often works better than the one designed without a model. Model development from first principles is a difficult and an expensive task, requiring participation of experts in numerous fields of engineering. This is also a time consuming and tedious process. In our computerized times, a lot of plant data is generally available, and hence this plant data can be used to generate the model of the process. Thus, the system identification can be defined as the process of developing a mathematical model of a physical. By making the controller adaptive, ideal performance and granted stability of the closed loop system can be achieved for even a large change in system parameters.
We used fast output sampling feedback controllers to control the structural vibrations of a flexible aluminum cantilever beam using collocated piezoelectric actuators and sensors for the fundamental mode.
Once appropriate input, output, we proceed to obtain the model. There are two steps in this process, identification of an appropriate model structure and estimation of values of parameters that pertain to the above model structure. The information used in the system identification consists of the input and output data and an assumption about the error. The process of identifying a physical system can be classified into three types,
1. Modal parameter identification, 2. Structural model parameter identification and the 3. Control model identification.
In (1), the dynamics of the structures is characterized by the modal parameters such as the natural frequencies, damping ratios and the mode shapes. In (2), using the identified
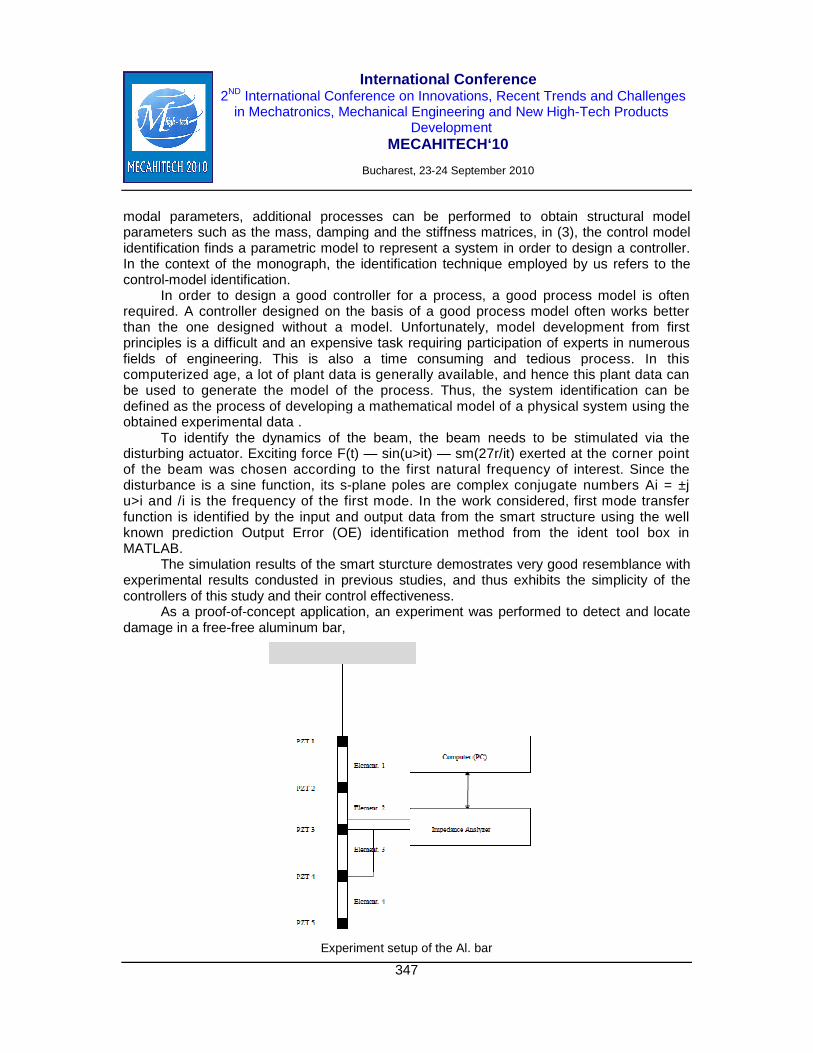
International Conference 2ND International Conference on Innovations, Recent Trends and Challenges
in Mechatronics, Mechanical Engineering and New High-Tech Products Development
MECAHITECH‘10
Bucharest, 23-24 September 2010
347
modal parameters, additional processes can be performed to obtain structural model parameters such as the mass, damping and the stiffness matrices, in (3), the control model identification finds a parametric model to represent a system in order to design a controller. In the context of the monograph, the identification technique employed by us refers to the control-model identification.
In order to design a good controller for a process, a good process model is often required. A controller designed on the basis of a good process model often works better than the one designed without a model. Unfortunately, model development from first principles is a difficult and an expensive task requiring participation of experts in numerous fields of engineering. This is also a time consuming and tedious process. In this computerized age, a lot of plant data is generally available, and hence this plant data can be used to generate the model of the process. Thus, the system identification can be defined as the process of developing a mathematical model of a physical system using the obtained experimental data .
To identify the dynamics of the beam, the beam needs to be stimulated via the disturbing actuator. Exciting force F(t) — sin(u>it) — sm(27r/it) exerted at the corner point of the beam was chosen according to the first natural frequency of interest. Since the disturbance is a sine function, its s-plane poles are complex conjugate numbers Ai = ±j u>i and /i is the frequency of the first mode. In the work considered, first mode transfer function is identified by the input and output data from the smart structure using the well known prediction Output Error (OE) identification method from the ident tool box in MATLAB.
The simulation results of the smart sturcture demostrates very good resemblance with experimental results condusted in previous studies, and thus exhibits the simplicity of the controllers of this study and their control effectiveness.
As a proof-of-concept application, an experiment was performed to detect and locate damage in a free-free aluminum bar,
Experiment setup of the Al. bar

International Conference 2ND International Conference on Innovations, Recent Trends and Challenges
in Mechatronics, Mechanical Engineering and New High-Tech Products Development
MECAHITECH‘10
Bucharest, 23-24 September 2010
348
The aluminum bar (which measured 630 x 40 x 2 mm) was suspended by a thin wire to simulate a free-free boundary condition). Five pairs of PZT patches (Piezo Systems Inc. PSI-5H, 40 x 15 x 0.2 mm) were bonded to the bar, for the acquisition of electrical impedance. An HP4194 electrical impedance analyzer was used for the measurement of the PZT’s electrical impedance in the frequency range of 70-90 kHz. The frequency range typically used in the impedance method is up to several hundred kHz ranges. The range for a given structure is determined by a trial and error method. It has been found that a frequency range with a high mode density exhibits a higher sensitivity, since it generally covers more structural dynamic information. A frequency range, 70-90 kHz, is found to be favorable in monitoring this specific structure. Damage was induced by attaching two bolts (d-10 mm) on the middle of the third element. This damage can be considered as addition of mass and also as having stiffening effects on the element by tightening bolts on the side of the cross section of the bar. Only the real portion of the electrical impedance is analyzed to predict damage because it is more sensitive to change than the imaginary part or magnitude, since they are dominated by the capacitive response of the sensor and hence, are less sensitive to structural damage effects. A complete change occurs in the impedance signature pattern over the entire frequency range and is clearly indicative of damage.
We gave this as an example of a technique, which allows a single piece of PZT material to simultaneously control the vibration of a structure and detect structural damage.

International Conference 2ND International Conference on Innovations, Recent Trends and Challenges
in Mechatronics, Mechanical Engineering and New High-Tech Products Development
MECAHITECH‘10
Bucharest, 23-24 September 2010
349
Criticality Assessment Using Fuzzy Risk Priority Nu mbers
Despina Duminică, Mihai Avram
“POLITEHNICA” University of Bucharest Department of Mechanical Engineering and Mechatronics 313, Splaiul IndependenŃei, 060042, Bucharest, Romania
ABSTRACT
Risk analysis must be performed in the early stage of a product development. Failure mode and effect analysis is a systematic technique for identifying, prioritizing and obviating potential failure modes before they occur. Risk prioritization is performed usually by computing risk priority numbers (RPN) associated to each failure. A traditional RPN is obtained as product of three indexes: occurrence, severity and detection. However, the classical risk assessment method suffers from several shortcomings. Fuzzy RPNs are considered a promising solution in order to give a more accurate ranking of potential risks.
PRINCIPLES OF FMEA ANALYSIS
Failure Modes and Effect Analysis (FMEA) is a methodology designed to identify potential failure modes for a product or process before they occur, to assess the risk associated with each failure mode, to rank the issues in terms of importance and to identify and carry out corrective actions to address the most serious concerns.
Corrective actions include, among others, fail-safe mechanisms, redundant controls, error-handling routines, fault-tolerance, alarms and testing activities.
Two alternative approaches may be used: a functional approach or a hardware approach. The functional approach considers sub-systems in terms of their function within the system, being often applied when hardware components cannot be uniquely identified, and the hardware approach is usually adopted when components can be uniquely identified in the system.
The formal approach of FMEA analysis is documented in [1]. The method and its applications are also described in [2].
The FMECA procedure extends the FMEA analysis and consists of two parts: the first part identifies failure modes and their effects and the second part ranks failure modes according to their potential risks.
The risk associated with the potential problems identified through the analysis is evaluated, generally, by two methods: risk priority numbers (RPN) and criticality analysis.
Two types of criticality analysis, quantitative and qualitative, are described in [1]. To use the quantitative criticality analysis method, the team must:
Define the reliability / unreliability for each item, at a given operating time. Identify the portion of the item’s unreliability that can be attributed to each
potential failure mode. Rate the probability of loss (or severity) that will result from each failure mode
that may occur.

International Conference 2ND International Conference on Innovations, Recent Trends and Challenges
in Mechatronics, Mechanical Engineering and New High-Tech Products Development
MECAHITECH‘10
Bucharest, 23-24 September 2010
350
Calculate the criticality for each potential failure mode by obtaining the product of the three factors:
Mode Criticality = Item Unreliability x Mode Ratio of Unreliability x Probability of Loss
Calculate the criticality of each item by obtaining the sum of the criticalities for
each failure mode that has been identified for the item:
Item Criticality = Sum of Mode Criticalities To use the qualitative criticality analysis method to evaluate risk and prioritize
corrective actions, the analysis team must: Rate the severity of the potential effects of failure. Rate the likelihood of occurrence for each potential failure mode. Compare failure modes via a criticality matrix, which identifies severity of the
horizontal axis and occurrence on the vertical axis.
TYPICAL AND FUZZY COMPUTATION OF RISK PRIORITY NUMB ERS
Risk priority numbers are mostly used in the automotive industry [3]. A risk priority number (RPN) represents the mathematical product of the seriousness of a group of effects (severity S), the likelihood that a cause will create the failure associated with those effects (occurrence O), and an ability to detect the failure before leading to serious effects (detection D). RPNs are used to help identify the most serious risks and to place priorities when planning corrective action.
In order to perform RPN computation, severity, occurrence and detection should be quantified. Different situations are rated on a scale sensible enough, according to specific evaluation criteria. Scales from 1 to 10 are generally used. The minimum value (“no risk”) is rated with 1.
However, these specific criteria are mostly subjective and described qualitatively in natural language, deriving from the previous experience of a group of experts or of the design team. It has also being pointed out that different score combinations of severity, occurrence and detection led to the same RPN, even when it was obvious that the gravity of the risks involved was not the same [4]. The relative significance of the three indexes is neglected, all of them being assumed to be of equal importance, when in fact the nature of a process or of a product increases often the weight of an index in regard to the other two. Consequently, some combinations of the three indexes S, O and D can hide high danger risks even if their RPN is relatively low.
Another shortcoming of the typical RPN computation method is that only a limited set of outputs from the output range can be obtained. For instance, if each of the three inputs is rated on a scale from 1 to 10, their combination leads to only 120 values from the range of 10x10x10=1000 values. The mean of these 120 values is equal to 166, far from the middle of the interval, and the medial is equal to 105. In fact, only 6% of the obtained values situate among the middle of the interval.
To overcome the above presented weaknesses of the typical approach, fuzzy mathematics, developed for solving problems where parameter descriptions are subjective,

International Conference 2ND International Conference on Innovations, Recent Trends and Challenges
in Mechatronics, Mechanical Engineering and New High-Tech Products Development
MECAHITECH‘10
Bucharest, 23-24 September 2010
351
vague and imprecise, was considered a promising tool for directly manipulating the linguistic terms used for the description of severity, occurrence and detection in order to assess risks associated to each failure mode [4-7].
The methodology of the fuzzy RPNs is based on fuzzy set theory [8, 9]. The three inputs S, O and D are fuzzified and evaluated in a fuzzy inference engine built on a consistent base of IF-THEN rules. The fuzzy output is defuzzified to get the crisp value of the RPN that will be used for a more accurate ranking of the potential risks.
CASE STUDY
The case study consisted of the typical and the fuzzy computation of RPNs in order to assess and rank risks that could appear in the functioning of a water meter used in domestic applications.
The FMEA analysis was based on the causes and effects diagram presented in figure 1. The diagram pointed out the problems that could appear in the functioning of the water meter.
Figure 16: Causes and effects diagram established for the water meter
Occurrence, severity and detection were rated on a scale from 1 to 10, according to
Tables 1, 2 and 3. The analyzed failure modes are presented in Table 4 and the resulted RPNs are
presented in Table 5. For the sake of clarity, only the first relevant 8 failure modes were preserved.

International Conference 2ND International Conference on Innovations, Recent Trends and Challenges
in Mechatronics, Mechanical Engineering and New High-Tech Products Development
MECAHITECH‘10
Bucharest, 23-24 September 2010
352
Table 4 Occurrence Rating
Occurrence: Failure Rates Rank Repeated failures 8, 9, 10
Occasional failures 4, 5, 6, 7 Relatively few failures 2, 3
Failure is unlikely 1
Table 2 Severity Rating
Severity: MTTR (Mean Time To Repair) Rank Repairing time longer than 60 min 8, 9, 10
Repairing time between 20 and 60 min 4, 5, 6, 7 Repairing time between 1 and 20 min 2, 3
Repairing time under 1 min 1
Table 3 Detection Rating
Detection: Likelihood To Detect The Failure Before Serious Effects Appear
Rank
No warning signs 8, 9, 10 Warning signs difficult to notice 4, 5, 6, 7
Warning signs that could pass unnoticed 2, 3 Warning signs easily noticeable 1
Table 4 Analyzed Failure Modes
Code Involved part or subassembly
Failure mode
Effect Potential cause Preventive
action
FM1 Body Unable to
mount Replacement of the water meter
Inaccurate processing of
the thread
Assurance of the quality of
manufacturing
FM2 Body Leakage Fluid leakage Casting defects Assurance of the quality of
casting
FM3 Body O-ring Wear Fluid leakage, condensation Rubber wear
Adequate materials
FM4 Body O-ring Wear Fluid leakage, condensation
Deterioration during
mounting
Assurance of the quality of
mounting
FM5 Gear
subassembly Input loss Erroneous indication
Friction in functioning
Adequate materials
FM6 Plastic cover Breaking, cracking
Penetration of impurities
Mechanical shocks
Adequate materials
FM7 Plastic cover Breaking, cracking
Penetration of impurities
Plastic ageing Adequate materials
FM8 Indicator
subassembly Input loss
Erroneous indication
Friction in functioning
Adequate materials

International Conference 2ND International Conference on Innovations, Recent Trends and Challenges
in Mechatronics, Mechanical Engineering and New High-Tech Products Development
MECAHITECH‘10
Bucharest, 23-24 September 2010
353
Table 5 Criticality Assessment Using RPNs
Code Failure rates O MTTR (min)
S Likelihood of non-
detection (%) D RPN Rank
FM8 under 1 in 5,000 3 30 5 65 7 105 1 FM5 under 1 in 1,000 4 20 3 75 8 96 2 FM3 under 1 in 1,000 4 15 3 20 5 60 3-4 FM2 under 1 in 50,000 1 45 6 95 10 60 3-4 FM1 under 1 in 30,000 1 30 4 80 9 36 5 FM4 under 1 in 10,000 2 15 3 25 5 30 6 FM7 under 1 in 5,000 3 5 2 5 2 12 7 FM6 under 1 in 20,000 1 5 2 5 2 4 8
As mentioned above, the allocation of the scores remains subjective. It is a matter of
estimating the risks involved, thus different experts can have different opinions. The resulting hierarchy is somewhat unexpected. For instance, one would suppose that
failure modes with high dissatisfaction potential (FM1, FM2, FM3) would have a higher ranking. Also, equal priorities are assigned to two very different failure modes (FM3 and FM2).
In order to obtain a risk prioritization that would reflect better the customer perception in terms of dissatisfaction, a fuzzy computation of the RPN was proposed.
The fuzzy sets corresponding to the inputs and to the outputs are presented in Table 6. Four categories were associated to each fuzzy set: VL (very low), L, (low), M (moderate) and H (high). The output of the fuzzy system, FRPN, was scaled in the range 0...1000 in order to be compatible with the previous results. Table 7 presents the inference rules adopted for this application, based on expert knowledge.
Table 6 Fuzzy sets corresponding to inputs and outputs
Name Symbol Type Indicator Unit Min. value
Max. value
Fuzzy sets
Occurrence O Input Common
logarithm of failure rate
- -6 0 VL, L, M, H
Severity S Input MTTR min 0 100 VL, L, M, H
Detection D Input Likelihood of non-detection
- 0 1 VL, L, M, H
Fuzzy RPN FRPN Output - - 0 1000 VL, L, M, H
Gaussian shapes were adopted for the membership functions, because they are considered to best fit normal distributions and also allow obtaining a more smooth control surface, without sharp edges that can lead to an unpredictable behaviour of the system.
Minimum function was used in order to implement AND method and implication. Maximum function was used in order to implement OR method and aggregation. The centroid method was chosen for defuzzification.
The fuzzy logic system was simulated using MATLAB-SIMULINK. Figure 2 presents, as an example, the set of rules activated for the values corresponding to the failure mode FM1.

International Conference 2ND International Conference on Innovations, Recent Trends and Challenges
in Mechatronics, Mechanical Engineering and New High-Tech Products Development
MECAHITECH‘10
Bucharest, 23-24 September 2010
354
Table 7 The inference rules
Occurrence: VL Occurrence: L
Severity
Severity
VL L M H VL L M H
Det
ectio
n VL VL VL VL L
Det
ectio
n VL VL VL L L L VL VL L L L VL L L M M VL L L M M L L M M H L L M M H L M M H
Occurrence: M Occurrence: H
Severity
Severity
VL L M H VL L M H
Det
ectio
n VL VL L L M D
etec
tion VL L L M M
L L L M M L L M M H M L M M H M M M H H H M M H H H M H H H
The same failure modes were analyzed, in order to compare the previous results,
calculated by “classical” assessment of RPNs, with the values obtained by fuzzy computation. The defuzzification values of RPNs are presented in Table 8.
Table 8 Fuzzy computation of RPNs
Code Involved part or subassembly
Failure mode Fuzzy RPN
Rank Previous rank
FM2 Body Leakage 532.8 1 3-4
FM1 Body Unable to mount 459 2 5
FM5 Gear subassembly Input loss 425.6 3 2
FM8 Indicator subassembly Input loss 374 4 1
FM3 O-Ring Wear 289.3 5 3-4
FM4 O-Ring Wear 202.8 6 6
FM7 Plastic cover Breaking, cracking 192.2 7 7
FM6 Plastic cover Breaking, cracking 169.2 8 8 It can be noticed that the results obtained by fuzzy inference provide a hierarchy of
potential risks that differs from the ranking established by typical computation of the RPN, but reflect more accurately the dissatisfaction felt by the customer that faces the effects of a certain failure mode.
The fuzzy inference does not allow identical values of RPNs to appear for different sets of risk factors. In fact, two identical RPNs can be obtained only for two failure modes that feature exactly the same values of the three indexes: occurrence, severity and detection.

International Conference 2ND International Conference on Innovations, Recent Trends and Challenges
in Mechatronics, Mechanical Engineering and New High-Tech Products Development
MECAHITECH‘10
Bucharest, 23-24 September 2010
355
Figure 3: Set of rules activated by the failure mode FM1
CONCLUSIONS
The assessment of criticality using fuzzy RPNs overcomes the weaknesses of the typical approach and represents a very promising manner of prioritizing failure modes in FMEA, due to its advantages
the set of IF-THEN rules allows considering the relative importance of severity, occurrence and detection, based on knowledge and expertise in the field;

International Conference 2ND International Conference on Innovations, Recent Trends and Challenges
in Mechatronics, Mechanical Engineering and New High-Tech Products Development
MECAHITECH‘10
Bucharest, 23-24 September 2010
356
risk factors are evaluated in a linguistic manner, using qualifications rather then rigorous numerical values, fact that facilitates the manipulation of vague and imprecise information, often the case in the practice of product design;
different score combinations of severity, occurrence and detection lead to different RPN;
the whole range of outputs is used; the method can be extended considering even more risk factors.
REFERENCES
[1] US-MIL–STD-1629A, “Procedures For Performing A Failure Mode Effects And Criticality Analysis”. 1984.
[2] Stamatis, D. H., “Failure Mode and Effect Analysis – FMEA from Theory to Execution”, ASQC Press, New York. 1995.
[3] Ford Motor Company, “Potential Failure Mode And Effect Analysis In Design And For Manufacturing And Assembly Process”, Instruction Manual. 1998.
[4] Pillay, A., Wang, J., “Modified failure mode and effects analysis using approximate reasoning”, Reliability Engineering & System Safety. 2003; 79; 69–85.
[5] Bowles, J.B. and C.E. Pelaez, “Fuzzy logic prioritization of failures in a system failure mode, effects, and criticality analysis,” Reliability Engineering and System Safety. 1995; 50; 205-213.
[6] Chen, L.-H., Ko. W.-C., „Fuzzy linear programming models for new product using QFD with FMEA“, Applied Mathematical Modeling. 2009; 33; 633-647.
[7] Liu, H.T., “The extension of fuzzy QFD: From product planning to part deployment”, Expert Systems with Applications: An International Journal archive. 2009; 36; 8; 11131-11144.
[8] Zadeh, L. A., “Fuzzy sets”, Information and Control. 1965; 8; 338–353.
[9] Bühler, H., “Réglage par logique floue”, Presses Polytechniques et Universitaires Romandes, Lausanne. 1994.

International Conference 2ND International Conference on Innovations, Recent Trends and Challenges
in Mechatronics, Mechanical Engineering and New High-Tech Products Development
MECAHITECH‘10
Bucharest, 23-24 September 2010
357
Web-based Decision Support System for Industrial Op erations
Management
Ricardo Magalhães, Leonilde R. Varela, S. Carmo-Silva Department of Production and Systems, School of Engineering, University of Minho
Campus de Guartar, 4710-057 Braga, Portugal [email protected], [email protected], [email protected]
ABSTRACT
To maintain sustainability in today’s’ global economy industrial companies must have well managed systems and operations to keep up with competition. For this they can take advantage of using Web and Internet based technologies. Such can be achieved by accessing good management resources and methods through the Internet which otherwise would not be available and, at the same time, take advantageous of collaboration provided by networks of partners and users. Due to operations management complexity when a company does not have access to good algorithms it usually draws upon simple and empirical procedures whose quality of solutions provided tends to be poor. This is a situation that can be avoided if companies have easy access to good operations management algorithms or services. This can be possible because a pool of knowledge on industrial operations management, which has been developed by academia and industry over the years, can be made available, through the Internet, to a large community of users. This idea is explored towards development of a web-based system for Industrial Operation Management, based on a P2P network of operations management algorithms providers and users. Thus, the paper describes a web system for aiding the resolution of Operations Management problems through collaboration based on a network of distributed resources and users, web services and other Internet technology. The system adopts a P2P network architecture to create and enable a decentralized and global industrial operations management environment. It includes a set of functionalities accessed through the P2P network, which holds algorithms for solving different types of Operations Management problems. The algorithms are selected through a user-friendly interface, which is automatically generated for each specific problem context, including loading existing XML problem data documents, and searching and running algorithms on the peers belonging to the P2P network.
INTRODUCTION
The Internet increasingly performs an important role in the success of companies. In particular, it enhances collaboration among different companies or partners helping to improve operations and everyday decision-making processes in different areas of activity and knowledge. This enhancement results from taking advantage of the features and resources that are or can be made available through the Internet to all company stakeholders. This means that a greater impact on companies’ performance can be achieved ensuring better use of manufacturing and management resources and better customer

International Conference 2ND International Conference on Innovations, Recent Trends and Challenges
in Mechatronics, Mechanical Engineering and New High-Tech Products Development
MECAHITECH‘10
Bucharest, 23-24 September 2010
358
service, namely through reliable and timely deliveries. Therefore, providing decision support systems based on Internet technology can make the difference between success and failure and highly contribute to the competitive ability of industrial companies.
In this paper, work is reported towards providing companies with improved decision making abilities on managing industrial operations with the aid of the Internet.
Due to operations management complexity when a company does not have access to good algorithms it usually draws upon simple and empirical procedures whose quality of solutions provided tends to be poor. This is a situation that can be avoided if companies have easy access to good operations management algorithms or services. By exploring the Internet facilities in a network of industrial operation management (IOM) service providers, users can ensure better management of their industrial operations. This is because a pool of valuable knowledge on IOM, which has been developed by academia and industry over the years, can be made available to virtually any company or user.
The idea, of easily providing required IOM knowledge to any company that needs to improve operations, is explored in this paper through the development of a web-based decision support system (WB-DSS) for IOM based on a P2P network of operations management algorithms providers. At this stage the system is focused on scheduling problems and based on a problems ontology developed by Varela and Carmo-Silva [1]. This paper describes such a web-based system and is organized as follows: The next section briefly reviews the literature on IOM solvers available through the Internet. After, there is a brief description of the WB-DSS architecture, focusing on its P2P structure and components. The subsequent section, summarizes the main system functionalities, and illustrates them through a practical example. Finally, the conclusion section is presented.
LITERATURE REVIEW
With the evolution Internet technologies web-based industrial management applications can now be easily made available, implemented and become a valuable resource for the success of modern manufacturing companies. Traditional IOM applications, running locally on PCs have been gradually substituted by more dynamic and worldwide available applications running on the Internet. An application example to the control of manufacturing cells is presented by Ming Tsai and James Lin [2]. They describe a application architecture for a web-based distributed manufacturing control system based on co-operative mechanisms and contract net protocols. The control system uses a web based controller that in coordination works with the local manufacturing cell controllers for carrying out manufacturing control decisions on production orders. Typical information used by the Web controller includes due date, quantity, process plans and priority parameters of production orders. The system is responsible for selecting a specific process plan or routing, allocating resources, scheduling work, downloading processing instructions, monitoring the progress of activities, detecting and recovering from errors and preparing reports based on system status data.
In the literature we can find reference to a variety of several solvers that can be of great use for IOM. Two well known solvers are the Lekin system (http://www.stern.nyu.edu/om/ software/lekin/index.htm), oriented to flexible job shop IOM, and the Lisa Library of IOM algorithms (http://lisa.math.uni-magdeburg.de/).The NEOS Server [3], developed by the Northwestern University and the Argonne National Laboratory, is another example of a web

International Conference 2ND International Conference on Innovations, Recent Trends and Challenges
in Mechatronics, Mechanical Engineering and New High-Tech Products Development
MECAHITECH‘10
Bucharest, 23-24 September 2010
359
application for solving optimization problems, including IOM ones (http://www-neos.mcs.anl.gov/). NEOS Server accesses nearly 50 solvers, through several different interfaces, for remotely solving problems. Another novel application, relevant to IOM, is the ForthMP (http://www.brunel.ac.uk/ depts/ma/research/com), a system for mathematical programming running on the web, developed by the Mitra’s Group of the Brunel University. The Test Bench Assistant being developed under the IMS-NoE umbrella is another example running on the Internet (http://www.ims-noe.org/BENCHMARK/ TBA.asp). Other solvers which can be accessed through the Internet include VISHNU (http://vishnu.bbn.com), OCEA (http://www.ocea.li.univ-tours.fr/eocea/index.jsp) and RIOT (http://riot.ieor.berkeley.edu/riot/ Applications/Scheduling/index.html) specifically oriented to scheduling.
Although useful and powerful these solvers may be, in general, they are mostly centralized, based on a number of available algorithms and procedures provided for user access, either though download or for direct use on the remote server though the Internet. In this paper a different approach is explored, namely the development of a dynamically updatable IOM application, based on algorithms globally available through a P2P network, and selectively chosen for solving industrial operations management problems. This extends previous work carried out by Varela, Carmo-Silva et al. [4, 5].
WEB TECHNOLOGY AND SYSTEM ARCHITECTURE
Collaborative manufacturing is emerging as a norm for manufacturing in distributed environments. This is largely due to the global business decentralization and global manufacturing outsourcing. To stay competitive in the dynamic global market of today, companies with distributed factories or divisions require new ways of effective collaboration among all production units and stakeholders including suppliers and outsourced service providers. Among many other factors, flexibility, timeliness, and adaptability are identified as the major characteristics to bring dynamism to collaborative manufacturing environments.
Manufacturing processes, including distributed ones are quite complex, especially at job shop like systems where a large variety of products, usually in small batch sizes, are handled dynamically. Therefore, there is a need for using IOM applications enabling the use of a wide range of knowledge and algorithms for easing decision-making. This is particularly required in dynamic manufacturing environments. These needs, purpose and environments are probably better accomplished and dealt with an adaptive application architecture that enables effectiveness and efficiency of important functions such as distributed planning, dynamic scheduling, real-time monitoring and remote control. Moreover, the application should be responsive to both varying collaboration needs and unpredictable changes of distributed production capacity and functionality. An ideal shop floor should be the one that uses real-time manufacturing intelligence to achieve the best overall performance with the least unscheduled downtime. However, traditional methods are based on off-line processing that is normally performed in advance, and thus, are impractical if applied directly to this dynamic collaborative environment. In response to the requirements and to coordinate the dynamic activities in collaborative manufacturing, a web-based IOM approach can greatly turn these everday decision-making processes much easier for manufacturing companies to achieve dynamism, even in distributed manufacturing environments.
Developing an IOM applications using web-based technology becomes a promising strategy. In fact, by migrating from conventional applications to a web-based application, the

International Conference 2ND International Conference on Innovations, Recent Trends and Challenges
in Mechatronics, Mechanical Engineering and New High-Tech Products Development
MECAHITECH‘10
Bucharest, 23-24 September 2010
360
following improvements are expected: 1. Automate the data transactions and eliminate human errors, by enabling direct XML
data transferring. 2. Sharing IOM resources and services, regardless of distance between peers. 3. Structuring the application in a decentralized and distributed manner, e.g. including
several modules replicable and running on different machines. In order to make a contribution in this direction, an application architecture is proposed
and designed to use a Peer-to-Peer (P2P) structure for effective IOM algorithms and information sharing. We may define a P2P network as a network of several computers, i.e. peers, which do not possess a permanent client or server nature but, instead, work dynamically as both, depending on a transaction or service being received from or supplied to the network [6]. P2P technology enables distributing information in a network of peers by providing any user with direct or indirect access to peers in the network. The peers collaborate forming a virtual network for communication and data transfer and for solving problems in a collaborative manner.
Peer-to-peer technology and appropriate networks suit well the increasingly decentralized nature of modern companies and their industrial and business processes. Characteristics of P2P networks are explored in the design of the IOM WB-DSS, of which a prototype was developed and is described in this paper. The IOM WB-DSS follows a P2P network and is based on XML and related technologies [7]. In this web system a set of peers, each one contributing with a local knowledge base component, compose a Distributed Knowledge Base (DKB) and form the P2P network of the system. The P2P network has the capability of allowing a direct-interaction between the peers, which turns the computing environment decentralized, namely in terms of storage, computations, messaging, security and distribution. One of the greatest benefits of a P2P network, in the context of this work, is to easily support the concept of community. Consequently, it is possible for users to organize themselves into groups that can collaborate with each other in order to achieve certain goals.
One of the main goals in this work is the collaborative improvement of the resolution of IOM problems. This is possible through a DKB for IOM by easily accessing different algorithms spread through a P2P network, integrating several algorithms’ servers. It is achieved by providing a mechanism that allows the members of the P2P network to share their IOM knowledge and respective solving algorithms.
Figure 17 shows a general outline of the P2P IOM WB-DSS architecture. The system is able to quickly assign algorithms to problems that occur in real world industrial environments and solve them through the execution of one or more appropriate implemented algorithms which are local or remotely available and accessible through the Internet through the P2P network. The selection of one or more specific algorithm for solving a given problem is made through a searching process on the DKB. Therefore, one of the most important goals of the system is to be able to facilitate the access to web services and to share them.
The P2P networks make an important contribution because they allow systems to run in a decentralized and distributed environment and allow individuals and communities to participate more actively in the network. The P2P networks allow direct collaboration between users without them having to rely on central services and allow sharing processing capabilities of the resources that are interacting on the network. Moreover, all network resources may communicate directly without having to have an intermediary.

International Conference 2ND International Conference on Innovations, Recent Trends and Challenges
in Mechatronics, Mechanical Engineering and New High-Tech Products Development
MECAHITECH‘10
Bucharest, 23-24 September 2010
361
Figure 17: P2P system network.
An application deployed to operate in a P2P network context must have three types of
layers: 1) One layer for enabling to discover and communicate with all network participants; 2) a middleware layer for system integration with other systems or applications and 3) a layer capable of providing a user interface to exploit the full functionality of applications [8].
The IOM WBDSS is structured around this three layer framework, as describe in the next section together with main system features.
The system is intended to bring systems’ users together in order to enable sharing all the resources involved in the network as well as important information, enabling a collaborative work between all actors in the network.
SYSTEM FUNCTIONALITIES
The IOM WB-DSS inherited generic functionalities from web based framework, such as standard user interfaces, ubiquitous networks and web-based programming capability including web-services technologies.
The IOM WB-DSS possesses a set of specific functionalities. The algorithms, available in the P2P network are selected through a user-friendly interface, which is automatically generated for each specific algorithm. XML documents of IOM problems available in the network may be accessed for easing the user’s task of problem instance specification. Once this is carried out, one or a set of algorithms can be selected for obtaining solutions to each IOM problem. Solution can be stored and presented to users in several formats, including tables, Gantt charts and XML e PDF files. Input data, in addition to direct introduction through the browser interface referred, can also be input through XML files. Some important functionalities are illustrated in Figure 18.
The system is able to search for information and existing services, mainly IOM procedures and algorithms, in the network to support IOM problem solving in several different production environments. It selects appropriate problem solving algorithms, available on the different peers belonging to the network and having its own local data and knowledge bases. Searches can be filtered according given manufacturing environment

International Conference 2ND International Conference on Innovations, Recent Trends and Challenges
in Mechatronics, Mechanical Engineering and New High-Tech Products Development
MECAHITECH‘10
Bucharest, 23-24 September 2010
362
scenarios or by choosing server communities capable of providing the required services, as illustrated in Figure 19.
Figure 18: Application functionalities.
Figure 19: Network search functionality
The application also allows the association of individuals or communities to work with a
common purpose, thereby catalyzing and increasing the collaboration among them.

International Conference 2ND International Conference on Innovations, Recent Trends and Challenges
in Mechatronics, Mechanical Engineering and New High-Tech Products Development
MECAHITECH‘10
Bucharest, 23-24 September 2010
363
After a given algorithm is selected, from the ones available in the P2P network, it is remotely executed for solving a problem instance specified, as illustrated on Figure 20.
Once a service is selected it is invoked for solving the specific IOM problem instance under consideration. An example could be for the resolution of a single machine operation scheduling problem using the Hodgson’s algorithm [9]. This finds a solution that minimizes the total number of tardy jobs in a set of jobs to be processed on a single machine manufacturing environment.
Figure 20: Machine/ algorithm selection interface.
Figure 21: Hodgson’s algorithm interface.

International Conference 2ND International Conference on Innovations, Recent Trends and Challenges
in Mechatronics, Mechanical Engineering and New High-Tech Products Development
MECAHITECH‘10
Bucharest, 23-24 September 2010
364
The problem instances data are given either directly through XML files or through the automatically generated system interface, as illustrated in Figure 21. The XML file contains all data concerning to the web service, such as the problem input parameters for running the IOM service on a peer.
The way information about problems’ solutions results is reported is very important regarding to the need of its interpretation and understanding by the user for decision-making. Therefore, in order to enable a better decision-making process, the IOM WB-DSS presents and store results in several alternative formats. These include Gantt charts, tables, XML documents and PDF files. These documents can be saved and locally stored for a later reuse if necessary.
Gantt charts are very effective for visualizing, analyzing and understanding IOM scheduling solutions and for providing an easy perception of job processing priorities and starting and finishing events. It is also very suitable for comparing the quality of different problem solutions provided by alternative solving algorithms. Figure 22 shows a Gantt chart example, which is automatically generated by the IOM WB-DSS, based on the results represented as a XML document.
Figure 22: Gantt chart interface.
One of the advantages of storing XML files of problems data is that it enables
performing further IOM services execution by repeatedly submitting it to other web service without having to repetitively inserting the same problem data. This storage procedure also enables an ease and fast way of reusing documents for specifying similar problems or different problems instances.
Figure 23: XML document loading interface

International Conference 2ND International Conference on Innovations, Recent Trends and Challenges
in Mechatronics, Mechanical Engineering and New High-Tech Products Development
MECAHITECH‘10
Bucharest, 23-24 September 2010
365
Figure 23 illustrates the application interface for Gantt chart generation based on searching XML files, over the P2P network, of problem solutions.
CONCLUSION
A web-based application for aiding IOM problem solving can be based on the concept of a distributed knowledge base available on computers or peers, integrating a P2P network. Thus, a very large knowledge base, on the form of IOM algorithms and mechanisms, can be made available and accessed by users by means of adequate platforms.
In this paper this idea is explored through the concept of a P2P web-based application for solving IOM problems or tasks, based on a network of computers. In this network each peer may supply and receive IOM services. This application explores the use of problems solving algorithms made globally available through the proposed application, and easily accessible through the Internet.
A prototype of this application was designed and implemented with the support of web technology and P2P networks and based on the use of XML and related technology.
An illustrative example of the use of the prototype of the web application, to solve a IOM problem using web service, was presented. Results were shown to be presented in several formats, namely Gantt charts, XML files and PDF files. The use of each format very much depends on what the results is used for., i.e. for simple decision making of for integration with other data for either further problem solving or reporting.
Further work needs to be carried out now to increase the IOM service providers and service users and create an effective network IOM web services.
REFERENCES
[1] Varela, M. L. R. and Carmo-Silva S. “An Ontology for a Model of Manufacturing Scheduling Problems to be Solved on the Web.” Azevedo, A. (ed) Innovation in Manufacturing Networks, pp. 197-204, Springer Boston ISSN: 1571-5736 / 1861-2288 (Internet), ISBN: 978-0-387-09491-5; eISBN: 978-0-387-09492-2
[2] Tsai, M. P., Lin, J. T. “Web-based distributed manufacturing control systems.” The International Journal of Advanced Manufacturing Technology, Vol 25, No 5-6 / March, 2005 pp. 608-618
[3] Elizabeth D. Dolan, Robert Fourer, Jorge J. Moré, and Todd S. Munson “Optimization on the NEOS Server” SIAM News Vol 35 (2002), No. 6.
[4] S. Carmo-Silva, L. Varela, A. Lemos, A. Garcia, C. Ribeiro, J. Carvalho, “Collaborative production scheduling”, D T Pham, E E Eldukhhr, Soroka, A. J., Intelligent Production Machines and Systems, 2nd I*PROMS Virtual Conference 2nd -13thJuly 2007, Elsevier
[5] Varela, L.; Aparício, J.; Carmo Silva, “A Scheduling Web Service”, in Graham Kendall; Edmund Burke; Sanja Petrovic; Michel Gendreau (Eds., Multidisciplinary Scheduling - Theory and Applications, pp … (15 pages), ISBN: 0-387-25266-5, Springer, 2005

International Conference 2ND International Conference on Innovations, Recent Trends and Challenges
in Mechatronics, Mechanical Engineering and New High-Tech Products Development
MECAHITECH‘10
Bucharest, 23-24 September 2010
366
[6] Papazoglou, M.P., Krämer, B.J., Yang, J. “Leveraging Web-Services and Peer-to-Peer Networks.” In: Proceedings of Advanced Information Systems Engineering - 15th International Conference, CAiSE, 2003, June 16- 18, pg. 485-501. Klagenfurt, Austria.
[7] Ceponkus, A., Hoodbhoy, F.” Applied XML”. Wiley Computer Publishing, USA., 1999
[8] Xianga, A., Liub, L., Luoc, Q. “VPeers: A peer-to-peer service discovery framework for Virtual Manufacturing Organizations”. (2008),COMPLETAR A REFERÊNCIA)
[9] Blazewicz J., Ecker KH., Pesch E., Schmidt G., Weglarz J. “Handbook of Scheduling - from Theory to Applications” , Springer, 2007.
[10] Verma, D. (2004). Legitimate applications of peer-to-peer networks.

International Conference 2ND International Conference on Innovations, Recent Trends and Challenges
in Mechatronics, Mechanical Engineering and New High-Tech Products Development
MECAHITECH‘10
Bucharest, 23-24 September 2010
367
Development of a Posture-sensorial Modeling and Ana lysis 3D
Structure for the Human Bio-system Involved in Moti litate Activities
Mihaela Baritz, Diana Cotoros, Ion Balcu University Transilvania from Brasov
500036, B-ul Eroilor nr.29, Brasov, Romania, E-mail: [email protected]
ABSTRACT
In this paper we present some aspects related to the development of a posture-sensorial modeling and analysis 3D structure in order to evaluate the human bio-system involved in motion activities and to obtain some performance characteristics. Posture, as well as the human body motion are energetic and kinetic activities that may be identified and analyze with respect to the modules involved in each of these actions. In the first part of the paper these aspects are briefly overviewed while in the second part we propose an analysis methodology for human body posture and motion in order to obtain some motilities activities conditions without inducing additional fatigue states. Results and conclusions are presented in the final part of the paper.
INTRODUCTION
Human body become a complex organism, having most various forms of motion, and more and more developed adaptabilities and compatibilities, by a lot of changes in the human body evolution and also having a final result of a prolonged cycle of phylogenetic transformations and a complicated ontogenesis. A multitude of morpho—functional factors that are the base of human locomotion should be analytically studied because is important each factor. Human body, as an entity of its subsystems should be regarded as a whole and not as a manifestation of modular structures that are independently acting, so that the morpho-functional factors generating the body motions are integrated in this system by means of the analysis using reintegrating synthesis of the environment interaction feed-back reactions. A series of external factors acting on the human organism like a greater or smaller extent, along a variable or constant period represent the source of functional elements interacting with the human body.
The importance and influence of the external factors upon the human body is well-known, such as: ground resistance and elasticity, acceleration, gravitation, temperature, pressure and humidity. At the same time, the human body motion itself is the one influencing its evolution, changing even its structure, making it fit to achieve more and more complicated movements. It can say that the human body structure consists of functional structures , created by dedicated function , with the purpose of creating functions.
From the point of view of structural analyses performed upon the human body in order to achieve its static or dynamic normal or abnormal behavior assessment, the most important elements that were taken into account were: the hip, the thigh, the knee, the calf, the ankle and the foot acting during various positions or/and motions like an open or closed kinematical

International Conference 2ND International Conference on Innovations, Recent Trends and Challenges
in Mechatronics, Mechanical Engineering and New High-Tech Products Development
MECAHITECH‘10
Bucharest, 23-24 September 2010
368
chain. The closed kinematical chain formed by the locomotor system components acts for maintaining and supporting the body in orthostatic position, for propulsion motions or for damping motions during a fall (on the feet). The inferior limb acts like an open kinematical chain in the different variants of adduction and abduction motions, external and internal rotation, kicking, pushing and not least in accomplishing the gait cycle, all these actions being included in a system of coordinates. (fig.1)
Fig.1.
The stability stance as well as the integral balance around the equilibrium position are determined by the health level of the entire human body and may constitute clear informational sources for the human behavior evaluation in any situation. The small deviations of the human body posture around the vertical direction determine the occurrence of a torsion moment, which acts upon the entire structure and may unbalance the human body or may create a vibration state. However, this process of corrective torque generation is not fully understood and controversy remains regarding the organization of sensory and motor systems contributing to the postural stability of the entire human body. Balanced state of postural sway is controlled by central nervous system (CNS), and the upright stance cannot be sustained without this control. It is widely accepted that the corrective torque is generated through the action of feedback control system; the input sources include visual, proprioceptive and vestibular system.
The symbolic motion structure representation (SMSR) algorithm analyzes a sample human motion (motion capture data) to identify its basic spatial–temporal structure. A sample motion is assumed to be associated with a linkage system that consists of N rigid body link segments L=(l1…..ln…..lN) and J locally defined joint angles θ=(θ1…..θj…..θJ). Thus, a sample motion is described as a set of J joint angle–time trajectories θ(t)=(θ1(t)..θj(t)..θJ(t)), where t represents time in [0;T].
Note that the SMSR algorithm is not specific to a particular linkage system but can be applied to any two- or three-dimensional linkage systems and motions provided that joint angles are locally defined. The SMSR algorithm resolves and transform each joint angle–time trajectory θj(t) (j=1….J) into a sequence of elemental motion segments in the angle–time domain.
Each elementary joint motion corresponds to a monotonically increasing (U), a monotonically decreasing (D), or a stationary (S) motion segment. By concatenating the symbols according to their order in time, the structure of a joint angle trajectory θj(t) is represented by a symbolic string. Successive application of the SMSR algorithm to each of the J joint angle trajectories reveals the structure of a multi-joint motion θ(t) as a set of J

International Conference 2ND International Conference on Innovations, Recent Trends and Challenges
in Mechatronics, Mechanical Engineering and New High-Tech Products Development
MECAHITECH‘10
Bucharest, 23-24 September 2010
369
symbolic strings. The SMSR algorithm consists of the four steps described like a sample joint angle trajectory obtained from a motion capture experiment (a left elbow flexion/extension angle–time trajectory during a manual handling activity) [11] THEORETICAL ASPECTS
The biomechanical principles that marked the analyses set upon equilibrium stability and human body motions can be synthesized as follows:
• Any motion of the human body starts either by means of a stabilization in a suitable and convenient position or a mobilization of the body centre of mass;
• The segments mobilization action is accomplished starting from the centre to the margins;
• If the lower or upper members act like open cinematic chains, meaning the peripheral extremity is free, the muscles stepping into action take a fixed insertion point on their central ends and act upon the segments by means of their peripheral ends;
• When the upper or lower members act like closed cinematic chains, meaning that their peripheral extremities are supported or fixed on a certain basis, the acting muscles will take a fixed point on their peripheral ends;
• When the members act like open cinematic chains, a series of agonistic muscles will contract in an isotonic way and the motion is the result of the insertion muscular ends near coming;
• When the members act like closed cinematic chains, the agonistic muscles groups will contract in an isotonic or isometric way, successively or both ways;
• The motions execution speed depends on the inversely proportional ratio between the agonistic muscles intensity action and respectively of that of the antagonistic ones;
• At the end of each performed motion, the antagonistic muscles change to neutralizing muscles and the higher the execution speed, the more intense their action is;
• The position is held by equalizing the agonistic and antagonistic action intensity and also by putting all the muscular chains in static action conditions;
• When the external forces action upon the human body is used, the role of the muscular groups is reversed and they keep the body in a resistance stance towards these external forces. But this reversed action is possible in certain conditions of using external forces, only after they triggered the body or its segments motion;
• In case of closed cinematic chains, the bone-joints systems act like supporting elements, while in case of open cinematic chains they act like speed and action systems;
• For the improvement of human body motion or equilibrium mechanisms, we aim at their maximum efficiency operation, using internal forces at minimum values and external forces at maximum values;
When it analyzed the human body equilibrium, it was necessary to establish that the sum of the forces acting on it is equal to zero and the sum of the torques acting on it is also equal to zero. In other words, there are no unbalancing forces or torques.
Human body posture is the term used to describe the orientation of any body segment relative to the gravitational vector and the balance refers to body posture dynamics that prevent falling in arbitrary directions.
To maintain balance or equilibrium, the postural neuro-muscular control system keeps the body’s centre of mass (COM) over the base of support (BOS). The BOS represent the

International Conference 2ND International Conference on Innovations, Recent Trends and Challenges
in Mechatronics, Mechanical Engineering and New High-Tech Products Development
MECAHITECH‘10
Bucharest, 23-24 September 2010
370
minimum area enclosing the body’s contact with the ground. Therefore, while standing, in bipedal posture, the BOS is the area enclosing the soles of the feet (or shoes). A smaller BOS gives a smaller area for the alignment of the COM, and the body in such position is considered less stable and can fall over. This postural control process is referred to as dynamic stability. The biomechanical goal of human body stability analyze, is to adjust the relationship between the COM and the BOS.
Situations requiring balance can be classified into three general conditions: • maintenance of a stable position, • postural adjustment to voluntary movements, and • reactions to external predicted and unpredicted mechanical perturbations (slipping or
stepping).
B ig a n d sm all B O S
Ba la n ce
H ea lth sta te
P h ys iolo gic al d ata
F o rc e p la te
Fig.2. In dynamic stability, both the BOS and the COM are in relative motion. Prevention of
falls requires effective balance function under dynamic conditions because most falls are caused by sudden motion of the BOS or by sudden acceleration of the COM. [5]
The main key to dynamic stability is the momentum control of the COM. The distribution of body mass is achieved by two-thirds of mass distributed in the head, arms, and trunk and the rest into different human body parts. Because of the large mass and inertia moment of the upper body, its position and movement (forward momentum) can be critical in the overall stability of the upright stance.
For that, stability of human body can be defined as the ability of body to return to its original state that means desired actions or movement trajectory after a disturbance or stable position. [13]
Another approach was based upon the analysis of the muscular-skeletal model. Thus, the muscular-skeletal model of the human body consists of driving elements and respectively of elastic elements as it is presented in the next figure, which makes possible the human body approach by bio-mechanical modeling. For each musculotendon, a model based on Hill’s three-component model was used. There are a lot of muscle models that are derived from Hill’s model [10].
It is composed of three elements: the contractile element (CE), or muscle fibers, series elastic element (SEE), or muscle tendon, and the parallel elastic element (PEE), or

International Conference 2ND International Conference on Innovations, Recent Trends and Challenges
in Mechatronics, Mechanical Engineering and New High-Tech Products Development
MECAHITECH‘10
Bucharest, 23-24 September 2010
371
connective tissue around the fibers and fiber bundles. There is an inclination between the muscle part (CE and PEE) and the tendon part (SEE) and the angle between them is called the pennation angle of the muscle, and it is denoted by α.
The force (fce ) made by the CE is a function of its length (lce), contraction velocity (vce), and the muscle activation level (a), which is controlled by the central nervous system (CNS).
The muscle-tendon length (lmt) is the sum of the muscle fiber length and the tendon length: lmt = lmcosα +lt, where lm =lce = lpe.
The dimension (lmt ) can be calculated by the joint angles of each leg. The force of the SEE (ft) and PEE ( fpe) are functions only of their lengths (lt ; lpe).
The relationship between the force at each element is: ( ) αcospecet fff += (1)
SEE
CE
PEE
lt lmcosα
lmt
α
Fig.3.
The tendon is a passive element that exerts an elastic force(ft ) only when its length is longer than the slack length (lts).
The CE can generate the maximum force (fMo) when its length is set to the natural length (lmo), and the contraction velocity (vce), to zero. The normalized curve of fce/ fMo (lce/lmo), where a = 1 and vce = 0, is shown in fig. 4 together with the normalized curve of fpe/ fMo(lpe/lmo).
The force exertable by the CE decreases as the contraction velocity increase. The curve of fce/ fMo and vce, where a=1 and lce=lmo , is shown in fig. 5.
Fig.5
The speed vo is the maximum contraction velocity of the CE, and it is assumed to be 10lmo/s. This curve is defined here as gce(vce/vo). Using fceo ; fpeo ; fto and gce, we obtain:
av
vg
l
lffavlf
o
mce
mo
mceoMommce
=),,( (2)

International Conference 2ND International Conference on Innovations, Recent Trends and Challenges
in Mechatronics, Mechanical Engineering and New High-Tech Products Development
MECAHITECH‘10
Bucharest, 23-24 September 2010
372
( )
−=ts
tsttMott l
llfflf (3)
( )mo
mpeoMompe l
lfflf = (4)
The method to predict the muscle force from the joint torque and the profile of the motion is explained by the value of torque ττττi made at joint i, which is generated by the muscles crossing the joint:
∑ ×=j
jji frτ (5)
where r j and f j are the moment arm and the force exerted by muscle j, respectively, and x represents the outer product.
The joint torque can be calculated with inverse dynamics if the joint angles θθθθ, angular velocities and angular acceleration are specified. However, since the number of muscles crossing joint i is always greater than the degree of freedom (DOF) of the joint, solving f j in (5) is a redundant problem. It can be possible to apply an optimization method to determine the muscle force and also using a criterion:
2
1∑
=
=
i i
ti
A
fu (6)
where f ti= I fi I, Ai is the physiological cross-sectional area (PCSA) of muscle i, and nm is the number of muscles is optimized. The muscle force ft at this moment is obtained at the same time. However, we do not use the upper limit ft < fmax here. This constraint can be used for conversion and optimization level to obtain feasible motions.
It was used ft and lmt to calculate lm. After that, the dimension lm was used as lmprev in the next level to calculate vm by finite differentiation, and then fmin and fmax can be calculated again at the next level. By forward repetition of this calculation, it is possible to calculate fmin and fmax at any level during the motion.
To keep the balance of the human body model, it is necessary to define a function that evaluates the stability of the posture and the zero moment point (ZMP) can be used to define such a function of stability.
When a human stands on one foot or on both feet, a point exists where the torque applied to the body from the ground becomes zero.
When the body is supported by a single leg, this point is at the sole of the support foot, while, when the body is supported by both legs, it stays in the area surrounded by the feet.
Since there is no joint between each foot and the ground, the torque that can be generated between the sole and the ground is limited. If the torque exceeds the limit, the body will fall down to the ground.
One way to judge whether the motion is valid is to calculate the ZMP and check if it is within the supporting area.
Suppose ττττg and fg are the torque and force applied by the ground to the body, and rg is the vector from the center of mass of the body to ZMP, then, the relationship between these vectors can be listed by:
ggg fr ×=τ (7)
As the elements of these vectors are listed as τg=(τx; τy; τz), rg = (rx ; ry; rz) and fg =(fgx;

International Conference 2ND International Conference on Innovations, Recent Trends and Challenges
in Mechatronics, Mechanical Engineering and New High-Tech Products Development
MECAHITECH‘10
Bucharest, 23-24 September 2010
373
fgy; fgz), we have
gxzgzxy
gyxgxyz
gzygyzx
frfr
frfr
frfr
−=−=−=
τττ
(8)
The z axis is parallel to the vertical direction here. It is assumed here that the static frictional constant between the force and the ground is infinite. This means only the moment around the x and y axes of the floor must be checked to keep the body stable.
The distance rz is already known from the posture (the height of the center of mass of the body). Using the first two equations,we can calculate rx and ry:
gz
gyzxy
gy
gxzyx
f
frr
f
frr
+−=
+=
τ
τ
(9)
If the ZMP is in the support area (BOS), the posture is stable. If the ZMP is outside the area, however, some additional torque must be added to the support foot to prevent the body from falling. [10]
EXPERIMENTAL SETUP In order to develop the posture-sensorial modeling and analysis 3D structure for the bi-
system involved in motion activities and respectively to obtain data, we designed a modular experimental system that allows the assessment of these manifestations regardless of their size or the measured moving part or the subjects’ characteristics.
Thus the system consists of a Kistler force plate with four piezzo-electric sensors for measuring forces and moments on three directions (Ox, Oy, Oz), devices and software for anthropometrical analysis of the human body, a system with sensor glove for evaluating the handling skills and motion activities, respectively a high speed video cam for the analysis of fast motions.
For the simulation of real activities conditions the subjects were tested also by help of a system meant for inducing and measuring vibrations into the human body.
The experiments were developed upon a sample of subjects with different physiological parameters; also recordings were performed in different times of the day during a week. We also aimed at the fact that the bipedal position of each subject is centered on the plate, with no high heels shoes, arms relaxed along the body, open eyes and the eyes oriented straight ahead.
In first stage of the experiments we established and kept the parameters of the laboratory environment. Temperature into laboratory was 220C, air humidity 80% and atmospheric pressure 755 mmHg. [7]
In the second stage we measured the physiological parameters of the human subjects (weight, height, age, pulse, blood pressure) in relaxed stance, without any general health problems and with a good metabolism (example: blood pressure 155/82 mmHg, pulse 78-88, face temperature 36,70C, height 170-185 cm, weight from 50-95 kg). All these parameters are necessary to establish a common modeling base to measure and to evaluate the human body behavior and abilities.
By this proposed investigation structure we establish that the human subjects are

International Conference 2ND International Conference on Innovations, Recent Trends and Challenges
in Mechatronics, Mechanical Engineering and New High-Tech Products Development
MECAHITECH‘10
Bucharest, 23-24 September 2010
374
analyzed and compared to the corresponding virtual models of the stability measurements simulations in order to correlate all the influence factors for working activities of human subjects.
Fig.6.
Fig.7. RESULTS AND CONCLUSIONS For the results exemplification we chose one of the subjects, having the weight 80,4kg,
female, aged 52, that was recorded in the above mentioned conditions, was instructed to maintain a bipedal position with big base of support, arms along the body, open eyes, look ahead and no visual or acoustic stimulus (the subject wears glasses being near-sighted). The force plate and the data acquisition system were calibrated for each measurement as the subjects have different weights and the filtering basis will change.
The explanations of human postural control system are very complex approaches and
Amplifier and
trigger
Physiolog ical parameters
Video-cam
Kistler force plate
Human subject
Oz
Ox
Oy
Computer
Biomechanical and anthropome tric
parameters
Com puter So f tw a re de dic ate
A nthr opome tr ical dev ice s: - D yn am om eter - L eng ht scale - Fing er go n io meter - Sen zori a l tes ts
Entire bod y v ibrat ion
st im u la tion dev ic e
R esul ts
1
2
3
4
7
5
6

International Conference 2ND International Conference on Innovations, Recent Trends and Challenges
in Mechatronics, Mechanical Engineering and New High-Tech Products Development
MECAHITECH‘10
Bucharest, 23-24 September 2010
375
they involve multiple sensory systems and motor components. There are possibilities of investigating human balance control under quasi-static (unperturbed) conditions or dynamic (perturbed) conditions, but despite these approaches, it remains a very important variable that sensorial motor components are integrated into the postural control system and the system uses similar mechanisms and strategies under quiet-standing and perturbed conditions. Having the complexity of the postural control system, we can consider that its output is highly irregular.
For example, during quiet standing the centre of mass (COM) under an individual’s feet continually fluctuates in a stochastic manner like in fig.8.
Time (seconds)
0 2 4 6 8 10 12 14 160
50
100
150
200
250
300
350
400
450
500
Fig.8.
By this set of procedures we may assess the behavioural performances of the subjects we may determine their physical or psychical fatigue degree along an active day.
These recordings may indicate in time a certain manifestation of the neuro-sensorial equilibrium instability and not last we may establish some correlations between the metabolic level and the organism wear. Also, using sensorial gloves in the same time with stability recordings it will be possible to establish a correlation between impacts of sensorial inputs (visual, audio or vibrations), stability behaviour and hands reactions. These correlations are very important and extremely necessary to be known especially when human subjects develop precise workings. Acknowledgment These researches are part of the Grant PNII-IDEI 722 and 744 with CNCSIS Romania and we’ve developed the investigations with apparatus from these Grants and from Mechatronic Researches Department in University Transilvania of Brasov
REFERENCES
[1] Arthur D Kuo, An optimal state estimation model of sensory integration in human postural balance J. Neural Eng. 2 (2005) S235–S249;
[2] A. Tozeren, Human Body Dynamics: Classical mechanics and Human Movement, 2000 Springer-Verlag New York, Inc.ISBN 0-387-98801-7;
[3] Y. Jiang, S. Nagasaki, M. You, J. Zhou, Dynamic studies on human body sway by using

International Conference 2ND International Conference on Innovations, Recent Trends and Challenges
in Mechatronics, Mechanical Engineering and New High-Tech Products Development
MECAHITECH‘10
Bucharest, 23-24 September 2010
376
a simple model with special concerns on pelvic and muscles roles, Asian Journal of Control, Vol. 8, No. 3, pp. 297-306, September 2006;
[4] J. Mrozowski and J. Awrejcewicz, ZMP and GCOM criteria as a base of assessment of the human gait stability, Department of Automatics and Biomechanics, Technical University of Łódź,
[5] Baritz M., Cotoros D., Cristea L., Rogozea L. Analyze of human body bipedal stability for neuromotors disabilities, BICS'2008, Tg.Mures, Nov.6-7, 2008, ISSN 2065-0418.
[6] Radu C., Determinarea fortelor de reactiune in articulatia gleznei in conditii dinamice, ANNALS of the ORADEA UNIVERSITY. Fascicle of Management and Technological Engineering, 2007;
[7] Baritz, M. et al. Advanced methodology for evaluation of human behavior in technological working activities, 6th International Conference on the Management of Technological Changes, Date: SEP 03-05, 2009 Alexandroupolis GREECE, VOL 1, Pag. 449-452;
[8] Baritz, M., et al., Analyses of noise effects on standing human body stability, 9th WSEAS Conference on SIGNAL, SPEECH AND IMAGE PROCESSING, Budapest, Hungary, September 3-5, 2009;
[9] Baritz, M., et al., Thermal human body behavior analyze during cycling movements: PROCEEDINGS 6th IASME/WSEAS International Conference on Heat Transfer, Thermal Engineering and Environment, AUG 20-22, 2008, Rhodes, GREECE, Pag. 338-341;
[10] Taku Komura, Creating and retargeting motion by the musculoskeletal human body model, The Visual Computer , 16:254–270 Springer-Verlag 2000;
[11] Woojin Park et al., A computer algorithm for representing spatial–temporal structure of human motion and a motion generalization method, Journal of Biomechanics, 2004 Elsevier Ltd.;
[12] Baritz, M; Cotoros, D., Human gait analyzed by complex and interconnected system, PROCEEDINGS 7th WSEAS International Conference on Applied Computer Science (AOS 07), NOV 21-23, 2007 Venice ITALY Pages: 306-309 2007
[13] Baritz M., Correlated and interconnected analyses for human walking and standing biomechanical behavior, WSEAS Cambridge, Anglia, 22-24 febr.2010.
[14] Cotoros D, Baritz M. Serban I., Applied Computer Science to Establish Active Correlation for Improving the Handling Skills, APPLIED COMPUTER SCIENCE (ACS), Malta Grecia, 15-17 sept.2010;
[15] Baritz, M, et al. Retinal image and oculo-motor equilibrium analyze using recordings of human body stability-posture, 9th WSEAS International Conference on Signal Processing, Robotics and Automation (ISPRA'10), feb.2009 Cambridge ENGLAND Pag.258-263.

International Conference 2ND International Conference on Innovations, Recent Trends and Challenges
in Mechatronics, Mechanical Engineering and New High-Tech Products Development
MECAHITECH‘10
Bucharest, 23-24 September 2010
377
A Document-oriented Web-based Application for Suppo rting
Collaborative Product Development
Filipe Rocha, Leonilde R. Varela, S. Carmo-Silva Department of Production and Systems, School of Engineering, University of Minho
Campus de Gualtar, 4710-057 Braga, Portugal [email protected], [email protected], [email protected]
ABSTRACT
Innovation is a creative process strongly associated with development and deployment of new products, i.e., goods and services. This is essential in the global economy of today for sustainability and success of companies. Good collaboration between those involved in new product development is an essential requisite for this success. Such collaboration, which involves not only company stakeholders but also suppliers and customers, requires easy access to necessary data and agile communication and sharing of relevant information, which is distributed in a network of resources and users. Hence, web-based applications, decentralized repositories and databases are used to store and manage product and process development information. For meeting these new product development requirements Internet based collaborative tools and services must be applied. The use of web services is important in product development, helping the integration of data and knowledge bases and also processes and application interactions.
This paper reports on work for managing product and process information, as well as documentation generation, throughout the product development process cycle in an Internet based collaborative environment. The information concerned includes product and process information, as well as product development history. One important aspect deals with web based restoring decisions and options made along the product design and development cycle, including product revisions and/or versions manipulation. The research work, focus is on the development of a document-oriented web-based application using Apache CouchDB technology and REST web services. The proposed application is described and the main functionalities are illustrated through some examples of use.
INTRODUCTION
Innovation is closely associated with new product development (NPD). This is an activity that can benefit very much from collaboration between stakeholders involved. This can be enhanced through the use of agile tools and technology for efficient and fast information sharing and the carrying out of collaboration tasks. Such tools and technology are mostly available through the Internet. In fact, nowadays the Internet can be considered the best channel for collaboration and knowledge exchange and un inevitable path for companies sustainability and competitiveness [1]. This is true not only for a company itself, but also for suppliers and customers that contribute for product innovation in a cooperative and collaborative environment [1-4].

International Conference 2ND International Conference on Innovations, Recent Trends and Challenges
in Mechatronics, Mechanical Engineering and New High-Tech Products Development
MECAHITECH‘10
Bucharest, 23-24 September 2010
378
Zhang et al. [5] enhances and describes a web-based collaborative design platform. This platform provides a product catalogue, a communication system between peers, knowledge access restrictions and project management.
The use of web services [6] can be seen as a feasible interface between involved parties in product innovation, helping the integration of data and knowledge bases, processes and application interactions [1, 3, 5, 7].
One important aspect of this work is to access product and process information, in the collaborative distributed context of NPD.
Access to information for product design and development is not an easy task when using relational databases (RDB). Tables are referencing other tables and to retrieve little information, extreme computational work needs to be done by selecting and joining data from this structure.
RDB are designed to store and report on highly structured, interrelated data. Moreover, they include schemas and storage of the existing data that need frequent update. This often causes problems not anticipated in the initial database design. Each change in the initial database schema is a challenge for local and distributed upgrades. When dealing with paperwork, this is common and happens when we need to adapt predefined paper forms by adding or removing information and fitting its strict form to the needs of the moment.
In this paper, we propose a new approach to manage new product development information. This new concept is based on Document-oriented Databases (DoDB) with native distributed properties, instead of the usual Relational Database Managements System (RDBMS). So, instead of the strict schema provided by tables we get to work with the documents and free schemas. This new concept is based on an open source Apache project named Apache CouchDB, commonly referred just as CouchDB [8].
This paper, in addition to this introduction follows with a literature review and the description of a proposed approach for managing product information. Based on this a system architecture is described and illustrated. Finally a conclusion is presented.
LITERATURE REVIEW
Companies use proprietary software, most of the times centralized, having high costs with licenses and high risk with information losses. Aziz et al. [9] talk about the shortcomings of centralized architectures and proposes a decentralized one based on open standards and open source tools, stating that systems like this are implementable at low cost.
Sharma et al. [3] referring collaborative product innovation presents a theoretical framework identifying tools and processes for people and teams to collaborate on product development. Zhang et al. [5] reviewed the state of the art on Internet-based product information, concluding that despite several Internet web-based technologies which have been applied to product development still none has been applied to real industrial applications. They also found a number of practical problems remaining unsolved, including dynamic product information collection and update, real-time collaboration, scalability and interoperability. These problems still occur today despite several attempts and approaches to solve them [10-14]. This is probably due to the existence of bottlenecks on the database back-ends [14]. Relational databases have very strict schemas and enhance those problems with dynamic information, i.e., a change on the initial schema represents a change in the whole system.

International Conference 2ND International Conference on Innovations, Recent Trends and Challenges
in Mechatronics, Mechanical Engineering and New High-Tech Products Development
MECAHITECH‘10
Bucharest, 23-24 September 2010
379
Moreover, dynamic product information is not what we get with schemas because there is no predefined schema for each product or service.
Major problems with scalability with relational databases become a point of failure. In particular, replication is not trivial. To understand why, consider the problem of having two database servers that need to have identical data. Having both servers for reading and writing data makes it difficult to synchronize changes. Having one master server and another slave is bad too, because the master has to take all the heat when users are writing information [15]. This statement leads to wish that there was a replication system that would come with an automatic conflict detection and resolution, by making it easy to synchronize data in both directions whenever wanted after being able to work offline independently [16].
REST (Representational State Transfer) technology is considered to have great potential for solving scalability problems [17-20]. Fielding [19] states that “The REST architectural style has been defined to describe the web architecture and to guide its future evolution, preserving the fundamental characteristics of scalability”. It promotes software evolvability, efficiency, performance and reliability [16] using the protocols already available for the web.
Liu and Xen [21] reviewing some traditional technologies and systems for management of product information and discuss the need for their integration on a web environment as a means of having a more adaptive and flexible infrastructure. They also mention bandwidth and security concerns with data availability over the Internet. Unfortunately they do not say how the reviewed systems handle changes made to predefined data management models, leaving therefore, important questions unanswered.
Frutos and Borenstein [22] talk about mass customization and the role that customers should have in new product development. They report a web-based information system for flats’ customization through interactions between building company web site and costumers. Customers can generate a variety of customized solutions, i.e new products, with control on costs, despite flat variants’ limitations.
One concept that has been used in production areas on several fields is the Document-Oriented Databases (DoDB). This concept is implemented in Apache CouchDB DBMS (Database Management System) [23] and can be of great utility in NPD due to the functionalities that DoDB offer .
The next sections will focus on explaining how Apache CouchDB works in the proposed approach to manage new product development information, followed by a description of our solution for the system’s architecture.
PROPOSED APPROACH
In this work we propose the CouchDB for managing NPD information. CouchDB is an open source “distributed, fault-tolerant and schema-free DoDB, accessible via a RESTful HTTP/JSON API” [24]. Data is stored in documents, presented in key-value maps using the data types from Javascript Oriented Notation (JSON) [25].
CouchDB is not a relational database or a replacement for it. Moreover, it should also not be seen as an object-oriented database, despite relationships between documents being possible. CouchDB is designed to store and report on large amounts of semi-structured data, simplifying the development of document-oriented applications, which is the bulk of collaborative web applications. A CouchDB database can be described as a flat collection of

International Conference 2ND International Conference on Innovations, Recent Trends and Challenges
in Mechatronics, Mechanical Engineering and New High-Tech Products Development
MECAHITECH‘10
Bucharest, 23-24 September 2010
380
JSON (JavaScript Object Notation) documents, identified by a universal unique identifier (UUID). Each document is an object that consists of named fields. Field values can be strings, numbers and dates, ordered lists and associative maps.
With CouchDB, no schema is enforced, so new document types with new meaning can be safely added alongside the old ones. Error! Reference source not found. Figure 24 illustrates a JSON document including some of the substructures stated before.
Figure 24: Excerpt of a JSON Document in CouchDB
CouchDB is a fully Atomic Consistent Isolated Durable (ACID) [18] storage engine,
never overwriting committed data or associated structures, ensuring that the database file is always in a consistent state. Thus it guarantees that database transactions are reliably processed. Document updates are serialized and there are no locks. It uses a Multi-Version Concurrency Control (MVCC) model, meaning that any number of clients can be reading documents without being locked out or interrupted by concurrent updates, even on the same document [15]. Documents are indexed in B-Trees by their DocID and a sequential number. Since we are talking about append-only, each update to the database generates a new sequential number to identify the document state in its history. This is implemented in the _rev field, i.e. the field containing the identification of document revision. of the document as shown in Figure 24.

International Conference 2ND International Conference on Innovations, Recent Trends and Challenges
in Mechatronics, Mechanical Engineering and New High-Tech Products Development
MECAHITECH‘10
Bucharest, 23-24 September 2010
381
Transactional commits provide consistent state to the database, i.e., in case of failure during a commit transaction, the commit is discarded and maintenance operations are run. From time to time, some jobs are run in order to compact data, freeing space on disk.
CouchDB also integrates a view model to add structure back to unstructured data. Views are the method of aggregating and reporting on the documents. They are built dynamically never affecting the document and providing different representations of the same data, as shown in Figure 25.
Figure 25: Concurrency with CouchDB – Documents concurrently trying to access Apache CouchDB
CouchDB uses Google’s MapReduce programming model [26] for views. CouchDB is a peer based distributed database system. Here, any number of CouchDB
hosts, servers and off-line clients, can have independent “replica copies” of the same database, where applications have full database interactivity (query, add, edit, delete). When back on-line or on a schedule, database changes are replicated bi-directionally on the several players (CouchDB hosts), as seen on Figure 26.
Figure 26: Apache CouchDB distributed System
CouchDB also is characterized by having a built-in conflict detection and management and the replication process is incremental and fast, copying only documents and individual fields changed since the previous replication.
Figure 27 shows an updated document that is inserted on one database and should be

International Conference 2ND International Conference on Innovations, Recent Trends and Challenges
in Mechatronics, Mechanical Engineering and New High-Tech Products Development
MECAHITECH‘10
Bucharest, 23-24 September 2010
382
replicated through the entire distributed database backend.
Figure 27: CouchDB Replication
Most applications require no special planning to take advantage of distributed updates and replication.
“Unlike cumbersome attempts to bolt distributed features on top of the same legacy models and databases, it is the result of careful ground-up design, engineering and integration” [27]. The document, view, security and replication models, the special purpose query language, the efficient and robust disk layout are all carefully integrated for a reliable [27] and efficient system.
With very little database work, it is possible to build a distributed document management application with granular security and full revision histories. Updates to documents can also be easy and interactively carried out by enabling incremental fields that hold the revision number and also replication of fields that hold digitized information and replications including text, images, audio or video.
The main purpose of this work is to manage NPD information. Hence, in the next section we present a system architecture aimed at supporting this purpose.
SYSTEM ARCHITECTURE
A schematic representation of how the system has been implemented is shown in Figure 24. The system is based on distributed CouchDB DoDB. The figure shows the main system functionalities in two parts. The first part includes a web-based product catalog, available to customers and fed by final versions of products created by NPD teams inside the company’s walls. The second part deals with information handling and storage, arising from interaction among NPD stakeholders involved, particularly from NPD teams, and applications used.
Internet feedback from customers can be seen as an advantage. Customers’ views, comments and reviews on a product usually lead to new versions of products. So, new product ideas can arise from customers’ feedback. Thus, one major feature of this system is to take the views and ideas from customers and from other stakeholders for generating new ideas and new products. A NPD idea may originate a new document that can be tagged to call attention e.g. to the idea and to resulting product versions. Then, taking advantage of CouchDB’s, product development information, including all external attachments, design information, reports, specifications and concepts in all product development iterations should be stored.

International Conference 2ND International Conference on Innovations, Recent Trends and Challenges
in Mechatronics, Mechanical Engineering and New High-Tech Products Development
MECAHITECH‘10
Bucharest, 23-24 September 2010
383
Figure 28: System architecture.
There are several technologies being considered for system implementation. CouchDB
manages the distributed environment keeping all peers synchronized on demand and/or on schedule. Since we are using REST, operations on the database are simple. Catalog and product information management web interfaces will be created using Ruby programming language [28] and the web application framework Ruby on Rails (RoR) [29], usually referred simply as Rails. Ruby is a robust object-oriented programming language and Rails is a Model/View/Controller (MVC) web framework for creating dynamic websites coded in Ruby. RoR also uses REST [30], Therefore, RoR and CouchDB just need a small wrapper to exchange information. All of these technologies are open source and thus available for free.
At this stage of the work, we managed to produce a very simple prototype of a web application that is able to interact with CouchDB. The application is designed to allow users to add their own product specifications freely and register and browse revisions to the shared documents.
Figure 29 shows the prototype at work. It presents some product information, including the last revision of it. Attachments are also shown when they are images, or links to the files are provided for images’ retrieval in an easy and user-friendly way.

International Conference 2ND International Conference on Innovations, Recent Trends and Challenges
in Mechatronics, Mechanical Engineering and New High-Tech Products Development
MECAHITECH‘10
Bucharest, 23-24 September 2010
384
Figure 29: Showing basic product information.
Another interesting system feature is related to suppliers. They may dynamically
propose supplying resources for a product. In order to preserve suppliers’ confidential information, data should be filtered by web services, becoming a subpart of the product information. Figure 30 is a graphical representation of this idea.
Figure 30: Use of web services to filter confidential information.

International Conference 2ND International Conference on Innovations, Recent Trends and Challenges
in Mechatronics, Mechanical Engineering and New High-Tech Products Development
MECAHITECH‘10
Bucharest, 23-24 September 2010
385
CONCLUSION
New product development (NPD) can be enhanced trough collaboration of stakeholders involved including customers and suppliers. This collaboration requires easy access to information generated in the NPD process. This process and collaboration can benefit very much from the use of recent advances on Internet technology, including web services and Document-oriented Databases (DoDB).
In this work we explore the use of some recent Internet technologies, namely Apache CouchDB DBMS and REST towards the development of an environment for dynamic information handling, updating and storage, in the process of NPD, carried out by the local or remote interaction and collaboration of several stakeholders, including customers product development teams and suppliers.
As a first incursion on the collaboration and easy access of information in the process of NPD, a small prototype of a web application that is able to interact with CouchDB has been developed and described here. It is designed to allow users to freely add their own product specifications, register and browse revisions to be shared. Moreover, document revisions and attachments can be easily made available through revision properties provided by DoDB.
Shared catalogs, provided by distributed properties, can be used in this context, since NPD teams may have online and offline access to suppliers’ catalogs. Hence, further work will be carried out in the near future enhancing the system by adding several features. These include sharing catalogs that can provide parts of the new product directly from suppliers using an API, improving abstraction of the prototype by letting users define all product requirements and functional specifications freely and interactively choosing what revisions created should be adopted in the design of the final product.
REFERENCES
[1] W. Yan, C. Chen, Y. Huang et al., “A data-mining approach for product conceptualization in a web-based architecture,” Computers in Industry, vol. 60, no. 1, pp. 21-34, Jan 1, 2009.
[2] B. Dong, G. Qi, X. Gu et al., “Web service-oriented manufacturing resource applications for networked product development,” Advanced Engineering Informatics, vol. 22, no. 3, pp. 282-295, Jul 1, 2008.
[3] A. Sharma, “Collaborative product innovation: integrating elements of CPI via PLM framework,” Computer-Aided Design, vol. 37, no. 13, pp. 1425-1434, Nov 1, 2005.
[4] L. Wang, “Collaborative conceptual design—state of the art and future trends,” Computer-Aided Design, vol. 34, no. 13, pp. 981-996, Nov 1, 2002.
[5] S. Zhang, W. Shen, and H. Ghenniwa, “A review of Internet-based product information sharing and visualization,” Computers in Industry, vol. 54, no. 1, pp. 1-15, May 1, 2004.
[6] "Web Services @ W3C," 20 May 2009; http://www.w3.org/2002/ws. [7] H. Wang, G. Liu, B. Han et al., “Collaborative simulation environment framework based
on SOA,” Computer Supported Cooperative Work in Design, 2008. CSCWD 2008. 12th International Conference on, pp. 416 - 419, Mar 31, 2008.
[8] http://couchdb.apache.org. "Apache CouchDB: The Apache CouchDB Project," 20 May 2009, 2009; http://couchdb.apache.org/.
[9] H. Aziz, J. Gao, P. Maropoulos et al., “Open standard, open source and peer-to-peer

International Conference 2ND International Conference on Innovations, Recent Trends and Challenges
in Mechatronics, Mechanical Engineering and New High-Tech Products Development
MECAHITECH‘10
Bucharest, 23-24 September 2010
386
tools and methods for collaborative product development,” Computers in Industry, vol. 56, no. 3, pp. 260-271, Apr 1, 2005.
[10] W. Shen, Q. Hao, and W. Li, “Computer supported collaborative design: Retrospective and perspective,” Computers in In, no. 59, pp. 855-863, 2008.
[11] K. Rodriguez, and A. Al-Ashaab, “Knowledge web-based system architecture for collaborative product development,” Computers in Industry, no. 56, pp. 125-140, 2004.
[12] K. C. Tseng, H. Abdalla, and E. M. Shehab, “A Web-based integrated design system: its applications on conceptual design stage,” The International Journal of Advanced Manufacturing Technology, vol. 35, no. 9-10, pp. 1028-1040, 2006.
[13] B. Dong, and D. Zhao, “Service-oriented design part information semantic modeling and applications,” Computer Design and Applications (ICCDA), 2010 International Conference, vol. 5, pp. 174-177, 2010.
[14] S. Xie, H. Huang, and Y. Tu, “A WWW-Based Information Management System for Rapid and Integrated Mould Product Development,” The International Journal of Advanced Manufacturing Technology, vol. 20, no. 1, pp. 50-57, 2002.
[15] G. Decandia, D. Hastorun, M. Jampani et al., "Dynamo: amazon's highly available key-value store." pp. 205-220.
[16] J. C. Anderson, J. Lehnardt, and N. Slater, "CouchDB: The Definitive Guide," O' Reilly, 2009. [17] L. Richardson, and S. Ruby, RESTful web services - Webservices for the real world:
O'Reilly, 2007. [18] J. Gray, and A. Reuter, Transaction Processing : Concepts and Techniques (Morgan
Kaufmann Series in Data Management Systems): Morgan Kaufmann, 1992. [19] R. T. Fielding, “Architectural Styles and the Design of Network-based Software
Architectures,” PhD Thesis, 2000. [20] P. Mazzetti, S. Nativi, and L. Bigagli, “Integration of REST style and AJAX technologies
to build Web applications; an example of framework for Location-Based-Services,” Information and Communication Technologies: From Theory to Applications, 2008. ICTTA 2008. 3rd International Conference on, pp. 1-6, 2008.
[21] D. T. Liu, and X. W. Xu, “A review of web-based product data management systems,” Computers in Industry, vol. 44, no. 3, pp. 251-262, 2001.
[22] J. D. Frutos, and D. Borenstein, “A framework to support customer-company interaction in mass customization environments,” Computers in Industry, vol. 54, no. 2, pp. 115-135, 2004.
[23] "CouchDB Wiki: CouchDB in the Wild," 20 May 2009; http://wiki.apache.org/couchdb/CouchDB_in_the_wild.
[24] "CouchDB wiki: FrontPage," 29 May 2009; http://wiki.apache.org/couchdb. [25] http://www.json.org. "JSON," 29 May 2009, 2009; http://www.json.org. [26] J. Dean, and S. Ghemawat, “MapReduce: simplified data processing on large clusters,”
Commun. ACM, vol. 51, no. 1, pp. 107-113, 2008. [27] "Apache CouchDB: The Apache CouchDB Project," 20 May 2009;
http://couchdb.apache.org/. [28] http://www.ruby-lang.org. "Ruby Programming Language," 20 May 2009, 2009;
http://www.ruby-lang.org/. [29] http://www.rubyonrails.org. "Ruby on Rails," 20 May 2009, 2009;
http://www.rubyonrails.org. [30] "Ruby on Rails Guides," September 2010;
http://guides.rubyonrails.org/getting_started.html#rest.

International Conference 2ND International Conference on Innovations, Recent Trends and Challenges
in Mechatronics, Mechanical Engineering and New High-Tech Products Development
MECAHITECH‘10
Bucharest, 23-24 September 2010
387
Considerations Regarding Mechatronic Systems for Ex ploration
Tasks
AluŃei Adrian, Vistrian Mătieş, Tătar Mihai Olimpiu, Scrob Alin Technical University of Cluj Napoca, Department of Mechanisms, Precision Mechanics and Mechatronics
Memorandumului Str., Nr. 28, 400114, Cluj-Napoca, Cluj, Romania. [email protected], matiesvistrian, olimpiut, [email protected]
ABSTRACT
The objective of this paper is to investigate the specific aspects concerning the mechatronic systems for inspection and exploration, specifically the category of omnidirectional mobile robots. After the presentation of the most representative issues of robots mobility, the paper is focused on the aspects concerning the design and control of the autonomous omnidirectional mobile robots. Applications using autonomous omnidirectional three wheel drive mobile robot Robotino® are presented along with a developed mobile omnidirectional four wheel drive robot prototype. An analogy between the developed prototype and Robotino® on aspects regarding the design, driving, control system and applications is made in the paper.
INTRODUCTION
Mobile robots represent mechatronic systems because they include mechanical, electronic and software components in an integrated and intelligent design. Mobile robots for inspection and exploration represent a distinctive category of robots specialized to work in dangerous and hazardous environments with the aim to substitute human intervention. There are several mechanisms to accomplish this aim; for example one, two, four, and six legged locomotion and many configurations of wheeled locomotion [1-3]. Mobility gives a higher flexibility to the robot to complete complex tasks. Wheeled mobile robots are always quicker than legged-robots, easy to control and have no problem of stability or balance as always occurred in legged-robots. The term omnidirectional is used to describe the ability of a system to move instantaneously in any direction from any configuration, as presented in figure 1 [4].
A
B
A
B
a) b)
Figure 31: Necessary movements from A to B point for a directional robot (a) and for an omnidirectional robot (b)

International Conference 2ND International Conference on Innovations, Recent Trends and Challenges
in Mechatronics, Mechanical Engineering and New High-Tech Products Development
MECAHITECH‘10
Bucharest, 23-24 September 2010
388
A large variety of omnidirectional robots are presented in specialized literature, [5]. These robots can be divided in two categories: robots with special wheels and robots with conventional wheels. An omnidirectional robot has three or more of these types of wheels.
Applications of omnidirectional systems are: exploration and manipulation of objects in hazardous environments, surveillance tasks of buildings, services like room cleaning, object search, identification and manipulation.
DESIGN ASPECTS OF OMNIDIRECTIONAL ROBOTS
Omnidirectional wheels are wheels that enable the robot to perform movement in all directions without them necessary turning around the robot’s vertical axis [4]. An omnidirectional wheel is created by a hub, its perimeter being surrounded by rolling segments - spherical, cylindrical, conical or circular rollers (Fig. 2). Wheels are divided according to the orientation of the rolling segments on the wheel hub [4]
Figure 2: Universal omnidirectional wheel
When the robot is moving, the rolling segments of the omnidirectional wheel will give
an induced speed that adds to the actual speed of the wheel. This will result, in a 3 and 4 wheel drive robots, in an adequate sequence of controlled wheels movement to obtain a specific trajectory.
The omnidirectional mobile robot Robotino®, developed by Festo and acquired in our research laboratory, represents an ideal mechatronic system for exploration and surveillance tasks and its capability can be extended to cleaning, manipulation and service tasks. Figure 3 shows the 3D model of the autonomous mobile agent [6].
Figure 3: Robotino mobile robot used for exploration tasks

International Conference 2ND International Conference on Innovations, Recent Trends and Challenges
in Mechatronics, Mechanical Engineering and New High-Tech Products Development
MECAHITECH‘10
Bucharest, 23-24 September 2010
389
Robotino® has a diameter of 370 mm, total height of 210 mm and the total mass of 11 Kg. Using three omnidirectional wheels, Robotino® can achieve a maximum speed of 10 [km/h]. For actuation three Dunkel DC motors with an encoder and a reducer are used to drive the agent. The transmission of movement to the omnidirectional wheels is through a toothed belt with a ratio of 1:4 or 1:16. A rubber band is mounted on the chassis as an integrated bumper sensor protection against collision, 9 infrared distance sensors, an analogue inductive sensor, 2 optical sensors and a color video camera with USB interface.
The autonomy is made using 2 batteries of 12 V mounted inside the chassis. The electronic hardware contains a 104 PC processor Linux kernel with real-time, 64 MB SDRAM, 128 MB Compact Flash card, Ethernet, two USB ports and two RS232, PS2 ports, parallel and VGA ports, wireless LAN and possibility of expansion through CAN bus card or PCMCIA adaptor.
Robotino View® is the graphical interface programming software based on block functions offered by Festo for the autonomous mobile agent Robotino®. This software can easily connect, through digital entries and exits, different parameters for development of complicated diagrams based on the functions obtained. These diagrams obtained on the functions can be used as subprograms for more complex sequence programming. Robotino View® can run on a PC / laptop in which creates programs for control. PC communication with the autonomous agent Robotino® is made through a server W-LAN which runs on Robotino®’s controller [7].
The developed prototype was constructed for surveillance tasks. It has 4 universal omnidirectional wheels mounted on a frame trough a specially designed clamping system (Fig.4) [8].
On the main frame the electronic board 3, a battery socket 8, a wireless video camera 6 with orientation system 5 and three optical distance sensors are mounted.
Figure 4: Omnidirectional mobile robot prototype
In figure 5 the omnidirectional wheel is rigidly mounted on the axle 9 trough screws 7 at one end. On the right end of the axle the DC motor 1 is mounted trough screw 2 and the assembly is connected to the main frame trough the connection element 11.

International Conference 2ND International Conference on Innovations, Recent Trends and Challenges
in Mechatronics, Mechanical Engineering and New High-Tech Products Development
MECAHITECH‘10
Bucharest, 23-24 September 2010
390
Figure 5: 3D model of the driving system
The driving and control system architecture is presented in figure 6. Three optical distance sensors are mounted at 1200 one from each other on the main robot frame and connected to the ADC ports of the controller electronic board. Based on the received signal from the sensors the main electronic board sends command signals to the four DC motors connected at the ports JA, JB, JE and JG. Feedback signals are given by four rotary encoders, obtaining the position of the robot in the given space based on the kinematics of the platform.
Figure 6: Control system architecture

International Conference 2ND International Conference on Innovations, Recent Trends and Challenges
in Mechatronics, Mechanical Engineering and New High-Tech Products Development
MECAHITECH‘10
Bucharest, 23-24 September 2010
391
The developed prototype is energetically autonomous, has a mass of 2300 g, diameter of 307 mm and a height of 100 mm. The maximum speed at 6V supply voltage for the DC motors is 0,4 m/s.
APPLICATIONS USING OMNIDIRECTIONAL MECHATRONIC SYST EMS
Applications of the developed prototype
The microcontroller ATMega64 is programmed using BascomAVR software which permits an easy programming language and development of applications on different levels of complexity. The developed application program executes a series of subroutines which are called using four switch electronic modules PmodSWT.
On three of the switch buttons, the controller will execute subroutines for applications of surveillance in different triangular, squared and hexagon areas. One switch button, when activated, will start the subroutine “Sensor” that will allow the robot to move avoiding obstacles found in the environment. Applications of Robotino® Omnidirectional Robot
Based on the multiple auxiliary components (sensors, video camera) applications were developed using RobotinoView, programming software specifically made for Robotino, also in LabView and Matlab programming software [7].
Figure 7: Exploration application for Robotino
The application from figure 7 is identical to the prototype developed application. It uses

International Conference 2ND International Conference on Innovations, Recent Trends and Challenges
in Mechatronics, Mechanical Engineering and New High-Tech Products Development
MECAHITECH‘10
Bucharest, 23-24 September 2010
392
nine similar distance sensors mounted around the robot’s circumference. The sensors can be programmed to keep a distance of 0-150 mm between the robot and an obstacle, allowing the robot to manage a dynamic environment.
CONCLUSIONS
Omnidirectional mobile robots have multiple applications because of their mobility and capacity to manage in a dynamic and congested environment. This paper presents two types of omnidirectional robots with three respective four wheels and applications in which they are used. The application presented in the paper has the aim analyze the differences between three and four wheel drive omnidirectional robots in respect with their design, mobility and control system. Three wheels drive omnidirectional robots do not have stability problems and the control system is not as complex as in the case of four wheel drive robots. One disadvantage for both robots is represented by the need of a complex suspension system design to allow movement on rough terrain.
REFERENCES
[1] Stuart, R., Novrig, P. “Artificial intelligence – A modern approach (The intelligent agent book)”, Prentice Hall, New Jersey, 1995.
[2] Siegwart, R. Nourbackhsh, I., Introduction to Autonomous Mobile Robots, The MIT Press, Massachsetts, 2004.
[3] AluŃei, A. and Mătieş, V. ”Aspects concerning the design, simulation and control of an autonomous mobile agent”, 1-st International Symposium on GREEN ENERGY, 14-16 may 2009, Tehnical University of Cluj – Napoca, Editura U.T.Press, pg 31-34, ISSN 2066-9577.
[4] AluŃei, A. and Mătieş, V., Tătar, M.O.,: ”Platformă mecatronică pentru studiul aplicaŃiilor cu agenŃi autonomi mobili – Partea I/II”, Lucrarile conferintei nationale de educatie tehnologica si tehnologii educationale, Conferinta Natională CNET&TE 2009, Cluj – Napoca 4-5 iunie 2009, Volumul 2, pag. 364, Editura Todesco, ISSN: 2066 – 446X
[5] Tătar, M.O., Mătieş, V., Mândru, D., “Mini şi microroboŃi”, Editura Todesco, Cluj–Napoca, 2005.
[6] Tătar, M.O., Mândru, D., AluŃei, A., ”Design and development of wheeled minirobots” Acta Technica Napocensis, pg. 571, Nr. 52, Volum 1b, Series: Applied mathematics and Mechanics, ISSN: 1221 – 5872,
[7] Festo Company, http://www.festo-didactic.com/int-en/learning-systems/education-and-research-robots-robotino/
[8] Scrob, A., “Proiectarea si realizarea unui robot omnidirectional cu patru roti” Lucrare de licenta, Universitatea Tehnică din Cluj-Napoca, 2010, (Prof. coord: Tătar Mihai Olimpiu).

International Conference 2ND International Conference on Innovations, Recent Trends and Challenges
in Mechatronics, Mechanical Engineering and New High-Tech Products Development
MECAHITECH‘10
Bucharest, 23-24 September 2010
393
Cellular Manufacturing with Kanbans Optimization
in Bosch Production System
Pedro Salgado, Leonilde R. Varela Department of Production and Systems, School of Engineering, University of Minho
Campus de Guartar, 4710-057 Braga, Portugal [email protected], [email protected]
ABSTRACT
Information sharing and optimization is a key factor for effective knowledge and work management, which is based on data exchange, communication and technological infrastructures and standardization, being essential in order to remain competitive in the today’s global market scenario. In this context, human functions are also relevant, and in this work we refer to the interaction of both in the optimization of Bosch Production System (BPS). Therefore, the aim of this paper consists on presenting the minimization of kanbans, when sharing this information in a proposed cellular manufacturing environment in Bosch production, in order to enhance workflows and material and work in process management as well as human interactions and production performance and productivity.
INTRODUCTION
Industrial management (IM) is concerned with the analysis and technical support of practices used in an organization to identify, create, represent and enable the adoption and leveraging of good practices embedded in organizational processes. Effective Industrial management is an increasingly important source of competitive advantage, and a key to the success of contemporary organizations.
IM focuses on some core components including: people, processes and technology and an important concern aims at taking an organizational focus, in order to optimize organization aspects and workflows.
In order to accomplish effective IM information sharing is a key element. Increasingly important information is enabled through kanbans technology implementation, and in this paper we aim at optimizing it, in order to enable an improved knowledge management scenario in Bosch production.
Information sharing and optimization is a key factor for effective Industrial management, which is based on data exchange, communication and technological infrastructures and standardization, being an essential element to remain competitive in the today’s global market scenario. In this context, human functions are also relevant, and in this work we refer to the interaction of both in the optimization of Bosch Production System (BPS). Therefore, the aim of this paper consists on presenting the minimization of kanbans, when sharing this information in a proposed cellular manufacturing environment in Bosch production, in order to enhance workflows and material and work in process management as well as human interactions.
Kanban, a Japanese word, means a board or card with visual information. In Toyota Production System (TPS) kanbans are used to conduct the information flows in the manufacturing system in order to pull the material flows from upstream to downstream. The

International Conference 2ND International Conference on Innovations, Recent Trends and Challenges
in Mechatronics, Mechanical Engineering and New High-Tech Products Development
MECAHITECH‘10
Bucharest, 23-24 September 2010
394
operations of various types of kanban systems were documented thoroughly by Monden, in 1993, and published even before the TPS has caught the attention of the majority of U.S. manufacturers [1].
Summarizing the main purpose of this paper consists on highline several kind of advantaged that were obtained throughout the implementation of diverse actions carried out with this work. The main aspects are related to work in process (WIP) and inventory costs reduction, throughout the minimization of the number of kanbans necessary in Bosch Production System, under the scope of Lean and Just-in-time (JIT) production principles. Another important concern was about the manufacturing environment, with a proposal of a cellular manufacturing system scenario, instead of the previously existing flow shop system. As a consequence, some important improvements were possible to reach in the BPS, by enhancing the production flow and consequently the production tasks management. Moreover, materials acquisition and storage were also focused, being optimized and material handling and control simplified.
In order to better summarize the contents of this paper, it is structured as follows: next, some main aspects about Lean and JIT management and related technologies are sensitized. After, a brief literature review about some work carried out in these areas is presented and then the implementation of kanbans and related technologies in Bosch production is briefly described and some important advantages are pointed out by comparing the proposed scenario with the BPS existing one. Finally, some conclusions are reached.
LEAN AND JIT MANAGEMENT
Levy [2] defines lean production as "a tightly coupled flexible system" centered on JIT, delivery and low inventories. To achieve this requires the elimination of defects, supply production problems and other delays in the product pipeline. It also requires high levels of responsiveness to changes in demand from customers. To this end, continuous improvements are necessary in component quality, in production control, reduction of lead times (as well as lot sizes and set-up times) and shortening of product development cycles.
To work effectively lean production requires a high coordination between suppliers and customers, rapid flows of products and information and JIT deliveries.
It is difficult for a modern manufacturing system to make the many different kinds of available products in low quantities, with high quality and low cost at just the right time. Moreover, in order to survive in the global competitive market manufacturing enterprises must increase their productivity and profitability through greater shop floor agility. As the manufacturing environment from mass production through to flexible and lean manufacturing moved towards an agile manufacturing philosophy, there was a drastic impact on all manufacturing-related activities [3, 4]. Therefore, manufacturing systems must adapt themselves at an ever-increasing pace to incorporate new information technology and new products as well as new organizational architectures.
A kanban system facilitates lean principles in a simple and effective way. While reportedly successful in many manufacturing firms, the conventional kanban systems using physical cards suffer from human errors, limited tracking capability, and so on. To make the information flow leaner, software providers add new features to their existing programs for manufacturing systems to computerize kanban activities. As Web-based technologies advance rapidly, developing an entirely Web-based kanban system appears to be feasible

International Conference 2ND International Conference on Innovations, Recent Trends and Challenges
in Mechatronics, Mechanical Engineering and New High-Tech Products Development
MECAHITECH‘10
Bucharest, 23-24 September 2010
395
and promising. Kidd [3] established that a kanban system typically performs efficiently and effectively
in shop floor control when the demand is repetitive and stable. It also applies to adjacent suppliers, customers, and even within a global supply chain to facilitate JIT delivery [4].
In the past decade, lean manufacturing concepts have shown significant influence in the way jobs are performed. Eliminating non-value added activities in response to customer’s true demand, i.e., value, makes manufacturers leaner and eventually stronger in the marketplace.
Levy [2] summarized lean thinking into value, value stream, flow, pull, and perfection. Among them, the pull concept is the key to carrying out a smooth flow of value stream. It aligns production targets throughout the system with end customer’s demand and hence minimizes inventory and work-in-process (WIP).
As lean manufacturing gains popularity globally, the impact of implementing pull or kanban system becomes clearer. Mortimer, in 2008, [5] summarized the major advantages of implementing pull system, including: (1) shorter lead time, and hence, higher flexibility to demand changes; (2) reduced levels of inventory and other wastes: (3) capacity considerations that are restricted by the system design, and (4) inexpensive to implement. Moreover, Hirano, in 2009, [6] compared the pull-and-push systems in terms of production planning and control and concluded that pull system is more efficient, easier to control, more robust, and more supportive of improving quality. In general, implementing kanban system for pull concept contributes to a higher level of customer satisfaction by providing products with lower cost, shorter lead time, and more stable quality, while the supplier enjoys a more manageable production environment with lower WIP and inventory.
From the viewpoint of implementing kanban system in practice, the “paper card” system is known to be simple and effective, and requires little investment.
Fax and e-mail are commonly used as the means of dispatching kanbans among distant sites, when delivering physical kanban is no more considered efficient. For production control, the number of kanban can be adjusted within a range to meet the capacity requirements. Using demand leveling, the pull system remains stable when demand fluctuates in a certain range. When the product variety, demand fluctuation, capacity requirement, or distance between facilities drops out of the acceptable range, the kanban system becomes too complicated and difficult to manage. As a result, mistakes arise, and significant workforce can be wasted on managing and maintaining the kanban system.
Beside the effectiveness of information delivery, visibility is another critical issue of the paper-based kanban system. Within a workstation or production cell, the conventional kanban system enhances visibility of workflows by the paper cards.
“Seeing” the flow of value stream is the key for building a lean system. Information technologies provide the tools that can greatly enhance the visibility of a kanban system. Therefore, e-kanban system with real-time data transaction and monitoring becomes the natural solution for eliminating the weaknesses of the kanban systems.
While reportedly successful in many manufacturing firms, the conventional kanban systems using physical cards suffer from human errors, limited tracking capability, and so on. To make the information flow leaner, software providers add new features to their existing programs for manufacturing systems to computerize kanban activities. As Web-based technologies advance rapidly, developing an entirely Web-based kanban system appears to be feasible and promising.
Ohno [7], Monden [1], and Slack [8] stated that a kanban system, when well applied in

International Conference 2ND International Conference on Innovations, Recent Trends and Challenges
in Mechatronics, Mechanical Engineering and New High-Tech Products Development
MECAHITECH‘10
Bucharest, 23-24 September 2010
396
organizations has as main advantages: eliminating waste, enhancing control levels in the shopfloor, through the decentralization and simplification of operational processes; lead time reduction; improvement of the company’s reactive capacity to its clients; stock level adjustment to regular oscillation of demand; reduced WIP stock; elimination of intermediate and safety stock; and production lot size reduction and all these aspects and advantages motivated carrying out this work.
JIT and Kanban calculation
The “Just-in-time” or simply JIT production system is a market-oriented production system that rests entirely on the foundation of serving client needs. JIT refers to the timing of production flow; goods are delivered to the manufacturing lines just in time to be used, just in the immediately quantities and just to the production process that need them. Saying "in time" is not enough, since parts can arrive at processes a week or to two prior to their use and still be there "in time". That is why the most important word in JIT is the first word "just". Goods need to arrive within minutes, not days or weeks, of their use on the production line. Only then can we eliminate waste in such forms as overproduction, waiting for late deliveries and excess inventory [6].
In the literature several different kanbans calculation formulas exist, namely the ones put forward by Shingo [9], and Monden [1].
In the opinion of Shingo [9], the determination of the number of kanbans is far away from being as important as the improvement of the production system in order to minimize the number of kanbans. Shingo [9] presents a simple formula for the determination of the number of kanbans necessary, as follows:
1)
K = number of kanbans; Q = quantity of products in batch production; α = minimum security stock level; n = quantity of products transported on a pallet. Monden [1] presented a wider formula for kanbans calculation:
2)
k = number of kanbans; d = demand on the planned period; te = waiting time, defined from the time since the necessity of production is defined until effective production starting time; tf = time it takes to produce a container (one kanban) of products; β = safety factor (around 15%); c = container capacity.
LITERATURE REVIEW
In the late 1980s and early 1990s, researchers started to intensively investigate the mechanism and benefits of kanban systems. Various studies were carried out, such as

International Conference 2ND International Conference on Innovations, Recent Trends and Challenges
in Mechatronics, Mechanical Engineering and New High-Tech Products Development
MECAHITECH‘10
Bucharest, 23-24 September 2010
397
simulation analysis, analytical modeling, system re-design, and so on [8, 10]. Various types of kanban systems and related techniques have been developed at
Toyota [1, 9]. The system can be applied internally on a shop floor and also externally between distant facilities.
E-kanban systems have been developed based on existing enterprise resources planning (ERP) systems, electronic data interchange (EDI) connections, and web-based technology [4, 11, 12]. In order to support the kanban activities, providers of ERP systems started to extend their products with pull or kanban modules. A few other e-kanban systems have also been developed recently by software providers, including Datacraft Solutions, eBots, SupplyWorks, among others [1].
Even Toyota, the creator of the kanban system, has adapted an e-kanban system for sending external pulling signals to distant suppliers [7].
The paper presented by Ming P. Tsai and James T. Lin, in 2004, [12] presents advantages, limitations, and challenges of web-based kanban systems. They developed an experimental program based on popular web programming platform and technology, based on PHP + MySQL. The server-executed program features cross-platform compatibility, real-time tracking and performance monitoring, and greatly enhanced information contents compared to physical kanbans. Therefore, human errors were minimized by the automated transactions; nevertheless, the interfacing and data maintenance still required further research efforts [13].
Rothenberg, in 2004, [14] reported that some printing companies that implement the Lean Production methods have been successful using the 'pull' or kanban in some specific segments of their business. Generally, in business it is important to implement a kanban system to produce only the quantity ordered, and managing production under Just-in-time principles.
Lean and JIT technology can also greatly profit from cell systems and Hyer [13] collected data on 20 U.S. firms. A detailed questionnaire was employed to gather information on the costs and benefits of cellular manufacturing. A large majority of the respondents reported that the actual benefits from implementing cellular manufacturing met or exceeded their expectations. Specific savings generally occurred in reductions of lead times, throughput times, queuing times, setup times, work in process, labor costs, material handling costs, and in easier process plan preparation.
BPS AND KANBANS
The main activity of Bosch Car Multimedia Portugal, S.A. consists on the production and assembly of car-radios. The production process of this enterprise is, in general, divided in two main areas: An upper level, composed by the automatic insertion area of components and an area for storing the material needed in this area.
The lower level is composed by the manual components insertion area and by several storage areas.
The automatic components insertion area integrates several assembly lines, which are dedicated to the production of Pressed Circuit Boards (PCB), namely: Main Boards, Switch Boards, Antennas and Tuners.
The production process starts in the automatic components insertion area, where the automatic assembly of the PCBs takes place, after which it passes to the final assembly,

International Conference 2ND International Conference on Innovations, Recent Trends and Challenges
in Mechatronics, Mechanical Engineering and New High-Tech Products Development
MECAHITECH‘10
Bucharest, 23-24 September 2010
398
where the manual components insertion process is carried out in PCBs.
Existing scenario
The production programming is performed in the Bosch Production System (BPS) in two steps. First an annual plan is established and next a monthly based plan is prepared. Based on these plans, the daily production programming is determined in detail. The information about the daily production programming is managed by the kanban system, by using information cards. Through this system, which is based on pull production principles, the previous process produces just the quantity to be used in the subsequent process, therefore, eliminating the necessity of planning the production on all production processes and thus avoiding overproduction.
In the BPS, the type of kanbans used for caring out this work was the cards attached to the material containers.
The material received from the storage area is removed from the supplier package and put in standard boxes, which are passed to the production lines by the “Milkrun”. The kanban card goes attached to the boxes, identifying them.
In the entry point of each production line, in the automatic components insertion area there is a kanbans board, as illustrated in Figure 1, where the batches of each product are defined and a rule about production planning.
Figure 32: Kanban board
This kanbans board is divided into three important areas. One area refers to the
composition of the batch for each product, indicated by “A”. Another is the kanbans buffer (“B”) and finally the planning ruler, indicated by “C”.
The kanban systems works as follows: first each time kanbans arrive to the board, coming from production they are inserted in the batch composition area of the corresponding product.
Next, at the time the number of batches is reached, i.e., when this area is full, for a given product, the cards are placed in an existing box (buffer). In this same box there is a red line, and once it is reached indicates that someone responsible has to pay attention to this information (Figure 2).
A
B
C
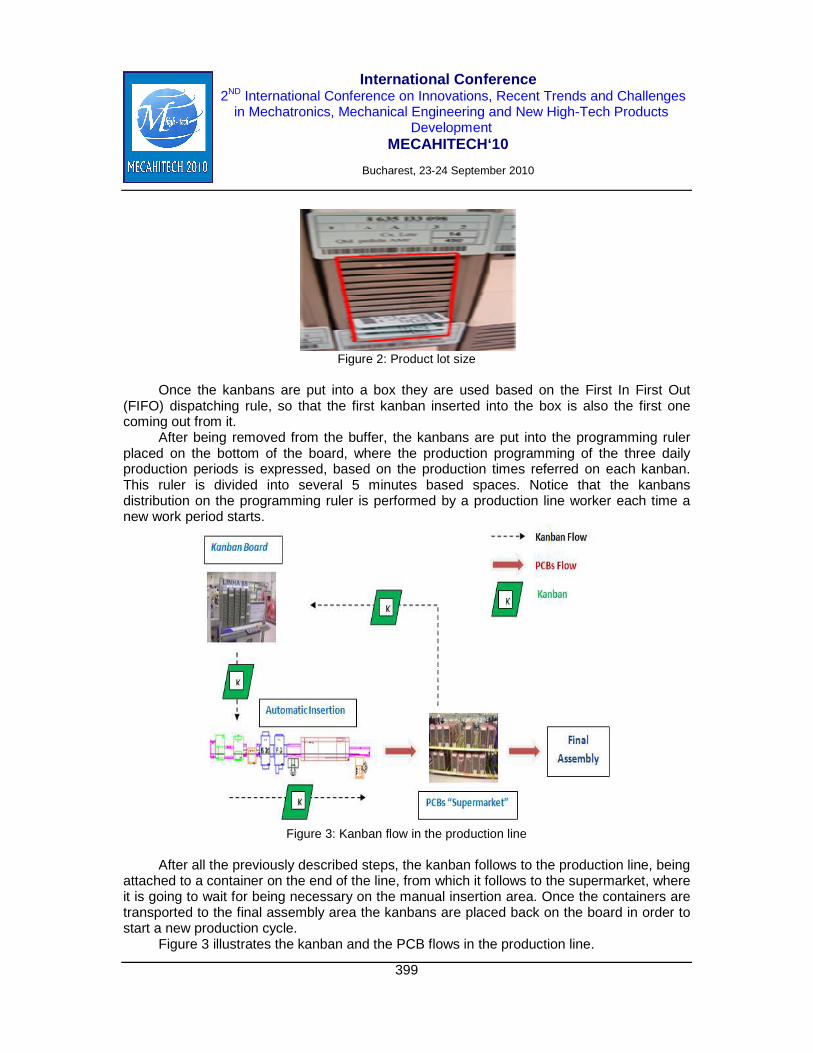
International Conference 2ND International Conference on Innovations, Recent Trends and Challenges
in Mechatronics, Mechanical Engineering and New High-Tech Products Development
MECAHITECH‘10
Bucharest, 23-24 September 2010
399
Figure 2: Product lot size
Once the kanbans are put into a box they are used based on the First In First Out
(FIFO) dispatching rule, so that the first kanban inserted into the box is also the first one coming out from it.
After being removed from the buffer, the kanbans are put into the programming ruler placed on the bottom of the board, where the production programming of the three daily production periods is expressed, based on the production times referred on each kanban. This ruler is divided into several 5 minutes based spaces. Notice that the kanbans distribution on the programming ruler is performed by a production line worker each time a new work period starts.
Figure 3: Kanban flow in the production line
After all the previously described steps, the kanban follows to the production line, being
attached to a container on the end of the line, from which it follows to the supermarket, where it is going to wait for being necessary on the manual insertion area. Once the containers are transported to the final assembly area the kanbans are placed back on the board in order to start a new production cycle.
Figure 3 illustrates the kanban and the PCB flows in the production line.

International Conference 2ND International Conference on Innovations, Recent Trends and Challenges
in Mechatronics, Mechanical Engineering and New High-Tech Products Development
MECAHITECH‘10
Bucharest, 23-24 September 2010
400
The kanban system is an information system to control harmoniously the production quantities in every process [1].
The term kanban has sometimes been used as being equivalent to “JIT planning control” or even to the whole of JIT, However, kanban controlled is a method for operationalizing a pull-based planning and control system. It is sometimes called the “invisible conveyor”, which controls the transference of material between the stages of operations [8]. Figure 4 shows a kanban card used in BPS.
Figure 4: Kanban example Shingo [9] stated that the determination of the number of kanbans is yet very far away
from being as important as the improvement of the production system in order to minimize the number of kanbans.
Besides that, several formulas have been put forward for determining the number of kanbans which consider forecast factors, namely demand forecast, and also products processing and waiting times between processes.
The BPS formula used to calculate kanbans (K) is as follows:
(3)
Where, RE = (PR×RTloop) / (NPT×SNP) (4)
, If LS>SNP
(5)
, Only if WA>LS, else WI=0
(6)
(7)
(8)
Being,

International Conference 2ND International Conference on Innovations, Recent Trends and Challenges
in Mechatronics, Mechanical Engineering and New High-Tech Products Development
MECAHITECH‘10
Bucharest, 23-24 September 2010
401
RE - replenishment time coverage LO - lot size coverage WI - withdrawal peak coverage TI - time gap coverage SA - safety coverage Tc - shift time model of customer (minutes); Ts - shift time model of supplier (minutes). PR – requirement per period [pieces/period]; RT loop – replenishment lead time [minutes]; NPT – working time [minute/period]; SNP – standard number of parts per kanban [pieces]; LS – lot size [pieces]; WA – withdrawal amount [pieces/period]; ST – safety time (hours); In order to illustrate the kanban calculation let us consider an example about a PCB
product, which we are going to refer as “Type I”. The daily based requisites (PR) of this product are around 1560 units /day, which corresponds to the quantity that BPS has to produce on a daily basis.
The standard number of pieces (SNP) is 120 units. This means that one box with 120 units will correspond to a kanban.
Production is based on a model that includes three work periods per day (24 hours = 1440 minutes), including intervals of 90 minutes (including breaks) and intervals of 187 minutes, including stopping periods, namely due to line stopping, due to technical problems or related to quality requisites. This conducts to an effective net production time (NPT) of 1163 minutes (1440 min – 90 min – 187 min = 1163 min).
The processing time of one piece is 30 minutes and the production line cycle time is 15 seconds.
Let us consider a client that needs the product type I every day. So, the quantity removed within the period (WA) for the products are: 1560 units/ day. The recharging time (RT loop) for the product type I is of 830 minutes.
Table 1 presents the values previously referred.
Table 1 Product type I main values (a)
Based on the values presented in Table 1 we can now calculate the values of RE (replenishment time coverage), LO (lot size coverage), WI (withdrawal peak coverage), TI (time gap coverage) and SA (safety coverage), shown in Table 2.
Table 2 Product type I main values (b)

International Conference 2ND International Conference on Innovations, Recent Trends and Challenges
in Mechatronics, Mechanical Engineering and New High-Tech Products Development
MECAHITECH‘10
Bucharest, 23-24 September 2010
402
The time gap coverage (TI) is zero, due to inexistence of difference between the time
shift model of the customer (Tc) and the supplier (Ts). The value of withdrawal peak coverage (WI) is also zero once the quantity removed in the periods; the withdrawal amount (WA) is the same as the lot size (LS).
Therefore, we have 35 kanbans for the product type I and 33 kanbans of product type II.
Based on a demand on the first month of 24.780 units, the number of kanbans necessary at the end of the month will be 554 units. Next we present a graphic expressing the number of kanbans necessary at the end of each month on a six month period planned (Figure 5).
Figure 5: Number of kanbans for six months At the end of the six months period the total number of kanbans necessary was 2.936
kanbans. Moreover, at the entry point of each production line, in the automatic insertion area is
planned to exist a laser machine for printing codes (bar code 1D and data matrix code 2D). In the existing scenario only three lines are already integrating the laser machine, but in the future, in order to enable the BPS to satisfy the total demand, a total of 12 lines, and each one integrating a laser machine will be necessary to implement. These codes are important for enabling the operators to identify the PCBs, in the ongoing processing along the processing system, and in the screening and programs selection on machines in the automatic and in the manual insertion areas, therefore contributing to the improvement of production control and to the final product quality.
These lines are characterized as common production lines, where the product enters on the beginning of the line and subsequently passes from one work centre to the next one, without skipping or re-entering any one, and maintaining, therefore, a typical straight forward production flow [14, 15].
Due to some relevant inconveniences detected on the existing BPS lines there was a need to propose another kind of production system to supply the automatic insertion area,

International Conference 2ND International Conference on Innovations, Recent Trends and Challenges
in Mechatronics, Mechanical Engineering and New High-Tech Products Development
MECAHITECH‘10
Bucharest, 23-24 September 2010
403
which is going to be described in the next section. Figure 6 shows the location of the production lines, which are 7 and each one includes the laser machines as well as a common local stockage area. Figure 7 ilustrates the corresponding kanban-line system layout.
Figure 6: Production line phases
Figure 7: Kanban-line system layout

International Conference 2ND International Conference on Innovations, Recent Trends and Challenges
in Mechatronics, Mechanical Engineering and New High-Tech Products Development
MECAHITECH‘10
Bucharest, 23-24 September 2010
404
Proposed scenario
The existing BPS scenario composed by production lines revealed some significant disadvantages for the company, namely in terms of the high investment that had to be made for acquiring the 12 laser machines. Another disadvantage about the lines arises from the lack of flexibility of those production systems, as they do not enable to rapidly adapt to changes in order to satisfy different kind of client demands and different products, and the consequent changes on the product design and processing requirements [15].
Another problem arises from the fact that if one machines stops working this may cause the complete production stopping [8].
Therefore, we presented a new proposal, which considers modifying the production system to a cellular manufacturing system. In this kind of system instead of having one laser machine per line, and 12 lines, we only have to integrate 7 lines, disposed as a cell, and the corresponding 7 laser machines. So, we reduce in 5 lines and 5 laser machines, in the new proposed scenario. Therefore, the company has to buy only 4 new laser machines, to complete the 7 necessary for serving the automatic insertion area, as 3 of them does already exist. So, in case of maintaining the production lines scenario the company would have to buy more 9 laser machines, instead of 4, which would represent a big investment requirement.
The proposed cell configures typical characteristics of manufacturing cells, including some typical aspects that characterize the so called just in time cells (JITC) and the quick response manufacturing cells (QRC).
The JIT cells are well known under the scope of JIT principles and objectives, namely, zero defects, zero setup times, zero stocks, zero extra manipulations, zero breakdowns, and zero deadlines and also unit lot sizes [16].
Nowadays it is convenient to use JIT cells, as they are wel suited for integrating group technology features and principles [17], therefore, being able to adapt very well to products families production, which is quite adequate in the BPS, in order to fulfil the requirements of producing PCBs product families. PCBs belonging to a same family share several kind of similarities, namely related with, processing and manipulation requirements, up to geometrical and dimensional and/ or materials related similarities.
Once BPS faces a growing necessity to satisfy a wider range of product specifications and differences, it turns out increasingly more important to be able to easily and fast adapt and change the production system and processes in shorter time periods and this flexibility and quick response are some of the most relevant characteristics enabled by manufacturing cells (MC) [13]. Moreover, MC also enable reaching better product quality levels at the same time as productivity is maintained at competitive levels and material transportations and stock levels are minimized [16]. Figure 8 shows the proposed cellular manufacturing environment.
Regarding the relation with clients, this kind of manufacturing environment also suits very well, as manufacturing cells are based on quick time models, which aim at enabling reduced production and delivery times of products combined while offering a widened range of product differences, in order to meet the costumers needs and product specifications, in increasingly more reduced due dates [8, 17].
The proposed layout for the automatic insertion area is presented in Figure 9 and shows the location of the proposed manufacturing cell. As we can observe, this proposal led to the need of an additional area of about 529 m2, for implementing the cell.

International Conference 2ND International Conference on Innovations, Recent Trends and Challenges
in Mechatronics, Mechanical Engineering and New High-Tech Products Development
MECAHITECH‘10
Bucharest, 23-24 September 2010
405
Figure 8: Manufacturing cell
Figure 9: Automatic insertion area layout
When the final assembly needs material coming from automatic insertion area the
containers placed in the stockage area, located at the end of the automatic insertion lines are transported, through milkruns, to the final assembly, were the final PCBs processing step takes place. Therefore, only when the containers are transported to final assembly kanbans are released in order to go back to the kanbans board and start a new cycle.
In a similar way, when the automatic insertion area requests material to the cell the materials grouped in the local storage area (the so called supermarket) located at the end of the manufacturing cell, are transported to the lines, where the automatic components insertions in the PCBs takes place. Therefore, every time a kanban returns from the supermarket to the board it is incorporated in the corresponding product area in order to constitute a new product batch. Once the product batch level is reached the corresponding

International Conference 2ND International Conference on Innovations, Recent Trends and Challenges
in Mechatronics, Mechanical Engineering and New High-Tech Products Development
MECAHITECH‘10
Bucharest, 23-24 September 2010
406
cards (kanbans) are put on its buffer, which is a box, where the cards are being removed accordingly to the FIFO rule.
After being removed from the buffer, the kanbans are placed into a programming ruler, located at the bottom of the kanban board, where the production programming is establisher for a rage of three daily working periods, based on the production times referred on each kanban. After leaving the programming ruler the kanban follows through the whole line and cell being attached to a container at the end of the line and the cell and moving towards the supermarket, where it waits until it is necessary in the automatic and in the manual components insertion areas.
Figure 10: Cell kanban system
In order to enable to establish a better data comparison the same PCBs example used
for the line case is going to be used for the proposed cellular manufacturing case (Figure 10). In the proposed scenario only the NPT and the RT loop values are different. This is due
to proposed manufacturing cell environment, which enables setup and processing time’s reduction. Therefore, the net production time (NPT) increases but the replacement time reduces and, so, at the end we obtain a reduced product processing time (25 minutes) and cycle time (9 seconds), as shown in Table 3.
Table 3 Cell parameters calculation

International Conference 2ND International Conference on Innovations, Recent Trends and Challenges
in Mechatronics, Mechanical Engineering and New High-Tech Products Development
MECAHITECH‘10
Bucharest, 23-24 September 2010
407
With these values we were able to calculate the associated RE, LO, WI, TI and SA values as follows.
Table 4 Cell kanbans calculation
As we can observe in Table 4, the number of kanbans reduced from 35 kanbans to 30
kanbans. This corresponds to reducing 5 kanbans per day and, therefore, a reduction of 100 kanbans per month (20 working days), maintaining the product demand. Thus, in a range of 6 months we are able to obtain a significant reduction of around 600 kanbans.
The kanbans reduction is due, on one hand, to the increase on the NPT and to the reduction on the cell replenishment time.
Ohno [7] referred that the number of kanbans reduction led to the reduction of the intermediate and final stocks levels, enabling a better adjustment to the regular demand variation. Moreover, Shingo [9] stated that eliminating stocks reduces down to 40% on labour costs.
For the proposed cell scenario the same forecast analysis was carried out as for the line case, based on the same product data, covering a range of 6 months, and the results obtained are expressed in Figure 11, which shows that at the end of this planned period a total of 2.581 kanbans was obtained.
Figure 11: Number of kanbans in the proposed cell
Comparing the results obtained for the proposed cellular manufacturing system with
the existing line system we can observe that the total number of kanbans reduced significantly. At the end of the six months period analysed, the number of kanbans reduced from 2.936 in the line scenario down to 2.581 (less 355 kanbans) in theproposed cellular manufacturing system scenario.
In Figure 12 we can observe the variations of the number of kanbans, along the six month period planned, in both scenarios simultaneously for enabling a better comparison. Therefore, we were able to obtain a reduction of around 12 % on the number of kanbans necessary in the proposed cell scenario at the end of the six months (from 2.936 to 2.581). This is mainly due to the increase of the net production time (NPT) and to the reduction of the replenishment time (RT loop) in the proposed manufacturing cell.

International Conference 2ND International Conference on Innovations, Recent Trends and Challenges
in Mechatronics, Mechanical Engineering and New High-Tech Products Development
MECAHITECH‘10
Bucharest, 23-24 September 2010
408
Figure 12: Total number of kanban comparison
As shown in Figure 12 it is expectable that product demand suffers some variations
from month to month. Therefore, when a demand increase occurs is it normal to also have an associated increase on the number of kanbans necessary, and vice versa. Ohno [7] stated that fluctuations of around 10 to 30% may be managed without significant changes on the number of kanbans necessary. Nevertheless, the real implementation is the most reliable indicator and the kanbans calculations will change accordingly to the company’s nature.
On the other hand, regarding the production system itself, Black [15] already stated that the main advantage, even in terms of the umber of kanbans, arises from the implementation of cellular manufacturing systems, instead of production lines, mainly due to it’s increased flexibility, i.e., the greater capacity that this kind of production system presents to quickly react to changes, namely the ones caused by externally imposed changes, where variations on the demand is included, and also internal ones, related to product project changes and changes due to an increased variety of products.
The advantages derived from cellular manufacturing in comparison to traditional manufacturing systems, in terms of system performance, have been widely discussed by Askin et al [10] and Singh [16]. These benefits have been established through simulation studies, analytical studies, surveys, and actual implementations and they can be summarized as follows:
Setup time is reduced. A manufacturing cell is designed to handle parts having similar shapes and relatively similar sizes. For this reason, many of the parts can employ the same or similar holding devices. Generic fixtures for the part family can be developed so that time required for changing fixtures and tools is decreased.
Lot sizes are reduced. Once setup times are greatly reduced, small lots are possible and economical as well as a smoother production flow.
Work-in-process (WIP) and finished goods inventories are reduced. With smaller lot sizes and reduced setup times, the amount of WIP can be reduced. Askin et al [10] showed that the WIP can be reduced by 50% when the setup time is cut in half. In addition to reduced setup times and WIP inventory, finished goods inventory is reduced. Instead of make-to-stock systems with parts either being run at long, fixed intervals or random intervals, the parts can be produced either just-in-time in small lots or at fixed, short intervals.
A reduction in flow time is obtained. Reduced material handling time and reduced setup

International Conference 2ND International Conference on Innovations, Recent Trends and Challenges
in Mechatronics, Mechanical Engineering and New High-Tech Products Development
MECAHITECH‘10
Bucharest, 23-24 September 2010
409
time greatly reduce flow time. Tool requirements are reduced. Parts produced in a cell are of similar shape, size, and
composition. Thus, they often have similar tooling requirements. Throughput times are reduced. In a job shop, parts are transferred between machines
in batches. However, in CM each part is transferred immediately to the next machine after it has been processed. Thus, the waiting time is reduced substantially.
As a result of these characteristics, product quality is also improved: As the parts are transported individually from one work center to another within the cell, the feedback is immediate and the process can be stopped whenever any errors may occur.
CONCLUSION
Summarizing the above results presented with the study performed we may highline that several kind of advantages were able to be reached throughout the implementation of the proposed work. These advantages are mainly related to WIP and inventory costs reduction, throughout decreasing the number of kanbans necessary, under the scope of Lean and JIT production principles, with are being used in Bosch Production System.
Another important improvement obtained was due to the proposed cellular manufacturing system scenario, instead of the existing line system. Therefore, it was possible to enhance the production system, by improving the production flow and consequently the production tasks management. Moreover it was possible to simplify materials acquisition and storage. Besides that, material handling and control were also simplified.
As a final conclusion we may state that kanbans sharing and minimization was possible through a manufacturing system layout change and improvement, by transforming lines to cellular manufacturing system. Thus, improving several other related aspects in the BPS, related to a better production system arrangement and materials and production flow, also enabling to facilitate the production planning and control tasks and material acquisition, storage, manipulation and control. Moreover, this study consisted on another contribution in terms of the Lean, JIT and kanban considerations showing that the implementation of these principles enabled to better control production process, having also enabled better tasks performance and enhanced productivity and production quality in the corresponding manufacturing environments, by having enabling better work integration among operators, through a closer interaction and information and responsibility sharing, which was a clear achievement within the proposed manufacturing cell. As a consequence, reduced production time and material and WIP flows were also reached, through the reduction of waste and distances between work centres within the manufacturing system, which was also visible in the proposed cellular manufacturing environment.
REFERENCES
[1] Monden, Y. 1993. Toyota Production System: An integrated approach to Just-In-Time, Industrial Engineering and Management Press, 2 Ed, 423.
[2] Levy, D.L. 1997. Lean production in a international supply chain. Sloan Management

International Conference 2ND International Conference on Innovations, Recent Trends and Challenges
in Mechatronics, Mechanical Engineering and New High-Tech Products Development
MECAHITECH‘10
Bucharest, 23-24 September 2010
410
Review.
[3] Kidd, P.T. 1995 Agile manufacturing – forging new frontiers. Addison-Wesley, Wokingham, England, UK.
[4] Cheng, K., Harrison, D.K., Pan, P.Y. 1998. An internet based architecture of implementing design and manufacturing agility for rolling bearings. J Mater Process Technology 76(1–3):96–101.
[5] Mortimer, A. L. 2008. A continuing lean journey: an electronic manufacturer’s adopting ok kanban. Assembly Automation, 28/2, 103-112.
[6] Hirano, H. 2009. JIT Implementation Manual - The Complete Guide to JIT Manufacturing: Vol 1 - The JIT Production System, CRC Press, 5 Ed, 192.
[7] Ohno, T. 1988. Toyota Production System: Beyond Large-Scale Production, Productivity Press, 143.
[8] Slack, N., Chambers, S. and Johnston, R. 2007. Operations Management, Pearson Education, 5 Ed, 728.
[9] Shingo, S. 1989. A study of the Toyota Production System from an Industrial Engineering viewpoint, Productivity Press, 257.
[10] Askin, R. G. and Standridge, S. R. 1993. Modeling and analysis of manufacturing systems, John Wiley and Sons, 461.
[11] Wan, H. and Chen, F.F. 2007. A Web-based kanban system for job dispatching, tracking and performance monitoring. International Journal Advanced Manufacturing Technology, 38:995-1005.
[12] Ming P. Tsai, James T. Lin. 2004. A web-based control system. Springer-Verlag, London.
[13] Hyer, N. 1984. The potential of group technology for U.S. manufacturing. Journal of Operations Management, 4(3):183-202.
[14] Baker, K. R. and Trietsch, D. 2009. Principles of Sequencing and Scheduling, John Wiley and Sons, 493.
[15] Black, J. T. 1991. The design of the factory with a future, McGraw-Hill, 233.
[16] Singh, N. and Rajamaani, D. 1996. Cellular Manufacturing Systems: Design, Planning and Control, Chapman and Hall, 277.
[17] Suri, R. 1998. Quick response manufacturing: a companywide approach to reducing lead times, Productivity Press, 544.

International Conference 2ND International Conference on Innovations, Recent Trends and Challenges
in Mechatronics, Mechanical Engineering and New High-Tech Products Development
MECAHITECH‘10
Bucharest, 23-24 September 2010
411
Bond Graph based model of the fluidic actuators
Rareş Ciprian Mîndru, Vistrian Mătieş, Adrian Ioan Cosma
Technical University of Cluj-Napoca, Faculty of Mechanics, Department of Mechanisms, Precision Mechanics and Mechatronics,
B-dul Muncii nr. 103-105, Cluj-Napoca, Romania, [email protected], [email protected]
ABSTRACT
The paper presents 2 types of mathematical models of pneumatic actuator based system. One of them is a “traditional” analytical model based on differential equations that describes the dynamic of the system’s components. The other is called Bond Graph model which is a method that uses graphical elements that integrates the energy flow in typified elements despite the type of that energy. Mechatronic design involves, besides the conceptual stage, the parallel development of virtual and effective prototyping processes, which can confirm the veracity of approaches. The analytical based model design is an approach which reduces time and costs of the design, allowing engineers to analyze and test a model to be equated to the actual behavior. The result of this way of working is a fully optimized and tested without the risk that some components will not function optimally in the system.
INTRODUCTION
Bond graph modeling method is based on the energetic flow method. Energy is the basic element in a system regardless of his type. A system can be supplied from one or more sources, the energy that flows through the system elements can be stored in certain components or partial dissipated trough resistances as heat, and then transmitted to the effectors [8],[9].
PNEUMATIC SYSTEM ANALYTICAL MODEL
The mathematical analysis of pneumatic systems has received an important attention. The model studied, proposes nonlinear characteristics analysis and for that were integrated into calculations the residual volume and uneven distribution of friction forces. Analysis of the dynamic behavior of pneumatic system requires relationships that characterize the dynamic features of 3 elements: the valve, the pneumatic actuator and the load [1],[3],[6],[7].
( )ePsPaPfaXawCdCsRTaV
kaP
aV
aVkaP ,,0+−=
&& (1)
( )ePsPbPfbXawCdCsRT
bV
kbP
bV
bVk
bP ,,0+−=&
& (2)

International Conference 2ND International Conference on Innovations, Recent Trends and Challenges
in Mechatronics, Mechanical Engineering and New High-Tech Products Development
MECAHITECH‘10
Bucharest, 23-24 September 2010
412
xMbPaPxSxcsKxfKbPbAaPaA &&&& =−−−− ),,()( (3)
Flow mass “m” relationship between the two ports of the valve, is written according to
the movement of the drawer and the chamber pressure. It can be written relations for mass flow that supplies the cylinder based on the energy conservation principle applied to the cylinder of limited volume.
Figure 33: The pneumatic system scheme
Where x& represents speed, x&& acceleration, fKviscous friction coefficient and )(xK cs−
is the combination of static and coulombian frictions. The compressed air volume (that is sent through the valve’s and actuator’s ports)
energy, is equal to the displacement mass energy, but related only to a adiabatic process.
CONCEPTS AND BASIC ELEMENTS OF THE BOND GRAPH METHO D
Power represents the energy flow value [8],[9]. This method uses arrows (figure 2) to indicate the value and direction of the energy flow, so power variable is materialized by one
flux variable and one effort variable. feP ⋅= ; e – effort variable, f – flux variable. Table 1 shows these variables for different types of systems. The arrow orientates the bond from A to B, that indicates that the power is supplied by the A element and is received by the B element.
A Bfe
A B
(a)
P = e f
(b) Figure 2: Bond representation

International Conference 2ND International Conference on Innovations, Recent Trends and Challenges
in Mechatronics, Mechanical Engineering and New High-Tech Products Development
MECAHITECH‘10
Bucharest, 23-24 September 2010
413
Table 1 Effort and flux variable for different types of systems System type Effort
variable Flux
variable Power
expression Mechanical-translation
system Force(F) Velocity(v) vFP ⋅=
Mechanical-rotational system
Momentum(M) Angular velocity(ω )
ω⋅= MP
Electrical system Voltage(U) Current Intensity(I)
IUP ⋅=
Hydraulic system Pressure(p) Flow(q) qpP ⋅= Pneumatic system Pressure (p) Gas column
mass ( )m&
vpP ⋅=
Thermal system Temperature(T) Heat
flow ( )Q
( )entropyeTP ⋅=
The method uses nine standard elements which can be found in every energetic domain: 1. Inductive or inertial element (I) which accumulates energy; 2. Capacitive element (C) which accumulates energy; 3. Resistive element (R) which dissipates energy; 4. Effort sources (Se) which supplies the system with energy and it has the “e”
variable preset; 5. Flux sources (Sf) which supplies the system with energy and it has the “f” variable
preset; 6. Transformer element (TF) which conserves energy and makes the power
parameters change by connecting “e” variables with each other; 7. Gyrator element (GY) which conserves energy and makes the power parameters
change by connecting “e” variables with “f” variables; 8. Zero junction (J0) which connects elements with the same “e” variable;
9. One junction (J1) which connects elements with the same “f” variable;
PNEUMATIC SYSTEM BOND GRAPH MODEL
The essential advantage brought by this relatively new method is the unitary treating of systems, regardless of the type: electrical, mechanical, hydraulic etc., by introducing some principles to which all systems can join [10]. This advantage can extend also to the mechatronic systems, knowing that they have a strong interdisciplinary character, and the integration principle represents a basic component that exists in all mechatronic systems. Bond Graph method is a less used and studied method that represents an alternative concept to the “traditional” modeling and can be used for checking the calculations and to check how the approach in mathematical terms was thought. Another advantage would be the correspondence with electronic science by introducing three passive components: resistance, coil and condenser as basic components in the phenomenology proposed by this
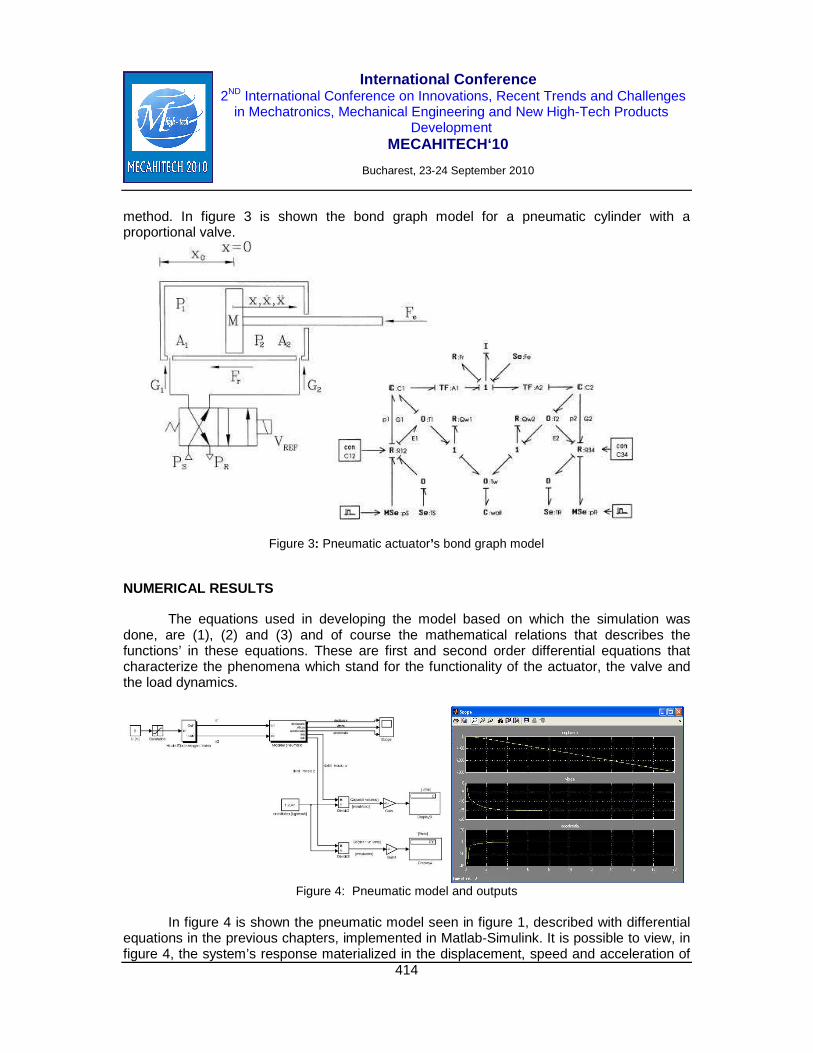
International Conference 2ND International Conference on Innovations, Recent Trends and Challenges
in Mechatronics, Mechanical Engineering and New High-Tech Products Development
MECAHITECH‘10
Bucharest, 23-24 September 2010
414
method. In figure 3 is shown the bond graph model for a pneumatic cylinder with a proportional valve.
Figure 3: Pneumatic actuator’s bond graph model
NUMERICAL RESULTS
The equations used in developing the model based on which the simulation was done, are (1), (2) and (3) and of course the mathematical relations that describes the functions’ in these equations. These are first and second order differential equations that characterize the phenomena which stand for the functionality of the actuator, the valve and the load dynamics.
Figure 4: Pneumatic model and outputs
In figure 4 is shown the pneumatic model seen in figure 1, described with differential equations in the previous chapters, implemented in Matlab-Simulink. It is possible to view, in figure 4, the system’s response materialized in the displacement, speed and acceleration of

International Conference 2ND International Conference on Innovations, Recent Trends and Challenges
in Mechatronics, Mechanical Engineering and New High-Tech Products Development
MECAHITECH‘10
Bucharest, 23-24 September 2010
415
the axis piston to a maximum valve’s opening obtained by applying 0 V to the valve’s coil. It is very important to specify how the proportional valve works, so the range of voltage that can be applied to the coil is between 0 and 10 V, 0 V representing the maximum displacement of the valve’s drawer in a giving direction, and 10 V represents the maximum displacement in the opposite direction. The same system (figure 1) with the same characteristics and functionality is implemented in the simulations made with bond graphs seen in figure 5 [11]. The outputs are form left to right displacement velocity and acceleration with the input signal seen as well.
G1p1 p2G2
E1 E2
0
Pulse1Pulse
TFA2
TFA1
RQW2R QW1
CPerete
0 Tp
11
0T20 T1
SeTr
SeTs
0
MSepR
MSepS
R R34RR12
R Fr Se Fe
1
I I
C CC1CCC
20-sim 4.1 Viewer (c) CLP 2009
Figure 5: Pneumatic bond graph model and outputs
CONCLUSIONS
Like hydraulic elements, pneumatic based systems are characterized by resistance, inertia and capacity. These three main components are well described in bond graph modeling, a less used method of modeling complex systems. Accentuating the limits of fragmentation approach and the necessity of an overall vision, the science of integration tries to avoid such situations, pointing out even more strongly the need to take into account not only the subsystem on which we must act, but also for his connections with other subsystems and in fact the suprasystem they belong. The integration science subscribes within the context of modern thinking.
This paper tried to show and explain a part of the modelling theory called bond graph method. The biggest advantage brought by this method, in technical science, is the unitary approach of all kind of technical systems by uninvolving the type of power that flows through the system’s elements.

International Conference 2ND International Conference on Innovations, Recent Trends and Challenges
in Mechatronics, Mechanical Engineering and New High-Tech Products Development
MECAHITECH‘10
Bucharest, 23-24 September 2010
416
REFERENCES
[1] Blagojević, V.; Stojiljković, M.; “Mathematical and model of the pneumatic system with bridging of the dual action cylinder chamber”, 2007
[2] Hancu, O. “ContribuŃii privind proiectarea optimalǎ a sistemelor mecatronice”, Phd Paper, Cluj-Napoca, 2007
[3] Jia Ke, Kary Thanapalan, Jihong Wang, Henry Wu, “Development of energy efficient optimal control for servopneumatic cylinders” 2004.
[4] Mătieş, V.; Mândru, D.; Bălan, R.; Tătar, O.; Rusu, C.; “Tehnologie şi EducaŃie Mecatronică”, Cluj-Napoca 2001.
[5] Mătieş, V., Bălan, R., Hancu, O., Gliga, A., “Hidronica Aplicații”, Cluj-Napoca, 2003,
[6] J.Wang, D.J.D.Wang, P.R.Moore and J.Pu, “Modelling study, analysis and robust servocontrol of pneumatic cylinder actuator systems” 2001
[7] Jihong Wang, Ülle Kottab, Jia Ke, “Tracking control of nonlinear pneumatic actuator systems using static state feedback linearization of the input–output map” , 2007
[8] A.J. Blundell, „Bond Graphs for modelling engineering systems”, Department of Systems and Control Lanchaster Polytechnic Coventry
[9] V. Damic, J. Montgomery, „Mechatronics by Bond Graphs”, 2003
[10] http://www.engin.umd.umich.edu/vi/w2_workshops/bond_graph_shim_w2.pdf
[11] Rareş Mîndru – “ContribuŃii teoretice”, Raport de cercetare ştiinŃifică, Cluj-Napoca, 2010

International Conference 2ND International Conference on Innovations, Recent Trends and Challenges
in Mechatronics, Mechanical Engineering and New High-Tech Products Development
MECAHITECH‘10
Bucharest, 23-24 September 2010
417
Pneumatic Distributors - A Study
Regarding the Development Trends
Mihai Avram, Constantin Bucşan Politehnica University of Bucharest,
Splaiul Independentei 313 , 77206 Bucuresti, [email protected]
ABSTRACT
The paper analyzes the important future development of pneumatics. There are identified and motivated the main trends and perspectives of the domain, as follows: the miniaturization and modularization of the equipment, the direct integration of the interface electronics within the equipment, the optional interface for connecting the equipment to the system data bus, the development of some modulated pulses command techniques for the on/off type distributors in order to obtain a proportional flow control, the use of some new type of unconventional actuators within the distributing equipment structure, the development of environmental friendly structures etc. INTRODUCTION
Nowadays the pneumatic actuating systems are used in a large number of applications, due to the undoubted qualities of this type of actuators: stamina, simplicity in construction, productivity, high reliability, lower costs and non-pollutant energy.
The actual stage and the development trends situates pneumatics beyond the top technologies. The future high development of pneumatics is analyzed using pertinent arguments in [1]. There are identified and analyzed the principle trends of the domain. The success rests in the results of some fascinating researches on limiting the negative effects of the working fluid low viscosity and high compressibility. These two properties are the principle obstacles in the way of building accurate pneumatic positioning systems.
Most pneumatic actuating systems incorporate one or more classic or proportional distributors. The classic distributors lead the compressed air to certain tracks according to the external commands. So, it is possible to invert the moving direction of the load carried by the system motor and in some cases, to stop this moving. Additionally the proportional distributors control the flowrate and thereby the speed of the actuated load. As an example, figure 1 shows the functional scheme of a pneumatic positioning system [2]. There are three distributors: two proportional ones, DP1 and DP2 and a classic one, DC.

International Conference 2ND International Conference on Innovations, Recent Trends and Challenges
in Mechatronics, Mechanical Engineering and New High-Tech Products Development
MECAHITECH‘10
Bucharest, 23-24 September 2010
418
Figure 1: The functional scheme of a pneumatic positioning system
PNEUMATIC DISTRIBUTING EQUIPMENT – TRENDS AND PERSP ECTIVES
The performances of a pneumatic actuating system depend on the performances of
every equipment within its structure. In many cases the distributing equipment represents "the heart" of the pneumatic actuating system and highly influences the static and dynamic performances of the whole system. That's the reason why this paper takes regard to such equipment. An analysis of the evolution of the distributing equipment emphasizes the following trends:
• a sustained attention to increase the reliability, the functional accuracy and the static and dynamic performances;
• decreasing the price of the equipment; • promoting the low power consumption equipment; • miniaturizing and modularizing the equipment; • the integration of the interface electronics within the equipment; • the use of optional interfaces to connect the equipment to the data bus of the system; • the development of control techniques using modulated pulses to control the on/off
distributors in order to obtain the proportional flowrate control;

International Conference 2ND International Conference on Innovations, Recent Trends and Challenges
in Mechatronics, Mechanical Engineering and New High-Tech Products Development
MECAHITECH‘10
Bucharest, 23-24 September 2010
419
• using new types of unconventional actuators within the equipment structure; • promoting environment friendly solutions. There is a large constructive variety of distributing equipment, differenced by: the type of
the mobile element (sliding valve, valve), the type of the mobile element movement (translation, rotation), the number of the steady functional positions, the number of orifices, the type of the control, the presence of the preferred position. The most used types are those with cylindrical sliding valve.
Well known companies in the field of pneumatics as Festo and SMC offer such distributors with acceptable static and dynamic performances. In order to improve this performances the research is focused on minimizing the weight of the mobile element, because it is the parameter that determines the response time of the equipment and its frequency response.
As mentioned, there is a large demand of distributing equipment and also a large offer. Beyond the working performances the decisive element is the price of the equipment and the costs of working and maintenance.
A lower price may be achieved in more ways, as follows: - using standard parts in the construction of the equipment, when possible; - using adequate manufacturing and assembly technologies, often advanced
technologies, especially in the case of proportional equipment; - using new materials that are cheaper, lighter, with superior mechanical properties,
more machinable and accessible. The miniaturizing of the equipment is another challenge for the manufacturers. The
goal is to reduce the sizes and the weight, to use less materials and energy and to reduce the cost of working and maintenance. The weight of the mobile element is also reduced and the dynamic performances increase.
In the last decade the most influential trend was to build compact distributing equipment, with a high level of aggregation of the component parts in a reduced volume. Some examples are the equipment for textile industry, the automatic manufacturing and assembly lines, the robotized systems, the equipment for electronic components manufacturing. The miniaturizing of the electronic and optoelectronic components brought forward the design and manufacturing of micromechanical devices, micro-systems and miniaturized pneumatic equipment. The goals are to reduce the actuating power, to integrate in certain technologies and to develop more efficient equipment. For the integration process it is essential to build mixed pneumatic and electronic systems, where every technology participate with its specific characteristics. There were built low sizes pneumatic motors and the sizes of the distributing equipment were significantly reduced according to the reduced flowrates needed. The miniaturization requested an adequate design of the distributing section of the equipment, the optimization of the actuator and the use of new materials.
The miniaturization process was initiated by building some basic pneumatic equipment (motors, distributing equipment) that were used to build pneumatic mini-systems. These equipment are similar to the conventional ones and have the same working principle. In many cases it was sufficient to reduce the scale of the equipment. One example is shown in figure 2, a. It is a Festo distributor of the MH1 type. Figure 2, b shows an "island" of such distributors, mounted on the PB base and having a common P power input orifice. The electric power signals are transmitted through the C connector, reducing the volume of the equipment. The equipment has the following characteristics:
- length: 10 mm;

International Conference 2ND International Conference on Innovations, Recent Trends and Challenges
in Mechatronics, Mechanical Engineering and New High-Tech Products Development
MECAHITECH‘10
Bucharest, 23-24 September 2010
420
- nominal flowrate: 10...14 l/min; - power voltage: 5/12/24 V; - switching time: 8, 5 or 4 ms; - pressure range: -0,9...8 bar.
Figure 2: a) The Festo MH1 distributor
b) An "island" of distributors Figure 3: The "Airbox" module The "Airbox" module shown in figure 3 is an autonomous system including two very compact mini-distributors.
The miniaturizing trend led to the development of more reduced dimensions distributing equipment, known as micro-distributors or micro-pneumatic distributors. While the classic distributors (with usual sizes) control flowrates in the range of 10.000...10 dm3/min (ANR - atmosphere normal reference conditions: 20 oC temperature, 65% humidity and 1013 mbar pressure), the micro-distributors control flowrates lower than 1 dm3/min (ANR). All micro-distributors are based on a mobile element with membranes that close or open the flowing area. The mobile element is controlled with specific actuators as: electromechanical, piezoelectric, electrostatic, thermal, shape memory, electrolytic, etc.
The difference between mini and micro - pneumatics is not neat set out. The two concepts use first to measure the possibilities of miniaturizing in pneumatics. The manufacturers already use silicon - the material used for microprocessors and AI - in order to miniaturize pneumatic equipments. There were built silicon chips with etched structure capable to direct the air flow. This distributors have virtually null intake power, their response time is much lower than 1 ms, and they are made of silicon. This means that it is possible to build the electronic circuits on the same substrate. This concept work, as showed by the developed prototypes. The input voltage must be 150 V, but the intake power is virtually null, the mobile element being moved by the force of the electrostatic field.
Figure 4 shows a micro-distributor with electrostatic actuation [3]. The upper side of the distributor is a SiO2 membrane covered with a thin layer of
chrome acting as a mobile electrode. The body of the distributor is made of silicon and a passing orifice is etched on it. The membrane stays in the proffered upper position due to internal stresses. When a control voltage is applied to the poly-silicon electrodes the membrane is pushed down and the flow is stopped.

International Conference 2ND International Conference on Innovations, Recent Trends and Challenges
in Mechatronics, Mechanical Engineering and New High-Tech Products Development
MECAHITECH‘10
Bucharest, 23-24 September 2010
421
Figure 4: The scheme of a micro-distributor with electrostatic actuation
The experimental models have flow areas in the range of 10x10 µm to 100x100 µm,
the membrane dimensions are in the range of 80...1000 µm and the thickness is in the range of 20...120 µm. The blocking voltage is 68 V and the working voltage is 120 V. The equipment is nonsensitive to electromagnetic fields and supports mechanical shocks due to the very low weight of the mobile element. Another advantage consist in the possibility to build more distributors on one substrate.
Figure 5 shows the construction of a thermal controlled micro-distributor developed by IFAS and FhG - ISIT from Itzehoe, Germany [4].
Figure 5: The IFAS and FhG - ISIT thermal controlled micro-distributor Figure 6: The dynamic characteristic
A pre-tensioned nickel bridge is warmed and suspended, allowing the control of a nozzle. Due to the used physical principle the needed input power is less than 1 W to modulate pressures up to 10 bar. The distributor may be of the two or three ways type and it has a proportional working mode. The main advantage of this distributor is the relative long stroke: 40 µm. Even if the distributor is thermal controlled it has excellent dynamic performances as shown in figure 6. The response time for a 90% step input signal is about 16 ms. The maximum flowrate of the thermal controlled distributor is ten times larger than the maximum flowrate of the electrostatic distributor, due to the longer stroke. The thermal controlled distributor may be used as a pilot, with no need for an amplifier.
The control interfaces for such equipment are designed as cards or modules. A modern development trend is to integrate the electronic interface directly within the equipment, that becomes a mechatronic structure controlling the pneumatic parameter

International Conference 2ND International Conference on Innovations, Recent Trends and Challenges
in Mechatronics, Mechanical Engineering and New High-Tech Products Development
MECAHITECH‘10
Bucharest, 23-24 September 2010
422
through an electric control signal. There are yet unsolved problems in connection with the environment and especially with the temperature, that decisively influences the working of the electronic components within optimum parameters. Figure 7 shows a proportional distributor manufactured by Norgren, having direct actuation and position control for the mobile element using a microprocessor integrated within the equipment.
Figure 7: The Norgren proportional distributor
The characteristics of the equipment are the following:
- the digital micro-controller assures a high stability and a superior dynamics for the mobile element of the equipment;
- linear characteristic and minimum hysteresis; - very good sensitivity; - high flowrate range; - very good sealing; - zero cover; - low pressure loss; - PC configurable using the V24 interface; - the control signal: 4...20 mA; ±5 V; 0...10 V. The pneumatic equipment manufacturers offer an optional interface to connect directly to
the data bus. Figure 8 shows such an equipment using integrated digital electronics and environment monitoring functions. The bus module transmits the digital commands for automations. Other distributor modules and I/O modules are connected to a circuit that is independent of the bus protocol. This allows the diagnose to the distributor or coil level. Power, transmitting or configuring errors may be detected at the system level. Power, output and input errors may be detected at the distributor or coil level. In the case of distributors with feedback functions a variation of the signal larger than the permitted one will produce an error message. The error is easily eliminated by replacing the components or by stopping the process.
Beside the analogical proportional pneumatic distributors, there were developed proportional distributors with discrete working. Using adequate control techniques based on the modulation of the electromagnet power pulses, this distributors assures the control of the average flowrate, while the control of the instantaneous flowrate is not possible. These are, in fact, electric actuated 3/2 micro-distributors with preferential position, with a mobile element that is not a slider but often a valve. The actuation is performed by a classic electromagnet and the working is of the type "all or nothing". In this case the mobile element

International Conference 2ND International Conference on Innovations, Recent Trends and Challenges
in Mechatronics, Mechanical Engineering and New High-Tech Products Development
MECAHITECH‘10
Bucharest, 23-24 September 2010
423
opens and shuts the inner circuit with a high frequency (≈ 200 Hz), allowing the control of the average flowrate. The main advantages of this distributors are the following: high response speed, acceptable price (the construction is simple and does not need special manufacturing and assembly conditions), the elimination of hysteresis and its unwanted effects, a very good repeatability. An actuating system that integrates such equipment may be controlled by a digital microprocessor, which simplifies the control system structure.
Figure 8: Pneumatic equipment with integrated digital electronics
Some control techniques [5] are based on mixing up the outputs of more micro-
distributors of the same type, grouped in "batteries", and especially on controlling the opening and shutting time of the distributor flowing area. The used control methods may be classified as follows:
a. flowrate control methods based on coupling more distributors: the PNM method (“Pulse Number Modulation”) and the PCM method (“Pulse Cod Modulation”);
b. flowrate control methods using modulated control signals: the PFM method (“Pulse Frequency Modulation”) and the PWM method (“Pulse Width Modulation”);
c. mixed flowrate control methods. Beside the consecrated actuators (the classic electromagnet and the proportional
one) there were developed another types of unconventional actuators, as: piezoelectric actuators, magneto-strictive actuators, actuators without mobile elements (with electro-viscous or magnetic fluids). Piezoelectric actuators are the most interesting. Figure 9 shows two, a linear one (figure 9,a) and a bimorph actuator (figure 9,b).
Figure 9: Micro-distributors with piezoelectric actuators
In the first case (figure 9,a), when the actuator is not commanded, the position of the beam 3 determines the valve S1 to close the orifice (1), and so the orifice (2) is connected to

International Conference 2ND International Conference on Innovations, Recent Trends and Challenges
in Mechatronics, Mechanical Engineering and New High-Tech Products Development
MECAHITECH‘10
Bucharest, 23-24 September 2010
424
the orifice (3). When the control voltage is applied to the actuator 2, the length of the actuator increases (the elongation is about 5 … 10 µm, according to the applied voltage), the generated force determines the buckling of the beam and the valve S2 closes the orifice (3), while the valve S1 opens the orifice (1) which is now connected to the orifice (2). In this case the beam 3 works as a mechanical amplifier of the actuator displacement.
In the second case (figure 9,b), the beam 2 consist of at least two piezoelectric segments, bonded with each other, or both bonded on a metallic segment. When the control voltage is applied to the piezoelectric segments, the free end of the beam moves proportionally with the voltage value.
The proportionality factor depend on the sizes of the segments and on the used materials. This actuators have the advantage that produce a displacement of tenths of a millimeter, but the developed forces are very small (of about 0,5 N).
The problem of the environment pollution was first connected to the industrial areas. The next step was to analyze the technologies and so the notion "clean technology" was born. The actual approach is to analyze the product along its hole life cycle, starting with the manufacture of the materials, design, manufacture, transport and operation, and finishing with the possibilities of recycling or return to nature in a non-polluting form. This are also valid for pneumatic equipment. CONCLUSIONS
The development of the pneumatic distributors domain was imposed by demands of
automation technologies. Pneumatics was one of the main innovation factors in fluid power domain. The trends of miniaturization, increase of dynamic performances, piezoelectric technologies, and the use of the connection to the data bus, appeared in pneumatics earlier then in hydraulics. A recent trend in distributors development is the use of reduced sizes micro-distributors, with low energy consumption, made of silicon using etching technologies. The on/off distributors can reach similar performances as the analogical equipment using modulated pulses control, and this is why they are interesting for the designers. REFERENCES [1] Vogel, G., Mühlberger, E., L’univers fascinant de la pneumatique, HOPE Internationa Communication, 2003 :
[2] Avram M., Bucsan C., Pneutronic Positioning Unit - Part 1: Design and Working Principle, Romanian Review of Precision Mechanics, Optics and Mecatronics 2009 (19), No.36; pag.7…10;
[3] Haji Babaei, J., A New Bistabile Microvalve Using SIO2 Beam as Movable Part, Proc. Of Int. Conf. On New Actuators, Bremen, 1994, pag.34...37;
[4] Günther, Götz; Quenzer, Hans-Joachim: Entwicklung eines pneumatischen Mikroventils. O+P “Ölhydraulik und Pneumatik” 44 (2000) Nr. 9;
[5] Avram, M., AcŃionări hidraulice şi pneumatice – Echipamente şi sisteme clasice şi mecatronice, Editura Universitară, Bucureşti, 2005.

International Conference 2ND International Conference on Innovations, Recent Trends and Challenges
in Mechatronics, Mechanical Engineering and New High-Tech Products Development
MECAHITECH‘10
Bucharest, 23-24 September 2010
425
Comparing Extended Neighborhood Search Techniques A pplied to
Production Scheduling
Leonilde R. Varela, Telmo Pinto Department of Production and Systems, School of Engineering, University of Minho
Campus de Guartar, 4710-057 Braga, Portugal [email protected], [email protected]
ABSTRACT
Extended Neighborhood Search Techniques (ENST) are meta-heuristics that are adequate tools for solving optimization problems, through the selection of the best solution among a finite number of possible solutions. They are particularly attractive techniques to solve optimization problems, namely scheduling problems, because they allow finding close to optimal solutions, without big computational effort, which in real-world environments is usually good-enough. Moreover, they are relatively simple to implement and manipulate. In this paper, some interesting features of these kind of methods are enhanced, including an application example of implemented algorithms, which are described and illustrated. Among several advantages the possibility of repeating a huge number of experiences is referred. This feature facilitates a comparative analysis of the results obtained for different program executions for an analyzed problem. Furthermore, the parameters that control the algorithms are also discussed to show how easily they can be implemented and manipulated in order to more closely adapt for satisfying more specific requirements of problems arising on different and quite complex manufacturing scenarios.
INTRODUCTION
Production scheduling consists on an important production management function, affecting all branches of industrial and commercial organizations and services. In the strict industrial context, a very important objective, which is usually imposed by the clients consists on satisfying due dates of manufacturing orders.
Therefore, the aim of this paper consists on comparing ENST applied to production scheduling problems solving. We intend to highlight advantages and inconveniences of several meta-heuristics, namely genetic algorithms (GA) and tabu search (TS), by including a literature review and also describing implemented algorithms, aiming at the satisfaction of jobs’ due dates and minimization of objective functions related with tardy jobs and flow times. Our main purpose consists on providing good solutions for problems occurring on real world scenarios, enabling a supported decision making process, by putting forward different kind of approaches for solving scheduling problems arising on distinct manufacturing environments.
In this context, we present the results for a given problem, selected with the purpose of testing several algorithms’ solutions. The problem presented enhanced the flexibility and adaptability of those algorithms for the resolution of production scheduling problems.
In order to clearly describe the main ideas underlying to this work, this paper starts with a brief description about production scheduling problems. Next the main characteristics of

International Conference 2ND International Conference on Innovations, Recent Trends and Challenges
in Mechatronics, Mechanical Engineering and New High-Tech Products Development
MECAHITECH‘10
Bucharest, 23-24 September 2010
426
extended neighbourhood search techniques or meta-heuristics, namely genetic algorithms and tabu search based approaches are summarized. Afterwards, a set of scheduling problem results are presented, through the application of the corresponding implemented algorithms as well as a brief literature review about these kind of methods. Finally, some conclusions are reached.
PRODUCTION SCHEDULING
Good schedules strongly contribute to increase companies’ success. Among other ways, this is achieved through deadlines satisfaction for the accepted orders, low flow times, few ongoing jobs in the system, high resource utilization and low production costs. These objectives can be better satisfied through the execution of the most suitable scheduling algorithms available for solving each particular problem under consideration.
In order to apply a scheduling process the first step consists on specifying the scheduling problem to be solved.
Scheduling problems have a set of characteristics that need specification. These characteristics can be organized into classes. One such class of factors, which we call the α class, characterizes the production environment, i.e. the system and machines available. Another, the β class, deals mainly with characterization of jobs and processing requirements. Some important processing requirements that frequently have to be taken into account for processing jobs have to do with resources other than machines, i.e. operators, tools, handling devices buffers and others. These must also be specified and are considered in our framework for problem definition [1, 2]. The third, the γ class, specifies the performance measure or evaluation criterion, through a given simple or complex objective function. Typical examples of such objective functions are the maximum flow time, the makespan and the mean and maximum lateness of jobs, among others.
The classification framework is used as a basis for clearly specifying a problem to be solved. It includes a wide range of problem classification factors, which may be combined in different ways, resulting in many distinct scheduling problem classes. For example, class 1|n,dj|ΣwjLj, referrers to the problem of processing n jobs on a single machine production system with jobs subject to due dates (dj) and penalties (wj) dependent on lateness (Lj). The performance measure is the sum of the weighted lateness (ΣwjLj).
APPROACHES FOR PROBLEM SOLVING
The time one can devote for solving particular scheduling problems is usually short. Therefore, only low order polynomial time approaches are likely to be acceptable to solve real world problems, usually complex. Thus, the examination of the complexity of those problems should be the basis for further analysis to problem solving. Although many scheduling problems are NP hard [3, 4, 5, 6, 7, 8] not all NP-hard problems are equally hard from a practical perspective. Some NP-hard problems can be solved pseudo-polynomially using approximation methods that provide feasible solutions, which although normally sub-optimal are within a fixed percentage of the optimum. Examples of this kind of methods are approximate dynamic programming or branch and bound methods [6]. Other approaches, heuristic based, to obtain good or at least satisfactory solutions, in acceptable time, are

International Conference 2ND International Conference on Innovations, Recent Trends and Challenges
in Mechatronics, Mechanical Engineering and New High-Tech Products Development
MECAHITECH‘10
Bucharest, 23-24 September 2010
427
based on the, nowadays widely used, extended local search techniques, also known as meta-heuristics. These include, among others, Genetic and Evolutionary Algorithms, Simulated Annealing, and Tabu Search [3, 4, 8, 9]. There are also other important approaches to scheduling based on computer simulation [5, 6, 7, 8, 9], bottleneck methods, neural networks and petrinets, among others [6, 10, 11, 12].
Methods based on heuristics or approximate approaches tend to provide good results in the available time to make decisions, reason why we intend to apply them for solving production scheduling problems. We cannot disregard the use of sequencing priority rules, sometimes also quite appropriate for scheduling in complex production environments.
The process of scheduling problem solving is essentially concerned with finding the sequence in which jobs should be processed. Sometimes, however, we may need also to know the scheduled start and finishing times of every job’s operation on each machine. This information completely defines a schedule or scheduling plan.
Sequencing rules
Sequencing rules are, probably, the most frequently used approach for solving job-sequencing problems in practice. This is mainly due to its easy implementation and also to the usually short time required for its execution. A lot of work was done in the past and is still being done for evaluating the performance of sequencing rules. Table 1 presents a small sample of some simple and well-known sequencing priority rules.
Table 1 Priority rules
Abb. Rule name S(L)OT Shortest(Longest) Operation Time S(L)RPT Shortest(Longest) Remaining Processing Time F(L)CFS First(Last) Come First Served S(L)PT Shortest(Longest) Processing Time S(L)OS Shortest(Longest) Operation Successor S(L)NRO Smallest(Largest) Number of Remaining Operations EDD Earliest Due Date
Clearly, with a few exceptions, applying sequencing rules rarely leads to optimum
solutions. However there are some very interesting findings related with job sequencing using priority rules. For example, the mean lateness (Lmean) of a number of jobs that are available for starting processing on a single machine system, as well as the mean flow time per job (Fmean), are minimized by processing the jobs by increasing order of their processing times (SPT rule). Another example, in the same production environment, is that ordering the jobs by increasing order of their due dates (EDD rule) minimizes the maximum lateness (Lmax) [13, 14].
Meta-heuristics
The neighbourhood or local search techniques, and more precisely the extended neighbourhood search techniques, like GA, SA and TS referred above are nowadays widely used in the aim of optimization purposes, namely in production scheduling. For example, GAs and other evolutionary computation approaches, namely Evolutionary Algorithms (EA)

International Conference 2ND International Conference on Innovations, Recent Trends and Challenges
in Mechatronics, Mechanical Engineering and New High-Tech Products Development
MECAHITECH‘10
Bucharest, 23-24 September 2010
428
[15, 16, 17]. Genetic algorithms are a form of probabilistic search that trades off increased
computational requirements for the potential to achieve more extensive coverage of the search space.
Genetic algorithms mimic the process of natural evolution by maintaining at each step a population of chromosomes (candidate solutions), and iteratively changing the population by applying operators such as crossover (the combination of a pair of chromosomes to generate a new chromosome) and mutation (the random perturbation of an existing chromosome). A fitness function, which measures the quality of each candidate solution according to the given optimization objective, is used to help determine which chromosomes are retained in the population as successive generations evolve [1].
Several genetic algorithms have been developed for multiprocessor task scheduling, the primary distinction among them being the chromosomal representation of a schedule. The structure of and restrictions placed upon the chromosomal representation significantly impact the complexity of the genetic operators as well as the algorithm’s potential for convergence to an optimal schedule. For example, Wang and Korfhage [11] make use of a binary matrix encoding for the assignment and the execution order of the tasks on each processor. However, the rules governing the form of a valid solution are not fully accounted for by the crossover and mutation operators and, as a consequence, there is the potential for the production of inexecutable schedules. Although repair operations can be implemented to correct these solutions, the operations consume time that could otherwise be dedicated purely to the optimization process.
Hou, Ansari, and Ren [3] propose a very different representation. Variable-length strings, rather than matrices of fixed dimensions, which are used to explicitly list the order of the tasks on each processor. Although the restrictions placed upon the string representation prevent the production of invalid solutions, it is proven by Correa, Ferreira, and Rebreyend [2] that this representation cannot express the full range of possible schedules. Hence, it may be impossible for the genetic algorithm to converge to an optimal solution regardless of the amount of time allocated to the optimization.
Correa et al. improve upon the work by Hou et al. and propose the full-search genetic algorithm (FSG), which uses a string representation capable of spanning the entire space of possible schedules [9]. Although FSG significantly outperforms its predecessor, additional list-heuristics that leverage some knowledge about the scheduling problem were added to FSG to further improve the quality of its schedules. The culminating algorithm was termed the combined-genetic list algorithm (CGL). CGL outperforms its predecessors [9].
Regarding Tabu Search (TS), this approach may be described as follows. Given a function f(x) to be optimized over a set X, TS begins in the same way as ordinary local search, proceeding iteratively from one point (solution) to another until a chosen termination criterion is satisfied. Each x Î X has an associated neighborhood N(x) Ì X, and each solution x_ N(x) is reached from x by an operation called a move. TS goes beyond local search by employing a strategy of modifying N(x) as the search progresses, effectively replacing it by another neighborhood N*(x). A key aspect of TS is the use of special memory structures which serve to determine N*(x), and hence to organize the way in which the space is explored.
The solutions admitted to N*(x) by these memory structures are determined in several ways. One of these, which gives TS its name, identifies solutions encountered over a specified horizon (and implicitly, additional related solutions), and forbids them to belong to
International Conference 2ND International Conference on Innovations, Recent Trends and Challenges
in Mechatronics, Mechanical Engineering and New High-Tech Products Development
MECAHITECH‘10
Bucharest, 23-24 September 2010
429
N*(x) by classifying them tabu. (The tabu terminology is intended to convey a type of restraint that embodies a "cultural" 6 connotation, i.e., one that is subject to the influence of history and context, and capable of being surmounted when conditions warrant.
The process by which solutions acquire a tabu status has several facets, designed to promote a judiciously aggressive examination of new points. A useful way of viewing and implementing this process is to conceive of replacing original evaluations of solutions by tabu evaluations, which introduce penalties to significantly discourage the choice of tabu solutions (i.e., those preferably to be excluded from N*(x), according to their dependence on the elements that compose tabu status). In addition, tabu evaluations also periodically include inducements to encourage the choice of other types of solutions, as a result of aspiration levels and longer term influences.
It should be emphasized that the concept of a neighborhood in tabu search also differs from that used in local search, by embracing the types of moves used in constructive and destructive processes (where the foundations for such moves are accordingly called constructive neighborhoods and destructive neighborhoods). Such expanded uses of the neighborhood concept reinforce a fundamental perspective of TS, which is to define neighborhoods in dynamic ways that can include serial or simultaneous consideration of multiple types of moves, by mechanisms subsequently identified.
Tabu search (TS) has provided advances for solving difficult optimization problems in many domains. It is a meta-heuristic that guides a local heuristic search procedure to explore the solution space beyond local optimality. Widespread successes in practical applications of optimization have spurred a rapid growth of tabu search in the past few years [9]. TS procedures incorporate basic elements and hybrids of these procedures with other heuristic and algorithmic methods, have succeeded in finding improved solutions to problems in scheduling, sequencing, resource allocation, investment planning, telecommunications and many other areas [9].
Tabu search is based on the premise that problem solving, in order to qualify as intelligent, must incorporate adaptive memory and responsive exploration. The use of adaptive memory contrasts with "memoryless" designs, such as those inspired by metaphors of physics and biology, and with "rigid memory" designs, such as those exemplified by branch and bound and its AI-related cousins. The emphasis on responsive exploration (and hence purpose) in tabu search, whether in a deterministic or probabilistic implementation, derives from the supposition that a bad strategic choice can yield more information than a good random choice. In a system that uses memory, a bad choice based on strategy can provide useful clues about how the strategy may profitably be changed. Even in a space with significant randomness - which fortunately is not pervasive enough to extinguish all remnants of order in most real world problems - a purposeful design can be more adept at uncovering the imprint of structure, and thereby at affording a chance to exploit the conditions where randomness is not all encompassing.
Meta-heuristic procedures have benefitted from numerous advances in recent years. Developments in new implementations of TS have been especially productive. Most striking are the advances enabling difficult practical problems to be handled with
greater effectiveness than previously envisioned possible. At the same time, adaptive memory strategies of TS are becoming incorporated into other methods, both significantly modifying the operation of these methods and changing the perspectives on which they are based.
Tabu search has become the focus of numerous comparative studies and practical

International Conference 2ND International Conference on Innovations, Recent Trends and Challenges
in Mechatronics, Mechanical Engineering and New High-Tech Products Development
MECAHITECH‘10
Bucharest, 23-24 September 2010
430
applications in recent years. Fruitful discoveries about preferred strategies for solving difficult optimization problems have surfaced as a result.
However, sometimes the nature and implications of these discoveries have not been made entirely clear. The reason for this ambiguity is that TS has been presented with two faces in the literature, causing it to be viewed as two different methods - one simpler and one more advanced. The simpler method incorporates a restricted portion of the TS design, and is sometimes used in preliminary analyses to test the performance of a limited subset of its components - usually involving only short term memory. The more advanced method embodies a broader framework that includes longer term memory, with associated intensification and diversification strategies. This second approach, due to its focus on exploiting a collection of strategic memory components, is sometimes referred to as Adaptive Memory Programming (AMP).
In fact, in both of its forms (though more strongly on the second) the thrust that gives TS its distinctive character is the systematic use of adaptive memory — in contrast to the design of "memoryless" approaches like simulated annealing and genetic algorithms, or "rigid memory" approaches like branch and bound and its various AI cousins.
Nevertheless, simplified TS approaches are sometimes surprisingly successful. Since they are also frequently quite easy to implement, these approaches will undoubtedly continue to appear in the literature, applied on quite different problem domains, including manufacturing scheduling.
ALGORITHMS APPLICATION ILLUSTRATION
In this section the application of some priority rules and meta-heuristics is going to be described. The problem that we are going to consider is a single machine problem instance that belongs to the previously referred 1|n,dj|ΣwjLj problem class, were the objective consists on minimizing the sum of the weighted lateness. This is a generalization of the well-known 1|n,dj|ΣLj problem.
Table 2 shows the problem data, for the problem instance to be solved, which includes four jobs (Jj), and for each job, the processing time (pj) on the single machine and the corresponding due dates (dj) are given, as well as the penalty for each unit time lateness (wj).
Table 2 Problem data
Jobs J1 J2 J3 J4 pj 10 10 13 4 dj 4 2 1 12 wj 14 12 1 12
Several different approaches have been applied to solve this problem. These approaches vary from very sophisticated intensive-time computing techniques to reasonably simple heuristics. Approaches applying dynamic programming and branch and bound techniques have also been used [7].
Our sample problem about sequencing a set of jobs with known due dates considers, as the most relevant performance measure, which is going to be minimized, the weighted lateness of jobs (ΣwjLj), through the application of an Evolutionary Algorithm (EA) and a Tabu Search Algorithm (TSA), although some closely related ones are also analyzed, by the

International Conference 2ND International Conference on Innovations, Recent Trends and Challenges
in Mechatronics, Mechanical Engineering and New High-Tech Products Development
MECAHITECH‘10
Bucharest, 23-24 September 2010
431
execution of suitable sequencing rules, the Shortest Processing Time rule (SPT) and the Earliest Due Date (EDD).
Next, the pseudo-codes about the EA and the TSA algorithms are presented.
Evolutionary algorithm
The high-level pseudo-code of the evolutionary algorithm (EA), which was used in this work is presented next, in Figure 1 [18].
Step 1: Let k=1; Select q initial sequences S11, ..., S1q, by applying a heuristic. Step 2: Select the best sequence Sk* within Sk1, ..., Skq; Select the worst sequence Sk** within Sk1, ..., Skq; Build a solution S in the neighborhood of S*k; Substitute S**k in the population by S; Step 3: k=k+1; If k=Stopping criterion then Stop; Else go to Step 2;
Figure 1: Pseudo-code of the EA algorithm
Tabu search algorithm
The high-level pseudo-code of tabu search algorithm (TSA), which was used in this work is presented next, in Figure 2 [7].
Step 1: Let k=1; Select one initial sequence S1, by applying a heuristic; Set So = S1; Step 2: Build a solution S in the neighborhood of Sk; If the movement Sk -> S is not forbidden by any mutation on the tabu list Set S(k+1) = S; Insert the reverse mutation on the top of the tabu list; Put all remaining entries in the tabu list one position down; Clear the last entry on the bottom of the tabu list; If G(S) < G(So), put So = S; Go to Step 3; Step 3: k=k+1; If k=Stopping criterion then Stop; Else go to Step 2;
Figure 2: Pseudo-code of the TS algorithm

International Conference 2ND International Conference on Innovations, Recent Trends and Challenges
in Mechatronics, Mechanical Engineering and New High-Tech Products Development
MECAHITECH‘10
Bucharest, 23-24 September 2010
432
These algorithms are relatively simple to implement and manipulate and some interesting features included in the algorithms’ implementation are related with its easy way to repeat experiences, by selecting a seed. This feature facilitates a comparative analysis of the results obtained for different program executions for an analyzed problem. Furthermore, the parameters that control the algorithms are easily manipulated in order to more closely adapt for satisfying more specific requirements of problems arising on different manufacturing scenarios. For example, for a same problem basis, if the user chooses to minimize a different, but related, performance measure, namely the maximum lateness (Lmax) then each algorithm will provide a new, but closely related, solution.
Algorithms implementation results
Table 3 shows the results obtained by running four different approaches, the Evolutionary Algorithm (EA) and a Tabu Search Algorithm (TS), for minimizing the total weighted lateness (∑wjLj), and two sequencing rules, Shortest Processing Time (SPT) and Earliest Due Date (EDD), for the minimization of closely related objective functions, which are the mean and the maximum lateness, respectively.
Table 3 Algorithms’ sequencing results
Sequence Measure Algorithm 1,4,2,3 ∑wjLj = 408 EA
1,4,2,3 ∑wjLj = 408 TS
3,2,1,4 ∑wjLj = 707 EDD
4,1,2,3 ∑wjLj = 492 SPT
3,2,1,4 Lmax = 29 Lmean = 21
Fmean = 25,75
EDD
4,1,2,3 Lmax = 40 Lmean = 17
Fmean = 21,75
SPT
Analyzing the results shown in Table 3 we realize that the EA and the TS algorithms
have provided the best solution in terms of total lateness (correspondingly at the 4th and 6th iteration), while the sequencing rules, as expected, have shown its best performance in terms of the maximum lateness, by the EDD rule and the mean lateness as well as the mean flow-time, through the SPT rule.
The referred algorithms can also be easily adapted for enabling to solve other closely related scheduling problems, namely problems occurring on different manufacturing environments. Therefore, if we want to solve a problem that occurs, for example, on a given bottleneck, in a job shop, we may use the proposed algorithms for solving those bottleneck machines first and next apply those partial solutions as indicial solutions for running other algorithms in order to obtain the final solution for the whole problem. In the same way, by applying problem decomposition we may be able to solve other, more complex problems arising on manufacturing cells or on other flexible manufacturing systems.

International Conference 2ND International Conference on Innovations, Recent Trends and Challenges
in Mechatronics, Mechanical Engineering and New High-Tech Products Development
MECAHITECH‘10
Bucharest, 23-24 September 2010
433
LITERATURE REVIEW
Effective scheduling in manufacturing systems leads to the reduction of manufacturing costs (inventory costs, labor costs, etc.) and improves the operational efficiency of management.
The most frequently used and extensively studied problems in the literature are (A) the job shop problem and (B) the flow shop problem. In addition, a basic model for a broad family of cases called flexible flow line scheduling problems is given by the problem known as (C) the flow shop problem with parallel machines. Industrial applications arise in computer systems, telecommunication networks, and the chemical and polymer industries.
Nowicki and Smutnicki [referred in 7] have developed effective tabu search methods for problems A, B, and C to optimize the makespan criterion. These algorithms employ a classical insertion neighborhood which is significantly reduced by a candidate list strategy for removing useless moves, in order to concentrate on "the most promising part" of the neighborhood.
TS algorithms employ a short-term memory tabu list which stores attributes of visited solutions, represented by selected pairs of adjacent jobs on a machine. Linked intensification and diversification occurs by storing the best solutions collected during the search on a list of limited length. An extended sequence of unproductive steps triggers a ‘back jump’ on the search trajectory to the nearest elite solution, which is recovered together with its associated search history as a basis for re-initiating the search.
Implementations made on a PC are able to improve significantly the best known solution found by other algorithms. Computation times are only a few minutes for instances of A&B problems containing 10,000 operations, and for instances of C problems containing 3,000 operations. An extensive comparative study shows the significant superiority of TS over other approaches including iterative improvement, genetic search, simulated annealing, threshold accepting, constraint satisfaction, neural networks, and other local search methods [3, 5, 6, 7, 10].
Effective scheduling of flow-lines for manufacturing cells improves the operational efficiency of manufacturing processes, leading to reductions in setup costs, labor costs, tooling and inventory costs. This leads to further reductions in throughput times and a corresponding increase in the shipment of on-time deliveries. A tabu search method for this problem has been proposed and successfully implemented by [7].
A manufacturing cell consists of a group of similar machines located in close proximity to one another and dedicated to the manufacture of a specific number of part families. Part families consist of a set of jobs with similar processing requirements. In this context, a feasible schedule S consists of a sequence of part families and a sequence of jobs within each family in a manufacturing cell. The tabu search heuristic of Skorin-Kapov and Vakharia efficiently schedules a pure flow-line manufacturing cell under varying parameter conditions (given F families, M machines and N(f) jobs in family f).
A collection of alternative tabu search strategies (designed to test different aspects of tabu search) was compared against state-of-the-art simulated annealing heuristic that was tailored to solve this problem. Results from testing multiple data sets with alternative ratios of family set up times to job processing times showed the clear superiority of tabu search for these scheduling problems [5, 7].

International Conference 2ND International Conference on Innovations, Recent Trends and Challenges
in Mechatronics, Mechanical Engineering and New High-Tech Products Development
MECAHITECH‘10
Bucharest, 23-24 September 2010
434
CONCLUSION
In production enterprises, it is important nowadays, as a competitive strategy, to explore and use extended neighborhood search methods (ENS) also simply known as meta-heuristics for enabling to solve scheduling problems in a near optimal way. This paper proposes the use of those kind of methods, namely an implemented evolutionary algorithm (EA) and a tabu search algorithm (TSA), which may contribute to assist the scheduling decision-making process, by allowing the comparison of different solutions, obtained by the execution of different approaches, including some simple sequencing rules, like SPT and EDD, for a given problem. As a consequence, the most suitable solution, among those obtained, to solve a particular problem, can be selected, considering a given performance measure or closely related ones and this idea was highlighted by some other related work reported.
These kind of algorithms are relatively simple to implement and manipulate and some interesting features included in the algorithms’ implementation are related, for instance, with its easy way to repeat experiences, by selecting a seed. Moreover, as they are quite fast-running algorithms, another advantage arising from its use is related to the possibility of applying them a certain number of times, before selecting a solution for a giver problem and, therefore, enabling a better decision-making. This feature also facilitates a comparative analysis of the results obtained for different algorithms executions for an analyzed problem.
Furthermore, the parameters that control the algorithms are easily manipulated in order to more closely adapt for satisfying more specific requirements of problems arising on different manufacturing scenarios. Therefore, these algorithms can be easily adapted for enabling to solve other closely related scheduling problems, namely problems occurring on different and complex manufacturing environments, like manufacturing cells or flexible manufacturing systems.
REFERENCES
[1] Varela, L.R., Aparício, J.N., Silva, S.C., An XML Knowledge Base System for Scheduling Problems. Springer-Verlag in the Lecture Notes in Computer Science series - Proceedings of the Innovative Internet Computing System Conference, Kuhlungsborn, Germany, 2002. p. 20-22.
[2] Varela, L.R., Aparício, J.N., Silva, S.C., Scheduling Problems Modeling with XML, Proceedings of the 4th International Meeting for Research in Logistics, Lisbon Portugal, 2002. p. 897-909.
[3] Blazewicz, J., et al, Scheduling Computer and Manufacturing Processes. 1996 Germany: Springer-Verlag.
[4] Brucker, P., Scheduling Algorithms. 1995, Germany: Springer-Verlag.
[5] Jordan, C., Batching and Scheduling. 1996, Germany: Springer-Verlag.
[6] Morton, T., Pentico, D.W., Heuristic Scheduling Systems. 1993, USA: John Wiley & Sons Inc.

International Conference 2ND International Conference on Innovations, Recent Trends and Challenges
in Mechatronics, Mechanical Engineering and New High-Tech Products Development
MECAHITECH‘10
Bucharest, 23-24 September 2010
435
[7] Pinedo, M., Scheduling Theory, Algorithms and Systems. 1995, USA: Prentice-Hall Inc.
[8] Artiba, A., Elmaghraby, S.E., The Planning and Scheduling of Production Systems. 1997, UK: Chapman & Hall.
[9] Goldberg, D. E., Genetic Algorithms in Search, Optimization and Machine Learning. 1989, Addison-Wesley Publishing Company, Inc.
[10] Dagli, C. H., Artificial Neural Networks for Intelligent Manufacturing. 1994, Chapmann & Hall.
[11] Kaskavelis, C. A. and Caramanis M. C., Application of Lagrangian Relaxation Scheduling Based Algorithms to Semicondutor Testing Facility, Technical Paper of the Department of Manufacturing Engineering, Boston University, Boston, 1996.
[12] Zhou, M., Petri Nets in Flexible and Agile Automation. 1995, London: Kluwer Academic Publishers.
[13] Conway, R. W., Maxwell, W. L., Miller, L. W., Theory of Scheduling. 1967, England: Addison-Wesley Publishing Company, Inc.
[14] French, S., Sequencing and Scheduling – An Introduction to Mathematics of the Job-Shop. 1982, John Wiley and Sons, Inc.
[15] Godfrey C. Onwubolu, M. Multingi, Genetic Algorithm for Minimizing Tardiness in Flow-shop Scheduling. Production Planning and Control, 1999. Vol. 10(5): p. 462-471.
[16] Lee, C.Y., Piramuthu, S., Tsai, J.K., Job Shop Scheduling with Genetic Algorithm and Machine Learning. International Journal of Production Research, 1997. Vol. 35(4): p. 1171-1191.
[17] Maimon, O.Z., Bhaha, D., A Genetic Algorithm Approach to Scheduling PCBs on a Single Machine. International Journal of Production Research, 1997. Vol. 34(2): p. 1162-1170.
[18] Varela, M.L.R., Algoritmos Evolutivos Aplicados ao Escalonamento da Produção, Technical Report, 2000. N.º 5, University of Minho, CESP.

International Conference 2ND International Conference on Innovations, Recent Trends and Challenges
in Mechatronics, Mechanical Engineering and New High-Tech Products Development
MECAHITECH‘10
Bucharest, 23-24 September 2010
436
The Hardware Structure of a Robotized System
Used as a Chess Partner
Mihai Avram, Adrian Miu, Victor Constantin, Constantin Bucşan Politehnica University of Bucharest,
Splaiul Independentei 313 , 77206 Bucuresti, [email protected]
ABSTRACT
The paper deals with the building and working of a robotized system used as a partner in the chess game. The hardware structure consists of a pneumatic robot with 4 mobility ranks, an electronic command unit especially designed and built, a sensorial chess board with USB connection and a gripper which was adapted for manipulating the chess figures. The working program for this application may be developed using the graphic programming environment LabView. The algorithms used and the structure of the program will be the subject of a future paper. INTRODUCTION A special type of robots are those intended for entertainment and leisure. In this category may be included: the toy robots, leisure time robot systems, hobby robots, education and training robots. This paper presents an application of a pneumatic robot used as a partner in the chess game. First there were studied the most representative existing such systems. Figure 1 shows a system built with Lego parts. The detection of the chess figures is accomplished by 64 switches mounted under every square of the chess board. The programming language is RCX Movement Programming and the chess engine is WinBoard.
Figure 1: Lego chess playing robot

International Conference 2ND International Conference on Innovations, Recent Trends and Challenges
in Mechatronics, Mechanical Engineering and New High-Tech Products Development
MECAHITECH‘10
Bucharest, 23-24 September 2010
437
Figure 2 shows the Monster Chess system also built with Lego parts. The system allows playing man to computer games, computer to computer games or man to man games with computer control in order to move the figures on the board.
Figure 2: The “Monster Chess” system Figure 3 shows the "2ROBOT" system. The figures are moved by an electric robot. The system acts as a chess trainer, and incorporates teaching modules designed to improve chess knowledge.
Figure 3: The "2ROBOT" system

International Conference 2ND International Conference on Innovations, Recent Trends and Challenges
in Mechatronics, Mechanical Engineering and New High-Tech Products Development
MECAHITECH‘10
Bucharest, 23-24 September 2010
438
Figure 4 shows a complex system incorporating a software for chess figures recognition, no matter the angle of view the chess board is aimed at. Figure 5 shows the working window of the system software.
Figure 4: The system with chess figures recognition Figure 5: The working window Figure 6 shows a robot controlled by a microcontroller of the type Atmega 128. The chess program is written in C language and contains about 65,000 code lines. Every chess figure has a magnet in its base and a Reed relay is mounted under every square of the chess board, in order to determine the figures positions. The chess figures are recognized only by the history of moves, starting from the initial position.
Figure 6: The microcontroller chess robot
THE HARDWARE STRUCTURE OF THE ROBOT A pneumatic robot having 5 mobility ranks [1] is used as a basis for the chess playing robot. The control system of the robot is built around the National Instruments USB-6009 data acquisition board connected to a PC using the USB port, as shown in figure 7. The reasons this DAQ board was chosen are its accessible price and the fact that the

International Conference 2ND International Conference on Innovations, Recent Trends and Challenges
in Mechatronics, Mechanical Engineering and New High-Tech Products Development
MECAHITECH‘10
Bucharest, 23-24 September 2010
439
application doesn't need a high sampling rate. The DAQ board features 12 digital I/O configurable channels. An analyze of the mechanical system of the robot revealed that there are necessary 13 digital input channels and 24 digital output channels. In order to satisfy this requirements an electronic block BE was inserted between the DAQ board and the robot system, its task being to adapt the signals and to realize a serial transfer of the data between the data acquisition system and the robot.
Figure 7: The control system of the robot
The electronic block BE contains 2 x 74HC165 integrated circuits used to serialize the signals read from the robot and 4 x 74HC595 integrated circuits used to transmit the control signals to the system [1]. This way the electronic block is able to transmit 32 output control signals and to receive 16 digital signals. Three signals are generated for every direction of the data transfer. In order to use this robot system as a partner for the chess game it was necessary to find a way to recognize the chess figures and their positions on the chess board. Three solutions were taken into consideration:
- a chess table with 64 proximity sensors, having the advantages of accurate position determination and simplicity of the software; the main disadvantages are the complexity of the construction and the high possibility of failure;
- the determination of the chess figures current position using a video USB camera and the IMAQ software, having the advantage of simple assembly and the disadvantage of high possibility of failure;
- a commercial chess board that can be connected to the PC via USB port (figure 8), having the advantages of the low price, safe working and easy implementation. This solution was the chosen one. Table 1 shows the principle characteristics of the chess board.
Figure 8: The USB chess board

International Conference 2ND International Conference on Innovations, Recent Trends and Challenges
in Mechatronics, Mechanical Engineering and New High-Tech Products Development
MECAHITECH‘10
Bucharest, 23-24 September 2010
440
Table 1 Width 293 mm Length 260 mm Connexion USB Software Two libraries: one for controlling the USB
connexion and the other for the chess game Weight 395g
The following step was to choose a chess program to be integrated within the system, and also three solutions were taken into consideration: - the integration of a free chess program within the application control software developed
using the LabView environment; two programs were taken into consideration: Der Bringer and Jester, but the integration difficulties were insurmountable;
- the communication at the command line level with a Telnet chess server; this would eliminate the local chess program, but the low stability of the chess servers made this solution impracticable;
- the use of the chess program delivered with the chess board; this solution was adopted due to the direct communication with the USB chess board; the communication between this software and the LabView working application is accomplished by some WinAPI subroutines.
The experimental model of the chess playing robot is shown in figure 9.
Figure 9: The experimental model of the chess playing robot
REFERENCES [1] Avram M., Alexandrescu, N., Bucşan C., Hardware and Software Development of an Intelligent Pneutronic Robot, 2010 IEEE International Conference on Automation, Quality and Testing, Robotics (AQTR 2010) THETA 17th edition, pag.239...242;
[2] Avram M., Bucşan C., Modular Pneumatic Robot - Design and working, Mecatronica, nr.1, 2009, pag.1...3;

International Conference 2ND International Conference on Innovations, Recent Trends and Challenges
in Mechatronics, Mechanical Engineering and New High-Tech Products Development
MECAHITECH‘10
Bucharest, 23-24 September 2010
441
Dynamic Model and Control of
Electroactive Polymer Actuators
Ioan Adrian Cosma, Vistrian Mătieş, Rareş Ciprian Mîndru Technical University of Cluj-Napoca,
400641, Cluj-Napoca, Romania, [email protected], [email protected],
ABSTRACT
The aim of the paper is to describe an integrated approach for modeling the dynamic behavior of actuation systems based on electroactive polymer actuators. The mathematical analysis of the system in order to develop the dynamic model is difficult in this case because of the unknown parameters within governing equations, and therefore a new approach is presented. Thus, an actuation system is considered, and its behavior is determined using Matlab Software, D-space platform and an optical sensor, which analyses the position, velocity and acceleration developed by the actuator. The dynamic model of the system is determined in order to further implement it in a model based control technique. The model is generated, using system identification toolbox within Matlab, based on the input and output (response) of the considered system.
INTRODUCTION
The group of electroactive polymers (EAP) is a family of dissimilar technologies, which are producing actuation based on a large variety of transduction phenomena [3]. As the demand for new actuators with better actuation characteristics and smaller sizes increases, the research activity for this type of unconventional actuators, but also on shape memory alloys, piezoelectric materials, gains big amplitude. For this research electroactive polymers in form of Ionic polymer metal composite (IPMC) structures are considered.
IPMC, as a subclass of wet EAP actuators, also referred as ‘artificial muscles’, are composite structures made of ion exchanging membranes (Nafion, Flemion, Aciplex ) and thin layers of metal (Au, Pt)[3][4]. As the most important application field of IPMC actuators is robotics, controlling such actuators presents a significant importance. Their dynamic behavior is studied using an integrated approach in order to generate the model of the considered actuator. Further, a model based control technique is implemented using the previous developed model through system identification method.
EXPERIMENTAL STAND AND METHODOLOGY
As presented in figure 1, the experimental stand for studying the dynamic behavior of actuation systems based on electroactive polymer actuators is compound of: -The physical system: - IPMC actuator;

International Conference 2ND International Conference on Innovations, Recent Trends and Challenges
in Mechatronics, Mechanical Engineering and New High-Tech Products Development
MECAHITECH‘10
Bucharest, 23-24 September 2010
442
- Bernstein OR18LC-DDAP-0000-CLE optical sensor; - PC unit with DS 1104 board and connector panel.
Figure 1: Data acquisition stand for model identification.
Open loop process [6]
The identification process is done by stimulating the system with a step, sinusoidal or random signal and observing the input versus output of the system during a certain period of time, in correlation with the phenomena which underlies the actuation process. The next step involves choosing an appropriate form of the transfer function which will describe the system’s behavior. After the model was identified using System identification toolbox within Matlab Software, the model is tested and if inadequate, the methodology described above is repeated until the new obtained model can be validated. The module based on electroactive polymer as IPMC structure (30X10X0.5mm) and the optical sensor used for measurement are presented in figure 2
Figure 2: Testing module for studying dynamic behavior of actuation
systems based on IPMC actuators In order to activate the IPMC structure using DS 1104 Board, the electrical mounting presented in figure 3 was developed using power transistor NPN BD681 with ICmax=6A and one electrical resistance of RB=360Ω . The base of the transistor is coupled using RB resistance directly to the DSP_PWM1 port of the control board. The optical sensor which analyses the displacement of the actuator is attached to the ADC 1 port of the control board,

International Conference 2ND International Conference on Innovations, Recent Trends and Challenges
in Mechatronics, Mechanical Engineering and New High-Tech Products Development
MECAHITECH‘10
Bucharest, 23-24 September 2010
443
after the response of the sensor was adapted from current response (4-20mA)[8] to voltage response (0..10V) according to the needs of the control board within the stand [9].
a) b)
Figure 3: Power scheme for IPMC actuator a) electrical scheme
b) workable mounting
EXPERIMENTAL RESULTS
The first step before the data acquisition process is to implement the Simulink model presented in figure 4 on the data acquisition board in order to activate the IPMC actuator through the power transistor used. The same model allows data to be acquisitioned. Thus, the upper branch of the model represents the activation of the considered actuator using a PWM signal with a varying the duty cycle, while the lower branch of the model deals with the component which is responsible with the data acquisition and processing from the implemented optical sensor, as the voltage from the sensor is converted in displacement, in velocity and acceleration by deriving once respective twice the acceleration.
Figure 4: The implemented Simulink model on DS 1104 for
the actuator command and data acquisition
Figure 5 presents the interface developed in Control Desk, with the scope of viewing and recording data from the system. The interface permits displaying the command signal and the response of the system in accordance with it, but also modifying the signal used to activate the actuator. The signals used for system identification are presented in the lower

International Conference 2ND International Conference on Innovations, Recent Trends and Challenges
in Mechatronics, Mechanical Engineering and New High-Tech Products Development
MECAHITECH‘10
Bucharest, 23-24 September 2010
444
part of the figure 5 where the input of the system is represented with green and the response -displacement, velocity and acceleration – with red color.
Figure 5: Data sets used for identification process
Within the experiment, there were identified three models (figure 6a - P3DZ, arxqs and n4s2), being different concerning the form of the transfer function adopted for each of the models, but also on the resemblance factor with the measured output.
a)
b) c) d)
Figure 6: System identification toolbox with generated models. Step response and frequency response of models.
Matlab software permits evaluating the quality of the obtained models by comparing the response of the model with the data set used for identification [10]. The obtained results are presented in figure 6 b. The graphs presented in figure 6 c and d are representing the step

International Conference 2ND International Conference on Innovations, Recent Trends and Challenges
in Mechatronics, Mechanical Engineering and New High-Tech Products Development
MECAHITECH‘10
Bucharest, 23-24 September 2010
445
and frequency response of the three models. The graphs presented are the evaluation criteria for choosing the model with the behavior closest to reality. The validated model for a further model based control for the IPMC actuator is P3DZ function, with three poles and one zero, in this case the resemblance with the real system is 85,97%. The validated transfer function is given by G(s):
)exp()+1)(+1)(+1(
+1=)(
321sT
sTsTsT
sTKsG d
ppp
zp (1)
with: Kp = 30.372,Tp1 = 39.003, Tp2 = 0.2424, Tp3 = 0.43956, Td = 0, Tz=-1,7737 Loss function: 0.0104481 si FPE 0.0108646 The parameters that are defining the transfer function represent real aspects within the real system behavior, more exactly: Kp - static gain; Td - input-output delay; Tp - time constant. In order to simulate the model’s response to a PID controller, a Simulink model was developed, model presented in figure 7. A discrete PID controller was used because the input for the previous generated model is represented by PWM duty cycle, with values in [0..1]. Imposing constraints on the response of the model, such as rise time (1sec), settling time (7 sec) and steady state error (<1mm), the obtained parameters for the PID controller are: Kp=1, Ki=1, Kd=1.
Figure 7: Step and sine wave response of obtained P3DZ model

International Conference 2ND International Conference on Innovations, Recent Trends and Challenges
in Mechatronics, Mechanical Engineering and New High-Tech Products Development
MECAHITECH‘10
Bucharest, 23-24 September 2010
446
CONCLUSIONS
The article succeeded to present an integrated approach to determine the dynamical model of actuation systems based on IPMC actuators. The advantage of the method is that despite the complex equations which are underlying the actuation process, the behavior of the actuator can be easily modeled and described. Using the model identification method, the model is automatically generated by Matlab software, the user only has to record input signal and the response of the considered system and to analyze the system in order to generate and validate a model [2]. The models obtained with system identification toolbox are offering well suited and easy to apply solutions for simulations, predictions and control system design of complex systems. The actuation characteristics obtained during the experimental research are concluding that the stroke of the IPMC actuator reaches 2mm, the time response 5 seconds, while the maximum speed and acceleration reached at 1.5mm/s respective 10mm/s2, characteristics which are well suited for novel robotics or biomedical applications.
REFERENCES
[1] Cosma, I.,A., V. Mătieş, C. Lăpuşan, and R. Mîndru. „Modelling of Shape Memory Alloy Actuators Using Matlab and Dspace Platform”, Robotics 2010, Cluj-Napca, Romania, September 2010.
[2] Lăpuşan, C., V. Mătieş and R. Bălan, „ Dezvoltarea modelelor dinamice în proiectarea sistemelor mecatronice utilizând mediul Matlab şi platforma dSpace”, CNET&TE 2009, Cluj-Napoca, Romania, June 2009.
[3] Pons, J. L. „Emerging actuator Technologies, a micromechatronic approach”, John Wiley & Sons Ltd, West Sussex, England, 2005.
[4] Mândru, D., O. Tătar, R. Crişan, and S. Noveanu, „AcŃionari în mecanică fină şi mecatronică”, Alma Mater, Cluj-Napoca, Romania, 2004.
[5] Jung, L.” System identification Theory for User”, Second edition, Prentice Hall, New Jersey, USA, 1999.
[6] Landau, I.D., „Identificarea şi comanda sistemelor”, Ed. Tehnica, Bucuresti, Romania, 1997.
[7] Soderstor, T., P. Stoica, „System identification”, Prentice Hall, Upper Saddle River, New Jersey, USA, 1999.
[8] http://www.bernsteinag.de/cw_bernstein/kunden/bernstein/produktfiles/datasheet/71000 21_de.pdf
[9] http://www.dspace.com/ww/en/pub/home/products/hw/singbord.com
[10] http://www.mathworks.com/products/sysid/

International Conference 2ND International Conference on Innovations, Recent Trends and Challenges
in Mechatronics, Mechanical Engineering and New High-Tech Products Development
MECAHITECH‘10
Bucharest, 23-24 September 2010
447
Working Program for a Chess Playing Robot
Mihai Avram, Adrian Miu, Victor Constantin, Constantin Bucşan
Politehnica University of Bucharest, Splaiul Independentei 313 , 77206 Bucuresti,
ABSTRACT
The paper presents the working program and the algorithm used to control a pneumatic 4-axis, chess playing robot. The hardware structure is comprised of a four axis pneumatic robot, a specialised electronic control system, a chess table connected to the USB port of a computer and a gripper modified for the purpose of grabbing the chess pieces. The application was created using the LabView 7.1 programming enviroment.
INTRODUCTION
The paper centers around the control algorithm created in order to control the chess playing robot. The software and hardware structures are also included in this paper.
Figure 1: The hardware/signal diagram of the system

International Conference 2ND International Conference on Innovations, Recent Trends and Challenges
in Mechatronics, Mechanical Engineering and New High-Tech Products Development
MECAHITECH‘10
Bucharest, 23-24 September 2010
448
THE ALGORITHM The control system used for this task required the creation of a algorithm that would allow the usage of the response received from the USB chess board. As was stated before, the enviroment used to do this is LabView 7.1; fig 2 shows the main steps of the workflow.
Figure 2: The workflow tasks considered for the system The main steps of the considered algorithm are ;
- Start - The actual start of the LabView application;
- Robot initialization. This stage verifies if the robot is in the „0” position and creates the appropriate controls for the Z axis in order to correct any initial errors.
- Software configuration – this stage the user designates three areas of the screen that will need to be clicked on, in order to save the current game from the USB chessboard application.
- Partner move – This stage replicates the human partner’s move. After the user signals the start of the move, the current game is saved by automatically moving the mouse and clicking in all of the previously designated ares.
- Software and hardware control signal generation – After generation the controls default templates for each position are read from text files in order to move the robot in the correct position. This stage also determines if it is necessary to remove a piece from the board
- Robot move – The control file is read one row at a time and the controls are serialised towards the system, with delays and safety limitations at mind.
WORKING PROGRAM FOR THE CHESS ROBOT
As figure 3 shows, the system goes through a initial configuration phase that verifies that the robot is in the initial position and also initially configures the two applications. The applications are started at the same time by pressing the START button comprised in the LabView application.

International Conference 2ND International Conference on Innovations, Recent Trends and Challenges
in Mechatronics, Mechanical Engineering and New High-Tech Products Development
MECAHITECH‘10
Bucharest, 23-24 September 2010
449
Figure 3: Initial look of the computer screen
The next step in the algorithm is the configuration of the PS application: selecting the „Player vs Computer” option and the level of difficulty. The block diagram of the LV application is shown in figure 4
Figure 4: The full block diagram for the program, including subvis

International Conference 2ND International Conference on Innovations, Recent Trends and Challenges
in Mechatronics, Mechanical Engineering and New High-Tech Products Development
MECAHITECH‘10
Bucharest, 23-24 September 2010
450
For diagram size consideration, a series of subvis were created as follows:
- init file – this subivi deletes the contents of the master control file Chess_RUN.txt - conf mouse – the subvi is comprised of specific LabView functions that are used
to determine the current position of the mouse, in screen coordinates. The subvi stores three such coordinates, designated by the user via a left mouse click
- Press ctrl – this subvi follows the current state of the left CTRL key, used to signal the end of the human partner’s move, followed by the saving of the current game and the processing of the stored data.
- Click winapi – saving the current game from the PS application is done via this subvi by automatically left clicking in the previously stored position via the conf mouse subvi. The block diagram for this subvi is shown in figure 5
Figure 5 : The block diagram for the Click winapi subvi - Open ccp – this subvi openes the file that contains the savegame.
<S1 ST="3600" GL="1" S2="P2" SS="S1" S1="P1" DG="1"> <S2 FS="a2" TS="a4" SS="1" SN="S_1" />
<S2 FS="d7" TS="d6" SS="0" SN="S_1" /> <S2 FS="g1" TS="h3" SS="3" SN="S_1" />
<S2 FS="e7" TS="e5" SS="1" SN="S_1" /> <S2 FS="e2" TS="e3" SS="4" SN="S_1" />
<S2 FS="b8" TS="c6" SS="1" SN="S_1" />
- Chess data processing – the subvi is used to extract the last moves from the savegame file (both the human partner’s and the robot’s move.)
- User input – this subvi generates the control file that is needed to execute the current robot move. This subvi also determines if it is necessary to remove a piece from the chessboard. By using the data extracted from the savegame file the application creates the filepath to a previosly created file that contains the necessary controls the move the robot from one position to the next one. There is a file created for every step of the robot’s move, from taking the piece from the

International Conference 2ND International Conference on Innovations, Recent Trends and Challenges
in Mechatronics, Mechanical Engineering and New High-Tech Products Development
MECAHITECH‘10
Bucharest, 23-24 September 2010
451
chessboard, removing a piece if it is necessary and also moving a new piece to a new position.
Root:\Program_Sah\Fisiere_Tip\T step_number \T step_number
_char_1 _char_2 .txt The addressed files differ, from stage to stage, only by the number of the current program on
the controllers. If the game requires the robot to remove a piece from the chessboard, at the start of the master file the sequence needed to pick up the piece and drop it outside the board. In order to determine if a piece needs to be removed from the board a boolean 8 by 8 matrix was stored inside a text file. This matrix represents the busy or free status of each of the squares on the chessboard. Thus, when a piece is moved, the bit associated to the intial square becomes a 0 and the bit for the final square for the move becomes a 1. If the final square is already a 1, the application creates, much like a normal move, the filepath to the files where the moves needed to eliminate the piece are stored.
- 32 bit false – this subvi initialises a 32-bit vector the the value 0 . The vector will be the basis for the controls that are to be applied to the robot .This vector is modified via the x/y controls and x/y app subvis.
- x/y controls – this subvi modified the 32 bit vector, according the the data read from the control file. Thus, the current value read from the file represents the index of the bit from the vector that will be changed to a 1. If the read value is bigger than 0, the bit will become a 1, or if, on the contrary, it is a negative value, the bit will become a 0. Controls are passed from one cycle to the next by using a shift register. The block diagram for the this subvi is shown in figure 6
Figure 6: The block diagram for the x/y controls subvi
- x/y app – the subvi-ul changes the current program from the two controllers using
the same principle from the x/y controls subvi. However, this subvi changes 4 bits at the same time, bits that control the 4 program inputs of the SMC controllers
- write – the subvi shown in figure 6 generates a clock signal and writes the data to
the system. Syncronisation of the signals is done by using a Flat Sequence vi function and by choosing the order in which the vi-s are executed by passing the error from one vi to the next one in the correct order.

International Conference 2ND International Conference on Innovations, Recent Trends and Challenges
in Mechatronics, Mechanical Engineering and New High-Tech Products Development
MECAHITECH‘10
Bucharest, 23-24 September 2010
452
Figure 7: The block diagram for the write subvi
The reading of the data is done by using a While loop that contains the rest of the vi’s, responsible for generating the Load_IN and Clock_IN signals, necessary for the correct syncronisation of data received on the Data_IN pin. The vector obtained is read one bit at a time by using a Index Array vi.
CONCLUSIONS
The robot is capable of playing chess with a human partner, without any intervention. The response of the robot is reasonably quick : the robot’s move is complete within an 40 seconds after the human partner’s move. However, the application supplied with the USB chessboard has not proven to be very reliable as fatal crashes have been known to occur. All in all, the project can be considered a success.
REFERENCES
[1] Avram M., Alexandrescu, N., Bucşan C., Hardware and Software Development of an Intelligent Pneutronic Robot, 2010 IEEE International Conference on Automation, Quality and Testing, Robotics (AQTR 2010) THETA 17th edition, pag.239...242;
[2] Avram M., Bucşan C., Modular Pneumatic Robot - Design and working, Mecatronica, nr.1, 2009, pag.1...3.

International Conference 2ND International Conference on Innovations, Recent Trends and Challenges
in Mechatronics, Mechanical Engineering and New High-Tech Products Development
MECAHITECH‘10
Bucharest, 23-24 September 2010
453
Computerized System for Controlling Package Encasin g
in the Food Industry
Cristian Logofatu; Aurel Abalaru; Daniela Cioboata; Danut Stanciu INCDMTM, Pantelimon Road 6-8, Bucharest,
[email protected] ABSTRACT: The computerized system for controlling package encasing in the food industry is an integrated system of computing and control shall be realized which shall be used for a total control of the encasing of the canned product. Thus, there shall be measured the encasing parameters and the dimensional and shape parameters of the packages subject to the sterilization process to find out defects that may lead in time to the alteration of the content. Keywords: computerized system, encasing of the canned product, sterilization INTRODUCTION
The increase in the national economy competitiveness in producing high quality products in compliance with the international standards and especially, the alignment of quality at technical performances thereof to the requirements imposed by the European Union is one of the main targets. According to the data furnished by the Sanitary Veterinary National Authority for Food Safety (ANSVSA), more than 500 units of the food industry could be closed, unless they are modernized and restructured, so that to comply with the European regulations. The immediate consequences of such situation could be summarized as follows: • a serious risk people’s food safety; • weak presence of the Romanian canned products on the European market though Romania has a high agricultural potential (vegetables, fruits), and the Danube Delta represents a huge fishing capacity (canned fish); • immediate shut-off of all trade agents not complying with the quality regulations of the European Union; • cost price increase of the products, if, due to market requisites, control equipment for the food industry packages are to be imported; • neglecting the scientific capacity of the Romanian researchers and specialists.
The computerized system for controlling package encasing in the food industry, dimensionally verify the packages, according to the European Union regulations, furnishing information on certain parameters that may influence the quality of the canned product and decides if it has any potential risk for consumer’s food safety. The geometrical parameters of the package are extremely important, as the quality of the encasing of such food stuff depends on them. The encasing is one of the most important stages in the technology for canned product manufacturing, being decisive for the conservations interval, and implicitly food safety of such product.

International Conference 2ND International Conference on Innovations, Recent Trends and Challenges
in Mechatronics, Mechanical Engineering and New High-Tech Products Development
MECAHITECH‘10
Bucharest, 23-24 September 2010
454
Considering the long life canned products should have (2-3 years) and the fact that the defects (content alteration)are not immediately detectable, as they appear after a long time and being extremely dangerous for consumer’s health, a special attention should be granted the control of canned stuff packages. SCIENTIFIC AND TECHNICAL DESCRIPTION
From the point of view of the technical and constructive complexity, it was design an integrated system of computing and control shall be realized which shall be used for a total control of the encasing of the canned product. Thus, there shall be measured the encasing parameters and the dimensional, subject to the sterilization process to find out defects that may lead in time to the alteration of the content. From a constructive point of view, the Computerized system for the control of package encasing in the food industry has the following functional structure:
The equipment for checking package encasing. It is an integrated system of optical-electronic control, containing a high resolution video camera and a tele-centric lighting system.
The camera takes over the real image of the encasing (welt) of the controlled package and sends it to the main computer, which display the image on a LCD screen.

International Conference 2ND International Conference on Innovations, Recent Trends and Challenges
in Mechatronics, Mechanical Engineering and New High-Tech Products Development
MECAHITECH‘10
Bucharest, 23-24 September 2010
455
The computer measures the encasing parameters and calculates the real union.
The real union represents the synthesis of all composing elements of the encasing, is expressed in percentages of total union and consists in the welt portion where sealing effectively takes place, by gripping the rubber seal between the hook of the body and that of the tap. A welt is correctly formed when the real union has a value above 50%. Below the mentioned value, the welt may be suspected of leakage. The results of the measurements are displayed on the electronic block and are sent to the main computer.
• The cutting device carries out the cutting of the tin with the view to measuring it, being acted by a mono-phase motor with an electronic command block.
The cutting system is made up of two parallel milling discs, with the width of 0.5 mm, that, by a system of manual advance cuts the falt section that is to be measured. The revolution of the mill may vary between 400rpm and 800 rpm.

International Conference 2ND International Conference on Innovations, Recent Trends and Challenges
in Mechatronics, Mechanical Engineering and New High-Tech Products Development
MECAHITECH‘10
Bucharest, 23-24 September 2010
456
The cutting device is provided with safety systems meant to prevent possible accidents.
In the cutting areas is placed a proximity sensor that validates the presence of the box, and prevents the accidental start of the mill.
Stopping the cutting process is carried out automatically, with a stroke limiter, the operator no longer being required to push another button. The device is also provided with an emergency switch, mushroom-like, that at a simple fast push interrupts the cutting process instantaneously. The device no longer sets in motion until the switch is no longer connected.
The main computer correlated the measurements directly on the package, to those
obtained after encasing and identifies the elements that could cause a defect. The

International Conference 2ND International Conference on Innovations, Recent Trends and Challenges
in Mechatronics, Mechanical Engineering and New High-Tech Products Development
MECAHITECH‘10
Bucharest, 23-24 September 2010
457
measurements bulletin is typed by the editing system of the computer to the complete data of the measurements, including the lot, change, date and time. All these operations are made automatically, with no intervention of the human factor (operator). There is a possibility of printing the real image of the welt for a complex analysis of the material and sealing after the encasing process. All measured date shall be stored for monitoring the entire process in time. Thus, there shall be statistically monitored the evolution of such elements in time and the appropriate measures can be taken as soon as there may be found out deviations from the interval considered normal. The values thus obtained may furnish accurate indices as to the causes having generated an inappropriate encasing. PERFORMANCE AND QUALITY PARAMETERS
The level of performance and quality parameters of the suggested solution can be found in the technical characteristics aimed at by the new product: - the resolution of the measuring system for the linear quotas: 0,01mm; - resolution of the system for the measuring of shape and surface deviations: 0,01mm; - accuracy of measurement: ± 0,01mm; - optical enlargement on the LCD screen: 30X; - parameters measured at encasing: welt thickness and height, tap depth, body hook, tap hook, outer reinforcement and inner indentation (in line with the body union), as well as encasing percentage; - parameters measured for packages: diameter and height on the encasing quota, deviation from surface smoothness of the surface on which encasing is made, circularity (ovality) deviation of the surface on which encasing takes place;
- encasing parameters of the taps: outer diameter, tap height, edge height, area „elongated metal”; - working field: this equipment may control:
- metallic canned products (STAS 1687/81, SR ISO 3004/92, SR ISO 10653/96): ø73mm and ø99mm;
- taps for metallic tins with dimensions: ø73mm and ø99mm. - metallic taps for steel (Twist-Off, PT, etc.) and aluminum (Omnia, Keller, etc.)
recipients. The most used of them are Omnia with the following variants P(pasteurization) and S(sterilization) with the dimensions: ø56mm, ø68mm and ø83mm. Due to the high flexibility provided by the equipment, it may be used for checking an important sort of packages for the food industry. There should be underlined the fact that when designing the equipment, there shall be considered the possibility of permanently adjusting the measuring accuracy and field to the demands of the future beneficiaries. There shall also be considered the future evolution of the field, by the occurrence of new typo-dimensions of packages.
DEGREE OF NOVELTY AND COMPLEXITY
The idea of this project proposal occurred because of the many requests which were received from certain trade agents of the food industry. They are interested in acquiring some systems measuring the encasing, but also the dimensional and shape deviations of the packages that may influence on their encasing. Accurate control systems were requested where the operator’s influence be manifest as little

International Conference 2ND International Conference on Innovations, Recent Trends and Challenges
in Mechatronics, Mechanical Engineering and New High-Tech Products Development
MECAHITECH‘10
Bucharest, 23-24 September 2010
458
as possible to avoid any possibility of occurring objective or subjective errors. For this reason, this project proposes the creation of a computer-assisted system, to carry out the control and monitoring of the technological process for the encasing of packages and to automatically issue the measurement bulletin with all the identification data on it, with no intervention of the operator. Project contribution to the settlement of certain high complexity problems, in the area of industrial applications, is that it settles the problem of encasing control for pack ages used in the food industry . This issue is very important as canned products should resist long time (2-3 years), and the consequences of a package defect (content alteration) are not immediately detectable; occurring after a long time and may become extremely dangerous for consumer’s health. By mathematical models and dedicated measuring software to be worked out, the project directly contributes to the development of new S/T field, determining its research character at the border of scientific and technical border. From this point of view, we should mention: the use of dimensional measurements, and computer-assisted deviations in industrial applications and transfer of the decisional factor of the control operation, from man to computer. The degree of novelty and originality of this project is represented by the creation for the first time of a computerized system for the control of package encasing to be integrated in the manufacturing technology of trade agents producing packages for the food industry and meat, fish, vegetable and fruit canned products, in order to comply with the quality demands set by the European Union. Another objective sustaining the high degree of novelty and originality on international levele of the project is represented by the working out of a dedicated, flexible software, so that the measuring diagram may contain as many data as required by the user of the equipment. This original software shall be designed in a modular (reconfigurable) way as reusable elements. The hardware and software components shall be the basis for the subsequent development, in order to refit the systems and to adjust them to the new types of packages to appear in the future. For this reason, we may say that the project has a high degree of novelty and originality, falling within the major tendencies manifested on international level. CONCLUSIONS The implementation of “Computerized system for controlling package encasing in the food industry”, shall have a significant technical, economic, scientific, and social impact. The technical-economic impact consists in: - the creation of a new, salable product demanded by the market; - the creation of a new product and the implementation of modern technologies for control in the production processes; - increase of consumer’s food safety; - economic growth in regional plan, including in the developed areas, but with a significant potential for the food industry; - increase of the turnover and profit by the significant increase of the productivity, quality and viability; - increase of economic competitiveness by economic re-launching of the field-related trade agents;

International Conference 2ND International Conference on Innovations, Recent Trends and Challenges
in Mechatronics, Mechanical Engineering and New High-Tech Products Development
MECAHITECH‘10
Bucharest, 23-24 September 2010
459
The scientific impact shall be evidenced by: - increase of the personal capacity of research - development; - training young researchers with experience in complex research-development projects; - scientific knowledge obtainable after the completion of the project tat shall be easily usable in other projects; - developing a system of acquisitions and data processing of high velocity; - use of highly accurate mechanical elements; - development of algorithms for the control of products and processes in the food industry. The social impact of implementing the project in the mechanical processing fields shall be significant as well: - boosting the regional economic growth by providing trade units with modern equipment; - increase of the canned stuff production with a positive impact on the raw material
producers; - providing an important data basis for the Romanian technical education; - establishing better labor and life conditions by reducing the risk of occurrence of accidents at the working place; - reducing the level of noise in the canned stuff production units.

International Conference 2ND International Conference on Innovations, Recent Trends and Challenges
in Mechatronics, Mechanical Engineering and New High-Tech Products Development
MECAHITECH‘10
Bucharest, 23-24 September 2010
460
Some Considerations about Pedestrian Biomechanical Behavior
Affected by Audio and Visual Stimuli Perception
Mihaela Baritz, Todor Ana Viorela University Transilvania from Brasov
500036, B-ul Eroilor nr.29, Brasov, Romania, E-mail: [email protected]
ABSTRACT
This paper is a part of a complex research and we aim to present a range of analyzes related to the biomechanical study of the human body stability in normal conditions (pedestrian) but under influences of different audio and/or visual stimuli from internal and/or external sources of automotive. Thus, in the first part of the paper the theoretical aspects of the human body behavior from the point of view of the sensory perceptions (audio or visual), also internal and external forces actions are approached and are established. In the second part of the paper we present the experimental considerations concerning the data acquisition methodology and the experimental setup proposed is described.
INTRODUCTION
"Posture is a composite of the positions of all the joints of the body at any given moment".[1] An ideal posture is defined to be stable because the postural alignment maintains the body's mass over its base of support, also minimizes stress and strain on tissues statically all time and dynamically, during movement and minimizes energy cost .
M usculo-skeletal system
Sensory systems
M otor coordination
Environmental adaptation
Perception and
orientation
Predictive central set
BALANCE
Fig.1.
But in order to analyze, at its entire complexity, the human body balance it is important
to consider a series of factors like: the muscle-skeletal system, sensorial elements

International Conference 2ND International Conference on Innovations, Recent Trends and Challenges
in Mechatronics, Mechanical Engineering and New High-Tech Products Development
MECAHITECH‘10
Bucharest, 23-24 September 2010
461
organization, motor coordination, environmental adjusting, orientation and perception abilities and not last, the central controlled predictive actions set.
Also in order to analyze the way of keeping posture stability, we have in fact to analyze the alignment of the human body about the gravitational axis, called gravitation line. In the sagittal plane, the gravitation line is located in front of the ankle joint's lateral axis, producing an ankle dorsal-flexion moment, requiring activity in the ankle plantar flexors. The line is also anterior to the knee joint's lateral axis, producing a knee extensor moment, requiring no muscle activity, just passive tension in posterior knee ligaments. From the point of view of the position about the hip joint, the gravitation line is placed posterior and lateral, producing a hip extensor moment, necessitating no muscle activity, just passive tension in anterior hip ligaments (iliac-femoral ligament). Gravitational force, acting at a distance from the axis of the hip joint, produces a posterior pelvic tilt. In a closed chain, with the relatively fixed femur, a posterior pelvic tilt produces hip extension. When we discus about gravity’s effect on hip joint movement unilateral stance and because the stance phase of walking occurs in a closed kinetic chain it is necessary to analyze right hip movement by considering the mass superincumbent to the joint as the moving part. By placing the gravity vector (in frontal plane) on the moving part gravity center it will be possible to determine that its force, the weight of superincumbent mass acting to the hip joint, producing adduction of the right hip. When the human subject walks, its pelvis does not drop on the non-stance side because the gravity’s adductor moment is balanced by an equal and opposed abductor moment. THEORETICAL ASPECTS
With the proper physiological background set, it is very important to understand and to coordinate the cooperation and interaction between the different perception systems, particularly the mutual influence of seeing and hearing.
These two systems cooperate in everyday life in the sense that they can support themselves mutually and draw together more usable information from the situation than one system alone.
A typical example is: If we walk on a close road and a car approaches from the rear, then our hearing notices this first; it alarms the entire body, and if sufficient time up to the threatening collision remains, we turn, in order to take the car into inspection and prepare further actions. If there is not sufficient time left for further visual inspection, then we jump immediately to the side.
It can be called this ”a co-operation of the sense systems to survival protection” in a way that the hearing system functions as “early warning system” over the presence of a potential threat, it supplies information about the distance of the threatening object and the remaining time for possible preventive measures. If distance and time are large enough, then a transfer of the auditory to the visual subsystem takes place for controlling the motor function. The visual system can then explore the kind of the object (dimension, color), its position, and direction of motion and speed more exactly.
The above mentioned example highlights a substantial functional difference between seeing and hearing: differences are in spatial and temporal selectivity of them [19].
Like spatial sensitivity, the visual system has a small surface for field of view (fovea), where acuity and color distinction are maximum. With increasing distance from this point (fovea centralis) to the periphery both become worse, but movements can be recognized more easily. The visual field is however altogether limited to approximately half of the

International Conference 2ND International Conference on Innovations, Recent Trends and Challenges
in Mechatronics, Mechanical Engineering and New High-Tech Products Development
MECAHITECH‘10
Bucharest, 23-24 September 2010
462
environment which lies in front of our nose, and with good visibilities we can see several kilometers far. In addition we steer the eyes arbitrarily around so that they can examine fields of the surrounding area more exactly.
Other sensory system from human body cannot be comparable like organization with visual systems. When hearing human subject can perceive spacious information from the environment which surrounds its body, when smelling something similar happens at shorter distance, pressure and temperature are felt at close range by the whole body surface (with regional different resolving power).
Like temporal selectivity there are a lot of differences like: human subject can close its eyes, which temporarily stops working the visual information channel, but he cannot seal the ears, the nose and its skin.
Hearing, smelling and feeling take place all the time - also while is sleeping. The temporarily complete suppression of information other than visual is not possible. The visual system can catch fine and small details from the enormous information offer; on the other hand it misses all the available information which lies outside the field of view. A condition for the survival of an organism equipped with so different systems is the close cooperation and mutual control between these subsystems.
There are many implications because in everyday life human subject has multimodal information about the place of an object or an event: if telephones ring, cars drive, humans speak, then the visible place of the sound agrees with the audible, and he is informed both by the visual and by the hearing system about the place of object or event. The senses cooperate here in the way that they analyzed corresponding information.
Fig.2. Some other researches had demonstrated that the key to robust perception is the
combination and integration of multiple sources of sensory information and they suggest that humans combine the available information using following two strategies: sensory combination and sensory integration.
First strategy – sensory combination - tries to maximize information delivered from the different sensory modalities and the incoming information streams of the environment are processed by the human brain to reconstruct and update a mental image of the scene, with object, event or human subjects. Sometimes the human brain is confronted with ambiguous situations: for example: two trains and one human observer into a train, one stays and the other train starts moving, there is presented with an ambiguous situation: which train starts to
Somatosensory space
Audio space
Visual space
Vestibular space Orientation
point Gait direction
Stability position

International Conference 2ND International Conference on Innovations, Recent Trends and Challenges
in Mechatronics, Mechanical Engineering and New High-Tech Products Development
MECAHITECH‘10
Bucharest, 23-24 September 2010
463
move? This leads the brain to a – right or wrong – answer, if the brain is wrong the illusory self-motion is noticed either when looking out of an opposite window or when a different sensory modality such as the vestibular system disambiguates the situation.
That means it collects more and more information about the perceptual event to finally resolve the ambiguity. If a single modality is not enough, information from several modalities is combined [19]
These collected signals are not redundant; they may be in different units, coordinate systems or about complementary aspects of the same environmental property.
The second strategy is sensory integration and describes interactions between redundant signals. If there is more than one sensory estimate available for perceiving some environmental property, the information has to be integrated so that a coherent multisensory percept is formed.
To come up with the most reliable (meaning unbiased) estimate, the variance of the final estimate should be as low as possible. If the system made 10 estimates of the same environmental property, all 10 would be slightly different due to the fact that every sensory signal is noisy.
The external aspects of the human factor’s mobility, posture and style of displacement may indicate certain instabilities due to sensorial systems. Thus, a person walking with a bowed head watching closely the path depends at a great extent upon the visual system for preserving balance.
Additionally, knowing and recognizing these limitations of the sensorial systems develop within those persons a feeling of fear from falling, clumsy motion due not to the muscular malfunction but to the delayed effects of the somato-sensorial system response and not last to the vestibular system, but also due to the incapacity of realizing the stability and balance limits, which are sometimes being pushed leading to traffic accidents involving pedestrians. EXPERIMENTAL SETUP
Following the human subjects behavior analysis, as pedestrians under visual and audio
stimuli, we analyzed and proposed a modular recording structure, in real time of the human body manifestations within in pre-established environmental conditions. The structure of the recording equipments of the subject’s biomechanical behavior consisted of: Kistler force plate, Bioware and PeopleSize software, anthropometric and subjects dimensional analysis devices, Essilor type Visiotest and various environmental and perturbing noise sources as well as continuous and intermittent light sources.
The main measuring element is the Kistler force plate, which allows the values acquisition for the forces and moments developed by the human body, along the three directions (X, Y and Z), during an established period of time according to the experiment requirements. [10]
The corresponding soft for the values acquisition is Bioware, which allows the recording of the forces and moments values, measured along the three directions by help of some piezzo-electric sensors of the force plate.
The analysis performed upon the subjects started by establishing an investigation protocol, which aimed at a large range of measuring the bipedal stability (big support base with different polygons, small support base trapeze shaped, open eyes and arms along the body, in the same moments of the day – morning) and with different levels and sort of noises or acoustic stimuli. The subjects were subjected to various sounds perturbations, continuous

International Conference 2ND International Conference on Innovations, Recent Trends and Challenges
in Mechatronics, Mechanical Engineering and New High-Tech Products Development
MECAHITECH‘10
Bucharest, 23-24 September 2010
464
or briskly, with different intensities and along various time intervals, with or without hearing protection, especially using loud music or strong noises.
Computer
Amplif ier
OyOx
Oz
Audiometer
Noise dosing appara tus and m icrophone
Visiotest
Force plate Kistler
Continue/intermittent and alternate light sources
Light source
Fig.3.
The used light sources were located in front or lateral about the subjects’ heads (fig.3.), which stood in bipedal position and worked intermittent (stroboscopic), continuous, mono-lateral or bilateral, aiming each time at the simulation of real displacement or stationing conditions in pedestrians’ traffic. [3]
This experimental setup for investigations of human subject biomechanical behavior like pedestrian, proposed by this paper, will be used to analyze different situations in traffic to establish correlations between positions, stability and walking process with sensorial system and also to find some modalities to protect and help pedestrian in traffic conditions. Acknowledgment These researches are part of the Grant PNII-IDEI 722 and 744 with CNCSIS Romania and we’ve developed the investigations with apparatus from these Grants and from Mechatronic Researches Department in University Transilvania of Brasov
REFERENCES
[1] http://moon.ouhsc.edu accessed in July 2010
[2] Arthur D Kuo, An optimal state estimation model of sensory integration in human postural balance J. Neural Eng. 2 (2005) S235–S249;
[3] Baritz M., Cotoros D., Cristea L., Balcu I., Analyses of noise effects on standing human body stability, 9th WSEAS International Conference on SIGNAL, SPEECH AND IMAGE PROCESSING (SSIP '09), Budapesta, sept.2009
[4] A. Tozeren, Human Body Dynamics: Classical mechanics and Human Movement, 2000 Springer-Verlag New York, Inc.ISBN 0-387-98801-7
[5] J. Mrozowski, J. Awrejcewicz, ZMP and GCOM criteria as a base of assessment of the

International Conference 2ND International Conference on Innovations, Recent Trends and Challenges
in Mechatronics, Mechanical Engineering and New High-Tech Products Development
MECAHITECH‘10
Bucharest, 23-24 September 2010
465
human gait stability, Technical University of Łódź,
[6] Y. Jiang, et al., Dynamic studies on human body sway by using a simple model with special concerns on pelvic and muscles roles, Asian Journal of Control, Vol. 8, No. 3, September 2006;
[7] Baritz M., Cotoros D., Cristea L., Rogozea L. Analyze of human body bipedal stability for neuromotors disabilities, BICS'2008, Tg.Mures, Nov.6-7, 2008, ISSN 2065-0418.
[8] S. Mota, R. W. Picard, Automated Posture Analysis for detecting Learner’s Interest Level, MIT Media Laboratory 20 Ames Street Cambridge, MA 02139, USA, 2007;
[9] F. Hlavačka, Human Postural Responses to Sensory Stimulations. Measurements and Model, MEASUREMENT SCIENCE REVIEW, Volume 3, Section 2, 2003;
[10] M. Baritz, L. Cristea, D. Cotoros, L. Rogozea, Human body biomechanical stability evaluation affected by automated movements, 3rd International Conference "Optimization of the Robots and Manipulators" OPTIROB 2008 - PREDEAL Romania, 30 May- 1 June 2008 ;
[11] Kui Fu Chen, Standing Human - an Inverted Pendulum, Lat. Am. J. Phys. Educ. Vol. 2, No. 3, Sept. 2008, ISSN 1870-9095;
[12] J. Polechonski, J. Blaszczyk, The Effect of Acoustic Noise on Postural Sway in Male and Female Subjects, Journal of Human Kinetics volume 15, 2006, 37-52
[13] Baritz, M. et al. Advanced methodology for evaluation of human behavior in technological working activities, 6th International Conference on the Management of Technological Changes, Date: SEP 03-05, 2009 Alexandroupolis GREECE, VOL 1, Pag. 449-452;
[14] Taku Komura, Creating and retargeting motion by the musculoskeletal human body model, The Visual Computer , 16:254–270 Springer-Verlag 2000;
[15] Woojin Park et al., A computer algorithm for representing spatial–temporal structure of human motion and a motion generalization method, Journal of Biomechanics, 2004 Elsevier Ltd.;
[16] Baritz, M; Cotoros, D., Human gait analyzed by complex and interconnected system, PROCEEDINGS 7th WSEAS International Conference on Applied Computer Science (AOS 07), NOV 21-23, 2007 Venice ITALY Pages: 306-309 2007
[17] Baritz M., Correlated and interconnected analyses for human walking and standing biomechanical behavior, WSEAS (ISPRA'10 Cambridge, Anglia, 22-24 febr.2010.
[18] Baritz, M, et al. Retinal image and oculo-motor equilibrium analyze using recordings of human body stability-posture, 9th WSEAS (ISPRA'10), feb.2009 Cambridge ENGLAND
[19] K. Grosse, Audio-Visual Perception in Interactive Virtual Environments, Diploma thesis, 2009, Technische Universität Wien, Austria.

International Conference 2ND International Conference on Innovations, Recent Trends and Challenges
in Mechatronics, Mechanical Engineering and New High-Tech Products Development
MECAHITECH‘10
Bucharest, 23-24 September 2010
466
Influence of Normal Load and Microball Diameter on Rolling Friction
Torque in Microsystems
D. N. Olaru, A. Dumitrascu, C. Stamate and Gh. Prisacaru
Department of Machine Elements and Mechatronics
Technical University “Gheorghe Asachi” –Iasi, Romania [email protected]
ABSTRACT
Using an analytical model and an original microtribometer with two steel rotating discs and three steel microballs the authors determined the influences both of the normal load and the microball diameter on the total rolling friction torque in dry conditions. The tests were realized with normal contact force having values between 8.68 mN and 33 mN and for the following four microball diameters: 1.588 mm, 2mm, 2.5 mm and 4.762 mm The experimental results evidenced that by increasing of the microball diameter an increasing of the total friction torque was obtained. Also, by increasing of the contact normal load the total friction torque increases. Was obtained values of the total friction torque in dry contacts between 10 µNmm and 115 µNmm. The corresponding rolling friction coefficient obtained was between 0.0005 to 0.005.
INTRODUCTION
The use of the rotating microball bearings in the MEMS applications (micromotors, microgenerators, microactuators, micropumps) implies the simplification in construction, low level of the friction, low level of the wear, high stability, and thus the microball bearings seem to be a promising solution for future MEMS applications.
In the last period some experimental evaluations of the global friction in the rotating microball bearings were realized. Ghalichechian et al. [1] experimentally determined the global friction torque in an encapsulated rotary microball bearing mechanism using silicon micro fabrication and stainless steel microballs of 0.285 mm diameter. The global friction torque obtained varied between 5.62 µNm and 0.22 µNm for a rotational speed of 20.5 rad/s, under an axial load of 48 mN. McCarthy et al. [2] experimentally investigated the influence of the speed and of the normal load on the friction torque in a planar-contact encapsulated microball bearing having 0.285 mm diameter steel balls and silicon races. Using the spin-down testing and the hypothesis of the linear dependence between global friction torque and rotational speed, the authors determined the global friction torque for rotational speed between 250 rpm and 5000 rpm and for axial load between 10 mN and 50 mN.
Using the integration of the free oscillations equations of a steel microball on a spherical glass surface, Olaru et al. [3] evaluated the rolling friction torque on the basis of the number and amplitude of the experimentally determined microball oscillations and obtained in dry conditions values for rolling friction torque of 3107.0 −⋅ µNm at a normal load on a microball of 0.04mN.

International Conference 2ND International Conference on Innovations, Recent Trends and Challenges
in Mechatronics, Mechanical Engineering and New High-Tech Products Development
MECAHITECH‘10
Bucharest, 23-24 September 2010
467
To determine only the rolling friction torque in the micro rolling systems Olaru et al. [4] developed in the last time an analytical model based on the dissipation of the inertial energy of a rotating microdisc in three rolling microballs. Using an original microtribometer with two steel rotating discs and three steel microballs having diameter of 1.588 mm Olaru et al. [4] determined the rolling friction torque in dry conditions for contacts loaded with normal forces between 8.68 mN to 33 mN and for rotational speed between 30 to 210 rpm.
Using the analytical model and the original microtribometer developed by Olaru et al. [4], the authors determined the influences both of the normal load and the microball diameter on the total rolling friction torque in dry conditions. This paper presents the most important results.
ANALYTICAL MODEL
Figure 1 presents the new micro tribometer. The driving disc 1 is rotated with a constant rotational speed and has a radial groove race. Three microballs are in contact with the race of the disc 1 at the equidistance position (120 degrees). All the three microballs sustain an inertial disc 2 and are normal loaded with a force 3GQ = , where G is the weigh of the disc 2. When the disc 1 start to rotate with a constant angular speed ω1, the balls start to rolls on the raceway of the disc 1 and start to rotate the inertial disc 2, as a result of rolling friction forces between the balls and the disc 2. As a result of inertial effect the disc 2 is accelerated from zero to the synchronism rotational speed (when ω2 = ω1) in a time t, after that the rotational speed of the disc 1 is stopped. The disc 2 has a deceleration process from the constant rotational speed ω2,0 to his completely stop as a result of the friction in the rolling of the three microballs over the two discs.
Figure 1: General view of the microtribometer
In the deceleration process of the disc 2 when ω2 decreases from a constant value to
zero, the following differential equation can be used:
03)(
222
2
=−⋅⋅−⋅ fMrFdt
tdJ
ϕ (1)
were J is inertial moment for the disc 2, φ2(t) is variation of the angular position of the disc 2 in the deceleration process, F2 is the tangential force developed in the contact between a

International Conference 2ND International Conference on Innovations, Recent Trends and Challenges
in Mechatronics, Mechanical Engineering and New High-Tech Products Development
MECAHITECH‘10
Bucharest, 23-24 September 2010
468
microball and disc 2, r is the radius and Mf is the friction torque developed between the rotating disc 2 and air.
Based on the equilibrium of the forces and moments acting on a microball, equation (1) was solved in [4] and following variation of the angular position φ2(t) was obtained:
b
c
b
b
c
barctgtctg
t2
1ln
2
1ln
)(
2
0,20,2
2
⋅+
+
⋅+⋅−+−=
ωωϕ (2)
where a and b are constants defined by relations: )
43
(
3
2bmrJd
ra
⋅⋅+⋅
⋅= , )
43
( 2b
f
mrJ
cb
⋅⋅+= and
c is a parameter depending on the total friction torque (Mr1 + Mr2) by relation: )( 21 rr MMbac +⋅⋅= .
Also, the analytical variation of the angular speed of the disc 2 in deceleration process results from equation (2):
⋅+⋅−⋅= 0,22 )( ωωc
barctgtctg
b
ct (3)
The inertial effect of the microball is considered by including his mass mb, the friction between the disc 2 and air is considered by the coefficient cf developed in [4], 0,2ω is angular
rotational speed of the disc 2 at the moment of the stopped the rotation of the disc 1 and d is the microball diameter. Mr1 and Mr2 are the rolling friction torques developed in the rolling contact between the microball and the two discs 1 and 2, respectively. Was considered that in dry conditions the rolling friction torque Mr is not depending on the rotational speed.
EXPERIMENTAL INVESTIGATION
Using the new microtribometer presented in figure 1 a lot of experimental investigations was realized to determine the influence of the normal load and ball diameter to the total rolling friction torque. The microtribometer was mounted on the rotational table of the CETR-UMT Tribometer as in figure 3.
To determine the angular acceleration of the disc 2 a high – speed camera Philips SPC900NC/00 VGA CCD with 90 frames/seconds was used to capture the angular position of the disc 2 from the rotational speed 0,2ω to his completely stop. Also, the angular positions
of the disc 1 are captured by camera. In figure 4 are presented the registered positions of the disc 2, and of the disc 1, at a short time t after the stop of the disc 1.
The images captured by the camera was processed frame by frame in a PC using Virtual Dub soft and was transferred in AutoCAD to be measured the angular positions φ2 corresponding to every frame. A white mark was placed both on disc 2 and on disc 1 as it can be observed in the figure 3 and the angular positions φ2(t) was measured according to the reference position of the mark on the disc 1(position at t = 0). The discs 1 and 2 are the steel rings of an axial ball bearing (series 51100) having a rolling path at a radius r = 8.4mm and a transversal curvature radius Rc = 2.63 mm. The inertial disc 2 was machined on external surface by electro erosion to reduce the weight to a minimum of G = 26.05 mN, that means a minimum normal load on every microball Q = 8.68 mN. To increase the normal
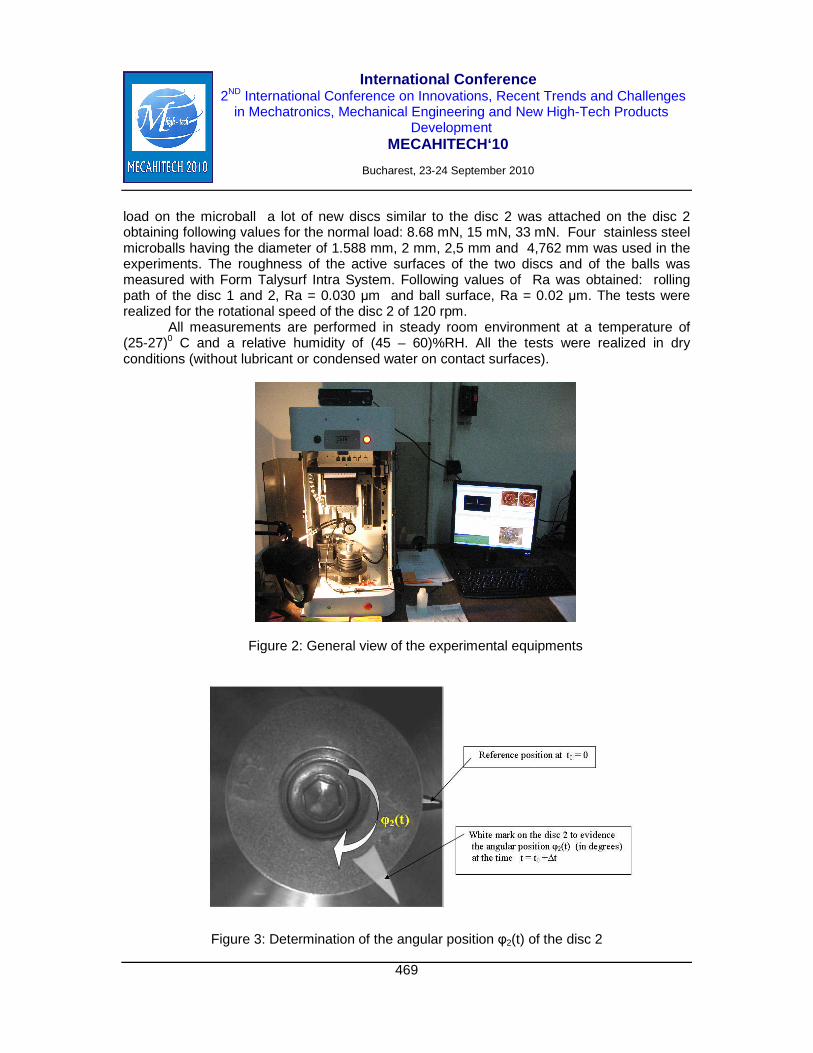
International Conference 2ND International Conference on Innovations, Recent Trends and Challenges
in Mechatronics, Mechanical Engineering and New High-Tech Products Development
MECAHITECH‘10
Bucharest, 23-24 September 2010
469
load on the microball a lot of new discs similar to the disc 2 was attached on the disc 2 obtaining following values for the normal load: 8.68 mN, 15 mN, 33 mN. Four stainless steel microballs having the diameter of 1.588 mm, 2 mm, 2,5 mm and 4,762 mm was used in the experiments. The roughness of the active surfaces of the two discs and of the balls was measured with Form Talysurf Intra System. Following values of Ra was obtained: rolling path of the disc 1 and 2, Ra = 0.030 µm and ball surface, Ra = 0.02 µm. The tests were realized for the rotational speed of the disc 2 of 120 rpm.
All measurements are performed in steady room environment at a temperature of (25-27)0 C and a relative humidity of (45 – 60)%RH. All the tests were realized in dry conditions (without lubricant or condensed water on contact surfaces).
Figure 2: General view of the experimental equipments
Figure 3: Determination of the angular position φ2(t) of the disc 2

International Conference 2ND International Conference on Innovations, Recent Trends and Challenges
in Mechatronics, Mechanical Engineering and New High-Tech Products Development
MECAHITECH‘10
Bucharest, 23-24 September 2010
470
EXPERIMENTAL RESULTS
The total rolling friction torques for all experiments was determined by using equations (2) and (3) applied to the experimental values. So, for every experiment was imposed that at the time tmax the analytical value of the angular position given by equation (2) to be equal with max,2ϕ , where max,2ϕ and tmax were experimentally determined by the high
– speed camera. By imposing this condition resulted numerical values for the total rolling friction torque (Mr1 + Mr2).
With the sum (Mr1 + Mr2) above determined, it was verified by the equation (3) if the angular speed of the disc 2 was stopped at the time experimentally determined tmax.
In figure 4 are presented the variation of the total rolling friction torque (Mr1 + Mr2) with normal load and in figure 5 are presented the variation of the total rolling friction torque (Mr1 + Mr2) with microball diameter.
0
20
40
60
80
100
120
0 5 10 15 20 25 30 35
Normal Load Q (mN)
Tota
l Fric
tion
Torq
ue (µN
mm
)
Db=1.585 mm Db=2 mmDb=2.5 mm Db=4.762 mm
Figure 4: Variation of the total rolling friction torque (Mr1 + Mr2) with normal load
Both increasing of the normal load and of the microball diameter leads to increasing of the total rolling friction torque. These results can be correlated with the other empirical equations used for rolling friction torque in dry contacts.
So, Houpert [ 5] developed for a ball – race contact in a ball bearing following equation for the rolling friction torque caused by elastic hysteresis:
[ ]8063.0*333.133.0
7 )1(10519.31..2
1048.7 −−
⋅== −− kQd
M r (4)
where k* is the ellipticity parameter given by relation ( )cRdk ⋅−= 2/1/1* .

International Conference 2ND International Conference on Innovations, Recent Trends and Challenges
in Mechatronics, Mechanical Engineering and New High-Tech Products Development
MECAHITECH‘10
Bucharest, 23-24 September 2010
471
0
20
40
60
80
100
120
0 1 2 3 4 5
Microball Diameter (mm)
Tota
l Fri
ctio
n To
rque
(µN
mm
)
Q=8.68 mN Q=15 mN Q=33 mN
Figure 5: Variation of the total rolling friction torque (Mr1 + Mr2) with microball diameter
From equation (4) results increasing of the rolling friction torque when increases
normal load and ball diameter but is a different rate of increasing: the exponent of normal load is 1.33 and the exponent of the diameter is 0.33. Results from equation (4) that the contribution of the normal load on the rolling friction torque is higher that the contribution of the ball diameter.
Our experimental results suggest that at microscale the contribution of the microball diameter on the rolling friction torque is higher that the contribution of the normal load.
On the other side, the friction torque Mr obtained by equation (4) for our experimental conditions (d = 1.588 mm to 4.762 mm and normal load Q = 8.68 mN to 33 mN) leads to values of total rolling friction between 0.3 µNmm to 2.5 µNmm. It can be observed that the friction torque generated by hysteresis effect is less of 10% from the measured friction torque. The roughness, the adhesion, the micro sliding can to have important effects on rolling friction torque at the microscale. Future experiments will give quantitative effects of the roughness and adhesion on the rolling friction torque. CONCLUSIONS
The influences both of the normal load and the microball diameter on the total rolling
friction torque in dry conditions have been investigated. The tested was realized with normal contact force having values between 8.68 mN and 33 mN and for the following four microball diameters: 1.588 mm, 2mm, 2.5 mm and 4.762 mm.
The experimental results evidenced that by increasing of the microball diameter an increasing of the total friction torque was obtained. Also, by increasing of the contact normal load the total friction torque increases.

International Conference 2ND International Conference on Innovations, Recent Trends and Challenges
in Mechatronics, Mechanical Engineering and New High-Tech Products Development
MECAHITECH‘10
Bucharest, 23-24 September 2010
472
Was obtained values of the total friction torque in dry contacts between 10 µNmm and 115 µNmm. ACKNOWLEDGEMENTS
This paper was realised with the support of Grant CNCSIS ID_607 No. 381/1.10.2007 and BRAIN “Doctoral scholarships as an investment in intelligence” project, financed by the European Social Found and Romanian Government. REFERENCES [1] Ghalichechian, N., Modafe, A., Beyaz, M. I., Ghodssi, R., (2008): Design, Fabrication, and Characterization of a Rotary Micromotor Supported on Microball Bearings. Journal of Microelectromechanical Systems 17, p. 632-642 [2] McCarthy, M., Waits, C. M., Ghodssi, R., (2009): Dynamic Friction and Wear in a Planar-Contact Encapsulated Microball Bearing Using an Integrated Microturbine. Journal of Microelectromechanical Systems 18, p. 263-273 [3] Olaru, D. N., Stamate, C., Prisacaru, Gh., (2009): Rolling Friction in a Microtribosystem.
Tribology Letters 35, p. 205-210
[4] Olaru, D.N.,Dumitrascu, A., Stamate, C., Prisacaru, Gh.,Rolling Friction Torque in
Microsystems, Proc. of the 15th International Conference VAREHD, 4-6 May, (2010)
[5] Houpert, L., Numerical and Analytical Calculations in Ball Bearing, in Proc. of 8th European Space Mechanism and Tribology Symp., Toulouse, France (1999)

International Conference 2ND International Conference on Innovations, Recent Trends and Challenges
in Mechatronics, Mechanical Engineering and New High-Tech Products Development
MECAHITECH‘10
Bucharest, 23-24 September 2010
473
Nanotechnology and Solar Cells
Sorea Sorin, Popan Gheorghe, Atanasescu Anca
National Institute of Research and Development in Mechatreonics and Measurement Technique Şos. Pantelimon 6-8, sector 2, Bucharest, ROMANIA
ABSTRACT:
Nanotechnology is one of the world's fastest-growing technology. A relatively new area in producing solar cells has emerged using nanotechnology. Here is a short presentation of the solar cells and new materials and nanotehnologies. The nanotechnology devices could open a potential avenue to improved solar power efficiency in so-called 3rd Generation solar technology. The solar cells are devices that convert the energy of sunlight directly into electricity by the photovoltaic effect. Sometimes the term solar cell is reserved for devices intended specifically to capture energy from sunlight such as solar panels and solar cells, while the term photovoltaic cell is used when the light source is unspecified. Assemblies of cells are used to make solar panels, solar modules, or photovoltaic arrays. Photovoltaics is the field of technology and research related to the application of solar cells in producing electricity for practical use. The most commonly known solar cell is configured as a large-area p-n junction made from silicon by diffusing an n-type dopant into one side of a p-type wafer (or vice versa). When the electrons diffuse across the p-n junction, they recombine with holes on the p-type side. The diffusion of carriers does not happen indefinitely, however, because charges build up on either side of the junction and create an electric field. The electric field creates a diode that promotes charge flow, known as drift current, that opposes and eventually balances out the diffusion of electrons and holes. This region where electrons and holes have diffused across the junction is called the depletion region (the space charge region) because it no longer contains any mobile charge carriers. Photovoltaic panels are normally made of either silicon or thin-film cells: Many currently available solar cells are configured as bulk materials that are subsequently cut into wafers and treated in a "top-down" method of synthesis (silicon being the most prevalent bulk material). Other materials are configured as thin-films (inorganic layers, organic dyes, and organic polymers) that are deposited on supporting substrates, while a third group are configured as nanocrystals and used as quantum dots (electron-confined nanoparticles) embedded in a supporting matrix in a "bottom-up" approach. SILICON PROCESSING Silicon wafer-based solar cells The photovoltaics market is still dominated by silicon wafer-based solar cells (first-generation solar cells). This means that most solar cell manufacturers are currently equipped to produce this type of solar cells. Consequently, a large body of research is being done all

International Conference 2ND International Conference on Innovations, Recent Trends and Challenges
in Mechatronics, Mechanical Engineering and New High-Tech Products Development
MECAHITECH‘10
Bucharest, 23-24 September 2010
474
over the world to manufacture silicon wafer-based solar cells at lower cost and to increase the conversion efficiencies without an exorbitant increase in production cost. THIN-FILM PROCESSING Thin-film photovoltaic cells can use less than 1% of the expensive raw material (silicon or other light absorbers) compared to wafer-based solar cells, leading to a significant price drop per Watt peak capacity. There are many research groups around the world actively researching different thin-film approaches and/or materials. [1] One particularly promising technology is crystalline silicon thin films on glass substrates. This technology combines the advantages of crystalline silicon as a solar cell material (abundance, non-toxicity, high efficiency, long-term stability) with the cost savings of using a thin-film approach.[2][3] Transparent conducting film Many new solar cells use transparent thin films that are also conductors of electrical charge. The dominant conductive thin films used in research now are transparent conductive oxides (abbreviated "TCO"), and include fluorine-doped tin oxide (SnO2:F, or "FTO"), doped zinc oxide (e.g.: ZnO:Al), and indium tin oxide (abbreviated "ITO"). These conductive films are also used in the LCD industry for flat panel displays. The dual function of a TCO allows light to pass through a substrate window to the active light-absorbing material beneath, and also serves as an ohmic contact to transport photogenerated charge carriers away from that light-absorbing material. The present TCO materials are effective for research, but perhaps are not yet optimized for large-scale photovoltaic production. They require very special deposition conditions at high vacuum, they can sometimes suffer from poor mechanical strength, and most have poor transmittance in the infrared portion of the spectrum (e.g.: ITO thin films can also be used as infrared filters in airplane windows). These factors make large-scale manufacturing more costly. NANOPARTICLE PROCESSING Experimental non-silicon solar panels can be made of quantum heterostructures, e.g. carbon nanotubes or quantum dots, embedded in conductive polymers or mesoporous metal oxides. In addition, thin films of many of these materials on conventional silicon solar cells can increase the optical coupling efficiency into the silicon cell, thus boosting the overall efficiency. By varying the size of the quantum dots, the cells can be tuned to absorb different wavelengths. Although the research is still in its infancy, quantum dot modified photovoltaics may be able to achieve up to 42% energy conversion efficiency due to multiple exciton generation (MEG).[4] A relatively new area has emerged using carbon nanotube networks as a transparent conductor for organic solar cells. Nanotube networks are flexible and can be deposited on surfaces a variety of ways. With some treatment, nanotube films can be highly transparent in the infrared, possibly enabling efficient low-bandgap solar cells. Nanotube networks are p-type conductors, whereas traditional transparent conductors are exclusively n-type. The availability of a p-type transparent conductor could lead to new cell designs that simplify manufacturing and improve efficiency.

International Conference 2ND International Conference on Innovations, Recent Trends and Challenges
in Mechatronics, Mechanical Engineering and New High-Tech Products Development
MECAHITECH‘10
Bucharest, 23-24 September 2010
475
The solar cell developed at New Jersey Institute of Technology (NJIT) uses a carbon nanotubes complex, which by the way, is a molecular configuration of carbon in a cylindrical shape. The name is derived from the tube’s miniscule size. Scientists estimate nanotubes to be 50,000 times smaller than a human hair. Nevertheless, just one nanotube can conduct current better than any conventional electrical wire. “Actually, nanotubes are significantly better conductors than copper,” Infrared solar cells Researchers at Idaho National Laboratory, along with partners at Microcontinuum Inc.[5] in Cambridge, MA and University of Missouri, have devised an inexpensive way to produce plastic sheets containing billions of nanoantennas that collect heat energy generated by the sun and other sources. The technology is the first step toward a solar energy collector that could be mass-produced on flexible materials. The nanoantennas target mid-infrared rays, which the Earth continuously radiates as heat after absorbing energy from the sun during the day; also double-sided nanoantenna sheets can harvest energy from different parts of the Sun's spectrum. In contrast, traditional solar cells can only use visible light, rendering them idle after dark. UV solar cells Japan's National Institute of Advanced Industrial Science and Technology (AIST) has succeeded in developing a transparent solar cell that uses ultraviolet (UV) light to generate electricity but allows visible light to pass through it. Used to replace conventional window glass, the installation surface area could be large, leading to potential uses that take advantage of the combined functions of power generation, lighting and temperature control. 3D solar cells Three-dimensional solar cells that capture nearly all of the light that strikes them and could boost the efficiency of photovoltaic systems while reducing their size, weight and mechanical complexity. The new 3D solar cells capture photons from sunlight using an array of miniature “tower” structures that resemble high-rise buildings in a city street grid.[6] Metamaterial Metamaterials are heterogeneous materials employing the juxtaposition of many microscopic elements, giving rise to properties not seen in ordinary solids. Using these, it may become possible to fashion solar cells that are excellent absorbers over a narrow range of wavelengths. Photovoltaic thermal hybrid solar collector Systems which combine photovoltaic with thermal solar, the advantage of such a system is that the thermal solar part carries heat away and cools the photovoltaic cells, keeping temperature down lowers the resistance and improves the cell efficiency.[7]
The ultimate goal for both wafer-based and alternative photovoltaic concepts is to produce solar electricity at a cost comparable to currently market-dominant coal, natural gas, and nuclear power in order to make it the leading primary energy source. To achieve this it may be necessary to reduce the cost of installed solar systems from currently about US$ 1.80 (for bulk Si technologies) to about US$ 0.50 per Watt peak power.[8] Since a major part of the final cost of a traditional bulk silicon module is related to the high cost of solar grade polysilicon feedstock (about US$ 0.4/Watt peak) there exists substantial drive to make Si

International Conference 2ND International Conference on Innovations, Recent Trends and Challenges
in Mechatronics, Mechanical Engineering and New High-Tech Products Development
MECAHITECH‘10
Bucharest, 23-24 September 2010
476
solar cells thinner (material savings) or to make solar cells from cheaper upgraded metallurgical silicon . REFERENCES [1] M. A. Green, "Consolidation of Thin-film Photovoltaic Technology: The Coming Decade
of Opportunity," Progress in Photovoltaics: Research and Applications.
[2] P. A. Basore, "CSG-1: Manufacturing a New Polycrystalline Silicon PV Technology," in Conference Record of the 2006 IEEE 4th World Conference on Photovoltaic Energy Conversion, Hawaii
[3] M. A. Green, P. A. Basore, N. Chang, D. Clugston, R. Egan, R. Evans, D. Hogg, S. Jarnason, M. Keevers, P. Lasswell, J. O'Sullivan, U. Schubert, A. Turner, S. R. Wenham, and T. Young, "Crystalline silicon on glass (CSG) thin-film solar cell modules," Solar Energy
[4] "Peter Weiss". "Quantum-Dot Leap". Science News Online.
[5] MicroContinuum, Inc
[6] 3D Solar Cells Boost Efficiency While Reducing Size, Weight and Complexity of Photovoltaic Arrays
[7] S.A. Kalogirou, Y. Tripanagnostopoulos (2006). "Hybrid PV/T solar systems for domestic hot water and electricity production". Energy Conversion and Management.
[8] R. M. Swanson, "A Vision for Crystalline Silicon Photovoltaics," Progress in Photovoltaics: Research and Applications.
International Conference 2ND International Conference on Innovations, Recent Trends and Challenges
in Mechatronics, Mechanical Engineering and New High-Tech Products Development
MECAHITECH‘10
Bucharest, 23-24 September 2010
477
Improving the Delivery Performance of the WLC conce pt
N.O. Fernandes1, S. Carmo-Silva2
1 Dept of Industrial Engineering, Polytechnic Institute of Castelo Branco, Av. do Empresário, 6000-767, Castelo Branco – Portugal, [email protected]
2 Dept of Production and Systems, University of Minho, Campus de Gualtar, 4710-057, Braga – Portugal, [email protected]
ABSTRACT
Order release based on Workload Control (WLC) is an important instrument to achieve short and predictable flow times and thus to improve the delivery performance of make-to-order enterprises. In this paper, we report a simulation study on the role of order release and dispatching in the delivery reliability of these enterprises. Two order release procedures and two types of dispatching rules were evaluated assuming the continuous release of orders to the shop floor. The obtained results provide new directions for the development of the release and dispatching functions of WLC concepts.
INTRODUCTION
An issue of particular concern for many manufacturing enterprises, particularly make-to-order (MTO), is the ability to delivery their products on time. Short and reliable due dates and consequently short and predictable flow times are an important goal for these enterprises, especially when they increasingly need to offer more customized and unique products in order to attract customers. To attain this goal the production planning and control (PPC) system must be designed appropriately.
Workload Control (WLC) is a Production, Planning and Control (PPC) concept with particular relevance to the MTO and the job shop production [1]. It has been described in many publications since the 1980s, e.g., [2], [3], [4], [5] and [6].WLC emphasis is on firmly controlling orders’ flow times through the whole production system by means of input and output control decisions.
WLC assumes that by controlling the workloads on the shop floor, short and predictable flow times may be achieved and the lead time syndrome [7] may be prevented. This makes order release (input control) as an essential decision function and a core part of WLC [8]. Order release aims at restrict and balance workload on the shop floor and across capacity groups, i.e., groups of capacity resources. An important part of the research developed on the WLC concept is related to the order release function. For an overview see [9]; for setting order release parameters see [10]; for implementing issues see [11] and [12]; for workload norms considerations and the influence of the flow characteristics see [13] and [14]; for decision on grouping machines and on the control of capacity groups see [15]; for setup considerations see [16].
A common denominator in this body of work is the use of (1) a pre-shop pool that buffers the shop floor against the external dynamics and (2) an order release mechanism that decides on the release of individual orders. Once released, the progress of the orders on the shop floor is controlled by priority dispatching rules in the queues of the capacity groups.

International Conference 2ND International Conference on Innovations, Recent Trends and Challenges
in Mechatronics, Mechanical Engineering and New High-Tech Products Development
MECAHITECH‘10
Bucharest, 23-24 September 2010
478
A key indicator of delivery reliability performance often used in practice is the percentage of orders (jobs) delivered late i.e. the percentage of tardy jobs. A high tardiness percentage can result from either: (1) a high average lateness; or (2) a high variance of lateness across orders. This paper concentrates on the contribution of order release and dispatching for improving the delivery reliability performance of manufacturing systems. The relevance of this investigation is confirmed by a recent empirical research [17] indicating that companies continue to have inadequate planning information for sales decisions and that management should pay more attention to the pre-production phase where there is the potential to make significant logistic improvements.
The remainder of the paper is organized as follows. The following Section describes the order release and dispatching functions within WLC. Next, the simulation study, involving the simulation model, the experimental design and the performance measures, is detailed and the simulation results are presented and analysed. Concluding remarks and directions for future research work are put forward in last Section of the paper.
ORDER RELEASE FOR WORKLOAD CONTROL
Within WLC an order release mechanism is used to determine the time and the orders to release into the shop floor. This mechanism considers both, (1) the relative urgency of the orders, which is designated as the timing function of the mechanism and (2) the current shop floor situation in terms of the workload in each capacity group, which is designated as the balancing function.
The pool of orders is usually assessed periodically, at the beginning of each release period T and those orders with a planned release date within a time limit from the current date are considered for release. The planned release date (PRD) of an order is determined by backward scheduling from the due date using the lead times of each capacity group in the routing of the order. To determine their relative urgency, the orders in the pre-shop pool are sequenced accordingly to the PRD value. To restrict and balance workload on the shop floor and across capacity groups, an order j is released only if it doesn’t violate the workload norm ∆w of each required capacity group w in the orders’ routings (set Sj). Two basic release or trigger procedures are as follows [9]:
Procedure I: (1) Procedure II: (2) Where, Lw is the current workload of w, djw is a depreciation factor for workload
accounting and pjw the operation processing time of j at w. The depreciation factor determines the fraction of pjw i.e., the parcel that is accounted for the direct workload of w.
While procedure I is focused on balancing the direct loads across capacity groups, by releasing only those orders whose workload contribution ) do not make any workload norm to be exceed, procedure II relax this focus and try to keep the priority of urgent orders. Phan et al. [18] compares both procedures by means of a simulation study. Authors showed that a small percentage of tardy jobs can be achieved by release procedure I. Whether the combination of both procedures gives place to improved delivery performance remains to be investigated.

International Conference 2ND International Conference on Innovations, Recent Trends and Challenges
in Mechatronics, Mechanical Engineering and New High-Tech Products Development
MECAHITECH‘10
Bucharest, 23-24 September 2010
479
Once an order is released, the workload of each capacity group in the order’s routing is updated with the load contribution of the selected order. The release procedure is repeated until all orders in the pre-shop pool have been considered for release.
Previous studies on periodic order release, e.g., [19] and [10] showed that the release period T, i.e., the time period between two consecutive executions of the order release procedure, may have an important influence on the delivery performance. Long release periods may unnecessarily delay orders in the pre-shop and increase the system flow times. Short release periods may hold back the release of large orders that do not fit workload norms and thus negatively affecting the timing of release. Continuous order release does not need the specification of the release period parameter. The release of orders into the shop floor is allowed at any time during the system operation. Continuous order release may hinder the release of large orders, but it has the advantage of leading to a continuous updating of the shop floor control situation with improved smoothing and stabilization of workload at capacity groups. Though most of the past research on the WLC concept has been focused on periodic order release, continuous order release reflects the competitiveness of industry and the short lead time expectations of customers. Order release mechanisms that implement continuous release have been suggested by [20], [21], [22] and [23].
To control the progress of the orders through the shop floor simple dispatching rules are used. The First-Come-First-Serve (FCFS) dispatching rule is commonly used, supporting the predictability of flow times. These, in turn, are used to establish accurate planned release dates for the orders. Due date oriented dispatching rules may also be used, as a means to reduce lateness variation across orders and thus influencing the percentage of tardy jobs.
As due date compliance is the primary concern of MTO enterprises, this study concentrates on investigating the influence the above referred order release and dispatching strategies with regard to delivery reliability performance. In particular the paper explores ways for reducing the percentage of tardy jobs under WLC.
SIMULATION STUDY
The simulation study was carried out using the Arena® software. The following sections details the simulation model, the experimental design and the performance measures used in the study.
Simulation Model
The study is based on a small job shop model described in [24] and used in several simulation studies of the WLC concept such as [13], [10] and [14]. This allows comparing simulation results of this study with the referred studies. The model consists of a shop with six capacity groups, each with a single multipurpose machine. Machines’ capacity is equal and remains constant over time. A machine can perform only one operation at a time on any order (job) and an operation of an order can be performed by only one machine at a time. Job pre-emption is not allowed in the simulation. The routing lengths are uniformly distributed between one and six operations, without return visits. Processing times are stochastic, following a 2-Erlang distribution with a mean µ of 1 time unit per order and assumed to be identical for all the operations of an order. Set-up times are defined to be sequence

International Conference 2ND International Conference on Innovations, Recent Trends and Challenges
in Mechatronics, Mechanical Engineering and New High-Tech Products Development
MECAHITECH‘10
Bucharest, 23-24 September 2010
480
independent and are modelled as part of the operation processing times. The mean inter-arrival time of orders results in a machine utilisation rate of 90%. The externally set due dates of the orders are determined by the order arrival time at the system plus a uniformly distributed due date allowance. The simulated shop characteristics are summarised in Table1.
Table 5 Simulated shop characteristics
Shop type job shop Routing sequence Random routing, no re-entrant flows Operations per order Discrete uniform [1, 6] Operation processing times 2-Erlang with a mean of 1 time unit Inter-arrival times Exponential distributed Due-date allowance Uniform [35, 60] time units
Design of Experiments
Table 2 summarises the different experimental settings. Two order release procedures were applied in this study, namely:
• Procedure I, as described in the previous section; • Hybrid. If a product in the pre-shop pool becomes urgent, it should be released in
order to achieve on-time delivery. Due to the importance of releasing urgent orders to management objectives, the release probability for these orders should be increased. Hybrid combines both procedures I and II, to do so. Under hybrid release, procedure I is used for releasing non-urgent orders and procedure II is used for releasing urgent orders.
Two dispatching rules were also applied for prioritizing the orders on capacity groups: • First-Come-First-Served (FCFS), where the sequence of the orders in the
outgoing flow at a capacity group is the same as the sequence in the incoming flow. FCFS is a flow conserving rule most often used;
• Operation planned starting date (OSD), which is intended to reduce job lateness variation. The OSDjs of an order j on a capacity group s is determined by backward scheduling from the due date using the lead times of the operations still to be done.
Workload norms were tested at twelve levels of restriction. These are deterministic parameters, setting the maximum workload that can be released from the pre-shop pool to each capacity group. In the simulation, workload norms are stepwise down, in order to gradually increase the level of restriction to order release.
Table 2 Experimental settings
Experimental factor Level 1 Level 2 Release procedure I hybrid (I and II) Dispatching rule FCFS OSD Workload norms tested 12 levels of restriction
Table 3 summarise the control strategies A1 to A4 that result from combining the above

International Conference 2ND International Conference on Innovations, Recent Trends and Challenges
in Mechatronics, Mechanical Engineering and New High-Tech Products Development
MECAHITECH‘10
Bucharest, 23-24 September 2010
481
release procedures and dispatching rules. The resulting strategies have different implications for shop floor control and performance. On one extreme strategy A1 is focused on providing capacity groups with a good workload balancing over time and in assuring the predictability of flow times to control the average lateness of the orders and thus to achieve high delivery reliability. On the other extreme strategy A4 puts the emphasis on keeping the priority of urgent orders at release and on the capacity groups of shop floor to reduce the dispersion of the lateness across the orders and thus to improve the delivery reliability.
Table 3 Control strategies resulting from combining release procedures and dispatching rules
Dispatching rule Release procedure FCFS OSD
I A1 A2 Hybrid A3 A4
These four strategies are implemented in the simulation study under the assumption of
continuous order release. Workloads are estimated using the corrected aggregate load conversion method [13]. Under this method the workload contribution of an order, at the moment of release, to the workload of a capacity group is the depreciation parcel referred in the previous section, which is determined according to the position of the capacity group in the routing of the order. The further downstream a capacity group is in the routing of an order, the higher the depreciation (i.e. the lower is).
During simulation runs, data were collected under system steady-state. The length of each simulation run was for 60,000 time units, in which the first 10,000 time units were considered as the warm-up period. The average values of 100 replications are presented as results. The statistical analysis was performed using the paired Student t-test with a 95% confidence level.
Performance measures
The key results we focus upon are the percentage of tardy jobs, the standard deviation of the lateness and system and shop flow times. Shop flow time refers to the time that elapses between order release and its completion and describes the performance of the shop floor. System flow time, which incorporates the pool delay, provides an overview of the performance across the whole system. The standard deviation of lateness is a measure of how spread out a lateness distribution is. It is used as an indicator of timing performance, i.e. it indicates how close to their due dates the completions of the orders are. The percentage of tardy jobs refers to orders (jobs) that are completed after the due date.
SIMULATION RESULTS AND ANALISYS
An overview of the system performance under the four control strategies is presented in Figures 1, 2 and 3. Periodic order release under release procedure I and FCFS dispatching with T equal to five time units was also simulated for comparison purpose. The average shop flow time is set on the horizontal axis. The three measures of delivery performance, namely average system flow time, percentage of tardy jobs and standard

International Conference 2ND International Conference on Innovations, Recent Trends and Challenges
in Mechatronics, Mechanical Engineering and New High-Tech Products Development
MECAHITECH‘10
Bucharest, 23-24 September 2010
482
deviation of the lateness are set on the vertical axis of Figures 1, 2 and 3, respectively.
20
25
30
35
5 10 15 20 25 30
Sy
ste
m f
low
tim
e (
tim
e u
nit
s)
Shop flow time (time units)
Periodic
A1
A2
A3
A4
Figure 1 Time in system performance of control strategies.
0
5
10
15
20
5 10 15 20 25 30
% T
ard
y
Shop flow time (time units)
Periodic
A1
A2
A3
A4
Figure 2 Percentage of tardy jobs.
10
15
20
25
30
5 10 15 20 25 30
STD
Late
ne
ss (
tim
e u
nit
s)
Shop flow time (time units)
Periodic
A1
A2
A3
A4

International Conference 2ND International Conference on Innovations, Recent Trends and Challenges
in Mechatronics, Mechanical Engineering and New High-Tech Products Development
MECAHITECH‘10
Bucharest, 23-24 September 2010
483
Figure 3 Standard desviation of the lateness. The points on each logistic performance curve represent twelve workload norm levels
simulated. The utmost right point of each curve results from an unrestricted norm level. This means that each time order release is activated all orders due to release are in fact released. By tightening workload norms stepwise down, the system and the shop flow time are reduced, except for strategy A4, until a critical workload level where system flow time stops decreasing, see Figure 1. Taking for example the logistic performance curve of the periodic release procedure this critical level is reached for a shop flow time of 18.6 time units and a system flow time of 27.4 time units (square mark). Below this critical workload level, the increase of the system flow time means that the decreased waiting times on the shop floor are no longer compensated by the increased waiting times in the pre-shop pool. Thus, to avoid deterioration of the system flow time, workload norms cannot be set excessively tight.
Figure 2 shows that, for the percentage of tardy jobs, continuous order release, which is adopted in strategies A1 to A4, outperforms periodic order release for almost the all range of workload norms. For strategies A1 and A3 this results from decreasing the system flow time (Figure 1), while for A2 and A4 this results from reducing both, the system flow time and the dispersion of the lateness across orders, particularly, under loose workload norms (right part of the curves), Figure 3.
A particularly striking finding from results is the lowest value of the percentage of tardy jobs that can be achieved by strategy A2. In this case only 1.1% of jobs are tardy. This is achieved for a workload norm that results in a shop flow time of 20.3 time units, figure 2. This means a 70% reduction of the percentage of tardy jobs relatively to the situation of immediately release (utmost right point of the curve), where 3.7% of the jobs are tardy.
From results we may conclude that strategies A3 and, particularly A4 (both with hybrid release), show poor load balancing qualities, when compared with strategy A1 and strategy A2 where the release procedure I is implemented, as revealed by the low system flow time. Strategies A2 and A4 show improved timing qualities (particularly for loose workload norms) when compared with strategies A1 and A3, as revealed by the low variation of orders’ lateness. Apparently the adoption of the delivery date oriented dispatching rule OSD, which look after the handling of urgent orders, explains this behaviour.
CONCLUSIONS
In this paper the performance of two order release procedures and two types of dispatching rules, under the assumption of continuous order release, was investigated by means of a simulation study. It was shown that continuous order release allows reducing the percentage of tardy jobs when compared with periodic order release. It was also shown that reducing the percentage of tardy jobs involve: (1) keeping the queues on the shop floor short and stable by releasing only those orders that provide capacity groups with a good workload balancing over time; (2) controlling the progress of urgent orders on the shop floor thought due date oriented dispatching.
Future planned research work will extend the study to include output (capacity) control decisions, delivery time promising and order acceptance rules.

International Conference 2ND International Conference on Innovations, Recent Trends and Challenges
in Mechatronics, Mechanical Engineering and New High-Tech Products Development
MECAHITECH‘10
Bucharest, 23-24 September 2010
484
REFERENCES
[9] Stevenson, M. Huang, Y. and Hendry, L. “The development and application of an interactive end-user training tool: part of an implementation strategy for workload control.” Production Planning and Control. 2009; 20(7), 622-635.
[10] Bertrand, J.W.M. and Wortmann, J.C. “Production Control and Information Systems for Component—Manufacturing Shops.” Elsevier, Amsterdam, 1981.
[11] Bechte, W. “Load oriented manufacturing control just in time production for job shops.” Production Planning and Control. 1994; 5(3), 292-307.
[12] Wiendahl, H.-P. “Load-Oriented Manufacturing Control.” Springer, Berlin, 1995.
[13] Kingsman B.G. “Modelling input–output workload control for dynamic capacity planning in production planning systems.” International Journal of Production Economics. 2000; 68, 73–93.
[14] Stevenson, M. and Hendry, L.C. “Aggregate load-oriented workload control: A review and a re-classification of a key approach.” International Journal of Production Economics. 2006; 104, 676–693.
[15] Plossl, G.W. “Throughput time control.” International Journal of Production Research 1988; 26 (3), 493–499.
[16] Missbauer, H. “Models of the transient behaviour of production units to optimize the aggregate material flow.” International Journal of Production Economics. 2009; 118(2), 387-397.
[17] Land, M. “Workload control in job shops, grasping the tap”. Ridderkerk: Labyrinth Publications, 2004.
[18] Land, M. “Parameters and sensitivity in workload control.” International Journal of Production Economics. 2006; 104(2), 625-638.
[19] Stevenson, M. and Silva, C., "Theoretical development of a workload control methodology: evidence from two case studies.” International Journal of Production Research, 2008; 46(11), 3107-3131.
[20] Hendry, L.C., Land, M., Stevenson, M. and Gaalman, G. “Investigating implementation issues for workload control (WLC): a comparative case study analysis.” International Journal of Production Economics. 2008; 112 (1), 452–469.
[21] Oosterman, B., Land, M. and Gaalman, G. “The influence of shop characteristics on workload control.” International Journal of Production Economics. 2000; 68, 107-119.
[22] Thurer, M., Silva, C., Stevenson, M. “Workload control release mechanisms: from practice back to theory building.” International Journal of Production Research. 2010;

International Conference 2ND International Conference on Innovations, Recent Trends and Challenges
in Mechatronics, Mechanical Engineering and New High-Tech Products Development
MECAHITECH‘10
Bucharest, 23-24 September 2010
485
8(12) 3593 – 3617.
[23] Henrich, P., Land, M.J. and Gaalman, G.J.C. "Grouping machines for effective workload control.” International Journal of Production Economics. 2006; 104(1), 125-142.
[24] Fernandes N.O. and Carmo-Silva, S. “Order release in a workload controlled flow-shop with sequence-dependent set-up times.” International Journal of Production Research. 2010. (In press).
[25] Land, M. and Gaalman, G.J.C. “Production planning and control in SMEs: time for change”. Production Planning and Control. 2009; 20(7), 548–558.
[26] Phan, B.S., Land, M.J. and Gaalman, G.J.C. “Workload control with continuous release”, Proceedings of IEEE international conference on Industrial Engineering and Engineering Management, Hong-Kong 2009.
[27] Perona, M. and Portioli, A. “The impact of parameters setting in load oriented manufacturing control”. International Journal of Production Economics. 1998; 55,133-142.
[28] Land, M. and Gaalman, G.J.C. “The performance of workload control concepts in job shops: Improving the release method.” International Journal of Production Economics. 1998; 56-57, 347-364.
[29] Sabuncuoglu, I. and Karapinar, H.Y. “Analysis of order review/release problems in production systems.” International Journal of Production Economics. 1999; 62, 259-279.
[30] Fernandes, N.O. and Carmo-Silva, S. “Generic POLCA - A production and materials flow control mechanism for quick response manufacturing.” International Journal of Production Economics. 2006; 104 (1), 74-84.
[31] Ebadian, M., Rabbani, M. Torabi, S.A. and Jolai, F. “Hierarchical production planning and scheduling in make-to-order environments: reaching short and reliable delivery dates.” International Journal of Production Research, 2009; 47(20), 5761–5789.
[32] Melnyk, S.A. and Ragatz, G.L. “Order review/ release: Research issues and perspectives.” International Journal of Production Research. 1989; 27(7), 1081–1096.

International Conference 2ND International Conference on Innovations, Recent Trends and Challenges
in Mechatronics, Mechanical Engineering and New High-Tech Products Development
MECAHITECH‘10
Bucharest, 23-24 September 2010
486
Nanotechnological Measuring System
Popan Gheorghe1, Chiriac Horia2, Gheorghe Marian3, Tom Savu3, Dan Ursu4 1INCDMTM Bucharest, 2INCDFT- Iasi, 3UP Bucharest; 4ProOptica Bucharest
ABSTRACT
Many fields have come to currently employ nanotechnology. The study of biological systems and of certain materials in the nanometric field is century-old. The recent opportunity to perform surgery by nano scale systems has caused a breakthrough in engineering thought and in devising new nano scale systems.
The field of technologies related to nano-manufacturing and nanodevices based on electrical, optic, magnetic, mechanic, chemical and biological effects would allow measurements in the length ranges involved. Furthermore, micro sensors, transducers and ultra-accurate machines must be calibrated or verified on production and on reception by the beneficiary because it is through them that the measuring unit is transmitted to users (producers). Traditional measuring means have proved limited in terms of accuracy because of the physical law. The approach to the field of nanotechnologies, which is worldwide only at the stage of incipient concern, is suggested to be achieved by means of unconventional methods, which mainly allow quantifications in the field of nanometrics.
The present project is meant to elaborate a calibrating nano range (below 100 nm). The only concerns in the field of nanoscale measuring have been set forth by researchers at INCDMF and INOE 2000. Together, they have created a prototype laboratory for a system of laser-based trace processing and equipment specialised in micropositioning of silicium plates in view of achieving integrated circuits. Researchers at INCDMF Bucharest have investigated issues related to measuring and calibrating in the nano domain and the adjoining areas; their findings have been imparted via workshops and patents within INCDMF Bucharest.
The field of nanotechnologies (leaving out the metrology in the nano range) has been successfully approached by specialised institutes (the National Institute of Research and Development in Microtechnologies IMT Bucharest, the National Institute of Research –Development in the Physics of Materials, the National Institute of Research –Development for Plasma and Radiation Physics, the National Research Institute of Technical Physics, Iasi; The Polytechnic University, Bucharest; the New Center of Electronical Architectures of the Romanian Academy; the Research Center of Macromolecular Materials and Membranes; the Center of Nanomaterials and Nanotechnologies, Iasi ).
Further insight into measuring and calibrating the nano field during the laboratory stage has become manifest during international conferences (PHANTOMS-European Network in Nanotechnologies- Rutherford, UK, EUROPRACTICE- European Service in Microtechonologies-Spain; „Partenering Day Cooperation: NANO 07” – Viena, Austria ianuarie 2007).
All production processes, from bolts to aeronautics, display a structure that mandatorily includes a system of control of the characteristics of each landmark, in order to ensure the interchangeability of the landmarks and the functional parameters of the product including them. This is even more important when devising nanosystems based on optic,

International Conference 2ND International Conference on Innovations, Recent Trends and Challenges
in Mechatronics, Mechanical Engineering and New High-Tech Products Development
MECAHITECH‘10
Bucharest, 23-24 September 2010
487
electronic, mechanic and biological nanodevices. In Romania, some of these microsystems have been devised at a laboratory stage and lack serial production so far. A serial production structure must provide real time monitoring in thousands of points of the process’ parameters. If it is not easy to provide such monitoring for a production process of reasonable dimensions, with a nanosystem production process complications arise not only because of the extremely small dimensions, but mostly because of the tolerance rate in relation to these dimensions. With the metrological structure of a production system of such dimensions, the traditional control and measurement equipments are no longer helpful. With such measurements, highly accurate unconventional non-contact checks and calibrations are needed. Since these measurements directly bear upon the production process, high speeds of measuring and control are required as well as outstanding accuracy of measurements.
This project aims to focusing on the creation of a precise system of calibration for organized nanosystems, micro sensors and ultra-accurate transducers.
The experimental model will include an ultra-accurate, controlled displacement system and will be supplied with optoelectronic, laser and atom level microscope measurement systems displaying the following technical features:
• Accuracy of displacement: 0.2 nm • Laser measurement resolution: 1 nm • Optoelectronic measurement resolution: 10 nm
The experimental model will include the mechanical, the optical and the optoelectronical subensembles, the optoelectronical measurement subensembles and the algorithms related to (real time) measurement system data acquisition, data processing and measurement protocol presentation.
The mechanic ensemble will include a system of controlled gas-static pillow displacement, meant to have the micro sensors and transducers oriented and fixed and a system meant to suppress low and high amplitude vibrations.
In devising the mechanical part special emphasis is to be laid on the choice of location materials, which must absorb vibrations. Special attention needs to be paid to the location of the driving systems; the coupling between the driving systems and the displacement system are special gas-static couplings with 5 degrees of freedom (original solution patented by the project manager). The supports against which the mechanical system is placed include three systems meant to take over the variation range (a system of controlled pre-tensioned springs, a system of rubber bushes of a specific hardness and a specially devised system of supporting elements lying on a gas-static pillow with specifically determined pressure). The foundation, the operator’s access and the environmental conditions are outstanding as well. The optic and optoelectronic measurement subensemble is destined to accurately orient, displace and fix the laser- measuring systems, via interferometry and triangulation-based laser measuring system, including orienting, regulating, aligning and fixing systems in the specially designed spaces within the mechanical ensemble.
The whole ensemble must be devised so that the measuring systems should strike a balance on the measuring head in order to avoid errors. The software created by P2 must enable data acquisition from the measuring systems, the processing of such data, correction insertion, the assessment of the results and the elaboration measuring protocol. The measuring principles being devoid of tangible contact with the measuring nanosystem, there are no errors likely to occur because of contact deformation.
The model thus devised will be employable with accuracy measurements and with the calibration of other ultra-accurate integrated systems in the metrological processes of micro

International Conference 2ND International Conference on Innovations, Recent Trends and Challenges
in Mechatronics, Mechanical Engineering and New High-Tech Products Development
MECAHITECH‘10
Bucharest, 23-24 September 2010
488
sensors and transducers. If about 16 years ago, when concerns regarding a measuring system in the nano domain were emerging, such a solution was unreachable, nowadays, due to the latest accomplishments in the field of laser-based measuring systems, the experimental model is altogether feasible. The non-negligible risk factors arise out of the environmental and the disturbance conditions; further risk factors are the incompatibility between certain nanosystems and the measuring principle. In order to do away with the risks, related to each risk factor, we have tripled the solutions regarding the environment and the disturbance factors, we have found isolation measures, technical solutions meant to diminish the influence and the software appropriate for corrections. To avoid the incompatibility between certain nanosystems and the measuring principles, we have tripled the number of measuring systems. The calibration system proposed by the present project is remarkably complex and the accuracy and calibration resolution it envisages have taken into account the latest accomplishments in the field and the concerns of various specialised staffs.
The findings of the Romanian research in the field of micro and nanotechnologies are the result of the researchers competence, yet are confined to studying and lab-designing nanosystems based on electrical, optic, magnetic, mechanical and chemical devices in the laboratory. Unless the findings of the research are applied by developing production processes, at an industrial scale, they do not acquire significance. The large scale production of nanosystems displaying accuracy at this size level cannot be achieved for want of an adequate metrological structure.
The metrological structure needs to adjust to the technological structure and contain a multitude of control points meant to quantify dimensional deviations (going beyond the tolerance field) of the nanosystems. This metrological structure must consist of micro sensors and gauges which must be verified and calibrated since they further transmit the measuring unit.
The project aims to elaborate and verify an ultra-accurate measuring, control and calibration system meant to contribute to devising the nanotechnological infrastructures.
Functional model has the following operating ciclograma 1-Nano device to calibrate the transfer of the precise positioning mass (Pos Pi)
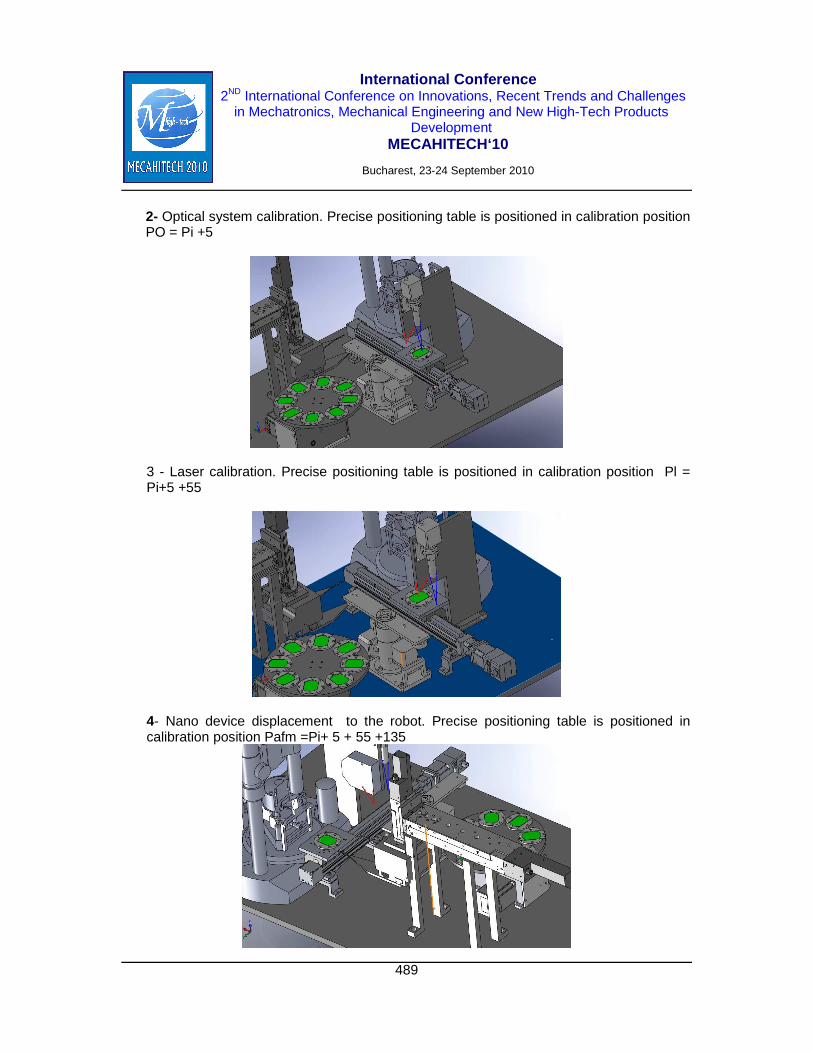
International Conference 2ND International Conference on Innovations, Recent Trends and Challenges
in Mechatronics, Mechanical Engineering and New High-Tech Products Development
MECAHITECH‘10
Bucharest, 23-24 September 2010
489
2- Optical system calibration. Precise positioning table is positioned in calibration position PO = Pi +5
3 - Laser calibration. Precise positioning table is positioned in calibration position Pl = Pi+5 +55
4- Nano device displacement to the robot. Precise positioning table is positioned in calibration position Pafm =Pi+ 5 + 55 +135

International Conference 2ND International Conference on Innovations, Recent Trends and Challenges
in Mechatronics, Mechanical Engineering and New High-Tech Products Development
MECAHITECH‘10
Bucharest, 23-24 September 2010
490
5.-Robot Gripper down (5mm) clamping position Nano device.
6-The gripper gripps the support/table with the calibration nanodevice
7- Robot raise support with nano device calibrated to the slot position of the AFM height.

International Conference 2ND International Conference on Innovations, Recent Trends and Challenges
in Mechatronics, Mechanical Engineering and New High-Tech Products Development
MECAHITECH‘10
Bucharest, 23-24 September 2010
491
8- The robot positions the support/table with the nano device calibrated in place by positioning the AFM
9- The robot opens the gripper , let stand with the calibrated and AFM nanodispozitivul catches and supports in the calibration positions.

International Conference 2ND International Conference on Innovations, Recent Trends and Challenges
in Mechatronics, Mechanical Engineering and New High-Tech Products Development
MECAHITECH‘10
Bucharest, 23-24 September 2010
492
Optoelectronic Dynamic Evaluation Methods of a Subj ect With a Prosthetic Limb
Doina Bucur*, Mihaela Buzatu**, Luminita Dumitru***, Alina Iliescu***, Sorin Vreja**,
Mircea - Iulian Nistor*, Sorin Kostrakievici* *”Politehnica” University of Bucharest, ** S.C. Alfa-Orto S.R.L.,
*** Elias Emergency Universitary Hospital – Bucharest
ABSTRACT
Engineering may help medicine not only by creating smaller and more precise human extensions, but by creating devices that bring new arguments in the complex processes of diagnosis, treatment, recovery and monitoring. It can create new ways through which doctors can check and confirm their theories, ultimately increasing patient care quality. Such a device will be presented below, not just through a technical description, but by analyzing a real case and highlighting the elements that can not be seen with a "naked eye". KEYWORDS
prosthesis, 3D model, gait analysis, limb, optoelectronic.
INTRODUCTION
In 2010’s Romania the doctor is seen more as a walking encyclopedia and as an artist. Most doctors rely only on knowledge, on experience, instinct and the five senses using some tools that amplify thouse senses. In these circumstances inexperienced doctors may fail due to lack of knowledge that can be obtained only from practice and the experienced doctors, few and usually older, due to the lack of new perspectives which can not be achieved through human senses.
Regarding the above engineering may help medicine not only by creating smaller and more precise human extensions, but by creating devices that bring new arguments in the complex processes of diagnosis, treatment, recovery and monitoring. It can create new ways through which doctors can check and confirm their theories, ultimately increasing patient care quality.
Such a device will be presented below, not just through a technical description, but by analyzing a real case and highlighting the elements that can not be seen with a "naked eye".
CASE STUDY
The case subject is a 42 years old man, who suffered at the begining of 1995 a road accident which resulted in an open fracture of the left femur and a broken tibia at the same

International Conference 2ND International Conference on Innovations, Recent Trends and Challenges
in Mechatronics, Mechanical Engineering and New High-Tech Products Development
MECAHITECH‘10
Bucharest, 23-24 September 2010
493
leg. Treatment required first a tibia amputation in the proximal third (near the knee). Following this trauma and treatment the subject had to wear a prosthetic leg.
In 2008 he came at S.C. Alpha-Ortho S.R.L., a company that deals orthopedic products and technical services, in order to change the old prosthesis (Fig. 1). The special conditions makes this issue of delivering a good fitted prosthesis very difficult. Following are presented parts of an examination form (Table no. 1), and images of the blunt (Fig. 2 and Fig. 3).
Fig. 1 - Subject wearing the old prosthesis
Table. 1
Residence Country side - plain (uneven ground) Height 1.90 m Bodyweight 170 kg Old prosthesis mass 6 kg New prosthesis mass 4.5 kg (with shoe) Examination reason The subject came to our company in order
to assess pre-prosthetic. Members of the evaluation committee - Mrs. Eng. Mihaela Buzatu - medical and
clinical engineering, expertise –orthesis an prosthesis - Mr. Sorin Vreja - orthopedist technician, lower limb prosthesis specialist
Blunt shape bulbous Residual blunt length 25 cm (long blunt) Tibia appearance prominent Fibula appearance prominent Residual blunt quality - the skin of normal coloration
- the proximal end of the blunt the dermis has jagged type growths, probably because of the pressure and skin erosion from prosthesis contact

International Conference 2ND International Conference on Innovations, Recent Trends and Challenges
in Mechatronics, Mechanical Engineering and New High-Tech Products Development
MECAHITECH‘10
Bucharest, 23-24 September 2010
494
- keloid scar with deep adhesions, with pus in the middle fo the scar groove
Soft tissues of the blunt - excessive amount of soft consistency (flaccid muscle mass)
Temperature (in contact with hands) warm Significant paines - spontaneous pain – rarely (weather
related) - phantom pain - rarely
Hip joint functions - flexion, extension, abduction, adductor movements amplitude – normal - muscular force - without significant reduction - stability - normal
Knee joint functions - abnormal extension (genu recurvatum) - abnormal flexion (limited to 90 °)
Other comments - right lower limb in internal rotation, leg in abduction - unbalanced basin - left femur is 5 cm shorter - back pain during locomotion caused by basin balance and lumbar spine vertebral subsidence (without radiographic image)
Old prosthesis The subject has a plastic leg prosthesis with thigh grip sleeve a) interface components - methacrylic resin sleeve blunt, without full contact surface, not complying with the blunt’s anatomy b) functional component - ankle-foot device that provides movement of plantar flexion and extension c) knee subset – not present d) hip subset – not present e) external knee joint – lateral, monocentric rotation axis, without control system f) aligning components - integrated g) prosthesis sturcture – exoskeleton h) aesthetic component - not present
Subject’s static evaluation (with the old prosthesis)
Standing, with bipodal support, imbalanced basin, 5-6 cm position deviation on the left side.
Subject’s dynamic evaluation (with the old prosthesis)
Slow locomotion without support devices. Normal heel strike, the swing, especially the initial part is hampered by the excessive weight of the prosthesis and the support phase is reduced because of the total lack of prosthetic paw front side (due to prosthesis advanced deterioration)

International Conference 2ND International Conference on Innovations, Recent Trends and Challenges
in Mechatronics, Mechanical Engineering and New High-Tech Products Development
MECAHITECH‘10
Bucharest, 23-24 September 2010
495
Final conclusions before recomanding a prosthesis
- patient with a high degree of difficulty for recomanding a prosthesis - inadequate prosthesis in an advanced state of deterioration
New prosthesis The subject has a modular prosthesis leg with thigh grip sleeve. a) interface components - blunt sleeve (internal) from soft material (copolymer), external sleeve from methacrylic resin with fiberglass, carbon fiber and textile fiber reinforcements b) functional component - ankle-foot device that provides movement of plantar flexion and extension c) knee subset – not present d) hip subset – not present e) external knee joint – lateral, monocentric rotation axis, without control system f) aligning components – integrated g) prosthesis sturcture – exoskeleton h) aesthetic component - filling materials (sponge) and aesthetic stockings
Subject’s static evaluation (with the new prosthesis)
Standing, with bipodal support, balanced basin through femur length correction by adjusting the tubular prosthesis components length
Subject’s dynamic evaluation (with the new prosthesis)
Initial locomotion with a support devices - a crutch to support the right forearm (when analyzing through the optoelectronic method). Normal heel strike, the initial phase of the swing is not hampered anymore by the excessive weight of the prosthesis and the standing phase becomes total; fermuro-tibial axis tends to physiological parameters (all genu recurvatum is deleted); is kept in abduction the coxo-femoral joint and so the left pelvic limb (due to muscle mass and especially to scratchy fat fillings on left thigh caused by the suspending element - thigh grip sleeve)
Extract from the clinical examination on the premises S.C. Alpha-Ortho S.R.L. made before the second prosthesis, at the end of 2008.

International Conference 2ND International Conference on Innovations, Recent Trends and Challenges
in Mechatronics, Mechanical Engineering and New High-Tech Products Development
MECAHITECH‘10
Bucharest, 23-24 September 2010
496
Fig. 2 – Blunt’s appearance in the new prosthesis
Fig. 3 – Blunt’s appearance, front view
Equipment and test methods presentation
The optoelectronic method for recording and analyzing data using a system built by the Vicon company consists of seven cameras acquireing images in the near infrared, each equipped with its own light source, a central unit that powers them and collects information and a PC on which are installed two softwares. The first is used for data acquisition and processing, and the second presents the results of the analysis. The system establishes the passive reflecting markers position in the measuring space through the triangulations method. Thus the system can indicate their position from the measuring spaces center at any measuring time. Because it uses this method the space consists of the sum of the points at which a marker can be seen by any two cameras.
The measurements are not influenced by "cold" light sources because the system uses near infrared light, but sunlight is a source of strong noise. It is manifested by the appearance of parasites additional markers. To remove this drawback the systems manufacturer has provided it with an opportunity to create masks to the affected areas and to delete unwanted occurrences of additional.

International Conference 2ND International Conference on Innovations, Recent Trends and Challenges
in Mechatronics, Mechanical Engineering and New High-Tech Products Development
MECAHITECH‘10
Bucharest, 23-24 September 2010
497
Such analysis begins by determining some anthropometric data such as body mass, limb length and more. Then the markers are sticked on predefined anatomical projections. They are defined by who makes the model, in this case the system manufacturer. In Fig. 4 and Fig. 5 the patient is presented in the biomechanics and biodynamics laboratory led by mrs. lecturer Ph.D. eng. Doina Bucur and it can be see some of the markers applied on the subject. In these pictures you can see, also, the new prosthesis.
Fig. 4 – The subject during dynamic determinations through the optoelectronic method (back view)
Fig. 5 - The subject during dynamic determinations through the optoelectronic method (side view)
After data acquisition they are processed so that the system can link the markers and
the anatomical landmarks to apply conclusively associated model calculation routines. Following the 3D model is built, a model that respects and uses anthropometric dimensions from the subject, taking his movement pattern.

International Conference 2ND International Conference on Innovations, Recent Trends and Challenges
in Mechatronics, Mechanical Engineering and New High-Tech Products Development
MECAHITECH‘10
Bucharest, 23-24 September 2010
498
RESULTS AND INTERPRETATION
Results that may be shown after this type of analysis are presented in graphical and numeric format. Although results can be obtained from a single record, the preferred analysis method is to average multiple measurements, to have the general behavior, not one at a particular time.
At first the system gives the space-time parameters that can be followed in Table. 2. Speed is about the same in both cases presented in the table so data can be regarded as conclusive in terms of improving patient movement.
Table. 2
Old prosthesis New prosthesis
left right left right
Cadence
68.4 ± 2.15
steps/min
69.3 ± 3.43
steps/min
66.8 ± 2.30
steps/min
67.6 ± 3.16
steps/min
Double
Support -0.44 ± 0.057 s -0.56 ± 0.036 s -0.49 ± 0.040 s -0.63 ± 0.036 s
Opposite
Foot Contact 84.0 ± 2.21 % 74.4 ± 0.98 % 86.6 ± 3.65 % 73.8 ± 1. 50 %
Opposite
Foot Off 58.8 ± 0.77 % 42.1 ± 1.00 % 59.6 ± 3.12 % 38.2 ± 2. 26 %
Single
Support 0.44 ± 0.057 s 0.56 ± 0.036 s 0.49 ± 0.040 s 0.63 ± 0.036 s
Step Length 0.32 ± 0.015 m 0.46 ± 0.021 m 0.31 ± 0.033 m 0.45 ± 0.030 m
Step Time 0.28 ± 0.030 s 0.44 ± 0.025 s 0.24 ± 0.066 s 0.47 ± 0.038 s
Step Width 0.38 ± 0.028 m
0.36 ± 0.019 m 0.45 ± 0.026 m 0.39 ± 0.041 m
Stride Length 0.86 ± 0.013 m 0.88 ± 0.020 m 0.93 ± 0.051 m 0.91 ± 0.056 m
Stride Time 1.76 ± 0.055 s 1.73 ± 0.087 s 1.80 ± 0.061 s 1.78 ± 0.079 s
Walking
Speed
0.49 ± 0.011
m/s
0.51 ± 0.016
m/s
0.52 ± 0.032
m/s
0.51 ± 0.048
m/s
Space-time data for the subject’s prosthetic left leg
Secondly each record can be reviewed at the speed at which it was taken, more quickly, in slow motion or may be conducted manually. Since is a 3D reconstruction of the subject’s movement it can be seen from any point and may be zoomed in to look in detail a

International Conference 2ND International Conference on Innovations, Recent Trends and Challenges
in Mechatronics, Mechanical Engineering and New High-Tech Products Development
MECAHITECH‘10
Bucharest, 23-24 September 2010
499
portion of the movement, things that can not be done on video or in reality. Also two entries may overlap so that differences can be highlighted (Fig. 6).
Fig. 6 - 3D comparison between walking with the new prosthesis, left, and the old, righ
Another way to interpret the objectives is through the graphical representation of
trends in relative angles of various body segments during the gait cycle (Fig. 7). Such a cycle starts with the heel strike of a lower limb on the ground and till the event is repeated with the same limb. During gait cycle the lower limb goes through several stages: heel strike or the contact with the ground, loading up till the leg is fully supported on the ground, unloading, toe off, initial and final balancing, when the limb prepares a new contact. Each of these phases has a time duration which varies greatly depending on numerous factors such as speed, height, age, health and many others.
Fig. 7 - Evolution of knee flexion/extension angle

International Conference 2ND International Conference on Innovations, Recent Trends and Challenges
in Mechatronics, Mechanical Engineering and New High-Tech Products Development
MECAHITECH‘10
Bucharest, 23-24 September 2010
500
In Fig. 7 the green curve represents the flexion / extension angle evolution for the left lower limb when the subject was using the old prosthesis and the blue curve represents the same thing when he uses the new one. The resulting curve by mediating determinations made on two apparently healthy subjects, aged about 21 years is shown red.
Although the program can show graphs of the angles in all lower limb joints (ankle, knee, hip) on three axes, the graph in Fig. 7 shows best the advantages of such an analysis. Last two types of data analysis should be performed by qualified personnel in this field such as doctors or physical therapists. They must follow the angles curve values and shape, independent analysis being inconclusive and useless for the subject.
The graphic portion that extends from 35% to 85% of the gait cycle, where the curve for the apparently healthy subjects has a second local maximum can be observed from video recordings or direct observation. It is associated with the phenomenon of genu recurvatum, it is not a physiological bending of the knee towards the back side. This phenomenon is due to the fact that the subject is wearing a lower limb prosthesis and is further amplified by the deteriorating condition. The graph can show clearly that the new prosthesis bring this angle values near physiological parameters and especially tends to recreate the area of local maximum. The subject was not used wearing the new prostesis when the determinations were made and it is possible that this problem may have diminished further. The review will be able to quantify how much will be diminished and will do so in an objective manner.
Between 0% and 35% of the gait cycle and the last portion of the graphical portion, between 85% and 100% of the gait cycle, especially in areas with positive slope it can be observed that the curve for apparently healthy subjects and for the new prosthesis has almost the same values and tend to be parallel. These things are hard to be observed directly and practically impossible to quantify objectively, but the system can do so.
Figure 34: Control equipment for diameters and axial coordinates of bent shaft

International Conference 2ND International Conference on Innovations, Recent Trends and Challenges
in Mechatronics, Mechanical Engineering and New High-Tech Products Development
MECAHITECH‘10
Bucharest, 23-24 September 2010
501
CONCLUSIONS
Following these tests customized recovery programs can be created, and also the technicians can realise more accurate and objective adjustment of the prosthesis. The records can be stored and then used on a subject to be able to monitor progress and restore physiological walking. Also database with apparently healthy subjects may be created to try to establish normal walking pattern.
The system can be an important tool for research and education because it can protect the subjet’s identity (it is not a video recording). Also the system usage should not be limited to the area shown. Both medically and technically, the limits apear only beacause of lack of imagination, creativity and experience of those who use it.
ACKNOWLEDGMENTS
S.C. Alpha-Ortho S.R.L. for preclinical evaluation and adjustment of prosthetic and technical advice as well as space and facilities necessary to conduct these activities.
Elias Emergency Universitary Hospital - Bucharest for clinical evaluation and specialized counseling, space and facilities necessary to conduct these activities.
Politehnica University of Bucharest, Department of Mechatronics and Precision Mechanics and Department of Bioengineering and Biotechnology (Medical Engineering Faculty) for space, facilities and equipment necessary to conduct the scientific activities and drafting this paper.

International Conference 2ND International Conference on Innovations, Recent Trends and Challenges
in Mechatronics, Mechanical Engineering and New High-Tech Products Development
MECAHITECH‘10
Bucharest, 23-24 September 2010
502
Considerations on Dental Implants Fixation
Conf. Sorin Kostrakievici*, As. Mircea Iulian Nistor*, S.l. Doina Bucur*,
Medic Cristian Dobreci**, *Politehnica” University of Bucharest, **University of Medicine and Pharmacy
ABSTRACT
Considerations on dental implants fixation In the paper it is presented a testing bench and the tests done on the special fixing
screws of the upperstructure of the metalic dental implants. Are expressed also conclusions on measurements and those resulting for the users
and producers.
INTRODUCTION
In the nowadays dental practice one of the frequently used prosthetic methods consists in the use of metalic dental implants, also known as root implants (after NIH 1988). These implants implies a threaded body (fig.1) which is inserted in the mandibular or maxilar bone.
On this artificially created „root”, after osseointegration is fixed, the upperstructure of the thooth manufactured in the dental laboratory in conformity with the anatomical structure of the dental element of the patient. The fixing element of the upperstructure is, in this case, also a special screw of M1.8 or M2 thread (depending of the manufacturing company.
Fig.1 Root implant
A – implant with surface treated with Titanium plasma; B – implant with surface treated with hydroxylapatite (TPS); C - implant with fine surface texture; D - implant with medium surface texture.

International Conference 2ND International Conference on Innovations, Recent Trends and Challenges
in Mechatronics, Mechanical Engineering and New High-Tech Products Development
MECAHITECH‘10
Bucharest, 23-24 September 2010
503
Fig. 2 Upperstructure fixing screw
Root osseointegration needs 3 to 6 months, time during which its central threaded
chanel is loaded up with different substances. Taking into consideration other substances used in the dental practice such as metronidazole gel, special dental adhesive, clorehexidine, etc., during the processes of threading into and out of the screw has been reported accidents by tearing it off which is a very serious case as the restoring of the implants is in general compromised.
The objective of the paper has been to investigate the resistance of the fixing screw for different working hypothesis.
Fig.3 Testing bench
1 - rack, 2 – moment transducer IMADA HTG2-2N (0…2Nm), 3 – IMADA interface, 4 – computer display, 5 – receiving part.

International Conference 2ND International Conference on Innovations, Recent Trends and Challenges
in Mechatronics, Mechanical Engineering and New High-Tech Products Development
MECAHITECH‘10
Bucharest, 23-24 September 2010
504
2. The testing bench and procedure
In order to check the different types of screws it has been manufactured a receiving part having 10 threaded seats (fig.2, position 5) from which five are M1.8 and five M2. The receivinf part is mounted on the rotating plate 1 of the testing bench. Above the plate is postioned the moment transducer 2 which is connected to the computer 4. By the rotation of the plate the special screw is treaded into the receiving part 5. The seats were treated initially with blood, metronidazole gel, special dental adhesive, clorhexidrine and the first seat was dried. The maximum clamping moment used was of 350Nmm as in the manufacturer documentation. The tested special screws were measured with a pasameter SUHL –TGL 20250.
Table 1 Outer diameter deviation of the thread for the M2 screw
Numărul probei
Dimensiune nominală filet [mm]
Abaterea de la dimensiunea nominală [mm]
1. M2 -0,022 2. M2 -0,020 3. M2 -0,095 4. M2 -0,092 5. M2 -0,021
Table 2 Outer diameter deviation of the thread of the M1.8 screw
Numărul probei
Dimensiune nominală filet [mm]
Abaterea de la dimensiunea nominală [mm]
1. M1,8 -0,006 2. M1,8 +0,004 3. M1,8 +0,0015 4. M1,8 -0,0092 5. M1,8 +0,011
proba 1 uscata
-0.05
0
0.05
0.1
0.15
0.2
0.25
0.3
0.35
0.4
1 123 245 367 489 611 733 855 977 1099 1221 1343 1465 1587 1709 1831 1953 2075 2197 2319
frecventa de 50 Hz
valo
area
mom
entu
lui
Series1
Fig. 4 Tightening screw M2, dry
proba 2 clorhexidrina
-0.05
0
0.05
0.1
0.15
0.2
0.25
0.3
0.35
0.4
1 37 73 109 145 181 217 253 289 325 361 397 433 469 505 541 577 613 649 685 721 757 793 829 865
frecventa 50 Hz
valo
area
mom
entu
lui
Series1
Fig. 5 Tightening screw M2, with clorhexidrine

International Conference 2ND International Conference on Innovations, Recent Trends and Challenges
in Mechatronics, Mechanical Engineering and New High-Tech Products Development
MECAHITECH‘10
Bucharest, 23-24 September 2010
505
proba 3 gel metronidazol
-0.05
0
0.05
0.1
0.15
0.2
0.25
0.3
0.35
0.4
1 77 153 229 305 381 457 533 609 685 761 837 913 989 1065 1141 1217 1293 1369 1445
frecventa de 50 Hz
valo
area
mom
entu
lui
Series1
Fig. 6 Tightening screw M2, metronidazole gel
proba 4 adeziv
-0.05
0
0.05
0.1
0.15
0.2
0.25
0.3
0.35
0.4
0.45
1 21 41 61 81 101 121 141 161 181 201 221 241 261 281 301 321 341 361 381 401 421 441 461 481
frecventa de 50 Hz
valo
area
mom
entu
lui
Series1
Fig. 7 Tightening screw M2, with adhezive
proba 5 sange
-0.1
-0.05
0
0.05
0.1
0.15
0.2
0.25
0.3
0.35
0.4
0.45
1 154 307 460 613 766 919 1072 1225 1378 1531 1684 1837 1990 2143 2296 2449 2602 2755 2908
frecventa de 50 Hz
valo
area
mom
entu
lui
Series1
Fig. 8 Tightening screw M2, with blood
proba 1 uscata
-0.05
0
0.05
0.1
0.15
0.2
0.25
0.3
0.35
0.4
1 103 205 307 409 511 613 715 817 919 1021 1123 1225 1327 1429 1531 1633 1735 1837 1939
frecventa de 50 Hz
valo
area
mom
entu
lui
Series1
Fig. 9 Tightening screw M1,8, dry
proba 2 clorhexidrina
-0.1
-0.05
0
0.05
0.1
0.15
0.2
0.25
0.3
0.35
0.4
0.45
1 182 363 544 725 906 1087 1268 1449 1630 1811 1992 2173 2354 2535 2716 2897 3078 3259 3440
frecventa de 50 Hz
valo
area
mom
entu
lui
Series1
Fig. 9 Tightening screw M1,8, cu clorhexidrine
proba 3 gel metronidazol
-0.1
-0.05
0
0.05
0.1
0.15
0.2
0.25
0.3
0.35
0.4
0.45
1 197 393 589 785 981 1177 1373 1569 1765 1961 2157 2353 2549 2745 2941 3137 3333 3529 3725
frecventa de 50 Hz
valo
area
mom
entu
lui
Series1
Fig. 10 Tightening screw M1,8, with metronidazole

International Conference 2ND International Conference on Innovations, Recent Trends and Challenges
in Mechatronics, Mechanical Engineering and New High-Tech Products Development
MECAHITECH‘10
Bucharest, 23-24 September 2010
506
proba 4 adeziv
-0.2
-0.1
0
0.1
0.2
0.3
0.4
0.5
1 259 517 775 1033 1291 1549 1807 2065 2323 2581 2839 3097 3355 3613 3871 4129 4387 4645 4903 5161
frecventa de 50 Hz
valo
area
mom
entu
lui
Series1
Fig. 11 Tightening screw M1,8, with
adhezive
proba 5 sange
-0.2
-0.1
0
0.1
0.2
0.3
0.4
0.5
1 268 535 802 1069 1336 1603 1870 2137 2404 2671 2938 3205 3472 3739 4006 4273 4540 4807 5074 5341
frecventa de 50 Hz
valo
area
mom
entu
lui
Series1
Fig. 12 Tightening screw M1,8, with blood
proba 1 seria I maxim
-0.3
-0.2
-0.1
0
0.1
0.2
0.3
0.4
0.5
0.6
0.7
0.8
1 329 657 985 1313 1641 1969 2297 2625 2953 3281 3609 3937 4265 4593 4921 5249 5577 5905 6233 6561
frecventa de 50 Hz
valo
area
mom
entu
lui
Series1
Fig. 13 Tightening screw M2, dry, maximum
moment
proba 1 seria II maxim
-0.2
-0.1
0
0.1
0.2
0.3
0.4
0.5
0.6
1 315 629 943 1257 1571 1885 2199 2513 2827 3141 3455 3769 4083 4397 4711 5025 5339 5653 5967 6281
frecventa de 50 Hz
valo
area
mom
entu
lui
Series1
Fig. 14 Tightening screw M2, dry, maximum
moment According to the known relationship of torque screw:
Mt= Q[ d2 /2 × tg ( α + φ´ ) + µ1 × Dm/2] (1)
where: µdry = 0,2, µwet = 0,15, φ´dry = arctg 0,2 = 11,3099° , φ´wet = arctg 0,15 = 8,53°, α = 30° it can be deduced the values of the tensile forces in the screw rods when they are maximum stressed:
Q = 243,345 N for the M2 screw and Q´= 483,50 N for the M1,8 screw (2) For the two screws the resulting efective tensile forces in the threaded ros are:
σt = 4Q / π d1² = 136,019 N/ mm² şi σ´t = 297,03 N/ mm². (3)
3. CONCLUSIONS
In none of the tests was observed breaking any screw rod no matter of the material interposed between the screw and the receiving plate. Also have not noticed cracks in the structure of materials.

International Conference 2ND International Conference on Innovations, Recent Trends and Challenges
in Mechatronics, Mechanical Engineering and New High-Tech Products Development
MECAHITECH‘10
Bucharest, 23-24 September 2010
507
The conclusion here is clear that the tightening of these bolts wrench to the recommended value of 350 Nmm, there is no riskof breaking special screws. But producers are required to verify possible structural failure of the materials these being the only ones which could lead to accidental breakage of these screws.
Even if tightening the screws at a maximum, possibly manually created with the special designed instruments for thightining in the dental office, the tensile stress values do not exceed allowable values, which justifies once again the claim that in the absence of structural defects breaking their material is excluded. During interventions, while working with them it is indicated to use dynamometric keys in order to eliminate any unpleasant event.
BIBLIOGRAPHY
[1]. Cranin A. Herman , Klein Michael , Simons Alan - „Atlas of Oral Implantology” 1993, Thieme Medical Publishers , New York
[2]. Dumitriu Horia Traian - „Parodontologie”, EdiŃia a-IV-a, Editura ViaŃa Medicală Românească 2006
[3]. Gehrke Peter, Brunner Jochen, Wolf Dietrich, Degidi Marco, Piattelli Adriano - „Ziconium Implant Abutments: Fracture Strength and Influence of Cyclic Loading on Retaining-Screw Loosening”, Quintessence International vol.37, nr.7, ianuarie 2006
[4]. Karl Matthias, Rosch Silke, Friedrich Greaf, Taylor D. Thomas, Heckmann M. Siegfried
„Strain Situation after Fixation of Three-Unit Ceramic Veneered Implant Superstructures” , Implant Dentistry, Vol. 14, nr. 2, 2005
[5]. Kohal Ralf-J., Klaus Gerold, Strub Jorg R. - „Zirconia-Implant-Supported All-Ceramic Crowns Withstand Long-Term Load: A Pilot Investigation”, Clinical Oral Implant Research.17, 2006
[6]. Rosenstiel, Land, Fujimoto - „Contemporary Fixed Prosthodontics”, 3-rd Edition, Ed. Mosby, 2002
[7]. ISO 14801/2003 Încercarea la oboseală a implantelor dentare.

International Conference 2ND International Conference on Innovations, Recent Trends and Challenges
in Mechatronics, Mechanical Engineering and New High-Tech Products Development
MECAHITECH‘10
Bucharest, 23-24 September 2010
508
A Technique for Dynamic Characterization of Dielect ric Elastomers
*Vlad Cârlescu, **Florin Breabăn, *Dumitru Olaru, *Gheorghe Prisăcaru
*Machine Design and Mechatronics Department, ”Gheorghe Asachi” Technical University of Iaşi, 700050, Iaşi, România
**LGCgE/IUT, Université d’Artois, 62400, Béthune, France [email protected]
ABSTRACT
There is a strong demand on soft actuators based on electro-active polymers (EAPs). In particular, dielectric elastomers are well studied for actuators applications. Thus, measurement of static and dynamic strain response is important. A technique for static strain response measurement using a displacement sensor has been already presented in a previous paper [1]. In this paper we present a strain measurement system based on laser vibrometry to study the dynamic transverse strain response of some elastomeric polymer films that are subject to high electric fields. The films were coated on both sides with compliant electrode material. When voltage was applied, the film compressed in thickness and expanded in area. Laser vibrometry offer a good accuracy and can measure displacements in order of pm. A variety of actuators, including electrooptical devices, diaphragm pumps, and muscle-like linear actuators, have been demonstrated with dielectric elastomer materials, suggesting that this technology is well suited to small-scale electromechanical devices and robots [2].
INTRODUCTION
In the last decade, the interest in “smart materials”, which respond to external stimuli by changing their shape or size, has essentially increased. In particular soft dielectric EAPs as muscle-like actuators, a subgroup of the electro-active polymers, have attracted much interest in recent years due to their outstanding active deformation potential. Soft dielectric EAPs consist of a thin elastomer film, which is coated on both sides with compliant electrodes (Fig. 1, left). When applying a high voltage U (in the range of several kV) to this compliant capacitor, the electrodes squeeze the elastomeric dielectric in the thickness direction (Maxwell pressure, equivalentp ), and thus the nearby incompressible film expands in
the planar direction (Fig. 1, right).
2
0
=d
Up requivalent εε (17)
Thereby 0ε is the free-space dielectric permittivity ( 0ε = 8.85×10⁻¹² F/m), rε is the
relative permittivity of the dielectric material and d represents the thickness of the dielectric film. As soon as the voltage is switched off and the electrodes are short-circuited the film deforms back to its initial state [3]. The electromechanical response is predominantly caused

International Conference 2ND International Conference on Innovations, Recent Trends and Challenges
in Mechatronics, Mechanical Engineering and New High-Tech Products Development
MECAHITECH‘10
Bucharest, 23-24 September 2010
509
by the interaction between the electrostatic charges on the electrodes. The behavior of the polymer is functionally similar to electrostrictive polymers in that the response is directly related to the square of the applied electric field [2].
Figure 1 : Principle of operation of dielectric elastomer actuators [3] The actuation of the dielectric elastomer films can be used in two different ways: planar
directions (expanding actuator) and thickness direction (contractile actuator) [3]. The strain in thickness, although large, may be difficult to measure because the
thickness is relatively small and the absolute motion is small. However, the polymer is essentially incompressible, so the strain in thickness, zs , may be related to the in-plane
strains, xs and ys , as [2]:
1)1)(1)(1( =+++ zyx sss (2)
The characterisation of the dynamic transverse strain response, especially under high driving fields, is difficult. Contact methods of strain measurement are generally unsuitable as the contacts often cause mechanical clamping and reduce the strain of the soft polymer materials. Non-contact methods used include optical microscopythe low resolution of which makes small strain measurements difficult, and cantilever beam based dilatometry with a photonic sensor
that cannot, however, measure large displacements.
Thereby, laser vibrometry can measure transverse strain responses of polymer actuators of different sizes over a wide displacement and frequency range [4,5].
EXPERIMENT
Figure 2 present the experimental setup of dynamic transverse strain measurement. The samples were put in horizontal position on a plastic plate. The laser beam generated by optic head of a Polytec vibrometer falls perpendicular to the sample and the reflected laser beam has an optical pathway parallel to the incident beam. A map points was defined on upper electrode area and laser beam measured in each point the transverse displacement. After that the Polytec software reconstituted the displacement profile of sample.
A “white noise” signal was first applied to the sample to find the resonance frequencies of polymers. It is well know that at resonance frequency the behavior of the material is at maximum level.

International Conference 2ND International Conference on Innovations, Recent Trends and Challenges
in Mechatronics, Mechanical Engineering and New High-Tech Products Development
MECAHITECH‘10
Bucharest, 23-24 September 2010
510
Figure 2: Thickness strain measurement system based on laser vibrometry Figure 3 show an example of resonance frequencies record for a polymer sample.
Figure 3: Resonance frequencies of a polymer sample

International Conference 2ND International Conference on Innovations, Recent Trends and Challenges
in Mechatronics, Mechanical Engineering and New High-Tech Products Development
MECAHITECH‘10
Bucharest, 23-24 September 2010
511
The dynamic transverse strain of the polymers produced by a sinusoidal electric field
has been investigated over a frequency range of 0.01 Hz to 200 Hz. From figure 3 it can be observed that peaks correspond to the resonance frequencies.
The usual dimensions of the elastomer films and aluminium electrodes were 40 x 40 mm and 30 x 30 mm respectively. The thicknesses of the polymer films varied from 28 µm to 990 µm.
The vibrometer is synchronized with the signal generated by HP 33120A function generator. An oscilloscope was used to monitor applied voltage and current on the sample. The amplitude of sinusoidal voltage was in range of 0 – 6kV. A selected voltage amplitudes generated by a HP 33120A function generator is amplified by a Treck 610E power amplifier and then applied to the polymer films at each resonance frequency. For these resonance frequencies was obtained displacements in order of micrometers.
CONCLUSION
We present a laser interferometry method to measure the transverse strain response of some dielectric elastomer actuators. This technique based on laser vibrometry has a good accuracy and is easy to apply to thickness strain measurements on thin polymeric films. This technique is important for electromechanical characterization of dielectric elastomer actuators and the results provided allow us to propose these materials in some mechatronic systems.
REFERENCES
[33] Dumitru Olaru, Vlad Cârlescu, Gheorghe Prisăcaru, “Electrostrictivity study of some polymers as potential actuators”, 1st International Conferences on Innovation, Recent Trends and Challenges in Mechatronics, Mechanical Engineering and New High-Tech Products Development, Mecahitech 2009;
[34] Roy Kornbluh, Ron Pelrine, Qibing Pei, Seajin Oh and Jose Joseph, “Ultrahigh strain response of field-actuated elastomeric polymers”;
[35] G.Kovacs, L. Düring, S. Michel, G. Terrasi, “Stacked dielectric elastomer actuator for tensile force transmission”, Sensor and Actuators A: Phys.(2009);
[36] G. Yang, W. Ren, B.K. Mukherjee, G. Akhras, J.P. Szabo, “Transverse strain response of silicone dielectric elastomer actuators”;
[37] G. Yang, W. Ren, B.K. Mukherjee, J.P. Szabo, “The transverse strain response of electroactive polymers actuators”, 2004;

International Conference 2ND International Conference on Innovations, Recent Trends and Challenges
in Mechatronics, Mechanical Engineering and New High-Tech Products Development
MECAHITECH‘10
Bucharest, 23-24 September 2010
512
The Development of Education for the viability of l abour market
through the innovative vectors: MECHATRONICS – INTE GRONICS (M&I)
Professor Ph.D Eng. EurEng. Gh. Ion GHEORGHE *
Ph.D Eng. Paul BECA * Eng. Anton VIERU*
Ec. Octavia CĂRUNTU* Professor Ph.D Eng. Nicolae ALEXANDRESCU**
Professor Ph.D Eng. Cornel MARIN*** Professor Ph.D Eng. Luciana CRISTEA****
Mat. Viorel DUNCA***** Eng. Mariana STOICA******
(*) The National Institute for Research and Development for MECHATRONICS AND MEASUREMENT
TECHNIQUE – INCDMTM, Bucharest –Romania (**) University “Politehnica” Bucharest – Faculty of Mechanical Engineering and Mechatronics, The Research
Centre for Mecahtronics – CCDI (***) University “VALAHIA” of Târgovişte – Department of Materials, Equipments, Installations and Robots
(****) University “Transilvania” of Braşov – Department of Precision Mechanics and Mechatronics (*****) The Professional Association Romanian Patronage in the Industry of Precision Mechanics, Optics and
Mechatronics (******) The Romanian Chamber of Commerce of Bucharest – CCIB
ABSTRACT
The project “The Development of Education for the viability of l abour market through the innovative vectors: MECHATRONICS – INTE GRONICS (M&I)”, financed by the Sector Operational Programme Human Resources Romania 2007÷2013, responds to the directives of the Key Aria of Intervention 2.1 from the priority axis 2: Call for project proposal no. 90 – Learn a trade, on: carrying out a wide set of activities for promo ting the new HIGH-TECH ADVANCED field of MECHATRONICS & INTEGRON ICS, on the internal labour market, especially in the ranks of universit y higher education graduates . This apex field is an integrative science that offers a wide perspective on the contribution of science and technology to the unfolding of the programmes corresponding to the national strategies for sustainable economic development and aligning to the ones promoted at the community level. INTRODUCTION
Promoting MECHATRONICS & INTEGRONICS will lead to t he formation of new occupation niches on the labour market since their current occupation degree is very low at the national scale stemming from the lack of interest in concerns for specialization and facilitating the insertion of un iversity higher education graduates in the fields. The specific objectives pursued in the project:
Improving learning conditions by industrial practice, that is to ensure higher capacity and the capabilities for absorbing young graduates on the labour market;

International Conference 2ND International Conference on Innovations, Recent Trends and Challenges
in Mechatronics, Mechanical Engineering and New High-Tech Products Development
MECAHITECH‘10
Bucharest, 23-24 September 2010
513
Developing and providing services for the orientation, counselling and guiding the transition from school to active life;
Formation, encouraging and developing partnerships between universities and enterprises with the view to ensure professional specialisation and staff absorption;
Promoting equal opportunities; Occupation programme multiregional development; Promoting innovative actions on the transition from school to active life.
Within the target group , the project regards highly important the formation of specialized staff for :
Counselling, orientating and professional during and at the end of the higher learning circle.
Activities of interface in the perfecting of contra cts and partnerships between universities and enterprises (productive commercial societies, of import-export, research and development institutes), for unwinding strategies of practical training of students. On the long term , the project will generate positive effects , such as:
Developing occupational programmes at the national and trans-national scale ; Aligning and integrating in European educational desiderata; Innovative developments meant to favour insertions and assimilations towards new
modern occupational fields on the market labour; Increase in the occupational degree based on safe fields and perspective
ascending trend fields facilitating the sources of integration on the national/international labour market.
FORSEEN RESULTS
The anticipated results of the project , quantified on the basis of indicators: Forming the management team ; management procedures; logistics for
management; Acquisition lists , documentations for equipment and services, reports; Organizing promoting, information and media campaig ns ; promotion plan,
information and media plan, presenting and promoting conference; promoting and media campaigns, etc.;
Building the target group (selecting and constituting the strategy and the programme);
Stuff groups (students in final years of faculties specialized in mechatronics and integronics, practical instruction trainers/tutors and staff – interface between universities and commercial societies, for perfecting practical instruction contracts);
Databases structured on objectives/target groups; Planning the instruction in target groups; Development, implementation, modernizing and evalua tion, counselling and
professional orientation reports (body of counsels, programme of service, counselling and professional orientation);
Methodological and information documentations; Strategies of counselling in the university environment; Monitoring and annual evaluation reports;

International Conference 2ND International Conference on Innovations, Recent Trends and Challenges
in Mechatronics, Mechanical Engineering and New High-Tech Products Development
MECAHITECH‘10
Bucharest, 23-24 September 2010
514
Coercive measures programmes , measures of organizing practical training stages for students;
Partnership contracts between universities and commercial societies for practical training;
Body of tutors for practical training in the host enterprise; Stages of practical instruction of students; Reports of monitoring and evaluation of practical training stages; Round table for experience exchange between partners; Reports of external audit of the project:; Etc.
GLOBAL INDICATORS
Output indicators: No. of tutors who will take part in the instruction: 21 No. of studies, analyses, reports, strategies: 12 No. of partnerships for experience exchange and good practices: 18 No. of students aided in the transaction from school to active life: 360 No. of beneficiaries of the services of career counselling: 400. Results indicators: The share of aided students in the transaction from school to active life: 55% The share of persons who benefited from counselling/orientation and who found a
job: 50% Persons who benefited from counselling/orientation and who continued their studies: 200. Target group: Staff in enterprises with tutor abilities: 21 Young graduates (in the first stage of the first relevant job): 100 Young graduates: 100.
CONCLUSIONS
In conclusion, the current project aims at accomplishing the development objectives in Romania, with the view to reduce as fast as possible the gaps from the EU, by the development and the most efficient use possible of the human capital of Romania, complementarily to the EU strategy and the provisions of the reference National Strategy Framework 2007÷2013. REFERENCES
[1] European Programme <<POSDRU, 2007 ÷ 2013, Invest in People>>, http://www.fseromania.ro/index.php

International Conference 2ND International Conference on Innovations, Recent Trends and Challenges
in Mechatronics, Mechanical Engineering and New High-Tech Products Development
MECAHITECH‘10
Bucharest, 23-24 September 2010
515
PUBLISHING HOUSE
Proceedings of the International Conference “2ND International
Conference on Innovations, Recent Trends and Challenges in Mechatronics, Mechanical Engineering and New High-Tech Products
Development” ISSN 2068-648X