Internalisation mechanisms of the endoderm during ...
250
HAL Id: tel-01426014 https://tel.archives-ouvertes.fr/tel-01426014 Submitted on 4 Jan 2017 HAL is a multi-disciplinary open access archive for the deposit and dissemination of sci- entific research documents, whether they are pub- lished or not. The documents may come from teaching and research institutions in France or abroad, or from public or private research centers. L’archive ouverte pluridisciplinaire HAL, est destinée au dépôt et à la diffusion de documents scientifiques de niveau recherche, publiés ou non, émanant des établissements d’enseignement et de recherche français ou étrangers, des laboratoires publics ou privés. Internalisation mechanisms of the endoderm during gastrulation in the zebrafish embryo Florence Giger To cite this version: Florence Giger. Internalisation mechanisms of the endoderm during gastrulation in the zebrafish embryo. Development Biology. Université Pierre et Marie Curie - Paris VI, 2016. English. NNT: 2016PA066203. tel-01426014
-
Upload
khangminh22 -
Category
Documents
-
view
0 -
download
0
Transcript of Internalisation mechanisms of the endoderm during ...

HAL Id: tel-01426014https://tel.archives-ouvertes.fr/tel-01426014
Submitted on 4 Jan 2017
HAL is a multi-disciplinary open accessarchive for the deposit and dissemination of sci-entific research documents, whether they are pub-lished or not. The documents may come fromteaching and research institutions in France orabroad, or from public or private research centers.
L’archive ouverte pluridisciplinaire HAL, estdestinée au dépôt et à la diffusion de documentsscientifiques de niveau recherche, publiés ou non,émanant des établissements d’enseignement et derecherche français ou étrangers, des laboratoirespublics ou privés.
Internalisation mechanisms of the endoderm duringgastrulation in the zebrafish embryo
Florence Giger
To cite this version:Florence Giger. Internalisation mechanisms of the endoderm during gastrulation in the zebrafishembryo. Development Biology. Université Pierre et Marie Curie - Paris VI, 2016. English. �NNT :2016PA066203�. �tel-01426014�

Institut de Biologie de l’École Normale Supérieure – INSERM U1024 – CNRS UMR 8197 46 rue d’Ulm, 75005 Paris
Thèse de Doctorat de
l’Université Pierre et Marie Curie Spécialité : Biologie moléculaire et cellulaire du développement
École doctorale 515 – Complexité du Vivant
Présentée par
Florence GIGER
Internalisation Mechanisms of the Endoderm During
Gastrulation in the Zebrafish Embryo
Dirigée par Nicolas DAVID
Présentée et soutenue le 23 septembre 2016
Devant un jury composé de :
Professeur Claire FOURNIER-THIBAULT Présidente
Docteur Pia AANSTAD Rapporteur
Docteur Maximilian FÜRTHAUER Rapporteur
Docteur Jo BEGBIE Examinateur
Docteur Estelle HIRSINGER Examinateur
Docteur Laurent KODJABACHIAN Examinateur
Docteur Nicolas DAVID Directeur de thèse
1

2

During development, cells are progressively separated into distinct territories, delimited by
embryonic boundaries. The first segregation event occurs during gastrulation, when the embryo
is organised in three germ-layers, the ectoderm, the mesoderm and the endoderm. The
molecular and cellular mechanisms ensuring this segregation have not yet been elucidated.
During my PhD thesis, I have focused on the endoderm internalisation in the zebrafish embryo.
Based on in vitro results, it has been suggested that germ-layer progenitors would be segregated
by a passive cell sorting. Combining cell transplantation, live confocal microscopy and
functional analyses, I have shown that endodermal cell internalisation actually results from an
active migration process dependent on Rac1 and its effector Arp2/3, a direct regulator of actin.
Strikingly, endodermal cells are not attracted to their internal destination but rather appear to
migrate out of their neighbouring cells. This process is dependent on the Wnt/PCP pathway and
N-cadherin. Furthermore, N-cadherin is sufficient to trigger the internalisation of ectodermal
cells, without affecting their fate. Overall, these results lead to a new model of germ-layer
formation, in which endodermal cells actively migrate out of the epiblast to reach their internal
position.
Au cours du développement, les cellules sont progressivement séparées dans des territoires
distincts délimités par des frontières embryonnaires. La première ségrégation a lieu pendant la
gastrulation, quand l’embryon s’organise en trois feuillets embryonnaires, l’ectoderme, le
mésoderme et l’endoderme. Les mécanismes moléculaires et cellulaires assurant cette
ségrégation n’ont pas encore été élucidés. Au cours de ma thèse, je me suis focalisée sur
l’internalisation de l’endoderme chez le poisson-zèbre. À partir de résultats in vitro, il a été
suggéré que les progéniteurs de feuillets embryonnaires soient ségrégés par un tri cellulaire
passif. En combinant des expériences de transplantation de cellules, une imagerie confocale en
temps réel et des analyses fonctionnelles, j’ai montré que l’internalisation des cellules
endodermiques est due en réalité à un processus de migration active dépendante de Rac1 et de
son effecteur Arp2/3, un régulateur direct de l’actine. De manière surprenante, les cellules
endodermiques ne sont pas attirées par leur destination interne, mais semblent plutôt migrer
hors de leurs voisines. Ce processus est dépendant de la voie Wnt/PCP et de la N-cadhérine. De
plus, la N-cadhérine est suffisante pour induire l’internalisation de cellules ectodermiques, sans
modifier leur identité. Dans leur ensemble, ces résultats conduisent à un nouveau modèle de
formation des feuillets embryonnaires dans lequel les cellules endodermiques migrent
activement hors de l’épiblaste pour atteindre leur position interne dans l’embryon.
3

4
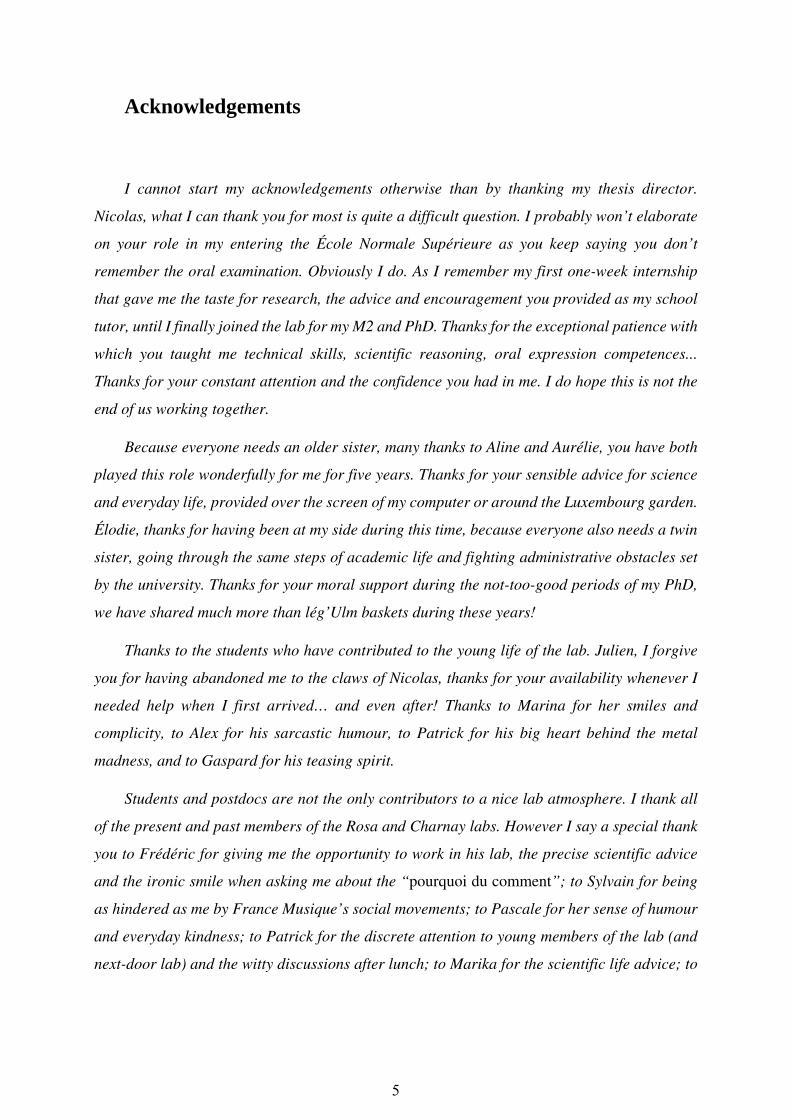
Acknowledgements
I cannot start my acknowledgements otherwise than by thanking my thesis director.
Nicolas, what I can thank you for most is quite a difficult question. I probably won’t elaborate
on your role in my entering the École Normale Supérieure as you keep saying you don’t
remember the oral examination. Obviously I do. As I remember my first one-week internship
that gave me the taste for research, the advice and encouragement you provided as my school
tutor, until I finally joined the lab for my M2 and PhD. Thanks for the exceptional patience with
which you taught me technical skills, scientific reasoning, oral expression competences...
Thanks for your constant attention and the confidence you had in me. I do hope this is not the
end of us working together.
Because everyone needs an older sister, many thanks to Aline and Aurélie, you have both
played this role wonderfully for me for five years. Thanks for your sensible advice for science
and everyday life, provided over the screen of my computer or around the Luxembourg garden.
Élodie, thanks for having been at my side during this time, because everyone also needs a twin
sister, going through the same steps of academic life and fighting administrative obstacles set
by the university. Thanks for your moral support during the not-too-good periods of my PhD,
we have shared much more than lég’Ulm baskets during these years!
Thanks to the students who have contributed to the young life of the lab. Julien, I forgive
you for having abandoned me to the claws of Nicolas, thanks for your availability whenever I
needed help when I first arrived… and even after! Thanks to Marina for her smiles and
complicity, to Alex for his sarcastic humour, to Patrick for his big heart behind the metal
madness, and to Gaspard for his teasing spirit.
Students and postdocs are not the only contributors to a nice lab atmosphere. I thank all
of the present and past members of the Rosa and Charnay labs. However I say a special thank
you to Frédéric for giving me the opportunity to work in his lab, the precise scientific advice
and the ironic smile when asking me about the “pourquoi du comment”; to Sylvain for being
as hindered as me by France Musique’s social movements; to Pascale for her sense of humour
and everyday kindness; to Patrick for the discrete attention to young members of the lab (and
next-door lab) and the witty discussions after lunch; to Marika for the scientific life advice; to
5

6

Aurélie for the words of encouragement during the tea breaks; and to Firas for the care of our
fish.
Speaking of fish, thank you Estelle for your help when I needed embryos. I am really
grateful to you as well as Stéphane and Alex at Jussieu’s fish facility. Many thanks also for your
scientific advice as part of my thesis committee. Another colourful figure of my thesis committee
was my “thesis godmother”; thank you Sonia for listening to my concerns and shouting the
very personal optimism you have for scientific life. Let’s keep your motto in mind: « au pire,
tout ce qui peut arriver, c’est que ça se passe très mal ! »
Let’s now cross the Chanel and spend some time in Oxford. Thanks Jo for introducing me
to the second-best model in developmental biology, and offering me my first opportunity to
present my work at a meeting. Thanks Lexy and Stephen for the incomparable family
atmosphere you gave to this lab. And finally, Jo, thank you so much for welcoming me
repeatedly, I look forward to seeing more of you during my postdoc in London.
A few words for my family, thanks for being each of you, in your own way, interested in
my work, thanks for sharing my expectations, dismissing my doubts, and being always at my
side. Thanks to my friends outside the lab and in particular my music partners.
Finally, many thanks to the members of the jury for accepting to be part of it, and in
particular to the reviewers, Pia Aanstad and Max Fürthauer. Bonne lecture !
7

8

List of abbreviations
BMP: bone morphogenetic protein
CIL: contact inhibition of locomotion
DIC: differential interference contrast
EC: extracellular
EMT: epithelial-to-mesenchymal transition
EVL: enveloping layer
FGF: fibroblast growth factor
FGFR: fibroblast growth factor receptor
GPCR: G-protein coupled receptor
GPI: glycosylphosphatidylinositol
hpf: hours post fertilisation
Irf: interferon regulatory factor
MAPK: mitogen-associated protein kinase
MMP: matrix metalloproteinase
MLC: myosin light chain
MLCK: myosin light chain kinase
MTOC: microtubule organising centre
PCP: planar cell polarity
PI3K: phosphoinositide 3 kinase
PIP3: phosphatidylinositol-triphosphate
PKC: protein kinase C
PLC: phospholipase C
RTK: receptor tyrosine kinase
WASP: Wiskott-Aldrich syndrome protein
WAVE: WASP-family verprolin homology protein
YSL: yolk syncytial layer
9

10

Table of contents
INTRODUCTION 17
I. Establishment of Embryonic Boundaries 21
1. Tissue Segregation during Development 21
2. Cell Sorting Based on Biophysical Properties 23
3. Cell Sorting Based on Different Repertoires of Adhesion Molecules 27
4. Cell Sorting Achieved by Contact Inhibition 29
II. Mechanisms of Active Cell Migration Segregating Cell Populations 35
1. Actin Cytoskeleton 35
2. Cell Polarity 37
3. Models of Migration in Vitro 41
4. In Vivo: Integration of the Environment 45
III. Endoderm and Mesoderm Internalisation in Model Organisms 51
1. Lessons from Sea Urchin Gastrulation: Two Ways for Cell Internalisation 51
2. Internalisation of a Coherent Layer of Cells 51
3. Ingression of Individual Cells 55
IV. Zebrafish Embryo Early Development 63
1. Stages of Development 63
2. Genetic Control of Endoderm Formation 71
3. Morphogenetic Gastrulation Movements 73
EXPERIMENTAL APPROACH 81
Live Imaging of Zebrafish Gastrulation 83
Functional Analysis of Endoderm Internalisation 85
RESULTS 89
The Endodermal Germ Layer Formation Results from Active Migration Induced by N-
cadherin 91
11

12

DISCUSSION 131
Work at the Animal Pole 135
Ectopic Transplantation of Nodal-Activated Cells 135
Creation of Mosaic Embryos by Plasmid DNA Injection 137
Relevance of a Passive Cell Sorting for the Formation of Germ-layers 137
Cell Sorting and Germ-layer Formation: a Long-Lasting Idea 137
Direct Observations and Functional Analyses Challenging This Model 139
Role for Cell Sorting in the Maintenance of Germ-layer Boundaries? 141
Polarisation of Cells 141
Origin of the Polarising Signal 141
Role of Par-3 145
Role of the Wnt/PCP Pathway 145
Migration Towards a “Cell-Free” Area 147
Role of the Eph/Ephrin Signalling Pathway 147
Contact Inhibition of Locomotion 149
Role of N-cadherin in Cell Internalisation 151
N-cadherin Cell-autonomous Function 151
Subcellular Localisation of N-cadherin in Migrating Cells 153
Lack of Gastrulation Defects in N-cadherin Parachute Mutants 153
Conservation of N-cadherin and Reinterpretation of EMT During Gastrulation 155
Conclusion 157
BIBLIOGRAPHIC REFERENCES 161
APPENDIX 187
Appendix 1 189
Inhibitory signalling to the Arp2/3 complex steers cell migration. 189
Appendix 2 229
Analyzing In Vivo Cell Migration using Cell Transplantations and Time-lapse Imaging in
Zebrafish Embryos. 229
13

14
Figure contents
Figure 1: Models for Embryonic Boundary Formation. 20
Figure 2: Liquid-like Properties of Cell Tissues and Their Cellular Basis. 22
Figure 3: Cell Sorting Based on Different Types of Cell Adhesion Molecules. 26
Figure 4: Contact Inhibition Mediated by Eph/Ephrin Signalling. 30
Figure 5: Actin Cytoskeleton. 34
Figure 6: Cell Polarity. 40
Figure 7: Membrane Protrusions and Cell Migration. 42
Figure 8: Prechordal Plate Collective Migration. 46
Figure 9: Neural Crest Cell Migration by Contact Inhibition of Locomotion. 48
Figure 10: Back to the 50s: Live Imaging of Sea Urchin Gastrulation. 50
Figure 11: Two Main Ways for Cell Internalisation. 52
Figure 12: Involution at the Level of the Blastopore in Xenopus. 54
Figure 13: EMT at the Level of the Primitive Streak in Chick. 56
Figure 14: Zebrafish Stages of Development. 62
Figure 15: Zebrafish Extra-Embryonic Layers. 66
Figure 16: Zebrafish Fate Map. 66
Figure 17: Nodal Signalling Pathway. 72
Figure 18: Zebrafish Morphogenetic Gastrulation Movements. 74
Figure 19: Germ-layer Progenitor Physical Properties and Segregation. 76
Figure 20: Transplantation of endoderm-committed cells at the animal pole. 84
Figure 21: Internalisation model. 134
Figure 22: Internalisation of an Endogenous Cell at the Margin of the Embryo. 136
Figure 23: N-cadherin-induced motility. 150
15

16

INTRODUCTION
17

18

During development, cells separate into tissues and organs to give rise to a functional
organism. All major animal groups are characterised by the organisation of the embryo in
three germ-layers: the ectoderm forms the outside-most layer, the mesoderm lays in the
middle and the endoderm is located at the centre of the embryo. The ectoderm gives rise to
the epidermis, and to tissues that will constitute the nervous system. The mesoderm gives rise
to most internal organs: muscles, dermis, blood cells and blood vessels, the gonads, kidneys,
bones and connective tissues. The endoderm gives rise to the epithelium of the digestive tract
and respiratory system, and to organs associated with the digestive system, such as the liver
and the pancreas.
The organisation of the embryo in three germ-layers occurs during a process called
gastrulation, derived from the Greek (gaster), meaning stomach, gut. Before
gastrulation, all cells form a uniform layer in the embryo. Large scale cell movements
remodel the embryo in order to segregate germ-layer progenitors, and in particular get
mesodermal and endodermal cells internalised. The general movements of this internalisation
have been described in most species. However, the cellular mechanisms underlying these
movements still need to be unravelled. Being optically clear, the zebrafish embryo appeared
as a good model to analyse the cell movements underlying germ-layers segregation during
gastrulation.
In this introduction, I first discuss the different ways to segregate cell populations and
establish embryonic boundaries, from cell sorting based on biophysical properties to active
migration mechanisms. I then review the different gastrulation strategies in the major model
organisms, and finally I describe the early steps of zebrafish embryo development, from
fertilisation to gastrulation.
19
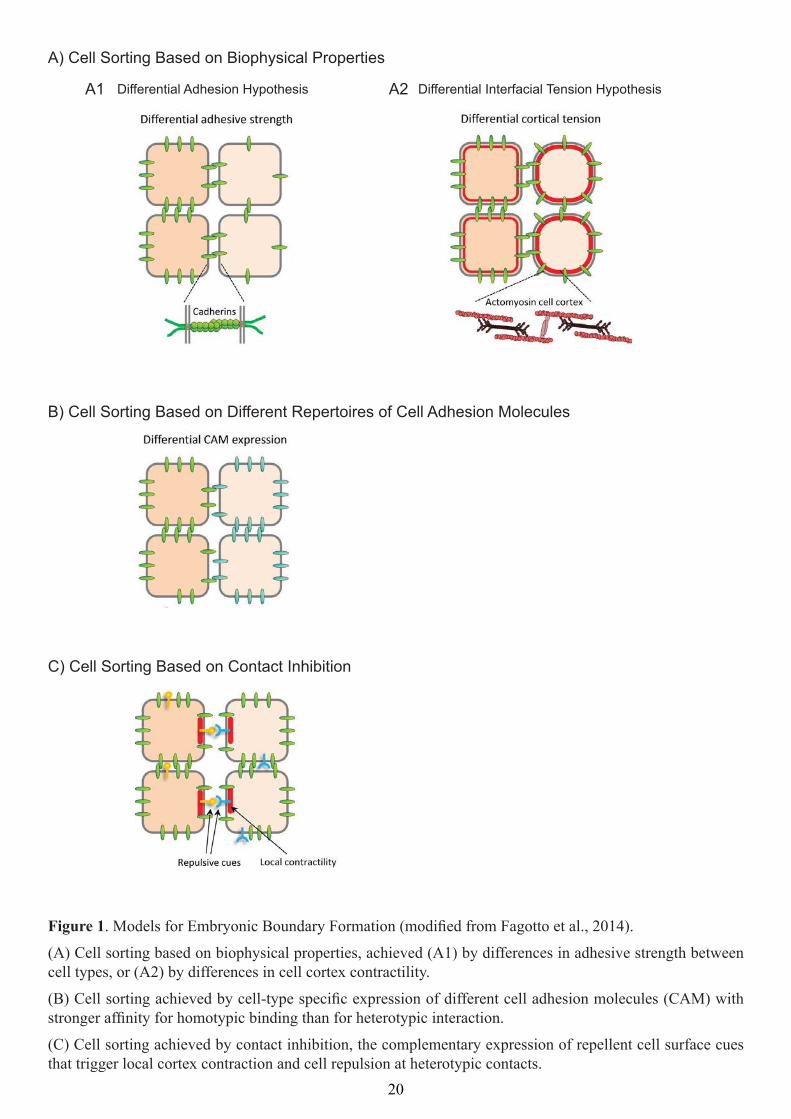
. Models for Embryonic Boundary Formation (modiied from Fagotto et al., 2014).
(A) Cell sorting based on biophysical properties, achieved (A1) by differences in adhesive strength between cell types, or (A2) by differences in cell cortex contractility.
(B) Cell sorting achieved by cell-type speciic expression of different cell adhesion molecules (CAM) with stronger afinity for homotypic binding than for heterotypic interaction.
(C) Cell sorting achieved by contact inhibition, the complementary expression of repellent cell surface cues that trigger local cortex contraction and cell repulsion at heterotypic contacts.

I. Establishment of embryonic boundaries
1. Tissue segregation during development
Development proceeds by subdivisions of a single mass of cells into progressively
smaller regions, which will eventually give rise to the tissues and organs of the adult
organism. The position and size of these regions are determined by the interplay between
patterning signals and gene regulatory networks. The newly determined regions become
rapidly physically separated by embryonic boundaries, which impede any future exchange of
cells. Boundaries allow each separate region to further evolve into complex structures
(Fagotto, 2015). The first segregation of cells occurs during gastrulation and results in the
creation of three germ-layers, the ectoderm, the mesoderm and the endoderm.
The phenomenon of cell sorting was discovered in sponges at the beginning of the 20th
century, when it was observed that dissociated cells from different embryonic territories
gradually sort into distinct populations (Wilson, 1907). Following these first observations,
Townes and Holtfreter systematically analysed the behaviour of dissociated and mixed germ-
layer progenitors from frog embryos. They noticed that “mixed-up individual cells first
formed a single aggregate, and then performed, according to their cell type, the same kinds of
directed movements as did the corresponding tissue fragments”. This indicated that all cells
could adhere to each other, but were associated with different affinities. The authors
distinguished two phases in the re-aggregation process: in consequence of directed
movements, the different cell types were first sorted out into distinct homogeneous layers, the
stratification of which corresponded to the normal germ-layer arrangement. The tissue
segregation then became complete because of the emergence of a selectivity of cell adhesion,
which they termed “cell affinity”: homologous cells when they meet remain permanently
united, whereas a cleft develops between non-homologous tissues (Townes and Holtfreter,
1955).
Various models have been proposed to explain tissue separation and provide a
mechanistic explanation for the absence of mixing across the tissue interface. Some are based
solely on physical considerations, whereas others involve more regulated cellular pathways,
such as cadherin expression or Eph/ephrin signalling (Figure 1; Fagotto, 2014).
21

zebraish ectoderm (red) and mesendoderm (green). Modiied from Foty and Steinberg, 2013.
(B1) Interfacial tension results from the balance of surface tension (blue arrows) dictated by the cortical contractility (red) that tends to minimise the cell surface area, and cell-cell adhesion (green) that produces an opposing force increasing cell-cell contact. (B2) Heterotypic contact between loosely adhering cells (yellow) and a tightly packed epithelium (blue). Modiied from Fagotto, 2014.
(b)
(d)
(c)

2. Cell sorting based on biophysical properties
a) Differential adhesion hypothesis
Following Townes and Holtfreter’s tissue re-aggregation observations, Steinberg
proposed a new interpretation of cell sorting, by comparing cells within tissues with
molecules in liquids. He suggested that the binding of cell to cell was achieved through the
formation of Ca2+-dependent bounds between the surfaces of adjacent cells, comparable with
the cohesion bounds between two molecules of a liquid. Cells of different identities would
differ by the organisation of bounds at their surface, which would induce cells to adhere
preferentially, but not exclusively, with cells of the same identity. The principle of liquid
surface tension predicted many of the configurations adopted by cells and tissues. For
instance, tissue explants in isolation round up, thus minimising the surface exposed to the
medium, like drop of oil in water. Similarly, when two groups of cells are put into contact,
they either coalesce or remain fully separated, again similar to the behaviour of immiscible
liquids (Figure 2A; Steinberg, 1958).
Steinberg suggested that cells of a strongly cohesive type, when moving among cells of a
more weakly cohesive type, could by their own progressive cohesion squeeze the other cells
to the periphery and thereby assume an internal position, in the absence of directed migration.
Differences in mutual adhesiveness among cells could thus alone account for both sorting and
selective localisation of cells (Steinberg, 1958; Steinberg, 1962). The physical and biological
bases of this theory have since been validated in vitro. Measurement of the surface tension of
embryonic tissues demonstrated that a tissue of lower tension indeed always enveloped a
tissue of higher tension (Foty et al., 1996). The surface tension was then found to be a linear
function of the level of cadherin expression (Foty and Steinberg, 2005), confirming that
differences in adhesion alone could account for differences in surface tension, which induce
tissue separation (Figure 1A).
The relevance of differential adhesion in segregating cell populations in vivo has been
tested in different morphogenetic systems, and in particular in the zebrafish gastrula. It has
been shown that mesendodem and ectoderm tissues display different surface tensions,
ectoderm being more cohesive than mesendoderm. Consistently, upon separation and mixing,
mesendodermal cells envelop ectodermal cells, a process dependent on E-cadherin levels
(Schötz et al., 2008).
23

24

b) Differential interfacial tension hypothesis
Steinberg’s differential adhesion hypothesis was first challenged by Harris, who pointed
out major differences in the physical properties of liquid drops and living cells. In particular,
liquid drops are thermodynamically closed systems whereas aggregates of living cells can
generate metabolic energy capable of altering cell position and adhesion. Furthermore,
because intercellular adhesion is generally concentrated at small foci such as desmosomes, a
maximisation of intercellular adhesion does not necessarily correlate with a maximisation of
intercellular contact area (Harris, 1976).
Harris proposed alternative hypotheses able to explain cell sorting behaviour, one of
them being the differential surface contraction hypothesis, which explains the differences in
surface tension by the contraction of acto-myosin cell cortex (Harris, 1976). This hypothesis
has been later formalised by Brodland, who precisely simulated cell-cell interactions and
found they could not be explained by Steinberg’s differential adhesion hypothesis. The
differential interfacial tension hypothesis he proposed includes an important component of
contractile tension induced by acto-myosin filaments, which tends to round up the cell and
hence reduce the interface surface between two cells, while cell-cell adhesion increases this
surface (Figures 1A, Figure 2B; Brodland, 2002).
In the context of germ-layer separation during gastrulation in the zebrafish embryo,
atomic force microscopy has been used to determine the level of adhesion and cortical tension
at the single cell level. The authors show that higher acto-myosin-dependent cell-cortex
tension, but not adhesion, correlates with ectoderm progenitor sorting to the inside of a
heterotypic aggregate (Krieg et al., 2008).
At least two major objections to these conclusions can be raised. The most obvious one is
that in the embryo, the ectoderm envelops the mesendoderm, which does not fit with their
sorting behaviour in vitro. Authors point out the presence of the enveloping layer (EVL) and
yolk syncytial layer (YSL) that could modify the relative adhesions between the different
layers in the embryo to explain this discrepancy. The second objection is related to the time
scale of this sorting phenomenon: while the internalisation of the mesendoderm occurs in less
than one hour in vivo, progenitor cell sorting took several hours in vitro. These observations
suggest that differential adhesion alone may not account for tissue separation, and that other
mechanisms are likely at stake for the separation of germ-layers in the fish embryo. Direct in
25

-strands (expanded view). Modiied from Brasch et al., 2012.
homotypic aggregates. Modiied from Katsamba et al., 2009.
B) Segregation of Cells According to Their Specific Expression of Cadherin Types
A B
E-cadherinE-cadherin
N-cadherinN-cadherin
Homotypic Mixing
D
E-cadherinN-cadherin
Heterotypic Mixing
A) Type I Cadherin Structure and Homodimerisation
(a) EC5
EC4
EC3
EC2
EC1
90º
EC1EC1
EC1
EC2
EC3
EC4
EC5
(b)
90º
EC3
EC4
EC5
p120
β-cateninα-catenin
Actin
EC2
EC1

vivo observations are missing to assess the relevance of differential adhesion and/or
differential interfacial tension in the formation of the germ-layers during gastrulation.
3. Cell sorting based on different repertoires of adhesion molecules
a) Cadherins
Cadherins are a large family of transmembrane proteins involved primarily in cell
adhesion. Three classes of cadherins have been identified, depending on their number and
arrangement of extracellular domains: classical cadherins, protocadherins and atypical
cadherins. I will focus here on classical cadherins, and in particular type I classical cadherins,
which were first identified as cell surface glycoproteins responsible for Ca2+-dependent
homophilic cell-cell adhesion in the pre-implantation mouse embryo, and during chick
development (Yoshida and Takeichi, 1982).
The classical cadherins are composed of five extracellular (EC) cadherin repeats, a
transmembrane domain and a cytoplasmic tail. Cadherins form homodimers through their N-
terminal extracellular domains and thus form trans bonds between adjacent cells. The binding
relies on a double hydrophobic interaction: a tryptophan residue on the EC1 is anchored into a
conserved hydrophobic pocket in the body of the partnering EC1 domain. Calcium binds to
cadherins at stereotyped binding sites situated between successive EC domains. Ca2+ binding
rigidifies the extracellular domain so that it adopts a characteristic crescent shape, critical to
adhesive trans binding. The intracellular domain interacts with p120 and -catenin, which
binds to -catenin and the actin cytoskeleton (Figure 3A; Alpha S. Yap and Barry M.
Gumbiner, 1998). The recruitment of actin fibres stabilises the complex, strengthening the
cellular adhesion (Brasch et al., 2012).
b) Different combinations of cadherins
Cadherins preferentially form homophilic binding. It has been shown in vitro that cells of
different types expressing either E-cadherin or N-cadherin are segregated according to the
cadherin type they express (Figure 1B, Figure 3B; Katsamba et al., 2009; Nose et al., 1988;
Takeichi et al., 1981). Specificity of cadherin expression has then been observed in different
tissues in the chick embryo, N-cadherin being specifically expressed in the inner portion of
the cell layer in closing vesicular or tubular structures (Edelman et al., 1983). Furthermore, N-
27

28

cadherin expression was found to be initiated in cells undergoing separation from other cell
layers during morphogenetic processes such as gastrulation, neurulation and lens formation. It
has therefore been postulated that specificity of cadherin expression would facilitate
segregating specific cells into different tissues during development (Hatta and Takeichi,
1986). The switch from E-cadherin to N-cadherin is regarded as one of the hallmarks of the
process of Epithelial-to-Mesenchymal Transition (EMT), when epithelial cells lose their
characteristic polarity, disassemble cell-cell junctions and become more migratory (Wheelock
et al., 2008).
The functional role of tissue-specific cadherin expression in cell sorting has however
been questioned with the observation of heterotypic binding between E-cadherin and N-
cadherin (Volk et al., 1987). Cells expressing different types of cadherins have been observed
to mix, revealing the formation of heterophilic cadherin adhesive interactions (Niessen and
Gumbiner, 2002).
The effect of manipulating cadherin levels and functions in normal embryonic tissues has
been studied directly in the Xenopus gastrula. Interference with cadherin adhesion did not
affect normal tissue separation, and the artificial creation of adhesive differences failed to
induce separation (Ninomiya et al., 2012), suggesting that cadherin-based cell sorting does not
play a significant role in establishing embryonic boundaries in vivo. Although the authors did
not test directly the effect of expressing E-cadherin in a portion of cells and N-cadherin in
another portion of cells, these in vivo observations do not support differential adhesion
hypothesis, and suggest that other mechanisms would be responsible for the segregation of
cell populations in the embryo.
4. Cell sorting achieved by contact inhibition
a) Eph/ephrin signalling
Over the past 20 years, Eph/ephrin signalling has been involved in the formation of a
number of embryonic boundaries. Eph receptors constitute a large family of receptor tyrosine
kinases (RTKs). They exclusively bind ephrin ligands, which are divided in two classes:
ephrins A are extracellular proteins tethered to the cell membrane by a
glycosylphosphatidylinositol (GPI) anchor and ephrins B are transmembrane proteins. Both
receptors and ligands being attached to the cell membrane, Eph/ephrin signalling requires cell
29

cell (bottom). Modiied from Kullander and Klein, 2002.
embryo. Rohani et al., 2011.

contact. Eph/ephrin signalling can be bi-directional, with intracellular pathways operating
downstream of both the Eph receptor (forwards signalling) and the ephrin ligand (reverse
signalling), and converging to the cytoskeleton (Figure 4A). In the majority of cases, Eph
forwards signalling causes cell repulsion away from the ephrin-expressing cell, although
adhesive responses have also been described (Kullander and Klein, 2002).
b) Eph/ephrin signalling at embryonic boundaries
Eph/ephrin signalling has first been studied for its role in axon guidance during neural
development. The role of Eph/ephrin signalling in boundaries was discovered in the mouse
embryo in the hindbrain, which is segmented in seven rhombomeres, r1-r7. The Eph receptor
EphA4 is regulated by Krox20 and was found to be expressed specifically in rhombomeres 3
and 5 (Gilardi-Hebenstreit et al., 1992). Further characterisation of the expression of Eph
receptors has shown that three more Eph receptors have a segmented pattern of expression in
the rhombencephalon: EphB2 and EphB3 are expressed in rhombomeres 3 and 5 like EphA4,
while EphA2 is expressed in rhombomere 4, suggesting that Eph/ephrin signalling could play
a role during hindbrain segmentation. The functional role of Eph/ephrin signalling in
hindbrain boundaries formation was later demonstrated in Xenopus and zebrafish: loss of
function experiments have shown that down-regulation of EphA4 indeed led to a
missegregation of rhombomeres 3 and 5 (Xu et al., 1995).
Eph/ephrin signalling has then been shown to be involved in tissue separation in the
forebrain in zebrafish (Xu et al., 1996), in the somites boundaries in zebrafish (Durbin et al.,
1998) and later in chick (Watanabe et al., 2009), and in the ectoderm/mesoderm and
notochord/presomitic mesoderm separations in Xenopus (Fagotto et al., 2013; Rohani et al.,
2011).
c) Molecular mechanism of Eph/ephrin signalling
The mechanism of cell-cell repulsion has been mostly studied in the Xenopus embryo at
the ectoderm/mesoderm boundary. Cycles of alternating detachments-reattachments have
been observed and described as follows: tight cadherin contacts favour ephrin-Eph
interactions, which activates Rho GTPase. Rho activation induces a myosin-dependent local
increase in cortical tension and inhibits cadherin cluster formation, which eventually triggers
repulsion and deadhesion. Once cells apart, the repulsive signal decays, contractility
31

32

decreases, and protrusions are emitted until adhesive contacts are re-established (Figure 4B;
Fagotto et al., 2013; Rohani et al., 2011). These repulsive cues trigger contact inhibition at
heterotypic contacts and thus control tissue separation events based on “negative affinities”
(Figure 1C; Fagotto et al., 2014).
Different models have thus been proposed to explain the formation and maintenance of
boundaries formation. While the Eph/ephrin signalling pathway seems to be very efficient to
maintain existing boundaries in a number of different systems, the role of this pathway in
establishing boundaries has not yet been addressed. Likewise, computational modelling has
suggested that, while differential adhesion is efficient to maintain but not induce cell sorting,
oriented migration is more efficient to segregate different cell types (Tan and Chiam, 2014).
In the next part, I will discuss mechanisms of active cell migration that could play a role in
segregating cell populations.
33
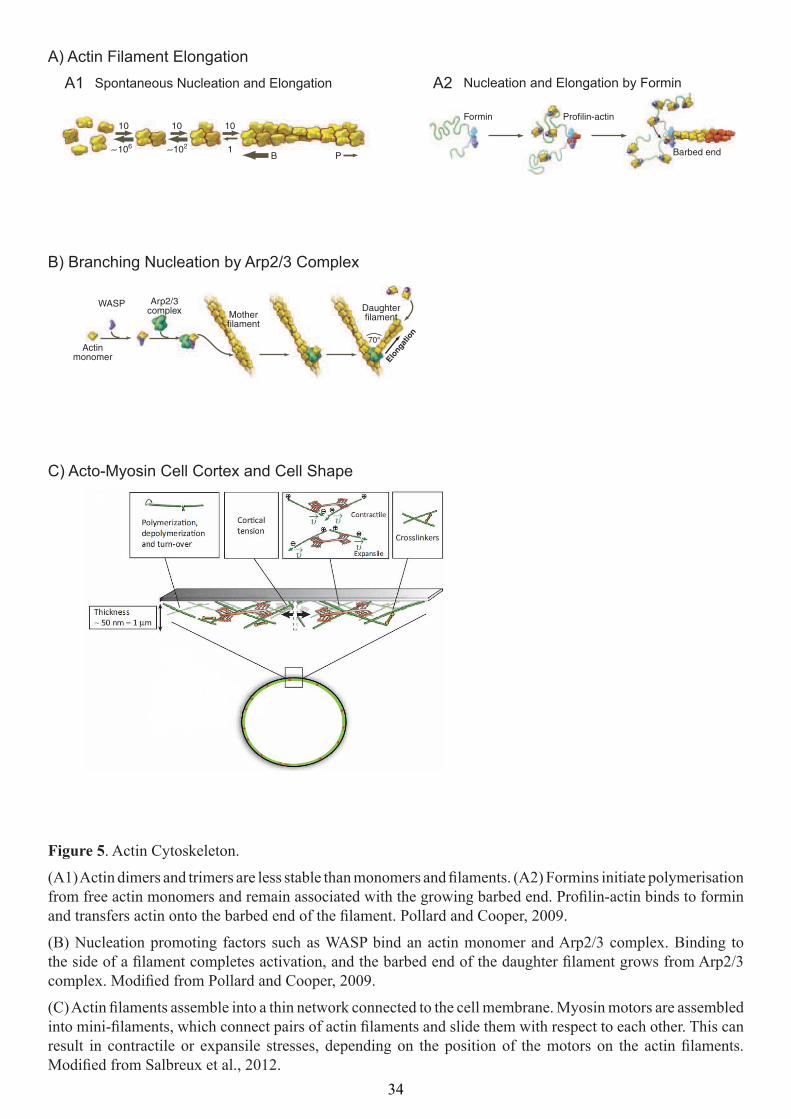
(A1) Actin dimers and trimers are less stable than monomers and ilaments. (A2) Formins initiate polymerisation from free actin monomers and remain associated with the growing barbed end. Proilin-actin binds to formin and transfers actin onto the barbed end of the ilament. Pollard and Cooper, 2009.
(B) Nucleation promoting factors such as WASP bind an actin monomer and Arp2/3 complex. Binding to the side of a ilament completes activation, and the barbed end of the daughter ilament grows from Arp2/3 complex. Modiied from Pollard and Cooper, 2009.
(C) Actin ilaments assemble into a thin network connected to the cell membrane. Myosin motors are assembled into mini-ilaments, which connect pairs of actin ilaments and slide them with respect to each other. This can result in contractile or expansile stresses, depending on the position of the motors on the actin ilaments. Modiied from Salbreux et al., 2012.
10 10 10
B P106 102 1
on
July
5, 2
016
http
://sc
ienc
e.sc
ienc
emag
.org
/
D Nucleation and elongation by formin
Formin Profilin-actin
Barbed end
on
July
5, 2
016
http
://sc
ienc
e.sc
ienc
emag
.org
/
E Branching nucleation by Arp2/3 complex
F
Actinmonomer
WASP/Scar
Arp2/3complex Mother
filament
Daughterfilament
Elo
ngat
ion
70°
on
July
5, 2
016
http
://sc
ienc
e.sc
ienc
emag
.org
/

II. Mechanisms of active cell migration segregating cell populations
1. Actin cytoskeleton
a) Actin filaments
The major component of the cytoskeleton is actin, an ATP-binding protein that exists in
two forms in the cell: monomers (G-actin or globular-actin) and filaments (F-actin or
filamentous-actin). Only polymeric F-actin is known to have a biological function. Actin
filaments are assembled by the reversible polymerisation of monomers. Actin filaments are
polar; the fast-growing end is called the barbed end, and the slower-growing end is called the
pointed end. Polymerisation occurs mostly at the barbed end (Korn et al., 1987) and is tightly
controlled by monomer- and filament-binding proteins that regulate the monomer pool,
orchestrate the formation of filaments, organise filaments into arrays, and depolymerise
filaments for monomer recycling (Figure 5A; Pollard and Cooper, 2009; Pollard et al., 2000).
All cells contain a cortical network of actin filaments, generally oriented with their barbed
ends facing towards the plasma membrane (Welch and Mullins, 2002).
b) Actin branching
The formation of new actin filaments from actin monomers is regulated by three classes
of nucleating proteins. Formins and tandem-monomer-binding nucleators form unbranched
filaments (Figure 5A) while the Arp2/3 complex nucleates branched actin filaments. The
Arp2/3 complex consists of seven tightly associated subunits that include the actin-related
proteins Arp2 and Arp3 and five additional proteins (Machesky et al., 1994). This complex
plays a dual role in actin polymerisation: it nucleates new actin filaments, and it cross-links
newly formed filaments into Y-branched arrays characterised by a stereotypical branch angle
of 70° (Figure 5B; Mullins et al., 1998). The Arp2/3 complex is regulated by a number of
nucleation promoting factors (Derivery and Gautreau, 2010), among which proteins of the
WASP (Wiskott-Aldrich syndrome protein) and WAVE (WASP-family verprolin homology
protein) families. One of Arp2/3 regulators, Arpin, has recently been identified and I have
participated in the characterisation of its role in in vivo cell migration during my PhD (Dang
et al., 2013, APPENDIX 1).
35

36

c) Acto-myosin cortex
The cellular cortex comprises a layer of actin filaments, myosin motors, and actin-
binding proteins and lies under the plasma membrane of most eukaryotic cells. Mechanically,
the cortical actin mesh is the main determinant of stiffness of the cell surface and resists
external mechanical stresses (Bray and White, 1988). The cortex can undergo dynamic
remodelling on timescales of seconds, because of turnover of its protein constituents and
network rearrangement through myosin-mediated contractions. This dynamic plasticity is a
key feature of animal cell survival in a changing extracellular environment, as it allows cells
to rapidly change shape, move, and exert forces (Figure 5C; Salbreux et al., 2012).
2. Cell polarity
In cell migration, polarity refers to the front-rear polarity, the molecular and functional
differences between the front (closest to the direction of migration) and rear (opposite to the
front) of the cell (Figure 6A). In most cases, the symmetry is broken by signals from the
extracellular environment and later integrated by intracellular machineries. Cell polarity has
been mostly studied in the social amoeba Dictyostelium discoideum and in neutrophils in
vitro. I will first review the different kinds of anisotropy that can break cell symmetry and
then analyse the intracellular pathways integrating these signals.
a) Breaking the symmetry; perception of the extracellular environment
The anisotropy of the extracellular environment can be of several natures. The best
studied in case of cell migration have been gradients in chemical components (chemotaxis),
cellular adhesion (haptotaxis), and mechanical properties (durotaxis).
Chemotaxis refers to the movement of an organism towards a chemical stimulus.
Gradients of chemo-attractants like morphogens or pheromones in prospective migrating cells
provide spatial cues that generate cellular asymmetry by activating specific receptors, which
are distributed homogeneously in the cellular membrane. Asymmetric activation of these
receptors creates a front-rear polarity that is amplified through the asymmetric recruitment
and activation of signalling adaptors. This process magnifies very shallow differences in the
gradient as perceived by the front and the rear of the cell (Swaney et al., 2010). The
phenomenon of chemotaxis is observed in particular in wound healing. Rapid induction of
37

38
cell motility in epithelial cells and leukocytes is crucial for efficient epithelial repair and
defence. Epithelial injury causes cell damage and lysis, which releases cytoplasmic molecules
into the extracellular space. These damage associated molecular patterns released at the injury
site, such as ATP and formylated peptides, directly mediate both cell movements and
directional sensing through G-protein coupled receptor (GPCR) pathways (Enyedi and
Niethammer, 2015).
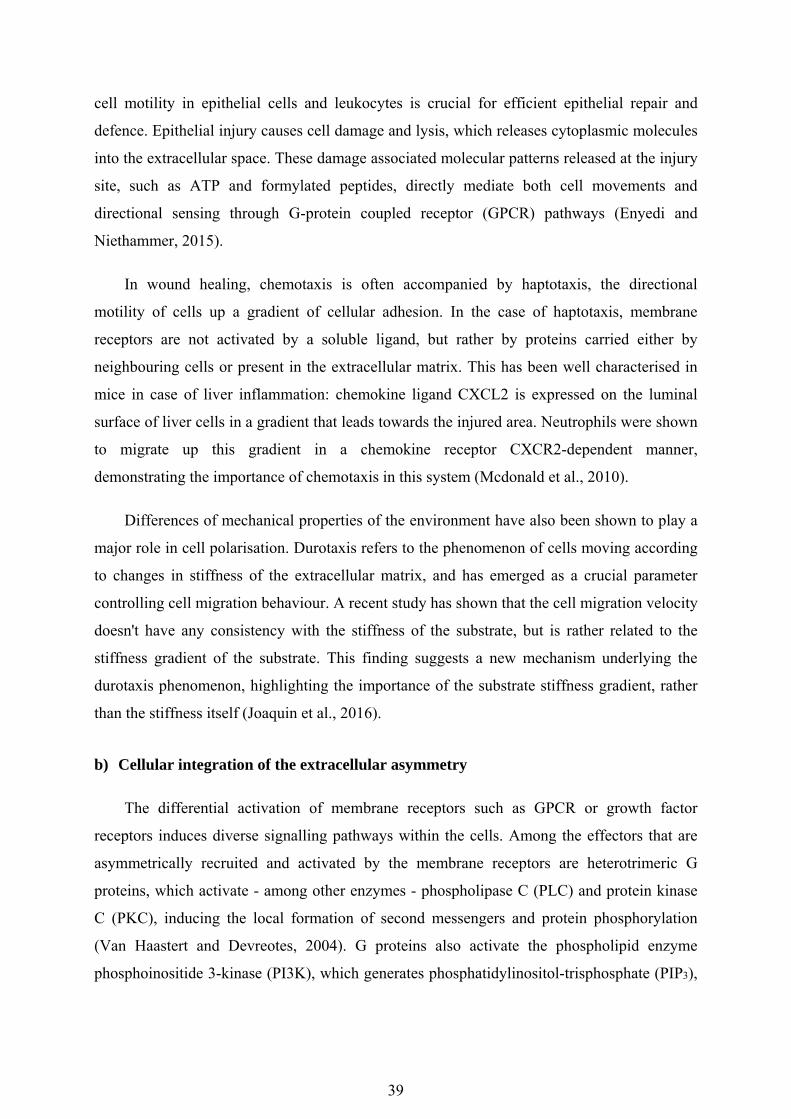
In wound healing, chemotaxis is often accompanied by haptotaxis, the directional
motility of cells up a gradient of cellular adhesion. In the case of haptotaxis, membrane
receptors are not activated by a soluble ligand, but rather by proteins carried either by
neighbouring cells or present in the extracellular matrix. This has been well characterised in
mice in case of liver inflammation: chemokine ligand CXCL2 is expressed on the luminal
surface of liver cells in a gradient that leads towards the injured area. Neutrophils were shown
to migrate up this gradient in a chemokine receptor CXCR2-dependent manner,
demonstrating the importance of chemotaxis in this system (Mcdonald et al., 2010).
Differences of mechanical properties of the environment have also been shown to play a
major role in cell polarisation. Durotaxis refers to the phenomenon of cells moving according
to changes in stiffness of the extracellular matrix, and has emerged as a crucial parameter
controlling cell migration behaviour. A recent study has shown that the cell migration velocity
doesn't have any consistency with the stiffness of the substrate, but is rather related to the
stiffness gradient of the substrate. This finding suggests a new mechanism underlying the
durotaxis phenomenon, highlighting the importance of the substrate stiffness gradient, rather
than the stiffness itself (Joaquin et al., 2016).
b) Cellular integration of the extracellular asymmetry
The differential activation of membrane receptors such as GPCR or growth factor
receptors induces diverse signalling pathways within the cells. Among the effectors that are
asymmetrically recruited and activated by the membrane receptors are heterotrimeric G
proteins, which activate - among other enzymes - phospholipase C (PLC) and protein kinase
C (PKC), inducing the local formation of second messengers and protein phosphorylation
(Van Haastert and Devreotes, 2004). G proteins also activate the phospholipid enzyme
phosphoinositide 3-kinase (PI3K), which generates phosphatidylinositol-trisphosphate (PIP3),
39

by the Microtubule organising centre (MTOC). Modiied from Ridley et al., 2003.
ilaments (red) at the rear. Microtubules (green) originating from the centrosome (purple) are preferentially stabilised in the direction of migration allowing targeted vesicle traficking from the Golgi (brown) to the leading edge. Modiied from Jaffe and Hall, 2005. (B2) Targets of Rho GTPases. Spiering and Hodgson, 2011.
Factors Inluencing FRET Eficiency
Ann
u. R
ev. C
ell D
ev. B
iol.
2005
.21:
247-
269.
Dow
nloa
ded
from
ww
w.a
nnua
lrevi
ews.o
rgby
INSE
RM
-mul
ti-si
te a
ccou
nt o
n 06
/09/
12. F
or p
erso
nal u
se o
nly.

an important second messenger in the amplification of the response to the initial gradient of
stimulus and the asymmetric activation of Rho GTPases (Garcia-Mata and Burridge, 2007).
Cdc42 is among the initial GTPases implicated in the response to polarising signals; it
controls the recruitment of polarity proteins Par-3 and Par-6, atypical PKCs (aPKCs) and the
actin polymerisation machinery to the leading edge (Etienne-Manneville and Hall, 2002).
Cdc42 participates in additional polarity-related events, such as positioning the nucleus and
orienting the microtubules. Cdc42 can directly promote nucleation of actin filaments via its
effect on nucleation promoting factors WASP and WASP, and is essential for restricting
Rac1-dependent actin polymerisation to the front of fibroblasts induced to migrate (Nobes and
Hall, 1999). Rac1 is active at the front of the cell, where it activates Arp2/3 through the
WAVE and WASP complex, and thereby promotes actin branching and the formation of
lamellipodia (Nobes and Hall, 1999). Rho acts at the rear of the cell to generate contractile
forces through Rock-mediated myosin light chain (MLC) phosphorylation, which move the
cell body forwards. In addition, Rho and Rock inhibit Rac1 that also inhibits Rho, which
maintains the polarity. In some situations inhibition of Rock can stimulate cell migration
(Figure 6; Riento and Ridley, 2003).
3. Models of migration in vitro
Cell motility has been studied historically on two-dimensional (2D) tissue culture
surfaces. In most migrating cells, a leading protrusion points in the direction of movement and
is part of a polarity (Ridley et al., 2003). Cells extend three major types of membrane
protrusions at the leading edge: filopodia, lamellipodia and blebs (Ridley, 2011).
a) Polymerisation-driven migration
The “crawling model” is based on actin-polymerisation-based cytoplasmic extensions,
lamellipodia and filopodia. Lamellipodia are broad, sheet-like protrusions that contain a
branched network of thin, short actin filaments (Ponti et al., 2004). Lamellipodia are
generated by the small GTPase Rac1 and some of its effectors, as the WAVE/Scar complex
and N-WASP, which control Arp2/3 (Figure 7A; Campellone and Welch, 2010; Swaney and
Li, 2016). Filopodia are long, thin protrusions that emerge from the cellular membrane. They
are mainly regulated by the small Rho GTPase Cdc42. They are made of long, unbranched,
parallel actin bundles. Their elongation is mediated by formins (Figure 5A). Filopodia carry
41


out an exploratory function, enabling the cell to probe its local environment (Mattila and
Lappalainen, 2008).
Polymerisation-driven migration has been described as follows: localised activation of
Rac1 at the plasma membrane directs the actin nucleator Arp2/3 to form the branched
filamentous actin network which drives protrusion of the lamellipodium at the front of
migration (Svitkina and Borisy, 1999). Integrin receptors then form small clusters termed
nascent adhesions beneath the extending lamellipodium, thereby anchoring the cellular
protrusion to the underlying extracellular matrix (Swaminathan et al., 2016). The small
GTPase RhoA helps to connect these nascent adhesions to acto-myosin stress fibres by
activating the formin family of actin nucleators (Ridley and Hall, 1992). These force-
generating machines respond to the rigidity of the surface and provide the power to enlarge
and strengthen the cell-matrix adhesions needed for moving the bulk of the cell body. The
cell-matrix adhesions disassemble after the nucleus passes over them, and myosin II-mediated
contractility squeezes the back of the cell forwards (Figure 7A; Chen, 1981).
b) Blebbing-induced migration
First observed during primordium germ cells migration in Fundulus embryos (Trinkaus,
1973), migration by blebbing appears as an important motility mechanism and a common
alternative to lamellipodia-driven migration in three-dimensional environments. Blebs are
spherical protrusions formed when the plasma membrane separates from the cortex due to
high cytoplasmic pressure. They differ from other cellular protrusions in that their growth is
pressure-driven, rather than due to polymerising actin filaments pushing against the
membrane.
The bleb life cycle can be subdivided into three phases: bleb initiation (nucleation),
expansion and retraction. Bleb initiation can result from a local detachment of the acto-
myosin cortex from the membrane or from a local rupture of the cortex. Hydrostatic pressure
in the cytoplasm then drives membrane expansion by propelling cytoplasmic fluid through the
remaining cortex or through the cortex hole. Concomitantly, the membrane detaches further
from the cortex, increasing the diameter of the bleb base. As bleb expansion slows down, a
new actin cortex reforms under the bleb membrane. Recruitment of myosin to the new cortex
is followed by bleb retraction. In migrating cells, a new bleb forms soon after cortex re-
polymerisation under the membrane (Figure 7B; Charras and Paluch, 2008).
43

44

4. In vivo: integration of the environment
a) Multiple modes of migration in vivo
Intriguingly, in addition to the well-described mode of lamellipodia-based motility,
single cells can switch between several distinct 3D migration mechanisms, a phenomenon
termed migratory plasticity. An early example of plasticity in the movement of cells was
identified in developing Fundulus embryos (Trinkaus and Lentz, 1967). During gastrulation,
Fundulus deep cells move in the space between two confining cell layers. Non-adherent deep
cells possess large, stable blebs, which switch to flat lamellipodia or filopodia when the cells
become more adhesive (Trinkaus, 1973), similar to zebrafish progenitor cells (Ruprecht et al.,
2015). It is now clear that, rather than adopting one of the well described models for in vitro
2D cell migration, many cell types can use distinct mechanisms to move through diverse 3D
environments (Petrie and Yamada, 2016).
b) Social behaviour of migrating cells
In multicellular organisms, cell migration is essential for development and is required
throughout life for numerous processes, including wound healing and responses to infections.
Dysregulation in the control of cell migration can lead to diseases such as cancer. Most
migration studies have been realised in vitro, while most cells do not move as isolated entities
in vivo but rather interact with their neighbours during migration. Thus, cells must have their
locomotory machinery adapted to these constant interactions. This has prompted scientists to
investigate the ‘social behaviour of cells’ (Abercrombie and Heaysman, 1953). Many models
of collective migration have been described; I will here present two of them: prechordal plate
collective migration and neural crest cell migration by contact inhibition of locomotion.
c) Prechordal plate progenitors collective migration
The prechordal plate is a group of cells composed of the first internalised cells on the
dorsal side of the embryo. During gastrulation, the prechordal plate migrates from the
embryonic organiser to the animal pole, to later give rise mainly to the hatching gland, the
anterior-most structure in the zebrafish embryo (Kimmel et al., 1995; Solnica-Krezel et al.,
1995). Being a cohesive group, the prechordal plate, also referred to as mesendoderm, is a
very good model to study the mechanisms of oriented collective migration.
45

in tiles and oriented animally (arrow). Modiied from Winklbauer, 2009. (A2) The prechordal plate migrates via a distributed traction mechanism. Modiied from Weber et al., 2012.
(B1) Isolated cells (red) do not migrate towards the animal pole. When the cells are contacted by the endogenous plate (green), actin-rich protrusions are reoriented towards the animal pole and cells start migrating in this direction. (B2) Directionality is obtained by transmission of intrinsic information through cell-cell contacts. When isolated however, cells lose directionality. Modiied from Dumortier et al., 2012.
B) Zebrafish Prechordal Plate

In Xenopus, ahead of the involuting mesoderm, the leading-edge mesendodermal cells
migrate as a cohesive group towards the animal pole, on the fibronectin of the blastocoele
floor extracellular matrix (Winklbauer, 1990). Most studies have thus been realised on
blastocoele roof explants. Prechordal plate progenitors emit frequent lamellipodia in the
direction of migration, crawling underneath the cellular body of the preceding cell and thus
forming a structure in tiles (Figure 8A; Winklbauer, 2009). Recent studies have shown that
prechordal plate progenitors respond to local forces and migrate persistently away from the
direction of the applied force (Weber et al., 2012). This response is dependent on E-cadherin.
In the embryo, the traction forces that each cell exerts on the substrate must be balanced by
the cell-cell adhesions that keep the cells part of a cohesive tissue. The notochord lying
behind the prechordal plate is thought to exert a pulling force on the advancing prechordal
plate, and thus polarise prechordal plate progenitors that migrate in the opposite direction,
towards the animal pole (Figure 8A; Weber et al., 2012).
The collective behaviour of prechordal plate migration has been studied in vivo in the
zebrafish embryo. These studies have revealed that all prechordal plate cells actively migrate
as individuals, using actin-rich cytoplasmic extensions oriented in the direction of migration.
However, prechordal plate progenitors isolated from the endogenous plate lose their
orientation and do not migrate towards the animal pole. When these isolated cells are
contacted by the plate, they re-orient their protrusions in the direction of movement and start
migrating towards the animal pole, demonstrating that prechordal plate progenitors require a
directional signal provided by contact to the endogenous plate to migrate. Prechordal plate
migration is thus a true collective process, rather than the sum of individual migrations.
Strikingly, groups of cells ahead of the endogenous prechordal plate do not migrate either, but
resume their migration as soon as they are joined by the endogenous prechordal plate. The
directionality appears to be contained in the moving group and transmitted between cells
through cell-cell contacts, in an E-cadherin dependent process (Figure 8B; Dumortier et al.,
2012).
d) Neural crest cell migration: contact inhibition of locomotion
The neural crest is a multipotent cell population specified at the interface between neural
and non-neural ectoderms (Le Douarin and Teillet, 1973). After induction, neural crest cells
undergo an epithelial-to-mesenchymal transition and delaminate from the neural tube. Neural
crest cells become highly motile, colonise nearly all tissues and organs in the embryo and give
47

Modiied from Dupin and Le Douarin, 2014.
(B1) Contact inhibition of locomotion is represented by yellow inhibitory arrows. Collision between single cells leads to a change in the direction of migration (green arrows). Mayor and Carmona-Fontaine, 2012. (B2) Cells are polarised according to their cell-cell contacts; free edge is in green, cell contacts are in red. Théveneau and Mayor, 2011.

rise to a wide range of derivatives such as neurons, glia, bones, cartilage, endocrine cells,
connective tissues and smooth muscles (Figure 9A; Dupin and Le Douarin, 2014).
Neural crest cells migrate by contact inhibition of locomotion (Carmona-Fontaine et al.,
2008), a phenomenon first described in fibroblast cultures: “upon contact with another cell, a
cell changes its direction and migrates in the opposite direction” (Abercrombie and
Heaysman, 1954). The typical sequence of cell activities implicated in contact inhibition of
locomotion are: (i) cell-cell contact, (ii) inhibition of cell protrusive activities at the site of
contact, (iii) generation of a new protrusion away from the site of cell contact and (iv)
migration in the direction of the new protrusion (Figure 9B; Mayor and Carmona-Fontaine,
2010). Cell-cell contact is thought to be mediated by N-cadherin, while the Wnt/PCP pathway
polarises the cell by activating RhoA at the site of contact and Rac1 at the opposite site, thus
inducing migration in the direction opposite to the contact (Figure 9B; Carmona-Fontaine et
al., 2008; Theveneau and Mayor, 2011).
In addition to contact inhibition of locomotion, mutual cell-cell attraction (co-attraction)
counterbalances the tendency of cells to disperse and allows neural crest cells to migrate
collectively. Co-attraction and contact inhibition of locomotion thus act in concert to allow
cells to self-organise and respond efficiently to external chemo-attractant signals (Carmona-
Fontaine et al., 2011).
Active migration is omnipresent during development and can participate in the
segregation of cells, and thus to the formation of embryonic boundaries that would then be
stabilised as described in the first part of this introduction. One of the first separations of
tissues occurs during gastrulation, when the mesoderm and the endoderm internalise to later
give rise to internal tissues, while the ectoderm while give rise to the epidermis and nervous
system of the embryo. In the next part, I will review the morphogenetic events that have been
described for the germ-layer segregation in different model organisms, focusing on the cell
movements ensuring mesoderm and endoderm internalisation.
49


III. Endoderm and mesoderm internalisation in model organisms
1. Lessons from sea urchin gastrulation: two ways for cell internalisation
The first dynamic information about morphogenetic movements during gastrulation were
derived from the observation and analysis of time-lapse films from 1956, taking advantage of
the transparency of the sea urchin embryo (Figure 10A; Gustafson and Kinnander, 1956).
In sea urchin, gastrulation movements start after the 10th division, at 10 hours post
fertilisation. At this stage, the sea urchin embryo is a single-layered hollow blastula. The
primary mesenchymal cells located at the vegetal pole internalise individually: they undergo
an epithelial-to-mesenchymal transition and end up in the blastocoele. Several hours after this
ingression, the vegetal plate, consisting of endomesodermal progenitors, folds inwards and
initiates the archenteron. This internalisation of a coherent layer of cells has been termed
invagination (Figure 10B), and results from three different mechanisms: convergent-extension
movements that narrow and elongate the archenteron, involution of endodermal cells from the
vegetal and lateral plate, and stretching of secondary mesenchymal cells that extend thin
protrusions towards the animal pole (Miller and McClay, 1997).
These early images have enlighten two major ways for cell internalisation: either as
individuals, or as a coherent layer. According to the species, mesoderm and endoderm
internalisation involves either or both strategies, which I will review here for the principal
model organisms (Figure 11).
2. Internalisation of a coherent layer of cells
a) Involution in Xenopus
In Xenopus, the first gastrulation movement is the indentation of the mesodermal belt at
the vegetal boundary, forming the dorsal lip of the blastopore (Hardin and Keller, 1988). The
blastopore groove expands laterally and dorsally and deepens, and concomitantly the
internalisation of the mesoderm occurs by involution of a cohesive sheet of cells. The
presumptive somitic mesoderm, the presumptive hypochord and the presumptive
suprablastoporal endoderm (bottle cells) roll over the blastopore lip, thereby turning inwards.
51

. Two Main Ways for Cell Internalisation. Modiied from Solnica-Krezel and Sepich, 2012.
(A) Internalisation of cells as a coherent layer. : involution at the level of the blastopore (yellow). : invagination of the ventral furrow.
(B) Internalisation of cells as individuals. : delamination of mesodermal and endodermal progenitors. Chick, mouse: ingression at the level of the primitive streak (yellow). Zebraish: synchronised ingression.
Green: endoderm; red: mesoderm; dark blue: epidermis; light blue: neuro-ectoderm; yellow: site of internalisation; A, anterior; An, animal; D, dorsal; P, posterior; V, ventral; Vg, vegetal.
) Diagrams of whole embyros indicating the regions of the mesodermal, endodermal and ectodermal primordia.At the cellular blastoderm stage (~3 h of development at 25°C) the primordia lie at the surface of the embryo (top). Fifteen minutes later, theprospective mesoderm has formed a furrow on the ventral side of the embryo (second embryo). A few minutes later, the posterior part of theendoderm has invaginated and the germ band has begun to extend onto the dorsal side of the embryo (third embryo). Approximately 45 min afterthe beginning of gastrulation the mesoderm is fully internalized and has begun to spread to form a single cell layer (bottom embryo). ( ) Diagramsof cross sections of embryos at the same stages as those shown in (A). Colours mark regions or cells in which events relevant for gastrulation occur.Top: expression domains of Twist (red) and Snail (blue). Twist is shown as protein in the nucleus and Snail as RNA in the cytoplasm only to be ableto show both in one cell. Second embryo, orange: Fog and Concertina (and probably myosin and actin) activity in apical constrictions. Thirdembryo, yellow: unknown activity in cell shortening. Last embryo, green: Cell division, and FGF-receptor activity in cell spreading. ( ) Changes inan individual mesodermal cell in the embryos shown on the left.
by the maternal genome. These molecules are not onlyneeded for the speciication and growth of the egg, butcontinue to direct developmental processes after fertiliza-tion, allowing the embryo to develop for 2 h, nearly15% of the embryonic period. During this period,transcription of genes from the zygotic genome is notnecessary (Merrill ., 1988). Since the morphogenetic
processes that occur at this time (14 nuclear divisioncycles, migration of nuclei, the formation of the primarygerm cells) do not depend on zygotic transcription, theyare not affected by the genetic constitution of the zygote,but only by that of the mother. Zygotic gene activity isirst required for the conversion of the syncytium resultingfrom the nuclear cleavages into a cellular epithelium, and

It has been proposed that this internalisation of mesodermal cells is driven by the vegetal
rotation of endodermal cells (Figure 12A; Winklbauer and Damm, 2012; Winklbauer and
Schurfeld, 1999). During the involution process, the ectoderm thins from 5-6 cells to 2 cells
and spreads around the embryo by radial intercalation of deep mesenchymal cells (Wilson et
al., 1989). This epiboly phenomenon is a force-producing process and could be a motor of the
involution of cells (Wilson and Keller, 1991).
The presumptive suprablastoporal endodermal bottle cells form progressively, at the
place of the involuting marginal zone, first dorsally, then laterally and ventrally. Removal of
these cells has little effect on gastrulation, suggesting either that they do not play a major role
in the involution process or that redundancy effects compensate for their loss in the embryo.
Bottle cells are a strong anchor-point of the epithelial layer and suprablastoporal layer to the
underlying mesodermal cells (Keller 1981). At the stage when the ventral bottle cells form,
the dorsal bottle cells start to spread out. This respreading process is also progressive and
happens first dorsally, then laterally and ventrally. The presumptive suprablastoporal
endodermal cells will then form the archenteron, and it thus seems that the formation of the
bottle cells may be a way to internalise a large surface area in a small place (Figure 12B;
Hardin and Keller, 1988).
b) Invagination of the ventral furrow in Drosophila
At the cellular blastoderm stage (3 hours post fertilisation) the mesoderm and endoderm
primordia lie at the ventral surface of the Drosophila embryo (Figure 11A). Dorsal is a
maternal transcription factor that activates the expression of two transcription factors, Twist
and Snail, in a band of ventral cells that include the mesoderm primordium. The endoderm
primordium is split in two parts which lie anterior and posterior of the mesoderm primordium.
Twist acts as a transcriptional activator for mesodermal genes while Snail represses the
expression of ectodermal genes (Leptin 1999).
In addition to their patterning role in the embryo, Twist and Snail jointly control the
activation of the molecules that mediate cell-shape changes in the ventral furrow: they turn on
zygotic transcription of folded gastrulation, which activates a Gα (Concertina)-coupled
receptor and the Rho pathway to initiate actin-myosin-based cell shape changes (Ip et al.,
1994; Leptin, 1999). The apical surface of ventral cells first flattens. When the ventral furrow
of the prospective mesoderm begins to invaginate, non-muscle myosin becomes concentrated
53

indicated by arrows (blue, ectoderm; black, mesoderm; yellow, vegetal cell mass). Modiied from Winklbauer
arrows). Formation of the Cleft of Brachet (CB). BC: bottle cells; RSBC: respreading bottle cells. Modiied

at the apical sides of the invaginating cells as they begin to constrict. This process transforms
the columnar epithelial cells into a wedge shape, which probably helps the cells to move into
the basal, interior side. Approximately 45 min after the beginning of gastrulation, the
mesoderm is fully internalised and has begun to spread to form a single cell layer, the
posterior part of the endoderm has invaginated and the germ band has begun to extend onto
the dorsal side of the embryo (Leptin, 1999).
3. Ingression of individual cells
a) Epithelial-to-mesenchymal transition in Drosophila
The conversion of epithelial cells to mesenchymal cells is fundamental for embryonic
development and involves profound phenotypic changes that include loss of cell-cell
adhesion, loss of cell polarity, disruption of basal membrane and acquisition of migratory and
invasive properties. One of the hallmarks of epithelial-to-mesenchymal transition is the so-
called ‘cadherin switch’, which refers to a downregulation of E-cadherin accompanied by an
upregulation of N-cadherin (Thiery et al., 2009). Epithelial-to-mesenchymal transition during
gastrulation has been well described in Drosophila and occurs after ventral furrow
invagination (Figure 11B).
After invagination, the mesoderm undergoes a transition from its epithelial state to a
mesenchymal state, the cells divide and migrate out on the underlying ectoderm (Leptin,
1999). In addition to controlling mesodermal fate and initiating ventral furrow formation,
Twist and Snail are responsible for the complementary expression pattern of cadherins in the
early Drosophila embryo: Twist activates N-cadherin expression in the mesoderm, whereas
Snail represses E-cadherin expression, initiating the epithelial-to-mesenchymal transition of
the mesoderm (Oda et al., 1998). Surprisingly, it has been shown that the complementarity of
cadherin expression in the ectoderm and mesoderm is not needed for early morphogenesis,
and in particular cell internalisation during gastrulation, suggesting that the cadherin switch is
not essential for cell ingression (Schäfer et al., 2014). More work is thus needed to decipher
the molecular mechanisms ensuring mesoderm delamination in Drosophila.
55

(A) Morphogenetic movements of gastrulation. Modiied from Nakaya and Sheng, 2009.
(B) Immunohistochemistry showing the localisation of E-cadherin (red) and N-cadherin (green). End: endoderm; Mes: mesoderm. Modiied from Hardy et al., 2011.
(C) Cellular events leading to EMT. Nakaya and Sheng, 2009.
degrees of apical constriction and basolateral expansion (‘ingression stages 1–5’). Voiculescu et al., 2014.

b) EMT along a primitive streak in chick and mouse
i. Chick
Before gastrulation, the chick embryo is a large flat disc of epithelial cells (epiblast). This
embryonic epiblast is called the area pellucida and covers 3-5 mm in diameter. The epiblast
cells move as two bilaterally symmetrical whorls, known as the ‘Polonaise’ pattern (Gräper,
1929; Wetzel, 1929). The movements continue for 8-10 hours, culminating in the formation
of a stable morphological structure in the posterior midline, the primitive streak. The primitive
streak then quickly narrows and elongates along the midline of the embryo, reaching about
2/3 of the diameter of the area pellucida in a further 8-10 hours. Once the primitive streak
forms, cells in the epiblast lateral to the primitive streak start moving directly into it along
trajectories perpendicular to its axis (Bellairs, 1986).
Internalisation of the mesoderm and the endoderm happens via ingression of single cells:
endodermal and mesodermal progenitors undergo an epithelial-to-mesenchymal transition
mostly at the level of the primitive streak, and enter the space between epiblast and hypoblast
(Figure 13A). Cadherins exhibit a complementary pattern, E-cadherin being expressed in the
epiblast and N-cadherin in the hypoblast (Figure 13B; Hardy et al., 2011; Hatta and Takeichi,
1986). Loss of cell-basal membrane interaction and breakdown of the basal membrane take
place first, when most cell-cell junctions are still intact. Loss of tight junctions occurs next, at
the time when cells leave an integral epithelial sheet (Figure 13C; Nakaya et al., 2008).
Electron micrographs and live imaging have shown that epiblast cells acquire a bottle shape
within the streak while internalising (Figure 13D; Nakaya and Sheng, 2009; Voiculescu et al.,
2014). Although several molecular pathways have been involved in the ingression of
mesodermal and endodermal progenitors, the cellular basis of mesoderm and endoderm
internalisation still needs to be unravelled.
ii. Mouse
At the onset of gastrulation (E 6.5), the mouse embryo is cup-shaped and bi-layered: the
epiblast and the visceral endoderm are two epithelia with reversed apical-basal polarity, with
the basement membrane at their common basal interface and the visceral endoderm
surrounding the epiblast (Figure 11B). The primitive streak forms within the epiblast at the
posterior extraembryonic-embryonic boundary. At the level of the primitive streak, cells
delaminate and invade the space between epiblast and visceral endoderm. The primitive streak
57

58

progresses from the posterior side to the anterior of the embryo. The ingression is progressive:
first to internalise is the mesoderm of the extraembryonic structures, then the embryonic
mesoderm and finally the axial mesendoderm (prechordal plate, notochord and node) and the
definitive endoderm (Nowotschin and Hadjantonakis, 2010). Ingressing cells undergo an
epithelial-to-mesenchymal transition, exhibiting again a complementary pattern of cadherins,
epiblast cells expressing E-cadherin and mesendodermal cells expressing N-cadherin (Viotti
2014).
Definitive endodermal cells then undergo a mesenchymal-to-epithelial transition to insert
into the surface epithelial layer of the embryo. Two models have been proposed for the
spreading of this layer. The first model suggests that increasing numbers of definitive
endodermal cells insert focally into the pre-existing visceral endoderm epithelium at the distal
tip of the embryo’s surface. From there they displace pre-existing embryonic visceral
endodermal cells proximal-wards towards extraembryonic territories, thereby completing the
segregation of embryonic from extra-embryonic tissues (Lawson 1986, Burtscher 2009). The
second model is based on recent observations showing that embryonic visceral endodermal
cells are rapidly dispersed and not displaced en masse during endoderm morphogenesis. This
model stipulates that the widespread multifocal intercalation of definitive endodermal cells
into the embryonic visceral endoderm epithelium situated on the surface of the embryo would
result in scattering and dilution of embryonic visceral endodermal cells (Kwon 2008).
c) Ingression without EMT in Caenorhabditis elegans
In Caenorhabditis elegans gastrulation begins at the 26-cell stage. At this stage, the
embryo consists of a single layer of cells surrounding a small blastocoele (Nance and Priess,
2002). Ea and Ep, the endodermal precursor cells located on the ventral side of the embryo,
ingress into the blastocoele and are covered by their six neighbour cells (Figure 11B). This
internalisation is followed by several waves of synchronised ingression of pairs or small
groups of cells in various regions of the ventral side (Nance et al., 2005).
Wnt signalling has been shown to be necessary for endodermal specification.
Independently of this role, Wnt is required for myosin regulatory light chain accumulation at
the apical surface (Lee et al., 2006). Non-muscle myosin accumulates at the apical side in a
Par-3 and Par-6 dependent manner and induces apical flattening and cell ingression (Nance
and Priess, 2002; Sulston et al., 1983).
59

60

Endodermal and mesodermal cells thus internalise as individuals in C. elegans. This
ingression has however not been described as an epithelial-to-mesenchymal transition, most
likely due to the absence of several characteristic features of a classical epithelial-to-
mesenchymal transition. There is no basal membrane at this stage in C. elegans and thus no
disruption of basal membrane occurs; furthermore, internalising cells do not change their
repertoire of cadherin expression (cadherin switch).
In this part, I have reviewed the general movements giving rise to embryos organised in
three germ-layers. It is puzzling that such an important phenomenon as the segregation of
these layers seems to be very different according to species. It is also striking that in most
organisms, although the movements of mesoderm and endoderm internalisation have been
described, the cellular and molecular basis of germ-layer segregation has not been unravelled.
During my PhD thesis, I have taken advantage of the optical clarity of the zebrafish embryo to
use it as a good model to investigate this particular question.
61

1-cell
(0.2 h)
2-cell
(0.75 h)
4-cell
(1 h)
8-cell
(1.25 h)
16-cell
(1.5 h)
32-cell
(1.75 h)
64-cell
(2 h)
128-cell
(2.25 h)
256-cell
(2.5 h)
512-cell
(2.75 h)
1k-cell
(3 h)
high
(3.3 h)
oblong
(3.7 h)
sphere
(4 h)
dome
(4.3 h)
30%-epiboly
(4.7 h)
50%-epiboly
(5.3 h)
germ ring (5.7 h) shield (6 h)
75%-epiboly
(8 h)
90%-epiboly
(9 h)
bud
(10 h)
. Zebraish Stages of Development (modiied from Kimmel et al., 1995; Schier and Talbot, 2005).
(A) Zygote and cleavage stages, 0 - 2 hpf.
(B) Blastula stages, 2.25 hpf - 4.7 hpf.
(C) Gastrula stages, 5.3 hpf - 10 hpf. sh: shield.
(D) Segmentation and later stages. som: somites; hg: hatching gland.

IV. Zebrafish embryo early development
The zebrafish embryo has first been used as a proper model for developmental biology
50 years ago, initiated by George Streisinger in Oregon. Streisinger thought the zebrafish
embryo would allow the scientific community to unravel the logic of vertebrate neural
development, being easier to handle than mouse embryos (Grunwald and Eisen, 2002). The
zebrafish community has hence increased rapidly, zebrafish being currently the second most
used model in developmental biology, behind the mouse model.
Before the beginning of zebrafish era, the first observations of fish embryo development
had been realised in the second half of the 19th century, in Southern France (Nice), Northern
Germany (Kiel) and Eastern United States (Newport and Woods Hole) (Agassiz and
Whitman, 1884). Observations were greatly facilitated by the transparency of embryos, and
their availability from the fertilisation onwards.
Stages of zebrafish embryo development are defined by name rather than by numbers as
is often used in other species, and have been exhaustively described in (Kimmel et al., 1995).
I focus here on the first steps of development, from fertilisation to gastrulation.
1. Stages of development
a) Zygote and cleavage stages
Just after fertilisation (zygote stage), the zebrafish embryo is a 550 - 600 µm sphere
surrounded by a soft and transparent chorion. The animal-vegetal axis appears a few minutes
after fertilisation, when important cytoplasmic movements separate a cytoplasmic disc at the
animal pole from the yolk sphere at the vegetal pole (Hisaoka and Battle, 1958).
Cleavage stages refer to the first six series of divisions (Figure 14A; 2-cell stage to 64-
cell stage), occurring during the first 2 hours post fertilisation (hpf) (Kimmel et al., 1995). The
first division occurs about 35 minutes after fertilisation. The cytoplasmic disc then undergoes
a series of synchronous meroblastic divisions at the animal pole, every 15 minutes (Hisaoka
and Battle, 1958). These divisions give rise to a mass of cells, the blastoderm, on top of a yolk
sphere. Until the 16-cell stage, all divisions occur in a plane parallel to the animal-vegetal
axis. At cycle 5 (16-32 cell stage, 2 hpf), the four central blastomeres divide orthogonally to
63

64

the surface, allowing the formation of a partially double-layered blastoderm (Olivier et al.,
2010).
b) Blastula stages
The term blastula refers to the period when the blastodisc begins to look ball-like, at the
128-cell stage (2.25 hpf), to the 30% epiboly stage (4.7 hpf), just prior to the onset of
gastrulation (Figure 14B). After the 1k-cell stage, the embryo rounds up, acquiring a sphere
shape. The stages of development are named after the shape of the embryo (high, oblong,
sphere, dome). The process of epiboly is then initiated. Stages of development are hence
defined as the percentage of yolk cell covered by the blastoderm.
i. Mid-blastula transition
Cell divisions become metasynchronous, with waves of division from the animal pole to
the marginal cells (Kimmel et al., 1995). The mid-blastula transition occurs at the 10th cell
cycle (512-cell stage, 2.75 hpf). Cell cycles lengthen under the control of the
nucleocytoplasmic ratio, which results in the loss of their synchrony. As a consequence of
longer interphases periods, zygotic genome transcription is activated, and cells become motile
(Kane and Kimmel 1993). The blastoderm cells hence undergo epiboly: they migrate over the
yolk towards the vegetal pole like an inverted cup and start enveloping the yolk cell (Warga
and Kimmel, 1990).
ii. Formation of extra-embryonic layers
After the 6th cleavage (64-cell stage, 2 hpf), the embryo is composed of superficial cells
and deep cells. The superficial cells form an external layer called the Enveloping Layer
(EVL). Until the 11th division (high stage, 3.3 hpf), these cells divide into both deep cells and
EVL cells. EVL cells start being restricted to this layer at the high stage and the restriction is
complete at the sphere stage (4 hpf). The EVL is a tight epithelium, which is linked to the
YSL around the margin of the embryo (Betchaku and Trinkaus, 1978; Kimmel et al., 1990).
The EVL gives rise to the periderm, a specialised superficial epithelium that will form the
embryo’s first skin (Kimmel et al., 1990), and to the dorsal forerunner cells, which will form
Kuppfer’s vesicle (Oteíza et al., 2008).
First referred to as the periblast (Agassiz and Whitman, 1884; Lentz and Trinkaus,
1967), the second extra-embryonic layer was renamed as the Yolk Syncytial Layer (YSL) by
65

. Zebraish Fate Map.
A) Zebraish fate map before gastrulation. Blue: ectoderm; red: mesoderm; green: endoderm. Modiied from David et al., 2004.
B) Endodermal progenitors fate map. Modiied from Warga and Nüsslein-Volhard, 1999.
. Zebraish Extra-Embryonic Layers (modiied from Sakaguchi et al., 2002).
Orange: yolk syncytial layer (YSL); blue: enveloping layer (EVL).
Zebrafish endoderm development
showing the blastoderm distribution of all the clones, thepercentage of clones giving rise to endoderm or mesoderm, andthe distribution of the clones as a percent with respect todistance from the margin. Of the 71 clones, 17 gave rise toendoderm only, 30 gave rise to mesoderm only, and 24 clonesgave rise to derivatives of both mesoderm and endoderm. Noneof the clones gave rise to ectodermal precursors. To determinethe overlap between involuting cells and noninvoluting cells,we labeled cells earlier, thus creating larger clones of 8 to 16cells by 40% epiboly. Of these 14 clones, 4 gave rise to bothmesoderm and ectoderm, 6 gave rise to both mesoderm andendoderm, and 4 gave rise to mesoderm only. No clones gaverise to both endoderm and ectoderm conirming the observationthat there is a band of mesoderm separating the two ields.
Surprisingly, our fate map dataset shows a marked density ofclones in the dorsal half of theblastula. Also, dorsal clones aredistributed closer to the marginthan lateral or ventral clones. Thisis likely due to our labeling cells anhour before we mapped them (seeDiscussion) perhaps caused by amarked compaction of cells on thedorsal side of the embryo occurringbetween 30% and 40% epiboly(Warga and Nüsslein-Volhard,1998).
At 40% epiboly, cells have notyet begun to involute to form thehypoblast. To determine wheremarginal clones mapped at 40%epiboly were later located at shieldstage, we remapped a subset of thefate map data set ( =12) withrespect to the blastoderm margin.By shield stage, labeled cellsfrequently had involuted into thehypoblast (73%), and often thesecells had migrated more than 6 celldiameters from the margin (53%).Thus, by shield stage, the majorityof marginal cells have alreadyinvoluted; many are no longer nearthe margin, but rather are locatedbeneath the presumptive ectoderm
Hence, endodermal precursorsarise from cells primarily on thedorsal side, near the margin. Whilecells in this region also contributeto mesodermal structures, themajority of mesodermal precursorsoriginate from cells on the ventralside and from dorsal cells locatedfurther from the margin. Amongclones restricted to a single germlayer, dorsal clones tend to beendoderm and ventral clones tendto be mesoderm. Unrestrictedclones originate from all positionsalong the dorsoventral margin,
decreasing with distance from the margin. Thus, while blastulacells are unrestricted to a particular germ layer, blastomeresclosest to the margin on the dorsal side are biased towardendodermal fate.
fieldsThe progeny of marginal blastomeres contributed to all of thetissues classically thought to be endoderm (Fig. 1J-P).Although each organ derives from an extensive ield of cellswhose boundaries overlap with that of other organs, there isgeneral correspondence for more anterior organs to map moredorsally and more posterior organs to map more laterally (Fig.3A). Pharynx comes predominantly from more dorsal cells,
ventral 60 30
6
6
6
6
6
6
6
6
Mesoderm
ventral 90dorsal ventral90
6
6liver
6
liver
ventral 60 30
6
6
6
90
6
Endoderm
Fate map positions of endodermal and mesodermal derivatives. The diagrams are aspresented in Fig. 1C. (A) Endodermal derivatives. In the case of the liver, swimbladder andpancreas, we also present a rotated dorsal view (A ). (B) Mesodermal derivatives. In the case ofnotochord, caudal in, tail body wall and tail muscle, a subset of these tissues were derived frommarginal deep cells (black circle) or from a detached group of cells located at the margin known asthe forerunner cells (white circles). Forerunner cells never involute and instead lead the marginduring epiboly, ending up in the tailbud where they intermingle with ventrally derived cells (Melbyet al., 1996; Cooper and D’Amico, 1996). Like endoderm, the anterior-posterior location of theendothelial blood vessels and muscle roughly corresponds to dorsoventral position in the lateblastula, disregarding tail muscle derived from the forerunner cells.
Zebrafish endoderm development
showing the blastoderm distribution of all the clones, thepercentage of clones giving rise to endoderm or mesoderm, andthe distribution of the clones as a percent with respect todistance from the margin. Of the 71 clones, 17 gave rise toendoderm only, 30 gave rise to mesoderm only, and 24 clonesgave rise to derivatives of both mesoderm and endoderm. Noneof the clones gave rise to ectodermal precursors. To determinethe overlap between involuting cells and noninvoluting cells,we labeled cells earlier, thus creating larger clones of 8 to 16cells by 40% epiboly. Of these 14 clones, 4 gave rise to bothmesoderm and ectoderm, 6 gave rise to both mesoderm andendoderm, and 4 gave rise to mesoderm only. No clones gaverise to both endoderm and ectoderm conirming the observationthat there is a band of mesoderm separating the two ields.
Surprisingly, our fate map dataset shows a marked density ofclones in the dorsal half of theblastula. Also, dorsal clones aredistributed closer to the marginthan lateral or ventral clones. Thisis likely due to our labeling cells anhour before we mapped them (seeDiscussion) perhaps caused by amarked compaction of cells on thedorsal side of the embryo occurringbetween 30% and 40% epiboly(Warga and Nüsslein-Volhard,1998).
At 40% epiboly, cells have notyet begun to involute to form thehypoblast. To determine wheremarginal clones mapped at 40%epiboly were later located at shieldstage, we remapped a subset of thefate map data set ( =12) withrespect to the blastoderm margin.By shield stage, labeled cellsfrequently had involuted into thehypoblast (73%), and often thesecells had migrated more than 6 celldiameters from the margin (53%).Thus, by shield stage, the majorityof marginal cells have alreadyinvoluted; many are no longer nearthe margin, but rather are locatedbeneath the presumptive ectoderm
Hence, endodermal precursorsarise from cells primarily on thedorsal side, near the margin. Whilecells in this region also contributeto mesodermal structures, themajority of mesodermal precursorsoriginate from cells on the ventralside and from dorsal cells locatedfurther from the margin. Amongclones restricted to a single germlayer, dorsal clones tend to beendoderm and ventral clones tendto be mesoderm. Unrestrictedclones originate from all positionsalong the dorsoventral margin,
decreasing with distance from the margin. Thus, while blastulacells are unrestricted to a particular germ layer, blastomeresclosest to the margin on the dorsal side are biased towardendodermal fate.
fieldsThe progeny of marginal blastomeres contributed to all of thetissues classically thought to be endoderm (Fig. 1J-P).Although each organ derives from an extensive ield of cellswhose boundaries overlap with that of other organs, there isgeneral correspondence for more anterior organs to map moredorsally and more posterior organs to map more laterally (Fig.3A). Pharynx comes predominantly from more dorsal cells,
ventral 60 30
6
6
6
6
6
6
6
6
Mesoderm
ventral 90dorsal ventral90
6
6
liver
6liver
ventral 60 30
6
6
6
90
6
Endoderm
Fate map positions of endodermal and mesodermal derivatives. The diagrams are aspresented in Fig. 1C. (A) Endodermal derivatives. In the case of the liver, swimbladder andpancreas, we also present a rotated dorsal view (A ). (B) Mesodermal derivatives. In the case ofnotochord, caudal in, tail body wall and tail muscle, a subset of these tissues were derived frommarginal deep cells (black circle) or from a detached group of cells located at the margin known asthe forerunner cells (white circles). Forerunner cells never involute and instead lead the marginduring epiboly, ending up in the tailbud where they intermingle with ventrally derived cells (Melbyet al., 1996; Cooper and D’Amico, 1996). Like endoderm, the anterior-posterior location of theendothelial blood vessels and muscle roughly corresponds to dorsoventral position in the lateblastula, disregarding tail muscle derived from the forerunner cells.

Trinkaus (Betchaku and Trinkaus, 1978). During initial cleavages, the marginal blastomeres
remain connected to the yolk cell by cytoplasmic bridges (Kimmel and Law, 1985; Lentz and
Trinkaus, 1967). Around the 10th division, these marginal blastomeres fuse with the yolk cell,
creating a syncytial cytoplasmic layer. The lower cell borders adjacent to the yolk cell fade
and disappear as the marginal cells collapse. Yolk nuclei are initially located around the
margin of the embryo, in the external YSL, and progressively propagate in the internal YSL,
beneath the blastoderm (Figure 15; Sakaguchi et al., 2002). These nuclei undergo 3-5 further
metasynchronous mitotic divisions every 15 minutes while deep cell cycle lengthens (Kane et
al., 1992). The YSL is transcriptionally active and plays crucial patterning and morphogenetic
roles during early development (Sakaguchi et al., 2002; Williams et al., 1996).
c) Gastrula stages
The beginning of internalisation of the mesoderm and the endoderm defines the onset of
gastrulation and occurs at the 50% epiboly stage (5.3 hpf). A germ ring consequently appears
at the equator of the embryo. Epiboly continues, until the yolk cell is completely enveloped by
the blastoderm (tail bud stage, 10 hpf) (Figure 14C; Kimmel et al., 1995).
i. Establishment of the fate map
A fate map is established by tracing experiments: a single cell is specifically labelled at a
given stage and its progeny is then analysed to determine the identity of the derivatives. Due
to important cell mixing during the early zebrafish development, it is only possible to
establish a fate map at the onset of gastrulation (Kimmel et al., 1990), unlike in Xenopus,
where this map can be established as soon as the 32-cell stage (Dale and Slack, 1987). The
map obtained in zebrafish is quite close to the one established in Xenopus: cells at the animal
pole give rise to ectoderm and cells close to the margin give rise to mesoderm and endoderm
(Figure 16A). Endoderm comes mostly from the four cellular rows closest to the dorsal and
lateral margin (Figure 16B). Mesoderm comes mostly from the six cellular rows closest to the
ventral and lateral margin. Endoderm and mesoderm boundaries largely overlap at the onset
of gastrulation, suggesting that these boundaries are statistical rather than completely
determined (Kimmel et al., 1990; Warga and Nüsslein-Volhard, 1999).
The position of the ectodermal, mesodermal and endodermal precursors along the dorsal-
ventral axis gives information about their future: dorsal ectoderm gives rise to neurectoderm
and ventral ectoderm to epidermis. Dorsal mesodermal precursors give rise mostly to the
67

68

notochord while ventral ones give rise to blood derivatives. As regards the endoderm, dorsal
precursors mostly participate to the pharynx while ventral ones will be found in the intestine
(Figure 16; Schier and Talbot, 2005; Warga and Nüsslein-Volhard, 1999).
ii. Zebrafish organiser
The dorsal-ventral axis is revealed by the formation of the embryonic shield, which
appears as a local thickening on the dorsal side 6 hours after fertilisation. Cells internalising at
the shield form the axial hypoblast, which will give rise to the prechordal plate, a group of
cells that migrate collectively to the animal pole. Axial mesoderm has the potential to induce
a second embryonic axis. The embryonic shield, in terms of its inductive role, its dorsal
marginal position in the embryo, and the fates it eventually generates, is equivalent to the
amphibian organiser region of Spemann.
iii. Organisation of the embryo in three germ-layers
Gastrulation is the stage when many morphogenetic movements (Figure 18A) set up the
body plan of the embryo, reorganised in three germ-layers. Cells located at the equatorial
zone of the embryo internalise, forming an internal layer, the hypoblast, underneath a
pluristratified layer of external cells, the epiblast. The epiblast gives rise to the ectoderm
while the hypoblast is composed of mesodermal and endodermal cells. Within the hypoblast,
the separation between mesoderm and endoderm occurs during gastrulation. Endodermal cells
flatten on the yolk and spread at its surface by random walk (Pézeron et al., 2008) whereas
mesodermal cells keep their round morphology (Warga and Nüsslein-Volhard, 1999).
Endodermal cells also differ from mesodermal ones by their expression of specific markers,
as the transcription factor Sox17.
d) Segmentation and later development
After epiboly is completed, the somites appear sequentially, providing a staging index.
The rudiments of the primary organs become visible, the tail bud becomes more prominent
and the embryo elongates. The neural plate transforms topologically into the neural tube.
Cells initiate their morphological differentiations, and the first body movements appear at
24 hpf. The larva usually hatches during the second day of development and will start feeding
three days later (Figure 14D).
69

70

2. Genetic control of endoderm formation
a) Nodal signalling induces endodermal identity and behaviour
Nodal ligands (Squint and Cyclops in fish) are TGF-molecules expressed in the YSL
and in the marginal cells at the onset of gastrulation. Loss of function experiments have
demonstrated the key role of Nodal signalling pathway in the formation of the hypoblast:
squint:cyclops double mutant embryos do not show any internalisation movements and are
deprived of endoderm and of almost all mesoderm (Feldman et al., 1998). This was further
confirmed by the analysis of mutants of the one eyed pinhead (oep) gene, an essential co-
factor of Nodal signals (Gritsman et al., 1999). Mutants lacking the maternal and zygotic
contributions of oep display a phenotype similar to the squint:cyclops double mutant, forming
neither endoderm nor mesoderm. Conversely, over-expression of Nodal ligands induces
endodermal and mesodermal markers (Feldman et al., 1998).
Nodal ligands bind and activate serine/threonine kinase type I receptor Taram-A
(Renucci et al., 1996). Cells expressing a constitutively activated form of the Nodal-receptor
Taram-A (further referred to as Tar*) always differentiate into endodermal derivatives
(Peyriéras et al., 1998). Furthermore, the constitutive activation of Nodal signalling in naïve
cells results in their ability to internalise, whatever their position in the embryo, and
contribute to endodermal derivatives (David and Rosa, 2001).
Within the hypoblast, the choice between an endodermal or mesodermal identity has
been attributed at least in part to the level of Nodal signalling perceived by the cells. A high
level of Nodal signalling induces endoderm and prechordal plate while a low level of Nodal
induces mesoderm (Grapin-Botton and Constam, 2007). Low doses of Nodal induce fibroblast
growth factor (FGF) that interacts with bone morphogenetic protein (BMP) to promote
mesoderm and repress endoderm (Poulain et al., 2006). Recent studies have revealed that the
temporal pattern of Nodal signalling is a key factor determining organiser cell fate
specification at the onset of gastrulation. These data suggest that the duration of Nodal
signalling is critical for prechordal plate versus endoderm specification: in the shield, where
the authors have shown that Nodal signalling starts earlier and lasts longer than in the
remainder of the germ ring, signal-receiving cells are likely to become prechordal plate
progenitors rather than endoderm by expressing genes involved in both prechordal plate
specification and endoderm repression, such as goosecoid (Sako et al., 2016).
71

(A) Endodermal fate determination by Nodal signals. Modiied from David et al., 2004.
(B) Dynamics of expression of bon/mixer, fau/gata5, casanova and sox17 genes in wild-type embryos throughout gastrulation. (A-D) Animal pole views; (E-T) lateral views, dorsal to the right. Aoki et al., 2002.
requires Nodal signalling (Dickmeis et al., 2001a). We studiedwhether the transient activation of the Nodal pathway inducedby an early Oep function was sufficient to induce a normallevel of expression. Expression of embryos devoid of zygotic contribution (Z(Schier et al., 1997; Strahle et al., 1997). In late blastula (40%epiboly) and during gastrulation, Z tz57 homozygousembryos had either a dramatic reduction of the number of expressing cells or no expressing cells at all within theblastoderm (Fig. 2A-D). Thus, similar to the expression of theendodermal markers differentiation marker expression requires function and Nodal signalling. However, the early transientNodal signalling, associated with the maternal expressionis not sufficient to ensure full expression (Alexander andStainier, 1999). By contrast, previous work has shown thatmost mesodermal derivatives form normally in Z(Schier et al., 1997; Strahle et al., 1997), indicating that
attenuated Nodal signalling is sufficient to allow mesoderm but
Expression of within the blastoderm is induced upon theactivation of the Nodal pathway by Tar* (Dickmeis et al.,2001a). This induction could be either cell autonomous or non-cell autonomous. To address this issue, we microinjected anRNA encoding the lineage tracer (100 pg) alone as acontrol or combined with RNA (1.2 pg) into early donorembryos. At the late blastula stage (sphere stage), small groupsof cells were transferred from donor embryos to the animal poleregion of host untreated embryos, which were allowed todevelop until mid-gastrulation, ixed and stained for theexpression of and of the lineage tracer. This showed that
but not induced the expression of in grafted cellsbut not in host cells (Fig. 2E,F). Thus, consistent with theendodermal expression of and the autonomous induction ofendodermal progenitors by Tar*, expression is induced in acell autonomous fashion by activation of the Nodal pathway.
The analysis of zygotic mutants indicates thatattenuated Nodal signalling is not sufficient to allowendoderm development. MZdevelop endoderm. We wished to know when activationof Nodal signalling would be required to allowendoderm development in these mutants.
MZ embryos can be fully rescued bymicroinjection of an RNA encoding a soluble form of
Dynamics of expression of , ,genes in wild-type embryos at 40%
epiboly (A-H), 50% epiboly (I-L), shield (M-P) and 70-80%epiboly (Q-T) stages. (A-D) Animal pole views; (E-T)lateral views, dorsal to the right. At 40% epiboly, whereas
(A,E) and (B,F) are homogeneouslyexpressed in large marginal domains, expression ismosaic and preferentially restricted to the most marginalblastomeres of the dorsal side (C,G). At this stage, expressed only in the supericial and marginal cells of thedorsal side (D,H). At 50% epiboly, expression patterns of
(I), (L) are roughlyunchanged. The pattern is still mosaic but it isfound throughout the margin and in the forerunner cells (K).At the shield stage, expressed in more germ ring blastomeres. Cells expressing
have begun to involute and abut the YSL, exceptthe forerunner cells, which remain supericial (O). The
gene is expressed in deep cells abutting the YSL inthe dorsal axis (P). After the onset of gastrulation, (Q) is no longer expressed, whereas (R),
(T) are expressed in the scattered endodermalcells (arrowhead); (T) are stillexpressed in the forerunner cells. (U,V) Close up of themosaic pattern of at the dorsal margin (U) andlateral margin (V) of embryos at 40% epiboly stage (notice
-positive cells (arrowheads); thedotted lines mark the YSL-blastoderm frontier).(W-Y) Cross sections of embryos following whole-mount insitu hybridization with at 50% epiboly (W), shield(X) and 70-80% epiboly stage (Y), animal pole up (arrowspoint to YSL nuclei). The positive cells involute at themargin, abut YSL and spread over the whole embryos with ascattered pattern.

b) Downstream of Nodal
Downstream of Nodal ligands, a series of transcription factors ultimately activate sox17
and other endodermal genes (Reiter et al., 2001). Among them, casanova is the first gene to
be strictly endoderm-specific, and is absolutely required for endoderm formation (Dickmeis et
al., 2001). Casanova can induce the Nodal ligands Squint and Cyclops, thereby enhancing the
signal by inducing its own expression (Kikuchi et al., 2001).
Nodal binding to its receptor induces a signalling pathway that is conserved among
Vertebrates. The activated receptor phosphorylates the cytosolic proteins Smad2 or Smad3.
Phosphorylated Smad2/3 then binds to Smad4 and translocates to the nucleus, where it
associates with DNA-binding transcription factors, such as the Fork head box h1
(Foxh1/FAST1) or Mix-like homeodomain proteins, to stimulate the transcription of
mesendoderm genes. In zebrafish, Nodal induces the expression of Bon/Mixer and
Faust/Gata5, which form a complex with T-box transcription factor Eomesodermin to activate
Casanova (Bjornson et al., 2005), which in turn cooperates with Pou5f1/Oct4 to stimulate
sox17 and foxa2 transcription (Figure 17; Lunde et al., 2004).
3. Morphogenetic gastrulation movements
a) Epiboly
The first morphogenetic movement is initiated at the dome stage (4.3 hpf), when the yolk
cell domes into the blastoderm. The blastoderm then migrates towards the animal pole at a
pace of 100 µm/hour until it envelops the yolk cell at the bud stage (10 hpf), taking a 40
minute break when it reaches the equator of the embryo, concomitantly with the formation of
the germ ring and the shield (Kane and Adams, 2002; Warga and Kimmel, 1990). Deep cells,
EVL and YSL coordinately migrate towards the vegetal pole.
The beginning of epiboly starts concomitantly with mitotic arrest in the YSL (Kane et al.,
1992). YSL epiboly precedes deep cells epiboly by 50-100 µm (Solnica-Krezel and Driever,
1994). Experiments separating the blastoderm from the yolk cell have shown that the YSL
undergoes epiboly autonomously, with yolk syncytial nuclei migrating towards the vegetal
pole (Trinkaus 1951). These epiboly movements seem to involve three separate mechanisms:
external-YSL membrane endocytosis (Betchaku and Trinkaus, 1986), microtubules shortening
73

. Zebraish Morphogenetic Gastrulation Movements.
(A) Morphogenetic movements from shield stage to tail bud stage. Modiied from Roszko et al., 2009.
(B) During epiboly, epiblast cells intercalate into the external epiblast. Modiied from Lepage and Bruce, 2010.
(C) Internalisation of mesodermal and endodermal progenitors at the margin of the embryo. YSN: Yolk syncytial nuclei. Modiied from David et al., 2004.
(D) Convergence and extension movements in the embryo. Modiied from Roszko et al., 2009.
1221
vl
e-ep
i-ep
yp
yc
vl
e-ep
i-ep
yp
yc
time
1 23 4

(Solnica-Krezel and Driever, 1994; Strähle and Jesuthasan, 1993), and the contraction or
friction-based flow of an acto-mysin ring (Behrndt et al., 2013; Cheng et al., 2004). The EVL
is tightly linked to the YSL at the embryonic margin, suggesting that the YSL is towing the
EVL towards the animal pole (Betchaku and Trinkaus, 1978).
During epiboly, deep cells intercalate, cells located close to the YSL getting closer to the
surface (Figure 18B). This results in the thinning of the blastoderm (Lepage and Bruce, 2010;
Warga and Kimmel, 1990). Deep cells epiboly is affected in E-cadherin mutants, while
YSL/EVL epiboly is not (Kane et al., 1996), suggesting an E-cadherin dependent mechanism
specific to deep cells epiboly. In the absence of E-cadherin, cell intercalation still occurs, but
exterior layer cells often return to the interior layer, suggesting that loss of cells in the exterior
layer of the epiblast would be the physical basis for the arrest of epiboly (Kane et al., 2005).
Whether cell intercalation is the passive result of the doming force of the yolk (Wilson et al.,
1995) or an active mechanism contributing to epiboly remains an open question.
b) Convergence and extension
After mesoderm and endoderm internalisation, which I will describe in the next
paragraph, cells converge towards the dorsal side, simultaneously elongating the embryo from
head to tail. The embryo becomes highly asymmetric, revealing the dorsal-ventral and
anterior-posterior axes (Solnica-Krezel and Cooper, 2002).
Five different domains have been described according to their relative convergence and
extension movements (Figure 18D). Cells on the most ventral part (I) do not participate either
in convergence or in extension movements but rather migrate towards the vegetal pole and
will contribute to the tail bud. In the lateral domain, convergence and extension movements
are initially slow (II) , and then accelerate as cells move closer to the dorsal midline (III)
(Myers et al., 2002a). Finally, cells in the presomitic mesoderm domain intercalate both in the
planar and radial directions (IV). Dorsal cells undergo strong extension and low convergence
movements (V) (Glickman et al., 2003; Roszko et al., 2009).
Convergence and extension movements rely on different cellular mechanisms of different
importance in the different domains. Directed cell migration is the main behaviour in the
endoderm and lateral mesoderm (Myers et al., 2002b; Pézeron et al., 2008). Mediolateral
intercalation is observed mainly in the trunk axial mesoderm (Glickman et al., 2003), while
75

. Germ-layer Progenitor Physical Properties and Segregation (modiied from Krieg et al., 2008).
(A) Measure of cell adhesion (A1) and cortical tension (A2).
(B) Germ-layer progenitor segregate after dissociation and mixing. Scale bar: 300 µm.
17h 17h17h
4h0h
d
e f g
ba
8h
c
ecto
meso
ecto
endo
meso
endo
Donor 2Donor 1
∆t

the presomitic mesodermal cells undergo radial intercalation (Yin et al., 2008). Finally,
oriented cell divisions contribute to the extension of the neuro-epithelium (Concha and
Adams, 1998). These cellular movements are highly polarised and largely dependent on the
Wnt / Planar Cell Polarity (PCP) pathway (Roszko et al., 2009).
c) Internalisation
When the margin pauses, the marginal-most blastomeres start to move inwards towards
the YSL, thus forming the germ ring (5.7 hpf) (Figure 18C). Whether cells internalise by
involution of a sheet of cells around the margin or by ingression of individual cells has been
long debated. Initial descriptions, reporting that marginal cells undergo a coordinated
movement to form the hypoblast, pleaded in favour of an involution process (Solnica-Krezel
et al., 1995; Warga and Kimmel, 1990). However, it had also been suggested that ingression
movements contribute to the internalisation of mesendodermal cells (Shih and Fraser, 1995;
Trinkaus, 1996). According to this hypothesis, cell transplantation experiments have
demonstrated by that single cells can internalise (Carmany-Rampey and Schier, 2001; David
and Rosa, 2001), strongly suggesting that the cellular process at stake is of the ingression
type. These seemingly divergent observations were reconciled in the concept of synchronised
ingression, in which cells internalise through ingression, but in a coordinated manner, at the
very margin of the blastoderm (Kane and Adams, 2002). The degree of synchronisation seems
to vary along the dorsal-ventral axis, with ventrolateral cells ingressing in a more coordinate
way than dorsal ones (Keller et al., 2008; Montero et al., 2005).
In vitro experiments using zebrafish cells suggest that germ-layer formation would rely
on a cell sorting based on germ-layer progenitor biophysical properties. Atomic force
microscopy revealed that mesodermal cells are more adhesive than endodermal cells, which
are more adhesive than ectodermal cells. Furthermore, these cells also display different acto-
myosin dependent cortical tensions, ectodermal progenitors having the highest cortical
tension, and endodermal progenitors the lowest (Figure 19A). When dissociated and mixed,
germ-layer progenitors are segregated, ectodermal cells sorting to the inside of heterotypic
aggregates, which correlates with higher cortical tension (Krieg et al., 2008). However the
relevance of these processes to germ-layer formation in the embryo has not been tested in
vivo. In particular, progenitor segregation in vitro required 17 hours, while mesendoderm
internalisation is achieved much faster in vivo, suggesting that other mechanisms may be at
play in the embryo to ensure the rapid separation of germ-layers.
77

78

Time-lapse microscopy analysis of gastrulating embryos have shown that cells migrating
from the epiblast to the hypoblast pass through a transition state. While cells in the epiblast
display an epithelioid morphology, cells migrating to the hypoblast remain densely packed
and bleb extensively when transitioning from the epiblast to the hypoblast. Once in the
hypoblast, cells that have completed involution acquire a typical mesenchymal morphology,
extending many protrusions (Row et al., 2011). These first observations of cells undergoing
the transition from epiblast to hypoblast in living embryos are limited by the collective
internalisation movement of internalising cells, making difficult to unravel cell-autonomous
features triggering the internalisation movement.
Overall, the mechanisms ensuring the acquisition of a hypoblastic identity have been
pretty well described. However, how the hypoblast physically separates from the epiblast, and
how germ-layers are formed has been so far much less studied. During my PhD, I have
combined transplantation experiments, live imaging, functional analyses and micro-dissection
experiments to decipher the molecular and cellular basis of the germ-layers segregation,
focusing on the endoderm internalisation in the zebrafish embryo.
79

80
EXPERIMENTAL APPROACH
81

82

The general movements of mesoderm and endoderm internalisation during gastrulation
have been well described. However, in most species, very little is yet known about the
molecular basis of cell internalisation. Our limited understanding of the mechanisms driving
cell internalisation and germ-layer formation stems from the difficulty and hence limited
number of direct in vivo observations, in particular in Vertebrates (Row et al., 2011; Viotti et
al., 2014; Voiculescu et al., 2014). During my PhD, I have aimed at describing the basis of the
germ-layer formation during gastrulation from the precise observation and functional
description of endodermal cell internalisation in the zebrafish embryo.
Live Imaging of Zebrafish Gastrulation
Using digital scanned laser light sheet fluorescence microscopy, Keller and his colleagues
have recorded nuclei localisation and movement in entire zebrafish embryos during the first
24 hours of development. These images have allowed the authors to analyse the positions,
movements and migratory tracks of cells during early morphogenetic movements, and in
particular during gastrulation. The analysis of these “digital embryos” have revealed that about
1550 cells (34% of all cells) internalise around the margin of the embryo to form the mesoderm
and the endoderm between the 40% epiboly stage and the 60% epiboly stage (Keller et al.,
2008). This work, however, does not address cell morphology during gastrulation and thus does
not give much information about the cellular mechanisms triggering the internalisation.
The question of cell morphology during gastrulation has been addressed by Row and his
colleagues in Kimelman’s laboratory. Using differential interference contrast (DIC)
microscopy, the authors have focused on mesodermal cell internalisation during gastrulation
and have described a transition state between the epiblast and the hypoblast in which
internalising cells bleb extensively, before extending more filopodia-like cytoplasmic
extensions when they have reached the hypoblast (Row et al., 2011). DIC images, however, do
not have a resolution that is sufficient to identify the contours of individual cells, which makes
difficult the analysis of cell morphology and behaviour during internalisation and thus decipher
the basis of this migration.
Studying the dynamics of a cell requires the visualisation of its contour to analyse in
particular the formation of membrane protrusions. The creation of chimeric embryos by cell
transplantation allows the labelling of an isolated cell in a differently labelled environment, thus
offering good visual contrast. The technique of cell transplantation followed by live imaging
83

(A) Nodal activated (Tar*) cells internalise and take part to endodermal derivatives at 24 hpf. Modiied from
40 x

has been precisely described for the analysis of in vivo cell migration in the zebrafish prechordal
plate (Giger et al., 2016; APPENDIX 2).
Functional Analysis of Endoderm Internalisation
At the margin of the embryo, cells internalise synchronously, resulting in a collective
internalisation movement. It has been shown that the absence of Nodal signalling in MZoep
mutants results in the failure of marginal cells to internalise (Gritsman et al., 1999). However,
cells from this mutant transplanted at the margin of wild-type embryos internalise with their
neighbours, demonstrating that community movements can induce the internalisation of non-
ingressing cells (Carmany-Rampey and Schier, 2001). These non-autonomous effects
complicate the analysis of cell internalisation, the movement of a cell resulting both from its
own activity and from the movement of its neighbouring cells.
Strikingly, despite the number of genetic screens realised in zebrafish, no mutant has yet
been identified for which cell internalisation is affected independently of their identity. This
suggests that the mechanisms ensuring cell internalisation are highly redundant at the margin
of the embryo. Because of the magnitude of these redundant effects, it is very difficult to
understand the molecular basis of cell internalisation in situ, which probably explains why so
little is known about the mechanisms triggering this internalisation. A simplified experimental
model of gastrulation is thus needed to circumvent these community effects and dissect the
cellular machinery of mesoderm and endoderm internalisation during gastrulation.
In Xenopus, most experiments related to the germ-layer formation during gastrulation have
been realised ex vivo on blastocoele roof explants. The animal pole of the zebrafish embryo is
a physiological environment devoid of non-autonomous effects, where endodermal cells seem
to internalise as they do at their endogenous location and thus appears to be the best compromise
to study the cellular basis of endoderm internalisation in vivo.
During my PhD, I have taken advantage of the fact that, wherever they are placed in the
embryo, cells expressing an activated form of Nodal receptor (Tar*) internalise and form
endoderm (Figure 20A; David and Rosa, 2001). Using single cell transplantation at the animal
pole of the embryo, I have thus been able to label single cells and place them in a differently
labelled environment, where neighbouring cells do not move, and where they have some
distance to migrate to reach the yolk (Figure 20B). I have used this original approach to study
85

86

the internalisation of endodermal cells during gastrulation, with several main questions: what
is the morphology of internalising endodermal cells? What is the cellular basis of endodermal
cell internalisation? Does it involve an active migration or a passive cell sorting based on
differences in adhesion and cortical tension? What are the molecular actors downstream of
Nodal inducing this internalisation? Are endodermal cells attracted to their final destination?
87

88

RESULTS
89

90

The Endodermal Germ Layer Formation Results from
Active Migration Induced by N-cadherin
Authors/Affiliations
Florence A Giger1,2,3, Nicolas B David1,2,3
1 CNRS UMR8197, F-75005 Paris, France.
2 INSERM U1024, F-75005 Paris, France.
3 IBENS, Institut de Biologie de l'École Normale Supérieure, F-75005 Paris, France.
Correspondence to: Nicolas B David at [email protected]
Summary
Germ layer formation during gastrulation is both a fundamental step of development and
a paradigm for tissue formation and remodelling. However, the cellular and molecular basis of
germ layer segregation is poorly understood. Here, we use high resolution live observations and
functional analyses in zebrafish embryos to investigate the formation of the endoderm. We find
that endodermal cells reach their characteristic innermost position not through differential
adhesion cell sorting, as previously proposed, but through an active, rapid and actin-based
migration. Instead of being attracted to their destination, cells appear to migrate away from their
neighbours, in a process dependent on the Wnt/PCP pathway and N-cadherin. Furthermore, N-
cadherin is sufficient to trigger the internalisation of ectodermal cells, without affecting their
fate. Overall, these results lead to a new model of germ layer formation, in which endodermal
cells actively migrate out of the epiblast to reach their internal position.
Films can be visualised at http://these-florence.hol.es.
Introduction
Gastrulation is the first developmental stage when different progenitors segregate and
organise into distinct germ layers. Large-scale cell movements set up the body plan of the
91

92

embryo, with endodermal and mesodermal cells becoming internalised beneath the ectoderm.
Whereas an extensive body of literature describes the pathways that specify endoderm and
mesoderm identity (Schier and Talbot, 2005), the cellular mechanisms that physically create
these layers in the embryo are much less understood.
In frog, internalisation is achieved by involution, in which the prospective mesoderm and
endoderm roll inward as a coherent tissue at the blastopore, driven by the vegetal rotation of
the endodermal mass (Winklbauer and Schurfeld, 1999). In amniotes, as well as in the sea
urchin and urodeles, internalisation is achieved via ingression of single cells, with endodermal
and mesodermal progenitors undergoing an epithelial to mesenchymal transition (EMT)
(Solnica-Krezel and Sepich, 2012; Voiculescu et al., 2014). In fish, cell transplantation
experiments have demonstrated that cells internalise individually, but in a coordinated manner,
termed “synchronised ingression”, at the very margin of the blastoderm (Carmany-Rampey and
Schier, 2001; David and Rosa, 2001; Kane and Adams, 2002).
The general movements leading to germ layer formation have thus been described in many
species. However, how these movements are driven at the cellular scale remains poorly
understood (Voiculescu et al., 2014). Sixty years ago, Townes and Holtfreter (Townes and
Holtfreter, 1955) established that, when dissociated and mixed, embryonic cells would sort into
their previously specified germ layers. Following this original observation, it was proposed that
the mechanism underpinning germ layer formation in vivo could be cell sorting based on
differential adhesion (Steinberg, 2007; Takeichi, 1995) and/or differential cortical tension
(Brodland, 2002; Krieg et al., 2008). However, this hypothesis has not been validated in the
embryo (Ninomiya et al., 2012).
Our limited understanding of the mechanisms driving cell internalisation and germ layer
formation most likely stems from the difficulty and hence limited number of direct in vivo
observations, in particular in vertebrates (Row et al., 2011; Viotti et al., 2014; Voiculescu et al.,
2014). Here, we focused on endodermal cells in the zebrafish embryo to decipher the molecular
and cellular mechanisms driving germ layer separation. We show that cell internalisation relies
on an active, actin-driven migration process. Rather than being attracted to their destination,
cells migrate away from their neighbours, in a process mediated by the Wnt Planar Cell Polarity
(PCP) pathway and N-cadherin. We show that N-cadherin expression acts as a key trigger for
endodermal internalisation, being both necessary and sufficient for this process.
93
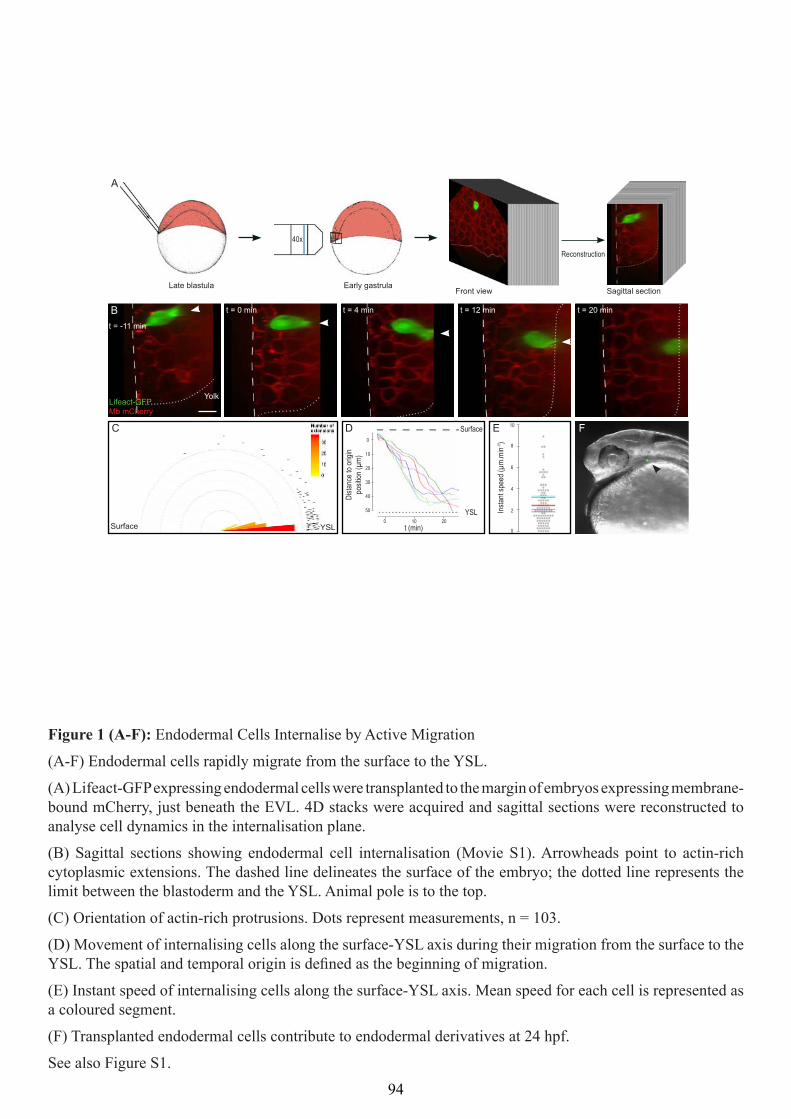
YSL. The spatial and temporal origin is deined as the beginning of migration.

Results
Endodermal Cells Emit Cytoplasmic Extensions towards the YSL and Rapidly
Migrate to Its Surface
To unravel the basis for germ layer formation, we analysed the cell behaviour and
dynamics of endodermal cells during internalisation. Naive cells can easily be driven to adopt
an endodermal fate (see MM; Carmany-Rampey and Schier, 2001; David and Rosa, 2001;
Krieg et al., 2008), and combined with cell transplants, allow the creation of mosaic embryos,
a prerequisite to good imaging. At the late blastula stage, single endodermal progenitors
expressing the actin labelling construct Lifeact-GFP were transplanted close to the margin of
embryos expressing a membrane-bound mCherry. Rapid 5D confocal imaging was used to
acquire entire volumes over time, and optical sections were reconstructed to analyse cell
behaviour in the plane of the internalisation movement (Figure 1A).
When in the epiblast, endodermal cells emitted large, frequent and short-lived cytoplasmic
extensions enriched in actin and oriented towards the YSL (n = 103 extensions, p < 0.001,
Figure 1C). Cells internalised through rapid migration to the surface of the YSL (mean speed:
2.4 µm.min-1, n = 6 cells, Figure 1 B, D, E, Movie S1). Once internalised, these cells performed
a random walk on the surface of the YSL and later differentiated into endodermal derivatives
(Figure 1F; David and Rosa, 2001; Pézeron et al., 2008).
We noticed that endodermal cells internalised either independently of neighbouring cells
or in coordination with them (compare Movie S2 and Movie S3, Figure S1 A, A’, B, B’), which
is consistent with previous reports showing that internalisation of hypoblastic cells is a more
coherent process at the ventral than at the dorsal margin (Keller et al., 2008). Coordinated
internalisation likely correlates with non-autonomous effects during internalisation; a cell from
a non-gastrulating MZoep mutant embryo transplanted into a wild-type embryo can be
passively internalised by its neighbours (Figure S1C, Movie S4; Carmany-Rampey and Schier,
2001). The movement of a cell may thus result both from its own activity and from the
behaviour of its neighbours. To circumvent these non-autonomous effects, we analysed the
behaviour of wild-type endodermal cells transplanted to the margin of non-gastrulating MZoep
embryos. These cells show the same internalisation features as in wild-type embryos
(n = 3 cells, Figure S1D, Movie S5), indicating autonomous migration.
95

(G-R) Cell sorting based on differential adhesion is not suficient to account for germ layer formation.
Ectodermal (G, J, M) or endodermal cells (H, I, K, L, N, O) were transplanted to the supericial-most layer of a blastoderm of either ectodermal (G, H, J, K, M, N) or endodermal (I, L, O) identity. Sections showing the position of transplanted cells at the onset of gastrulation (G-I) and at mid-gastrulation (J-L). Distribution of or as a cumulative plot (R).
transplanted endodermal cells (red nuclear labelling) and in neighbouring cells (red membrane labelling). (P) Endodermal cells in ectodermal blastoderm, (Q) endodermal cells in endodermal blastoderm.
See also Figures S2, S4, S5.
Scale bar: 20 µm.
*** : p-value < 0.001

In summary, endodermal cells internalise autonomously, by emitting long, actin-rich
cytoplasmic extensions directed towards the YSL, and by rapidly migrating to the YSL surface.
Cell Sorting Is not Sufficient to Account for Germ Layer Segregation
Actin-rich protrusions oriented in the direction of the rapid internalisation movement
strongly evoke an active migration. However, previous work in fish has suggested that germ
layer formation results from passive cell sorting, based on differences in cortical tension and
adhesive properties between cells of different identities (Krieg et al., 2008). We directly tested
the relevance of passive cell sorting in vivo by transplanting ectodermal or endodermal cells
into ectodermal or endodermal environments and examining their behaviour. In a differential
adhesion-based process, cells should migrate when surrounded by those of a different identity,
and remain stationary when surrounded by identical neighbours. Compatible with both passive
sorting and active migration, ectodermal cells transplanted into the outermost layer of the
ectoderm (animal pole) of a host embryo (Figure 1G) remained at this position at mid-
gastrulation (n = 20 embryos, Figure 1 J, M, R), and most endodermal cells transplanted into
the ectoderm internalised (n = 17 embryos, Figure 1 H, K, N, R). However, when surrounded
by cells of similar identity (Figure 1Q), a large proportion of endodermal cells still internalised
(n = 21 embryos, Figure 1 I, L, O, R). Thus, differential adhesion alone cannot account for
endoderm internalisation and germ layer segregation. Accordingly, endodermal cells at the
animal pole internalised using long, actin-rich cytoplasmic extensions directed to the YSL, and
rapidly migrating to the surface of the YSL, a behaviour again evocative of active migration
rather than a differential adhesion cell sorting (n = 6 cells, Movie S6).
Consistent with cell adhesion not being the principal driver behind germ layer formation,
while E-cadherin is responsible for most cell adhesion at this stage (Krieg et al., 2008), its
expression level is similar in endodermal and ectodermal cells (n = 30 membranes for each
condition, p = 0.6, Figure S2A). Furthermore, downregulating E-cadherin levels, either in the
internalising endodermal cells or in their ectodermal neighbours, did not impair endoderm
internalisation (Figure S2B).
Together, these results demonstrate that cell sorting based on differential adhesion is not
sufficient to account for germ layer segregation in vivo, and that endodermal cells internalise
through active migration.
97

(A) Endodermal cells were transplanted into the supericial-most layer of the blastoderm. By mid-gastrulation, were counted as non-internalised.
(B-G) Distribution of embryos according to the percentage of internalised cells at mid-gastrulation are plotted as histograms (B-F) or as a cumulative plot (G). While most control (B), dnRhoA (C) and dnCdc42 (D) expressing endodermal cells were internalised, endodermal cells expressing either dnRac1 (E) or VCA (F) were not.
(H, I) Cytoplasmic extensions emitted by control (H) or dnRac1 expressing (I) cells labelled with Lifeact-GFP.
(J-M) Orientation (J, K), frequency (L) and length (M) of cytoplasmic extensions emitted by control endodermal cells (J, n = 88) or endodermal cells expressing dnRac1 (K, n = 57).
See also Figure S3 and Movie S7.
Scale bar: 10 µm.
ns: non-signiicant (p-value > 0.05)
** : p-value < 0.01
*** : p-value < 0.001

The Internalisation of Endodermal Cells Is Dependent on Rac1 and Arp2/3
As the internalisation of endodermal cells appeared to be an active process, we tested the
potential role of the small GTPases RhoA, Cdc42 and Rac1, which are established regulators
of cell migration (Jaffe and Hall, 2005). To do so, we interfered with the function of each protein
in turn, and analysed the internalisation of endodermal cells transplanted to the animal pole
(Figure 2A) rather than at the margin, since at the margin, even non-ingressing cells can be
internalised by their neighbours. Expression of dominant negative forms of RhoA or Cdc42
(Djiane et al., 2000; Tahinci and Symes, 2003) did not affect cell internalisation (ncontrol = 60
embryos, ndnRho = 45 embryos, p = 0.43, ndnCdc42 = 31 embryos, p = 0.46, Figure 2 B-D, G).
However, endodermal cells expressing a dominant negative form of Rac1 (Tahinci and Symes,
2003) did not internalise (ndnRac = 26 embryos, p < 0.001, Figure 2 E, G) nor contribute to
endodermal derivatives at 24 hours post fertilisation (hpf) (ncontrol = 51 embryos, ndnRac = 28
embryos, pcontrol/dnRac < 0.001, Figure S3 B, D). Importantly, when transplanted to a deep
position in the embryo, at the surface of the YSL, most endodermal cells expressing dominant
negative Rac1 did form endodermal derivatives at 24 hpf, showing that Rac1 is required
specifically for the internalisation step (ndnRac deep = 37 embryos, pdnRac surface/deep < 0.001,
Figure S3 C, D).
To unravel the role of Rac1 in the internalisation process, we observed the morphology
and dynamics of endodermal cells expressing dominant negative Rac1. These cells showed a
dramatic reduction in the frequency of cytoplasmic extensions (freqcontrol = 1.4 ext.min-1,
n = 88 extensions; freqdnRac = 0.3 ext.min-1, n = 57 extensions; p < 0.01; Figure 2L, Movie S7).
The remaining extensions were shorter (lengthcontrol = 12.4 µm, lengthdnRac = 7.6 µm, p < 0.01;
Figure 2 H, I, M), but still polarised towards the YSL (pangle control/dnRac = 0.3; Figure 2 J, K).
These results suggest that cytoplasmic extensions are required for cell internalisation. To
confirm this, we used the constitutively active VCA domain of N-WASp to interfere with the
function of the actin branching complex Arp2/3, a direct regulator of protrusions (Costa et al.,
2003; Machesky and Insall, 1998). Endodermal cells expressing the VCA fragment internalised
poorly (nVCA = 22 embryos, p < 0.001, Figure 2 F, G). Actin-rich protrusions thus seem to play
a major role in endodermal cell internalisation. Interestingly, ectodermal cells display similar
oriented protrusions, showing that, even though protrusions appear required for the
internalisation, acquisition of protrusive activity or polarisation is not the event triggering the
internalisation (Figures S4, S5, Movie S8).
99


Endodermal Cells Are Not Attracted to the YSL but Migrate away from Their
Neighbours
Because cells are polarised towards the YSL and migrate to its surface, the YSL, which is
transcriptionally active, could be the source of an attractant. To test this, we injected RNAse
with rhodamine-dextran in the YSL at the mid-blastula stage. RNAse injection in the YSL has
been shown to rapidly eliminate RNAs (Chen and Kimelman, 2000), which we verified by in
situ hybridisation for cb120 and A2ML, which are normally strongly expressed in the YSL
(Figure 3 E-H; Hong and Dawid, 2008; Thisse et al., 2001). RNA depletion led to severe
defects, with the blastoderm lifting off the yolk cell (Figure 3B; Chen and Kimelman, 2000).
Nevertheless, by mid-gastrulation (assessed on control embryos), endodermal cells transplanted
beneath the EVL of RNAse injected embryos (Figure 3A) had internalised and reached the
surface of the YSL (nRNAse = 9/10 embryos, ncontrol = 14/14 embryos, p = 0.4, Figure 3 C, D).
Therefore, the internalisation of endodermal cells is independent of the YSL, or the internalising
signal is provided by proteins produced before RNA depletion.
To discriminate between these possibilities, we examined endoderm cell behaviour in
absence of the YSL. We transplanted cells to the animal pole of host embryos at the late blastula
stage and dissected animal cap explants to separate the blastoderm from the YSL (Figure 3I).
After three hours of culture, when non-dissected embryos had reached mid-gastrulation,
transplanted control ectodermal cells were still within the explant (n = 11/11 explants,
Figure 3J). In contrast, endodermal cells were found outside (n = 12/16 explants,
pecto/endo < 0.001, Figure 3K); live analysis revealed that they emitted large actin-rich
cytoplasmic extensions directed outwards and migrated out of the explant (n = 15 cells,
Figure 3L, Movie S9). Endoderm internalisation is therefore YSL-independent, suggesting that
endodermal cells instead migrate away from their neighbours to reach a cell-free area.
Consistent with this idea, we observed instances in which an enveloping layer had partially
reformed around the explant (Krens et al., 2011), leaving only a few gaps through which
blastoderm cells were in direct contact with the medium. When an endodermal cell produced a
protrusion reaching the gap, strikingly, the cell would rapidly migrate to and then through the
gap, exiting the explant (n = 3 cells, Movie S10).
101

N-cadherin Is Necessary and Suficient to Induce Cell Internalisation
(A-G) N-cadherin and the Wnt/PCP pathway are required for endodermal cell internalisation.
(A-E) Control endodermal cells or endodermal cells with Dsh-DEP mRNA, N-cadherin morpholino, or N-cadherin morpholino and N-cadherin mRNA were transplanted to the animal pole of a host embryo. At mid-gastrulation, Dsh-DEP expressing cells had poorly internalised (B, E), as had N-cadherin morphant cells (C, E), which can be rescued by expression of a morpholino insensitive N-cadherin RNA (D, E).
(F) Orientation of protrusions emitted by N-cadherin morphant endodermal cells, n = 108.
(G) Sagittal sections showing N-cadherin morphant endodermal cells (Movie S11). Arrowheads point to actin-rich cytoplasmic extensions. The dashed line delineates the surface of the embryo; the dotted line represents the limit between the blastoderm and the YSL.
(H-N) N-cadherin overexpression is suficient to trigger ectodermal cell internalisation.
See also Figure S6.
Scale bar: 10 µm.
ns: non-signiicant (p-value > 0.05)
*** : p-value < 0.001
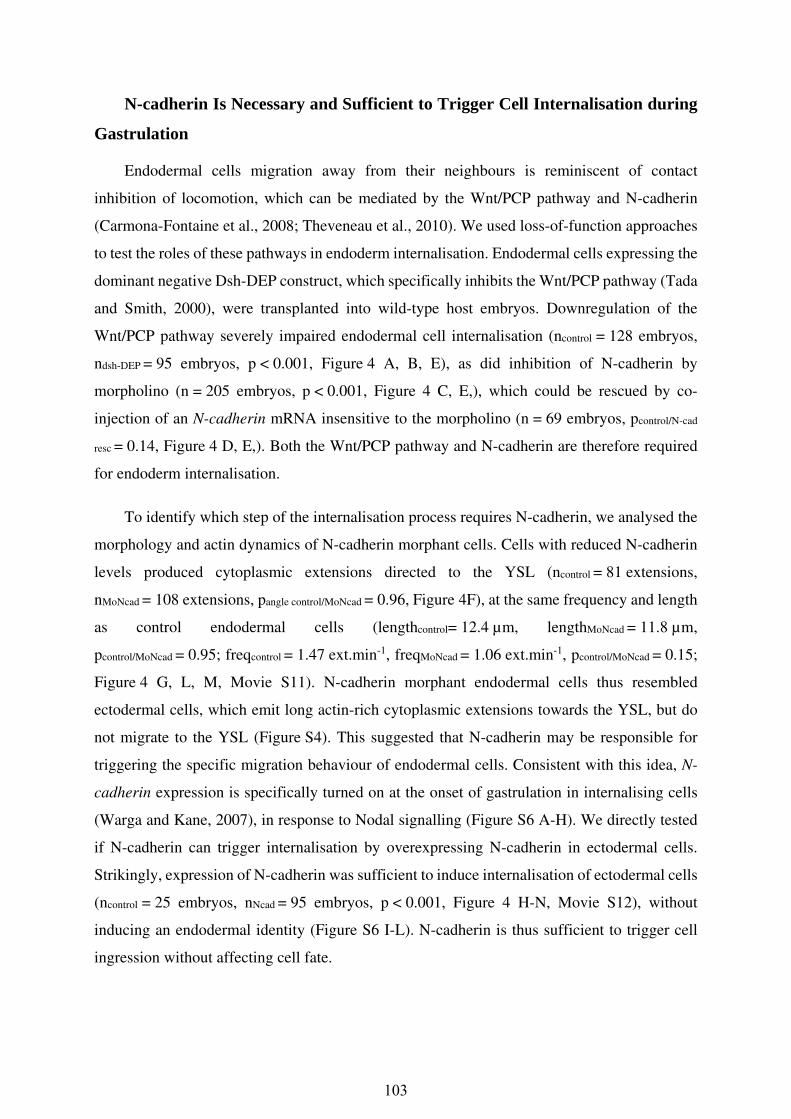
N-cadherin Is Necessary and Sufficient to Trigger Cell Internalisation during
Gastrulation
Endodermal cells migration away from their neighbours is reminiscent of contact
inhibition of locomotion, which can be mediated by the Wnt/PCP pathway and N-cadherin
(Carmona-Fontaine et al., 2008; Theveneau et al., 2010). We used loss-of-function approaches
to test the roles of these pathways in endoderm internalisation. Endodermal cells expressing the
dominant negative Dsh-DEP construct, which specifically inhibits the Wnt/PCP pathway (Tada
and Smith, 2000), were transplanted into wild-type host embryos. Downregulation of the
Wnt/PCP pathway severely impaired endodermal cell internalisation (ncontrol = 128 embryos,
ndsh-DEP = 95 embryos, p < 0.001, Figure 4 A, B, E), as did inhibition of N-cadherin by
morpholino (n = 205 embryos, p < 0.001, Figure 4 C, E,), which could be rescued by co-
injection of an N-cadherin mRNA insensitive to the morpholino (n = 69 embryos, pcontrol/N-cad
resc = 0.14, Figure 4 D, E,). Both the Wnt/PCP pathway and N-cadherin are therefore required
for endoderm internalisation.
To identify which step of the internalisation process requires N-cadherin, we analysed the
morphology and actin dynamics of N-cadherin morphant cells. Cells with reduced N-cadherin
levels produced cytoplasmic extensions directed to the YSL (ncontrol = 81 extensions,
nMoNcad = 108 extensions, pangle control/MoNcad = 0.96, Figure 4F), at the same frequency and length
as control endodermal cells (lengthcontrol= 12.4 µm, lengthMoNcad = 11.8 µm,
pcontrol/MoNcad = 0.95; freqcontrol = 1.47 ext.min-1, freqMoNcad = 1.06 ext.min-1, pcontrol/MoNcad = 0.15;
Figure 4 G, L, M, Movie S11). N-cadherin morphant endodermal cells thus resembled
ectodermal cells, which emit long actin-rich cytoplasmic extensions towards the YSL, but do
not migrate to the YSL (Figure S4). This suggested that N-cadherin may be responsible for
triggering the specific migration behaviour of endodermal cells. Consistent with this idea, N-
cadherin expression is specifically turned on at the onset of gastrulation in internalising cells
(Warga and Kane, 2007), in response to Nodal signalling (Figure S6 A-H). We directly tested
if N-cadherin can trigger internalisation by overexpressing N-cadherin in ectodermal cells.
Strikingly, expression of N-cadherin was sufficient to induce internalisation of ectodermal cells
(ncontrol = 25 embryos, nNcad = 95 embryos, p < 0.001, Figure 4 H-N, Movie S12), without
inducing an endodermal identity (Figure S6 I-L). N-cadherin is thus sufficient to trigger cell
ingression without affecting cell fate.
103

N-cadherin Is Necessary and Suficient to Induce Cell Internalisation
(H-N) N-cadherin overexpression is suficient to trigger ectodermal cell internalisation.
(H-J) Control ectodermal cells or ectodermal cells with N-cadherin mRNA were transplanted to the animal pole of a host embryo. Contrary to control ectodermal cells (H, J), at mid-gastrulation, N-cadherin expressing ectodermal cells had internalised (I, J).
Orientation (K), length (L) and frequency (M) of cytoplasmic extensions emitted by N-cadherin expressing ectodermal cells (K-M) and N-cadherin morphant endodermal cells, compared to control ectodermal and endodermal cells (L, M). ncontrol endo = 81, nendo MoNcad = 108, ncontrol ecto = 102, necto NcadRNA = 99 extensions.
(G) Sagittal sections showing N-cadherin expressing ectodermal cell internalisation (Movie S12). Arrowheads point to actin-rich cytoplasmic extensions. The dashed line delineates the surface of the embryo; the dotted line represents the limit between the blastoderm and the YSL.
See also Figure S6.
Scale bar: 10 µm.
ns: non-signiicant (p-value > 0.05)
*** : p-value < 0.001

Discussion
In this study, we have analysed the mechanisms driving germ layer formation during
gastrulation. Our results reveal that endodermal cells internalise by an active, Rac1 dependent
migration, rather than through cell sorting based on differential adhesion. This is in direct
agreement with studies performed in Xenopus, showing that differential adhesion leads to cell
sorting in vitro but not in vivo (Ninomiya et al., 2012). It is however possible that differential
adhesion is involved in the maintenance of germ layer separation (Tan and Chiam, 2014). We
have furthermore established that endodermal migration is not guided by the YSL, but that cells
rather migrate away from neighbouring cells, a process requiring the Wnt/PCP pathway and N-
cadherin. Together, these results lead to a new two-step model for endoderm ingression. Before
the onset of gastrulation, cells, regardless of their identity, are polarised and emit actin-rich
protrusions to the surface of the YSL. We hypothesise that endodermal cells thus identify the
YSL as a region free of neighbouring cells. At the onset of gastrulation, endodermal cells
express N-cadherin in response to Nodal signalling. This triggers their active migration away
from their neighbours to the surface of the YSL, ensuring their internalisation.
A key finding of this work is that N-cadherin is necessary and sufficient to trigger the
active internalisation of endodermal cells. Quite strikingly, this can happen in single cells at the
animal pole, where neighbouring cells do not express N-cadherin. One possibility is that N-
cadherin forms a hetero-duplex with E-cadherin present in neighbouring cells (Volk et al.,
1987). However, downregulation of E-cadherin in neighbouring cells does not affect
internalisation (Figure S2), arguing against such hetero-duplexes. Alternatively, N-cadherin
may induce endodermal cell motility autonomously, and trigger internalisation. Indeed, N-
cadherin cell-autonomously modulates motility of different tumour cells, by interaction with
the FGF and PDGF pathways (Wheelock et al., 2008).
It is very striking that N-cadherin is turned on at the onset of gastrulation in cells that will
internalise not only in fish, but also in fly, chick and mouse (Hatta and Takeichi, 1986; Oda et
al., 1998; Viotti et al., 2014; Yang et al., 2008). In these species, N-cadherin upregulation is
accompanied by E-cadherin downregulation, in the so-called cadherin switch, one of the
hallmarks of EMT. As cadherins are mainly homophilic adhesion molecules, the cadherin
switch is classically interpreted as a mechanism that induces cell sorting based on differential
adhesion (Takeichi, 1995). In fish, however, previous work has shown (Krieg et al., 2008;
Montero et al., 2005), and we confirmed (Figure S2), that E-cadherin is not down-regulated in
105

106

internalising cells. Furthermore, we have established that internalisation does not rely on
differential adhesion, but on active migration. This suggests either that the internalisation
mechanism we have identified is specific to fish, or that the role of N-cadherin in other species
should be reconsidered. In support of the latter idea, internalisation appears to be independent
of E-cadherin levels in both fly and chick (Hardy et al., 2011; Moly et al., 2016; Schäfer et al.,
2014). More generally, cell migration can be induced by N-cadherin expression in different
EMT systems, without the loss of E-cadherin (Huang et al., 2016; Nieman et al., 1999). N-
cadherin-induced motility can thus be functionally separated from E-cadherin downregulation,
and should be regarded as one of the many distinct steps leading to a full EMT (Nakaya and
Sheng, 2009; Scarpa et al., 2015). We propose that during gastrulation, N-cadherin upregulation
is a conserved process, which is required to induce cell motility in internalising cells, and allows
these cells to actively migrate away from their neighbours. In some species, this is in addition
accompanied by a loss of E-cadherin expression, probably depending on the degree of
epithelisation of the epiblast at the onset of gastrulation (Solnica-Krezel and Sepich, 2012).
In summary, this work showed that the internalisation of endodermal cells results from an
active migration process induced by N-cadherin. In addition to providing a comprehensive
model of endodermal layer formation during gastrulation, our live observations and functional
analyses lead to a new interpretation of the role of N-cadherin during gastrulation and suggest
that its pro-migratory role could be conserved across species during evolution. More generally,
the pro-migratory role of N-cadherin may deserve further examination in a number of EMTs,
in particular in cancer cells in which TGF--induced N-cadherin expression leads to metastatic
spread (Foroni et al., 2012).
Experimental procedures
Embryos
Embryos were obtained by natural spawning of WT or oeptz57-/- adult fish (Gritsman et al.,
1999). All animal studies were done in accordance with the guidelines issued by the French
Ministry of Agriculture and were approved by the Direction Départementale des Services
Vétérinaires de Paris and the ethics committee Charles Darwin (C2EA-05).
107

108

Constructs, mRNA and Morpholinos
To generate endoderm progenitors for transplant experiments, donor embryos were
injected in one blastomere at the 4/8-cell stage with mRNA (1.2 pg) encoding the constitutively
active Nodal receptor Taram-A (Tar*; Peyriéras et al., 1998), as sustained Nodal signalling
induces endodermal fate and behaviour (David and Rosa, 2001). This approach has been
previously used to characterise adhesive properties of germ layer progenitors (Krieg et al.,
2008). Cells were in addition injected with 150 pg of either Lifeact-GFP or GFP or mCherry
or H2B-mCherry mRNA and, depending on the experiment, 4 pg dnRac1N, 40 pg dnRhoA,
150 pg dnCdc42 mRNA (Tahinci and Symes, 2003), 6 pg N-cadherin mRNA (Lele et al.,
2002), or 250 pg dsh-DEP mRNA (Tada and Smith, 2000), 2 pmol E-cadherin morpholino or
0.4 pmol N-cadherin morpholino.
To generate host embryos of endodermal identity for cell sorting experiments, embryos
were injected with Tar* mRNA at the 1-cell stage. To generate large clones of endodermal cells
for E-cadherin quantification, embryos were injected in one blastomere at the 4-cell stage.
mRNAs were synthesised in vitro using an SP6 promoter (mMessage, mMachine, SP6,
Ambion).
E-Cadherin (TAA ATC GCA GCT CTT CCT TCC AAC G; Babb and Marrs, 2004;
Dumortier et al., 2012; Krieg et al., 2008) and N-cadherin (GTT CTG TAT AAA GAA ACC
GAT AGA; LaMora and Voigt, 2009) morpholinos were previously described.
The activated form of the Nodal receptor taram-A (Tar*) and a Lifeact-GFP fusion were
PCR amplified and inserted on either side of a bi-directional heat-shock inducible promoter
(Bajoghli et al., 2004) to generate the Tar*:HSE:Lifeact-GFP construct. Heat shock was
performed at the dome stage, at 39°C for 30 minutes.
Whole-mount in situ Hybridisation and Immunostaining
In situ hybridisation was performed following standard protocols (Hauptmann and Gerster,
1994) with a sox32 (Aoki et al., 2002) or N-cadherin probe (provided by L. Bally-Cuif).
Immunostaining was performed as in (Bielen and Houart, 2012). Rabbit anti-Ds-Red antibody
(ClonTech, 1:200) and mouse anti-E-cadherin antibody (Biosciences, 1:200) were incubated
overnight at 4°C.
109

110

Cell Transplantation Experiments
At the 30% epiboly stage (4.7 hpf), 5-20 cells from donor embryos were transplanted to
the margin or animal pole of host embryos (Ho and Kimmel, 1993). Embryos were then cultured
in embryo medium (Westerfield, 2000) with 10 U/mL penicillin and 10 µg/mL streptomycin.
For single cell transplantations, donor embryos were cultured in calcium-free Ringer medium
after dechorionation at the sphere stage (4 hpf). At 30% epiboly, cells were mechanically
dissociated and isolated cells were transplanted.
Injections into the Yolk Syncytial Layer
Rhodamine-dextran 10 000 MW (ThermoFisher D1824, 2 mg/mL) was injected alone or
in combination with DNAse free RNAse (Roche, 0.5 mg/mL diluted to 10 µg/mL) into the Yolk
Syncytial Layer of high stage embryos (3.3 hpf).
Culture of Animal Caps
Cells were transplanted to the animal pole at the 30% epiboly stage. At 50% epiboly
(5.3 hpf), animal caps were dissected with forceps and mounted in 0.2% agarose in L15 (65%;
Gibco), embryo medium (20%), BSA (1 mg/ml), Hepes (pH 7.5, 10 mM), penicillin (10 U/mL)
and streptomycin (10 µg/mL). Explants were imaged either immediately, for live imaging, or
when control embryos had reached 70% epiboly (8 hpf).
Time-lapse Imaging
Dechorionated embryos were mounted in 0.2% agarose in embryo medium and imaged
from the germ ring stage (5.7 hpf) to the 70% epiboly stage (8 hpf). Imaging was performed on
an inverted thermostated Nikon spinning disk (Yokogawa) equipped with an Evolve camera
(Photometrics) and MetaMorph software (Molecular Devices). Z-stacks with a Z-step of 1 µm
were collected at 1-min intervals and images were reconstructed using FIJI software.
Endodermal cells were automatically tracked using Imaris software (Bitplane). Tracks
were manually validated and corrected when necessary. Neighbour cells labelled with
membrane-bound mCherry were tracked manually using a custom modified version of the
manual track FIJI plugin. Data were further processed with Matlab.
111

112

Statistics
The t-test was used to compare means, the Kolmogorov-Smirnov test to compare
distributions, and the Fisher exact test for categorical data. When multiple measurements where
done on the same embryo, linear mixed-effects models were used to take into account
resampling of the same statistical unit. Analyses were performed in R.
Acknowledgements
We are grateful to A. Bonnet and F. Rosa for critically reading the manuscript, and to E.
Theveneau, L. Bally-Cuif, M. Hammerschmidt, C. Revenu for plasmids and antibodies. We
thank Firas Bouallague for fish care, E. Hirsinger, F. Giudicelli and IBPS Fish Facility. We are
grateful to the IBENS Imaging Facility, which received the support of grants NERF N°2009-
44, NERF N°2011-45), FRM N° DGE 20111123023, ANR-10-LABX-54 MEMO LIFE, ANR-
11-IDEX-0001-02 PSL* and ANR‐10‐INSB‐04‐01. This work was supported by grants from
the Association pour la Recherche sur le Cancer PJA 20131200143 and PJA 20151203256.
FAG was supported by the Ministère de l’Enseignement Supérieur et de la Recherche and the
Fondation pour la Recherche Médicale FDT20150532614. NBD was supported by the Centre
National de la Recherche Scientifique.
References
Aoki, T.O., David, N.B., Minchiotti, G., Saint-Etienne, L., Dickmeis, T., Persico, G.M., Strähle, U., Mourrain, P., Rosa, F.M., 2002. Molecular integration of casanova in the Nodal signalling pathway controlling endoderm formation. Development 129, 275–86.
Babb, S.G., Marrs, J.A., 2004. E-cadherin regulates cell movements and tissue formation in early zebrafish embryos. Dev. Dyn. 230, 263–77.
Bajoghli, B., Aghaallaei, N., Heimbucher, T., Czerny, T., 2004. An artificial promoter construct for heat-inducible misexpression during fish embryogenesis. Dev. Biol. 271, 416–30.
Bielen, H., Houart, C., 2012. BMP Signaling Protects Telencephalic Fate by Repressing Eye Identity and Its Cxcr4-Dependent Morphogenesis. Dev. Cell 23, 812–822.
Brodland, G.W., 2002. The Differential Interfacial Tension Hypothesis (DITH): A Comprehensive Theory for the Self-Rearrangement of Embryonic Cells and Tissues. J Biomech Eng.
Carmany-Rampey, A., Schier, A.F., 2001. Single-cell internalization during zebrafish gastrulation. Curr. Biol. 11, 1261–5.
Carmona-Fontaine, C., Matthews, H.K., Kuriyama, S., Moreno, M., Dunn, G. a, Parsons, M., Stern, C.D., Mayor, R., 2008. Contact inhibition of locomotion in vivo controls neural crest directional migration. Nature 456, 957–61.
113

114

Chen, S., Kimelman, D., 2000. The role of the yolk syncytial layer in germ layer patterning in zebrafish. Development 127, 4681–9.
Costa, S.R. da, Sou, E., Xie, J., Yarber, F.A., Okamoto, C.T., Pidgeon, M., Kessels, M.M., Mircheff, A.K., Schechter, J.E., Qualmann, B., Hamm-Alvarez, S.F., 2003. Impairing Actin Filament or Syndapin Functions Promotes Accumulation of Clathrin-coated Vesicles at the Apical Plasma Membrane of Acinar Epithelial Cells Silvia. Mol. Biol. Cell 14, 4397–4413.
David, N.B., Rosa, F.M., 2001. Cell autonomous commitment to an endodermal fate and behaviour by activation of Nodal signalling. Development 128, 3937–47.
Djiane, A., Riou, J., Umbhauer, M., Boucaut, J., Shi, D.L., 2000. Role of frizzled 7 in the regulation of convergent extension movements during gastrulation in Xenopus laevis. Development 127, 3091–3100.
Dumortier, J.G., Martin, S., Meyer, D., Rosa, F.M., David, N.B., 2012. Collective mesendoderm migration relies on an intrinsic directionality signal transmitted through cell contacts. Proc. Natl. Acad. Sci. U. S. A. 1–6.
Foroni, C., Broggini, M., Generali, D., Damia, G., 2012. Epithelial-mesenchymal transition and breast cancer: Role, molecular mechanisms and clinical impact. Cancer Treat. Rev. 38, 689–697.
Gritsman, K., Zhang, J., Cheng, S., Heckscher, E., Talbot, W.S., Schier, A.F., 1999. The EGF-CFC protein one-eyed pinhead is essential for nodal signaling. Cell 97, 121–32.
Hardy, K.M., Yatskievych, T. a, Konieczka, J., Bobbs, A.S., Antin, P.B., 2011. FGF signalling through RAS/MAPK and PI3K pathways regulates cell movement and gene expression in the chicken primitive streak without affecting E-cadherin expression. BMC Dev. Biol. 11, 20.
Hatta, K., Takeichi, M., 1986. Expression of N-cadherin adhesion molecules associated with early morphogenetic events in chick development. Nature 320, 447–449.
Hauptmann, G., Gerster, T., 1994. Two-color whole-mount in situ hybridization to vertebrate and Drosophila embryos. Trends Genet. 10, 266.
Ho, R.K., Kimmel, C.B., 1993. Commitment of cell fate in the early zebrafish embryo. Science 261, 109–11.
Hong, S.-K., Dawid, I.B., 2008. Alpha2 macroglobulin-like is essential for liver development in zebrafish. PLoS One 3, e3736.
Huang, C., Kratzer, M.-C., Wedlich, D., Kashef, J., 2016. E-cadherin is required for cranial neural crest migration in Xenopus laevis. Dev. Biol.
Jaffe, A.B., Hall, A., 2005. Rho GTPases: biochemistry and biology. Annu. Rev. Cell Dev. Biol. 21, 247–69.
Kane, D.A., Adams, R.J., 2002. Life at the edge: epiboly and involution in the zebrafish. Results Probl. Cell Differ. 40, 117–35.
Keller, P.J., Schmidt, A.D., Wittbrodt, J., Stelzer, E.H.K., 2008. Reconstruction of zebrafish early embryonic development by scanned light sheet microscopy. Science 322, 1065–9.
Krens, S.F.G., Möllmert, S., Heisenberg, C.-P., 2011. Enveloping cell-layer differentiation at the surface of zebrafish germ-layer tissue explants. Proc. Natl. Acad. Sci. U. S. A. 108, E9–10; author reply E11.
115

116

Krieg, M., Arboleda-Estudillo, Y., Puech, P., Käfer, J., Graner, F., Müller, D., Heisenberg, C.-P., 2008. Tensile forces govern germ-layer organization in zebrafish. Nat. Cell Biol. 10, 429–36.
LaMora, A., Voigt, M.M., 2009. Cranial sensory ganglia neurons require intrinsic N-cadherin function for guidance of afferent fibers to their final targets. Neuroscience 159, 1175–1184.
Lele, Z., Folchert, A., Concha, M.L., Rauch, G., Geisler, R., Rosa, F.M., Wilson, S.W., Hammerschmidt, M., Bally-Cuif, L., 2002. Parachute/n-cadherin is required for morphogenesis and maintained integrity of the zebrafish neural tube. Development 3294, 3281–3294.
Machesky, L.M., Insall, R.H., 1998. Scar1 and the related Wiskott-Aldrich syndrome protein, WASP, regulate the actin cytoskeleton through the Arp2/3 complex. Curr. Biol. 8, 1347–56.
Moly, P.K., Cooley, J.R., Zeltzer, S.L., Yatskievych, T.A., Antin, P.B., 2016. Gastrulation EMT Is Independent of P-Cadherin Downregulation. PLoS One 11, e0153591.
Montero, J.A., Carvalho, L., Wilsch-Brauninger, M., Kilian, B., Mustafa, C., Heisenberg, C.-P., 2005. Shield formation at the onset of zebrafish gastrulation. Development 132, 1187–1198.
Nakaya, Y., Sheng, G., 2009. An amicable separation. Cell Adh. Migr. 3, 160–163.
Nieman, M.T., Prudoff, R.S., Johnson, K.R., Wheelock, M.J., 1999. N-cadherin promotes motility in human breast cancer cells regardless of their E-cadherin expression. J. Cell Biol. 147, 631–44.
Ninomiya, H., David, R., Damm, E.W., Fagotto, F., Niessen, C.M., Winklbauer, R., 2012. Cadherin-dependent differential cell adhesion in Xenopus causes cell sorting in vitro but not in the embryo. J. Cell Sci. 125, 1877–83.
Oda, H., Tsukita, S., Takeichi, M., 1998. Dynamic behavior of the cadherin-based cell-cell adhesion system during Drosophila gastrulation. Dev. Biol. 203, 435–450.
Peyriéras, N., Strähle, U., Rosa, F.M., 1998. Conversion of zebrafish blastomeres to an endodermal fate by TGF-beta-related signaling. Curr. Biol. 8, 783–786.
Pézeron, G., Mourrain, P., Courty, S., Ghislain, J., Becker, T.S., Rosa, F.M., David, N.B., 2008. Live analysis of endodermal layer formation identifies random walk as a novel gastrulation movement. Curr. Biol. 18, 276–81.
Row, R.H., Maître, J.-L., Martin, B.L., Stockinger, P., Heisenberg, C.-P., Kimelman, D., 2011. Completion of the epithelial to mesenchymal transition in zebrafish mesoderm requires Spadetail. Dev. Biol. 354, 102–10.
Scarpa, E., Theveneau, É., Mayor, R., Bibonne, A., Parsons, M., 2015. Cadherin Switch during EMT in Neural Crest Cells Leads to Contact Inhibition of Locomotion via Repolarization of Forces. Dev. Cell 1–14.
Schäfer, G., Narasimha, M., Vogelsang, E., Leptin, M., 2014. Cadherin switching during the formation and differentiation of the Drosophila mesoderm - implications for epithelial-to-mesenchymal transitions. J. Cell Sci. 127, 1511–22.
Schier, A.F., Talbot, W.S., 2005. Molecular genetics of axis formation in zebrafish. Annu Rev Genet 39, 561–613.
Solnica-Krezel, L., Sepich, D.S., 2012. Gastrulation: Making and Shaping Germ Layers.
117

118

Annu. Rev. Cell Dev. Biol. 28, 687–717.
Steinberg, M.S., 2007. Differential adhesion in morphogenesis: a modern view. Curr. Opin. Genet. Dev. 17, 281–286.
Tada, M., Smith, J.C., 2000. Xwnt11 is a target of Xenopus Brachyury: regulation of gastrulation movements via Dishevelled, but not through the canonical Wnt pathway. Development 127, 2227–2238.
Tahinci, E., Symes, K., 2003. Distinct functions of Rho and Rac are required for convergent extension during Xenopus gastrulation. Dev. Biol. 259, 318–35.
Takeichi, M., 1995. Morphogenetic roles of classic cadherins. Curr. Opin. Cell Biol. 7, 619–627.
Tan, R.Z., Chiam, K.H., 2014. Computational modeling reveals that a combination of chemotaxis and differential adhesion leads to robust cell sorting during tissue patterning. PLoS One 9.
Theveneau, É., Marchant, L., Kuriyama, S., Gull, M., Moepps, B., Parsons, M., Mayor, R., 2010. Collective Chemotaxis Requires Contact-Dependent Cell Polarity. Dev. Cell 19, 39–53.
Thisse, B., Pflumio, S., Fürthauer, M., Loppin, B., Heyer, V., Degrave, A., Woehl, R., Lux, A., Steffan, T., Charbonnier, X.., Thisse, C., 2001. Expression of the zebrafish genome during embryogenesis. ZFIN direct data Submiss.
Townes, P., Holtfreter, J., 1955. Directed movements and selective adhesion of embryonic amphibian cells. J. Exp. Zool. 128, 53–120.
Viotti, M., Nowotschin, S., Hadjantonakis, A.-K., 2014. SOX17 links gut endoderm morphogenesis and germ layer segregation. Nat. Cell Biol. 16.
Voiculescu, O., Bodenstein, L., Lau, I., Stern, C.D., 2014. Local cell interactions and self-amplifying individual cell ingression drive amniote gastrulation. Elife 1–26.
Volk, T., Cohen, O., Geiger, B., 1987. Formation of heterotypic adherens-type junctions between L-CAM-containing liver cells and A-CAM-containing lens cells. Cell 50, 987–994.
Warga, R.M., Kane, D.A., 2007. A role for N-cadherin in mesodermal morphogenesis during gastrulation. Dev. Biol. 310, 211–25.
Westerfield, M., 2000. The zebrafish book. A guide for the laboratory use of zebrafish (Danio rerio), 4th ed., U. ed.
Wheelock, M.J., Shintani, Y., Maeda, M., Fukumoto, Y., Johnson, K.R., 2008. Cadherin switching. J. Cell Sci. 121, 727–735.
Winklbauer, R., Schurfeld, M., 1999. Vegetal rotation, a new gastrulation movement involved in the internalization of the mesoderm and endoderm in Xenopus. Development 126, 3703–3713.
Yang, X., Chrisman, H., Weijer, C.J., 2008. PDGF signalling controls the migration of mesoderm cells during chick gastrulation by regulating N-cadherin expression. Development 135, 3521–3530.
119

120
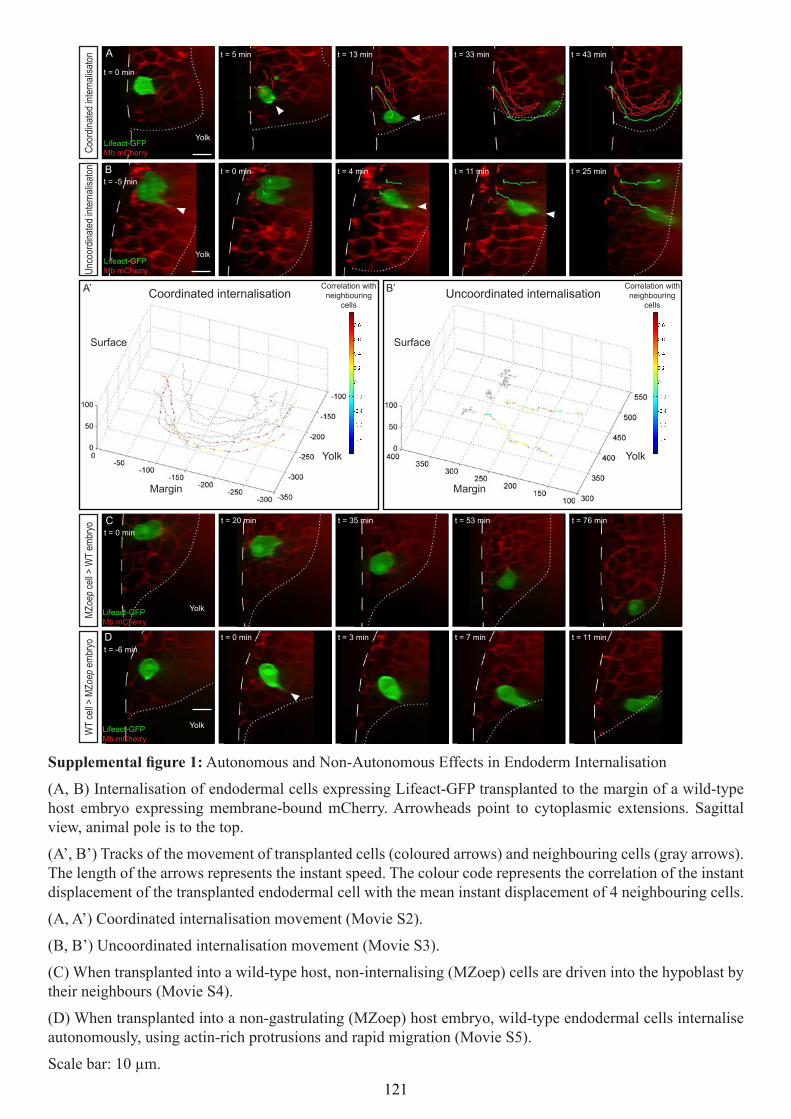
Supplemental igure 1:

122


124

Supplemental igure 3: Rac1 Inhibition Speciically Impairs Endoderm Internalisation
(A-C) Control endodermal cells were transplanted just beneath the EVL (A) and dnRac1 expressing endodermal cells were transplanted just beneath the EVL (B) or close to the YSL (C). Both control cells and dnRac1 expressing cells transplanted close to the YSL contribute to endodermal derivatives at 24 hpf (A, C). In contrast, endodermal cells expressing dnRac1 transplanted just beneath the EVL (B) are found in ectodermal derivatives.
(D) Distribution of embryos with transplanted cells in endodermal derivatives at 24 hpf.
* : p-value < 0.05
*** : p-value < 0.001
Supplemental igure 4: Ectodermal Cells Are Protrusive and Polarised
(A) Position of cell transplantation just beneath the EVL, at the animal pole of the embryo.
Ectodermal cells, expressing Lifeact-GFP, emit large cytoplasmic extensions (B), oriented towards the YSL (C), of the same length (D) and at the same frequency (E) as endodermal cells.
nendo = 72 extensions, necto = 71 extensions, pangle endo/ecto = 0.97.
Scale bar: 10 µm.
ns: non-signiicant (p-value > 0.05)

126

Supplemental igure 5:
ns: non-signiicant (p-value > 0.05)

128

Supplemental igure 6:

130

DISCUSSION
131

132

133

Our high resolution in vivo time-lapse imaging and functional approaches have revealed
unexpected cell behaviours and properties, and led us to propose an original model of the germ-
layer formation in two steps (Figure 21). Before the onset of gastrulation, cells, regardless of
their identity, are polarised and emit Rac1-dependent actin-rich protrusions to the YSL,
sometimes reaching its surface (Figure 21A). At the onset of gastrulation, endodermal cells
specifically express N-cadherin in response to Nodal signalling. This triggers their active
migration away from their neighbours to the surface of the YSL, ensuring their internalisation
(Figure 21B). I will here discuss several points raised by this new internalisation model.
Work at the Animal Pole
Ectopic Transplantation of Nodal-Activated Cells
Most of the analysis of endodermal cell internalisation has been performed by transplanting
Nodal-activated cells to the animal pole, while endogenous endoderm internalisation takes
place at the margin of the embryo. This raises two major questions: do Nodal-activated cells
behave like endogenous endodermal cells, and do endoderm-committed cells have the same
behaviour when transplanted ectopically?
Endogenous endoderm-committed cells transplanted to the animal pole of the embryo
internalise and take part to endodermal derivatives as do Nodal-activated cells (David and Rosa,
2001). Moreover, once internalised, Nodal-activated cells migrate by random walk on the
surface of the YSL, as do endogenous endodermal cells (Pézeron et al., 2008). It thus seems
that Nodal-activated cells behave like endogenous endodermal cells.
Regarding the ectopic transplantation of endoderm-committed cells, I have shown that
Nodal-activated cells emit actin-rich cytoplasmic extensions towards the YSL and translocate
to its surface when they are transplanted either ectopically to the animal pole or to their
homotypic position at the margin of the embryo, suggesting that their internalisation behaviour
does not depend upon their localisation within the embryo. There are some cases when the
transplanted endoderm-committed cell internalises in coordination to its neighbouring cells at
the margin of the embryo. It has been shown that the internalisation is a very coherent process
at the ventral margin (Keller et al., 2008). The film showing collective internalisation
movements may thus have been recorded on the ventral side of the embryo, which cannot be
determined at the beginning of the recording. In this particular situation, the movement is
135


different in that the cell turns around the margin of the embryo rather than migrating directly to
the surface of the YSL. However, at the cellular level, the same actin-rich cytoplasmic
extensions can be observed as in other cases, suggesting that, while the environment is different,
resulting in a different general movement, the individual cellular machinery would be the same.
Creation of Mosaic Embryos by Plasmid DNA Injection
An easy way to stochastically label a portion of cells in the embryo without requiring cell
transplantation is to inject plasmid DNA at the 1-cell stage (Downes et al., 2002). The injected
plasmids form aggregates that are randomly and unequally segregated in cells during cell
division. This leads to the expression of the plasmid in a random subset of cells. Cells
expressing the injected plasmid tend to form clusters, and the probability of finding embryos
containing few isolated expressing cells at the very margin of the embryo is quite low.
Furthermore, use of plasmid DNA offers very limited control over the expression level of the
injected construct. However, this technique represents a very fast, easy and non-invasive
method for generating mosaic embryos.
I am currently using this technique and have thus observed endogenous cells at the very
margin of the embryo extending actin-rich protrusions towards the YSL and migrating to its
surface (Figure 22). The marginal-most rows of cells consist of a mix of mesodermal and
endodermal progenitors (Warga and Nüsslein-Volhard, 1999). Although the endodermal
identity of the imaged cells cannot be assessed, these very recent observations corroborate the
results obtained with transplanted endoderm-committed cells.
Relevance of a Passive Cell Sorting for the Formation of Germ-layers
Cell Sorting and Germ-layer Formation: a Long- asting Idea
Ever since Townes and Holtfreter’s re-aggregation observations and Steinberg’s liquid
analogy, the idea that germ-layer segregation relies on differential adhesion cell sorting has
been widely adopted. This hypothesis has received until recently many in vitro confirmations.
In particular, zebrafish germ-layer progenitors indeed display different cortical tension
properties according to their type, and are segregated in vitro. The authors propose that these
differences would be responsible for the germ-layer formation in the embryo (Krieg et al.,
2008). The authors, however, did not assess the correct segregation of germ-layers in the
137

138

embryo upon modification of cell-cortex tension. Due to the absence of good live imaging of
cell internalisation, the relevance of such a passive cell sorting in the formation of germ-layers
in the embryo had not yet been assessed.
Direct Observations and Functional Analyses Challenging This Model
My direct observations of endodermal cell internalisation provide a set of arguments
against the classical model for germ-layer separation.
Endodermal cells emit actin-rich cytoplasmic extensions oriented towards the YSL, in the
direction of movement, and rapidly translocate to the surface of the YSL, which is evocative of
an active migration rather than a progressive segregation of cells that is a much slower process.
The requirement of Rac1, which is known to be involved in active cell migration based on the
formation of actin-rich cytoplasmic extensions, and its effector Arp2/3 for endodermal cell
internalisation reinforced the hypothesis of an active migration.
While adhesion is mostly mediated by E-cadherin during gastrulation (Krieg et al., 2008),
endodermal cell internalisation does not rely on differential E-cadherin levels. Finally, I have
directly tested the relevance of cell sorting for germ-layer formation by transplanting
endodermal cells into an endodermal area. In a cell sorting context, these cells would be
expected to remain at their transplantation position, as do ectodermal cells transplanted into
ectodermal cells. However, a good proportion of transplanted endodermal cells still internalised
when surrounded by cells of the same identity. These direct observations demonstrated that
adhesion-based cell sorting is not sufficient to account for germ-layer segregation in the
embryo, and that endodermal internalisation indeed likely results from an active migration
rather than a passive cell sorting. These results are consistent with studies performed in
Xenopus, showing that differential adhesion leads to cell sorting in vitro but not in vivo
(Ninomiya et al., 2012).
I have shown that N-cadherin is required for endodermal cell internalisation, and triggers
ectodermal cell internalisation. It is thus possible that N-cadherin expression induces cell
sorting based on differential adhesion. To test this, I will over-express a truncated form of N-
cadherin lacking the cytoplasmic domain in ectodermal cells. It has indeed been shown that the
cytoplasmic domain is required for cell adhesion (Maître et al., 2012), while the extracellular
domain of N-cadherin alone can induce cell motility in some systems, as discussed below.
139

140

Role for Cell Sorting in the Maintenance of Germ-layer Boundaries?
Computational simulations have demonstrated that directed migration led to correct but
unstable sorting, whereas differential adhesion resulted in low fraction of correct sorting which
were very stable. The most efficient way for establishing a boundary would thus be to segregate
cell populations through directed cell migration and then maintain the segregation by
differential adhesion (Tan and Chiam, 2014). It is thus possible that differential adhesion would
be involved in the maintenance of germ-layer separation, once they have been segregated
through active migration.
Polarisation of Cells
One of the surprising observations of my PhD was that not only endodermal cells, but also
ectodermal cells are polarised and emit cytoplasmic extensions towards the YSL. In the case of
endodermal cell internalisation, we hypothesise that this polarisation allows endodermal cells
to emit cytoplasmic extensions to the YSL and thus identify it as a region devoid of
neighbouring cells. The signal inducing cell polarisation in the embryo is still unknown.
Origin of the Polarising Signal
Preliminary results suggest that cells lose their polarity in blastoderm explants. Indeed,
while transplanted endodermal cells located close to the surface emit cytoplasmic extensions
towards the outside and migrate out of the explant, cells located at more than one cell-diameter
(35 µm) from the surface seem to emit extensions in a randomised manner and in most cases
do not migrate out of the explant. I have described a case when a cell located at some distance
from the surface emits cytoplasmic extensions without any preferred direction, until an
extension reaches a gap towards the outside. The cell then emits cytoplasmic extensions towards
this area and the cell migrates out of the explant (Movie S10). These results suggest that cells
are not polarised in the explant, unless they contact the outside. In blastoderm explants, the YSL
is lost, as well as the EVL and the general geometry of the embryo. These features could thus
polarise the cells within the embryo.
As cells emit cytoplasmic extensions towards the YSL, this extra-embryonic layer appears
as the most likely source of a polarising signal. To test the role of the YSL in cell polarisation,
cells can be transplanted to the animal pole of embryos injected with RNAse in the YSL, imaged
and analysed for the orientation of cytoplasmic extensions. I have observed during my PhD that
141

142

endodermal cells transplanted to the animal pole of such injected embryos internalise as in
control embryos. According to our internalisation model (Figure 21), cell polarisation would be
required for endodermal cells to emit cytoplasmic extensions to the YSL as a pre-requisite for
their migration. Although I did not perform live imaging on cells transplanted in embryos
injected with RNAse in the YSL, endodermal cells internalising in these embryos suggests that
the polarity is maintained and thus that the polarising signal would not come from the YSL, or
that it would be provided by stable proteins produced before RNA depletion.
Another possible source for the polarising signal is the EVL surrounding the embryo. EVL
formation is dependent on interferon regulatory factor (Irf) 6. Using a dominant negative
construct of this factor, it is possible to inhibit the formation of the EVL in the embryo (Sabel
et al., 2009). Manipulation of such injected embryos is tricky as the EVL plays a crucial role in
maintaining the shape of the embryo, and embryos injected with dominant negative irf6 thus
tend to collapse at the 50% epiboly stage. To avoid this, I have transplanted endodermal cells
to the animal pole of embryos deficient for Irf6 and engulfed them into an agarose gel to
artificially maintain the shape of the embryos, which prevented them from falling out.
Endodermal cells transplanted in embryos injected with dominant negative irf6 were
internalised at the end of gastrulation as in control embryos. These preliminary results suggest,
based on the same assumption that polarity is a prerequisite for endodermal cell internalisation,
that the EVL does not play a crucial role in cell polarisation. However, I have not been able to
demonstrate the complete absence of an EVL in embryos injected with dominant negative irf6.
It is thus not possible at this stage to completely rule out a role for the EVL in polarising cells
in the embryo.
As a third hypothesis for the origin of the polarising signal, the mechanical tensions
naturally present in a spherical embryo could be a good candidate. To test this, I have designed
an experimental setup to modify the tensions in the embryo: an embryo is mounted between a
slide and a large coverslip separated by small coverslips that act as spacers. This setup allows
to gently squeeze the embryo and thus modify its curvature during gastrulation. Note worthily,
an embryo submitted to such tensions for three hours and then freed from these mechanical
constraints does not present any apparent defects at 24 hpf. This setup will allow to image
deformed embryos, analyse the protrusive behaviour of transplanted cells and thus determine
the importance of mechanical tensions for cell polarisation.
143

144

Role of Par-3
Among the best known proteins involved in cell polarity are the Par proteins that were first
identified in C. elegans for their role in early embryonic development. Par proteins assemble in
complexes that are localised asymmetrically within the cell and regulate cell polarisation in
many different contexts (Goldstein and Macara, 2007). Interestingly, Par-3 has been involved
in C. elegans gastrulation and localises at free borders in endodermal cells before their
ingression in the blastocoele (Nance and Priess, 2002).
To identify a possible role for Par-3 in polarising cells during zebrafish gastrulation, I have
first sought to analyse Par-3 subcellular localisation using a Par-3-GFP fusion protein. Signals
being very faint, I have not been able to identify any asymmetric localisation of Par-3 within
endodermal cells during their internalisation. I have then inhibited Par-3 using morpholino
injection (Moore et al., 2013) to test its potential role during zebrafish gastrulation. Par-3 down-
regulation did not impair endodermal cell internalisation, even at the animal pole, suggesting
that Par-3 is not required for the internalisation of endodermal cells. If polarisation is required
for endodermal cell internalisation, then Par-3 does not seem to be essential for cell polarisation.
Live imaging of Par-3 morphant endodermal cells and analysis of cytoplasmic extensions would
allow to confirm or infirm these preliminary conclusions.
Role of the Wnt/PCP Pathway
Using a dominant negative approach, I have shown that the Wnt/PCP pathway is involved
in the internalisation of endodermal cells. A possible role for this pathway could be to polarise
endodermal cells and orient them towards the YSL. This could explain the reduced
internalisation phenotype observed upon down-regulation of this pathway. This could be
assessed by imaging endodermal cells with dsh-DEP dominant negative construct and
analysing the orientation of cytoplasmic extensions. As ectodermal cells are polarised and
protrusive like endodermal cells, one would expect that, if the Wnt/PCP pathway is important
for the polarisation of endodermal cells, it could also play a role in the polarisation of
ectodermal cells. This can also be tested by imaging and analysing ectodermal cells expressing
dsh-DEP dominant negative construct. Alternatively, the Wnt/PCP pathway could play a role
in the polarisation of regulators of cell motility independently of the orientation of cytoplasmic
extensions.
145

146

Migration Towards a “Cell-Free” Area
Perhaps the most surprising results of my PhD were that endodermal cells internalise even
when transplanted to the animal pole of embryos injected with RNAse in the YSL, and most
strikingly endodermal cells migrate out of blastoderm explants in the complete absence of a
yolk syncytium. These results demonstrate that the migration is not guided by the YSL and
suggest that endodermal cells rather migrate out of their neighbouring cells towards an area
devoid of cells. Endodermal cells thus seem to have the ability to identify the presence of cells,
and in particular distinguish neighbouring cells from the YSL.
Role of the Eph/Ephrin Signalling Pathway
The best described cellular pathway allowing cells of different identities to repel each
other is the Eph/ephrin signalling pathway. This mechanism has been involved in the formation
of a number of embryonic boundaries, and in particular in the maintenance of the
ectoderm/mesoderm boundary in Xenopus (Rohani et al., 2011). Assessing the role of
ephrin/Eph signalling is quite tricky because of the number of ligands and receptors of this
family acting redundantly. The commonly used approach is to down-regulate some of these
ligands and receptors using multiple morpholinos injection (Cavodeassi et al., 2013; Fagotto et
al., 2013; Rohani et al., 2011), or over-express soluble receptors of a given ligand or receptor
that thus acts as a dominant negative (Cavodeassi et al., 2013; Chan et al., 2001; Cooke et al.,
2001; Oates et al., 1999).
During zebrafish gastrulation, five Eph receptors (EphB3a, EphA4a, EphA4b, EphB4a
and EphA3) and four ephrin ligands (ephrin A1a, ephrin A1b, ephrin B2a and ephrin B2b) have
been reported to be expressed. To test a possible role for ephrin/Eph signalling in germ-layer
segregation in zebrafish, I have performed both multiple morpholinos injection and dominant
negative over-expression. In addition to ephrin A1b and ephrin B2a ligands that are both
expressed in the germ ring and the shield at the beginning of gastrulation, I have chosen to
down-regulate EphA4b that is expressed ubiquitously and is thought to interact with both
ephrin A and ephrin B ligands. The injection of three morpholinos designed against these
ligands and receptor did not impair the internalisation of isolated endodermal cells at the animal
pole of the embryo. As a complementary approach, I have over-expressed a soluble form of
ephrin B2a ligand that has been used as a dominant negative (Cooke et al., 2001), which again
did not impair endodermal cell internalisation. My first observations thus do not plead in favour
of a role for ephrin/Eph signalling in the segregation of germ-layer progenitors in zebrafish.
147

148

These results are, however, still preliminary and would need to be reproduced to draw any
definitive conclusion. It is, furthermore, possible that other Eph receptors and ephrin ligands
would be responsible for the separation of the germ-layers during gastrulation and/or
compensate for the loss of the down-regulated receptor and ligands.
Contact Inhibition of Locomotion
Another pathway known to be involved in the migration of cells away from each other is
the mechanism of contact inhibition of locomotion. This mechanism relies on N-cadherin-
mediated detection of neighbouring cells (Theveneau et al., 2010), and Wnt/PCP pathway
dependent reorientation of cell polarity, so that the cell changes its direction of migration away
from the contacted cell (Carmona-Fontaine et al., 2008). In the case of endodermal cell
migration out of their neighbouring cells and to the YSL, we reasoned that such a mechanism
could explain how cytoplasmic extensions would be inhibited in case of contact with
neighbouring cells, but maintained when they contact the YSL (or the outside of the explant in
the case of dissected blastoderm explants). Functional analyses have revealed that N-cadherin
and the Wnt/PCP pathway both play a role in the internalisation of endodermal cells, suggesting
that a mechanism like contact inhibition of locomotion could indeed be involved in the
internalisation of endodermal cells.
In the case of neural crest cells that exhibit contact inhibition of locomotion, N-cadherin
down-regulation by morpholino injection resulted in cells that were highly motile, dispersed
quicker than control cells and extended numerous cell protrusions (Theveneau et al., 2010).
This phenotype is very different from the phenotype I observed for N-cadherin morphant
endodermal cells: these cells did not exhibit any change either in their number or orientation of
cytoplasmic extensions, and the motility was reduced rather than increased. These observations
do not fit with the classical description of contact inhibition of locomotion.
In neural crest cells, N-cadherin is needed in the responding cell as well as in the migrating
cell for contact inhibition of locomotion to occur (Theveneau et al., 2010). Endodermal cells
transplanted to the animal pole of the embryo are, however, surrounded by ectodermal cells that
do not express N-cadherin and would thus be unable to induce a repulsive activity.
Altogether, these observations suggest that, although N-cadherin and the Wnt/PCP
pathway play a role in the internalisation of endodermal cells in zebrafish, they do not seem to
149
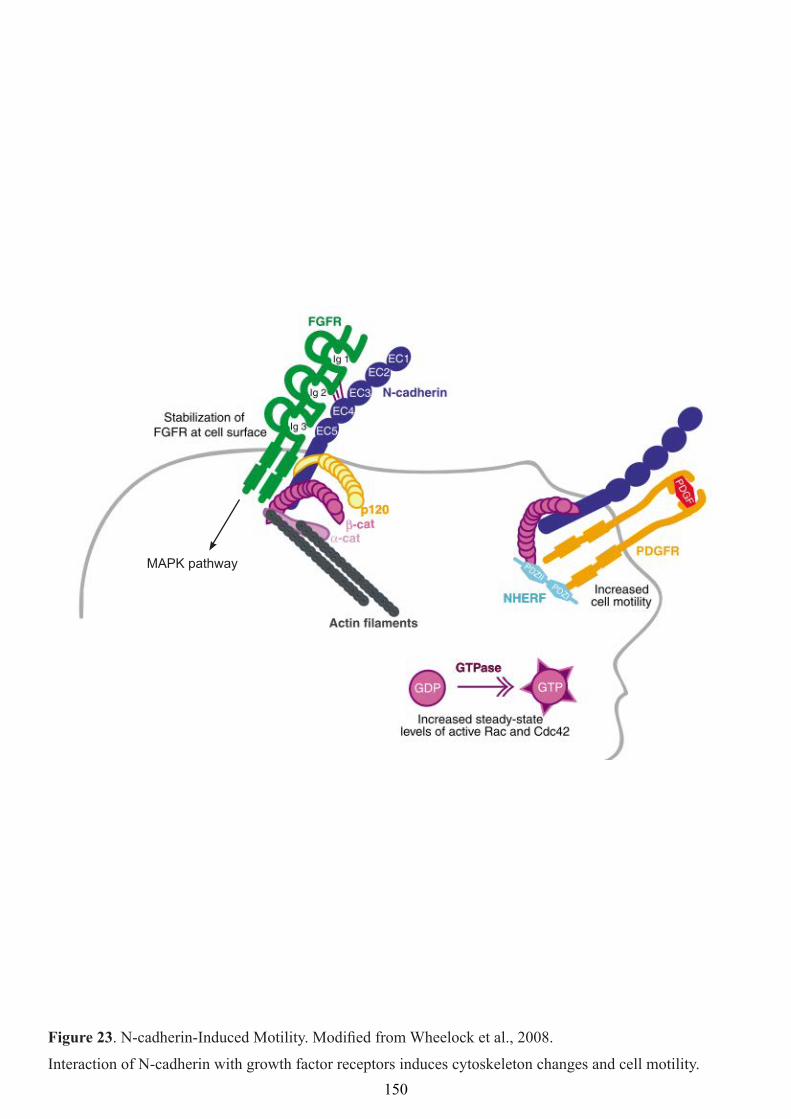
. N-cadherin-Induced Motility. Modiied from Wheelock et al., 2008.
Interaction of N-cadherin with growth factor receptors induces cytoskeleton changes and cell motility.
be part of a mechanism of contact inhibition of locomotion as it has been described so far. The
role of N-cadherin in the internalisation of endodermal cells thus still needs to be unravelled.
Role of N-cadherin in Cell Internalisation
N-cadherin Cell-autonomous Function
I have shown that N-cadherin is necessary for the internalisation of endodermal cells and
sufficient to trigger the internalisation of naïve ectodermal cells, even at the animal pole, where
neighbouring ectodermal cells do not express N-cadherin. N-cadherin could form a hetero-
duplex with E-cadherin present at the membrane of neighbouring cells (Volk et al., 1987).
However, down-regulation of E-cadherin in neighbouring ectodermal cells does not affect the
internalisation of endodermal cells, which argues against such hetero-duplexes.
Alternatively, N-cadherin may induce endodermal cell motility autonomously. It has
indeed been shown that N-cadherin up-regulation promotes motility and invasion in cancer cells
(Hazan et al., 2000; Nieman et al., 1999). Fine dissection of N-cadherin structural domains have
revealed that the 4th extracellular domain (EC4) of N-cadherin is necessary and sufficient to
promote the invasive behaviour of breast epithelial cells, independently of cell-cell adhesion
(Kim et al., 2000).
The pro-migratory role of N-cadherin has been shown to be exacerbated by FGF ligands,
which suggested a functional interaction between N-cadherin and FGF receptor (FGFR), and
in particular FGFR-1, to induce invasive properties (Hazan et al., 2000). This functional
cooperativeness was postulated to involve N-cadherin EC4 domain, based on the inhibitory
effect of peptides derived from this domain (Williams et al., 2001). It was then shown that N-
cadherin associates with the extracellular first two Ig-like domains of FGFR-1. As a
consequence of this interaction, FGFR-1 is not efficiently internalised by FGF-2, causing
sustained cell surface expression of FGFR-1, leading to persistent MAPK activation, MMP-9
expression, and tumour cell invasion (Figure 23; Suyama et al., 2002).
N-cadherin expression could thus cell-autonomously induce cell motility in the zebrafish
embryo, and trigger endodermal cell internalisation. Note worthily, FGFR-1 is expressed
ubiquitously during gastrulation (Rohner et al., 2009), and MAPK activity has been detected at
the margin of the embryo at the onset of gastrulation (Poulain et al., 2006). Furthermore, FGFR-
151

152

1 is required for mesoderm internalisation in Xenopus (Amaya et al., 1991), chick (Hardy et al.,
2011) and mouse (Ciruna et al., 1997). FGFR-1 is therefore a good candidate that could interact
with N-cadherin to trigger endodermal cell migration during zebrafish gastrulation.
Investigating a potential role for FGFR in endodermal internalisation in zebrafish will, however,
prove difficult because of the role of the FGF/MAPK pathway in mesodermal and endodermal
fate determination during gastrulation: FGF signals have been shown to antagonise Nodal
factors and inhibit Casanova, which reduces the number of endodermal progenitors during
gastrulation (Poulain et al., 2006).
N-cadherin may also interact with other receptor tyrosine kinases. For instance, the protein
NHERF links N-cadherin to the platelet-derived growth factor (PDGF) receptor, and this
complex localises to the leading edge of migrating tumour cells, where it promotes motility
(Figure 23; Theisen et al., 2007).
Subcellular Localisation of N-cadherin in Migrating Cells
To assess the subcellular localisation of N-cadherin I have analysed embryos from a line
provided by Céline Revenu, expressing an N-cadherin-GFP fusion protein under the control of
N-cadherin regulatory sequences in an N-cadherin mutant (pac-/-) background (Revenu et al.,
2014). These embryos did not exhibit any GFP signal before the end of gastrulation, which is
consistent with the expression pattern of N-cadherin that is first expressed at the onset of
gastrulation, and the duration of GFP folding. I have thus tried to detect N-cadherin in fixed
samples by immunohistochemistry. Unfortunately, the antibody did not detect the protein.
Finally, I have over-expressed an N-cadherin-mCherry fusion protein by RNA injection in order
to have an earlier expression of the fusion protein. Although the signals were rather faint, I have
been able to detect N-cadherin-mCherry at the cell membrane. I have not observed any
asymmetry in the localisation of the protein, which could be due to the over-expression strategy.
Note worthily, in the case of neural crest cell contact inhibition of locomotion, N-cadherin has
been shown to be expressed at the cell membrane, but the authors did not detect any enrichment
either at cell-cell contacts or at the leading edge of the cell (Theveneau et al., 2010).
Lack of Gastrulation Defects in N-cadherin Parachute Mutants
Parachute (pac) mutants were identified during the “big screen” initiated by Christiane
Nüsslein-Volhard in Tübingen (Nüsslein-volhard, 2012), and described for their defects in brain
morphogenesis (Jiang et al., 1996). Mutant embryos are first recognisable at the eight-somite
153

154

stage (13 hpf) when the hindbrain appears mushroom shaped rather than oval. By 24 hpf, the
midbrain and hindbrain are disorganised, with no morphologically distinct midbrain-hindbrain
boundary and an enlarged fourth ventricle extending into the midbrain. In the tail, the caudal-
most part of the dorsal fin is reduced, less erect and often split along the midline. Further
analysis of this mutant line demonstrated that pac encodes N-cadherin and is a null mutation
(Lele et al., 2002).
While I have demonstrated that N-cadherin is required for the cell-autonomous
internalisation of endodermal cells, no gastrulation defect has been identified in pac mutants.
One possibility would be that N-cadherin morpholino induces non-specific defects that would
prevent endodermal cell migration. The rescue experiments realised by co-injection of N-
cadherin RNA along with N-cadherin morpholino do not corroborate this hypothesis.
Furthermore, the morpholino we used has been previously validated (Lele et al., 2002) and
phenocopies pac mutants at later stages.
Alternatively, the lack of internalisation defects in pac mutants could be explained by
redundancy effects in the embryo. In particular, during gastrulation, endoderm internalisation
is followed by the massive internalisation of mesodermal cells. This collective internalisation
process is sufficient to drive a non-ingressing cell into the hypoblast (Carmany-Rampey and
Schier, 2001). Furthermore, no mutant has yet been identified for which cell internalisation is
affected independently of their identity. I have shown here that the internalisation rate at the
animal pole is roughly reduced by 40% when N-cadherin is down-regulated, compared to
control endodermal cells. At the margin of the embryo, endodermal cells deficient for N-
cadherin could for instance be driven in the hypoblast by internalising mesodermal cells, which
would explain why no gastrulation defects are detected in pac mutant embryos.
Conservation of N-cadherin and Reinterpretation of EMT During Gastrulation
Very interestingly, N-cadherin is turned on at the onset of gastrulation in cells that will
internalise not only in zebrafish, but also in chick (Hatta and Takeichi, 1986), mouse (Viotti et
al., 2014) and Drosophila (Oda et al., 1998). This up-regulation is accompanied by a down-
regulation of E-cadherin, in a so-called cadherin switch, one of the hallmarks of EMT. In fish,
it had been shown (Krieg et al., 2008; Montero et al., 2005), and we confirmed, that E-cadherin
is not down-regulated in internalising cells, suggesting that the internalisation mechanism may
be specific to fish. However, it was recently shown in fly that, even though E-cadherin is down-
155

156

regulated during cell internalisation, this down-regulation is not required for internalisation
(Schäfer et al., 2014). Similarly in chick, it has been established that FGF signalling can
modulate internalisation without affecting E-cadherin levels (Hardy et al., 2011), and more
generally, it has been demonstrated in different EMT systems that cell migration can be induced
by N-cadherin expression, without loss of E-cadherin (Huang et al., 2016; Nieman et al., 1999;
Wheelock et al., 2008).
N-cadherin induced motility can therefore be functionally separated from E-cadherin
down-regulation, and should be regarded as one of several distinct steps leading to EMT
(Nakaya and Sheng, 2009; Scarpa et al., 2015). During gastrulation, N-cadherin up-regulation
could thus be a conserved process, required to induce cell motility in internalising cells,
allowing these cells to migrate from the epiblast to the hypoblast. In some species this is
accompanied by a loss of E-cadherin expression, probably depending on the degree of
epithelisation of the epiblast at the onset of gastrulation. This hypothesis fits with the previously
proposed idea that gastrulation processes may be largely conserved between species, but vary
in the degree and timing of EMT (Solnica-Krezel and Sepich, 2012).
Conclusion
Previous results of the lab, showing that Nodal signalling is sufficient to induce
endodermal cell internalisation even at the animal pole of the embryo (David and Rosa, 2001),
opened wide possibilities for the analysis of endodermal cell internalisation in an environment
free of non-autonomous effects. While imaging techniques were not good enough at this stage
to use this powerful tool, the development of rapid confocal microscopes and the acquisition of
a performant spinning disc microscope by the IBENS imaging platform just before my masters
internship have allowed me to launch this promising method and provide the first high
resolution live images of cell internalisation in vertebrate gastrulation. This original simplified
gastrulation model has allowed me to address the question of germ-layer segregation in vivo by
focusing on endodermal cell internalisation. In addition to providing a new model for
endodermal layer formation, live observations and functional analyses lead to a new
interpretation of the role of N-cadherin during gastrulation and suggest that its pro-migratory
role could be conserved across species during evolution.
157

158

During zebrafish gastrulation, endoderm internalisation is quickly followed by mesoderm
internalisation. It would be very interesting to compare the internalising behaviour of
endodermal and mesodermal cells. Mesodermal cells have been shown to bleb while
transitioning from the epiblast to the hypoblast (Row et al., 2011), suggesting that their
internalisation mechanism is very different from the actin-polymerisation-based migration I
have described for endodermal cells. Like endoderm-committed cells, mesoderm-committed
cells internalise when transplanted to the animal pole of the embryo (Ho and Kimmel, 1993); it
could thus be possible to use the same kind of simplified gastrulation model as I have used
during my PhD, and transplant mesoderm-committed cells to the animal pole of a host embryo
to decipher the cellular basis of mesoderm internalisation. This would allow to provide a
complete model for germ-layer formation.
159

160

BIBLIOGRAPHIC REFERENCES
161

162

Abercrombie, M. and Heaysman, J. E. M. (1953). Observations on the social behaviour of
cells in tissue culture. I. Speed of movement of chick heart fibroblasts in relation to their
mutual contacts. Exp. Cell Res. 5, 111–131.
Abercrombie, M. and Heaysman, J. E. M. (1954). Observations on the social behaviour of
cells in tissue culture. II. Monolayering of fibroblasts. Exp. Cell Res. 6, 293–306.
Agassiz, A. and Whitman, C. O. (1884). On the Development of Some Pelagic Fish Eggs.
Proc. Am. Acad. Arts Sci. 20, 23–75.
Amaya, E., Musci, T. J. and Kirschner, M. W. (1991). Expression of a dominant negative
mutant of the FGF receptor disrupts mesoderm formation in xenopus embryos. Cell 66,
257–270.
Aoki, T. O., David, N. B., Minchiotti, G., Saint-Etienne, L., Dickmeis, T., Persico, G. M., Strähle, U., Mourrain, P. and Rosa, F. M. (2002). Molecular integration of casanova
in the Nodal signalling pathway controlling endoderm formation. Development 129,
275–86.
Behrndt, M., Roensch, J., Grill, S. W. and Heisenberg, C. (2013). Forces Driving
Epithelial Spreading in Zebrafish Gastrulation. Science 257, 10–14.
Bellairs, R. (1986). The primitive streak. Anat. Embryol. (Berl). 174, 1–14.
Betchaku, T. and Trinkaus, J. P. (1978). Contact relations, surface activity, and cortical
microfilaments of marginal cells of the enveloping layer and of the yolk syncytial and
yolk cytoplasmic layers of Fundulus before and during epiboly. J. Exp. Zool. 206, 381–
426.
Betchaku, T. and Trinkaus, J. P. (1986). Programmed endocytosis during epiboly of
Fundulus heteroclitus. Integr. Comp. Biol. 26, 193–199.
Bjornson, C. R. R., Griffin, K. J. P., Farr III, G. H., Terashima, A., Himeda, C., Kikuchi, Y. and Kimelman, D. (2005). Eomesodermin Is a Localized Maternal
Determinant Required for Endoderm Induction in Zebrafish. Dev. Cell 9, 523–533.
Brasch, J., Harrison, O. J., Honig, B. H. and Shapiro, L. (2012). Thinking outside the cell:
How cadherins drive adhesion. Trends Cell Biol. 22, 299–310.
Bray, D. and White, J. G. (1988). Cortical Flow in Animal Cells. Science 282, 883–888.
Brodland, G. W. (2002). The Differential Interfacial Tension Hypothesis (DITH): a
comprehensive theory for the self-rearrangement of embryonic cells and tissues. J. Biomech. Eng. 124, 188–197.
Campellone, K. G. and Welch, M. D. (2010). A nucleator arms race: cellular control of actin
assembly. Nat. Rev. Mol. Cell Biol. 11, 237–51.
Carmany-Rampey, A. and Schier, A. F. (2001). Single-cell internalization during zebrafish
gastrulation. Curr. Biol. 11, 1261–5.
Carmona-Fontaine, C., Matthews, H. K., Kuriyama, S., Moreno, M., Dunn, G. a, Parsons, M., Stern, C. D. and Mayor, R. (2008). Contact inhibition of locomotion in
vivo controls neural crest directional migration. Nature 456, 957–61.
Carmona-Fontaine, C., Theveneau, É., Tzekou, A., Tada, M., Woods, M., Page, K. M., Parsons, M., Lambris, J. D. and Mayor, R. (2011). Complement Fragment C3a
Controls Mutual Cell Attraction during Collective Cell Migration. Dev. Cell 21, 1026–
1037.
Cavodeassi, F., Ivanovitch, K. and Wilson, S. W. (2013). Eph/Ephrin signalling maintains
163

164

eye field segregation from adjacent neural plate territories during forebrain
morphogenesis. Development 140, 4193–202.
Chan, J., Mably, J. D., Serluca, F. C., Chen, J. N., Goldstein, N. B., Thomas, M. C., Cleary, J. a, Brennan, C., Fishman, M. C. and Roberts, T. M. (2001). Morphogenesis
of prechordal plate and notochord requires intact Eph/ephrin B signaling. Dev. Biol. 234,
470–82.
Charras, G. and Paluch, E. K. (2008). Blebs lead the way: how to migrate without
lamellipodia. Nat. Rev. Mol. Cell Biol. 9, 730–736.
Chen, W.-T. (1981). Mechanism of the trailing edge during fibroblast movement. J.Cell Biol. 90, 187–200.
Cheng, J. C., Miller, A. L. and Webb, S. E. (2004). Organization and function of
microfilaments during late epiboly in zebrafish embryos. Dev. Dyn. 231, 313–323.
Ciruna, B. G., Schwartz, L., Harpal, K., Yamaguchi, T. P. and Rossant, J. (1997).
Chimeric analysis of fibroblast growth factor receptor-1 (Fgfr1) function: a role for
FGFR1 in morphogenetic movement through the primitive streak. Development 124,
2829–41.
Concha, M. L. and Adams, R. J. (1998). Oriented cell divisions and cellular morphogenesis
in the zebrafish gastrula and neurula: a time-lapse analysis. Development 125, 983–94.
Cooke, J. E., Moens, C. B., Roth, L., Durbin, L., Shiomi, K., Brennan, C., Kimmel, C. B., Wilson, S. W. and Holder, N. (2001). Eph signalling functions downstream of Val to
regulate cell sorting and boundary formation in the caudal hindbrain. Development 128,
571–80.
Dale, L. and Slack, J. M. (1987). Fate map for the 32-cell stage of Xenopus laevis.
Development 99, 527–51.
Dang, I., Gorelik, R., Sousa-Blin, C., Derivery, E., Guérin, C., Linkner, J., Nemethova, M., Dumortier, J. G., Giger, F. A., Chipysheva, T. a., et al. (2013). Inhibitory
signalling to the Arp2/3 complex steers cell migration. Nature.
David, N. B. and Rosa, F. M. (2001). Cell autonomous commitment to an endodermal fate
and behaviour by activation of Nodal signalling. Development 128, 3937–47.
Derivery, E. and Gautreau, A. (2010). Generation of branched actin networks: Assembly
and regulation of the N-WASP and WAVE molecular machines. BioEssays 32, 119–131.
Dickmeis, T., Mourrain, P., Saint-Etienne, L., Fischer, N., Aanstad, P., Clark, M., Strähle, U. and Rosa, F. M. (2001). A crucial component of the endoderm formation
pathway, CASANOVA, is encoded by a novel sox-related gene. Genes Dev. 15, 1487–
1492.
Downes, G. B., Waterbury, J. A. and Granato, M. (2002). Rapid in vivo labeling of
identified zebrafish neurons. Genesis 34, 196–202.
Dumortier, J. G., Martin, S., Meyer, D., Rosa, F. M. and David, N. B. (2012). Collective
mesendoderm migration relies on an intrinsic directionality signal transmitted through
cell contacts. Proc. Natl. Acad. Sci. 1–6.
Dupin, E. and Le Douarin, N. M. (2014). The neural crest, A multifaceted structure of the
vertebrates. Birth Defects Res. Part C Embryo Today Rev. 102, 187–209.
Durbin, L., Brennan, C., Shiomi, K., Cooke, J. E., Barrios, A., Shanmugalingam, S., Guthrie, B., Lindberg, R. and Holder, N. (1998). Eph signaling is required for
165

166

segmentation and differentiation of the somites. Genes Dev. 12, 3096–3109.
Edelman, G. M., Gallin, W. J., Delouvée, A., Cunningham, B. A. and Thiery, J. P. (1983). Early epochal maps of two different cell adhesion molecules. Proc. Natl. Acad. Sci. 80, 4384–8.
Enyedi, B. and Niethammer, P. (2015). Mechanisms of epithelial wound detection. Trends Cell Biol. 25, 1–10.
Etienne-Manneville, S. and Hall, A. (2002). Cell polarity: Par6, aPKC and cytoskeletal
crosstalk. Curr. Opin. Cell Biol. 15, 67–72.
Fagotto, F. (2014). The cellular basis of tissue separation. Development 141, 3303–3318.
Fagotto, F. (2015). Regulation of Cell Adhesion and Cell Sorting at Embryonic Boundaries.
Curr. Top. Dev. Biol. 112,.
Fagotto, F., Rohani, N., Touret, A.-S. and Li, R. (2013). A Molecular Base for Cell Sorting
at Embryonic Boundaries: Contact Inhibition of Cadherin Adhesion by Ephrin/Eph-
Dependent Contractility. Dev. Cell 1–16.
Fagotto, F., Winklbauer, R. and Rohani, N. (2014). Ephrin-Eph signaling in embryonic
tissue separation. Cell Adh. Migr. 8, 308–326.
Feldman, B., Gates, M. A., Egan, E. S., Dougan, S. T., Rennebeck, G., Sirotkin, H. I., Schier, A. F. and Talbot, W. S. (1998). Zebrafish organizer development and germ-
layer formation require nodal-related signals. Nature 395, 181–185.
Foty, R. A. and Steinberg, M. S. (2005). The differential adhesion hypothesis: A direct
evaluation. Dev. Biol. 278, 255–263.
Foty, R. A. and Steinberg, M. S. (2013). Differential adhesion in model systems. Wiley Interdiscip. Rev. Dev. Biol. 2, 631–45.
Foty, R. a, Pfleger, C. M., Forgacs, G. and Steinberg, M. S. (1996). Surface tensions of
embryonic tissues predict their mutual envelopment behavior. Development 122, 1611–
20.
Garcia-Mata, R. and Burridge, K. (2007). Catching a GEF by its tail. Trends Cell Biol. 17,
36–43.
Giger, F. A., Dumortier, J. G. and David, N. B. (2016). Analyzing In Vivo Cell Migration
using Cell Transplantations and Time-lapse Imaging in Zebrafish Embryos. J. Vis. Exp
53792, 1–10.
Gilardi-Hebenstreit, P., Nieto, M. A., Frain, M., Mattéi, M.-G., Chestier, A., Wilkinson, D. G. and Charnay, P. (1992). An Eph-related receptor protein tyrosine kinase gene
segmentally expressed in the developing mouse hindbrain. Oncogene.
Glickman, N. S., Kimmel, C. B., Jones, M. a and Adams, R. J. (2003). Shaping the
zebrafish notochord. Development 130, 873–887.
Goldstein, B. and Macara, I. G. (2007). The PAR Proteins: Fundamental Players in Animal
Cell Polarization. Dev. Cell 13, 609–622.
Gräper, L. (1929). Die Primitiventwicklung des Hühnchens nach stereokinematographischen
Untersuchungen, kontrolliert durch vitale Farbmarkierung und verglichen mit der
Entwicklung anderer Wirbeltiere. Wilhelm Roux. Arch. Entwickl. Mech. Org. 116, 382–
429.
Grapin-Botton, A. and Constam, D. (2007). Evolution of the mechanisms and molecular
control of endoderm formation. Mech. Dev. 124, 253–78.
167

168

Gritsman, K., Zhang, J., Cheng, S., Heckscher, E., Talbot, W. S. and Schier, A. F. (1999). The EGF-CFC protein one-eyed pinhead is essential for nodal signaling. Cell 97,
121–32.
Grunwald, D. J. and Eisen, J. S. (2002). Headwaters of the zebrafish — emergence of a new
model vertebrate. Nat. Rev. 3,.
Gustafson, T. and Kinnander, H. (1956). Microaquaria for time-lapse cinematographic
studies of morphogenesis in swimming larvae and observations on sea urchin
gastrulation. Exp. Cell Res. 11, 36–51.
Hardin, J. and Keller, R. E. (1988). The behaviour and function of bottle cells during
gastrulation of Xenopus laevis. 230, 211–230.
Hardy, K. M., Yatskievych, T. a, Konieczka, J., Bobbs, A. S. and Antin, P. B. (2011).
FGF signalling through RAS/MAPK and PI3K pathways regulates cell movement and
gene expression in the chicken primitive streak without affecting E-cadherin expression.
BMC Dev. Biol. 11, 20.
Harris, A. K. (1976). Is cell sorting caused by differences in the work of intercellular
adhesion? A critique of the steinberg hypothesis. J. Theor. Biol. 61, 267–285.
Hatta, K. and Takeichi, M. (1986). Expression of N-cadherin adhesion molecules associated
with early morphogenetic events in chick development. Nature 320, 447–449.
Hazan, R. B., Phillips, G. R., Qiao, R. F., Norton, L. and Aaronson, S. a (2000).
Exogenous expression of N-cadherin in breast cancer cells induces cell migration,
invasion, and metastasis. J. Cell Biol. 148, 779–790.
Hisaoka, K. K. and Battle, H. I. (1958). The normal developmental stages of the zebrafish,
Brachydanio rerio (Hamilton-Buchanan). J. Morphol. 102, 311–327.
Ho, R. K. and Kimmel, C. B. (1993). Commitment of cell fate in the early zebrafish embryo.
Science 261, 109–11.
Huang, C., Kratzer, M.-C., Wedlich, D. and Kashef, J. (2016). E-cadherin is required for
cranial neural crest migration in Xenopus laevis. Dev. Biol.
Ip, Y. T., Maggert, K. and Levine, M. (1994). Uncoupling gastrulation and mesoderm
differentiation in the Drosophila embryo. EMBO J. 13, 5826–34.
Jiang, Y.-J., Brand, M., Heisenberg, C.-P., Beuchle, D., Furutani-Seiki, M., Kelsh, R. N., Warga, R. M., Granato, M., Haffter, P., Hammerschmidt, M., et al. (1996).
Mutations affecting neurogenesis and brain morphology in the zebrafish, Danio rerio.
Development 123, 205–216.
Joaquin, D., Grigola, M., Kwon, G., Blasius, C., Han, Y., Perlitz, D., Jiang, J., Ziegler, Y., Nardulli, A. and Hsia, K. (2016). Cell migration and organization in three-
dimensional in vitro culture driven by stiffness gradient. Biotechnol. Bioeng.
Kane, D. A. and Adams, R. J. (2002). Life at the edge: epiboly and involution in the
zebrafish. Results Probl. Cell Differ. 40, 117–35.
Kane, D. A., Warga, R. M. and Kimmel, C. B. (1992). Mitotic domains in the early embryo
of the zebrafish. Nature 356, 133–135.
Kane, D. A., Hammerschmidt, M., Mullins, M. C., Maischein, H. M., Brand, M., van Eeden, F. J., Furutani-Seiki, M., Granato, M., Haffter, P., Heisenberg, C.-P., et al. (1996). The zebrafish epiboly mutants. Development 123, 47–55.
Kane, D. A., McFarland, K. N. and Warga, R. M. (2005). Mutations in half baked/E-
169

170

cadherin block cell behaviors that are necessary for teleost epiboly. Development 132,
1105–16.
Katsamba, P., Carroll, K., Ahlsen, G., Bahna, F., Vendome, J., Posy, S., Rajebhosale, M., Price, S., Jessell, T. M., Ben-Shaul, A., et al. (2009). Linking molecular affinity
and cellular specificity in cadherin-mediated adhesion. Proc. Natl. Acad. Sci. U. S. A. 106, 11594–9.
Keller, R. E. and Shook, D. R. (2004). Gastrulation in Amphibians. In Gastrulation, pp.
171–203.
Keller, P. J., Schmidt, A. D., Wittbrodt, J. and Stelzer, E. H. K. (2008). Reconstruction of
zebrafish early embryonic development by scanned light sheet microscopy. Science 322,
1065–9.
Kikuchi, Y., Agathon, A., Alexander, J., Thisse, C., Waldron, S., Yelon, D., Thisse, B. and Stainier, D. Y. R. (2001). casanova encodes a novel Sox-related protein necessary
and sufficient for early endoderm formation in zebrafish. Genes Dev. 15, 1493–505.
Kim, J. B., Islam, S., Kim, Y. J., Prudoff, R. S., Sass, K. M., Wheelock, M. J. and Johnson, K. R. (2000). N-cadherin extracellular repeat 4 mediates epithelial to
mesenchymal transition and increased motility. J. Cell Biol. 151, 1193–1205.
Kimmel, C. B. and Law, R. D. (1985). Cell lineage of zebrafish blastomeres. I. Cleavage
pattern and cytoplasmic bridges between cells. Dev. Biol. 108, 78–85.
Kimmel, C. B., Warga, R. M. and Schilling, T. F. (1990). Origin and organization of the
zebrafish fate map. Development 108, 581–94.
Kimmel, C. B., Ballard, W. W., Kimmel, S. R., Ullmann, B. and Schilling, T. F. (1995).
Stages of embryonic development of the zebrafish. Dev. Dyn. 203, 253–310.
Korn, E. D., Carlier, M. F. and Pantaloni, D. (1987). Actin polymerization and ATP
hydrolysis. Science 238, 638–644.
Krieg, M., Arboleda-Estudillo, Y., Puech, P., Käfer, J., Graner, F., Müller, D. and Heisenberg, C.-P. (2008). Tensile forces govern germ-layer organization in zebrafish.
Nat. Cell Biol. 10, 429–36.
Kullander, K. and Klein, R. (2002). Mechanisms and functions of Eph and ephrin
signalling. Nat. Rev. Mol. Cell Biol. 3, 475–486.
Le Douarin, N. M. and Teillet, M. A. (1973). The migration of neural crest cells to the wall
of the digestive tract in avian embryo. J. Embryol. Exp. Morphol. 30, 31–48.
Lee, J.-Y., Marston, D. J., Walston, T., Hardin, J., Halberstadt, A. and Goldstein, B. (2006). Wnt/Frizzled Signaling Controls C. elegans Gastrulation by Activating
Actomyosin Contractility. Curr. Biol. 16, 1986–1997.
Lele, Z., Folchert, A., Concha, M. L., Rauch, G., Geisler, R., Rosa, F. M., Wilson, S. W., Hammerschmidt, M. and Bally-Cuif, L. (2002). Parachute/n-cadherin is required for
morphogenesis and maintained integrity of the zebrafish neural tube. Development 3294,
3281–3294.
Lentz, T. L. and Trinkaus, J. P. (1967). A fine structural study of cytodifferenciation during
cleavage, blastula, and gastrula stages of fundulus heteroclitus. J. Cell Biol. 32,.
Lepage, S. E. and Bruce, A. E. E. (2010). Zebrafish epiboly: mechanics and mechanisms.
Int. J. Dev. Biol. 54, 1213–28.
Leptin, M. (1999). Gastrulation in Drosophila : the logic and the cellular. EMBO J. 18, 3187–
171

172

3192.
Leptin, M. and Grunewald, B. (1990). Cell shape changes during gastrulation in Drosophila.
Development 110, 73–84.
Lunde, K., Belting, H. G. and Driever, W. (2004). Zebrafish pou5f1/pou2, Homolog of
Mammalian Oct4, Functions in the Endoderm Specification Cascade. Curr. Biol. 14, 48–
55.
Machesky, L. M., Atkinson, S. J., Ampe, C., Vandekerckhove, J. and Pollard, T. D. (1994). Purification of a Cortical Complex Containing 2 Unconventional Actins from
Acanthamoeba by Affinity-Chromatography on Profilin-Agarose. J. Cell Biol. 127, 107–
115.
Maître, J.-L., Berthoumieux, H., Krens, S. F. G., Salbreux, G., Jülicher, F., Paluch, E. K. and Heisenberg, C.-P. (2012). Adhesion functions in cell sorting by mechanically
coupling the cortices of adhering cells. Science 338, 253–6.
Mattila, P. K. and Lappalainen, P. (2008). Filopodia: molecular architecture and cellular
functions. Nat. Rev. Mol. Cell Biol. 9, 446–454.
Mayor, R. and Carmona-Fontaine, C. (2010). Keeping in touch with contact inhibition of
locomotion. Trends Cell Biol. 20, 319–28.
Mcdonald, B., Pittman, K., Menezes, G. B., Hirota, S. a, Slaba, I., Waterhouse, C. C. M., Beck, P. L., Muruve, D. a and Kubes, P. (2010). Intravascular Danger Signals Guide
Neutrophils to Sites of Sterile Inflammation. Science 330, 362–367.
Miller, J. R. and McClay, D. R. (1997). Changes in the pattern of adherens junction-
associated beta-catenin accompany morphogenesis in the sea urchin embryo. Dev Biol 192, 310–322.
Montero, J. A., Carvalho, L., Wilsch-Brauninger, M., Kilian, B., Mustafa, C. and Heisenberg, C.-P. (2005). Shield formation at the onset of zebrafish gastrulation.
Development 132, 1187–1198.
Moore, R., Theveneau, É., Pozzi, S., Alexandre, P., Richardson, J., Merks, A., Parsons, M., Kashef, J., Linker, C. and Mayor, R. (2013). Par3 controls neural crest migration
by promoting microtubule catastrophe during contact inhibition of locomotion.
Development 1–13.
Mullins, R. D., Heuser, J. a and Pollard, T. D. (1998). The interaction of Arp2/3 complex
with actin: nucleation, high affinity pointed end capping, and formation of branching
networks of filaments. Proc. Natl. Acad. Sci. 95, 6181–6.
Myers, D. C., Sepich, D. S. and Solnica-Krezel, L. (2002a). Bmp activity gradient regulates
convergent extension during zebrafish gastrulation. Dev. Biol. 243, 81–98.
Myers, D. C., Sepich, D. S. and Solnica-Krezel, L. (2002b). Convergence and extension in
vertebrate gastrulae: Cell movements according to or in search of identity? Trends Genet. 18, 447–455.
Nakaya, Y. and Sheng, G. (2009). An amicable separation Chick’s way of doing EMT. Cell Adh. Migr. 3, 160–163.
Nakaya, Y., Sukowati, E. W., Wu, Y. and Sheng, G. (2008). RhoA and microtubule
dynamics control cell-basement membrane interaction in EMT during gastrulation. Nat. Cell Biol. 10, 765–75.
Nance, J. and Priess, J. R. (2002). Cell polarity and gastrulation in C. elegans. Development
173

174

129, 387–97.
Nance, J., Lee, J.-Y. and Goldstein, B. (2005). Gastrulation in C. elegans. WormBook 1–13.
Nieman, M. T., Prudoff, R. S., Johnson, K. R. and Wheelock, M. J. (1999). N-cadherin
promotes motility in human breast cancer cells regardless of their E-cadherin expression.
J. Cell Biol. 147, 631–44.
Niessen, C. M. and Gumbiner, B. M. (2002). Cadherin-mediated cell sorting not determined
by binding or adhesion specificity. J. Cell Biol. 156, 389–399.
Ninomiya, H., David, R., Damm, E. W., Fagotto, F., Niessen, C. M. and Winklbauer, R. (2012). Cadherin-dependent differential cell adhesion in Xenopus causes cell sorting in
vitro but not in the embryo. J. Cell Sci. 125, 1877–83.
Nobes, C. D. and Hall, A. (1999). Rho GTPases control polarity, protrusion, and adhesion
during cell movement. J. Cell Biol. 144, 1235–44.
Nose, A., Nagafuchi, A. and Takeichi, M. (1988). Expressed recombinant cadherins mediate
cell sorting in model systems. Cell 54, 993–1001.
Nowotschin, S. and Hadjantonakis, A.-K. (2010). Cellular dynamics in the early mouse
embryo: from axis formation to gastrulation. Curr. Opin. Genet. Dev. 20, 420–427.
Nüsslein-volhard, C. (2012). The zebrafish issue of Development. Development 4103, 4099–
4103.
Oates, A. C., Lackmann, M., Power, M. a, Brennan, C., Down, L. M., Do, C., Evans, B., Holder, N. and Boyd, a W. (1999). An early developmental role for eph-ephrin
interaction during vertebrate gastrulation. Mech. Dev. 83, 77–94.
Oda, H., Tsukita, S. and Takeichi, M. (1998). Dynamic behavior of the cadherin-based cell-
cell adhesion system during Drosophila gastrulation. Dev. Biol. 203, 435–450.
Olivier, N., Luengo-Oroz, M. a, Duloquin, L., Faure, E., Savy, T., Veilleux, I., Solinas, X., Débarre, D., Bourgine, P., Santos, A., et al. (2010). Cell lineage reconstruction of
early zebrafish embryos using label-free nonlinear microscopy. Science 329, 967–71.
Oteíza, P., Köppen, M., Concha, M. L. and Heisenberg, C.-P. (2008). Origin and shaping
of the laterality organ in zebrafish. Development 135, 2807–13.
Petrie, R. J. and Yamada, K. M. (2016). Multiple mechanisms of 3D migration: the origins
of plasticity. Curr. Opin. Cell Biol. 42, 7–12.
Peyriéras, N., Strähle, U. and Rosa, F. M. (1998). Conversion of zebrafish blastomeres to
an endodermal fate by TGF-beta-related signaling. Curr. Biol. 8, 783–786.
Pézeron, G., Mourrain, P., Courty, S., Ghislain, J., Becker, T. S., Rosa, F. M. and David, N. B. (2008). Live analysis of endodermal layer formation identifies random walk as a
novel gastrulation movement. Curr. Biol. 18, 276–81.
Pollard, T. D. and Cooper, J. A. (2009). Actin, a central player in cell shape and movement.
Science 326, 1208–12.
Pollard, T. D., Blanchoin, L. and Mullins, R. D. (2000). Molecular mechanisms controlling
actin filament dynamics in nonmuscle cells. Annu. Rev. Biophys. Biomol. Struct. 545–76.
Ponti, A., Machacek, M., Gupton, S. L., Waterman-Storer, C. M. and Danuser, G. (2004). Two distinct actin networks drive the protrusion of migrating cells. Science 305,
1782–6.
Poulain, M., Fürthauer, M., Thisse, B., Thisse, C. and Lepage, T. (2006). Zebrafish
175

176

endoderm formation is regulated by combinatorial Nodal, FGF and BMP signalling.
Development 133, 2189–200.
Reiter, J. F., Kikuchi, Y. and Stainier, D. Y. R. (2001). Multiple roles for Gata5 in
zebrafish endoderm formation. Development 128, 125–35.
Renucci, A., Lemarchandel, V. and Rosa, F. M. (1996). An activated form of type I
serine/threonine kinase receptor TARAM-A reveals a specific signalling pathway
involved in fish head organiser formation. Development 122, 3735–43.
Revenu, C., Streichan, S., Donà, E., Lecaudey, V., Hufnagel, L. and Gilmour, D. (2014).
Quantitative cell polarity imaging defines leader-to-follower transitions during collective
migration and the key role of microtubule-dependent adherens junction formation.
Development 141, 1282–91.
Ridley, A. J. (2011). Life at the leading edge. Cell 145, 1012–22.
Ridley, A. J. and Hall, A. (1992). The small GTP-binding protein rho regulates the assembly
of focal adhesions and actin stress fibers in response to growth factors. Cell 70, 389–399.
Ridley, A. J., Schwartz, M. a, Burridge, K., Firtel, R. a, Ginsberg, M. H., Borisy, G. G., Parsons, J. T. and Horwitz, A. R. (2003). Cell migration: integrating signals from front
to back. Science 302, 1704–9.
Riento, K. and Ridley, A. J. (2003). Rocks: multifunctional kinases in cell behaviour. Nat. Rev. Mol. Cell Biol. 4, 446–56.
Rohani, N., Canty, L., Luu, O., Fagotto, F. and Winklbauer, R. (2011). EphrinB/EphB
Signaling Controls Embryonic Germ Layer Separation by Contact-Induced Cell
Detachment. PLoS Biol. 9, e1000597.
Rohner, N., Bercsényi, M., Orbán, L., Kolanczyk, M. E., Linke, D., Brand, M., Nüsslein-Volhard, C. and Harris, M. P. (2009). Duplication of fgfr1 Permits Fgf Signaling to Serve as a Target for Selection during Domestication.
Roszko, I., Sawada, A. and Solnica-Krezel, L. (2009). Regulation of convergence and
extension movements during vertebrate gastrulation by the Wnt/PCP pathway. Semin. Cell Dev. Biol. 20, 986–997.
Row, R. H., Maître, J.-L., Martin, B. L., Stockinger, P., Heisenberg, C.-P. and Kimelman, D. (2011). Completion of the epithelial to mesenchymal transition in
zebrafish mesoderm requires Spadetail. Dev. Biol. 354, 102–10.
Ruprecht, V., Wieser, S., Callan-Jones, A., Smutny, M., Morita, H., Sako, K., Barone, V., Ritsch-Marte, M., Sixt, M., Voituriez, R., et al. (2015). Cortical Contractility
Triggers a Stochastic Switch to Fast Amoeboid Cell Motility. Cell 160, 673–685.
Sabel, J. L., d’Alençon, C., O’Brien, E. K., Van Otterloo, E., Lutz, K., Cuykendall, T. N., Schutte, B. C., Houston, D. W. and Cornell, R. a (2009). Maternal Interferon
Regulatory Factor 6 is required for the differentiation of primary superficial epithelia in
Danio and Xenopus embryos. Dev. Biol. 325, 249–62.
Sakaguchi, T., Mizuno, T. and Takeda, H. (2002). Germ Layer Formation and Early
Patterning Formation and Patterning Roles of the Yolk Syncytial Layer. Results Probl. Cell Differ.
Sako, K., Pradhan, S. J., Barone, V., Inglés-Prieto, Á., Müller, P., Ruprecht, V., Čapek, D., Galande, S., Janovjak, H. and Heisenberg, C.-P. (2016). Optogenetic Control of
Nodal Signaling Reveals a Temporal Pattern of Nodal Signaling Regulating Cell Fate
Specification during Gastrulation. Cell Rep. 1–12.
177

178
Salbreux, G., Charras, G. and Paluch, E. K. (2012). Actin cortex mechanics and cellular
morphogenesis. Trends Cell Biol. 22, 536–545.
Scarpa, E., Theveneau, É., Mayor, R., Bibonne, A. and Parsons, M. (2015). Cadherin
Switch during EMT in Neural Crest Cells Leads to Contact Inhibition of Locomotion via
Repolarization of Forces. Dev. Cell 1–14.
Schäfer, G., Narasimha, M., Vogelsang, E. and Leptin, M. (2014). Cadherin switching
during the formation and differentiation of the Drosophila mesoderm - implications for
epithelial-to-mesenchymal transitions. J. Cell Sci. 127, 1511–22.
Schier, A. F. and Talbot, W. S. (2005). Molecular genetics of axis formation in zebrafish.
Annu Rev Genet 39, 561–613.
Schötz, E.-M., Burdine, R. D., Jülicher, F., Steinberg, M. S., Heisenberg, C.-P. and Foty, R. A. (2008). Quantitative differences in tissue surface tension influence zebrafish germ
layer positioning. HFSP J. 2, 42–56.
Shih, J. and Fraser, S. E. (1995). Distribution of tissue progenitors within the shield region
of the zebrafish gastrula. Development 121, 2755–65.
Solnica-Krezel, L. and Cooper, M. S. (2002). Cellular and Genetic Mechanisms of
Convergence and Extension. Results Probl. Cell Differ. 136–164.
Solnica-Krezel, L. and Driever, W. (1994). Microtubule arrays of the zebrafish yolk cell:
organization and function during epiboly. Development 120, 2443–2455.
Solnica-Krezel, L. and Sepich, D. S. (2012). Gastrulation: Making and Shaping Germ
Layers. Annu. Rev. Cell Dev. Biol. 28, 687–717.
Solnica-Krezel, L., Stemple, D. L. and Driever, W. (1995). Transparent things: cell fates
and cell movements during early embryogenesis of zebrafish. Bioessays 17, 931–939.
Spiering, D. and Hodgson, L. (2011). Dynamics of the Rho-family small GTPases in actin
regulation and motility. Cell Adh. Migr. 5, 170–180.
Steinberg, M. S. (1958). On the Chemical Bonds between Animal Cells. A Mechanism for
Type-Specific Association. Am. Nat. 92, 65–81.
Steinberg, M. S. (1962). On the Mechanism of Tissue Reconstruction By Dissociated Cells,
I. Population Kinetics, Differential Adhesiveness, and the Absence of Directed
Migration. Proc. Natl. Acad. Sci. 48, 1577–1582.
Strähle, U. and Jesuthasan, S. (1993). Ultraviolet irradiation impairs epiboly in zebrafish
embryos: evidence for a microtubule-dependent mechanism of epiboly. Development 119, 909–919.
Sulston, J. E., Schierenberg, E., White, J. G. and Thomson, J. N. (1983). The embryonic
cell lineage of the nematode Caenorhabditis elegans. Dev. Biol. 100, 64–119.
Suyama, K., Shapiro, I., Guttman, M. and Hazan, R. B. (2002). A signaling pathway
leading to metastasis is controlled by N-cadherin and the FGF receptor. Cancer Cell 2,
301–314.
Svitkina, T. M. and Borisy, G. G. (1999). Arp2/3 complex and actin depolymerizing
factor/cofilin in dendritic organization and treadmilling of actin filament array in
lamellipodia. J. Cell Biol. 145, 1009–1026.
Swaminathan, V., Fischer, R. S. and Waterman, C. M. (2016). The FAK-Arp2/3
interaction promotes leading edge advance and haptosensing by coupling nascent
adhesions to lamellipodia actin. Mol. Biol. Cell 27, mbc.E15–08–0590–.
179

180

Swaney, K. F. and Li, R. (2016). Function and regulation of the Arp2/3 complex during cell
migration in diverse environments. Curr. Opin. Cell Biol. 42, 63–72.
Swaney, K. F., Huang, C.-H. and Devreotes, P. N. (2010). Eukaryotic chemotaxis: a
network of signaling pathways controls motility, directional sensing, and polarity. Annu. Rev. Biophys. 39, 265–289.
Takeichi, M., Atsumi, T., Yoshida, C., Uno, K. and Okada, T. S. (1981). Selective
adhesion of embryonal carcinoma cells and differentiated cells by Ca2+-dependent sites.
Dev. Biol. 87, 340–350.
Tan, R. Z. and Chiam, K. H. (2014). Computational modeling reveals that a combination of
chemotaxis and differential adhesion leads to robust cell sorting during tissue patterning.
PLoS One 9,.
Theisen, C. S., Wahl, J. K., Johnson, K. R. and Wheelock, M. J. (2007). NHERF links the
N-cadherin/catenin complex to the platelet-derived growth factor receptor to modulate
the actin cytoskeleton and regulate cell motility. Mol. Biol. Cell 18, 1220–32.
Theveneau, É. and Mayor, R. (2011). Can mesenchymal cells undergo collective cell
migration? The case of the neural crest. Cell Adh. Migr. 5, 490–8.
Theveneau, É., Marchant, L., Kuriyama, S., Gull, M., Moepps, B., Parsons, M. and Mayor, R. (2010). Collective Chemotaxis Requires Contact-Dependent Cell Polarity.
Dev. Cell 19, 39–53.
Thiery, J. P., Acloque, H., Huang, R. Y.-J. and Nieto, M. A. (2009). Epithelial-
mesenchymal transitions in development and disease. Cell 139, 871–90.
Townes, P. L. and Holtfreter, J. (1955). Directed movements and selective adhesion of
embryonic amphibian cells. J. Exp. Zool. 128, 53–120.
Trinkaus, J. P. (1973). Surface activity and locomotion of Fundulus deep cells during
blastula and gastrula stages. Dev. Biol. 30, 69–103.
Trinkaus, J. P. (1996). Ingression during early gastrulation of fundulus. Dev. Biol. 177, 356–
70.
Trinkaus, J. P. and Lentz, T. L. (1967). Surface Specializations od Fundulus Cells and their
Relation to Cell Movements during Gastrulation. J. Cell Biol. 32, 139–153.
Van Haastert, P. J. M. and Devreotes, P. N. (2004). Chemotaxis: signalling the way
forward. Nat. Rev. Mol. Cell Biol. 5, 626–634.
Viotti, M., Nowotschin, S. and Hadjantonakis, A.-K. (2014). SOX17 links gut endoderm
morphogenesis and germ layer segregation. Nat. Cell Biol. 16,.
Voiculescu, O., Bodenstein, L., Lau, I. and Stern, C. D. (2014). Local cell interactions and
self-amplifying individual cell ingression drive amniote gastrulation. Elife 1–26.
Volk, T., Cohen, O. and Geiger, B. (1987). Formation of heterotypic adherens-type
junctions between L-CAM-containing liver cells and A-CAM-containing lens cells. Cell 50, 987–994.
Warga, R. M. and Kimmel, C. B. (1990). Cell movements during epiboly and gastrulation
in zebrafish. Development 580, 569–580.
Warga, R. M. and Nüsslein-Volhard, C. (1999). Origin and development of the zebrafish
endoderm. Development 126, 827–38.
Watanabe, T., Sato, Y., Saito, D., Tadokoro, R. and Takahashi, Y. (2009). EphrinB2
coordinates the formation of a morphological boundary and cell epithelialization during
181

182

somite segmentation. Proc. Natl. Acad. Sci. 106, 7467–72.
Weber, G. F., Bjerke, M. a and DeSimone, D. W. (2012). A mechanoresponsive cadherin-
keratin complex directs polarized protrusive behavior and collective cell migration. Dev. Cell 22, 104–15.
Welch, M. D. and Mullins, R. D. (2002). Cellular control of actin nucleation. Annu. Rev. Cell Dev. Biol. 18, 247–88.
Wetzel, R. (1929). Untersuchungen am Hühnchen. Die Entwicklung des Keims Während der
Ersten Beiden Bruttage. In Untersuchungen am Hühnchen, pp. 188–321. Berlin,
Heidelberg: Springer Berlin Heidelberg.
Wheelock, M. J., Shintani, Y., Maeda, M., Fukumoto, Y. and Johnson, K. R. (2008).
Cadherin switching. J. Cell Sci. 121, 727–735.
Williams, D. W., Müller, F., Lavender, F. L., Orbán, L. and Maclean, N. (1996). High
transgene activity in the yolk syncytial layer affects quantitative transient expression
assays in zebrafish Danio rerio) embryos. Transgenic Res. 5, 433–42.
Williams, E. J., Williams, G., Howell, F. V., Skaper, S. D., Walsh, F. S. and Doherty, P. (2001). Identification of an N-cadherin Motif that Can Interact with the Fibroblast
Growth Factor Receptor and Is Required for Axonal Growth. J. Biol. Chem. 276, 43879–
43886.
Wilson, H. V. (1907). On some phenomena of coalescence and regeneration in sponges. J. Exp. Zool. 5, 245–258.
Wilson, P. and Keller, R. E. (1991). Cell rearrangement during gastrulation of Xenopus : direct observation of cultured explants. Development 300, 289–300.
Wilson, P., Oster, G. and Keller, R. E. (1989). Cell rearrangement during gastrulation of
Xenopus : direct observation of cultured explants. Development 105, 155–166.
Wilson, E. T., Cretekos, C. J. and Helde, K. A. (1995). Cell mixing during early epiboly in
the zebrafish embryo. Dev. Genet. 17, 6–15.
Winklbauer, R. (1990). Mesodermal cell migration during Xenopus gastrulation. Dev. Biol. 142, 155–168.
Winklbauer, R. (2009). Cell Adhesion in Amphibian Gastrulation. Int. Rev. Cell Mol. Biol. 278, 215–275.
Winklbauer, R. and Damm, E. W. (2012). Internalizing the vegetal cell mass before and
during amphibian gastrulation: Vegetal rotation and related movements. Wiley Interdiscip. Rev. Dev. Biol. 1, 301–306.
Winklbauer, R. and Schurfeld, M. (1999). Vegetal rotation, a new gastrulation movement
involved in the internalization of the mesoderm and endoderm in Xenopus. Development 126, 3703–3713.
Xu, Q., Alldus, G., Holder, N. and Wilkinson, D. G. (1995). Expression of truncated Sek-1
receptor tyrosine kinase disrupts the segmental restriction of gene expression in the
Xenopus and zebrafish hindbrain. Development 121, 4005–4016.
Xu, Q., Alldus, G., Macdonald, R., Wilkinson, D. G. and Holder, N. (1996). Function of
the Eph-related kinase rtk1 in patterning of the zebrafish forebrain. Nature 381, 319–22.
Yap, A. S., Niessen, C. M. and Gumbiner, B. M. (1998). The Juxtamembrane Region of the
Cadherin Cytoplasmic Tail Supports Lateral Clustering, Adhesive Strengthening, and
Interaction with p120ctn. J. Cell Biol. 141, 779–789.
183

184

Yin, C., Kiskowski, M., Pouille, P.-A., Farge, E. and Solnica-Krezel, L. (2008).
Cooperation of polarized cell intercalations drives convergence and extension of
presomitic mesoderm during zebrafish gastrulation. J. Cell Biol. 180, 221–232.
Yoshida, C. and Takeichi, M. (1982). Teratocarcinoma cell adhesion: Identification of a
cell-surface protein involved in calcium-dependent cell aggregation. Cell 28, 217–224.
185

186

APPENDIX
187

188

Appendix 1
Inhibitory Signalling to the Arp2/3 Complex Steers Cell Migration.
189

190

LETTERdoi:10.1038/nature12611
Inhibitory signalling to the Arp2/3 complex steerscell migrationIreneDang1*, RomanGorelik1*, Carla Sousa-Blin1*, EmmanuelDerivery1, ChristopheGuerin2, JoernLinkner3,MariaNemethova4,Julien G. Dumortier5, Florence A. Giger5, Tamara A. Chipysheva6, Valeria D. Ermilova6, Sophie Vacher7, Valerie Campanacci8,Isaline Herrada9, Anne-Gaelle Planson8, Susan Fetics8, Veronique Henriot1, Violaine David1, Ksenia Oguievetskaia1,Goran Lakisic1, Fabienne Pierre1, Anika Steffen10, Adeline Boyreau11, Nadine Peyrieras11, Klemens Rottner10,12,Sophie Zinn-Justin9, Jacqueline Cherfils8, Ivan Bieche7, Antonina Y. Alexandrova6, Nicolas B. David5, J. Victor Small4, Jan Faix3,Laurent Blanchoin2 & Alexis Gautreau1
Cell migration requires the generation of branched actin networksthatpower the protrusionof theplasmamembrane in lamellipodia1,2.The actin-related proteins 2 and 3 (Arp2/3) complex is themolecularmachine thatnucleates these branchedactinnetworks3. Thismachineis activated at the leading edge ofmigrating cells byWiskott–Aldrichsyndrome protein (WASP)-family verprolin-homologous protein(WAVE, also known as SCAR). TheWAVE complex is itself directlyactivated by the small GTPase Rac, which induces lamellipodia4–6.However, howcells regulate the directionality ofmigration is poorlyunderstood.Here we identify a newprotein, Arpin, that inhibits theArp2/3 complex in vitro, and show that Rac signalling recruits andactivates Arpin at the lamellipodial tip, like WAVE. Consistently,after depletion of the inhibitoryArpin, lamellipodia protrude fasterand cells migrate faster. Amajor role of this inhibitory circuit, how-ever, is to control directionalpersistenceofmigration. Indeed,Arpindepletion in both mammalian cells and Dictyostelium discoideumamoeba resulted in straighter trajectories, whereas Arpin micro-injection in fish keratocytes, one of the most persistent systems ofcell migration, induced these cells to turn. The coexistence of theRac–Arpin–Arp2/3 inhibitory circuit with the Rac–WAVE–Arp2/3activatory circuit can account for this conserved role of Arpin insteering cell migration.The Arp2/3 complex is activated at different cellular locations by
different nucleation promoting factors (NPFs), WAVE at lamellipo-dia, neural WASP (N-WASP) at clathrin-coated pits, and WASP andSCAR homologue (WASH) at endosomes7,8. NPFs share a characteri-stic carboxy-terminal tripartite domain, referred to as theVCA9. TheA(acidic) motif binds to the Arp2/3 complex and induces its conforma-tional activation. Arp2/3 inhibitory proteins containing an A motif,PICK1 andGadkin (also known as AP1AR and c-BAR), were detectedat endocytic pits and at endosomes10,11. Thus, although endocytic pitsand endosomes possess antagonistic activities towards theArp2/3 com-plex, it was not known whether lamellipodia contain a similar Arp2/3inhibitory protein to counteract WAVE. To identify such a protein,we performed a bioinformatics search for proteins displaying the typ-ical A motif of human NPFs, characterized by a tryptophan residue atthe antepenultimate position in an acidic context. We identified anuncharacterized protein (C15orf38) clustered with NPFs with thisprocedure (Fig. 1a). This protein was named Arpin. Arpin is encodedby a single gene in metazoans and amoeba. Predictions and NMRanalysis indicate that this protein of about 220 residues is structured
with the exception of its highly mobile C-terminal end, which containsthe putative Arp2/3-binding site (Extended Data Figs 1 and 2). Indeed,Arpin binds to Arp2/3 mostly through its acidic motif (Fig. 1b andExtended Data Figs 3 and 4).The molecular function of Arpin on Arp2/3 activity was assayed by
spectrofluorimetry and total internal reflection fluorescence (TIRF)microscopy using purified proteins. Arpin was unable to activate theArp2/3 complex, consistent with its lack of verprolin (V) and cofilin(C) homology motifs. However, when Arp2/3 was activated by VCA,Arpin, but not its truncated form lacking the acidic motif (ArpinDA),inhibited actin polymerization in a dose-dependent manner (Fig. 1c).The acidic peptidewas sufficient for this inhibition, although it was lesseffective than full-length Arpin, in line with its lower affinity for theArp2/3 complex (ExtendedData Fig. 4). Arpin inhibitedArp2/3 activa-tion, because we observed by TIRFmicroscopy the generation of feweractin branched junctions in the presence of Arpin (Fig. 1d and Sup-plementary Video 1). Full-length Arpin and its acidic motif, but notArpinDA, competewithVCA forArp2/3 binding (Fig. 1e andExtendedData Fig. 4). Therefore, Arpin is a new competitive inhibitor of theArp2/3 complex. The nameArpin is amnemonic for its activity (Arp2/3 inhibition).The subcellular localization of Arpin was examined by immuno-
fluorescence in spreadingmouse embryonic fibroblasts (MEFs). Arpinwas detected in restricted segments of the plasma membrane, whichwere also stained by three lamellipodialmarkers—theWAVE complex,the Arp2/3 complex and cortactin (Fig. 2a and Extended Data Fig. 5).Radial line scans of immunofluorescence pictures through lamellipo-dial outlines were generated, registeredwith the edge as a reference, andaveraged to reveal the relative distributions of these different lamelli-podial components. Arpin overlapped perfectly with the distributionof theWAVE complex, a tip component12 (Fig. 2a). Arpin is thus loca-lized at the lamellipodium tip, where new actin branches are nucleatedby WAVE and Arp2/3 complexes. As expected, Arp2/3 and cortactindistribution extended rearwards compared to Arpin (Extended DataFig. 5), because Arp2/3 and cortactin correspond to branches of thelamellipodial actin network undergoing retrograde flow with respectto the protruding membrane9,13.To understand the regulation of Arpin activity, we examined the
role of Rac, the master controller of lamellipodium formation. We co-transfected 293T cells with different forms of Rac and green fluor-escent protein (GFP)–Arpin and then analysed the interaction of
*These authors contributed equally to this work.
1GroupCytoskeleton inCellMorphogenesis, Laboratoire d’Enzymologie et BiochimieStructurales, CNRSUPR3082,Gif-sur-Yvette 91190, France. 2Institut deRecherches en Technologies et Sciences pour
le Vivant (iRTSV), Laboratoire de Physiologie Cellulaire et Vegetale, CNRS/CEA/INRA/UJF, Grenoble 38054, France. 3Institute for Biophysical Chemistry, Hannover Medical School, Hannover 30625,
Germany. 4Institute ofMolecular Biotechnology, Vienna 1030, Austria. 5INSERMU1024, CNRSUMR8197, ENS, Institut de Biologie de l‘ENS, Paris 75005, France. 6Institute of Carcinogenesis, N. N. Blokhin
Cancer Research Center, Russian Academy of Medical Sciences, Moscow 115478, Russia. 7Oncogenetic Laboratory, Institut Curie, Hopital Rene Huguenin, Saint-Cloud 92210, France. 8Group Small G
Proteins, Laboratoired’EnzymologieetBiochimieStructurales, CNRSUPR3082,Gif-sur-Yvette91190, France. 9LaboratoiredeBiologieStructurale et Radiobiologie (iBiTec-S), CNRSURA2096,CEASaclay,
Gif-sur-Yvette 91190, France. 10Institute of Genetics, University of Bonn, Bonn 53115, Germany. 11Institut des Systemes Complexes & NeD, Institut de Neurobiologie Alfred Fessard, CNRS UPR3294, Gif-
sur-Yvette 91190, France. 12Helmholtz Centre for Infection Research, Braunschweig 38124, Germany.
1 4 N O V E M B E R 2 0 1 3 | V O L 5 0 3 | N A T U R E | 2 8 1
Macmillan Publishers Limited. All rights reserved©2013
191

192

Arpin with the Arp2/3 complex through GFP immunoprecipitations.The active formof Rac1, which is sufficient to induce lamellipodia, wasalso sufficient to induce Arp2/3 co-immunoprecipitation with Arpin(Fig. 2b). To examine whether Rac is required for Arpin activation, weused Rac1 knockoutMEFs that lack lamellipodia14. The absence of Racabrogated the peripheral localization of Arpin in all knockout MEFcells examined (Extended Data Fig. 5). Endogenous Arpin was thenimmunoprecipitated fromRac1 knockoutMEFs. TheArp2/3 complexco-immunoprecipitated with Arpin in control MEF cells, but not inRac-deficient cells (Fig. 2c). Together, these results show that, in res-ponse to Rac signalling, Arpin inhibits the Arp2/3 complex at thelamellipodium tip, that is, where Rac also stimulates actin polymeriza-tion through the WAVE complex.This counterintuitive finding suggests thatArpinwould be a built-in
brake of protrusions. Human RPE1 cells transiently transfected withshort hairpin RNAs (shRNA) that efficiently deplete Arpin displayedincreased lamellipodia-mediated cell spreading (Extended Data Fig. 6and Supplementary Video 2). Arpin depletion increased protrusionvelocity of lamellipodia, consistent with its Arp2/3 inhibitory role(Fig. 2d). This effect was fully rescued byArpin re-expression, but onlywhen Arpin contained the acidic motif. Arpin thus provides a para-doxical negative circuit downstream of Rac. Such a circuitry, whereRac induces and inhibits actin polymerization, generates an ‘incoherentfeedforward loop’ (Fig. 2e), which can favour temporal regulations15.To examine whether the Arpin circuit is physiologically relevant for
cell migration, we impaired the expression of the arpin gene in zebra-fish embryosusingmorpholinos.During gastrulation, prechordal plate
cells collectively migrate towards the animal pole. After arpin loss offunction, cellmovementswere less coordinated (ExtendedData Fig. 7).Prechordal plate cell transplants revealed a cell autonomous effect ofArpin on protrusions. Protrusions were more frequent and more per-sistent over time in the absence of Arpin (Supplementary Video 3).This observation is consistent with the incoherent feedforward loop, acircuitry that can suppress the protrusion it creates.To understand the role of the incoherent feedforward loop in cell
migration further, we performed Arpin loss-of-function experimentsin cell systemsmigrating as individual cells.Migration of stable Arpin-depleted clones from the breast human cell line MDA-MB-231 wasanalysed by video microscopy in two or three dimensions (Fig. 3a,Supplementary Videos 4 and 5, and Extended Data Fig. 8). In bothcases, the tracks illustrate that Arpin-depleted cells explored a largerterritory than control cells, an observation substantiated by meansquare displacements (Extended Data Fig. 9). Increased explorationwas not only due to increased speed, but also to increased directionalpersistence, measured as the ratio of the distance between two pointsby the actual trajectory (Fig. 3a) or as the direction autocorrelationfunction (ExtendedDataFig. 10). BecauseArpin is conserved in amoeba,
shRNA Ctrl Arpin
GFPArp
in
ArpinΔA
Pro
trusio
n v
elo
city
(μm
min
-1)
: PC-RacGFP GFP–Arpin
TN WT QL
GFP–Arpin
Inp
ut
GF
P IP
GFP–Arpin
Arpin
ArpC2
PC
ArpC2
0 0
a
b c
shCtrl
shArpin
1 μm
1 μ
m
2 min
2.5
2.0
1.5
1.0
0.5
0
******
******
d
Arpin Brk1
0
100
200
300
400
–5 –4 –3 –2 –1 0 1
Distance (μm)
Flu
o.
inte
nsity (a.u
.)
WT
KO
Arpin
ArpC5
IgG
Arp
inIg
G
Arp
in
Inp
ut
WT KO
Rac1
Arpin
ArpC5 Arp
in IP
e
Rac
WAVEcomplex
Arp2/3complex
Branchedactin
Arpin
Figure 2 | Arpin inhibits the Arp2/3 complex at the lamellipodium tip.a, Arpin colocalizes with Brk1, a subunit of the WAVE complex, at thelamellipodium tip (mean6 s.e.m., 24 line scans). Scale bar, 20mm. b, Active(Gln61Leu; QL), but not wild-type (WT), nor dominant negative (Thr17Asn;TN), Rac induces Arpin association with the Arp2/3 complex. IP,immunoprecipitation. PC, protein C epitope. c, Rac is required for the Arpin–Arp2/3 interaction. KO, knockout. d, Arpin depletion increases the speed atwhich lamellipodia protrude. GFP–Arpin expression rescues the phenotype.Ctrl, control; shCtrl, control shRNA; shArpin, arpin shRNA. Data aremean6 s.e.m.; n5 40; ***P, 0.001, two-tailed analysis of variance(ANOVA). e, Arpin circuitry.
N-WASP DEDDEEDFEDDDEWEDWAVE2 DSEDDSSEFDEDDWSD
WASH1 PPQQPQAEEDEDDWES
Arpin EIREQGDGAEDEEWDD
a b
c
d e
100
50
30
15
Inp
ut
0 VCA Arpin
FL ΔA A
Ponceau
ArpC2
GST fusion
Arpin FL0
ArpinΔA0
GST–VCA
GST–VCA
ArpC2
ArpC2
400 nM 800 nM 1,600 nM
3 μM 7 μM 10 μM 17 μM
Arp2/3 + VCA + Arpin FL at:
0
5
10
15
25
30
35
20
Time (s)
0 1,000 2,000 3,000 4,000
Flu
ore
scen
ce (a.u
.)
Control
Arp2/3
Arp2/3 + VCA
0 1,200600
Time (s)
Flu
ore
scen
ce (a.u
.)
1,800 2,4000
5
10
15
25
30
35
20
1 μM
2 μM
4 μM
8 μM
12 μM
Arp2/3 + VCA + ArpinΔA at:
ArpinControl
Control
Arp2/3
Arp2/3 + VCA
Figure 1 | Arpin inhibits Arp2/3 activation in vitro. a, Alignment of acidic Ctermini of three NPFs and of Arpin. b, Arpin binds to the Arp2/3 complexthrough its acidic C-terminal region. Glutathione S-transferase (GST)pulldown with full-length Arpin (FL), its last 16 amino-acids (A), ArpinDA orthe VCA domain of N-WASP as a positive control. ArpC2 is a subunit of theArp2/3 complex. c, Spectrofluorimetry assay using pyrene-labelled actin tomonitor polymerization. a.u., arbitrary units. d, Assembly of branched actinnetworksmonitored byTIRFmicroscopy using rhodamine-labelled actin. Scalebar, 5 mm. e, Full-length Arpin, but not ArpinDA (18mM and serial twofolddilutions), competes with the NPF for Arp2/3 binding.
RESEARCH LETTER
2 8 2 | N A T U R E | V O L 5 0 3 | 1 4 N O V E M B E R 2 0 1 3
Macmillan Publishers Limited. All rights reserved©2013
193

194
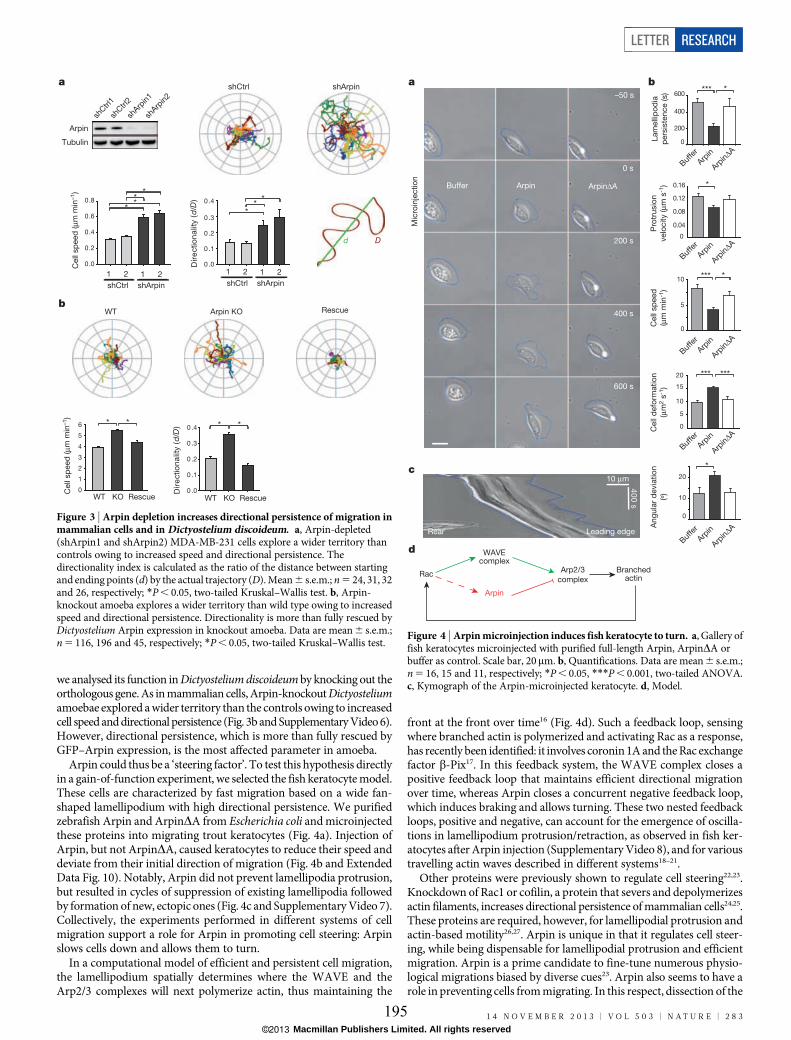
we analysed its function inDictyosteliumdiscoideum by knocking out theorthologous gene.As inmammalian cells,Arpin-knockoutDictyosteliumamoebae explored awider territory than the controls owing to increasedcell speedanddirectional persistence (Fig. 3b andSupplementaryVideo6).However, directional persistence, which is more than fully rescued byGFP–Arpin expression, is the most affected parameter in amoeba.Arpin could thus be a ‘steering factor’. To test this hypothesis directly
in a gain-of-function experiment, we selected the fish keratocytemodel.These cells are characterized by fast migration based on a wide fan-shaped lamellipodium with high directional persistence. We purifiedzebrafish Arpin and ArpinDA from Escherichia coli andmicroinjectedthese proteins into migrating trout keratocytes (Fig. 4a). Injection ofArpin, but not ArpinDA, caused keratocytes to reduce their speed anddeviate from their initial direction of migration (Fig. 4b and ExtendedData Fig. 10). Notably, Arpin did not prevent lamellipodia protrusion,but resulted in cycles of suppression of existing lamellipodia followedby formation of new, ectopic ones (Fig. 4c and SupplementaryVideo 7).Collectively, the experiments performed in different systems of cellmigration support a role for Arpin in promoting cell steering: Arpinslows cells down and allows them to turn.In a computational model of efficient and persistent cell migration,
the lamellipodium spatially determines where the WAVE and theArp2/3 complexes will next polymerize actin, thus maintaining the
front at the front over time16 (Fig. 4d). Such a feedback loop, sensingwhere branched actin is polymerized and activating Rac as a response,has recently been identified: it involves coronin1Aand theRac exchangefactor b-Pix17. In this feedback system, the WAVE complex closes apositive feedback loop that maintains efficient directional migrationover time, whereas Arpin closes a concurrent negative feedback loop,which induces braking and allows turning. These two nested feedbackloops, positive and negative, can account for the emergence of oscilla-tions in lamellipodium protrusion/retraction, as observed in fish ker-atocytes after Arpin injection (SupplementaryVideo 8), and for varioustravelling actin waves described in different systems18–21.Other proteins were previously shown to regulate cell steering22,23.
Knockdown of Rac1 or cofilin, a protein that severs and depolymerizesactin filaments, increases directional persistence ofmammalian cells24,25.These proteins are required, however, for lamellipodial protrusion andactin-based motility26,27. Arpin is unique in that it regulates cell steer-ing, while being dispensable for lamellipodial protrusion and efficientmigration. Arpin is a prime candidate to fine-tune numerous physio-logical migrations biased by diverse cues23. Arpin also seems to have arole in preventing cells frommigrating. In this respect, dissection of the
shCtrl shArpin
Arpin KOWT
aC
ell
sp
eed
(μ
m m
in–1)
shCtrl shArpin
1 2 1 2
0 .0
0 .1
0 .2
0 .3
0 .4)D/
d( ytil
an
oitc
eriD
Cell
sp
eed
(μ
m m
in–1)
)D/
d( ytil
an
oitc
eriD
shCtrl shArpin
1 2 1 2
0
1
2
3
4
5
6 * *
WT KO Rescue0 .0
0 .1
0 .2
0 .3
0 .4
Tubulin
Arpin
shCtrl
1
shCtrl
2
shArp
in2
shArp
in1
bRescue
Dd
0.0
0.2
0.4
0.6
0.8
***
*
**
*
* *
WT KO Rescue
Figure 3 | Arpin depletion increases directional persistence of migration inmammalian cells and in Dictyostelium discoideum. a, Arpin-depleted(shArpin1 and shArpin2) MDA-MB-231 cells explore a wider territory thancontrols owing to increased speed and directional persistence. Thedirectionality index is calculated as the ratio of the distance between startingand ending points (d) by the actual trajectory (D).Mean6 s.e.m.; n5 24, 31, 32and 26, respectively; *P, 0.05, two-tailed Kruskal–Wallis test. b, Arpin-knockout amoeba explores a wider territory than wild type owing to increasedspeed and directional persistence. Directionality is more than fully rescued byDictyostelium Arpin expression in knockout amoeba. Data are mean6 s.e.m.;n5 116, 196 and 45, respectively; *P, 0.05, two-tailed Kruskal–Wallis test.
Arpin
Mic
roin
jectio
n
a b
0
200
400
600
0
0.04
0.08
0.12
0.16
5
10
0
0
5
10
15
20
10
20
0
Buffer
*** *
*
*** *
*** ***
*
Rac
WAVEcomplex
Arp2/3
complex
Branchedactin
Arpin
ArpinΔA
–50 s
0 s
200 s
400 s
600 s
Buf
fer
Arpin
ArpinΔA
Buf
fer
Arpin
ArpinΔA
Buf
fer
Arpin
ArpinΔA
Buf
fer
Arpin
ArpinΔA
Buf
fer
Arpin
ArpinΔA
d
c10 μm
s 0
04
Rear Leading edge
Lam
elli
po
dia
pers
iste
nce (s)
Pro
trusio
n
velo
city (μ
m s
-1)
Cell
sp
eed
(μm
min
-1)
Cell
defo
rmatio
n
(μm
2 s
-1)
Ang
ula
r d
evia
tio
n
(º)
Figure 4 | Arpinmicroinjection induces fish keratocyte to turn. a, Gallery offish keratocytes microinjected with purified full-length Arpin, ArpinDA orbuffer as control. Scale bar, 20mm. b, Quantifications. Data are mean6 s.e.m.;n5 16, 15 and 11, respectively; *P, 0.05, ***P, 0.001, two-tailed ANOVA.c, Kymograph of the Arpin-microinjected keratocyte. d, Model.
LETTER RESEARCH
1 4 N O V E M B E R 2 0 1 3 | V O L 5 0 3 | N A T U R E | 2 8 3
Macmillan Publishers Limited. All rights reserved©2013
195

196

mechanisms regulating Arpin in physiology and pathology is a majorchallenge ahead of us.
METHODS SUMMARYArpin purification and antibody production.Arpin was purified from E. coli asa glutathione S-transferase (GST) fusion protein and cleaved off GST. UntaggedArpin was used for in vitro assays of actin polymerization, antibody generationand keratocyte injection. Rabbit polyclonal antibodies targeting full-length Arpinwere purified by affinity chromatography. Immunoprecipitation of endogenousArpin was performed using purified antibodies coupled to magnetic beads.Cells and imaging. RPE1 cells were electroporated with plasmids. Plasmidsencoding fusion proteins or shRNAs were transfected into MDA-MB-231 cellsusing liposomes. Lamellipodial dynamics and random migration were analysedwith ImageJ using the plug-ins ‘Kymograph’ and ‘MtrackJ’, respectively. Live-cellimaging was performed using an inverted Axio Observer microscope (Zeiss)equipped with two chambers controlled for temperature and CO2. For Arpinlocalization, MEF cells were fixed with 10% TCA, permeabilized with 0.2% TritonX-100, andprocessed for immunofluorescence. Todraw radial line scans, a custom-made ImageJ plug-in was developed, edge was determined using ‘Isodata’ and‘Analyze particle’, and then a custom-made VBAmacro in Excel was used to aligndata relative to the edge. Keratocytes were isolated from scales of freshly killedbrook trout (Salvelinus fontinalis) andmicroinjected with a Femtojet (Eppendorf).Plots were drawn with SigmaPlot (SPSS) and statistics were performed withSigmaStat (SPSS).
Online Content Any additional Methods, ExtendedData display items and SourceData are available in the online version of the paper; references unique to thesesections appear only in the online paper.
Received 21 November 2012; accepted 28 August 2013.
Published online 16 October 2013.
1. Wu, C. et al. Arp2/3 is critical for lamellipodia and response to extracellular matrixcues but is dispensable for chemotaxis. Cell 148, 973–987 (2012).
2. Suraneni, P. et al. The Arp2/3 complex is required for lamellipodia extension anddirectional fibroblast cell migration. J. Cell Biol. 197, 239–251 (2012).
3. Mullins, R. D., Heuser, J. A. & Pollard, T. D. The interaction of Arp2/3 complex withactin: nucleation, high affinity pointed end capping, and formation of branchingnetworks of filaments. Proc. Natl Acad. Sci. USA 95, 6181–6186 (1998).
4. Insall, R. H. & Machesky, L. M. Actin dynamics at the leading edge: from simplemachinery to complex networks. Dev. Cell 17, 310–322 (2009).
5. Padrick, S. B. & Rosen, M. K. Physical mechanisms of signal integration by WASPfamily proteins. Annu. Rev. Biochem. 79, 707–735 (2010).
6. Ridley, A. J. Life at the leading edge. Cell 145, 1012–1022 (2011).7. Derivery, E. et al. The Arp2/3 activator WASH controls the fission of endosomes
through a large multiprotein complex. Dev. Cell 17, 712–723 (2009).8. Suetsugu, S. & Gautreau, A. Synergistic BAR-NPF interactions in actin-driven
membrane remodeling. Trends Cell Biol. 22, 141–150 (2012).9. Pollard, T. D. Regulation of actin filament assembly by Arp2/3 complex and
formins. Annu. Rev. Biophys. Biomol. Struct. 36, 451–477 (2007).10. Rocca, D. L., Martin, S., Jenkins, E. L. & Hanley, J. G. Inhibition of Arp2/3-mediated
actin polymerization by PICK1 regulates neuronal morphology and AMPAreceptor endocytosis. Nature Cell Biol. 10, 259–271 (2008).
11. Maritzen, T. et al. Gadkin negatively regulates cell spreading and motility viasequestration of the actin-nucleating ARP2/3 complex. Proc. Natl Acad. Sci. USA109, 10382–10387 (2012).
12. Lai, F. P. et al. Arp2/3 complex interactions and actin network turnover inlamellipodia. EMBO J. 27, 982–992 (2008).
13. Cai, L., Makhov, A. M., Schafer, D. A. & Bear, J. E. Coronin 1B antagonizes cortactinand remodels Arp2/3-containing actin branches in lamellipodia. Cell 134,828–842 (2008).
14. Steffen, A. et al. Rac function is critical for cell migration but not required forspreading and focal adhesion formation. J. Cell Sci. http://dx.doi.org/10.1242/jcs.118232 (31 July 2013).
15. Hart, Y. & Alon, U. The utility of paradoxical components in biological circuits.Mol.Cell 49, 213–221 (2013).
16. Neilson, M. P. et al. Chemotaxis: a feedback-based computational model robustlypredicts multiple aspects of real cell behaviour. PLoS Biol. 9, e1000618 (2011).
17. Castro-Castro, A. et al. Coronin 1A promotes a cytoskeletal-based feedback loopthat facilitates Rac1 translocation and activation. EMBO J.30,3913–3927 (2011).
18. Machacek, M. & Danuser, G. Morphodynamic profiling of protrusion phenotypes.Biophys. J. 90, 1439–1452 (2006).
19. Weiner, O.D.,Marganski,W.A.,Wu, L. F., Altschuler, S. J.&Kirschner,M.W.Anactin-based wave generator organizes cell motility. PLoS Biol. 5, e221 (2007).
20. Brandman,O.&Meyer, T. Feedback loops shape cellular signals in spaceand time.Science 322, 390–395 (2008).
21. Allard, J. & Mogilner, A. Traveling waves in actin dynamics and cell motility. Curr.Opin. Cell Biol. 25, 107–115 (2013).
22. Ghosh, M. et al.Cofilin promotes actin polymerization and defines the direction ofcell motility. Science 304, 743–746 (2004).
23. Petrie, R. J., Doyle, A. D. & Yamada, K. M. Random versus directionally persistentcell migration. Nature Rev. Mol. Cell Biol. 10, 538–549 (2009).
24. Pankov, R. et al. A Rac switch regulates random versus directionally persistent cellmigration. J. Cell Biol. 170, 793–802 (2005).
25. Sidani,M.et al.Cofilindetermines themigrationbehavior and turning frequencyofmetastatic cancer cells. J. Cell Biol. 179, 777–791 (2007).
26. Li, A. et al. Rac1 drives melanoblast organization during mouse development byorchestrating pseudopod- drivenmotility and cell-cycle progression. Dev. Cell 21,722–734 (2011).
27. Loisel, T. P., Boujemaa, R., Pantaloni, D. & Carlier, M. F. Reconstitution of actin-based motility of Listeria and Shigella using pure proteins. Nature 401, 613–616(1999).
Supplementary Information is available in the online version of the paper.
Acknowledgements A.G. acknowledges his PhD supervisor M. Arpin, the name of thehere identified protein is a tribute to her mentoring. We thank G. Romet-Lemonne,E. Portnoy and F. Marletaz for suggestions. We acknowledge support from AgenceNationale pour la Recherche (ANR-08-BLAN-0012-CSD 8 to A.G. and L.B.,ANR-08-PCVI-0010-03 to A.G., ANR-11-BSV8-0010-02 to A.G., J.C. and S.Z.-J.),Association pour la Recherche sur le Cancer (SFI20101201512 to A.G.,PDF20111204331 to R.G., SFI20111203770 to N.B.D.), the Bio-Emergences IBISAfacility and Fundacao para a Ciencia e a Tecnologia (SFRH/BPD/46451/2008 toC.S.-B.), the Austrian Science Fund (FWF P21292-B09 to J.V.S.), the DeutscheForschungsgemeinschaft (FA 330/5-1 to J.F.) and grant number 8066, code2012-1.1-12-000-1002-064 from the Russian Ministry of Education and Science toA.Y.A.
Author Contributions I.D., R.G. and C.S.-B. performed videomicroscopy, analysed cellmigration, analysedbiochemical interactionsofArpin and its localization.E.D.wrote thebioinformatics programme that first identified Arpin. C.G. and L.B. performed in vitroactinpolymerizationandfluorescenceanisotropyassays. J.L. and J.F. isolatedknockoutamoeba and analysed their migration. M.N. and J.V.S. micro-injected fish keratocytes.J.G.D., F.A.G. and N.B.D characterized the Arpin phenotype in zebrafish. A.B. and N.P.determined the Arpin expression profile in zebrafish. I.H. and S.Z.-J. contributed theNMR spectrum. T.A.C., V.D.E., A.Y.A., S.V., I.B., V.C., V.D., G.L., K.O., F.P., A.-G.P., S.F. andV.H. generated DNA constructs, isolated stable cell clones, purified and characterizedrecombinant proteins, and performed crucial experiments for our understanding ofArpin function. A.S. and K.R. isolated the Rac1 knockout MEFs. All authors designedexperiments. N.P., K.R., S.Z.-J., J.C., N.B.D., I.B., A.Y.A., J.V.S., J.F., L.B. and A.G. supervisedthe work in their respective research group. A.G. coordinated the study and wrote thepaper.
Author Information Reprints and permissions information is available atwww.nature.com/reprints. The authors declare no competing financial interests.Readers are welcome to comment on the online version of the paper. Correspondenceand requests for materials should be addressed to A.G.([email protected])
RESEARCH LETTER
2 8 4 | N A T U R E | V O L 5 0 3 | 1 4 N O V E M B E R 2 0 1 3
Macmillan Publishers Limited. All rights reserved©2013
197

198

METHODSPlasmids. Human and zebrafish Arpin were amplified by PCR from clonesIMAGE:5770387 and IMAGE:7404342, respectively (GeneService). Dictyosteliumdiscoideum DdArpin was amplified from Ax2 cDNA. Human full-length Arpin(residues 1–226), ArpinDA (residues 1–210) orArpinA (residues 211–226), zebra-fish full-length Arpin (residues 1–226), ArpinDA (residues 1–210), and murineN-WASPVCA fragment (residues 392–501)28 were cloned into a modified pGEXvector with a TEV cleavage site between the restriction sites FseI and AscI. Forexpression in mammalian cells, Arpin inserts were cloned into a compatible plas-mid pcDNAm PC-GFP blue7. Zebrafish full-length Arpin was also insertedpBluescript to generate probes for in situ hybridization and in pCS2-GFP forrescue experiments. Human RAC1 wild-type, Thr17Asn, Gln61Leu, the Arp2/3complex subunits ArpC5A and ArpC5B29 were cloned into pcDNA5 His PCTEV blue7. For expression in amoeba, Dictyostelium Arpin was inserted intopDGFP-MCS-neo30. For shRNA-expressing plasmids, two hybridized oligonu-cleotides (MWG) were cloned into psiRNA-h7SKblasti G1 (Invivogen) accordingto themanufacturer’s protocol. The following target sequenceswere used: shArpin1: 59-GGAGAACTGATCGATGTATCT-39; shArpin 2: 59-GCTTCCTCATGTCGTCCTACA-39; shArpin 3: 59-GCCTTCCTAGACATTACATGA-39 (targetsthe 39 untranslated region (UTR) of arpinmRNA); shArpC2 1: 59-CATGTATGTTGAGTCTAA-39; and shArpC2 2: 59-GCTCTAAGGCCTATATTCA-39. Theseplasmids were compared to the non-targeting control provided by Invivogen;shControl: 59-GCATATGTGCGTACCTAGCAT-39. All constructs were verifiedby sequencing.
Protein purification.Arpin, ArpinDA, ArpinA andN-WASPVCA fused to GSTwere purified from E. coli BL21* strain (Life Technologies) using standard puri-fication protocols, dialysed against storage buffer (20mMTris-HCl, 50mMNaCl,1mMdithiothreitol (DTT), pH7.5), frozen in liquidnitrogen and stored at280 uC.When indicated, Arpin was cleaved by TEV protease off GST. Arpin bound toglutathione sepharose 4B beads was cleaved by overnight incubation at 4 uC usingHis-taggedTEVprotease in 50mMTris, pH7.5, 2mMb-mercaptoethanol, 100mMNaCl and 5mM MgCl2. TEV was removed by incubation with Ni21 beads (GEHealthcare). Arpin was further purified by size-exclusion chromatography (SEC)on a Superdex-200 column (GEHealthcare) and concentrated on Vivaspin filters.Human Arpin was used for the production of polyclonal antibodies and competi-tion experiments. Zebrafish Arpin was similarly produced, purified and usedfor keratocyte injection at 7.5mgml21 in 15mM Tris-HCl, 150mM NaCl, 5mMMgCl2 and 1mMDTT, pH7.5. Both proteins had an amino-terminal extension of10 amino acids (GAMAHMGRP) after TEV cleavage. ArpinA peptide (residues211–226 of full-length Arpin) was purchased from Proteogenix. For the SECcoupled to multiangle light scattering (SEC-MALS) characterization, proteinswere separated in a 15-ml KW-803 column (Shodex) run on a Shimadzu HPLCsystem.MALS,quasi-elastic light scattering (QELS)andrefractive index (RI)measure-ments were achieved with a MiniDawn Treos (Wyatt technology), a WyattQELS(Wyatt technology) and an Optilab T-rEX (Wyatt technology), respectively.Molecular mass and hydrodynamic radius calculations were performed with theASTRA VI software (Wyatt Technology) using a dn/dc value of 0.183ml g21.
Antibodies.Polyclonal antibodies targetingArpinwere obtained in rabbits (Agro-Bio) against purified human Arpin, and then purified by affinity purification on aHiTrap NHS-activated HP column (GE Healthcare) coupled to the immunogen.
ArpC2polyclonal antibody and cortactinmonoclonal antibody (clone 4F11)werefrom Millipore. ArpC5 monoclonal antibody (clone 323H3) was from SynapticSystems. Brk1monoclonal antibody (clone 231H9)was described earlier31. Tubulinmonoclonal antibody (clone E7) was obtained from Developmental StudiesHybridoma Bank. PC monoclonal antibody (clone HPC4) was from Roche.
In vitro assays of actin polymerization. Pyrene actin assays and monitoring ofthe branching reaction were performed as described previously32. VCA refers tothe VCA domain of WAVE1 purified as described33. Conditions for Fig. 1c were:2mM actin (10% pyrene-labelled), 500nM VCA, 20 nM Arp2/3 and Arpin full-length or ArpinDA at the indicated concentrations. Conditions for Fig. 1d were:1mM actin (10% rhodamine-labelled), 150nM VCA, 80 nM Arp2/3 and 5mMArpin when indicated.
Fluorescence anisotropy based determination of Kd. The ArpinA peptide wassynthesized and labelled with 5-TAMRA at the amino terminus (Proteogenix).The peptide was excited with polarized light at 549nm and emitted light wasdetected at 573 nm using a MOS450 fluorimeter (Biologic). Measurements weremade for 60 s at 1 point s21, and the average anisotropy was calculated with theBiologic software. Fits were performed as described previously34.
GST pull-down, immunoprecipitations, SDS–PAGE and western blots. HeLacells were lysed in 50mM Tris-HCl, 150mM NaCl, 1mM EDTA, 1mM DTT,0.5% Triton X-100 and 5% glycerol, pH7.5. GST fusion protein (20mg) associatedwith 20ml of glutathione sepharose 4B beads (GE Healthcare) was incubated with
1ml HeLa cell extracts for 2 h at 4 uC. Beads were washed and analysed bywestern blot.
Co-immunoprecipitation of Arpin with the Arp2/3 complex was performedwith either two 15-cm dishes of MEF cells, or one 10-cm dish of transfected 293Tcells. Cell lysates prepared in 10mM HEPES, pH7.7, 50mM KCl, 1mM MgCl2,1mM EGTA and 1% Triton X-100 were incubated with 10mg of non-immunerabbit IgG or 10mg of anti-Arpin antibodies coupled to tosyl-activated dynabeads(Life Technologies) or to GFP-trap beads (Chromotek). Beads were incubatedwith extracts for 2 h at 4 uC, washed and analysed by western blot.
SDS–PAGE was performed using NuPAGE 4–12% Bis-Tris gels (Life Tech-nologies). For western blots, nitrocellulose membranes were developed usinghorseradish peroxidase (HRP)-coupled antibodies, Supersignal kit (Pierce) anda LAS-3000 imager (Fujifilm).
Cells and transfections. hTERT immortalized RPE1 cells (Clontech) were grownin DMEM/HAM F12, MEFs and 293T cells in DMEM, and MDA-MB-231 cellswere grown in RPMI. All media were supplemented with 10% FBS (media andserum from PAALaboratories). All cells and stable clones were found negative formycoplasma infection by a sensitive PCR assay.
RPE1 cells were electroporated with ECM 630 BTX (Harvard Apparatus). Ten-million cells were resuspended in 200ml serum-free DMEM/HAM F12 mediumcontaining 7.5mM HEPES, pH7.5, mixed with 10–40mg DNA plasmid in 50ml210mMNaCl and electroporated at 1,500mF and 250V. To isolate stable Arpin-depleted clones, MDA-MB-231 cells were transfected with shRNA Arpin 3 orshControl using Lipofectamine 2000, and clones selected with 10mgml21 blasti-cidin (Invivogen) were isolated with cloning rings and expanded. For rescueexperiments, cells transfectedwith shRNA3,which targets the 39UTR,were trans-fected with GFP–Arpin, which lacks UTR sequences. To validate Arpin locali-zation,MEFswere transfectedwith non-targeting (D-001810-10) orArpin targeting(J-059240-10;ON-TARGETplus siRNA,Dharmacon) using lipofectamine RNAiMax(Life Technologies), and examined after 2 days.
Immunofluorescence and live imaging of mammalian cells. Cells were fixed in10% TCA, permeabilized with 0.2% Triton X-100, and processed for immuno-fluorescence. To draw radial line scans, a custom made ImageJ plug-in wasdeveloped, edge was determined using ‘Isodata’ thresholding, then a custom-madeVBA macro in Excel was used to align data relative to the edge. Lamellipodialdynamics and random migration were analysed with ImageJ using the plugins‘Kymograph’ and ‘MtrackJ’, respectively. All imaging was done on a AxioObserver microscope (Zeiss) equipped with a Plan-Apochromat 633/1.40 oilimmersion objective, an EC Plan-Neofluar 403/1.30 oil immersion objectiveand a Plan-Apochromat 203/0.80 air objective, a Hamamatsu camera C10600Orca-R2 and a Pecon Zeiss incubator XL multi S1 RED LS (Heating Unit XL S,Temp module, CO2 module, Heating Insert PS and CO2 cover).
Fish keratocytes. Keratocytes were isolated from scales of freshly killed brooktrout (Salvelinus fontinalis) as previously described35 and imaged by phase contraston an inverted Zeiss Axioscope using 363 optics, and a halogen lamp as lightsource. Microinjection was performed with a micromanipulator (Leitz) and amicro-injector Femtojet (Eppendorf) controllingbackpressure and injectionpulses.Contours were analysed using the CellTrack software (Ohio State University).
Zebrafish. Embryos were obtained by natural spawning of Tg(-1.8gsc:GFP)ml1fish36. In these embryos, prechordal plate cells can be identified by their expressionof GFP. In situ hybridization was performed following standard protocols37. Forloss of function experiments, a morpholino directed against arpin (GTTGTCATAAATACGACTCATCTTC, where the underlined anticodon corresponds to theinitiating ATG codon), or a standard control morpholino (CCTCTTACCTCAGTTACAATTTATA) was injected at the one-cell stage, together with histone2B-mCherrymRNAsor Lifeact-mCherrymRNAs, andGFP–ArpinmRNAs for rescueexperiments. To analyse cell trajectories, confocal z-stacks were acquired every min-ute using a Nikon confocal spinning disk with an Evolve camera (Photometrics).Nuclei were tracked using Imaris (Bitplane). Further analyses were performedusing custom routines in Matlab (MathWorks)38. All animal studies were donein accordance with the guidelines issued by the French Ministry of Agriculture(Decree no 2013-118) and have been submitted to Paris ethical committee no. 3.
Dictyostelium discoideum.Cultivation and transformation by electroporation ofD. discoideum cells was performed as described39. To knockout Arpin, a piece ofgenomic DNA containing the arpin coding sequence with its intronwas amplifiedfrom Ax2 wild-type amoeba, using oligonucleotides DdArpin_BU 59-CGCGGATCCGCATGAGTTCAAGTACAAATTATAGT-39 and DdArpin_SD 59-CGCGTCGACTTTATTTCCATTCATCATCATCTTC-39. The cloned PCR fragmentwas then used as a template to amplify a 59 fragment (using 59-CGCGGATCCGCATGAGTTCAAGTACAAATTATAGT-39 and 59-GCGCTGCAGCATCTGAAATTGCAACTGATAGTTG-39) and a 39 fragment (using 59-GCGAAGCTTTCTTCTTTACCTTCAAATTTTCAT-39 and 59-CGCGTCGACGTTGGTTATTTGATTCTATTTGATC-39). These two fragments were cloned as to flank a cassette
LETTER RESEARCH
Macmillan Publishers Limited. All rights reserved©2013
199

200

carrying Blasticidin resistance in pLPBLP vector40. Arpin knockout clones wereselected inHL5c-mediumsupplementedwith 10mgml21 blasticidin S (Invivogen)after electroporation of the resulting vector. Recombination was assessed usingdiagnostic PCRs that distinguish knockout from wild-type amoeba. GFP–Arpinre-expressing knockout lineswere obtained after electroporation of pDGFP-Arpinand selection with 10mgml21 geneticin (Sigma). Two time series with more than30 cells eachwere acquired per amoeba. Two clones isolated after each transforma-tion gave similar results.
Statistics. Statistical analysis of the results was carried out with SigmaStat software(SPSS inc., v2.03). When data satisfied the two criteria of normality and equalvariance, parametric tests were used: t-test to compare two groups; ANOVA formore than two.Where indicated, a bijective transformationwas applied to the datato pass the two criteria of normality and equal variance. When data did not satisfyboth criteria even after transformation, non-parametric tests were applied:Mann–Whitney to compare two groups; Kruskal–Wallis for more than two. A repres-entative experiment is plotted and results are expressed asmean s.e.m.with respectto the number of cells (n). Differences were considered significant at confidencelevels greater than 95% (two-tailed). Three levels of statistical significance aredistinguished: *P, 0.05; **P, 0.01; ***P, 0.001.
28. Lommel, S. et al.Actin pedestal formation by enteropathogenic Escherichia coli andintracellular motility of Shigella flexneri are abolished in N-WASP-defective cells.EMBO Rep. 2, 850–857 (2001).
29. Millard, T. H., Behrendt, B., Launay, S., Futterer, K. & Machesky, L. M. Identificationand characterisation of a novel human isoform of Arp2/3 complex subunit p16-ARC/ARPC5. Cell Motil. Cytoskeleton 54, 81–90 (2003).
30. Dumontier, M., Hocht, P., Mintert, U. & Faix, J. Rac1 GTPases control filopodiaformation, cellmotility, endocytosis, cytokinesisanddevelopment inDictyostelium.J. Cell Sci. 113, 2253–2265 (2000).
31. Derivery, E. et al. FreeBrick1 is a trimeric precursor in the assembly of a functionalwave complex. PLoS ONE 3, e2462 (2008).
32. Michelot, A. et al. Actin-filament stochastic dynamics mediated by ADF/cofilin.Curr. Biol. 17, 825–833 (2007).
33. Machesky, L. M. et al. Scar, a WASp-related protein, activates nucleation of actinfilamentsby theArp2/3complex.Proc.Natl Acad. Sci.USA96,3739–3744(1999).
34. Marchand, J. B., Kaiser, D. A., Pollard, T. D. & Higgs, H. N. Interaction ofWASP/Scarproteins with actin and vertebrate Arp2/3 complex. Nature Cell Biol. 3, 76–82(2001).
35. Urban, E., Jacob, S., Nemethova,M., Resch, G. P. &Small, J. V. Electron tomographyreveals unbranched networks of actin filaments in lamellipodia. Nature Cell Biol.12, 429–435 (2010).
36. Doitsidou, M. et al. Guidance of primordial germ cell migration by the chemokineSDF-1. Cell 111, 647–659 (2002).
37. Hauptmann, G. & Gerster, T. Two-color whole-mount in situ hybridization tovertebrate and Drosophila embryos. Trends Genet. 10, 266 (1994).
38. Dumortier, J. G., Martin, S., Meyer, D., Rosa, F. M. & David, N. B. Collectivemesendodermmigration relies on an intrinsic directionality signal transmittedthrough cell contacts. Proc. Natl Acad. Sci. USA 109, 16945–16950 (2012).
39. Schirenbeck, A., Bretschneider, T., Arasada, R., Schleicher, M. & Faix, J. TheDiaphanous-related formin dDia2 is required for the formation andmaintenanceof filopodia. Nature Cell Biol. 7, 619–625 (2005).
40. Faix, J., Kreppel, L., Shaulsky, G., Schleicher,M.&Kimmel, A. R. A rapid andefficientmethod to generatemultiple gene disruptions inDictyosteliumdiscoideumusing asingle selectable marker and the Cre-loxP system. Nucleic Acids Res. 32, e143(2004).
41. Edgar, R. C. MUSCLE: multiple sequence alignment with high accuracy and highthroughput. Nucleic Acids Res. 32, 1792–1797 (2004).
42. Clamp, M., Cuff, J., Searle, S. M. & Barton, G. J. The Jalview Java alignment editor.Bioinformatics 20, 426–427 (2004).
43. McGuffin, L. J., Bryson, K. & Jones, D. T. The PSIPRED protein structure predictionserver. Bioinformatics 16, 404–405 (2000).
44. Ward, J. J., McGuffin, L. J., Bryson, K., Buxton, B. F. & Jones, D. T. The DISOPREDserver for the prediction of protein disorder. Bioinformatics 20, 2138–2139(2004).
45. Blanchoin, L. et al. Direct observation of dendritic actin filament networksnucleated by Arp2/3 complex and WASP/Scar proteins.Nature 404, 1007–1011(2000).
46. Montero, J. A., Kilian, B., Chan, J., Bayliss, P. E. &Heisenberg, C. P. Phosphoinositide3-kinase is required for process outgrowth and cell polarization of gastrulatingmesendodermal cells. Curr. Biol. 13, 1279–1289 (2003).
RESEARCH LETTER
Macmillan Publishers Limited. All rights reserved©2013
201

202

Extended Data Figure 1 | Prediction of secondary structure elements anddisordered regions of Arpin. A multiple alignment of the Arpin orthologueswas performed with MUSCLE41 and displayed with Jalview42. Two methodsrelying on multiple alignments of Arpin orthologues were used to predictsecondary structures and disordered regions, Psipred43 and Disopred44,respectively. The predicted secondary structure (SS) elements are indicated bygreen arrows for b-strands, red cylinders for a-helices, and a black line for coils;
the associated confidence (conf) score is displayed below, ranging from 0 to 9for poor and high confidence, respectively. Amino acid conservation isindicated by a 0 to 10 score, and highlighted by brown to yellow histogram bars.The confidence in predicting disorder is also scored from 0 to 10, bymultiplying tenfold the Disopred probability. Arpin is predicted to be astructured protein with the notable exception of the 20 C-terminal residues,which are predicted to be disordered with high confidence.
LETTER RESEARCH
Macmillan Publishers Limited. All rights reserved©2013
203

204

ExtendedData Figure 2 | NMR analysis of 15N-labelled humanArpin. Bothviews represent 1H–15N heteronuclear single quantum coherence (HSQC)spectra. Each peak corresponds to the 1H–15N backbone amide bond of aspecific residue. The position of a 1H–15Npeak in the spectrum depends on thechemical environment of the corresponding residue. a, Such a scattereddistribution of peaks is characteristic of a folded protein. The last 20 residueswere assigned to individual peaks and are displayed on the spectrum. These
residues are clustered in the centre of the spectrum. b, Same HSQC spectrumdisplayed with a higher threshold to display only high peaks. The height of apeak depends on the mobility of the residue on a picosecond to millisecondtimescale. This spectrum experimentally demonstrates that the 20 C-terminalresidues are highly mobile. This result confirms that, as predicted, the Arp2/3-binding site of Arpin is exposed as a poorly structured tail of the protein.
RESEARCH LETTER
Macmillan Publishers Limited. All rights reserved©2013
205

206

Extended Data Figure 3 | Characterization of recombinant Arpin. a, Full-length Arpin or ArpinDA from human or zebrafish cDNA was expressed in E.coli and purified. Purity was assessed by SDS–PAGE and coomassie staining.These proteins were used for in vitro actin polymerization assays and for fishkeratocyte injection, respectively. b, Analysis of the molar mass of full-lengthArpins by size-exclusion chromatography coupled to multiangle lightscattering (SEC–MALS). The ultraviolet measurement (left axis, dashed line)and the molar mass (right axis, horizontal solid line) were plotted as a functionof column elution volume. c, SEC–MALSmeasures ofmasses indicate that bothproteins aremonomeric in solution.d, GST pull-downusing a lysate of 293 cellsoverexpressing PC-tagged Arpin and purified GST–Rac1 wild type,
GST–Rac1(Gln61Leu) or GST alone as a negative control. Arpin did notassociate with either type of Rac. By contrast, the endogenousWAVE complexbound to Rac(Gln61Leu), but not Rac wild type, as expected from a Raceffector. e, Untagged Rac1 was purified from E. coli and then loadedwith eitherGDP or GTPcS. Human Arpin (60mM), Rac1 (120mM) and mixture of thesetwo proteins were analysed by SEC–MALS as above. SEC was run in 20mMHEPES, 100mMNaCl, pH7.4. The height of ultraviolet peaks was normalizedto 1 to be displayed on the same figure. A single peak was detected in all cases.The measured masses indicate that no complex is formed between Arpin andRac and that the single peak observed in the mixture corresponds tocofractionation of the two proteins of similar mass by SEC.
LETTER RESEARCH
Macmillan Publishers Limited. All rights reserved©2013
207

208

RESEARCH LETTER
Macmillan Publishers Limited. All rights reserved©2013
209

210

Extended Data Figure 4 | Arpin directly binds to the Arp2/3 complex.a, Fluorescence anisotropy measurements of labelled ArpinA peptide bindingat equilibrium to the purified Arp2/3 complex at the indicated concentrations.b, LabelledArpinApeptide bound to theArp2/3 complexwas then titratedwithpurified Arpin full-length, ArpinDAor unlabelled ArpinApeptide as indicated.Full-length Arpin displaces the labelled ArpinA peptide more efficiently thanthe A peptide. ArpinDA is unable to displace the ArpinA peptide. Curves thatbest fit the values yield the indicated equilibrium constants. c, Arpin inhibitsArp2/3 activation in the pyrene-actin assay. Part of this experiment is displayedin Fig. 1c,more curves are plotted here.d, From curves in c, the number of actin
barbed ends is calculated from the slope at half-polymerization using therelationship described previously45. Best fit of the values indicate an apparentKd value of 7606 156nM for the Arp2/3 complex in a mixture including actinand theVCA. e, ArpinA inhibits Arp2/3 activation in a dose dependentmannerin the pyrene-actin assay. Conditions: 2mM actin (10% pyrene-labelled),500nM VCA, 20 nM Arp2/3 and ArpinA at the indicated concentrations.f, ArpinA competes with theNPF for Arp2/3 binding. Arp2/3 is displaced fromits interaction with 5 mM GST N-WASP VCA immobilized on glutathionebeads by the Arpin acidic peptide (304mM and serial twofold dilutions).
LETTER RESEARCH
Macmillan Publishers Limited. All rights reserved©2013
211

212

Extended Data Figure 5 | Specific localization of Arpin at thelamellipodium tip. a, Arpin overlaps with the Arp2/3 complex at thelamellipodium tip. b, Arpin overlaps with cortactin at the lamellipodium tip.Arpin staining is lost after short interfering RNA (siRNA)-mediated depletion.Intensity profiles along multiple line scans encompassing the cell peripherywere registered to the outer edge of the staining of a lamellipodial marker. Thismarker was Arpin in a and cortactin in b. The multiple line scans were thenaveraged and displayed as an intensity plot, where the y axis representsfluorescent intensity, arbitrary units (mean6 s.e.m., n5 17, 16 and 17,respectively). Scale bar, 20mm. Arp2/3 localization extends rearwards relativeto Arpin localization. This result is because the Arp2/3 complex becomes abranched junctionwhen activated by theWAVE complex at the lamellipodium
tip. The branched junction undergoes retrograde flow like actin itself due toactin filament elongation9,12. Cortactin recognizes Arp2/3 at the branchjunction and is thought to stabilize branched actin networks13. As a marker ofthe branched junction, cortactin stains the width of lamellipodia, like theArp2/3 complex. c, Rac1 knockout MEFs that lack lamellipodia14 arecompletely devoid of Arpin staining at the cell periphery, in line with thecomplete absence of lamellipodia indicated here by the absence of cortactinstaining. Arpin is normally expressed in the Rac1 knockoutMEFs (see Fig. 2c).Intensity profiles along multiple line scans encompassing the cell peripherywere averaged after manual drawing of the cell edge (mean6 s.e.m., n5 16).Scale bar, 20mm.
RESEARCH LETTER
Macmillan Publishers Limited. All rights reserved©2013
213

214

Extended Data Figure 6 | Arpin regulates cell spreading through itsinteraction with the Arp2/3 complex. Arpin was depleted from human RPE1cells after transient transfection of shRNA plasmids and blasticidin-mediatedselection of transfected cells. After 5 days, cells were either analysed by westernblot or used for the spreading assay. Cells were serum-starved for 90min insuspension in polyHEMA-coated dishes and then allowed to spread oncollagen-I-coated coverslips for 2 h. Phalloidin staining was used to calculatecell surface area of individual cells using ImageJ. Mean6 s.e.m.; **P, 0.01,***P, 0.001; t-test or ANOVA when more than two conditions. a, Arpin
depletion increases cell spreading (n5 57 and 52, respectively). The same effectis obtained with three shRNAs targeting Arpin (n5 51, 48 and 59,respectively). b, This effect is rescued by GFP–Arpin expression in knockdowncells, but not byGFP–ArpinDA expression(n5 63, 56, 63 and 52, respectively).c, Combined depletion of Arpin and the Arp2/3 complex reverses thephenotype of Arpin depletion. The effect is seen with two shRNAs targetingArpC2 (n5 56, 60, 69, 68, 63 and 66, respectively). The last two experimentsindicate that Arpin exerts its effect on cell spreading through its ability toregulate the Arp2/3 complex.
LETTER RESEARCH
Macmillan Publishers Limited. All rights reserved©2013
215

216

RESEARCH LETTER
Macmillan Publishers Limited. All rights reserved©2013
217

218

Extended Data Figure 7 | Arpin regulates protrusion frequency ofprechordal plate cells and their collective migration in zebrafish embryos.a, In situ hybridization of arpin probe in zebrafish embryos at different stages.arpinmRNAs arematernally deposited. During gastrulation, arpin is expressedin hypoblast, which includes the prechordal plate. b, Three-dimensionaltrajectories of prechordal plate cells in embryos injected with control or arpinmorpholino. During fish gastrulation, prechordal plate cells migratecollectively in a straight direction from the margin of the embryo towards theanimal pole38,46. Loss of arpin function induces dispersion as evidenced byincreased lateral cell displacement (n5 1,516 and 1,546) and a higher distancebetween cells (n5 194 and 235). Lateral displacement is the cell movementperpendicular to main direction of the migration. Distance between cells refersto the average distance of the nucleus of a given cell to the nuclei of its fiveclosest neighbours. Mean6 s.e.m.; ***P, 0.001, t-test. c, At the onset of
gastrulation prechordal plate cells derived from morpholino injected embryoswere transplanted into the prechordal plate of an untreated host embryo atthe same stage in order to allow imaging of cell autonomous effects onprotrusion formation. Donor embryos are injected with control or arpinmorpholinos andmRNAs encoding Lifeact-mCherry as well as GFP–Arpin forthe rescue. Time-lapse imaging of injected cells is performed by epifluorescenceto reveal Lifeact, a marker of filamentous actin, which stains actin-basedprotrusions. For each cell, presence of a protrusion was assessed at each frameto deduce probability of protrusion presence and protrusion lifetimes. arpinloss of function increases the probability of presence of protrusions(n5 8, 8 and 10, respectively; *P, 0.05, ANOVA) and their duration(in this case, n corresponds to the number of protrusions (n5 42, 41 and 40,respectively; *P, 0.05, Kruskal–Wallis). Protrusions are indicated byarrowheads. Scale bar, 50mm.
LETTER RESEARCH
Macmillan Publishers Limited. All rights reserved©2013
219

220

Extended Data Figure 8 | Arpin depletion increases cell migration in threedimensions. Stable MDA-MB-231 clones depleted of Arpin or not wereembedded in a collagen gel. a, Single-cell trajectories illustrate that control cellshardly move in this dense environment (see Supplementary Video 4), unlikeArpin-depleted cells, which explore a significant territory, albeit at lower pacethan in two dimensions, as evidenced by mean square displacement (Extended
Data Fig. 9). b, Cell speed is significantly increased in the Arpin-depletedclones. Mean6 s.e.m.; n5 27, 25, 26 and 17, respectively, *P, 0.05,Kruskal–Wallis, two experiments. Directional persistence, calculated by d/D, isnot significantly different in the clones depleted of Arpin or not. Directionautocorrelation (Extended Data Fig. 10), however, shows an increaseddirectionality in the Arpin-depleted cells at the earliest time points.
RESEARCH LETTER
Macmillan Publishers Limited. All rights reserved©2013
221

222

Extended Data Figure 9 | Analysis of mean square displacement of thedifferent migration experiments. The mean square displacement gives ameasure of the area explored by cells for any given time interval. By setting apositional vector on the cellular trajectory at time t, the MSD is defined as:MSD(Dt)~ ½x(tzt0){x(t0)�
2z½y(tzt0){y(t0)�
2� �
t,N, in which brackets hi
indicate averages over all starting times t0 and all cellsN. For each time intervalDtime, mean and s.e.m. are plotted. Error bars corresponding to s.e.m. areplotted, even if too small to be visible. The grey area excludes the noisy part ofcurves corresponding to large time intervalswhere less data points are available.a, MDA-MB-231 depleted or not of Arpin in a two- or three-dimensional
environment. Arpin-depleted MDA-MB-231 cells explore a larger territorythan the controls in time intervals examined (for twodimensions,n as indicatedin Fig. 3a; P, 0.001, two-way ANOVA with time and conditions; for threedimensions, n as indicated in Extended Data Fig. 8; P, 0.001, two-wayANOVA with time and conditions). b, Dictyostelium discoideum knockoutamoebae explore a larger territory than controls and rescued amoebae (n asindicated in Fig. 3b, P, 0.001, two-way ANOVA with time and conditions).c, Arpin-injected fish keratocytes explore a smaller territory than the controls(n as indicated in Fig. 4b; P, 0.001, two-way ANOVA with time andconditions).
LETTER RESEARCH
Macmillan Publishers Limited. All rights reserved©2013
223

224

RESEARCH LETTER
Macmillan Publishers Limited. All rights reserved©2013
225

226

Extended Data Figure 10 | Analysis of direction autocorrelation of thedifferent migration experiments. a, Principle of the analysis. A hypotheticalcell trajectory is depicted. Each step is represented by a vector ofnormalized length. h is the angle between compared vectors. The plot illustratesthe cosh values for the putative trajectory of four steps (colour-coded).Averaging these cosh values yields the direction autocorrelation (DA)function of time that measures the extent to which these vectors arealigned over different time intevals. The DA function is defined as:DA(t)~vu(t0)Nu(t0zt)wt0,N~v cos h(t0,t0zt)wto,N , in which u(t0) is thevector at the starting time t0, and u(t01 t) the vector at t01 t. Brackets indicatethat all calculated cosines are averaged for all possible starting times (t0)over all cells (N). For each time interval t, vectors from all cell trajectories were
used to compute average and sem. Error bars corresponding to s.e.m. areplotted, even if too small to be visible. b, Arpin-depleted MDA-MB-231 clonesturn less than control cells (for two dimensions, n as indicated in Fig. 3a;P, 0.05 between 10 and 40min, Kruskal–Wallis; for three dimensions, n asindicated in Extended Data Fig. 8; P, 0.05 at time 10min, Kruskal–Wallis).c, Arpin knockout amoebae turn less than wild-type amoebae, and GFP–Arpinoverexpressing knockout amoebae (rescue) turn more than wild type(n as indicated in Fig. 3b; P, 0.05 between 5 and 85 s, Kruskal–Wallis).e, Arpin-injected fish keratocytes turn more than buffer-injected cells, andArpinDA-injected keratocytes turn more than buffer-injected but less thanfull-length-Arpin-injected keratocytes (n as indicated in Fig. 4b; P, 0.05between 16 and 272 s, Kruskal–Wallis).
LETTER RESEARCH
Macmillan Publishers Limited. All rights reserved©2013
227

228

Appendix 2
Analyzing In Vivo Cell Migration using Cell Transplantations
and Time-lapse Imaging in Zebrafish Embryos.
229

230

Journal of Visualized Experiments www.jove.com
Copyright © 2016 Journal of Visualized Experiments April 2016 | 110 | e53792 | Page 1 of 10
Video Article
Analyzing In Vivo Cell Migration using Cell Transplantations and Time-lapseImaging in Zebrafish EmbryosFlorence A. Giger1, Julien G. Dumortier2, Nicolas B. David1
1CNRS UMR8197 – INSERM U1024, IBENS, Institut de Biologie de l'École Normale Supérieure2Department of Physiology Development and Neuroscience, University of Cambridge
Correspondence to: Nicolas B. David at [email protected]
URL: http://www.jove.com/video/53792DOI: doi:10.3791/53792
Keywords: Developmental Biology, Issue 110, Zebrafish, cell migration, mosaic, cell transplantation, actin, live imaging, developmental biology,micro-injection
Date Published: 4/29/2016
Citation: Giger, F.A., Dumortier, J.G., David, N.B. Analyzing In Vivo Cell Migration using Cell Transplantations and Time-lapse Imaging in ZebrafishEmbryos. J. Vis. Exp. (110), e53792, doi:10.3791/53792 (2016).
Abstract
Cell migration is key to many physiological and pathological conditions, including cancer metastasis. The cellular and molecular bases of cellmigration have been thoroughly analyzed in vitro. However, in vivo cell migration somehow differs from in vitro migration, and has proven moredifficult to analyze, being less accessible to direct observation and manipulation. This protocol uses the migration of the prospective prechordalplate in the early zebrafish embryo as a model system to study the function of candidate genes in cell migration. Prechordal plate progenitorsform a group of cells which, during gastrulation, undergoes a directed migration from the embryonic organizer to the animal pole of the embryo.The proposed protocol uses cell transplantation to create mosaic embryos. This offers the combined advantages of labeling isolated cells, whichis key to good imaging, and of limiting gain/loss of function effects to the observed cells, hence ensuring cell-autonomous effects. We describehere how we assessed the function of the TORC2 component Sin1 in cell migration, but the protocol can be used to analyze the function of anycandidate gene in controlling cell migration in vivo.
Video Link
The video component of this article can be found at http://www.jove.com/video/53792/
Introduction
In multicellular organisms, cell migration is essential both for the development of the embryo where it ensures the organization of cells intotissues and organs, and for adult life, where it takes part to tissue homeostasis (wound healing) and immunity. In addition to these physiologicalfunctions, cell migration is also involved in diverse pathological situations, including, in particular, cancer metastasis.
Cell migration has been analyzed in vitro for decades, providing an overall understanding of the molecular mechanisms ensuring cell movementson flat surfaces. In vivo however, cells are confronted by a more complex environment. It clearly appeared in the past years that migration withinan organism may be influenced by external cues such as the extracellular matrix, neighboring cells or secreted chemokines guiding migration,and that the mechanisms driving cell migration may vary from what has been described in vitro1,2. The mechanisms ensuring in vivo cellmigration have received less attention so far, mainly because of the increased technical difficulty, compared to in vitro studies. In vivo analysisof cell migration in particular requires direct optical access to migrating cells, techniques to label unique cells in order to see their dynamics andmorphology, as well as gain or loss of function approaches to test the role of candidate genes. So far, only a few model systems harboring thesecharacteristics have been used to dissect in vivo cell migration3.
We recently used the migration of the prospective prechordal plate in early zebrafish embryos as a new convenient model system to assessthe function of candidate genes in controlling in vivo cell migration4,5. Prospective prechordal plate (also known as anterior mesendoderm) is agroup of cells forming at the onset of gastrulation on the dorsal side of the embryo. During gastrulation this group collectively migrates towardsthe animal pole of the embryo6-8, to form the prechordal plate, a mesendodermal thickening, anterior to the notochord, and underlying the neuralplate. The anterior part of the prechordal plate will give rise to the hatching gland, while its posterior part likely contributes to head mesoderm9.Thanks to the external development and optical clarity of the fish embryo, cell migration can be directly and easily observed in this structure.
Cell transplantation is a very potent technique that allows for the rapid and easy creation of mosaic embryos10. Expressing fluorescentcytoskeletal markers in transplanted cells results in the labeling of isolated cells, the morphology and dynamics of which can be easily observed.Combining this to loss or gain of function approaches permits the analysis of cell-autonomous functions of a candidate gene.
The presented protocol describes how we assessed the function of the TORC2 component Sin1 in controlling cell migration and actin dynamicsin vivo5. But, as mentioned in the results and further discussed, it could be used to analyze the potential implication of any candidate gene incontrolling cell migration in vivo.
231

232

Journal of Visualized Experiments www.jove.com
Copyright © 2016 Journal of Visualized Experiments April 2016 | 110 | e53792 | Page 2 of 10
Protocol
Note: Figure 1 presents the outline of the protocol.
1. Preparation of the Needles for Injection and Transplantation
Note: Needles can be prepared at any time and stored. Keep them in a Petri dish, on a band of modeling clay. Seal the dish with parafilm toprotect from dust.
1. For injection needles, pull a glass capillary (outside diameter 1.0 mm, inside diameter 0.58 mm, without filament (see list of Materials)) witha micropipette puller (see list of Materials). Prefer short and thin needles (tapered part of about 5 mm) as they are more efficient for piercingthe chorion.
Note: The injection needles are single-use.2. Needle for Cell Transplantation
1. Pull a glass capillary (outside diameter 1.0 mm, inside diameter 0.78 mm, without filament (see list of Materials)) with a micropipettepuller.
2. Using a microforge (see list of materials), cut the tip of the needle at the point where the inside diameter is 35 µm (slightly more thanthe diameter of cells to be transplanted).
3. Bevel the cut extremity of the capillary with a microgrinder (see list of Materials) with an angle of 45°.4. Optionally, pull a barb on the end of the needle using a microforge. For this, touch the hot filament with the tip of the bevel and rapidly
pull it away, creating a barb that can help penetrating the embryo.5. Mount the needle on a needle holder attached to a syringe. Using the syringe, rinse the inside of the needle three times with 2%
hydrofluoric acid to eliminate glass residues, and then rinse three times with acetone.
Caution: hydrofluoric acid is toxic, manipulate under the hood, with gloves.
Note: The cell transplantation needles can be used several times.
2. Preparation of the Dishes for Injection and Cell Transplantation
1. Heat 50 ml of embryo medium11 containing 0.5 g of agarose in a microwave for 1 min at full power to get 1% agarose in embryo medium.Cool the agarose gel to about 60 °C and pour the 50 ml in a 90 mm Petri dish. Place at the surface of the gel a specially designed mold (seelist of material), either with lines for the injection dish or with wells for the cell transplantation dish.
1. Observe the mold float on the agarose, if the agarose is not too hot. After the agarose gel is set, remove the mold with forceps (Figure2A-B).
Note: dishes can be stored at 4 °C, up to a few weeks. Keep them in a closed wet box, to avoid drying.
2. Place the dish in a 28 °C incubator 30 min before use.
3. Collection of Embryos and Injection
1. Injection Solution Preparation
Note: Actin binding domain of the yeast actin binding protein 140 (ABP-140) such as Lifeact bound to mCherry (referred to as ABP140-mCherry) is used to visualize polymerized actin within the cell, in order to analyze the protrusive activity. Add another compound to testthe function of a candidate gene (e.g. mRNA of dominant negative or constitutively active construct, or Morpholino oligonucleotides). Toassess the functions of Sin1 as described in the results (Figure 3), we used Morpholino oligonucleotides. As a control, we used a morpholinoidentical to the sin1 morpholino but for 5 nucleotides distributed along the sequence so that this control morpholino doesn't match the targetRNA.
1. Thaw sin1 and 5-mismatch control morpholinos (2 mM stock solutions), and ABP140-mCherry mRNAs on ice. Add 375 ng of mRNAs(75 ng/µl final) and 0.75 µl of either sin1 or 5-mismatch control morpholino (0.3 mM final) in Danieau buffer (58 mM NaCl, 0.7 mM KCl,0.4 mM MgSO4, 0.6 mM Ca(NO3)2, 5.0 mM HEPES pH 7.6), to reach a total volume of 5 µl.
2. Embryo Collection
Note: for this experimental set up both donor and host embryos are transgenic, expressing the GFP under the control of the goosecoid (gsc)promoter in order to visualize the prospective prechordal plate11.
1. Collect Tg(gsc:gfp) eggs. Place about 80 eggs in a 90 mm Petri dish filled with embryo medium and incubate at 28 °C.
3. Inject Donor Embryos1. Under a stereomicroscope, gently squeeze collected embryos with forceps into the lines of an injection dish filled with embryo medium.
Using forceps, orient the embryos with the cells towards the top. Place the injection dish in the incubator at 28 °C until the embryoshave reached the 4-cell stage (1 hr post fertilization).
2. Load an injection needle with 2 µl of injection solution. Insert the needle in a needle holder (see list of materials) that is placed in amicro-manipulator (see list of materials) and connected with polytetrafluoroethylene (PTFE) tubing (see list of Materials) to an airtransjector (see list of materials).
3. Open the capillary by gently touching the tip with fine forceps. If necessary, cut the capillary open by pinching its extremity.4. Enter one of the four cells with the needle and inject the solution within the cell in order to fill 70% of the cell volume (2 nl). Inject 30
embryos.
233

234

Journal of Visualized Experiments www.jove.com
Copyright © 2016 Journal of Visualized Experiments April 2016 | 110 | e53792 | Page 3 of 10
Note: Getting the needle in the cell may be difficult, as the plasma membrane is soft. Aiming at the junction between the cell and theyolk facilitates needle penetration.
5. Place the embryos in the 28 °C incubator until they have reached the sphere stage (4 hours post fertilization).
4. Preparation of the Embryos for the Cell Transplantation
1. Prepare 20 ml of embryo medium with 200 µl penicillin/streptomycin (see list of materials) (Pen/Strep EM).2. Dechorionation of the embryos at the sphere stage (4 hr post fertilization)
Note: Dechorionated embryos are very fragile and will explode in case of contact with air or plastic. They thus need to be placed in agarose-coated dishes, and transferred with fire-polished glass Pasteur pipettes.
1. Using a plastic Pasteur pipette, transfer host embryos collected at step 3.2 and donor embryos injected at step 3.3 into two 35 mmPetri dishes coated with 1% agarose in embryo medium and filled with Pen/Strep EM. Keep host embryos and donor embryos in twoseparate dishes.
2. Manually extract the embryos from their chorions with fine tweezers (see list of materials).3. Place the embryos in the 28 °C incubator until they have reached the shield stage (6 hr post fertilization).
5. Cell Transplantation
1. Arrange the Embryos for the cell Transplantation.1. Under a fluorescent stereomicroscope, select donor embryos expressing ABP140-mCherry (red) within the shield (green).2. Using a fire-polished Pasteur pipette, transfer the embryos in the wells of the cell transplantation dish filled with Pen/Strep EM. Place
the host embryos in one row and the donor embryos in the neighboring row.3. Using an eyelash, carefully orient the embryos with the shield up.
Note: the position of the shield can be assessed by GFP expression or anatomically.
2. Transplantation System Set-up.
Note: The transplantation system is composed of a needle holder (see list of materials) connected with PTFE tubing (see list of Materials)and a tube connector (see list of Materials) to a Hamilton syringe equipped with a micro-drive (see list of Materials). The needle holder ismounted on a 3-way micromanipulator (see list of Materials).
1. Using a needle holder attached to a syringe, rinse the needle for cell transplantation with 70% ethanol. Dry by sucking up air into theneedle. Do not dry by blowing, as this may result in dust getting stuck in the tapered part of the needle.
2. Insert the needle in the needle holder connected to the Hamilton syringe, with the bevel upwards.
3. Shield-to-shield Cell Transplantation1. Enter the shield of a donor embryo with the transplantation needle and draw up about 10-20 cells labeled with ABP140-mCherry.
Carefully avoid drawing yolk.2. Transplant the cells into the shield of the host embryo. Repeat until all host embryos have been transplanted.3. Remove any damaged embryos with a fire-polished Pasteur pipette. Place the transplanted embryos in the incubator at 28 °C and let
them recover for about 30 min.4. Using a needle holder attached to a syringe, rinse the cell transplantation needle with water and place it back in a Petri dish on a band
of modeling clay. Seal the dish with parafilm.
6. (OPTIONAL) Single Cell Transplantation
Note: In the embryo, cells adhere to each other, so that it is difficult to draw only one cell in the transplantation needle. We developed a modifiedprotocol to easily transplant single prechordal plate progenitor cells. The idea is to dissociate cells prior to transplantation. Because isolatedprechordal plate progenitor cells tend to lose their identity, we genetically impose them a prospective prechordal plate identity, by activatingthe Nodal signaling pathway, in absence of the Sox32 transcription factor. We have verified that these induced cells behave like endogenousprechordal plate progenitor cells8. Below are the specific steps to perform single cell transplantations. Cell dissociation is achieved by placingembryos in Calcium-free Ringer11, dissecting an explant and mechanically stirring it.
1. At step 2.1, prepare the transplantation dish with 1% agarose in Calcium-free Ringer instead of Embryo Medium.2. At step 3.1, in addition to ABP140-mCherry RNA and sin1 morpholino, add 3 ng of RNAs encoding the active form of the Nodal receptor
Taram-A (0.6 ng/µl final) and 1.25 µl of morpholino against sox32 (stock solution at 2 mM, hence 0.5 mM final).3. After step 4, transfer three selected donor embryos in the dish for cell transplantation filled with Pen/Strep Calcium-free Ringer using a fire-
polished Pasteur pipette. With fine tweezers, dissect an explant containing the injected cells (ABP140-mCherry labeled cells). Rapidly discardthe rest of the embryos.
4. With an eyelash, gently stir the explant until cells dissociate.5. Draw up a single isolated cell in the transplantation needle and transplant it into the shield of a host embryo.6. Using a fire-polished Pasteur pipette, transfer the embryos in an agarose-coated dish filled with Pen/Strep EM. Place the embryos in the
incubator at 28 °C for 30 min.
7. Embryo Mounting
1. Imaging Chamber
235

236

Journal of Visualized Experiments www.jove.com
Copyright © 2016 Journal of Visualized Experiments April 2016 | 110 | e53792 | Page 4 of 10
1. Method 1: use an imaging chamber composed of a plastic slide (75*25*0.5 mm) pierced with 4 holes (5.5 mm diameter), with 3 mmhigh edges on one side (Figure 2C-D). Glue a glass coverslip on the back side, with cyanoacrylate glue (super glue).
Note: At the end of the experiment, place the chamber in water for one night to remove the coverslip and get rid of glue residues withsand paper.
2. Method 2: use 35 mm MatTek glass bottom dishes (see list of Materials) with a 10 mm hole.
2. Embryo Mounting1. Fill up a glass vial with 1 ml of hot 0.2 % agarose in embryo medium. Keep it at 42 °C in a heat-block.2. Under the fluorescent stereomicroscope, select an embryo in which red transplanted cells are part of the prospective prechordal plate
labeled in green (i.e. red transplanted cells are within the green prospective prechordal plate, and have started migrating towards theanimal pole).
3. Transfer a selected embryo into the agarose solution with a fire-polished Pasteur pipette. Discard the excess of embryo mediumfrom the pipette. Draw the embryo in the pipette with agarose, and transfer the embryo in the imaging chamber, depositing a drop ofagarose. Before agarose is set, orient the embryo with an eyelash. Place the prospective prechordal plate upwards for imaging withan upright microscope, or on the glass bottom for imaging with an inverted microscope. Wait until the agarose is set (around 1 min,depending on room temperature) before mounting another embryo in the next well of the chamber.
Note: an imaging chamber containing 4 wells allows mounting up to 4 embryos.4. When the agarose is set, fill the chamber with Pen/Strep EM to avoid drying.
8. Live Imaging
1. Use a 40X water-immersion long-range lens. Use appropriate filter sets to image GFP and mCherry (for GFP: excitation BP 470/40, beamsplitter FT 510, and emission BP 540/50; for mCherry: excitation BP 578/21, beam splitter FT 596, and emission LP 641/75). Adjust exposureduration in order to optimize image dynamics.
2. To image all cells in the plate, acquire z-stacks, starting a few µm above the prospective prechordal plate (in the ectoderm) and ending a fewµm below the prospective prechordal plate (in the yolk). Use a z-step of 2 µm. To optimize acquisition speed, switch colors between z-stacksrather than between frames.
Note: This may lead to slight differences between the green and red images, but is not a problem since no precise co-localization betweenthe green and red signals is required. To reduce further imaging time and exposure to light, green may be acquired only once every 5 timepoints, which is sufficient to identify prechordal plate progenitor cells.
3. Using such settings, image up to 4 embryos within the two-minute time interval which is necessary to analyze protrusion frequency andorientation. For analysis of protrusion lifetime, reduce time interval to 30 sec to get higher time resolution. Image from 60% epiboly to 80%epiboly.
9. Cell Dynamics Analysis
1. Load 4D images in ImageJ
Note: Depending on the software used for acquisition, images are stored in different formats (one file per image, one file per z-stack, one filefor the whole experiment). Some ImageJ Plugins are available online to open 4D stacks. Our data are stored as one file per z-stack. Becausethe dataset can be large, it may be convenient to open only part of it (some time points, or a subpart of the z-stack, or 8-bit convertedimages…). We use a custom-made ImageJ plugin to do so, which we would be happy to distribute on request.
2. Analysis of the Orientation and Frequency of Cell Protrusions1. Use GFP images to determine the main direction of prospective prechordal plate migration. Take this as a reference for cell protrusions
angle measurements. Rotate the stack, so that this reference direction is parallel to one side of the image.2. Follow one cell. Select angle tool. For each frame and each protrusion, use the angle tool to measure the angle between the protrusion
and the reference direction (Figure 3A). Use the Analyze/Measure command to store the value (or press M on keyboard). Save theresults as a txt file. Repeat with the next cell.
3. Import the data into R and plot angle distribution as histograms. Use the Kolmogorov-Smirnov test (ks.test in R) to compare differentconditions.
Note: The angle tool provides values comprised between 0° and 180°, allowing the use of classical statistical tests and not circulartests.
4. With this data set, calculate emission frequency as the number of protrusions per cell per minute. Use Student T-test (t.test in R) tocompare different conditions.
3. Analysis of the Cell Protrusions Lifetime1. For each cell and each protrusion, measure protrusion duration (number of frames during which the protrusion is present x time-interval
between frames).2. Import the data into R. Use Student T-test (t.test in R) to compare different conditions.
Note: Other migration features can be interesting to analyze in order to characterize the cell migration. These include cell tracks, forspeed, direction and persistence measurements, or cell morphology. Some commercial software applications are available to measurethese features, but a large number of open-source software applications and ImageJ plugins are also available, as for instance ADAPTto analyze morphodynamics12, DiPer to look at cell trajectories and directional persistence13, CellTrack to track cell boundaries duringthe migration14.
237

238

Journal of Visualized Experiments www.jove.com
Copyright © 2016 Journal of Visualized Experiments April 2016 | 110 | e53792 | Page 5 of 10
Representative Results
The presented technique was used to analyze the role of Sin1, one of the core components of the Tor complex 2 (TORC2), in controlling in vivocell migration. The use of cell transplantation permits labeling of isolated cells and analysis of cell-autonomous effects. Movie S1 shows themigration of transplanted prechordal plate progenitor cells. Actin labeling with ABP140 allows the easy visualization of actin-rich cytoplasmicprotrusions. We measured their frequency and orientation. Wild-type cells produce frequent large cytoplasmic protrusions oriented in direction ofthe animal pole, i.e. in the direction of migration (Figure 3B). Loss of function of Sin1 leads to a drastic reduction of the number of protrusions,and randomization of the remaining ones, demonstrating the importance of sin1 in controlling actin-rich protrusion formation. Interestingly, thisphenotype can be rescued by expression of a constitutively active form of Rac115, strongly suggesting that TorC2 controls actin dynamics andcell protrusion formation through Rac1 (Figure 3B).
The presented technique was also used to characterize the role of Arpin, a recently identified inhibitor of the Arp2/3 complex, on cell dynamics4.Loss of Arpin function leads to an increase in protrusion frequency (average rate of cells harboring a protrusion at a given time). This could bedue either to more frequent protrusion formation or to an increase in protrusion stability. Measuring protrusion lifetime revealed that, in absenceof Arpin, protrusion temporal persistence is doubled (Figure 3C). This is consistent with the role of Arpin as an Arp2/3 inhibitor, which wouldfacilitate protrusion retraction, and suggests that Arpin affects protrusion frequency by modulating protrusion stability, rather than protrusioninitiation.
Figure 1: Outline of the Procedure. Tg(gsc:gfp) embryos are injected at the 4-cell stage (1 hr post fertilization). After 5 hr at 28 °C, embryosshowing ABP140-mCherry positive cells within the shield (GFP +) are selected as donor embryos. Shield cells are drawn up within thetransplantation needle and transferred into the shield of a host embryo. After 0.5 hr of recovery, host embryos are mounted and imaged with anepifluorescent microscope (40X objective). hpf: hours post fertilization. Please click here to view a larger version of this figure.
239

240

Journal of Visualized Experiments www.jove.com
Copyright © 2016 Journal of Visualized Experiments April 2016 | 110 | e53792 | Page 6 of 10
Figure 2: Transplantation Dish and Imaging Chamber. (A) Transplantation dish with individual wells. (B) Mold for cell transplantation dish. (C)Home-made imaging chamber. (D) Schematic drawing of the home-made imaging chamber. Scale bar = 1 cm. Please click here to view a largerversion of this figure.
241

242

Journal of Visualized Experiments www.jove.com
Copyright © 2016 Journal of Visualized Experiments April 2016 | 110 | e53792 | Page 7 of 10
Figure 3: Results from Cell Dynamics Analysis. (A) Scheme of protrusion angle measurement. (B) Analysis of cell protrusion orientation andfrequency. In absence of Sin1 (Mo-Sin1), cells emit fewer protrusions and the remaining protrusions are randomly oriented. This phenotype canbe rescued by expression of a constitutively active form of the GTPase Rac1 (Mo-Sin1 + CA-Rac1). Modified from Dumortier and David, 20155.(C) Analysis of protrusion lifetime. In absence of Arpin (Mo-Arpin), protrusion frequency is increased. This is due to an increase in protrusionlifetime. Reintroducing an arpin RNA insensitive to the morpholino restores this hyper protrusive phenotype. Modified from Dang et al., 20134.Scale bar = 10 µm. A: Anterior; P: Posterior, L: Left, R: Right. Please click here to view a larger version of this figure.
Movie 1: Sin1 controls formation of cell protrusions, through Rac1 (Right click to download). Transplanted prechordal plate progenitorcells, injected with ABP140-mCherrry RNAs and a control morpholino, or the sin1 morpholino, or the sin1 morpholino and RNAs for theconstitutive form of Rac1. Protrusion frequency and orientation were measured on these images.
243

244

Journal of Visualized Experiments www.jove.com
Copyright © 2016 Journal of Visualized Experiments April 2016 | 110 | e53792 | Page 8 of 10
Discussion
This protocol presents an easy way to study the role of a candidate gene in cell migration in vivo, by combining the creation of chimeric embryosusing cell transplantation with live imaging.
Creation of mosaic embryos
Studying the dynamics of a cell requires the visualization of its contour to analyze cytoplasmic extensions. This can be achieved by labelingisolated cells in an otherwise unlabeled – or differently labeled - environment, thus offering good visual contrast.
An easy way to stochastically label a portion of cells in the embryo is to inject plasmidic DNA at the 1-cell stage16. The injected plasmids formaggregates that are randomly and unequally segregated in cells during cell division. This leads to the expression of the plasmid in a randomsubset of cells, and thus represents a very fast, easy and non-invasive method for generating mosaic embryos. However, cells expressingthe injected plasmid tend to form clusters, and the probability of finding embryos containing few isolated expressing cells in the prospectiveprechordal plate is quite low. Furthermore, use of plasmidic DNA offers very limited control of the expression level of the injected construct.The creation of chimeric embryos by cell transplantation, although technically more difficult than plasmidic DNA injection, offers a number ofadvantages: control of the number of transplanted cells, control of the expression level of the constructs (RNA injection), and last but not least,cell transplantations allow to test for cell-autonomous effects, by creating mosaic embryos in which transplanted cells contain loss or gain offunction constructs. Conversely, transplantations can also be used to assess the non-autonomous role of the environment by transplanting wild-type cells into embryos that have been modified. This can be of particular interest for testing for instance, the function of extracellular matrixcomponents that are particularly relevant for cell migration analysis.
A detailed protocol for cell transplantation has already been described10. Compared to this protocol, we would like to discuss two maindifferences in our procedure.
The first difference is related to the stage of donor embryos injection. According to our experience, embryos injected at the 1-cell stage withRNAs of a fluorescent protein do not express homogeneously the fluorescent protein in all cells, due to an incomplete diffusion of the RNAs inthe cell. Injection of donor embryos at the 4-cell stage in one of the four cells allows to get a homogeneous clone of cells, which is of particularinterest when RNAs of the fluorescent protein are co-injected with other RNAs that are not traceable.
The second main difference is the use of air instead of oil in the transplantation syringe. The main drawback of an air-filled system is the inertiaresulting from the elasticity of the air. Oil on the contrary, being incompressible, offers good control of suction and pressure. However, with alittle training, and by maintaining the interface between air and embryo medium in the thin, tapered part of the needle, the control of suctionand pressure with an air-filled system is sufficient for transplanting cells at the shield stage. For later stages, as cells become smaller and morecohesive, the suction requires a high pressure that needs to be very precisely controlled, which can't be achieved with an air-filled setup. Usingair instead of oil eases the setup, as filling the system with oil without any air bubble is tricky. Furthermore, it avoids filling the transplantationneedle with oil. This allows transplantation needles to be reused, and hence to be carefully prepared. We feel that a needle without sharp edgesand of the correct diameter is key to successful transplantation. This transplantation step is clearly one of the critical steps in the protocol, whichrequires practice before being easily performed.
We have also proposed a specific procedure for transplanting single cells, which consists in dissociating cells prior to transplantation, in orderto draw a unique cell in the transplantation needle. This implies that transient cell dissociation will not modify their identity and/or behavior. Forprechordal plate progenitor cells, we genetically impose cell identity, and have carefully checked that these cells behave like non-dissociatedones. However, we cannot formally exclude that dissociation and/or genetic induction induce unnoticed modifications in the cells. Transplantingsingle cells without dissociating them is feasible. Cells should be drawn up carefully in the transplantation needle. However, at least in our hands,success rate is quite low, either because more than one cell gets into the needle, or because the cell shears when drawn up and dies in theneedle or once transplanted.
Epifluorescence versus fast confocal imaging
The use of cell transplantation to create mosaic embryos allows for the labeling of isolated cells, separated from other labeled cells. In thiscontext, good imaging of cell morphology and dynamics can be achieved with standard epifluorescence microscopy, as proposed in the protocol.This has the obvious advantage of being a relatively wide-spread equipment and a low-cost alternative to more expensive confocal imagingsystems.
For precise subcellular localizations, confocal imaging can be used to improve resolution, in particular axial resolution. To still get sufficienttemporal resolution, fast confocal imaging should be used. From our experience, spinning-disc microscopes offer a good compromise betweenresolution, speed and photo-toxicity. Fast scanning confocal microscopes (like resonant scanning microscopes) are good options as well, butless frequent and more expensive.
Cytoskeleton labeling
Good labeling of actin filaments and their dynamics is crucial to study mechanisms of actin-based cell migration. Although membrane-boundfluorescent markers are more efficient to analyze the cell outlines, actin labeling allows a much better visualization of the cell protrusions. Inparticular, if three labeled cells get in contact, it is very difficult to identify a cytoplasmic extension located between two neighboring cells as theoutline of the extension and the membrane of the neighboring cells can get mixed up. Labeling actin filaments allows the unambiguous detectionof actin-based cell protrusions, on which we focused. If cell morphology was to be quantified, a membrane labeling would be preferable. Anotheroption is to use both labeling, either using 3-color imaging (one for the transgenic line, one for actin and one for membrane), or by GFP labeling
245

246

Journal of Visualized Experiments www.jove.com
Copyright © 2016 Journal of Visualized Experiments April 2016 | 110 | e53792 | Page 9 of 10
the membrane. In the transgenic line, GFP is cytoplasmic, and goosecoid-GFP positive cells can thus be identified, even if the membrane is GFPlabeled.
Over the past years, a number of probes have been used to label actin in live samples. The first ones were direct fusions to actin monomers.These presented two major drawbacks. First, they labeled all actin and not specifically polymerized actin. Second, they were frequently toxic.The probes currently in use are filamentous actin binding domains fused to fluorescent reporters. In this protocol, we used ABP14017 (actinbinding domain of the yeast actin binding protein 140), which is currently the most frequently used marker for filamentous actin, and labels allfilamentous actin. Utrophin18 (calponin homology domain) also labels filamentous actin, but appears to label only stable filaments. This differencehas been used to identify dynamic actin filaments, as the ones labeled by ABP140 and not Utrophin19.
Recently it has been reported in fly that ABP140 and Utrophin could have toxic effects, in particular over long expression20. Even though wehave not noticed any migration defects in ABP140-labeled cells, we cannot exclude that ABP140 expression may perturb endogenous actindynamics. A third probe for filamentous actin was recently reported21. F-tractin (actin-binding domain from rat inositol triphosphate 3-kinase) hasbeen described as a faithful reporter of filamentous actin, which would not show toxic effects20,22. To our knowledge, the use of F-tractin has notbeen reported in zebrafish yet.
In addition to actin, many other cell constituents could be labeled to improve our understanding of the cell migration. This includes othercytoskeletal components like myosin, microtubules, centrosomes, as well as known regulators of cell migration (activated forms of the smallGTPases Rho, Rac and Cdc42, fluorescent probes for PIP3…) or proteins involved in cell adhesion (integrins, cadherins…).
Overall, this protocol regroups a number of previously described tools and techniques to propose a rapid and easy system to test theinvolvement of a candidate gene in controlling cell migration in vivo. We used prospective prechordal plate migration as it is an interesting modelof directed collective migration, and because of the available transgenic line labeling it. However, a similar protocol could be adapted to analyzeother migration events occurring during development.
Disclosures
The authors have nothing to disclose.
Acknowledgements
We thank F. Bouallague and the IBENS animal facility for excellent zebrafish care. Research reported in this publication was supported by theFondation ARC pour la recherche sur le cancer, grants N° SFI20111203770 and N° PJA 20131200143.
References
1. Charras, G., & Sahai, E. Physical influences of the extracellular environment on cell migration. Nature Reviews Molecular Cell Biology. 15(12), 813-824 (2014).
2. Friedl, P., & Wolf, K. Plasticity of cell migration: A multiscale tuning model. Journal of Cell Biology. 188 (1), 11-19 (2010).3. Friedl, P., & Gilmour, D. Collective cell migration in morphogenesis, regeneration and cancer. Nature reviews. Molecular cell biology. 10 (7),
445-57 (2009).4. Dang, I., Gorelik, R., et al. Inhibitory signalling to the Arp2/3 complex steers cell migration. Nature. (2013).5. Dumortier, J. G., & David, N. B. The TORC2 Component, Sin1, Controls Migration of Anterior Mesendoderm during Zebrafish Gastrulation.
Plos One. 10, e0118474 (2015).6. Solnica-Krezel, L., Stemple, D. L., & Driever, W. Transparent things: cell fates and cell movements during early embryogenesis of zebrafish.
BioEssays. 17 (11), 931-9 (1995).7. Ulrich, F., Concha, M. L., et al. Slb/Wnt11 controls hypoblast cell migration and morphogenesis at the onset of zebrafish gastrulation.
Development. 130 (22), 5375-84 (2003).8. Dumortier, J. G., Martin, S., Meyer, D., Rosa, F. M., & David, N. B. Collective mesendoderm migration relies on an intrinsic directionality
signal transmitted through cell contacts. Proceedings of the National Academy of Sciences of the United States of America. 1-6 (2012).9. Gritsman, K., Talbot, W. S., & Schier, a F. Nodal signaling patterns the organizer. Development. (Cambridge, England) 127 (5), 921-932
(2000).10. Kemp, H. A., Carmany-Rampey, A., & Moens, C. Generating chimeric zebrafish embryos by transplantation. Journal of visualized
experiments : JoVE. (29) (2009).11. Westerfield, M. The zebrafish book. A guide for the laboratory use of zebrafish (Danio rerio). (2000).12. Barry, D. J., Durkin, C. H., Abella, J. V., & Way, M. Open source software for quantification of cell migration, protrusions, and fluorescence
intensities. The Journal of Cell Biology. 209 (1), 163-180 (2015).13. Gorelik, R., & Gautreau, A. Quantitative and unbiased analysis of directional persistence in cell migration. Nature Protocols. 9 (8), 1931-1943
(2014).14. Sacan, A., Ferhatosmanoglu, H., & Coskun, H. CellTrack: An open-source software for cell tracking and motility analysis. Bioinformatics. 24
(14), 1647-1649 (2008).15. Tahinci, E., & Symes, K. Distinct functions of Rho and Rac are required for convergent extension during Xenopus gastrulation. Developmental
biology. 259 (2), 318-35 (2003).16. Zhang, T., Yin, C., et al. Stat3-Efemp2a modulates the fibrillar matrix for cohesive movement of prechordal plate progenitors. Development.
141 (22), 4332-4342 (2014).17. Riedl, J., Crevenna, A. H., et al. Lifeact: a versatile marker to visualize F-actin. Nature methods. 5 (7), 605-7 (2008).18. Burkel, B. M., Von Dassow, G., & Bement, W. M. Versatile fluorescent probes for actin filaments based on the actin-binding domain of
utrophin. Cell Motility and the Cytoskeleton. 64 (11), 822-832 (2007).
247

248

Journal of Visualized Experiments www.jove.com
Copyright © 2016 Journal of Visualized Experiments April 2016 | 110 | e53792 | Page 10 of 10
19. Yoo, S. K., Deng, Q., Cavnar, P. J., Wu, Y. I., Hahn, K. M., & Huttenlocher, A. Differential regulation of protrusion and polarity by PI3K duringneutrophil motility in live zebrafish. Developmental cell. 18 (2), 226-36 (2010).
20. Spracklen, A. J., Fagan, T. N., Lovander, K. E., & Tootle, T. L. The pros and cons of common actin labeling tools for visualizing actin dynamicsduring Drosophila oogenesis. Developmental biology. 393 (2), 209-26 (2014).
21. Johnson, H. W., & Schell, M. J. Neuronal IP3 3-kinase is an F-actin-bundling protein: role in dendritic targeting and regulation of spinemorphology. Molecular biology of the Cell. 20 (24), 5166-80 (2009).
22. Yi, J., Wu, X. S., Crites, T., & Hammer, J. A. Actin retrograde flow and actomyosin II arc contraction drive receptor cluster dynamics at theimmunological synapse in Jurkat T cells. Molecular Biology of the Cell. 23 (5), 834-852 (2012).
249