INTERNAL CASH FLOW, INSIDER OWNERSHIP, AND CAPITAL EXPENDITURES: A TEST OF THE PECKING ORDER AND...
21
Journal of Bwiness Finance &Accounting, 22(2), March 1995, 0306-686X INTERNAL CASH FLOW, INSIDER OWNERSHIP, AND CAPITAL EXPENDITURES: A TEST OF THE PECKING ORDER AND MANAGERIAL HYPOTHESES EMMETT H. GRINER AND LAWRENCE A. GORDON* INTRODUCTION Corporate capital expenditures are of key importance for several reasons. At the macroeconomic level, capital expenditures are an important part of aggregate demand and gross national product, economic growth, and business cycles (Dornbusch and Fisher, 1987). At the microeconomic level, capital expenditures affect a firm’s production decisions (Nicholson, 1992) and strategic plans (Bromiley, 1986). Capital expenditures also have been linked directly to firm performance (McConnell and Muscarella, 1985). Consequently, a large body of research has attempted to establish the factors that determine the level of corporate capital expenditures. The classic readings in this area include work by Kuh and Meyer (1957), Dusenberry (1958), Jorgenson (1963), Kuh (1963), Jorgenson and Siebert (1968), Grabowski and Mueller (1972), and Elliot (1973). Research concerning the determinants of corporate capital expenditures has continued to the present day, largely because of the importance of the issue and the mixed findings of the early studies. Works by such individuals as Nair (1979), Berndt et al. (1980), Larcker (1983), Fazzari and Athey (1987), Fazzari et al. (1988), Waegelein (1988), Madan and Prucha (1989), and Gaver (1992) have contributed to our understanding of the determinants of capital expenditure levels. One unresolved issue in this area is the role of internal cash flow.* Although previous studies have established that internal cash flow is an important determinant of capital expenditures, there is disagreement as to why this is the case. The two agency-based arguments that have been proposed are known as the ‘pecking order’ and ‘managerial’ hypotheses. According to the pecking order hypothesis set forth by Myers (1984) and Myers and Majluf (1984), managers choose the level of capital expenditures that maximizes the wealth of current shareholders, regardless of the managers’ ownership stake in the firm. Managers are forced to rely on internal cash flow for financing due to information asymmetries between themselves and potential new shareholders. * The authors are respectively, Assistant Professor, Culverhouse School of Accountancy, University’ of Alabama; and Ernst and Young Alumni Professor of Managerial Accounting, University of Maryland. (Paper received December 1992, revised and accepted March 1993) Address for correspondence: Lawrence A. Gordon, Ernst and Young Alumni Professor of Managerial Accounting, College of Business and Management, University of Maryland, College Park, Maryland 20742, USA. @ Basil Blackwell Ltd. 1995, 108 Cowlcy Road, Oxford OX4 1JF. UK and 238 Main Street, Cambridge, MA 02142, USA. 179
Transcript of INTERNAL CASH FLOW, INSIDER OWNERSHIP, AND CAPITAL EXPENDITURES: A TEST OF THE PECKING ORDER AND...

Journal of Bwiness Finance &Accounting, 22(2), March 1995, 0306-686X
INTERNAL CASH FLOW, INSIDER OWNERSHIP, AND CAPITAL EXPENDITURES: A TEST OF THE
PECKING ORDER AND MANAGERIAL HYPOTHESES
EMMETT H. GRINER AND LAWRENCE A. GORDON*
INTRODUCTION
Corporate capital expenditures are of key importance for several reasons. At the macroeconomic level, capital expenditures are an important part of aggregate demand and gross national product, economic growth, and business cycles (Dornbusch and Fisher, 1987). At the microeconomic level, capital expenditures affect a firm’s production decisions (Nicholson, 1992) and strategic plans (Bromiley, 1986). Capital expenditures also have been linked directly to firm performance (McConnell and Muscarella, 1985).
Consequently, a large body of research has attempted to establish the factors that determine the level of corporate capital expenditures. The classic readings in this area include work by Kuh and Meyer (1957), Dusenberry (1958), Jorgenson (1963), Kuh (1963), Jorgenson and Siebert (1968), Grabowski and Mueller (1972), and Elliot (1973). Research concerning the determinants of corporate capital expenditures has continued to the present day, largely because of the importance of the issue and the mixed findings of the early studies. Works by such individuals as Nair (1979), Berndt et al. (1980), Larcker (1983), Fazzari and Athey (1987), Fazzari et al. (1988), Waegelein (1988), Madan and Prucha (1989), and Gaver (1992) have contributed to our understanding of the determinants of capital expenditure levels.
One unresolved issue in this area is the role of internal cash flow.* Although previous studies have established that internal cash flow is an important determinant of capital expenditures, there is disagreement as to why this is the case. The two agency-based arguments that have been proposed are known as the ‘pecking order’ and ‘managerial’ hypotheses. According to the pecking order hypothesis set forth by Myers (1984) and Myers and Majluf (1984), managers choose the level of capital expenditures that maximizes the wealth of current shareholders, regardless of the managers’ ownership stake in the firm. Managers are forced to rely on internal cash flow for financing due to information asymmetries between themselves and potential new shareholders.
* The authors are respectively, Assistant Professor, Culverhouse School of Accountancy, University’ o f Alabama; and Ernst and Young Alumni Professor of Managerial Accounting, University of Maryland. (Paper received December 1992, revised and accepted March 1993)
Address for correspondence: Lawrence A. Gordon, Ernst and Young Alumni Professor of Managerial Accounting, College of Business and Management, University of Maryland, College Park, Maryland 20742, USA.
@ Basil Blackwell Ltd. 1995, 108 Cowlcy Road, Oxford OX4 1JF. UK and 238 Main Street, Cambridge, MA 02142, USA.
179
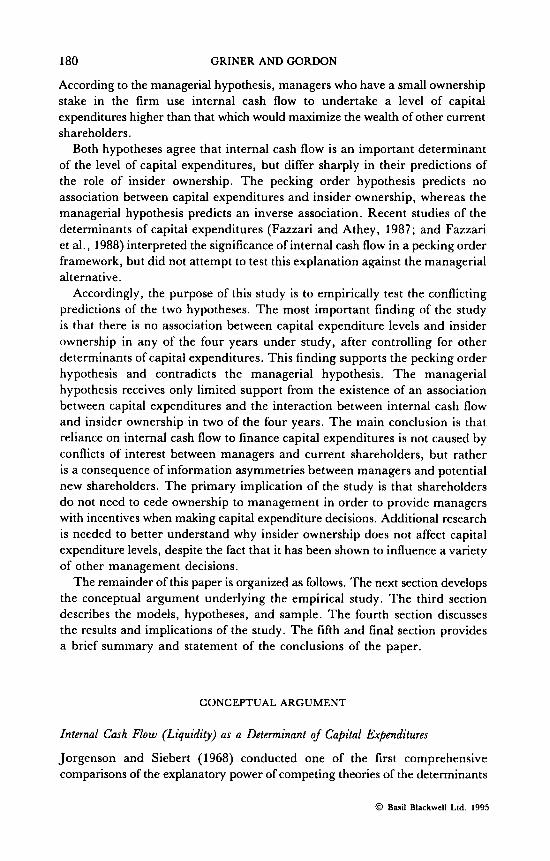
180 GRINER AND GORDON
According to the managerial hypothesis, managers who have a small ownership stake in the firm use internal cash flow to undertake a level of capital expenditures higher than that which would maximize the wealth of other current shareholders.
Both hypotheses agree that internal cash flow is an important determinant of the level of capital expenditures, but differ sharply in their predictions of the role of insider ownership. The pecking order hypothesis predicts no association between capital expenditures and insider ownership, whereas the managerial hypothesis predicts an inverse association. Recent studies of the determinants of capital expenditures (Fazzari and Athey, 1987; and Fazzari et al., 1988) interpreted the significance of internal cash flow in a pecking order framework, but did not attempt to test this explanation against the managerial alternative.
Accordingly, the purpose of this study is to empirically test the conflicting predictions of the two hypotheses. The most important finding of the study is that there is no association between capital expenditure levels and insider ownership in any of the four years under study, after controlling for other determinants of capital expenditures. This finding supports the pecking order hypothesis and contradicts the managerial hypothesis. The managerial hypothesis receives only limited support from the existence of an association between capital expenditures and the interaction between internal cash flow and insider ownership in two of the four years. The main conclusion is that reliance on internal cash flow to finance capital expenditures is not caused by conflicts of interest between managers and current shareholders, but rather is a consequence of information asymmetries between managers and potential new shareholders. The primary implication of the study is that shareholders do not need to cede ownership to management in order to provide managers with incentives when making capital expenditure decisions. Additional research is needed to better understand why insider ownership does not affect capital expenditure levels, despite the fact that it has been shown to influence a variety of other management decisions.
The remainder of this paper is organized as follows. The next section develops the conceptual argument underlying the empirical study. The third section describes the models, hypotheses, and sample. The fourth section discusses the results and implications of the study. The fifth and final section provides a brief summary and statement of the conclusions of the paper.
CONCEPTUAL ARGUMENT
Internal Cash Flow (Liquidity) as a Determinant of Capital Expenditures
Jorgenson and Siebert (1968) conducted one of the first comprehensive comparisons of the explanatory power of competing theories of the determinants
0 Basil Blackwell Ltd. 1995

CASH FLOW, INSIDER OWNERSHIP, CAPITAL EXPENDITURES 181
of capital expenditures. Based on a time series analysis of fifteen large manufacturing firms over twenty years, they ranked the models in the following order: (1) neoclassical, (2) sales accelerator, (3) expectations, and (4) liquidity. Elliot (1973) extended the work of Jorgenson and Siebert (1968) by conducting cross-sectional and time series analyses using a sample of 184 manufacturing and non-manufacturing firms. In Elliot’s study, the liquidity model ranked first in both the cross-sectional and time series results. Nair (1979) showed that the rankings of the various models were in part dependent on the accounting techniques utilised. Grabowski and Mueller ( 1972) compared the explanatory power of a neoclassical shareholder welfare model to that of a liquidity-based managerial welfare model and concluded that the latter was ‘both conceptually and statistically superior’ (Grabowski and Mueller, 1972, p. 23). More recently, Fazzari and Athey (1987) and Fazzari et al. (1988) offered evidence that liquidity adds significant explanatory power to a variety of capital expenditure models.
Although previous studies are generally in agreement that internal cash flow is an important determinant of capital expenditure levels, there is substantial disagreement as to why this is the case. Agency theorists have proposed two conflicting explanations for the observed reliance on internal cash flow to finance capital expenditures. These two explanations are known as the ‘pecking order’ and ‘managerial’ hypotheses.
The pecking order hypothesis does not acknowledge a conflict of interest between managers and current shareholder^.^ According to the pecking order hypothesis proposed by Myers (1984) and Myers and Majluf (1984), managers are forced into reliance on internal cash flow because of information asymmetries between themselves and potential new shareholders. When managers who are seeking to maximize the wealth of current shareholders have information that is not available to potential new shareholders, the new investors reduce the price they are willing to pay for the new shares under the assumption that managers will use the private information to act in the best interests of current shareholders. If the private information is favorable, managers who wish to use external finance are required to issue under-valued shares. Managers who rely entirely on external financing will be denied funds for some of the capital expenditures that would increase the wealth of current shareholders. According to the pecking order hypothesis, the reliance on internal cash flow results from managers seeking to avoid the under-valuation of shares imposed by imperfect external capital markets, thereby maintaining the ability to undertake all capital expenditures that would increase the wealth of current shareholders.
In contrast, the managerial hypothesis focuses on the conflicts of interest between managers and current shareholders that arise from the separation of ownership and control. Berle and Means (1932) were among the first to acknowledge conflicts between managers and owners. Marris (1964) emphasized internal cash flow and capital expenditures as focal points for this conflict by arguing that managers tend to retain and re-invest a greater portion of earnings than is in the best interest of shareholders. In a similar spirit, Grabowski and
0 Basil Blackwell Ltd. 1995

182 GRINER AND GORDON
Mueller (1972) argued that reliance on internal cash flow to finance capital expenditures is a manifestation of managers acting in their own interest to the detriment of shareholders. Jensen and Meckling (1976) framed the conflict between managers and owners in terms of agency theory. More recently, Jensen (1986) used an agency argument to conclude that ‘the problem is how to motivate managers to disgorge the cash rather than invest it’ in capital expenditures that do not serve the interests of shareholders Uensen, 1986, p. 323). Several authors have argued that the agency conflicts are reduced (but not eliminated) by a variety of market mechanisms Uensen and Meckling, 1976; Fama, 1980; Jensen and Ruback, 1983; Hart, 1983; and Jensen, 1986).
Internal Cash Flow, Insider Ownership, and Capital Expenditures
Managerial theories hinge upon the separation of ownership and control. According to Jensen and Meckling (1976), managers who own less than one- hundred percent of the firm have incentives and opportunities to take actions that do not benefit other owners. The incentive exists because managers enjoy all of the non-pecuniary benefits of their actions without having to bear all of the pecuniary costs. The opportunity arises as a result of the inability of owners to costlessly observe all of the actions taken by management. The divergence of preference between managers and owners, in conjunction with the information asymmetries resulting from the separation of ownership and control, has led to the use of mechanisms for aligning the interests of managers and owners. Two such mechanisms are accounting-based compensation plans and insider ownership of shares and options.
Larcker (1983) found that adoption of long-term performance plans was associated with increases in capital expenditures and shareholder returns. Waegelein (1988) obtained similar results for firms that adopted short-term bonus plans. Newman (1989) found that the degree of capital intensity was associated with the choice of after-tax versus pre-tax earnings measures in managerial compensation plans. Gaver (1992) found that firms adopted long- term performance plans in part to align management incentives and shareholder interests in the presence of stagnant investment opportunities sets. Collectively, this body of literature supports the argument that capital expenditure levels are affected by agency considerations and that incentive-based compensation plans are used to attempt to align the interests of managers and shareholder^.^
Little is known about the relation between insider ownership and capital expenditures. However, there is a large body of research that investigates the other effects of insider ownership. Analytical work by Haugen and Senbet (1981) showed that insider ownership of options can provide managers with incentives to make decisions that promote the interests of shareholders. Morck et al. (1988) found an association between insider ownership and the financial performance of the firm. Jensen et al. (1992) empirically established interdependencies among insider ownership, debt levels, and dividend policies. Walkling and Long (1984),
@ Basil Blackwell Lid. 1995

CASH FLOW, INSIDER OWNERSHIP, CAPITAL EXPENDITURES 183
Benston (1985), Agrawal and Mandelker (1987), and Sicherman and Pettway (1987) offered evidence that insider ownership affects the level and nature of merger and acquisition activity entered into by firms. As noted by Benston (1985, p. 82):
. . . stock ownership is an important means by which the managers are induced to act in the interests of shareholders.
The fact that several studies have found effects of insider ownership on a broad range of decisions lends credence to the possibility that insider ownership influences capital expenditure level^.^'^
According to the managerial hypothesis, internal cash flow provides the opportunity for self-seeking managers to make capital expenditures, and low levels of insider ownership provide the incentive for managers to choose a level of capital expenditures higher than that preferred by other shareholders. According to the pecking order hypothesis, reliance on internal cash flow is a consequence of managers acting in the best interest of current shareholders, regardless of the level of insider ownership. The purpose of this study is to test the conflicting predictions of the pecking order and managerial hypotheses. The next section describes the models, statistical hypotheses, and sample that are used in the study.
EMPIRICAL PROCEDURES
Two basic steps are followed to test the pecking order and managerial hypotheses. First, we examine bivariate associations between capital expenditures, internal cash flow, and insider ownership. Second, we propose a benchmark equation to control for other factors that are known to influence capital expenditure levels, and then extend the benchmark to include internal cash flow, insider ownership, and their interaction. This section specifies the regression equations, states the statistical hypotheses to be tested, defines the variables, and describes the sample. The Appendix provides a listing of the sample firms for each year.
Bivasiate Analysis
The pecking order and managerial hypotheses agree that internal cash flow should have an important influence on the level of capital expenditures. For this reason, the first step in the analysis is to estimate the equation:’
Capexp(t) = BO + Bl*[Flow(t)].
Capexp(t) is the amount of expenditures on property, plant, and equipment (Cornpustat item No. 30). We follow Lehn and Poulsen (1989) and Lang et al. (1991) by defining Flow as:
0 Basil Blackwell Ltd. 1995

184 GRINER AND GORDON
FLOW = INC - TAX - INTEXP - PFDIV - COMDIV where,
INC TAX
= operating income before depreciation (Compustat item No. 13); = total income taxes (Compustat item No. 16 minus the change
in the deferred taxes from the previous year to the current year (change in Compustat item No. 35));
= gross interest expense on short- and long-term debt (Compustat item No. 15);
= total amount of preferred dividend requirement on cumulative preferred stock and dividends paid on noncumulative preferred stock (Compustat item No. 19);
COMDIV = total dollar amount of dividends declared on common stock (Compustat item No. 21).
INTEXP
PFDIV
Both the pecking order and managerial hypotheses predict that B1 will be positive in each year. This test establishes the foundation for subsequent discriminations between the competing hypotheses. Controls for firm size and capital intensity are introduced in equation (4) below.
Under the managerial hypothesis, insider ownership is expected to reduce the propensity of managers to over-invest in capital expenditures by forcing them to bear more of the pecuniary consequences of their actions. Thus, an inverse association between capital expenditures and insider ownership would support the managerial hypothesis. The pecking order hypothesis assumes that there is no conflict of interest between managers and current shareholders, thereby implying no association between capital expenditures and insider ownership. We take the predictions of the pecking order argument as the null hypothesis and test it against the alternative of the inverse association implied by the managerid hypothesis. We predict that capital expenditures will be linear in the reciprocal of insider ownership,* leading to a regression equation of the form:
Capexp(t) = BO + Bl*[l/IO(t)].
Insider Ownership (10) is defined as the percentage of votes corresponding to shares and options owned by officers and directors as a group.g Under the managerial hypothesis, B1 is predicted to be positive. Controls for firm size and capital intensity are introduced in equation (4) below.
Multivariate Analysis
It is necessary to reinforce any finding of bivariate associations by showing that the associations persist after controlling for other factors that are known to influence the level of capital expenditures. Previous research has established associations between capital expenditures and a broad range of variables.
@ Basil Blackwell Ltd. 1995
CASH FLOW, INSIDER OWNERSHIP, CAPITAL EXPENDITURES 185
However, there is not a consensus concerning which one of the various models of the determinants of capital expenditures exhibits the greatest explanatory power and/or strongest theoretical foundations. The analysis contained here uses a benchmark regression equation that incorporates two key determinants of capital expenditure levels. Specifically, the benchmark capital expenditure equation is:"
Capexp(t) = BO + Bl*[Sales(t)] + B2*[Capint(t- l ) ] . (3)
Sales is defined as Compustat item No. 12. Capital intensity (Capint) is defined as the ratio of net property, plant, and equipment (Compustat item No. 8) to total assets (Compustat item No. 6).
Sales is included in the equation to control for size.'' Without this control, any bivariate association between capital expenditures and internal cash flow could be spurious, since both capital expenditures and internal cash flow are likely to be positively associated with firm size. Also, any bivariate association between capital expenditures and insider ownership could be spurious to the extent that large firms tend to have a smaller percentage of votes concentrated in the hands of officers and directors (Jensen et al., 1992). Allowing sales to enter the equation removes effects attributable to size and permits an examination of the incremental effects of internal cash flow and insider ownership.
Capital intensity is included in the equation to control for differences in the need for property, plant, and equipment. Without this control, bivariate associations could be spurious because firms with similar demands for property, plant, and equipment may tend to be similar in cash flow patterns and ownership structure.
B1 and B2 in equation (3) are predicted to be positive. Ultimately, the appropriateness of equation (3) depends upon its explanatory power. High explanatory power will serve as evidence that the equation captures the effects it intends to capture and thus functions well as a benchmark against which to assess the incremental explanatory power offered by the variables of interest in this study.
The complete regression equation extends the benchmark by including internal cash flow, insider ownership, and their interaction, as follows:'*
Capexp(t) = BO + Bl*[Sales(t)] + B2*[Capint(t- l)] + B3*[Flow(t)]
+ B4*[ l/IO(t)] + B5*[Flow(t)/IO(t)] (4)
Table 1 summarizes the predictions of the pecking order and managerial hypotheses for the coefficients in equation (4). Neither hypothesis makes any prediction for the sign of the intercept term BO. Both hypotheses are consistent with the prediction that B1, B2, and B3 are all positive. As explained earlier, the managerial hypothesis implies an inverse association between capital expenditures and insider ownership in which the level of capital expenditures is positively associated with the reciprocal of insider ownership. The pecking
0 Basil Blackwell Lrd. 1995

186 GRINER AND GORDON
Table 1
Predictions of the Pecking Order and Managerial Hypotheses
Predicted S i p Coefficient Independent Variable Pecking Order Managerial
BO - No Prediction No Prediction B1 Sales + + B2 Capint + + B3 Flow + + B4 1 / I 0 0 + B5 Flow * (l/IO) 0 +
order hypothesis implies no such association. Thus, the managerial hypothesis predicts that B4 should be positive, whereas the pecking order hypothesis predicts that B4 should be zero. The coefficient of the interaction term (B5) is also helpful in discriminating between the two theories. The managerial hypothesis predicts that B5 will be positive. Under the managerial hypothesis, internal cash flow provides the opportunity to make discretionary growth- inducing capital expenditures without interference by current shareholders or other capital market agents. A low level of insider ownership provides the incentive to invest internal cash flow in capital expenditures rather than pay it out to shareholders, because managers with a small ownership stake reap the non-pecuniary benefits of growth without having to bear the full cost of unprofitable growth. Over-investment will be most severe for firms where managers have both the greatest opportunity and the greatest incentive. These firms are those for which the interaction term corresponding to B5 will be largest (i.e. where internal cash flow is large and insider ownership is small). Thus, we again use the pecking order argument as the null hypothesis against the alternative of a positive sign for B5.
Sample
The sample consists of a subset of the 1988 Fortune 500 that responded to a mailed request for proxy statements for each year in the period 1985 through 1988. The Fortune 500 were chosen because of their dominant role in the US economy, the industrial nature of the firms, and the precedent established by previous studies. The year 1988 was chosen because it was the most recent year for which complete data were available at the time the study was initiated. The three years prior to 1988 were included to ensure that the findings were not unique to any one year. One hundred and sixty firms provided one or more useable responses, resulting in observations for each year as follows:
Q Basil Blackwell Ltd. 1995
CASH FLOW, INSIDER OWNERSHIP, CAPITAL EXPENDITURES
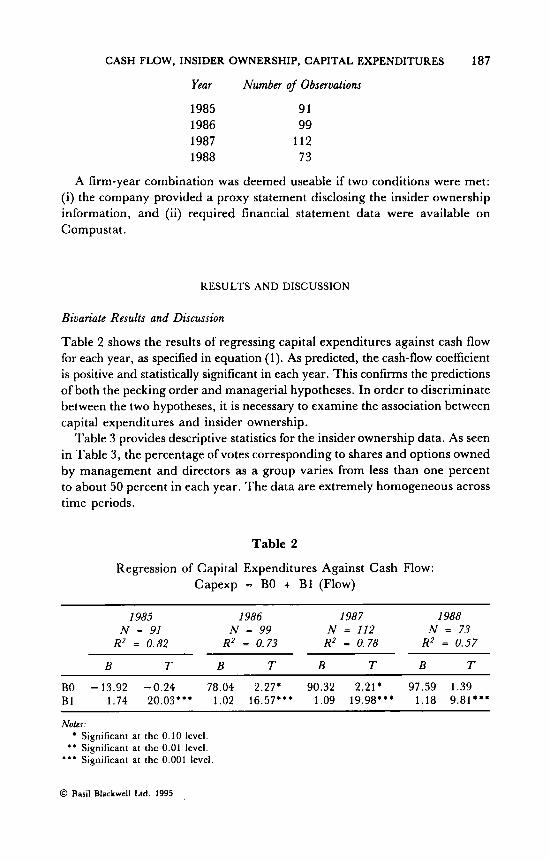
Year Number of Observations
1985 91 1986 99 1987 112 1988 73
187
A firm-year combination was deemed useable if two conditions were met: (i) the company provided a proxy statement disclosing the insider ownership information, and (ii) required financial statement data were available on Compustat.
RESULTS AND DISCUSSION
Biuariate Results and Discussion
Table 2 shows the results of regressing capital expenditures against cash flow for each year, as specified in equation (1). As predicted, the cash-flow coefficient is positive and statistically significant in each year. This confirms the predictions of both the pecking order and managerial hypotheses. In order to discriminate between the two hypotheses, it is necessary to examine the association between capital expenditures and insider ownership.
Table 3 provides descriptive statistics for the insider ownership data. As seen in Table 3, the percentage of votes corresponding to shares and options owned by management and directors as a group varies from less than one percent to about 50 percent in each year. The data are extremely homogeneous across time periods.
Table 2
Regression of Capital Expenditures Against Cash Flow: Capexp = BO + B1 (Flow)
1985 I986 1987 I988 N = 91 N = 99 N = 112 N = 73 R2 = 0.82 RZ = 0.73 R2 = 0.78 R2 = 0.57
B T B T B T B T
BO -13.92 -0.24 78.04 2.27' 90.32 2.21* 97.59 1.39 B1 1.74 20.03"' 1.02 16.57"* 1.09 19.98". 1.18 9.81'*'
Notes: Significant at the 0.10 level.
* * Significant at the 0.01 level. * * * Significant at the 0.001 level.
0 Basil Blackwell Ltd. 1995

188 GRINER AND GORDON
Table 3
Insider Ownership - Descriptive Statistics*
1985 I986 1987 I988 N = 91 N = 99 N = 112 N = 73
Mean 7.60 6.90 7.47 8.10 Standard Deviation 11.06 9.71 11.14 10.97 Minimum 0.11 0.20 0.09 0.13 Maximum 51.40 47.20 52.00 53.49
Nofe; * Insider ownership is defined as the percentage of votes corresponding to shares held by officers and directors as a group.
Table 4
Regression of Capital Expenditures Against the Reciprocal of Insider Ownership:
Capexp = BO + B1 (1/IO)
I985 1986 1987 I988 N = 91 N = 99 N = 112 N = 73 R2 = 0.31 RZ = 0.09 R' = 0.22 R2 = 0.12
B T B T B T B T
BO 160.09 1.40 201.61 2.88;. 201.67 2.49; 229.52 2.22. B1 368.31 6.45*** 169.27 3.30" 206.77 5.71." 211.77 3.32;;
Notes: * Significant at the 0.10 level.
* * Significant at the 0.01 level. * * * Significant at the 0.001 level
Plots of capital expenditures against insider ownership (available from the authors) revealed an inverse curvilinear association. Table 4 shows the results of a formal test of the association specified in equation (2). As hypothesized, there is a positive, statistically significant association between capital expenditures and the reciprocal of insider ownership in each year. This finding favors the managerial hypothesis by supporting the argument that reductions in the degree of separation of ownership and control reduce the propensity of managers to invest in capital expenditures.
Multivariate Results and Discussion
The bivariate analyses are revealing but not conclusive. The positive bivariate association found between capital expenditures and cash flow is neutral with
@ Basil Blackwell Ltd. 1995
CASH FLOW, INSIDER OWNERSHIP, CAPITAL EXPENDITURES 189
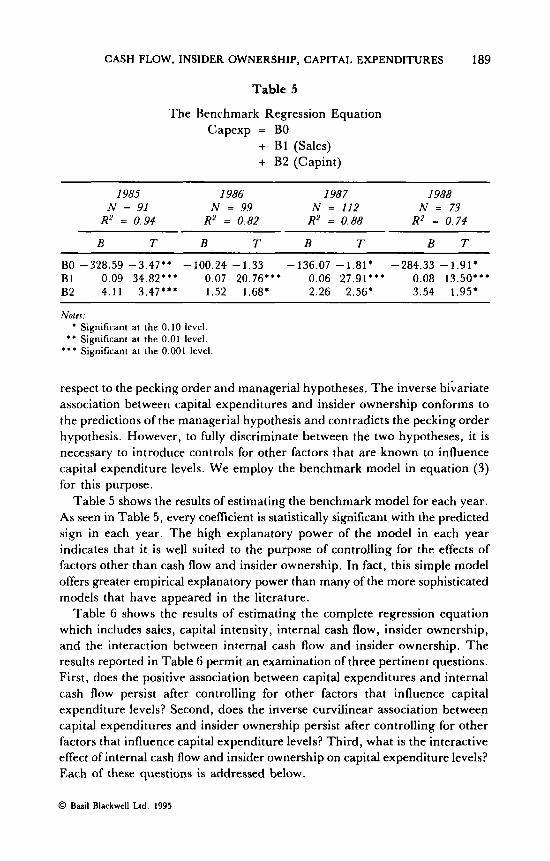
Table 5
The Benchmark Regression Equation Capexp = BO
+ B1 (Sales) + B2 (Capint)
I985 I986 1987 I988 N = 91 N = 99 N = 112 N = 73
R2 = 0.94 R2 = 0.82 R2 = 0.88 R2 = 0.74
B T B T B T B T ~ ~~ ~ ~~ ~~ ~~ ~~
BO -328.59 -3.47** -100.24 -1.33 -136.07 -1.81' -284.33 -1.91* B1 0.09 34.82*** 0.07 20.76*** 0.06 27.91*** 0.08 13.50*** B2 4.11 3.47*** 1.52 1.68* 2.26 2.56* 3.54 1.95.
Notes: * Significant at the 0.10 level.
* * Significant at the 0.01 level. * * * Significant at the 0.001 level.
respect to the pecking order and managerial hypotheses. The inverse bivariate association between capital expenditures and insider ownership conforms to the predictions of the managerial hypothesis and contradicts the pecking order hypothesis. However, to fully discriminate between the two hypotheses, it is necessary to introduce controls for other factors that are known to influence capital expenditure levels. We employ the benchmark model in equation (3) for this purpose.
Table 5 shows the results of estimating the benchmark model for each year. As seen in Table 5 , every coeficient is statistically significant with the predicted sign in each year. The high explanatory power of the model in each year indicates that it is well suited to the purpose of controlling for the effects of factors other than cash flow and insider ownership. In fact, this simple model offers greater empirical explanatory power than many of the more sophisticated models that have appeared in the literature.
Table 6 shows the results of estimating the complete regression equation which includes sales, capital intensity, internal cash flow, insider ownership, and the interaction between internal cash flow and insider ownership. The results reported in Table 6 permit an examination of three pertinent questions. First, does the positive association between capital expenditures and internal cash flow persist after controlling for other factors that influence capital expenditure levels? Second, does the inverse curvilinear association between capital expenditures and insider ownership persist after controlling for other factors that influence capital expenditure levels? Third, what is the interactive effect of internal cash flow and insider ownership on capital expenditure levels? Each of these questions is addressed below.
0 Basil Blackwell Ltd. 1995

190 GRINER AND GORDON
Table 6
The Complete Regression Equation: Capexp = BO
+ B1 (Sales) + B2 (Capint) + B3 (Flow) + B4 (1/IO) + B5 (Flow/IO)
1985 1986 1987 1988 N = 91 N = 99 N = 112 N = 73
R2 = 0.96 R2 = 0.83 R2 = 0.90 R2 = 0.74
B T B T B 7- B T ~~ ~ ~~ ~
BO -205.24 -2.62' -16.32 -0.20 -94.63 -1.33 -334.3 -2.20' B1 0.06 7.92'*' 0.05 6.09**' 0.05 10.53'" 0.07 6.20'" B2 2.85 2.97'' 0.42 0.42 1.75 2.09' 3.63 2.00' B3 0.33 2.86'. 0.42 2.40' 0.09 0.98 0.27 1.38 B4 21.28 1 . 1 7 1.52 0.05 15.57 0.89 63.96 1.55 B5 0.09 6.17'*' -0.04 -1.04 0.03 2.71" -0.06 - 1.03
Noles: Significant at the 0.10 level.
* * Significant at the 0.01 level. * * * Significant at the 0.001 level.
The results in Table 2 indicated the existence of a positive and statistically significant association between capital expenditures and internal cash flow in every year. The somewhat weaker results for B3 in Table 6 suggest that some portion of the apparent influence of cash flow evident in Table 2 can be attributed to firm size and capital intensity. However, it should be noted that the internal cash flow coefficient is positive in every year and statistically significant in two years. This confirms that internal cash flow is an important determinant of capital expenditure levels even after controlling for firm size and capital intensity. The significance of internal cash flow as a determinant of capital expenditure levels is equally consistent with both the pecking order and managerial hypotheses. In order to discriminate between these two explanations, it is necessary to examine the effects of insider ownership.
Table 4 provided evidence of a statistically significant inverse curvilinear association between capital expenditures and insider ownership in every year. As seen in the results for B 4 in Table 6, the association disappears when other determinants of capital expenditures are allowed to enter the equation. This result supports the pecking order hypothesis and casts doubt on the managerial hypothesis by contradicting the managerial prediction that capital expenditure levels should be affected by the degree of separation of ownership and control.
@ Basil Blackwell Ltd. 1995

CASH FLOW, INSIDER OWNERSHIP, CAPITAL EXPENDITURES 191
However, to fully understand the effects of insider ownership it is necessary to consider the possibililty of an interaction with internal cash flow.
Earlier, we justified the inclusion of an interaction term in the equation to test the managerial hypothesis. High levels of internal cash flow provide managers with the opportunity for over-investment in capital expenditures, and low levels of insider ownership provide the incentive. Thus, the managerial hypothesis predicts a positive sign for the coefficient for the interaction between internal cash flow and the reciprocal of insider ownership. The results in Table 6 provide limited support for the managerial hypothesis in that B5 is positive in the two years in which it is statistically significant.I3 T h e existence of a positive association between capital expenditures and the interaction term, coupled with the absence of any main effects for insider ownership, indicates that incentives for over-investment (in the form of low insider ownership) will not lead to higher capital expenditure levels unless managers also have the opportunity to finance the expenditures through internal cash flow.
Overall, the results favor the pecking order hypothesis. Internal cash flow is clearly an important determinant of capital expenditure levels, and insider ownership is not. This finding contradicts the predictions of the managerial hypothesis and confirms the view of Myers (1984) and Myers and Majluf (1984) that reliance on internal cash flow does not reflect a conflict of interest between managers and current shareholders. The evidence in this study does not suggest reasons why ownership by officers and directors has no effect on capital expenditure levels. One seemingly plausible conjecture is that capital expenditure decisions tend to be made by division-level managers, not by officers and directors. Investigation of this and other possibilities is needed to better understand how the choice of capital expenditure levels differs from the large number of managerial decisions that are affected by the ownership stake of officers and directors.
SUMMARY AND CONCLUSIONS
Although several studies have established that internal cash flow (liquidity) is an important determinant of the level of corporate capital expenditures, there is disagreement as to why this is the case. According to the pecking order hypothesis, managers rely on internal cash flow in an effort to undertake all capital expenditures that serve the best interest of current shareholders. According to the managerial hypothesis, managers rely on internal cash flow in an effort to undertake capital expenditures in an amount greater than that which serves the best interest of shareholders. The two hypotheses agree that capital expenditures should be positively associated with internal cash flow but differ sharply in their predictions concerning the effects of insider ownership.
This study used subsets of the Fortune 500 in each of the years 1985 through 1988 to test the pecking order and managerial hypotheses. The bivariate analysis
@ Basil Blackwell Ltd. 1995

192 GRINER AND GORDON
of capital expenditures and internal cash flow confirmed the prediction of both theories that internal cash flow is an important determinant of capital expenditure levels. The bivariate analysis also revealed an inverse curvilinear association between capital expenditures and insider ownership. The purpose of the multivariate analysis was to see if the bivariate results persisted after controlling for other factors that influence capital expenditure levels. The multivariate analysis confirmed that internal cash flow is an important determinant of capital expenditure levels. However, the most important finding was that there was no association between capital expenditure levels and insider ownership in any of the four years, after controlling for other determinants of capital expenditures. The conclusion is that reliance on internal cash flow to finance capital expenditures is not caused by conflicts of interest between managers and existing shareholders, but rather is a consequence of information asymmetries between managers and potential new shareholders. The implication of the study is that shareholders do not need to cede ownership to management in order to provide managers with incentives when making capital expenditure decisions. Additional research is needed to better understand why insider ownership influences a broad range of management decisions but does not affect capital expenditure levels.
1. Abbott Laboratories 2. Affiliated Publications 3. Allied Signal 4. Amax Inc. 5. American Greetings 6. Ametek 7. Amoco 8. AMP 9. Ashland Oil
10. Avery International 11. Avon Products 12. Baker-Hughes Inc. 13. Bard (C.R.) Inc. 14. Bemis Co. 15. Boise Cascade 16. Briggs & Stratton 17. Brunswick Corp. 18. Calmat Co. 19. Caterpillar 20. Chevron 21. Chrysler 22. Clark Equipment Co. 23. Clorox Co.
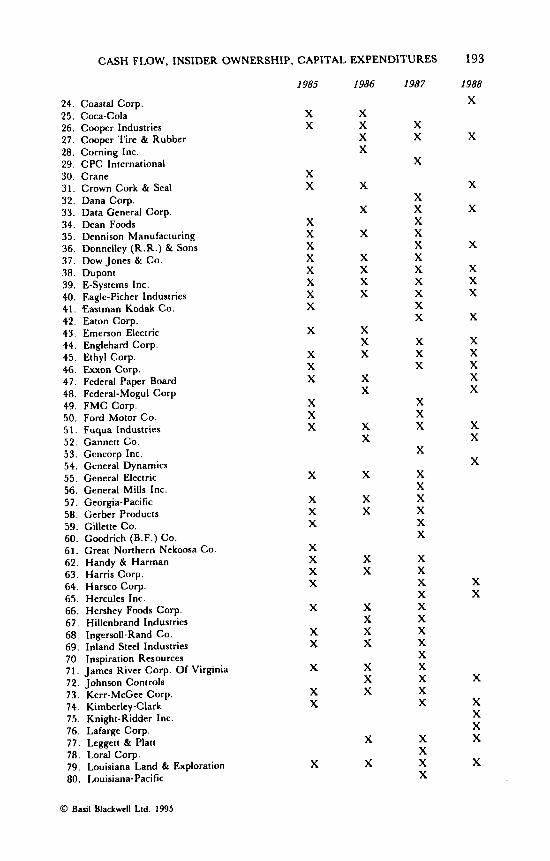
APPENDIX
Sample Firms - By Year 1985
X
X
X X X X X
X X X X
X
X
1986
X
X X X X X X X X X
X X X X X X X
X
1987
X
X X X X X X X
X X X
X
X
X X
1988
X
X
X
X X
X
0 Basil Blackwcll Ltd. 1995
CASH FLOW, INSIDER OWNERSHIP, CAPITAL EXPENDITURES
24. Coastal Corp. 25. Coca-Cola 26. Cooper Industries 27. Cooper Tire & Rubber 28. Corning Inc. 29. CPC International 30. Crane 3 1. Crown Cork & Seal 32. Dana Corp. 33. Data General Corp. 34. Dean Foods 35. Dennison Manufacturing 36. Donnelley (R.R.) & Sons 37. Dow Jones & c o . 38. Dupont 39. E-Systems Inc. 40. Eagle-Picher Industries 41. Eaatman Kodak Co. 42. Eaton Corp. 43. Emerson Electric 44. Englehard Corp. 45. Ethyl Corp. 46. Exxon Corp. 47. Federal Paper Board 48. Federal-Mogul Corp 49. FMC Corp. 50. Ford Motor Co. 5 I . Fuqua Industries 52. Gannett Co. 53. Gencorp Inc. 54. General Dynamics 55. General Electric 56. General Mills Inc. 57. Georgia-Pacific 58. Gerber Products 59. Gillette Co. 60. Goodrich (B.F.) Co. 61. Great Northern Nekoosa Co. 62. Handy & Harman 63. Harris Corp. 64. Harsco Corp. 65. Hercules Inc. 66. Hershey Foods Corp. 67. Hillenbrand Industries 68. Ingersoll-Rand c o . 69. Inland Steel Industries 70. Inspiration Resources 71. James River Corp. Of Virginia 72. Johnson Controls 73. Kerr-McGee Corp. 74. Kimberley-Clark 75. Knight-Ridder Inc. 76. Lafarge Corp. 77. Leggett & Platt 78. Loral Corp. 79. Louisiana Land & Exploration 80. Louisiana-Pacific
1985
X X
X X
X X X X X X X X
X
X X X
X X X
X
X X X
X X X X
X
X X
X
X X
X
I986
X X X X
X
X
X
X X X X
X X X
X X
X X
X
X X
X X
X X X X
X X X
X
X
1987
X X
X
X X X X X X X X X X X
X X X
X X X
X
X X X X X X
X X X X X X X X X X X X X
X X X X
193
1988 X
X
X
X
X
X X X
X
X X X X X
X X
X
X X
X
X X X X
X
0 Basil Blackwell Lrd. 1995

194
81. 82. 83. 84. 85. 86. 87. 88. 89. 90. 91. 92. 93. 94. 95. 96. 97. 98. 99.
100. 101. 102. 103 104 105 106 I07 I08 109 110 1 1 1 112 113 114
GRINER AND GORDON
LTV Corp. Lubrizol Corp. Mapco Inc. Marion Labs Martin Marietta Maytag Corp. McDonnell Douglas Mead Corp. Media General Medtronic Inc. Merck & Co. Minnesota Mining and Manufacturing Mobil Corp. Monsanto Motorola Inc. Murphy Oil Nacco Industries Nalco Chemical Co. National Service Industries Newell Companies Norton Co. Nucor Corp. Olin Corp. Oxford Industries Parker-Hannilin Pennzoil Co. Pepsico Inc. Phelps Dodge Corp. Phillips Petroleum Pittway Corp. Polaroid Corp. Pope & Talbot Inc. Potlatch Corp. PPG Industries Inc.
115. Quaker Oats 116. Quaker State Corp. 1 17. Raytheon 118. Reynolds & Reynolds 119. Robertson (H.H.)Co. 120. Rockwell International 121. Rohm & Haas 122. Rubbermaid Inc. 123. Russell Corp. 124. Schering-Plough 125. Scott Paper Co. 126. Shaw Industries 127. Sherwin-Williams 128. Smith (A.O.) Corp. 129. Southdown Inc. 130. Springs Industries 131. Standard Products 132. Stanley Works 133. Stone Container 134. Sun Co. Inc. 135. Sundstrand Corp. 136. Tambrands Inc. 137. Tecumseh Products
I985
X
X X
X
X X
X X
X
X
X X X X X X
X X
X X X X X
X X X
X
X X X X
I986
X X X X X
X X
X
X
X X
X
X X X X X
X
X X X
X X X
X X X X X X
X X X X
X
X X
1987
X X X X X
X X X X
X
X X X
X X
X X X X X X X
X
X
X
X X
X X X X X X X X
X
X
X
I988
X X X X
X X
X X X X X
X X
X X X
X X X
X X X
X X
X X
X X X
X
X X
X
0 Basil Blackwell Ltd. 1995
CASH FLOW, INSIDER OWNERSHIP, CAPITAL EXPENDITURES 195
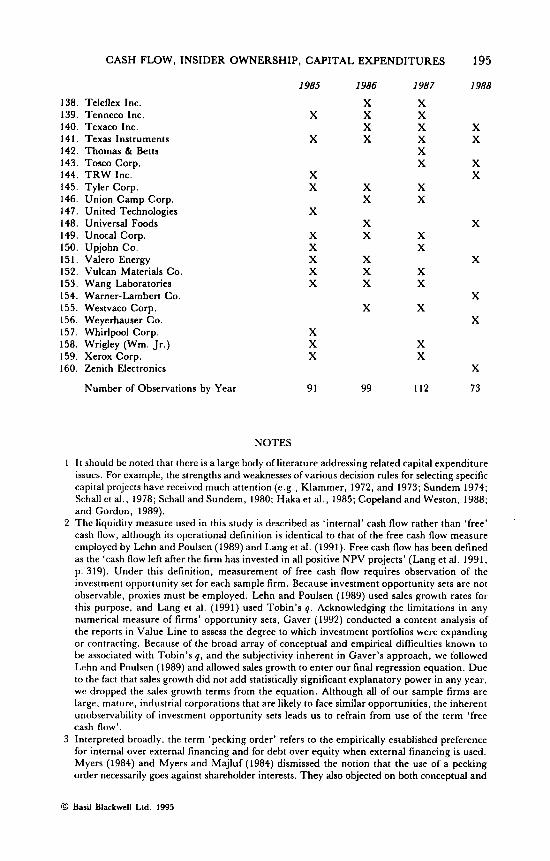
138. Teleflex Inc. 139. Tenneco Inc. 140. Texaco Inc. 141. Texas Instruments 142. Thomas & Betts 143. Tosco Corp. 144. T R W Inc. 145. Tyler Corp. 146. Union Camp Corp. 147. United Technologies 148. Universal Foods 149. Unocal Corp. 150. Upjohn Co. 151. Valero Energy 152. Vulcan Materials Co. 153. Wang Laboratories 154. Warner-Lambert Co. 155. Westvaco Corp. 156. Weyerhauser Co. 157. Whirlpool Corp. 158. Wrigley (Wm. Jr.) 159. Xerox Corp. 160. Zenith Electronics
Number of Observations by Year
1985 1986 1987 1988
X X X X X
X X X X X
X X
X X X X
X X X
X X X X X X X X X X X X X X
X X
X X
X
X
X X X
X X
X X
91 99 I12
X
X
X
73
NOTES
1 I t should be noted that there is a large body of literature addressing related capital expenditure issues. For example, the strengths and weaknesses of various decision rules for selecting specific capital projects have received much attention (e.g., Klammer, 1972, and 1973; Sundem 1974; Schall et al., 1978; Schall and Sundem, 1980; Haka et al., 1985; Copeland and Weston, 1988; and Gordon, 1989).
2 The liquidity measure used in this study is described as ‘internal’ cash flow rather than ‘free’ cash flow, although its operational definition is identical to that of the free cash flow measure employed by Lehn and Poulsen (1989) and Lang et al. (1991). Free cash flow has been defined as the ‘cash flow left after the firm has invested in all positive NPV projects’ (Lang et al. 1991, p. 319). Under this definition, measurement of free cash flow requires observation of the investment opportunity set for each sample firm. Because investment opportunity sets are not observable, proxies must be employed. Lehn and Poulsen (1989) used sales growth rates for this purpose, and Lang et al. (1991) used Tobin’s 9. Acknowledging the limitations in any numerical measure of firms’ opportunity sets, Gaver (1992) conducted a content analysis of the reports in Value Line to assess the degree to which investment portfolios were expanding or contracting. Because of the broad array of conceptual and empirical difficulties known to be associated with Tobin’s q, and the subjectivity inherent in Gaver’s approach, we followed Lehn and Poulsen (1989) and allowed sales growth to enter our final regression equation. Due to the fact that sales growth did not add statistically significant explanatory power in any year, we dropped the sales growth terms from the equation. Although all of our sample firms are large, mature, industrial corporations that are likely to face similar opportunities, the inherent unobservability of investment opportunity sets leads us to refrain from use of the term ‘free cash flow’.
3 Interpreted broadly, the term ‘pecking order’ refers to the empirically established preference for internal over external financing and for debt over equity when external financing is used. Myers (1984) and Myers and Majluf (1984) dismissed the notion that the use of a pecking order necessarily goes against shareholder interests. They also objected on both conceptual and
0 Basil Blackwell Ltd. 1995

196 GRINER AND GORDON
empirical grounds to the so-called ‘static trade-off theory, according to which firms establish and move toward target debt-to-value ratios. They proposed a modified pecking order hypothesis that incorporates the elements of the static trade-off theory that have been shown to have empirical support. The modified pecking order hypothesis is built upon an agency-based rationale that explains why managers’ financing preferences do not reflect conflicts of interests between managers and current shareholders. For brevity and clarity in this study, we use the term ‘pecking order hypothesis’ to mean the agency-based rationale offered by Myers (1984) and Myers and Majluf (1984) as an alternative to the view that reliance on internal finance is contrary to the interests of shareholders.
4 Most previous studies focused on the effects of adopting an incentive-based compensation plan for the first time. Gaver et al. (1992) identifed several difficulties associated with studies of performance plan adoption. Also, in the time period examined in this study (1985-1988) virtually all large industrial firms, including the ones in our sample, had at least one incentive-based compensation plan in place. For these reasons, we have not attempted to incorporate compensation plans into this study.
5 While suggestive, the evidence concerning the effects of insider ownership on merger and acquisition activity cannot be generalized to all capital expenditures due to the fact that mergers and acquisitions often substantially change the ordinary course of business for the firms involved. Shareholders frequently have the right to vote on mergers and acquisitions proposed by management, but do not have the right to vote on capital expenditures made in the ordinary course of business. Also, extensive press coverage exposes mergers and acquisitions to greater scrutiny than ordinary capital expenditures not requiring a business combination.
6 Insider ownership also has been shown to help align the interests of managers and shareholders regarding sell-off decisions (Hirschey and Zaima, 1989). However, as with merger and acquisition decisions, sell-off decisions are substantially different from capital expenditure decisions.
7 Neither the pecking order hypothesis nor the managerial hypothesis makes any predictions concerning the intercept term in equations (1) through (4). Accordingly, we report each intercept, f-value, and significance level, but we do not attempt to offer interpretations.
8 The conjecture that capital expenditure levels are linear in the reciprocal of insider ownership is motivated by the notion of diminishing marginal returns. A priori, we believe that a given aboslute increase in the level of insider ownership will decrease capital expenditures more at low levels of insider ownership than at high levels. Prior to estimating equation (Z), the insider ownership data were plotted against capital expenditures to confirm the reasonableness of the functional form specified.
9 The measures of insider ownership employed in previous studies have focused on the dollar value of insider holdings (Benston, 1985; and Agrawal and Mandelker, 1987) or the percentage of shares owned by insiders (Agrawal and Mandelker, 1987; Morck et al., 1988; and Jensen et al., 1992). In this study, the term ‘ownership’ is defined to mean the right to vote on corporate matters. Because different classes of stock sometimes have different numbers of votes per share, we introduce a new measure by defining insider ownership as the percentage of votes corresponding to shares and options owned by officers and directors as a group. The necessary data were obtained from proxy statements.
10 There is considerable intuitive appeal to the notion that capital expenditure levels should be inversely associated with the firm-specific cost of capital. This possibility was formally incorporated into the neoclassical capital expenditure model developed by Jorgenson (1963) and tested in Jorgenson and Sieben (1968), Grabowski and Mueller (1972), Elliot (1973), Fazzari and Athey (1987) and Fazzari et al. (1988). There are three reasons why we have not incorporated a cost-of-capital variable in equation (3). First, the objective of equation (3) is to empirically control for determinants of capital expenditures other than internal cash flow and insider ownership, not to provide a fully specified analytic model of capital expenditure behavior. For the purposes of this study, the relevant test of equation (3) is its explanatory power. The results in Table 5 indicate that the criterion of explanatory power has been met. Second, there is a broad range of limitations inherent in measures of the cost of capital that have been employed in previous studies. Jorgenson and Siebert (1968) and Elliot (1973) used an accounting-based rate of return to proxy for the firm’s equilibrium return. Grabowski and Mueller (1972) used measures of the cost of equity based upon the CAPM and upon firm-specific risk, but did not consider the cost of debt. More recently, Fazzari and Athey (1987) incorporated debt into the calculations by conjecturing various values for firms’ debt betas, whereas Fazzari et al. (1988)
0 Basil Blackwell Ltd. 1995

CASH FLOW, INSIDER OWNERSHIP, CAPITAL EXPENDITURES 197
resorted to the assumption that all firms earn the Baa bond yield. Each of these approaches is fraught with shortcomings. Third, we improved upon previous measures by employing a firm-specific weighted average cost-of-capital based upon the CAPM for the cost of equity and the ratio of interest expense to book value of long-term debt for the cost of debt. We found no association with capital expenditures and decided to drop the cost of capital variable from equation (3).
1 1 Several studies of the determinants of capital expenditures have controlled for size by using financial ratios with sales or fixed assets in the denominator (for example, Larcker, 1983; Fazzari et al., 1988; and Newman, 1989). Similarly, Lehn and Poulsen (1989) normalized their cash flow measure by dividing by the market value of common equity, whereas Lang et al. (1991) used the book value of equity. Lev and Sunder (1979) argued that ‘control for size by the ratio method is adequate only under very restrictive conditions’ and recommended instead that researchers define a ‘structural relationship between the investigated variable and size variable’ (Lev and Sunder, 1979, p. 188). In developing the accelerator theory of capital expenditures, Eisner (1967) specified a structural relation between capital expenditure levels and sales by showing that capital expenditures should be proportional to output. Although some accelerator models have used the change in sales as the independent variable, we simply use sales, as recommended by Abel and Blanchard (1986) and Fazzari et al. (1988).
12 An argument might be made that a simultaneous equations model is needed due to the fact that capital expenditures cannot be studied in isolation from other phenomena, such as dividends. Grabowski and Mueller (1972) used a simultaneous equations model incorporating capital expenditures, dividends, and research and development expenditures. They interpreted the results as confirming ‘the findings of single equation studies of these variables’ (Grabowski and Mueller, 1972). Single equation models of capital expenditures continue to dominate the literature. For these reasons, we employ a single equation model.
13 Although we do not have a specific explanation as to why the interaction term is significant in only two years, we can offer two plausible conjectures. The first possibility is that the difference across years results from our use of different sample firms in each year. A second possibility suggested by Uri (1982) is that capital expenditure functions are unstable over time. We believe that both factors are at work in the four annual cross-sections in this study.
REFERENCES
Abel, A. and 0. Blanchard (1986), ‘Investment and Sales: Some Empirical Evidence’, Working Paper 2050 (National Bureau of Economic Research).
Agrawal, A. and G.N. Mandelker (1987), ‘Managerial Incentives and Corporate Investment and Financing Decisions’, Journal of Finance, Vol. 42 (September), pp. 823-837.
Benston, G. (1985), ‘The Self-serving Management Hypothesis: Some Evidence’,Journal ofAccounfing and Economics, Vol. 7 (April), pp. 67-84.
Berle, A.A., and G.C. Means (1932), Priuafc Property and fhe Modern Corporafion (McMillan, New York).
Rerndt, E.R., M. Fuss and L. Waverman (1980), Empirical Analysis of Dynamic Adjusfmenf Models offhe Demand for Energy in US Manufacfurins Industries, 1947-74, Final Report (Electric Power Research Institute, Palo Alto).
Bromiley, P. (1986), Corporafe Capital Inuesfmmf: A Behavioral Appraoch (Cambridge University Press, London).
Copeland, T.E. and J .F. Weston (1988), Financial 7heory and Corporafe Policy, third edition (Addison- Wesley, Reading, MA).
Dornbusch, R. and S. Fischer (1987). Macroeconomics, fourth edition (McGraw-Hill, New York). Dusenberry, J.S. (1958), Business Cycles and Economic Growth (McGraw-Hill, New York). Eisner, R. (1967), ‘A Permanent Income Theory for Investment: Some Empirical Explorations’,
Elliot, J . W. (1973), ‘Theories of Corporate Investment Behavior Revisited’, American Economic
Fama, E. (1980), ‘Agency Problems and the Theory of the Firm’,Journal of Pofifical Economy, Vol.
American Economic Reuiew, Vol. 57 (June 1967), pp. 363-390.
Reuiew, Vol. 63 (March), pp. 195-207.
88 (April), pp. 288-307.
0 Basil Blackwell Lrd. 1995

198 GRINER AND GORDON
Fazzari, S.M. and M.J. Athey (1987), ‘Asymmetric Information, Financing Constraints, and Investment’, Rcuicw of Economics and Sfafisfics, Vol. 69 (August), pp. 481-487.
-, R.G. Hubbard and B.C. Petrrsen (1988). ‘Financing Constraints and Corporate Investment’, Brookings Papers on Economic Acfiuity 1988(1), pp. 141-206.
Gaver, J.J. (1992), ‘Incentive Effects and Managerial compensation Contracts’, Joumal ojtlccounting, Auditing, and Finance, Vol. 7 (Spring), pp. 137-156.
-, K.M. Gaver and G.P. Battistel (1992). ‘The Stock Market Reaction to Performance Plan Adoptions’, The Accounfing Rcuicw, Vol. 67 (January), pp. 172-182.
Gordon, L.A. (1989), ‘Benefit-cost Analysis and Resource Allocation Decisions’, Accounfing, Organizafions, and Society, Vol. 14 (March 1989). pp. 247-258.
Grabowski, H.G. and D.C. Mueller (1972), ‘Managerial and Stockholder Welfare Models of Firm Expenditures’, Thc Reuiew of Economics and Stafisfics, Vol. 54 (February) pp. 9-24.
Haka, S., L.A. Gordon and G.E. Pinches (1985), ‘Sophisticated Capital Budgeting Techniques and Firm Performance’, The Accounting Rcuicw, Vol. 60 (October), pp, 651-669.
Hart, O.D. (1983), ‘The Market Mechanism as an Incentive Scheme’, Bell Journal of Economics, Vol. 14 (Autumn), pp. 301-325.
Haugen, P. and L. Senbet (1981). ‘Resolving the Agency Problems of External Capital Through Options’, Journal ojFinance, Vol. 36 (June), pp. 629-647.
Hirschey, M. and J .K. Zaima (1989), ‘Insider Trading, Ownership Structure, and the Market Assessment of Corporate Sell-offs’, Journal of Finance, Vol. 42 (September), pp, 971 -980.
Jensen, G.R. , D.P. Solberg and T.S. Zorn (1992), ‘Simultaneous Determination of Insider Ownership, Debt, and Dividend Policies’, Journal of Financial and Quanfifafiuc Anabsis, Vol. 27 (June), pp. 247-263.
Jensen, M.C. (1986), ‘Agency Costs of Free Cash Flow, Corporate Finance, and Takeovers’, American Economic Rcuiew, Vol. 76 (May), pp. 323-329. - and W.H. Meckling (1976), ‘Theory of the Firm: Managerial Behavior, Agency Costs
and Ownership Structure’, Journal of Financial Economics, Vol. 3 (October), pp. 305-360. -and R.S. Ruback (1983), ‘The Market for Corporate Control: The Scientific Evidence’,
Journal of Financial Economics, Vol. 11 (April), pp. 5-50. Jorgenson, D.W. (1963), ‘Capital Theory and Investment Behavior’, American Economic Reuiew,
Vol. 53 (May), pp. 247-259. - and C.D. Siebert (1968), ‘A Comparison of Alternative Theories of Corporate Investment
Behavior’, American Economic Rcuicw, Vol. 58 (September), pp. 681-712. Klammer, T. (1972). ‘Empirical Evidence of the Adoption of Sophisticated Capital Budgeting
Techniques’, Journal of Business, Vol. 45 (July), pp. 337-352. - (1973), ‘The Association of Capital Budgeting Techniques with Firm Performance’, The
Accounting Reuiew, Vol. 48 Uanuary), pp. 353-364. Kuh, E. (1963), Capifal Stock Growth: A Microeconomic Approuch (North-Holland, Amsterdam). - and J.R.Meyer (1957), The Inuesfmml Decision (Harvard University Press, Cambridge). Lang, L.H.P., R. Stulz and R.A. Walkling (1991), ‘A Test of the Free Cash Flow Hypothesis:
The Case of Bidder Returns’, Journal of Financial Economics, Vol. 29 (June), pp. 315-335. Larcker, D.F. (1983), ‘The Association between Performance Plan Adoption and Corporate Capital
Investment’, Journal of Accounfing and Economics, Vol. 5 (April), pp. 3-30. Lehn, K. and A. Poulsen (1989). ‘Free Cash Flow and Stockholder Gains in Going Private
Transactions’, Journal of Finance, Vol. 44 (July), pp. 771-787. Lev, B. and S. Sunder (19791, ‘Methodological Issues in the Use of Financial Ratios’, Journal
of Accounfing and Economics, Vol. 1 (December), pp. 187-210. Madan, D.B. and I.R. Prucha (1989), ‘A Note on the Estimation of Non-symmetric Dynamic
Factor Demand Models’, Journal of Economfricr, Vol. 42 (October), pp. 275-283. Marris, R . (1964), The Economic Theory of Managerial Capifalism (The Free Press, Glencoe, IL). McConnell, J.J., and C.J. Muscarella (1985), ‘Corporate Capital Expenditures Decisions and
the Market Value of the Firm’,Jou~ofFinancialEconomics, Vol. 14 (September), pp. 399-422. Morck, R.A., A. Shleifer and R.W. Vishny (1988), ‘Management Ownership and Market
Valuation’, Journal of Financial Economics, Vol. 20 (January/March), pp. 293-3 15. Myers, S.C. (1984), ‘The Capital Structure Puzzle’, JoumdojFinuncc, Vol. 39 (July), pp. 575-592. - and N.S. Majluf (1984). ‘Corporate Financing and Investment Decisions When Firms
Have Information That Investors Do Not Have’, Journal of Financial Economics, Vol. 39 (June), pp. 187-221.
0 Basil Blackwell Ltd. 1995

CASH FLOW, INSIDER OWNERSHIP, CAPITAL EXPENDITURES 199
Nair, R.D. (1979), ‘Economic Analyses and Accounting Techniques: An Empirical Study’, Journal of Accounfing Research, Val. 1 7 (Spring), pp. 225-242.
Newman, H.A. (1989), ‘Selection of Short-term Accounting-based Bonus Plans’, The Accounting Reuiew, Val. 64 (October), pp. 758-772.
Nicholson, W. (1992). Microeconomir Theory: Basic Principles and Exfmsions, fifth edition (The Dryden Press, Hinsdale, IL).
Schall, L.G. and G . Sundem (1980), ‘Capital Budgeting Methods and Risk: A Further Analysis’, Fznancial Managemenf, Vol. 9 (Spring), pp. 7-11. - - and W. Geijsbeek (1978), ‘Survey and Analysis of Capital Budgeting Methods’,
Journal of Finance, Vol. 33 (March 1978). pp. 281-287. Sicherman, N.W. and R . H . Pettway (1987), ‘Acquisition of Divested Assets and Shareholder
Wealth’, Journal of Finance, Val. 42 (December), pp. 1261-1273. Sundem, G.L. (1974). ‘Evaluating Simplified Capital Budgeting Models Using a Time State
Preference Metric’, The Accounting Review, Val. 49 (January), pp. 306-320. Uri, N.D. (1982), ‘Testing for the Stability of the Investment Function’, The Rcuicw ofEconomzc~
and Bafisf ics , Vol. 64 (February), pp. 117-125. Waegelein, J.F. (1988), ‘The Association between the Adoption of Short-term Bonus Plans and
Corporate Expenditures’, Journal ofAccounting and Public Policy, Vol. 7 (Spring), pp. 43-63. Walkling, R. and M. Long (1984), ‘Agency Theory, Managerial Welfare, and Takeover Bid
Resistance’, Rand Journal of Economics, Vol. 15 (Spring), pp. 54-66.
@ Basil Blackwell Ltd. 1995