MONTHLY M&A INSIDER - Abvcap
67
MONTHLY M&A INSIDER A MERGERMARKET REPORT ON GLOBAL M&A ACTIVITY OCTOBER 2012 EDITION
-
Upload
khangminh22 -
Category
Documents
-
view
1 -
download
0
Transcript of MONTHLY M&A INSIDER - Abvcap

MONTHLY M&A INSIDERA MERGERMARKET REPORT ON GLOBAL M&A ACTIVITY
OCTOBER 2012
EDITION

MONTHLY M&A INSIDERMERGERMARKET
GLOBAL OVERVIEW 01
AMERICAS: LATIN AMERICA 09
NORTH AMERICA 18
ASIA-PACIFIC 29
EUROPE 41
MIDDLE EAST & AFRICA 52
ABOUT MERRILL CORPORATION 62
www.mergermarket.comPart of The Mergermarket Group
CONTENTS
80 StrandLondon, WC2R 0RLUnited Kingdom
t: +44 (0)20 7059 6100f: +44 (0)20 7059 [email protected]
11 West 19th Street 2nd fl.New York, NY 10011USA
t: +1 212 686-5606f: +1 212 [email protected]
Suite 2401-3Grand Millennium Plaza181 Queen’s Road, CentralHong Kong
t: +852 2158 9700f: +852 2158 [email protected]

Monthly M&A Insider
GLOBAL OVERVIEW
01
Robust deal values in North America
Casting a look to regional activity, North America stands out as a global bright spot: while Q3 has seen a decline in overall M&A, aggregate deal value climbed to the highest level since the first quarter of last year at US$235.7bn. Even in the private equity arena – a space hard hit by the slowdown of the past year – buyout and exit values witnessed healthy year-on-year increases. It appears that fewer, higher-value deals are boosting dealmaking among both financial and strategic investors.
Certainly, this recent trend is evident in the consumer sector – particularly in relation to North American Kraft Foods’ spinoff of its snacks business. The deal, valued at US$26bn, ranks as the largest North American transaction in the quarter and forms part of a string of spinoffs by international food groups over the past year.
In the consumer sector itself, the spinoff comprised 74% of North American consumer deal value, and contributed heavily to the sector’s eight-fold increase in deal value between Q3 2011 and Q3 2012. With 16.6% of global M&A value, the consumer sector outstripped a number of other industries to become Q3’s second biggest in North America – in comparison, the space accounted for just 2% of global deal value in Q3 2011.
A growing appetite for Consumer dealsWhile the Kraft demerger accounts for the bulk of consumer activity in North America, there are a number of other recent, high-value consumer deals that have come to market across the globe. For instance, TCC Assets announced in September its US$10bn acquisition of Fraser & Neave (F&N),
a Singapore-based conglomerate with extensive food and brewing operations. In a related transaction, Dutch brewer Heineken moved to acquire a majority stake in Asia-Pacific Breweries (APB) for US$6.6bn in July – indeed, as F&N holds a 40% stake in APB, Heineken’s move may well have made F&N a more attractive target for TCC.
Turning to deals in the pipeline, Richard Schulze, who owns a 20.3% stake of Best Buy Co Inc, voiced his plans to take the company private – a move with a projected value of US$6.2bn.
OutlookTraditionally, after the seasonal slowdown in the summer holiday period, M&A activity picks up in the final quarter of the year, with a particularly strong showing in December. Admittedly, the early weeks of the fourth quarter have not inspired much confidence. It was widely expected that the US$45bn merger of BAE Systems and EADS – the defence sector’s biggest deal in a decade – would trigger a rush of deal-making in the industry. But with the deal failing, these hopes have been dashed.
Yet with corporate reorganisation taking place among some of the world’s largest consumer groups and other strategic investors expanding into emerging markets to seize new opportunities through M&A, it shows that despite the climate of slowed deal-making and general economic malaise, there remain opportunities for growth.
GLOBAL OVERVIEW
GLOBAL M&A ACTIVITY DISAPPOINTED IN Q3 WITH DEAL VOLUME FALLING BY 16% FROM 3,203 IN Q3 2011 TO 2,679 IN Q3 2012. DEAL VALUE PAINTS A SIMILAR PICTURE, DROPPING BY A FIFTH FROM US$579BN TO US$461BN OVER THE SAME PERIOD.
Head of Research: Elias Latsis
Editor: Gwen Ceton
For advertising opportunities contact:
Erik Wickman
Tel: + (1) 212 686-3329 [email protected]
Global overview: Kristina Thompson and Fabio Lopes
Latin America: Jennifer Ruiz
North America: Urna Chakraborty and Ashley Klepach
Asia-Pacific: Raza Hussain
Europe: Peter Kruk & Kirsty Wilson
Middle East & Africa: Darragh Riordan & Silvia Paparello

Monthly M&A Insider 02
GLOBAL OVERVIEW
LEAGUE TABLES
Monthly M&A Insider
Ranking Q1-Q3 2012 Q1-Q3 2011
Q1-Q3 2012 Q1-Q3 2011 Company name Value (US$bn)
Deal count Value (US$bn)
Value change (%)
1 1 Goldman Sachs 377,755 220 467,150 -19.1%
2 3 Morgan Stanley 331,661 188 357,517 -7.2%
3 2 JPMorgan 295,608 161 372,174 -20.6%
4 9 Deutsche Bank 256,118 139 213,890 19.7%
5 6 Barclays 254,610 137 249,164 2.2%
6 7 Citigroup 233,166 118 243,254 -4.1%
7 4 Credit Suisse 226,178 131 299,405 -24.5%
8 5 Bank of America Merrill Lynch 178,746 116 250,474 -28.6%
9 12 Rothschild 144,412 166 108,572 33.0%
10 14 Nomura Holdings 135,877 91 72,644 87.0%
11 10 UBS Investment Bank 117,619 110 170,795 -31.1%
12 8 Lazard 113,179 135 216,762 -47.8%
13 13 BNP Paribas 86,908 44 72,823 19.3%
14 18 RBC Capital Markets 79,913 105 54,139 47.6%
15 11 HSBC 46,764 45 111,492 -58.1%
16 20 Jefferies & Company 41,425 78 38,353 8.0%
17 40 BMO Capital Markets 41,190 32 22,882 80.0%
18 58 Greenhill & Co 40,773 31 12,087 237.3%
19 15 Evercore Partners 37,510 59 66,624 -43.7%
20 16 SG 37,299 40 60,181 -38.0%Source: mergermarket
The financial adviser league tables by value and volume have been run from 01-Jan-12 to 30-Sep-12. The tables cover all sectors and are based on the geography of either the target, bidder or seller being Global.
TOP 20 FINANCIAL ADVISERS – GLOBAL
VALUE
Ranking Q1-Q3 2012 Q1-Q3 2011
Q1-Q3 2012 Q1-Q3 2011 Company name Value (US$bn)
Deal count Deal count Deal count change
1 1 Goldman Sachs 377,755 220 251 -31
2 3 Morgan Stanley 331,661 188 198 -10
3 6 Rothschild 144,412 166 173 -7
4 5 JPMorgan 295,608 161 183 -22
5 13 Deutsche Bank 256,118 139 143 -4
6 15 Barclays 254,610 137 108 29
7 4 PwC 13,529 136 194 -58
8 12 Lazard 113,179 135 145 -10
9 8 Credit Suisse 226,178 131 165 -34
10 11 Deloitte 11,156 130 147 -17
11 2 KPMG 14,278 122 207 -85
12 14 Citigroup 233,166 118 124 -6
13 7 Bank of America Merrill Lynch 178,746 116 170 -54
14 9 UBS Investment Bank 117,619 110 163 -53
15 18 RBC Capital Markets 79,913 105 84 21
16 17 Nomura Holdings 135,877 91 89 2
17 10 Ernst & Young 11,441 90 163 -73
18 16 Jefferies & Company 41,425 78 94 -16
19 19 M&A International 1,378 75 80 -5
20 24 Houlihan Lokey 13,164 69 64 5Source: mergermarket
TOP 20 FINANCIAL ADVISERS – GLOBAL
VOLUME

Monthly M&A Insider 03
GLOBAL OVERVIEW
Ranking Q1-Q3 2012 Q1-Q3 2011
Q1-Q3 2012 Q1-Q3 2011 Company name Value (US$bn)
Deal count Deal count Deal count change
1 1 DLA Piper 34,041 206 259 -53
2 3 Jones Day 87,333 204 229 -25
3 2 Latham & Watkins 126,483 192 232 -40
4 8 Kirkland & Ellis 90,859 186 196 -10
5 4 Linklaters 151,048 166 205 -39
6 7 Clifford Chance 219,543 152 196 -44
7 5 Baker & McKenzie 53,283 149 198 -49
8 10 Skadden Arps Slate Meagher & Flom 190,993 143 169 -26
9 9 Allen & Overy 76,250 137 189 -52
10 6 Freshfields Bruckhaus Deringer 205,564 131 196 -65
11 15 White & Case 95,043 122 115 7
12 13 Weil Gotshal & Manges 98,470 118 133 -15
13 11 CMS 9,174 110 161 -51
14 12 Hogan Lovells 46,225 101 152 -51
15 18 Sullivan & Cromwell 126,419 87 106 -19
16 17 Ashurst 31,911 86 107 -21
17 14 Simpson Thacher & Bartlett 103,593 83 116 -33
18 26 Paul Hastings 13,932 78 87 -9
19 21 Cleary Gottlieb Steen & Hamilton 120,576 77 97 -20
20 32 Stikeman Elliott 51,063 77 75 2Source: mergermarket
The legal adviser league tables by value and volume have been run from 01-Jan-12 to 30-Sep-12 and include lapsed and withdrawn deals. The tables cover all sectors and are based on the geography of either the target, bidder or seller being Global.
TOP 20 LEGAL ADVISERS – GLOBAL
VOLUME
Ranking Q1-Q3 2012 Q1-Q3 2011
Q1-Q3 2012 Q1-Q3 2011 Company name Value (US$bn)
Deal count Value (US$bn)
Value change (%)
1 16 Clifford Chance 219,543 152 96,240 128.1%
2 7 Freshfields Bruckhaus Deringer 205,564 131 204,391 0.6%
3 3 Skadden Arps Slate Meagher & Flom 190,993 143 233,530 -18.2%
4 5 Linklaters 151,048 166 213,931 -29.4%
5 9 Latham & Watkins 126,483 192 195,603 -35.3%
6 1 Sullivan & Cromwell 126,419 87 318,424 -60.3%
7 11 Cleary Gottlieb Steen & Hamilton 120,576 77 166,396 -27.5%
8 14 Davis Polk & Wardwell 104,111 75 116,746 -10.8%
9 2 Simpson Thacher & Bartlett 103,593 83 295,246 -64.9%
10 13 Weil Gotshal & Manges 98,470 118 116,904 -15.8%
11 23 White & Case 95,043 122 67,604 40.6%
12 66 King & Wood Mallesons 91,176 61 24,487 272.3%
13 20 Kirkland & Ellis 90,859 186 74,507 21.9%
14 4 Wachtell, Lipton, Rosen & Katz 87,526 43 225,418 -61.2%
15 17 Jones Day 87,333 204 93,855 -6.9%
16 12 Allen & Overy 76,250 137 161,672 -52.8%
17 10 Cravath Swaine & Moore 74,670 34 167,170 -55.3%
18 19 Blake, Cassels & Graydon 72,479 76 79,845 -9.2%
19 8 Shearman & Sterling 66,622 74 199,800 -66.7%
20 21 Baker & McKenzie 53,283 149 72,206 -26.2%Source: mergermarket
TOP 20 LEGAL ADVISERS – GLOBAL
VALUE
LEAGUE TABLES

Monthly M&A Insider 04
GLOBAL OVERVIEW
LEAGUE TABLES
VALUE
VALUE
Rank
Q1-Q3 2012 Company name Value (US$m)
Deal count
1 The Carlyle Group 15,495 20
2 BC Partners 10,721 4
3 Blackstone Group 8,741 14
4 Apollo Global Management 7,924 3
5 Access Industries 7,482 2
6 Riverstone Holdings 7,350 2
7 Arcus Infrastructure Partners 5,633 1
8 GS Capital Partners 4,754 5
9 Advent International 4,649 5
10 Global Infrastructure Partners 4,489 3
11 Macquarie Group 4,435 4
12 CVC Capital Partners 4,174 6
13 Bain Capital 4,141 6
14 EQT Partners 3,414 7
15 Thomas H Lee Partners 3,090 2Source: mergermarket
Rank
Q1-Q3 2012 Company name Value (US$m)
Deal count
1 GS Capital Partners 9,890 4
2 Hellman & Friedman 8,000 4
3 Kohlberg Kravis Roberts & Co 7,903 4
4 Oaktree Capital Group 7,199 4
5 General Atlantic 7,107 4
6 Macquarie Group 6,971 8
7 The Carlyle Group 6,653 8
8 Quadrangle Group 6,579 1
9 CVC Capital Partners 6,448 4
10 Permira 5,889 2
11 Novator Partners 5,806 1
12 Weston Presidio Capital 5,290 2
13 Madison Dearborn Partners 4,728 2
14 EnCap Investments 3,850 2
15 Apollo Global Management 3,776 4Source: mergermarket
VOLUME
VOLUME
Rank
Q1-Q3 2012 Company name Value (US$m)
Deal count
1 The Carlyle Group 15,495 20
2 Blackstone Group 8,741 14
3 AXA Private Equity 1,816 12
4 Kohlberg Kravis Roberts & Co 2,858 11
5 The Riverside Company 0 10
6 Lloyds TSB Development Capital 396 9
7 HIG Capital 47 8
8 EQT Partners 3,414 7
9 Vista Equity Partners 2,501 7
10 Warburg Pincus 1,638 7
11 Oaktree Capital Group 572 7
12 CVC Capital Partners 4,174 6
13 Bain Capital 4,141 6
14 Partners Group Holding 1,690 6
15 Sun Capital Partners 585 6Source: mergermarket
Rank
Q1-Q3 2012 Company name Value (US$m)
Deal count
1 Intel Capital 1,531 12
2 Draper Fisher Jurvetson 1,948 11
3 3i Group 1,122 11
4 Battery Ventures 830 9
5 The Riverside Company 70 9
6 Macquarie Group 6,971 8
7 The Carlyle Group 6,653 8
8 Sun Capital Partners 98 8
9 Benchmark Capital 1,619 6
10 Atlas Venture 1,571 6
11 Softbank Capital Partners 869 6
12 TA Associates 738 6
13 Kleiner, Perkins, Caufield & Byers 3,679 5
14 Polaris Venture Partners 1,514 5
15 Bessemer Venture Partners 873 5Source: mergermarket
ACTIVITY TABLE OF PRIVATE EQUITY FIRMS ON GLOBAL BUYOUTS
ACTIVITY TABLE OF PRIVATE EQUITY FIRMS ON GLOBAL EXITS
The private equity buyout activity tables by value and volume are based on private equity firms advising the bidder on buyout deals where the dominant geography of the target company is Global. The tables by value and volume have been run from 01-Jan-12 to 30-Sep-12 and exclude lapsed and withdrawn deals.
The private equity exit activity tables by value and volume are based on private equity firms advising the vendor on exit deals where the dominant geography of the target company is Global. The tables by value and volume have been run from 01-Jan-12 to 30-Sep-12 and exclude lapsed and withdrawn deals.

Monthly M&A Insider 05
GLOBAL OVERVIEW
TREND GRAPHS
GLOBAL M&A QUARTERLY TREND
0
200
400
600
800
1,000
1,200
1,400
Q312*
Q212
Q112
Q411
Q311
Q211
Q111
Q410
Q310
Q210
Q110
Q409
Q309
Q209
Q109
Q408
Q308
Q208
Q108
Q407
Q307
Q207
Q107
Q406
Q306
Q206
Q106
Valu
e (U
S$bn
)
Total value Mid-market value
Num
ber of deals
0
500
1,000
1,500
2,000
2,500
3,000
3,500
4,000
4,500
Total volume Mid-market volume
0
50
100
150
200
250
300
350
400
Q312*
Q212
Q112
Q411
Q311
Q211
Q111
Q410
Q310
Q210
Q110
Q409
Q309
Q209
Q109
Q408
Q308
Q208
Q108
Q407
Q307
Q207
Q107
Q406
Q306
Q206
Q106
Valu
e (U
S$bn
)
Buyout value Exit value
Num
ber of deals
Buyout volume Exit volume
0
100
200
300
400
500
600
700
800
900
GLOBAL M&A ANNUAL TREND GLOBAL M&A ANNUAL PRIVATE EQUITY TREND
0
500
1,000
1,500
2,000
2,500
3,000
3,500
4000
YTD 2012*201120102009200820072006
Valu
e (U
S$bn
)
Total value Mid-market value
Num
ber of deals
0
2,000
4,000
6,000
8,000
10,000
12,000
14,000
16,000
18,000
Total volume Mid-market volume
0
100
200
300
400
500
600
700
800
900
YTD 2012*201120102009200820072006
Valu
e (U
S$bn
)
Buyout value Exit value
Num
ber of deals
Buyout volume Exit volume
0
500
1,000
1,500
2,000
2,500
3,000
3,500
GLOBAL M&A QUARTERLY PRIVATE EQUITY TREND

Monthly M&A Insider 06
GLOBAL OVERVIEW
TREND GRAPHS
GLOBAL M&A SECTOR BREAKDOWN Q3 2012
GLOBAL GEOGRAPHIC BREAKDOWN Q3 2012
VALUE
VALUE
VOLUME
VOLUME
5.9%
16.6%
2.9% 1.8%1.0%
1.7%
7.6%
8.0%
20.0%
16.5%
16.2%
Industrials & Chemicals
TMT
Consumer
Business Services
Energy, Mining & Utilities
Financial Services
Pharma, Medical & Biotech
Leisure
Construction
Transportation
Real Estate
Agriculture
Defence
0.1%
1.7%
1.8%2.7%
51.4%
21.8%
22.3% Asia-Pacific
Europe
North America
Middle East & Africa
Central & South America
10.2%
12.5%
1.6%
0.3%1.0%
3.4%3.7%
7.2%
3.8%
8.0%
20.3%
15.1%
13.1%
Industrials & Chemicals
TMT
Consumer
Business Services
Energy, Mining & Utilities
Financial Services
Pharma, Medical & Biotech
Leisure
Construction
Transportation
Real Estate
Agriculture
Defence
4.2%2.4%
33.3%
38.5%
21.5% Asia-Pacific
Europe
North America
Middle East & Africa
Central & South America

Monthly M&A Insider 07
GLOBAL OVERVIEW
TREND GRAPHS
GLOBAL M&A DEAL SIZE BREAKDOWN
VALUE VOLUME
0
10
20
30
40
50
60
70
80
90
100
2012*201120102009200820072006
42.3%
16.8%
20.8%
7.5%
12.6%
39.8%
16.9%
23.0%
7.9%
12.5%
42.0%
15.3%
19.3%
8.9%
14.5%
40.6%
16.5%
20.5%
7.9%
14.5%
27.3%
20.6%
27.6%
9.5%
14.9%
29.8%
19.3%
26.2%
10.2%
14.5%
28.5%
19.3%
28.0%
10.8%
13.5%
<US$250m or undisclosed value
US$251m-US$500m
US$501m-US$2,000m
US$2,001m-US$5,000m
>US$5,001m
Perc
enta
ge
80
82
84
86
88
90
92
94
96
98
100
2012*201120102009200820072006
<US$250m or undisclosed value
US$251m-US$500m
US$501m-US$2,000m
US$2,001m-US$5,000m
>US$5,001m
1.2%
5.0%
4.7%
88.3%
1.3%
5.5%
5.1%
87.4%
0.6%
0.9%
3.9%
4.6%
90.1%
1.0%
3.8%
3.9%
90.9%
89.2%
4.5%
4.7%
1.1%
0.4%
1.1%
4.7%
4.8%
88.8%
0.7% 0.7% 0.5%
1.1%
5.0%
5.3%
88.1%
0.5%0.5%
Perc
enta
ge
SECTOR ANALYSISGLOBAL SECTOR ANALYSISSector Q3 2012 Q3 2011 % change
Value ($m) Mrk share Deal count Value ($m) Mrk share Deal count value volume
Energy, Mining & Utilities 92,020 19.9% 272 112,348 19.4% 288 -18% -6%
Industrials & Chemicals 76,058 16.5% 544 105,397 18.2% 660 -28% -18%
Consumer 76,565 16.6% 350 50,769 8.8% 423 51% -17%
Financial Services 34,951 7.6% 213 76,005 13.1% 292 -54% -27%
Pharma, Medical & Biotech 36,672 7.9% 194 60,182 10.4% 243 -39% -20%
Technology 57,735 12.5% 308 36,456 6.3% 328 58% -6%
Business Services 27,316 5.9% 334 31,627 5.5% 400 -14% -17%
Media 16,966 3.7% 96 6,495 1.1% 112 161% -14%
Transportation 13,277 2.9% 90 12,511 2.2% 96 6% -6%
Real Estate 8,303 1.8% 42 23,326 4.0% 63 -64% -33%
Leisure 7,914 1.7% 101 8,649 1.5% 104 -8% -3%
Telecommunications 506 0.1% 100 47,682 8.2% 36 -99% 178%
Defence 4,803 1.0% 9 115 0.0% 8 4077% 13%
Construction 7,920 1.7% 100 6,304 1.1% 119 26% -16%
Agriculture 506 0.1% 26 1,558 0.3% 32 -68% -19%
Total 461,512 2,779 579,424 3,204 -20% -13%

datasite.com
M E R R I L L D A T A S I T E ®
Maximize your deal’s potential with aMerrill DataSite virtual data room.
Every day, dealmakers all over the world use virtual data rooms from Merrill DataSite® to drive deals to asuccessful conclusion. Why? Because Merrill DataSite makes it easy to present your deal to buyers any-where around the world, and it’s fully supported by an expert and experienced project management team.Invite interested parties to review your deal’s due diligence information online, via a secure virtual dataroom, hosted by Merrill DataSite.
It’s faster. It’s less expensive. It’s more convenient. It captures buyers’ actual due diligence activities onlineand provides you with valuable intelligence to help negotiate a successful deal.
To find out more, or to arrange a demonstration of our VDR solution, call +1 888 867 0309, email usat [email protected], or visit www.datasite.com today.
In today’s uncertain marketwhat is the best way to presentour company’s assetsto bring the deal to asuccessfulclose?”Wrap up your dealwith Merrill DataSite®.

LATIN AM
ERICA
LATIN AMERICAA MERGERMARKET M&A REPORT ON
Monthly M&A Insider 09
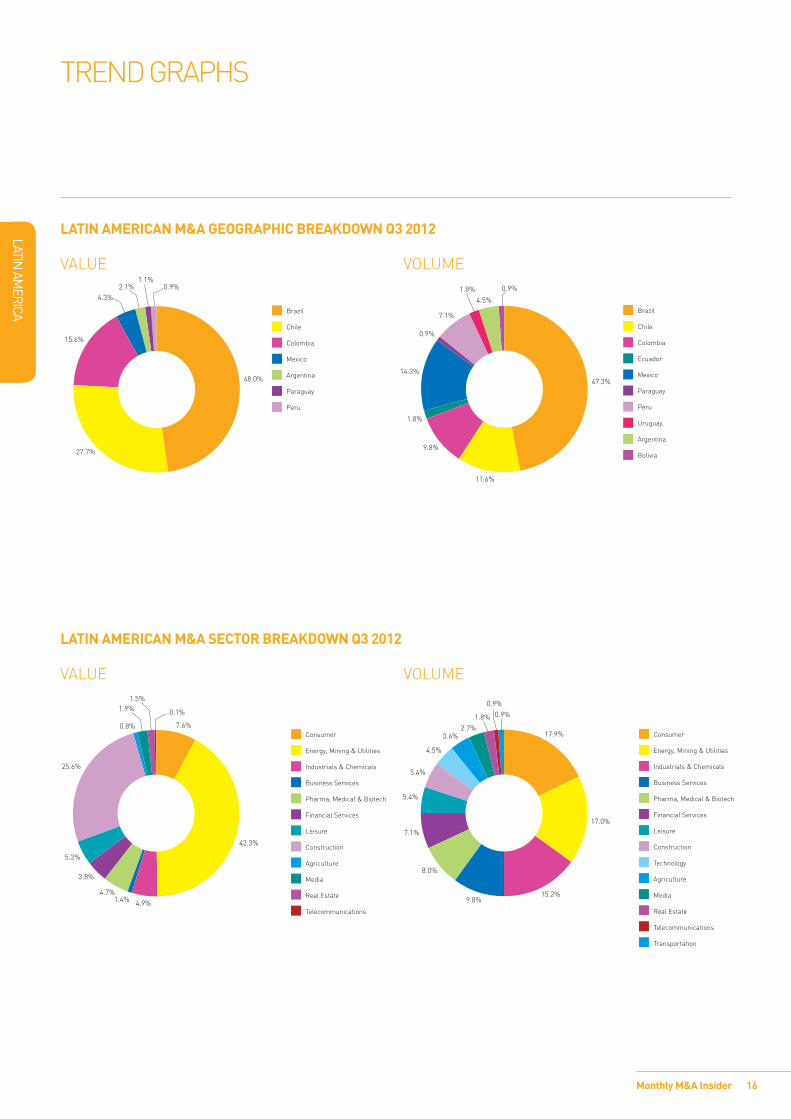
Brazil, Mexico, and Chile with the largest market share As expected, Brazil, with 247 deals worth US$37.9bn in the first three quarters of 2012, or a 47.3% market share of the Latin American M&A, was the most active country in the region. The largest deal in the year-to-date for Brazil remains the acquisition of a 44.4% stake in Redecard, a provider of credit card payment processing services, by Itau Unibanco for a deal value of US$5.2bn. The transaction was announced in February 2012.
Mexico was the second most active Latin American country in the first three quarters of the year, attaining a 29.2% share of deal value with 40 deals worth US$23.4bn. Such a large combined deal value was mainly due to the acquisition of a 49.7% stake in Grupo Modelo, a beer brewing company, by Anheuser-Busch. This transaction, which was valued at US$20.1bn, took place at the very end of June 2012.
Chile came in third with 38 deals and a US$7.1bn deal value representing an 8.8% market share in the region. Corporacion Nacional del Cobre de Chile’s acquisition of a 24.5% stake in Anglo American Sur SA, a copper mining and smelting company, for US$1.7bn was the largest in Chile in the year-to-date.
Consumer was the most active sector in the year-to-date, followed by Energy, Mining & UtilitiesIn the first three quarters of the year, the Consumer sector, which saw 27 deals worth US$29.1bn, was the most active sector in Latin America with a 36.3% market share by deal value. During the comparable period last year it was Telecommunications that dominated the Latin American M&A market, with 11 deals valued at US$32.6bn, or a 32% market share by deal value. Similarly to last year’s values for Telecommunications, which can mainly be attributed to a few extremely large deals, the Consumer sector has had unusually high investments thus far this year.
The largest deal in this sector in the year-to-date was the already mentioned acquisition of Grupo Modelo. The second largest deal was the acquisition of a 41.6% stake in Cerveceria Nacional Dominicana, the Dominican Republic beverage company, by Ambev Brasil Bebidas, the Brazil based manufacturer of soft drinks and alcoholic beverages, for US$1bn. The third largest deal happened to be the acquisition of another beverage company, Chile-based Embotelladoras Coca Cola Polar, by Embotelladora Andina for US$956m.
The Energy, Mining & Utilities sector attained a 23.6% market share by deal value in the year-to-date, with 74 deals valued at US$19bn. The largest transaction in the sector was the acquisition of a 60.1% stake in Cia de Gas de Sao Paulo, the Brazil-based energy company, by Cosan SA Industria e Comercio for US$2.6bn.
LATIN AMERICAN M&A ACTIVITY IN Q3 2012 SAW 112 DEALS WORTH US$13.4BN, THE LOWEST DEAL VALUE SINCE Q1 2009, WHICH HAD 101 DEALS VALUED AT US$12.1BN. THE TOP DEAL FOR Q3 2012 WAS THE ACQUISITION OF OBRASCON HUARTE LAIN BRASIL, THE BRAZIL-BASED CONSTRUCTION COMPANY, BY ABERTIS INFRAESTRUCTURAS SA AND BROOKFIELD INFRASTRUCTURE PARTNERS LP FOR US$2.7BN. IT WAS FOLLOWED BY THE ACQUISITION OF A 75% STAKE IN PROMIGAS SA ESP, THE COLOMBIA-BASED OPERATOR OF NATURAL GAS TRANSMISSION AND DISTRIBUTION SYSTEMS, BY CORPORACION FINANCIERA COLOMBIANA SA FOR US$1.9BN.

10
LATIN AM
ERICA
Monthly M&A Insider
Deal summary
Announced: 06-Aug-12 Deal Value: US$2,763m
Brookfield Infrastructure Partners LP and Abertis Infraestructuras, SA has agreed to acquire a 60% stake in Obrascon Huarte Lain Brasil SA from OHL Concesiones SA.
TERMS:• Abertis will issue 81.48m shares, representing a 10% of
its total outstanding shares, as an equity consideration to OHL Brazil.
• An assumed concessions liability of ¤504.1m of OHL.
• A cash consideration of ¤10.7m (US$13.3m).
• The implied equity value of the transaction is approximately ¤2,197.6m.
• The offer provides a discount of 7.8% based on OHL Brazil closing share price of BRL17.6 (US$8.58) on 07-Aug-12.
• The offer provides a discount of 10.9% based on OHL Brazil closing share price of BRL16.22 (US$8.88) on 06-Jul-12.
RATIONALE: • The acquisition is in line with Abertis’ expansion strategy.
• The acquisition will increase the concessions portfolio managed by Abertis and Brookfield.
• The acquisition will enable Brookfield to generate stable cash flow.
POST DEAL DETAILS: • Brookfield and Abertis will launch a tender offer to
acquire the remaining 40% stake in OHL Brazil.
• Brookfield Infrastructure expects to initially invest approximately US$250m in OHL Brazil.
• OHL Brasil will own a 15% stake in Abertis.
EXPECTED COMPLETION: • The transaction is expected to close in the fourth quarter
of 2012.
CONDITIONS:• Subject to customary closing conditions.
• Subject to approval from regulatory authorities.
• Subject to third party consents.
• Subject to Obrascon Huarte Lain Brasil SA shareholders’ approval.
BACKGROUND: • On 06-Aug-12, a joint venture was formed
between Brookfield and Abertis to acquire a 60% stake in OHL Brazil.
• Brookfield Infrastructure and its institutional partners would own 49% of the joint venture and Abertis would own the remaining 51% in the joint venture.
• Earlier OHL Brazil held a 5% stake in Abertis.
DEAL OF THE QUARTER

11
LATIN AM
ERICA
Monthly M&A Insider
DEAL OF THE QUARTER
Target
Obrascon Huarte Lain Brasil SA
Headquarters: Rua Joaquim Floriano, 913 - 6 FloorItaim BibiSao PauloBrazil
Sector: Construction
Description: Brazil based company engaged highway operator and construction
Bidder
Abertis Infraestructure Partners SA
Headquarters: Avinguda del Parc Logistic 12-20Barcelona 08040Spain
Sector: Construction
Description: Spain based company engaged in the management of mobility and telecommunications infrastructures
Brookfield Infrastructure Partners LP
Headquarters: Canada
Sector: Construction
Description: Canada based operator of infrastructure assets
Advisers
Target/Seller Bidder
Financial Banco BTG Pactual JPMorgan
Financial SG
Legal Clifford Chance (Advising JPMorgan);Lefosse Advogados; Linklaters
Legal Freshfields Bruckhaus Deringer;Machado Meyer Sandacz e Opice
Exit multiples – Y/E 31-Dec-11 Premium analysis
Multiples Value (US$m) Offer price per share (US$) -
Revenue 2.6x 18,655 1 day before -7.79%
EBITDA 7.1x 3,324 1 month before -10.87%
EBIT 8.9x 2,960 1 day after -7.32%
Earnings 2.5x 1,839 Pre-rumour -5.66%

12
LATIN AM
ERICA
Monthly M&A Insider
TOP 10 LATIN AMERICAN ANNOUNCED DEALS OF Q3 2012Announced Bidder company Target company Target dominant
sectorSeller company Exit multiples (x) Bid premia
1-day before
Deal value
(US$m)Revenue EBITDA P/E
6-Aug-12 Abertis Infraestructuras SA; and Brookfield Infrastructure Partners LP
Obrascon Huarte Lain Brasil SA (60% stake)
Construction OHL Concesiones SA 2.6 7.1 2.5 -7.8% 2,763
24-Jul-12 Corporacion Financiera Colombiana SA
Promigas SA ESP (75.03% stake)
Energy, Mining & Utilities
20.2 39.1 19.3 -13.5% 1,908
23-Aug-12 Corporacion Nacional del Cobre de Chile
Anglo American Sur SA (24.5% stake)
Energy, Mining & Utilities
Anglo American Plc - - - - 1,700
23-Aug-12 Mitsui & Co Ltd; and Corporacion Nacional del Cobre de Chile
Anglo American Sur SA (5% stake)
Energy, Mining & Utilities
Anglo American Plc; and Mitsubishi Corporation
- - - - 1,100
02-Jul-12 Public Sector Pension Investment Board
Isolux Infrastructure SA (undisclosed stake)
Construction Grupo Isolux Corsan SA - - - - 630
08-Aug-12 Royal DSM NV Tortuga Companhia Zootecnica Agraria
Pharma, Medical & Biotech
- - - - 575
19-Jul-12 Consortium led by LarrainVial SA
Repsol Butano Chile Industrials & Chemicals
Repsol SA - - - - 540
05-Jul-12 STR Projetos e Participacoes Ltda
STR Projetos e Participacoes em Recursos Naturais SA (9% stake)
Energy, Mining & Utilities
Banco BTG Pactual SA - - - - 367
11-Jul-12 Australia Acquisition Corp Ferrous Resources do Brasil Ltda (9.7% Stake); and Asian Coast Development (Canada) Limited (65.4% Stake)
Leisure Harbinger Capital Partners
- - - - 350
13-Sep-12 The Carlyle Group LLC Tok & Stok Ltda (60% stake)
Consumer 1.2 - - - 345
Based on announced deals, including lapsed and withdrawn bids Based on dominant geography of target company being Latin AmericaData correct as of 09-Oct-12
Source: mergermarket
TOP DEALS

13
LATIN AM
ERICA
Monthly M&A Insider
The financial adviser league tables by value and volume have been run from 01-Jan-12 to 30-Sep-12. The tables cover all sectors and are based on the geography of either the target, bidder or seller being Latin American.
VALUERanking Q1-Q3 2012 Q1-Q3 2011
Q1-Q3 2012 Q1-Q3 2011 Company name Value (US$m)
Deal count Value (US$bn)
Value change (%)
1 12 JPMorgan 36,158 13 9,630 275%
2 17 Lazard 30,177 11 7,035 329%
3 19 Deutsche Bank 27,725 10 5,172 436%
4 10 Barclays 26,604 4 14,780 80.0%
5 15 Bank of America Merrill Lynch 25,039 10 7,573 231%
6 8 Morgan Stanley 23,244 6 15,235 52.6%
7 2 Banco Itau BBA 21,361 29 26,761 -20.2%
8 1 Banco BTG Pactual 18,826 31 35,751 -47.3%
9 6 Goldman Sachs 17,652 17 19,470 -9.3%
10 7 Citigroup 15,121 9 15,735 -3.9%
11 3 Banco Bradesco BBI 14,126 16 24,973 -43.4%
12 5 Rothschild 12,657 16 20,391 -37.9%
13 4 Credit Suisse 11,095 19 23,178 -52.1%
14 11 Santander Global Banking and Markets 6,068 8 14,170 -57.2%
15 16 Banco Espirito Santo de Investimento 5,783 5 7,192 -19.6%
16 42 BR Partners 5,700 8 509 1019%
17 14 UBS Investment Bank 4,022 8 7,950 -49.4%
18 - ABN AMRO Bank 3,456 1 - -
19 - SG 2,763 1 - -
20 13 HSBC 2,115 4 8,916 -76.3%Source: mergermarket
TOP 20 FINANCIAL ADVISERS – LATIN AMERICA
VOLUMERanking Q1-Q3 2012 Q1-Q3 2011
Q1-Q3 2012 Q1-Q3 2011 Company name Value (US$m)
Deal count Deal count Deal count change
1 1 Banco BTG Pactual 18,826 31 26 5
2 2 Banco Itau BBA 21,361 29 25 4
3 3 Credit Suisse 11,095 19 22 -3
4 4 Goldman Sachs 17,652 17 19 -2
5 5 Banco Bradesco BBI 14,126 16 17 -1
6 9 Rothschild 12,657 16 11 5
7 14 JPMorgan 36,158 13 7 6
8 19 Lazard 30,177 11 5 6
9 25 Deutsche Bank 27,725 10 4 6
10 17 Bank of America Merrill Lynch 25,039 10 6 4
11 8 Citigroup 15,121 9 13 -4
12 7 Santander Global Banking and Markets 6,068 8 14 -6
13 10 BR Partners 5,700 8 11 -3
14 16 UBS Investment Bank 4,022 8 6 2
15 20 Vinci Partners 153 7 5 2
16 6 Morgan Stanley 23,244 6 14 -8
17 11 Banco Espirito Santo de Investimento 5,783 5 10 -5
18 18 Barclays 26,604 4 5 -1
19 23 HSBC 2,115 4 4 0
20 - Ernst & Young 57 4 - -Source: mergermarket
TOP 20 FINANCIAL ADVISERS – LATIN AMERICA
LEAGUE TABLES

14
LATIN AM
ERICA
Monthly M&A Insider
The legal adviser league tables by value and volume have been run from 01-Jan-12 to 30-Sep-12 and include lapsed and withdrawn deals. The tables cover all sectors and are based on the geography of either the target, bidder or seller being Latin American.
LEAGUE TABLES
VOLUMERanking Q1-Q3 2012 Q1-Q3 2011
Q1-Q3 2012 Q1-Q3 2011 Company name Value (US$m)
Deal count Deal count Deal count change
1 2 Machado Meyer Sendacz e Opice 9,740 41 34 7
2 1 Pinheiro Neto Advogados 3,339 32 39 -7
3 6 Souza, Cescon, Barrieu & Flesch Advogados 7,194 24 19 5
4 3 Mattos Filho, Veiga Filho, Marrey Jr. e Quiroga Advogados 17,020 21 27 -6
5 4 Barbosa, Mussnich & Aragao 4,644 20 25 -5
6 21 Lefosse Advogados 8,102 15 9 6
7 20 Veirano Advogados 873 15 10 5
8 30 Azevedo Sette Advogados 1,466 14 5 9
9 44 Linklaters 6,547 12 3 9
10 16 Gomez-Pinzon Zuleta 1,055 12 11 1
11 5 Tozzini Freire Teixeira e Silva Advogados 937 12 21 -9
12 7 Baker & McKenzie 2,553 11 17 -6
13 12 Estudio Muniz, Ramirez, Perez-Taiman & Olaya Abogados 1,104 11 13 -2
14 17 Skadden Arps Slate Meagher & Flom 31,122 10 10 0
15 8 Clifford Chance 27,741 10 14 -4
16 23 Jones Day 5,819 10 7 3
17 19 Prieto & Carrizosa 1,047 9 10 -1
18 10 Rodrigo Elias & Medrano 732 9 13 -4
19 18 Sullivan & Cromwell 24,161 8 10 -2
20 57 Uria Menendez 6,368 8 2 6Source: mergermarket
TOP 20 LEGAL ADVISERS – LATIN AMERICA
VALUERanking Q1-Q3 2012 Q1-Q3 2011
Q1-Q3 2012 Q1-Q3 2011 Company name Value (US$m)
Deal count Value (US$bn)
Value change (%)
1 3 Skadden Arps Slate Meagher & Flom 31,122 10 17,783 75.0%
2 6 Clifford Chance 27,741 10 14,430 92.2%
3 54 Freshfields Bruckhaus Deringer 25,517 3 884 2787%
4 4 Sullivan & Cromwell 24,161 8 17,452 38.4%
5 - Alston & Bird 20,805 3 - -
6 55 Creel, Garcia-Cuellar, Aiza y Enriquez 20,466 4 844 2325%
7 155 Greenberg Traurig 20,120 5 39 51490%
8 56 Mijares, Angoitia, Cortes y Fuentes 20,100 3 819 2354%
9 17 Cravath Swaine & Moore 20,100 1 6,535 208%
10 19 Mattos Filho, Veiga Filho, Marrey Jr. e Quiroga Advogados 17,020 21 6,458 164%
11 14 Shearman & Sterling 10,069 7 7,887 27.7%
12 5 Machado Meyer Sendacz e Opice 9,740 41 16,222 -40.0%
13 31 Lefosse Advogados 8,102 15 2,503 224%
14 9 Souza, Cescon, Barrieu & Flesch Advogados 7,194 24 10,922 -34.1%
15 11 Cleary Gottlieb Steen & Hamilton 7,022 5 9,819 -28.5%
16 47 Linklaters 6,547 12 1,092 500%
17 40 Uria Menendez 6,368 8 1,414 350%
18 8 Simpson Thacher & Bartlett 6,097 4 11,621 -47.5%
19 69 Jones Day 5,819 10 658 784%
20 - Bredin Prat 5,427 1 - -Source: mergermarket
TOP 20 LEGAL ADVISERS – LATIN AMERICA

15
LATIN AM
ERICA
Monthly M&A Insider
TREND GRAPHS
0
10
20
30
40
50
60
70
Q312*
Q212
Q112
Q411
Q311
Q211
Q111
Q410
Q310
Q210
Q110
Q409
Q309
Q209
Q109
Q408
Q308
Q208
Q108
Q407
Q307
Q207
Q107
Q406
Q306
Q206
Q106
Total value Mid-market value
Num
ber of dealsValu
e (U
S$bn
)
0
20
40
60
80
100
120
140
160
180
Total volume Mid-market volume
0
500
1,000
1,500
2,000
2,500
3,000
3,500
4,000
4,500
Q312*
Q212
Q112
Q411
Q311
Q211
Q111
Q410
Q310
Q210
Q110
Q409
Q309
Q209
Q109
Q408
Q308
Q208
Q108
Q407
Q307
Q207
Q107
Q406
Q306
Q206
Q106
Valu
e (U
S$m
)
Buyout value Exit value
Num
ber of deals
Buyout volume Exit volume
0
2
4
6
8
10
12
14
16
18
0
20
40
60
80
100
120
140
160
180
YTD 2012*201120102009200820072006
Total value Mid-market value
Num
ber of dealsValu
e (U
S$bn
)
0
100
200
300
400
500
600
700
Total volume Mid-market volume
0
1,000
2,000
3,000
4,000
5,000
6,000
7,000
8,000
YTD 2012*201120102009200820072006
Valu
e (U
S$m
)
Buyout value Exit value
Num
ber of deals
Buyout volume Exit volume
0
5
10
15
20
25
30
35
40
45
50
LATIN AMERICAN M&A QUARTERLY TREND
LATIN AMERICAN M&A ANNUAL TREND LATIN AMERICAN M&A ANNUAL PRIVATE EQUITY TREND
LATIN AMERICAN M&A QUARTERLY PRIVATE EQUITY TREND
16
LATIN AM
ERICA
Monthly M&A Insider
TREND GRAPHS
LATIN AMERICAN M&A GEOGRAPHIC BREAKDOWN Q3 2012
VALUE VOLUME
15.6%
27.7%
2.1%1.1%
0.9%
48.0%
4.3%
Brazil
Chile
Colombia
Mexico
Argentina
Paraguay
Peru
47.3%
11.6%
14.3%
1.8%
9.8%
0.9%
7.1%
1.8%4.5%
0.9%
Brazil
Chile
Colombia
Ecuador
Mexico
Paraguay
Peru
Uruguay
Argentina
Bolivia
LATIN AMERICAN M&A SECTOR BREAKDOWN Q3 2012
VALUE VOLUME
7.6%
4.9%
5.3%
3.8%
4.7%1.4%
42.3%
25.6%
1.5%
0.1%1.9%
0.8%Consumer
Energy, Mining & Utilities
Industrials & Chemicals
Business Services
Pharma, Medical & Biotech
Financial Services
Leisure
Construction
Agriculture
Media
Real Estate
Telecommunications
17.9%
17.0%
15.2%9.8%
8.0%
4.5%
2.7%3.6%
0.9%0.9%
1.8%
7.1%
5.4%
5.4%
Consumer
Energy, Mining & Utilities
Industrials & Chemicals
Business Services
Pharma, Medical & Biotech
Financial Services
Leisure
Construction
Technology
Agriculture
Media
Real Estate
Telecommunications
Transportation

17
LATIN AM
ERICA
Monthly M&A Insider
LATIN AMERICAN M&A DEAL SIZE BREAKDOWN
VALUE VOLUME
0
10
20
30
40
50
60
70
80
90
100
2012*201120102009200820072006
<US$250m or undisclosed value
US$251m-US$500m
US$501m-US$2,000m
US$2,001m-US$5,000m
>US$5,001m
12.7%
10.3%
21.8%
8.3%
46.9%
25.2%
15.6%
32.4%
10.7%
16.2%
14.6%
10.0%
24.5%
20.3%
30.6%
14.8%
10.1%
36.6%
29.3%
9.2%
39.6%
19.2%
24.9%
6.9%
9.4%14.5%
10.7%
27.5%
18.4%
28.9%
14.0%
14.1%
3.5%
32.3%
36.1%
Perc
enta
ge
20
30
40
50
60
70
80
90
100
2012*201120102009200820072006
1.0%
5.4%
7.4%
85.1%
0.2%
5.5%
6.2%
87.5%
0.6%
4.7%
5.3%
88.2%
0.3%
6.9%
5.4%
85.7% 82.3%
6.3%
8.1%
1.2%1.0% 0.7% 1.2% 1.8% 2.0%
6.0%
5.8%
86.3%
0.8% 0.5%
Perc
enta
ge
1.1%
7.7%
6.9%
84.6%
<US$250m or undisclosed value
US$251m-US$500m
US$501m-US$2,000m
US$2,001m-US$5,000m
>US$5,001m
0.3%
TREND GRAPHS
LATIN AMERICAN SECTOR ANALYSISSector Q3 2012 Q3 2011 % change
Value ($m) Mrk share Deal count Value ($m) Mrk share Deal count Value Volume
Energy, Mining & Utilities 5,696 42.3% 19 4,133 9.3% 15 38% 27%
Industrials & Chemicals 659 4.9% 17 1,166 2.6% 28 -43% -39%
Consumer 1,020 7.6% 20 6,160 13.8% 31 -83% -35%
Financial Services 516 3.8% 8 6,199 13.9% 11 -92% -27%
Pharma, Medical & Biotech 626 4.7% 9 891 2.0% 10 -30% -10%
Technology 5 0.0% 5 811 1.8% 9 -99% -44%
Business Services 192 1.4% 11 1,483 3.3% 18 -87% -39%
Media 250 1.9% 3 0 0.0% 2 0% 50%
Transportation 0 0.0% 1 836 1.9% 4 -100% -75%
Real Estate 202 1.5% 2 874 2.0% 7 -77% -71%
Leisure 711 5.3% 6 134 0.3% 4 431% 50%
Telecommunications 12 0.1% 1 21,010 47.1% 5 0% 100%
Defence 0 0.0% 0 0 0.0% 0 100% 0%
Construction 3,447 25.6% 6 165 0.4% 4 100% 50%
Agriculture 114 0.8% 4 774 1.7% 8 -85% -50%
Total 13,450 112 44,636 156 -70% -28%
SECTOR ANALYSIS

NORTH AM
ERICA
A MERGERMARKET M&A REPORT ON
18Monthly M&A Insider
NORTH AMERICA
Q3 2012 HIGHEST PERFORMING QUARTER SINCE Q1 2011 Q3 2012 ENDED ON A HIGH NOTE WITH 879 DEALS COLLECTIVELY VALUED AT US$235.7BN, THE HIGHEST VALUE SINCE Q1 2011 (US$263BN). THIS WAS A 12.7% INCREASE IN VALUE FROM Q3 2011, BUT A 10.8% DECREASE IN VOLUME (US$209.2BN WITH 985 DEALS). THE HIGHEST PERFORMING QUARTER IN THE YEAR-TO-DATE, Q3 2012, REPRESENTS 39.7% OF TOTAL NORTH AMERICAN M&A IN THE YEAR-TO-DATE. BOTH BUYOUTS AND EXITS DECREASED IN VOLUME FOR Q3 FROM THE LAST QUARTER BY 15.2% AND 8.9% RESPECTIVELY.
Energy, Mining and Utilities dominated top deals for the third quarterThe Energy, Mining and Utilities sector secured three of the top 10 deal spots with the acquisition of Nexen Inc by China National Offshore Oil Corporation Ltd for US$17.6bn, which was the second largest deal of the month, and two other acquisitions worth over US$5bn. Due to the large value of deals for this quarter, Energy, Mining and Utilities represented 24.5% of all North American M&A by value.
Consumer sector sees strong growth in SeptemberFor the last month of the quarter, the Consumer sector saw an increase of 717% from Q3 2011 with 78 deals worth US$35.3bn. The largest deal for this quarter was also in the Consumer sector, with the US$26.3bn spin-off of Kraft Foods Inc’s North American grocery business, Kraft Foods Group Inc, to the shareholders of Kraft Foods. This growth brought the Consumer sector’s market share in the year-to-date to 15% by value, a 13% increase from the comparable period last year.
Goldman Sachs tops financial advisers league tablesWith 136 deals worth US$223bn, Goldman Sachs climbed to the top spot on mergermarket’s league tables for financial advisers in both value and volume. This represented an 18.7% increase in value for the investment bank.

19
NORTH AM
ERICA
Monthly M&A Insider
DEAL OF THE QUARTER
Deal summary
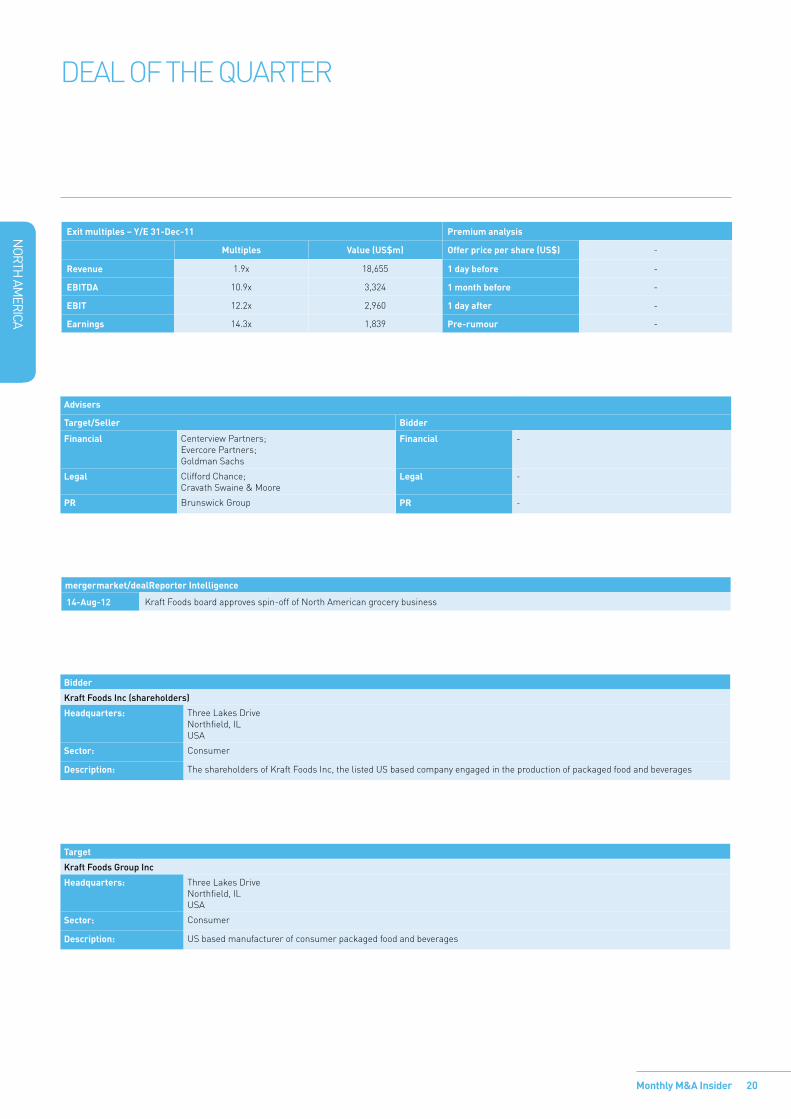
Announced: 14-Aug-12 Deal Value: US$26,294m
Kraft Foods Inc has agreed to spin off its North American grocery business, Kraft Foods Group Inc, to the shareholders of Kraft Foods.
TERMS:• Kraft Foods’ shareholders will receive one share of Kraft
Foods Group for every three shares of Kraft Foods held.
• The distribution will be made in book-entry form, and no physical share certificates will be issued.
• In addition, no fractional Kraft Foods Group shares will be issued. All fractional shares will be aggregated and sold in the open market. The cash proceeds from such sales will be distributed to the shareholders who would have otherwise received fractional shares. Such cash distributions, unlike the distribution of shares, will be taxable.
POST DEAL DETAILS:• Kraft Foods Group will be listed on NASDAQ Global Select
Market, under the symbol “KRFT”.
• Kraft Foods will change its name to Mondelez International Inc and its ticker symbol to “MDLZ”.
EXPECTED COMPLETION: • Kraft Foods Group is expected to commence trading
on 02-Oct-12.
CONDITIONS:• Customary closing conditions.
BACKGROUND: • Kraft Foods’ Board of Directors has approved
the transaction.
UPDATE 01-OCT-12:• Kraft Foods have completed the spin-off of its North
American grocery business. Kraft Foods has changed its name to Mondelez International. Kraft Foods Group shares will begin trading on NASDAQ on 02-Oct-12, under the ticker symbol “KRFT”.
UPDATE 02-OCT-12:• Kraft Foods Group has started trading on NASDAQ at the
opening price of US$44.45.
20
NORTH AM
ERICA
Monthly M&A Insider
DEAL OF THE QUARTER
Bidder
Kraft Foods Inc (shareholders)
Headquarters: Three Lakes DriveNorthfield, ILUSA
Sector: Consumer
Description: The shareholders of Kraft Foods Inc, the listed US based company engaged in the production of packaged food and beverages
Target
Kraft Foods Group Inc
Headquarters: Three Lakes DriveNorthfield, ILUSA
Sector: Consumer
Description: US based manufacturer of consumer packaged food and beverages
Advisers
Target/Seller Bidder
Financial Centerview Partners;Evercore Partners;Goldman Sachs
Financial -
Legal Clifford Chance;Cravath Swaine & Moore
Legal -
PR Brunswick Group PR -
mergermarket/dealReporter Intelligence
14-Aug-12 Kraft Foods board approves spin-off of North American grocery business
Exit multiples – Y/E 31-Dec-11 Premium analysis
Multiples Value (US$m) Offer price per share (US$) -
Revenue 1.9x 18,655 1 day before -
EBITDA 10.9x 3,324 1 month before -
EBIT 12.2x 2,960 1 day after -
Earnings 14.3x 1,839 Pre-rumour -

21
NORTH AM
ERICA
Monthly M&A Insider
TOP DEALS & EXPECTED DEALS
TOP 10 NORTH AMERICAN ANNOUNCED DEALS OF Q3 2012Announced Bidder company Target company Target dominant
sectorSeller company Exit multiples (x) Bid premia
1-day before
Deal value(US$m)Revenue EBITDA P/E
14-Aug-12 Kraft Foods Inc (shareholders)
Kraft Foods Group Inc Consumer Mondelez International Inc
1.9 10.9 14.3 - 26,294
23-Jul-12 China National Offshore Oil Corporation Ltd
Nexen Inc Energy, Mining & Utilities
2.7 4.5 22.2 61.2% 17,654
18-Jul-12 BC Partners Limited; and Canada Pension Plan Investment Board
Suddenlink Communications
Telecommunications GS Capital Partners; Oaktree Capital Group; and Quadrangle Group
3.4 8.9 - - 6,579
06-Aug-12 Kinder Morgan Energy Partners LP
El Paso Natural Gas Company (50% stake); and Tennessee Gas Pipeline Company LLC
Energy, Mining & Utilities
Kinder Morgan Inc - - - - 6,220
20-Aug-12 Aetna Inc Coventry Health Care Inc Pharma, Medical & Biotech
0.5 5.7 11.4 20.3% 5,702
10-Sep-12 Plains Exploration & Production Company
BP plc (Outer Continental Shelf of the Gulf of Mexico assets)
Energy, Mining & Utilities
BP Plc - - - - 5,550
30-Aug-12 The Carlyle Group LLC DuPont Performance Coatings
Industrials & Chemicals
E I du Pont de Nemours and Company
1.1 - - - 4,900
09-Jul-12 WellPoint Inc Amerigroup Corporation Pharma, Medical & Biotech
0.7 8.6 24.1 43.0% 4,558
30-Jul-12 Chicago Bridge & Iron Company NV
The Shaw Group Inc Industrials & Chemicals
- - - 72.3% 4,249
01-Jul-12 Linde AG Lincare Holdings Inc Pharma, Medical & Biotech
2.3 9.4 21.5 22.0% 4,245
Based on announced deals, including lapsed and withdrawn bids Based on dominant geography of target company being North America (US + Canada) Data correct as of 08-Oct-12
Source: mergermarket

22
NORTH AM
ERICA
Monthly M&A Insider
Situation Target company Sector Potential bidder company
Financial adviser to bidder (B); target (T); seller (S)
Seller company
Market cap/ est. value (US$m)
Comments
Expected Deal Best Buy Co Inc Consumer Richard Schulze
Goldman Sachs (B) 6,286 Richard Schulze, the 20.3% shareholder of Best Buy Co Inc, the listed US based retailer of electronics, has announced that he plans to take the company private for US$24 to US$26 per share. On 24-Jul-12, Best Buy engaged Goldman Sachs to explore defensive measures.
Expected Deal Monster Worldwide Inc Technology Undisclosed bidder
Stone Key Partners (T); Bank of American Merrill Lynch (T)
986 On 01-Mar-12, Monster Worldwide Inc, the listed US based provider of employment services, announced that its Board of Directors was reviewing strategic alternatives for the company. Monster Worldwide has retained Stone Key Partners and Bank of American Merrill Lynch as financial advisors for the review.
Expected Deal Digital Generation Systems Inc
Business Services
Undisclosed bidder
Goldman Sachs (T) 318 On 16-Jul-12, Digital Generation Systems Inc, the listed US based provider of digital technology services, announced that its Board of Directors was looking into strategic alternatives for the company. The company has engaged Goldman Sachs in connection with the matter.
Expected Deal Winnebago Industries Inc Industrials & Chemicals
North Street Capital
263 On 18-May-12, Winnebago Industries Inc, the listed US based manufacturer of recreation vehicles, received an unsolicited proposal from North Street Capital, the US based private equity firm. As a part of the offer, North Street Capital would acquire Winnebago Industries for US$11.00 per share.
Expected deals based on confirmed announcements by companies involved Data correct as of 08-Oct-12
PIPELINE OF NORTH AMERICAN EXPECTED DEALS
TOP DEALS & EXPECTED DEALS

23
NORTH AM
ERICA
Monthly M&A Insider
Ranking Q1-Q3 2012 Q1-Q3 2011
Q1-Q3 2012 Q1-Q3 2011 Company name Value (US$bn)
Deal count Value (US$bn)
Value change (%)
1 2 Goldman Sachs 222,999 136 187,886 18.7%
2 1 JPMorgan 135,918 96 190,897 -28.8%
3 6 Barclays 122,790 100 125,356 -2.0%
4 3 Morgan Stanley 122,663 94 161,290 -23.9%
5 5 Bank of America Merrill Lynch 121,341 83 129,695 -6.4%
6 4 Credit Suisse 116,980 77 138,082 -15.3%
7 9 Deutsche Bank 108,119 73 80,038 35.1%
8 8 Citigroup 103,662 67 83,065 24.8%
9 12 RBC Capital Markets 71,696 92 29,223 145.3%
10 11 Evercore Partners 61,431 49 51,916 18.3%
11 17 Centerview Partners 53,318 12 17,887 198.1%
12 7 Lazard 47,875 76 108,334 -55.8%
13 10 UBS Investment Bank 47,202 50 78,495 -39.9%
14 19 BMO Capital Markets 41,260 32 17,591 134.6%
15 13 Jefferies & Company 39,962 67 28,744 39.0%
16 18 Rothschild 38,839 48 17,745 118.9%
17 41 Greenhill & Co 34,122 22 5,328 540.4%
18 16 Wells Fargo Securities 24,712 39 19,703 25.4%
19 22 Nomura Holdings 23,994 14 15,248 57.4%
20 62 Rabobank 23,516 9 1,874 1154.9%Source: mergermarket
The financial adviser league tables by value and volume have been run from 01-Jan-12 to 30-Sep-12. The tables cover all sectors and are based on the geography of either the target, bidder or seller being US or Canadian.
TOP 20 FINANCIAL ADVISERS – NORTH AMERICA
LEAGUE TABLES
Ranking Q1-Q3 2012 Q1-Q3 2011
Q1-Q3 2012 Q1-Q3 2011 Company name Value (US$bn)
Deal count Deal count Deal count change
1 1 Goldman Sachs 222,999 136 109 27
2 9 Barclays 122,790 100 54 46
3 4 JPMorgan 135,918 96 78 18
4 3 Morgan Stanley 122,663 94 82 12
5 11 RBC Capital Markets 71,696 92 48 44
6 2 Bank of America Merrill Lynch 121,341 83 89 -6
7 6 Credit Suisse 116,980 77 65 12
8 12 Lazard 47,875 76 44 32
9 10 Deutsche Bank 108,119 73 48 25
10 8 Citigroup 103,662 67 59 8
11 7 Jefferies & Company 39,962 67 61 6
12 13 Houlihan Lokey 8,311 63 41 22
13 5 UBS Investment Bank 47,202 50 66 -16
14 20 Evercore Partners 61,431 49 25 24
15 14 Rothschild 38,839 48 37 11
16 16 Raymond James & Associates 3,073 44 29 15
17 23 Moelis & Company 18,721 43 22 21
18 26 William Blair & Company 4,593 41 22 19
19 33 Wells Fargo Securities 24,712 39 15 24
20 27 Keefe, Bruyette & Woods 2,343 38 21 17Source: mergermarket
TOP 20 FINANCIAL ADVISERS – NORTH AMERICA
VALUE
VOLUME

24
NORTH AM
ERICA
Monthly M&A Insider
Ranking Q1-Q3 2012 Q1-Q3 2011
Q1-Q3 2012 Q1-Q3 2011 Company name Value (US$bn)
Deal count Deal count Deal count change
1 2 Kirkland & Ellis 86,729 177 119 58
2 3 Jones Day 71,304 167 104 63
3 1 Latham & Watkins 111,664 157 122 35
4 5 DLA Piper 25,394 122 83 39
5 4 Skadden Arps Slate Meagher & Flom 134,122 104 85 19
6 8 Weil Gotshal & Manges 77,727 95 69 26
7 6 Simpson Thacher & Bartlett 94,466 76 79 -3
8 41 Vinson & Elkins 46,945 73 33 40
9 17 Stikeman Elliott 48,289 72 50 22
10 7 Sullivan & Cromwell 76,036 70 69 1
11 12 Blake, Cassels & Graydon 64,013 69 57 12
12 21 Morgan Lewis & Bockius 9,823 68 45 23
13 13 Davis Polk & Wardwell 98,135 64 53 11
14 60 White & Case 57,489 62 23 39
15 42 Morrison & Foerster 40,264 62 32 30
16 19 Baker & McKenzie 23,771 61 46 15
17 22 Greenberg Traurig 18,799 59 44 15
18 32 Paul Hastings 10,954 57 39 18
19 11 Hogan Lovells 16,087 52 58 -6
20 9 Wilson Sonsini Goodrich & Rosati 11,035 52 65 -13Source: mergermarket
The legal adviser league tables by value and volume have been run from 01-Jan-12 to 30-Sep-12 and include lapsed and withdrawn deals. The tables cover all sectors and are based on the geography of either the target, bidder or seller being US or Canadian.
TOP 20 LEGAL ADVISERS – NORTH AMERICA
LEAGUE TABLES
Ranking Q1-Q3 2012 Q1-Q3 2011
Q1-Q3 2012 Q1-Q3 2011 Company name Value (US$bn)
Deal count Value (US$bn)
Value change (%)
1 7 Skadden Arps Slate Meagher & Flom 134,122 104 115,283 16.3%
2 4 Latham & Watkins 111,664 157 131,978 -15.4%
3 12 Davis Polk & Wardwell 98,135 64 75,350 30.2%
4 2 Simpson Thacher & Bartlett 94,466 76 178,911 -47.2%
5 20 Kirkland & Ellis 86,729 177 49,541 75.1%
6 3 Wachtell, Lipton, Rosen & Katz 86,583 42 156,351 -44.6%
7 9 Cleary Gottlieb Steen & Hamilton 81,526 43 104,675 -22.1%
8 10 Weil Gotshal & Manges 77,727 95 89,044 -12.7%
9 1 Sullivan & Cromwell 76,036 70 181,584 -58.1%
10 44 Clifford Chance 72,109 38 21,116 241.5%
11 19 Jones Day 71,304 167 58,209 22%
12 15 Blake, Cassels & Graydon 64,013 69 61,351 4.3%
13 35 White & Case 57,489 62 24,688 132.9%
14 8 Cravath Swaine & Moore 53,633 30 107,070 -49.9%
15 6 Shearman & Sterling 50,636 49 117,439 -56.9%
16 117 Bracewell & Giuliani 50,099 27 3,598 1292.4%
17 25 Stikeman Elliott 48,289 72 29,699 62.6%
18 33 Vinson & Elkins 46,945 73 25,269 85.8%
19 16 Freshfields Bruckhaus Deringer 45,261 46 61,106 -25.9%
20 28 Gibson Dunn & Crutcher 43,114 45 28,223 52.8%Source: mergermarket
TOP 20 LEGAL ADVISERS – NORTH AMERICA
VALUE
VOLUME

25
NORTH AM
ERICA
Monthly M&A Insider
LEAGUE TABLES
VALUE
VALUE
Rank
Q1-Q3 2012 Company name Value (US$m)
Deal count
1 The Carlyle Group 15,495 20
2 GS Capital Partners 11,333 6
3 BC Partners 10,039 2
4 Blackstone Group 8,980 15
5 Apollo Global Management 7,924 2
6 Access Industries 7,482 2
7 Riverstone Holdings 7,350 2
8 Advent International 7,339 6
9 Oaktree Capital Group 7,151 8
10 Quadrangle Group 6,579 1
11 Hellman & Friedman 6,027 4
12 Madison Dearborn Partners 5,146 5
13 TPG Capital 4,370 7
14 Bain Capital 4,141 5
15 Global Infrastructure Partners 3,188 2Source: mergermarket
Rank
Q1-Q3 2012 Company name Value (US$m)
Deal count
1 GS Capital Partners 10,620 7
2 The Carlyle Group 10,195 10
3 Kohlberg Kravis Roberts & Co 10,114 9
4 Hellman & Friedman 9,727 5
5 CVC Capital Partners 7,448 5
6 Oaktree Capital Group 6,579 5
7 BC Partners 6,579 1
8 Quadrangle Group 6,579 1
9 General Atlantic 6,567 7
10 Madison Dearborn Partners 6,191 5
11 Advent International 6,166 5
12 Bain Capital 6,075 7
13 Permira 5,500 2
14 Weston Presidio Capital 5,290 2
15 TPG Capital 4,218 5Source: mergermarket
VOLUME
VOLUME
Rank
Q1-Q3 2012 Company name Value (US$m)
Deal count
1 The Carlyle Group 15,495 20
2 Blackstone Group 8,980 15
3 The Riverside Company 0 13
4 Kohlberg Kravis Roberts & Co 2,858 11
5 Sun Capital Partners 569 10
6 Oaktree Capital Group 7,151 8
7 Warburg Pincus 2,313 8
8 Audax Private Equity Group 124 8
9 H.I.G. Capital 47 8
10 TPG Capital 4,370 7
11 Vista Equity Partners 2,501 7
12 GS Capital Partners 11,333 6
13 Advent International 7,339 6
14 Wynnchurch Capital 169 6
15 Arsenal Capital Partners 161 6Source: mergermarket
Rank
Q1-Q3 2012 Company name Value (US$m)
Deal count
1 Draper Fisher Jurvetson 1,948 12
2 The Carlyle Group 10,195 10
3 Battery Ventures 830 10
4 Kohlberg Kravis Roberts & Co 10,114 9
5 Intel Capital 1,127 9
6 Audax Private Equity Group 124 9
7 Sun Capital Partners 98 9
8 Kleiner, Perkins, Caufield & Byers 3,962 8
9 TA Associates 931 8
10 The Riverside Company 70 8
11 GS Capital Partners 10,620 7
12 General Atlantic 6,567 7
13 Bain Capital 6,075 7
14 Benchmark Capital 1,619 6
15 Bessemer Venture Partners 1,056 6Source: mergermarket
ACTIVITY TABLE OF PRIVATE EQUITY FIRMS ON NORTH AMERICAN BUYOUTS
ACTIVITY TABLE OF PRIVATE EQUITY FIRMS ON NORTH AMERICAN EXITS
The private equity buyout activity tables by value and volume are based on private equity firms advising the bidder on buyout deals where the dominant geography of the target company is US or Canadian. The tables by value and volume have been run from 01-Jan-12 to 30-Sep-12 and exclude lapsed and withdrawn deals.
The private equity exit activity tables by value and volume are based on private equity firms advising the vendor on exit deals where the dominant geography of the target company is US or Canadian. The tables by value and volume have been run from 01-Jan-12 to 30-Sep-12 and exclude lapsed and withdrawn deals.

26
NORTH AM
ERICA
Monthly M&A Insider
TREND GRAPHS
NORTH AMERICAN M&A QUARTERLY TREND
0
100
200
300
400
500
600
Q312*
Q212
Q112
Q411
Q311
Q211
Q111
Q410
Q310
Q210
Q110
Q409
Q309
Q209
Q109
Q408
Q308
Q208
Q108
Q407
Q307
Q207
Q107
Q406
Q306
Q206
Q106
Valu
e (U
S$bn
)
Total value Mid-market value
Num
ber of deals
0
200
400
600
800
1,000
1,200
1,400
1,600
Total volume Mid-market volume
0
50
100
150
200
250
Q312*
Q212
Q112
Q411
Q311
Q211
Q111
Q410
Q310
Q210
Q110
Q409
Q309
Q209
Q109
Q408
Q308
Q208
Q108
Q407
Q307
Q207
Q107
Q406
Q306
Q206
Q106
Valu
e (U
S$bn
)
Buyout value Exit value
Num
ber of deals
Buyout volume Exit volume
0
50
100
150
200
250
300
350
NORTH AMERICAN M&A ANNUAL TREND NORTH AMERICAN M&A ANNUAL PRIVATE EQUITY TREND
0
200
400
600
800
1,000
1,200
1,400
1,600
1,800
YTD 2012*201120102009200820072006
Total value Mid-market value
Num
ber of dealsValu
e (U
S$bn
)
0
1,000
2,000
3,000
4,000
5,000
6,000
Total volume Mid-market volume
0
50
100
150
200
250
300
350
400
450
500
YTD 2012*201120102009200820072006
Valu
e (U
S$bn
)
Buyout value Exit value
Num
ber of deals
Buyout volume Exit volume
0
200
400
600
800
1,000
1,200
NORTH AMERICAN M&A QUARTERLY PRIVATE EQUITY TREND

27
NORTH AM
ERICA
Monthly M&A Insider
TREND GRAPHS
NORTH AMERICAN M&A SECTOR BREAKDOWN Q3 2012
VALUE VOLUME
6.5%
24.5%
13.6%
15.0%
12.2%
6.8%
4.7%
3.4%
2.0%
1.9%
1.9%
5.1%
1.6% 0.7%
Industrials & Chemicals
Financial Services
Energy, Mining & Utilities
Consumer
Pharma, Medical & Biotech
Technology
Business Services
Media
Telecommunications
Defence
Real Estate
Transportation
Leisure
Construction
10.8%
8.9%
11.9%
13.0%
14.2%
0.9%0.7%
0.9% 2.6% 2.3%0.5%
4.6%
2.2%
9.1%
17.5% Industrials & Chemicals
Financial Services
Energy, Mining & Utilities
Consumer
Pharma, Medical & Biotech
Technology
Business Services
Media
Telecommunications
Defence
Real Estate
Transportation
Leisure
Construction
Agriculture
NORTH AMERICAN M&A DEAL SIZE BREAKDOWN
VALUE VOLUME
0
10
20
30
40
50
60
70
80
90
100
2012*201120102009200820072006
<US$250m or undisclosed value
US$251m-US$500m
US$501m-US$2,000m
US$2,001m-US$5,000m
>US$5,001m
52.8%
14.7%
16.8%
6.2%
9.5%
43.5%
18.8%
21.5%
6.5%
9.6%
49.1%
14.0%
17.4%
7.3%
12.2%
58.8%
13.3%
13.2%
5.5%
9.2% 12.6%
9.7%
27.7%
18.0%
32.0%36.9%
21.4%
21.0%
8.9%
11.8%
24.3%
25.1%
29.9%
9.3%
11.4%
Perc
enta
ge
75
80
85
90
95
100
2012*201120102009200820072006
1.1%
1.5%
5.3%
5.3%
86.9%
1.1%
1.8%
6.2%
5.3%
85.6%
0.9%
3.7%
4.1%
90.6%
1.0%
3.4%
3.8%
91.0%
87.4%
5.3%
5.6%
1.1% 1.4%
4.9%
5.3%
87.6%
0.7% 0.7% 0.6% 0.7%
1.6%
6.4%
5.5%
85.9%
0.6%
<US$250m or undisclosed value
US$251m-US$500m
US$501m-US$2,000m
US$2,001m-US$5,000m
>US$5,001m
Perc
enta
ge

28
NORTH AM
ERICA
Monthly M&A Insider
NORTH AMERICAN SECTOR ANALYSISSector Q3 2012 Q3 2011 % change
Value ($m) Mrk share Deal count Value ($m) Mrk share Deal count Value Volume
Energy, Mining & Utilities 57,785 24.5% 95 36,363 17.4% 85 59% 12%
Industrials & Chemicals 32,085 13.6% 154 47,517 22.7% 188 -32% -18%
Consumer 35,331 15.0% 78 4,325 2.1% 90 717% -13%
Financial Services 15,381 6.5% 80 9,843 4.7% 114 56% -30%
Pharma, Medical & Biotech 28,711 12.2% 105 53,277 25.5% 112 -46% -6%
Technology 15,985 6.8% 114 17,106 8.2% 149 -7% -23%
Business Services 11,975 5.1% 125 17,271 8.3% 131 -31% -5%
Media 11,166 4.7% 40 2,552 1.2% 32 338% 25%
Transportation 4,497 1.9% 23 1,653 0.8% 15 172% 53%
Real Estate 4,543 1.9% 8 927 0.4% 5 390% 60%
Leisure 3,731 1.6% 20 1,693 0.8% 22 120% -9%
Telecommunications 8,070 3.4% 8 15,947 7.6% 13 -49% -38%
Defence 4,803 2.0% 6 86 0.0% 4 5485% 50%
Construction 1,621 0.7% 19 670 0.3% 23 142% -17%
Agriculture 0 0.0% 4 0 0.0% 2 - 100%
Total 235,684 879 209,230 985 13% -11%
SECTOR ANALYSIS

ASIA-PACIFIC
A MERGERMARKET M&A REPORT ON
Monthly M&A Insider 29
ASIA-PACIFIC
Asia regaining its sheen?Growing economic uncertainties, coupled with a general slowdown in economic growth have put the brakes on large deals across the globe. The Asia-Pacific region, however, has bucked the downward trend. Deals worth over US$5bn have grown as a proportion of total deal value for two successive years to hit 25.6%, the highest level since 2008. Private equity buyout and exit deal values have also grown for the past two quarters, which may be interpreted as a vote of confidence in Asia’s growth prospects. While fears of a slowdown in the region’s export-oriented economies continue to linger, these rises attest to the faith acquirers have placed in the region. Rising incomes, along with favourable demographics and sluggish growth in other regions are likely to cement Asia’s status as the focal point of global M&A activity in the near future.
Unabated Japanese outbound activityIndia’s Infrastructure sector received a big shot in the arm in the shape of the Japanese government’s acquisition of a US$4.5bn stake in the Delhi Mumbai Industrial Corridor. The project, slated to cost US$90bn, will rely heavily on low-interest loans and technical assistance from the Japanese government. This increased assertiveness on the part of Japanese bidders is also underscored by the fact that three of the top 10 largest deals featuring Asian companies involved Japanese bidders. Japanese corporations have embarked on a relentless drive to snap up stable, high profile counterparts in developed countries and gain headway in other emerging economies as they grapple with a mature home market. This is also borne out by phenomenal growth in overseas acquisitions by Japanese firms, which hit an all-time high last year and have attained 82% of that level during the first three quarters of 2012.
Chinese outbound activityChinese bidders accounted for two of the largest outbound deals to emanate from the region. Li Ka Shing’s tryst with
British utilities continued after he sought to add Wales & West Utilities to the Northumbrian Water Group he snapped up last year. The desire to secure high, stable yields will prompt Asian bidders to scour the developed world for utility providers. More striking, however, was CNOOC’s bid for oil major Nexen. It represented the largest ever bid for a foreign corporation to emerge from China at a time when Chinese state-owned enterprises are being scrutinised by the US government and regulatory bodies. The timing of the acquisition is even more significant, as it comes before leadership transitions in both China and the US. State-owned corporations in China have been loath to make big forays in foreign markets in light of the disastrous US$3bn investment in Blackstone by CIC in 2007. Thus, making such a large bid amid political and economic uncertainties reflects China’s desire to maintain high economic growth at all costs. This is also lent credence by the fact that Chinese outbound activity reversed three successive quarters of decline to post a total of US$28.1bn, the highest quarterly tally since 2004.
Consumer sector regaining favour? The consumer sector notched up US$29.1bn-worth of deals this quarter, the highest quarterly haul ever for the region on mergermarket’s record. This mind-boggling figure was attained courtesy of competing bids for Asia-Pacific Breweries. Heineken’s determination to acquire the target came in the wake of attempts to expand its footprint in one of the fastest growing consumer regions in the world. It also underscored the fiscal clout of Asian bidders vis-a-vis their counterparts in more developed economies. As the region continues to develop, Asian corporations from outside China and Japan continue to amass substantial resources, which they will use to deter competitors from encroaching on their turf and making inroads in other fast-growing parts markets. In this respect, this tug-of-war between Heineken and Thai billionaire Charoen Sirivadhanabhakdi may set the template for future interactions between firms from developed and emerging economies who have their sights on the same targets.
M&A ACTIVITY IN THE ASIA-PACIFIC REGION DURING THE THIRD QUARTER OF THE YEAR WITNESSED A SLIGHT DECREASE, BUT FARED REMARKABLY WELL CONSIDERING THE GLOOMY OUTLOOK FOR OTHER REGIONS. A TOTAL OF 566 DEALS WORTH US$102.6BN WERE RECORDED IN THE REGION BETWEEN JULY AND SEPTEMBER, A TALLY VIRTUALLY UNCHANGED BY VALUE AND 10% LOWER BY VOLUME COMPARED TO THE PREVIOUS QUARTER. A RAFT OF SIGNIFICANT ACQUISITIONS WAS ANNOUNCED DURING THIS PERIOD, DEALS WHICH MAY BE THE HARBINGER OF FUTURE M&A ACTIVITY IN THE REGION.

30
ASIA-PACIFIC
Monthly M&A Insider
DEAL OF THE QUARTER
Deal summary
Announced: 23-Jul-12 Deal value: US$17,654m
Nexen Inc(NXY), an Alberta corporation, has signed a definitive agreement to be acquired by CNOOC (883), a Beijing corporation. The board of directors of both companies have approved the merger.
TERMS:• The offer provides a premium of 62% based on NXY’s
closing share price on 20-Jul-12 of US$17.06.
• The implied equity value of the transaction is approx. US$14,556.74m.
• If approved by the holders of preferred shares in a separate class vote, CNOOC Limited will acquire the outstanding preferred shares of Nexen for a purchase price of CAD26.00 (US$27.5) per share in cash, plus any dividends accrued but unpaid at the time of closing.
• If a superior offer were to emerge for NXY, the company would be required to give CNOOC at least four business days to make adjustments to its current offer before NXY’s board of directors could effect a change of recommendation of the deal.
FINANCING• The transaction will be funded by CNOOC Limited’s
existing cash resources and external financing.
TERMINATION/INDUCEMENT FEE• US$425m, or 3% based on the implied equity value of the
deal. The per-share increase required to cover this fee in a superior offer would be US$0.8. A Reverse Termination Fee of US$425m will be payable by CNOOC to NXY in the event the Arrangement Agreement is terminated solely as a result of the PRC Approvals having not been obtained.
RATIONALE• The acquisition of Nexen enhances CNOOC Limited’s
presence in Canada, Nigeria and the Gulf of Mexico, adds a significant presence in the UK North Sea and diversifies CNOOC Limited’s growth platform.
POST DEAL DETAILS• CNOOC Limited plans to establish Calgary as the head
office of its North and Central American operations. This head office will be responsible for operating and growing Nexen’s assets in North and South America, Europe and West Africa and CNOOC Limited’s portfolio in Canada, the US and Central America.
• CNOOC Limited intends to retain Nexen’s current management team and employees.
• CNOOC Limited intends to list its common shares on the TSX.
EXPECTED COMPLETION• The transaction is expected to close in the fourth quarter
of 2012.
CONDITIONS• HSR (USA).
• CA (Canada).
• ICA (Canada).
• CFIUS (USA).
• EU (Europe).
• MOFCOM (China).
• NDRC (China).
• SASAC (China).
• OFT (UK).
• Competition Commission (UK).
• NXY EGM (Two thirds of affirmative vote required to approve).
UPDATE:• Awaits update.

31
ASIA-PACIFIC
Monthly M&A Insider
DEAL OF THE QUARTER
mergermarket/dealReporter Intelligence
23-Jul-12 Nexen to be acquired by CNOOC for US$15.1bn
24-Jul-12 Nexen/CNOOC deal subject to review under Investment Canada Act, Minister Paradis confirms
24-Jul-12 CNOOC has no plan to spin-off overseas assets into separate listing
24-Jul-12 CNOOC does not see regulatory hurdles in US for Nexen deal
25-Jul-12 Nexen: CNOOC considering bond offering to fund its offer
29-Jul-12 CNOOC may borrow billions of US dollars in 2013 to fund Nexen’s bid
31-Jul-12 CNOOC merger with Nexen faces opposition from US lawmaker Ed Markey over royalties
02-Aug-12 CNOOC to raise bridge and long-term loans from overseas lenders to back Nexen bid
07-Aug-12 CNOOC to pay LIBOR +150bp on bridge loan to support Nexen bid
10-Aug-12 CNOOC to delay dispatch of circular in relation to Nexen bid to a date on or before 13 December
24-Aug-12 Govt of Canada will weigh issues such as public sentiment, reciprocity as it considers whether or not to allow CNOOC to buy Nexen
03-Sep-12 CNOOC to raise US$10bn via bank loans and bonds to finance Nexen deal
11-Sep-12 CNOOC secures US$5bn - US$6bn one-year loan for Nexen bid
12-Sep-12 CNOOC submits formal application with Committee of Foreign Investment to review Nexen takeover bid
19-Sep-12 Govt of Canada's junior finance minister receives lots of negative feedback over CNOOC's bid for Nexen
21-Sep-12 Nexen shareholders approve plan of arrangement with CNOOC Limited and CNOOC Canada Holding Ltd
26-Sep-12 Top oil sector execs largely support CNOOC-Nexen deal but still want govt to implement rules to protect Canadian ownership of large oil sands entities
27-Sep-12 U.S. Congress members want Obama administration to force CNOOC to divest five Gulf of Mexico leases before getting approval to buy Nexen
10-Oct-12 New Democratic Party of Canada formally rejects CNOOC's bid for Nexen
Advisers
Target/Seller Bidder
Financial Goldman Sachs; RBC Capital Markets; Sumitomo Mitsui Financial Group
Financial BMO Capital Markets; Citigroup
Legal Blake, Cassels & Graydon; Osler Hoskin & Harcourt; Paul Weiss Rifkind Wharton & Garrison
Legal Cleary Gottlieb Steen & Hamilton; Davis Polk & Wardwell; Herbert Smith; Morrison & Foerster; Stikeman Elliott
PR - PR Pelham Bell Pottinger
Exit multiples – Y/E 31-Mar-12 Premium analysis
Multiples Value (US$m) Offer price per share (US$) 27.5
Revenue 2.7 6,469 1 day before 17.06
EBITDA 4.5 3,940 1 month before 15.83
EBIT 8.7 2,027 1 day after 26
Earnings 22.2 697 Pre-rumour -

32
ASIA-PACIFIC
Monthly M&A Insider
DEAL OF THE QUARTER
Bidder
China National Offshore Oil Corporation Ltd
Headquarters: No 25 Chaoyangmenbei Main StreetDongcheng DistrictBeijing, China
Sector: Energy
Description: China based company engaged in the exploration, development, production and sales of crude oil and natural gas and other petroleum products
Target
Nexen Inc
Headquarters: 801 7th Avenue S WCalgary T2P 3P7Alberta, Canada
Sector: Energy; Chemicals and materials
Description: Canada based energy company engaged in oil and gas, Syncrude, energy marketing and chemicals business

33Monthly M&A Insider
ASIA-PACIFIC
TOP 10 ASIA-PACIFIC ANNOUNCED DEALS OF Q3 2012Announced Bidder company Target company Target dominant
sectorSeller company Exit multiples (x) Bid premia
1-day beforeDeal value
(US$m)Revenue EBITDA P/E
23-Jul-12 Nexen Inc China National Offshore Oil Corporation Ltd
Energy, Mining & Utilities
2.7 4.5 22.2 61.2% 17,654
22-Aug-12 China Telecommunication Corporation (certain CDMA Network assets)
China Telecom Corporation Limited
Telecom China Telecommunications Corporation
4.6 8.9 (loss) n/a 13,307
13-Sep-12 Fraser & Neave Limited (69.64% stake)
TCC Group Consumer 2.7 13.4 21.5 4.3% 10,134
20-Jul-12 Asia Pacific Breweries Limited (58.1% stake)
Heineken NV Consumer 4.9 21.3 46.8 27.4% 6,593
23-Aug-12 Delhi Mumbai Industrial Corridor Development Corporation Limited (26% stake)
Government of Japan; and Japan Bank for International Cooperation
Transportation - - - n/a 4,500
12-Jul-12 Aegis Group Plc Dentsu Inc Media 2.9 15.2 36.9 48.0% 4,345
20-Jul-12 Hebei Shougang Qian'an Iron and Steel Co Ltd
Beijing Shougang Co Ltd
Industrial and Chemicals
Shougang Group Corporation
0.9 9.9 23.5 n/a 4,168
29-Aug-12 Goodman Global Inc Daikin Industries Ltd Industrial and Chemicals
Hellman & Friedman LLC 1.8 - - n/a 3,700
26-Jul-12 CFAO SA (29.8% stake) Toyota Tsusho Corporation
Business Services
PPR SA 0.8 8.5 19.0 -0.8% 3,189
25-Jul-12 Wales & West Utilities Limited
Cheung Kong Infrastructure Holdings Limited; Power Assets Holdings Limited ; Li Ka Shing Foundation Limited; and Cheung Kong (Holdings) Limited
Energy, Mining & Utilities
Industry Funds Management Pty Ltd; Canada Pension Plan Investment Board; Macquarie Group Limited; AMP Capital Investors Limited; and Codan Trust Company Limited
5.6 14.3 (loss) n/a 3,030
Based on announced deals, including lapsed and withdrawn bids Based on dominant geography of target company being Asia-Pacific Data correct as of 09-Oct-12
Source: mergermarket
TOP DEALS & EXPECTED DEALS

34
ASIA-PACIFIC
Monthly M&A Insider
Situation Target company Sector Potential bidder company Financial adviser to bidder (B); target (T); seller (S)
Seller company
Market cap/ est. value (US$m)
Comments
Expected deal 7 Days Group Holdings Limited
Leisure The Carlyle Group LLC; Sequoia Capital China; and Mr Boquan He (Private Investor)
590 7 Days Group Holdings Limited received an offer from the consortium led by Carlyle Group and Sequoia Capital China estimated to US$4.233 per share and US$12.7 per ADS in Sep 2012.
Expected deal Focus Media Holding Ltd Media FaountainVest Partners; The Carlyle Group LLC; CITIC Capital Partners; CDH Investments; and China Everbright Limited
JP Morgan (T) 3,122 Focus Media Holding Ltd received an offer from the consortium led by its management team and Carlyle Group estimated to US$5.40 per share or US$27 per ADS in August 2012.
Expected deal Fraser & Neave Holdings Bhd
Consumer TCC Group United Overseas Bank (B); DBS Bank (B); Morgan Stanley (B); JP Morgan (T)
2,181 Fraser & Neave Holdings Bhd received an offer from TCC Group in Sep 2012 to acquire the remaining 70% stake. Terms are not disclosed.
Expected deals based on confirmed announcements by companies involved Data correct as of 09-Oct-12
PIPELINE OF ASIA PACIFIC EXPECTED DEALS
TOP DEALS & EXPECTED DEALS

35
ASIA-PACIFIC
Monthly M&A Insider
Ranking Q1-Q3 2012 Q1-Q3 2011
Q1-Q3 2012 Q1-Q3 2011 Company name Value (US$m)
Deal count Value (US$m)
Value change (%)
1 1 Goldman Sachs 76,303 40 96,693 -21.1%
2 7 Citigroup 65,280 36 36,413 79.3%
3 11 Credit Suisse 48,056 25 25,857 85.9%
4 2 Morgan Stanley 46,666 32 66,275 -29.6%
5 4 UBS Investment Bank 44,245 29 44,102 0.3%
6 3 JPMorgan 33,305 24 48,401 -31.2%
7 10 Deutsche Bank 28,000 23 29,451 -4.9%
8 20 RBC Capital Markets 26,519 11 13,883 91.0%
9 39 BMO Capital Markets 24,089 6 5,015 380.3%
10 8 Bank of America Merrill Lynch 21,238 9 33,585 -36.8%
11 54 DBS Bank 18,718 10 2,555 632.6%
12 6 HSBC 17,372 16 36,638 -52.6%
13 22 China International Capital Corporation 16,837 5 11,692 44.0%
14 33 Rothschild 14,418 22 6,726 114.4%
15 17 Macquarie Group 13,697 25 14,832 -7.7%
16 27 CITIC Securities 12,089 9 8,694 39.0%
17 - United Overseas Bank 10,164 2 - -
18 38 Standard Chartered 8,750 14 5,594 56.4%
19 71 Allen & Company 8,110 2 1,684 381.6%
20 60 ING 7,444 5 2,092 255.8%Source: mergermarket
TOP 20 FINANCIAL ADVISERS – ASIA-PACIFIC
The financial adviser league tables by value and volume have been run from 01-Jan-12 to 30-Sep-12 and exclude lapsed and withdrawn deals. The tables cover all sectors and are based on the geography of either the target, bidder or seller being Asia-Pacifc excluding Japan.
LEAGUE TABLES
Ranking Q1-Q3 2012 Q1-Q3 2011
Q1-Q3 2012 Q1-Q3 2011 Company name Value (US$m)
Deal count Deal count Deal count change
1 1 Goldman Sachs 76,303 40 56 -16
2 11 Citigroup 65,280 36 32 4
3 7 Morgan Stanley 46,666 32 38 -6
4 3 UBS Investment Bank 44,245 29 48 -19
5 4 KPMG 4,460 29 47 -18
6 2 Ernst & Young 5,289 27 49 -22
7 5 PwC 2,371 27 44 -17
8 9 Credit Suisse 48,056 25 34 -9
9 10 Macquarie Group 13,697 25 33 -8
10 6 Deloitte 1,146 25 39 -14
11 13 JPMorgan 33,305 24 27 -3
12 12 Deutsche Bank 28,000 23 32 -9
13 17 Rothschild 14,418 22 22 -
14 16 HSBC 17,372 16 25 -9
15 29 Standard Chartered 8,750 14 11 3
16 24 Lazard 2,678 14 13 1
17 32 Maybank Investment Bank 4,956 13 9 4
18 8 CIMB Group 2,346 13 35 -22
19 22 Barclays 7,343 12 13 -1
20 40 RBC Capital Markets 26,519 11 7 4Source: mergermarket
TOP 20 FINANCIAL ADVISERS – ASIA-PACIFIC
VOLUME
VALUE

36
ASIA-PACIFIC
Monthly M&A Insider
LEAGUE TABLES
The legal adviser league tables by value and volume have been run from 01-Jan-12 to 30-Sep-12 and include lapsed and withdrawn deals. The tables cover all sectors and are based on the geography of either the target, bidder or seller being Asia-Pacifc excluding Japan.
VOLUMERanking Q1-Q3 2012 Q1-Q3 2011
Q1-Q3 2012 Q1-Q3 2011 Company name Value (US$m)
Deal count Deal count Deal count change
1 - King & Wood Mallesons 21,306 57 - 572 1 Baker & McKenzie 17,205 48 66 -18
3 3 Freehills 14,609 40 58 -18
4 8 Kim & Chang 7,454 40 41 -1
5 28 Gilbert + Tobin 9,274 37 19 18
6 7 Clifford Chance 12,592 36 41 -5
7 4 Allen & Overy 12,590 34 48 -14
8 2 Minter Ellison 3,066 31 62 -31
9 9 Lee & Ko 5,018 30 39 -9
10 10 Linklaters 18,114 29 38 -9
11 13 Desai & Diwanji 934 29 36 -7
12 6 Allens 8,016 28 44 -16
13 18 Norton Rose 7,952 28 31 -3
14 24 Khaitan & Co 1,367 28 25 3
15 15 Clayton Utz 7,217 27 33 -616 32 Amarchand & Mangaldas & Suresh A Shroff & Co 15,612 26 18 8
17 12 DLA Piper 1,131 26 36 -10
18 46 Ashurst 9,896 24 12 12
19 17 Allen & Gledhill 13,515 23 32 -9
20 21 WongPartnership 22,916 21 27 -6Source: mergermarket
TOP 20 LEGAL ADVISERS – ASIA-PACIFIC
VALUERanking Q1-Q3 2012 Q1-Q3 2011
Q1-Q3 2012 Q1-Q3 2011 Company name Value (US$m)
Deal count Value (US$m)
Value change (%)
1 6 Freshfields Bruckhaus Deringer 29,213 16 27,765 5.2%2 16 Skadden Arps Slate Meagher & Flom 23,295 20 20,026 16.3%
3 51 WongPartnership 22,916 21 6,130 273.8%
4 85 Paul Weiss Rifkind Wharton & Garrison 21,606 11 2,964 628.9%
5 - Herbert Smith 21,502 13 - -
6 138 Stikeman Elliott 21,334 9 1,100 1839.5%
7 - King & Wood Mallesons 21,306 57 - -
8 31 Davis Polk & Wardwell 20,814 8 10,060 106.9%
9 30 Cleary Gottlieb Steen & Hamilton 20,772 11 10,286 101.9%
10 37 Blake, Cassels & Graydon 20,268 10 8,490 138.7%
11 65 Osler, Hoskin & Harcourt 18,837 4 4,635 306.4%
12 104 Stamford Law Corporation 18,686 9 2,045 813.7%
13 112 Morrison & Foerster 18,252 5 1,797 915.7%
14 10 Sullivan & Cromwell 18,161 8 23,355 -22.2%
15 5 Linklaters 18,114 29 27,808 -34.9%16 47 Weil Gotshal & Manges 17,747 16 6,887 157.7%
17 7 Baker & McKenzie 17,205 48 27,338 -37.1%
18 71 Amarchand & Mangaldas & Suresh A Shroff & Co 15,612 26 4,311 262.1%
19 4 Freehills 14,609 40 36,832 -60.3%
20 32 Allen & Gledhill 13,515 23 10,018 34.9%Source: mergermarket
TOP 20 LEGAL ADVISERS – ASIA-PACIFIC

37
ASIA-PACIFIC
Monthly M&A Insider
VALUE
VALUE
Rank
Q1-Q3 2012 Company name Value (US$m)
Deal count
1 Bain Capital 2,244 3
2 CITIC Capital Partners 1,839 2
3 TPG Capital 1,413 3
4 China Africa Development Fund 1,250 2
5= Affinity Equity Partners 1,062 1
5= Baring Private Equity Asia 1,062 1
5= IMM Private Equity 1,062 1
8 MBK Partners 1,055 1
9 Pacific Equity Partners 1,021 2
10 Permira 1,000 1Source: mergermarket
Rank
Q1-Q3 2012 Company name Value (US$m)
Deal count
1 H&Q Asia Pacific 1,757 1
2 Verny Capital JSC 1,395 1
3 Hony Capital 1,158 1
4 Standard Chartered Private Equity 1,090 2
5= General Atlantic 1,004 1
5= Oak Hill Capital Partners 1,004 1
7 Unison Capital 1,000 2
8 Macquarie Group 911 4
9 CVC Capital Partners 850 1
10 GS Capital Partners 685 1Source: mergermarket
VOLUME
VOLUME
Rank
Q1-Q3 2012 Company name Value (US$m)
Deal count
1 Bain Capital 2,244 3
2 TPG Capital 1,413 3
3 Quadrant Private Equity 826 3
4 CVC Capital Partners 751 3
5 Kohlberg Kravis Roberts & Co 627 3
6 Warburg Pincus 368 3
7 L Capital Asia 228 3
8 STIC Investments 182 3
9 Standard Chartered Private Equity 106 3
10 Jacob Ballas Capital India 103 3Source: mergermarket
Rank
Q1-Q3 2012 Company name Value (US$m)
Deal count
1 Macquarie Group 911 4
2 Navis Capital Partners 26 4
3 MBK Partners 388 3
4 Standard Chartered Private Equity 1,090 2
5 Unison Capital 1,000 2
6 The Carlyle Group 443 2
7 Mizuho Capital Partners 206 2
8 H&Q Asia Pacific 1,757 1
9 Verny Capital JSC 1,395 1
10 Hony Capital 1,158 1Source: mergermarket
ACTIVITY TABLE OF PRIVATE EQUITY FIRMS ON ASIA-PACIFIC BUYOUTS
ACTIVITY TABLE OF PRIVATE EQUITY FIRMS ON ASIA-PACIFIC EXITS
LEAGUE TABLES
The Private Equity buyout activity tables by value and volume are based on private equity firms advising the bidder on buyout deals where the dominant geography of the target company is Asia-Pacific. The tables by value and volume have been run from 01-Jan-12 to 30-Sep-12 and exclude lapsed and withdrawn deals
The Private Equity exit activity tables by value and volume are based on private equity firms advising the vendor on exit deals where the dominant geography of the target company is Asia-Pacific. The tables by value and volume have been run from 01-Jan-12 to 30-Sep-12 and exclude lapsed and withdrawn deals

38
ASIA-PACIFIC
Monthly M&A Insider
TREND GRAPHS
ASIA-PACIFIC M&A QUARTERLY TREND
0
20
40
60
80
100
120
140
160
180
Q312*
Q212
Q112
Q411
Q311
Q211
Q111
Q410
Q310
Q210
Q110
Q409
Q309
Q209
Q109
Q408
Q308
Q208
Q108
Q407
Q307
Q207
Q107
Q406
Q306
Q206
Q106
Valu
e (U
S$bn
)
Total value Mid-market value
Num
ber of deals
0
100
200
300
400
500
600
700
800
900
Total volume Mid-market volume
0
5
10
15
20
25
Q312*
Q212
Q112
Q411
Q311
Q211
Q111
Q410
Q310
Q210
Q110
Q409
Q309
Q209
Q109
Q408
Q308
Q208
Q108
Q407
Q307
Q207
Q107
Q406
Q306
Q206
Q106
Valu
e (U
S$bn
)
Buyout value Exit value
Num
ber of deals
Buyout volume Exit volume
0
10
20
30
40
50
60
70
80
90
100
ASIA-PACIFIC M&A ANNUAL TREND ASIA PACIFIC M&A ANNUAL PRIVATE EQUITY TREND
0
50
100
150
200
250
300
350
400
450
500
YTD 2012*201120102009200820072006
Total value Mid-market value
Num
ber of dealsValu
e (U
S$bn
)
0
500
1,000
1,500
2,000
2,500
3,000
Total volume Mid-market volume
0
10
20
30
40
50
60
70
YTD 2012*201120102009200820072006
Valu
e (U
S$bn
)
Buyout value Exit value
Num
ber of deals
Buyout volume Exit volume
0
50
100
150
200
250
300
350
ASIA-PACIFIC M&A QUARTERLY PRIVATE EQUITY TREND

39
ASIA-PACIFIC
Monthly M&A Insider
TREND GRAPHS
ASIA-PACIFIC M&A GEOGRAPHIC BREAKDOWN Q3 2012
VALUE VOLUME
China
Japan
Australia
India
South Korea
Singapore
Indonesia
Hong Kong
Malaysia
Taiwan
Other
34.0%
18.3%11.9%
5.4%
4.8%
4.0%
3.9%
3.2%2.2%
3.4%
9.0%
24.9%
15.1%
9.2%
10.8%
4.6%
3.2%
2.9%
1.0%
1.2% 10.0%
17.0%
China
Japan
Australia
India
South Korea
Singapore
Indonesia
Hong Kong
Malaysia
Taiwan
Other
ASIA-PACIFIC M&A SECTOR BREAKDOWN Q3 2012
VALUE VOLUME
14.6%
9.8%
9.5%
3.1%2.9%
2.7%
2.3% 0.2%1.5%
24.8%
17.1%
5.7%
4.4%
Energy, Mining & Utilities
Financial Services
Industrials & Chemicals
Consumer
Technology
Telecommunications
Business Services
Pharma, Medical & Biotech
Real Estate
Transportation
Construction
Leisure
Agriculture
10.9%
7.8%
23.0%
11.0%
8.6%
0.8%
10.6%
5.9%
4.0%
4.6%
4.4%4.2%
1.2%0.1%
Energy, Mining & Utilities
Financial Services
Industrials & Chemicals
Consumer
Technology
Telecommunications
Business Services
Pharma, Medical & Biotech
Real Estate
Transportation
Construction
Leisure
Agriculture
Defence
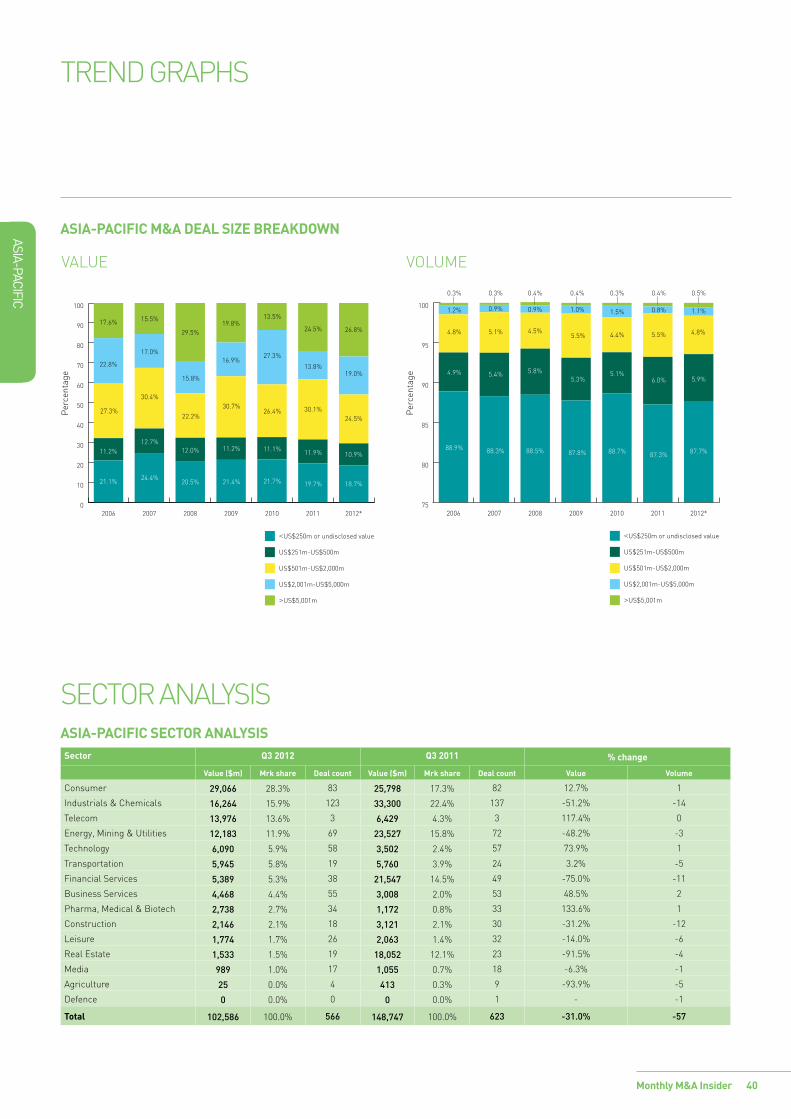
40
ASIA-PACIFIC
Monthly M&A Insider
ASIA-PACIFIC M&A DEAL SIZE BREAKDOWN
VALUE VOLUME
0
10
20
30
40
50
60
70
80
90
100
2012*201120102009200820072006
<US$250m or undisclosed value
US$251m-US$500m
US$501m-US$2,000m
US$2,001m-US$5,000m
>US$5,001m
17.6%
22.8%
27.3%
11.2%
21.1%
15.5%
17.0%
30.4%
12.7%
24.4%
29.5%
15.8%
22.2%
12.0%
20.5%
19.8%
16.9%
30.7%
11.2%
21.4% 21.7%
11.1%
26.4%
27.3%
13.5%
24.5%
13.8%
30.1%
11.9%
19.7%
26.8%
19.0%
24.5%
10.9%
18.7%
Perc
enta
ge
75
80
85
90
95
100
2012*201120102009200820072006
1.2%
4.8%
4.9%
88.9%
0.9%
5.1%
5.4%
88.3%
0.9%
4.5%
5.8%
88.5%
1.0%
5.5%
5.3%
87.8% 88.7%
5.1%
4.4%
1.5% 0.8%
5.5%
6.0%
87.3%
0.3% 0.3% 0.3% 0.5%0.4%
1.1%
4.8%
5.9%
87.7%
0.4% 0.4%
<US$250m or undisclosed value
US$251m-US$500m
US$501m-US$2,000m
US$2,001m-US$5,000m
>US$5,001m
Perc
enta
ge
TREND GRAPHS
ASIA-PACIFIC SECTOR ANALYSISSector Q3 2012 Q3 2011 % change
Value ($m) Mrk share Deal count Value ($m) Mrk share Deal count Value Volume
Consumer 29,066 28.3% 83 25,798 17.3% 82 12.7% 1
Industrials & Chemicals 16,264 15.9% 123 33,300 22.4% 137 -51.2% -14
Telecom 13,976 13.6% 3 6,429 4.3% 3 117.4% 0
Energy, Mining & Utilities 12,183 11.9% 69 23,527 15.8% 72 -48.2% -3
Technology 6,090 5.9% 58 3,502 2.4% 57 73.9% 1
Transportation 5,945 5.8% 19 5,760 3.9% 24 3.2% -5
Financial Services 5,389 5.3% 38 21,547 14.5% 49 -75.0% -11
Business Services 4,468 4.4% 55 3,008 2.0% 53 48.5% 2
Pharma, Medical & Biotech 2,738 2.7% 34 1,172 0.8% 33 133.6% 1
Construction 2,146 2.1% 18 3,121 2.1% 30 -31.2% -12
Leisure 1,774 1.7% 26 2,063 1.4% 32 -14.0% -6
Real Estate 1,533 1.5% 19 18,052 12.1% 23 -91.5% -4
Media 989 1.0% 17 1,055 0.7% 18 -6.3% -1
Agriculture 25 0.0% 4 413 0.3% 9 -93.9% -5
Defence 0 0.0% 0 0 0.0% 1 - -1
Total 102,586 100.0% 566 148,747 100.0% 623 -31.0% -57
SECTOR ANALYSIS
41Monthly M&A Insider
EUROPE
A MERGERMARKET M&A REPORT ON
EUROPE
Contenders propping up Europe Germany, France and the UK are known for their tumultuous relationships in the bid for power. Proof of the repeated struggle was them trying to find an agreement over share percentages for the now lapsed mega-merger between BAE-EADS. It was Germany’s Chancellor Angela Merkel, the cog in any EU deal making at the moment, who vetoed the deal that would have added €16.1bn to UKs value count according to Mergermarket’s DealReporter.
The UK continues its title as the most active country in Europe for deal value in Q3 for value, €19.5bn and deal volume (210) which is in part down to the shadow of indecisiveness over the Glencore-Xstrata arrangements. It has been a focus this summer after a series of special events consumed the country boosting regional economy. The short term effects are surrounded by doubt though because of its deficit and consequent IMF warnings which means there are still many guarded investors out there.
Attempts to improve Italian businessItaly is the fifth weakest country for deal value (€6.6bn) compared to the other consolidated mergermarket regions. The Italian government is trying to be more constructive in its attempt to re-structure the country’s economy and encourage international expansion of Italian businesses. Cassa depositi e Prestiti acquiring Siminvest and Grupp Sace from the Italian Ministry for the Economy and Finance was one of the top deals in September worth €3.8bn.
Industrials and Chemicals at the centre of EuropeA buoyant Industrials and Chemicals sector is the most active in Europe on the whole with deals worth €21.2bn (239 deals) and a 26% market share that puts deal value up 33.8% on Q3 2011 (€15.9bn).
Germany, home to BASF as one of the largest global chemical companies, is a well known hub for European activity for the Industrials and Chemicals sector where it is the most active out of all other sectors in the region. It also features in the top deal this quarter from July when Volkswagen acquired Dr. Ing. h.c. F. Porsche for €11.4bn.
In Q3 2012 the German Industrials & Chemicals sector accounted for deals worth €14.5bn, 76.7% of the total German M&A Activity of €18.9bn. Forward looking deal making opportunities in Germany are within the regionally fragmented car and truck parts distribution market where consolidation is expected “to save on logistical costs and expand their regional footprint,” according to mergermarket intelligence.
Deflated quarter for private equity Since the beginning of 2012 European buyouts have had a gradual decline every quarter but -39.3% from Q2 (€18.5bn) to Q3 (€11.2bn) is the largest yet and the biggest dip from Q2 to Q3 since 2009 (59.9%). The low deal volume is sustained by the lack of deals for the quarter (65) and also the lowest average deal size of €65m since Q4 2011 (€64m). Cross border deals with targets in Europe dwindle, especially in the infamous Euro affected areas where trust in the recovery lies dormant, and this is pulling buyout values with it.
European exits for Q3 are worth €15.6bn. After an active Q2 (€29.1bn), Q3 experiences a slow down as seen in Q1 (€14.5bn) with deals worth €15.6bn making a -46.4% quarterly difference. Deals are slow to come to fruition and investors’ concern about exiting too early is likely to persist.
SCEPTICISM OF THE DIRECTION EUROPE IS HEADING IN THE CRISIS FACILITATED THE LOWEST DEAL VALUE SINCE Q3 2009 (¤55BN) WITH ¤80.9BN CREATING A 42.8% DECLINE ON LAST QUARTER (¤141.4BN). FITTINGLY, GERMANY, FRANCE AND THE UK ARE THE TOP THREE COUNTRIES FOR DEAL VALUES IN Q3 AND ALSO KEY DECISION MAKERS ON THE EU CRISIS – THEY’RE UNDER PRESSURE TO CLOSE DEALS AND PROVIDE A MORE ATTRACTIVE SETTLEMENT FOR INVESTORS IN EUROPE.
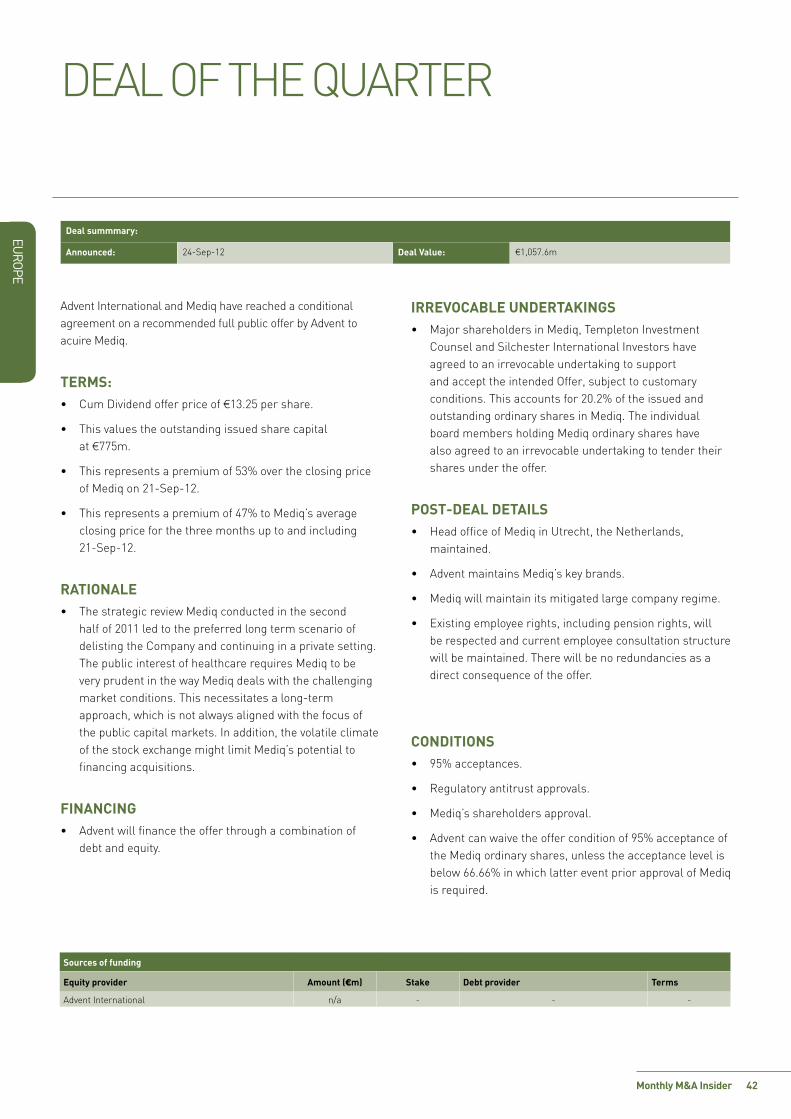
42
EUROPE
Monthly M&A Insider
DEAL OF THE QUARTER
Deal summmary:
Announced: 24-Sep-12 Deal Value: ¤1,057.6m
Advent International and Mediq have reached a conditional agreement on a recommended full public offer by Advent to acuire Mediq.
TERMS:• Cum Dividend offer price of ¤13.25 per share.
• This values the outstanding issued share capital at ¤775m.
• This represents a premium of 53% over the closing price of Mediq on 21-Sep-12.
• This represents a premium of 47% to Mediq’s average closing price for the three months up to and including 21-Sep-12.
RATIONALE• The strategic review Mediq conducted in the second
half of 2011 led to the preferred long term scenario of delisting the Company and continuing in a private setting. The public interest of healthcare requires Mediq to be very prudent in the way Mediq deals with the challenging market conditions. This necessitates a long-term approach, which is not always aligned with the focus of the public capital markets. In addition, the volatile climate of the stock exchange might limit Mediq’s potential to financing acquisitions.
FINANCING• Advent will finance the offer through a combination of
debt and equity.
IRREVOCABLE UNDERTAKINGS• Major shareholders in Mediq, Templeton Investment
Counsel and Silchester International Investors have agreed to an irrevocable undertaking to support and accept the intended Offer, subject to customary conditions. This accounts for 20.2% of the issued and outstanding ordinary shares in Mediq. The individual board members holding Mediq ordinary shares have also agreed to an irrevocable undertaking to tender their shares under the offer.
POST-DEAL DETAILS• Head office of Mediq in Utrecht, the Netherlands,
maintained.
• Advent maintains Mediq’s key brands.
• Mediq will maintain its mitigated large company regime.
• Existing employee rights, including pension rights, will be respected and current employee consultation structure will be maintained. There will be no redundancies as a direct consequence of the offer.
CONDITIONS• 95% acceptances.
• Regulatory antitrust approvals.
• Mediq’s shareholders approval.
• Advent can waive the offer condition of 95% acceptance of the Mediq ordinary shares, unless the acceptance level is below 66.66% in which latter event prior approval of Mediq is required.
Sources of funding
Equity provider Amount (¤m) Stake Debt provider Terms
Advent International n/a - - -

43
EUROPE
Monthly M&A Insider
DEAL OF THE QUARTER
mergermarket/dealReporter Intelligence
05-Oct-12 Mediq/Advent break fee negotiated at low end of 'bracket' for ¤775m deal
03-Oct-12 Mediq not being eyed by 3i backed Onemed
24-Sep-12 Mediq and Advent reach agreement on ¤775m take-private offer; debt financing secured
24-Sep-12 Mediq 14% shareholder says Advent bid is ‘not a done deal’
24-Sep-12 Mediq/Advent's lack of irrevocables not 'negative'; no auction held – CEO
24-Sep-12 Advent intends to make ¤775m public offer for Mediq
Advisers
Target/Seller Bidder
Financial ING (Bart de Klerk, Maurits Duynstee, Romano Herrie, Wieger Jansen, Floris Pot, Robert Specken); ABN AMRO Bank NV (Martijn Arlman, Diny de Jong, Frederik Gorter de Vries, Maurice Laudy, Maarten Meurs, Marco Seller, Rutger van Nouhuijs, Machiel van Oostveen, Dennis van Zijl)
Financial BNP Paribas SA; Deutsche Bank AG; Rabobank NV (Istvan Csejtei, Paul Huizinga, Oscar Nettl, Roeland Peeters, Walter Smidts, Pieter Stor)
Legal Allen & Overy LLP Legal Freshfields Bruckhaus Deringer LLP (James Clarke, Shawn der Kinderen, Alexander Doorman, Thijs Flokstra, Marike Kuin, Hanneke Rothbarth, Harald Spruit)
PR Citigate First Financial BV PR FTI Consulting (Fergus Wheeler, Sophia Winfield)
Exit multiples – Y/E 31-Dec-12 Premium Analysis
Multiples Value (¤m) Offer price per share (¤) 13.25
Revenue 0.4 x 2,657.71 1 day before 53.13%
EBITDA 7.1 x 149.02 1 month before 50.06%
EBIT 9.5 x 111.08 1 day after 3.11%
Earnings 10.5 x 73.42 Pre-rumour -
Bidder
Advent International Corporation
Headquarters: 75 State Street 02109, Boston, MAUSA
Sector: Financial Services
Description: US based venture capital and private equity firm specialising in growth buyout, acquisitions, mid and upper mid market buyouts, management buyouts, turnaround, buyins, company succession, international expansion, strategic repositioning with investments between ¤100m and ¤500m in companies with enterprise value up to ¤2bn or US$2bn and revenues between ¤200m and ¤2bn
Target
Mediq NV
Headquarters: Hertogswetering 1593543, UtrechtNetherlands
Sector: Pharma, Medical & Biotech
Description: Netherlands based international retail and distribution company for pharmaceuticals and medical supplies

44
EUROPE
Monthly M&A Insider
TOP DEALS & EXPECTED DEALS
TOP 10 EUROPEAN ANNOUNCED DEALS OF Q3 2012Announced Bidder company Target company Target dominated
sectorSeller company Exit multiples (x) Bid premia
1-day before
Deal value(¤m)
Revenue EBITDA P/E
04-Jul-12 Volkswagen AG Dr. Ing. h.c. F. Porsche AG (50.1% stake)
Industrials & Chemicals
Porsche Automobil Holding SE
1.4 5.4 6.1 - 11,353
27-Sep-12 Cassa depositi e prestiti spa Simest SpA (76% stake); and Gruppo Sace Spa
Financial Services Italian Ministry for the Economy and Finance; and Italian Ministry of Economic Development
n/a n/a - - 3,800
12-Jul-12 Dentsu Inc Aegis Group Plc Technology 2.9 15.2 36.9 48.0% 3,562
15-Aug-12 Altimo VimpelCom Ltd (14.8% stake)
Telecommunication Weather Investments II Sarl
2.1 5.5 32.8 25.8% 2,930
26-Jul-12 Toyota Tsusho Corporation CFAO SA (29.8% stake)
Business Services PPR SA 0.8 8.5 19.0 -0.8% 2,597
09-Jul-12 Intel Corporation ASML Holding NV (15% Stake)
Technology 2.6 8.0 11.7 -1.4% 2,513
25-Jul-12 Cheung Kong Infrastructure Holdings Limited; Power Assets Holdings Limited; Li Ka Shing Foundation Limited; and Cheung Kong (Holdings) Limited
Wales & West Utilities Limited
Energy, Mining & Utilities
Industry Funds Management Pty Ltd; Canada Pension Plan Investment Board; Macquarie Group Limited; AMP Capital Investors Limited; and Codan Trust Company Limited
5.6 14.3 - - 2,499
03-Jul-12 Hellman & Friedman LLC Wood Mackenzie Limited
Business Services Charterhouse Capital Partners LLP
- 15.7 - - 1,369
23-Jul-12 Sinopec International Petroleum Exploration and Production Corporation
Talisman Energy (UK) Ltd (49% stake)
Energy, Mining & Utilities
Talisman Energy Inc 2.9 4.5 2.3 - 1,236
24-Sep-12 CGGVeritas Fugro Geotechnique SA
Business Services Fugro NV 1.5 9.6 - - 1,200
Based on announced deals, including lapsed and withdrawn bids Based on dominant geography of target company being Europe Data correct as of 09-Oct-12
Source: mergermarket
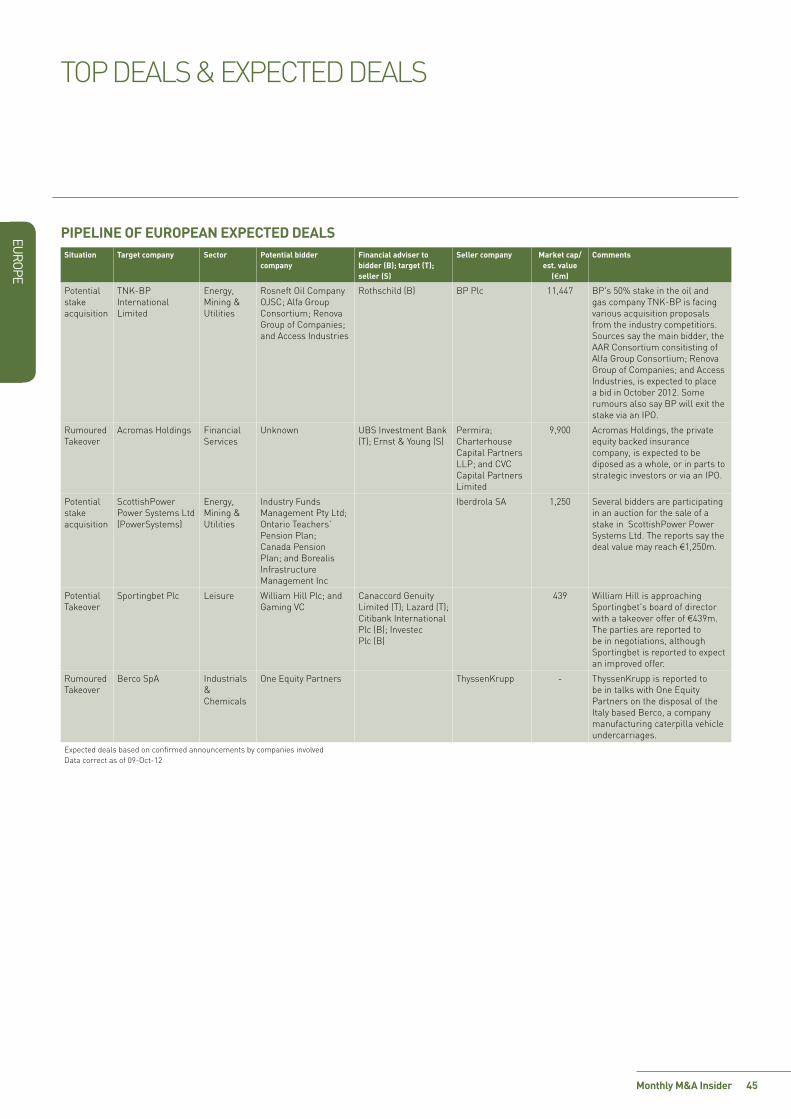
45
EUROPE
Monthly M&A Insider
PIPELINE OF EUROPEAN EXPECTED DEALSSituation Target company Sector Potential bidder
companyFinancial adviser to bidder (B); target (T); seller (S)
Seller company Market cap/est. value
(¤m)
Comments
Potential stake acquisition
TNK-BP International Limited
Energy, Mining & Utilities
Rosneft Oil Company OJSC; Alfa Group Consortium; Renova Group of Companies; and Access Industries
Rothschild (B) BP Plc 11,447 BP's 50% stake in the oil and gas company TNK-BP is facing various acquisition proposals from the industry competitiors. Sources say the main bidder, the AAR Consortium consitisting of Alfa Group Consortium; Renova Group of Companies; and Access Industries, is expected to place a bid in October 2012. Some rumours also say BP will exit the stake via an IPO.
Rumoured Takeover
Acromas Holdings Financial Services
Unknown UBS Investment Bank (T); Ernst & Young (S)
Permira; Charterhouse Capital Partners LLP; and CVC Capital Partners Limited
9,900 Acromas Holdings, the private equity backed insurance company, is expected to be diposed as a whole, or in parts to strategic investors or via an IPO.
Potential stake acquisition
ScottishPower Power Systems Ltd (PowerSystems)
Energy, Mining & Utilities
Industry Funds Management Pty Ltd; Ontario Teachers' Pension Plan; Canada Pension Plan; and Borealis Infrastructure Management Inc
Iberdrola SA 1,250 Several bidders are participating in an auction for the sale of a stake in ScottishPower Power Systems Ltd. The reports say the deal value may reach ¤1,250m.
Potential Takeover
Sportingbet Plc Leisure William Hill Plc; and Gaming VC
Canaccord Genuity Limited (T); Lazard (T); Citibank International Plc (B); Investec Plc (B)
439 William Hill is approaching Sportingbet's board of director with a takeover offer of ¤439m. The parties are reported to be in negotiations, although Sportingbet is reported to expect an improved offer.
Rumoured Takeover
Berco SpA Industrials & Chemicals
One Equity Partners ThyssenKrupp - ThyssenKrupp is reported to be in talks with One Equity Partners on the disposal of the Italy based Berco, a company manufacturing caterpilla vehicle undercarriages.
Expected deals based on confirmed announcements by companies involved Data correct as of 09-Oct-12
TOP DEALS & EXPECTED DEALS
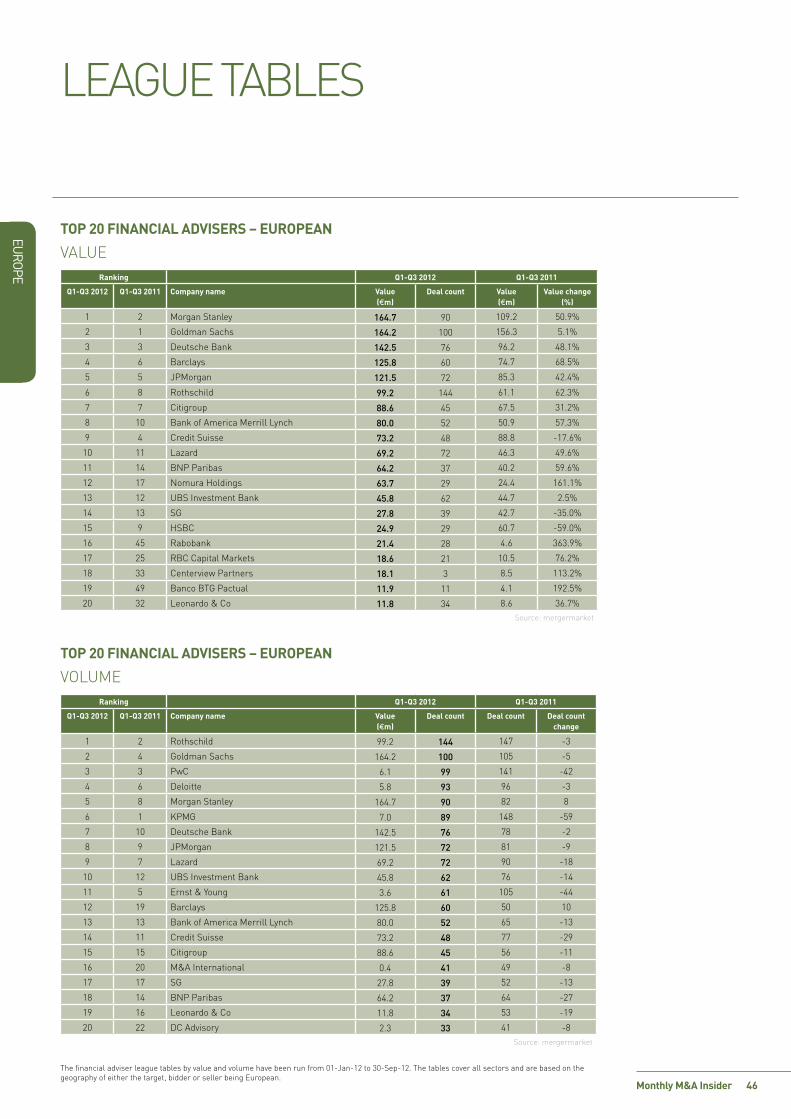
46
EUROPE
Monthly M&A Insider
LEAGUE TABLES
TOP 20 FINANCIAL ADVISERS – EUROPEAN
The financial adviser league tables by value and volume have been run from 01-Jan-12 to 30-Sep-12. The tables cover all sectors and are based on the geography of either the target, bidder or seller being European.
Ranking Q1-Q3 2012 Q1-Q3 2011
Q1-Q3 2012 Q1-Q3 2011 Company name Value (¤m)
Deal count Value (¤m)
Value change (%)
1 2 Morgan Stanley 164.7 90 109.2 50.9%
2 1 Goldman Sachs 164.2 100 156.3 5.1%
3 3 Deutsche Bank 142.5 76 96.2 48.1%
4 6 Barclays 125.8 60 74.7 68.5%
5 5 JPMorgan 121.5 72 85.3 42.4%
6 8 Rothschild 99.2 144 61.1 62.3%
7 7 Citigroup 88.6 45 67.5 31.2%
8 10 Bank of America Merrill Lynch 80.0 52 50.9 57.3%
9 4 Credit Suisse 73.2 48 88.8 -17.6%
10 11 Lazard 69.2 72 46.3 49.6%
11 14 BNP Paribas 64.2 37 40.2 59.6%
12 17 Nomura Holdings 63.7 29 24.4 161.1%
13 12 UBS Investment Bank 45.8 62 44.7 2.5%
14 13 SG 27.8 39 42.7 -35.0%
15 9 HSBC 24.9 29 60.7 -59.0%
16 45 Rabobank 21.4 28 4.6 363.9%
17 25 RBC Capital Markets 18.6 21 10.5 76.2%
18 33 Centerview Partners 18.1 3 8.5 113.2%
19 49 Banco BTG Pactual 11.9 11 4.1 192.5%
20 32 Leonardo & Co 11.8 34 8.6 36.7%Source: mergermarket
Ranking Q1-Q3 2012 Q1-Q3 2011
Q1-Q3 2012 Q1-Q3 2011 Company name Value (¤m)
Deal count Deal count Deal count change
1 2 Rothschild 99.2 144 147 -3
2 4 Goldman Sachs 164.2 100 105 -5
3 3 PwC 6.1 99 141 -42
4 6 Deloitte 5.8 93 96 -3
5 8 Morgan Stanley 164.7 90 82 8
6 1 KPMG 7.0 89 148 -59
7 10 Deutsche Bank 142.5 76 78 -2
8 9 JPMorgan 121.5 72 81 -9
9 7 Lazard 69.2 72 90 -18
10 12 UBS Investment Bank 45.8 62 76 -14
11 5 Ernst & Young 3.6 61 105 -44
12 19 Barclays 125.8 60 50 10
13 13 Bank of America Merrill Lynch 80.0 52 65 -13
14 11 Credit Suisse 73.2 48 77 -29
15 15 Citigroup 88.6 45 56 -11
16 20 M&A International 0.4 41 49 -8
17 17 SG 27.8 39 52 -13
18 14 BNP Paribas 64.2 37 64 -27
19 16 Leonardo & Co 11.8 34 53 -19
20 22 DC Advisory 2.3 33 41 -8Source: mergermarket
TOP 20 FINANCIAL ADVISERS – EUROPEAN
VOLUME
VALUE

47
EUROPE
Monthly M&A Insider
LEAGUE TABLES
VOLUMETOP 20 LEGAL ADVISERS – EUROPEAN
The legal adviser league tables by value and volume have been run from 01-Jan-12 to 30-Sep-12 and include lapsed and withdrawn deals. The tables cover all sectors and are based on the geography of either the target, bidder or seller being European.
VALUE
Ranking Q1-Q3 2012 Q1-Q3 2011
Q1-Q3 2012 Q1-Q3 2011 Company name Value (¤m)
Deal count Deal count Deal count change
1 2 Linklaters 106.7 149 176 -27
2 3 Clifford Chance 139.8 121 159 -38
3 5 DLA Piper 18.9 116 152 -36
4 1 Freshfields Bruckhaus Deringer 135.4 115 178 -63
5 4 CMS 6.9 109 159 -50
6 6 Allen & Overy 50.7 105 145 -40
7 7 Baker & McKenzie 25.6 84 128 -44
8 11 Jones Day 18.1 74 90 -16
9 10 White & Case 40.9 73 90 -17
10 8 Hogan Lovells 30.0 66 98 -32
11 9 Latham & Watkins 39.3 64 93 -29
12 13 Eversheds 10.2 64 78 -14
13 20 Skadden Arps Slate Meagher & Flom 67.5 56 54 2
14 15 Ashurst 13.1 56 65 -9
15 17 SJ Berwin 3.5 49 62 -13
16 19 Pinsent Masons 1.2 49 55 -6
17 83 Bech-Bruun 5.8 48 20 28
18 16 Loyens & Loeff 14.6 46 65 -19
19 22 Mannheimer Swartling 2.0 44 52 -8
20 34 Hengeler Mueller 31.6 43 39 4Source: mergermarket
Ranking Q1-Q3 2012 Q1-Q3 2011
Q1-Q3 2012 Q1-Q3 2011 Company name Value (¤m)
Deal count Value (¤m)
Value change (%)
1 6 Clifford Chance 139.8 121 58.0 141.0%
2 1 Freshfields Bruckhaus Deringer 135.4 115 137.2 -1.3%
3 2 Linklaters 106.7 149 122.8 -13.1%
4 13 Skadden Arps Slate Meagher & Flom 67.5 56 35.9 87.8%
5 7 Cleary Gottlieb Steen & Hamilton 58.5 42 56.8 2.9%
6 128 King & Wood Mallesons 54.1 9 2.6 1966.5%
7 4 Allen & Overy 50.7 105 79.7 -36.3%
8 3 Sullivan & Cromwell 45.1 25 91.1 -50.4%
9 10 White & Case 40.9 73 42.7 -4.1%
10 15 Weil Gotshal & Manges 39.6 40 35.0 13.2%
11 11 Latham & Watkins 39.3 64 38.7 1.7%
12 8 Simpson Thacher & Bartlett 34.7 20 56.7 -38.9%
13 22 Hengeler Mueller 31.6 43 29.0 8.8%
14 9 Wachtell, Lipton, Rosen & Katz 30.9 11 54.5 -43.2%
15 23 Hogan Lovells 30.0 66 28.7 4.6%
16 35 Davis Polk & Wardwell 28.5 17 16.6 71.9%
17 45 Kirkland & Ellis 26.0 31 13.8 89.1%
18 21 Slaughter and May 25.6 29 29.9 -14.4%
19 26 Baker & McKenzie 25.6 84 26.6 -4.0%
20 67 A&L Goodbody 25.4 15 8.1 214.0%Source: mergermarket
TOP 20 LEGAL ADVISERS – EUROPEAN

48
EUROPE
Monthly M&A Insider
VALUE
ACTIVITY TABLE OF PRIVATE EQUITY FIRMS ON EUROPEAN BUYOUTS
ACTIVITY TABLE OF PRIVATE EQUITY FIRMS ON EUROPEAN EXITS
The private equity buyout activity tables by value and volume are based on private equity firms advising the bidder on buyout deals where the dominant geography of the target company is European. The tables by value and volume have been run from 01-Jan-12 to 30-Sep-12 and exclude lapsed and withdrawn deals.
The private equity exit activity tables by value and volume are based on private equity firms advising the vendor on exit deals where the dominant geography of the target company is European.The tables by value and volume have been run from 01-Jan-12 to 30-Sep-12 and exclude lapsed and withdrawn deals.
LEAGUE TABLES
VALUE
VALUE
Rank
Q1-Q3 2012 Company name Value (¤m)
Deal count
1 Arcus Infrastructure Partners 4,222 1
2 Macquarie Group 3,370 2
3 EQT Partners 2,657 6
4 Cinven 2,032 4
5 CVC Capital Partners 1,800 1
6 Vista Equity Partners 1,700 2
7 Blackstone Group 1,692 2
8= Infracapital Partners 1,541 1
8= Morgan Stanley Infrastructure 1,541 1
10 AXA Private Equity 1,440 12
11 Hellman & Friedman 1,369 1
12 Terra Firma Capital Partners 1,342 2
13 Kohlberg Kravis Roberts & Co 1,163 2
14 Partners Group Holding 1,100 2
15 Montagu Private Equity 1,013 4Source: mergermarket
VOLUME
VOLUME
Rank
Q1-Q3 2012 Company name Value (¤m)
Deal count
1 AXA Private Equity 1,440 12
2 Lloyds TSB Development Capital 306 9
3 EQT Partners 2,657 6
4 Naxicap Partners 235 6
5 Oaktree Capital Group 437 5
6 Nordic Capital 262 5
7 Equistone Partners Europe 174 5
8 Edmond de Rothschild Investment Partners 29 5
9= BNP Paribas Developpement - 5
9= Ciclad - 5
9= mutares - 5
9= Polaris Management - 5
9= Valedo Partners - 5
14 Cinven 2,032 4
15 Montagu Private Equity 1,013 4Source: mergermarket
Rank
Q1-Q3 2012 Company name Value (¤m)
Deal count
1 3i Group 869 10
2 Equistone Partners Europe 1,295 4
3 Capvis Equity Partners 1,283 4
4 Gimv 225 4
5 Argos Soditic 185 4
6= Barclays Ventures 128 4
6= Omnes Capital 128 4
8 CapMan 59 4
9 CVC Capital Partners 4,302 3
10 EQT Partners 1,730 3
11 Bridgepoint Capital 1,434 3
12 Electra Partners 1,375 3
13 HgCapital 1,316 3
14 AAC Capital Partners 346 3
15 Intel Capital 306 3Source: mergermarket
Rank
Q1-Q3 2012 Company name Value (¤m)
Deal count
1 Kohlberg Kravis Roberts & Co 5,270 1
2 Macquarie Group 4,997 2
3 Permira 4,552 2
4 CVC Capital Partners 4,302 3
5= AMP Capital Investors 2,499 1
5= Industry Funds Management 2,499 1
7 Charterhouse Capital Partners 2,169 2
8= Cinven 1,800 1
8= GS Capital Partners 1,800 1
8= Montagu Private Equity 1,800 1
11 EQT Partners 1,730 3
12 Bridgepoint Capital 1,434 3
13 Electra Partners 1,375 3
14 Mid Europa Partners 1,370 2
15 HgCapital 1,316 3Source: mergermarket

EUROPE
Monthly M&A Insider 49
TREND GRAPHS
EUROPEAN M&A QUARTERLY TREND
0
100
200
300
400
500
Q312*
Q212
Q112
Q411
Q311
Q211
Q111
Q410
Q310
Q210
Q110
Q409
Q309
Q209
Q109
Q408
Q308
Q208
Q108
Q407
Q307
Q207
Q107
Q406
Q306
Q206
Q106
Valu
e (!
bn)
Total value Mid-market value
Num
ber of deals
0
200
400
600
800
1,000
1,200
1,400
1,600
1,800
2,000
Total volume Mid-market volume
0
10
20
30
40
50
60
70
80
90
100
110
120
130
140
Q312*
Q212
Q112
Q411
Q311
Q211
Q111
Q410
Q310
Q210
Q110
Q409
Q309
Q209
Q109
Q408
Q308
Q208
Q108
Q407
Q307
Q207
Q107
Q406
Q306
Q206
Q106
Buyout value Exit value Buyout volume Exit volume
Valu
e (!
bn)
Num
ber of deals
0
50
100
150
200
250
300
350
400
450
EUROPEAN M&A ANNUAL TREND EUROPEAN M&A ANNUAL PRIVATE EQUITY TREND
0
200
400
600
800
1,000
1,200
YTD 2012*201120102009200820072006
Total value Mid-market value
Num
ber of deals
Valu
e (!
bn)
0
1,000
2,000
3,000
4,000
5,000
6,000
7,000
8,000
Total volume Mid-market volume
0
50
100
150
200
250
300
YTD 2012*201120102009200820072006
Valu
e (!
bn)
Buyout value Exit value
Num
ber of deals
Buyout volume Exit volume
0
200
400
600
800
1,000
1,200
1,400
1,600
EUROPEAN M&A QUARTERLY PRIVATE EQUITY TREND

EUROPE
Monthly M&A Insider 50
TREND GRAPHS
EUROPEAN M&A GEOGRAPHIC BREAKDOWN Q3 2012
VALUE VOLUME
UK
Nordic
Germany
France
Benelux
Italy
Others
CEE
Iberia
11.6%
11.6%
6.3%
5.6%
8.1%
24.2%
5.7%
3.6%
23.3%
9.1%
5.8%
10.3%
3.9%
8.4%
20.1%
15.3%
14.6%12.5%
UK
Nordic
Germany
France
Benelux
Italy
Others
CEE
Iberia
EUROPEAN M&A SECTOR BREAKDOWN Q3 2012
VALUE VOLUME
10.7%
26.3%
14.1%
4.7%
4.5%
4.6%
2.7%
1.9%
1.7%
0.3%0.5%
11.6%
6.6%
9.9%
Industrials & Chemicals
Energy, Mining & Utilities
Financial Services
Business Services
Consumer
Technology
Telecommunications
Media
Pharma, Medical & Biotech
Transportation
Real Estate
Leisure
Construction
Agriculture
4.0%
22.8%4.5%
0.7%
1.0%
3.2%
4.4%
5.2%
0.9%0.3%
7.5%
7.3%
12.9%15.4%
10.1%
Industrials & Chemicals
Energy, Mining & Utilities
Financial Services
Business Services
Consumer
Technology
Telecommunications
Media
Pharma, Medical & Biotech
Transportation
Real Estate
Leisure
Construction
Agriculture
Defence

EUROPE
Monthly M&A Insider 51
TREND GRAPHS
EUROPEAN M&A DEAL SIZE BREAKDOWN
VALUE VOLUME
0
10
20
30
40
50
60
70
80
90
100
2012*201120102009200820072006
<!250m or undisclosed value
!251m-!500m
!501m-!2,000m
!2,001m-!5,000m
>!5,001m
17.6%
23.4%
8.5%
15.9%
34.6%
16.6%
22.3%
8.3%
13.7%
39.1%
14.8%
20.2%
9.1%
17.1%
38.8%
20.0%
24.1%
9.2%
20.3% 17.6%
9.4%
29.5%
20.9%
26.4% 22.6%17.1%
21.8%
30.9%
11.5%
18.7%
22.8%
22.9%
26.8%
10.8%
16.7%
Perc
enta
ge
88
90
92
94
96
98
100
2012*201120102009200820072006
3.8%
0.9%
3.5%
91.4%
4.0%
0.9%
3.9%
90.8%
2.7%
0.6%
3.2%
93.2%
2.1%
0.6%
2.3%
94.8%
93.2%
2.7%
3.2%
0.7% 0.7%
3.1%
3.1%
92.9%
0.4%0.4% 0.4% 0.1%0.2% 0.2% 0.2%
0.7%
2.9%
2.9%
93.3%
<!250m or undisclosed value
!251m-!500m
!501m-!2,000m
!2,001m-!5,000m
>!5,001m
Perc
enta
ge
EUROPEAN SECTOR ANALYSISSector Q3 2012 Q3 2011 % change
Value (¤m) Mrk share Deal count Value (¤m) Mrk share Deal count Value Volume
Industrials & Chemicals 21,249 26.0% 239 15,883 13.6% 288 34% -17%
Energy, Mining & Utilities 11,428 15.3% 79 30,699 26.2% 102 -63% -23%
Financial Services 9,364 13.2% 76 26,103 22.3% 105 -64% -28%
Business Services 8,631 10.7% 135 6,812 5.8% 194 27% -30%
Consumer 8,013 5.4% 161 8,850 7.6% 205 -9% -21%
Technology 5,311 5.2% 106 10,020 8.6% 106 -47% 0%
Telecommunications 3,811 5.0% 7 2,798 2.4% 13 36% -46%
Media 3,718 5.0% 33 2,035 1.7% 60 83% -45%
Pharma, Medical & Biotech 3,617 4.4% 42 3,420 2.9% 86 6% -51%
Transportation 2,214 3.1% 46 2,630 2.2% 49 -16% -6%
Real Estate 1,517 2.6% 10 2,415 2.1% 28 -37% -64%
Leisure 1,342 2.1% 47 3,375 2.9% 44 -60% 7%
Construction 431 1.7% 54 1,633 1.4% 59 -74% -8%
Agriculture 208 0.2% 9 259 0.2% 13 -20% -31%
Defence 0 0.1% 3 20 0.0% 3 -100% 0%
Total 80,854 1,047 116,952 1,355 -31% -23%
SECTOR ANALYSIS
52
MIDDLE EAST &
AFRICA
THE MIDDLE EAST & AFRICA
A MERGERMARKET M&A REPORT ON
Monthly M&A Insider
Whilst the first two quarters of this year brought successive growth, Q3 marked a 37% decline in deal values on Q2, dropping from US$13.5bn to US$8.5bn. However, it is notable that average deal sizes in the mid-market in Q3 reached US$83.5m. Since 2004, this figure has been surpassed only once (US$92m in Q4 2010), perhaps providing a glimmer of hope for dealmakers.
Energy, Mining & Utilities was the most active sector of Q3 2012, its US$3.3bn worth of deals accounting for 38.3% of the market. Despite this position, and with five of the top ten deals, it posted a 36.5% drop on its performance in Q3 2011 (US$5.2bn). The top deal in the sector was UAE-based Shelf Drilling Holdings purchase of 38 shallow water drilling rigs from Transocean for US$1.1bn.
Telecommunications, with just one US$ 2.2bn buy constituting a 25.9% market share, was ousted from its position as Q2 sector leader (US$ 6.1bn, 41%). Although deal flow has slowed, sizeable opportunities of significant scale appear to have remained in the sector. European interest in the market was demonstrated in the spring by France Telecom’s US$3.3bn acquisition of a stake in OCMS, the top deal of the year so far. However, the largest transaction of Q3 suggests that there may be competition from within the region, as Qatar Telecom bid US$2.2bn for the 47.5% shares it does not already own in Kuwait’s Wataniya Telecom.
The completion of this deal was far from certain. Local reports in September suggested that the Kuwait Investment Authority, which held a 23.54% stake, may look to drive a higher price out of the suitor. In a Mergermarket follow-up shortly after, it was discovered that Qatar Telecom had no intention of revising its offer. A source close to the transaction said that the bid represented a 25.7% premium on the average closing price over the past twelve months and was “a onetime offer that is not going to be increased”. On October 7th, Mergermarket revealed that the offer had been accepted in its original terms and KIA made a complete exit.
Aided this deal, Kuwait was the most active country by deal value with a 25.9% share of the market (US$2.2bn). Egypt, with US$1.1bn worth of deals for 12.4%, and Nigeria, US$1bn for 12.3%, also performed strongly. In terms of the number of transactions, traditional powerhouses South Africa and Israel led the way, making up 46.9% of all activity between them.
Elsewhere, the most notable story was the emergence of Iraq, which posted its joint highest quarter by volume ever on Mergermarket record, shared with Q2 of this year. It grabbed a 7.9% share of the market by value with US$596m worth of deals, helping make 2012 the most active year for Iraqi M&A activity on Mergermarket record by some distance already. All three of Q3’s deals in the region concerned oil, the largest of which being Turkey-based Genel Energy’s US$240m acquisition of a 21% stake in the Bina Bawi Exploration Block.
Activity in the space looks set to continue. There are plans afoot for a new oil and gas pipeline between Iraq and Turkey, and Genel is reported to have a further US$1bn available to invest. Additionally, an auction for the Nassiriya Oil Field, with proven crude oil reserves of 4.4bn barrels, is likely to take place later this year, according to a senior Iraqi official.
A mergermarket analysis piece in July suggested that, despite ongoing tensions with Baghdad, the outlook for M&A activity in involving oil in the Kurdistan region remains buoyant. Several projects in Kurdistan are at the exploration and drilling stage and require capital injections through operational and strategic investors to proceed. Smaller firms are more inclined to go directly to the region to avoid bureaucratic complexities in Baghdad, but national oil companies from Japan and Korea could also be attracted, and would have more pull with the central government, the report said. With an International Energy Agency report suggesting its oil output could double by 2020, Iraq looks on course to become an M&A hotspot in the ME&A region.
THE MIDDLE EAST & AFRICA COULD NOT ESCAPE THE GLOBAL SLOWDOWN IN M&A ACTIVITY, WITH DEALS TOTALLING US$31.2BN FOR THE PERIOD Q1-Q3 2012, DOWN 12.8% ON THE SAME PERIOD LAST YEAR (US$35.8BN). ALONGSIDE AN 8.3% DROP IN DEAL COUNT, THE FIRST NINE MONTHS HAS BEEN THE WORST SUCH PERIOD FOR M&A IN THE REGION SINCE 2009 (US$24.7BN) AND THE SECOND WORST SINCE 2005 (US$23BN).

53
MIDDLE EAST &
AFRICA
Monthly M&A Insider
DEAL OF THE QUARTER
Qatar Telecom (QTel) Q.S.C. has launched a mandatory tender offer to acquire 47.5% stake in National Mobile Telecommunications Company KSC.
National Mobile Telecommunications Company KSC (Wataniya Telecom), the Kuwait based company headquartered in Safat, is engaged in the provision of mobile telecommunications and internet services.
Qatar Telecom (QTel) Q.S.C., the Qatar based company headquartered in Doha, is engaged in providing telecommunications services.
TERMS:• 239,391,053 shares, representing 47.5% stake of Wataniya,
will be acquired at an offer price of KWD2.6 (US$9.21) valuing the transaction at KWD622.42m (US$2,205.98m).
• The implied equity value of the transaction is approximately KWD1310.49m (US$4,644.64m).
• The offer price represents a premium of 25.6% over the Wataniya Telecom’s estimated volume weighted average closing share price of KWD2.07 (US$7.34) for two weeks ended 21-Jun-12;
• It also provides a premium of 20.8% over the Wataniya Telecom’s estimated volume weighted average closing share price of KWD2.151 (US$7.62) for the six month period ended 21-Jun-12;
• It provides a premium of 25.7% over the Wataniya Telecom’s estimated volume weighted average closing share price of KWD2.069 (US$7.33) for the 12 month period ended 21-Jun-12;
• And it represents a premium of 22.6% over the Wataniya Telecom’s closing share price of KWD2.12 (US$7.51) as of 21-Jun-12 , the last trading day prior to the announcement.
RATIONALE:• The transaction is in line with Qatar Telecom’s strategy to
simplify group structure and enhance growth potential, efficiency and operational effectiveness of its subsidiaries.
• The transaction will also enable shareholders of Wataniya Telecoms to maximise their investments.
POST-DEAL DETAILS:• Upon completion, Wataniya Telecom will operate as wholly
owned subsidiary of Qatar Telecom.
BACKGROUND:• Qatar Telecom has received the approval from the Kuwait
Capital Markets Authority regarding the mandatory tender offer.
• Prior to transaction, Qatar Telecom and Kuwait Investment Authority held 52.5% and 23.34% stakes respectively in Wataniya Telecom.
• Prior to the transaction, in 2007, Qatar Telecom acquired 51% stake in Wataniya Telecom, for a total consideration of US$3,700m.
CONDITIONS • Board of directors of Wataniya Telecom approval.
UPDATE 03-OCT-12:• Kuwait Investment Authority has agreed to sell its 23.34%
stake in Wataniya Telecom as part of the mandatory tender offer.
Deal summary
Announced: 16-Aug-12 Deal Value: US$2,206m

54
MIDDLE EAST &
AFRICA
Monthly M&A Insider
DEAL OF THE QUARTER
mergermarket/dealReporter Intelligence
30-Aug-12 Qtel launches USD 2.2bn offer for Wataniya Telecom shares
28-Jun-12 Wataniya Telecom: Qtel concludes talks to buy KIA’s 23.54% stake – report
26-Jun-12 Wataniya Telecom: Qtel submits an offer to CMA to acquire remaining shares
Bidder
Qatar Telecom (QTel) Q.S.C.
Headquarters: Doha, Qatar
Sector: TMT
Description: Qatar based company engaged in providing telecommunications services
Target
National Mobile Telecommunications Company KSC
Headquarters: Safat, Kuwait
Sector: TMT
Description: Kuwait based company engaged in the provision of mobile telecommunications and internet services
Advisers
Target/Seller Bidder
Financial - Financial Barclays; NBK Capital
Legal - Legal The Law Office of Bader Saud Al Bader and Partners
PR - PR FTI Consulting
Exit multiples – Y/E 31-Dec-11 Premium analysis
Multiples Value (US$m) Offer price per share (US$) 9.21
Revenue 1.8 x 2,606 1 day before -
EBITDA 4.8 x 969 1 month before -
EBIT 8.9 x 522 1 day after -
Earnings 3.5 x 1,173 Pre-rumour -

55
MIDDLE EAST &
AFRICA
Monthly M&A Insider
TOP DEALS
TOP 10 MIDDLE EASTERN & AFRICAN ANNOUNCED DEALS OF Q3 2012Announced Bidder company Target company Target dominated
sectorSeller company Exit multiples (x) Bid premia
1-day before
Deal value(US$m)Revenue EBITDA P/E
16-Aug-12 Qatar Telecom (QTel) QSC National Mobile Telecommunications Company KSC (47.5% stake)
Telecommunications 1.8 4.8 3.5 - 2,206
10-Sep-12 Shelf Drilling International Holdings Ltd
Transocean Ltd (38 Shallow Water Drilling Rigs)
Energy, Mining & Utilities
Transocean Ltd - 1,050
06-Sep-12 Shlomo Eliahu (private investor)
Migdal Insurance and Financial Holdings Ltd (69.13% stake)
Financial Services Assicurazioni Generali SpA
496.6 17.0 - 891
02-Jul-12 Heritage Oil Plc; and Shoreline Power Company Limited
Oil Mining Lease 30 (45% stake)
Energy, Mining & Utilities
The Shell Petroleum Development Company of Nigeria Limited; Total E&P Nigeria Limited; and Nigerian Agip Oil Company Limited
- 850
24-Jul-12 Anglo American Plc Minas de Revuboe (58.9% stake)
Energy, Mining & Utilities
Talbots Estate Agents
- 553
06-Aug-12 Genel Energy plc Bina Bawi Exploration Block (21% stake)
Energy, Mining & Utilities
Hawler Energy Ltd - 240
19-Jul-12 Chevron Corporation Reliance Industries Limited (Sarta and Rovi onland blocks) (80% stake)
Energy, Mining & Utilities
Reliance Exploration and Production DMCC
- 200
27-Aug-12 Medi-Clinic Corporation Ltd
Emirates Healthcare Holdings Limited (44.39% stake)
Pharma, Medical & Biotech
Varkey Group Limited
1.8 - 197
24-Jul-12 Fawaz Abdulaziz Al Hokair Company
NESK Group Of Trading Projects LLC
Consumer Al-Jedaie Group - 195
25-Sep-12 Tiger Brands Limited Dangote Flour Mills PLC (63.35% stake)
Consumer The Dangote Group 0.7 6.5 0.0 - 193
Based on announced deals, including lapsed and withdrawn bids Based on dominant geography of target being Middle East or Africa Data correct as of 08-Oct-12
Source: mergermarket

56
MIDDLE EAST &
AFRICA
Monthly M&A Insider
TOP 20 FINANCIAL ADVISERS – MIDDLE EAST & AFRICA
The financial adviser league tables by value and volume have been run from 01-Jan-12 to 30-Sep-12. The tables cover all sectors and are based on the geography of either the target, bidder or seller being Middle East & Africa including Israel.
Ranking Q1-Q3 2012 Q1-Q3 2011
Q1-Q3 2012 Q1-Q3 2011 Company name Value (US$bn)
Deal count Value (US$bn)
Value change (%)
1 1 Goldman Sachs 7.5 10 18.0 -58.2%
2 17 HSBC 6.7 7 2.6 157.2%
3 - Barclays 5.1 8 - -
4 26 Lazard 4.5 3 1.6 180.6%
5 4 Deutsche Bank 4.0 2 10.4 -61.8%
6 11 Citigroup 3.7 4 4.8 -24.2%
7 12 Rothschild 3.5 6 3.8 -6.8%
8 2 Bank of America Merrill Lynch 3.4 5 11.9 -71.6%
9 8 Standard Bank Group 3.3 9 6.0 -44.2%
10 - SG 3.3 1 - -
11 61 Nomura Holdings 3.3 2 0.2 2076.0%
12 34 UBS Investment Bank 3.0 4 0.9 229.7%
13 5 Credit Suisse 2.9 2 9.1 -67.8%
14 51 PwC 2.7 9 0.3 948.0%
15 35 RBC Capital Markets 2.6 6 0.6 347.5%
16 6 JPMorgan 2.6 7 8.2 -68.5%
17 - NBK Capital 2.2 1 - -
18 - Kuwait Finance and Investment Co 2.1 1 - -
19 n/a Banco Itau BBA 2.0 1 - -
20 25 Jefferies & Company 1.5 5 1.6 -9.3%Source: mergermarket
Ranking Q1-Q3 2012 Q1-Q3 2011
Q1-Q3 2012 Q1-Q3 2011 Company name Value (US$bn)
Deal count Deal count Deal count change
1 1 Goldman Sachs 7.5 10 15 -5
2 2 Rand Merchant Bank 1.5 10 14 -4
3 5 Ernst & Young 1.2 9 12 -3
4 22 PwC 2.7 9 4 5
5 4 Standard Bank Group 3.3 9 12 -3
6 - Barclays 5.1 8 - -
7 13 HSBC 6.7 7 5 2
8 6 JPMorgan 2.6 7 10 -3
9 30 RBC Capital Markets 2.6 6 2 4
10 12 Rothschild 3.5 6 5 1
11 7 Bank of America Merrill Lynch 3.4 5 9 -4
12 9 Investec 0.9 5 9 -4
13 19 Jefferies & Company 1.5 5 4 1
14 - BDO 0.3 4 - -
15 15 Citigroup 3.7 4 4 0
16 26 M&A International 0.1 4 3 1
17 25 UBS Investment Bank 3.0 4 3 1
18 - Canaccord Genuity 0.6 3 - -
19 20 Lazard 4.5 3 4 -1
20 - UniCredit Group 1.3 3 - -Source: mergermarket
TOP 20 FINANCIAL ADVISERS – MIDDLE EAST & AFRICA
LEAGUE TABLES
VOLUME
VALUE

57
MIDDLE EAST &
AFRICA
Monthly M&A Insider
LEAGUE TABLES
VOLUMETOP 20 LEGAL ADVISERS – MIDDLE EAST & AFRICA
The legal adviser league tables by value and volume have been run from 01-Jan-12 to 30-Sep-12 and include lapsed and withdrawn deals. The tables cover all sectors and are based on the geography of either the target, bidder or seller being Middle East & Africa including Israel.
Ranking Q1-Q3 2012 Q1-Q3 2011
Q1-Q3 2012 Q1-Q3 2011 Company name Value (US$bn)
Deal count Deal count Deal count change
1 5 Edward Nathan Sonnenbergs 6.1 13 13 0
2 14 Allen & Overy 5.0 12 7 5
3 1 DLA Cliffe Dekker Hofmeyr 4.6 15 25 -10
4 11 Freshfields Bruckhaus Deringer 3.5 3 9 -6
5 6 Linklaters 3.5 17 12 5
6 9 Clifford Chance 3.3 1 11 -10
7 4 Herzog, Fox and Neeman 2.9 7 15 -8
8 7 Webber Wentzel 2.5 12 12 0
9 3 Bowman Gilfillan 2.5 6 17 -11
10 52 Shearman & Sterling 2.5 3 2 1
11 10 Meitar Liquornik Geva & Leshem Brandwein 2.4 3 10 -7
12 2 Werksmans 2.3 5 23 -18
13 16 Gibson Dunn & Crutcher 2.3 2 6 -4
14 19 Skadden Arps Slate Meagher & Flom 2.3 1 5 -4
15 55 Jones Day 2.2 1 2 -1
16 44 Fasken Martineau Dumoulin 2.2 5 2 3
17= 20 GKH Law Offices 2.0 1 5 -4
17= 24 Latham & Watkins 2.0 1 4 -3
17= 41 Mayer Brown 2.0 1 3 -2
20 31 Baker & McKenzie 2.0 2 3 -1Source: mergermarket
Ranking Q1-Q3 2012 Q1-Q3 2011
Q1-Q3 2012 Q1-Q3 2011 Company name Value (US$bn)
Deal count Value (US$bn)
Value change (%)
1 2 Freshfields Bruckhaus Deringer 6.1 13 13.0 -52.9%
2 1 Linklaters 5.0 12 13.2 -62.2%
3 9 Allen & Overy 4.6 15 6.3 -27.3%
4 - Dechert 3.5 3 - -
5 12 Edward Nathan Sonnenbergs 3.5 17 4.4 -20.9%
6 69 Cleary Gottlieb Steen & Hamilton 3.3 1 0.5 551.0%
7 52 Shearman & Sterling 2.9 7 0.7 300.4%
8 14 Clifford Chance 2.5 12 3.5 -29.0%
9 3 Skadden Arps Slate Meagher & Flom 2.5 6 10.1 -75.1%
10 7 Dewey & LeBoeuf 2.5 3 7.2 -65.3%
11 94 Yigal Arnon & Co 2.4 3 0.3 812.8%
12 58 Jones Day 2.3 5 0.6 286.8%
13 157 Davis Polk & Wardwell 2.3 2 - -
14 32 Sullivan & Cromwell 2.3 1 1.5 51.1%
15 - The Law Office of Bader Saud Al Bader and Partners 2.2 1 - -
16 27 Fasken Martineau Dumoulin 2.2 5 1.8 20.4%
17= - Lefosse Advogados 2.0 1 - -
17= - Mattos Filho, Veiga Filho, Marrey Jr. e Quiroga Advogados 2.0 1 - -
17= - Souza, Cescon, Barrieu & Flesch Advogados 2.0 1 - -
20= - Epstein Rosenblum Maoz 2.0 2 - -
20= - Rosenram 2.0 2 - -Source: mergermarket
TOP 20 LEGAL ADVISERS – MIDDLE EAST & AFRICA
VALUE

58
MIDDLE EAST &
AFRICA
Monthly M&A Insider
LEAGUE TABLES
VALUE
VALUE
VOLUME
VOLUMERank
Q1-Q3 2012 Company name Value (US$m)
Deal count
1 Battery Ventures 820 2
2= Giza Venture Capital 430 1
2= Jerusalem Venture Partners (JVP) 430 1
2= Lightspeed Venture Partners 430 1
5= Intel Capital 390 1
5= Pitango Venture Capital 390 1
7 Prime Natural Resources 240 1
8 StageOne Ventures 151 2
9 Carmel Ventures 141 2
10 NBK Capital 140 1
11= Bessemer Venture Partners 130 1
11= Shaked Ventures 130 1
13= Magma Venture Partners 120 1
13= Motorola Ventures 120 1
13= Plenus 120 1Source: mergermarket
Rank
Q1-Q3 2012 Company name Value (US$m)
Deal count
1= Castle Harlan 1,050 1
1= CHAMP Private Equity Pte 1,050 1
1= Lime Rock Partners 1,050 1
4 EFG Hermes 991 1
5 Access Industries 332 1
6 Abraaj Capital Holdings 127 2
7 Duet Group 118 1
8 Ethos Private Equity 109 2
9 First Israel Mezzanine Investors 100 2
10= Citi Venture Capital International 100 1
10= Levant Capital 100 1
12= Aureos Capital 55 1
12= Swedfund International 55 1
12= Tuninvest 55 1
15 Zico Capital 46 1Source: mergermarket
Rank
Q1-Q3 2012 Company name Value (US$m)
Deal count
1 Battery Ventures 820 2
2 StageOne Ventures 151 2
3 Carmel Ventures 141 2
4= Giza Venture Capital 430 1
4= Jerusalem Venture Partners (JVP) 430 1
4= Lightspeed Venture Partners 430 1
7= Intel Capital 390 1
7= Pitango Venture Capital 390 1
9 Prime Natural Resources 240 1
10 NBK Capital 140 1
11= Bessemer Venture Partners 130 1
11= Shaked Ventures 130 1
13= Magma Venture Partners 120 1
13= Motorola Ventures 120 1
13= Plenus 120 1Source: mergermarket
ACTIVITY TABLE OF PRIVATE EQUITY FIRMS ON MIDDLE EASTERN & AFRICAN BUYOUTS
ACTIVITY TABLE OF PRIVATE EQUITY FIRMS ON MIDDLE EASTERN & AFRICAN EXITS
The private equity buyout activity tables by value and volume are based on private equity firms advising the bidder on buyout deals where the dominant geography of the target company is Middle East & Africa including Israel. The tables by value and volume have been run from 01-Jan-12 to 30-Sep-12 and exclude lapsed and withdrawn deals.
The private equity exit activity tables by value and volume are based on private equity firms advising the vendor on exit deals where the dominant geography of the target company is Middle East & Africa including Israel. The tables by value and volume have been run from 01-Jan-12 to 30-Sep-12 and exclude lapsed and withdrawn deals.
Rank
Q1-Q3 2012 Company name Value (US$m)
Deal count
1 Abraaj Capital Holdings 127 2
2 Ethos Private Equity 109 2
3 First Israel Mezzanine Investors 100 2
4 Capitalworks 39 2
5 Gulf Capital 27 2
6= RMB Corvest (Pty) 21 2
6= Shalamuka Capital Proprietary 21 2
8= Castle Harlan 1,050 1
8= CHAMP Private Equity Pte 1,050 1
8= Lime Rock Partners 1,050 1
11 EFG Hermes 991 1
12 Access Industries 332 1
13 Duet Group 118 1
14= Citi Venture Capital International 100 1
14= Levant Capital 100 1Source: mergermarket

59
MIDDLE EAST &
AFRICA
Monthly M&A Insider
TREND GRAPHS
MIDDLE EASTERN & AFRICAN M&A QUARTERLY TREND
0
5,000
10,000
15,000
20,000
25,000
30,000
35,000
40,000
Q312*
Q212
Q112
Q411
Q311
Q211
Q111
Q410
Q310
Q210
Q110
Q409
Q309
Q209
Q109
Q408
Q308
Q208
Q108
Q407
Q307
Q207
Q107
Q406
Q306
Q206
Q106
Valu
e (U
S$m
)
Total value Mid-market value
Num
ber of deals
0
20
40
60
80
100
120
140
160
Total volume Mid-market volume
0
1,000
2,000
3,000
4,000
5,000
6,000
7,000
Q312*
Q212
Q112
Q411
Q311
Q211
Q111
Q410
Q310
Q210
Q110
Q409
Q309
Q209
Q109
Q408
Q308
Q208
Q108
Q407
Q307
Q207
Q107
Q406
Q306
Q206
Q106
Buyout value Exit value Buyout volume Exit volume
Num
ber of dealsValu
e (U
S$m
)
0
5
10
15
20
25
MIDDLE EASTERN & AFRICAN M&A ANNUAL TREND
MIDDLE EASTERN & AFRICAN M&A ANNUAL PRIVATE EQUITY TREND
0
10
20
30
40
50
60
70
80
90
100
YTD 2012*201120102009200820072006
Total value Mid-market value
Valu
e (U
S$bn
)
Num
ber of deals
0
50
100
150
200
250
300
350
400
450
500
Total volume Mid-market volume
0
2
4
6
8
10
12
14
YTD 2012*201120102009200820072006
Buyout value Exit value Buyout volume Exit volume
Valu
e (U
S$bn
)
0
10
20
30
40
50
60
70
Num
ber of deals
MIDDLE EASTERN & AFRICAN M&A QUARTERLY PRIVATE EQUITY TREND
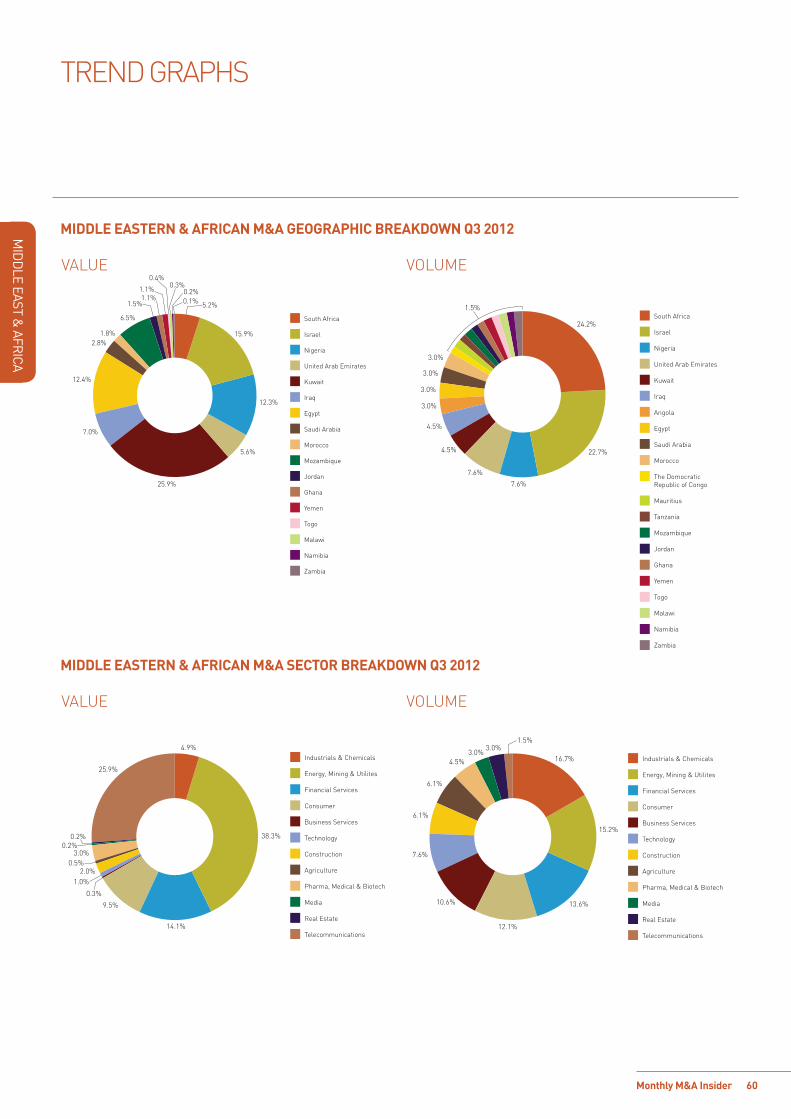
60
MIDDLE EAST &
AFRICA
Monthly M&A Insider
TREND GRAPHS
MIDDLE EASTERN & AFRICAN M&A GEOGRAPHIC BREAKDOWN Q3 2012
MIDDLE EASTERN & AFRICAN M&A SECTOR BREAKDOWN Q3 2012
VALUE
VALUE
VOLUME
VOLUME
2.0%0.5%
3.0%0.2%
25.9%
0.2%
4.9%
38.3%
14.1%
9.5%
0.3%
1.0%
Industrials & Chemicals
Energy, Mining & Utilites
Financial Services
Consumer
Business Services
Technology
Construction
Agriculture
Pharma, Medical & Biotech
Media
Real Estate
Telecommunications
4.5%
24.2%
22.7%
3.0%
3.0%
3.0%
3.0%
1.5%
7.6%7.6%
4.5%
South Africa
Israel
Nigeria
United Arab Emirates
Kuwait
Iraq
Angola
Egypt
Saudi Arabia
Morocco
The DomocraticRepublic of Congo
Mauritius
Tanzania
Mozambique
Jordan
Ghana
Yemen
Togo
Malawi
Namibia
Zambia
16.7%
13.6%
15.2%
12.1%
10.6%
6.1%
7.6%
6.1%
4.5%3.0%
3.0%1.5%
Industrials & Chemicals
Energy, Mining & Utilites
Financial Services
Consumer
Business Services
Technology
Construction
Agriculture
Pharma, Medical & Biotech
Media
Real Estate
Telecommunications
5.2%
12.3%
15.9%
5.6%
25.9%
7.0%
12.4%
2.8%1.8%
6.5%
1.5%1.1%
1.1%
0.4%0.3%
0.2%0.1%
South Africa
Israel
Nigeria
United Arab Emirates
Kuwait
Iraq
Egypt
Saudi Arabia
Morocco
Mozambique
Jordan
Ghana
Yemen
Togo
Malawi
Namibia
Zambia

61
MIDDLE EAST &
AFRICA
Monthly M&A Insider
TREND GRAPHS
MIDDLE EASTERN & AFRICAN M&A DEAL SIZE BREAKDOWN
VALUE VOLUME
0
10
20
30
40
50
60
70
80
90
100
2012*201120102009200820072006
12.7%
12.7%
65.6%
13.2%
11.3%
67.0%
18.0%
19.0%
47.6%
19.2%
13.2%
53.2%
68.0%
12.6%
9.5%
17.1%
7.8% 7.5%13.7% 12.9%
8.9%
14.8%
9.1%
57.5%
14.5%
16.0%
9.5%
58.9%
1.1% 0.9% 1.7% 1.5% 1.0% 1.4% 1.1%
<US$14.9m or undisclosed value
US$15m-US$100m
US$101m-US$250m
US$251m-US$500m
>US$501m
Perc
enta
ge
0
10
20
30
40
50
60
70
80
90
100
2012*201120102009200820072006
33.9%
14.5%
6.2%
9.1%
32.5%
15.4%
5.6%
7.2%
36.3%
11.3%
5.7%3.8%
32.6%
13.1%
4.0%3.4% 6.0%
5.7%
33.7%
10.2%
16.8%
8.6%
36.3% 39.3% 42.9%47.0% 44.4%
23.7%
40.5%
10.3%
12.5%
5.2%
47.0%
28.9%
6.5%
<US$14.9m or undisclosed value
US$15m-US$100m
US$101m-US$250m
US$251m-US$500m
>US$501m
Perc
enta
ge
SECTOR ANALYSISMIDDLE EASTERN & AFRICAN SECTOR ANALYSISSector Q3 2012 Q3 2011 % change
Value ($m) Mrk share Deal count Value ($m) Mrk share Deal count Value Volume
Energy, Mining & Utilities 3,259 38.3% 10 5,182 45.5% 13 -37% -23%
Telecommunications 2,205 25.9% 1 280 2.5% 2 688% -50%
Financial Services 1,201 14.1% 9 1,556 13.7% 13 -23% -31%
Consumer 811 9.5% 8 1,967 17.3% 15 -59% -47%
Industrials & Chemicals 413 4.9% 11 1,006 8.8% 18 -59% -39%
Pharma, Medical & Biotech 258 3.0% 3 14 0.1% 2 1,743% 50%
Construction 170 2.0% 4 24 0.2% 3 608% 33%
Technology 82 1.0% 5 763 6.7% 7 -89% -29%
Agriculture 42 0.5% 4 - - - -
Business Services 29 0.3% 7 184 1.6% 4 -84% 75%
Media 19 0.2% 2 - - - -
Real Estate 18 0.2% 2 - - - -
Leisure 0 0.0% 0 5 0.0% 2 -100% -100%
Transportation 0 0.0% 0 402 3.5% 3 -100% -100%
Defence 0 0.0% 0 - - - -
Total 8,507 66 11,383 82 -25% -20%

Monthly M&A Insider 62
ABOUT M
ERRILL CORPORATION
ABOUT MERRILL CORPORATION
Merrill Transaction and Compliance Services Through a broad range of tools and services, Merrill Corporation streamlines document composition, filing, printing, distribution and electronic access to the transaction and regulatory compliance activities of its clients engaged in securities offerings, reorganisations, mergers and acquisitions, SEC and other regulatory filings. As a registered, third-party service provider offering public companies expert EDGARization and XBRL filing services, Merrill professionals can compose, edit, electronically file, manage and distribute data in printed or electronic format.
Merrill Legal Solutions provide both on-demand and on-site litigation support, information management and electronic and print document management services for law firms, corporate legal departments and professional services firms.
Examples of our expertise include the creation of searchable litigation document repositories, management of electronic data discovery and the delivery of real-time court reporting and deposition videography services.
Merrill’s Marketing and Communication Solutions supply brand identity management, customer communication and packaged direct marketing programmes for sales professionals in industries such as real estate, mutual funds and insurance. Examples of our services include customisable corporate identity materials, direct-mail marketing pieces and promotional programs supported by web-based technologies.
Merrill’s Translations Services provide a range of translation options to help clients achieve the most efficient and cost effective approach to their translation projects. Merrill Brink offers extensive legal translation services for international litigation, intellectual property, patents, contractual matters, antitrust matters, mergers and acquisitions, arbitration and more.
www.datasite.com
About Merrill DataSiteRevolutionising the due diligence process
Merrill DataSite is designed for rapid deployment and can be up and running within two hours of a client’s need. Our team can scan, upload and organise thousands of pages of content from any source in 24 hours or less. Every aspect of the process, from document scanning to VDR hosting and project management is delivered by Merrill’s multilingual team, available around the clock worldwide.
With Merrill DataSite, all documents are captured and indexed to an online database and because all rights are designated by the client, security and control are guaranteed. Each user’s ability to view, print or access source documents is set up by the client administrator and can be changed at any time. Merrill DataSite provides useful tools, including full search, viewer audit capability, Q&A, bulk uploads and detailed user activity tracking that help clients maintain tighter control and have greater insight into reviewer behaviour.
Merrill DataSite enhances transaction success
Merrill DataSite is the industry’s acknowledged leader. More than 61,000 different private and public companies across the globe have leveraged Merrill DataSite to increase the value of the following types of transactions:
• Mergers, acquisitions and divestitures
• Private placement transactions
• Leveraged buyout transactions
• Bankruptcy and reorganisation transactions
• Financial restructuring transactions
• Initial public offerings and dual-track processes
• Asset purchases and liquidations
• Post-merger integration
FOUNDED IN 1968 AND HEADQUARTERED IN ST. PAUL, MINNESOTA, MERRILL CORPORATION IS A LEADING PROVIDER OF OUTSOURCED SOLUTIONS FOR COMPLEX BUSINESS COMMUNICATION AND INFORMATION MANAGEMENT. MERRILL’S SERVICES INCLUDE DOCUMENT AND DATA MANAGEMENT, LITIGATION SUPPORT, LANGUAGE TRANSLATION SERVICES, FULFILLMENT, IMAGING AND PRINTING. MERRILL SERVES THE CORPORATE, LEGAL, FINANCIAL SERVICES, INSURANCE AND REAL ESTATE MARKETS. WITH MORE THAN 5,000 PEOPLE IN OVER 40 DOMESTIC AND 22 INTERNATIONAL LOCATIONS, MERRILL EMPOWERS THE COMMUNICATIONS OF THE WORLD’S LEADING ORGANISATIONS.

63Monthly M&A Insider
ABOUT MERRILL DATASITE
Merrill DataSite – built with the client in mindMerrill DataSite was created to meet its clients’ needs and built to their specifications. Since 2002 we have consistently leveraged the experiences of our clients to add leading-edge functionality to the available toolset. Merrill DataSite allows its users and administrators to:
Examine documents immediately. Patented technology ensures you never have to wait for a document to be downloaded. Because the data resides on Merrill’s servers, you can simultaneously view an unlimited number of documents in multiple windows without having to close out or save to your “temp” file. When faced with hundreds of documents to review, this feature saves significant time and expense.
Designate user permissions. Team administrators can control which users will be able to view, print or download specific documents, folders or projects – simply and quickly.
Search every word in every document. With large document collections, sophisticated search features are key to finding critical information and accelerating the due diligence process. Merrill DataSite performs Optical Character Recognition (OCR) on each and every letter in each and every document. Our search capabilities allow users to search tens – if not hundreds – of thousands of pages to find what’s relevant to them. Merrill DataSite’s search capabilities ensure nothing is missed in any of the posted documents - regardless of where they may be organised within the index (e.g. find every instance of “contract” and “termination” within 5 words of each other, etc.). Search results are returned much faster and are unlimited in terms of document results and hits within a document.
Using wildcard, fuzzy, proximity, boosting, Boolean and grouping modifiers, you can search and find exact matches and near-matches, including misspelled words. Potential buyers will enjoy increased confidence knowing they’ve received and seen all materials and documents that are relevant to their decision-making.
Protect confidential information. ”View-only” documents are never downloaded. Merrill DataSite, not the computer’s browser, controls the caching process providing unmatched security levels. Unlike other VDR providers, images are never viewable on the PC’s cache after the conclusion of a session.
Track all activity accurately. Auditing and reporting tools provide a verifiable account of each individual’s time spent viewing both documents and specific pages – information that adds negotiating leverage.
Need to work remotely?No problem. Whether you’re working in Beijing or New York, you can view your documents online without having to navigate through internal firewalls and email restrictions that often exist for outside company connections and which delay the due diligence process.
Security is our highest priorityMerrill has been a trusted provider of secure information to the financial and legal industries for more than 40 years. Our employees execute letters of confidentiality and we are audited annually (internal and third-party) to make certain our IT infrastructure and processes remain sound.
Merrill DataSite was the first virtual data room to receive the ISO 27001 certification for its comprehensive Information Security Management System (ISMS).
The ISO 27001 standard, developed by the International Organisation for Standards to establish international requirements for information security and certification of ISMS, is designed to ensure effective protection of information assets in foreign markets, as well as across national and regional boundaries.
The best tool in the industryMerrill DataSite technology allows for the fastest conversion of soft and hard copy documents to the electronic viewing platform. As a result, designated administrators are able to review documents the moment they are available.
Through secure, simultaneous access, full text search capabilities and robust reporting tools, both archival and transactional due diligence processes are streamlined. As a result, Merrill DataSite gives you more insight and control, and dramatically reduces transaction time and costs.
As a leading provider of VDR solutions worldwide, Merrill DataSite has empowered nearly two million unique visitors to perform electronic due diligence on thousands of transactions totalling trillions of dollars in asset value.
NOW SMARTER, FASTER, EASIER!
PLEASE VISIT OUR WEBSITE: WWW.DATASITE.COM
ABOUT M
ERRILL DATASITE

Monthly M&A Insider 64
ABOUT MERRILL CORPORATION
ABOUT M
ERRILL CORPORATION
EXECUTIVE MANAGEMENT
Ed BifulkPresidentTel: +1 212 229 6563
Paul HartzellSenior Vice PresidentTel: +1 212 367 5950
EXECUTIVE SALES
Chris BeckmannRegional Director, Germany, Switzerland & Poland Tel: +49 69 25617 110
Manuel BianchiRegional Director, EuropeTel: +44 (0)207 422 6271
Will BrownRegional Director, Life SciencesTel: +33 1 40 06 13 02
Francesco CaracutaRegional Director, EuropeTel: +44 (0)207 422 6270
Hakema El-HadadRegional Director, France &Northern AfricaTel: +33 (0) 1 40 06 13 10
Alex GrossRegional Director, Eastern Europe & Middle EastTel: +49 69 7593 7148
Mike Hinchliffe Regional Director, EuropeTel: +44 (0)207 422 6256
Jonathan HughesAccount Manager, EuropeTel: +44 (0)207 422 6267
Shashank JainAccount Manager, United Arab EmiratesTel: +971 (0)50 252 3025
Alvaro OrtegaRegional Director, Southern EuropeTel: +34 610 909 353
Adam PangAccount Manager, EuropeTel: +44 20 7422 6268
Merlin J. Piscitelli Regional Director, EuropeTel: +44 (0)207 422 6266
Jérôme PottierRegional Director, FranceTel: +33 (0) 1 40 06 13 12
Colin Schopbach Regional Director, EuropeTel: +44 (0)207 422 6221
Anna ScottRegional Director, U. K.Tel: +44 (0)207 422 6263Mark FinnieRegional Director, North AsiaTel: +852 2536 2534
Ari LeeRegional Director, North AsiaTel: +852 9855 3758
Vincent LorkRegional Director, South East AsiaTel: +65 6248 4602
Chris RobilliardRegional Director, Australia & New ZealandTel: +612 8667 3064
Manuel BentosinosRegional Director, Mexico, Columbia & CaribbeanTel: +52 55 9171 2237
Ana Paula Macêd Távora de CastroRegional Director, South AmericaTel: +55 11 9908 0858
Luis Felipe Salles CunhaRegional Director, BrazilTel: +55 11 3568 2429
Carlos NogueiraRegional Director, BrazilTel: +55 11-3895-8572
Brian GilbreathVice President, Midwest & Latin AmericaTel: +1 404 934 8085
Hank GregorySVP, Western Canada & Pacific NorthwestTel: + 604 603 4360
Ryan MacMillanRegional Director, CanadaTel: +1 416 214 2448
Jason HedgesRegional Director, CanadaTel: +1 416-878-3260
Michael KennedyRegional Director, New EnglandTel: +1 207 829 4369
Ross WhittakerRegional Director, New EnglandTel: +1 617.535.1516
Jon LenihanRegional Director, BostonTel: +1 617-535-1618
Scott RedikerRegional Director, Mid AtlanticTel: +1 443-690-3122
Forrest R. DoaneRegional Director, New YorkTel: +1 212 229 6620
Adam KuritzkyRegional Director, New YorkTel: +1 917 232 9569
John McElroneRegional Director, New YorkTel: +1 212 229 6656
Matthew MezzancelloRegional Director, NY, NJ & PATel: +1 212 229 6618
Steve PicconeVice President, New YorkTel: +1 212 229 6883
BJ BirtzRegional Director, RaleighTel: +1 919 996 9117
Paul KleinkaufRegional Director, SoutheastTel: +1 404 602 3251
Michail SidorovRegional Director, Ohio & MichiganTel: +1 216 333 1274
Jessie SainiRegional Director, MidwestTel: +1 312-386-2293
Scott HaugenRegional Director, Minnesota & WisconsinTel: +1 651 632 4375
Anthony CrosbyRegional Director, ChicagoTel: +1 312 674 6511
Mark PlaehnRegional Director, ChicagoTel: +1 312 674 6527
Kelly-Leigh KeefeRegional Director, ChicagoTel: +1 312 386 2229
Nicholas RenterRegional Director, TexasTel: +1 214 754 2100
Bryan BrightonRegional Director, AustinTel: +1 512 551 2986
Andrew BuonincontroRegional Director, Bay AreaTel: +1 650 493 1400
Erik SandieRegional Director, Bay AreaTel: +1 650 493 1400
Jay LoyolaRegional Director, Bay AreaTel: +1 949 622 0663
Shelle MartinRegional Director, Bay AreaTel: +1 415 357 4355
Dan PhelanRegional Director, Los AngelesTel: +1 213 253 2139
Hans SchumannRegional Director, San DiegoTel: +1 760 635 0830
David YearyVice President, DataSite Life SciencesTel: +1 415 307 4414
James SnazaDirector of Life SciencesTel: +1 651 632 4585
Jon BlueVice President, Clean TechTel: +1 206 696 9169
www.mergermarket.comRemark, Part of The Mergermarket Group
80 StrandLondon, WC2R 0RLUnited Kingdom
t: +44 (0)20 7059 6100f: +44 (0)20 7059 [email protected]
11 West 19th Street, 2nd fl.New York, NY 10011USA
t: +1 212 686-5606f: +1 212 [email protected]
Suite 2401-3Grand Millennium Plaza181 Queen’s Road, CentralHong Kong
t: +852 2158 9700f: +852 2158 [email protected]
Disclaimer
This publication contains general information and is not intended to be comprehensive nor to provide financial, investment, legal, tax or other professional advice or services. This publication is not a substitute for such professional advice or services, and it should not be acted on or relied upon or used as a basis for any investment or other decision or action that may affect you or your business. Before taking any such decision you should consult a suitably qualified professional adviser. Whilst reasonable effort has been made to ensure the accuracy of the information contained in this publication, this cannot be guaranteed and neither Mergermarket nor any of its subsidiaries nor any affiliate thereof or other related entity shall have any liability to any person or entity which relies on the information contained in this publication, including incidental or consequential damages arising from errors or omissions. Any such reliance is solely at the user’s risk.
Remark, the events and publications arm of The Mergermarket Group, offers a range of publishing, research and events services that enable clients to enhance their own profile, and to develop new business opportunities with their target audience.
The following notes pertain to data contained in this publication:
• Deals are included where the deal value is greater than or equal to ¤5m.
• Where no deal value has been disclosed, deals are included if the turnover of the target is greater than or equal to ¤10m.
• Deals are included in the graphs and Top Deals in each section based on the dominant geography and dominant sector of the target company. Data underlying the League Tables are based on deals where the bidder, target or parent geography of either is that of the geography in focus.
• Q3 2012 refers to the period 01-Jul-12 to 30-Sep-12. Q1-Q3 2012 refers to the period 01-Jan-12 to 30-Sep-12. *YTD 2012 refers to the period 01-Jan-12 to 30-Sep-12.