Internal arsenite bioassay calibration using multiple bioreporter cell lines
10
PDFlib PLOP: PDF Linearization, Optimization, Protection Page inserted by evaluation version www.pdflib.com – [email protected]
Transcript of Internal arsenite bioassay calibration using multiple bioreporter cell lines

PDFlib PLOP: PDF Linearization, Optimization, Protection
Page inserted by evaluation versionwww.pdflib.com – [email protected]
Internal arsenite bioassay calibration using multiplebioreporter cell lines
Anke Wackwitz,1* Hauke Harms,1
Antonis Chatzinotas,1 Uta Breuer,1 Christelle Vogne,2
and Jan Roelof van der Meer2
1UFZ, Helmholtz Centre for Environmental Research,Department of Environmental Microbiology, 04318Leipzig, Germany.2Department of Fundamental Microbiology, University ofLausanne, 1015 Lausanne, Switzerland.
Summary
Bioassays with bioreporter bacteria are usually cali-brated with analyte solutions of known concentra-tions that are analysed along with the samples ofinterest. This is done as bioreporter output (the inten-sity of light, fluorescence or colour) does not onlydepend on the target concentration, but also on theincubation time and physiological activity of the cellsin the assay. Comparing the bioreporter output withstandardized colour tables in the field seems ratherdifficult and error-prone. A new approach to controlassay variations and improve application ease couldbe an internal calibration based on the use of multi-ple bioreporter cell lines with drastically differentreporter protein outputs at a given analyte concentra-tion. To test this concept, different Escherichiacoli-based bioreporter strains expressing eithercytochrome c peroxidase (CCP, or CCP mutants) orb-galactosidase upon induction with arsenite wereconstructed. The reporter strains differed either in thecatalytic activity of the reporter protein (for CCP)or in the rates of reporter protein synthesis (forb-galactosidase), which, indeed, resulted in outputsignals with different intensities at the same arseniteconcentration. Hence, it was possible to use combi-nations of these cell lines to define arsenite concen-tration ranges at which none, one or more cell linesgave qualitative (yes/no) visible signals that wererelatively independent of incubation time or bio-reporter activity. The discriminated concentrationranges would fit very well with the current permissive
(e.g. World Health Organization) levels of arsenite indrinking water (10 mg l-1).
Introduction
In the recent years, new tools for environmental monitor-ing have been developed on the basis of so-called biore-porter organisms. Bioreporters are often microbial strainswhich are genetically modified to produce easily detect-able output in response to the presence of specific ana-lytes. Several reviews have been dedicated to this rapidlydeveloping field, exposing details of genetic construc-tions, type of reporters or analyte detection (Daunertet al., 2000; Leveau and Lindow, 2002; Belkin, 2003; vander Meer et al., 2004; Harms et al., 2006). The detectionsystem of bioreporter microorganisms is in most casescomposed of a simple genetic circuitry, comprising a regu-latory system (i.e. regulatory gene plus its cognate pro-moter) and one or more reporter genes. Commonly usedreporter proteins are the chromogenic b-galactosidase(lacZ) or b-glucuronidase (gusA), luminescent luciferases(luc or luxAB) or autofluorescent proteins (GFP and vari-ants) (Ivask et al., 2002; Paitan et al., 2004; Werlen et al.,2004; DeAngelis et al., 2005).
For quantitative measurements, bioreporter assaysneed to be calibrated with analyte solutions of knownconcentrations, which are typically analysed along withthe samples of interest (Hakkila et al., 2004; Harms et al.,2005). The reason for this is that the bioreporter output(colour, luminescence or fluorescence) does not onlydepend on analyte concentration, but also on assay incu-bation time and the numbers and physiological activitiesof the cells in the assay (Jansson, 2003; Stocker et al.,2003; van der Meer et al., 2004; Wells et al., 2005). Thelatter two variables are very difficult to control, in particularwhen dried or immobilized cells are used (Bjerketorpet al., 2006). Simple applications like bioreporter field testkits or paper test strips are hampered by the difficulty tocompare the resulting colour signals with standardizedcolour tables. Therefore, a robust and reliable system forinternal calibration would be highly desirable.
The problem of variable incubation time and uncertaincellular activity could be overcome by the simultaneoususe of multiple bioreporter cell constructs, each givingqualitative information about the presence or absence ofanalyte in a certain concentration range. Bioreporters
Received 28 August, 2007; accepted 13 October, 2007. *For corre-spondence. E-mail [email protected]; Tel. (+49) 341 235 1374;Fax (+49) 341 235 2247.
Microbial Biotechnology (2008) 1(2), 149–157 doi:10.1111/j.1751-7915.2007.00011.x
© 2007 The AuthorsJournal compilation © 2007 Society for Applied Microbiology and Blackwell Publishing Ltd

could be designed and combined in such a way that notthe actual individual output but the combination of react-ing cell lines indicates the analyte concentration range inunknown samples without the need to measure exactrates or endpoints of colour formation by individual biore-porters (Fig. 1). Although this method would not reportexact concentrations, the identification of concentrationranges should be sufficient for many applications, where,for instance, only a distinction of concentrations belowand above a predefined permissible level is desired. If incombination with a chromogenic reporter protein thiswould allow signal interpretation by eye without instru-mentation. In the case of arsenic in potable water, adistinction between concentrations below and above theWorld Health Organization (WHO) drinking water stan-dard of 10 mg l-1 or the local standard of 50 mg l-1 in themost arsenic-threatened countries of South-East Asiawould be most desirable.
To test this concept, we used two reporter genes toredesign bioreporter bacteria that had previously beendeveloped for the detection of arsenite in drinking water,exploiting the ArsR sensor transcriptional repressor of thenatural arsenic resistance of Escherichia coli (Stockeret al., 2003). In the presence of arsenite, ArsR loses affin-ity for its binding site on the DNA the result of which isdepression of the arsR promoter. Equally effective inderepressing the arsR promoter via ArsR is antimonite. In
cells that carry the arsenate reductase ArsC, arsenate(at 25% efficiency) and trimethylarsine oxide (at 10% effi-ciency) will also lead to derepression (Baumann and vander Meer, 2007). In one series of cell lines, the arsRpromoter was combined with lacZ for b-galactosidase.b-Galactosidase has many advantages and variouschromo- and fluorogenic substrates exist to assay LacZactivity (Daunert et al., 2000; Lei et al., 2006). In a secondseries of cell lines we applied the ccp gene. Its product,the cytochrome c peroxidase (CCP), has not frequentlybeen utilized in whole-cell bioreporter bacteria so far, buta large variety of ccp mutants have been developed whichdisplay different catalytic activity for one of its substratesguaiacol (Iffland et al., 2000). The signal outputs of bothreporters were thus varied in different ways: for LacZbioreporters we modified the intervening sequencebetween arsR and lacZ in order to modulate lacZ expres-sion. For ccp we maintained the same reporter synthesisrate, but hypothesized that because of different catalyticactivity of the reporters we would get variable output of thecells at the same arsenite concentration. Our researchquestions therefore were (i) if both types of reporter con-structions would result in different levels of reaction sen-sitivity to arsenite and (ii) if combinations of such reportercell lines with variable signal outputs would be suitable toinfer arsenite concentration ranges without external cali-bration and at the required drinking water standards.
Results
b-Galactosidase-based bioreporter assay
Bioassays were performed in 96-well plates to allow spec-trophotometrical measurements (Fig. 2) as well as visualsignal detection by digital imaging (Fig. 3). For each biore-porter strain the bioassay was performed in triplicate with15 different arsenite concentrations ranging from 0.2 to100 mg l-1. Strain 2245 was very sensitive and producedvisible colour from the lowest arsenite concentration(0.2 mg l-1) with a linear signal increase up to 6 mg l-1 and aplateau above 10 mg l-1 (Figs 2 and 3). Colour develop-ment by strain 1595 began at approximately 10 mg l-1
Fig. 1. Principle of the internal calibration approach. (A)–(D)represent bioreporter cell lines differing in their sensitivity toarsenite.
Fig. 2. Colour development after 480 min byfour bioreporter strains expressing LacZmeasured as absorbance at 595 nm. Datapoints represent the average of threereplicates.
As [µg l–1]20 40 60 800 2 4 6
ab
so
rba
nc
e 595 n
m
0.00
0.05
0.20
strain 1580strain 1595strain 2245strain 2066
150 A. Wackwitz et al.
© 2007 The AuthorsJournal compilation © 2007 Society for Applied Microbiology and Blackwell Publishing Ltd, Microbial Biotechnology, 1, 149–157

arsenite and linearly increased at higher concentrations.Both strains had a relatively low background activity in theabsence of arsenite. In contrast, strain 1580 was charac-terized by a high background and little further signalincrease towards higher concentrations. Strain 2066 wasthe least sensitive and gave visible signals only at very highconcentrations (around 50 mg l-1). Visual signal differentia-tion for neighbouring concentrations was difficult with allstrains. The combination of qualitative (yes/no) signals ofall four strains appeared suitable for the definition of threearsenite concentration ranges: < 6 mg l-1, 10–50 mg l-1 and> 50 mg l-1 (Table 1A). The quality of the responses (visiblecolour or not) was independent of incubation time in awindow between 4 and 8 h after induction. During that timeframe the colours gained intensity but the pattern of thesignals stayed the same. Signal distribution was also inde-pendent of cell density for final cell culture turbidity in theassays of OD600 of between 0.1 and 1.0 (data not shown).
CCP-based bioreporter assay
In this case, the assays were carried out with coloniesexposed to arsenite on agar plates and transferred to
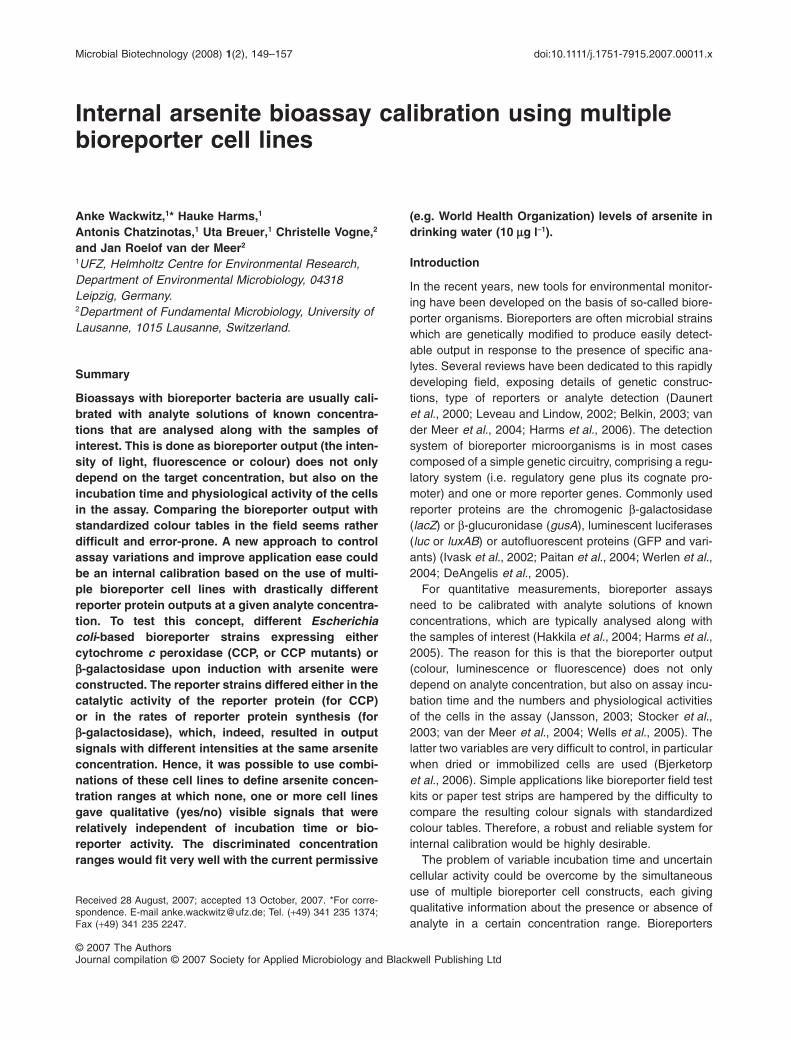
paper in order to obtain optimal visual signal interpreta-tion. For each strain the bioassay was performed infour replicates with 10 different arsenite concentrationsranging from 1 mg l-1 to 5 mg l-1. The bioreporter strains1971, 1981 and 1982 displayed relatively similarresponses and produced clearly visible, concentration-dependent signals between 4 and 30 mg l-1 followed by aplateau (Fig. 4). For the strains 1971 and 1982 a furthersignal increase could be detected after incubation with1000 mg l-1. The background activity in the absence ofarsenite was high enough to result in visible spots. Strain2031 showed no background activity without arsenite,while colour production was clearly visible at 4 mg l-1 andincreased strongly until 20 mg l-1. Strains 2332 and2340 did not respond to low arsenite concentrations(1–10 mg l-1) and produced slightly increasing signalsbetween 20 mg l-1 and 5 mg l-1 arsenite. The combinationof the qualitative signals of these strains appeared toenable the distinction of arsenite-free controls fromthe concentrations ranges 1–10 mg l-1 and > 20 mg l-1
(Table 1B). Similar results were obtained with either twiceas many cells per spot or shorter (2 h) and longer incu-bation (16 h) (data not shown).
Fig. 3. Colour development from X-gal byfour LacZ-based bioreporter strains asresponse to different arsenite concentrations.A. Wide concentration range overview ofassay carried out in 96-well plates. The digitalimage was taken after 8 h, whereas colourdevelopment proceeded for 22 h.B. Colour detail in assays performed in24-well plates. Image taken after 4 hincubation time at 30°C.
Table 1. Arsenite concentration ranges distinguished with combinations of LacZ strains (A) and CCP strains (B).
A Concentration range (mg l-1) 1580 1595 2245 2066
< 6 x x10–50 x x x> 50 x x x x
B Concentration range (mg l-1) 1971 1981 1982 2031 2332 2340
0 x x x1–10 x x x x> 20 x x x x x x
Strains that give a signal in the respective concentration range are marked with x.
Bioassay calibration with multiple cell lines 151
© 2007 The AuthorsJournal compilation © 2007 Society for Applied Microbiology and Blackwell Publishing Ltd, Microbial Biotechnology, 1, 149–157
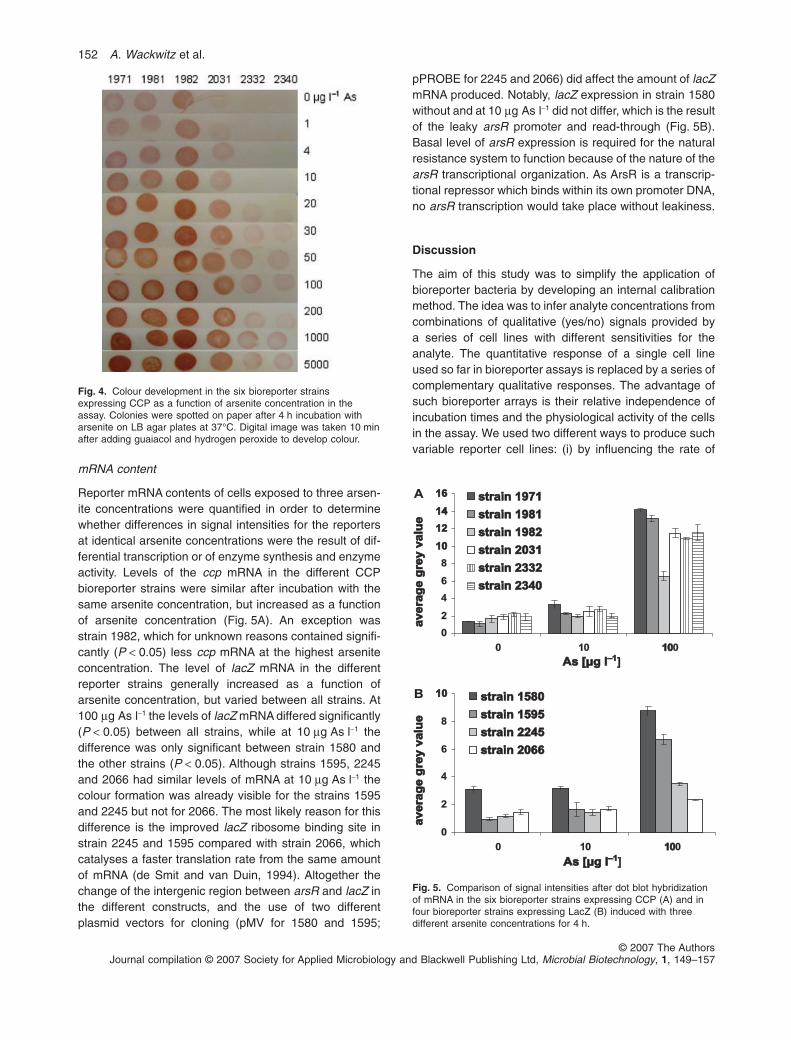
mRNA content
Reporter mRNA contents of cells exposed to three arsen-ite concentrations were quantified in order to determinewhether differences in signal intensities for the reportersat identical arsenite concentrations were the result of dif-ferential transcription or of enzyme synthesis and enzymeactivity. Levels of the ccp mRNA in the different CCPbioreporter strains were similar after incubation with thesame arsenite concentration, but increased as a functionof arsenite concentration (Fig. 5A). An exception wasstrain 1982, which for unknown reasons contained signifi-cantly (P < 0.05) less ccp mRNA at the highest arseniteconcentration. The level of lacZ mRNA in the differentreporter strains generally increased as a function ofarsenite concentration, but varied between all strains. At100 mg As l-1 the levels of lacZ mRNA differed significantly(P < 0.05) between all strains, while at 10 mg As l-1 thedifference was only significant between strain 1580 andthe other strains (P < 0.05). Although strains 1595, 2245and 2066 had similar levels of mRNA at 10 mg As l-1 thecolour formation was already visible for the strains 1595and 2245 but not for 2066. The most likely reason for thisdifference is the improved lacZ ribosome binding site instrain 2245 and 1595 compared with strain 2066, whichcatalyses a faster translation rate from the same amountof mRNA (de Smit and van Duin, 1994). Altogether thechange of the intergenic region between arsR and lacZ inthe different constructs, and the use of two differentplasmid vectors for cloning (pMV for 1580 and 1595;
pPROBE for 2245 and 2066) did affect the amount of lacZmRNA produced. Notably, lacZ expression in strain 1580without and at 10 mg As l-1 did not differ, which is the resultof the leaky arsR promoter and read-through (Fig. 5B).Basal level of arsR expression is required for the naturalresistance system to function because of the nature of thearsR transcriptional organization. As ArsR is a transcrip-tional repressor which binds within its own promoter DNA,no arsR transcription would take place without leakiness.
Discussion
The aim of this study was to simplify the application ofbioreporter bacteria by developing an internal calibrationmethod. The idea was to infer analyte concentrations fromcombinations of qualitative (yes/no) signals provided bya series of cell lines with different sensitivities for theanalyte. The quantitative response of a single cell lineused so far in bioreporter assays is replaced by a series ofcomplementary qualitative responses. The advantage ofsuch bioreporter arrays is their relative independence ofincubation times and the physiological activity of the cellsin the assay. We used two different ways to produce suchvariable reporter cell lines: (i) by influencing the rate of
Fig. 4. Colour development in the six bioreporter strainsexpressing CCP as a function of arsenite concentration in theassay. Colonies were spotted on paper after 4 h incubation witharsenite on LB agar plates at 37°C. Digital image was taken 10 minafter adding guaiacol and hydrogen peroxide to develop colour.
A
0
2
4
6
8
1010
1212
1414
1616
0 10 10100
As [µg lAs [µg l–1–1]
av
era
ge
gre
y v
alu
ea
vera
ge
gre
y v
alu
e
strain 1971strain 1971
strain 1981strain 1981
strain 1982strain 1982
strain 2031strain 2031
strain 2332strain 2332
strain 2340strain 2340
B
0
2
4
6
8
1010
0 10 10100
As [µg lAs [µg l–1–1]
av
era
ge
gre
y v
alu
ea
vera
ge
gre
y v
alu
e
strain 1580strain 1580
strain 1595strain 1595
strain 2245strain 2245
strain 2066strain 2066
Fig. 5. Comparison of signal intensities after dot blot hybridizationof mRNA in the six bioreporter strains expressing CCP (A) and infour bioreporter strains expressing LacZ (B) induced with threedifferent arsenite concentrations for 4 h.
152 A. Wackwitz et al.
© 2007 The AuthorsJournal compilation © 2007 Society for Applied Microbiology and Blackwell Publishing Ltd, Microbial Biotechnology, 1, 149–157

reporter enzyme synthesis (LacZ) or (ii) by influencing thereporter enzyme specific activity (for CCP). Various otherways of obtaining similar effects can be imagined, forinstance, by using different stabilities of reporter proteins(Andersen et al., 1998). We focused on an arsenite-detecting bioreporter, for which a simple qualitative assaycould be useful in field campaigns notably in South-EastAsia (Smith et al., 2000; British Geological Survey, 2001).Several studies have shown that bioreporter strainsbased on ArsR and the arsR promoter react equally wellto antimonite and arsenite (Ramanathan et al., 1997;Scott et al., 1997; Tauriainen et al., 1999). Even wol-framite will be able to derepress the system although at a1000-fold higher concentration than arsenite. However,we believe that cross-reaction with antimonite is ratherunlikely in groundwater samples, because most arsenite-contaminated samples contain only negligible concentra-tions of antimonite (Trang et al., 2005). On the other hand,the bioreporter may be of equal use for the detection ofantimonite where it prevails as antimonite is a suspectedcarcinogen. The presence of phosphate and nitrate in theanalyte has not significantly affected the assays asreported by Ramanathan and colleagues (1997), Scottand colleagues (1997) and Harms and colleagues (2005).
LacZ bioreporters
Arsenite measurements have been performed before withLacZ bioreporters under control of the ArsR promoterusing classical spectrophotometrical, chemiluminescenceand electrochemical detection (Scott et al., 1997;Ramanathan et al., 1998), or by chromogenic visualizationusing X-gal (Stocker et al., 2003). We previously showedthat leaky expression from the arsR promoter must bereduced to obtain gradually intensifying blue colour forma-tion from X-gal as a function of arsenite concentration.This was accomplished by placing a second ArsR DNAbinding site downstream of arsR (Stocker et al., 2003).Upon long incubation times, however, cells with this biore-porter construct (i.e. strain 1595) will intensify their bluecolour at all arsenite concentrations, reducing the visibilityof a good colour scale. We therefore produced one variantof strain 1595 in which the background is further reduced(strain 2066) by altering the ribosome binding site in frontof lacZ (Fig. S1). Indeed, production of LacZ activity instrain 2066 is very low compared with the others, whichwas useful for the concept of the multi-strain assay,because the 2066 bioreporter only produces visible bluecolour from X-gal at arsenite concentrations above50 mg l-1. At the engineered unique restriction sites in frontof lacZ we then replaced fragments of various lengthoriginating from the wild-type lacZ promoter in E. coli, oneof which (construct in strain 2245, Fig. S1) appeared to besuitable for the arsenite concentration range below
5 mg l-1. Interestingly, strain 2245 reacted with visibly dif-ferent blue colour formation from X-gal already at 0.2 mg l-1
arsenite, compared with the negative control. Thus, theresponses of strains 2245 and 1595 complement eachother very well in the low (0.2–5 mg l-1) and medium(5–50 mg l-1) concentration ranges. Although strain 1580 isnot directly useful in showing colour differences at varyingarsenite concentrations, it can be used as positive controlfor the quality of the test.
By probing lacZ mRNA levels in the four strains, wecould provide evidence that the different LacZ activities inthe reporter strains as a function of arsenite is due to bothdifferential transcription efficiency or mRNA stability andtranslational effects. Two transcriptional effects wereclearly seen: first, the inclusion of the secondary ArsRbinding site in all constructs except 1580, which reducedmRNA formation in the absence of arsenite, and second,the lower lacZ mRNA abundance from the constructsbased on plasmid pPROBE (i.e. 2066 and 2245), whichmight be due to variations in plasmid copy number.However, the strong LacZ activity difference between2066 and 2245 was not apparent from mRNA levels(Fig. 5B), but the result from the absence (2066) andpresence (2245) of a good ribosome binding site. One canconclude that our intention to control the bioreporter sen-sitivity on the level of reporter enzyme synthesis wassuccessful in that it led to a range of bioreporter strains ofquite complementary sensitivities including a nearly con-stitutive control strain.
CCP bioreporters
The use of CCP as reporter gene resulted in a usefulcolouration as well, although the assay was a bit lessrobust than that for b-galactosidase. The main advantageof ccp was the availability of a well-characterized set ofmutants with variable activity against the classical peroxi-dase substrate guaiacol (Iffland et al., 2000; 2001). In thiscase mRNA probing showed that all mutant ccp geneswere transcribed with similar efficiencies, and as a func-tion of arsenite concentration (except one; Fig. 5A).However, the colouration resulted in very different inten-sities at the same arsenite concentration for the variousreporters. Those strains containing CCP with improvedspecific activity (1971, 1981, 1982) compared with thewild type (2031) gave high signals at very low arseniteconcentrations, but with a relatively high background inthe absence of arsenite. Their increased activity confirmsprevious findings of Wilming et al., who observed turnovernumbers of 102 and 26 s-1 of strain 1971 and 1982,respectively, compared with 0.35 s-1 for the wild-typeenzyme (Wilming et al., 2002). The ccp gene in strain1981 contains multiple mutations (Y39H–H60R–N184D–D217G–D224Y) and although the substrate turnover was
Bioassay calibration with multiple cell lines 153
© 2007 The AuthorsJournal compilation © 2007 Society for Applied Microbiology and Blackwell Publishing Ltd, Microbial Biotechnology, 1, 149–157

reported to be only slightly higher (0.8 s-1; Iffland et al.,2001) than that of the wild type, a colouration similar tothat of 1971 and 1982 for arsenite concentrations up to100 mg l-1 was observed. The CCP of the bioreporterstrains with the lowest observed activity and sensitivity inour tests (2332, 2340) had higher reported turnovernumbers (13 s-1 and 5 s-1 respectively) than the wild-typeenzyme (Wilming et al., 2002). The reasons for thesediscrepancies between reported enzyme activities andsignals obtained in our experiments with whole cells areunknown. Measurements of enzyme activities in cellextracts were in accordance with the reported substrateturnover (Fig. S1), which might be an indication for differ-ent enzyme activity in extracts and whole cells, or differ-ences in substrate accessibility or transport in whole cells.Our results, however, show that it is possible to receive aset of bioreporter bacteria with varying sensitivity by modi-fying the catalytic activity of the reporter protein and to usecombination of them for internal calibration.
Conclusions
We demonstrated that bioreporter bacteria of various sen-sitivities can be tailored by modifying different steps of thedetection-signalling chain, i.e. the rate of reporter enzymesynthesis and the catalytic activity of the reporter protein.It appears thus possible to construct sets of bioreporterbacteria that, when combined, cover ranges of target con-centrations that could not be covered by a single biore-porter organism due to restrictions of, for example, theinduction factor, limitations of spectroscopic signal detec-tion or the insensitivity of visual interpretation. Further-more, our results demonstrate the potential of reporterprotein engineering as opposed to the former focus on
analyte sensing and gene regulation for bioreporterimprovement (van der Meer et al., 2004).
The accomplished modifications altogether resulted intwo sets of bioreporter bacteria that can be used to inferanalyte concentration ranges without external calibration.This quantitative information originates from combinationsof robust qualitative signals of the individual bioreporterstrains. The hypothesized working principle was thusshown to function. A further important result is that per-missive concentrations of arsenic could be identified withboth bioreporter sets: (i) below the WHO limit only two ofthe four LacZ bioreporter bacteria produced a visiblesignal, above 10 mg l-1 three or at concentrations abovelocal arsenic standards (50 mg l-1) all four strains wereresponding with clear signals, (ii) the CCP bioreporterbacteria indicate a concentration below the WHO limitwhen four out of six strains show signals. This set couldalso be reduced to four strains, as three strains gaveredundant information.
Our approach promises to simplify bioreporter applica-tion by layman as it eliminates time-consuming and tech-nically demanding calibration. Especially for simple fielddetection devices such as paper strips (Stocker et al.,2003) our method would be of great value. Besides itshigher robustness it has the advantage of the much easierinterpretation of sets of qualitative subsignals than ofgradual colour changes.
Experimental procedures
Construction of ArsR plasmids
The following reporter plasmids were constructed (Fig. 6) inwhich ArsR controls expression of either the lacZ gene or theccp gene [for CCP from Saccharomyces cerevisiae (Iffland
Fig. 6. Schematic picture of the plasmidsdeveloped in this study. Genes arerepresented as arrows, drawn to proportion.Relevant restriction sites for cloning areshown in their usual abbreviations. The blackvertical bars symbolize the ArsR binding sites(ABS).
154 A. Wackwitz et al.
© 2007 The AuthorsJournal compilation © 2007 Society for Applied Microbiology and Blackwell Publishing Ltd, Microbial Biotechnology, 1, 149–157

et al., 2000)]. In plasmid pMV-arsR [strain number 1580(Stocker et al., 2003)] the arsR gene is placed directlyupstream of lacZ and in the same direction of transcription, sothat expression of arsR and lacZ are under control of theArsR-regulated promoter in front of arsR itself (Pars, Fig. 6). Toreduce background lacZ expression from the leaky Pars pro-moter, a second ArsR DNA binding site (ABS) was introduceddownstream of arsR in plasmid pMV-arsR-ABS [strainnumber 1595, Fig. 6 (Stocker et al., 2003)]. To change thesequence and ribosome binding site upstream of lacZ, weamplified the entire lacZ gene from the E. coli K12 chromo-some while introducing HindIII and NheI restriction sites atthe gene extremities. This lacZ DNA was then used to replacethe gfp gene in the broad host range vector pPROBE’ (Milleret al., 2000). The arsR gene and the downstream secondaryArsR binding site were recovered on a BamHI–SpeI fragmentand inserted into pPROBE’–lacZ in front of lacZ to makepPR-ArsR-ABS-LacZ (strain 2066, Fig. 6). The ribosomebinding site (RBS) of the original lacZ gene of E. coli wasamplified together with the entire lacZ gene by PCR by usingprimer LacZ Rev NheI (5’-gctagcttatttttgacaccagaccaactgg-3’) and primer LacZ-RBS-For (5′-gcttgtgagcggataacaatttcacacagg-3′) and introduced in pPR-ArsR-ABS-LacZ digestedby HindIII and NheI (plasmid pPR-arsR-ABS-RBS-LacZ,strain 2245, Fig. 6). Sequences of the arsR–lacZ intergenicregions are presented in Fig. S2.
The ccp reporter plasmids were all constructed by insertinga BamHI–SpeI fragment containing arsR and the secondArsR binding site from pPR-arsR-ABS (Stocker et al., 2003)in a pET15-based plasmid containing the ccp gene or itsvariants (Iffland et al., 2000; 2001), pre-digested with BglIIand XbaI (during which the T7 promoter is removed). ThearsR gene is thus expressed from Pars and on its turn regu-lates ccp expression (Fig. 6). In this manner we producedE. coli strains with plasmids pArsR-CCP-WT (strain number2031, wild-type ccp), pArsR-CCP-R48I (strain 2332, R48Imutation in CCP), pArsR-CCP-R48T (strain 2340), pArsR-CCP-R48Q (strain 1971), pArsR-CCP-K2.4 (strain 1981,Y39H-H60R-N184D-D217G-D224Y mutations) and pArsR-CCP-PT1 (strain 1982, R48H mutation). Arsenite bio-reporters were constructed in E. coli DH5a.
Cell pre-culturing
Arsenite in aqueous solution was measured with cell sus-pensions of E. coli strains (Table 2). Bioreporter strainswere plated from –80°C stock cultures on fresh Luria–Broth(LB) plates with appropriate antibiotic selection (ampicillin100 mg ml-1 or kanamycin 50 mg ml-1) and grown overnight at37°C. Five millilitres of liquid LB medium plus antibiotic wasinoculated with a single colony and incubated for 16 h at37°C. Cultures were diluted in fresh pre-heated LB mediumwithout antibiotics at a 1:50 ratio and incubated until anoptical density at 600 nm of 0.5 was reached and then usedfor triplicate bioassays as described below.
Arsenite assays with E. coli b-galactosidase(LacZ) bioreporters
Assay mixtures containing 100 ml of cell suspension (OD600 of0.5, 1:5 diluted in water), 90 ml of arsenite stock solution and
10 ml of X-gal substrate solution (5-bromo-4-chloro-3-indolyl-b-D-galactosidase, Serva, 0.2 mg ml-1 in dimethylformamid)were prepared directly in 96-well plates. Cells were exposedto different final arsenite concentrations (0, 0.05, 0.2, 0.5, 2,4, 6, 10, 20, 25, 30, 40, 50, 60, 70, 80 and 100 mg l-1).Arsenite solutions were prepared by dilution from a 50 mM(3.9 g l-1) sodium arsenite solution commercial stock (Merck)in tap water. The 96-well plates with the assay mixtures werecovered with a lid and incubated at 30°C in a rotary shaker(700 r.p.m.) for 22 h. In order to detect the blue colour formedfrom X-gal conversion, the optical density was measured in amicroplate reader (Spectramax 250, Molecular Devices) at595 nm after 0, 1, 2, 3, 4, 5, 6, 7, 8 and 22 h. The turbidityresulting from the cell suspension itself was subtracted fromthe measured signal by measuring triplicate assay mixtureswithout X-gal.
Arsenite measurements with E. coli CCP bioreporters
The CCP bioreporters were cultured as above for the LacZreporters in small pre-cultures for 16 h at 37°C after whichcells were diluted 50-fold and again grown until a cultureturbidity of ~0.5 was reached. Cells were then concentratedby centrifugation to achieve a turbidity at 600 nm of ~6. Tenmicrolitres of these cell suspensions were then spotted onagar plates containing different concentrations of arsenite(0, 1, 4, 10, 20, 30, 50, 100, 200, 1000 and 5000 mg l-1) andbriefly dried. After an incubation of 4 h at 37°C the cell spotswere transferred to paper by gently pressing a paper sheet(3M chromatography paper, Whatman) of the right diameterdirectly on the agar surface. Peroxidase activity of the cellswas detected by incubating the paper sheets on filter paperwhich was wetted with 50 mM potassium phosphate buffer(pH 6.0) containing freshly added guaiacol (final concen-tration 105 mM, Sigma) and hydrogen peroxide (finalconcentration 170 mM, Merck) (Iffland et al., 2000). Colourdevelopment was allowed to proceed until clearly visible,after which the paper sheets were digitally photographed.
Determination of mRNA contents
Reporter strain cultures grown similarly were exposed to 0,10 or 100 mg l-1 arsenite for 4 h at 37°C, after which total RNA
Table 2. Identification and characteristics of E. coli DH5a bioreporterconstructs.
Strain Plasmid
LacZ1580 pMV-arsR1595 pMV-arsR-ABS2245 pPR-arsR-ABS-RBS-lacZ2066 pPR-arsR-ABS-lacZ
CCP1971 pArsR-ABS-CCP-R48Q1981 pArsR-ABS-CCP-K2.41982 pArsR-ABS-CCP-PT12031 pArsR-ABS-CCP-WT2332 pArsR-ABS-CCP-R48I2340 pArsR-ABS-CCP-R48T
ABS, ArsR binding site; RBS, ribosome binding site.
Bioassay calibration with multiple cell lines 155
© 2007 The AuthorsJournal compilation © 2007 Society for Applied Microbiology and Blackwell Publishing Ltd, Microbial Biotechnology, 1, 149–157

was isolated from 5 ml of culture using a Macherey NagelNucleo Spin Kit. Twenty microlitres from 120 ml of total RNAextract from each sample was blotted on a positively chargednylon membrane (Roche) using a Milliblot system (Millipore).The total RNA on the membrane was fixed with UV (1 min at120 mJ cm-2) and stored at room temperature until hybridiza-tion. DIG-labelled DNA probes were synthesized usingrandom primed labelling (DIG DNA labelling kit, Roche) fromPCR products generated with specific primers (Table 3) forlacZ and ccp respectively. Hybridization was performed for16 h at 57°C for the ccp probe and 53°C for the lacZ probeusing DIG Easy Hyb solution (Roche) and 100 ng ml-1 probe.Subsequent washing was performed according to the manu-facturer’s protocol (Roche). DIG–DNA–RNA hybrids weredetected with the NBT-CSIB (Roche) approach as describedby the manufacturer. Dot blots were scanned and quantita-tively analysed using Image J, in which the signal intensities(i.e. the grey intensities of the dots) are expressed asaverage grey values.
Acknowledgements
The authors thank Kai Johnsson for the generous gift of theccp variants. Alexandra Baumeyer is thanked for her help inarsR-ccp cloning and preliminary tests with CCP.
References
Andersen, J.B., Sternberg, C., Poulsen, L.K., Bjorn, S.P.,Givskov, M., and Molin, S. (1998) New unstable variants ofgreen fluorescent protein for studies of transient geneexpression in bacteria. Appl Environ Microbiol 64: 2240–2246.
Baumann, B., and van der Meer, J.R. (2007) Analysis ofbioavailable arsenic in rice with whole cell living bioreporterbacteria. J Agric Food Chem 55: 2115–2120.
Belkin, S. (2003) Microbial whole-cell sensing systems ofenvironmental pollutants. Curr Opin Microbiol 6: 206–212.
Bjerketorp, J., Hakansson, S., Belkin, S., and Jansson, J.K.(2006) Advances in preservation methods: keeping biosen-sor microorganisms alive and active. Curr Opin Biotechnol17: 43–49.
British Geological Survey (2001) Arsenic Contamination ofGroundwater in Bangladesh. BGS Technical ReportWC/00/19; British Geological Survey, London.
Daunert, S., Barrett, G., Feliciano, J.S., Shetty, R.S.,Shrestha, S., and Smith-Spencer, W. (2000) Genetically
engineered whole-cell sensing systems: coupling biologi-cal recognition with reporter genes. Chem Rev 100: 2705–2738.
DeAngelis, K.M., Ji, P.S., Firestone, M.K., and Lindow, S.E.(2005) Two novel bacterial biosensors for detection ofnitrate availability in the rhizosphere. Appl EnvironMicrobiol 71: 8537–8547.
Hakkila, K., Green, T., Leskinen, P., Ivask, A., Marks, R., andVirta, M. (2004) Detection of bioavailable heavy metals inEILATox-Oregon samples using whole-cell luminescentbacterial sensors in suspension or immobilized onto fibre-optic tips. J Appl Toxicol 24: 333–342.
Harms, H., Rime, J., Leupin, O., Hug, S.J., and van der Meer,J.R. (2005) Effect of groundwater composition on arsenicdetection by bacterial biosensors. Microchim Acta 151:217–222.
Harms, H., Wells, M.C., and van der Meer, J.R. (2006)Whole-cell living biosensors – are they ready for environ-mental application? Appl Environ Biotechnol 70: 273–280.
Iffland, A., Tafelmeyer, P., Saudan, C., and Johnsson, K.(2000) Directed molecular evolution of cytochrome c per-oxidase. Biochemistry 39: 10790–10798.
Iffland, A., Gendreizig, S., Tafelmeyer, P., and Johnsson, K.(2001) Changing the substrate specificity of cytochrome cperoxidase using directed evolution. Biochem Biophys ResCommun 286: 126–132.
Ivask, A., Virta, M., and Kahru, A. (2002) Construction anduse of specific luminescent recombinant bacterial sensorsfor the assessment of bioavailable fraction of cadmium,zinc, mercury and chromium in the soil. Soil Biol Biochem34: 1439–1447.
Jansson, J.K. (2003) Marker and reporter genes: illuminatingtools for environmental microbiologists. Curr OpinMicrobiol 6: 310–316.
Lei, Y., Chen, W., and Mulchandani, A. (2006) Microbial bio-sensors. Anal Chim Acta 568: 200–210.
Leveau, J.H.J., and Lindow, S.E. (2002) Bioreporters inmicrobial ecology. Curr Opin Microbiol 5: 259–265.
van der Meer, J.R., Tropel, D., and Jaspers, M. (2004) Illu-minating the detection chain of bacterial bioreporters.Environ Microbiol 6: 1005–1020.
Miller, W.G., Leveau, J.H.J., and Lindow, S.E. (2000)Improved gfp and inaZ broad-host-range promoter-probevectors. Mol Plant Microbe Interact 13: 1243–1250.
Paitan, Y., Biran, I., Shechter, N., Biran, D., Rishpon, J., andRon, E.Z. (2004) Monitoring aromatic hydrocarbons bywhole cell electrochemical biosensors. Anal Biochem 335:175–183.
Ramanathan, S., Shi, W.P., Rosen, B.P., and Daunert, S.(1997) Sensing antimonite and arsenite at the subattomolelevel with genetically engineered bioluminescent bacteria.Anal Chem 69: 3380–3384.
Ramanathan, S., Shi, W.P., Rosen, B.P., and Daunert, S.(1998) Bacteria-based chemiluminescence sensing sys-tem using beta-galactosidase under the control of the ArsRregulatory protein of the ars operon. Anal Chim Acta 369:189–195.
Scott, D.L., Ramanathan, S., Shi, W.P., Rosen, B.P., andDaunert, S. (1997) Genetically engineered bacteria: elec-trochemical sensing systems for antimonite and arsenite.Anal Chem 69: 16–20.
Table 3. Primers for the synthesis of probes for dot blot hybridization.
Primer name Target Sequence
sfi_for ccp 5′-GCC ATG GCC AGC ACG GCC ACACC-3′
R48Trev ccp 5′-GTG CCA AGC AAG AGT GAC TAATAC GGG-3′
LacZfor lacZ 5′-TCG GTT ACG GCC AGG ACA GT-3′LacZrev lacZ 5′-CAT CAT TAA AGC GAG TGG CAA
CAT-3′
156 A. Wackwitz et al.
© 2007 The AuthorsJournal compilation © 2007 Society for Applied Microbiology and Blackwell Publishing Ltd, Microbial Biotechnology, 1, 149–157
de Smit, M.H., and van Duin, J. (1994) Control of translationby mRNA secondary structure in Escherichia coli: a quan-titative analysis of literature data. J Mol Biol 244: 144–150.
Smith, A.H., Lingas, E.O., and Rahman, M. (2000) Contami-nation of drinking water by arsenic in Bangladesh: a publichealth emergency. Bull World Health Organ 78: 1093–1103.
Stocker, J., Balluch, D., Gsell, M., Harms, H., Feliciano, J.,Daunert, S., et al. (2003) Development of a set of simplebacterial biosensors for quantitative and rapid measure-ments of arsenite and arsenate in potable water. EnvironSci Technol 37: 4743–4750.
Tauriainen, S., Virta, M., Chang, W., and Karp, M. (1999)Measurement of firefly luciferase reporter gene activityfrom cells and lysates using Escherichia coli arsenite andmercury sensors. Anal Biochem 272: 191–198.
Trang, P.T.K., Berg, M., Viet, P.H., Mui, N.V., and van derMeer, J.R. (2005) Bacterial bioassay for rapid and accurateanalysis of arsenic in highly variable groundwater samples.Environ Sci Technol 39: 7625–7630.
Wells, M., Gosch, M., Rigler, R., Harms, H., Lasser, T., andvan der Meer, J.R. (2005) Ultrasensitive reporter proteindetection in genetically engineered bacteria. Anal Chem77: 2683–2689.
Werlen, C., Jaspers, M.C.M., and van der Meer, J.R. (2004)Measurement of biologically available naphthalene in gas
and aqueous phases by use of a Pseudomonas putidabiosensor. Appl Environ Microbiol 70: 43–51.
Wilming, M., Iffland, A., Tafelmeyer, P., Arrivoli, C., Saudan,C., and Johnsson, K. (2002) Examining reactivity andspecificity of cytochrome c peroxidase by using combina-torial mutagenesis. Chembiochem 3: 1097–1104.
Supplementary material
The following supplementary material is available for thisarticle online:Fig. S1. Specific activity of CCP in cell extracts from CCPbioreporter bacteria incubated for 4 h with 5 different arseniteconcentrations.Fig. S2. Intervening sequences in the arsR-lacZ construc-tions between the end of arsR (taa, underlined) and thebeginning of lacZ (atg, underlined). Relevant restriction sitesused for cloning are indicated. The ArsR binding site motif isshaded in grey background. Rbs, ribosome binding site.Plasmid pBGD23 is the original construct used by Scott et al.,1997.
This material is available as part of the online article fromhttp://www.blackwell-synergy.com
Bioassay calibration with multiple cell lines 157
© 2007 The AuthorsJournal compilation © 2007 Society for Applied Microbiology and Blackwell Publishing Ltd, Microbial Biotechnology, 1, 149–157