Amniotic fluid interleukin 6 in preterm labor. Association with infection

Interleukin-6 and Cachexia in ApcMin/+ Mice
Kristen A. Baltgalvis1,3, Franklin G. Berger2,3, Maria Marjorette O. Pena2,3, J. Mark Davis1,
Stephanie J. Muga4, and James A. Carson1,3
Integrative Muscle Biology Laboratory, Exercise Science Department1,
Department of Biological Sciences2, and the Center for Colon Cancer Research3,
University of South Carolina, Columbia, South Carolina, 29208
Department of Cellular and Molecular Pharmacology4
Medical University of South Carolina, Charleston, South Carolina
Running title: ApcMin/+ Mice and Cachexia
Corresponding author:
James A. Carson, Ph.D.
University of South CarolinaDepartment of Exercise SciencePublic Health Research Center921 Assembly St., Room 405Columbia, SC 29208
Office Phone: 803-777-0809Lab Phone: 803-777-0142Fax: [email protected]
Page 1 of 35Articles in PresS. Am J Physiol Regul Integr Comp Physiol (December 5, 2007). doi:10.1152/ajpregu.00716.2007
Copyright © 2007 by the American Physiological Society.
2R-00716-2007.R2
ABSTRACT
The ApcMin/+ mouse has a mutation in the Apc tumor suppressor gene and develops
intestinal polyps, beginning at 4 weeks of age. This mouse develops cachexia by 6 months,
characterized by significant loss of muscle and fat tissue. The purpose of the present study was
to determine the role of circulating IL-6 and the polyp burden for the development of cachexia in
ApcMin/+ mice. At 26 weeks of age, mice exhibiting severe cachectic symptoms had a 61%
decrease in gastrocnemius muscle weight, complete loss of epididymal fat, a 10-fold increase in
circulating IL-6 levels, and an 89% increase in intestinal polyps compared to mildly cachectic
animals. ApcMin/+ / IL-6-/- mice did not lose gastrocnemius muscle mass or epididymal fat pad
mass, while overall polyp number decreased by 32% compared to ApcMin/+ mice. Plasmid-based
IL-6 over-expression in ApcMin/+ / IL-6-/- mice led to a decrease in gastrocnemius muscle mass,
epididymal fat pad mass, and increased intestinal polyp burden. IL-6 over-expression did not
induce cachexia in non-tumor bearing mice. These data demonstrate that IL-6 is necessary for
the onset of adipose and skeletal muscle wasting in the ApcMin/+ mouse and that circulating IL-6
can regulate ApcMin/+ mouse tumor burden.
KEYWORDS: Cachexia, colorectal cancer, inflammation, polyps, STAT-3
Page 2 of 35
3R-00716-2007.R2
INTRODUCTION
Cachexia is characterized as an overall state of ill-health, accompanied by a loss of lean
body mass and fat mass, weakness, fatigue, anemia, metabolic abnormalities, inflammation, and
impaired immune function, with or without anorexia (2-4, 24). This condition is associated with
other life-threatening diseases, such as cancer and AIDS, and negatively affects life quality and
survival (2, 26, 36). Almost 50% of all cancer patients experience progressive wasting of
adipose tissue and/or skeletal muscle mass (37), predominantly during the terminal stages of
disease. Cancer patients can lose up to 30% of their original body weight and cachexia accounts
for approximately 20-33% of cancer deaths. In particular, gastrointestinal and lung cancer
patients are extremely susceptible to cachexia (16, 31). The ApcMin/+ mouse is an established
model of colorectal cancer and cachexia (28, 30). This mouse develops intestinal polyps as early
as 4 weeks of age and becomes cachectic between 3 and 6 months of age. Using ApcMin/+ mice
to study cachexia has many advantages in that these mice have a polyp burden that mimics
human colorectal cancer, chronic low levels of circulating IL-6, and lack of anorexia. However,
the mechanisms inducing wasting in these mice are poorly understood.
One potential candidate for inducing cachexia is interleukin-6 (IL-6), a pleiotropic
cytokine that modulates a variety of physiological responses and activates genes associated with
cellular proliferation, differentiation, and apoptosis (20). Elevated circulating IL-6 levels have
been associated with cachexia (21). Intraperitoneal IL-6 treatment (40), intracerebroventricular
IL-6 injections in the lateral ventricle, IL-6 transgenic mice (38), and colon-26 tumor bearing
mice with elevated plasma IL-6 levels (45) all demonstrate approximately a 25% decrease in
gastrocnemius muscle weight. Blocking IL-6 through neutralization antibodies results in
Page 3 of 35

4R-00716-2007.R2
attenuation of IL-6 induced-muscle wasting in rodents (14, 35, 39, 44). In contrast, some studies
administering exogenous IL-6 to rodents fail to find an association between high circulating IL-6
levels and cachexia (12, 15, 33, 42, 43). The disparities between studies on IL-6 and cachexia
point to indirect effects of IL-6 on skeletal muscle wasting during cancer. One such indirect
mechanism may be IL-6-induced tumor growth. IL-6 is also a potent tumor growth factor (8, 13,
34) and the contribution of IL-6-induced tumor growth to cachexia has not been elucidated.
IL-6 elicits its effect by binding to a plasma membrane receptor complex which contains
the common signal transducing receptor chain, gp130 (glycoprotein 130) (9, 20, 23). Ligation of
this receptor activates STAT-3 (Signal Transducers and Activators of Transcription) (9, 11, 20)
which is generally associated with cell growth, differentiation, development, and survival (6).
Skeletal muscle and myotubes are sensitive to IL-6 and treatment with IL-6 results in
phosphorylation of STAT-3 (1, 17, 19, 32, 41). Skeletal muscle STAT-3 is activated during
atrophy (18, 22), but it is unknown whether muscle STAT-3 activation leads to cachexia.
The purpose of the present study was to determine the relationship between circulating
IL-6 and polyp burden for the development of cachexia in ApcMin/+ mice. We hypothesized that
increased circulating IL-6 would both increase the polyp burden and overall wasting in ApcMin/+
mice. In addition to wild-type and ApcMin/+ mice, ApcMin/+ / IL-6-/- mice were developed to ablate
IL-6. A plasmid-based in vivo electroporation system delivered into skeletal muscle was used to
over-express IL-6 in ApcMin/+ and ApcMin/+ / IL-6-/- mice, as well as wild-type mice.
MATERIALS AND METHODS
Animals. C57BL/6, ApcMin/+, and ApcMin/+ / IL-6-/- mice were originally purchased from Jackson
Laboratories (Bar Harbor, ME) and breeding was maintained at the University of South
Page 4 of 35

5R-00716-2007.R2
Carolina’s animal resource facility as previously described (28). ApcMin/+ mice (n=12) were
individually housed in cages with voluntary activity wheels and sacrificed at 26-weeks of age
(See activity protocol below). ApcMin/+ / IL-6-/- mice were genotyped for the mutant Apc allele,
IL-6, and neomycin resistance. The primer sequences for IL-6 were: Forward: 5' – TTC CAT
CCA GTT GCC TTC TTG G – 3' and Reverse: 5' – TTC TCA TTT CCA CGA TTT CCC AG –
3'. The reverse primer sequence for neomycin resistance was: Reverse: 5’ – CCG GAG AAC
CTG CGT GCA ATC C – 3’. ApcMin/+ / IL-6-/- mice (n=8), ApcMin/+ mice (n=7), and C57BL/6
mice (n=5) were sacrificed at 26-weeks of age to examine a cachectic time point. Another group
of ApcMin/+ / IL-6-/- mice (n=6), ApcMin/+ mice (n=6), and C57BL/6 mice (n=5) were sacrificed at
13-weeks of age to examine a pre-cachectic time point. To increase circulating IL-6 levels, 16-
wk-old C57BL/6 (Control; n=10 and + IL-6; n=10), ApcMin/+ (Control; n=8 and + IL-6; n=10)
and ApcMin/+ / IL-6-/- mice (Control; n=8 and + IL-6; n=6) were used for IL-6 over-expression
experiments (See procedure below). The room was maintained on a 12:12 light:dark cycle with
the light period starting at 0700. Mice were provided standard rodent chow (Harlan Teklad
Rodent Diet, #8604, Madison, WI) and water ad libitum. Body weights and food intake were
measured weekly. All animal experimentation was approved by the University of South
Carolina’s Institutional Animal Care and Use Committee.
Voluntary wheel running activity. ApcMin/+ mice (n=12) were individually housed with 9.5-in
diameter stainless steel activity wheels at 4-wks of age (Mini Mitter, Bend, OR). Running
activity was monitored from 4 to 26 weeks of age. Bicycle computers (Specialized, Morgan Hill,
CA) using magnetic sensors measured running distance, and the data were recorded daily. Food
Page 5 of 35

6R-00716-2007.R2
intake and body weight were recorded weekly. Activity wheels were fixed 18 hours prior to
sacrifice.
Scoring cachexia. A strength of ApcMin/+ mice as a cachectic model is variability in the
development of cachectic symptoms between mice. To take advantage of this variability,
ApcMin/+ mice were categorized on their amount of wasting at the study’s end. A cachexia
severity score (Mild/None=1, Moderate=2, or Severe=3) based on body weight, gastrocnemius
muscle weight, and epididymal fat pad weight was assigned to each animal that had access to a
voluntary activity wheel. The weight ranges for each variable were based on the averages of
C57BL/6 mice of the same age. Each individual score (body weight + gastrocnemius weight +
epididymal fat pad weight) was averaged for a total cachexia score for each animal. A score of
“1” was within 1 standard deviation of the C57BL/6 mean and these mice had mild/no cachexia.
A score of “3” was more than 2 standard deviations away from the C57BL/6 mean, and these
mice had severe cachexia.
IL-6 over-expression. An IL-6 plasmid was used to increase circulating IL-6 levels in C57BL/6,
ApcMin/+, and ApcMin/+ / IL-6-/- mice. Electroporation of plasmid DNA into the quadriceps muscle
was used for endogenous IL-6 production and subsequent secretion into circulation. Fifty
micrograms of the IL-6 plasmid driven by the CMV promoter, or empty control vector was
injected intramuscularly. Mice were anesthetized with a 2% mixture of isoflurane and oxygen (1
L/min). The leg was shaved and a small incision was made over the quadriceps muscle. Fat was
dissected away from the muscle and the plasmids were injected in a 50 µl volume of PBS. A
Page 6 of 35

7R-00716-2007.R2
series of eight 50 ms, 100 V pulses was used to promote uptake of the plasmid into myofibers,
and then the incision was closed with a wound clip. Mice were electroporated every 2 weeks to
maintain circulating IL-6 levels, using alternate quadriceps muscles. C57BL/6 and ApcMin/+ / IL-
6-/- mice were sacrificed after 10 weeks of IL-6 over-expression. ApcMin/+ mice were sacrificed
after 4 weeks of IL-6 over-expression since they spontaneously undergo cachexia by 6 months of
age. It should be noted that the quadriceps muscle was not used for any analyses, but rather the
gastrocnemius muscle to examine the effect of circulating IL-6 on muscle mass.
Plasma IL-6. Plasma IL-6 levels were measured with a mouse specific ELISA (Biosource,
Carlsbad, CA) by taking blood samples under brief isoflurane anesthesia from the retroorbital
eye sinus 7 days following each electroporation and at sacrifice to ensure validity of the
procedure. The IL-6 level for each animal was averaged for all time points assessed over the
experimental period. In previous studies using this kit, we have detected 3-30 pg IL-6/ml
ApcMin/+ mouse plasma (28, 29).
Tissue collection. Mice were injected with a ketamine/xylazine/acepromazine cocktail (1.4
ml/kg BW), and gastrocnemius muscles, epididymal fat pads, tibias, and intestines were excised.
Tibia length was measured as an indicator of animal body size. The gastrocnemius muscle was
rinsed in PBS, snap frozen in liquid nitrogen, weighed, and stored at -80 °C until further
analysis. The small intestines were removed as described previously (29). Briefly, the intestines
were dissected, cleared of mesentery adipose tissue, and fixed in 10% buffered formalin for 24
hours. Plasma was collected via the inferior vena cava with heparinized needles, stored on ice,
Page 7 of 35

8R-00716-2007.R2
centrifuged at 1,000 g for 10 min at 4 °C, and the plasma was stored at -80 °C until further
analysis.
Polyp counts. Polyp counts were performed as described previously (29). Briefly, formalin-
fixed intestinal sections from all animals were rinsed in deionized water, stained in 0.1%
methylene blue, and counted by a single investigator who was blinded to the treatments. Polyps
were counted under a dissecting microscope, using tweezers to pick through the intestinal villi
and identify polyps. Polyps were categorized as >2 mm, 1-2 mm, and <1 mm in the small and
large intestine.
Total RNA Isolation and cDNA Synthesis. Total RNA was isolated from the gastrocnemius
muscles using TRIzol reagent (Invitrogen, Carlsbad, CA) as previously described (27).
Extracted RNA was treated with 10 units of DNase I to degrade any residual contaminating
genomic DNA. Complementary DNA (cDNA) was reverse transcribed (RT) from 3 µg of total
RNA using 1 µl of random hexamers and 50 units of Superscript III reverse transcriptase
(Invitrogen, Carlsbad, CA) in a final volume of 20 µl at 25°C for 10 min, followed by 42°C for
60 min, and 70°C for 15 min.
Real-time PCR. Real-time PCR was performed using reagents from Applied Biosystems (Foster
City, CA). Gene expression for IL-6 (FAM dye) was carried out in 25 µl reactions consisting of
2x Taqman Universal PCR master mix (AmpliTaq Gold DNA Polymerase, Buffer, dNTP mix,
AmpErase UNG, MgCl2), 1.0 µl cDNA, RNase-free water, and 1 µl of primer. Gene expression
Page 8 of 35

9R-00716-2007.R2
for cyclophilin (SYBR dye) was carried out in 25 µl reactions consisting of 2x SYBR green PCR
buffer (AmpliTaq Gold DNA Polymerase, Buffer, dNTP mix, AmpErase UNG, MgCl2), 0.1 µl
cDNA, RNase-free water, and 60 nM of each primer. The sequence for the primers were as
follows: Cyclophilin Forward: 5’ – TGT GCC AGG GTG GTG ACT T – 3’; Cyclophilin
Reverse, 5’ – TCA AAT TTC TCT CCG TAG ATG GAC TT – 3’. Samples were analyzed on
an ABI 7300 Sequence Detection System. Reactions were incubated for 2 min at 50°C and 10
min at 95°C, followed by 50 cycles consisting of a 15-s denaturing step at 95°C and 1-min
annealing/extending step at 60°C. Data were analyzed by ABI software using the cycle
threshold (CT), which is the cycle number at which the SYBR or FAM fluorescence emission is
midway between detection and saturation of the reaction. The 2-∆∆ CT method (25) was used to
determine changes in gene expression between treatment groups with the cyclophilin CT as the
correction factor.
Western Blotting. Western blotting was performed as previously described (28). Briefly, frozen
gastrocnemius muscle was homogenized in Mueller buffer and protein concentration determined
by the Bradford method (7). Crude muscle homogenate (30-60 µg) was fractionated on 8%-12%
SDS-polyacrylamide gels. Gels were transferred to PVDF membranes overnight. Membranes
were Ponceau stained to verify equal loading of each gel. Membranes were blocked overnight in
5% milk in Tris-buffered saline with 0.1% Tween-20 (TBS-T). Primary antibodies for total and
phosphorylated STAT-3 (TYR 705) were purchased from Cell Signaling (Danvers, MA).
Antibodies were diluted 1:1000 to 1:2000 in 5% BSA in TBS-T followed by overnight
incubation with membranes at 4 ºC. Anti-rabbit IgG horseradish-peroxidase conjugated
Page 9 of 35

10R-00716-2007.R2
secondary antibodies (GE Healthcare Life Sciences, Piscataway, NJ) were incubated with the
membranes at 1:2000 to 1:5000 dilutions for 2 hours in 5% milk in TBS-T. Enhanced
chemiluminescence (ECL) (GE Healthcare Life Sciences, Piscataway, NJ) was used to visualize
the antibody-antigen interactions. Film was digitally scanned and blots were quantified by
densitometry using scientific imaging software (Scion Image, Frederick, MD). The Ponceau
stained membranes were also digitally scanned and the 45 kDa actin bands were quantified by
densitometry and used as a protein loading correction factor for each lane.
Statistical analysis. Repeated measures ANOVA was used to examine changes in body weight,
food intake, and wheel running activity over time in mice categorized by stage of cachexia. One-
way ANOVAs or independent t-tests were used to determine significance for all other variables.
Post-hoc analyses were performed with Student-Newman-Keuls methods. When the assumption
of normality failed, a Kruskal-Wallis one-way ANOVA on ranks was performed. Post-hoc
analyses were performed with Dunn’s method. Significance was set at p<0.05.
Page 10 of 35

11R-00716-2007.R2
RESULTS
Voluntary activity and body weight. Body weight was traced over the entire study in ApcMin/+
mice that had access to voluntary activity wheels. There were no differences in body weight
between mildly and severely cachectic ApcMin/+ mice at the beginning of the study (Figure 1A;
p=0.904). The severely cachectic mice started to decrease in body weight by 18-weeks of age
(p=0.015) and differed in body weight by the completion of the study at 26-weeks of age
(p<0.001). Body weights in severely cachectic ApcMin/+ mice were reduced 20% compared to
mildly cachectic mice at the study’s end (26.2 ± 0.3 g vs. 20.9 ± 0.6 g; p<0.001). Food intake
was also measured weekly; there were no differences between the mildly cachectic and severely
cachectic mice at any time point (Figure 1B; p=0.115). All of these mice had access to voluntary
activity wheels which was used as an indicator of each animal’s health. Running distance per
day was not different between the 2 groups at the beginning of the study (Figure 1C; p=0.975).
However, by 15-18 weeks of age, the severely cachectic mice started to decrease running wheel
distance (p<0.001) and were running significantly less than the mildly cachectic group through
the completion of the study.
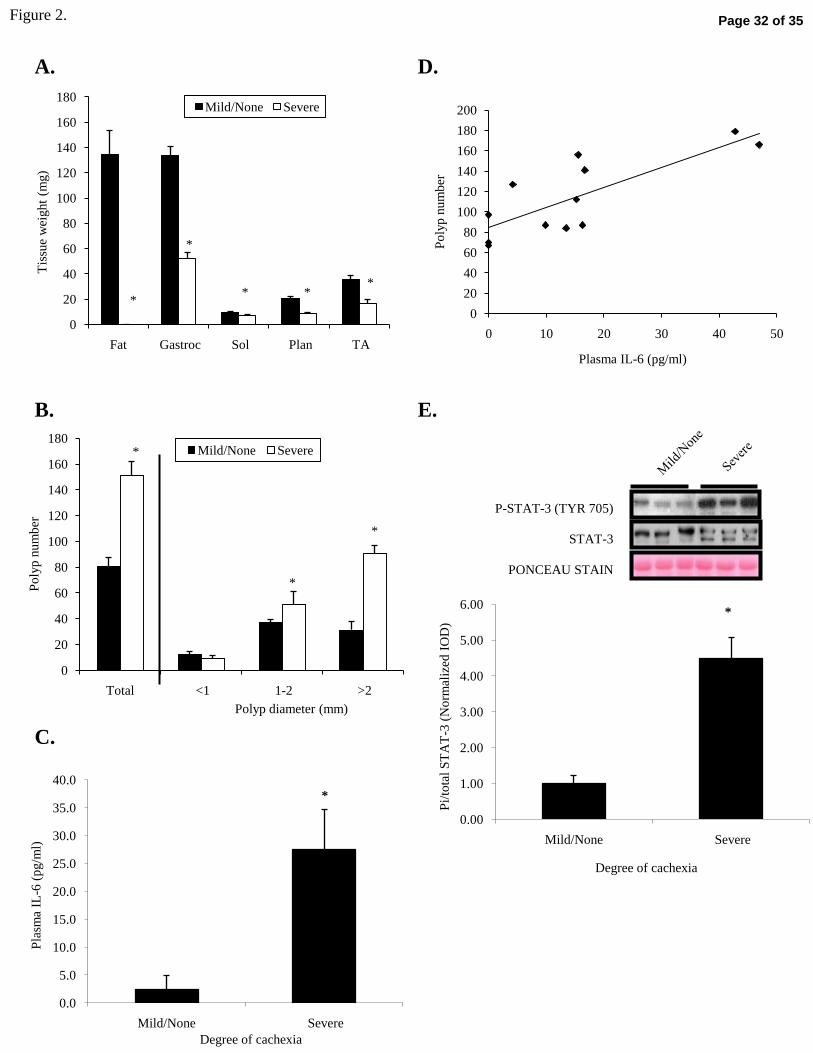
Muscle and fat pad mass. Skeletal muscle weights were measured to determine the amount of
skeletal muscle wasting in ApcMin/+ mice stratified by their degree of cachexia. Severely
cachectic ApcMin/+ mice had a 61% decrease in gastrocnemius muscle weight and complete
elimination of the epididymal fat pad compared to mildly cachectic mice (Figure 2A). Other
hindlimb muscles were examined. In severely cachectic mice, soleus muscle mass was reduced
30% (p=0.003), plantaris muscle mass reduced 57% (p<0.001), and tibialis anterior muscle mass
Page 11 of 35

12R-00716-2007.R2
reduced 53% (p=0.002), when compared to mildly cachectic mice. However, tibia length, an
indicator of body frame size, did not differ by degree of cachexia (16.4 ± 0.0 vs. 16.5 ± 0.1 mm;
p=0.297).
Polyp number. To determine whether the intestinal tumor burden varied with cachexia severity,
polyp counts were also performed in these mice. Total polyp number was 89% higher in
severely cachectic mice, compared to mildly cachectic mice (Figure 2B; p<0.001). However,
when stratified by polyp size, polyps 1-2 mm in diameter and >2 mm in diameter were greater in
severely cachectic mice compared to mildly cachectic mice.
Plasma IL-6 and muscle STAT-3 activation. Plasma IL-6 levels were increased ~10-fold in mice
with severe cachexia (Figure 2C; p=0.020). Overall, there was a strong negative correlation
(Figure 2D) between tumor number and plasma IL-6 (r=-0.893, p<0.001). To determine if
downstream targets of IL-6 signaling were activated in cachectic muscle, western blotting was
performed to assess STAT-3 activation in mildly and severely cachectic ApcMin/+ mouse
gastrocnemius muscle (Figure 2E). The ratio of phosphorylated STAT-3 to total STAT-3
increased 4.5-fold in severely cachectic mice compared to mildly cachectic mice (p=0.004).
There was a significant inverse correlation between STAT-3 activation (Pi/total STAT-3) and
gastrocnemius muscle weight (r=-0.831; p=0.002). Gastrocnemius muscle IL-6 mRNA did not
change with severity of cachexia (38.40 ± 0.35 vs. 38.22 ± 0.25 CT; p=0.91), suggesting that
circulating IL-6 rather than muscle-produced IL-6 was contributing to STAT-3 activation.
Page 12 of 35

13R-00716-2007.R2
IL-6 ablation. The effect of IL-6 ablation on cachexia development and progression was
examined with ApcMin/+ / IL-6-/- mice. At 3 months of age, ApcMin/+ mice had already begun
epididymal fat pad loss (Figure 3A), but there were no differences in gastrocnemius muscle mass
(Figure 3B) between the three strains. At 26-weeks of age, ApcMin/+ / IL-6-/- mice did not
demonstrate wasting, and had gastrocnemius muscle and epididymal fat pad masses similar to
C57BL/6 mice. Maintenance of fat and muscle mass was not due to increased caloric intake
since daily food intake was actually reduced 11% in ApcMin/+ / IL-6-/- mice compared to ApcMin/+
mice compared to (0.147 ± 0.003 vs. 0.165 ± 0.002 g food/g BW; p<0.001).
To determine if skeletal muscle was sensitive to circulating IL-6 levels, western blotting
was performed to determine STAT-3 activation (Figure 3C). The ratio of phosphorylated to total
STAT-3 was lowered 83% in ApcMin/+ / IL-6-/- mice compared to ApcMin/+ mice.
IL-6 over-expression. Mice were electroporated in the quadriceps muscle with either an IL-6
expression plasmid or control plasmid. C57BL/6 mice and ApcMin/+ / IL-6-/- were electroporated
every 2 weeks for a total of 10 weeks, starting at 16-weeks of age. ApcMin/+ mice were only
electroporated for a total of 4 weeks since they undergo cachexia spontaneously by 6-months of
age (Figure 4A). Average plasma IL-6 levels were significantly elevated in mice receiving the
IL-6 plasmid compared to mice receiving the control plasmid in C57BL/6 mice, ApcMin/+ mice,
and ApcMin/+ / IL-6-/- mice (Table 1). The plasma IL-6 levels obtained with over-expression were
similar to humans with cachexia prior to death (21).
There were no differences in body weight at the beginning of the study between the
different treatment groups and within any strain (Table 1). ApcMin/+ mouse body weight was
Page 13 of 35

14R-00716-2007.R2
decreased 11% by IL-6 over-expression (p=0.010) and ApcMin/+ / IL-6-/- mouse body weight
decreased 21% (p=0.012) compared to mice receiving the control plasmid. ApcMin/+ mice
receiving IL-6 had a 70% reduction in epididymal fat pad mass (p=0.028) and ApcMin/+ / IL-6-/-
mice had a 63% decrease in epididymal fat pad mass (p=0.030) compared to control mice
(Figure 4B). IL-6 over-expression in the circulation also reduced gastrocnemius muscle mass
23% in ApcMin/+ mice (p=0.004) and 32% in ApcMin/+ / IL-6-/- mice (Figure 4C; p=0.007).
Plasmid-based IL-6 over-expression induced cachexia in mice with a polyp burden, but not in
wild-type mice. The body weights of C57BL/6 mice were not affected by IL-6 over-expression.
C57BL/6 epididymal fat pad mass and gastrocnemius muscle weight were not affected by
circulating IL-6 over-expression. Food intake was not affected by IL-6 over-expression within
any of the strains (data not shown).
During IL-6 over-expression, phosphorylated STAT-3 was induced in all strains of mice
(Figures 4D). It appears that skeletal muscle is sensitive to circulating IL-6 levels and STAT-3 is
activated even in the absence of muscle mass loss. Since IL-6 can act in a paracrine manner,
gastrocnemius IL-6 mRNA was measured to determine if IL-6 produced by the muscle was
responsible for STAT-3 activation. Gastrocnemius muscle IL-6 mRNA did not change with IL-6
over-expression in wild-type mice (p=0.943) or in ApcMin/+ mice (p=0.34). Thus, changes in
skeletal muscle STAT-3 activation appear to be due to circulating IL-6 rather than muscle-
produced IL-6.
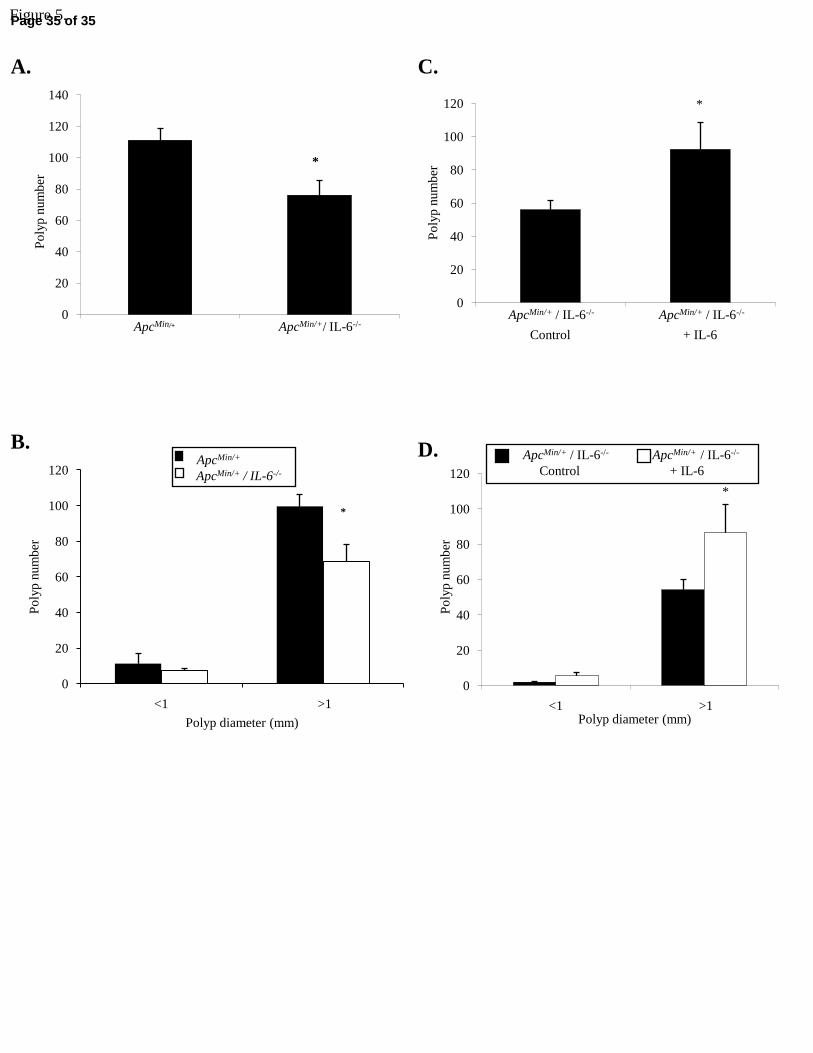
Polyp burden and IL-6. We examined if ApcMin/+ mouse intestinal polyp burden was sensitive to
circulating IL-6 levels. Total polyp number was 32% lower in the 26-wk-old ApcMin/+ / IL-6-/-
Page 14 of 35
15R-00716-2007.R2
compared to ApcMin/+ mice (Figure 5A; p=0.014). Polyp size was also affected in the ApcMin/+ /
IL-6-/- mouse with polyps >1 mm in diameter being reduced by 32% compared to ApcMin/+ mice
(Figure 5B; p=0.023).
IL-6 over-expression increased both intestinal and colon polyp number and size. Total
polyp number was 64% greater with IL-6 electroporation in ApcMin/+ / IL-6-/- mice (Figure 5C).
Polyps >1 mm in diameter also increased 61% with IL-6 over-expression (Figure 5D; p=0.030).
Similar results were found with IL-6 over-expression in ApcMin/- mice. ApcMin/+ mouse total
polyp number increased 82% with IL-6 over-expression (55 ± 13 vs.100 ± 5 polyps; p=0.005).
Polyp size also increased with IL-6 over-expression in polyps >1 mm in diameter by 98% (47 ±
14 vs. 92 ± 5; p=0.005). Overall, these results indicate that changes in circulating IL-6 are
associated with a greater tumor burden and a greater loss of adipose and muscle tissue.
Page 15 of 35

16R-00716-2007.R2
DISCUSSION
A strength of the ApcMin/+ mouse as a cachectic model is the variable wasting seen
between mice. This variable wasting rate may be related to significant differences in tumor
burden between mice. To examine different stages of muscle wasting we classified ApcMin/+
mice by the degree of wasting they exhibited. ApcMin/+ mice with the most severe cachectic
symptoms also had the highest circulating IL-6 levels and the largest intestinal polyp burden.
The importance of IL-6 was also demonstrated by the lack wasting and a lower overall tumor
burden in ApcMin/+ / IL-6-/- mice when compared to age-matched ApcMin/+ mice. Systemic IL-6
over-expression in ApcMin/+ and ApcMin/+ / IL-6-/- mice induced wasting and polyp formation.
However, IL-6 over-expression was not sufficient to induce skeletal muscle wasting in non-
tumor bearing mice. These data suggest that systemic IL-6 is essential for the development of
cachexia in ApcMin/+ mice, and is associated with a greater tumor burden.
The current study reports that severity of cachexia in ApcMin/+ mice is associated with
both a greater number and larger intestinal polyps. While others have suggested that cachexia-
inducing tumors are not necessarily large tumors (37), our data suggests that a critical tumor
burden is necessary in order to induce cachexia in the ApcMin/+ mouse. The ApcMin/+ mouse
primarily develops adenomas, but there is not metastasis (30). It is possible that the increase in
adenoma number or growth creates an environment that promotes muscle wasting. Additionally,
we had previously shown that plasma IL-6 levels were elevated in cachectic ApcMin/+ mice
compared to age-matched, wild-type mice (28). The current study extended this finding by
showing that in 26-wk-old ApcMin/+ mice, increased plasma IL-6 levels were also associated with
increased polyp number and size. Since IL-6 is a potent tumor growth factor (8, 13, 34), IL-6
Page 16 of 35

17R-00716-2007.R2
may be leading to an increase in polyp burden, promoting the cachectic environment driven by
the tumor. While the association between high circulating IL-6 levels and muscle wasting has
been demonstrated previously (21, 38, 40, 45), the current study shows that even low, chronic
levels of IL-6 are associated with muscle mass loss. This is important because the levels of
circulating IL-6 seen in ApcMin/+ mice are similar to humans with cachexia (21).
To examine the importance of IL-6 for development of cachexia and intestinal/colon
polyps, we generated ApcMin/+ / IL-6-/- mice. Unlike 26-wk-old ApcMin/+ mice, age-matched
ApcMin/+ / IL-6-/- mice did not exhibit wasting of muscle and fat pad mass. This demonstrates the
dependence of IL-6 on the induction of cachexia. These data coincide with other models of
cachexia showing that blocking the effects of IL-6 have positive effects on skeletal muscle mass
(14, 35, 39, 44). In the current study, ApcMin/+ / IL-6-/- mice also had a lower intestinal tumor
burden than ApcMin/+ mice. While tumor growth is associated with cachexia, many studies that
delay or reverse cachexia through the inhibition of IL-6 or other inflammatory cytokines fail to
detect a change in tumor growth (5, 10, 35). This may be related to the tumor model used to
induce cachexia. An advantage of the ApcMin/+ mouse is the ability to count and classify by
polyp size throughout the intestine and colon. Therefore, it is possible that the ablation of IL-6,
which leads to preservation of muscle and fat mass in ApcMin/+ mice, is mediated through the
inhibition of tumor growth. One limitation of the ApcMin/+ / IL-6-/- mouse model is that IL-6 is
ablated in both skeletal muscle and tumors, making it impossible to determine the source of IL-6
that is important for the induction of cachexia. Nevertheless, this has important implications for
clinicians treating cachectic patients because methods for controlling the increase in plasma IL-6
Page 17 of 35

18R-00716-2007.R2
seen during cancer may be beneficial for both suppressing tumor growth and maintaining
skeletal muscle and adipose tissue mass.
To determine if IL-6 was sufficient to induce cachexia, circulating IL-6 was increased in
wild-type, ApcMin/+, and ApcMin/+ / IL-6-/- mice. While the circulating levels obtained through
over-expression were physiological, it should be noted that these were at least 10-fold higher
than those seen in cachectic ApcMin/+ mice. Over-expression of circulating IL-6 induced wasting
in both ApcMin/+and ApcMin/+ / IL-6-/- mice, but not in wild-type mice. Others have also shown
that IL-6 induces cachexia in mice with tumors (33, 35, 43), similar to our finding in ApcMin/+
mice. Additionally, ApcMin/+and ApcMin/+ / IL-6-/- mice receiving IL-6 also had a greater tumor
burden than mice receiving the vector control. An additional finding of the current study was
that elevated circulating IL-6 induced wasting and polyp growth in the absence of tissue level
expression. ApcMin/+ / IL-6-/- mice lacked IL-6 expression in intestinal polyps, adipose tissue, and
skeletal muscle, and underwent cachexia in the presence of high circulating IL-6. It has been
suggested that tumor-produced IL-6 is essential for cachexia (44), but the current study does not
support tumor production of IL-6 as necessary for the induction of cachexia. In addition, IL-6
did not induce wasting in wild-type, non-tumor bearing mice, suggesting other factors related to
the overall tumor environment may also be involved in the regulation of cachexia. Further work
is needed to discover the specific interaction between the tumor and IL-6 that mediates wasting.
IL-6 signaling at the cellular level involves the phosphorylation and dimerization of
STAT-3. The current study examined STAT-3 phosphorylation in wasting skeletal muscle.
Skeletal muscle STAT-3 activation has been detected in other forms of atrophy, such as
sarcopenia (18) and following crush injury (22), but STAT-3 activation has not been studied
Page 18 of 35

19R-00716-2007.R2
during cancer cachexia. Greater muscle STAT-3 activation was associated with more muscle
mass loss in ApcMin/+ mice. Over-expression of circulating IL-6 in ApcMin/+ mice did induce
STAT-3 activation. However, STAT-3 activation also occurred in wild-type mice that did not
have muscle wasting. Although skeletal muscle STAT-3 phosphorylation is sensitive to
circulating IL-6, this signaling pathway does not appear to be sufficient to induce skeletal muscle
mass loss. This adds further support that indirect mechanisms of IL-6, possibly related to other
factors related to the overall tumor burden of the animal, are important for inducing muscle mass
loss during cancer.
Page 19 of 35

20R-00716-2007.R2
PERSPECTIVES AND SIGNIFICANCE
This study supports a role of systemic IL-6 in the development of cachexia and intestinal
polyp growth in the ApcMin/+ mouse. ApcMin/+ mice exhibiting a greater severity of cachexia and
a larger intestinal tumor burden also had the highest circulating IL-6 levels. Circulating IL-6
over-expression also accelerated ApcMin/+ mouse cachexia and increased intestinal polyp number.
Wasting was not induced by circulating IL-6 over-expression in wild-type mice, which have no
intestinal tumors. Together, these data suggest an interaction between intestinal tumors and high
circulating IL-6 levels, which create an environment favoring catabolism of skeletal muscle and
adipose tissue. This was further demonstrated by the absence cachexia in tumor-bearing mice
that lack IL-6, and adding back systemic IL-6 induced cachexia in these mice. These findings
have important implications for treatment of cancer and the associated cachexia. The ability to
inhibit specific targets of IL-6 regulation may serve beneficial to both tumor progression and the
maintenance of total body mass. Future work will attempt to identify muscle specific and other
systemic related changes induced by IL-6 that promote adipose tissue and muscle catabolism.
Page 20 of 35

21R-00716-2007.R2
ACKNOWLEDGEMENTS
The authors would like to thank Tia Davis for technical assistance, and Dr. John Baynes
for critical review of the manuscript.
The research described in this report was supported by NIH Grant P20 RR-017698 from
the National Center for Research Resources. Its contents are solely the responsibility of the
authors and do not necessarily represent the official views of the NIH.
Page 21 of 35

22R-00716-2007.R2
REFERENCES
1. Al-Khalili L, Bouzakri K, Glund S, Lonnqvist F, Koistinen HA, and Krook A.
Signaling specificity of interleukin-6 action on glucose and lipid metabolism in skeletal muscle.
Molecular endocrinology (Baltimore, Md 20: 3364-3375, 2006.
2. al-Majid S, and McCarthy DO. Cancer-induced fatigue and skeletal muscle wasting:
the role of exercise. Biol Res Nurs 2: 186-197, 2001.
3. Ardies CM. Exercise, cachexia, and cancer therapy: a molecular rationale. Nutr Cancer
42: 143-157, 2002.
4. Argiles JM, Busquets S, and Lopez-Soriano FJ. Cytokines in the pathogenesis of
cancer cachexia. Curr Opin Clin Nutr Metab Care 6: 401-406, 2003.
5. Barton BE, and Murphy TF. Cancer cachexia is mediated in part by the induction of
IL-6-like cytokines from the spleen. Cytokine 16: 251-257, 2001.
6. Battle TE, and Frank DA. The role of STATs in apoptosis. Current molecular medicine
2: 381-392, 2002.
7. Bradford MM. A rapid and sensitive method for the quantitation of microgram
quantities of protein utilizing the principle of protein-dye binding. Anal Biochem 72: 248-254,
1976.
8. Brozek W, Bises G, Girsch T, Cross HS, Kaiser HE, and Peterlik M. Differentiation-
dependent expression and mitogenic action of interleukin-6 in human colon carcinoma cells:
relevance for tumour progression. Eur J Cancer 41: 2347-2354, 2005.
9. Croker BA, Krebs DL, Zhang JG, Wormald S, Willson TA, Stanley EG, Robb L,
Greenhalgh CJ, Forster I, Clausen BE, Nicola NA, Metcalf D, Hilton DJ, Roberts AW, and
Page 22 of 35

23R-00716-2007.R2
Alexander WS. SOCS3 negatively regulates IL-6 signaling in vivo. Nat Immunol 4: 540-545,
2003.
10. Davis TW, Zweifel BS, O'Neal JM, Heuvelman DM, Abegg AL, Hendrich TO, and
Masferrer JL. Inhibition of cyclooxygenase-2 by celecoxib reverses tumor-induced wasting. J
Pharmacol Exp Ther 308: 929-934, 2004.
11. Duval D, Reinhardt B, Kedinger C, and Boeuf H. Role of suppressors of cytokine
signaling (Socs) in leukemia inhibitory factor (LIF) -dependent embryonic stem cell survival.
Faseb J 14: 1577-1584, 2000.
12. Espat NJ, Auffenberg T, Rosenberg JJ, Rogy M, Martin D, Fang CH, Hasselgren
PO, Copeland EM, and Moldawer LL. Ciliary neurotrophic factor is catabolic and shares with
IL-6 the capacity to induce an acute phase response. Am J Physiol 271: R185-190, 1996.
13. Fenton JI, Hursting SD, Perkins SN, and Hord NG. Interleukin-6 production induced
by leptin treatment promotes cell proliferation in an Apc (Min/+) colon epithelial cell line.
Carcinogenesis 27: 1507-1515, 2006.
14. Fujita J, Tsujinaka T, Yano M, Ebisui C, Saito H, Katsume A, Akamatsu K, Ohsugi
Y, Shiozaki H, and Monden M. Anti-interleukin-6 receptor antibody prevents muscle atrophy
in colon-26 adenocarcinoma-bearing mice with modulation of lysosomal and ATP-ubiquitin-
dependent proteolytic pathways. Int J Cancer 68: 637-643, 1996.
15. Garcia-Martinez C, Lopez-Soriano FJ, and Argiles JM. Interleukin-6 does not
activate protein breakdown in rat skeletal muscle. Cancer Lett 76: 1-4, 1994.
16. Giordano A, Calvani M, Petillo O, Carteni M, Melone MR, and Peluso G. Skeletal
muscle metabolism in physiology and in cancer disease. J Cell Biochem 90: 170-186, 2003.
Page 23 of 35
24R-00716-2007.R2
17. Glund S, Deshmukh A, Long YC, Moller T, Koistinen HA, Caidahl K, Zierath JR,
and Krook A. Interleukin-6 directly increases glucose metabolism in resting human skeletal
muscle. Diabetes 56: 1630-1637, 2007.
18. Haddad F, and Adams GR. Aging Sensitive Cellular and Molecular Mechanisms
Associated with Skeletal Muscle Hypertrophy. J Appl Physiol 100: 1188-1203, 2006.
19. Haddad F, Zaldivar FP, Cooper DM, and Adams GR. IL-6 Induced Skeletal Muscle
Atrophy. J Appl Physiol 98: 911-917, 2005.
20. Heinrich PC, Behrmann I, Haan S, Hermanns HM, Muller-Newen G, and Schaper
F. Principles of interleukin (IL)-6-type cytokine signalling and its regulation. Biochem J 374: 1-
20, 2003.
21. Iwase S, Murakami T, Saito Y, and Nakagawa K. Steep elevation of blood interleukin-
6 (IL-6) associated only with late stages of cachexia in cancer patients. Eur Cytokine Netw 15:
312-316, 2004.
22. Kami K, and Senba E. In vivo activation of STAT3 signaling in satellite cells and
myofibers in regenerating rat skeletal muscles. J Histochem Cytochem 50: 1579-1589, 2002.
23. Kamimura D, Ishihara K, and Hirano T. IL-6 signal transduction and its physiological
roles: the signal orchestration model. Rev Physiol Biochem Pharmacol 149: 1-38, 2003.
24. Khalfoun B, Thibault F, Watier H, Bardos P, and Lebranchu Y. Docosahexaenoic
and eicosapentaenoic acids inhibit in vitro human endothelial cell production of interleukin-6.
Adv Exp Med Biol 400B: 589-597, 1997.
Page 24 of 35

25R-00716-2007.R2
25. Livak KJ, and Schmittgen TD. Analysis of relative gene expression data using real-
time quantitative PCR and the 2(-Delta Delta C(T)) Method. Methods (San Diego, Calif 25: 402-
408, 2001.
26. McCarthy DO. Rethinking nutritional support for persons with cancer cachexia. Biol
Res Nurs 5: 3-17, 2003.
27. McClung JM, Mehl KA, Thompson RW, Lowe LL, and Carson JA. Nandrolone
decanoate modulates cell cycle regulation in functionally overloaded rat soleus muscle. Am J
Physiol Regul Integr Comp Physiol 288: R1543-1552, 2005.
28. Mehl KA, Davis JM, Berger FG, and Carson JA. Myofiber degeneration/regeneration
is induced in the cachectic ApcMin/+ mouse. J Appl Physiol 99: 2379-2387, 2005.
29. Mehl KA, Davis JM, Clements JM, Berger FG, Pena MM, and Carson JA.
Decreased intestinal polyp multiplicity is related to exercise mode and gender in ApcMin/+ mice.
J Appl Physiol 98: 2219-2225, 2005.
30. Moser AR, Pitot HC, and Dove WF. A dominant mutation that predisposes to multiple
intestinal neoplasia in the mouse. Science 247: 322-324, 1990.
31. Price SA, and Tisdale MJ. Mechanism of inhibition of a tumor lipid-mobilizing factor
by eicosapentaenoic acid. Cancer Res 58: 4827-4831, 1998.
32. Rotter Sopasakis V, Larsson BM, Johansson A, Holmang A, and Smith U. Short-
term infusion of interleukin-6 does not induce insulin resistance in vivo or impair insulin
signalling in rats. Diabetologia 47: 1879-1887, 2004.
Page 25 of 35
26R-00716-2007.R2
33. Soda K, Kawakami M, Kashii A, and Miyata M. Manifestations of cancer cachexia
induced by colon 26 adenocarcinoma are not fully ascribable to interleukin-6. Int J Cancer 62:
332-336, 1995.
34. Steiner H, Godoy-Tundidor S, Rogatsch H, Berger AP, Fuchs D, Comuzzi B,
Bartsch G, Hobisch A, and Culig Z. Accelerated in vivo growth of prostate tumors that up-
regulate interleukin-6 is associated with reduced retinoblastoma protein expression and
activation of the mitogen-activated protein kinase pathway. Am J Pathol 162: 655-663, 2003.
35. Strassmann G, Fong M, Kenney JS, and Jacob CO. Evidence for the involvement of
interleukin 6 in experimental cancer cachexia. J Clin Invest 89: 1681-1684, 1992.
36. Tisdale MJ. Cachexia in cancer patients. Nat Rev Cancer 2: 862-871, 2002.
37. Tisdale MJ. The 'cancer cachectic factor'. Support Care Cancer 11: 73-78, 2003.
38. Tsujinaka T, Ebisui C, Fujita J, Kishibuchi M, Morimoto T, Ogawa A, Katsume A,
Ohsugi Y, Kominami E, and Monden M. Muscle undergoes atrophy in association with
increase of lysosomal cathepsin activity in interleukin-6 transgenic mouse. Biochem Biophys Res
Commun 207: 168-174, 1995.
39. Tsujinaka T, Fujita J, Ebisui C, Yano M, Kominami E, Suzuki K, Tanaka K,
Katsume A, Ohsugi Y, Shiozaki H, and Monden M. Interleukin 6 receptor antibody inhibits
muscle atrophy and modulates proteolytic systems in interleukin 6 transgenic mice. J Clin Invest
97: 244-249, 1996.
40. Wallenius V, Wallenius K, Ahren B, Rudling M, Carlsten H, Dickson SL, Ohlsson
C, and Jansson JO. Interleukin-6-deficient mice develop mature-onset obesity. Nat Med 8: 75-
79, 2002.
Page 26 of 35

27R-00716-2007.R2
41. Weigert C, Hennige AM, Brodbeck K, Haring HU, and Schleicher ED. Interleukin-6
acts as insulin sensitizer on glycogen synthesis in human skeletal muscle cells by
phosphorylation of Ser473 of Akt. Am J Physiol Endocrinol Metab 289: E251-257, 2005.
42. Williams A, Wang JJ, Wang L, Sun X, Fischer JE, and Hasselgren PO. Sepsis in
mice stimulates muscle proteolysis in the absence of IL-6. Am J Physiol 275: R1983-1991, 1998.
43. Yasumoto K, Mukaida N, Harada A, Kuno K, Akiyama M, Nakashima E, Fujioka
N, Mai M, Kasahara T, Fujimoto-Ouchi K, and et al. Molecular analysis of the cytokine
network involved in cachexia in colon 26 adenocarcinoma-bearing mice. Cancer Res 55: 921-
927, 1995.
44. Zaki MH, Nemeth JA, and Trikha M. CNTO 328, a monoclonal antibody to IL-6,
inhibits human tumor-induced cachexia in nude mice. Int J Cancer 111: 592-595, 2004.
45. Zhou W, Jiang ZW, Tian J, Jiang J, Li N, and Li JS. Role of NF-kappaB and cytokine
in experimental cancer cachexia. World J Gastroenterol 9: 1567-1570, 2003.
Page 27 of 35

28R-00716-2007.R2
FIGURE LEGENDS
Figure 1. Body weight, food intake, and activity wheel distance in 26-wk-old male ApcMin/+ mice
stratified by degree of cachexia. A. Body weight. B. Food intake. C. Activity wheel distance.
Values are means ± SE. Data were analyzed by two-way repeated measures ANOVA.
Significance was set at p<0.05. *Signifies different from Mild/None.
Figure 2. Muscle size, polyp burden, and IL-6 in 26-wk-old male ApcMin/+ mice stratified by
degree of cachexia. A. Fat and muscle weights. B. Polyp counts. C . Plasma IL-6. D.
Pearson correlation between polyp number and plasma IL-6 (r=-0.831; p=0.002). E.
Representative Western blot and ponceau stain of gastrocnemius phosphorylated (TYR 705) and
total STAT-3. Fat=Epididymal fat. Gastroc=Gastrocnemius. Sol=Soleus. Plan=Plantaris.
TA=Tibialis Anterior. Values are means ± SE. Polyp counts were analyzed with independent t-
tests within each polyp size category. Significance was set at p<0.05. *Signifies different from
Mild/None.
Figure 3. IL-6 depletion rescues gastrocnemius muscle and epididymal fat loss in ApcMin/+ mice.
A. Epididymal fat pad weight. B. Gastrocnemius muscle weight. C. Representative Western
blot and ponceau stain of gastrocnemius muscle phosphorylated (TYR 705) and total STAT-3
during IL-6 depletion in 26-wk-old mice. Values are means ± SE. Weight data were analyzed
by two-way ANOVA with Student-Newman-Keuls post-hoc analyses. STAT-3 was analyzed by
a one-way ANOVA. Post-hoc analyses were performed with Student-Newman-Keuls methods.
Page 28 of 35
29R-00716-2007.R2
Significance was set at p<0.05. *Signifies different from C57BL/6. †Signifies different from
ApcMin/+ / IL-6-/-. ‡Signifies different from 13-wk-old.
Figure 4. IL-6 over-expression induces cachexia in ApcMin/+ and ApcMin/+ / IL-6-/- mice, but not
wild-type mice. A. Description of IL-6 over-expression experiments. C57BL/6, ApcMin/+, and
ApcMin/+ / IL-6-/- mice were administered an IL-6 over-expression plasmid or empty plasmid
control through electroporation. Experimentation started at 16-weeks of age. Mice were
electroporated bi-weekly for a total of 10-weeks (C57BL/6 and ApcMin/+ / IL-6-/-) or 4-weeks
(ApcMin/+). B. Epididymal fat pad weight. C. Gastrocnemius muscle weight. D. Representative
Western blot and ponceau stain of gastrocnemius muscle phosphorylated (TYR 705) and total
STAT-3 during IL-6 over-expression. Values are means ± SE. Data were analyzed with
independent t-tests within each strain. Significance was set at p<0.05. *Signifies different from
Control. EP=Electroporation.
Figure 5. ApcMin/+ mouse polyp burden varies with changes in circulating IL-6. A. Total polyp
burden in 26-wk-old ApcMin/+ and ApcMin/+ / IL-6-/- mice. B. Polyp burden stratified by size in
26-wk-old ApcMin/+ and ApcMin/+ / IL-6-/- mice. C. Total polyp burden in ApcMin/+ / IL-6-/- mice
following IL-6 over-expression. D. Polyp burden stratified by size in ApcMin/+ / IL-6-/- mice
following IL-6 over-expression. Values are means ± SE. Data were analyzed with independent t-
tests. Significance was set at p<0.05. *Signifies different from ApcMin/+ mice or Control.
Page 29 of 35

C57BL/6 ApcMin/+ ApcMin/+ / IL-6-/-
Control + IL-6 Control + IL-6 Control + IL-6
(n=10) (n=10) (n=8) (n=10) (n=8) (n=6)
Plasma IL-6 1.7 ± 0.8 152.5 ± 17.9* 9.7 ± 2.8 181.1 ± 29.6* 0 ± 0 317.4 ± 143.8*
(pg/ml)
Pre BW 27.7 ± 1.0 27.3 ± 0.4 24.0 ± 0.5 24.6 ± 0.4 26.0 ± 0.3 25.0 ± 0.8
(g)
Post BW 27.1 ± 1.0 28.9 ± 0.4 24.0 ± 0.5 21.8 ± 0.5*† 27.1 ± 0.7 21.4 ± 2.1*†
(g)
Table 1. IL-6 over-expression reduces body weight in mice with a polyp burden, but not in wild-type
mice. Plasma IL-6 was measured after each electroporation and averaged for each mouse. Values are
means ± SE. Changes in body weight were analyzed with a repeated measures one-way ANOVA.
Changes in plasma IL-6 were analyzed with independent t-tests. Significance was set at p<0.05.
*Signifies different from Control. †Signifies different from Pre.
Page 30 of 35

A.
B.
C.
0.0
5.0
10.0
15.0
20.0
25.0
30.0
6 8 10 12 14 16 18 20 22 24 26
Bo
dy w
eight
(g)
Age (Weeks)
Mild/None Severe
***** ****
0.00
0.05
0.10
0.15
0.20
0.25
0.30
0.35
6 8 10 12 14 16 18 20 22 24 26
Dai
ly F
oo
d I
nta
ke
(g F
oo
d/g
BW
)
Age (Weeks)
Mild/None Severe
0.0
1.0
2.0
3.0
4.0
5.0
6.0
7.0
4 to 7 8 to 10 11 to 14 15 to 18 19 to 22 23 to 26
Dis
tance
(km
/d)
Age (Weeks)
Mild/None Severe
*
**
Figure 1.Page 31 of 35
A.
B.
C.
0
20
40
60
80
100
120
140
160
180
Fat Gastroc Sol Plan TA
Tis
sue
wei
ght
(mg)
Mild/None Severe
*
*
* **
0.0
5.0
10.0
15.0
20.0
25.0
30.0
35.0
40.0
Mild/None Severe
Pla
sma
IL-6
(p
g/m
l)
Degree of cachexia
*
D.
0.00
1.00
2.00
3.00
4.00
5.00
6.00
Mild/None Severe
Pi/
tota
l S
TA
T-3
(N
orm
aliz
ed I
OD
)
Degree of cachexia
*
0
20
40
60
80
100
120
140
160
180
Total <1 1-2 >2
Po
lyp
num
ber
Polyp diameter (mm)
Mild/None Severe*
*
*
P-STAT-3 (TYR 705)
STAT-3
PONCEAU STAIN
Figure 2.
E.
0
20
40
60
80
100
120
140
160
180
200
0 10 20 30 40 50
Po
lyp
num
ber
Plasma IL-6 (pg/ml)
Page 32 of 35

A.
B.
C.
0.0
5.0
10.0
15.0
20.0
25.0
30.0
35.0
40.0
Pi/
tota
l S
TA
T-3
(N
orm
aliz
ed I
OD
)
C57BL/6 ApcMin/+ ApcMin/+ / IL-6-/-
*
*†
ApcMin/+ ApcMin/+ / IL-6-/-
P-STAT-3 (TYR 705)
STAT-3
C57BL/6
PONCEAU STAIN
Figure 3.
0
50
100
150
200
250
300
350
400
450
500
13 26
Ep
idid
ym
al f
at w
eight
(mg)
Age (weeks)
**†
C57BL/6 ApcMin/+ ApcMin/+ / IL-6-/-
*†
0
20
40
60
80
100
120
140
13 26
Gas
tro
c w
eight
(mg)
Age (weeks)
*†
C57BL/6 ApcMin/+ ApcMin/+ / IL-6-/-
Page 33 of 35

0
20
40
60
80
100
120
140
160
Gas
tro
c w
eight
(mg)
Control
+ IL-6
* *
ApcMin/+ / IL-6-/-ApcMin/+C57BL/6
0
50
100
150
200
250
300
350
400
450
500
Ep
idid
ym
al f
at w
eight
(mg)
Control
+ IL-6
ApcMin/+ / IL-6-/-
*
*
ApcMin/+C57BL/6
A.
D.
B.
C.
0.0
1.0
2.0
3.0
4.0
5.0
6.0
7.0
8.0
9.0
Pi/
tota
l S
TA
T-3
(N
orm
aliz
ed I
OD
)
Control
+ IL-6*
*
*
ApcMin/+ / IL-6-/-ApcMin/+C57BL/6
1st
EP
Age (weeks)
16 2624222018
2nd
EP
3rd
EP
4th
EP
5th
EP
Tissue collection
from ApcMin/+
mice
Tissue collection
from ApcMin/+ /
IL-6-/- mice
Tissue collection
from C57BL/6
mice
P-STAT-3 (TYR 705)
STAT-3
PONCEAU STAIN
ApcMin/+
Figure 4. Page 34 of 35
A. C.
0
20
40
60
80
100
120
140
Po
lyp
num
ber
ApcMin/+ ApcMin/+/ IL-6-/-
*
0
20
40
60
80
100
120
<1 >1
Po
lyp
num
ber
Polyp diameter (mm)
*
ApcMin/+
ApcMin/+ / IL-6-/-
0
20
40
60
80
100
120
Control + IL-6
Po
lyp
num
ber
*
ApcMin/+ / IL-6-/- ApcMin/+ / IL-6-/-
0
20
40
60
80
100
120
<1 >1
Po
lyp
num
ber
Polyp diameter (mm)
*
ApcMin/+ / IL-6-/- ApcMin/+ / IL-6-/-
Control + IL-6
D.B.
Figure 5.Page 35 of 35
Copyright © 2022 FDOKUMEN