The regulation of skeletal muscle protein turnover during the progression of cancer cachexia in the...
17
The Regulation of Skeletal Muscle Protein Turnover during the Progression of Cancer Cachexia in the Apc Min/+ Mouse James P. White 1 , John W. Baynes 1 , Stephen L. Welle 2 , Matthew C. Kostek 1 , Lydia E. Matesic 3 , Shuichi Sato 1 , James A. Carson 1 * 1 Department of Exercise Science, University of South Carolina, Columbia, South Carolina, United States of America, 2 Department of Medicine, University of Rochester Medical School, Rochester, New York, United States of America, 3 Department of Biological Sciences, University of South Carolina, Columbia, South Carolina, United States of America Abstract Muscle wasting that occurs with cancer cachexia is caused by an imbalance in the rates of muscle protein synthesis and degradation. The Apc Min/+ mouse is a model of colorectal cancer that develops cachexia that is dependent on circulating IL- 6. However, the IL-6 regulation of muscle protein turnover during the initiation and progression of cachexia in the Apc Min/+ mouse is not known. Cachexia progression was studied in Apc Min/+ mice that were either weight stable (WS) or had initial (#5%), intermediate (6–19%), or extreme ($20%) body weight loss. The initiation of cachexia reduced %MPS 19% and a further ,50% with additional weight loss. Muscle IGF-1 mRNA expression and mTOR targets were suppressed with the progression of body weight loss, while muscle AMPK phosphorylation (Thr 172), AMPK activity, and raptor phosphorylation (Ser 792) were not increased with the initiation of weight loss, but were induced as cachexia progressed. ATP dependent protein degradation increased during the initiation and progression of cachexia. However, ATP independent protein degradation was not increased until cachexia had progressed beyond the initial phase. IL-6 receptor antibody administration prevented body weight loss and suppressed muscle protein degradation, without any effect on muscle %MPS or IGF-1 associated signaling. In summary, the %MPS reduction during the initiation of cachexia is associated with IGF-1/mTOR signaling repression, while muscle AMPK activation and activation of ATP independent protein degradation occur later in the progression of cachexia. IL-6 receptor antibody treatment blocked cachexia progression through the suppression of muscle protein degradation, while not rescuing the suppression of muscle protein synthesis. Attenuation of IL-6 signaling was effective in blocking the progression of cachexia, but not sufficient to reverse the process. Citation: White JP, Baynes JW, Welle SL, Kostek MC, Matesic LE, et al. (2011) The Regulation of Skeletal Muscle Protein Turnover during the Progression of Cancer Cachexia in the Apc Min/+ Mouse. PLoS ONE 6(9): e24650. doi:10.1371/journal.pone.0024650 Editor: Se-Jin Lee, Johns Hopkins University School of Medicine, United States of America Received February 28, 2011; Accepted August 16, 2011; Published September 19, 2011 Copyright: ß 2011 White et al. This is an open-access article distributed under the terms of the Creative Commons Attribution License, which permits unrestricted use, distribution, and reproduction in any medium, provided the original author and source are credited. Funding: This study was funded by grant 5R01CA121249 from the Nation Institutes of Health (NIH) and the National Cancer Institute (NCI) to Dr. Carson. The funders had no role in study design, data collection and analysis, decision to publish, or preparation of the manuscript. Competing Interests: The authors have declared that no competing interests exist. * E-mail: [email protected] Introduction Skeletal muscle mass loss is a hallmark of cachexia, and muscle mass preservation is critical for the survival of many cancer patients [1]. Often cancer patients are not diagnosed until significant body weight loss has occurred [2], which limits treatment options in cachectic patients [3]. In contrast, patients diagnosed during initial stages of cachexia (,5% body weight loss) have a much better survival time and chemotherapy treatment outcomes [5–6]. Understanding the regulation of muscle wasting throughout the progression of cachexia is critical for developing both prevention and intervention strategies for treatment of cachexia [4]. Unfortunately, we have a limited understanding of muscle protein turnover regulation during the initial stages of cachexia. Furthermore, the progression of muscle wasting accelerates during the progression of cachexia [5]. This non- linear process creates gaps in our knowledge, which is based largely on regulatory changes during the later stages of cachexia. The cellular signaling that disrupts the delicate balance between the rates of muscle protein synthesis and degradation is thought to be a vital foundation needed for a better mechanistic understand- ing of muscle wasting with cancer. While accelerated muscle protein degradation has acknowledged importance for the progression of wasting, the regulation of proteolytic mechanisms throughout the progression of cachexia remains uncertain. Muscle proteolysis, primarily through ubiquitin dependent mechanisms, is increased during late stage cachexia [6], while a single report has reported no difference in muscle proteolysis during the initial stages of cachexia in tumor bearing mice [7]. Similarly, the role of protein synthesis during the progression of cachexia is uncertain. While reduction in protein synthesis has been shown in patients with late stage cachexia [8], and in tumor bearing mice having at least a 16% reduction in body weight [7], the regulation during the initial stages of cachexia and eventual transition to severe weight loss warrants further exploration. The muscle’s capacity to synthesize protein is responsive to many stimuli including energy status, anabolic hormones, catabolic hormones, and loading [9]. The insulin-like growth factor-1 (IGF-1) signaling through PI3K/Akt/mTOR pathway can integrate feedback from a variety of growth-related stimuli to PLoS ONE | www.plosone.org 1 September 2011 | Volume 6 | Issue 9 | e24650
Transcript of The regulation of skeletal muscle protein turnover during the progression of cancer cachexia in the...
The Regulation of Skeletal Muscle Protein Turnoverduring the Progression of Cancer Cachexia in theApcMin/+ MouseJames P. White1, John W. Baynes1, Stephen L. Welle2, Matthew C. Kostek1, Lydia E. Matesic3, Shuichi
Sato1, James A. Carson1*
1 Department of Exercise Science, University of South Carolina, Columbia, South Carolina, United States of America, 2 Department of Medicine, University of Rochester
Medical School, Rochester, New York, United States of America, 3 Department of Biological Sciences, University of South Carolina, Columbia, South Carolina, United States
of America
Abstract
Muscle wasting that occurs with cancer cachexia is caused by an imbalance in the rates of muscle protein synthesis anddegradation. The ApcMin/+ mouse is a model of colorectal cancer that develops cachexia that is dependent on circulating IL-6. However, the IL-6 regulation of muscle protein turnover during the initiation and progression of cachexia in the ApcMin/+
mouse is not known. Cachexia progression was studied in ApcMin/+ mice that were either weight stable (WS) or had initial(#5%), intermediate (6–19%), or extreme ($20%) body weight loss. The initiation of cachexia reduced %MPS 19% and afurther ,50% with additional weight loss. Muscle IGF-1 mRNA expression and mTOR targets were suppressed with theprogression of body weight loss, while muscle AMPK phosphorylation (Thr 172), AMPK activity, and raptor phosphorylation(Ser 792) were not increased with the initiation of weight loss, but were induced as cachexia progressed. ATP dependentprotein degradation increased during the initiation and progression of cachexia. However, ATP independent proteindegradation was not increased until cachexia had progressed beyond the initial phase. IL-6 receptor antibodyadministration prevented body weight loss and suppressed muscle protein degradation, without any effect on muscle%MPS or IGF-1 associated signaling. In summary, the %MPS reduction during the initiation of cachexia is associated withIGF-1/mTOR signaling repression, while muscle AMPK activation and activation of ATP independent protein degradationoccur later in the progression of cachexia. IL-6 receptor antibody treatment blocked cachexia progression through thesuppression of muscle protein degradation, while not rescuing the suppression of muscle protein synthesis. Attenuation ofIL-6 signaling was effective in blocking the progression of cachexia, but not sufficient to reverse the process.
Citation: White JP, Baynes JW, Welle SL, Kostek MC, Matesic LE, et al. (2011) The Regulation of Skeletal Muscle Protein Turnover during the Progression of CancerCachexia in the ApcMin/+ Mouse. PLoS ONE 6(9): e24650. doi:10.1371/journal.pone.0024650
Editor: Se-Jin Lee, Johns Hopkins University School of Medicine, United States of America
Received February 28, 2011; Accepted August 16, 2011; Published September 19, 2011
Copyright: � 2011 White et al. This is an open-access article distributed under the terms of the Creative Commons Attribution License, which permitsunrestricted use, distribution, and reproduction in any medium, provided the original author and source are credited.
Funding: This study was funded by grant 5R01CA121249 from the Nation Institutes of Health (NIH) and the National Cancer Institute (NCI) to Dr. Carson. Thefunders had no role in study design, data collection and analysis, decision to publish, or preparation of the manuscript.
Competing Interests: The authors have declared that no competing interests exist.
* E-mail: [email protected]
Introduction
Skeletal muscle mass loss is a hallmark of cachexia, and muscle
mass preservation is critical for the survival of many cancer
patients [1]. Often cancer patients are not diagnosed until
significant body weight loss has occurred [2], which limits
treatment options in cachectic patients [3]. In contrast, patients
diagnosed during initial stages of cachexia (,5% body weight loss)
have a much better survival time and chemotherapy treatment
outcomes [5–6]. Understanding the regulation of muscle wasting
throughout the progression of cachexia is critical for developing
both prevention and intervention strategies for treatment of
cachexia [4]. Unfortunately, we have a limited understanding of
muscle protein turnover regulation during the initial stages of
cachexia. Furthermore, the progression of muscle wasting
accelerates during the progression of cachexia [5]. This non-
linear process creates gaps in our knowledge, which is based
largely on regulatory changes during the later stages of cachexia.
The cellular signaling that disrupts the delicate balance between
the rates of muscle protein synthesis and degradation is thought to
be a vital foundation needed for a better mechanistic understand-
ing of muscle wasting with cancer. While accelerated muscle
protein degradation has acknowledged importance for the
progression of wasting, the regulation of proteolytic mechanisms
throughout the progression of cachexia remains uncertain. Muscle
proteolysis, primarily through ubiquitin dependent mechanisms, is
increased during late stage cachexia [6], while a single report has
reported no difference in muscle proteolysis during the initial
stages of cachexia in tumor bearing mice [7]. Similarly, the role of
protein synthesis during the progression of cachexia is uncertain.
While reduction in protein synthesis has been shown in patients
with late stage cachexia [8], and in tumor bearing mice having at
least a 16% reduction in body weight [7], the regulation during the
initial stages of cachexia and eventual transition to severe weight
loss warrants further exploration.
The muscle’s capacity to synthesize protein is responsive to
many stimuli including energy status, anabolic hormones,
catabolic hormones, and loading [9]. The insulin-like growth
factor-1 (IGF-1) signaling through PI3K/Akt/mTOR pathway
can integrate feedback from a variety of growth-related stimuli to
PLoS ONE | www.plosone.org 1 September 2011 | Volume 6 | Issue 9 | e24650
regulate myofiber size [10]. Circulating IGF-1 and muscle IGF-1
gene expression are generally decreased with wasting conditions
[11] including cachexia [12,13]. In addition, muscle mTOR
activation is also reduced after at least a 12% loss of body weight
and decreases further during late stage cachexia [14,15]. IGF-1
signaling can also regulate muscle protein degradation through the
suppression of forkhead box O (FOXO), whose transcriptional
targets include muscle atrogin-1/MAFbx, Muscle RING Finger-1
(MuRF1) and autophagy-related genes [16,17,18]. Muscle 59-
adenosine monophosphate-activated protein kinase (AMPK), a
sensor of cellular energy status, also regulates protein synthesis
[19,20,21]. AMPK is activated by low cellular energy status and
also muscle contraction [22]. AMPK can inhibit mTOR signaling
through several mechanisms, including phosphorylation of raptor
at Ser792 [23], which prevent binding and subsequent phosphor-
ylation of p70S6K and 4EBP1. In addition, AMPK activation has
shown to increase protein degradation in myotubes, being
associated with an increase in FOXO transcriptional targets
atrogin1 and MuRF1 [24]. In tumor bearing rats and mice, the
activation of AMPK during the progression of cachexia has shown
to be variable and its role in the regulation of muscle wasting with
cachexia is difficult to interpret [25]. The present study seeks to
clarify the role of AMPK in the regulation of muscle protein
turnover during cachexia.
There is emerging evidence for lysosomal/autophagy to play a
role during muscle wasting disease [26,27]. Similar to other
methods of muscle degradation, autophagy is an essential process
in skeletal muscle required to remove organelles, i.e. mitochondria
and portions of the cytoplasm [28]. Deletion of Atg7, a critical
gene involved in autophagy, results in skeletal muscle atrophy,
abnormal mitochondria and disorganization of sarcomeres [29].
In contrast to the ubiquitin system, autophagy is non-specific,
ATP-independent process, which digests portions of the cell rather
than individual proteins. The molecular components of autoph-
agy/lysosomal pathways are well described, however, the
regulation is not well known. Several genes have been identified
as autophagy-related including, LC3b, Gabarpl1, Atg12l, PI3kIII,
Ulk2, Atg4b and Beclin1. There have been reports that show
autophagy-related genes increase during muscle dystrophy [30],
diabetes [31], sepsis-induced wasting [27] and cancer related
cachexia [31,32].
Pro-inflammatory cytokine IL-6 has been implicated in the
regulation of muscle wasting during cachexia in both humans and
rodents [33]. Transgenic mice over-expressing IL-6 have muscle
atrophy associated with increased expression of lysosomal and
ubiquitin-related mRNA and proteins [34,35]. In humans, IL-6
administration can cause a reduction in skeletal muscle protein
synthesis [36]. Because of the catabolic effects that may be
mediated through IL-6 during cachexia, several therapies have
been proposed to inhibit IL-6 activity to prevent the progression of
cachexia. The administration of an IL-6 receptor antibody has
effectively countered muscle wasting in tumor bearing mice
[36,37]. Furthermore, the inhibition of IL-6 activity can reduce
both ubiquitin and lysosomal degradation pathways in the
gastrocnemius muscle of C-26 tumor bearing mice [37]. These
data suggest that IL-6 inhibition can reduce muscle protein
degradation; however, the effect on muscle protein synthesis has
not been explored. Further work is needed to elucidate the
associated between IL-6 signaling and muscle protein synthesis
during the progression of cachexia. We have previously reported
muscle wasting in the ApcMin/+ mouse to be dependent on
circulating pro-inflammatory cytokine IL-6 [38,39]. However, the
regulation of protein turnover during the initiation and progres-
sion to more severe loss has not been well studied during cachexia.
The purpose of this study was to determine IL-6 regulation of
muscle protein turnover during the initiation of and progression
towards more severe cachexia in the ApcMin/+ mouse. We directly
measured muscle protein synthesis, muscle protein degradation,
and associated signaling during different stages of weight loss. We
also examined if IL-6 receptor signaling was important for the
regulation of these processes during the progression of cachexia.
Related to processes initiating cachexia, we hypothesized that
protein synthesis would be reduced only during late stages of
cachexia, while ATP dependent protein degradation would be
primarily responsible for the initiation of muscle loss. After the
initiation of cachexia, we hypothesized that the suppression of IL-6
signaling would rescue muscle mass through the induction of
muscle protein synthesis and repression of ATP dependent protein
degradation.
Methods
AnimalsThe University of South Carolina’s Institutional Animal Care
and Use Committee approved all animal experimentation in this
study. ApcMin/+ mice on a C57Bl/6 background were originally
purchased from Jackson Laboratories (Bar Harbor, ME) and bred
at the University of South Carolina’s Animal Resource Facility as
previously described [40]. Male ApcMin/+ (n = 21) mice between 14
and 20 weeks of age were group housed and sacrificed at ages that
provided stratification of body weight loss to allow the study of the
progression of cachexia. The 4 groups used in this study were
weight stable (WS; n = 5), initial (#5%; n = 6), intermediate (6–
19%; n = 4), and extreme ($20%; n = 6) degrees of body weight
loss, when compared to peak body weight. To block the
progression of cachexia, a separate set of ApcMin/+ mice were
treated with an IL-6 receptor antibody (n = 5) or PBS control
(n = 7) for two weeks, starting at after the onset of cachexia (16
weeks). Wild-type C57Bl/6 controls were also treated with the IL-
6 receptor antibody (n = 6) or PBS control (n = 6) at 16 weeks. The
room was maintained on a 12:12 light:dark cycle with the light
period starting at 0700. Mice were provided standard rodent chow
(Harlan Teklad Rodent Diet, #8604, Madison, WI) and water ad
libitum.
Muscle CollectionMice were given a subcutaneous injection of ketamine/
xylazine/acepromazine cocktail (1.4 ml/kg BW) before the
gastrocnemius was dissected. Tibia length was measured as an
indicator of animal body size and a correction factor for skeletal
muscle weights. Thirty minutes prior to sacrifice, all mice were
given an intraperitoneal injection of 150 mM 2H5-phenylalanine
(Cambridge Isotope Laboratories) in a 75 mM NaCl solution at a
dose of 2 ml/100 g body weight [41]. At sacrifice, the gastrocne-
mius muscles were rinsed in PBS, snap frozen in liquid nitrogen,
weighed, and stored at 280uC until further analysis.
Intestinal Tissue CollectionIntestinal tissue collection was performed as described previ-
ously with a slight modification [39,42,43,44]. Briefly, the small
intestines were carefully cut at the distal end of the stomach and at
the proximal end of the cecum. The large intestine was removed
from the distal end of the cecum to the anus. Mesentery adipose
tissue was removed with forceps and the small intestine was cut
into four equal sections. All intestinal sections were flushed with
PBS, opened longitudinally with a pair of scissors, and flattened
with a cotton swab between two pieces of blotting paper. Intestinal
sections were fixed in 4% paraformaldehyde (PFA) in PBS
Skeletal Muscle Protein Turnover during Cachexia
PLoS ONE | www.plosone.org 2 September 2011 | Volume 6 | Issue 9 | e24650
overnight and transferred to PBS for storage at 4uC for further
analysis.
Polyp CountsPolyp counts were performed as previously described
[39,42,43,44]. Briefly, 4% PFA-fixed intestinal sections from all
animals were briefly stained in 0.1% methylene blue, and they
were placed under a dissecting microscope. Polyps were counted
by the same investigator in a blind manner. Polyps were
categorized as large (.2 mm in diameter), intermediate
(1,2 mm) or small (,1 mm).
IL-6 Receptor Antibody AdministrationThe MR16-1 IL-6 receptor antibody was a generous gift from
Chugai Pharmaceutical CO., LTD, Tokyo, Japan. The antibody
was administered at a dose of 300 ug/mouse in phosphate
buffered saline by intraperitoneal injection every three days for
two weeks starting at 16 weeks of age. PBS was injected as a
control vehicle.
Myofibrillar Protein SynthesisGastrocnemius muscle samples were homogenized in 1 ml
water. Myofibrils and other insoluble proteins were pelleted by
centrifugation, and the supernatants containing free amino acids
were used to determine the ratio of free 2H5-phenylalanine (m/z
239 fragment) to endogenous (unlabeled) phenylalanine (m/z 234
fragment). The ratios were determined by GC-mass spectrometric
analysis of the t-butyldimethylsilyl derivatives of these amino acids.
Myofibrillar proteins were washed, hydrolyzed, and analyzed for2H5-phenylalanine enrichment by monitoring the m/z 237 and
239 fragments, as described in detail by Welle et al. [41].
The fractional rate of myofibrillar synthesis, % per day, was
calculated as the % enrichment of tracer in the hydrolysate of
myofibrillar protein, divided by the tracer enrichment in the free
amino acid pool of muscle tissue. Myofibrillar protein enrichment
was determined from the m/z 237 and m/z 239 ions because the
lightest isotopomer (m/z 234) saturated the MS detector. The
myofibrillar/free enrichment ratio was multiplied by 48 to obtain
%/day values because tracer incorporation occurred over a period
of 30 min.
Protein DegradationTo assay the degradation of soluble muscle protein, a modified
proteasomal proteolysis assay reported by Hu et al [45] was be
used. The gastrocnemius muscle was removed and frozen in liquid
nitrogen. Muscle extracts (,40 mgs) were homogenized in ice-
cold harvest buffer (5 mm Tris-HCl (pH 8.8), 1% glycerol, 1 mm
EDTA, 1 mm EGTA, freshly constituted 1 mm b-Me, and
50 mm EP-475). The homogenates were centrifuged at 30,0006g for 30 min, and then the soluble fractions were used to measure
protein degradation. For the protein degradation determination,
muscle extracts were dialyzed against a basal buffer [20 mmTris-
HCl (pH 7.6) 10% glycerol, 2 mm dithiothreitol (DTT), 10 mm
magnesium acetate, and 20 mm potassium chloride] to remove
accumulated tyrosine. Aliquots of extracts were incubated for 2 h
at 37 C with or without an ATP-generation system (1 mm ATP,
100 mg/ml creatine kinase, and 10 mm phosphocreatine); ubiqui-
tin (250 mg/ml) was also added. The reaction was stopped with
trichloroacetic acid, precipitated proteins were removed by
centrifugation, and free tyrosine was measured fluorometrically
(450 nm excitation/550 nm emission) to calculate the rate of
protein degradation [46].
AMPK ActivityAMPK activity was determined using a kit from Linco (St.
Louis, MO). In brief, whole muscle homogenates were added to a
96-well plate coated with AMPK substrate IRS-1, incubated for
2 hr, followed by addition of a secondary antibody, conjugated to
horseradish peroxidase (HRP) and specific for phosphorylated Ser
794 in IRS-1. Lastly, illuminating agent was added to the plate to
quantify phosphor-IRS-1 and determine AMPK activity.
RNA Isolation, cDNA Synthesis, and Real Time PCRRNA isolation, cDNA synthesis, and real-time PCR were
performed as previously described [47], using reagents from
Applied Biosystems (Foster City, CA). Fluorescence labeled probes
for IGF-1, skeletal alpha actin, C2 proteasomal subunt, C7
proteasomal subunit, atrogin1, murf1 (FAM dye) and the
ribosomal RNA 18s (VIC dye) were purchased from Applied
Biosystems and quantified with TaqMan Universal mastermix.
Data were analyzed by ABI software using the cycle threshold
(CT), which is the cycle number at which the fluorescence emission
is midway between detection and saturation of the reaction.
Western BlottingWestern blot analysis was performed as previously described
[48]. Briefly, frozen gastrocnemius muscle was homogenized in
Mueller buffer and protein concentration determined by the
Bradford method [49]. Crude muscle homogenate 40 mg was
fractionated on 6%–15% SDS-polyacrylamide gels. Gels were
transferred to PVDF membranes overnight. Membranes were
stained with Ponceau red to verify equal loading of each gel.
Membranes were blocked overnight in 5% non-fat milk in Tris-
buffered saline with 0.1% Tween-20 (TBS-T). Primary antibodies
for p-Akt (Ser473), Akt, p-4EBP1 (Ser65), 4EBP1, p-mTOR
(Ser2448), mTOR, p-S6K (Thr389), S6K, p-AMPK (Thr172),
AMPK, p-Stat3 (Tyr705), Stat3, p-Raptor (Ser792), Raptor,
Beclin-1, Atg7, LC3b, Ubiquitin, atrogin1 (Cell signaling) and
SOCS3 (Santa Cruz) were diluted 1:1000 to 1:500 in 5% milk in
TBS-T followed by 1 hour incubation with membranes at room
temperature. Anti-rabbit IgG horseradish-peroxidase conjugated
secondary antibody (Cell Signaling) was incubated with the
membranes at 1:2000 dilutions for 1 hour in 5% milk in TBS-T.
Enhanced chemiluminescence (ECL) (GE Healthcare Life Scienc-
es, Piscataway, NJ) was used to visualize the antibody-antigen
interactions. Images were digitally scanned and blots were
quantified by densitometry using scientific imaging software (Scion
Image, Frederick, MD).
Statistical AnalysisA one way ANOVA was used to determine differences in
ApcMin/+ mice with varying degrees of body weigh loss. A two way
ANOVA was used to determine differences between genotype and
IL-6 receptor antibody treatment. Post-hoc analyses were
performed with Student-Newman-Keuls methods. A pre-planned
t test was used to compare wild-type mice with weight stable
ApcMin/+ in Table 1. Significance was set at p,0.05.
Results
Body weight, fat mass and inflammatory state during theprogression of cachexia in the ApcMin/+ mouse
Mice were sacrificed between 14 to 20 weeks of age, which is the
age range for cachexia development in ApcMin/+ mice, and
categorized according to percent body weight loss at the time of
sacrifice compared to their peak body weight. The groups were
Skeletal Muscle Protein Turnover during Cachexia
PLoS ONE | www.plosone.org 3 September 2011 | Volume 6 | Issue 9 | e24650
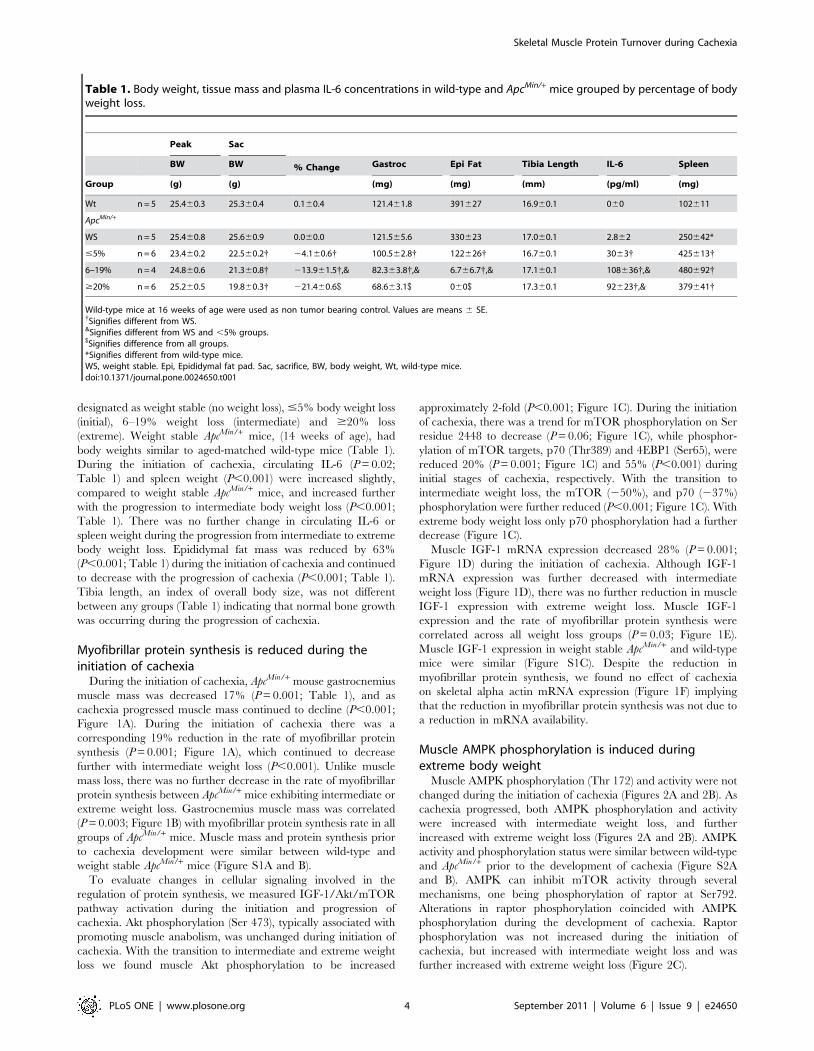
designated as weight stable (no weight loss), #5% body weight loss
(initial), 6–19% weight loss (intermediate) and $20% loss
(extreme). Weight stable ApcMin/+ mice, (14 weeks of age), had
body weights similar to aged-matched wild-type mice (Table 1).
During the initiation of cachexia, circulating IL-6 (P = 0.02;
Table 1) and spleen weight (P,0.001) were increased slightly,
compared to weight stable ApcMin/+ mice, and increased further
with the progression to intermediate body weight loss (P,0.001;
Table 1). There was no further change in circulating IL-6 or
spleen weight during the progression from intermediate to extreme
body weight loss. Epididymal fat mass was reduced by 63%
(P,0.001; Table 1) during the initiation of cachexia and continued
to decrease with the progression of cachexia (P,0.001; Table 1).
Tibia length, an index of overall body size, was not different
between any groups (Table 1) indicating that normal bone growth
was occurring during the progression of cachexia.
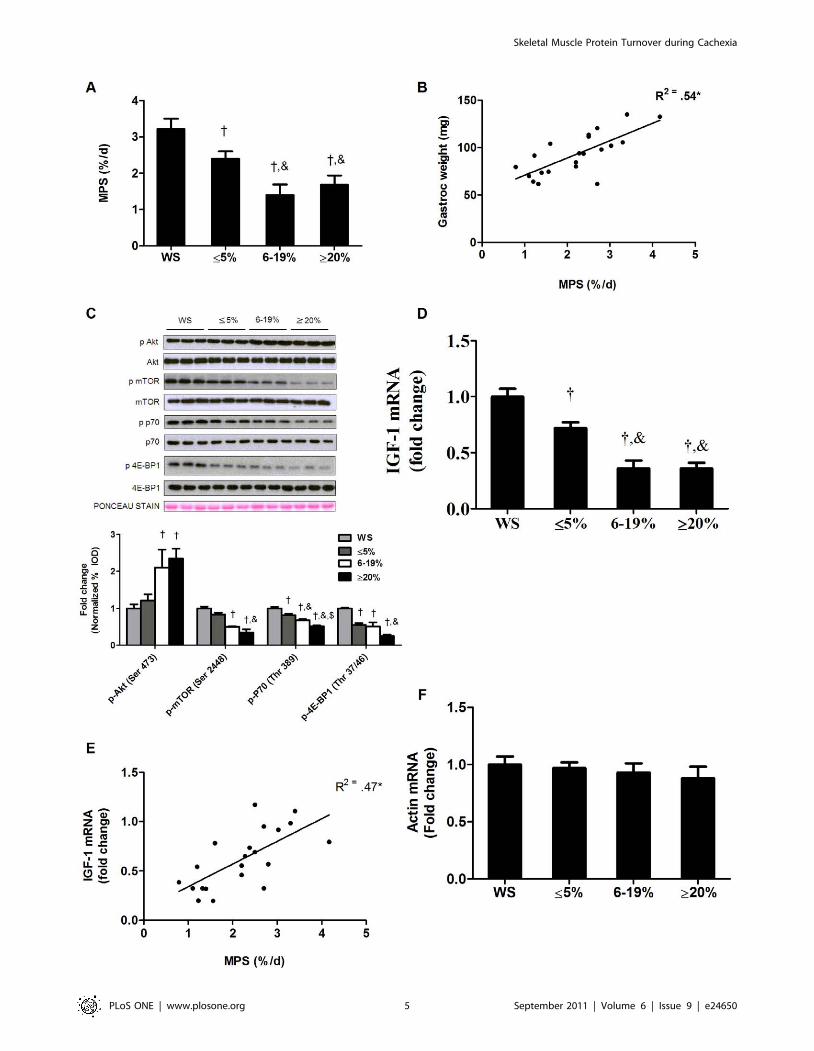
Myofibrillar protein synthesis is reduced during theinitiation of cachexia
During the initiation of cachexia, ApcMin/+ mouse gastrocnemius
muscle mass was decreased 17% (P = 0.001; Table 1), and as
cachexia progressed muscle mass continued to decline (P,0.001;
Figure 1A). During the initiation of cachexia there was a
corresponding 19% reduction in the rate of myofibrillar protein
synthesis (P = 0.001; Figure 1A), which continued to decrease
further with intermediate weight loss (P,0.001). Unlike muscle
mass loss, there was no further decrease in the rate of myofibrillar
protein synthesis between ApcMin/+ mice exhibiting intermediate or
extreme weight loss. Gastrocnemius muscle mass was correlated
(P = 0.003; Figure 1B) with myofibrillar protein synthesis rate in all
groups of ApcMin/+ mice. Muscle mass and protein synthesis prior
to cachexia development were similar between wild-type and
weight stable ApcMin/+ mice (Figure S1A and B).
To evaluate changes in cellular signaling involved in the
regulation of protein synthesis, we measured IGF-1/Akt/mTOR
pathway activation during the initiation and progression of
cachexia. Akt phosphorylation (Ser 473), typically associated with
promoting muscle anabolism, was unchanged during initiation of
cachexia. With the transition to intermediate and extreme weight
loss we found muscle Akt phosphorylation to be increased
approximately 2-fold (P,0.001; Figure 1C). During the initiation
of cachexia, there was a trend for mTOR phosphorylation on Ser
residue 2448 to decrease (P = 0.06; Figure 1C), while phosphor-
ylation of mTOR targets, p70 (Thr389) and 4EBP1 (Ser65), were
reduced 20% (P = 0.001; Figure 1C) and 55% (P,0.001) during
initial stages of cachexia, respectively. With the transition to
intermediate weight loss, the mTOR (250%), and p70 (237%)
phosphorylation were further reduced (P,0.001; Figure 1C). With
extreme body weight loss only p70 phosphorylation had a further
decrease (Figure 1C).
Muscle IGF-1 mRNA expression decreased 28% (P = 0.001;
Figure 1D) during the initiation of cachexia. Although IGF-1
mRNA expression was further decreased with intermediate
weight loss (Figure 1D), there was no further reduction in muscle
IGF-1 expression with extreme weight loss. Muscle IGF-1
expression and the rate of myofibrillar protein synthesis were
correlated across all weight loss groups (P = 0.03; Figure 1E).
Muscle IGF-1 expression in weight stable ApcMin/+ and wild-type
mice were similar (Figure S1C). Despite the reduction in
myofibrillar protein synthesis, we found no effect of cachexia
on skeletal alpha actin mRNA expression (Figure 1F) implying
that the reduction in myofibrillar protein synthesis was not due to
a reduction in mRNA availability.
Muscle AMPK phosphorylation is induced duringextreme body weight
Muscle AMPK phosphorylation (Thr 172) and activity were not
changed during the initiation of cachexia (Figures 2A and 2B). As
cachexia progressed, both AMPK phosphorylation and activity
were increased with intermediate weight loss, and further
increased with extreme weight loss (Figures 2A and 2B). AMPK
activity and phosphorylation status were similar between wild-type
and ApcMin/+ prior to the development of cachexia (Figure S2A
and B). AMPK can inhibit mTOR activity through several
mechanisms, one being phosphorylation of raptor at Ser792.
Alterations in raptor phosphorylation coincided with AMPK
phosphorylation during the development of cachexia. Raptor
phosphorylation was not increased during the initiation of
cachexia, but increased with intermediate weight loss and was
further increased with extreme weight loss (Figure 2C).
Table 1. Body weight, tissue mass and plasma IL-6 concentrations in wild-type and ApcMin/+ mice grouped by percentage of bodyweight loss.
Peak Sac
BW BW % Change Gastroc Epi Fat Tibia Length IL-6 Spleen
Group (g) (g) (mg) (mg) (mm) (pg/ml) (mg)
Wt n = 5 25.460.3 25.360.4 0.160.4 121.461.8 391627 16.960.1 060 102611
ApcMin/+
WS n = 5 25.460.8 25.660.9 0.060.0 121.565.6 330623 17.060.1 2.862 250642*
#5% n = 6 23.460.2 22.560.2{ 24.160.6{ 100.562.8{ 122626{ 16.760.1 3063{ 425613{
6–19% n = 4 24.860.6 21.360.8{ 213.961.5{,& 82.363.8{,& 6.766.7{,& 17.160.1 108636{,& 480692{
$20% n = 6 25.260.5 19.860.3{ 221.460.6$ 68.663.1$ 060$ 17.360.1 92623{,& 379641{
Wild-type mice at 16 weeks of age were used as non tumor bearing control. Values are means 6 SE.{Signifies different from WS.&Signifies different from WS and ,5% groups.$Signifies difference from all groups.*Signifies different from wild-type mice.WS, weight stable. Epi, Epididymal fat pad. Sac, sacrifice, BW, body weight, Wt, wild-type mice.doi:10.1371/journal.pone.0024650.t001
Skeletal Muscle Protein Turnover during Cachexia
PLoS ONE | www.plosone.org 4 September 2011 | Volume 6 | Issue 9 | e24650
Skeletal Muscle Protein Turnover during Cachexia
PLoS ONE | www.plosone.org 5 September 2011 | Volume 6 | Issue 9 | e24650

Muscle protein degradation is regulated by both ATPdependent and independent processes
Total protein degradation, determined by tyrosine release assay
was not different between wild-type and weight stable ApcMin/+
mice (Figure S3). However, total degradation was increased by
45% (P = 0.001; Figure 3A) in mice with initial weight loss while
degradation was increased 134% and 188% during intermediate
and extreme body weight loss respectively. The initial increase in
protein degradation was due to ATP dependent degradation.
During extreme cachexia, there was an increase in both ATP
dependent and independent degradation. In contrast to ATP
dependent degradation, ATP independent degradation continued
to increase with more severe body weight loss (Figure 3A). Total
protein degradation strongly correlated with gastrocnemius mass
within all groups of weight loss (P,0.001; Figure 3B). In addition,
protein degradation was significantly correlated to the percentage
Figure 2. AMPK activation increases during late stage cachexia. AMPK activation was measured in ApcMin/+ mice during the progression ofcachexia. A) AMPK activity in the gastrocnemius muscle normalized to the WS mice. B) Upper: representative western blot of phosphorylated AMPK(Thr172) and total AMPK in the gastrocnemius. Lower: The ratio of phosphorylated to total forms of AMPK in the gastrocnemius muscle. C) Upper:representative western blot of phosphorylated raptor (Ser792) and total raptor in the gastrocnemius. Lower: The ratio of phosphorylated to totalforms of raptor in the gastrocnemius muscle. Values are means 6 SE. Significance was set at p,0.05. { Signifies different from WS mice. & Signifiesdifference from mice with #5% body weight loss. $ Signifies difference from mice with 6–19% body weight loss. WS, weight stable.doi:10.1371/journal.pone.0024650.g002
Figure 1. Muscle protein synthesis and IGF-1/mTOR signaling are reduced during the progression of cachexia in ApcMin/+ mice.Protein synthesis and IGF-1 expression were measured in ApcMin/+ mice during the progression of cachexia. A) Myofibrillar protein synthesis. B)Correlation between muscle weights and protein synthesis. C) Upper: representative western blot of phosphorylated and total forms of Akt (Ser 473),mTOR (Ser2448), p70S6k (Thr389) and 4EBP-1 (Thr37/46). Lower: The ratio of phosphorylated and total Akt, mTOR, p70 and 4EBP1 in thegastrocnemius muscle normalized to the WS group. D) IGF-1 expression and E) correlation between IGF-1 gene expression and protein synthesis. F)Skeletal alpha actin mRNA expression. Values are means 6 SE. Significance was set at p,0.05. { Signifies different from WS mice. & Signifiesdifference from mice with #5% body weight loss. $ Signifies difference from mice with 6–19% body weight loss. WS, weight stable.doi:10.1371/journal.pone.0024650.g001
Skeletal Muscle Protein Turnover during Cachexia
PLoS ONE | www.plosone.org 6 September 2011 | Volume 6 | Issue 9 | e24650

Skeletal Muscle Protein Turnover during Cachexia
PLoS ONE | www.plosone.org 7 September 2011 | Volume 6 | Issue 9 | e24650
of body weight loss in the ApcMin/+ mice (P,0.001; Figure 3C). To
further explore the role of ATP independent and dependent
proteolytic pathways, we measured components of the ubiquitin
dependent proteasomal pathway. During the initiation of
cachexia, muscle protein ubiquitination increased 56%
(P = 0.001; Figure 3D) and further increased (P,0.001) with
greater body weight loss. C7 and C2 proteasomal subunit
expression increased by 94% (P = 0.001) and 81% (P = 0.008;
Figure 3E) respectively during initiation of cachexia and further
increased with the progression to extreme cachexia. There were
no differences in ubiquitination, C7 or C2 expression between
ApcMin/+ mice with intermediate and extreme weight loss.
Akt signaling can also regulate muscle degradation pathway
through phosphorylation and subsequent inhibition of the
transcription factor Foxo3 at Ser 253. During the initiation of
cachexia, Foxo3 phosphorylation was reduced by 39% (P = 0.001;
Figure 3F), and further reduced during the transition to
intermediate weight loss, but not further reduced with extreme
body weight loss (Figure 3F). Atrogin-1 and MuRF1 mRNA
expression, Foxo regulated muscle E3 ligases, demonstrated
different expression patterns during the development of cachexia.
Atrogin1 mRNA increased 79% (P = 0.01, Figure 3G) during the
initiation of cachexia, and was further induced with intermediate
and extreme weight loss. MuRF1 mRNA expression was not
increased during initiation of cachexia or the transition to
intermediate weight loss. However, ApcMin/+ mice with extreme
weight loss showed a 92% (P = 0.02, Figure 3G) increase in
MuRF1 expression. Atrogin1 protein expression was increased by
79% (P = 0.004; Figure 3H) during initial body weight loss.
Atrogin-1 protein expression was further induced with intermedi-
ate bodyweight loss, but there was no further induction with
extreme loss of body mass.
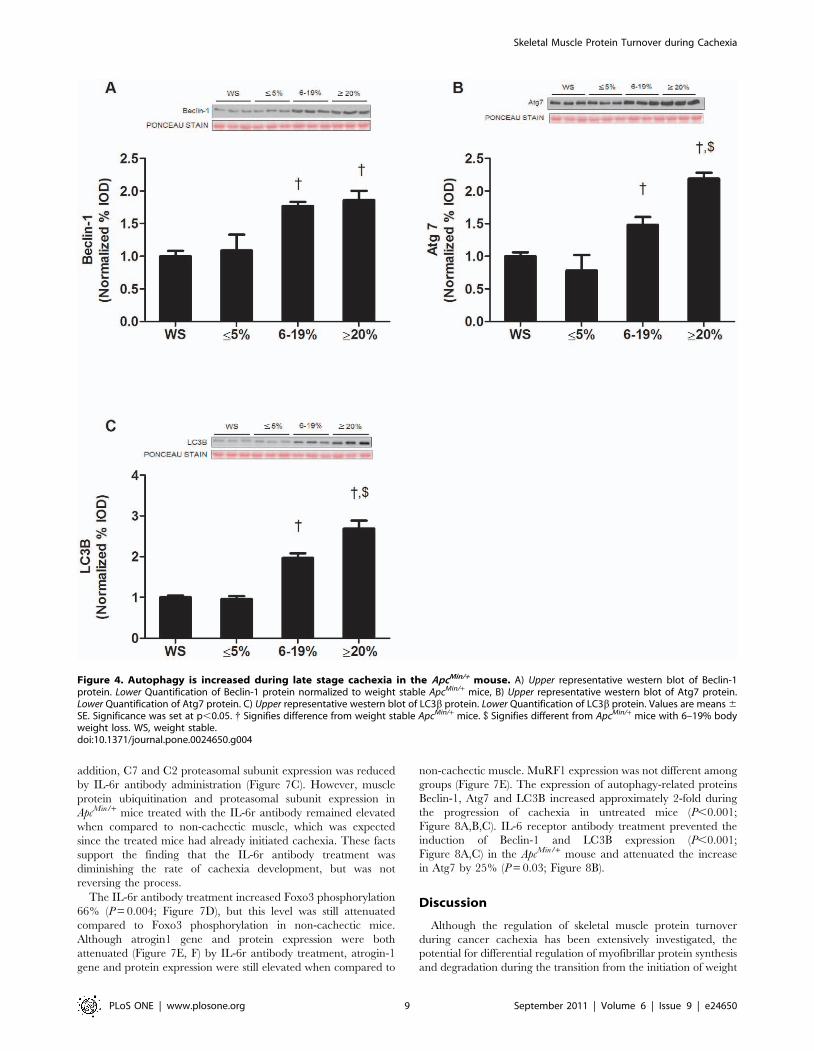
The role of autophagy during the development and progression
of cachexia was explored by the examination of autophagy-related
proteins. We did not observe any differences in autophagy-related
protein expression between wild-type and weight stable ApcMin/+
mice (Figure S4A and B). In support of our protein degradation
measurements, which show non-ATP dependent protein degra-
dation increased after the onset of cachexia, no autophagy-related
proteins were induced during the initiation of cachexia. During the
transition to intermediate body weight loss, the expression of
muscle Beclin-1, Atg7, and LC3B proteins all increased (Figure 4A,
B, & C). With extreme weight loss, muscle Atg 7 and LC3B
protein expression had an even greater induction (Figure 4A, B,
&C).
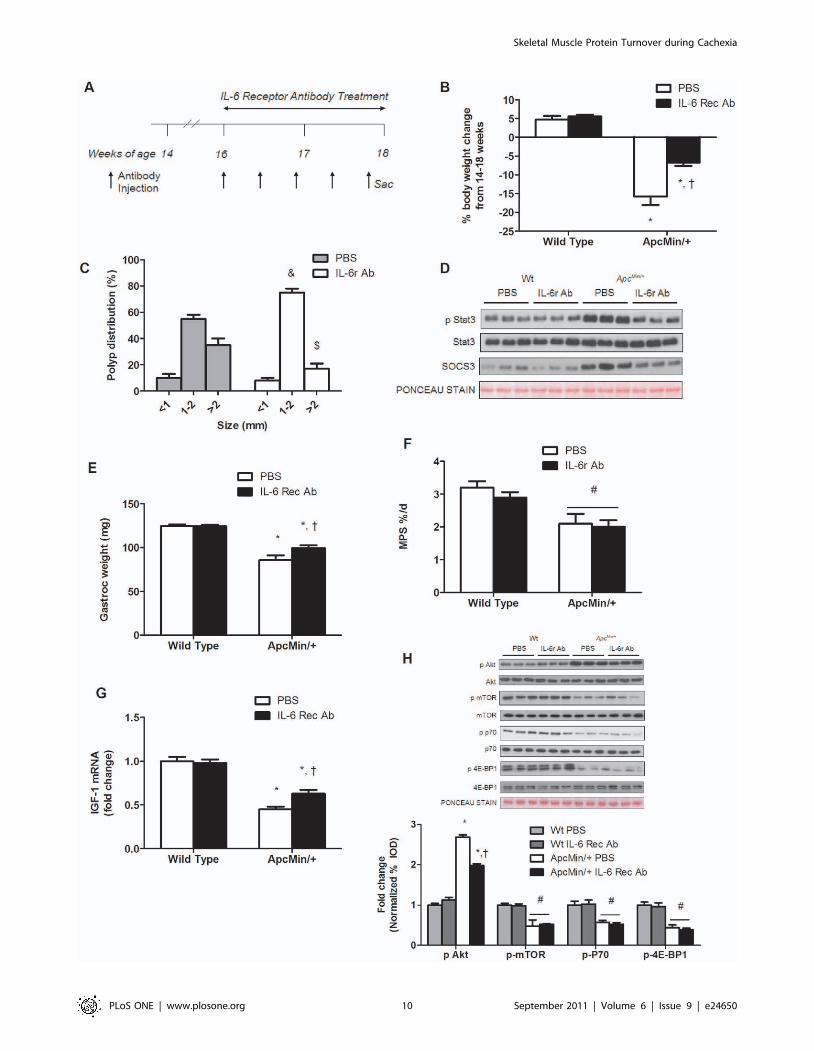
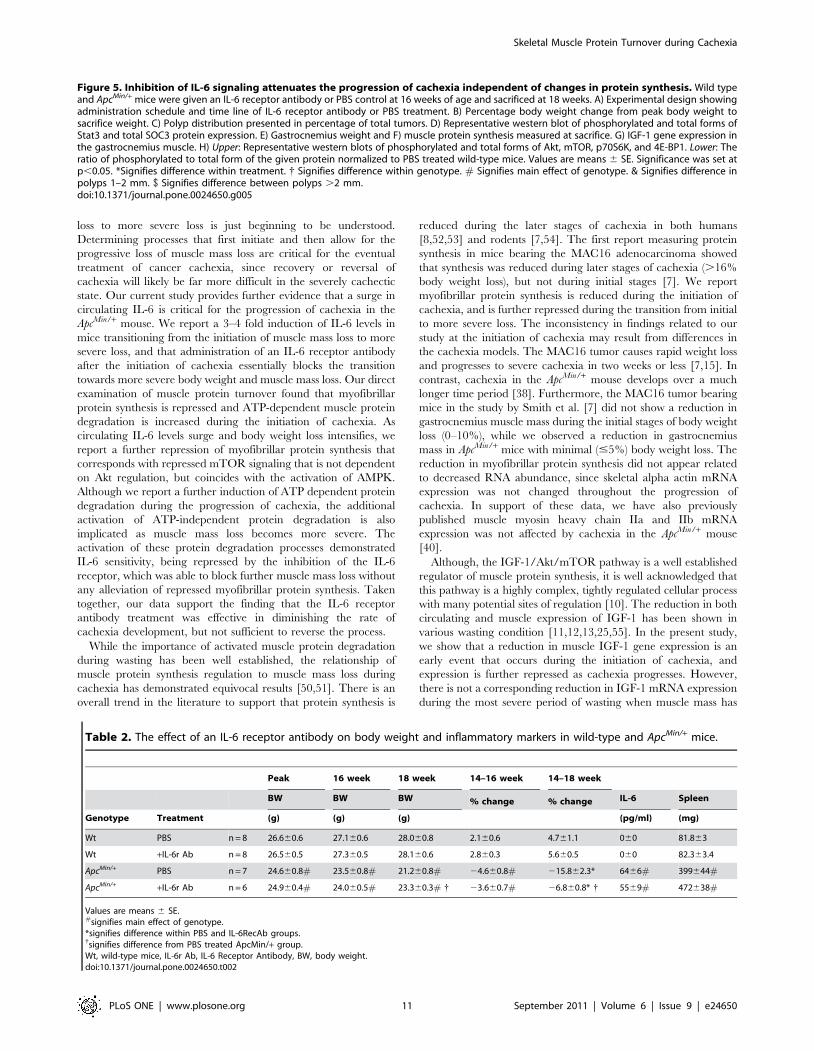
IL-6 signaling inhibition after the initiation of cachexiasuppresses the progression of cachexia by sparingmuscle mass independent of changes in muscle proteinsynthesis
This experiment administered an IL-6 receptor (IL-6r) antibody
to mice that had initiated cachexia and examined effects on the
regulation of skeletal muscle protein turnover (See Research
Design; Figure 5A). PBS treated ApcMin/+ mice had a 2.8
(P,0.001, Figure 5D) and 2.4 fold (P,0.001) increase in muscle
Stat3 activation and SOC3 protein expression. Treatment with the
IL-6r antibody reduced muscle Stat3 activation by 50% and
SOC3 expression by 41% (P,0.001; Figure 5D).
IL-6r antibody administration from 16 to 18 weeks of age
attenuated the progression of cachexia. ApcMin/+ mice receiving
control PBS injections had 16% reduction in body weight
(P,0.001; Figure 5B; Table 2) from their peak weight, while
ApcMin/+ mice receiving injections of IL-6r antibody only had a 7%
loss in body weight (P = 0.004; Figure 5B; Table 2). In addition,
gastrocnemius muscles from ApcMin/+ mice receiving the IL-6r
antibody were 16% (P = 0.01; Figure 5E) heavier than control
ApcMin/+ mice. IL-6r antibody administration had no effect on
muscle or body weight of wild-type controls. The effects of the IL-
6r antibody on the ApcMin/+ mice were not due to changes in food
consumption. Both wild-type and ApcMin/+ mice consumed similar
amounts of food throughout the study (Figure S5). However, the
IL-6r antibody treatment did reduce the percentage of large polyps
in ApcMin/+ mice (P = 0.014; Figure 5C). Total polyp number was
not affected by the IL-6r antibody treatment (Figure S6).
Related to protein synthesis, there was a main effect of genotype
(P = 0.002; Figure 5F) for ApcMin/+ mice to have a lower
myofibrillar protein synthesis rate, compared to wild-type mice.
Within ApcMin/+ mice, the administration of the IL-6r antibody did
not alter the attenuated rate of myofibrillar protein synthesis.
Although IL-6r antibody treatment increased muscle IGF-1
mRNA expression 65% (P,0.001; Figure 5G), mTOR signaling
was unaffected by IL-6r antibody treatment. As expected there
were main effects of genotype (P,0.05; Figure 5H) for mTOR,
p70S6K and 4E-BP1 phosphorylation, the ApcMin/+ mice having
suppressed signaling compared to wild-type mice. The cachexia
induction of Akt phosphorylation was attenuated 30% (P = 0.001;
Figure 5H) by the IL-6r antibody treatment. IL-6r antibody
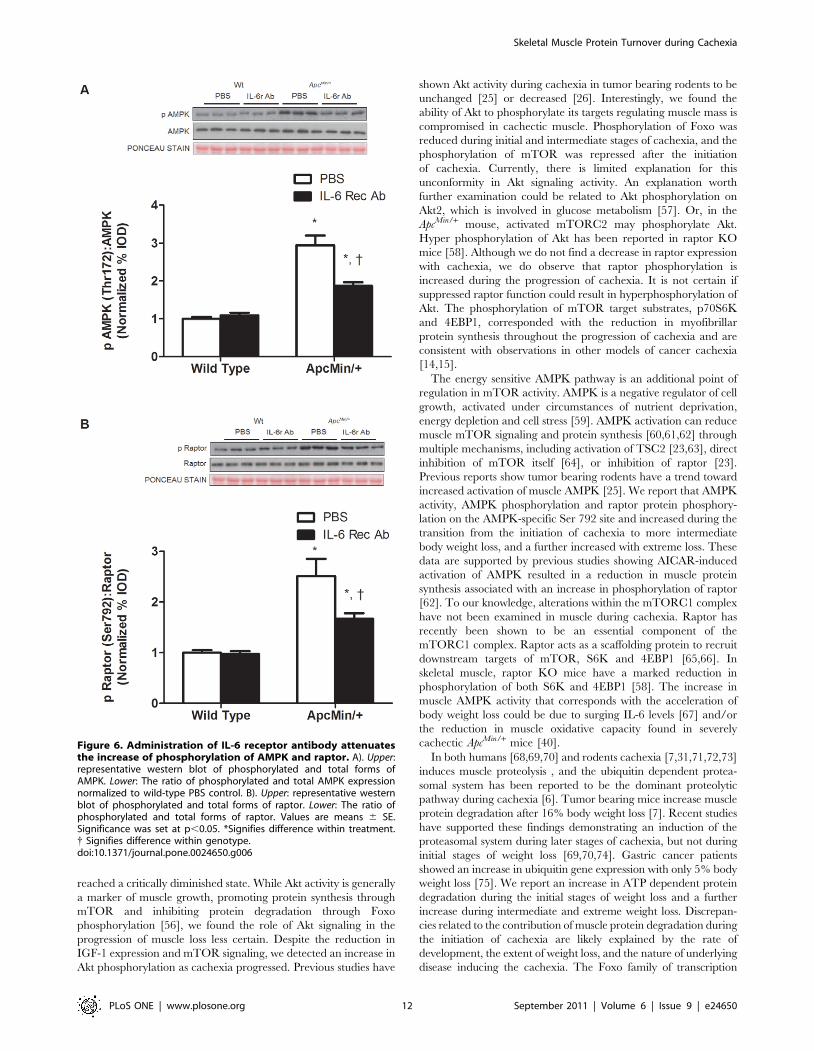
administration reduced AMPK and raptor phosphorylation
(P = 0.001; Figure 6A, B) compared to PBS treated ApcMin/+ mice.
However, AMPK and raptor phosphorylation was still elevated
above levels in non-cachectic muscle.
IL-6 signaling inhibition after the initiation of cachexiacan attenuate muscle protein degradation
ApcMin/+ control mice not treated with the IL-6r antibody
increased total protein degradation by 2.5 fold (P,0.001;
Figure 7A) during the progression of cachexia, which involved
ATP dependent and independent mechanisms of degradation.
Treatment with the IL-6r antibody attenuated total protein
degradation in the ApcMin/+ mouse by 40% (P = 0.002;
Figure 7A). The primary reduction was in ATP dependent
degradation, although ATP independent degradation was also
attenuated. There was no effect of IL-6r antibody administration
on protein degradation in wild-type mice. ApcMin/+ mice that were
not treated with the IL-6r antibody increased muscle protein
ubiquitination approximately 3-fold (P,0.001; Figure 7B), and the
antibody treatment significantly attenuated this induction. In
Figure 3. Skeletal muscle protein degradation consists of ATP dependent and independent mechanisms during the progression ofcachexia in the ApcMin/ mice. Protein degradation was measured in ApcMin/+ mice with progressive body weight loss. A) Protein degradationdetermined by tyrosine release assay. White bars represent ATP dependent degradation; Black bars represent ATP independent degradation. B)Correlation between protein degradation and gastrocnemius weight. C) Correlation between protein degradation and the percentage of bodyweight loss. D) Upper representative western blot of ubiquitinated proteins in the gastrocnemius muscle. Lower Quantification of ubiquitinatedproteins normalized to weight stable ApcMin/+ mice. E) Gene expression of C7 and C2 proteasomal subunits. F). Upper: representative western blot ofphosphorylated and total forms of Foxo3. Lower: The ratio of phosphorylated and total Foxo3. G) Gene expression of atrogin1 and MuRF1. H)Representative western blot of atrogin1 protein. Values are means 6 SE. Significance was set at p,0.05. { Signifies different from WS groups.& Signifies difference from mice with #5% body weight loss. WS, weight stable.doi:10.1371/journal.pone.0024650.g003
Skeletal Muscle Protein Turnover during Cachexia
PLoS ONE | www.plosone.org 8 September 2011 | Volume 6 | Issue 9 | e24650
addition, C7 and C2 proteasomal subunit expression was reduced
by IL-6r antibody administration (Figure 7C). However, muscle
protein ubiquitination and proteasomal subunit expression in
ApcMin/+ mice treated with the IL-6r antibody remained elevated
when compared to non-cachectic muscle, which was expected
since the treated mice had already initiated cachexia. These facts
support the finding that the IL-6r antibody treatment was
diminishing the rate of cachexia development, but was not
reversing the process.
The IL-6r antibody treatment increased Foxo3 phosphorylation
66% (P = 0.004; Figure 7D), but this level was still attenuated
compared to Foxo3 phosphorylation in non-cachectic mice.
Although atrogin1 gene and protein expression were both
attenuated (Figure 7E, F) by IL-6r antibody treatment, atrogin-1
gene and protein expression were still elevated when compared to
non-cachectic muscle. MuRF1 expression was not different among
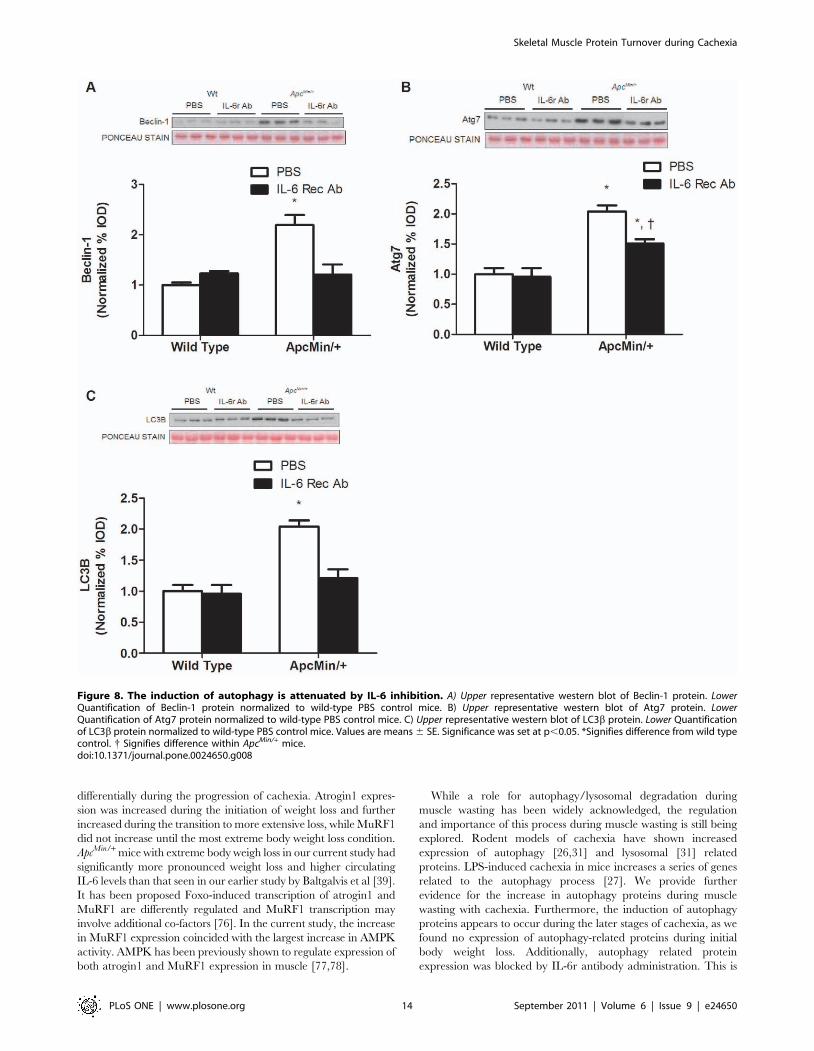
groups (Figure 7E). The expression of autophagy-related proteins
Beclin-1, Atg7 and LC3B increased approximately 2-fold during
the progression of cachexia in untreated mice (P,0.001;
Figure 8A,B,C). IL-6 receptor antibody treatment prevented the
induction of Beclin-1 and LC3B expression (P,0.001;
Figure 8A,C) in the ApcMin/+ mouse and attenuated the increase
in Atg7 by 25% (P = 0.03; Figure 8B).
Discussion
Although the regulation of skeletal muscle protein turnover
during cancer cachexia has been extensively investigated, the
potential for differential regulation of myofibrillar protein synthesis
and degradation during the transition from the initiation of weight
Figure 4. Autophagy is increased during late stage cachexia in the ApcMin/+ mouse. A) Upper representative western blot of Beclin-1protein. Lower Quantification of Beclin-1 protein normalized to weight stable ApcMin/+ mice, B) Upper representative western blot of Atg7 protein.Lower Quantification of Atg7 protein. C) Upper representative western blot of LC3b protein. Lower Quantification of LC3b protein. Values are means 6SE. Significance was set at p,0.05. { Signifies difference from weight stable ApcMin/+ mice. $ Signifies different from ApcMin/+ mice with 6–19% bodyweight loss. WS, weight stable.doi:10.1371/journal.pone.0024650.g004
Skeletal Muscle Protein Turnover during Cachexia
PLoS ONE | www.plosone.org 9 September 2011 | Volume 6 | Issue 9 | e24650
Skeletal Muscle Protein Turnover during Cachexia
PLoS ONE | www.plosone.org 10 September 2011 | Volume 6 | Issue 9 | e24650
loss to more severe loss is just beginning to be understood.
Determining processes that first initiate and then allow for the
progressive loss of muscle mass loss are critical for the eventual
treatment of cancer cachexia, since recovery or reversal of
cachexia will likely be far more difficult in the severely cachectic
state. Our current study provides further evidence that a surge in
circulating IL-6 is critical for the progression of cachexia in the
ApcMin/+ mouse. We report a 3–4 fold induction of IL-6 levels in
mice transitioning from the initiation of muscle mass loss to more
severe loss, and that administration of an IL-6 receptor antibody
after the initiation of cachexia essentially blocks the transition
towards more severe body weight and muscle mass loss. Our direct
examination of muscle protein turnover found that myofibrillar
protein synthesis is repressed and ATP-dependent muscle protein
degradation is increased during the initiation of cachexia. As
circulating IL-6 levels surge and body weight loss intensifies, we
report a further repression of myofibrillar protein synthesis that
corresponds with repressed mTOR signaling that is not dependent
on Akt regulation, but coincides with the activation of AMPK.
Although we report a further induction of ATP dependent protein
degradation during the progression of cachexia, the additional
activation of ATP-independent protein degradation is also
implicated as muscle mass loss becomes more severe. The
activation of these protein degradation processes demonstrated
IL-6 sensitivity, being repressed by the inhibition of the IL-6
receptor, which was able to block further muscle mass loss without
any alleviation of repressed myofibrillar protein synthesis. Taken
together, our data support the finding that the IL-6 receptor
antibody treatment was effective in diminishing the rate of
cachexia development, but not sufficient to reverse the process.
While the importance of activated muscle protein degradation
during wasting has been well established, the relationship of
muscle protein synthesis regulation to muscle mass loss during
cachexia has demonstrated equivocal results [50,51]. There is an
overall trend in the literature to support that protein synthesis is
reduced during the later stages of cachexia in both humans
[8,52,53] and rodents [7,54]. The first report measuring protein
synthesis in mice bearing the MAC16 adenocarcinoma showed
that synthesis was reduced during later stages of cachexia (.16%
body weight loss), but not during initial stages [7]. We report
myofibrillar protein synthesis is reduced during the initiation of
cachexia, and is further repressed during the transition from initial
to more severe loss. The inconsistency in findings related to our
study at the initiation of cachexia may result from differences in
the cachexia models. The MAC16 tumor causes rapid weight loss
and progresses to severe cachexia in two weeks or less [7,15]. In
contrast, cachexia in the ApcMin/+ mouse develops over a much
longer time period [38]. Furthermore, the MAC16 tumor bearing
mice in the study by Smith et al. [7] did not show a reduction in
gastrocnemius muscle mass during the initial stages of body weight
loss (0–10%), while we observed a reduction in gastrocnemius
mass in ApcMin/+ mice with minimal (#5%) body weight loss. The
reduction in myofibrillar protein synthesis did not appear related
to decreased RNA abundance, since skeletal alpha actin mRNA
expression was not changed throughout the progression of
cachexia. In support of these data, we have also previously
published muscle myosin heavy chain IIa and IIb mRNA
expression was not affected by cachexia in the ApcMin/+ mouse
[40].
Although, the IGF-1/Akt/mTOR pathway is a well established
regulator of muscle protein synthesis, it is well acknowledged that
this pathway is a highly complex, tightly regulated cellular process
with many potential sites of regulation [10]. The reduction in both
circulating and muscle expression of IGF-1 has been shown in
various wasting condition [11,12,13,25,55]. In the present study,
we show that a reduction in muscle IGF-1 gene expression is an
early event that occurs during the initiation of cachexia, and
expression is further repressed as cachexia progresses. However,
there is not a corresponding reduction in IGF-1 mRNA expression
during the most severe period of wasting when muscle mass has
Table 2. The effect of an IL-6 receptor antibody on body weight and inflammatory markers in wild-type and ApcMin/+ mice.
Peak 16 week 18 week 14–16 week 14–18 week
BW BW BW % change % change IL-6 Spleen
Genotype Treatment (g) (g) (g) (pg/ml) (mg)
Wt PBS n = 8 26.660.6 27.160.6 28.060.8 2.160.6 4.761.1 060 81.863
Wt +IL-6r Ab n = 8 26.560.5 27.360.5 28.160.6 2.860.3 5.660.5 060 82.363.4
ApcMin/+ PBS n = 7 24.660.8# 23.560.8# 21.260.8# 24.660.8# 215.862.3* 6466# 399644#
ApcMin/+ +IL-6r Ab n = 6 24.960.4# 24.060.5# 23.360.3# { 23.660.7# 26.860.8* { 5569# 472638#
Values are means 6 SE.#signifies main effect of genotype.*signifies difference within PBS and IL-6RecAb groups.{signifies difference from PBS treated ApcMin/+ group.Wt, wild-type mice, IL-6r Ab, IL-6 Receptor Antibody, BW, body weight.doi:10.1371/journal.pone.0024650.t002
Figure 5. Inhibition of IL-6 signaling attenuates the progression of cachexia independent of changes in protein synthesis. Wild typeand ApcMin/+ mice were given an IL-6 receptor antibody or PBS control at 16 weeks of age and sacrificed at 18 weeks. A) Experimental design showingadministration schedule and time line of IL-6 receptor antibody or PBS treatment. B) Percentage body weight change from peak body weight tosacrifice weight. C) Polyp distribution presented in percentage of total tumors. D) Representative western blot of phosphorylated and total forms ofStat3 and total SOC3 protein expression. E) Gastrocnemius weight and F) muscle protein synthesis measured at sacrifice. G) IGF-1 gene expression inthe gastrocnemius muscle. H) Upper: Representative western blots of phosphorylated and total forms of Akt, mTOR, p70S6K, and 4E-BP1. Lower: Theratio of phosphorylated to total form of the given protein normalized to PBS treated wild-type mice. Values are means 6 SE. Significance was set atp,0.05. *Signifies difference within treatment. { Signifies difference within genotype. # Signifies main effect of genotype. & Signifies difference inpolyps 1–2 mm. $ Signifies difference between polyps .2 mm.doi:10.1371/journal.pone.0024650.g005
Skeletal Muscle Protein Turnover during Cachexia
PLoS ONE | www.plosone.org 11 September 2011 | Volume 6 | Issue 9 | e24650
reached a critically diminished state. While Akt activity is generally
a marker of muscle growth, promoting protein synthesis through
mTOR and inhibiting protein degradation through Foxo
phosphorylation [56], we found the role of Akt signaling in the
progression of muscle loss less certain. Despite the reduction in
IGF-1 expression and mTOR signaling, we detected an increase in
Akt phosphorylation as cachexia progressed. Previous studies have
shown Akt activity during cachexia in tumor bearing rodents to be
unchanged [25] or decreased [26]. Interestingly, we found the
ability of Akt to phosphorylate its targets regulating muscle mass is
compromised in cachectic muscle. Phosphorylation of Foxo was
reduced during initial and intermediate stages of cachexia, and the
phosphorylation of mTOR was repressed after the initiation
of cachexia. Currently, there is limited explanation for this
unconformity in Akt signaling activity. An explanation worth
further examination could be related to Akt phosphorylation on
Akt2, which is involved in glucose metabolism [57]. Or, in the
ApcMin/+ mouse, activated mTORC2 may phosphorylate Akt.
Hyper phosphorylation of Akt has been reported in raptor KO
mice [58]. Although we do not find a decrease in raptor expression
with cachexia, we do observe that raptor phosphorylation is
increased during the progression of cachexia. It is not certain if
suppressed raptor function could result in hyperphosphorylation of
Akt. The phosphorylation of mTOR target substrates, p70S6K
and 4EBP1, corresponded with the reduction in myofibrillar
protein synthesis throughout the progression of cachexia and are
consistent with observations in other models of cancer cachexia
[14,15].
The energy sensitive AMPK pathway is an additional point of
regulation in mTOR activity. AMPK is a negative regulator of cell
growth, activated under circumstances of nutrient deprivation,
energy depletion and cell stress [59]. AMPK activation can reduce
muscle mTOR signaling and protein synthesis [60,61,62] through
multiple mechanisms, including activation of TSC2 [23,63], direct
inhibition of mTOR itself [64], or inhibition of raptor [23].
Previous reports show tumor bearing rodents have a trend toward
increased activation of muscle AMPK [25]. We report that AMPK
activity, AMPK phosphorylation and raptor protein phosphory-
lation on the AMPK-specific Ser 792 site and increased during the
transition from the initiation of cachexia to more intermediate
body weight loss, and a further increased with extreme loss. These
data are supported by previous studies showing AICAR-induced
activation of AMPK resulted in a reduction in muscle protein
synthesis associated with an increase in phosphorylation of raptor
[62]. To our knowledge, alterations within the mTORC1 complex
have not been examined in muscle during cachexia. Raptor has
recently been shown to be an essential component of the
mTORC1 complex. Raptor acts as a scaffolding protein to recruit
downstream targets of mTOR, S6K and 4EBP1 [65,66]. In
skeletal muscle, raptor KO mice have a marked reduction in
phosphorylation of both S6K and 4EBP1 [58]. The increase in
muscle AMPK activity that corresponds with the acceleration of
body weight loss could be due to surging IL-6 levels [67] and/or
the reduction in muscle oxidative capacity found in severely
cachectic ApcMin/+ mice [40].
In both humans [68,69,70] and rodents cachexia [7,31,71,72,73]
induces muscle proteolysis , and the ubiquitin dependent protea-
somal system has been reported to be the dominant proteolytic
pathway during cachexia [6]. Tumor bearing mice increase muscle
protein degradation after 16% body weight loss [7]. Recent studies
have supported these findings demonstrating an induction of the
proteasomal system during later stages of cachexia, but not during
initial stages of weight loss [69,70,74]. Gastric cancer patients
showed an increase in ubiquitin gene expression with only 5% body
weight loss [75]. We report an increase in ATP dependent protein
degradation during the initial stages of weight loss and a further
increase during intermediate and extreme weight loss. Discrepan-
cies related to the contribution of muscle protein degradation during
the initiation of cachexia are likely explained by the rate of
development, the extent of weight loss, and the nature of underlying
disease inducing the cachexia. The Foxo family of transcription
Figure 6. Administration of IL-6 receptor antibody attenuatesthe increase of phosphorylation of AMPK and raptor. A). Upper:representative western blot of phosphorylated and total forms ofAMPK. Lower: The ratio of phosphorylated and total AMPK expressionnormalized to wild-type PBS control. B). Upper: representative westernblot of phosphorylated and total forms of raptor. Lower: The ratio ofphosphorylated and total forms of raptor. Values are means 6 SE.Significance was set at p,0.05. *Signifies difference within treatment.{ Signifies difference within genotype.doi:10.1371/journal.pone.0024650.g006
Skeletal Muscle Protein Turnover during Cachexia
PLoS ONE | www.plosone.org 12 September 2011 | Volume 6 | Issue 9 | e24650
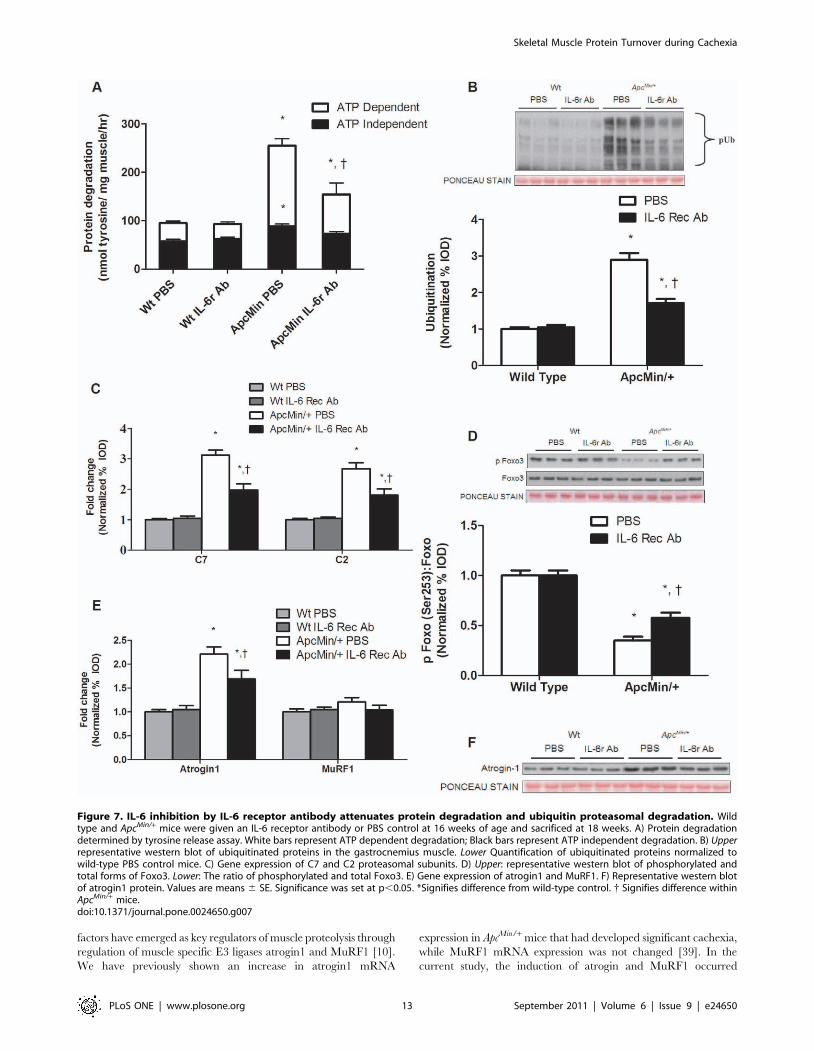
factors have emerged as key regulators of muscle proteolysis through
regulation of muscle specific E3 ligases atrogin1 and MuRF1 [10].
We have previously shown an increase in atrogin1 mRNA
expression in ApcMin/+ mice that had developed significant cachexia,
while MuRF1 mRNA expression was not changed [39]. In the
current study, the induction of atrogin and MuRF1 occurred
Figure 7. IL-6 inhibition by IL-6 receptor antibody attenuates protein degradation and ubiquitin proteasomal degradation. Wildtype and ApcMin/+ mice were given an IL-6 receptor antibody or PBS control at 16 weeks of age and sacrificed at 18 weeks. A) Protein degradationdetermined by tyrosine release assay. White bars represent ATP dependent degradation; Black bars represent ATP independent degradation. B) Upperrepresentative western blot of ubiquitinated proteins in the gastrocnemius muscle. Lower Quantification of ubiquitinated proteins normalized towild-type PBS control mice. C) Gene expression of C7 and C2 proteasomal subunits. D) Upper: representative western blot of phosphorylated andtotal forms of Foxo3. Lower: The ratio of phosphorylated and total Foxo3. E) Gene expression of atrogin1 and MuRF1. F) Representative western blotof atrogin1 protein. Values are means 6 SE. Significance was set at p,0.05. *Signifies difference from wild-type control. { Signifies difference withinApcMin/+ mice.doi:10.1371/journal.pone.0024650.g007
Skeletal Muscle Protein Turnover during Cachexia
PLoS ONE | www.plosone.org 13 September 2011 | Volume 6 | Issue 9 | e24650
differentially during the progression of cachexia. Atrogin1 expres-
sion was increased during the initiation of weight loss and further
increased during the transition to more extensive loss, while MuRF1
did not increase until the most extreme body weight loss condition.
ApcMin/+ mice with extreme body weigh loss in our current study had
significantly more pronounced weight loss and higher circulating
IL-6 levels than that seen in our earlier study by Baltgalvis et al [39].
It has been proposed Foxo-induced transcription of atrogin1 and
MuRF1 are differently regulated and MuRF1 transcription may
involve additional co-factors [76]. In the current study, the increase
in MuRF1 expression coincided with the largest increase in AMPK
activity. AMPK has been previously shown to regulate expression of
both atrogin1 and MuRF1 expression in muscle [77,78].
While a role for autophagy/lysosomal degradation during
muscle wasting has been widely acknowledged, the regulation
and importance of this process during muscle wasting is still being
explored. Rodent models of cachexia have shown increased
expression of autophagy [26,31] and lysosomal [31] related
proteins. LPS-induced cachexia in mice increases a series of genes
related to the autophagy process [27]. We provide further
evidence for the increase in autophagy proteins during muscle
wasting with cachexia. Furthermore, the induction of autophagy
proteins appears to occur during the later stages of cachexia, as we
found no expression of autophagy-related proteins during initial
body weight loss. Additionally, autophagy related protein
expression was blocked by IL-6r antibody administration. This is
Figure 8. The induction of autophagy is attenuated by IL-6 inhibition. A) Upper representative western blot of Beclin-1 protein. LowerQuantification of Beclin-1 protein normalized to wild-type PBS control mice. B) Upper representative western blot of Atg7 protein. LowerQuantification of Atg7 protein normalized to wild-type PBS control mice. C) Upper representative western blot of LC3b protein. Lower Quantificationof LC3b protein normalized to wild-type PBS control mice. Values are means 6 SE. Significance was set at p,0.05. *Signifies difference from wild typecontrol. { Signifies difference within ApcMin/+ mice.doi:10.1371/journal.pone.0024650.g008
Skeletal Muscle Protein Turnover during Cachexia
PLoS ONE | www.plosone.org 14 September 2011 | Volume 6 | Issue 9 | e24650
the first report, to our knowledge, demonstrating that muscle
autophagy-related degradation is related to the progression of
cachexia and circulating IL-6 levels. However, in cancer patients
increased lysosomal enzyme activity was correlated with weight
loss [79]. Previous reports using the IL-6r antibody have
demonstrated a reduction in muscle protein breakdown by
inhibition of proteasomal and lysosomal dependent pathways
[37]. However, tumor bearing rats treated with suramin, a global
cytokine inhibitor, demonstrated a suppression of muscle protea-
somal activity [80]. It has also been shown that Foxo family
proteins and the mammalian target of rapamycin (mTOR) can
regulate the expression of autophagy genes [18]. We report a
reduction in Foxo phosphorylation and trend for decreased
mTOR phosphorylation during the initiation of cachexia that
corresponded with an increase in proteasomal activation, but not
autophagy-related expression, which suggests additional regulation
of muscle autophagy gene expression beyond Foxo3 and mTOR.
IL-6r antibody treatment in ApcMin/+ mice attenuates muscle
proteolysis by reducing the expression of both proteasomal and
autophagy-related proteins.
In summary, our data show muscle protein synthesis and related
IGF-1 signaling is suppressed during the initial progression of
cachexia in the ApcMin/+ mouse. The decrease in IGF-1 signaling is
accompanied by a paradoxical increase in Akt phosphorylation,
despite a reduction in downstream mTOR and FOXO signaling.
In contrast to IGF-1 expression, AMPK activation was increased
throughout later stages of cachexia, which might explain the
decrease in mTOR signaling during extreme body weight loss. In
regards to protein degradation, we show protein degradation was
due, in part, by the increased ubiquitin proteasomal activation and
lysosomal/autophagy pathways. However, the regulation of the
two systems appears to be different as cachexia severity does not
activate both systems equally. Protein degradation during the
initial stages of cachexia appears to be the result of increased
ubiquitin proteasomal activation independent of autophagy/
lysosomal activation. However, later stages of cachexia increase
protein degradation through proteasomal and autophagy/lyso-
somal pathways. Lastly, inhibition of IL-6 signaling in ApcMin/+
mice with initial body weight loss can prevent the progression into
late stage cachexia independently of changes in protein synthesis.
This is associated with the attenuation of proteasomal activation
and prevention of autophagy-related protein expression, main-
taining what is observed during the initial stages of cachexia.
Supporting Information
Figure S1 Muscle wasting in cachectic ApcMin/+ mice isassociated with a reduction in muscle mass, proteinsynthesis and IGF-1 expression. Wild-type and ApcMin/+ mice
were sacrificed at 12 and 20 weeks of age. A) Gastrocnemius
muscle mass. B) Myofibrillar protein synthesis. C) IGF-1 mRNA
expression normalized to 12 week wild-type mice. Values are
means 6 SE. Significance was set at p,0.05. * Signifies different
from 12 week mice within genotype. Gastroc, Gastrocnemius.
(TIF)
Figure S2 AMPK signaling is increased in cachecticApcMin/+ mice. A). Upper representative western blot of
phosphorylated and total forms of AMPK. Lower The ratio of
phosphorylated and total AMPK expression normalized to 12
week wild-type mice. B). Muscle AMPK activity normalized to 12
week wild-type mice. C). Upper representative western blot of
phosphorylated and total forms of raptor. Lower The ratio of
phosphorylated and total raptor expression normalized to 12 week
wild-type mice. Values are means 6 SE. Significance was set at
p,0.05. *Signifies difference within genotype.
(TIF)
Figure S3 Rates of ATP-independent and ATP-depen-dent protein degradation are similar between wild-typeand weight stable ApcMin/+ mice. Protein degradation
measurements were taken at 12 weeks of age for both wild-type
and ApcMin/+ mice.
(TIF)
Figure S4 Autophagy is increased in cachectic ApcMin/+
mice. A). Upper representative western blot of Beclin-1 protein.
Lower Quantification of Beclin-1 protein normalized to 12 week
wild-type mice, B). Upper representative western blot of Atg7
protein. Lower Quantification of Atg7 protein. Values are means 6
SE. Significance was set at p,0.05. * Signifies difference from 12
week mice within genotype.
(TIF)
Figure S5 Administration of IL-6 receptor antibody didnot affect food intake in wild-type or ApcMin/+ mice.(TIF)
Figure S6 Administration of IL-6 receptor antibody didnot affect total polyp number in ApcMin/+ mice. Polypcounts were taken at 18 weeks of age.(TIF)
Acknowledgments
The authors would like to thank Melissa Puppa and Tia Davis for their
technical assistance. The authors would also like to thank Chugai
Pharmaceutical CO., LTD for allowing us to use their IL-6 receptor
antibody.
Author Contributions
Conceived and designed the experiments: JPW JWB SLW MCK LEM SS
JAC. Performed the experiments: JPW SLW SS JAC. Analyzed the data:
JPW JWB SLW MCK LEM SS JAC. Contributed reagents/materials/
analysis tools: JPW JWB SLW MCK LEM JAC. Wrote the paper: JPW
JAC. Obtained use of the IL-6 receptor antibody from Chugai
Pharmaceutical CO., LTD: JPW JAC.
References
1. Evans WJ, Morley JE, Argiles J, Bales C, Baracos V, et al. (2008) Cachexia: a
new definition. Clin Nutr 27: 793–799.
2. Wigmore SJ, Plester CE, Richardson RA, Fearon KC (1997) Changes in
nutritional status associated with unresectable pancreatic cancer. Br J Cancer 75:
106–109.
3. Tisdale MJ (2006) Clinical anticachexia treatments. Nutr Clin Pract 21:
168–174.
4. Muscaritoli M, Bossola M, Aversa Z, Bellantone R, Rossi Fanelli F (2006)
Prevention and treatment of cancer cachexia: new insights into an old problem.
Eur J Cancer 42: 31–41.
5. Muscaritoli M, Anker SD, Argiles J, Aversa Z, Bauer JM, et al. (2010) Consensus
definition of sarcopenia, cachexia and pre-cachexia: joint document elaborated
by Special Interest Groups (SIG) ‘‘cachexia-anorexia in chronic wasting
diseases’’ and ‘‘nutrition in geriatrics’’. Clin Nutr 29: 154–159.
6. Tisdale MJ (2009) Mechanisms of cancer cachexia. Physiol Rev 89: 381–410.
7. Smith KL, Tisdale MJ (1993) Increased protein degradation and decreased
protein synthesis in skeletal muscle during cancer cachexia. Br J Cancer 67:
680–685.
8. Dworzak F, Ferrari P, Gavazzi C, Maiorana C, Bozzetti F (1998) Effects of
cachexia due to cancer on whole body and skeletal muscle protein turnover.
Cancer 82: 42–48.
9. Kimball SR, Jefferson LS (2010) Control of translation initiation through
integration of signals generated by hormones, nutrients, and exercise. J Biol
Chem 285: 29027–29032.
Skeletal Muscle Protein Turnover during Cachexia
PLoS ONE | www.plosone.org 15 September 2011 | Volume 6 | Issue 9 | e24650
10. Glass DJ (2010) PI3 Kinase Regulation of Skeletal Muscle Hypertrophy and
Atrophy. Curr Top Microbiol Immunol.
11. Fan J, Molina PE, Gelato MC, Lang CH (1994) Differential tissue regulation of
insulin-like growth factor-I content and binding proteins after endotoxin.
Endocrinology 134: 1685–1692.
12. Attard-Montalto SP, Camacho-Hubner C, Cotterill AM, D’Souza-Li L, Daley S,
et al. (1998) Changes in protein turnover, IGF-I and IGF binding proteins in
children with cancer. Acta Paediatr 87: 54–60.
13. Costelli P, Muscaritoli M, Bossola M, Penna F, Reffo P, et al. (2006) IGF-1 is
downregulated in experimental cancer cachexia. Am J Physiol Regul Integr
Comp Physiol 291: R674–683.
14. Russell ST, Siren PM, Siren MJ, Tisdale MJ (2009) Attenuation of skeletal
muscle atrophy in cancer cachexia by D-myo-inositol 1,2,6-triphosphate. Cancer
Chemother Pharmacol 64: 517–527.
15. Eley HL, Russell ST, Tisdale MJ (2007) Effect of branched-chain amino acids on
muscle atrophy in cancer cachexia. Biochem J 407: 113–120.
16. Sandri M, Sandri C, Gilbert A, Skurk C, Calabria E, et al. (2004) Foxo
transcription factors induce the atrophy-related ubiquitin ligase atrogin-1 and
cause skeletal muscle atrophy. Cell 117: 399–412.
17. Latres E, Amini AR, Amini AA, Griffiths J, Martin FJ, et al. (2005) Insulin-like
growth factor-1 (IGF-1) inversely regulates atrophy-induced genes via the
phosphatidylinositol 3-kinase/Akt/mammalian target of rapamycin (PI3K/Akt/
mTOR) pathway. J Biol Chem 280: 2737–2744.
18. Zhao J, Brault JJ, Schild A, Cao P, Sandri M, et al. (2007) FoxO3 coordinately
activates protein degradation by the autophagic/lysosomal and proteasomal
pathways in atrophying muscle cells. Cell Metab 6: 472–483.
19. Bolster DR, Crozier SJ, Kimball SR, Jefferson LS (2002) AMP-activated protein
kinase suppresses protein synthesis in rat skeletal muscle through down-regulated
mammalian target of rapamycin (mTOR) signaling. J Biol Chem 277:
23977–23980.
20. Horman S, Browne G, Krause U, Patel J, Vertommen D, et al. (2002) Activation
of AMP-activated protein kinase leads to the phosphorylation of elongation
factor 2 and an inhibition of protein synthesis. Curr Biol 12: 1419–1423.
21. Chan AY, Soltys CL, Young ME, Proud CG, Dyck JR (2004) Activation of
AMP-activated protein kinase inhibits protein synthesis associated with
hypertrophy in the cardiac myocyte. J Biol Chem 279: 32771–32779.
22. Hardie DG (2010) Energy sensing by the AMP-activated protein kinase and its
effects on muscle metabolism. Proc Nutr Soc. pp 1–8.
23. Gwinn DM, Shackelford DB, Egan DF, Mihaylova MM, Mery A, et al. (2008)
AMPK phosphorylation of raptor mediates a metabolic checkpoint. Mol Cell 30:
214–226.
24. Nakashima K, Yakabe Y (2007) AMPK activation stimulates myofibrillar
protein degradation and expression of atrophy-related ubiquitin ligases by
increasing FOXO transcription factors in C2C12 myotubes. Biosci Biotechnol
Biochem 71: 1650–1656.
25. Penna F, Bonetto A, Muscaritoli M, Costamagna D, Minero VG, et al. (2010)
Muscle atrophy in experimental cancer cachexia: is the IGF-1 signaling pathway
involved? Int J Cancer 127: 1706–1717.
26. Asp ML, Tian M, Wendel AA, Belury MA (2010) Evidence for the contribution
of insulin resistance to the development of cachexia in tumor-bearing mice.
Int J Cancer 126: 756–763.
27. McClung JM, Judge AR, Powers SK, Yan Z (2009) p38 MAPK links oxidative
stress to autophagy-related gene expression in cachectic muscle wasting.
Am J Physiol Cell Physiol.
28. Lum JJ, DeBerardinis RJ, Thompson CB (2005) Autophagy in metazoans: cell
survival in the land of plenty. Nat Rev Mol Cell Biol 6: 439–448.
29. Masiero E, Agatea L, Mammucari C, Blaauw B, Loro E, et al. (2009) Autophagy
is required to maintain muscle mass. Cell Metab 10: 507–515.
30. Katunuma N, Kominami E (1987) Abnormal expression of lysosomal cysteine
proteinases in muscle wasting diseases. Rev Physiol Biochem Pharmacol 108:
1–20.
31. Lecker SH, Jagoe RT, Gilbert A, Gomes M, Baracos V, et al. (2004) Multiple
types of skeletal muscle atrophy involve a common program of changes in gene
expression. Faseb J 18: 39–51.
32. Asp ML, Tian M, Wendel AA, Belury MA (2010) Evidence for the contribution
of insulin resistance to the development of cachexia in tumor-bearing mice.
Int J Cancer 126: 756–763.
33. Carson JA, Baltgalvis KA (2010) Interleukin 6 as a key regulator of muscle mass
during cachexia. Exerc Sport Sci Rev 38: 168–176.
34. Tsujinaka T, Fujita J, Ebisui C, Yano M, Kominami E, et al. (1996) Interleukin
6 receptor antibody inhibits muscle atrophy and modulates proteolytic systems in
interleukin 6 transgenic mice. J Clin Invest 97: 244–249.
35. Tsujinaka T, Ebisui C, Fujita J, Kishibuchi M, Morimoto T, et al. (1995) Muscle
undergoes atrophy in association with increase of lysosomal cathepsin activity in
interleukin-6 transgenic mouse. Biochem Biophys Res Commun 207: 168–174.
36. van Hall G, Steensberg A, Fischer C, Keller C, Moller K, et al. (2008)
Interleukin-6 markedly decreases skeletal muscle protein turnover and increases
nonmuscle amino acid utilization in healthy individuals. J Clin Endocrinol
Metab 93: 2851–2858.
37. Fujita J, Tsujinaka T, Yano M, Ebisui C, Saito H, et al. (1996) Anti-interleukin-6
receptor antibody prevents muscle atrophy in colon-26 adenocarcinoma-bearing
mice with modulation of lysosomal and ATP-ubiquitin-dependent proteolytic
pathways. Int J Cancer 68: 637–643.
38. Baltgalvis KA, Berger FG, Pena MM, Davis JM, Muga SJ, et al. (2008)
Interleukin-6 and cachexia in ApcMin/+ mice. Am J Physiol Regul Integr Comp
Physiol 294: R393–401.
39. Baltgalvis KA, Berger FG, Pena MM, Davis JM, White JP, et al. (2009) Muscle
wasting and interleukin-6-induced atrogin-I expression in the cachectic Apc
(Min/+) mouse. Pflugers Arch 457: 989–1001.
40. White JP, Baltgalvis KA, Puppa MJ, Sato S, Baynes JW, et al. (2011) Muscle
oxidative capacity during IL-6-dependent cancer cachexia. Am J Physiol Regul
Integr Comp Physiol 300: R201–211.
41. Welle S, Bhatt K, Pinkert CA (2006) Myofibrillar protein synthesis in myostatin-
deficient mice. Am J Physiol Endocrinol Metab 290: E409–415.
42. Mehl KA, Davis JM, Clements JM, Berger FG, Pena MM, et al. (2005)
Decreased intestinal polyp multiplicity is related to exercise mode and gender in
ApcMin/+ mice. J Appl Physiol 98: 2219–2225.
43. Baltgalvis KA, Berger FG, Pena MM, Davis JM, Carson JA (2008) Effect of
exercise on biological pathways in ApcMin/+ mouse intestinal polyps. J Appl
Physiol 104: 1137–1143.
44. Baltgalvis KA, Berger FG, Pena MM, Davis JM, Carson JA (2009) The
interaction of a high-fat diet and regular moderate intensity exercise on intestinal
polyp development in Apc Min/+ mice. Cancer Prev Res (Phila) 2: 641–649.
45. Hu J, Klein JD, Du J, Wang XH (2008) Cardiac muscle protein catabolism in
diabetes mellitus: activation of the ubiquitin-proteasome system by insulin
deficiency. Endocrinology 149: 5384–5390.
46. Clark AS, Mitch WE (1983) Muscle protein turnover and glucose uptake in
acutely uremic rats. Effects of insulin and the duration of renal insufficiency.
J Clin Invest 72: 836–845.
47. White JP, Reecy JM, Washington TA, Sato S, Le ME, et al. (2009) Overload-
induced skeletal muscle extracellular matrix remodelling and myofibre growth in
mice lacking IL-6. Acta Physiol (Oxf) 197: 321–332.
48. White JP, Baltgalvis KA, Sato S, Wilson LB, Carson JA (2009) Effect of
nandrolone decanoate administration on recovery from bupivacaine-induced
muscle injury. J Appl Physiol 107: 1420–1430.
49. Bradford MM (1976) A rapid and sensitive method for the quantitation of
microgram quantities of protein utilizing the principle of protein-dye binding.
Anal Biochem 72: 248–254.
50. Combaret L, Ralliere C, Taillandier D, Tanaka K, Attaix D (1999)
Manipulation of the ubiquitin-proteasome pathway in cachexia: pentoxifylline
suppresses the activation of 20S and 26S proteasomes in muscles from tumor-
bearing rats. Mol Biol Rep 26: 95–101.
51. Llovera M, Garcia-Martinez C, Lopez-Soriano J, Agell N, Lopez-Soriano FJ,
et al. (1998) Protein turnover in skeletal muscle of tumour-bearing transgenic
mice overexpressing the soluble TNF receptor-1. Cancer Lett 130: 19–27.
52. Emery PW, Edwards RH, Rennie MJ, Souhami RL, Halliday D (1984) Protein
synthesis in muscle measured in vivo in cachectic patients with cancer. Br
Med J (Clin Res Ed) 289: 584–586.
53. Rennie MJ, Edwards RH, Emery PW, Halliday D, Lundholm K, et al. (1983)
Depressed protein synthesis is the dominant characteristic of muscle wasting and
cachexia. Clin Physiol 3: 387–398.
54. Emery PW, Lovell L, Rennie MJ (1984) Protein synthesis measured in vivo in
muscle and liver of cachectic tumor-bearing mice. Cancer Res 44: 2779–2784.
55. Wang H, Casaburi R, Taylor WE, Aboellail H, Storer TW, et al. (2005) Skeletal
muscle mRNA for IGF-IEa, IGF-II, and IGF-I receptor is decreased in
sedentary chronic hemodialysis patients. Kidney Int 68: 352–361.
56. Frost RA, Lang CH (2007) Protein kinase B/Akt: a nexus of growth factor and
cytokine signaling in determining muscle mass. J Appl Physiol 103: 378–387.
57. Garofalo RS, Orena SJ, Rafidi K, Torchia AJ, Stock JL, et al. (2003) Severe
diabetes, age-dependent loss of adipose tissue, and mild growth deficiency in
mice lacking Akt2/PKB beta. J Clin Invest 112: 197–208.
58. Bentzinger CF, Romanino K, Cloetta D, Lin S, Mascarenhas JB, et al. (2008)
Skeletal muscle-specific ablation of raptor, but not of rictor, causes metabolic
changes and results in muscle dystrophy. Cell Metab 8: 411–424.
59. Long YC, Zierath JR (2006) AMP-activated protein kinase signaling in
metabolic regulation. J Clin Invest 116: 1776–1783.
60. Williamson DL, Bolster DR, Kimball SR, Jefferson LS (2006) Time course
changes in signaling pathways and protein synthesis in C2C12 myotubes
following AMPK activation by AICAR. Am J Physiol Endocrinol Metab 291:
E80–89.
61. Thomson DM, Fick CA, Gordon SE (2008) AMPK activation attenuates S6K1,
4E-BP1, and eEF2 signaling responses to high-frequency electrically stimulated
skeletal muscle contractions. J Appl Physiol 104: 625–632.
62. Pruznak AM, Kazi AA, Frost RA, Vary TC, Lang CH (2008) Activation of
AMP-activated protein kinase by 5-aminoimidazole-4-carboxamide-1-beta-D-
ribonucleoside prevents leucine-stimulated protein synthesis in rat skeletal
muscle. J Nutr 138: 1887–1894.
63. Inoki K, Zhu T, Guan KL (2003) TSC2 mediates cellular energy response to
control cell growth and survival. Cell 115: 577–590.
64. Cheng SW, Fryer LG, Carling D, Shepherd PR (2004) Thr2446 is a novel
mammalian target of rapamycin (mTOR) phosphorylation site regulated by
nutrient status. J Biol Chem 279: 15719–15722.
65. Kim DH, Sarbassov DD, Ali SM, King JE, Latek RR, et al. (2002) mTOR
interacts with raptor to form a nutrient-sensitive complex that signals to the cell
growth machinery. Cell 110: 163–175.
Skeletal Muscle Protein Turnover during Cachexia
PLoS ONE | www.plosone.org 16 September 2011 | Volume 6 | Issue 9 | e24650
66. Hara K, Maruki Y, Long X, Yoshino K, Oshiro N, et al. (2002) Raptor, a
binding partner of target of rapamycin (TOR), mediates TOR action. Cell 110:177–189.
67. Carey AL, Steinberg GR, Macaulay SL, Thomas WG, Holmes AG, et al. (2006)
Interleukin-6 increases insulin-stimulated glucose disposal in humans andglucose uptake and fatty acid oxidation in vitro via AMP-activated protein
kinase. Diabetes 55: 2688–2697.68. Llovera M, Garcia-Martinez C, Agell N, Lopez-Soriano FJ, Authier FJ, et al.
(1998) Ubiquitin and proteasome gene expression is increased in skeletal muscle
of slim AIDS patients. Int J Mol Med 2: 69–73.69. Khal J, Hine AV, Fearon KC, Dejong CH, Tisdale MJ (2005) Increased
expression of proteasome subunits in skeletal muscle of cancer patients withweight loss. Int J Biochem Cell Biol 37: 2196–2206.
70. Bossola M, Muscaritoli M, Costelli P, Grieco G, Bonelli G, et al. (2003)Increased muscle proteasome activity correlates with disease severity in gastric
cancer patients. Ann Surg 237: 384–389.
71. Acharyya S, Ladner KJ, Nelsen LL, Damrauer J, Reiser PJ, et al. (2004) Cancercachexia is regulated by selective targeting of skeletal muscle gene products.
J Clin Invest 114: 370–378.72. Strelkov AB, Fields AL, Baracos VE (1989) Effects of systemic inhibition of
prostaglandin production on protein metabolism in tumor-bearing rats.
Am J Physiol 257: C261–269.73. Baracos VE, DeVivo C, Hoyle DH, Goldberg AL (1995) Activation of the ATP-
ubiquitin-proteasome pathway in skeletal muscle of cachectic rats bearing ahepatoma. Am J Physiol 268: E996–1006.
74. Khal J, Wyke SM, Russell ST, Hine AV, Tisdale MJ (2005) Expression of the
ubiquitin-proteasome pathway and muscle loss in experimental cancer cachexia.
Br J Cancer 93: 774–780.
75. Bossola M, Muscaritoli M, Costelli P, Bellantone R, Pacelli F, et al. (2001)
Increased muscle ubiquitin mRNA levels in gastric cancer patients. Am J Physiol
Regul Integr Comp Physiol 280: R1518–1523.
76. Senf SM, Dodd SL, Judge AR (2010) FOXO signaling is required for disuse
muscle atrophy and is directly regulated by Hsp70. Am J Physiol Cell Physiol
298: C38–45.
77. Krawiec BJ, Nystrom GJ, Frost RA, Jefferson LS, Lang CH (2007) AMP-
activated protein kinase agonists increase mRNA content of the muscle-specific
ubiquitin ligases MAFbx and MuRF1 in C2C12 cells. Am J Physiol Endocrinol
Metab 292: E1555–1567.
78. Romanello V, Guadagnin E, Gomes L, Roder I, Sandri C, et al. (2010)
Mitochondrial fission and remodelling contributes to muscle atrophy. Embo J
29: 1774–1785.
79. Schersten T, Lundholm K (1972) Lysosomal enzyme activity in muscle tissue
from patients with malignant tumor. Cancer 30: 1246–1251.
80. Costelli P, Bossola M, Muscaritoli M, Grieco G, Bonelli G, et al. (2002)
Anticytokine treatment prevents the increase in the activity of ATP-ubiquitin-
and Ca(2+)-dependent proteolytic systems in the muscle of tumour-bearing rats.
Cytokine 19: 1–5.
Skeletal Muscle Protein Turnover during Cachexia
PLoS ONE | www.plosone.org 17 September 2011 | Volume 6 | Issue 9 | e24650